
the Creative Commons Attribution 4.0 License.
the Creative Commons Attribution 4.0 License.
 | 16 Nov 2026
Photochemical mechanism–dependent ozone formation and precursor sensitivity under varying NOx conditions
Yuelin Liu
Yuanjun Gong

Guangming Shi
Fumo Yang
Yuanhang Zhang
Photochemical mechanisms are core components of air quality models, yet differences among them can introduce substantial uncertainty in tropospheric ozone (O3) simulations. We compared three mechanisms (CB06, SAPRC07, and RACM2) using CMAQ during an O3 pollution episode in Chengdu, China. A customized volatile organic compound (VOC) emission inventory was developed for RACM2. RACM2 and SAPRC07 produced comparable O3 levels (94.8–96.1 ppbv) with better performance at high-NOx urban site, whereas CB06 simulated lower O3 (∼80 ppbv) and performed better at low-NOx site. Inter-mechanistic differences in O3 formation were mainly associated with RO2+NO reactions, consistent with larger variability in RO2 than in HO2, while O3 loss differences mainly arose from OH+NO2 and O3+alkene reactions. Differences in primary ROx production were most evident in carbonyl photolysis, whereas termination differences mainly involved RONO2 formation and peroxy-radical self- and cross-reactions. Mechanism-dependent discrepancies were more pronounced at high-NOx urban site. Despite these discrepancies, the three mechanisms exhibited a broadly consistent photochemical framework, with O3 formation dominated by RO2+NO and ROx termination shifting from NOx-dependent pathways at high-NOx urban site toward peroxy-radical reactions at low-NOx suburban site. Sensitivity analysis showed O3 was most sensitive to anthropogenic aromatics and alkenes at urban site and relatively more sensitive to biogenic VOCs at suburban site, although response magnitudes remained mechanism dependent. These findings demonstrate that mechanism choice substantially affects O3 formation and precursor sensitivities, emphasizing the need for multi-mechanism approaches to improve model reliability and support emission control strategies.
- Article
(6882 KB) - Full-text XML
-
Supplement
(1141 KB) - BibTeX
- EndNote


Ozone (O3) is a potent oxidant in the atmosphere, playing a key role in the oxidation of trace gases in the troposphere. However, the high concentrations of surface O3 represent a significant environmental and public health challenge, as they are known to cause serious harm to human health and vegetation (Ashmore, 2005; Li et al., 2025b). Tropospheric O3 is also a significant greenhouse gas because of radiative effect (Kuai et al., 2017; Li et al., 2018). Due to its impacts on air quality and climate change, O3 has received sustained attention from the scientific community and policymakers over the past decades. In China, despite substantial reductions in many primary air pollutants in recent years, surface O3 concentrations have remained persistently high and have even increased in some regions and periods (Fu et al., 2020; Han et al., 2024; Huang et al., 2021; Liu and Wang, 2020; Nelson et al., 2024; Yan et al., 2024). This contrasting response of O3 concentrations to emission reductions is closely related to the highly nonlinear photochemical dependence of O3 formation on its major precursors, nitrogen oxides () and volatile organic compounds (VOCs).
Although tropospheric O3 is generated by NO2 photolysis (Dickerson et al., 1982), its net production of O3 was governed by the coupling between the NOx cycle and ROx cycle, where ROx denotes the sum of hydroxyl radicals (OH), hydroperoxyl radicals (HO2), and organic peroxy radicals (RO2) (Tan et al., 2019; Wang et al., 2017). Representative reactions involved in these coupled cycles are summarized in Table S1 in the Supplement and a simplified schematic O3 formation mechanism and coupling of NOx cycle and ROx cycle was shown as Fig. S1 in the Supplement. Due to this coupled NOx–ROx cycle involves highly nonlinear photochemical reactions, accurately simulating O3 formation remains challenging. Given the limitations of field observations and laboratory experiments in capturing the regional-scale spatial distributions, temporal variabilities, and the associated formation and transport processes of O3, air quality models have become essential tools for quantitatively understanding O3 formation mechanisms and evaluating emission control strategies. The accuracy of regional air quality model simulations of O3 are influenced by emission inventories, meteorological inputs, grid resolution, boundary conditions and atmospheric chemical mechanisms (Gao and Zhou, 2024; Du et al., 2026). Among these factors, gas-phase chemical mechanism is one of main sources of the model uncertainties (Gao and Zhou, 2024), which plays an important role in determine the chemical reactions rates governing O3 formation and loss pathways (Yu et al., 2010). Since the first tropospheric chemical mechanism was proposed in the 1960 s (Friedlander and Seinfeld, 1969), extensive researches on atmospheric chemical mechanisms has been conducted over the past few decades. The commonly used atmospheric photochemical mechanisms include the Master Chemical Mechanism (MCM) (Jenkin et al., 2015), Carbon Bond Mechanism (CBM) (Luecken et al., 2019), Statewide Air Pollution Research Center mechanism (SAPRC) (Carter, 1996), and Regional Atmospheric Chemistry Mechanism (RACM) (Goliff et al., 2013). From the perspective of chemical species, these photochemical mechanisms are generally classified as explicit or lumped mechanisms (Dodge, 2000). An explicit reaction mechanism includes all species involved in a chemical reaction, while a lumped reaction mechanism groups together species with similar chemical properties. Given the high computational demands of explicit reaction mechanisms, lumped chemical mechanisms such as CBM, SAPRC and RACM are the mainstream choices in the air quality models. These schemes utilize two distinct lumping approaches: structural classification (i.e., carbon-bond or functional groups, such as CBM) and reactivity-based classification (such as SAPRC and RACM).
The CBM classified by carbon-bond structures is the most widely applied chemical mechanism in air quality modeling studies for its low computational cost and the relative ease of obtaining emission inventories (Liu et al., 2023). Since it was first released in 1980 (Whitten et al., 1980), the CBM has retained its core carbon-bond lumping strategy while undergoing successive developments, with the latest CB6 series as its most recent advancement, in response to evolving research demands. However, the representation of RO2 chemistry in CBM remains highly lumped, employing a single generic surrogate (e.g., XO2) to approximate the collective reactivity of structurally diverse alkyl peroxy radicals, while a few key species (e.g., toluene peroxy radical, acetylperoxy radical) are treated explicitly (Zaveri and Peters, 1999). The simplified peroxy radical chemistry may reduce the efficiency of radical chain propagation and lead to lower O3 formation (Simonaitis et al., 1997). Unlike the highly lumped CBM, the SAPRC mechanism classifies organic species according to their OH reactivity, features the detailed description of reactions involving specific VOCs and provides a more mechanistically explicit treatment of peroxy radical (Carter, 2010b; Carter et al., 2025). And SAPRC mechanism achieves a deliberate balance between computational efficiency and chemical complexity through its chemical operator approach (Carter, 2010b, a). However, although this chemical operator method offers advantages in computational efficiency, it sacrifices chemical specificity in distinguishing RO2 radicals derived from specific VOC precursors and thereby impedes the accurate quantification of RO2 production attributable to individual precursor VOCs. The RACM mechanism is similar to that of the SAPRC mechanism, albeit with different criteria for classification by OH reactivity (Goliff et al., 2013; Stockwell et al., 1997). It was developed based on the Regional Acid Deposition Model versions (RADM and RADM2) with substantial improvements in representation of alkene chemistry compared to RADM (Stockwell et al., 1997; Goliff et al., 2013; Stockwell et al., 1990). It was subsequently updated to RACM2 to further revise the oxidation pathways of isoprene, terpenes, and aromatic compounds (Goliff et al., 2013). The RACM mechanism preserves the carbon structure of emitted species, explicitly simulates individual peroxyl radicals, and minimizes reliance on lumped species which are often referred as operators for radical cycle. These attributes make RACM2 particularly well-suited for comparison with observational data, ensure transparency in the mapping of emission inventories, and provide flexibility for modification and further expansion, while maintaining computational efficiency comparable to that of SAPRC mechanisms and suitable for regulatory applications.
Previous mechanism intercomparisons suggested that the selection of photochemical chemistry can substantially affect simulated O3 and oxidant levels (Gupta and Mohan, 2015; Kitayama et al., 2019; Li et al., 2025a; Shareef et al., 2022). CBMZ produced less O3 overestimation than RACM in WRF/Chem simulations over Delhi (Gupta and Mohan, 2015). Over Japan, mechanism-dependent O3 differences reached 10 ppbv, with CB05TUCL generally lower than SAPRC07TC and RACM2 close to SAPRC07TC (Kitayama et al., 2019). Similarly, SAPRC07 and RACM2 yielded higher summer O3 than CB6R3 in Alberta, accompanied by OH increases of about 30 % and 100 %, respectively (Shareef et al., 2022). Li et al. (2025a) also reported that SAPRC07 outperforms CB06 in predicting peak O during exceedances in the Great Bay Area in China, due to the more detailed VOC treatment in SAPRC07. Moreover, a recent comparative study using box models has demonstrated that CB06 and SAPRC07 both tended to underestimate OH than RACM2, which may subsequently lead to lower O3 production (Liu et al., 2023). Considering the availability of compatible emission inventories, three-dimensional air quality simulations in China have relied primarily on CBM and SAPRC-family mechanisms, whereas RACM has been largely used in box-model analyses (Liu et al., 2023). The limited use of RACM in three-dimensional models leaves its effects on simulated O3 difficult to assess, although mechanism intercomparison studies have shown that photochemical chemistry choices can substantially affect O3 simulations. Despite these advances, the influence of different photochemical mechanisms on three-dimensional O3 simulations over China remains poorly constrained, and systematic evaluations of the resulting uncertainty are still scarce (Huang et al., 2025; Liu et al., 2023).
Chengdu, a megacity in southwest China, covers a total area of about 14 335 km2, and the resident population was more than 20 million in 2025. In recent years, the total gross domestic product (GDP) of Chengdu was increasing rapidly, around 2.35 trillion dollars CNY in 2024 (available at https://www.sc.gov.cn/, last access: 11 November 2026, in Chinese). It is designated as a major regional center in western China, and expected to become one of the economic centers in western China. It features dense urban population, advanced industry and the highest car ownership in China, leading to high intensity of anthropogenic emissions (Wang et al., 2022; Zhou et al., 2019). Affected by the terrain of the unique deep basin and unfavorable meteorological conditions (Shu et al., 2021; Zhang et al., 2019), O3 and its precursors in Chengdu are prone to accumulate and further intensify chemical recycling in the local atmosphere (Wang et al., 2024; Tan et al., 2018). During 2022–2024 year, the 90th percentile of the maximum daily 8 h average (MDA8) O3 concentration in Chengdu (https://sthj.chengdu.gov.cn/, last access: 11 November 2026) was 168–181 µg m−3, continuously exceeding the secondary standard of the Ambient Air Quality Standard (GB3095-2012). Therefore, sustained investigation into the photochemical formation mechanisms and mitigation frameworks for O3 pollution in Chengdu is imperative. A more profound understanding and mechanistic discrepancies under varying NOx conditions within this region is essential for refining model evaluation and enhancing the reliability of predictive simulations.
To assess the uncertainties associated with gas-phase photochemical mechanisms under varying NOx conditions, we simulated an O3 episode in Chengdu from 9–18 August 2019 using the Community Multiscale Air Quality (CMAQ) model (Byun and Schere, 2006) with three chemical mechanisms (CB06, RACM2 and SAPRC07). A mechanism-specific VOC emission inventory was additionally developed for RACM2 through species mapping to ensure consistent representation of precursor emissions across the simulations. We systematically compared the three mechanisms in terms of simulated O3 and key photochemical species, O3 budgets, ROx cycle, and O3 sensitivities to precursor emissions under high-NOx urban and low-NOx suburban conditions. This study helps to profoundly understand the difference among the photochemical mechanisms and identify the key drivers of O3 formation under varying NOx condition, and benefits the mechanism selection for provide scientific and the formulation of precise emission control strategies.
2.1 Site descriptions and observational data
Chengdu, located in southwestern China, features a heterogeneous landscape that transitions from dense urban environments to peripheral croplands and woodlands (Fig. 1a). To investigate mechanistic discrepancies under varying NOx conditions, we conducted in-situ field observations at two contrasting sites during an O3 pollution episode from 9–18 August 2019. The Sichuan Academy of Environmental Sciences (SAES) site, situated in urban core, represents a typical high-NOx environment. Conversely, the Xinjin (XJ) site, characterized by more extensive vegetation cover, represents a relatively low-NOx suburban environment. During this O3 episode, the concentrations of NOx at SAES were significantly higher than those at XJ (Fig. 1b), reflecting a sharp urban–suburban emission gradient.
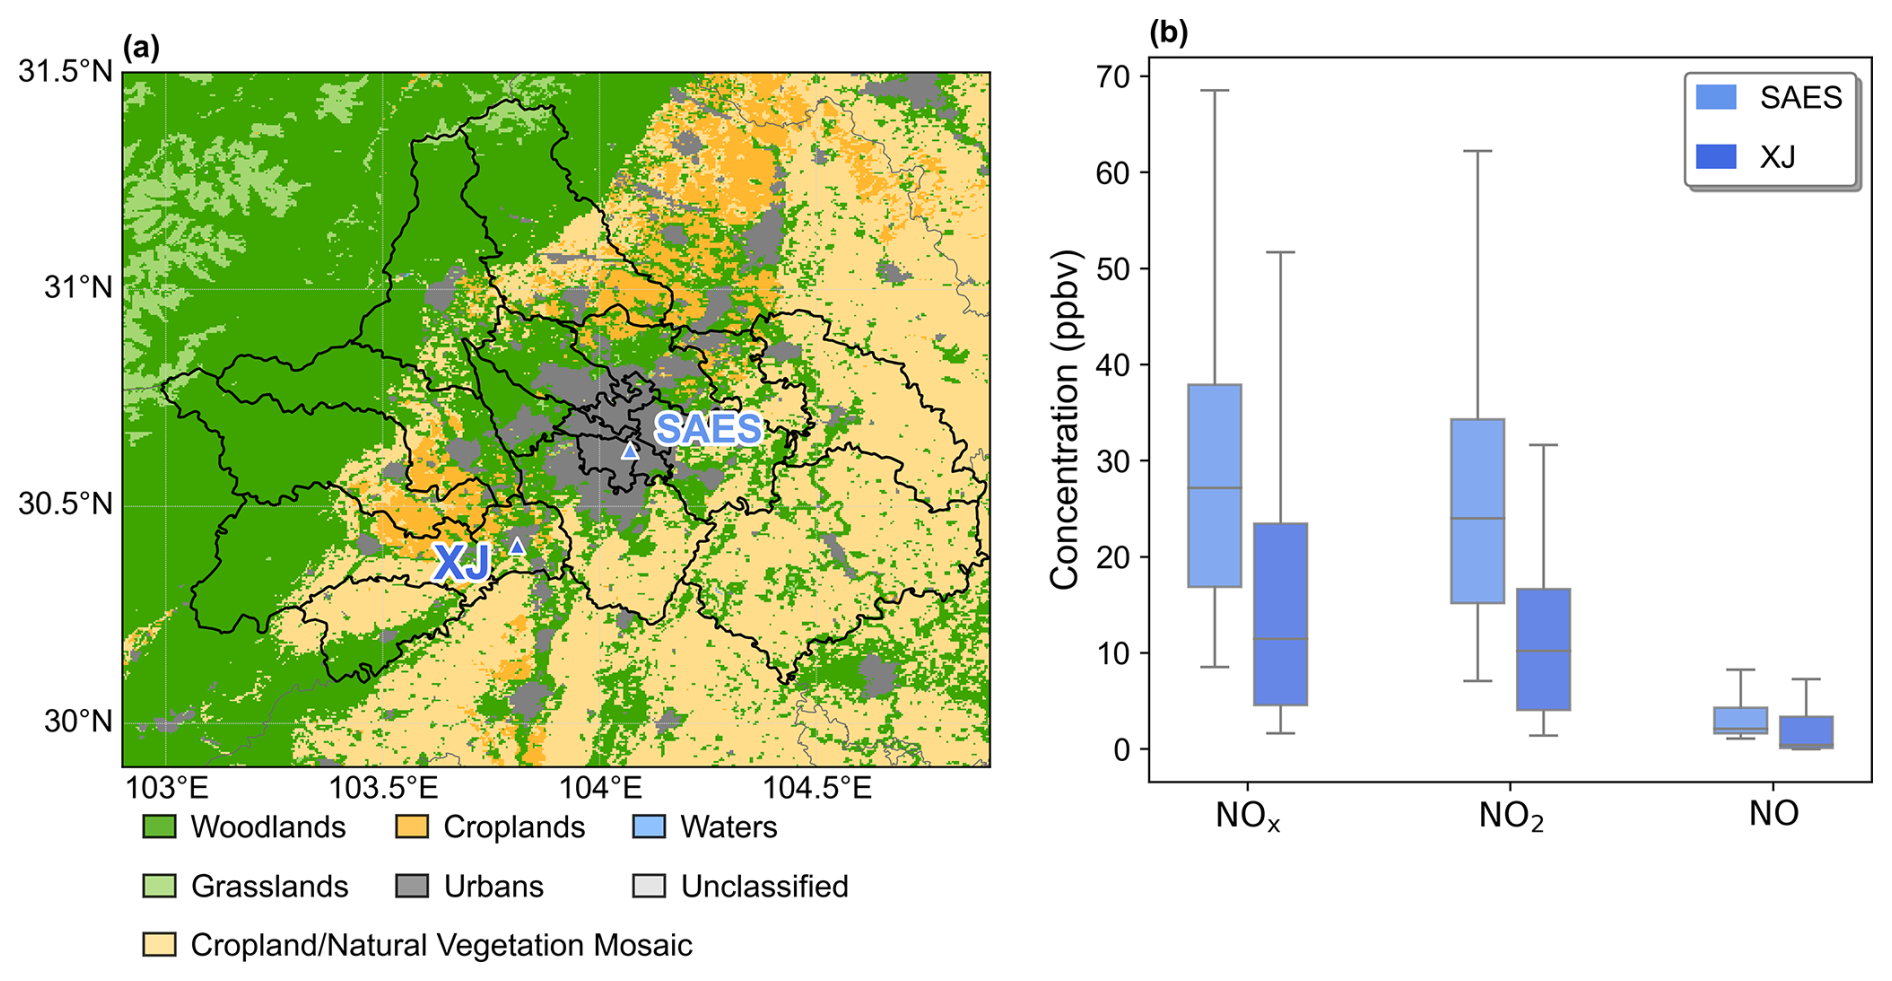
Figure 1(a) Land-use types in Chengdu and surrounding areas. The light blue and dark blue triangles indicate the locations of the Sichuan Academy of Environmental Sciences (SAES) site and Xinjin (XJ) sites, respectively. (b) Distribution of NOx, NO2 and NO concentrations at the SAES site and XJ site during the pollution episode. NOx is defined as the sum of NO and NO2. The units of concentrations are in ppbv. The box plots present the 10th, 25th, 50th, 75th, and 90th percentiles of the concentrations individually.
Hourly meteorological parameters and trace gases were obtained. The meteorological parameters included wind speed at 10 m (WS10M), temperature at 2 m (T2M) and relative humidity (RH). The trace gases include O3, NOx, isoprene (ISOP), nitric acid (HNO3) and nitrous acid (HONO) at the urban site (SAES), and O3, NOx, HONO, ISOP, and formaldehyde (HCHO) at the suburban site (XJ). The details of instruments for measuring trace gases are summarized in Table S2 in the Supplement. Furthermore, hourly concentrations of atmospheric radicals (OH and HO2) were measured at the XJ site using the Peking University laser-induced fluorescence system (PKU-LIF). This system, which utilizes the fluorescence assay by gas expansion (FAGE) technique (Fuchs et al., 2008), has been widely applied to high-fidelity radical measurements in field campaigns cross China (Lu et al., 2012; Tan et al., 2017). Details of the LIF system used in this study are provided by Yang et al. (2021). Network monitoring hourly O3 and NO2 data were obtained from the China National Environmental Monitoring Center (https://air.cnemc.cn:18007/, last access: 11 November 2026). Detail location information of the monitoring sites is as shown in the Table S3 in the Supplement.
2.2 WRF-CMAQ Modeling
The CMAQ (version 5.5) simulations were performed using two-way nested domains, consisting of a 27 km outer domain covering China and a 3 km inner domain focused on the Chengdu Plain (Fig. S2 in the Supplement). Three photochemical mechanisms were evaluated using their respective gas-phase and aerosol modules: cb6r5_ae7_aq (Luecken et al., 2019), saprc07tic_ae7i_aq (Xie et al., 2013) and racm2_ae6_aq (Sarwar et al., 2013), representing the CB06, SAPRC07, and RACM2 photochemical mechanisms, respectively. Meteorological forcing was provided by the Weather Research & Forecasting Model (WRF) version 4.6, with specific physics configurations detailed in Table S4 in the Supplement. Biogenic emissions were prepared using the Model of Emissions of Gases and Aerosols from Nature version 3.2 (Guenther et al., 2012), while anthropogenic emissions were derived from the Multi-resolution Emission Inventory for China (MEIC) (Zheng et al., 2018; Li et al., 2017; Geng et al., 2024). To address discrepancies in VOC species across mechanisms, different mapping strategies were employed. While VOCs emissions for SAPRC07 are directly obtained by the MEIC inventory, those for CB06 were derived by mapping from the CB05 and SAPRC07 schemes following the methodology described in Huang et al. (2023). To ensure inter-mechanistic consistency, a customized VOC emission inventory for RACM2 was specifically constructed through species mapping based on the MEIC database (see Sect. 2.3 and Table 1 for details). A summary of the VOCs inputs for all three mechanisms is provided in Table S5–S7 in the Supplement. For each simulation, a 3 d spin-up period was utilized to minimize the influence of initial conditions.
To quantify the reaction rates of individual chemical reaction or combinations of chemical reaction, the Integrated Reaction Rate (IRR) analysis module of CMAQ was employed. This diagnostic tool allows for a detailed assessment of the influence of specific chemical pathways on O3 concentrations. Moreover, to identify key primary precursor emission driving O3 formation, the Decoupled Direct Method in Three Dimensions (DDM-3D) module in CMAQ was used to calculate the sensitivities of O3 to NOx and primary VOC emission. CMAQ-DDM-3D can directly calculate the first-order sensitivity of pollutant concentrations to emission changes, eliminating the need for re-simulations and greatly reducing computational costs and simulation uncertainties (Cohan et al., 2005; Dunker, 1984; Dunker et al., 2002; Napelenok et al., 2006, 2008).
The WRF simulation was evaluated against meteorological observations of T2M, RH and WS10M at the SAES and XJ sites. The corresponding time series was shown in Figs. S3–S5 in the Supplement and model performances were quantified using several statistical metrics, including correlation coefficient (R), mean bias (MB), root-mean-square error (RMSE), and gross error (GE). The definitions and calculation formulas for these metrics are provided in Table S8 in the Supplement, and the corresponding evaluation results are summarized in Table S9 in the Supplement. The WRF simulation generally captured the observed variations in T2M and RH, with correlation coefficients ranging from 0.81–0.93. The RMSE for WS10M (1.4–1.6 m s−1) were below the commonly benchmark of 2.0 m s−1 recommended by (Emery et al., 2001). Moreover, compared to previous studies (T2M: ; RH: and ; WS10M: and ) over SCB in summer (Qiao et al., 2019), the statistical indices of T2M (), RH ( and ) and WS10M ( and ) in this study was closer to observation. Overall, the simulated meteorological fields provided a reasonable basis for the subsequent CMAQ simulations.
2.3 Development of a customized emission inventory for RACM2
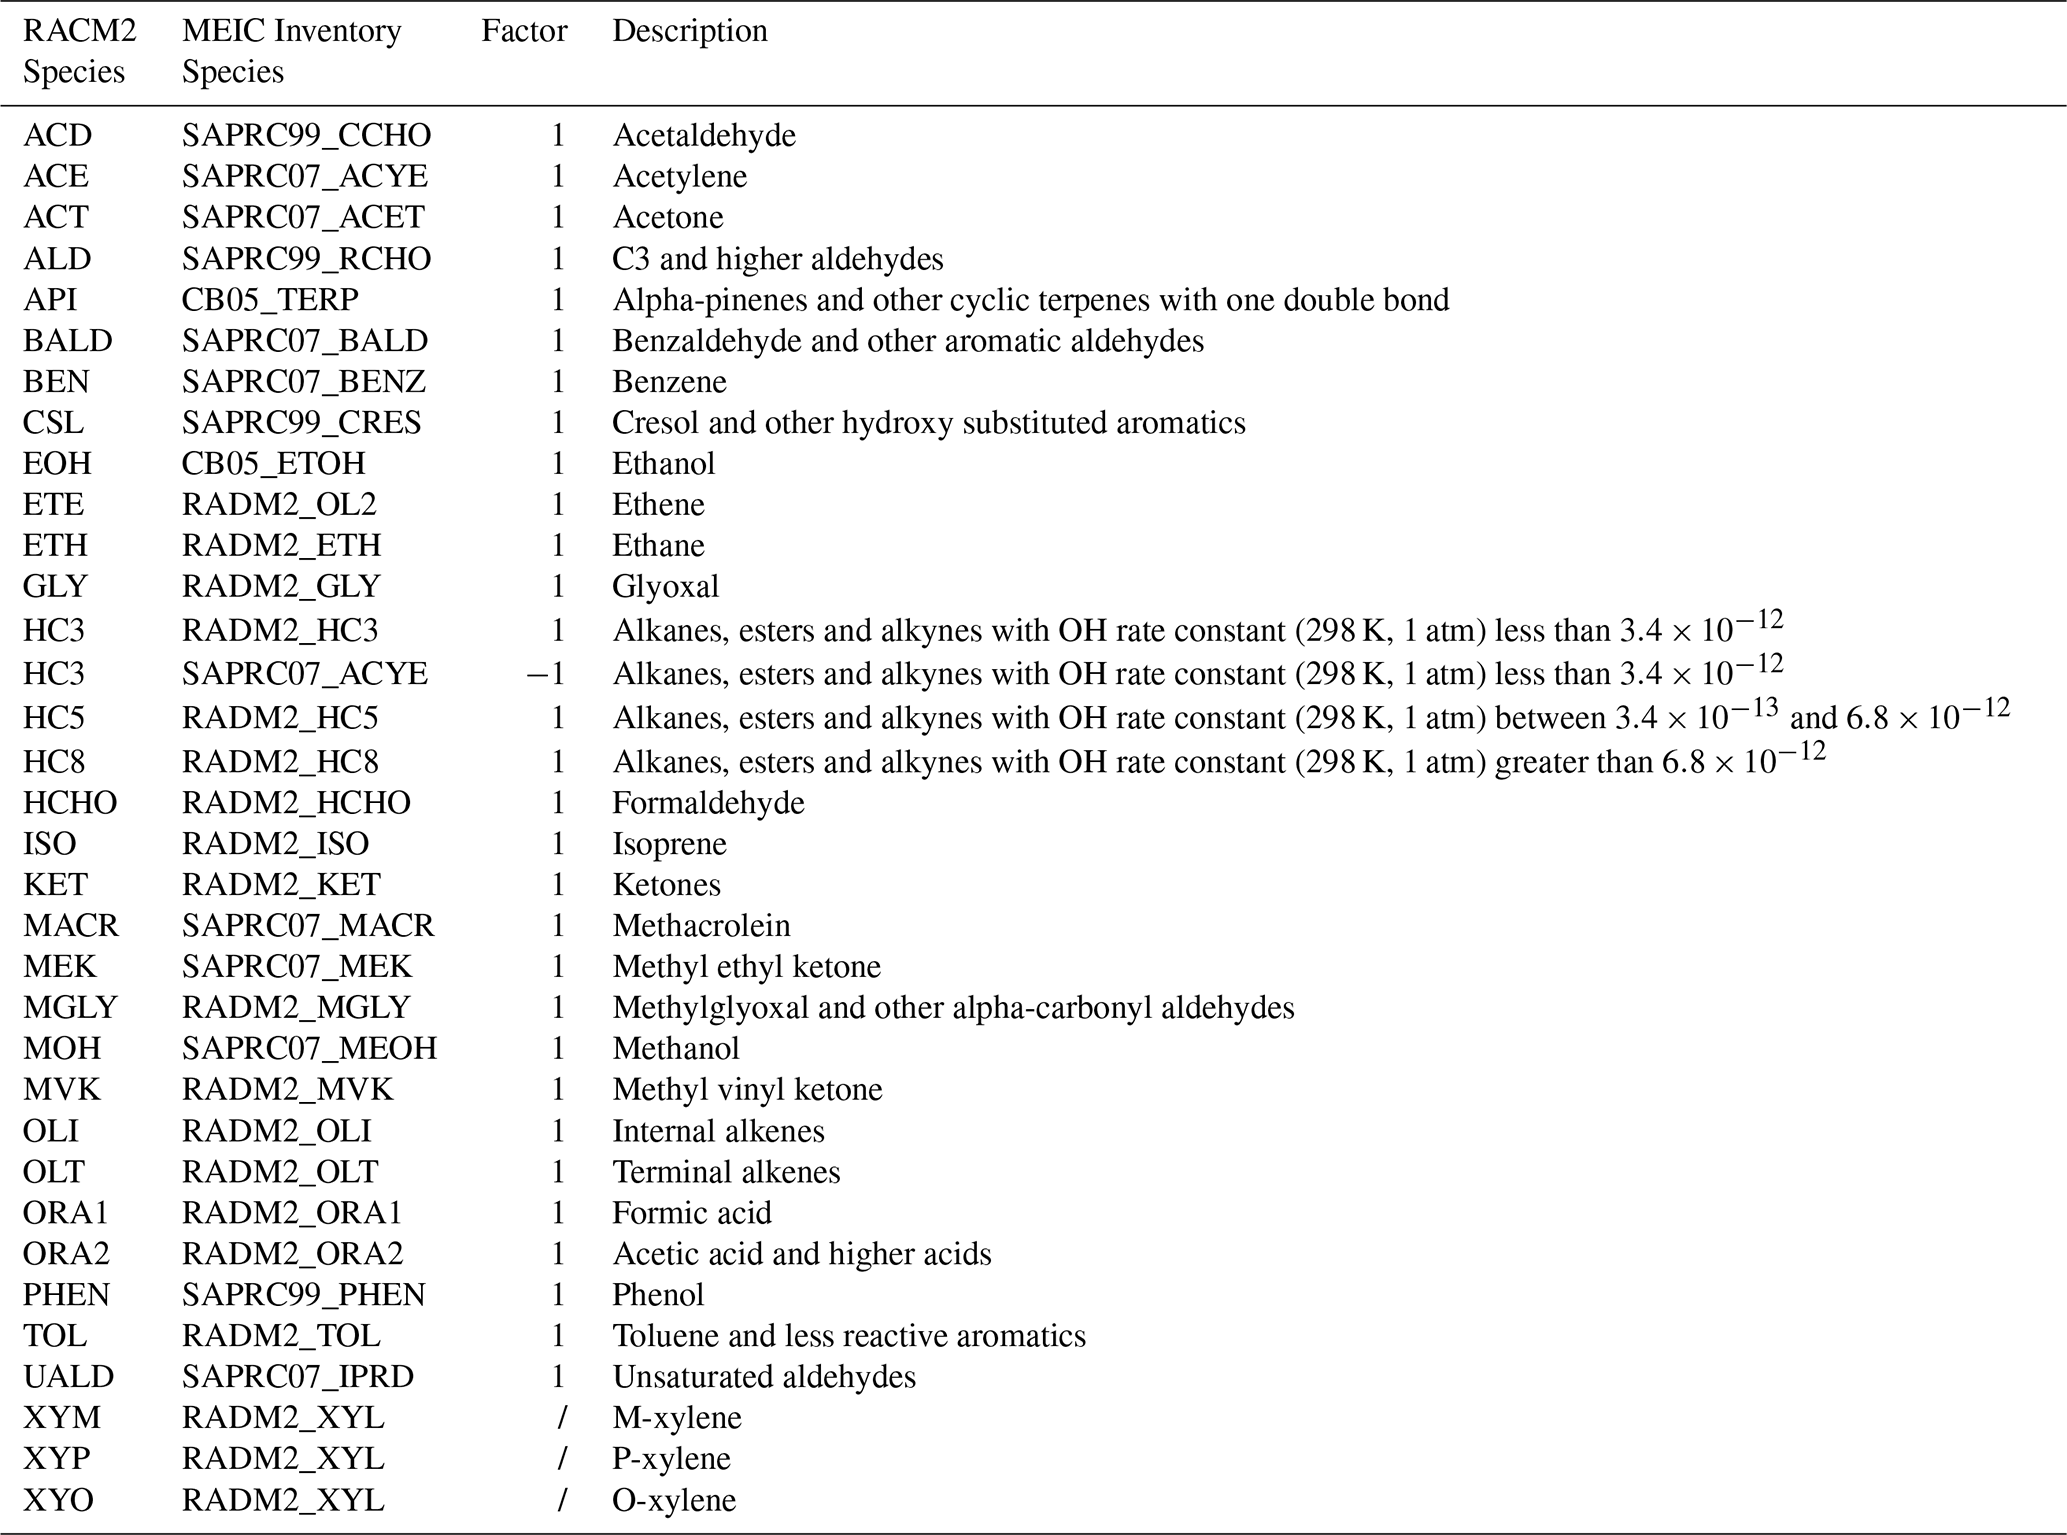
To evaluate the performance of the RACM2 mechanism in simulation atmospheric photochemical pollution, we developed a customized VOC emission inventory. This was necessitated by the fact that the mainstream MEIC database does not directly provide anthropogenic VOC emissions tailored for RACM2. Consequently, we constructed this inventory through species mapping, leveraging existing MEIC data for other chemical mechanisms including CB05, SAPRC99, SAPRC07, and RADM2. The detailed mapping protocols are summarized in Table 1. Moreover, the conversion of RADM2_XYL to RACM2_XYM, RACM2_XYP, and RACM2_XYO was informed by sector-specific proportions of these species in established VOC emission profiles (Sha et al., 2021).
Table 1Mapping of VOC emission species from other chemical mechanisms to RACM2 in the MEIC inventory.
2.4 Analytical framework for O3 budget
In the troposphere, photolysis of NO2 produces NO and O(3P) atom, which subsequently reacts with O2 to form O3 (Dickerson et al., 1982). In the absence of other chemical species, newly formed O3 can rapidly react with NO and regenerate NO2, resulting in a closed cycle with no net O3 accumulation (R1–3 Table S1). However, in the real atmosphere, other key oxidizing agents such as HO2 and RO2 in the troposphere can also oxidize NO to NO2 (Monks, 2005). The combination of these reactions (R1–2 and R11–12 in Table S1) lead to net O3production in the troposphere (Tan et al., 2018). Following this mechanism, the gross O3 formation rate (F(O3)) given approximately by the rate at which the HO2 and each RO2 species i oxidize NO to NO2 is calculated using Eq. (1), where k represents the bimolecular reaction rate constant.
Conversely, O3 loss pathways include O3 photolysis to O(1D) (followed by the reaction of O(1D) with water vapor) and ozonolysis of alkenes, and reactions with OH and HO2. Additionally, the reaction of NO2 with OH, which effectively removes NOx from the cycle by forming HNO3, is also accounted for one of the O3 loss pathways. The total O3 destruction rate (D(O3)) is determined by Eq. (2).
It noted that the first term for O3 photolysis in Eq. (2) is only including the reaction of O(1D) with H2O to generate OH, which leads to net O3 loss. Other O(1D) loss channels (e.g., quenching by N2 or O2) regenerate O3 through O(3P)+O2 and thus have no net effect on O3 destruction, resulting in that they are excluded from this term accordingly.
Consequently, the net O3 production rate P(O3) is defined as the difference between the gross O3 formation rate and the O3 destruction rate, as shown in Eq. (3).
2.5 Analytical framework for ROx radical budget
The ROx radical budget is determined by the initial and termination reactions. The main sources of primary ROx radicals that initiate the ROx cycle include the O(1D) channel of O3 photolysis, and photolysis of HONO, HCHO, and other carbonyls, as well as the ozonolysis of alkenes (Zhou et al., 2024; Yang et al., 2021; Xue et al., 2016; Wang et al., 2017), shown as in R4–R7 in Table S1. The production rate of primary ROx radicals is calculated as Eq. (4).
φOH in the first term for O3 photolysis in Eq. (4) is the yield of OH from the reaction of O(1D) with H2O. , , and are the yields of OH, HO2, and RO2 radicals, respectively, generated in the ozonolysis of each alkene species i with O3. denotes the yield of primary ROx radicals from photolysis of other carbonyls species i.
The termination reactions of ROx cycle are governed by the reactions of OH with with NO to form organic nitrate and the self-reaction among peroxy radicals (R14–20 in the Table S1). It removes radicals or NOx and prevents the explosive of ROx radicals in the atmosphere. The destruction rate of ROx radicals is calculated as Eq. (5).
φOrganic nitrate in the third term for the formation organic nitrate (RONO2) of in Eq. (5) is the yield of organic nitrate from the reactions of RO2 with NO.
The dominant termination reactions of ROx radicals vary under different NOx conditions. Under high NOx conditions, the terminations of the ROx and NOx cycles are primarily controlled by OH+NO2 and the organic-nitrate-forming branch of RO2+NO, which sequester reactive nitrogen as HNO3 and RONO2, respectively. In contrast, under low NO conditions, the terminations of ROx cycle were mainly driven by the self-reaction of HO2, and cross-reactions between HO2 and RO2, which further produce hydrogen peroxide (H2O2) and organic hydroperoxides (ROOH). Therefore, the ratios of major products or its production rates from termination reactions, such as , can provide a useful indicator of the prevailing radical-termination regime and the associated NOx chemical environment. Previous studies examined that the can be used as a robust indicator for determining O3 formation regimes (Wei et al., 2018; Liu et al., 2010; Cordiner et al., 2002). The classic threshold of separating the O3 formation regimes threshold range is [0.35, 0.65], whereas the threshold also varies with the region and season (Li et al., 2011; Wei et al., 2018; Xing et al., 2019).
3.1 Inter-mechanistic evaluation of modeled O3 and key precursors
3.1.1 Evaluation of inter-mechanistic O3simulation
Figure 2 illustrates the spatial distribution of MDA8 O3 concentrations simulated by the CB06, SAPRC07, and RACM2 mechanisms during the O3 pollution episode (9–18 August 2019). In general, the CB06 mechanism simulated the lowest O3 concentrations, while the SAPRC07 and RACM2 mechanisms simulated higher, comparable levels with largely consistent spatial patterns. Specifically, the regional mean MDA8 O3 for SAPRC07 and RACM2 in the Chengdu area were 96.1 and 94.8 ppbv, respectively, which were 16.1 and 14.8 ppbv higher than the 80.0 ppbv simulated by CB06. Compared with monitoring station observations, the MDA8 O3 concentrations simulated by SAPRC07 and RACM2 in the Chengdu urban area were in better agreement with the observations, while those simulated by CB06 were significantly lower. In contrast, at suburban sites such as XJ, SAPRC07 and RACM2 tended to overestimate MDA8 O3, whereas CB06 simulated lower concentrations and showed better agreement with the observations.
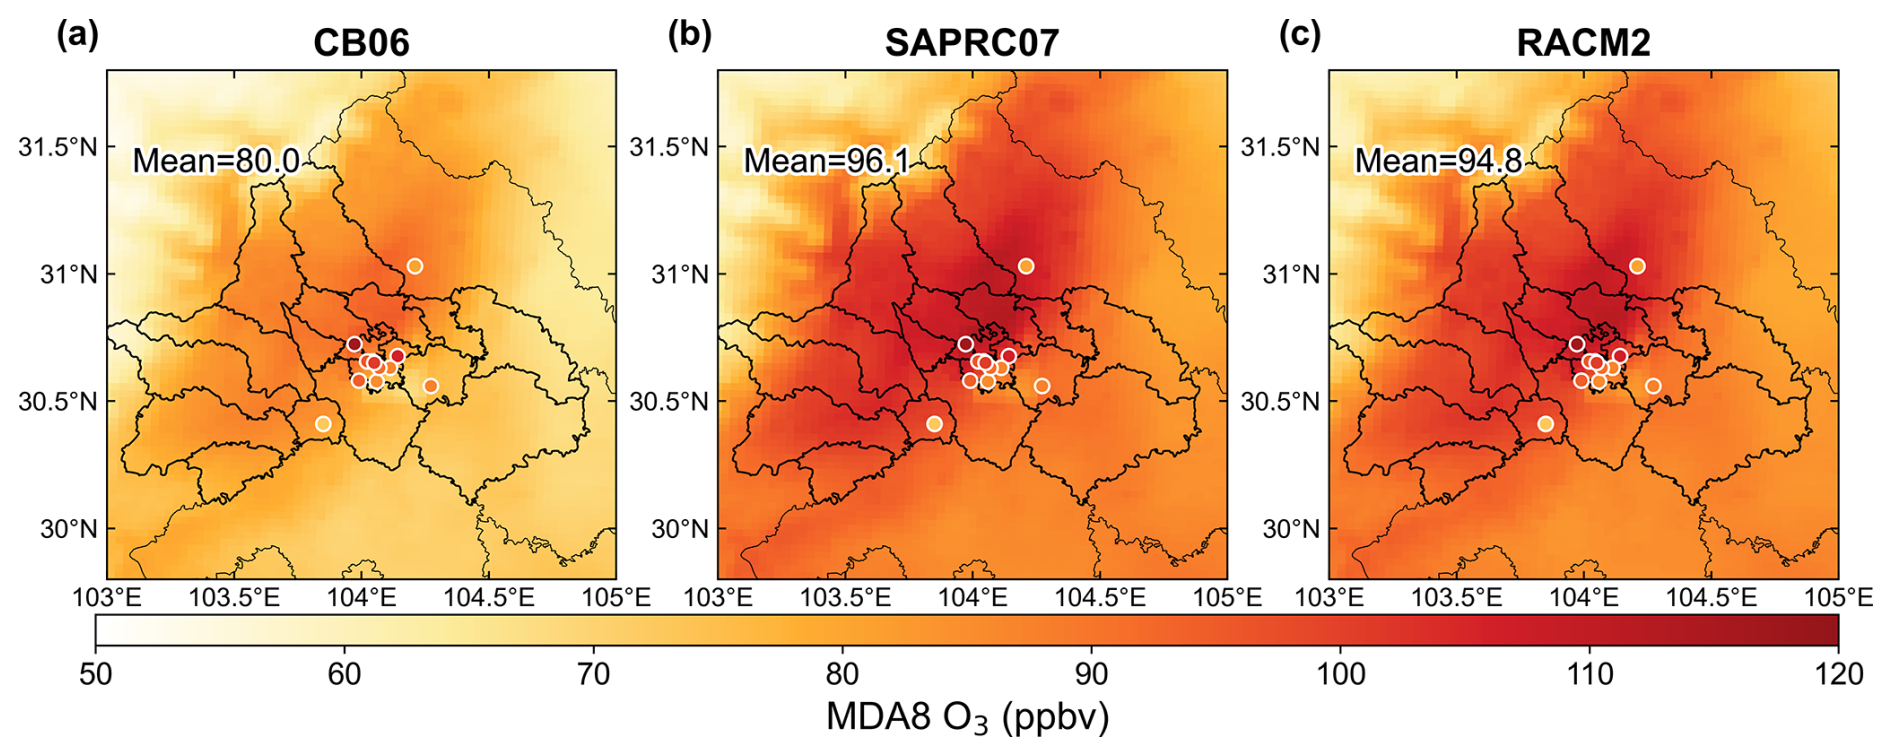
Figure 2Spatial distribution of maximum daily 8 h average (MDA8) O3 concentration simulated by CB06, SAPRC07, and RACM2 mechanisms. The solid dots represent the mean site-observed MDA8 O3 concentrations at monitoring sites.
The performance of the three photochemical mechanisms in simulating O3 pollution was further evaluated using mean fractional bias (MFB), mean fractional error (MFE), index of agreement (IOA), and correlation coefficient (R) at both urban and suburban sites (Fig. 3). The specific calculation methods for the statistical metrics are presented in Table S8. The locations information of sites used in this statistic analysis are provided in the Table S3. Statistical evaluation indicates that all three mechanisms met the established benchmarks for model performance (, MFE<65 %, R>0.6, and IOA>0.7) (Huang et al., 2025). However, the performances of the three gas-phase chemical mechanisms in reproducing O3 exhibited pronounced differences between urban and suburban environments.
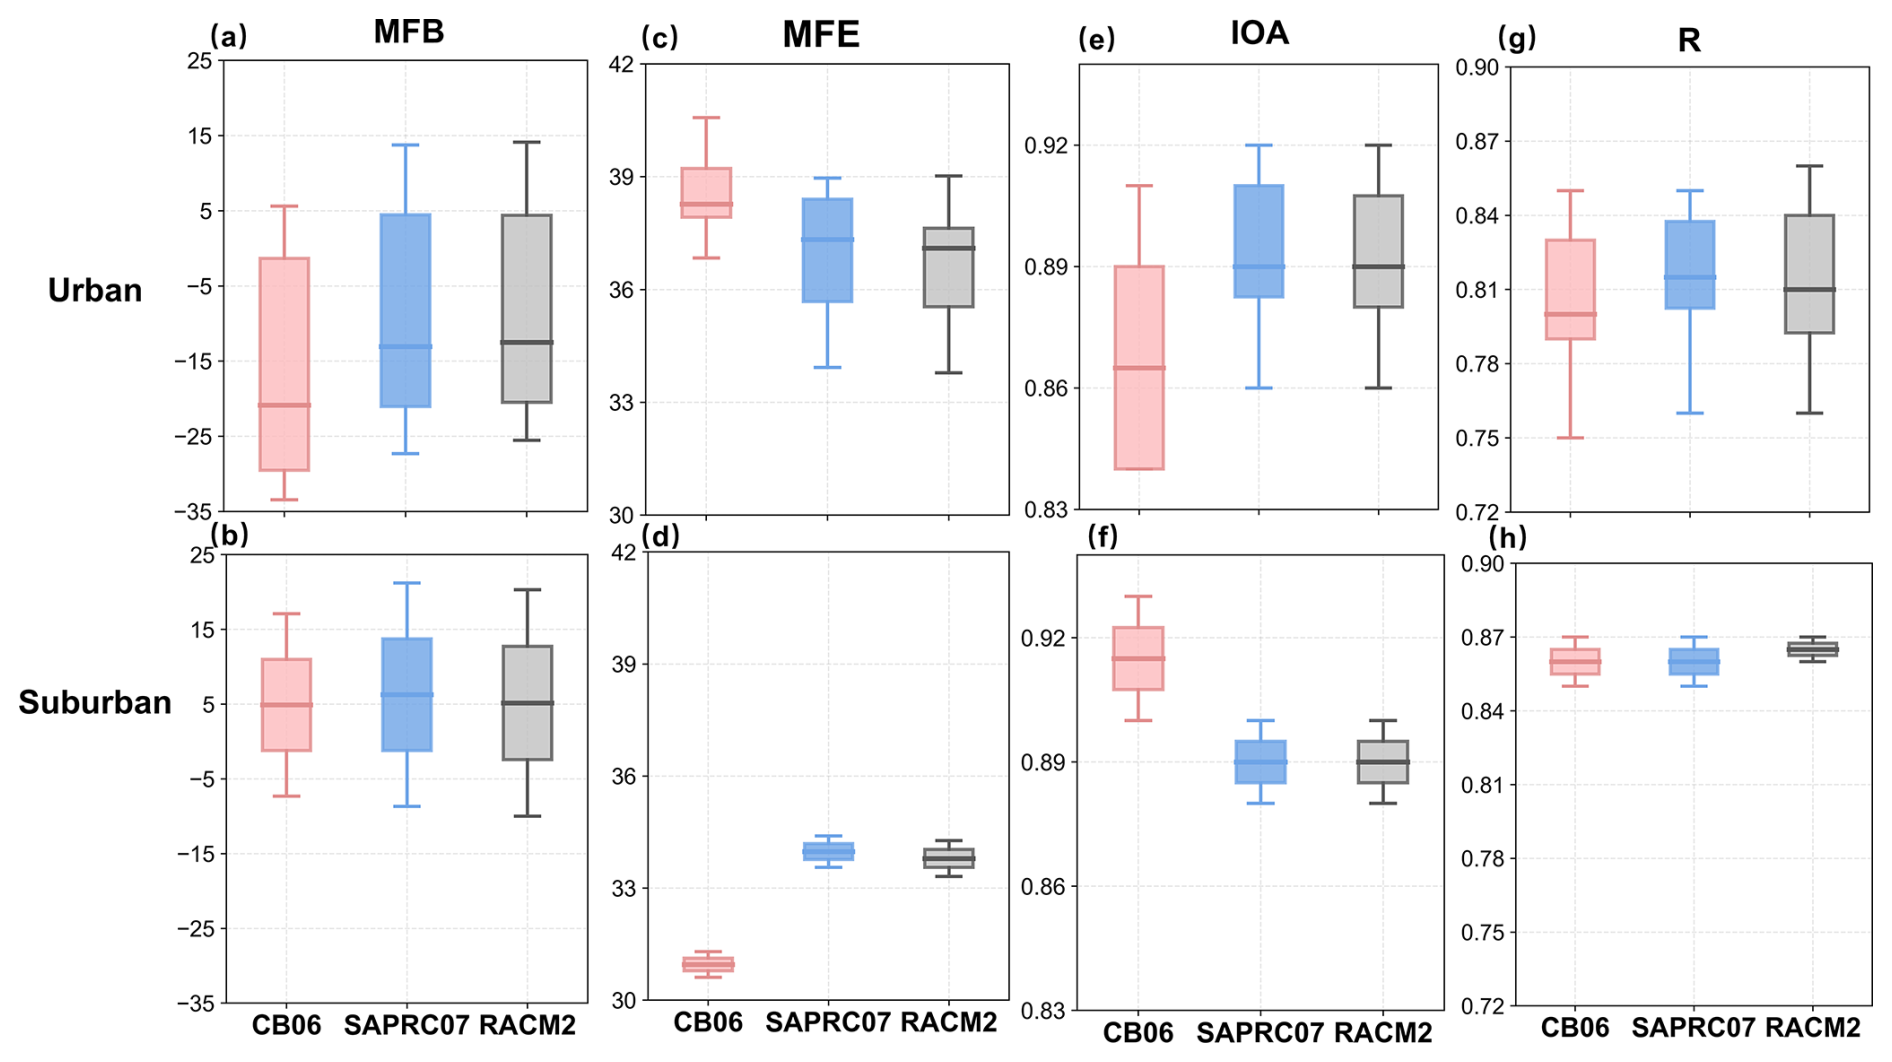
Figure 3Performance statistics of hourly O3 simulated using CB06, SAPRC07, and RACM2 mechanisms at urban sites and suburban sites across Chengdu region. The statistical metrics, including mean fractional bias (MFB), mean fractional error (MFE), index of agreement (IOA) and correlation coefficient (R), are presented. MFB and MFE are given as percentages. The unit of MFB and MFE is percent (%). The box plots present the 10th, 25th, 50th, 75th, and 90th percentiles of the statistical metrics individually.
At urban sites, the three mechanisms tend to underestimate O3 concentrations, with the median MFB less than zero. Among them, CB06 demonstrated the largest negative bias (with a median MFB of −20.9 %) with a wider range, while the MFB values for SAPRC07 (with a median MFB of −13.1 %) and RACM2 (with a median MFB of −12.5 %) are similar. Meanwhile, CB06 shows higher MFE (median value of 38.3 %) and lower IOA (median value of 0.87), whereas SAPRC07 and RACM2 have smaller simulation errors (with median MFE values of around 37 %) and better agreement (with median IOA values of around 0.89). The R values across the three mechanisms display similarity, with median values of around 0.8.
At suburban sites, the MFB values of the three mechanisms were similar and were overall slightly greater than zero (median values of around 5 %), suggesting these mechanisms overestimate O3 concentration. However, the MFE of CB06 (median value of 31 %) was lower than those of SAPRC07 and RACM2 (median MFE values of around 34 %), and its IOA (median value of 0.92) is also significantly higher than those of the other two mechanisms (median IOA values of around 0.89). The R values of the three mechanisms are all close to 0.86, with very small differences. Overall, at suburban sites, CB06 showed better agreement with observed O3, whereas SAPRC07 and RACM2 have similar simulation pattern. In addition, the smaller spread of the statistical metrics at suburban sites among the three mechanisms also suggests that inter-mechanistic differences in O3 simulation performance were less pronounced under low-NO suburban than high-NO urban conditions.
In general, the impact of gas-phase chemical mechanisms on the performances of simulating O3 varied markedly between urban and suburban sites. At urban sites, SAPRC07 and RACM2 mitigated the general underestimation of O3. At suburban sites, in contrast, all three mechanisms slightly overestimated O3, and the comparatively lower O3 concentrations simulated by CB06 resulted in closer agreement with observations. This discrepancies among the mechanisms for O3 simulation at urban and suburban sites were likely associated with the distinct NOx condition and dominant precursor species in urban and suburban environments. To comprehensively evaluate the performance of the three photochemical mechanisms in simulating O3 pollution, further in-depth comparative analysis with other indicators is essential.
3.1.2 Discrepancies in key photochemical intermediates under distinct NOx environments
The accuracy of simulation key photochemical species such as NO2, NO, HONO, ISOP, HCHO, and HNO3 is also one of the critical factors in evaluating the ability of different photochemical mechanisms, particularly under varying NOx concentrations. On the whole, all the three photochemical mechanisms significantly overestimated daytime NO2 concentrations at the urban site. At the suburban site, while SAPRC07 and RACM2 continued to exhibit notable overestimations, CB06 demonstrated superior agreement with observations (Fig. 4a and f). Specifically, at the urban site, the median simulated-to-observed NO2 ratios for SAPRC07, RACM2, and CB06 were 1.60, 1.54, and 1.46, respectively. In contrast, at the suburban site, SAPRC07 and RACM2 maintained higher biases with median ratios of 1.24 and 1.20, whereas CB06 yielded a near-perfect ratio of 1.01. The overestimation NO2 at the urban site in Chengdu is consistent with the findings of She et al. (2024). The possible reasons might be attributed that overestimation of NOx emission (Du et al., 2021) or inadequate representation of NO2 recycling pathways in the model (Luecken et al., 2019).
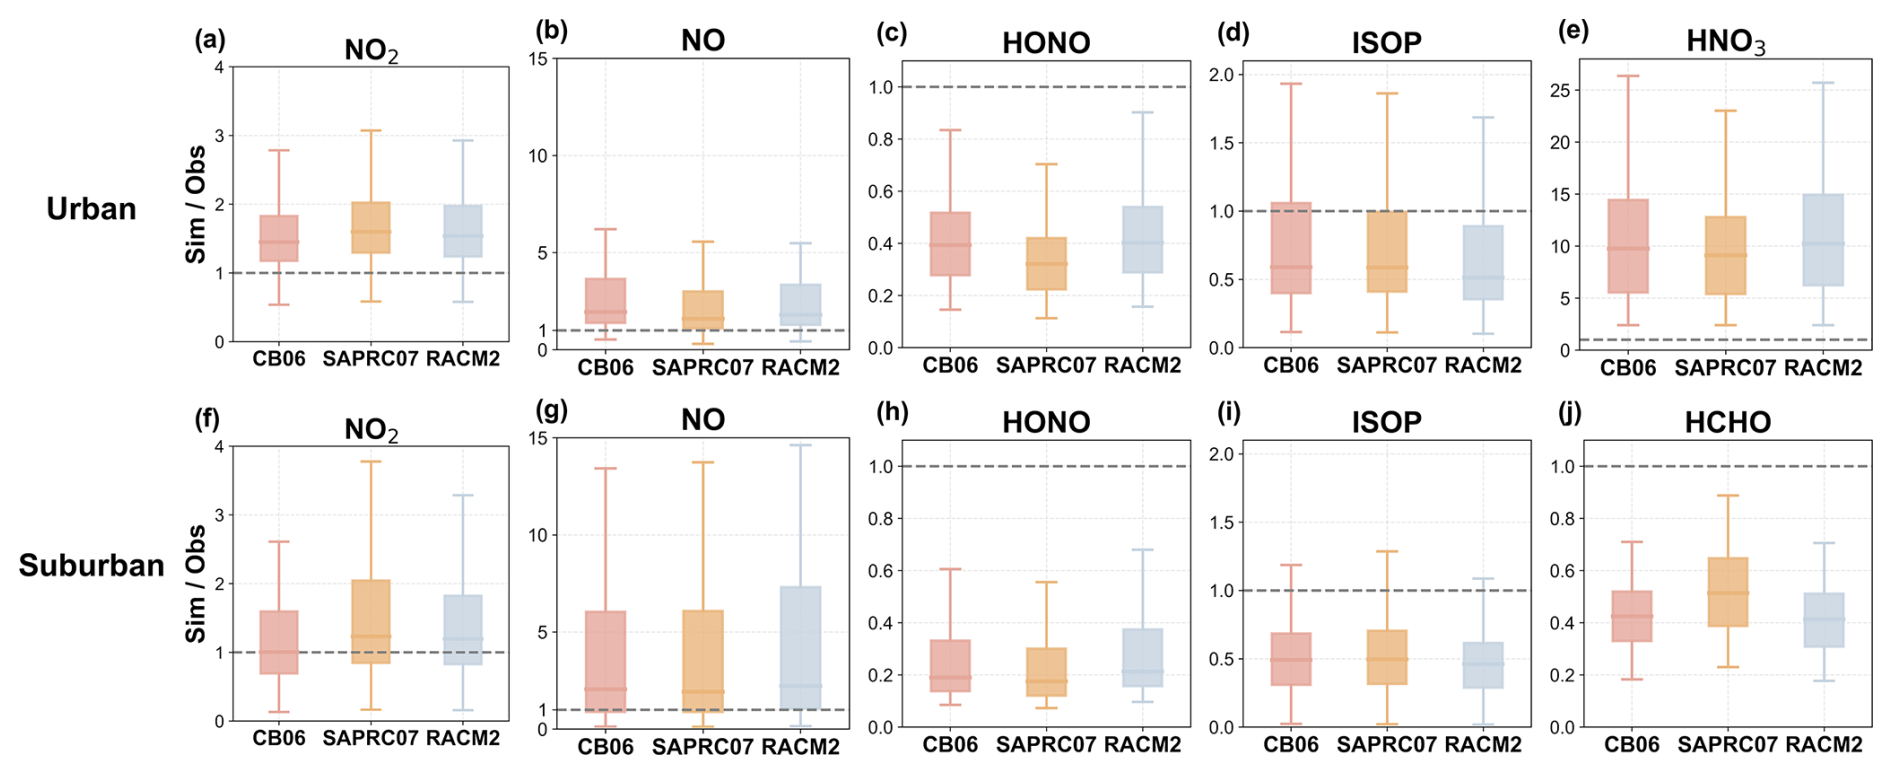
Figure 4Distributions of simulated-to-observed concentration ratios for key photochemical species obtained with CB06, SAPRC07, and RACM2 mechanisms at the urban site (SAES) and suburban site (XJ). The analysis covers daytime hours (08:00–18:00 local time). The box plots present the 10th, 25th, 50th, 75th, and 90th percentiles of the ratios individually. The dashed horizontal line denotes a ratio of 1.
The simulated NO exhibited a more pronounced site-dependent simulation bias than NO2 (Fig. 4b and g). At the urban site, the median simulated-to-observed NO ratios for CB06, RACM2, and SAPRC07 were 2.0, 1.8, and 1.6, respectively. These values indicated that all three mechanisms overestimated NO, with SAPRC07 showing the lowest median bias. At the suburban site, the corresponding median ratios were 2.1, 2.2, and 1.9, respectively. The ratio distributions at the suburban site were also substantially broader and exhibited pronounced upper tails, reflecting greater variability and severe overestimation. Overall, SAPRC07 yielded the lowest median bias at both sites, although none of the three mechanisms eliminated the positive bias in NO simulations, particularly at the suburban site. Consistent with previous studies, the overall performance of current air quality models in simulating NO remains limited (Kaynak et al., 2013). The bias may be associated with the uncertainties of emission inventories (Pennington et al., 2024) and the effects of numerical diffusion on simulated chemical processes (Zhu et al., 2024).
HONO, an important primary source of OH, plays a key role in atmospheric oxidation chemistry and the formation of secondary pollutants (Tan et al., 2017, 2026). Therefore, accurately representing HONO in air quality models is essential for reliably simulating atmospheric photochemistry and secondary pollution. Unlike the simulated NOx concentrations, HONO concentrations were substantially underestimated by all three photochemical mechanisms at both the urban and suburban sites (Fig. 4c and h). The underestimation may be partly related to missing HONO sources in the current modeling framework, including direct emissions (e.g., soil emissions, Wang et al., 2021, 2025b; vehicles, Trinh et al., 2017; and biomass combustion, Cui et al., 2021), heterogeneous processes (e.g., heterogeneous reactions of NO2 on aerosols and ground, Xuan et al., 2025; Zhang et al., 2021) and nitrate photolysis (Scharko et al., 2014; Ye et al., 2017). Notably, although the underestimations were particularly pronounced at the suburban site, inter-mechanistic discrepancies were larger under urban environment. Specifically, the median ratios of simulated-to-observed HONO at the urban site were 0.40 (RACM2), 0.38 (CB06) and 0.32 (SAPRC07), whereas at the suburban site, they dropped to 0.21, 0.19, and 0.18, respectively. RACM2 exhibited the smallest overall HONO underestimation among the three mechanisms. The substantial negative biases across all mechanisms highlight the need for improved representation of HONO sources and chemistry in CMAQ.
We further evaluated the simulation performance of ISOP, a key precursor originating from biogenic volatile organic compounds (BVOCs), across the three mechanisms. Similar to HONO, all the three chemical mechanisms systematically underestimated ISOP concentrations at both sites (Fig. 4d and i), with the pronounced negative biases at suburban site. These discrepancies may arise from a combination of factors, including underestimated anthropogenic isoprene sources (e.g., vehicle isoprene emission, Park et al., 2011), uncertainties in biogenic emission associated with coarse-resolution land-use data (Wang et al., 2025a), and uncertainties in the representation of ISOP oxidation chemistry (Von Kuhlmann et al., 2004).
HNO3 is a primary product of radical chain termination, particularly in high-NOx environments. Overall, the simulated HNO3 concentrations across all three chemical mechanisms were anomalously higher than observations at the urban site, with median simulated-to-observed ratios ranging from 9.13–10.27. The RACM2 exhibited the most pronounced bias, yielding a median ratio of 10.27 (Fig. 4e). The overestimations may be associated with the previously noted positive bias in NO2, which enhances the OH+NO2 reaction and consequently accelerates the production of HNO3.
HCHO is predominantly produced from the atmospheric oxidation of VOCs and represents an important primary source of ROx radicals through photolysis. Previous studies have shown that HCHO photolysis can contribute approximately 10 %–34 % of primary ROx production in China (Lu et al., 2013; Tan et al., 2017, 2019; Xue et al., 2016), highlighting the importance of accurately representing HCHO in air quality models for characterizing radical chemistry and atmospheric oxidation capacity. SAPRC07 showed the closest agreement with observations, with a median simulated-to-observed HCHO ratio of 0.51, compared with 0.42 and 0.41 for RACM2 and CB06 (Fig. 4j). This behavior is broadly consistent with previous modeling studies reporting substantial negative biases in simulated HCHO, including those using CB05 and MCM, which have been linked in part to uncertainties in the representation of isoprene oxidation chemistry (Marvin et al., 2017).
3.1.3 Comparisons in spatial–temporal ROx radicals
OH, HO2, and RO2 radicals are key components of atmospheric oxidation chemistry, mediating radical cycling and O3 formation. Their concentrations can serve as important metrics for assessing atmospheric oxidation capacity. To quantify inter-mechanistic differences in radical chemistry, we compared the spatial distributions of simulated OH, HO2, and RO2 across the region and examined their diurnal variations at the XJ site (Fig. 5).
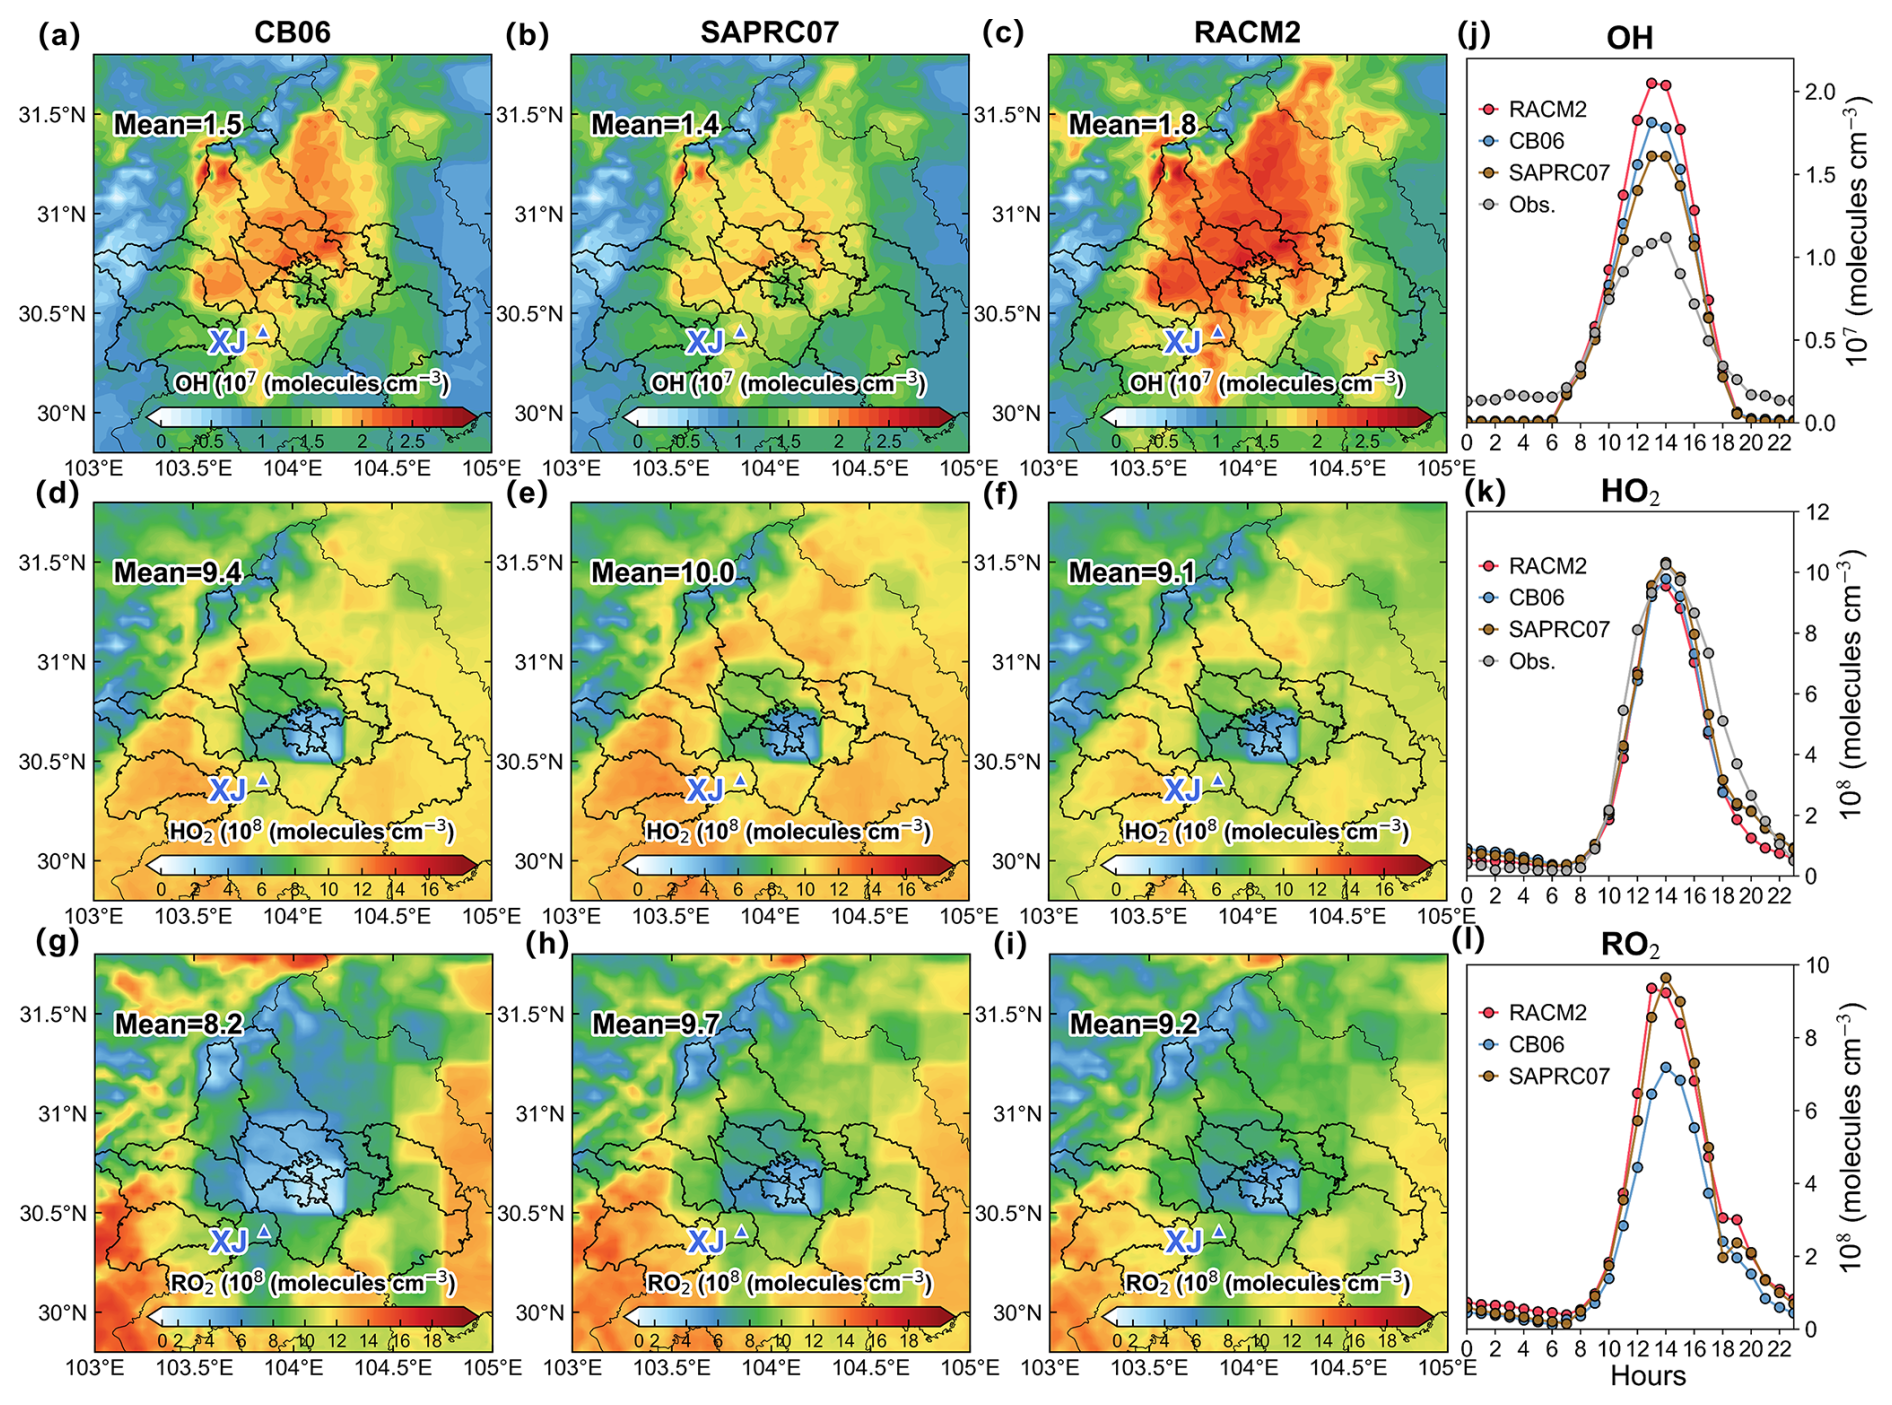
Figure 5Spatial distributions and diurnal variations of OH, HO2 and RO2 concentrations simulated by CB06, SAPRC07, and RACM2 mechanisms. Maps show the mean regional distribution at 14:00 LT. The right-hand panels show diurnal variations at the suburban XJ site. The dark blue triangle marks the location of the XJ site.
Generally, the three chemical mechanisms generally exhibited similar spatial distribution patterns for OH, HO2, and RO2 radicals, with comparable locations of high- and low-concentration regions across Chengdu (Fig. 5). For specific, the high-value region of OH concentrations across Chengdu region are mainly concentrated around the main urban area, while the a low-value region in the urban center. The response characteristics of OH to NOx concentrations are consistent with the distinct response patterns of OH concentration to varying NO levels across urban, forest, and marine environments revealed by Tan et al. (2026). The low OH concentration zone in heavily polluted urban may result from the reaction of OH and NO2, which is an important loss process for OH in urban (Ehhalt et al., 1990). In contrast to the spatial distribution of OH, HO2 exhibited a pronounced minimum over central Chengdu, with substantially higher concentrations in the surrounding areas. This urban HO2 depletion may be attributed to elevated NO levels. Under high-NO conditions, the reaction of HO2 with NO becomes a major HO2 loss pathway (Tang et al., 2006), leading to rapid HO2 consumption and consequently lower HO2 concentrations in the urban core than in the surrounding suburban areas. Across all three mechanisms, the spatial distribution of RO2 closely mirrors that of HO2.
Despite broadly consistent spatial patterns, the three mechanisms exhibited substantial differences in simulated radical concentrations and associated model performance. For OH, the RACM2 simulated the highest regional mean concentration (), compared with 1.5×10⁷ and for CB06 and SAPRC07, respectively. Consistently, the diurnal profiles at the XJ site further showed that RACM2 produced substantially higher daytime OH peaks than the other two mechanisms. This pattern is broadly consistent with previous studies reporting that CBM and SAPRC tend to predict lower OH levels than RACM2 (Liu et al., 2023). However, comparison with in situ observations at the XJ site indicates that all three mechanisms overestimated the observed peak OH concentrations, with the largest positive bias occurring in RACM2. This OH overestimation may enhance the OH+NO2 reaction and consequently contribute to excessive HNO3 production, particularly in RACM2, which also showed the largest positive HNO3 bias (Fig. 4e). In contrast to the OH behaviors, SAPRC07 produced the highest daytime HO2peaks at the XJ site, corresponding to the simulated highest mean HO2 concentration (), followed by CB06 () and RACM2 (). This feature coincided with the higher simulated-to-observed HCHO ratio for SAPRC07 (Fig. 4j). Because HCHO photolysis is one of important primary sources of HO2 radicals, the enhanced HCHO abundance in SAPRC07 may partly contribute to its higher simulated HO2 concentrations. For RO2 radicals, the CB06 mechanism yielded a regional mean RO2 concentration of , markedly lower than the 9.2×10⁸ and simulated by RACM2 and SAPRC07, respectively – a gap of approximately 11 %–16 %. And the diurnal variations further confirm that CB06 yields lower RO2 peak concentrations compared to RACM2 and SAPRC07.
Overall, the spatial distributions suggest greater inter-mechanistic variability in radical concentrations over the high-NOx urban area than over the surrounding regions, pointing to stronger mechanism dependence of radical chemistry under urban conditions. Moreover, the relatively similar simulated HO2 levels and the substantially larger inter-mechanistic differences in RO2 suggest that the differences in O3 formation may be largely related to variations in simulated RO2 abundance rather than HO2.
3.2 Budget analysis of O3 formation and loss pathways
To analyze inter-mechanistic discrepancies in O3 production, we evaluated mean diurnal reaction rates for O3 formation and loss pathways (Fig. 6). Clear inter-mechanistic differences were found in the simulated net O3 production rate P(O3), at both sites, with a consistent ordering of . Specifically, P(O3) values for RACM2, SAPRC07, and CB06 were 31.0, 29.6, and 25.0 ppbv h−1 at the urban site and 17.6, 17.4, and 15.1 ppbv h−1 at the suburban site, respectively. The inter-mechanistic differences in P(O3) were more pronounced under the high-NOx urban conditions than at the suburban site.
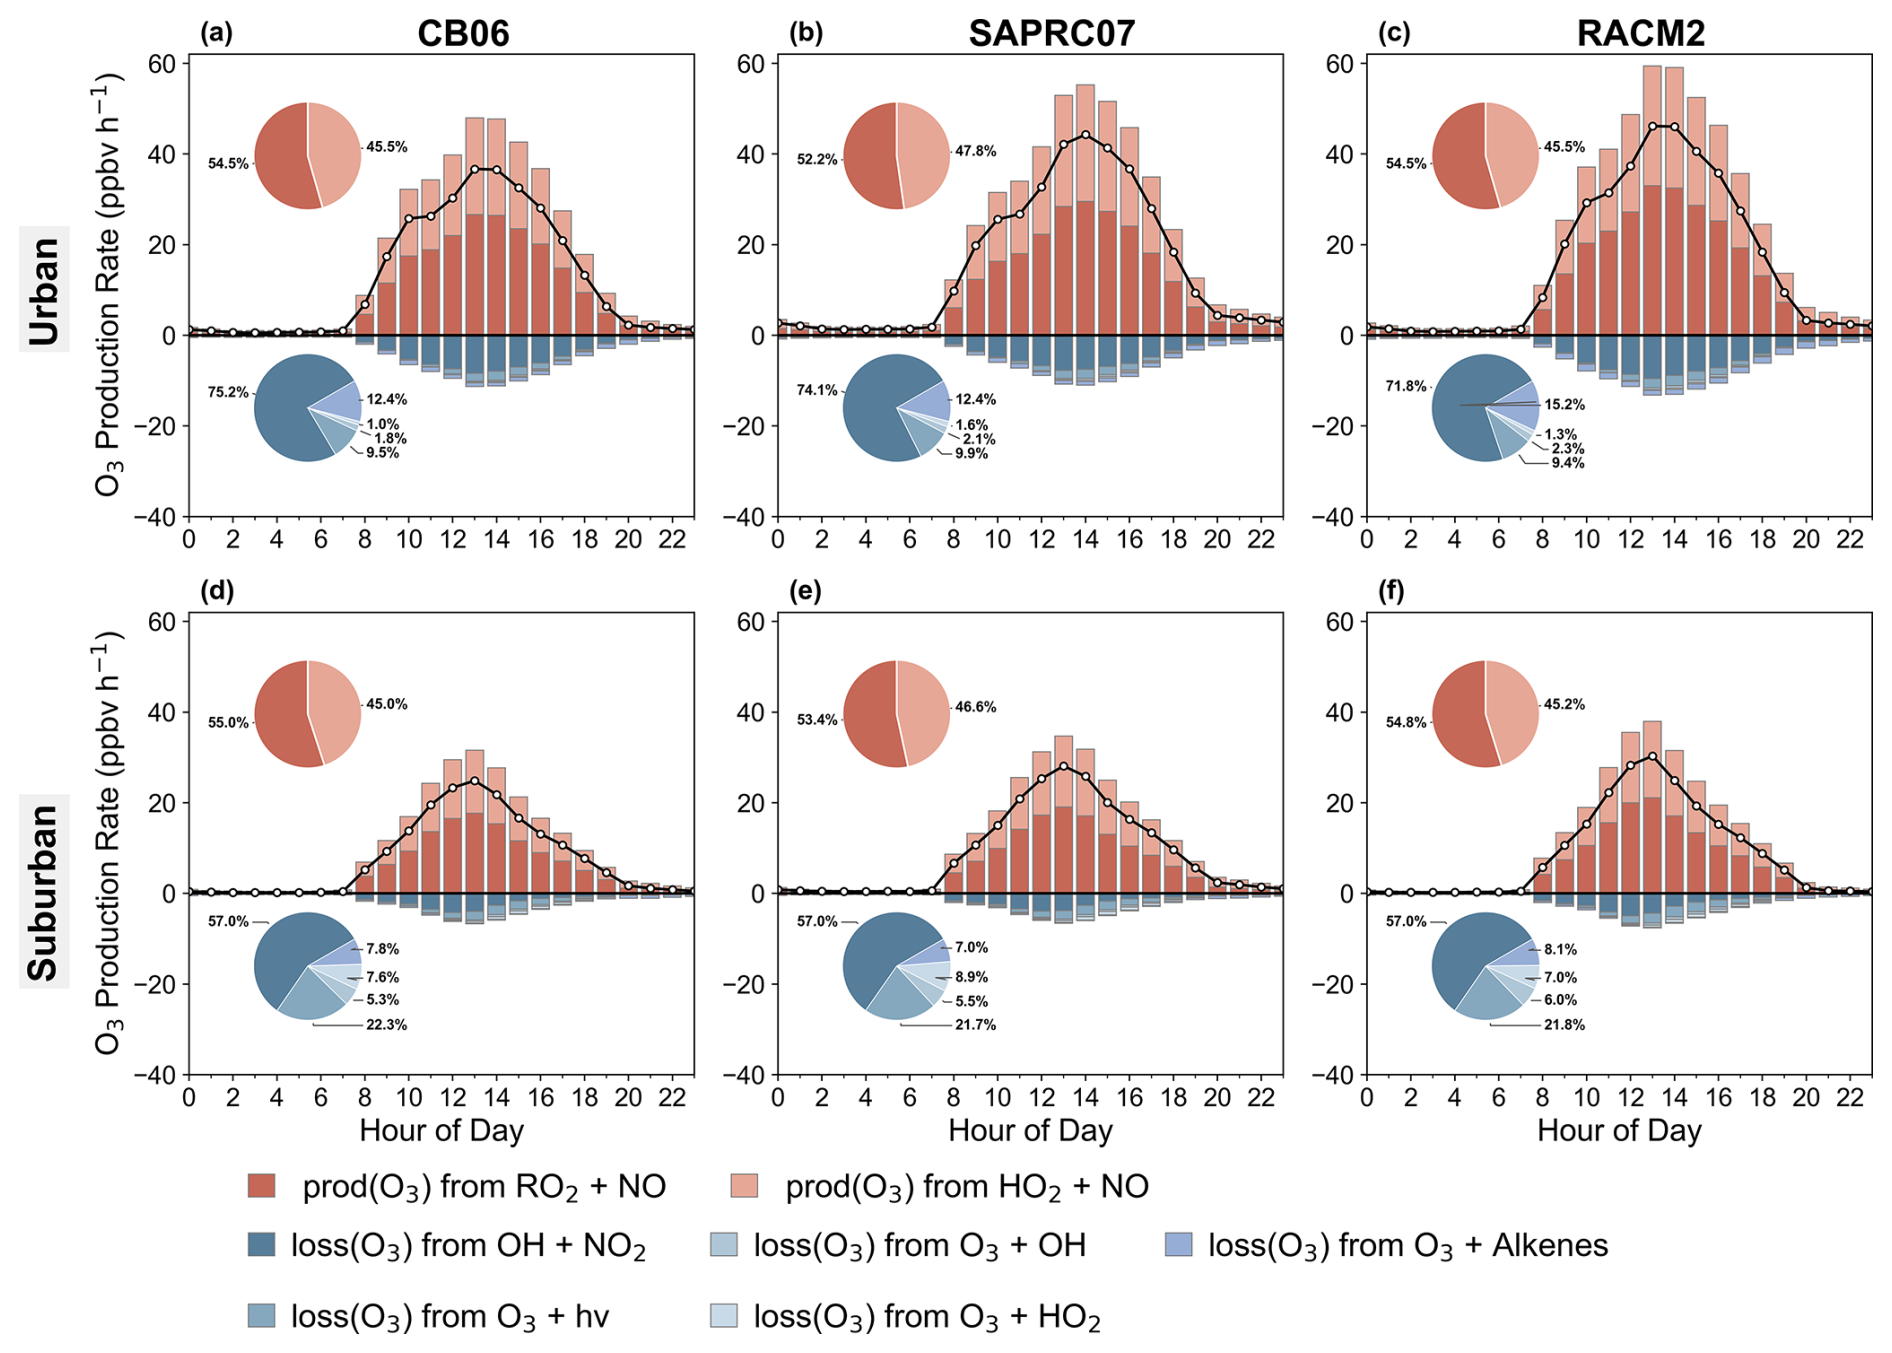
Figure 6O3 formation and loss rates (ppbv h−1) simulated by CB06, SAPRC07 and RACM2 mechanisms at the urban site (SAES) and suburban site (XJ). The black curve plotted with circle markers represents the net O3 production rate. The analysis covers daytime hours (08:00–18:00 LT).
A similar inter-mechanistic pattern was found for the gross O3 formation rates, which were 40.1, 37.0, and 32.5 ppbv h−1 for RACM2, SAPRC07, and CB06 at the urban site and 22.1, 21.5, and 19.0 ppbv h−1 at the suburban site, respectively. Further decomposition of gross O3 formation into the two major pathways, HO2+NO and RO2+NO, revealed a somewhat larger inter-mechanistic spread in the RO2+NO pathway, particularly at the urban site. At the urban site, the HO2+NO reaction rates were 18.1, 17.5, and 14.7 ppbv h−1 for RACM2, SAPRC07, and CB06, respectively, decreasing to 9.9, 10.0, and 8.5 ppbv h−1 at the suburban site. The corresponding RO2 + NO reaction rates were 22.0, 19.5, and 17.8 ppbv h−1 at the urban site and 12.2, 11.5, and 10.5 ppbv h−1 at the suburban site. The relatively small inter-mechanistic spread in HO2+NO reaction rates are broadly consistent with the similar HO2 levels (Fig. 5d–f and k). In contrast, the larger spread in RO2+NO reaction rates among the mechanisms were consistent with the more pronounced inter-mechanistic differences in RO2 levels (Fig. 5g–i and l), suggesting the mechanism-dependent in RO2 and chemistry can contribute substantially to the inter-mechanistic variability in O3 formation.
Clear inter-mechanistic differences were also found in the total O3 loss rates. At the urban site, the O3 loss rates for RACM2, SAPRC07, and CB06 were 9.1, 7.4, and 7.5 ppbv h−1, respectively, while the corresponding values at the suburban site were 4.5, 4.1, and 3.9 ppbv h−1. RACM2 consistently simulated the strongest O3 loss at both sites and the inter-mechanistic spread was again larger under the high-NOx urban conditions. These inter-mechanistic differences in O3 loss rates were mainly associated with reactions of OH+NO2 and O3+alkenes. The OH+NO2 reaction rates for RACM2, SAPRC07, and CB06 were 6.5, 5.4, and 5.6 ppbv h−1 at the urban site and 2.6, 2.2, and 2.2 ppbv h−1 at the suburban site, respectively. The largest OH+NO2 reaction rate in RACM2 is broadly consistent with the inter-mechanistic differences in OH levels (Fig. 5a–c and j), particularly at the urban site, although differences in NO2 levels and kinetic parameters may also influence this pathway. Differences in O3+alkenes were also apparent, especially at the urban site, where the corresponding rates for RACM2, SAPRC07, and CB06 were 1.2, 0.8, and 0.8 ppbv h−1, respectively. These differences likely reflect the mechanism-dependent representation of alkene species and their reactivities toward O3. For example, the more reactive internal-alkene group in RACM2 (OLI, ) has a higher O3 reaction rate constant at 298 K than the corresponding highly reactive alkene groups in SAPRC07 (OLE2, ) and CB06 (IOLE, ). By comparison, the O3+hν, O3+OH and O3+HO2 pathways showed relatively similar reaction rates among the three mechanisms at both sites.
Overall, the three mechanisms showed clear differences in the magnitudes of both O3 formation and loss, with these discrepancies being more pronounced under the high-NOx urban conditions. RACM2 generally simulated the highest net O3 production, along with the strongest O3 formation and loss rates, whereas CB06 yielded the lowest net O3 production. The inter-mechanistic differences in O3 formation were primarily attributable to variations in the RO2 + NO pathway, particularly under high-NOx urban conditions, indicating a strong dependence of O3 formation on mechanism-specific RO2 chemistry. In comparison, differences in O3 loss rates among the mechanisms were primarily attributable to OH+NO2 and O3+alkenes pathways, while the O3+hν, O3+OH, and O3+HO2 pathways showed relatively minor differences among the mechanisms. Despite these quantitative discrepancies, the three mechanisms reproduced a broadly consistent overall O3 chemical budget structure at both sites. The O3 formation at both sites was dominated by RO2+NO reaction, contributing more than 50 %. O3 loss was primarily governed by the OH+NO2 reaction at both sites. At the suburban site, however, the contribution of this pathway decreased by approximately 14–19 percentage points, while O3 photolysis and the reactions of O3 with HO2 and OH became relatively more important.
3.3 Mechanistic insights into ROx cycle
3.3.1 Characterizing primary sources of ROx radicals
The coupling between the NOx and ROx cycles promotes radical propagation and recycling, facilitating the conversion of NO to NO2 and net photochemical O3 production. Therefore, quantifying the budget and cycling of ROx radicals is important for understanding mechanism-dependent differences in atmospheric oxidation capacity and O3 production.
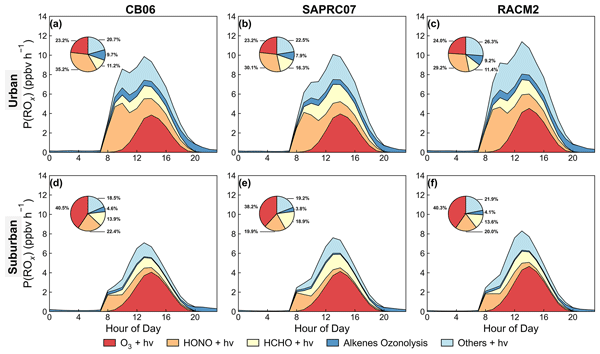
We further analyzed the primary ROx production (P(ROx)) at both sites (Fig. 7). These results demonstrated that P(ROx) was substantially higher at the urban site than at the suburban site. Specifically, P(ROx) values for RACM2, SAPRC07, and CB06 were 7.9, 6.9, and 7.0 ppbv h−1 at the urban site and 5.0, 4.6 and 4.3 ppbv h−1 at the suburban site, respectively. RACM2 yielded the highest P(ROx) at both sites, and the absolute inter-mechanistic differences were more pronounced at high-NOx urban site (1.0 ppbv h−1) than at the low-NOx suburban site (0.7 ppbv h−1).
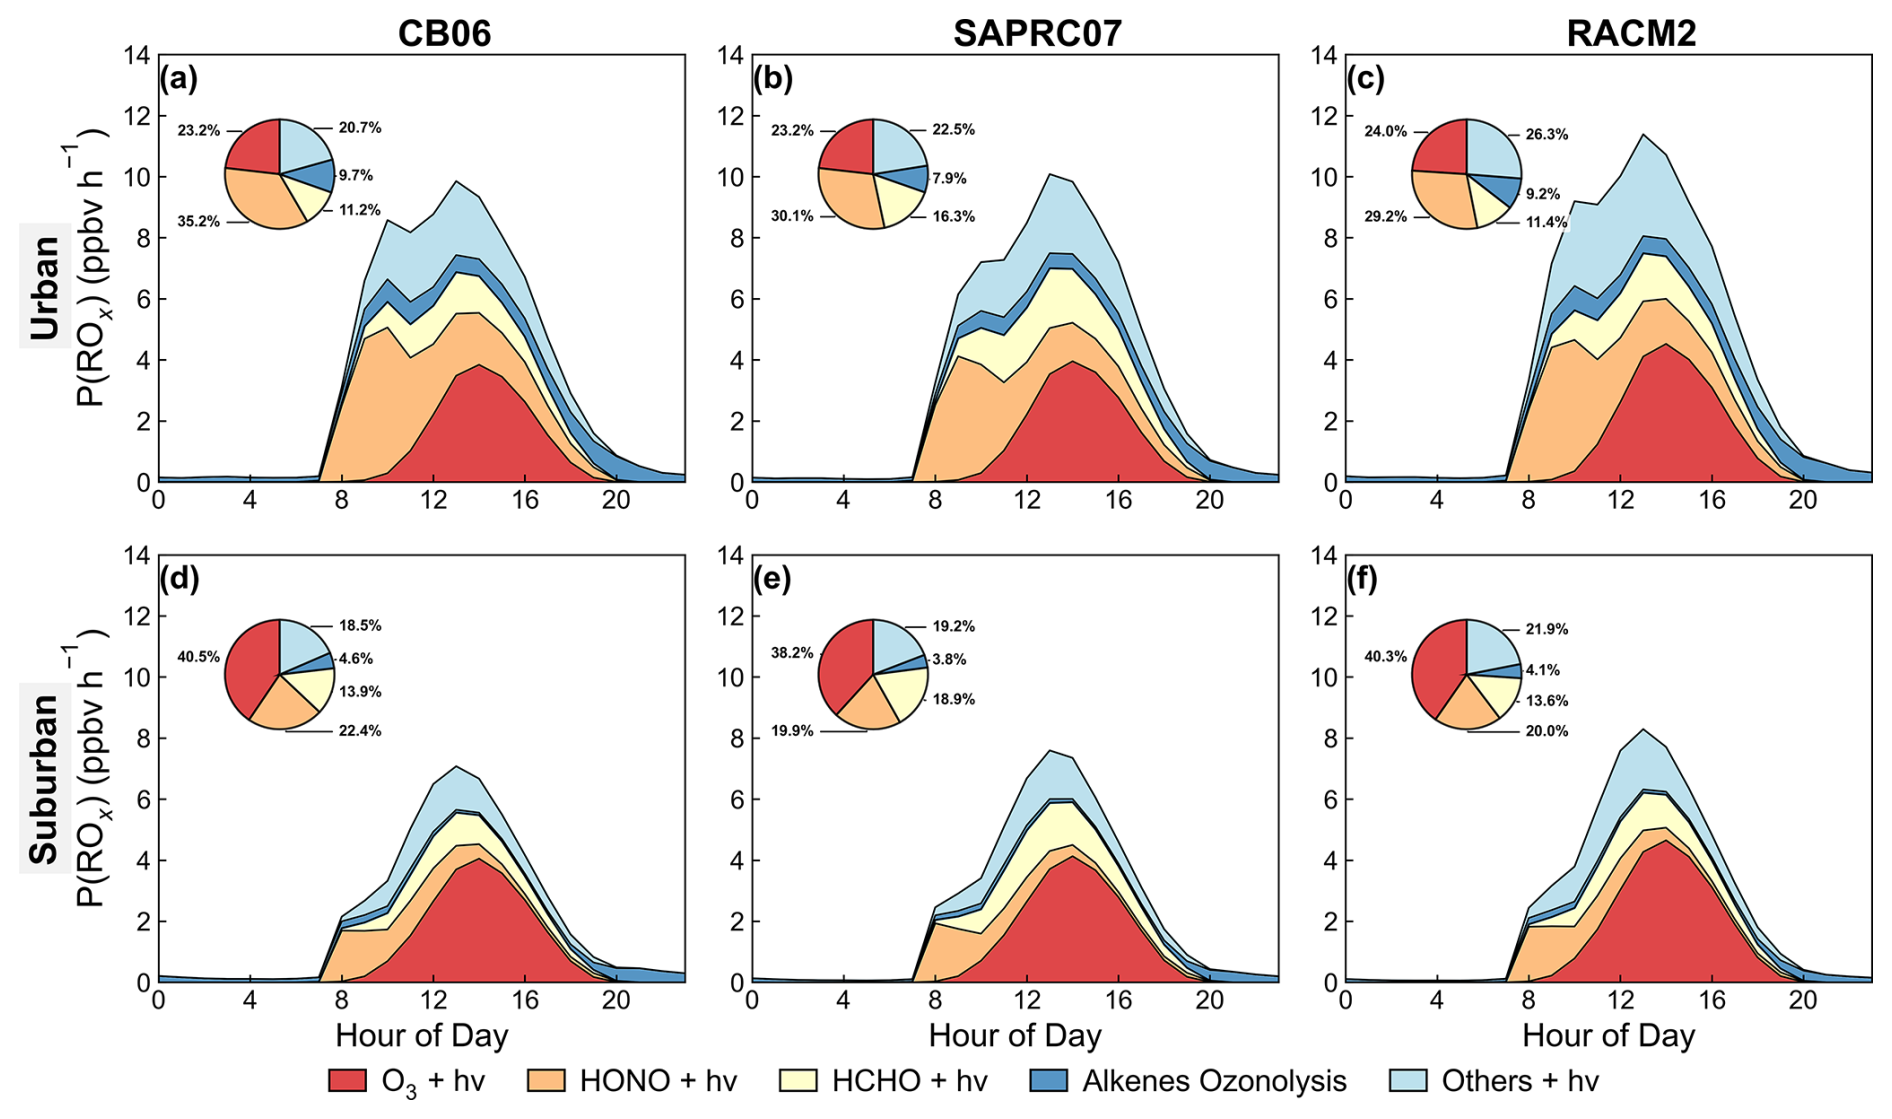
Figure 7Primary ROx production rates (ppbv h−1) simulated by CB06, SAPRC07 and RACM2 mechanisms at the urban site (SAES) and suburban site (XJ). The primary ROx production pathways include HONO photolysis, O3 photolysis, alkene ozonolysis, HCHO photolysis, and photolysis of other carbonyls. The analysis covers daytime hours (08:00–18:00 LT).
Despite these quantitative differences, the three mechanisms showed a broadly consistent primary ROx source structure at both sites. At the urban site, HONO photolysis was the dominant primary ROx source, accounting for 29.2 %–35.2 % of P(ROx), consistent with the important role of HONO photolysis under polluted urban conditions reported by Zhou et al. (2024). The corresponding production rates were 2.3, 2.1, and 2.5 ppbv h−1 for RACM2, SAPRC07, and CB06, respectively. The next largest contributions were from O3 photolysis (23.2 %–24.0 %) and photolysis of other carbonyl compounds (20.7 %–26.3 %), while HCHO photolysis and O3+alkenes contributed 11.2 %–16.3 % and 7.9 %–9.7 %, respectively. Among these pathways, the most pronounced inter-mechanistic difference occurred in the photolysis of other carbonyl compounds. Its contribution reached 26.3 % in RACM2, compared with 20.7 %–22.5 % in SAPRC07 and CB06, corresponding to production rates of 2.1, 1.6, and 1.4 ppbv h−1 for RACM2, SAPRC07, and CB06, respectively. The larger contribution and production rate of carbonyl-photolysis in RACM2 suggest that mechanism-dependent differences in the representation and photochemistry of carbonyl species may contribute to its enhanced primary ROx production under high-NO urban conditions.
At the suburban site, O3 photolysis became the dominant primary ROx source, contributing 38.2 %–40.5 %. The next largest contributions were from HONO photolysis (19.9 %–22.4 %) and photolysis of other carbonyl compounds (18.5 %–21.9 %), while HCHO photolysis and O3+alkenes accounted for 13.6 %–18.9 % and 3.8 %–4.6 %, respectively. Compared with the urban site, the relative importance of the more mechanism-sensitive pathways, particularly carbonyl photolysis and O3+alkenes, decreased, whereas O3 photolysis became more dominant and showed similar contributions among the three mechanisms. This increased contribution from O3 photolysis reduced the relative importance of VOC-dependent primary radical sources in the P(ROx) and may partly account for the smaller inter-mechanistic differences in P(ROx) budget at the suburban site. Overall, the three mechanisms reproduced a broadly similar hierarchy of primary ROx sources, while the largest pathway-level discrepancies were associated with VOC- and carbonyl-related radical production, particularly under the high-NOx urban conditions.
3.3.2 Termination mechanisms and radical fate in urban and suburban environments
We further quantified the termination reaction rates of the ROx radical chain at both sites (Fig. 8). Overall, all three mechanisms consistently simulated substantially higher total ROx radical loss rates (L(ROx)) at the urban site than that at the suburban site, with large the inter-mechanistic differences under the high-NOx conditions.
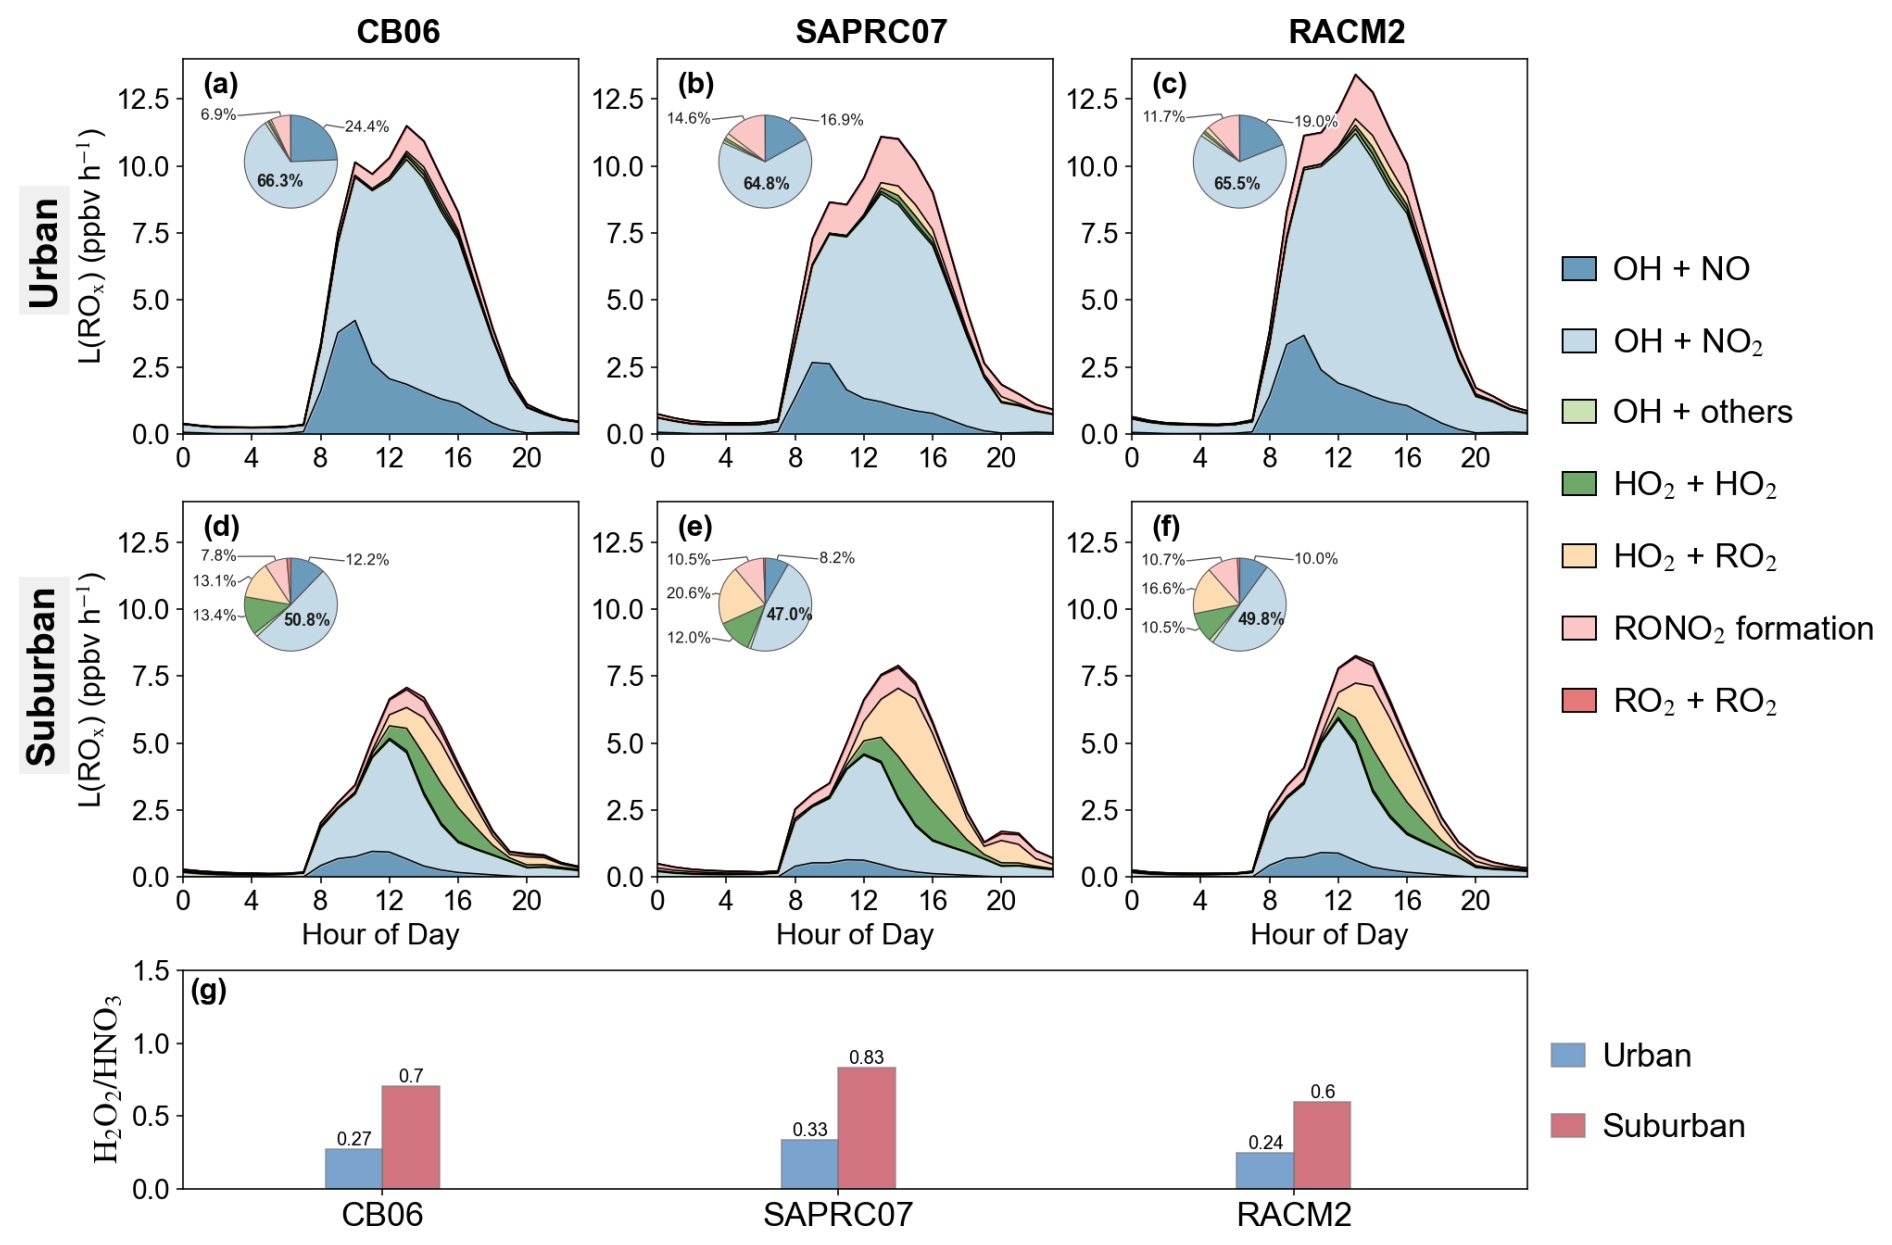
Figure 8Radical chain termination reaction rates and H2O2-to-HNO3ratio simulated by CB06, SAPRC07 and RACM2 mechanisms. Panels (a–f) show termination rates (ppbv h−1) at the urban site (SAES) and suburban site (XJ). Panel (g) compares the ratio between the two sites during daytime (08:00–18:00 LT).
At the high-NOx urban site, ROx termination was mainly driven by OH+NO2 to form HNO3, which accounted for 64.8 %–66.3 % of total termination. OH+NO contributed 16.9 %–24.4 %, while RONO2 formation accounted for 6.9 %–14.6 %. Previous work also reported that ROx termination in Chengdu was dominated by reactions of OH with NOx (Tan et al., 2018). The relatively narrow range in the contribution of OH+NO2 among the three mechanisms indicates a broadly consistent representation of this dominant termination pathway. In contrast, the contribution of RONO2 formation varied more widely among the three mechanisms (6.9 %–14.6 %). This variability may reflect differences in the representation of RO2+NO branching and organic nitrate yields among the mechanisms. Thus, although the three mechanisms agreed on the dominant role of NOx-related termination at the urban site, they differed appreciably in the partitioning of RO2 toward RONO2 formation.
In contrast, the ROx termination became more distributed across multiple pathways at the suburban site. Although OH+NO2 remained the largest individual ROx radical loss pathway, its contribution decreased to 47.0 %–50.8 %. Similar to the urban site, the relatively small spread in this contribution among the three mechanisms suggests that OH+NO2 remained comparatively consistent across mechanisms. Meanwhile, the relative contributions of peroxy-radical termination pathways increased, including HO2+RO2 (13.1 %–20.6 %) and HO2+HO2 (10.5 %–13.4 %). Among these pathways, HO2+RO2 exhibited the largest inter-mechanistic variability, whereas the differences in HO2+HO2 were comparatively smaller. The noticeable spread in HO2+RO2 and HO2+HO2 also highlights the increasing influence of mechanism-dependent peroxy-radical chemistry on ROx termination under lower-NOx conditions.
These results indicate that the mechanisms differ not only in the overall magnitude of L(ROx) but also in the partitioning of radical termination among individual pathways. Under high-NOx urban conditions, the fractional contribution of RONO2 formation to ROx termination varied appreciably among the three mechanisms., whereas under low-NOx suburban conditions, greater variability emerges in peroxy-radical termination, particularly through HO2+RO2 and HO2+HO2 reactions. This transition is consistent with the reduced relative importance of NOx-dependent ROx termination as NOx levels decreases, thereby increasing the influence of mechanism-dependent peroxy-radical chemistry on the ROx loss budget.
The change in ROx termination chemistry is further supported by the ratio, which increased substantially from 0.24–0.33 at the urban site to 0.6–0.83 at the suburban site (Fig. 8g). Differences in among the three mechanisms also reflect their different partitioning between peroxide-forming and NOx-related termination pathways. RACM2, SAPRC07, and CB06 yielded ratios of 0.24, 0.33, and 0.27 at the urban site and 0.6, 0.83, and 0.7 at the suburban site, respectively. Despite these quantitative differences, all three mechanisms reproduced the same systematic increase in from the urban to suburban site, providing consistent evidence for a shift toward greater importance of peroxy-radical termination under lower-NOx conditions.
Overall, all three mechanisms reproduced a broadly consistent urban-to-suburban transition in ROx termination chemistry but differed in both the magnitude of total ROx loss and the relative importance of individual termination pathways. At the urban site, the predominance of NOx-related pathways reflects strong NOx-dependent radical termination under high-NOx conditions, with the larger inter-mechanistic variability in RONO2 formation, highlighting greater sensitivity to the treatment of organic nitrate chemistry. In contrast, the increased contribution of HO2+HO2 and HO2+RO2 at the suburban site enhances the influence of mechanism-dependent peroxy-radical chemistry on the ROx budget. Thus, the dominant source of inter-mechanistic variability in ROx termination shifts from organic-nitrate-related chemistry under high-NOx urban conditions toward peroxy-radical self- and cross-reactions under lower-NOx suburban conditions.
3.3.3 Propagation pathways: OH-initiated oxidation of primary VOC emission
The OH-initiated oxidation of VOCs is one of the key propagation steps in the ROx cycle, generating RO2 radicals and triggering subsequent radical chain propagation reactions. In order to identify the key chemical drivers of the ROx cycle across varying NOx environments, we quantified the reaction rates of OH with major primary VOC emissions at urban and suburban site (Fig. 9).
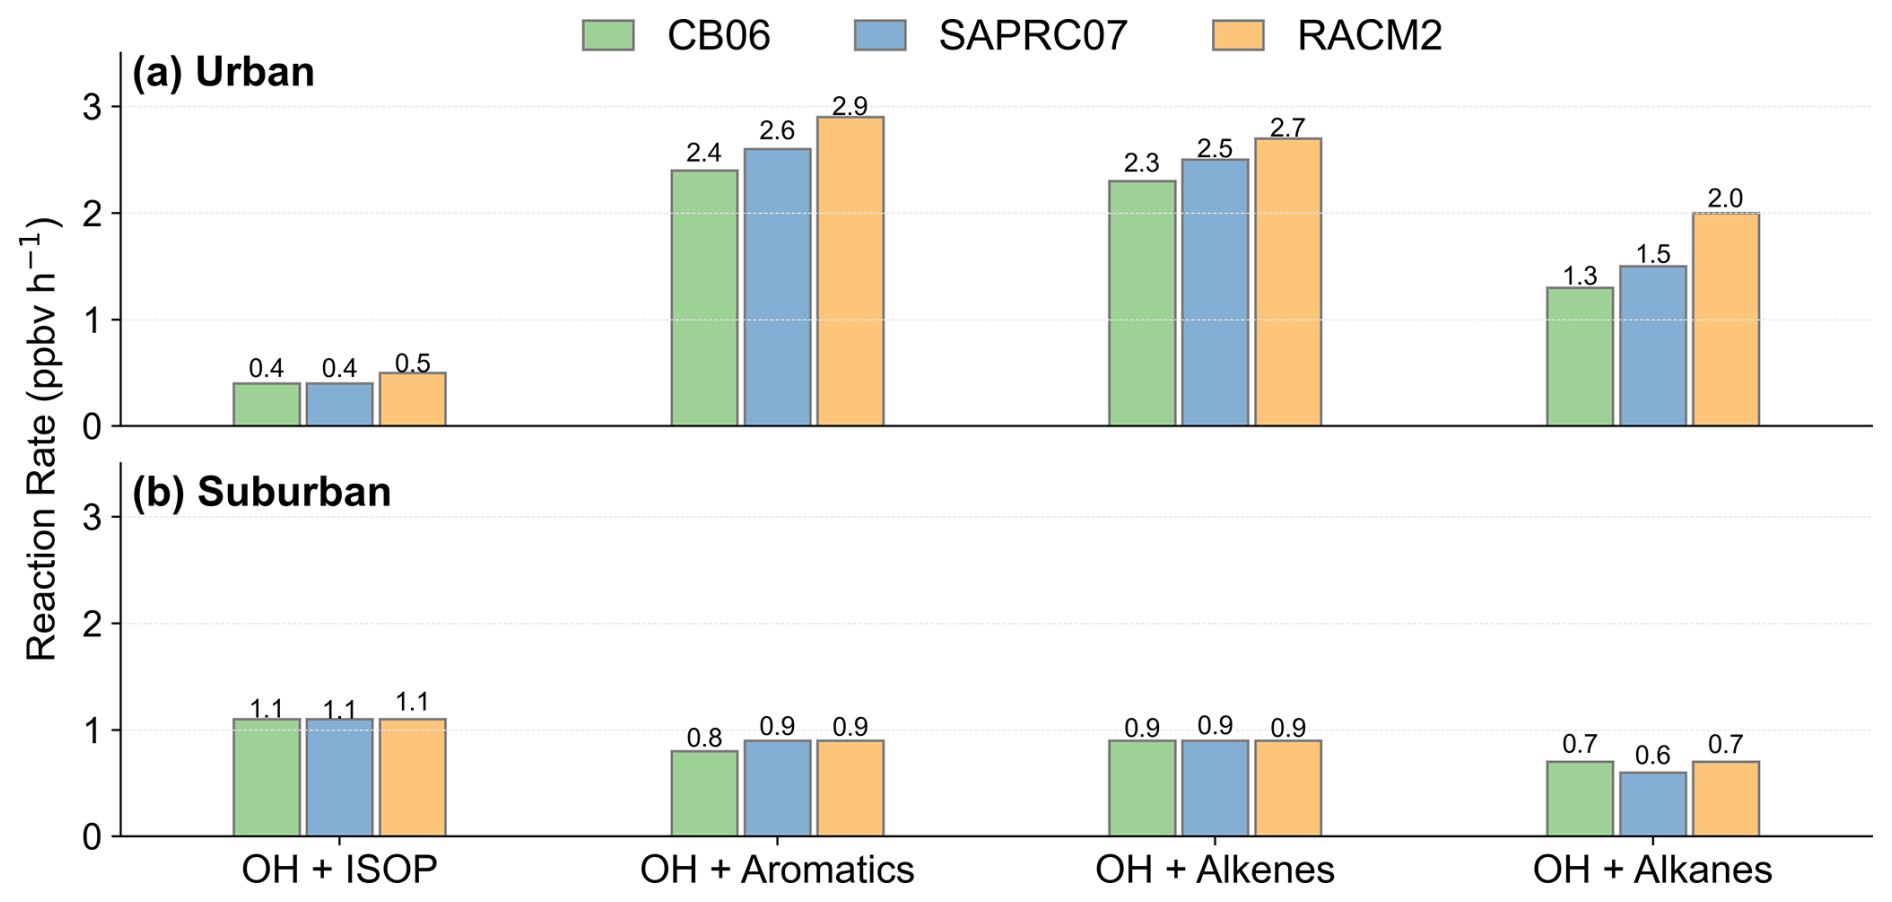
Figure 9OH-initiated oxidation rates (ppbv h−1) of major primary VOCs simulated by CB06, SAPRC07 and RACM2 mechanisms at the urban site (SAES) and suburban site (XJ). The analysis covers daytime hours (08:00–18:00 LT).
Alkanes represent the most abundant VOC class in Chengdu, while alkenes and aromatics are the primary high-reactivity components of anthropogenic emissions (Deng et al., 2019; Tan et al., 2018). ISOP is also an important BVOCs with high reactivity toward OH. Accordingly, we examined the OH-initiated reaction rates of these major anthropogenic and biogenic VOCs classes to characterize their respective roles in driving the ROx cycle.
Across all the three mechanisms, OH-initiated oxidation rates of the major anthropogenic VOC classes were consistently higher at the urban site compared to the suburban site, revealing the more rapid OH-initiated VOC oxidation at the urban site. At the high-NOx urban site, the OH-initiated VOC oxidation was primarily driven by anthropogenic volatile organic compounds (AVOCs). The OH+aromatics reaction rates were the highest, reaching 2.9, 2.6, and 2.4 ppbv h−1 for RACM2, SAPRC07, and CB06, respectively, followed by OH+alkenes, with corresponding rates of 2.7, 2.5, and 2.3 ppbv h−1. In comparison, OH + alkanes exhibited lower reaction rates (1.3–2.0 ppbv h−1), while OH+isoprene (0.4–0.5 ppbv h−1) was relatively less important under the urban conditions. These results indicate that anthropogenic aromatics and alkenes were the major VOC categories undergoing initial OH oxidation at the urban site, while also revealing appreciable quantitative differences among the three mechanisms.
At the low-NOx suburban site, the OH+isoprene reaction exhibited the highest reaction rate among the major VOC classes (), whereas the OH reaction rates with aromatics, alkenes, and alkanes were 0.8–0.9, 0.9, and 0.6–0.7 ppbv h−1, respectively. Compared with the urban site, the greater contribution of isoprene indicates an increased importance of BVOCs in the initial OH-driven VOC oxidation at the suburban site, although oxidation of anthropogenic VOCs remained appreciable.
The three mechanisms showed broadly consistent patterns among the major VOC classes but differed in the magnitude of OH-initiated oxidation, with larger inter-mechanistic discrepancies at the urban site. In particular, relatively large differences were found for OH+aromatics and OH+alkenes, whereas the corresponding differences among the mechanisms were smaller at the suburban site. The lower OH-initiated oxidation rates simulated by CB06 for several major VOC classes are qualitatively consistent with its lower RO2 concentrations (Fig. 5g–i and l). However, this correspondence does not necessarily imply a direct causal relationship, because RO2 abundances are additionally controlled by mechanism-dependent RO2 yields, branching, propagation, and termination chemistry. Moreover, the OH+VOC reaction rates also depend on simulated OH levels, VOC abundances, and reaction kinetics. Figure 9 characterizes mechanism-dependent differences in the initial VOC oxidation processes feeding the ROx cycle. However, variations in OH-initiated VOC oxidation alone do not directly reveal the relative importance of individual VOC classes as O3 precursors. This issue is further examined in Sect. 3.4 using sensitivity analysis, which quantifies the O3 response to individual VOC categories and assesses the consistency of the three mechanisms in identifying the dominant VOC precursors governing O3 formation.
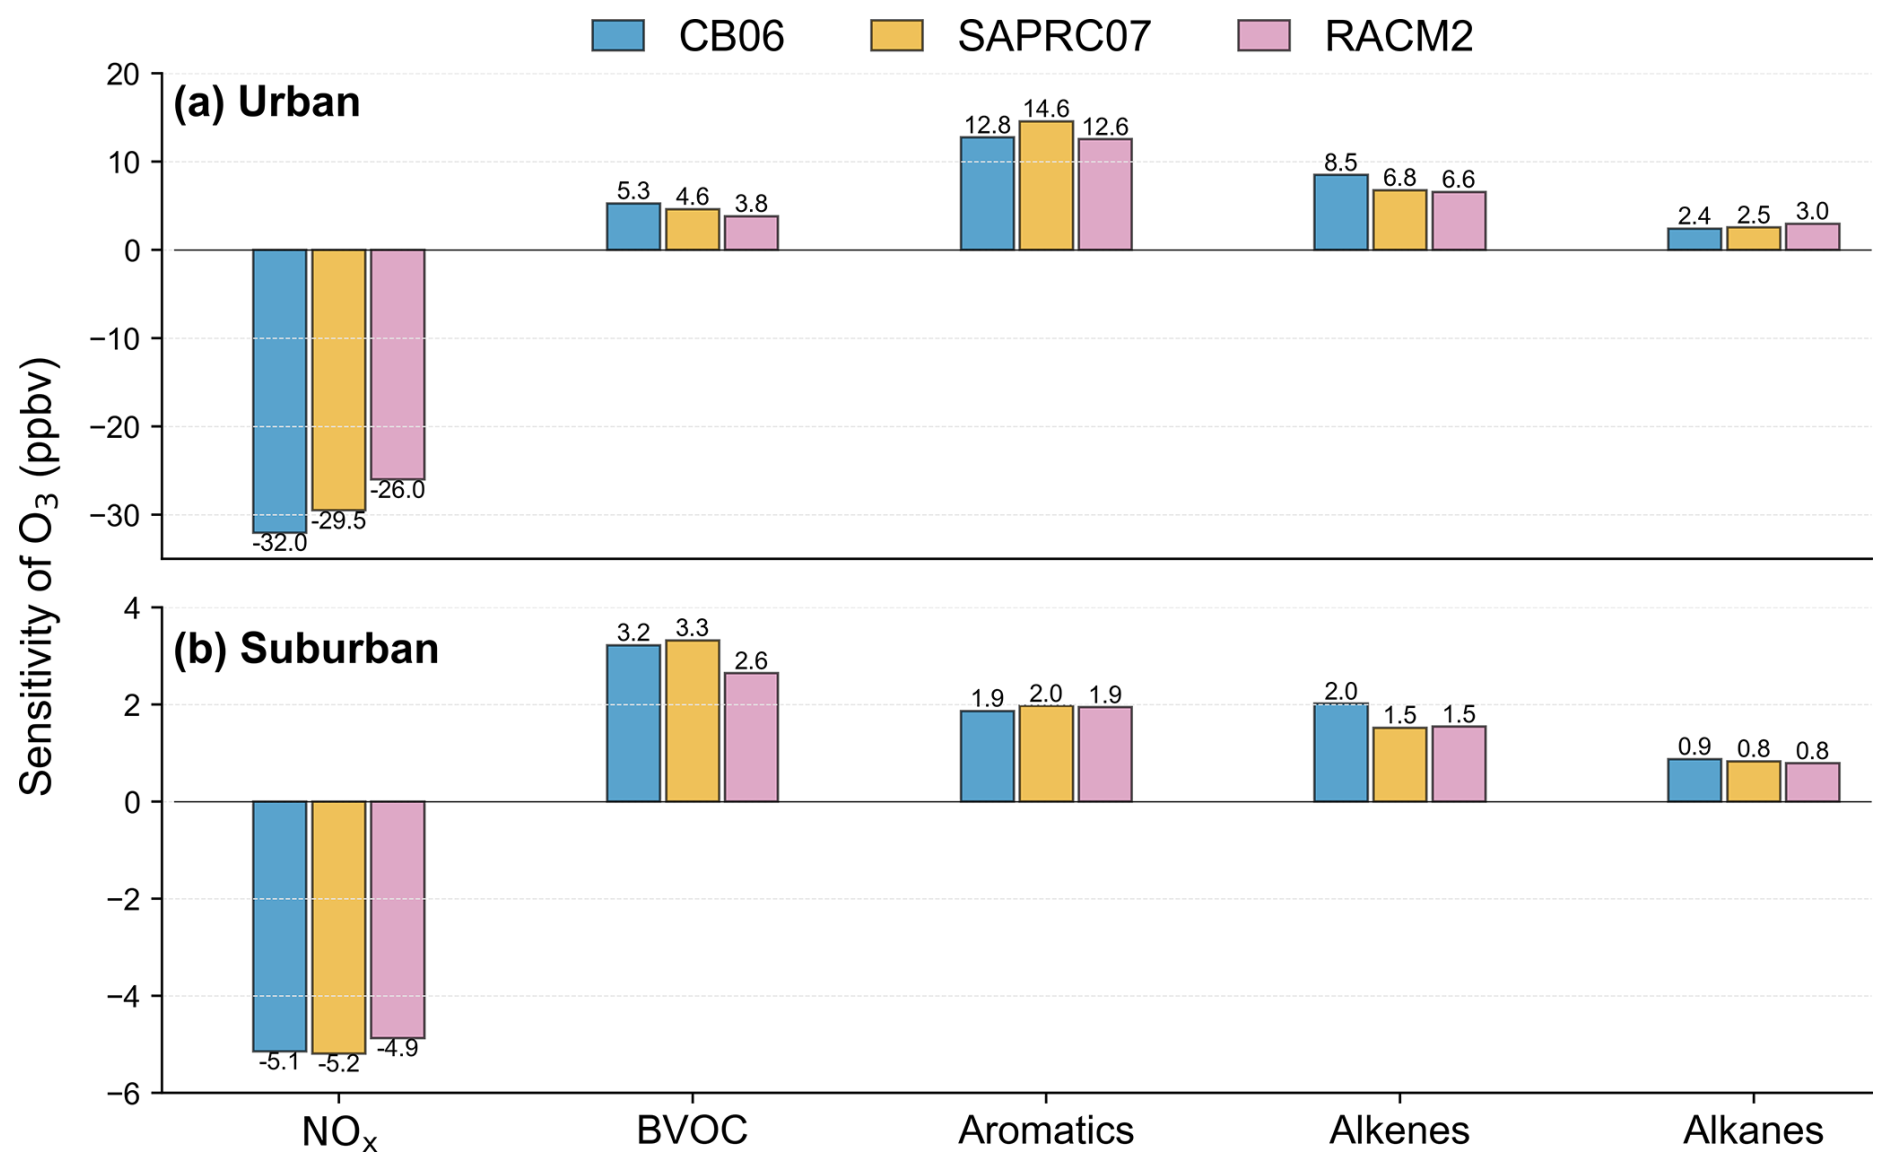
Figure 10First-order O3 sensitivities (ppbv) to primary NOx emissions and major primary VOC emissions calculated by CMAQ-DDM-3D with CB06, SAPRC07, and RACM2 mechanisms. The comparison covers daytime (08:00–18:00 LT) at the urban site (SAES) and suburban site (XJ).
3.4 Sensitivity of O3 to NOx and VOC emissions
We further quantified the first-order sensitivities of O3 concentrations to anthropogenic emissions (NOx, aromatics, alkenes, and alkanes) and BVOCs using the CMAQ-DDM-3D with the three mechanisms (Fig. 10). The three mechanisms exhibited a broadly consistent pattern in the relative importance of major O3 precursors and in their urban-to-suburban transition. All three mechanisms simulated negative O3 sensitivities to NOx emissions at both sites, with substantially larger negative responses at the urban site (−26.0 to −32.0 ppbv) than at the suburban site (approximately −5 ppbv) suggesting that NOx reductions would be associated with O3 increases in both environments, with a stronger response in the urban area. Among the VOC categories, anthropogenic aromatics and alkenes were associated with the highest O3 sensitivities at the urban site, whereas BVOCs emissions showed the highest sensitivity at the suburban site. Alkane emissions exhibiting relatively weak sensitivities at both sites. Specifically, at the urban site, the first-order sensitivity coefficients of O3 were 12.6–14.6 ppbv for aromatics, 6.6–8.5 ppbv for alkenes, 3.8–5.3 ppbv for BVOCs, and 2.4–3.0 ppbv for alkanes. In contrast, at the suburban site, O3 showed the highest sensitivity to BVOCs (2.6–3.3 ppbv), followed by aromatics (1.9–2.0 ppbv) and alkenes (1.5–2.0 ppbv), while alkanes remained the least influential (0.8–0.9 ppbv). The magnitude of the inter-mechanistic differences also varied substantially among major precursor categories and between the two sites. At the urban site, the largest absolute spreads occurred for aromatics (∼2.0 ppbv) and alkenes (∼1.9 ppbv), followed by BVOCs (∼1.5 ppbv). In comparison, the corresponding spreads at the suburban site were substantially smaller, at approximately 0.1, 0.5, and 0.7 ppbv, respectively. These results indicate that mechanism-dependent variability in O3 precursor sensitivity was more pronounced under the high-NOx urban conditions, particularly for the highly reactive anthropogenic aromatic and alkene classes, whereas the three mechanisms showed closer agreement under the lower-NOx suburban conditions. Despite these quantitative differences, all three mechanisms consistently identified the same major precursor categories and reproduced the shift from predominantly anthropogenic VOC sensitivity at the urban site to greater BVOC sensitivity at the suburban site.
An important urban–suburban contrast was found for BVOCs. Although OH-initiated ISOP oxidation was faster at the suburban site (Fig. 9), the absolute first-order sensitivity of O3 to BVOCs emissions was greater at high-NOx urban site. This apparent contrast indicates that the influence of BVOCs oxidation on O3 formation depends not only on the initial oxidation rate but also on the subsequent fate of the resulting peroxy radicals under different NOx regimes. Under high-NOx urban conditions, a larger fraction of these peroxy radicals reacts with NO, efficiently converting NO to NO2 and sustaining radical propagation and O3 formation. In contrast, under low-NOx suburban conditions, RO2+RO2, RO2+HO2, and HO2+HO2 reactions become relatively more important (Fig. 8), favoring peroxide formation and radical termination and thereby reducing the efficiency with which BVOC oxidation contributes to O3 production. Overall, the three mechanisms consistently capture the NOx-dependent shift in the role of major VOC precursors emissions, while their quantitative differences in O3 sensitivity reflect mechanism-dependent representations of VOC oxidation and subsequent peroxy-radical chemistry.
This study developed a customized VOC emission inventory for RACM2 and conducted a systematic inter-comparison of three photochemical mechanisms (CB06, SAPRC07, and RACM2) using CMAQ during an O3 pollution episode in Chengdu under contrasting NOx environments. The results show that chemical mechanism selection leads to substantial differences in simulated O3 levels and radical chemistry, particularly under high-NOx conditions.
SAPRC07 and RACM2 simulated higher and comparable O3 concentrations (94.8–96.1 ppbv, MDA8) than CB06 (∼80 ppbv, MDA8). This result is broadly consistent with previous mechanism intercomparisons (Kitayama et al., 2019; Shareef et al., 2022), which also reported that RACM2 and SAPRC07 yield similar O3 concentrations, while carbon-bond mechanisms produce lower values, with inter-mechanism differences reaching up to 10 ppb over Japan (Kitayama et al., 2019). Despite differences in simulated O3 concentrations, the three mechanisms exhibited a broadly consistent O3 photochemical framework, with O3 formation dominated by the RO2+NO pathway. The magnitude of inter-mechanistic differences variability, however, was strongly dependent on the NOx regime. Differences were more pronounced under high-NOx urban conditions, particularly in RO2-mediated O3 formation, O3 loss chemistry, and primary ROx production, with part of the variability in P(ROx) associated with mechanism-dependent carbonyl photolysis. The ROx termination regime also shifted markedly from NOx-related pathways under urban conditions toward greater contributions from peroxy-radical self- and cross-reactions under lower-NOx suburban conditions. Although this regime transition was reproduced consistently by all three mechanisms, the magnitude and partitioning of individual termination pathways remained mechanism dependent. These differences were mainly associated with RONO2 formation at the urban site, whereas HO2+HO2 and HO2+RO2 became more mechanism dependent at the suburban site. The accompanying increase in the ratio further supported the transition toward greater importance of peroxy-radical termination under lower-NOx conditions. Sensitivity analysis also revealed a broadly consistent regime-dependent pattern across the three mechanisms, with anthropogenic aromatics and alkenes dominating O3 sensitivity under high-NOx urban conditions and BVOCs becoming more important at the suburban site. Notably, O3 sensitivity to BVOC emissions was substantially greater under high-NOx urban conditions than at the lower-NOx suburban site, despite lower urban BVOC emissions. This contrast highlights the importance of NOx-dependent peroxy-radical fate in determining how efficiently VOC oxidation contributes to O3 formation.
Overall, these findings highlight that chemical mechanism uncertainty is strongly dependent on NOx regimes and is most pronounced under high-NOx conditions, underscoring the need for multi-mechanism ensemble simulations in air quality modeling. Furthermore, the clear urban–suburban transition in O3 formation regimes suggests that emission control strategies should be spatially differentiated, with anthropogenic VOC emission reductions prioritized in urban cores. Although NOx emission reductions alone were simulated to increase O3 at both sites, the weaker response at the suburban site indicates spatial differences in the sensitivity of O3 formation to NOx controls. These findings highlight the need for coordinated reductions in NOx and VOC emissions tailored to local chemical regimes. Importantly, NOx not only directly regulates O3 formation but also modulates radical cycling and thus the effectiveness of VOC emission reduction, which should be explicitly considered in control strategies. Finally, the amplified role of BVOCs under high-NOx conditions highlights the importance of accounting for interactions between anthropogenic emissions and biogenic sources in future O3 mitigation, particularly under a warming climate with increasing BVOC emissions.
The code and data used in this study are available from Yuelin Liu (2023323055055@stu.scu.edu.cn).
The supplement related to this article is available online at https://doi.org/10.5194/acp-26-16203-2026-supplement.
YL and YG contributed equally to this work. YL conducted the model simulations, performed data analysis, prepared the figures, and wrote original draft with contributions from all coauthors. NW and KL contributed to the writing and revision of the manuscript. YG, NW, KL, YZ, GS and FY designed the research. KL, YZ and YG provided the observation data support. GS and FY provided computing resources and assisted in conducting the model simulations.
The contact author has declared that none of the authors has any competing interests.
Publisher's note: Copernicus Publications remains neutral with regard to jurisdictional claims made in the text, published maps, institutional affiliations, or any other geographical representation in this paper. The authors bear the ultimate responsibility for providing appropriate place names. Views expressed in the text are those of the authors and do not necessarily reflect the views of the publisher.
This research was supported by the National Key Research and Development Program of China (grant nos. 2023YFC3706100, 2023YFC3709304), National Natural Science Foundation of China (grant no. 42575120).
This research has been supported by the National Key Research and Development Program of China (grant nos. 2023YFC3706100 and 2023YFC370930) and the National Natural Science Foundation of China (grant no. 42575120).
This paper was edited by Quanfu He and reviewed by three anonymous referees.
Ashmore, M. R.: Assessing the future global impacts of ozone on vegetation, Plant Cell Environ., 28, 949–964, https://doi.org/10.1111/j.1365-3040.2005.01341.x, 2005.
Byun, D. and Schere, K. L.: Review of the governing equations, computational algorithms, and other components of the models-3 Community Multiscale Air Quality (CMAQ) modeling system, Appl. Mech. Rev., 59, 51–77, https://doi.org/10.1115/1.2128636, 2006.
Carter, W. P. L.: Condensed atmospheric photooxidation mechanisms for isoprene, Atmos. Environ., 30, 4275–4290, https://doi.org/10.1016/1352-2310(96)00088-X, 1996.
Carter, W. P. L.: Development of the SAPRC-07 chemical mechanism, Atmos. Environ., 44, 5324–5335, https://doi.org/10.1016/j.atmosenv.2010.01.026, 2010a.
Carter, W. P. L.: Development of the SAPRC-07 chemical mechanism, Atmos. Environ., 44, 5324–5335, https://doi.org/10.1016/j.atmosenv.2010.01.026, 2010b.
Carter, W. P. L., Jiang, J., Wang, Z., and Barsanti, K. C.: The SAPRC atmospheric chemical mechanism generation system (MechGen), Geosci. Model Dev., 18, 8461–8483, https://doi.org/10.5194/gmd-18-8461-2025, 2025.
Cohan, D. S., Hakami, A., Hu, Y., and Russell, A. G.: Nonlinear Response of Ozone to Emissions: Source Apportionment and Sensitivity Analysis, Environ. Sci. Technol., 39, 6739–6748, https://doi.org/10.1021/es048664m, 2005.
Cordiner, S., Baciocchi, R., and Attinà, M.: A sensitivity analysis of ozone formation to ambient air composition by means of photochemical models, Water Air Soil Pollut. Focus, 2, 573–585, https://doi.org/10.1023/A:1021397115187, 2002.
Cui, L. L., Li, R., Fu, H. B., Meng, Y., Zhao, Y. L., Li, Q., and Chen, J. M.: Nitrous acid emission from open burning of major crop residues in mainland China, Atmos. Environ., 244, https://doi.org/10.1016/j.atmosenv.2020.117950, 2021.
Deng, Y. Y., Li, J., Li, Y. Q., Wu, R. R., and Xie, S. D.: Characteristics of volatile organic compounds, NO2, and effects on ozone formation at a site with high ozone level in Chengdu, J. Environ. Sci., 75, 334–345, https://doi.org/10.1016/j.jes.2018.05.004, 2019.
Dickerson, R. R., Stedman, D. H., and Delany, A. C.: Direct measurements of ozone and nitrogen dioxide photolysis rates in the troposphere, J. Geophys. Res.-Oceans, 87, 4933–4946, https://doi.org/10.1029/JC087iC07p04933, 1982.
Dodge, M. C.: Chemical oxidant mechanisms for air quality modeling: critical review, Atmos. Environ., 34, 2103–2130, https://doi.org/10.1016/S1352-2310(99)00461-6, 2000.
Du, Y., Yang, F., Lou, S., Lyu, B., Huang, R., Shi, G., Hu, Y., Jiang, Y., and Wang, N.: The role of chemical boundary conditions in simulating summer ozone and cross-boundary transport over China, Atmos. Chem. Phys., 26, 6223–6241, https://doi.org/10.5194/acp-26-6223-2026, 2026.
Du, Y., Huang, R., Wang, X., Qin, M., Zhang, W., Zhang, Y., Yang, Y., Zhang, W., Luo, B., Hu, Y., and Russell, A. G.: Implementing Reduced Form Model to Construct Ozone Isopleths and Its Application, Acta Scientiarum Naturalium Universitatis Pekinensis, 57, 311–321, https://doi.org/10.13209/j.0479-8023.2020.120, 2021.
Dunker, A. M.: The decoupled direct method for calculating sensitivity coefficients in chemical kinetics, J. Chem. Phys., 81, 2385–2393, https://doi.org/10.1063/1.447938, 1984.
Dunker, A. M., Yarwood, G., Ortmann, J. P., and Wilson, G. M.: The Decoupled Direct Method for Sensitivity Analysis in a Three-Dimensional Air Quality Model Implementation, Accuracy, and Efficiency, Environ. Sci. Technol., 36, 2965–2976, https://doi.org/10.1021/es0112691, 2002.
Ehhalt, D. H., Dorn, H. P., and Poppe, D.: The chemistry of the hydroxyl radical in the troposphere, P. Roy. Soc. Edinb. B, 97, 17–34, https://doi.org/10.1017/S0269727000005273, 1990.
Emery, C. A., Tai, E., and Yarwood, G.: Enhanced meteorological modeling and performance evaluation for two Texas ozone episodes, Final Report prepared for the Texas Natural Resource Conservation Commission, ENVIRON International Corporation, Novato, CA, USA, https://wayback.archive-it.org/414/20210529064218/https://www.tceq.texas.gov/assets/public/implementation/air/am/contracts/reports/mm/EnhancedMetModelingAndPerformanceEvaluation.pdf (last access: 12 November 2026), 2001.
Friedlander, S. K. and Seinfeld, J. H.: Dynamic model of photochemical smog, Environ. Sci. Technol., 3, 1175–1181, https://doi.org/10.1021/es60034a003, 1969.
Fu, X., Wang, T., Gao, J., Wang, P., Liu, Y., Wang, S., Zhao, B., and Xue, L.: Persistent Heavy Winter Nitrate Pollution Driven by Increased Photochemical Oxidants in Northern China, Environ. Sci. Technol., 54, 3881–3889, https://doi.org/10.1021/acs.est.9b07248, 2020.
Fuchs, H., Holland, F., and Hofzumahaus, A.: Measurement of tropospheric RO2 and HO2 radicals by a laser-induced fluorescence instrument, Rev. Sci. Instrum., 79, https://doi.org/10.1063/1.2968712, 2008.
Gao, Z. and Zhou, X.: A review of the CAMx, CMAQ, WRF-Chem and NAQPMS models: Application, evaluation and uncertainty factors, Environ. Pollut., 343, 123183, https://doi.org/10.1016/j.envpol.2023.123183, 2024.
Geng, G., Liu, Y., Liu, Y., Liu, S., Cheng, J., Yan, L., Wu, N., Hu, H., Tong, D., Zheng, B., Yin, Z., He, K., and Zhang, Q.: Efficacy of China's clean air actions to tackle PM2.5 pollution between 2013 and 2020, Nat. Geosci., 17, 987–994, https://doi.org/10.1038/s41561-024-01540-z, 2024.
Goliff, W. S., Stockwell, W. R., and Lawson, C. V.: The regional atmospheric chemistry mechanism, version 2, Atmos. Environ., 68, 174–185, https://doi.org/10.1016/j.atmosenv.2012.11.038, 2013.
Guenther, A. B., Jiang, X., Heald, C. L., Sakulyanontvittaya, T., Duhl, T., Emmons, L. K., and Wang, X.: The Model of Emissions of Gases and Aerosols from Nature version 2.1 (MEGAN2.1): an extended and updated framework for modeling biogenic emissions, Geosci. Model Dev., 5, 1471–1492, https://doi.org/10.5194/gmd-5-1471-2012, 2012.
Gupta, M. and Mohan, M.: Validation of WRF/Chem model and sensitivity of chemical mechanisms to ozone simulation over megacity Delhi, Atmos. Environ., 122, 220–229, https://doi.org/10.1016/j.atmosenv.2015.09.039, 2015.
Han, H., Zhang, L., Wang, X. L., and Lu, X.: Contrasting Domestic and Global Impacts of Emission Reductions in China on Tropospheric Ozone, J. Geophys. Res.-Atmos., 129, https://doi.org/10.1029/2024JD041453, 2024.
Huang, L., Liu, H., Yarwood, G., Wilson, G., Tao, J., Han, Z., Ji, D., Wang, Y., and Li, L.: Modeling of secondary organic aerosols (SOA) based on two commonly used air quality models in China: Consistent S/IVOCs contribution but large differences in SOA aging, Sci. Total Environ., 903, 166162, https://doi.org/10.1016/j.scitotenv.2023.166162, 2023.
Huang, L., Zhang, X., Emery, C., Mu, Q., Yarwood, G., Zhai, H., Sun, Z., Xue, S., Wang, Y., Fu, J. S., and Li, L.: Recommendations on benchmarks for numerical air quality model applications in China – Part 2: Ozone and uncertainty analysis, Atmos. Chem. Phys., 25, 4233–4249, https://doi.org/10.5194/acp-25-4233-2025, 2025.
Huang, X., Ding, A., Gao, J., Zheng, B., Zhou, D., Qi, X., Tang, R., Wang, J., Ren, C., Nie, W., Chi, X., Xu, Z., Chen, L., Li, Y., Che, F., Pang, N., Wang, H., Tong, D., Qin, W., Cheng, W., Liu, W., Fu, Q., Liu, B., Chai, F., Davis, S. J., Zhang, Q., and He, K.: Enhanced secondary pollution offset reduction of primary emissions during COVID-19 lockdown in China, Natl. Sci. Rev., 8, nwaa137, https://doi.org/10.1093/nsr/nwaa137, 2021.
Jenkin, M. E., Young, J. C., and Rickard, A. R.: The MCM v3.3.1 degradation scheme for isoprene, Atmos. Chem. Phys., 15, 11433–11459, https://doi.org/10.5194/acp-15-11433-2015, 2015.
Kaynak, B., Hu, Y., and Russell, A. G.: Analysis of NO, NO2, and O3 Between Model Simulations and Ground-Based, Aircraft, and Satellite Observations, Water Air Soil Poll., 224, 1674, https://doi.org/10.1007/s11270-013-1674-2, 2013.
Kitayama, K., Morino, Y., Yamaji, K., and Chatani, S.: Uncertainties in O3 concentrations simulated by CMAQ over Japan using four chemical mechanisms, Atmos. Environ., 198, 448–462, https://doi.org/10.1016/j.atmosenv.2018.11.003, 2019.
Kuai, L., Bowman, K. W., Worden, H. M., Herman, R. L., and Kulawik, S. S.: Hydrological controls on the tropospheric ozone greenhouse gas effect, Elementa – Science of the Anthropocene, 5, https://doi.org/10.1525/elementa.208, 2017.
Li, F., Newman, P., Pawson, S., and Perlwitz, J.: Effects of Greenhouse Gas Increase and Stratospheric Ozone Depletion on Stratospheric Mean Age of Air in 1960–2010, J. Geophys. Res.-Atmos., 123, 2098–2110, https://doi.org/10.1002/2017JD027562, 2018.
Li, J., Huang, J., Huang, Y., Liu, C., Zhang, X., Chen, Y., Cheung, V. T. F., Sobnack, M. B., and Fung, J.: Improving ozone episode predictions in the Great Bay Area: An evaluation of the contribution of gas-phase chemical mechanisms, Atmos. Environ. X, 28, 100392, https://doi.org/10.1016/j.aeaoa.2025.100392, 2025a.
Li, L., Chen, C., Huang, C., Huang, H., Zhang, G., Wang, Y., Chen, M., Wang, H., Chen, Y., Streets, D. G., and Fu, J.: Ozone sensitivity analysis with the MM5-CMAQ modeling system for Shanghai, J. Environ. Sci.-China, 23, 1150–1157, https://doi.org/10.1016/S1001-0742(10)60527-X, 2011.
Li, M., Liu, H., Geng, G. N., Hong, C. P., Liu, F., Song, Y., Tong, D., Zheng, B., Cui, H. Y., Man, H. Y., Zhang, Q., and He, K. B.: Anthropogenic emission inventories in China: a review, Natl. Sci. Rev., 4, 834–866, https://doi.org/10.1093/nsr/nwx150, 2017.
Li, M., Chen, S., Jiang, X., Ye, L., Guo, Y., Li, W., Zhang, J., Liu, W., Yang, Y., Ou, Z., Chen, L., Dong, G., Wu, W., Li, D., and Chen, W.: Subchronic ozone exposure leads to multi-organ injuries with differential reversibility in male C57BL/6J mice, J. Hazard. Mater., 492, 138049, https://doi.org/10.1016/j.jhazmat.2025.138049, 2025b.
Liu, X. H., Zhang, Y., Xing, J., Zhang, Q. A., Wang, K., Streets, D. G., Jang, C., Wang, W. X., and Hao, J. M.: Understanding of regional air pollution over China using CMAQ, part II. Process analysis and sensitivity of ozone and particulate matter to precursor emissions, Atmos. Environ., 44, 3719–3727, https://doi.org/10.1016/j.atmosenv.2010.03.036, 2010.
Liu, Y., Li, J., Ma, Y., Zhou, M., Tan, Z., Zeng, L., Lu, K., and Zhang, Y.: A review of gas-phase chemical mechanisms commonly used in atmospheric chemistry modelling, J. Environ. Sci., 123, 522–534, https://doi.org/10.1016/j.jes.2022.10.031, 2023.
Liu, Y. and Wang, T.: Worsening urban ozone pollution in China from 2013 to 2017 – Part 2: The effects of emission changes and implications for multi-pollutant control, Atmos. Chem. Phys., 20, 6323–6337, https://doi.org/10.5194/acp-20-6323-2020, 2020.
Lu, K. D., Hofzumahaus, A., Holland, F., Bohn, B., Brauers, T., Fuchs, H., Hu, M., Häseler, R., Kita, K., Kondo, Y., Li, X., Lou, S. R., Oebel, A., Shao, M., Zeng, L. M., Wahner, A., Zhu, T., Zhang, Y. H., and Rohrer, F.: Missing OH source in a suburban environment near Beijing: observed and modelled OH and HO2 concentrations in summer 2006, Atmos. Chem. Phys., 13, 1057–1080, https://doi.org/10.5194/acp-13-1057-2013, 2013.
Lu, K. D., Rohrer, F., Holland, F., Fuchs, H., Bohn, B., Brauers, T., Chang, C. C., Häseler, R., Hu, M., Kita, K., Kondo, Y., Li, X., Lou, S. R., Nehr, S., Shao, M., Zeng, L. M., Wahner, A., Zhang, Y. H., and Hofzumahaus, A.: Observation and modelling of OH and HO2 concentrations in the Pearl River Delta 2006: a missing OH source in a VOC rich atmosphere, Atmos. Chem. Phys., 12, 1541–1569, https://doi.org/10.5194/acp-12-1541-2012, 2012.
Luecken, D. J., Yarwood, G., and Hutzell, W. T.: Multipollutant modeling of ozone, reactive nitrogen and HAPs across the continental US with CMAQ-CB6, Atmos. Environ., 201, 62–72, https://doi.org/10.1016/j.atmosenv.2018.11.060, 2019.
Marvin, M. R., Wolfe, G. M., Salawitch, R. J., Canty, T. P., Roberts, S. J., Travis, K. R., Aikin, K. C., de Gouw, J. A., Graus, M., Hanisco, T. F., Holloway, J. S., Hübler, G., Kaiser, J., Keutsch, F. N., Peischl, J., Pollack, I. B., Roberts, J. M., Ryerson, T. B., Veres, P. R., and Warneke, C.: Impact of evolving isoprene mechanisms on simulated formaldehyde: An inter-comparison supported by in situ observations from SENEX, Atmos. Environ., 164, 325–336, https://doi.org/10.1016/j.atmosenv.2017.05.049, 2017.
Monks, P. S.: Gas-phase radical chemistry in the troposphere, Chem. Soc. Rev., 34, 376, https://doi.org/10.1039/b307982c, 2005.
Napelenok, S. L., Cohan, D. S., Hu, Y., and Russell, A. G.: Decoupled direct 3D sensitivity analysis for particulate matter (DDM-3D/PM), Atmos. Environ., 40, 6112–6121, https://doi.org/10.1016/j.atmosenv.2006.05.039, 2006.
Napelenok, S. L., Cohan, D. S., Odman, M. T., and Tonse, S.: Extension and evaluation of sensitivity analysis capabilities in a photochemical model, Environ. Modell. Softw., 23, 994–999, https://doi.org/10.1016/j.envsoft.2007.11.004, 2008.
Nelson, B. S., Liu, Z., Squires, F. A., Shaw, M., Hopkins, J. R., Hamilton, J. F., Rickard, A. R., Lewis, A. C., Shi, Z., and Lee, J. D.: The effect of different climate and air quality policies in China on in situ ozone production in Beijing, Atmos. Chem. Phys., 24, 9031–9044, https://doi.org/10.5194/acp-24-9031-2024, 2024.
Park, C., Schade, G. W., and Boedeker, I.: Characteristics of the flux of isoprene and its oxidation products in an urban area, J. Geophys. Res.-Atmos., 116, https://doi.org/10.1029/2011JD015856, 2011.
Pennington, E. A., Wang, Y., Schulze, B. C., Seltzer, K. M., Yang, J., Zhao, B., Jiang, Z., Shi, H., Venecek, M., Chau, D., Murphy, B. N., Kenseth, C. M., Ward, R. X., Pye, H. O. T., and Seinfeld, J. H.: An updated modeling framework to simulate Los Angeles air quality – Part 1: Model development, evaluation, and source apportionment, Atmos. Chem. Phys., 24, 2345–2363, https://doi.org/10.5194/acp-24-2345-2024, 2024.
Qiao, X., Guo, H., Wang, P., Tang, Y., Ying, Q., Zhao, X., Deng, W., and Zhang, H.: Fine Particulate Matter and Ozone Pollution in the 18 Cities of the Sichuan Basin in Southwestern China: Model Performance and Characteristics, Aerosol Air Qual. Res., 19, 2308–2319, https://doi.org/10.4209/aaqr.2019.05.0235, 2019.
Sarwar, G., Godowitch, J., Henderson, B. H., Fahey, K., Pouliot, G., Hutzell, W. T., Mathur, R., Kang, D., Goliff, W. S., and Stockwell, W. R.: A comparison of atmospheric composition using the Carbon Bond and Regional Atmospheric Chemistry Mechanisms, Atmos. Chem. Phys., 13, 9695–9712, https://doi.org/10.5194/acp-13-9695-2013, 2013.
Scharko, N. K., Berke, A. E., and Raff, J. D.: Release of Nitrous Acid and Nitrogen Dioxide from Nitrate Photolysis in Acidic Aqueous Solutions, Environ. Sci. Technol., 48, 11991–12001, https://doi.org/10.1021/es503088x, 2014.
Sha, Q. E., Zhu, M., Huang, H., Wang, Y., Huang, Z., Zhang, X., Tang, M., Lu, M., Chen, C., Shi, B., Chen, Z., Wu, L., Zhong, Z., Li, C., Xu, Y., Yu, F., Jia, G., Liao, S., Cui, X., Liu, J., and Zheng, J.: A newly integrated dataset of volatile organic compounds (VOCs) source profiles and implications for the future development of VOCs profiles in China, Sci. Total Environ., 793, 148348, https://doi.org/10.1016/j.scitotenv.2021.148348, 2021.
Shareef, M., Cho, S., Lyder, D., Zelensky, M., and Heckbert, S.: Evaluation of Different Chemical Mechanisms on O3 and PM2.5 Predictions in Alberta, Canada, https://doi.org/10.3390/app12178576, 2022.
She, Y., Li, J., Lyu, X., Guo, H., Qin, M., Xie, X., Gong, K., Ye, F., Mao, J., Huang, L., and Hu, J.: Current status of model predictions of volatile organic compounds and impacts on surface ozone predictions during summer in China, Atmos. Chem. Phys., 24, 219–233, https://doi.org/10.5194/acp-24-219-2024, 2024.
Shu, Z., Liu, Y., Zhao, T., Xia, J., Wang, C., Cao, L., Wang, H., Zhang, L., Zheng, Y., Shen, L., Luo, L., and Li, Y.: Elevated 3D structures of PM2.5 and impact of complex terrain-forcing circulations on heavy haze pollution over Sichuan Basin, China, Atmos. Chem. Phys., 21, 9253–9268, https://doi.org/10.5194/acp-21-9253-2021, 2021.
Simonaitis, R., Meagher, J. F., and Bailey, E. M.: Evaluation of the condensed carbon bond (CB-IV) mechanism against smog chamber data at low VOC and NOx concentrations, Atmos. Environ., 31, 27–43, https://doi.org/10.1016/S1352-2310(96)00155-0, 1997.
Stockwell, W. R., Kirchner, F., Kuhn, M., and Seefeld, S.: A new mechanism for regional atmospheric chemistry modeling, J. Geophys. Res.-Atmos., 102, 25847–25879, https://doi.org/10.1029/97JD00849, 1997.
Stockwell, W. R., Middleton, P., Chang, J. S., and Tang, X.: The second generation regional acid deposition model chemical mechanism for regional air quality modeling, J. Geophys. Res.-Atmos., 95, 16343–16367, https://doi.org/10.1029/JD095iD10p16343, 1990.
Tan, Z., Fuchs, H., Lu, K., Hofzumahaus, A., Bohn, B., Broch, S., Dong, H., Gomm, S., Häseler, R., He, L., Holland, F., Li, X., Liu, Y., Lu, S., Rohrer, F., Shao, M., Wang, B., Wang, M., Wu, Y., Zeng, L., Zhang, Y., Wahner, A., and Zhang, Y.: Radical chemistry at a rural site (Wangdu) in the North China Plain: observation and model calculations of OH, HO2 and RO2 radicals, Atmos. Chem. Phys., 17, 663–690, https://doi.org/10.5194/acp-17-663-2017, 2017.
Tan, Z., Lu, K., Jiang, M., Su, R., Dong, H., Zeng, L., Xie, S., Tan, Q., and Zhang, Y.: Exploring ozone pollution in Chengdu, southwestern China: A case study from radical chemistry to O3–VOC–NOx sensitivity, Sci. Total Environ., 636, 775–786, https://doi.org/10.1016/j.scitotenv.2018.04.286, 2018.
Tan, Z., Lu, K., Hofzumahaus, A., Fuchs, H., Bohn, B., Holland, F., Liu, Y., Rohrer, F., Shao, M., Sun, K., Wu, Y., Zeng, L., Zhang, Y., Zou, Q., Kiendler-Scharr, A., Wahner, A., and Zhang, Y.: Experimental budgets of OH, HO2, and RO2 radicals and implications for ozone formation in the Pearl River Delta in China 2014, Atmos. Chem. Phys., 19, 7129–7150, https://doi.org/10.5194/acp-19-7129-2019, 2019.
Tan, Z., Ma, X., Lu, K., Li, X., Zhu, Q., Rohrer, F., Novelli, A., Fuchs, H., Wahner, A., Whalley, L., Heard, D., Brown, S., Zhang, X., and Zhang, Y.: Governing atmospheric oxidation capacity is the key to synergistic air quality and climate gains, One Earth, 9, 101569, https://doi.org/10.1016/j.oneear.2025.101569, 2026.
Tang, X. Y., Zhang, Y. H., and Shao, M.: Atmospheric Environmental Chemistry, 2nd edn., Higher Education Press, Beijing, ISBN 978-7-04-019361-9, 2006.
Trinh, H. T., Imanishi, K., Morikawa, T., Hagino, H., and Takenaka, N.: Gaseous nitrous acid (HONO) and nitrogen oxides (NOx) emission from gasoline and diesel vehicles under real-world driving test cycles, J. Air WASTE Manage., 67, 412–420, https://doi.org/10.1080/10962247.2016.1240726, 2017.
von Kuhlmann, R., Lawrence, M. G., Pöschl, U., and Crutzen, P. J.: Sensitivities in global scale modeling of isoprene, Atmos. Chem. Phys., 4, 1–17, https://doi.org/10.5194/acp-4-1-2004, 2004.
Wang, H., Li, Y., Liu, Y., Lu, X., Zhang, Y., Fan, Q., Shen, C., Lai, S., Zhou, Y., Zhang, T., and Yue, D.: Underappreciated contributions of biogenic volatile organic compounds from urban green spaces to ozone pollution, Atmos. Chem. Phys., 25, 5233–5250, https://doi.org/10.5194/acp-25-5233-2025, 2025a.
Wang, N., Du, Y., Chen, D., Meng, H., Chen, X., Zhou, L., Shi, G., Zhan, Y., Feng, M., Li, W., Chen, M., Li, Z., and Yang, F.: Spatial disparities of ozone pollution in the Sichuan Basin spurred by extreme, hot weather, Atmos. Chem. Phys., 24, 3029–3042, https://doi.org/10.5194/acp-24-3029-2024, 2024.
Wang, T., Xue, L., Brimblecombe, P., Lam, Y. F., Li, L., and Zhang, L.: Ozone pollution in China: A review of concentrations, meteorological influences, chemical precursors, and effects, Sci. Total Environ., 575, 1582–1596, https://doi.org/10.1016/j.scitotenv.2016.10.081, 2017.
Wang, Y., Fu, X., Wu, D., Wang, M., Lu, K., Mu, Y., Liu, Z., Zhang, Y., and Wang, T.: Agricultural Fertilization Aggravates Air Pollution by Stimulating Soil Nitrous Acid Emissions at High Soil Moisture, Environ. Sci. Technol., 55, 14556–14566, https://doi.org/10.1021/acs.est.1c04134, 2021.
Wang, Y., Yang, X., Wu, K., Mei, H., De Smedt, I., Wang, S., Fan, J., Lyu, S., and He, C.: Long-term trends of ozone and precursors from 2013 to 2020 in a megacity (Chengdu), China: Evidence of changing emissions and chemistry, Atmos. Res., 278, 106309, https://doi.org/10.1016/j.atmosres.2022.106309, 2022.
Wang, Y., Li, Q., Wang, Y., Ren, C., Saiz-Lopez, A., Xue, L., and Wang, T.: Increasing soil nitrous acid emissions driven by climate and fertilization change aggravate global ozone pollution, Nat. Commun., 16, 2463, https://doi.org/10.1038/s41467-025-57161-6, 2025b.
Wei, W., Lv, Z. F., Li, Y., Wang, L. T., Cheng, S. Y., and Liu, H.: A WRF-Chem model study of the impact of VOCs emission of a huge petrochemical industrial zone on the summertime ozone in Beijing, China, Atmos. Environ., 175, 44–53, https://doi.org/10.1016/j.atmosenv.2017.11.058, 2018.
Whitten, G. Z., Hogo, H., and Killus, J. P.: The carbon-bond mechanism: a condensed kinetic mechanism for photochemical smog, Environ. Sci. Technol., 14, 690–700, https://doi.org/10.1021/es60166a008, 1980.
Xie, Y., Paulot, F., Carter, W. P. L., Nolte, C. G., Luecken, D. J., Hutzell, W. T., Wennberg, P. O., Cohen, R. C., and Pinder, R. W.: Understanding the impact of recent advances in isoprene photooxidation on simulations of regional air quality, Atmos. Chem. Phys., 13, 8439–8455, https://doi.org/10.5194/acp-13-8439-2013, 2013.
Xing, J., Ding, D., Wang, S., Dong, Z., Kelly, J. T., Jang, C., Zhu, Y., and Hao, J.: Development and application of observable response indicators for design of an effective ozone and fine-particle pollution control strategy in China, Atmos. Chem. Phys., 19, 13627–13646, https://doi.org/10.5194/acp-19-13627-2019, 2019.
Xuan, H. Y., Liu, C., Zhang, P., Chu, B. W., Liang, L. L., Ma, Q. X., and He, H.: A Review of Laboratory Studies on the Heterogeneous Chemistry of NO2: Mechanisms and Uptake Kinetics, J. Phys. Chem. A, 129, 815–835, https://doi.org/10.1021/acs.jpca.4c07943, 2025.
Xue, L., Gu, R., Wang, T., Wang, X., Saunders, S., Blake, D., Louie, P. K. K., Luk, C. W. Y., Simpson, I., Xu, Z., Wang, Z., Gao, Y., Lee, S., Mellouki, A., and Wang, W.: Oxidative capacity and radical chemistry in the polluted atmosphere of Hong Kong and Pearl River Delta region: analysis of a severe photochemical smog episode, Atmos. Chem. Phys., 16, 9891–9903, https://doi.org/10.5194/acp-16-9891-2016, 2016.
Yan, D., Jin, Z. P., Zhou, Y. T., Li, M. M., Zhang, Z. H., Wang, T. J., Zhuang, B. L., Li, S., and Xie, M.: Anthropogenically and meteorologically modulated summertime ozone trends and their health implications since China's clean air actions, Environ. Pollut., 343, https://doi.org/10.1016/j.envpol.2023.123234, 2024.
Yang, X., Lu, K., Ma, X., Liu, Y., Wang, H., Hu, R., Li, X., Lou, S., Chen, S., Dong, H., Wang, F., Wang, Y., Zhang, G., Li, S., Yang, S., Yang, Y., Kuang, C., Tan, Z., Chen, X., Qiu, P., Zeng, L., Xie, P., and Zhang, Y.: Observations and modeling of OH and HO2 radicals in Chengdu, China in summer 2019, Sci. Total Environ., 772, 144829, https://doi.org/10.1016/j.scitotenv.2020.144829, 2021.
Ye, C., Zhang, N., Gao, H., and Zhou, X.: Photolysis of Particulate Nitrate as a Source of HONO and NOx, Environ. Sci. Technol., 51, 6849–6856, https://doi.org/10.1021/acs.est.7b00387, 2017.
Yu, S., Mathur, R., Sarwar, G., Kang, D., Tong, D., Pouliot, G., and Pleim, J.: Eta-CMAQ air quality forecasts for O3 and related species using three different photochemical mechanisms (CB4, CB05, SAPRC-99): comparisons with measurements during the 2004 ICARTT study, Atmos. Chem. Phys., 10, 3001–3025, https://doi.org/10.5194/acp-10-3001-2010, 2010.
Zaveri, R. A. and Peters, L. K.: A new lumped structure photochemical mechanism for large-scale applications, J. Geophys. Res.-Atmos., 104, 30387–30415, https://doi.org/10.1029/1999JD900876, 1999.
Zhang, L., Guo, X., Zhao, T., Gong, S., Xu, X., Li, Y., Luo, L., Gui, K., Wang, H., Zheng, Y., and Yin, X.: A modelling study of the terrain effects on haze pollution in the Sichuan Basin, Atmos. Environ., 196, 77–85, https://doi.org/10.1016/j.atmosenv.2018.10.007, 2019.
Zhang, S., Sarwar, G., Xing, J., Chu, B., Xue, C., Sarav, A., Ding, D., Zheng, H., Mu, Y., Duan, F., Ma, T., and He, H.: Improving the representation of HONO chemistry in CMAQ and examining its impact on haze over China, Atmos. Chem. Phys., 21, 15809–15826, https://doi.org/10.5194/acp-21-15809-2021, 2021.
Zheng, B., Tong, D., Li, M., Liu, F., Hong, C., Geng, G., Li, H., Li, X., Peng, L., Qi, J., Yan, L., Zhang, Y., Zhao, H., Zheng, Y., He, K., and Zhang, Q.: Trends in China's anthropogenic emissions since 2010 as the consequence of clean air actions, Atmos. Chem. Phys., 18, 14095–14111, https://doi.org/10.5194/acp-18-14095-2018, 2018.
Zhou, M., Liu, Y., Lu, K., Yu, D., Li, C., Zhai, T., Yang, S., Tan, Z., Ma, X., Li, X., Dong, H., Zeng, L., Chen, S., Chen, J., Tan, Q., Song, D., Zhang, X., and Zhang, Y.: Ozone production sensitivity analysis for the Chengdu Plain Urban Agglomeration based on a multi-site and two-episode observation, Sci. Total Environ., 950, 175068, https://doi.org/10.1016/j.scitotenv.2024.175068, 2024.
Zhou, Z., Tan, Q., Deng, Y., Wu, K., Yang, X., and Zhou, X.: Emission inventory of anthropogenic air pollutant sources and characteristics of VOCs species in Sichuan Province, China, J. Atmos. Chem., 76, 21–58, https://doi.org/10.1007/s10874-019-9386-7, 2019.
Zhu, Z., Do, K., Ivey, C. E., and Collins, D. R.: Assessing CMAQ model discrepancies in a heavily polluted air basin using UAV vertical profiles and sensitivity analyses, Environ. Sci.: Atmos., 4, 1051–1063, https://doi.org/10.1039/d4ea00004h, 2024.