
the Creative Commons Attribution 4.0 License.
the Creative Commons Attribution 4.0 License.
 | 16 Nov 2026
Vertically stratified long-range transport of biomass-burning aerosol over Reunion Island during September 2017
Dominique Gantois

Alexandre Baron
Michaël Sicard
Valentin Duflot
Niels Groenen
Nelson Bègue
Sabine Eckhardt
Nikolaos Evangeliou
Martine De Mazière
Corinne Vigouroux
Guillaume Payen
Nicolas Marquestaut
Jean-Marc Metzger
Patrick Chazette
Cyrille Flamant
Biomass-burning (BB) aerosols seasonally perturb the otherwise relatively clean atmosphere of the South-West Indian Ocean (SWIO), but vertically resolved observations remain sparse in its eastern sector. We examine an enhanced aerosol episode over Reunion Island (21° S, 55° E) in September 2017 by combining AERONET sun-photometer measurements, ground-based Raman and elastic lidar retrievals, FTIR CO observations, MODIS and CALIOP products, CAMS EAC4 reanalysis, and FLEXPART simulations. AERONET aerosol optical depth at 550 nm reached unusually high values (0.16–0.42) during the second half of September. CAMS provided temporally continuous total and species-resolved model AOD and simulated organic matter as the largest aerosol contribution. MODIS and CALIOP provided regional context, showing elongated enhanced-AOD corridors and elevated aerosol layers frequently classified as smoke-related over the western SWIO. On 19 September, lidar observations identified one layer between 2.8 and 4.7 km with Å = 1.32 ± 0.23. On 25 September, two vertically separated layers with distinct optical properties were observed: a lower layer (3.3–5 km, Å = 1.45 ± 0.12) and a drier upper layer (5–9 km, Å = 1.60 ± 0.06). FLEXPART simulations for two selected source regions, evaluated against vertically smoothed FTIR CO observations, support Southern African influence on both cases and an additional South American contribution to the lower layer on 25 September. The observations demonstrate that column-integrated measurements alone cannot resolve the layered aerosol structure over Reunion; the combined evidence provides an illustrative case of vertically distinct long-range transport pathways in the eastern SWIO.
- Article
(10280 KB) - Full-text XML
- BibTeX
- EndNote


The Southern Hemisphere (SH) tropospheric aerosol content is characterized by a strong disparity between widespread near-pristine marine regions and seasonally polluted continental outflows. Over the oceans, background conditions are essentially made of marine aerosols such as sea salt and organic aerosols, responsible for low aerosol optical depth (AOD) values as measured over the South-West Indian Ocean (SWIO) (Mascaut et al., 2022). Over land, certain continental regions, such as Southern Africa and South America are the main seasonal sources of biomass burning (BB) aerosols (van der Werf et al., 2017). During the BB season (May–October, Edwards et al., 2006), the dry season in the tropics, massive fires emit large quantities of carbonaceous particles such as black carbon (BC) and organic matter (OM). These emissions create elevated smoke layers in the free troposphere (at typically 3, 5 and 8 km for African fires, Edwards et al., 2006; Garstang et al., 1996; Ranaivombola et al., 2023). These layers can follow long-range transport routes across the Atlantic and Indian Oceans (Edwards et al., 2006; Garstang et al., 1996; Thompson et al., 1996), leading to seasonal peaks in AOD (Ranaivombola et al., 2023), and inducing radiative effects related to absorption and aerosol-cloud interaction (Lu et al., 2018). Therefore, the SH troposphere could be represented as a two-regime system, with an aerosol background content made of clean marine aerosols, seasonally affected by short- and long-range transported BB aerosols.
Recent observation-constrained studies further show that variability in CO and NOx emissions can affect source interpretation (Wang et al., 2025), while uncertainties in aerosol absorption, especially for organic aerosol in BB plumes, remain important for radiative applications (Samset et al., 2018; Konovalov et al., 2021). Reducing aerosol-forcing uncertainty therefore requires coordinated use of models and satellite, ground-based, and in situ observations (Kahn et al., 2023).
Our understanding of this system has and is still being improved thanks to several major multi-instrumental international field campaigns that provided observations leading to key findings in terms of aerosol emissions, transport, and radiative effect. The SAFARI (Southern African Regional Science Initiative) 2000 campaign (Swap et al., 2003) was one of the first large-scale observational campaign designed to study BB aerosols over Southern Africa. It showed that BB is the main source of aerosols and trace gases in this region, and datasets from this campaign became benchmarks for global fire emission inventories (GFED, Global Fire Emission Database). It also revealed the existence of extensive regional smoke layers above Southern Africa and introduced the expression “river of smoke” to describe a spatially coherent large-scale smoke plume transported from Southern Africa toward the Indian Ocean (Annegarn et al., 2002), highlighting the efficiency of continental to ocean aerosol export (Schmid et al., 2003). The INDOEX campaign (Ramanathan et al., 2001) focused on anthropogenic pollution from South-East Asia spreading over the Indian Ocean and showed that continental outflow from South-East Asia strongly perturbs the radiative balance of otherwise pristine marine environments, sometimes thousands of kilometers away. These effects can influence large-scale systems such as the South Asian Monsoon. More recently, the AEROCLO-sA campaign (Formenti et al., 2019) focused on BB aerosols over Southern Africa and the southeast Atlantic. It followed a multi-instrumental coordinated approach by using aircraft, ground-based, and satellite observations to investigate aerosol vertical distribution, aerosol-cloud overlap, and radiative effects. This campaign confirmed the persistence of elevated smoke layers, highlighting the role of dynamical transport in shaping aerosol stratification, and demonstrated how absorbing aerosols can modify atmospheric stability and cloud development. It led to understand that aerosol transport along the Namibian coast is highly variable and vertically structured, with multiple layers of smoke from Angola and dust from South America extending through the lower and mid-troposphere under the influence of changing synoptic circulations such as coastal flows, jets, and cut-off lows (Chazette et al., 2019). With the help of global and mesoscale numerical simulations, another study (Flamant et al., 2022) focused on a coherent, fast-moving “river of smoke”, travelling for thousands of kilometers from Southern Africa toward the southeast Atlantic and Indian Ocean, and transporting BB aerosols. It showed that this long-range transport is driven by coupled synoptic-scale systems (tropical easterly disturbances, midlatitude westerly waves, and cut-off lows forming tropical-temperate troughs) which efficiently lift smoke into the mid- and upper troposphere (sometimes up to 8 km) and channel it along well-defined atmospheric pathways. More recently, (Ranaivombola et al., 2025) documented “river of smoke” events over the SWIO during the BB Aerosol Campaign (BiBAC) at Skukuza (South Africa), but under different synoptic conditions from those previously described. This work highlighted the diversity of large-scale dynamical pathways capable of channeling BB aerosols from Southern Africa toward the SWIO. These organized transport corridors are key for exporting aerosols far from their sources and strongly influence their radiative and cloud impacts downstream.
These campaigns established that smoke export from Southern Africa is frequent, vertically structured, and dynamically organized. However, most intensive observations were acquired close to the continental source regions, over the southeast Atlantic, or in the western SWIO. Far fewer vertically resolved observations are available at Reunion Island in the eastern SWIO, where air masses transported from Southern Africa and, episodically, South America can converge after several thousand kilometers of transport. Measurements at this remote receptor can therefore extend the geographical coverage of previous campaigns and constrain layer altitude, vertical separation, optical properties, and the surrounding moisture environment – information needed by subsequent aerosol–radiation and aerosol–cloud studies.
This observational need is becoming more pressing as wildfire activity intensifies in the SH. Recent analyses show that fire numbers and cumulated intensities across South America have been rising significantly over the past two decades (Groenen et al., 2026). In this context, Reunion Island (21° S, 55° E) emerges as a unique strategic observational site in the SH. Located in the SWIO, it hosts the Observatory of Atmospheric Physics of La Reunion (OPAR), and lies at the crossing of major atmospheric transport pathways linking Southern Africa, South America, Southern and Southeast Asia (Duflot et al., 2022). This location enables the island to observe both (i) clean marine background conditions dominated by marine aerosols under the influence of trade-winds (Mascaut et al., 2022), and (ii) seasonal perturbations associated with long-range transported biomass burning plumes (Duflot et al., 2022). The high-altitude Maïdo Observatory (2160 m a.s.l., Baray et al., 2013) provides direct access to the free troposphere. It hosts several ground-based instruments that can help study tropospheric aerosol content, validate satellite retrievals, and evaluate transport models. These instruments include sun-photometers to measure total aerosol optical depth (AOD), multiwavelength UV and visible lidars to retrieve vertical profiles of aerosol optical properties, and Fourier Transform Infra-red (FTIR) spectrometers to measure partial columns of Carbon Monoxide (CO) related to BB emissions.
In this work, we characterize the vertical structure, optical properties, and moisture environment of BB aerosol layers observed over Reunion Island during an enhanced episode in September 2017 and examine their possible transport pathways. Ground-based measurements at Maïdo Observatory are combined with satellite retrievals and CAMS reanalysis to connect the local vertical structure with the regional aerosol distribution; FLEXPART CO simulations then test whether transport from two selected source regions is consistent with the timing and altitude of the observed layers. The contribution of this case study is the vertically resolved characterization, in the eastern SWIO, of one single-layer case and one case with two simultaneous elevated layers displaying contrasting optical and moisture environments.
2.1 Instruments
2.1.1 CIMEL sun photometer
The total AOD500 and the Ångström exponent between 440 and 675 nm (Å440–675) were retrieved from a CIMEL sun-photometer (Cimel Electronique, Paris – France) located on a rooftop at the University of La Réunion in the city of Saint-Denis (80 m a.s.l., 20.90° S, 55.45° E). This instrument is in the SNO PHOTON/AERONET network (Service National d'Observation PHOTONS/AErosol RObotic NETwork) (Holben et al., 1998), part of ACTRIS-ERIC (Aerosol, Clouds, Trace Gases European Research Infrastructure Consortium). The data retrieved corresponded to direct sun version 3 level 2.0 (Giles et al., 2019; Smirnov et al., 2000) and was downloaded from AERONET website (https://aeronet.gsfc.nasa.gov/cgi-bin/webtool_aod_v3, last access: 28 April 2025). AOD level 2.0 product from the CIMEL Sun-photometer was accessed for measurements from December 2003 until December 2024. The AOD500 wavelength was converted into AOD550 wavelength and into AOD532 wavelength using Å440–675 in order to facilitate comparisons with similar variables from model reanalysis or lidar measurements at 532 nm. This conversion assumes that the measured Ångström exponent represents the wavelength dependence between 500 and 550/532 nm. Its uncertainty therefore propagates into the converted AOD. Because the wavelength interval is small, we use these converted values as comparison quantities rather than as independent measurements at 532 or 550 nm.
2.1.2 Spaceborne instruments
MODIS
The Moderate Resolution Imaging Spectroradiometers (MODIS) are spaceborne instruments onboard the synchronous polar-orbiting platforms Terra and Aqua (King et al., 1992; Salomonson et al., 1989). Both platforms provide a quasi-complete coverage of the Earth with a vertical resolution between 250 and 1000 m at ground level depending on the spectral band. In this study, we use the Terra and Aqua AOT at 550 nm from the MODIS aerosol product level 2 data (http://aqua.nasa.gov, last access: 3 April 2026) with a spatial resolution at nadir of 10 × 10 km2. We also use the radiance-based Fire Radiative Power (FRP), derived from MODIS measurements on the Aqua platform. The uncertainty on the AOT is AOT over the land and AOT over the ocean (Chu et al., 2002).
CALIOP
In this study, we also use vertical profiles of aerosol optical products from the Cloud-Aerosol LIdar with Orthogonal Polarization (CALIOP) aboard Cloud-Aerosol Lidar and Infrared Pathfinder Satellite Observations (CALIPSO, http://www-calipso.larc.nasa.gov, last access: 10 April 2026). Details on this instrument and the methodology for data processing can be found in (Winker et al., 2007). In this work, we use CALIOP level-2 data version 4.10 (Tackett et al., 2023). The inversion method is described in (Young and Vaughan, 2009); and the aerosol classification method can be found in (Kim et al., 2018) with updates in (Tackett et al., 2023). Because CALIOP subtyping is an algorithmic classification based on measured optical properties, location, and assumed aerosol models, mixed smoke–pollution layers and weakly scattering features may be misclassified. The subtype product is therefore used as regional context rather than as a direct chemical measurement.
2.1.3 Ground-based lidars
Two Maido lidars are used to retrieve vertical profiles of aerosol optical properties in the troposphere. The Li1200 provides Rayleigh-Mie scattering profiles at 355 nm, Raman N2 scattering profiles at 387 nm, and Raman H2O scattering profiles at 407 nm. The LiO3T provides elastic scattering profiles at 532 nm with polarization information, elastic scattering profiles at 1064 nm, and Raman N2 scattering profiles at 607 nm. Technical specifications for both instruments can be found in a dedicated data paper (Gantois et al., 2024a, b). Data can be accessed at https://doi.org/10.26171/rwcm-q370 (last access: 28 April 2025). These lidars are routinely operated twice per week and only measured during nighttime to ensure a good signal to noise ratio (SNR).
The datasets consist of 1 min integrated profiles for the Li1200 and 2 min integrated profiles for the LiO3T. An overlap factor correction was applied for the very low 355 nm elastic channel of the Li1200, as well as the polarized 532 nm elastic channels of the LiO3T. Up to now, it has never been physically possible to perform horizontal measurements with Maïdo lidars. Therefore, an experimental approach using vertical measurements (instead of horizontal) in aerosol-free conditions was performed. Specifics about the equation used as well as the corresponding uncertainty analysis can be found in Gantois et al. (2024b). Concerning the retrieval of aerosol optical products, a two-component Klett inversion was applied to the time-series, initially using a constant LR value of 50 sr (Klett, 1985). The corresponding equations and uncertainties can be found in Gantois et al. (2024b). A Raman inversion was then performed for the Li1200 using the average signal for each time-series to improve the SNR for the 387 nm channel. The corresponding equations used to compute the aerosol extinction and backscatter coefficients as well as the lidar ratio (LR) profile can be found in Ansmann et al. (1992). The mean value of this lidar ratio profile was used to perform a new Klett inversion on the lidar signal time-series. An Ångström exponent (Å) was also derived from the aerosol backscatter at 355 and 532 nm. For consistent processing of the two nights, the 75 ± 9 sr lidar ratio retrieved at 355 nm for the upper layer on 25 September was also applied to 19 September and to 532 nm. This transfer, although compatible with published BB-aerosol ranges, is the main systematic assumption affecting the absolute Klett extinction and subsequent AOD. Layer altitude and the identification of one versus two layers rely primarily on the observed backscatter structure and are consequently less sensitive to this choice.
Vertical profiles of Water vapor mixing ratio (WVMR) were retrieved from the 387 and 407 nm channels of the Li1200 using the methodology described in (Vérèmes et al., 2019). Time-series of WVMR vertical profiles were computed, using integrated 5 min signals from the Li1200 as described in Eq. (1) (Whiteman et al., 2006):
where C is the calibration coefficient, O(z) is the overlap function, Γ(z) is the temperature-dependent Raman cross-sections, and are respectively the power received at the 407 and 387 nm wavelengths, SB and SBare respectively the sky background at the 407 nm and 387 nm wavelengths, and Δτ is the differential term due to the atmosphere. The calibration constant was retrieved using the GNSS (Global Navigation Satellite System) methodology described in (Vérèmes et al., 2019).
2.1.4 FTIR
A Bruker IFS 125HR Fourier Transform Infra-red (FTIR) spectrometer has been continuously measuring at Maïdo observatory since March 2013 (Baray et al., 2013). This instrument is equipped with two detectors: InSb and MCT, and with a KBr beamsplitter. It covers the spectral range from 600 to 4500 cm−1 (2.2 to 16 µm). with a maximum optical path difference of 257 cm. To obtain one spectrum, the instrument must provide one forward and one backward scan in less than 3 min. Usually, two or three scans must be averaged to increase the SNR. Vertical profiles of volume mixing ratios of CO were derived using the Optimal Estimation Method, implemented in SFIT4 (SFIT4:V0.9.4.4, https://wiki.ucar.edu/display/sfit4/Infrared Working Group Retrieval Code, SFIT, last access: 6 November 2026, Hannigan et al., 2024). Details on the CO retrieval settings can be found in Zhou et al. (2018), including the fitted spectral windows, interfering species, and averaging kernels description. Concerning ancillary data, a priori temperature and pressure profiles were derived from 6-hourly NCEP analyses from the surface up to 1 mbar altitude, and WACCM monthly means above. A priori profiles of CO volume mixing ratio were taken from the WACCM v6 model. Vertical profiles of volume mixing ratios of CO were weighted by the airmasses in each retrieval layer and integrated to give the total or profiles of partial columns in molecules cm−2. The uncertainty budget was based on the methodology of Rogers (Rodgers, 2000). The total uncertainty has been determined by adding all components in quadrature. In our study, we chose to extract the uncertainty profiles from the diagonal of the covariance matrices. The risk is to underestimate the uncertainty by not taking into account the potential correlation with the non-diagonal elements. The most important contributions to the random and systematic uncertainty budget are the measurement noise and the spectroscopic parameters, respectively (Senten et al., 2008). Mean random and systematic uncertainties on CO total columns are 1.2 % and 2.5 %, respectively. In addition to total columns, FTIR can provide low-vertical resolution CO profiles. The mean degrees-of-freedom for signal (DOFS, trace of the averaging kernel matrix) is 2.25, meaning that at least 2 independent pieces of information can be retrieved from the FTIR spectra. In the altitude used in the present study, the mean DOFS is 0.62 for the ground to 5 km range, and 1.15 for the 5 to 15 km range. The FTIR data sets can be accessed at the NDACC repository (https://ndacc.larc.nasa.gov/index.php/instruments/ftir-spectrometer/profile-multiple-species-ftir-spectrometer-bruker-125hr-reunion, last access: 29 April 2025).
A climatology using FTIR data from 2013 to 2019 was performed to derive background values of CO.
2.2 Numerical modelling
2.2.1 Copernicus CAMS EAC4
Total, black carbon (BC), organic matter (OM), dust (DU), sulfate (SU), and sea salt (SS) AOD550 were retrieved from the Copernicus Atmosphere Monitoring Service (CAMS) European Centre for Medium-range Weather Forecast (ECMWF) Atmospheric Composition Reanalysis 4 (EAC4) (Benedetti et al., 2009; Mangold et al., 2011; Morcrette et al., 2009). CAMS was selected to provide temporally continuous total and species-resolved model AOD fields for the study period (Chazette, 2026). The CAMS global reanalysis (EAC4) is available from the Copernicus Atmosphere Data Store (Copernicus Atmosphere Monitoring Service, 2020, https://ads.atmosphere.copernicus.eu/datasets/cams-global-reanalysis-eac4?tab=download, last access: 29 April 2025). Concerning the naturally emitted aerosols (dust and sea-salt), their sources are linked to prognostic and diagnostic model variables on the surface and near-surface. However, sources of anthropogenic aerosols (organic matter, black carbon and sulfate) originate from the MACCity anthropogenic emission inventory (based on the ACCMIP historical emissions extended to 2020 following RCP 8.5), while biomass burning emissions of BC and OM are provided by the Global Fire Assimilation System version 1.2 (GFASv1.2) (Inness et al., 2019). We extracted one month of data produced by CAMS EAC4 from 1 September until 1 October 2017, with a spatial resolution of 0.75° × 0.75°, and a temporal resolution of 3 h. We averaged the data around Reunion Island using a 1° radius box centered on Reunion Island. EAC4 assimilates satellite total-AOD observations, whereas the partition among aerosol species is determined by the model, emission inventories, transport, removal, and optical assumptions; nitrate is not represented among the components used here. The comparison with AERONET therefore evaluates total column AOD, while species-resolved AOD is used as model-based information rather than as an independently validated composition measurement.
2.2.2 ECMWF ERA5
ERA5 reanalysis is the fifth generation of ECMWF global reanalysis. This widely used product is comprehensively presented by Hersbach et al. (2020). In this work, the hourly pressure level outputs (37 levels) are used to plot synoptic maps with 0.25° × 0.25° resolution. The data can be accessed via the climate data store portal hosted by Copernicus (https://cds.climate.copernicus.eu/, last access: 6 November 2026). Synoptic maps highlight the underlying atmospheric dynamics enabling long-range transport of aerosol.
2.2.3 FLEXPART
The long-range transport of wildfire CO from SA and Africa was simulated with the Lagrangian particle dispersion model FLEXPART version 10.4 (Pisso et al., 2019) in forward mode. The input emissions of CO into the model were adopted from the Copernicus Global Fire Assimilated System (GFAS) (Kaiser et al., 2012). In addition to emission fluxes of CO (and other pollutants), the product also provides estimates of the injection height of the wildfire plume, a feature that is crucial for accurate simulation of smoke dispersion. The model is driven by hourly reanalysis meteorological fields (ERA5) from ECMWF with 137 vertical levels (up to approximately 80 km) and a horizontal resolution of 0.5° × 0.5° (Hersbach et al., 2020). FLEXPART accounts for turbulence, unresolved mesoscale motions (Stohl et al., 2005), and deep convection (Forster et al., 2007). The model output consists of 4-dimensional modelled concentrations extending from the surface up to 15 km height, wet and dry deposition variables. The FTIR a priori profiles and averaging kernel matrices were used to smooth CO vertical profiles over Reunion Island provided by FLEXPART using the following equation (Rodgers and Connor, 2003):
where COFlex_smooth is the smoothed CO vertical profile from FLEXPART outputs, COFlex is the raw CO vertical profile provided by FLEXPART, FTIRapriori is the a priori profile from the FTIR, and Ak is the averaging kernel from the FTIR. Background values of CO derived from the FTIR 2013–2019 climatology were added to FLEXPART output profiles. The FTIR partial columns were compared to FLEXPART partial columns derived from vertical profiles to evaluate whether the model reproduced the observed CO variability and broad vertical distribution. The averaging-kernel smoothing makes FLEXPART and FTIR comparable at the limited FTIR vertical resolution, but it also removes fine vertical structure. This comparison therefore cannot validate individual aerosol-layer boundaries.
To examine possible source regions, distinct forward simulations were performed for BB CO emitted from Southern Africa and South America. The reported contributions are therefore defined within this two-source experiment; Madagascar and other possible source regions were not simulated separately. Their interpretation also depends on GFAS emission magnitude and injection height, ERA5-resolved transport and convection, and unresolved mixing. Moreover, CO is used as an air-mass tracer: its longer lifetime and the absence of aerosol-specific removal prevent its simulated source fractions from being interpreted as quantitative aerosol-mass fractions.
Each dataset constrains a different part of the analysis. AERONET establishes the timing and magnitude of enhanced column AOD; MODIS and CALIOP place the episode in its regional horizontal and vertical context; and the ground-based lidars resolve the local layer structure, optical properties, and coincident moisture environment. CAMS species AOD and FLEXPART CO simulations provide model-based information on composition and transport, with the latter evaluated against FTIR at the partial-column and coarse vertical scales resolved by the retrieval. Source pathways are consequently inferred from the combined evidence rather than observed directly.
3.1 Aerosol optical depths during September 2017
High AOD values were observed and modelled in September 2017 above Reunion Island. Figure 1 shows the AOD550 measured by the sun-photometer, as well as the total AOD550 and the contribution of various aerosol chemical compounds derived from CAMS EAC4 reanalysis.
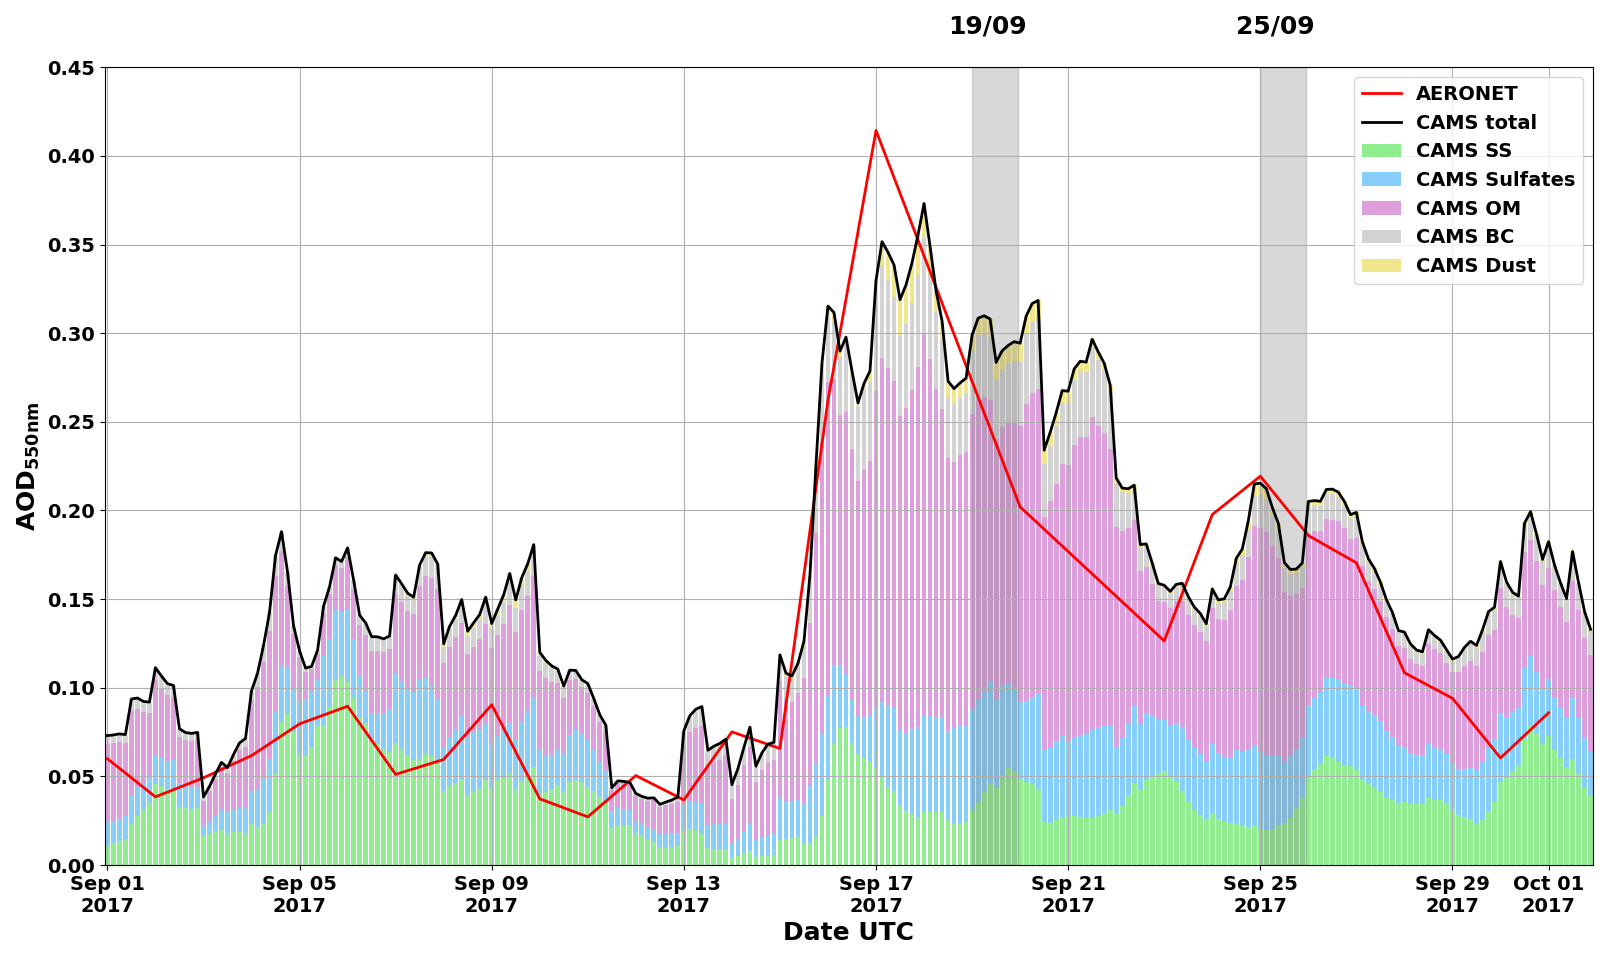
Figure 1Daily total Aerosol optical depth AOD550 measured by a CIMEL sun-photometer (AERONET network) above Saint-Denis (red curve) during September 2017. Total and specific AOD550 produced with a 3h temporal resolution by CAMS EAC4: total AOD550 (black curve – CAMS total), AOD550 from black carbon (grey bars – CAMS BC), AOD550 from dust (yellow bars – CAMS Dust), AOD550 from sulfates (blue bars – CAMS Sulfates), AOD550 from organic matter (purple bars – CAMS OM), and AOD550 from sea-salt (green bars – CAMS other). Vertical areas in grey indicate two days of high AOD with concomitant lidar measurements: 19 and 25 September 2017.
The usual AOD550 value from a monthly climatology encountered above Reunion Island in September is 0.09 ± 0.03 (Appendix A1, updated from Duflot et al., 2022). AOD550 from AERONET was particularly strong between 16 and 23 September 2017 (0.16–0.42), and between 24 and 28 September 2017 (0.16–0.23). For those two periods, we selected concomitant lidar measurements (grey areas) on the 19 and 25 September 2017.
The high values observed in September 2017 are consistent with the local BB-season enhancement identified in a previous AOD440 climatology from the same sun photometer, which associated the baseline mainly with sea salt and the seasonal increase with BB influence (Duflot et al., 2022). AERONET AOD550 and CAMS total AOD550 broadly covaried between the 11 and 28 September 2017. This comparison is used only to place the observed episode in the temporal context of the reanalysis, not as a formal evaluation of model performance or aerosol speciation. Larger differences occurred between the 1 and 11 September. Several factors may contribute, including the mismatch between a point measurement and the 1° marine-dominated averaging area, CAMS aerosol and removal assumptions, and the satellite observations assimilated by the reanalysis. The available analysis does not isolate the cause of this difference. In the CAMS model partition, organic matter (OM) contributes between 50 % and 60 % to the high AOD550 values observed for the two periods previously described. Black carbon (BC), sulfates (SU) and sea-salt (SS) also contribute, but much less than OM (between 5 % and 25 %). Dust (DU) has a negligible contribution (less than 5 %). Biomass burning emits many elements such as volatile and gaseous carbonaceous compounds (among which the carbon monoxide – CO), BC, and OC essentially made of degradation products from natural cellulose (Simoneit, 2002). The simulated rise in OM, together with elevated observed AOD and the independent satellite context described below, provides supporting evidence for BB-smoke influence. The CAMS partition itself is not an observational attribution.
3.2 Regional satellite context
3.2.1 Passive remote sensing observations of AOD
To assess the horizontal dispersion of these increased AOD values over Reunion Island, we used MODIS observations from AQUA and TERRA and compared average values of AOD from the first two weeks of September 2017 (Fig. 2b), and the last two weeks of September 2017 (Fig. 2c). We also added the cumulated FRP for the first two weeks of September 2017 (Fig. 2a). During the first two weeks of September 2017, the cumulated FRP was particularly high above South America and Southern Africa, meaning that the BB activity was strong during this period. For the same period, strong AOD values were observed above Brazil, Namibia and Botswana (AOD ≥ 1). The spatial displacement between the FRP maxima and elevated AOD is consistent with transport after emission, although these temporally averaged maps do not trace individual air masses.
Two elongated regions of elevated AOD, here described qualitatively as organized smoke-transport corridors, are visible in Fig. 2. One extends from Brazil toward the southeast over Bolivia, Argentina, and Uruguay before crossing the Atlantic toward southern Africa and the SWIO (Edwards et al., 2006; Flamant et al., 2022). The second is connected to Southern African fire regions and extends toward the Atlantic coast and then eastward across southern Africa toward the SWIO (Garstang et al., 1996; Swap et al., 2003). Mean ERA5 winds at 600 hPa provide dynamical context for these pathways. Higher AOD occurred over the SWIO during the second half of September. Because the maps are temporally averaged and AOD is not source-specific, they indicate plausible regional connectivity rather than demonstrating the origin of aerosol subsequently observed over Reunion.
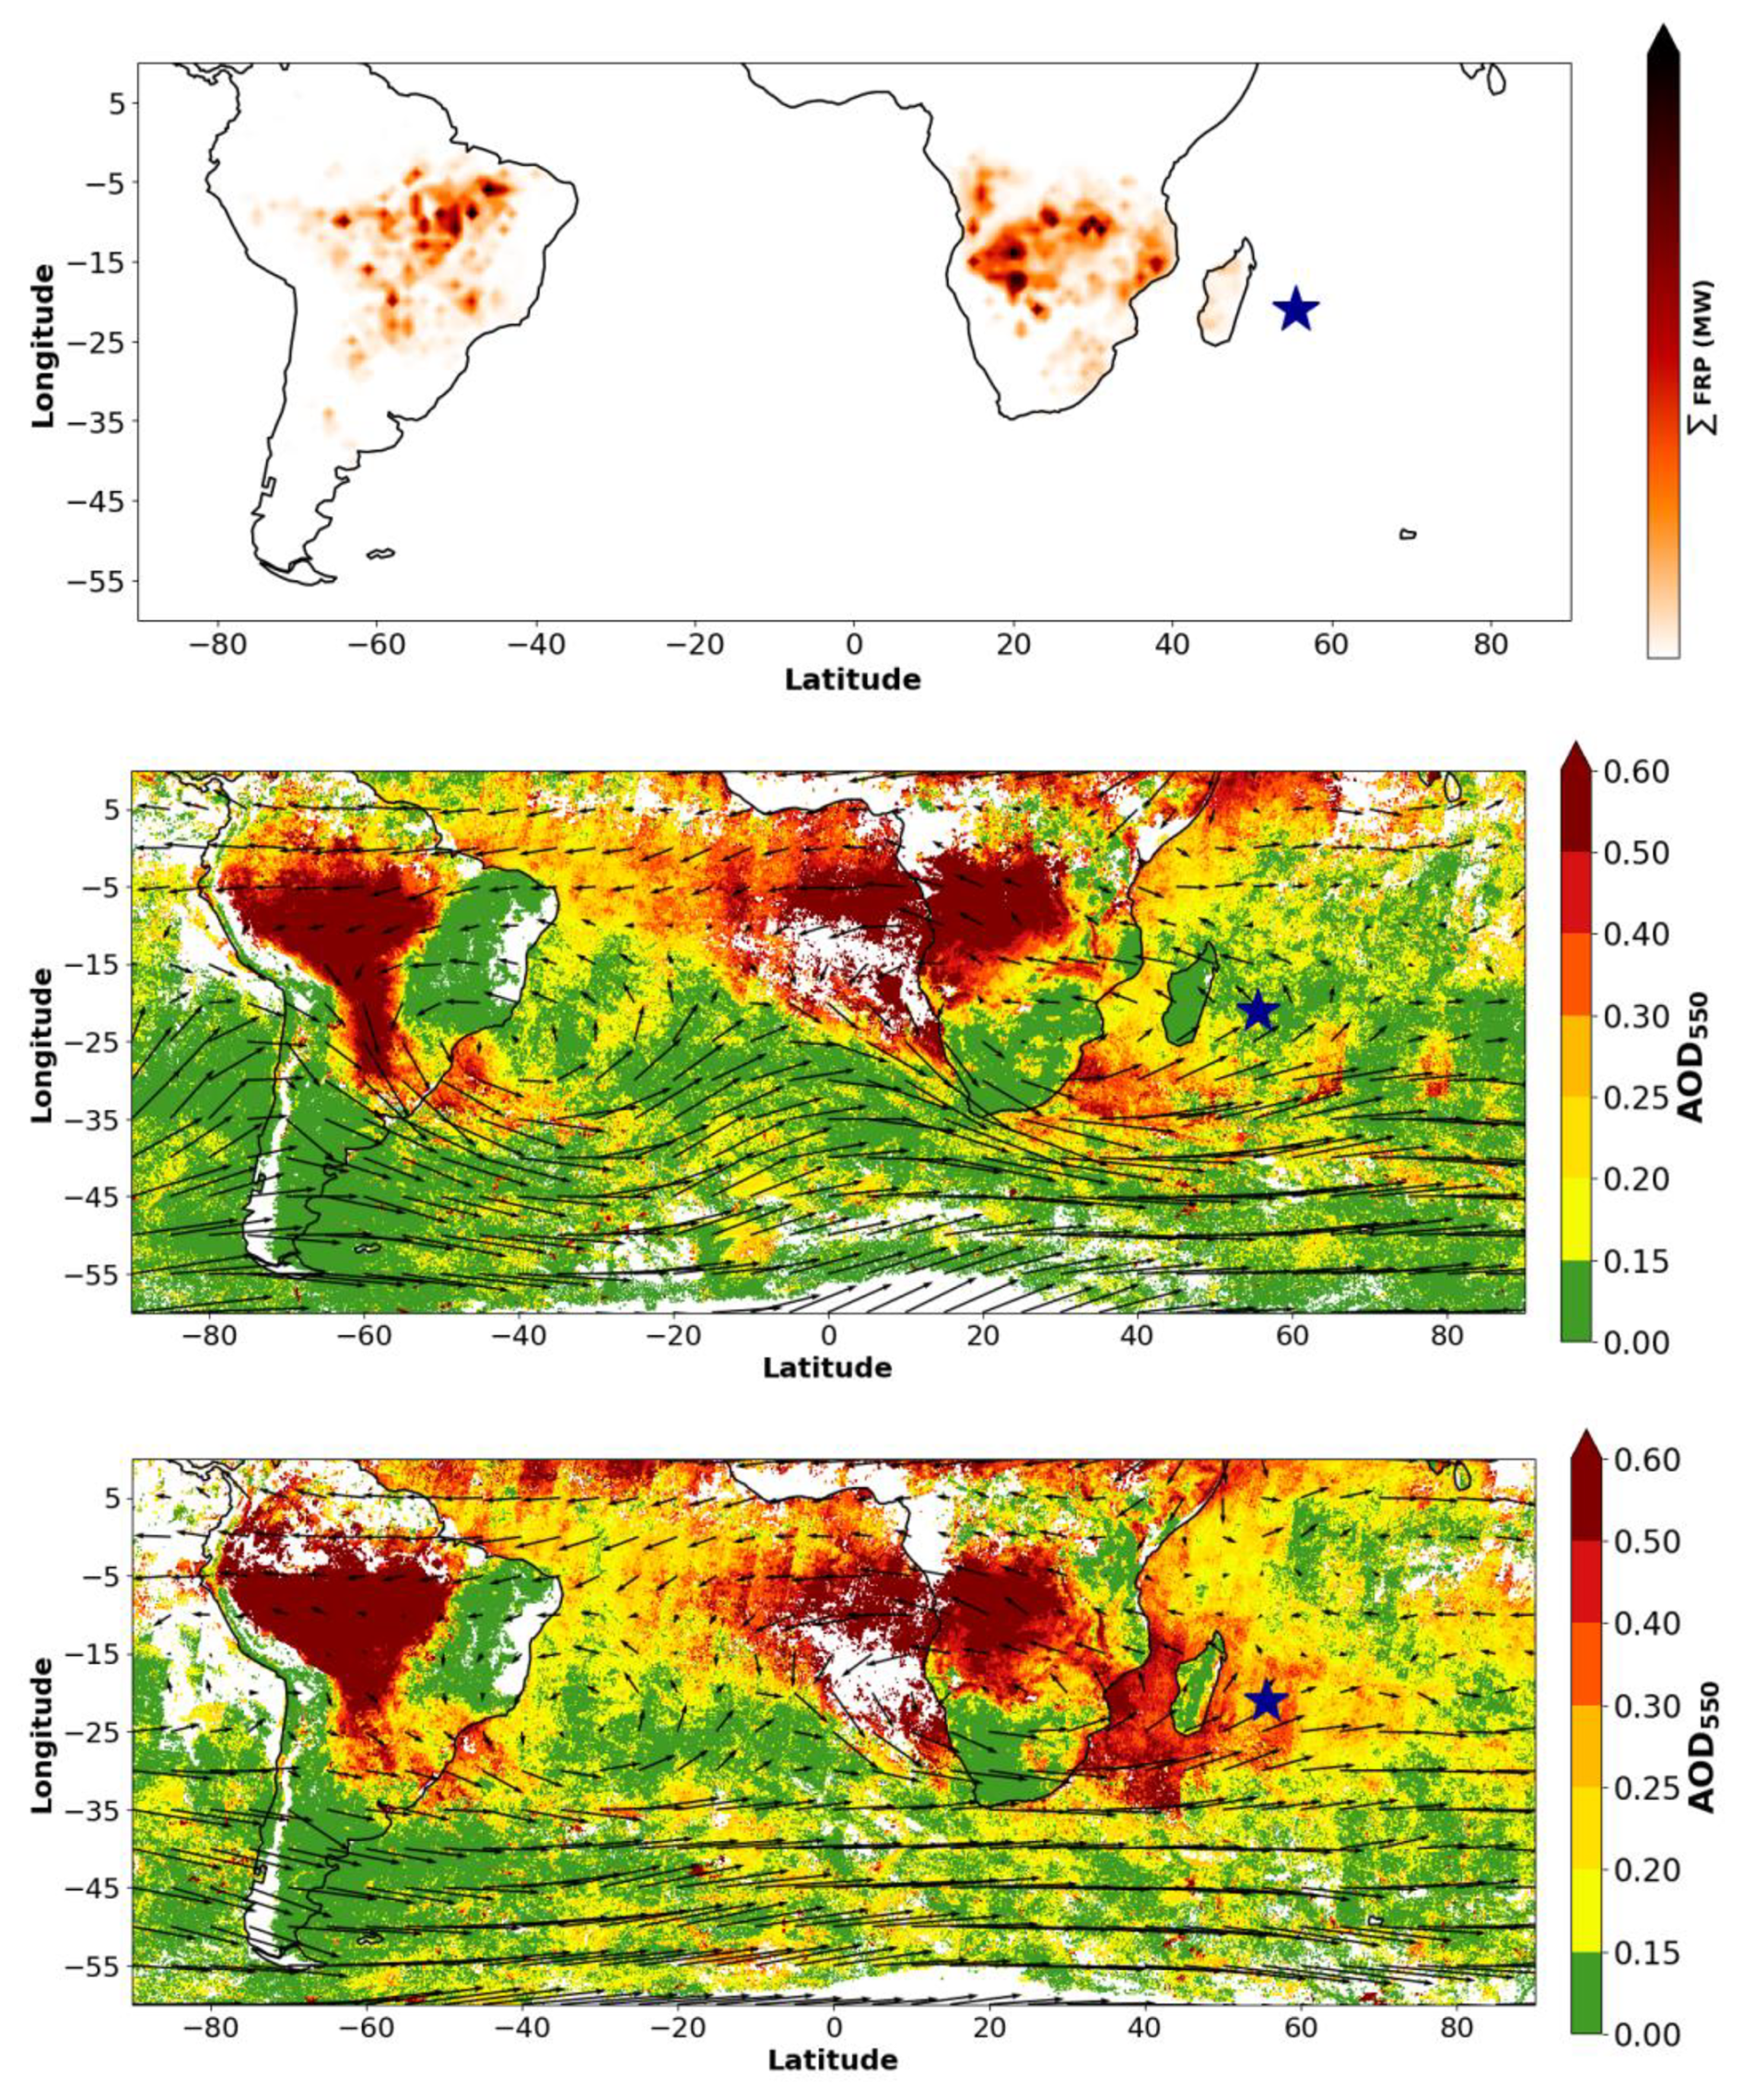
Figure 2Cumulated FRP from MODIS AQUA (1° horizontal resolution) between 1 and 15 September (top). Averaged total Aerosol optical depth AOD550 derived from MODIS AQUA + TERRA between 1 and 15 September (middle), and between 16 and 30 September (low). The mean ERA5 wind fields at 600 hPa for each period have been added in black (middle-low). Reunion Island is represented by the blue star.
3.2.2 Active remote sensing observations of aerosol extinction
CALIOP products provided information about the vertical distribution and algorithmic aerosol typing in the free troposphere of the SWIO (Fig. 3a–b). Four nighttime profiles acquired on 24 and 25 September crossed the east coast of Southern Africa and Madagascar during the period of enhanced MODIS AOD. They showed extensive elevated aerosol layers between 0 and 35° S, reaching approximately 9 km a.s.l. Over the continent and Madagascar, CALIOP assigned mainly the labels “polluted continental/smoke” and “elevated smoke”. Over the ocean around Madagascar, it identified a lower marine-aerosol layer between 0 and 2 km and an upper layer labelled “elevated smoke” between 4 and 9 km. These profiles establish the regional vertical extent of the aerosol layers. Because the subtype product is algorithmic, however, the labels provide regional context rather than direct chemical identification.
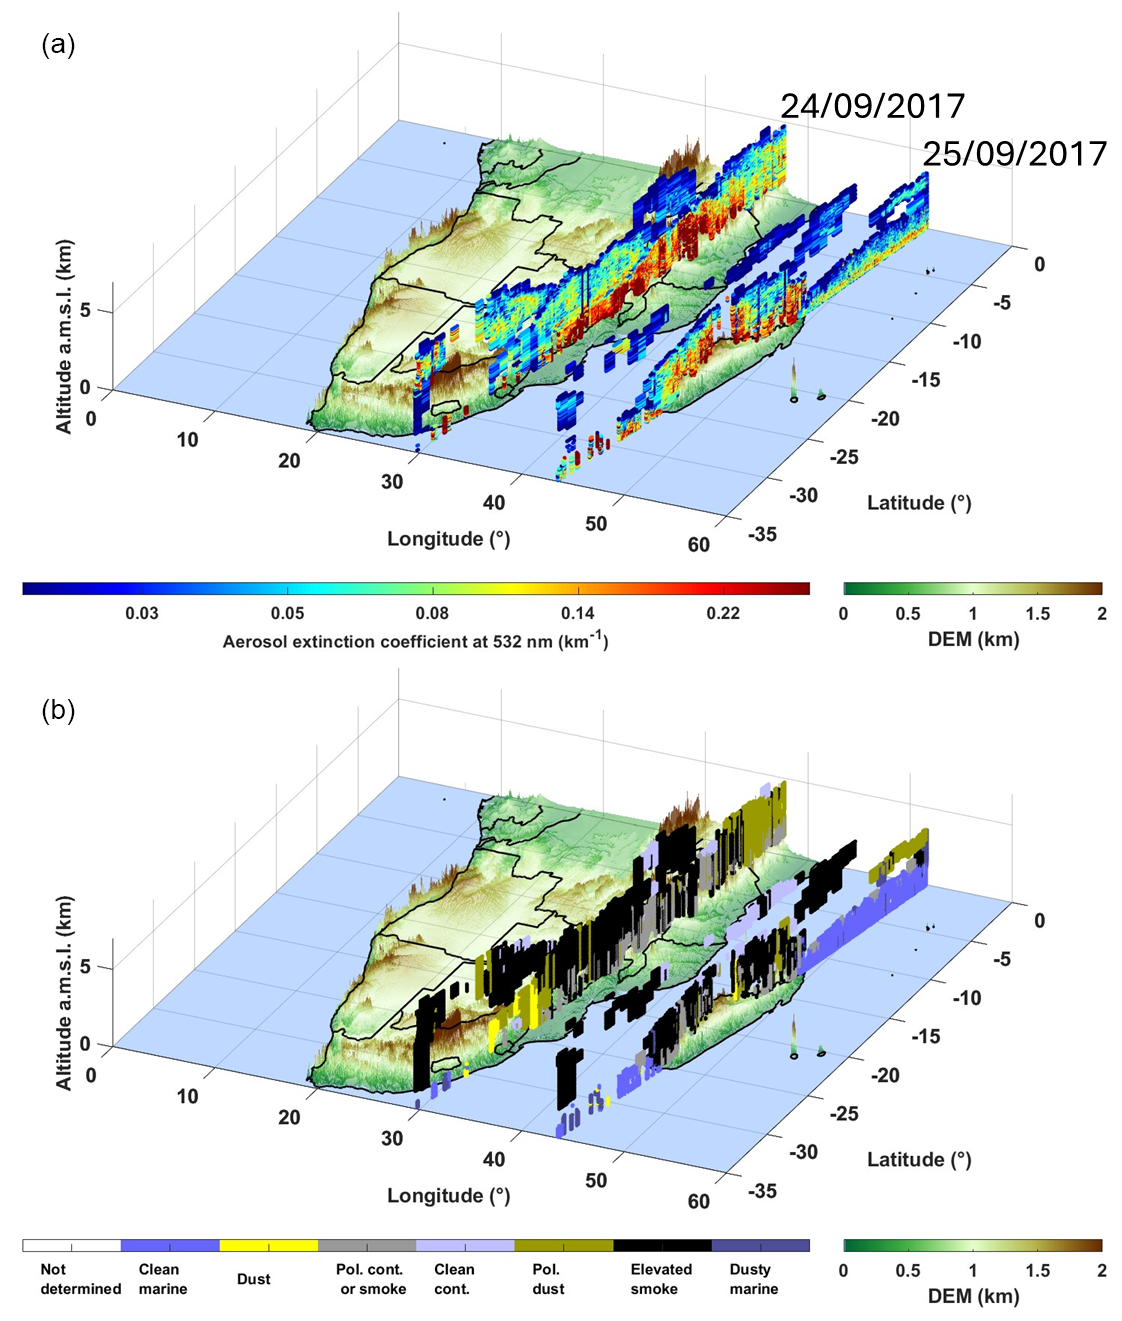
Figure 3(a) Aerosol extinction coefficient at 532 nm derived from the space-borne lidar CALIOP. (b) Same as (a) but for CALIOP-derived aerosol typing. Four nighttime orbits appear in these plots: (i) two of them on 24 September 2017, between 23:04 and 23:31 UTC over the east coast of Southern Africa, (ii) and two of them on 25 September 2017, between 21:55 and 22:35 UTC over Madagascar.
Together with the MODIS maps, these CALIOP profiles are consistent with substantial BB-smoke influence over the western SWIO during the latter half of September, sometimes accompanied by continental-pollution or marine-aerosol signatures. They do not provide a quantitative composition measurement for the air masses sampled later over Reunion.
3.3 Vertical profiles of aerosol optical properties
Vertical profiles of aerosol extinction coefficient at 355 (α355) and 532 nm (α532), as well as the Ångström exponent (Å) were derived from lidar measurements on the 19 and 25 September 2017.
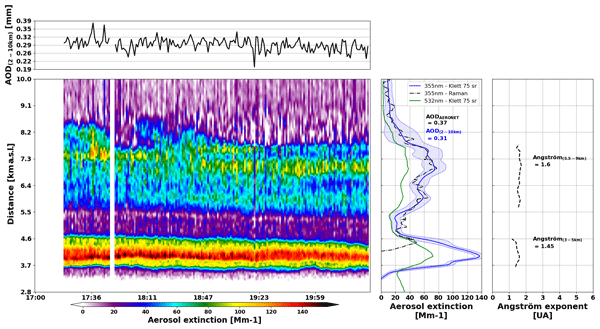
On 19 September 2017, the total AOD values at 355 and 532 nm measured by sun-photometer were respectively 0.34 and 0.21. The ground based lidars captured an aerosol plume in the low troposphere between 2.8 and 4.7 km a.s.l. (Fig. 4). The AOD values at 355 and 532 nm of this plume derived from the lidar measurements were respectively 0.19 and 0.14, lower than the sun-photometer AOD values. The discrepancies observed between lidar and sun-photometer AOD values can be explained by the optical geometry of our lidar instruments (overlap factors, see Gantois et al., 2024a), the difference in elevation between the sun-photometer site (80 m a.s.l.) and the lidars site (2160 m a.s.l.), and the presence of aerosols in the boundary layer. Based on lidars measurements, the 19 September plume was characterized by an Å of 1.32 ± 0.23. Published Å values for BB aerosol span a broad range and are influenced by particle size distribution, mixing state, combustion conditions, humidification, atmospheric processing, and retrieval assumptions (Fiebig et al., 2003; Reid et al., 1998; Wandinger, et al., 2002). Consequently, the measured Å value is treated here as an optical descriptor rather than a unique indicator of aerosol age. The Raman signals bellow 5 km were too poor for the two wavelengths, which prevented us from determining an LR profile for this plume.
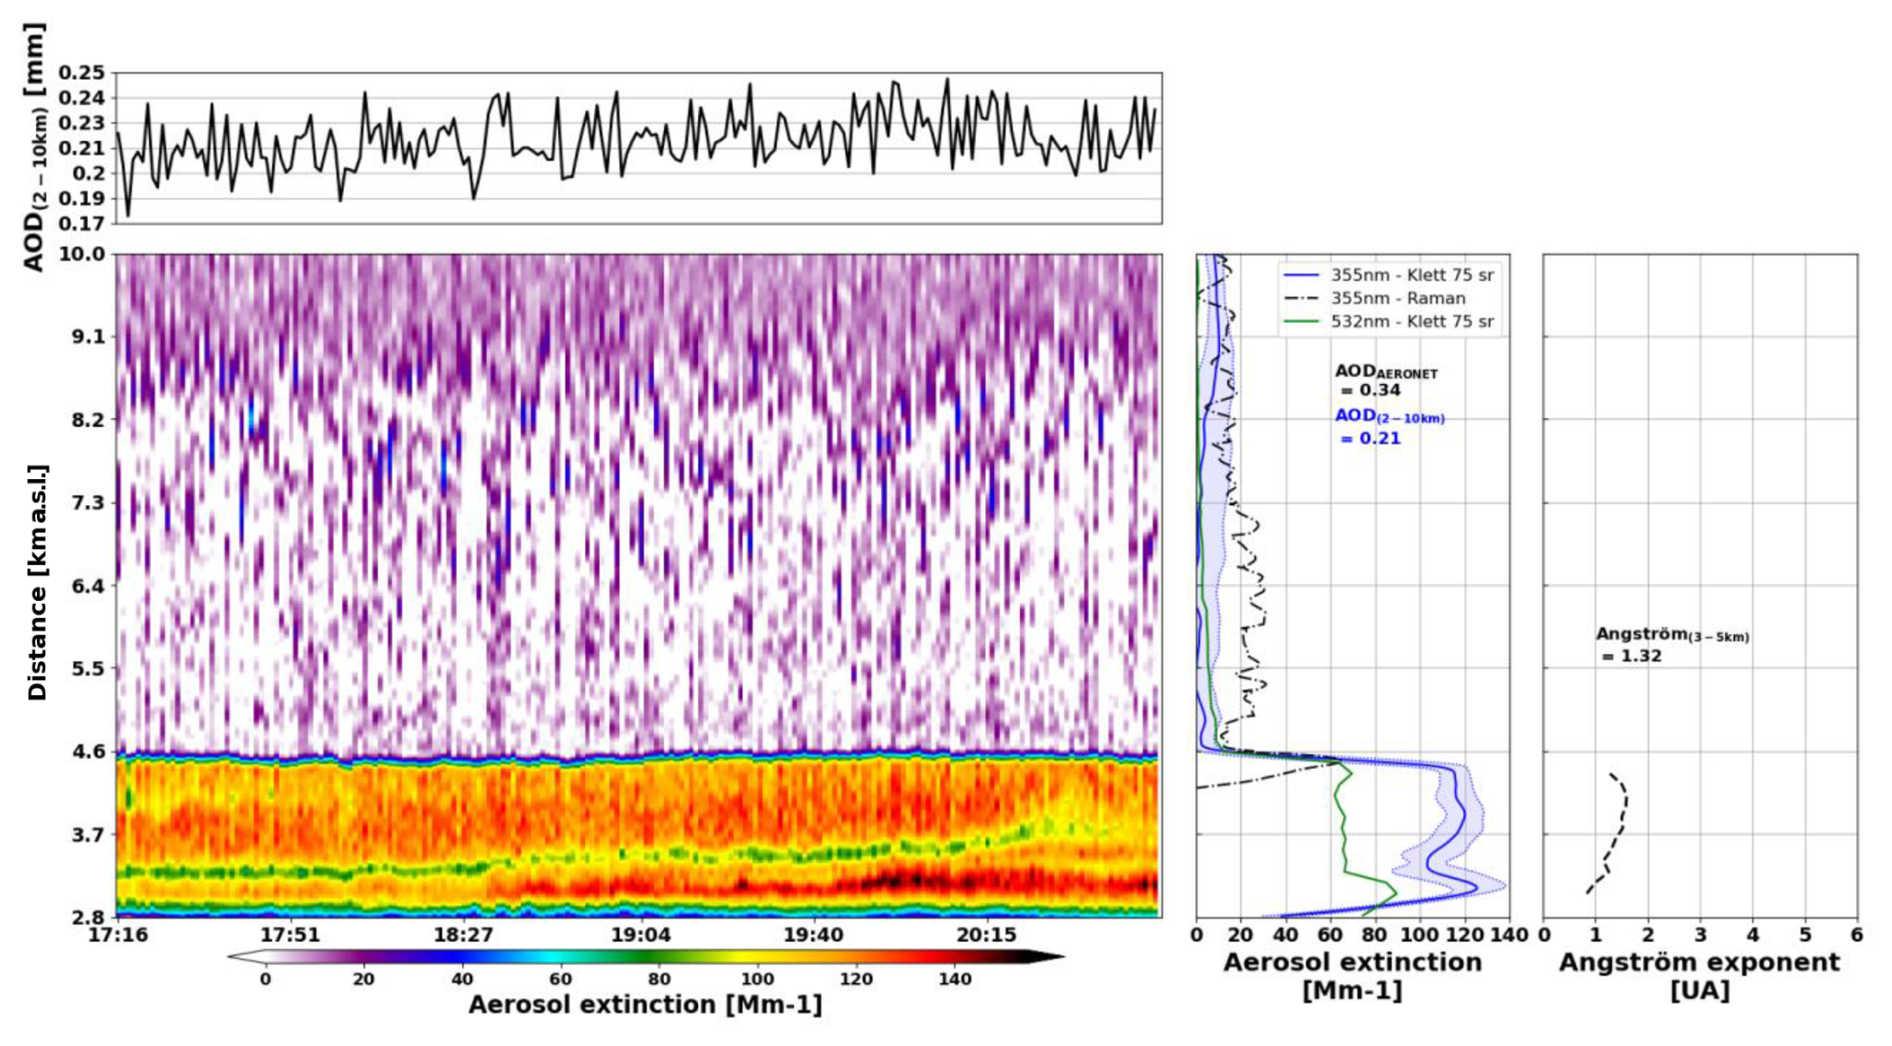
Figure 4[left] Aerosol extinction time-height cross-section over Maïdo facility (Reunion Island) on 19 September 2017. [center] Mean vertical profile of aerosol extinction from Klett inversion at 355 nm (blue curve: Li1200, LR = 75 sr) and corresponding standard deviation (shaded blue), 532 nm (green curve: LiO3T, LR = 75 sr), and from Raman inversion at 387 nm (black dotted curve: Li1200). AOD between 2 and 10 km (blue) is obtained from the Li1200 retrieval, and total AOD (black) from AERONET sun photometer. [right] Ångström exponent (black dotted line) vertical profile.
On 25 September 2017, the total AOD values at 355 and 532 nm measured by sun-photometer were respectively 0.37 and 0.23. Ground based lidars captured two aerosol plumes in the low troposphere between 3.3 and 5 km a.s.l., and in the middle troposphere between 5 and 9 km (Fig. 5). The specific AOD values at 355 and 532 nm for both plumes derived from lidar measurements were respectively 0.12 and 0.07 for the lowest, and 0.17 and 0.09 for the highest. Again, the sum of these AODs (0.29 and 0.16) is lower than the total AOD measured by AERONET, most probably due to the overlap factors of our instruments and the presence of aerosols in the 0–2.5km layer. A mean LR of 75 ± 9 sr at 355 nm was determined from Raman inversion for the highest plume, consistent with BB aerosols (Wandinger et al., 2002). This LR value was used to reprocess data for both days of measurements to increase comparability, and for both wavelengths, as this value of LR for 532 nm is consistent with previously published studies (Haarig et al., 2018). The highest plume was characterized with higher values of Å than the lowest plume (1.60 ± 0.06 vs 1.45 ± 0.12, respectively). This difference indicates distinct optical behavior between the layers. It may reflect differences in particle size, mixing state, source conditions, or processing history, but Å alone cannot determine aerosol age (Fiebig et al., 2003).
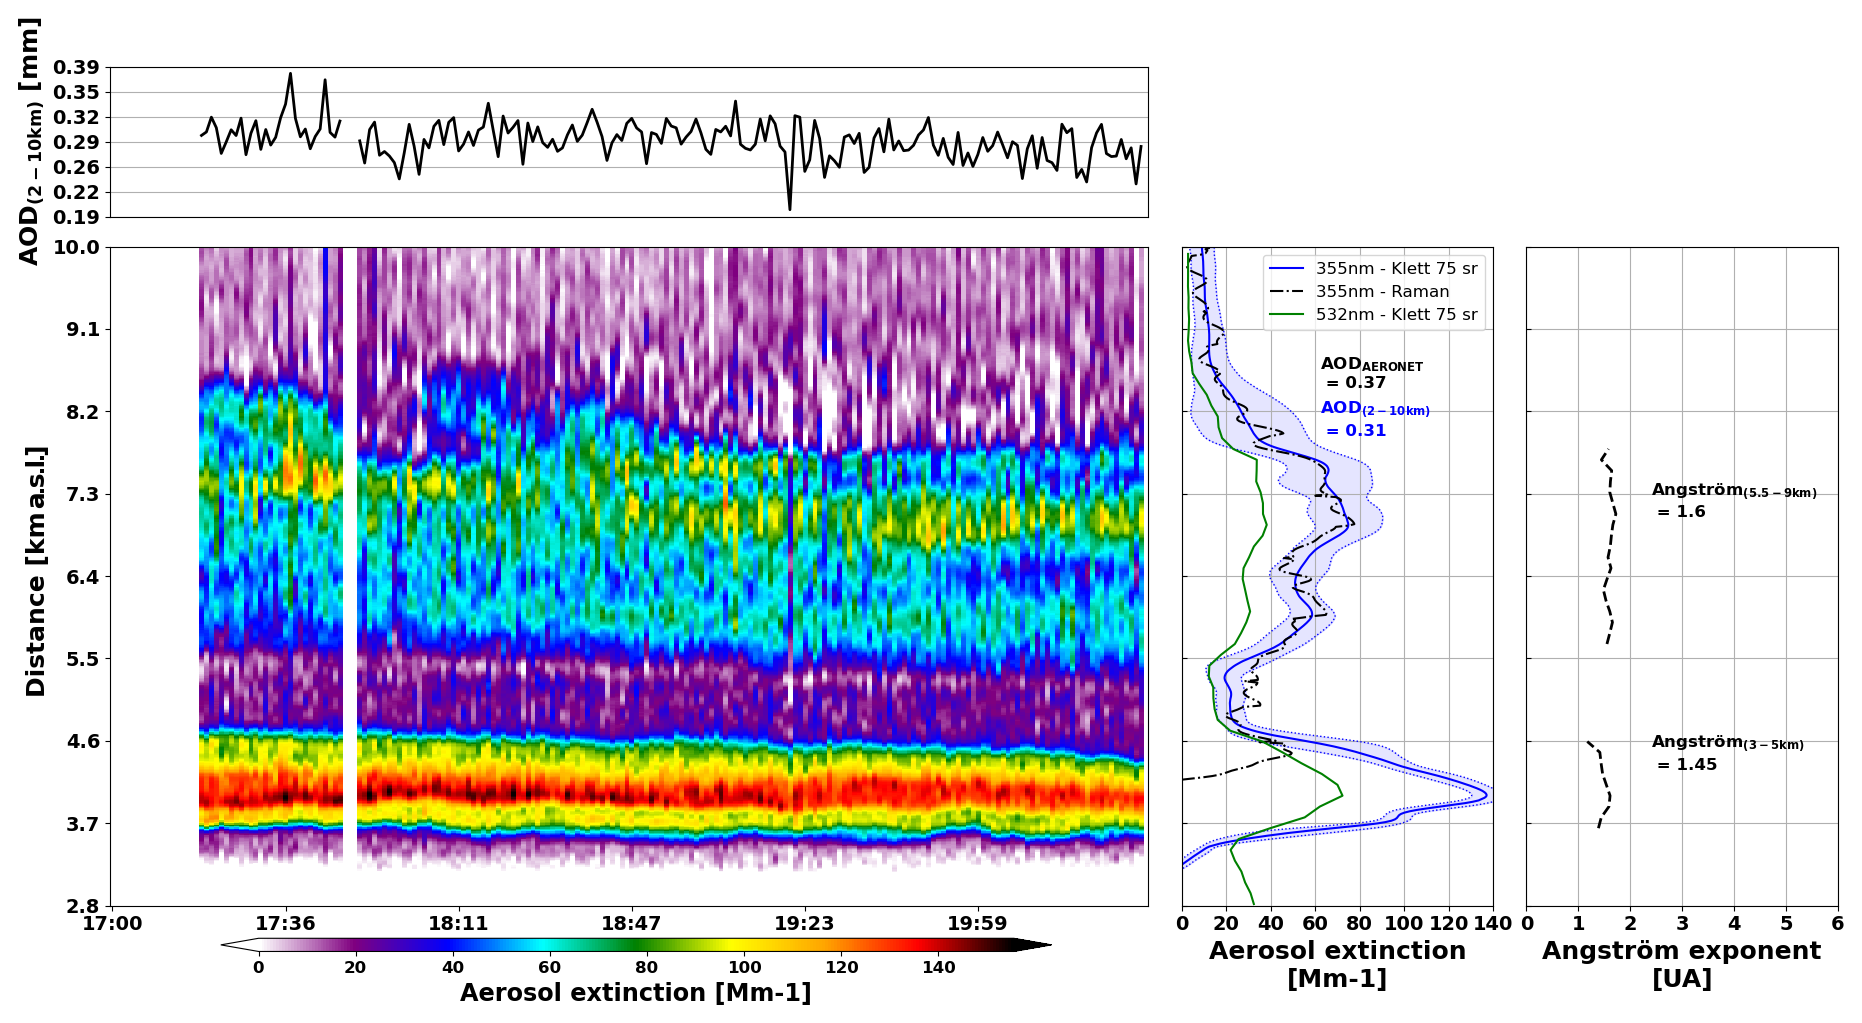
Figure 5[left] Aerosol extinction time-height cross-section over Maïdo facility (Reunion Island) on 25 September 2017. [center] Mean vertical profile of aerosol extinction from Klett inversion at 355 nm (blue curve: Li1200, LR = 75 sr) and corresponding standard deviation (shaded blue), 532 nm (green curve: LiO3T, LR = 75 sr), and from Raman inversion at 387 nm (black dotted curve: Li1200). AOD between 2 and 10 km (blue) is obtained from the Li1200 retrieval, and total AOD (black) from AERONET sun photometer. [right] Ångström exponent (black dotted line). Corresponding mean values are given for each aerosol layer.
3.4 Water-vapor environment
On 19 September 2017, retrieved WVMR within the aerosol layer was 2.08 ± 0.21 g kg−1. Precipitable water increased from 2.75 ± 0.04 mm during the first hour to 3.00 ± 0.08 mm thereafter, while AOD in the 3–5 km range increased slowly during the night. The estimated WVMR measurement-precision uncertainty was nevertheless 1.54 g kg−1, approximately 74 % of the mean; the small temporal standard deviation therefore describes repeatability during the measurement period but does not support a quantitative interpretation of the absolute moisture value or its small variations.
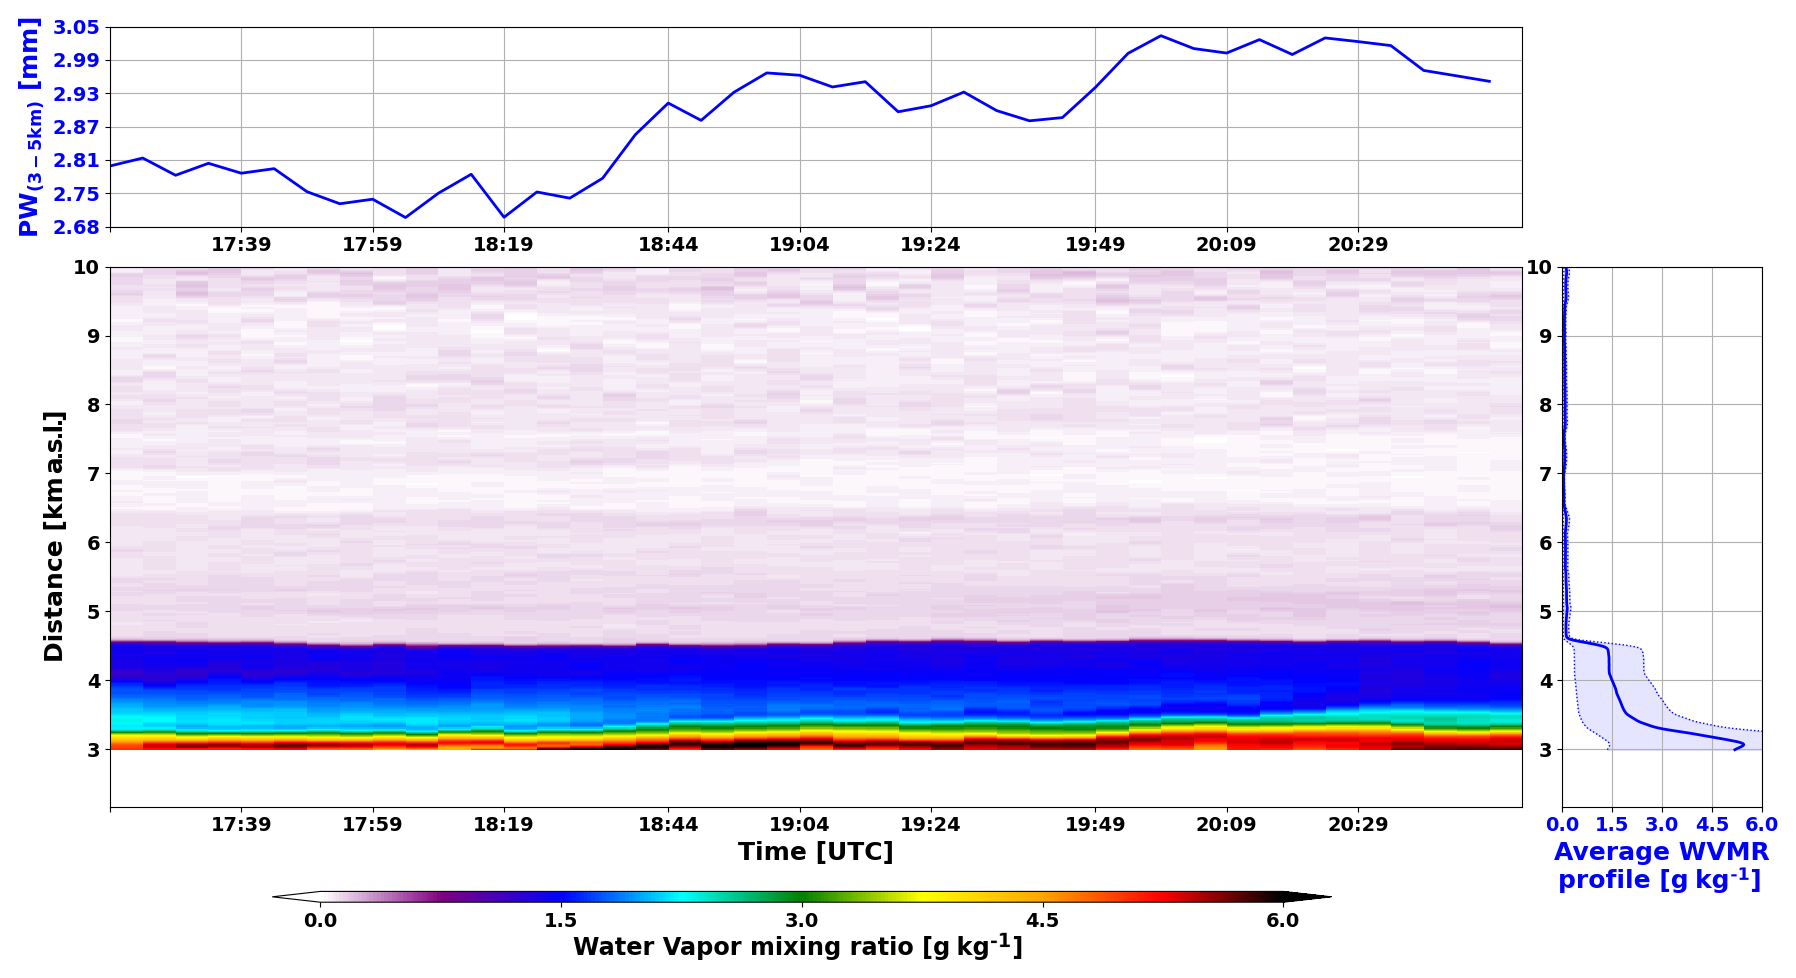
Figure 6[Bottom left] Water Vapor Mixing Ratio (WVMR) vertical profiles over Maïdo facility (Reunion Island) on 19 September 2017. [Top left] Precipitable Water (PW) values (blue curve), and AOD values (black curve) between 3 and 5 km over Maïdo facility (Reunion Island) on 19 September 2017. [Bottom right] Mean WVMR vertical profile over Maïdo facility (Reunion Island) on 19 September 2017, with uncertainty in shaded blue.
Figure 7 shows that WVMR decreased with altitude in the lower part of the aerosol layer while extinction remained comparatively stable. Both quantities varied little in the middle part and decreased together near the top. We use “decoupled” only for altitude ranges in which the two retrieved profiles do not covary. Given the WVMR uncertainty, this description remains qualitative and does not imply aerosol hygroscopicity or a causal aerosol–water-vapor interaction.
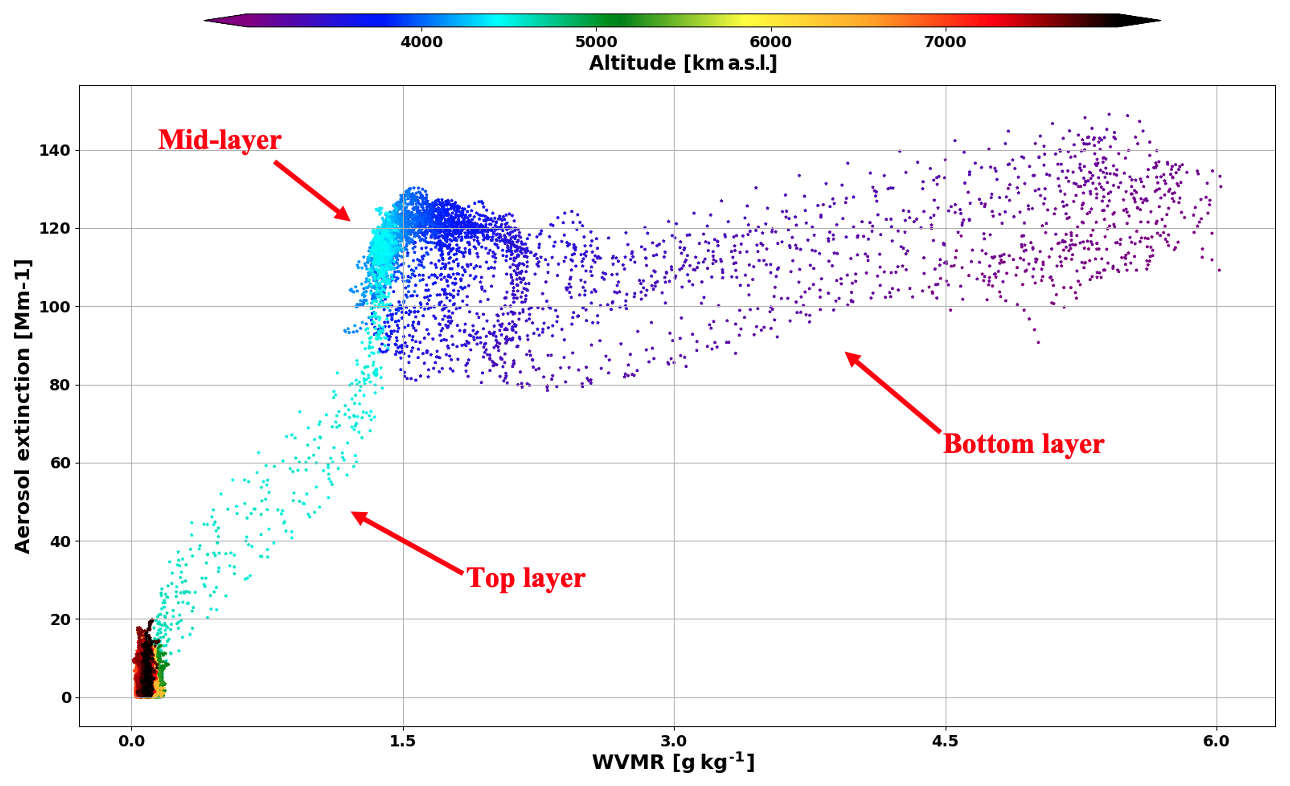
Figure 7Scatter plot of Aerosol extinction and WVMR as a function of altitude derived from lidar measurements over Maïdo facility (Reunion Island) on 19 September 2017.
On 25 September 2017, time-series of WVMR vertical profiles (Fig. 8) showed differences in water vapor content between the highest and the lowest aerosol layers. The highest layer was the driest (0.09 ± 0.04 g kg−1), when the lowest layer had the largest quantities of water vapor (1.27 ± 0.22 g kg−1). A high uncertainty (0.94 g kg−1)in the WVMR measurement precision concerning the lowest aerosol layer was estimated (almost 74 % of the mean WVMR). This layer was also characterized by slowly decreasing, yet high precipitable water values with higher values during the first two hours of measurement (2.72 ± 0.06 mm), and lower values for the rest of the night (2.39 ± 0.15 mm). Although the 0.94 g kg−1 retrieval uncertainty precludes a detailed quantitative interpretation of variability in the lower layer, the upper-layer WVMR of 0.09 ± 0.04 g kg−1 remains clearly distinct from the moister lower layer. AOD remained comparatively stable during the night (0.12 ± 0.006).
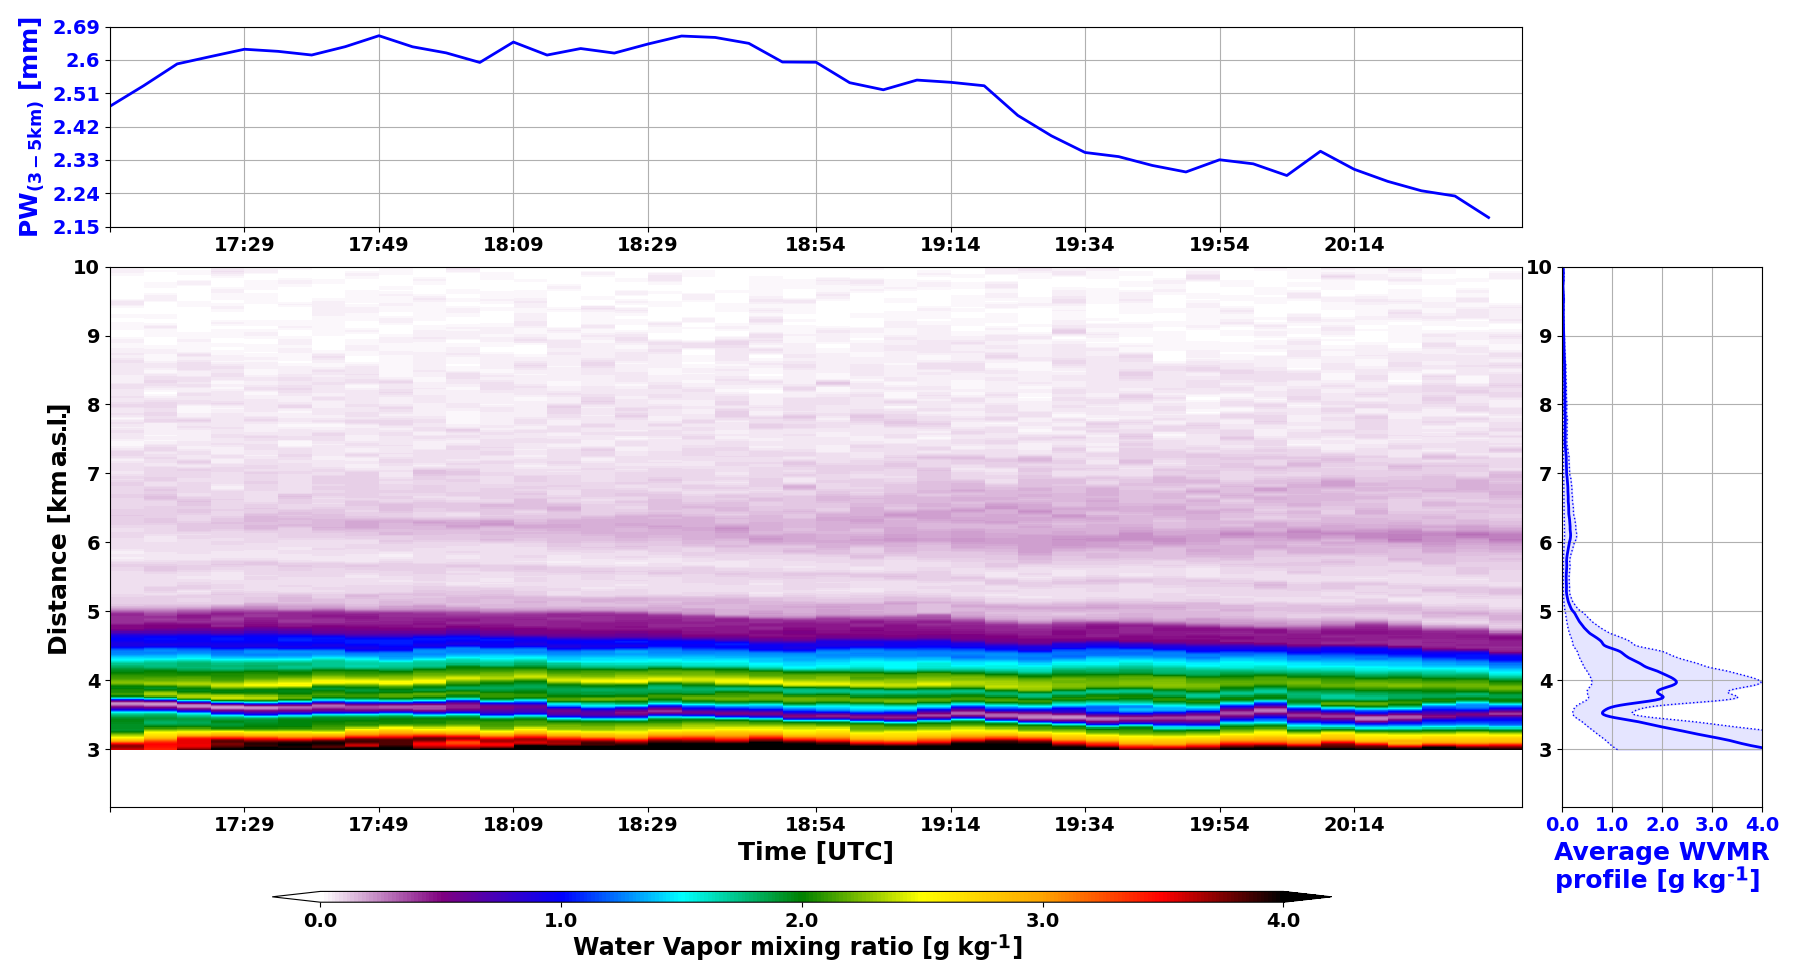
Figure 8[Bottom left] Water Vapor Mixing Ratio (WVMR) vertical profiles over Maïdo facility (Reunion Island) on 25 September 2017. [Top left] Precipitable Water (PW) values (blue curve), and AOD values (black curve) between 3 and 5 km over Maïdo facility (Reunion Island) on 25 September 2017. [Bottom right] Mean WVMR vertical profile over Maïdo facility (Reunion Island) on 25 September 2017, with uncertainty in shaded blue.
The profiles in Fig. 9 consequently distinguish a moist lower aerosol layer from a dry upper layer on 25 September. Particle backscatter and relative humidity increased simultaneously between 4 and 4.5 km, but their co-variation alone is insufficient to infer hygroscopic growth. Here WVMR is used to characterize the surrounding moisture environment and the vertical separation of the layers.
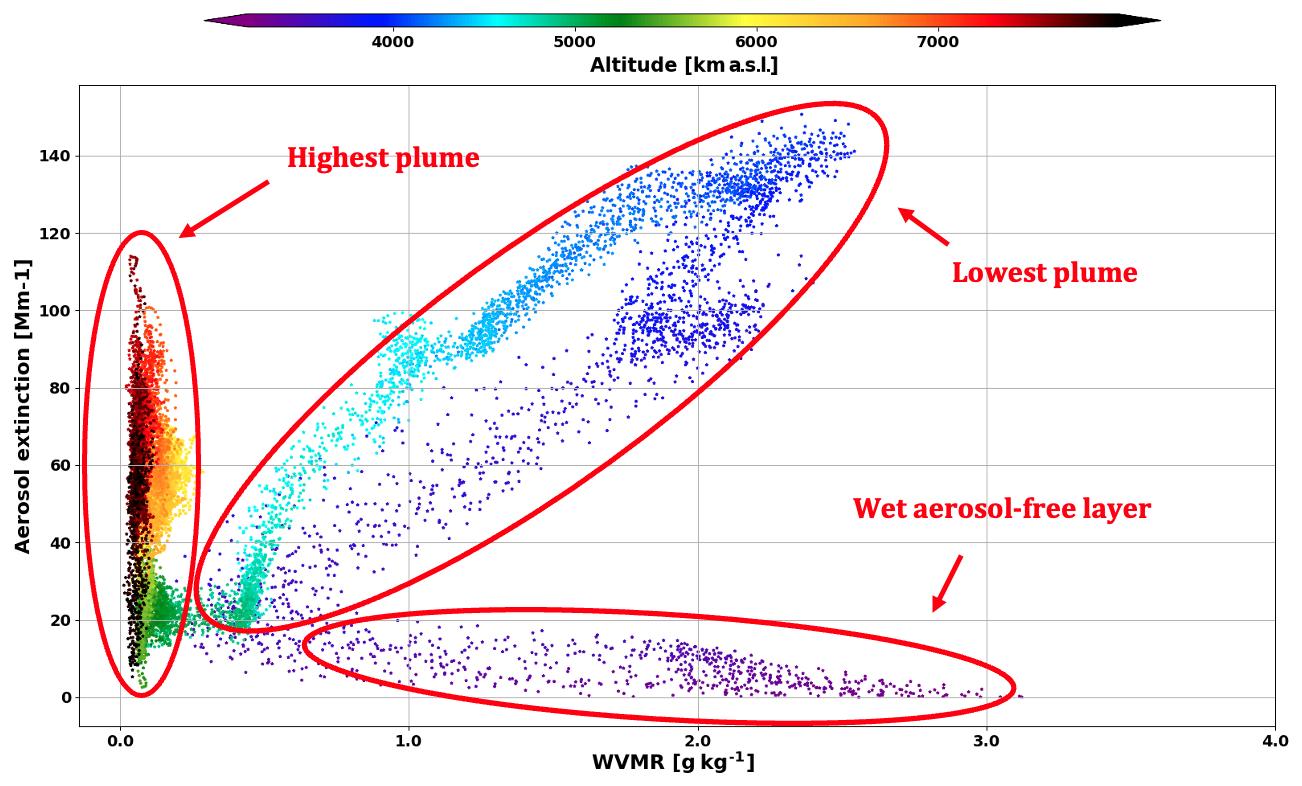
Figure 9Scatter plot of Aerosol extinction and WVMR as a function of altitude derived from lidar measurements over Maïdo facility (Reunion Island) on 25 September 2017.
3.5 Model-supported transport pathways
FLEXPART forward simulations of BB CO from Southern Africa and South America were used to examine whether transport from these selected regions was consistent with the timing and altitude of the observed layers. The simulations were evaluated against Maïdo FTIR CO observations after application of the FTIR a priori profile and averaging kernel. In this comparison, CO traces air-mass transport rather than the aerosol itself.
Time-series of CO concentration vertical profile and CO total column in 2017 measured by Maïdo FTIR (Fig. 10) showed an increase of CO with a mean value of (1.34 ± 0.26) × 1018 molecules cm2 between July and November (BB season) and between 2.5 and 12.3 km (essentially middle and low troposphere). This value is higher than the corresponding climatology value of (1.15 ± 0.18) × 1018 molecules cm2 computed from FTIR measurements between 2013 and 2019. This is consistent with the presence of BB plumes during this period (Duflot et al., 2010).
Both the CO total column time-series derived from FTIR measurements and the AOD values recorded by AERONET indicate that the BB season starts in July. The discrepancies observed between January and May can be attributed to the difference in instrument elevation: the FTIR site is located at 2160 m a.s.l., placing it above the boundary layer at night, while the sun-photometer operates at 80 m a.s.l., where it is influenced by the urban pollution within the boundary layer.
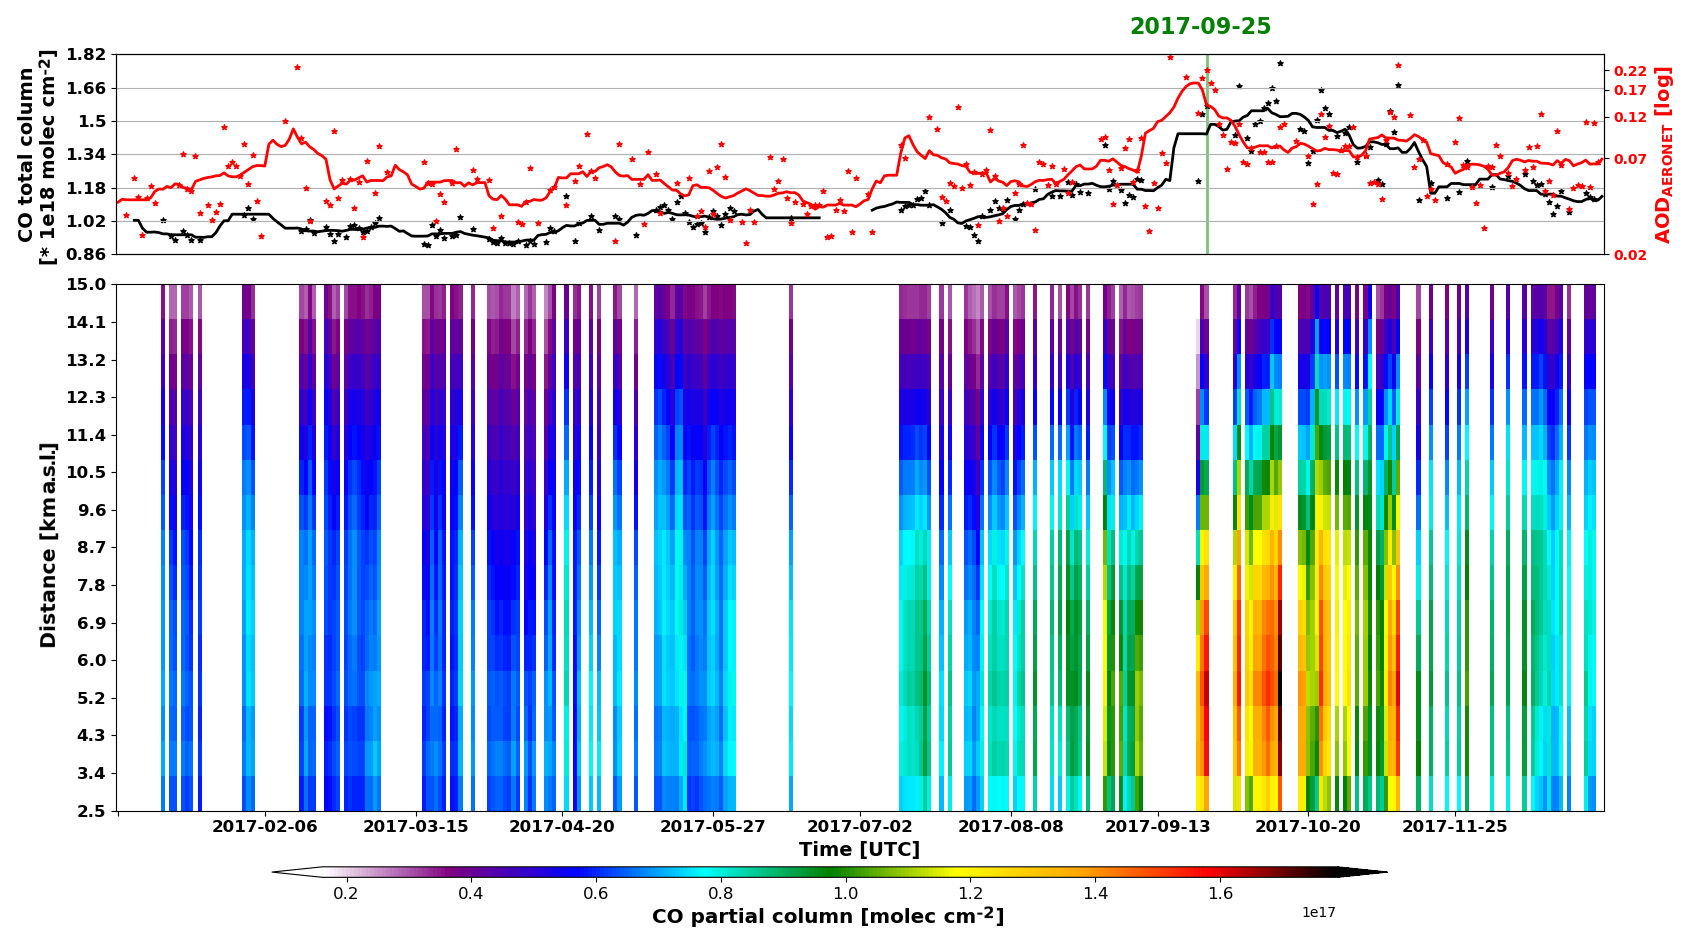
Figure 10[Bottom] Time-series of CO partial columns bounded by the altitude on the vertical axis between 2.5 and 15 km measured by the FTIR over Maïdo observatory during year 2017. [Top] Time-series of CO partial column between 2.5 and 15 km measured by the FTIR (black stars), and total AOD values from AERONET (red stars) during year 2017 with their respective 15 d moving average (plain lines).
The comparison between FLEXPART simulation outputs and FTIR measurements for CO partial columns between 2 and 15 km from 1 August to 1 November 2017 is represented in Fig. 11. A smoothing was applied to each FEXPART profiles, using the FTIR averaging kernels and the a priori profiles as described in the methodology section. CO concentration varied between 9.8 × 10¹⁷ and 1.8 × 10¹⁸ molecules cm−2 for FLEXPART output and the FTIR with a mean of 9.5 × 10¹⁷and 1.9 × 10¹⁸ molecules cm−2, respectively. The correlation coefficient between measured and simulated CO partial columns between 2 and 12 km was 0.82. This agreement evaluates the temporal variability at partial-column scale; it does not establish source uniqueness or aerosol-layer composition.
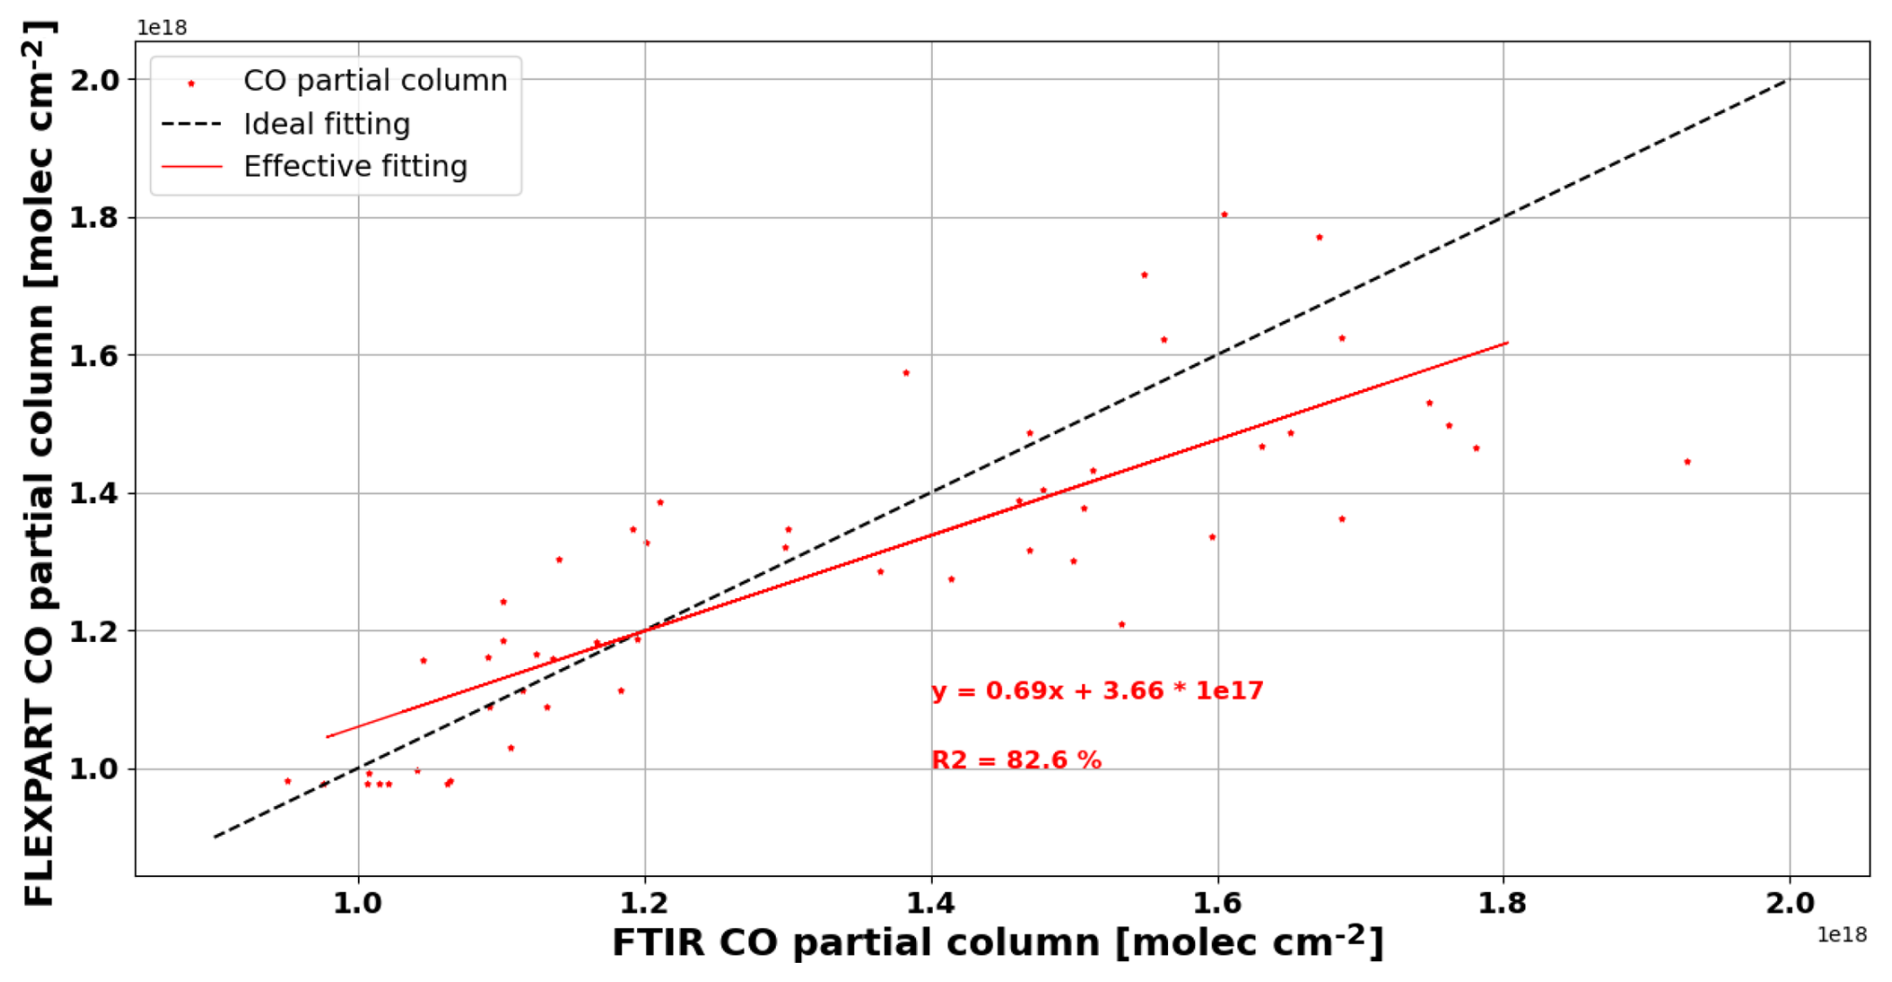
Figure 11Comparison between FLEXPART simulation outputs smoothed by FTIR averaging kernels and FTIR measurements for daily averaged CO partial columns between 2.16 and 15 km. The red line represents the theoretical linear regression. Background climatology values of CO partial columns from the FTIR were added to FLEXPART partial columns.
The only concomitant measurement between the FTIR and FEXPART for our case study was on 25 September 2017. The corresponding FLEXPART and FTIR vertical profiles of CO concentration are visualized on Fig. 12. A smoothing was applied to the FLEXPART profile, using the FTIR averaging kernel and the a priori profile as described in the methodology section. After adding the background value of CO derived from the FTIR climatology to the FLEXPART partial columns, we found matching values between the FLEXPART and FTIR partial columns from 2.16 to 5 km (6.16 × 10¹⁷ vs 6.11 × 10¹⁷ molecules m−2, respectively), 5 to 15 km (1.15 × 10¹⁸ vs 1.02 × 10¹⁸ molecules m−2, respectively), and 2.16 to 15 km (1.62 × 10¹⁷vs 1.49 × 10¹⁷ molecules m−2, respectively).
The similarity between simulated and measured CO partial columns supports the broad simulated CO distribution for this event. The altitude ranges of the FLEXPART CO enhancements are also broadly consistent with the aerosol layers detected by lidar on 19 and 25 September. This similarity provides qualitative support for the simulated broad vertical distribution. Because FTIR smoothing limits vertical resolution and lidar detects aerosol rather than CO, the comparison does not validate the detailed structure or source assignment of each aerosol layer.
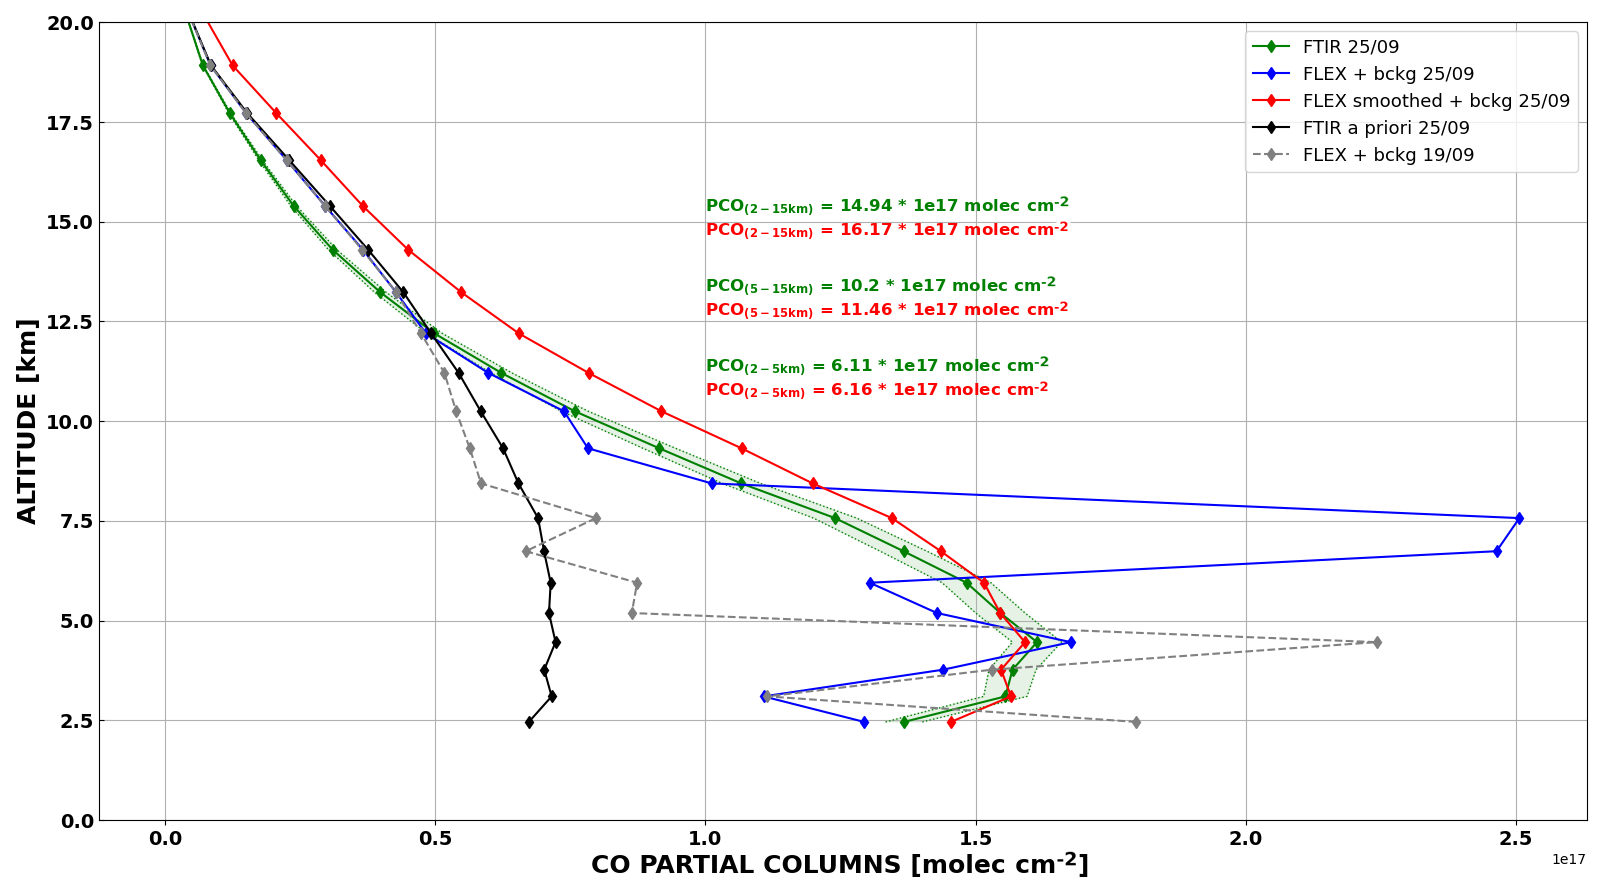
Figure 12Vertical profile of CO partial columns over Maïdo observatory on 25 September 2017, from FLEXPART forward mode before (Blue curve) and after (Red curve) smoothing using the FTIR averaging kernel and a priori profile (Black curve). Vertical profile of CO partial columns over Maïdo observatory on 25 September 2017, from FTIR measurement (green curve) with the associated uncertainty in shaded green. FLEXPART vertical profile of CO partial columns over Maïdo observatory on 19 September 2017, without smoothing (no FTIR data available).
To better understand the dynamical processes involved and visualize the atmospheric transport patterns, FLEXPART was run in forward mode with CO from BB as a tracer, emitted from South America and Southern Africa during two different simulations. Results can be visualized in the supplementary video (Gantois, 2026) showing the concentration of CO emitted by wildfires from each continent and integrated along the altitude vector, as well as the corresponding vertical profile of CO concentration over Reunion Island between 16 and 26 September 2017.
The transport regimes identified with FLEXPART simulations (Figs. 13 and 14) are coherent with the aerosol optical properties profiles retrieved from lidar measurements and align with the dynamical processes described in several studies (Flamant et al., 2022; Ranaivombola et al., 2023), such as the importance of vertical injection, stratified transport, and recirculation of Southern African BB plumes over the SWIO.
On 19 September 2017 (Fig. 13), more than 88 % of the BB CO represented by the two selected simulations within the observed layer originated from the Southern African simulation. This percentage is conditional on the two-source experiment and does not exclude Madagascar or other unsimulated contributions. The observed Å = 1.32 ± 0.23 is compatible with a processed BB aerosol population but is not a unique age indicator. Taken together, the modelled transport and observed layer structure support, without proving, a Southern African transport pathway involving regional recirculation followed by eastward export.
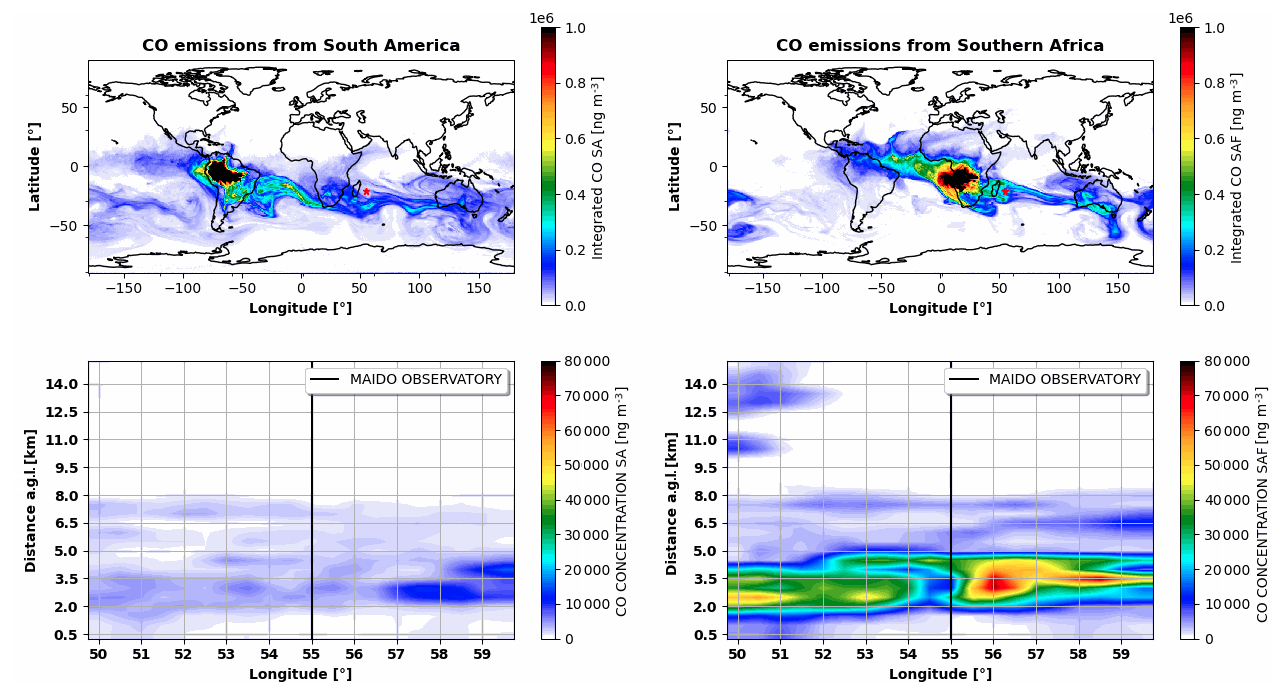
Figure 13FLEXPART partial column CO emitted from biomass burning in South America [left] and Southern Africa [right] integrated between 0 and 15 km [top], and vertical profiles at the latitude of 21.1° S Maido observatory, the longitude location of the Maido observatory shown as a black line [bottom] on 19 September 2017, at 18:00 UTC.
On 25 September 2017 (Fig. 14), the simulations produced two vertically separated CO enhancements with different relative contributions from the two selected source regions. In the upper layer (5–9 km), more than 70 % of the represented BB CO originated from the Southern African simulation. The higher Å of 1.60 ± 0.06 distinguishes its optical behavior from the lower layer but does not uniquely demonstrate fresher smoke. The combined evidence is consistent with relatively rapid uplift and mid-tropospheric export from Southern Africa.
The lower layer (3.3–5 km) had Å = 1.45 ± 0.12, and both Southern African and South American simulations contributed to the modelled CO. This supports a possible mixture of long-range pathways, but the exact aerosol-source fractions cannot be derived from CO and contributions from Madagascar were not separately represented. Alternative explanations for the optical contrast include differences in size distribution, mixing state, source combustion conditions, and humidification. The observations securely establish two vertically separated aerosol layers; their detailed processing and source apportionment remain model-supported interpretations.
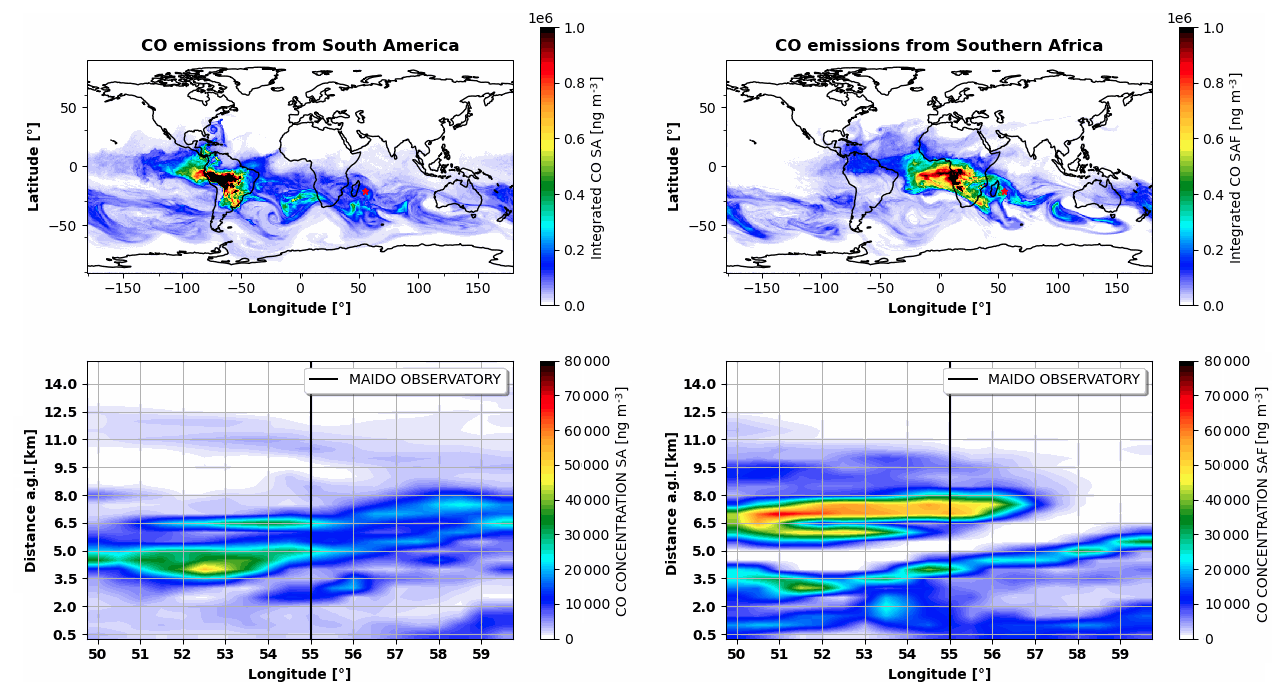
Figure 14Same as Fig. 13, but for 25 September 2017, at 18:00 UTC.
This study documents an enhanced aerosol episode over Reunion Island during September 2017. AERONET AOD550 reached 0.16–0.42 during the second half of the month, compared with a September climatological value of 0.09 ± 0.03, while MODIS and CALIOP placed the episode within a broader period of elevated aerosol loading and smoke transport across the western SWIO. Over Reunion, the ground-based lidars resolved one layer between 2.8 and 4.7 km on 19 September (Å = 1.32 ± 0.23) and two layers on 25 September: a lower layer between 3.3 and 5 km (Å = 1.45 ± 0.12) and an upper layer between 5 and 9 km (Å = 1.60 ± 0.06). On 25 September, the upper layer was also distinctly drier, with WVMR of 0.09 ± 0.04 g kg−1 compared with 1.27 ± 0.22 g kg−1 in the lower layer; although the 0.94 g kg−1 uncertainty limits quantitative interpretation of the lower-layer value, it does not obscure the contrast with the dry upper layer. These observations and retrievals establish the enhanced column loading, the vertical separation of the layers, and their contrasting optical and moisture environments.
The composition and source apportionment are interpreted with model support. CAMS simulated OM contributions of 50 %–60 % during the high-AOD periods, but this partition remains model-derived because comparison with AERONET evaluates total AOD rather than individual species. FLEXPART reproduced the broad temporal variability of the FTIR CO partial columns (r=0.82) after application of the FTIR averaging kernels. Within the two simulated source regions, more than 88 % of the represented BB CO in the 19 September layer originated from the Southern African simulation; on 25 September, more than 70 % of the represented BB CO in the upper layer came also from the Southern African simulation, whereas both Southern African and South American simulations contributed to the lower layer. These percentages support different transport pathways for the observed layers but remain conditional on the two-source experiment and describe CO air-mass transport rather than aerosol mass.
The results are consistent with, and extend, previous observations of Southern African smoke export. The lidar ratio retrieved for the 25 September upper layer (75 ± 9 sr at 355 nm) and the observed Å values of 1.32–1.60 fall within the range reported for aged biomass-burning aerosol in the DeLiAn reference dataset (Floutsi et al., 2023), although Å alone cannot diagnose aerosol age. The 3–9 km layer altitudes are comparable to elevated smoke layers documented during SAFARI-2000 (Abel et al., 2003; Haywood et al., 2003), and the vertical variability is consistent with the multi-layered Southern African outflow observed during ORACLES (Redemann et al., 2021; Das et al., 2024). The regional pathways inferred here also agree with the organized smoke-export corridors described over the western SWIO (Flamant et al., 2022; Ranaivombola et al., 2025) and with documented trans-Atlantic transport from South America (Edwards et al., 2006; Duflot et al., 2010). The specific advance of the present case study is to extend this vertically resolved picture to Reunion, in the eastern SWIO and approximately 5000 km downstream of the principal Southern African source regions.
Several factors nevertheless bound the interpretation. Differences in Å can also reflect particle size distribution, mixing state, combustion conditions, humidification, and processing history. The transfer of the 75 ± 9 sr lidar ratio to 19 September and to 532 nm affects absolute extinction and layer AOD, although the observed layer boundaries are less sensitive to this assumption. The lower-layer WVMR estimates carry large uncertainties, CALIOP typing and CAMS speciation depend on their respective algorithms and models, and FLEXPART source contributions depend on GFAS emissions and injection heights, ERA5 transport and convection, and unresolved mixing. Madagascar and other potential sources were not simulated separately, and the different lifetimes and removal processes of CO and aerosol prevent a quantitative conversion from CO source fractions to aerosol contributions. Finally, the two lidar nights are illustrative cases selected from the available routine measurements. They do not establish how frequently these configurations occur during September or over the full BB season.
Within these bounds, the combined observations show why column-integrated AOD alone cannot resolve the aerosol structure at this remote receptor site. Vertically resolved optical and moisture measurements, interpreted together with regional satellite observations and transport modelling, reveal how distinct air masses can reach the eastern SWIO at different altitudes and on different timescales. Longer lidar records, systematic case selection, and aerosol-specific simulations including additional source regions would be required to quantify the representativeness of these pathways. The present study does not calculate radiative forcing. However, recent observation-constrained studies show that aerosol absorption, particle size, mixing state, and column loading can substantially alter inferred forcing (Tiwari et al., 2023; Guan et al., 2026; Tiwari et al., 2026). In this context, the layer altitude and optical properties characterized here provide observational information for future analyses of aerosol–radiation and aerosol–cloud interactions.
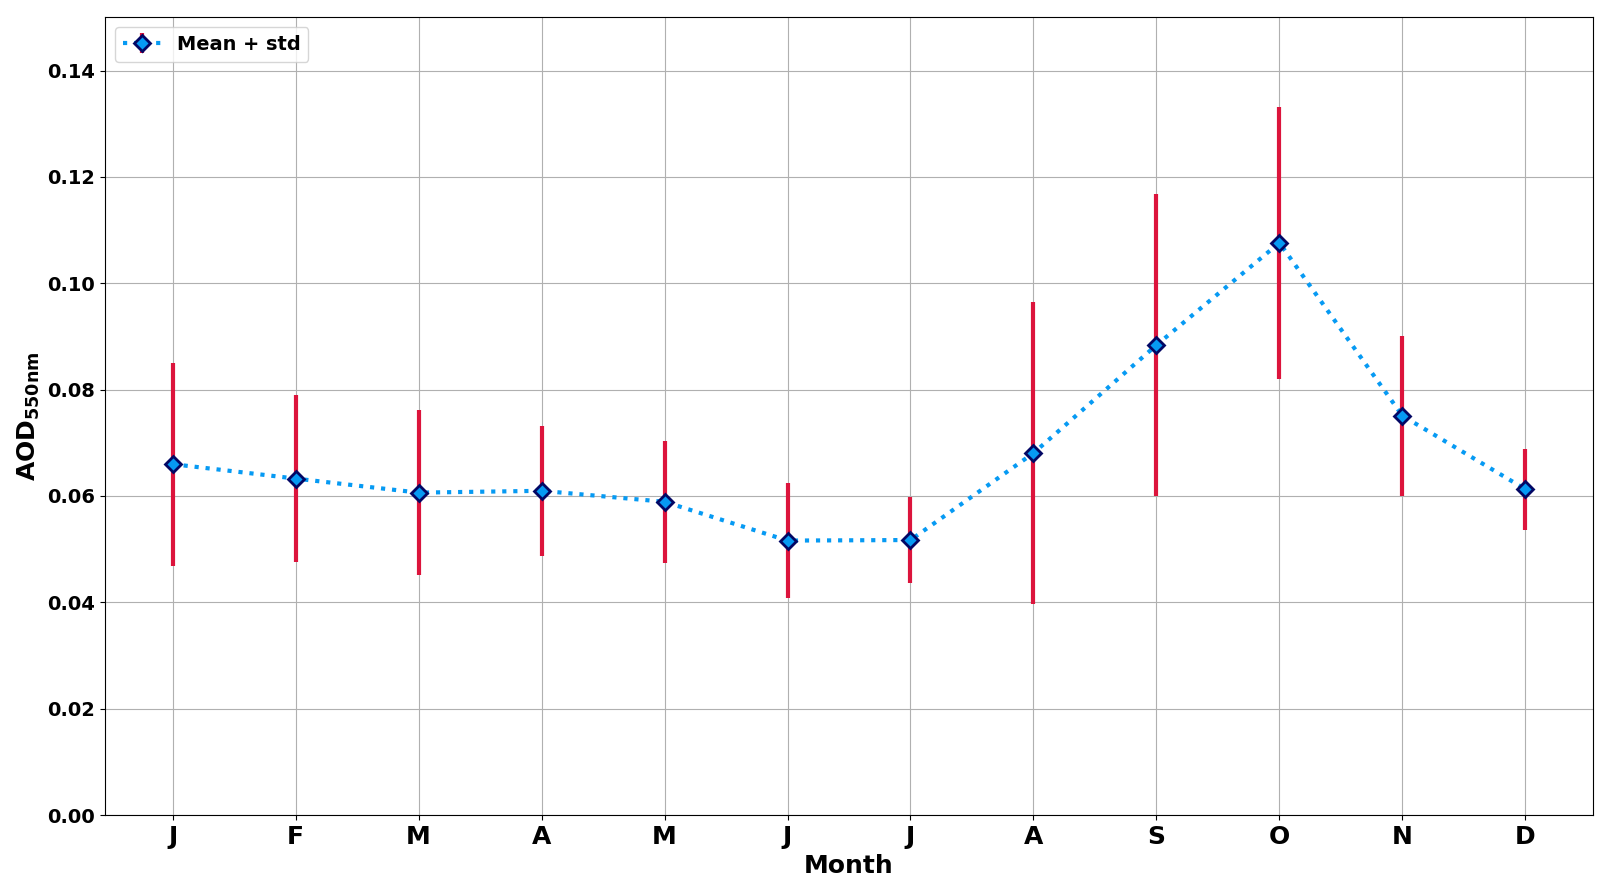
Figure A1Mean (blue diamonds) and standard deviation (red lines) of AOD550 monthly climatology CIMEL sun-photometer measurements (AERONET network) above Saint-Denis between December 2003 and December 2024.
The software code used to produce plots and ground-based lidar aerosol processing in this study is available from the corresponding author upon request.
AOD from direct sun version 3 level 2.0 can be obtained from AERONET website (https://aeronet.gsfc.nasa.gov/cgi-bin/webtool_aod_v3, last access: 28 April 2025). The CAMS global reanalysis (EAC4) is available on the Copernicus Atmosphere Data Store (Copernicus Atmosphere Monitoring Service, 2020, https://doi.org/10.24381/d58bbf47). MODIS Aqua and Terra aerosol products level 2 can be accessed on http://aqua.nasa.gov and http://terra.nasa.gov (last access: 3 April 2026). ECMWF ERA 5 reanalysis can be accessed via the Copernicus climate data store (https://cds.climate.copernicus.eu/, last access 9 November 2026). CALIOP level-2 data version 4.10 can be accessed on http://www-calipso.larc.nasa.gov (last access: 10 April 2026). Level 1b and level 2b nightly averaged aerosol products from the OPAR Maïdo Li1200 and LiO3T lidars can be accessed at https://doi.org/10.26171/rwcm-q370 (Gantois et al., 2024a). The corresponding time-series can be obtained upon request to the first author of the paper. The FTIR data sets are available on the NDACC repository (https://ndacc.larc.nasa.gov/index.php/instruments/ftir-spectrometer/profile-multiple-species-ftir-spectrometer-bruker-125hr-reunion, last access 29 April 2025). Water vapor profiles from the OPAR Maïdo Li1200 lidar and Flexpart simulations can be obtained upon request to the first author of the paper.
An animated sequence of FLEXPART forward dispersion of CO emitted from South America and Southern Africa between 16 and 26 September 2017 in terms of partial columns between 0 and 15 km, and vertical profiles at the latitude of 21.1° Maïdo observatory is available at https://doi.org/10.5446/73218 (Gantois, 2026).
DG conducted this study with the help of AB, MS, VD and NB. DG and AB performed the aerosol related processing of the lidar measurements. GP performed the water vapor related processing of the lidar measurements. SE and NE performed the FLEXPART model analysis and provided the corresponding outputs. NB contributed to the discussions concerning the dynamical part of this paper and involving FLEXPART simulations. JMM, MM and CV provided us with the FTIR observations and with their expertise in this instrument. VD and NM were responsible for the LiO3T instrument and dataset, and VD and GP were responsible for the Li1200 instrument and dataset. NG provided MODIS and ERA5 figures. PC provided CALIOP figures. PC and CF initiated the study and helped to implement the initial approach. All co-authors contributed to reviewing drafts of this manuscript.
The contact author has declared that none of the authors has any competing interests.
Publisher's note: Copernicus Publications remains neutral with regard to jurisdictional claims made in the text, published maps, institutional affiliations, or any other geographical representation in this paper. The authors bear the ultimate responsibility for providing appropriate place names. Views expressed in the text are those of the authors and do not necessarily reflect the views of the publisher.
FLEXPART model simulations are cross-atmospheric research infrastructure services provided by ATMO-ACCESS (EU grant agreement no. 101008004). SE and NE were funded by the same project. The computations/simulations were performed on resources provided by Sigma2 – the National Infrastructure for High Performance Computing and Data Storage in Norway. Eric Golubic, Patrick Hernandez, and Yann Hello are greatly thanked for the routine lidar measurements obtained at OPAR.
This research was funded by the European Union under Horizon Europe Grant Agreement 101086690. OPAR is presently funded by CNRS (INSU), Météo France, and Université de La Réunion, and managed by OSU-R (Observatoire des Sciences de l'Univers de La Réunion, UAR 3365). OPAR is supported by the French research infrastructure ACTRIS-FR (Aerosols, Clouds, and Trace gases Research InfraStructure – France) and by the French Center for Spatial Studies (CNES). This work was supported by the COST Action EARLICOST (CA24135), supported by COST (European Cooperation in Science and Technology). The authors acknowledge the support of the ANR through the OBS4CLIM project (ANR-21-ESRE-0013), and CNES through the projects EarthCARE-FR and EXTRA_SAT.
This paper was edited by Jason Cohen and reviewed by three anonymous referees.
Abel, S. J., Haywood, J. M., Highwood, E. J., Li, J., and Buseck, P. R.: Evolution of biomass burning aerosol properties from an agricultural fire in southern Africa, Geophys. Res. Lett., 30, 2003GL017342, https://doi.org/10.1029/2003GL017342, 2003.
Annegarn, H. J., Otter, L., Swap, R. J., and Scholes, R. J.: Southern Africa's ecosystem in a test-tube: A perspective on the Southern African Regional Science Initiative (SAFARI 2000), S. Afr. J. Sci., 98, 111–113, 2002.
Ansmann, A., Wandinger, U., Riebesell, M., Weitkamp, C., and Michaelis, W.: Independent measurement of extinction and backscatter profiles in cirrus clouds by using a combined Raman elastic-backscatter lidar, Appl. Opt., 31, 7113, https://doi.org/10.1364/AO.31.007113, 1992.
Baray, J.-L., Courcoux, Y., Keckhut, P., Portafaix, T., Tulet, P., Cammas, J.-P., Hauchecorne, A., Godin Beekmann, S., De Mazière, M., Hermans, C., Desmet, F., Sellegri, K., Colomb, A., Ramonet, M., Sciare, J., Vuillemin, C., Hoareau, C., Dionisi, D., Duflot, V., Vérèmes, H., Porteneuve, J., Gabarrot, F., Gaudo, T., Metzger, J.-M., Payen, G., Leclair de Bellevue, J., Barthe, C., Posny, F., Ricaud, P., Abchiche, A., and Delmas, R.: Maïdo observatory: a new high-altitude station facility at Reunion Island (21° S, 55° E) for long-term atmospheric remote sensing and in situ measurements, Atmos. Meas. Tech., 6, 2865–2877, https://doi.org/10.5194/amt-6-2865-2013, 2013.
Benedetti, A., Morcrette, J.-J., Boucher, O., Dethof, A., Engelen, R. J., Fisher, M., Flentje, H., Huneeus, N., Jones, L., Kaiser, J. W., Kinne, S., Mangold, A., Razinger, M., Simmons, A. J., and Suttie, M.: Aerosol analysis and forecast in the European Centre for Medium-Range Weather Forecasts Integrated Forecast System: 2. Data assimilation, J. Geophys. Res.-Atmos., 114, https://doi.org/10.1029/2008JD011115, 2009.
Chazette, P.: Raman lidar-derived aerosol optical properties and classification during the FENNEC experiment – coherence with CAMS data, Atmos. Meas. Tech., 19, 4293–4311, https://doi.org/10.5194/amt-19-4293-2026, 2026.
Chazette, P., Flamant, C., Totems, J., Gaetani, M., Smith, G., Baron, A., Landsheere, X., Desboeufs, K., Doussin, J.-F., and Formenti, P.: Evidence of the complexity of aerosol transport in the lower troposphere on the Namibian coast during AEROCLO-sA, Atmos. Chem. Phys., 19, 14979–15005, https://doi.org/10.5194/acp-19-14979-2019, 2019.
Chu, D. A., Kaufman, Y. J., Ichoku, C., Remer, L. A., Tanré, D., and Holben, B. N.: Validation of MODIS aerosol optical depth retrieval over land, Geophys. Res. Lett., 29, https://doi.org/10.1029/2001GL013205, 2002.
Copernicus Atmosphere Monitoring Service: CAMS global reanalysis (EAC4), Copernicus Atmosphere Monitoring Service (CAMS) Atmosphere Data Store [data set], https://doi.org/10.24381/D58BBF47, 2020.
Das, S., Colarco, P. R., Bian, H., and Gassó, S.: Improved simulations of biomass burning aerosol optical properties and lifetimes in the NASA GEOS Model during the ORACLES-I campaign, Atmos. Chem. Phys., 24, 4421–4449, https://doi.org/10.5194/acp-24-4421-2024, 2024.
Duflot, V., Dils, B., Baray, J. L., De Mazière, M., Attié, J. L., Vanhaelewyn, G., Senten, C., Vigouroux, C., Clain, G., and Delmas, R.: Analysis of the origin of the distribution of CO in the subtropical southern Indian Ocean in 2007, J. Geophys. Res., 115, D22106, https://doi.org/10.1029/2010JD013994, 2010.
Duflot, V., Bègue, N., Pouliquen, M.-L., Goloub, P., and Metzger, J.-M.: Aerosols on the Tropical Island of La Réunion (21° S, 55° E): Assessment of Climatology, Origin of Variability and Trend, Remote Sensing, 14, 4945, https://doi.org/10.3390/rs14194945, 2022.
Edwards, D. P., Emmons, L. K., Gille, J. C., Chu, A., Attié, J.-L., Giglio, L., Wood, S. W., Haywood, J., Deeter, M. N., Massie, S. T., Ziskin, D. C., and Drummond, J. R.: Satellite-observed pollution from Southern Hemisphere biomass burning, J. Geophys. Res., 111, D14312, https://doi.org/10.1029/2005JD006655, 2006.
Fiebig, M., Stohl, A., Wendisch, M., Eckhardt, S., and Petzold, A.: Dependence of solar radiative forcing of forest fire aerosol on ageing and state of mixture, Atmos. Chem. Phys., 3, 881–891, https://doi.org/10.5194/acp-3-881-2003, 2003.
Flamant, C., Gaetani, M., Chaboureau, J.-P., Chazette, P., Cuesta, J., Piketh, S. J., and Formenti, P.: Smoke in the river: an Aerosols, Radiation and Clouds in southern Africa (AEROCLO-sA) case study, Atmos. Chem. Phys., 22, 5701–5724, https://doi.org/10.5194/acp-22-5701-2022, 2022.
Floutsi, A. A., Baars, H., Engelmann, R., Althausen, D., Ansmann, A., Bohlmann, S., Heese, B., Hofer, J., Kanitz, T., Haarig, M., Ohneiser, K., Radenz, M., Seifert, P., Skupin, A., Yin, Z., Abdullaev, S. F., Komppula, M., Filioglou, M., Giannakaki, E., Stachlewska, I. S., Janicka, L., Bortoli, D., Marinou, E., Amiridis, V., Gialitaki, A., Mamouri, R.-E., Barja, B., and Wandinger, U.: DeLiAn – a growing collection of depolarization ratio, lidar ratio and Ångström exponent for different aerosol types and mixtures from ground-based lidar observations, Atmos. Meas. Tech., 16, 2353–2379, https://doi.org/10.5194/amt-16-2353-2023, 2023.
Formenti, P., D'Anna, B., Flamant, C., Mallet, M., Piketh, S. J., Schepanski, K., Waquet, F., Auriol, F., Brogniez, G., Burnet, F., Chaboureau, J.-P., Chauvigné, A., Chazette, P., Denjean, C., Desboeufs, K., Doussin, J.-F., Elguindi, N., Feuerstein, S., Gaetani, M., Giorio, C., Klopper, D., Mallet, M. D., Nabat, P., Monod, A., Solmon, F., Namwoonde, A., Chikwililwa, C., Mushi, R., Welton, E. J., and Holben, B.: The Aerosols, Radiation and Clouds in Southern Africa Field Campaign in Namibia: Overview, Illustrative Observations, and Way Forward, B. Am. Meteorol. Soc., 100, 1277–1298, https://doi.org/10.1175/BAMS-D-17-0278.1, 2019.
Forster, C., Stohl, A., and Seibert, P.: Parameterization of Convective Transport in a Lagrangian Particle Dispersion Model and Its Evaluation, J. Appl. Meteorol. Clim., 46, 403–422, https://doi.org/10.1175/JAM2470.1, 2007.
Gantois, D.: Entwined long-range transports of biomass burning aerosols over the South-West Indian Ocean: a case study of aerosol river in September 2017, TIB [video], https://doi.org/10.5446/73218, 2026., 2026.
Gantois, D., Payen, G., Sicard, M., Duflot, V., Bègue, N., Marquestaut, N., Portafaix, T., Godin Beekmann, S., Hernandez, P., and Golubic, E.: Multiwavelength aerosol lidars at Maïdo Observatory, GEOSUR [data set], https://doi.org/10.26171/rwcm-q370, 2024a.
Gantois, D., Payen, G., Sicard, M., Duflot, V., Bègue, N., Marquestaut, N., Portafaix, T., Godin-Beekmann, S., Hernandez, P., and Golubic, E.: Multiwavelength aerosol lidars at the Maïdo supersite, Réunion Island, France: instrument description, data processing chain, and quality assessment, Earth Syst. Sci. Data, 16, 4137–4159, https://doi.org/10.5194/essd-16-4137-2024, 2024b.
Garstang, M., Tyson, P. D., Swap, R., Edwards, M., Kållberg, P., and Lindesay, J. A.: Horizontal and vertical transport of air over southern Africa, J. Geophys. Res., 101, 23721–23736, https://doi.org/10.1029/95JD00844, 1996.
Giles, D. M., Sinyuk, A., Sorokin, M. G., Schafer, J. S., Smirnov, A., Slutsker, I., Eck, T. F., Holben, B. N., Lewis, J. R., Campbell, J. R., Welton, E. J., Korkin, S. V., and Lyapustin, A. I.: Advancements in the Aerosol Robotic Network (AERONET) Version 3 database – automated near-real-time quality control algorithm with improved cloud screening for Sun photometer aerosol optical depth (AOD) measurements, Atmos. Meas. Tech., 12, 169–209, https://doi.org/10.5194/amt-12-169-2019, 2019.
Groenen, N., Sicard, M., and Nabat, P.: Characteristics and trend of the wildfire activity in the Southern Hemisphere (2003–2022), Sci. Total Environ., 1052, 182240, https://doi.org/10.1016/j.scitotenv.2026.182240, 2026.
Guan, L., Cohen, J. B., Wang, S., Tiwari, P., Liu, Z., and Qin, K.: Improving Aerosol Absorption Estimates Via Size-Resolved Constraints Based on AERONET and In Situ Measurements, Geophys. Res. Lett., 53, e2025GL117418, https://doi.org/10.1029/2025GL117418, 2026.
Haarig, M., Ansmann, A., Baars, H., Jimenez, C., Veselovskii, I., Engelmann, R., and Althausen, D.: Depolarization and lidar ratios at 355, 532, and 1064 nm and microphysical properties of aged tropospheric and stratospheric Canadian wildfire smoke, Atmos. Chem. Phys., 18, 11847–11861, https://doi.org/10.5194/acp-18-11847-2018, 2018.
Hannigan, J., Palm, M., Jones, N., Ortega, I., Langerock, B., Mahieu, E., Zhou, M., and Smale, D.: SFIT4 Line-by-line nonlinear spectral fitting software: version 0.9.4 (0.9.4), Royal Belgian Institute for Space Aeronomy [software], https://doi.org/10.18758/EIJXNQWO, 2024.
Haywood, J. M., Osborne, S. R., Francis, P. N., Keil, A., Formenti, P., Andreae, M. O., and Kaye, P. H.: The mean physical and optical properties of regional haze dominated by biomass burning aerosol measured from the C-130 aircraft during SAFARI 2000, J. Geophys. Res., 108, 2002JD002226, https://doi.org/10.1029/2002JD002226, 2003.
Hersbach, H., Bell, B., Berrisford, P., Hirahara, S., Horányi, A., Muñoz-Sabater, J., Nicolas, J., Peubey, C., Radu, R., Schepers, D., Simmons, A., Soci, C., Abdalla, S., Abellan, X., Balsamo, G., Bechtold, P., Biavati, G., Bidlot, J., Bonavita, M., De Chiara, G., Dahlgren, P., Dee, D., Diamantakis, M., Dragani, R., Flemming, J., Forbes, R., Fuentes, M., Geer, A., Haimberger, L., Healy, S., Hogan, R. J., Hólm, E., Janisková, M., Keeley, S., Laloyaux, P., Lopez, P., Lupu, C., Radnoti, G., De Rosnay, P., Rozum, I., Vamborg, F., Villaume, S., and Thépaut, J.: The ERA5 global reanalysis, Q. J. Roy. Meteorol. Soc., 146, 1999–2049, https://doi.org/10.1002/qj.3803, 2020.
Holben, B. N., Eck, T. F., Slutsker, I., Tanré, D., Buis, J. P., Setzer, A., Vermote, E., Reagan, J. A., Kaufman, Y. J., Nakajima, T., Lavenu, F., Jankowiak, I., and Smirnov, A.: AERONET – A Federated Instrument Network and Data Archive for Aerosol Characterization, Remote Sens. Environ., 66, 1–16, https://doi.org/10.1016/S0034-4257(98)00031-5, 1998.
Inness, A., Ades, M., Agustí-Panareda, A., Barré, J., Benedictow, A., Blechschmidt, A.-M., Dominguez, J. J., Engelen, R., Eskes, H., Flemming, J., Huijnen, V., Jones, L., Kipling, Z., Massart, S., Parrington, M., Peuch, V.-H., Razinger, M., Remy, S., Schulz, M., and Suttie, M.: The CAMS reanalysis of atmospheric composition, Atmos. Chem. Phys., 19, 3515–3556, https://doi.org/10.5194/acp-19-3515-2019, 2019.
Kahn, R. A., Andrews, E., Brock, C. A., Chin, M., Feingold, G., Gettelman, A., Levy, R. C., Murphy, D. M., Nenes, A., Pierce, J. R., Popp, T., Redemann, J., Sayer, A. M., Da Silva, A. M., Sogacheva, L., and Stier, P.: Reducing Aerosol Forcing Uncertainty by Combining Models With Satellite and Within-The-Atmosphere Observations: A Three-Way Street, Rev. Geophys., 61, e2022RG000796, https://doi.org/10.1029/2022RG000796, 2023.
Kaiser, J. W., Heil, A., Andreae, M. O., Benedetti, A., Chubarova, N., Jones, L., Morcrette, J.-J., Razinger, M., Schultz, M. G., Suttie, M., and van der Werf, G. R.: Biomass burning emissions estimated with a global fire assimilation system based on observed fire radiative power, Biogeosciences, 9, 527–554, https://doi.org/10.5194/bg-9-527-2012, 2012.
Kim, M.-H., Omar, A. H., Tackett, J. L., Vaughan, M. A., Winker, D. M., Trepte, C. R., Hu, Y., Liu, Z., Poole, L. R., Pitts, M. C., Kar, J., and Magill, B. E.: The CALIPSO version 4 automated aerosol classification and lidar ratio selection algorithm, Atmos. Meas. Tech., 11, 6107–6135, https://doi.org/10.5194/amt-11-6107-2018, 2018.
King, M. D., Kaufman, Y. J., Menzel, W. P., and Tanre, D.: Remote sensing of cloud, aerosol, and water vapor properties from the moderate resolution imaging spectrometer (MODIS), IEEE T. Geosci. Remote, 30, 2–27, https://doi.org/10.1109/36.124212, 1992.
Klett, J. D.: Lidar inversion with variable backscatter/extinction ratios, Appl. Opt., 24, 1638, https://doi.org/10.1364/AO.24.001638, 1985.
Konovalov, I. B., Golovushkin, N. A., Beekmann, M., Panchenko, M. V., and Andreae, M. O.: Inferring the absorption properties of organic aerosol in Siberian biomass burning plumes from remote optical observations, Atmos. Meas. Tech., 14, 6647–6673, https://doi.org/10.5194/amt-14-6647-2021, 2021.
Lu, Z., Liu, X., Zhang, Z., Zhao, C., Meyer, K., Rajapakshe, C., Wu, C., Yang, Z., and Penner, J. E.: Biomass smoke from southern Africa can significantly enhance the brightness of stratocumulus over the southeastern Atlantic Ocean, P. Natl. Acad. Sci. USA, 115, 2924–2929, https://doi.org/10.1073/pnas.1713703115, 2018.
Mangold, A., De Backer, H., De Paepe, B., Dewitte, S., Chiapello, I., Derimian, Y., Kacenelenbogen, M., Léon, J.-F., Huneeus, N., Schulz, M., Ceburnis, D., O'Dowd, C., Flentje, H., Kinne, S., Benedetti, A., Morcrette, J.-J., and Boucher, O.: Aerosol analysis and forecast in the European Centre for Medium-Range Weather Forecasts Integrated Forecast System: 3. Evaluation by means of case studies, J. Geophys. Res.-Atmos., 116, https://doi.org/10.1029/2010JD014864, 2011.
Mascaut, F., Pujol, O., Verreyken, B., Peroni, R., Metzger, J. M., Blarel, L., Podvin, T., Goloub, P., Sellegri, K., Thornberry, T., Duflot, V., Tulet, P., and Brioude, J.: Aerosol characterization in an oceanic context around Reunion Island (AEROMARINE field campaign), Atmos. Environ., 268, 118770, https://doi.org/10.1016/j.atmosenv.2021.118770, 2022.
Morcrette, J.-J., Boucher, O., Jones, L., Salmond, D., Bechtold, P., Beljaars, A., Benedetti, A., Bonet, A., Kaiser, J. W., Razinger, M., Schulz, M., Serrar, S., Simmons, A. J., Sofiev, M., Suttie, M., Tompkins, A. M., and Untch, A.: Aerosol analysis and forecast in the European Centre for Medium-Range Weather Forecasts Integrated Forecast System: Forward modeling, J. Geophys. Res.-Atmos., 114, https://doi.org/10.1029/2008JD011235, 2009.
Pisso, I., Sollum, E., Grythe, H., Kristiansen, N. I., Cassiani, M., Eckhardt, S., Arnold, D., Morton, D., Thompson, R. L., Groot Zwaaftink, C. D., Evangeliou, N., Sodemann, H., Haimberger, L., Henne, S., Brunner, D., Burkhart, J. F., Fouilloux, A., Brioude, J., Philipp, A., Seibert, P., and Stohl, A.: The Lagrangian particle dispersion model FLEXPART version 10.4, Geosci. Model Dev., 12, 4955–4997, https://doi.org/10.5194/gmd-12-4955-2019, 2019.
Ramanathan, V., Crutzen, P. J., Lelieveld, J., Mitra, A. P., Althausen, D., Anderson, J., Andreae, M. O., Cantrell, W., Cass, G. R., Chung, C. E., Clarke, A. D., Coakley, J. A., Collins, W. D., Conant, W. C., Dulac, F., Heintzenberg, J., Heymsfield, A. J., Holben, B., Howell, S., Hudson, J., Jayaraman, A., Kiehl, J. T., Krishnamurti, T. N., Lubin, D., McFarquhar, G., Novakov, T., Ogren, J. A., Podgorny, I. A., Prather, K., Priestley, K., Prospero, J. M., Quinn, P. K., Rajeev, K., Rasch, P., Rupert, S., Sadourny, R., Satheesh, S. K., Shaw, G. E., Sheridan, P., and Valero, F. P. J.: Indian Ocean Experiment: An integrated analysis of the climate forcing and effects of the great Indo-Asian haze, J. Geophys. Res., 106, 28371–28398, https://doi.org/10.1029/2001JD900133, 2001.
Ranaivombola, M., Bègue, N., Bencherif, H., Millet, T., Sivakumar, V., Duflot, V., Baron, A., Mbatha, N., Piketh, S., Formenti, P., and Goloub, P.: Aerosol Optical Properties and Types over Southern Africa and Reunion Island Determined from Ground-Based and Satellite Observations over a 13-Year Period (2008–2021), Remote Sensing, 15, 1581, https://doi.org/10.3390/rs15061581, 2023.
Ranaivombola, M., Bègue, N., Vaz Peres, L., Fazel-Rastgar, F., Sivakumar, V., Krysztofiak, G., Berthet, G., Jegou, F., Piketh, S., and Bencherif, H.: Characterization of aerosol optical depth (AOD) anomalies in September and October 2022 over Skukuza in South Africa, Atmos. Chem. Phys., 25, 3519–3540, https://doi.org/10.5194/acp-25-3519-2025, 2025.
Redemann, J., Wood, R., Zuidema, P., Doherty, S. J., Luna, B., LeBlanc, S. E., Diamond, M. S., Shinozuka, Y., Chang, I. Y., Ueyama, R., Pfister, L., Ryoo, J.-M., Dobracki, A. N., da Silva, A. M., Longo, K. M., Kacenelenbogen, M. S., Flynn, C. J., Pistone, K., Knox, N. M., Piketh, S. J., Haywood, J. M., Formenti, P., Mallet, M., Stier, P., Ackerman, A. S., Bauer, S. E., Fridlind, A. M., Carmichael, G. R., Saide, P. E., Ferrada, G. A., Howell, S. G., Freitag, S., Cairns, B., Holben, B. N., Knobelspiesse, K. D., Tanelli, S., L'Ecuyer, T. S., Dzambo, A. M., Sy, O. O., McFarquhar, G. M., Poellot, M. R., Gupta, S., O'Brien, J. R., Nenes, A., Kacarab, M., Wong, J. P. S., Small-Griswold, J. D., Thornhill, K. L., Noone, D., Podolske, J. R., Schmidt, K. S., Pilewskie, P., Chen, H., Cochrane, S. P., Sedlacek, A. J., Lang, T. J., Stith, E., Segal-Rozenhaimer, M., Ferrare, R. A., Burton, S. P., Hostetler, C. A., Diner, D. J., Seidel, F. C., Platnick, S. E., Myers, J. S., Meyer, K. G., Spangenberg, D. A., Maring, H., and Gao, L.: An overview of the ORACLES (ObseRvations of Aerosols above CLouds and their intEractionS) project: aerosol–cloud–radiation interactions in the southeast Atlantic basin, Atmos. Chem. Phys., 21, 1507–1563, https://doi.org/10.5194/acp-21-1507-2021, 2021.
Reid, J. S., Hobbs, P. V., Ferek, R. J., Blake, D. R., Martins, J. V., Dunlap, M. R., and Liousse, C.: Physical, chemical, and optical properties of regional hazes dominated by smoke in Brazil, J. Geophys. Res., 103, 32059–32080, https://doi.org/10.1029/98JD00458, 1998.
Rodgers, C. D.: Inverse Methods for Atmospheric Sounding: Theory and Practice, World Scientific, 256 pp., https://doi.org/10.1142/3171, 2000.
Rodgers, C. D. and Connor, B. J.: Intercomparison of remote sounding instruments, J. Geophys. Res., 108, 2002JD002299, https://doi.org/10.1029/2002JD002299, 2003.
Salomonson, V. V., Barnes, W. L., Maymon, P. W., Montgomery, H. E., and Ostrow, H.: MODIS: advanced facility instrument for studies of the Earth as a system, IEEE T. Geosci. Remote, 27, 145–153, https://doi.org/10.1109/36.20292, 1989.
Samset, B. H., Stjern, C. W., Andrews, E., Kahn, R. A., Myhre, G., Schulz, M., and Schuster, G. L.: Aerosol Absorption: Progress Towards Global and Regional Constraints, Curr. Clim. Change Rep., 4, 65–83, https://doi.org/10.1007/s40641-018-0091-4, 2018.
Schmid, B., Redemann, J., Russell, P. B., Hobbs, P. V., Hlavka, D. L., McGill, M. J., Holben, B. N., Welton, E. J., Campbell, J. R., Torres, O., Kahn, R. A., Diner, D. J., Helmlinger, M. C., Chu, D. A., Robles-Gonzalez, C., and De Leeuw, G.: Coordinated airborne, spaceborne, and ground-based measurements of massive thick aerosol layers during the dry season in southern Africa, J. Geophys. Res., 108, 2002JD002297, https://doi.org/10.1029/2002JD002297, 2003.
Senten, C., De Mazière, M., Dils, B., Hermans, C., Kruglanski, M., Neefs, E., Scolas, F., Vandaele, A. C., Vanhaelewyn, G., Vigouroux, C., Carleer, M., Coheur, P. F., Fally, S., Barret, B., Baray, J. L., Delmas, R., Leveau, J., Metzger, J. M., Mahieu, E., Boone, C., Walker, K. A., Bernath, P. F., and Strong, K.: Technical Note: New ground-based FTIR measurements at Ile de La Réunion: observations, error analysis, and comparisons with independent data, Atmos. Chem. Phys., 8, 3483–3508, https://doi.org/10.5194/acp-8-3483-2008, 2008.
Simoneit, B. R. T.: Biomass burning – a review of organic tracers for smoke from incomplete combustion, Appl. Geochem., 17, 129–162, https://doi.org/10.1016/S0883-2927(01)00061-0, 2002.
Smirnov, A., Holben, B. N., Eck, T. F., Dubovik, O., and Slutsker, I.: Cloud-Screening and Quality Control Algorithms for the AERONET Database, Remote Sens. Environ., 73, 337–349, https://doi.org/10.1016/S0034-4257(00)00109-7, 2000.
Stohl, A., Forster, C., Frank, A., Seibert, P., and Wotawa, G.: Technical note: The Lagrangian particle dispersion model FLEXPART version 6.2, Atmos. Chem. Phys., 5, 2461–2474, https://doi.org/10.5194/acp-5-2461-2005, 2005.
Swap, R. J., Annegarn, H. J., Suttles, J. T., King, M. D., Platnick, S., Privette, J. L., and Scholes, R. J.: Africa burning: A thematic analysis of the Southern African Regional Science Initiative (SAFARI 2000), J. Geophys. Res., 108, 8465, https://doi.org/10.1029/2003JD003747, 2003.
Tackett, J. L., Kar, J., Vaughan, M. A., Getzewich, B. J., Kim, M.-H., Vernier, J.-P., Omar, A. H., Magill, B. E., Pitts, M. C., and Winker, D. M.: The CALIPSO version 4.5 stratospheric aerosol subtyping algorithm, Atmos. Meas. Tech., 16, 745–768, https://doi.org/10.5194/amt-16-745-2023, 2023.
Thompson, A. M., Pickering, K. E., McNamara, D. P., Schoeberl, M. R., Hudson, R. D., Kim, J. H., Browell, E. V., Kirchhoff, V. W. J. H., and Nganga, D.: Where did tropospheric ozone over southern Africa and the tropical Atlantic come from in October 1992? Insights from TOMS, GTE TRACE A, and SAFARI 1992, J. Geophys. Res., 101, 24251–24278, https://doi.org/10.1029/96JD01463, 1996.
Tiwari, P., Cohen, J. B., Wang, X., Wang, S., and Qin, K.: Radiative forcing bias calculation based on COSMO (Core-Shell Mie model Optimization) and AERONET data, npj Clim. Atmos. Sci., 6, 193, https://doi.org/10.1038/s41612-023-00520-1, 2023.
Tiwari, P., Cohen, J. B., Gao, H., Lu, L., Wang, J., Dubovik, O., and Qin, K.: Microphysical evolution and column loading drive nonlinear regional contrast in black carbon top-of-atmosphere forcing, Atmos. Chem. Phys., 26, 9149–9180, https://doi.org/10.5194/acp-26-9149-2026, 2026.
van der Werf, G. R., Randerson, J. T., Giglio, L., van Leeuwen, T. T., Chen, Y., Rogers, B. M., Mu, M., van Marle, M. J. E., Morton, D. C., Collatz, G. J., Yokelson, R. J., and Kasibhatla, P. S.: Global fire emissions estimates during 1997–2016, Earth Syst. Sci. Data, 9, 697–720, https://doi.org/10.5194/essd-9-697-2017, 2017.
Vérèmes, H., Payen, G., Keckhut, P., Duflot, V., Baray, J.-L., Cammas, J.-P., Evan, S., Posny, F., Körner, S., and Bosser, P.: Validation of the Water Vapor Profiles of the Raman Lidar at the Maïdo Observatory (Reunion Island) Calibrated with Global Navigation Satellite System Integrated Water Vapor, Atmosphere, 10, 713, https://doi.org/10.3390/atmos10110713, 2019.
Wandinger, U., Müller, D., Böckmann, C., Althausen, D., Matthias, V., Bösenberg, J., Weiß, V., Fiebig, M., Wendisch, M., Stohl, A., and Ansmann, A.: Optical and microphysical characterization of biomass- burning and industrial-pollution aerosols from- multiwavelength lidar and aircraft measurements, J. Geophys. Res., 107, https://doi.org/10.1029/2000JD000202, 2002.
Wang, S., Cohen, J. B., Guan, L., Lu, L., Tiwari, P., and Qin, K.: Observationally constrained global NOx and CO emissions variability reveals sources which contribute significantly to CO2 emissions, npj Clim. Atmos. Sci., 8, 87, https://doi.org/10.1038/s41612-025-00977-2, 2025.
Whiteman, D. N., Demoz, B., Rush, K., Schwemmer, G., Gentry, B., Di Girolamo, P., Comer, J., Veselovskii, I., Evans, K., Melfi, S. H., Wang, Z., Cadirola, M., Mielke, B., Venable, D., and Van Hove, T.: Raman Lidar Measurements during the International H2O Project. Part I: Instrumentation and Analysis Techniques, J. Atmos. Ocean. Tech., 23, 157–169, https://doi.org/10.1175/JTECH1838.1, 2006.
Winker, D. M., Hunt, W. H., and McGill, M. J.: Initial performance assessment of CALIOP, Geophys. Res. Lett., 34, 2007GL030135, https://doi.org/10.1029/2007GL030135, 2007.
Young, S. A. and Vaughan, M. A.: The Retrieval of Profiles of Particulate Extinction from Cloud-Aerosol Lidar Infrared Pathfinder Satellite Observations (CALIPSO) Data: Algorithm Description, J. Atmos. Ocean. Tech., 26, 1105–1119, https://doi.org/10.1175/2008JTECHA1221.1, 2009.
Zhou, M., Langerock, B., Vigouroux, C., Wang, P., Hermans, C., Stiller, G., Walker, K. A., Dutton, G., Mahieu, E., and De Mazière, M.: Ground-based FTIR retrievals of SF6 on Reunion Island, Atmos. Meas. Tech., 11, 651–662, https://doi.org/10.5194/amt-11-651-2018, 2018.