
the Creative Commons Attribution 4.0 License.
the Creative Commons Attribution 4.0 License.
 | 13 Nov 2026
Characterization of trace gas emissions from controlled laboratory burning of Canadian boreal forest fuels
Rowshon Afroz
Hongru Shen
Bradley H. Isenor
Samar G. Moussa
Amanda Hanashiro Moraes
Shakiba Talebian
Carolyn Liu-Kang
Jeremy J. B. Wentzell
Oscar Olfert
Amy Leithead
Ginny Marshall
Ralf M. Staebler
Cris Mihele
Arthur W. H. Chan
Jason Olfert
John Liggio
Jonathan Abbatt

Although boreal wildfires are a major global source of trace gases, their emissions remain poorly characterized. To address this gap, controlled burns of Canadian Boreal surface and ground fuels were conducted during the Biomass Burning Canada (BBCan) Campaign. Emission factors (EF) for 46 volatile organic compounds (VOC) were determined using iodide chemical ionization mass spectrometry (I-CIMS) and Vocus proton transfer reaction mass spectrometry (Vocus PTR-MS). Total non-methane organic compound (NMOC) emissions, which were measured separately, were found to account for 2 %–12 % of total emitted gas-phase carbon (i.e., CO2, CO, CH4, NMOC), with total quantified VOCs (∑VOCs) accounting for 13 %–40 % of that fraction. The dominant compounds contributing to the measured ∑VOCs include oxygenates and organic reactive nitrogen (Nr) species. Boreal peat fuels, which are prone to residual smoldering combustion, produced significantly higher total NMOC, total Nr, and individual VOC emissions than the other fuels. In contrast, boreal mulch, which burned very efficiently, produced low emissions. Combustion efficiency was observed to have a strong impact on total and individual VOC emissions, but VOC emission profiles were also dependent on fuel type and moisture content. The findings indicate that the EFs currently used to speciate NMOC emission may not adequately capture emissions from smoldering boreal peat fires. Study results provide the first comprehensive VOC EF for fresh emissions for a range of Canadian boreal surface and ground fuels, which can be used to improve emission inventories and enhance predictions of wildfire smoke impacts on air quality, climate, and health.
- Article
(3186 KB) - Full-text XML
-
Supplement
(8131 KB) - BibTeX
- EndNote


The works published in this journal are distributed under the Creative Commons Attribution 4.0 License. This licence does not affect the Crown copyright work, which is re-usable under the Open Government Licence (OGL). The Creative Commons Attribution 4.0 License and the OGL are interoperable and do not conflict with, reduce or limit each other.
© Copyright. His Majesty the King in Right of Canada, as represented by the Minister of the Environment, 2026.
Canada, with 28 % of the world's boreal forest (552 ×106 ha) and 9 % of the world's forests, has experienced a long history of wildfire activity that varies significantly by region and season (Natural Resources Canada, 2025a; Chen et al., 2019). Over the previous decade, the country experienced an average of 7000 wildfires annually, burning about 2.6 ×10⁶ ha each year (Canadian Interagency Forest Fire Centre, 2017). However, as a result of climate change-driven droughts and higher temperatures (Abatzoglou and Williams, 2016), and the accumulation of fuels due to effective fire suppression (Kreider et al., 2024), fire seasons have been increasing in duration, and are characterized by a greater number of large (≥200 ha) and very large fires (>100 000 ha) (Government of Canada, 2026). Peatlands, which cover 25 %–30 % of the boreal forest region, and store over half of Canada’s soil organic carbon (Government of Canada, 2026; Amiro et al., 2009), are particularly susceptible to fire in a warming climate. In 2023, Canada faced its most destructive wildfire season in history, with approximately 6000 fires burning 18.5 ×10⁶ ha, more than double the previous record set in 1989 (Government of Canada, 2024). This recent period of unprecedented fire activity in North America and worldwide is increasing the challenges associated with wildfires (Abatzoglou and Williams, 2016; Westerling et al., 2006).
In addition to emitting vast quantities of carbon dioxide (CO2), wildfires emit a variety of trace gas species including carbon monoxide (CO), methane (CH4), reactive nitrogen (Nr) species, and a wide spectrum of volatile organic compounds (VOCs) (Koss et al., 2018; Gilman et al., 2015; Burling et al., 2010; Yokelson et al., 2013; Akagi et al., 2011; Andreae, 2019; Watson et al., 2019). Nr, defined here as all nitrogen-containing compounds except N2 and N2O (Roberts et al., 2020), includes both inorganic species such as nitrogen oxides (NO), nitrous acid (HONO), and ammonia (NH3), as well as nitrogen-containing organic species, which are a subset of VOCs. Globally, wildfires release an estimated 400 teragrams of VOCs annually, making biomass burning the second-largest source of these compounds (Akagi et al., 2011). Once emitted, chemical transformations involving VOCs and Nr species within wildfire plumes result in the formation of secondary pollutants, including ozone and secondary particulate matter (Jaffe and Wigder, 2012; Alvarado and Prinn, 2009; Zhan et al., 2021). These wildfire pollutants can travel vast distances through the atmosphere, degrading air quality and introducing pollutants to downwind ecosystems, while also directly and indirectly impacting the earth’s radiative balance (Miller et al., 2011; Rogers et al., 2020; Campos et al., 2019; Kallenborn et al., 2012; Sommers et al., 2014; Voulgarakis et al., 2015; Crutzen and Andreae, 1990; Carter et al., 2019). In addition, many emitted VOCs are directly toxic (e.g., acrolein, acetaldehyde, hydrogen cyanide, acetonitrile, and benzene), making wildfire smoke a growing public health concern as evidence increasingly links exposure to adverse health effects (USEPA, 2019; Xiong et al., 2024). To mitigate against severe fire hazards, fuel reduction treatments, including vegetation thinning and prescribed burning, are increasingly being studied and employed (Agee and Skinner, 2005; Urbanski et al., 2022). A good understanding of the emission, transformation, and transport of VOC and reactive Nr species is essential to accurately modeling and evaluating the environmental and human health impacts of biomass burning, whether it be wildfires or prescribed burning.
Biomass burning emissions are typically estimated using bottom-up or hybrid approaches that combine activity data (e.g., fire radiative power (FRP), fuel consumption, area burned, fuel loading, fuel classification, combustion factor) with emission factors (i.e., EF, mass of emitted pollutant per mass of fuel consumed, on a dry fuel basis, g kg−1), emission ratios (i.e., ER, mass or molar ratio of emitted pollutant to another tracer, typically CO), or emission coefficients (i.e., mass of emitted pollutant per fire radiative energy, g MJ−1) (Chen et al., 2019; Copernicus Atmosphere Monitoring Service, 2022; Griffin et al., 2024; Wiedinmyer et al., 2023; Randerson et al., 2013). However, global and regional estimates of emissions from biomass burning remain highly uncertain due to difficulties in accurately assessing activity data such as area burned and fuel consumption, and due to the high variability between individual fires (Carter et al., 2019; Pan et al., 2020; Jaffe et al., 2020). Another key source of uncertainty for models, and the focus of the current study, lies in the EFs themselves.
Wildfire models that use EF as critical inputs include: the Fire Inventory from NCAR (National Center for Atmospheric Research) (FINN) (Wiedinmyer et al., 2023), NASA’s Global Fire Emissions Database (GFED) (Randerson et al., 2013), and the Canadian Forest Fire Emissions Prediction System (CFFEPS) developed by the Canadian Forest Service, which has recently been integrated into Environment and Climate Change Canada’s (ECCC) FireWork (v2.0) air quality forecast model (Chen et al., 2019). Several wildfire emissions inventories have been compiled for this purpose and provide biomass burning EFs for a large number of gas and particle species, for various fuel or vegetation types (e.g., “Boreal forest”, “Peat fires”) (Akagi et al., 2011; Andreae, 2019; Binte Shahid et al., 2024; Urbanski, 2014; Andreae and Merlet, 2001). These EF are typically derived from field and laboratory studies.
Field studies (typically by aircraft) are invaluable for understanding real-world wildfire emissions and plume chemistry under natural fire conditions and for a representative fuel mix (Yokelson et al., 2008; Chen et al., 2010). However, limited observational data, heterogeneity in fuel sources and combustion conditions, along with the coexistence of fresh and atmospherically-aged emissions, pose a challenge to deriving primary EFs for specific fuel types (Yokelson et al., 2013; Akagi et al., 2011; Andreae and Merlet, 2001). In contrast, controlled burning studies in the laboratory, and occasionally in the field, enable continuous monitoring throughout all combustion phases with minimal interference. This approach allows key variables such as fuel type, fuel characteristics (e.g., moisture content and chemical composition), and fuel structure and arrangement to be controlled in a consistent and reproducible manner, yielding emissions data (e.g., EF, ER, and other observations of fire behavior) that are critical for interpreting complex real-world observations (Koss et al., 2018; Selimovic et al., 2019). Laboratory studies may also facilitate the deployment of a large suite of instruments in contrast to field studies, which often face greater challenges related to payload capacity. Recent advances in analytical instrumentation and techniques have further expanded the ability to quantify a wide range of emitted compounds (Burling et al., 2010; Yokelson et al., 2013, 1996; Stockwell et al., 2016).
During biomass burning, several processes occur, sometimes simultaneously, including (a) distillation (which releases water vapour and other gases); (b) pyrolysis of the biomass (e.g., cellulose, hemicellulose, and lignin) to produce flammable gases; (c) flaming combustion; and (d) smoldering/non-flaming processes such as glowing (Yokelson et al., 1996; Sekimoto et al., 2018). Fuel moisture content plays a significant role in governing the depth and extent of burning, and also influences the combustion efficiency, emission profile, and plume chemistry (Rein et al., 2008). Due to the complexity of the processes involved, both laboratory and field studies have demonstrated that pollutant EFs vary substantially depending on fuel type, fuel characteristics, and combustion conditions, reinforcing the need for studies specific to different vegetation/fuel types (Andreae, 2019; Urbanski, 2014; Chen et al., 2010; Yokelson et al., 1996; Larkin et al., 2020; Kaiser et al., 2012; Cubison et al., 2011; Hecobian et al., 2011; Liu et al., 2017a).
The Canadian boreal region is dominated by peatlands, coniferous forests (e.g., black spruce, white spruce, jack pine, and balsam fir), with mixed-wood and deciduous stands (e.g., trembling aspen, white birch), and low-lying shrubs (Natural Resources Canada, 2025b; Foresty Canada, Fire Danger Group, 1992). These species contribute to a flammable layer of surface fuels on the forest floor consisting of leaves, fine woody debris, bark, and needles that dry quickly (Patil Shirish et al., 2013). Below the surface litter is a slower-drying layer of decomposing organic materials that can support smoldering combustion. Additional Canadian surface fuels include grass, feather moss, and lichen, while deeper ground fuels include organic soils, duff, and peat (Urbanski et al., 2022). Surface and ground fuels account for more than 85 % of the total biomass consumed by Canadian forest fires, and the propensity of organic soil and peat to smolder over long durations makes them a key driver of wildfire emissions (Turetsky et al., 2015, 2011; Amiro et al., 2001; De Groot et al., 2009; Hu and Rein, 2022; Hu et al., 2018; Turetsky et al., 2002). In the future, boreal fires are expected to burn deeper and consume more fuel on a per-area basis (De Groot et al., 2009). Furthermore, human activities and droughts that lower the water table in peatlands are also expected to make these important carbon reservoirs more susceptible to fire (Hu et al., 2018; Rein, 2013). On the other hand, prescribed burning, often conducted during marginal conditions (higher atmospheric humidities and lower temperatures), targets the removal of rapidly burning light surface and understory fuels, including litter, fine woody debris, and grass, while avoiding canopy fuels or deeper ground fuels to reduce the likelihood of high-intensity fire when conditions are hotter and drier (Agee and Skinner, 2005; Urbanski et al., 2022).
Despite the regional and global importance of wildland (wildfire and prescribed burning) emissions from the Canadian boreal zone, fuel-specific EF data remain scarce for Canadian biomass fuels, particularly boreal surface and ground fuels such as peat, moss, and mulch. Only two aircraft campaigns (Hayden et al., 2022; Simpson et al., 2011) have measured comprehensive VOC emission from Canadian boreal wildfires, and few laboratory studies have systematically investigated the combustion of Canadian boreal fuels (Urbanski et al., 2022; Urbanski, 2014; Stockwell et al., 2015). The flaming and smoldering/residual combustion EF profiles used by CFFEPS to speciate emissions of non-methane organic compounds (NMOC) are based on the Urbanski (2014) EF inventories for “Wildfire Boreal Forest” and “Boreal Forest Duff/Organic Soil”, respectively (Chen et al., 2019; Simon et al., 2010). However, the “Wildfire Boreal Forest” dataset is based solely on the Simpson et al. (2011) aircraft study and a synthesis paper by Yokelson et al. (2013) that couples field and laboratory data, while the “Boreal Forest Duff/Organic Soil” dataset is based primarily on laboratory studies of duff/organic soil sourced from Montana and Northwest Territories (Bertschi et al., 2003) and a single laboratory burn of organic soil sourced from Alaska (Burling et al., 2010; Yokelson et al., 2013).
Addressing this gap, this study presents the first comprehensive analysis of VOCs and other trace gas emissions from laboratory burns of natural fuels relevant to Canadian wildfires, including boreal peat, black spruce forest mulch, grass, and other surface materials. EFs and ERs for volatile organic compounds and other trace gas species were derived, and their dependence on fuel type, fuel moisture content, and combustion behavior was investigated. The resulting dataset addresses key gaps in emission inventories, which will in turn improve emission representation for boreal fuels in wildland fire emission and chemical transport models.
2.1 Fire lab experimental overview
The study was conducted in August, 2024 at the Fire Laboratory of Natural Resources Canada’s Northern Forestry Centre in Edmonton, Alberta, Canada, as a part of the BBCan (Biomass Burning in Canada) campaign (Biomass Burning in Canada, 2021). An overview of the campaign and a schematic of the burning platform and instrumentation are provided in an overview paper (Moraes et al., 2026); the overall methodology is briefly described here. For each experiment, a fuel sample was placed on an aluminum tray and ignited using a quartz tube infrared electric heater (Model SIRH4002W, Stelpro Zenith), positioned about 5 cm above the fuel to initiate combustion, and then removed. Real-time fuel mass loss was monitored using a precision balance (Omega LSC7000-10), while air temperature was recorded using a fine wire thermocouple placed near the fuel surface at 1-second intervals throughout the entire burning period. Smoke generated during combustion was drawn into an overhead exhaust hood above the burn platform. A static mixer was installed in the exhaust duct to ensure uniform mixing of emissions, and airflow through the system was maintained using a regulated fan. Gas samples were collected from sampling ports located downstream of the static mixer and exhaust fan, ensuring representative capture of well-mixed combustion gases. To prevent particle interference with the gas analysis, Teflon filters (2.0 µm) were installed upstream of the analyzers and replaced daily. Additionally, all gas sampling lines were constructed from perfluoroalkoxy alkane (PFA) and heated to 70 °C to reduce losses of gaseous compounds due to condensation or surface adsorption.
2.2 Volatile organic compound measurements
In this study we quantified a total of 46 VOCs using an Iodide High Resolution Time-of-Flight Chemical Ionization Mass Spectrometer (I-CIMS) and Vocus Proton Transfer Reaction Time-of-Flight Mass Spectrometer (Vocus PTR-MS) (Table S1 in the Supplement). These two measurement techniques provided complementary sensitivity to different chemical classes, together capturing a chemically diverse set of compounds representative of primary emissions from biomass combustion (as further discussed in Sect. S1 and illustrated in Fig. S1). Both instruments yield molecular formulae from high-resolution mass-to-charge ratio () detection. In the following, species are referred to by their molecular formula and also assigned to possible compounds based on a review of biomass burning studies, with details in Table S2. When comparing EFs to literature, reported EFs for all isomers for a given molecular formula are summed (e.g., for C10H16, the EF for all reported monoterpenes is summed). We acknowledge that differences between our study EFs and the literature EFs could be due to limitations in assigning measured by the mass spectrometers to specific VOC isomers, application of calibration factors for a specific VOC isomer to the signal at a given , or other interferences, such as from fragmentation (e.g., fragments contributing to C5H8–isoprene). The term total VOCs or ∑VOCs will be used to describe the sum of the 46 quantified VOCs. Low molecular weight compounds, such as methanol and formaldehyde, are not efficiently transmitted through the Vocus PTR-MS due to the influence of the big segmented quadrupole, while the selectivity of the ion chemistry limits the detection of small alkenes such as ethene and alkanes such as ethane and propane. These C1–C3 compounds are often found to contribute significantly to total biomass burning VOC emissions (Koss et al., 2018; Akagi et al., 2011; Urbanski, 2014; Hayden et al., 2022; Permar et al., 2021). In addition, common biomass burning species such as methyl furan, acrylonitrile, methyl guaiacol, pyrrole, and pyridines were detected by Vocus PTR-MS but not quantified (Koss et al., 2018; Akagi et al., 2011; Sekimoto et al., 2018; Romanias et al., 2024).
2.2.1 I-CIMS
The I-CIMS was used to measure 22 volatile organic compounds (organic acids, isocyanic acid, and hydrogen cyanide), as well as nitrous acid (HONO) (Table S1). The I-CIMS (Aerodyne Research Inc.) used in this study is a modified version of a previously described instrument (Hayden et al., 2022; Young et al., 2024). The radioactive 210Po ion source has been replaced by a vacuum ultraviolet ionization source (VUV-IS) (Ji et al., 2020; Riva et al., 2024), and the ion-molecule reaction (IMR) region and inlet have been redesigned (Young et al., 2024). During BBCan, the IMR was operated at 50 mbar and 35 °C. The I-CIMS sub-sampled (2450 sccm) perpendicular to a bypass line off the gas-phase inlet manifold (9.5 mm outer diameter PFA tubing) following dilution (2350 sccm of zero air). To minimize humidity effects, an additional 50 sccm flow of ultra-high-purity (UHP), 99.999 % N2 was directed through a room-temperature water bubbler and introduced directly to the IMR. The I-CIMS was operated at 1 Hz and had a mass resolution of ∼5000 .
Iodide reagent ions (I−) were generated by first passing a 250 sccm flow of UHP N2 over a permeation tube containing pure methyl iodide (CH3I) held at 40 °C, then benzene (C6H6) vapor was introduced to the CH3I N2 flow via a critical orifice above the headspace of a C6H6 reservoir at 70 °C before the CH3I C6H6 N2 flow passed through the VUV-IS and into the IMR. C6H6 serves as a VUV absorber to produce additional photoelectrons that promote I− generation (Ji et al., 2020).
Compounds were detected as iodide adducts (I ⋅ M)− (Ji et al., 2020; Riva et al., 2024), and the mass spectra were analyzed using Tofware (v4.0.0). The ion signal (IM, cps) for compound M was normalized to the sum of the reagent ion signals (I− and I ⋅ (H2O)−) and multiplied by 106 to yield the normalized ion signal (XM, ncps) as follows in Eq. (1).
I-CIMS calibrations were performed before and after the campaign to determine sensitivities (ncps ppbv−1) that were used to convert signal to mixing ratio; details of the calibration procedures are provided in Sect. S2.
2.2.2 Vocus PTR-MS
The Vocus PTR-MS (2R model, Aerodyne Research Inc.) was used to measure and quantify 24 VOCs (Table S1). The performance of this instrument model has been described elsewhere (Krechmer et al., 2018; Link et al., 2025). The drift tube was operated at 2.2 mbar and 60 °C. The axial voltages were 600 V (entry) and 20 V (exit), with the 450 V quadrupole amplitude voltage applied at a frequency of 1.3 MHz for a resulting E/N (reduced electric field) of ∼120 Td. During BBCan, the Vocus PTR-MS made 1 Hz measurements and had a mass resolution of ∼ 7000 .
A bypass pump sub-sampled ∼2500 sccm from the gas-phase inlet manifold (9.5 mm PFA tubing). The Vocus PTR-MS sub-sampled (∼100 sccm) perpendicular to the bypass flow through a short piece of polyether ether ketone tubing. The vapour from a permeation tube containing trichlorobenzene at room temperature was passively introduced to the bypass flow as a mass calibrant ( 182). Compounds were detected and quantified as protonated formulae (i.e., MH+) (De Gouw and Warneke, 2007), and mass spectra were analyzed using Tofware (v4.0.0). Unique peak lists were created for each fuel type, and sensitivities in cps ppbv−1 were applied to convert ion signals (cps) to mixing ratio (ppbv). Multi-point calibrations using a custom standard cylinder (Ionicon) were performed daily during the campaign, and additional calibrations were performed before and after the campaign (see Sect. S2 for further details).
2.3 Additional measurements
Several other gas-phase and particle-phase species were measured during the BBCan laboratory campaign, with instrumentation as described in the overview paper (Moraes et al., 2026). CO, CO2, and CH4 were quantified using cavity ring-down spectroscopy (Picarro G2401-m gas analyzer). A second Picarro G2401-m analyzer measured total gaseous carbon (TC, in units of ppmv C) after passing sample air through a catalyst to convert all gaseous carbon-containing species to CO2 (Hayden et al., 2022). Total non-methane organic compound (NMOC) in units of ppmv C was calculated by subtracting the CO, CO2, and CH4 measured by the first Picarro (i.e., instrument without the catalyst) from the TC measurements. In the manuscript, the term NMOC describes emissions in carbon units (i.e., NMOC EF in g C kg−1). To distinguish NMOC emissions in mass units (directly reported by other studies, or after converting NMOC from carbon to mass units), the term NMOCG (i.e., NMOCG EF in g kg−1) is used. Nitrogen oxides (NO and NO2) were measured separately using a Cavity Attenuated Phase Shift NOX analyzer (N500, Teledyne API) (Teledyne, 2025) and ammonia (NH3) was measured using an H2S NH3 analyzer (911-0039, ABB-LGR) (Los Gatos Research, 2025). EFs for CO, CO2, CH4, TC, NH3, NO, and NO2 are reported by Moraes et al. (2026). For peat with mulch, PM (dry) and peat with moss, PF (dry), direct CO2 measurements were associated with greater uncertainty because combustion was dominated by prolonged smoldering, during which CO2 concentrations frequently approached ambient background levels. Therefore, in Moraes et al. (2026), CO2 EFs were calculated using a carbon mass balance (CMB) approach, in which the measured carbon in CO, CH4, NMOC, elemental carbon (EC), and organic carbon (OC) was subtracted from the total fuel carbon. The CMB-based CO2 EFs for PM (dry) and PF (dry) were also used in the present study.
2.4 Biomass fuel samples
Six biomass fuel types were burned during the BBCan campaign: two peat fuels (PF, PM), mulch (MU), grass (GR), ponderosa pine needles (PN), and “surface material” (SM), which was composed of dead leaves, needles, and small branches (Moraes et al., 2026). Peat fuels included two subtypes: compacted peat with surface mulch (PM) and peat with surface moss (PF), with dimensions of roughly 254 × 508 × 508 mm. All peat and mulch samples were collected from the Pelican Mountain Research Site in Alberta, Canada, which is a bog and fen-type ecosystem dominated by black spruce (Picea mariana) (Thompson et al., 2020; Moore et al., 2020). Peat with moss was collected from the natural forest floor to represent peat with minimal anthropogenic disturbance, while peat with mulch was collected from the floor of open areas to represent areas that have been harvested or treated by humans. GR (Elymus trachycaulus and Bromus inermis) and SM were collected near Edmonton, Alberta and include species common to the Canadian Prairies. Ponderosa pine needles were sourced from Kamloops, British Columbia. PN is not considered a boreal fuel, but was included due to its abundance in Western North America and its well-documented combustion and emission characteristics, making it a valuable reference biomass (Burling et al., 2010; Chen et al., 2007).
Moisture content and elemental composition of the studied fuel types were determined according to methods described in Sect. S3 and are listed in Table 1, along with their assignment to Canadian Forest Fire Behavior Prediction System (FBP) fuel types, which are used in CFFEPS (Chen et al., 2019; Natural Resources Canada, 2025b). The experiments focused primarily on samples that had been subjected to drying prior to combustion; such samples are labelled as “dry” and include all fuel types with the exception of PN. PN is labelled as “wet” since it was not dried prior to burning, but its natural moisture content was relatively low (∼13 %), similar to the dry samples, and so it is included in discussions with the dried, “low moisture-content” fuels. To study the influence of moisture content on emissions, experiments were also performed on a subset of samples (PM, PF, MU) left in their natural state, and these samples are labelled as “wet”. MU (wet) also had a low moisture content (∼7 %), but it is considered with the wet fuels because it can be contrasted to the dried sample, MU (dry) (∼4 %). The PF (wet) samples had high moisture content (top 5 cm ∼30 %, bottom 5 cm ∼110 %, overall ∼51 %), which resulted in a short smoldering period with a large amount of unburnt fuel, and only one sample was burnt. The PM (wet) samples (top 5 cm ∼50 %, bottom 5 cm > 200 %, overall ∼100 %) did not sustain combustion beyond a short flaming period. Although the high moisture content of natural peat fuels provides resistance to combustion, smoldering of peat fuels can occur in high-intensity wildfires when heat from the combustion of surrounding fuels facilitates drying in advance of the wildfire front (Watson et al., 2019; Hu et al., 2018). Furthermore, under experimental fires with high-intensity fire conditions, despite patches of high peat surface moisture, the upper 1–2 cm of moss and/or peat fuel is observed as being combusted during the main fire front passage without further self-sustaining smouldering (Wilkinson et al., 2018). This externally driven peat combustion is due to the large, directed heat pulse from the large flaming front to the peat surface (Thompson et al., 2015).
Table 1Fuel properties and emission factors.
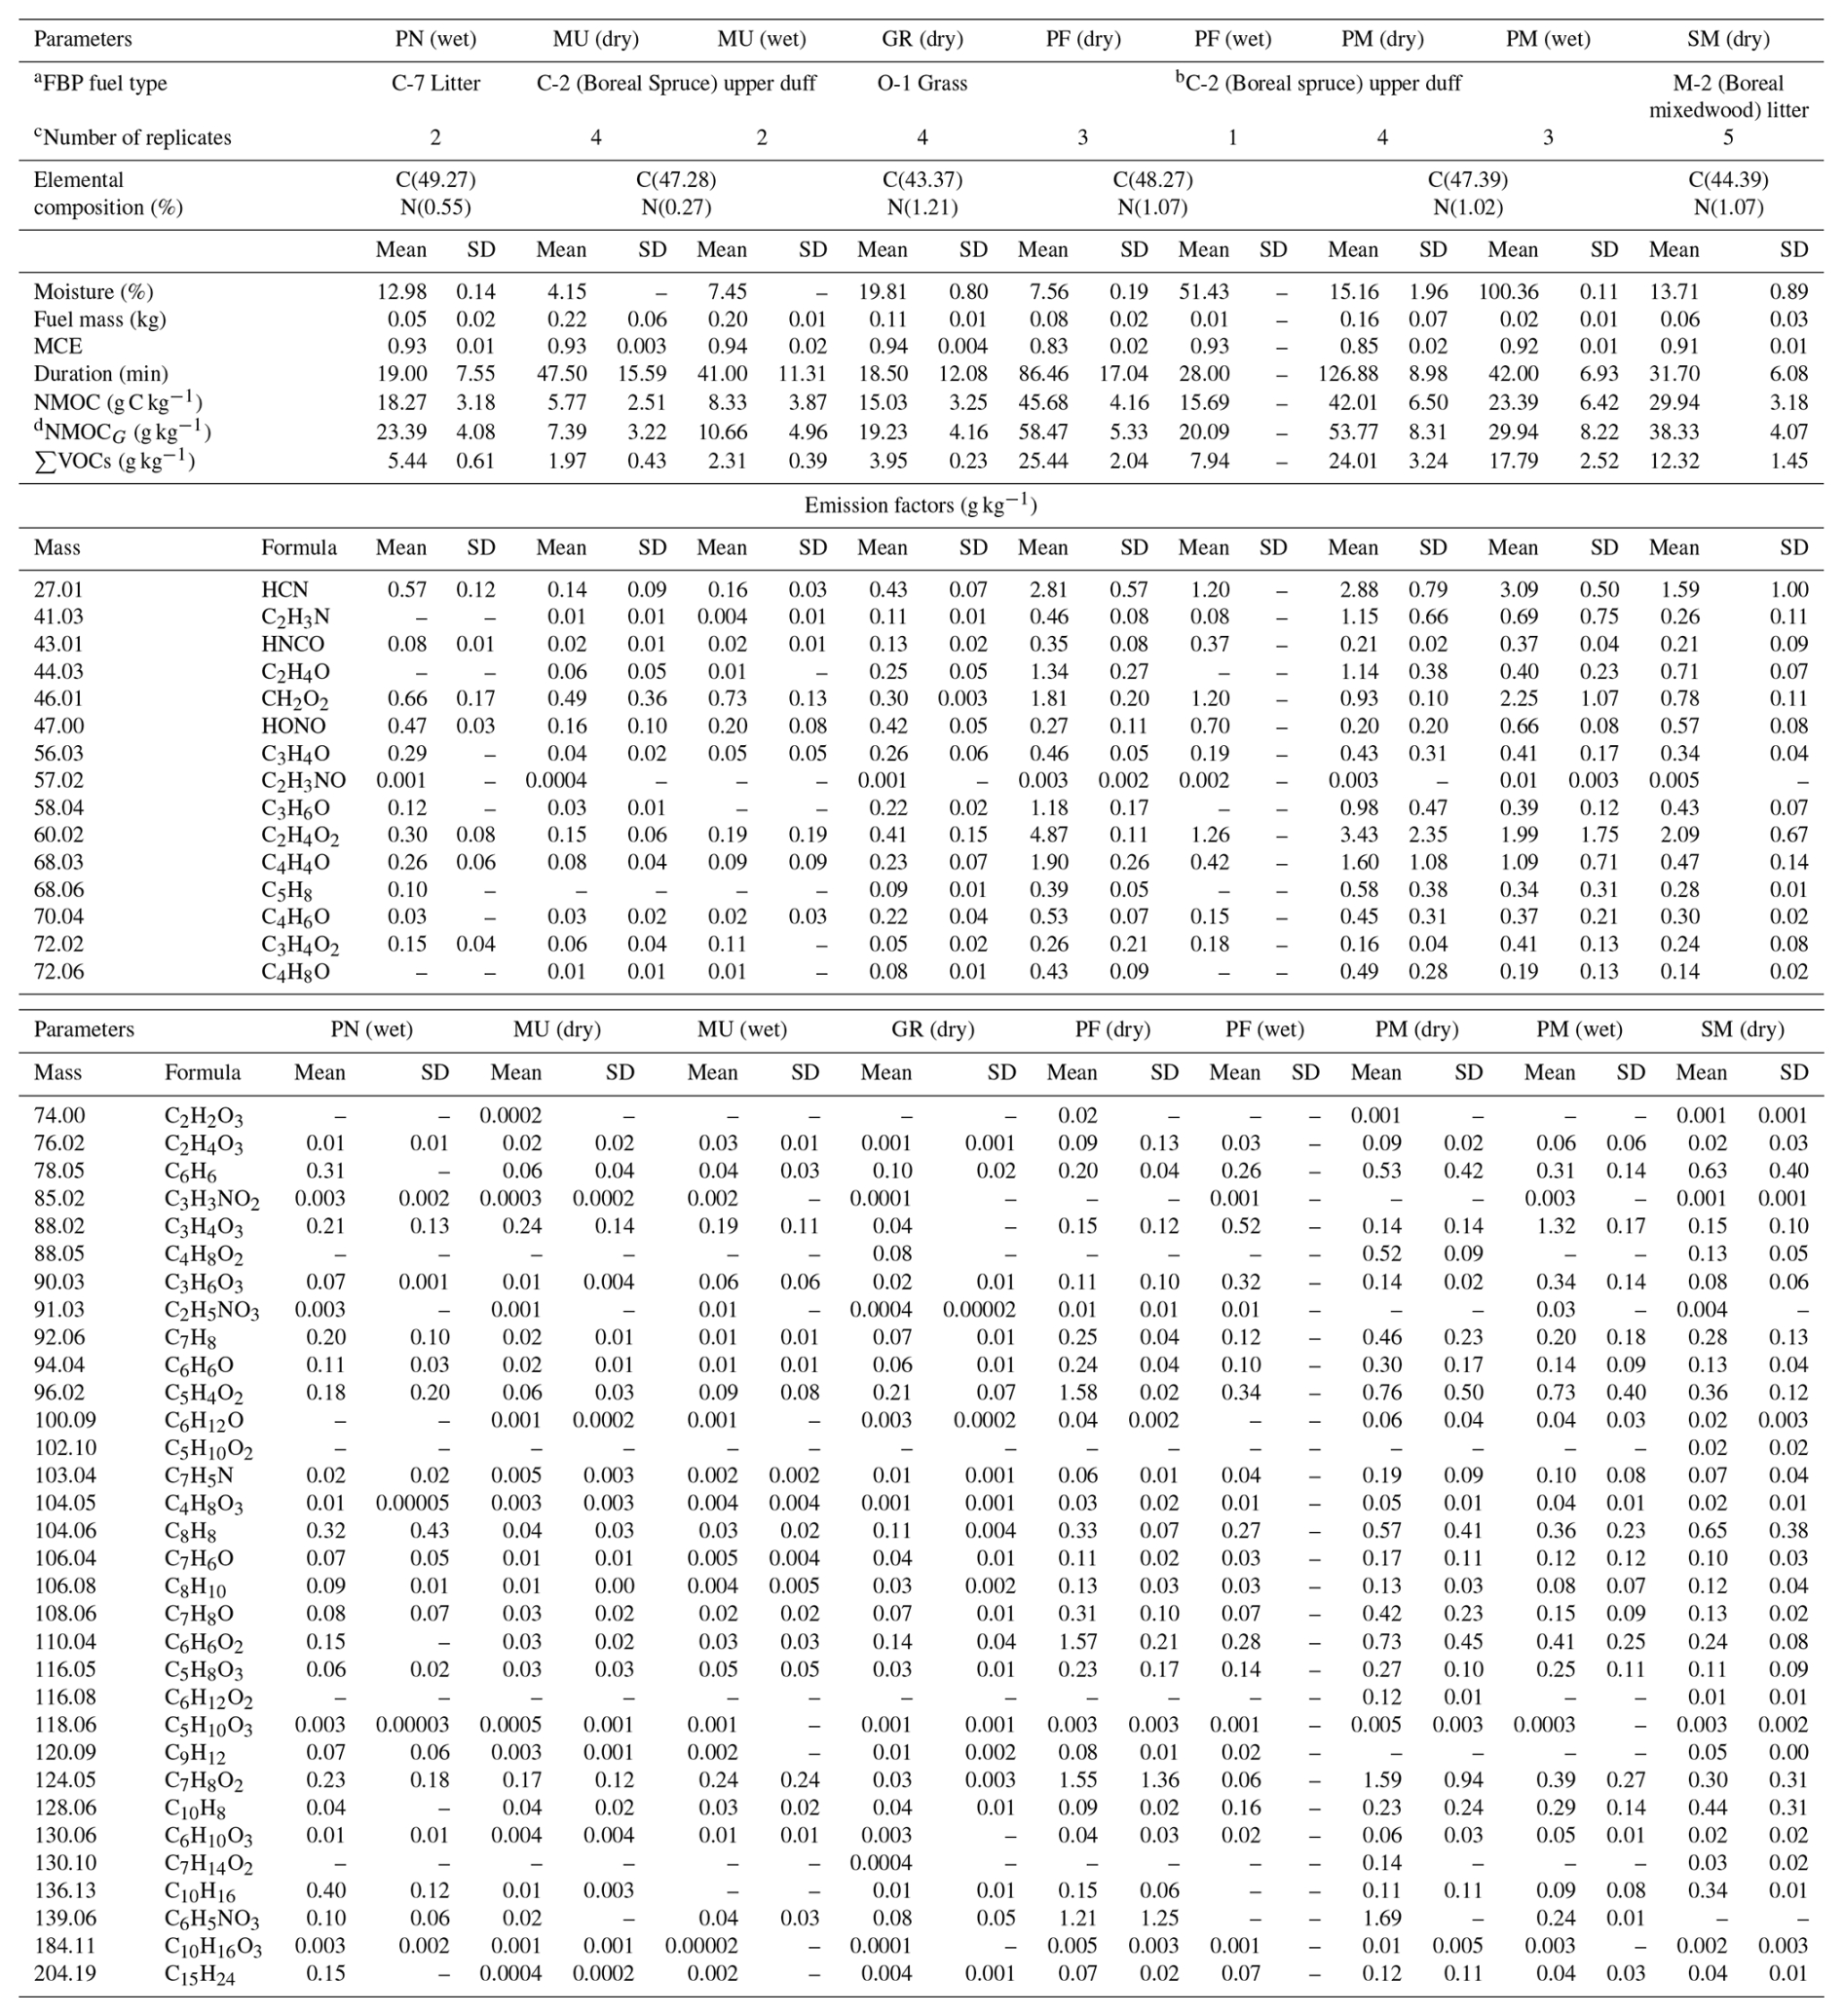
a Corresponding Canadian Forest FBP System fuel type used in CFFEPS. b Peat is not explicitly considered to be duff, however, it is analogous to duff and falls under this FBP fuel type. c Sample numbers varied among the I-CIMS, Vocus PTR-MS, and Picarro G2401-m measurements; therefore, the reported values represent the maximum number of samples available for each fuel across the three instruments. d NMOCG (g kg−1) was estimated by applying a 28 % increase to the NMOC values following the conversion proposed by Hayden et al. (2022).
2.5 Emission factors, emission ratios, and modified combustion efficiency
EF and ER were derived for quantified VOCs and other trace gases. EF, expressed in g emitted per kg of dry fuel consumption were calculated following the methodology described by Moraes et al. (2026) (Andreae, 2019; Hu et al., 2019).
Briefly, the EF for species X (EFX) was calculated following Eq. (2):
where ΔX(t) (ppbv) is the background-corrected mixing ratio of species X at time t, MWX (g mol−1) is the molecular weight of species X, Vair (m3 mol−1) is the molar volume of air at standard temperature and pressure, Qduct (t) (m3 s−1) is the volumetric flow rate of the duct at time t, and TFC (kg, dry fuel) is the total fuel consumption. TFC was calculated from real-time weight measurements for each burn, corrected for moisture content as detailed extensively in the overview paper (Moraes et al., 2026). The integral is calculated from ignition (initial t, ti) to extinction (final t, tf) for overall (i.e., entire burn) EFs. This direct-flow approach is well suited to the controlled laboratory setup because both fuel consumption and exhaust flow were measured directly during each burn. The system used an overhead exhaust hood, controlled duct flow, a static mixer, and downstream sampling ports to promote complete smoke capture and well-mixed sampling; further details and validation of the hood–duct system are provided in Moraes et al. (2026). In comparison, the CMB approach is useful when exhaust flow or fuel consumption cannot be measured directly, but depends on accurate fuel carbon content and adequate measurement of the major carbon-containing emissions.
The ER of a pollutant is also commonly expressed relative to a co-emitted, relatively inert species such as CO or CO2 (Akagi et al., 2011; Andreae, 2019). When direct fuel consumption measurements are not feasible, EF (g kg−1) can be derived from ER using the CMB approach (Koss et al., 2018; Akagi et al., 2011; Andreae, 2019; Selimovic et al., 2019; Ward and Radke, 1993). The choice of reference gas is critical, as CO2 predominantly reflects efficient flaming combustion, while CO is characteristic of incomplete, smoldering combustion (Gilman et al., 2015). CO is typically selected due to its long atmospheric lifetime (1–4 months) (Hayden et al., 2022; Seinfeld and Pandis, 2016) and its strong correlation with a wide range of emitted gases (Koss et al., 2018; Gilman et al., 2015; Liu et al., 2017b; Koppmann et al., 2005).
Accordingly, the ERX for species X was determined using Eq. (3):
where EFCO and MWCO are the EF and molecular weights of CO, respectively. The ERs are provided (Table S3) to facilitate comparison with prior studies and so that they may be incorporated into atmospheric models. However, the discussion below focuses only on the derived EFs.
Biomass burning emissions vary significantly between combustion processes such as flaming and smoldering (Gilman et al., 2015; Selimovic et al., 2019; Majluf et al., 2022). Modified combustion efficiency (MCE) is often used to describe the relative contributions of flaming and smoldering combustion, as defined by Eq. (4) (Yokelson et al., 2013; Akagi et al., 2011; Yokelson et al., 1996; Hu et al., 2019; Ward and Radke, 1993):
where ΔCO2 and ΔCO denote the background-corrected mixing ratios of CO2 and CO, respectively. MCE values ∼ 0.99 are representative of pure flaming combustion while MCE ∼ 0.80 are representative of pure smoldering combustion (Akagi et al., 2011; Urbanski et al., 2022; Yokelson et al., 1997). To assess the variability of emissions across combustion phases, EF and ER were determined separately for the flaming and smoldering phases using MCE to determine the transition time (tt). In this study, MCE values ≥ 0.90 were designated as indicative of flaming combustion, and tt was defined as the time when the instantaneous MCE first dropped below 0.90 and then remained below that threshold for at least 3 consecutive minutes (Akagi et al., 2011; Liu et al., 2017b). The flaming-phase and smoldering-phase EF were calculated using Eq. (2), substituting the appropriate bounds of integration (i.e., ti to tt for flaming, and tt to tf for smoldering). Similarly, overall (commonly referred to as fire-integrated) as well as combustion-phase resolved MCE were calculated by integrating Eq. (4) over the appropriate bounds of integration.
While we did not perform wall-loss and partitioning delay analysis, it is worth noting that they may influence the observed time series and bias phase-resolved EF estimates (De Gouw and Warneke, 2007; Pagonis et al., 2017). For instance, lower-volatility “sticky” VOCs may exhibit partitioning delays. Lower-volatility species are typically emitted during the low-temperature combustion associated with smouldering combustion (Sekimoto et al., 2018). However, if they are emitted during the flaming-phase, partitioning delays may lead to an apparent reduction in flaming-phase EFs and a corresponding enhancement of smoldering-phase EFs. These effects are unlikely to alter overall EF, but we acknowledge they may influence the relative magnitude of phase-resolved EFs for a small number of VOCs in this study (e.g., C7H8O2). Gas-particle partitioning (i.e., condensation of organic vapors with decreasing temperature in the duct or evaporation of primary organic aerosol due to dilution in the duct) may also impact the observed EFs (May et al., 2013; Pagonis et al., 2023; Selimovic et al., 2019). Indeed, concurrent measurements of particle number size distributions using a scanning mobility particle sizer (Moraes et al., 2026) show shifts to smaller geometric mean diameters for denuded vs. undenuded particles, suggesting that smoke particles contain a non-volatile solid core coated with semi-volatile organics. Nonetheless, the majority of species quantified in this paper are high-volatility organic compounds and therefore expected to be present in the gas-phase only. It is possible that the measured EFs for a small number of lower-volatility species quantified here (e.g., C7H8O2, C6H5NO3) or the total NMOC could be impacted by volatilization or condensation. However, a detailed analysis is beyond the scope of this paper. Gas-particle partitioning may also explain differences between our laboratory results and other studies, particularly aircraft studies, which sample at different temperatures and organic aerosol mass loadings (Permar et al., 2021; Selimovic et al., 2019).
EFs and ERs in the tables and text are presented as mean values ± standard deviation. The largest sources of uncertainty are the variance between tests (on average the relative standard deviation is > 50 %), the uncertainty in the flow rate in the exhaust duct (±12.2 %) (Moraes et al., 2026), and the uncertainty in the sensitivities used to convert signal to mixing ratio, which are estimated to range from 20 %–30 % depending on the species and the calibration method.
3.1 Temporal emission profiles
Figure 1 illustrates high-resolution (1 s) temporal profiles of key combustion parameters (fuel mass, air temperature at the fuel surface, and MCE) and background-subtracted mixing ratios of CO, CO2, and selected VOC (CH2O2, C5H4O2, C2H4O2, and HCN) for a representative laboratory burn of PF (dry). Upon ignition, the fuel burns by flaming combustion and the mixing ratios of CO2 and CO (panel b) increase sharply along with temperature, indicative of high-temperature pyrolysis. The MCE during this period of flaming combustion (panel 1a, yellow shaded area) reaches a mean of 0.90, reflecting efficient oxidation. After a short flaming phase, the CO2 and CO mixing ratios decrease rapidly, the MCE drops below 0.90, and the fire transitions into a prolonged smoldering phase. The smoldering phase is characterized by broader, delayed emission of CO and other incomplete combustion products (e.g., such as the VOC displayed in panel c) and lower temperatures (i.e., low-temperature pyrolysis), with temporal profiles similar to those observed in biomass burning studies (Burling et al., 2010; Akagi et al., 2011; Andreae, 2019; Stockwell et al., 2016). The MCE decreases accordingly, to a final fire-integrated value of 0.75. The fuel mass (panel a) decreases rapidly during the flaming stage and more slowly during the low-temperature smoldering phase. As the fuel is consumed and the combustion progresses towards extinction, mixing ratios (i.e., emissions) of CO and VOC decrease, temperature decreases, fuel consumption slows, and the MCE values become increasingly erratic due to low mixing ratios of CO2 and CO. As illustrated by panel c, the VOC temporal profiles are generally correlated with the CO temporal profile, supporting the use of ERs (Gilman et al., 2015; Majluf et al., 2022).
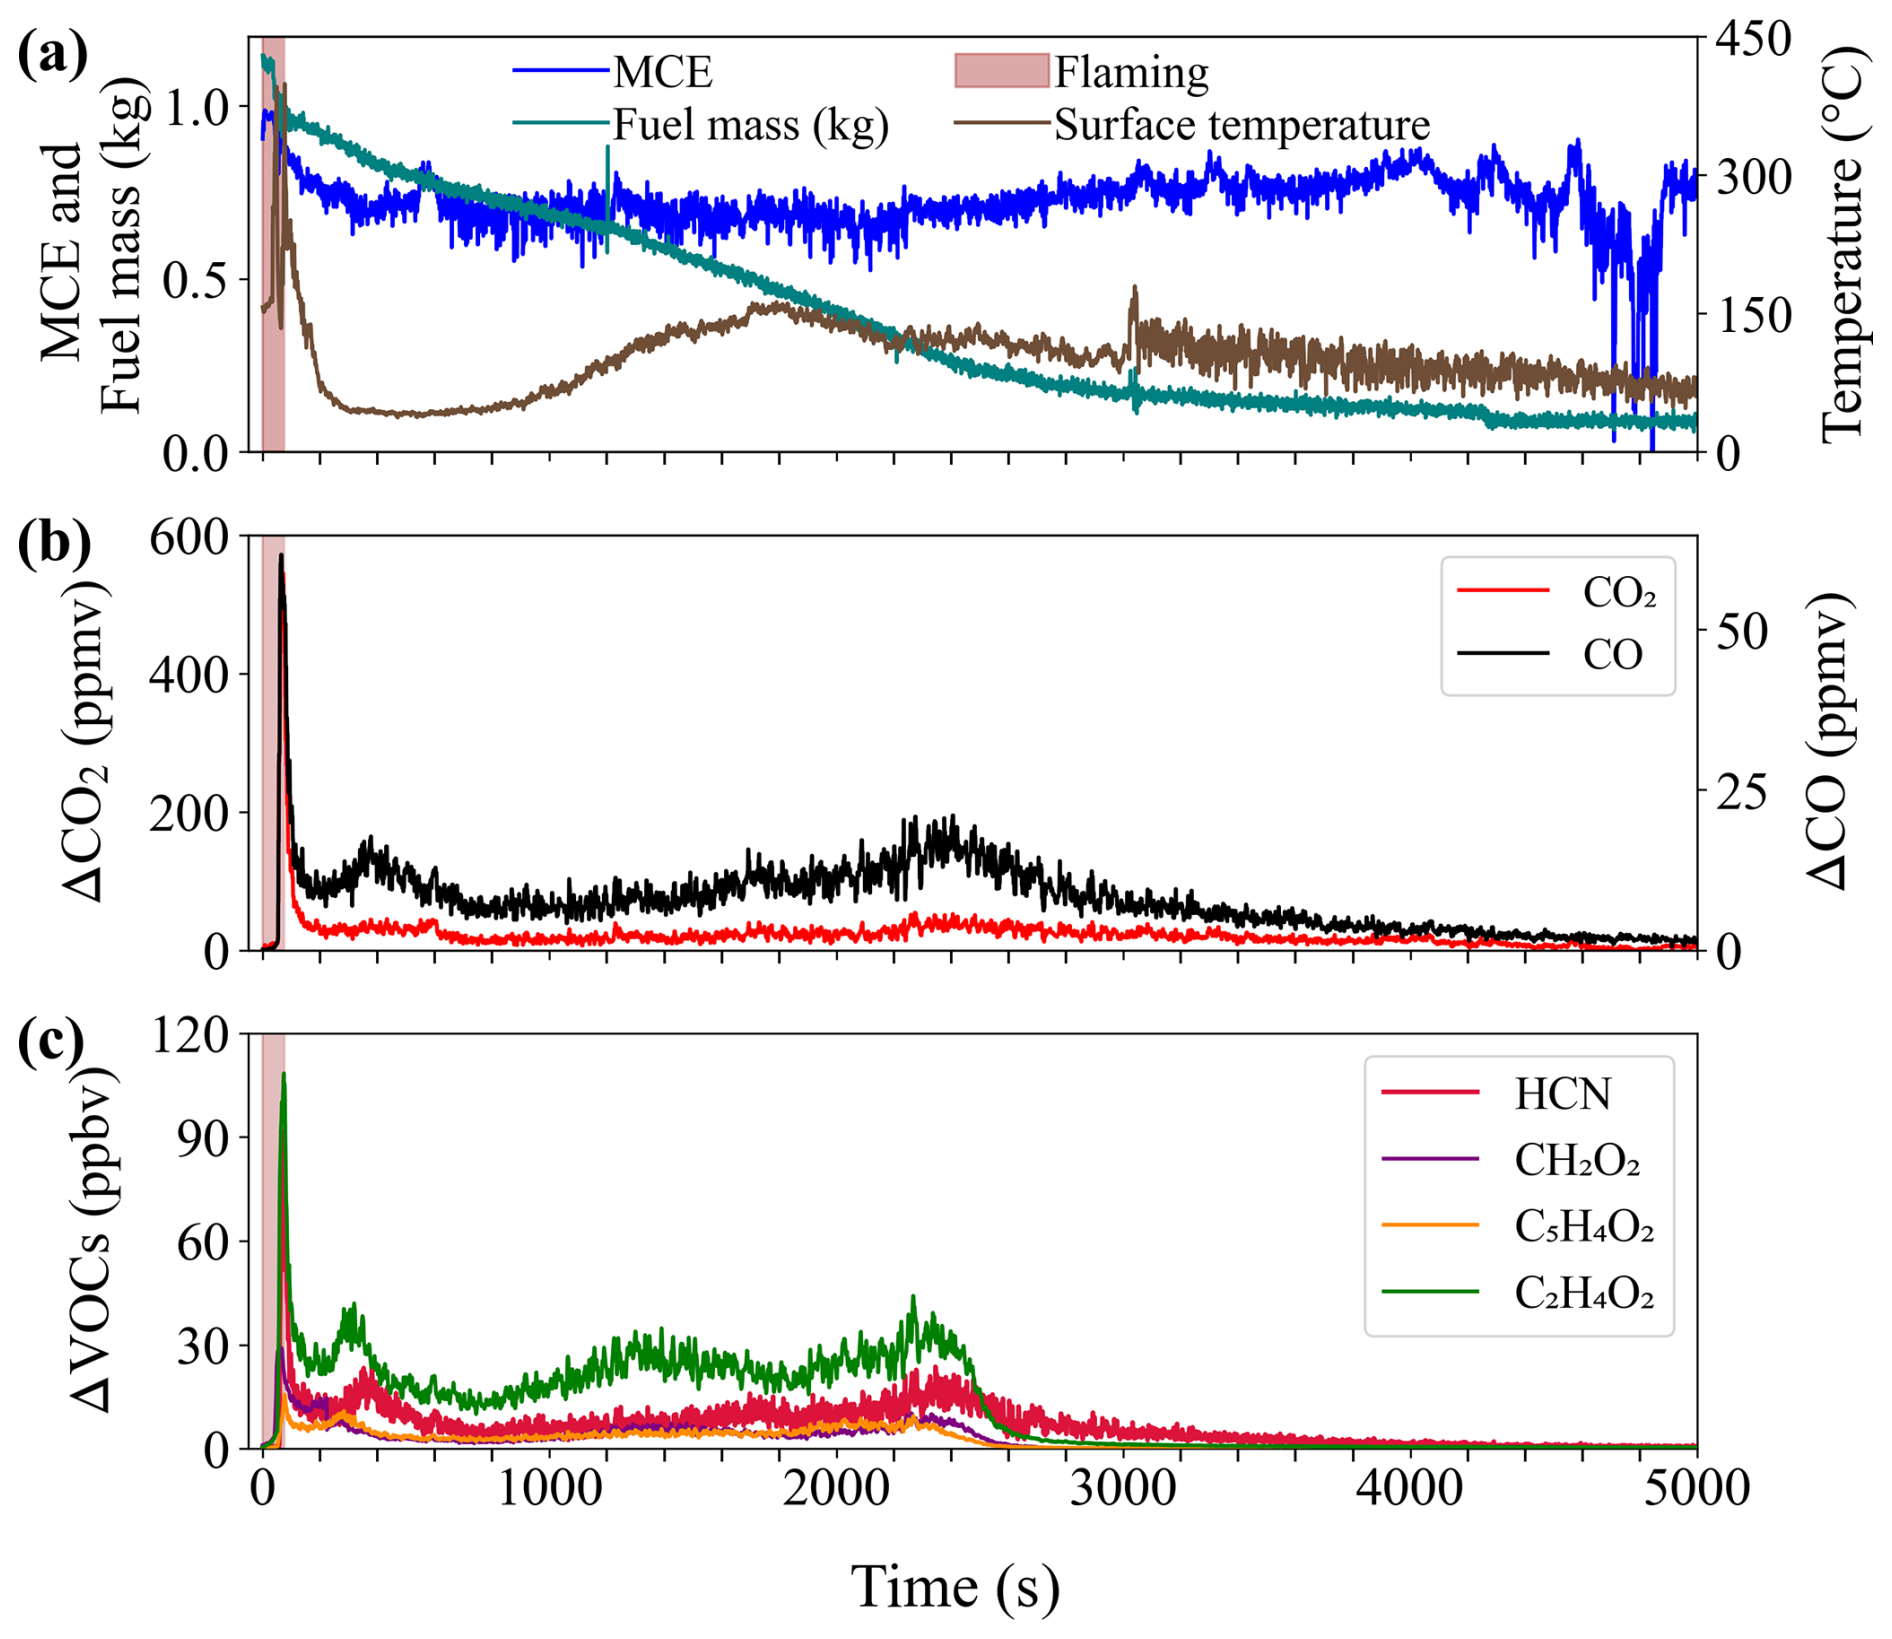
Figure 1Temporal emission profiles from a representative laboratory burn of PF (dry): (a) MCE (blue), fuel mass in kg (teal), and air temperature at the fuel surface in °C (brown); the flaming phase is indicated by the shaded (yellow) region, and the subsequent smoldering phase is colorless. (b) Background-subtracted mixing ratios (ppmv) of CO2 (red) and CO (black). (c) Background-subtracted mixing ratios of VOCs (ppbv), including HCN (crimson), CH2O2 (purple), C5H4O2 (orange), and C2H4O2 (green) measured by Vocus PTR-MS and I-CIMS.
3.2 Overview of trace gas emission factors
Mean overall EFs (g kg−1) (± standard deviation) for the 46 quantified VOCs and HONO are listed for each biomass type in Table 1, along with mean NMOC EF and ∑VOCs EF. The mean flaming-phase and smoldering-phase EFs are provided in Table S2. The mean overall and combustion-phase resolved ERs (ppbv VOC/ppmv CO) are listed in Table S3. The quantified VOC species cover several important compound classes, including oxygenates, furanoids, phenolic compounds, terpenoids, aromatics, and nitrogen-containing species, which are consistently reported among the dominant contributors to wildfire VOC emissions (Hayden et al., 2022; Simpson et al., 2011). Figure 2 presents mean overall EF (g kg−1) for a subset of 22 VOCs along with HONO for the studied biomass types and moisture conditions (colored points), together with reported ranges (orange bars) from literature sources, which include emission inventories for “Peatlands” (Binte Shahid et al., 2024) and “Boreal Forest” (Akagi et al., 2011; Andreae, 2019; Binte Shahid et al., 2024; Urbanski, 2014), aircraft measurements (Hayden et al., 2022; Simpson et al., 2011; Permar et al., 2021), and a recent laboratory study (Koss et al., 2018).
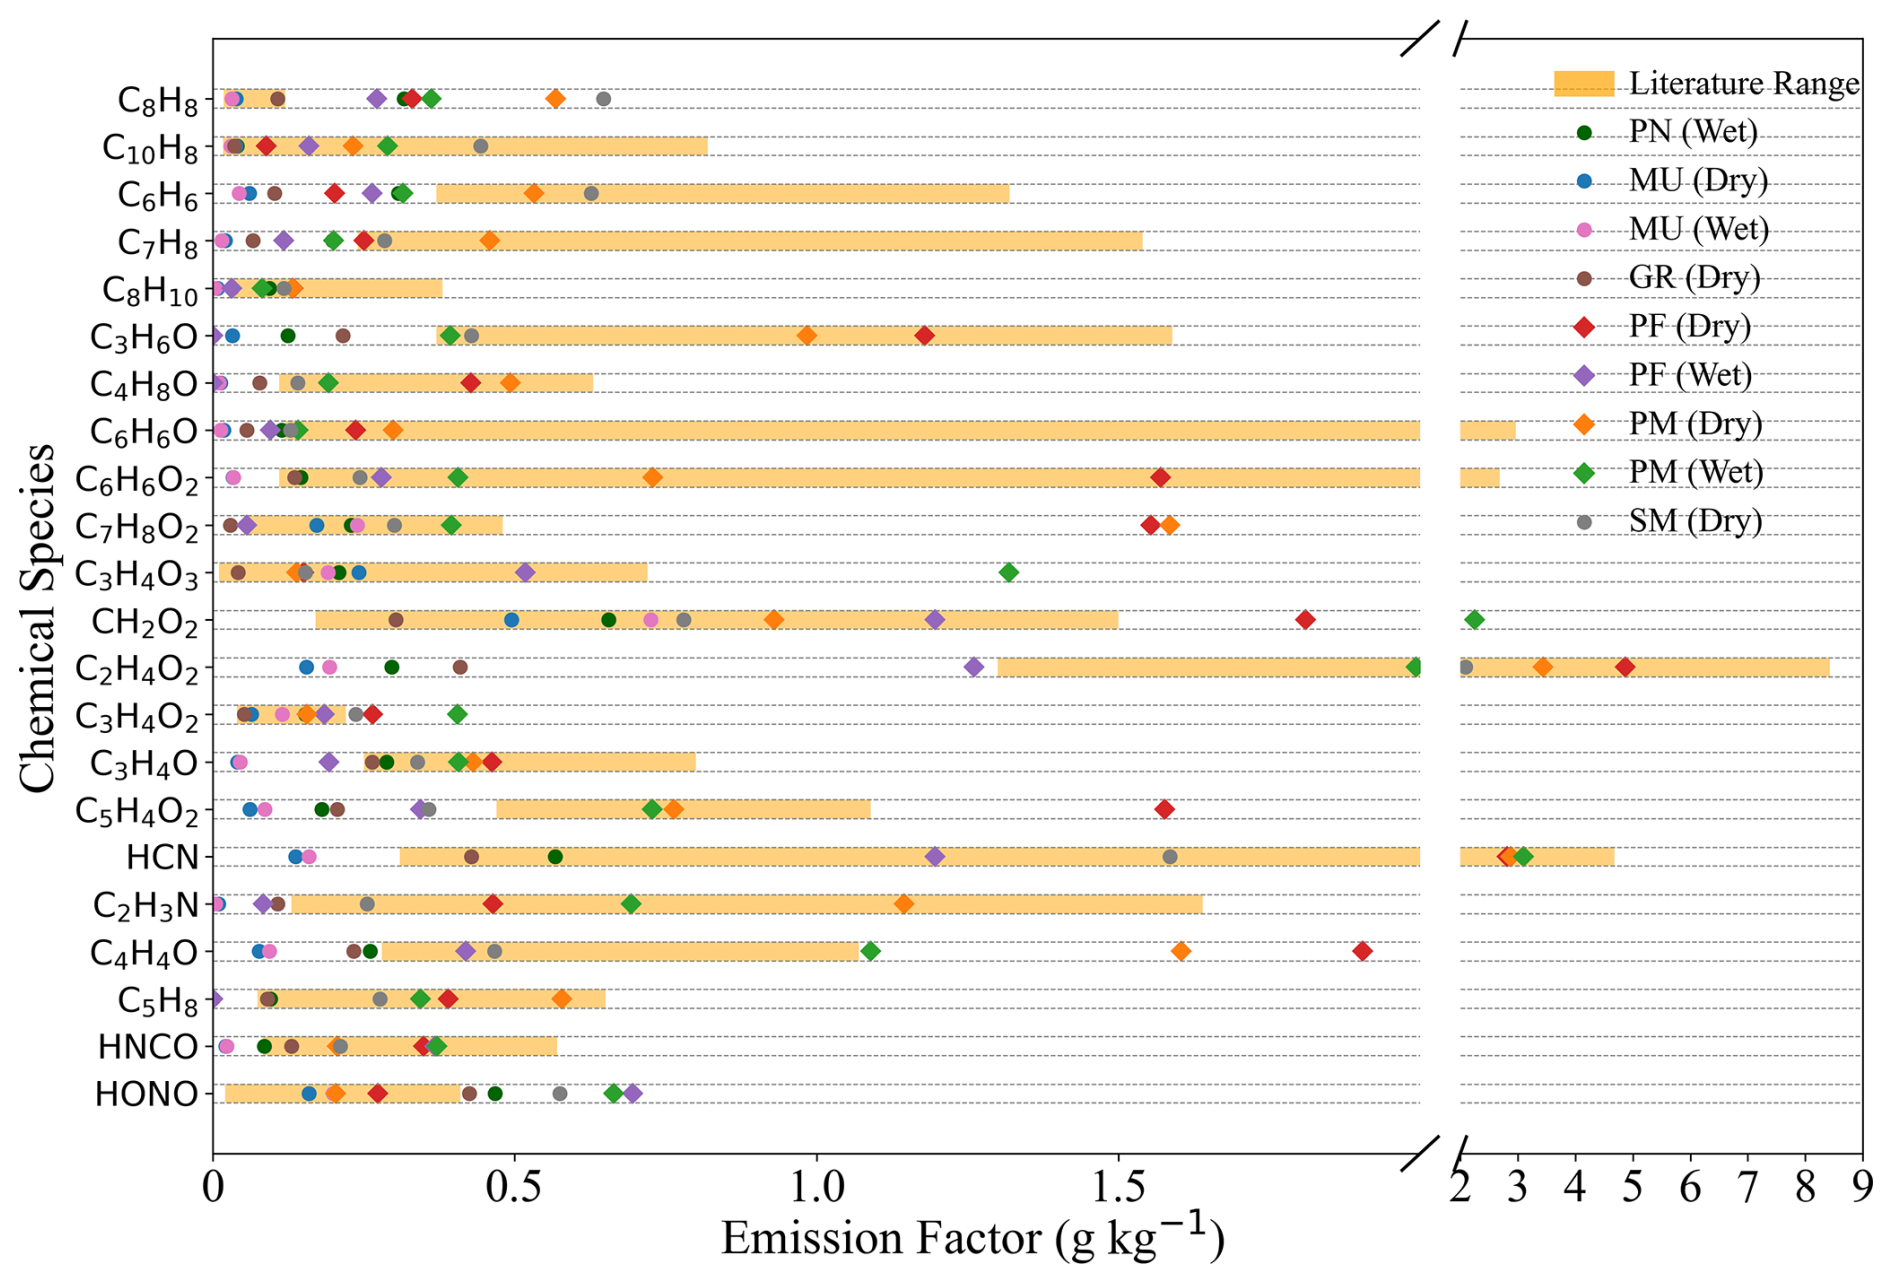
Figure 2Mean EF (g kg−1) of individual VOCs from biomass fuel types (PN, MU, GR, PF, PM, and SM, under wet and dry conditions; colored symbols) compared to literature EF ranges (orange bars). Literature used for the comparison include laboratory, field studies and emission inventories for Boreal Forests and Peatlands (Koss et al., 2018; Akagi et al., 2011; Andreae, 2019; Binte Shahid et al., 2024; Urbanski, 2014; Hayden et al., 2022; Simpson et al., 2011; Permar et al., 2021), as listed in Table S4. The peat fuels (PM, PF) are represented as diamonds for emphasis, and the remaining fuels are represented as circles.
As demonstrated by Figs. 2 and S2, the VOC emission magnitudes and emission profile (relative emissions) vary considerably by fuel type and moisture content. We find that CHO compounds dominate emissions across all fuel types, with contributions to the ∑VOCs EF ranging from 51 % to 78 %, consistent with the high contributions of CHO reported in the literature (Koss et al., 2016; Gilman et al., 2015; Permar et al., 2021), and also due to the high selectivity of the Vocus PTR-MS and I-CIMS to oxygenates. CHO compounds such as CH2O2 (formic acid), C2H4O2 (acetic acid, with smaller contributions from glycolaldehyde), C5H4O2 (furfural), and C4H4O (furan) consistently rank among the most abundant species for all studied fuel types, underscoring their widespread presence in biomass burning emissions. C2H4O2 (acetic acid, glycoaldehyde) is the largest contributor to the ∑VOCs EF for the dry peat fuels and SM (dry), with the highest EF for PF (dry) at 4.87 ± 0.11 g kg−1, followed by PM (dry) (3.43 ± 2.35 g kg−1). CH2O2 (formic acid) is the largest contributor to ∑VOCs EF for MU (dry and wet) and also ranks above C2H4O2 (acetic acid) for PN (wet) and PM (wet). The highest CH2O2 (formic acid) EF across all biomass types and moisture conditions is observed for PM (wet) (2.25 ± 1.07 g kg−1). The wet peat fuels also have higher relative contributions from C3H4O3 (pyruvic acid) and C3H4O2 (acrylic acid) compared to their dry counterparts. Other dominant oxygenates across fuels include C2H4O (acetaldehyde), C3H6O (acetone, with possible contributions from propanal), and phenolic compounds such as C6H6O2 (methylfurfural, benzenediols such as catechol and resorcinol) and C7H8O2 (guaiacol and isomers). PN and SM emit a greater proportion of CH compounds (28 % and 22% of ∑VOCs EF, respectively) compared to other fuel types, with high contributions from aromatics, C10H8 (naphthalene), and C8H8 (styrene). C10H16 (monoterpene) EFs are highest for PN (wet) (0.40 ± 0.12 g kg−1), SM (dry) (0.34 ± 0.01 g kg−1), and PF (dry) (0.15 ± 0.06 g kg−1), and ≤0.1 g kg−1 for all other fuels. The relative contribution of C6H6 (benzene), C8H8 (styrene), and C10H8 (naphthalene) to ∑VOCs EF is also enhanced for the wet peat fuels. With respect to nitrogen-containing VOC, we observe significant emissions of HCN (hydrogen cyanide) and C2H3N (acetonitrile) across all fuels, although the CHN class is most prominent for the wet and dry peat fuels, with PM (wet) showing the highest CHN contribution (21 % of ∑VOCs EF). Emissions of Nr are discussed in greater detail in Sect. 3.5.
The mean EFs from this study generally fall within reported ranges. However, as illustrated by Fig. 2, there are several VOC for which measured EF fall below the literature range, particularly for non-peat fuels. On the other hand, VOC EF for peat fuels (PF, PM) are at the high end, and in some cases exceeding the literature range for several VOC, including CH2O2 (formic acid), C4H4O (furan), C5H4O2 (furfural), and C7H8O2 (guaiacol and isomers). High emissions of guaiacol are a result of low-temperature pyrolysis (Sekimoto et al., 2018), which is often associated with the smoldering phase, although the correspondence is not exact. It should be noted that the literature EF for guaiacol in Fig. 2 is limited to three studies (Koss et al., 2018; Hayden et al., 2022; Permar et al., 2021), none of which are laboratory studies of peat or organic soil combustion. High EF for peat fuels are consistent with their low MCE, as described below. Another exception is styrene (C8H8), for which we observe systematically higher EF than reported for all fuels except MU and GR.
3.3 Total non-methane organic compound (NMOC) emissions
Figure 3a and b show the contribution of CO2, CO, CH4, and NMOC to the total gaseous carbon (TC) emissions for each fuel type in absolute terms (g C kg−1) and as percentage contributions, respectively. The mean fire-integrated MCE values are shown for each biomass type in Fig. 3c, with the low moisture-content fuels displayed on the left (brown), and the “wet” PM, PF, and MU fuels on the right (yellow). Figure 3d shows the contribution of the total quantified VOCs (∑VOCs; solid brown and yellow; also expressed in g C kg−1 of fuel) to the total measured NMOC EF for each fuel type, with the percent contribution of ∑VOCs to NMOC displayed at the top of each bar. The quantified ∑VOCs constituted 13 %–40 % of total NMOC on a carbon basis, with the highest quantified contribution for the peat fuels (PM and PF) and PN, and the lowest for GR and MU. A substantial unquantified NMOC fraction is expected because only 46 species were quantified by the Vocus PTR-MS and I-CIMS. This fraction may include I/SVOCs, which can contribute from > 5 % to almost 40 % depending on fuel type and the definition of I/SVOC (Yokelson et al., 2013; Hayden et al., 2022; Hatch et al., 2018). It is also expected to include low-molecular-weight VOCs and detected but unquantified compounds described in Sect. 2.2. For context, Simpson et al. (2011) reported that C1–C2 NMOCs accounted for approximately 41 % of measured NMOC carbon in fresh Canadian boreal wildfire plumes. Permar et al. (2021) also found that the top 10 most abundant VOCs were C1–C3 NMOC (acetic acid/glycoaldehyde, formaldehyde, acetaldehyde, methanol, formic acid, ethane, acetone/propanal, propene, hydroxyacetone), accounting for ∼ 53 % of total measured VOC mass emitted. Therefore, the quantified ∑VOCs should be interpreted as a subset of total NMOC rather than total VOC emissions.
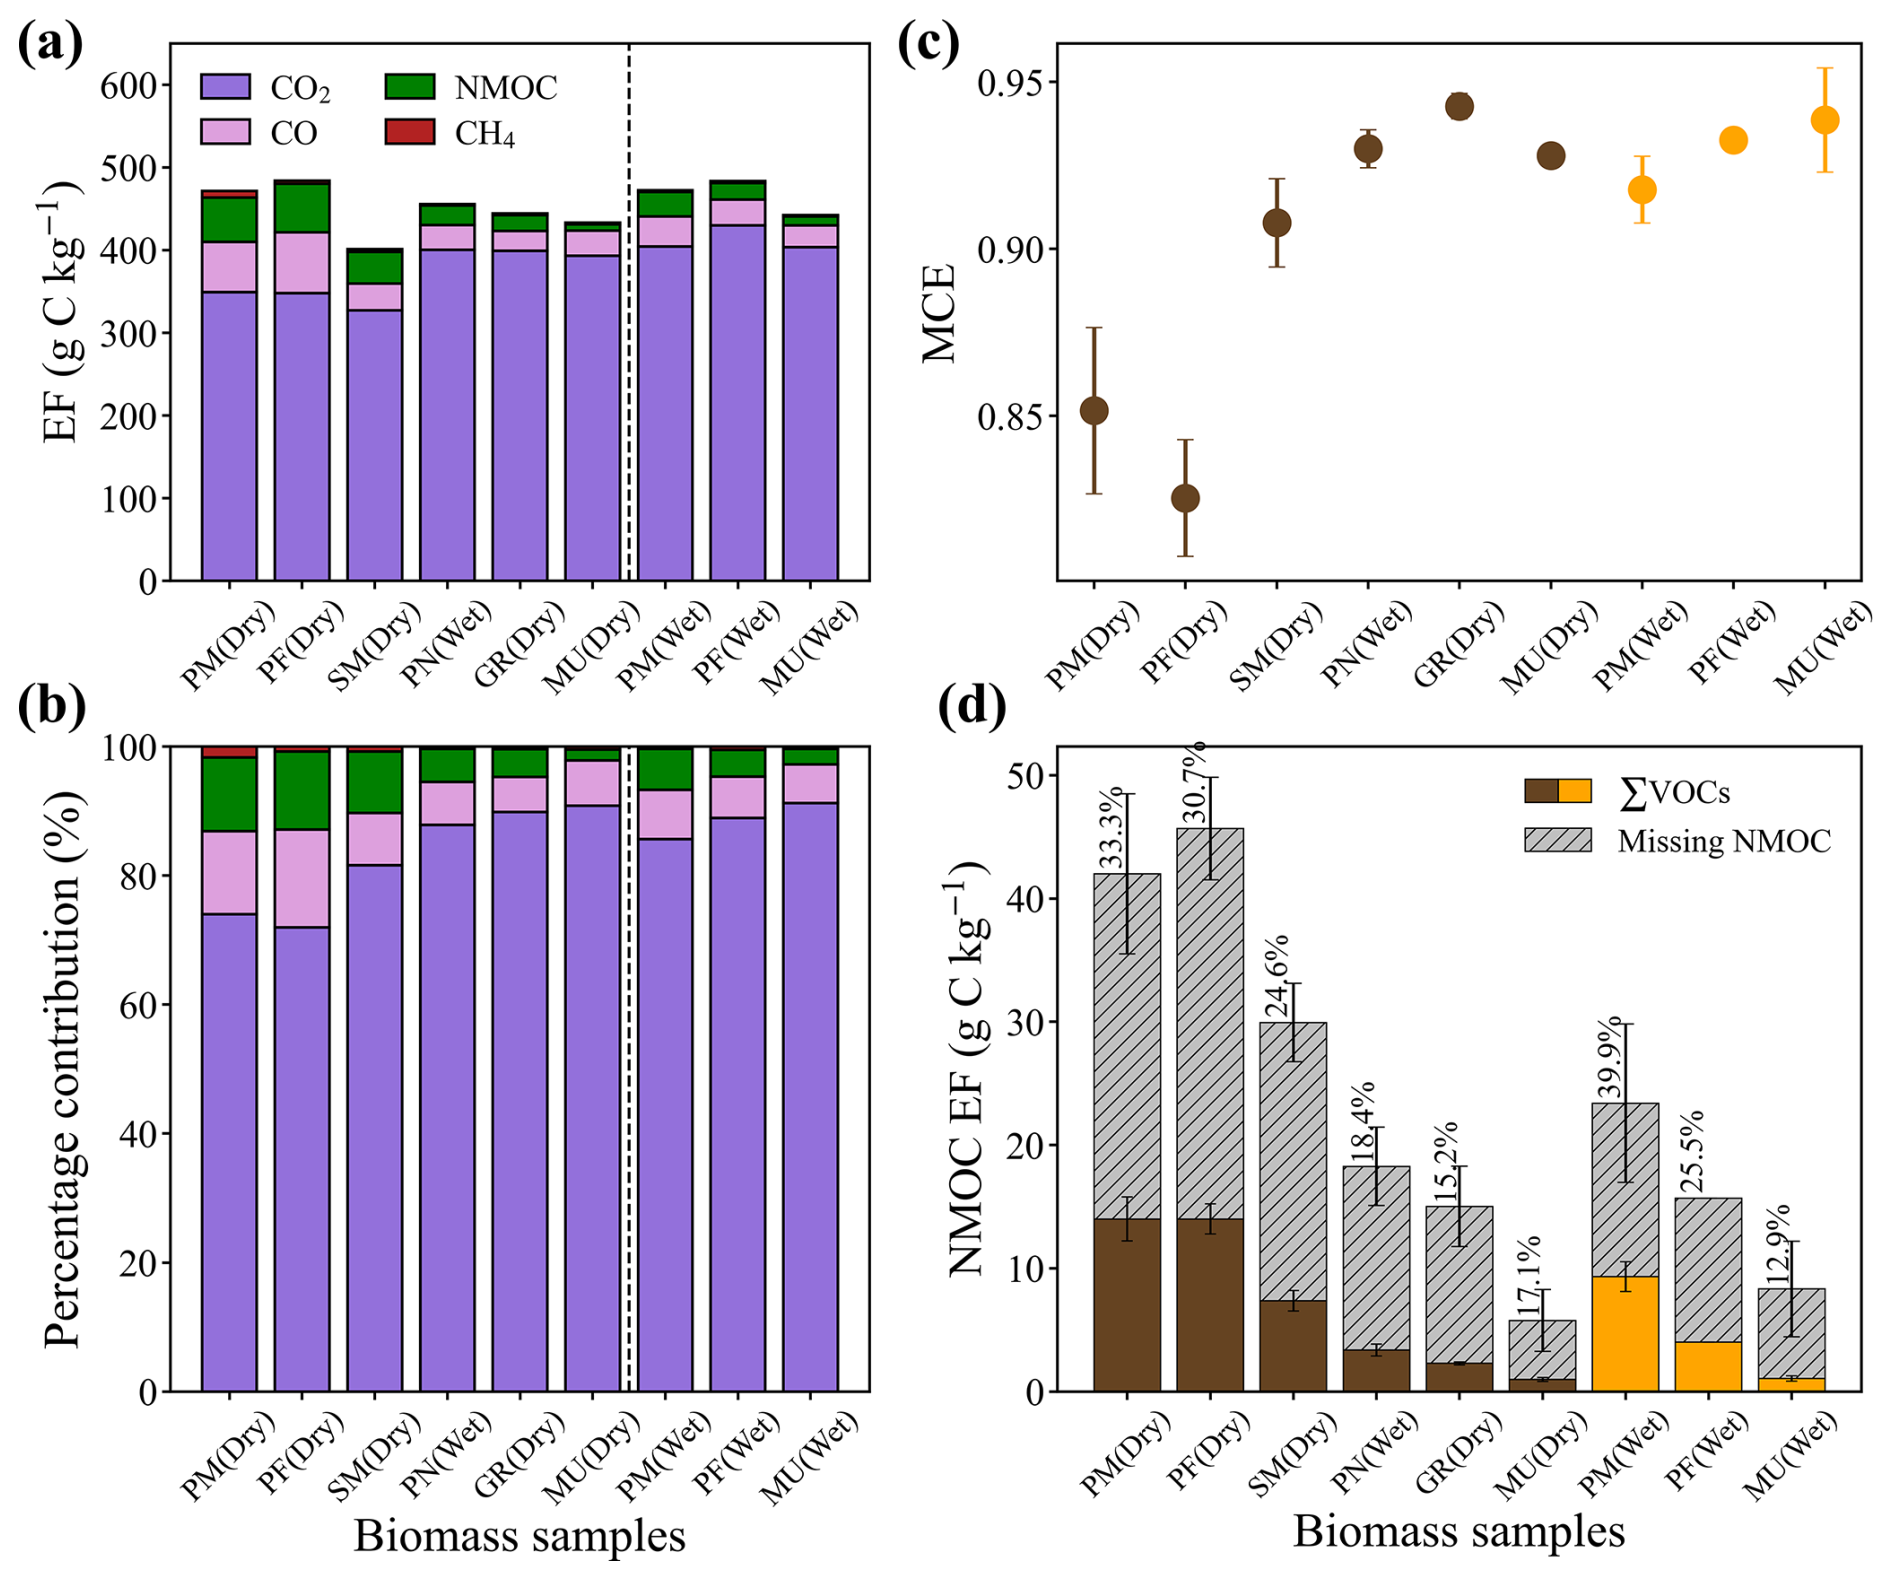
Figure 3(a) Mean overall EF for CO2 (purple), CO (pink), CH4 (red), and NMOC (green) expressed in carbon units (g C kg−1); (b) their percentage contributions to TC (g C kg−1) for each biomass type; (c) mean fire-integrated MCE for each biomass type; and (d) mean overall NMOC EF (g C kg−1) for each biomass type, with mean overall ∑VOCs (solid brown and yellow, sum of quantified VOC) and missing NMOC (grey stripes). The percentage values indicate the contribution of ∑VOCs EF to the total NMOC EF. Error bars in (c) and (d) indicate the standard deviation of the mean. In (c) and (d), brown is used for low-moisture content fuels and yellow is used for wet fuels.
Figure 3a and b demonstrate that gas-phase carbon is emitted primarily as CO2 across all species (70 %–93 %), with smaller contributions from CO (5 %–16 %), NMOC (2 %–12 %), and CH4 (<2 %), with the absolute magnitude and distribution of emissions varying depending on the biomass type. Note that emission factors for particulate organic carbon and elemental carbon from offline analysis of filter samples are presented in the overview paper (Moraes et al., 2026). Among the biomass types, the dry peat fuels (PF and PM) are prone to extensive smoldering (Turetsky et al., 2011, 2015), and burn with characteristically low combustion efficiency (fire-integrated MCE, 0.83–0.85) as shown in Fig. 3c. The MCE values observed in this study fall within the range reported in other laboratory studies of peat fuels (0.77–0.90) (Watson et al., 2019), including Canadian peat (MCE =0.81) (Stockwell et al., 2014). Accordingly, the dry peat fuels exhibit the highest NMOC EF due to a greater contribution from incomplete combustion products compared to the other fuels, with NMOC accounting for about 11 %–12 % of the TC. In contrast, MU (dry and wet) and GR (dry) burn very efficiently via flaming combustion (fire-integrated MCE 0.93–0.94), while PN (wet) and SM (dry) display MCE values of 0.93 and 0.91, respectively. In fact, GR (dry) combusted entirely during the flaming stage with no identifiable smoldering phase based on MCE.
3.4 Dependence of EF on MCE
3.4.1 NMOC and ∑VOCs
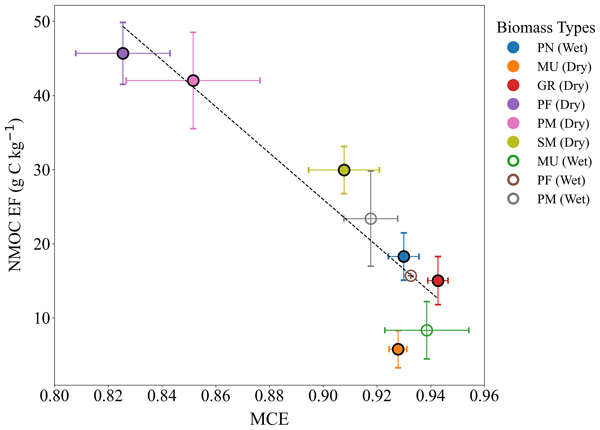
Several studies have demonstrated that for many compounds, EF is anti-correlated with MCE, and that these relationships can be helpful for extrapolating EF to real-world MCE and for comparing EF across fuel types (Yokelson et al., 2013; Urbanski et al., 2022; Permar et al., 2021; Selimovic et al., 2019; Stockwell et al., 2014). The mean overall (circles) NMOC EFs are plotted as a function of their respective mean integrated MCEs for all fuel types in Fig. 4, along with a linear fit to the low moisture-content data. An inverse linear relationship is evident (R2=0.83), illustrating that the overall variation in NMOC emissions within and between fuels is largely driven by combustion efficiency (i.e., degree of smoldering vs. flaming combustion). The same trend is also evident when considering all individual burn data (Fig. S3), reinforcing that the observed relationships are robust and not an artifact of averaging. The same plot as Fig. 4 but for total ∑VOCs EF (g kg−1) is provided in Fig. S4. Similar trends are evident for ∑VOCs EF, with EFs generally decreasing as MCE increases. Some variability is still observed among fuel types with similar MCE values, indicating that combustion efficiency is not the only factor controlling VOC emissions. The variation in the contribution of ∑VOCs to NMOC across fuel types (Fig. 3d) further indicates that the VOC speciation profile and individual VOC EFs are dependent on other factors as well.
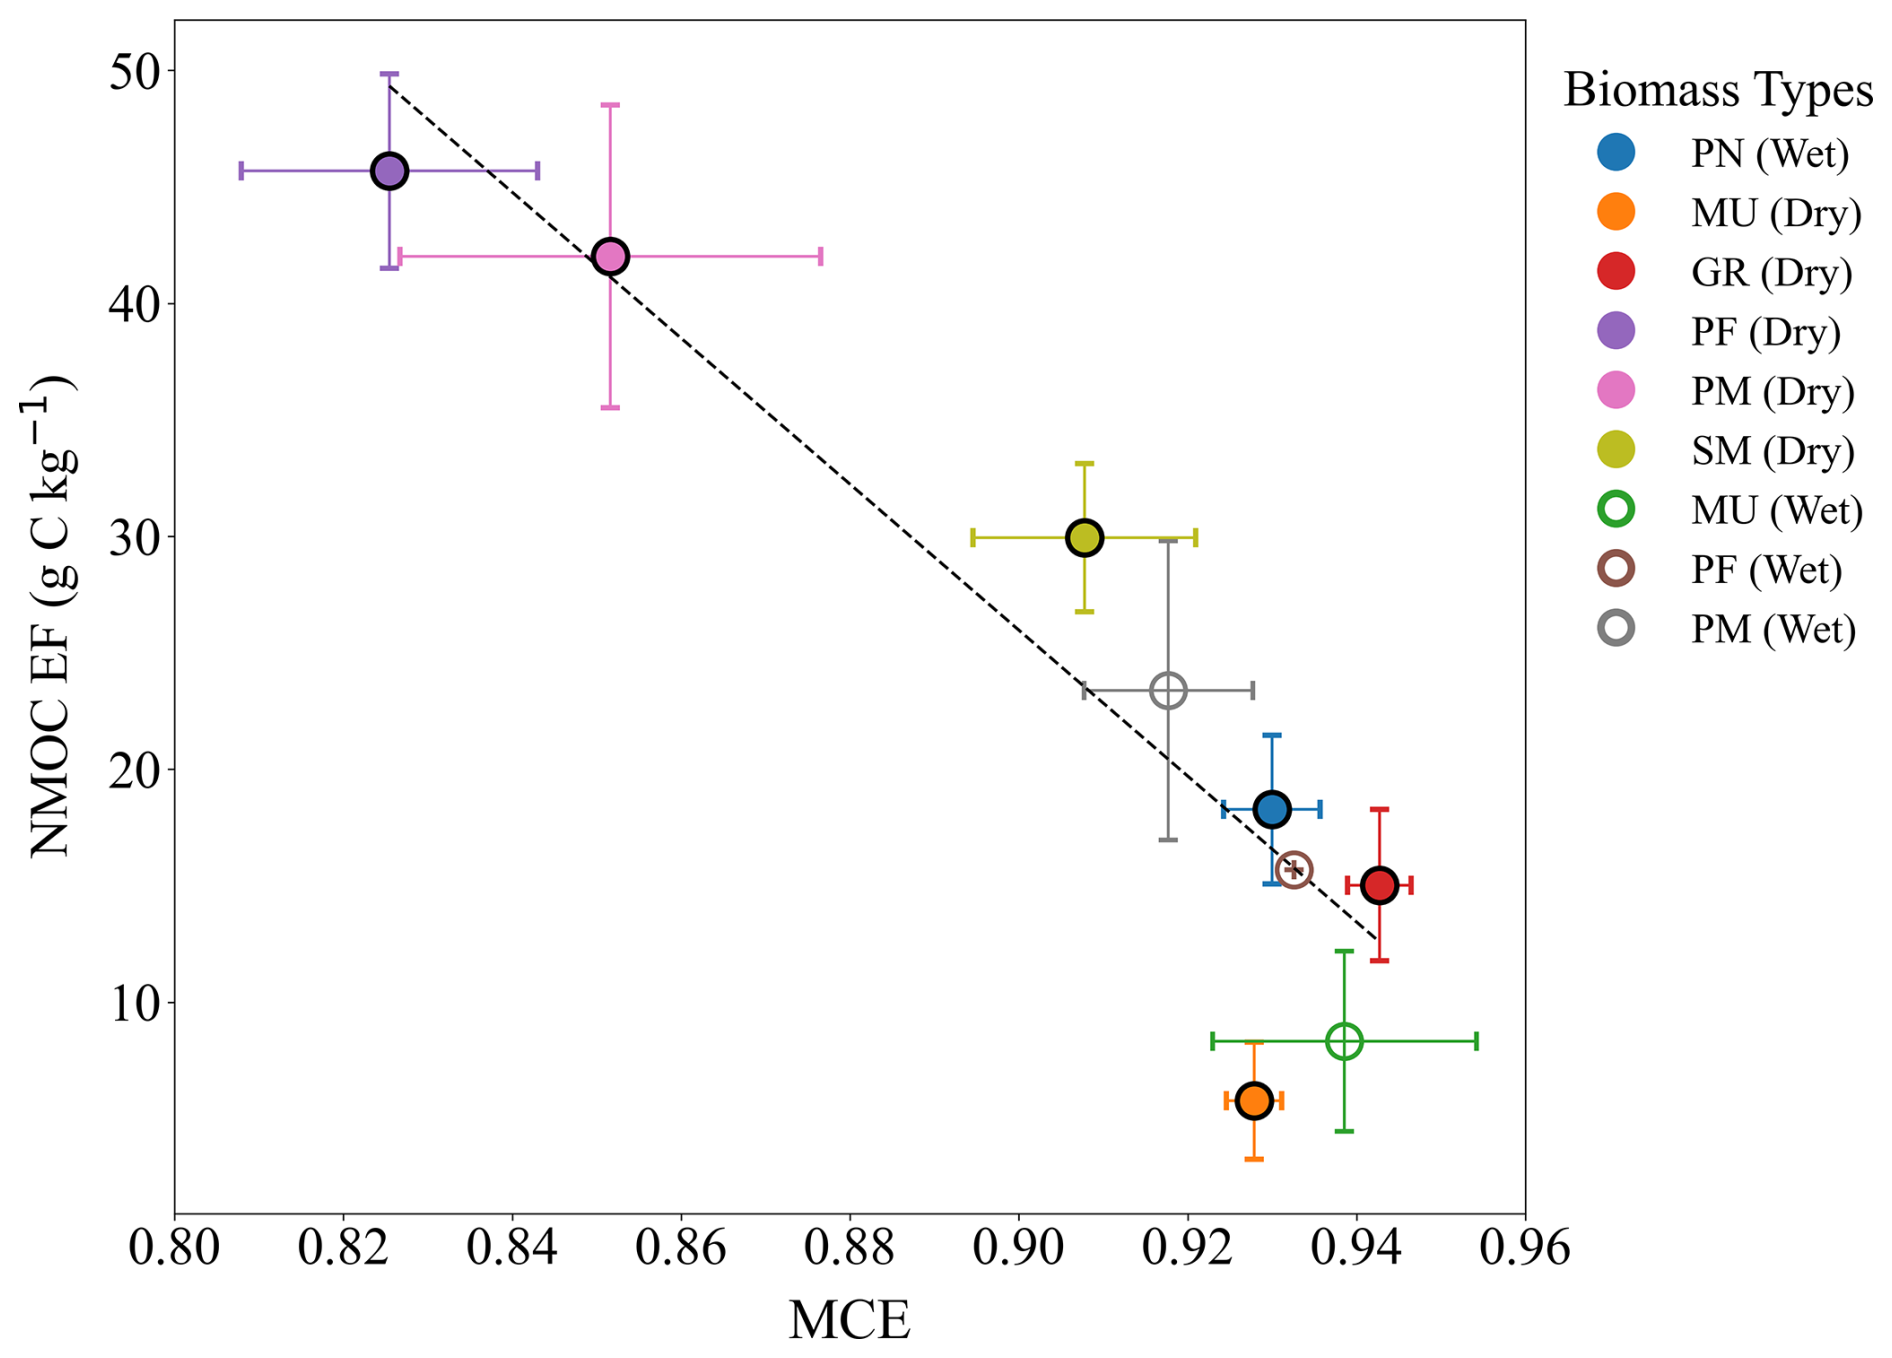
Figure 4NMOC EF (g C kg−1) as a function of MCE across various biomass fuel types. Data are shown for the entire burning period (circles). Vertical and horizontal error bars represent the standard deviation of the mean NMOC and MCE, respectively. The dashed line is the linear regression to data points for low-moisture content fuels (solid symbols), with slope (−313), intercept (308), and R2 (0.83). Entire burn data are highlighted with a bold black outline, while open symbols denote MU (wet), PM (wet), and PF (wet) fuels.
Interestingly, the dry and wet MU samples exhibit unique behavior and show a very weak relationship with MCE compared to the other fuels. Lower emissions from PM (peat with mulch) compared to PF (peat with moss) are consistent with the low NMOC EF for mulch on its own. Interestingly, the human-influenced peat (PM) has higher methane EFs (Moraes et al., 2026), but lower NMOC and CO EFs than the natural peat (PF). PF (wet) and PM (wet) extinguished shortly after smoldering began, leaving a substantial fraction of unburnt fuel (90 %–98 %), highlighting the inhibitory effect of high moisture content on sustained smoldering combustion. Their respective NMOC EFs are consistent with the high MCE associated with flaming combustion.
3.4.2 Individual VOC
Figure 5 illustrates the relationship between overall EFs (g kg−1) and fire-integrated MCE for four example VOCs: (a) CH2O2 (formic acid), (b) HCN (hydrogen cyanide) (c) C6H6 (benzene) and (d) C4H4O (furan). The low-moisture content fuels (teal squares) are distinguished from the “wet” fuels (blue diamonds). Similar relationships for CH4 (methane) and an additional 19 VOC are displayed in Fig. S5.
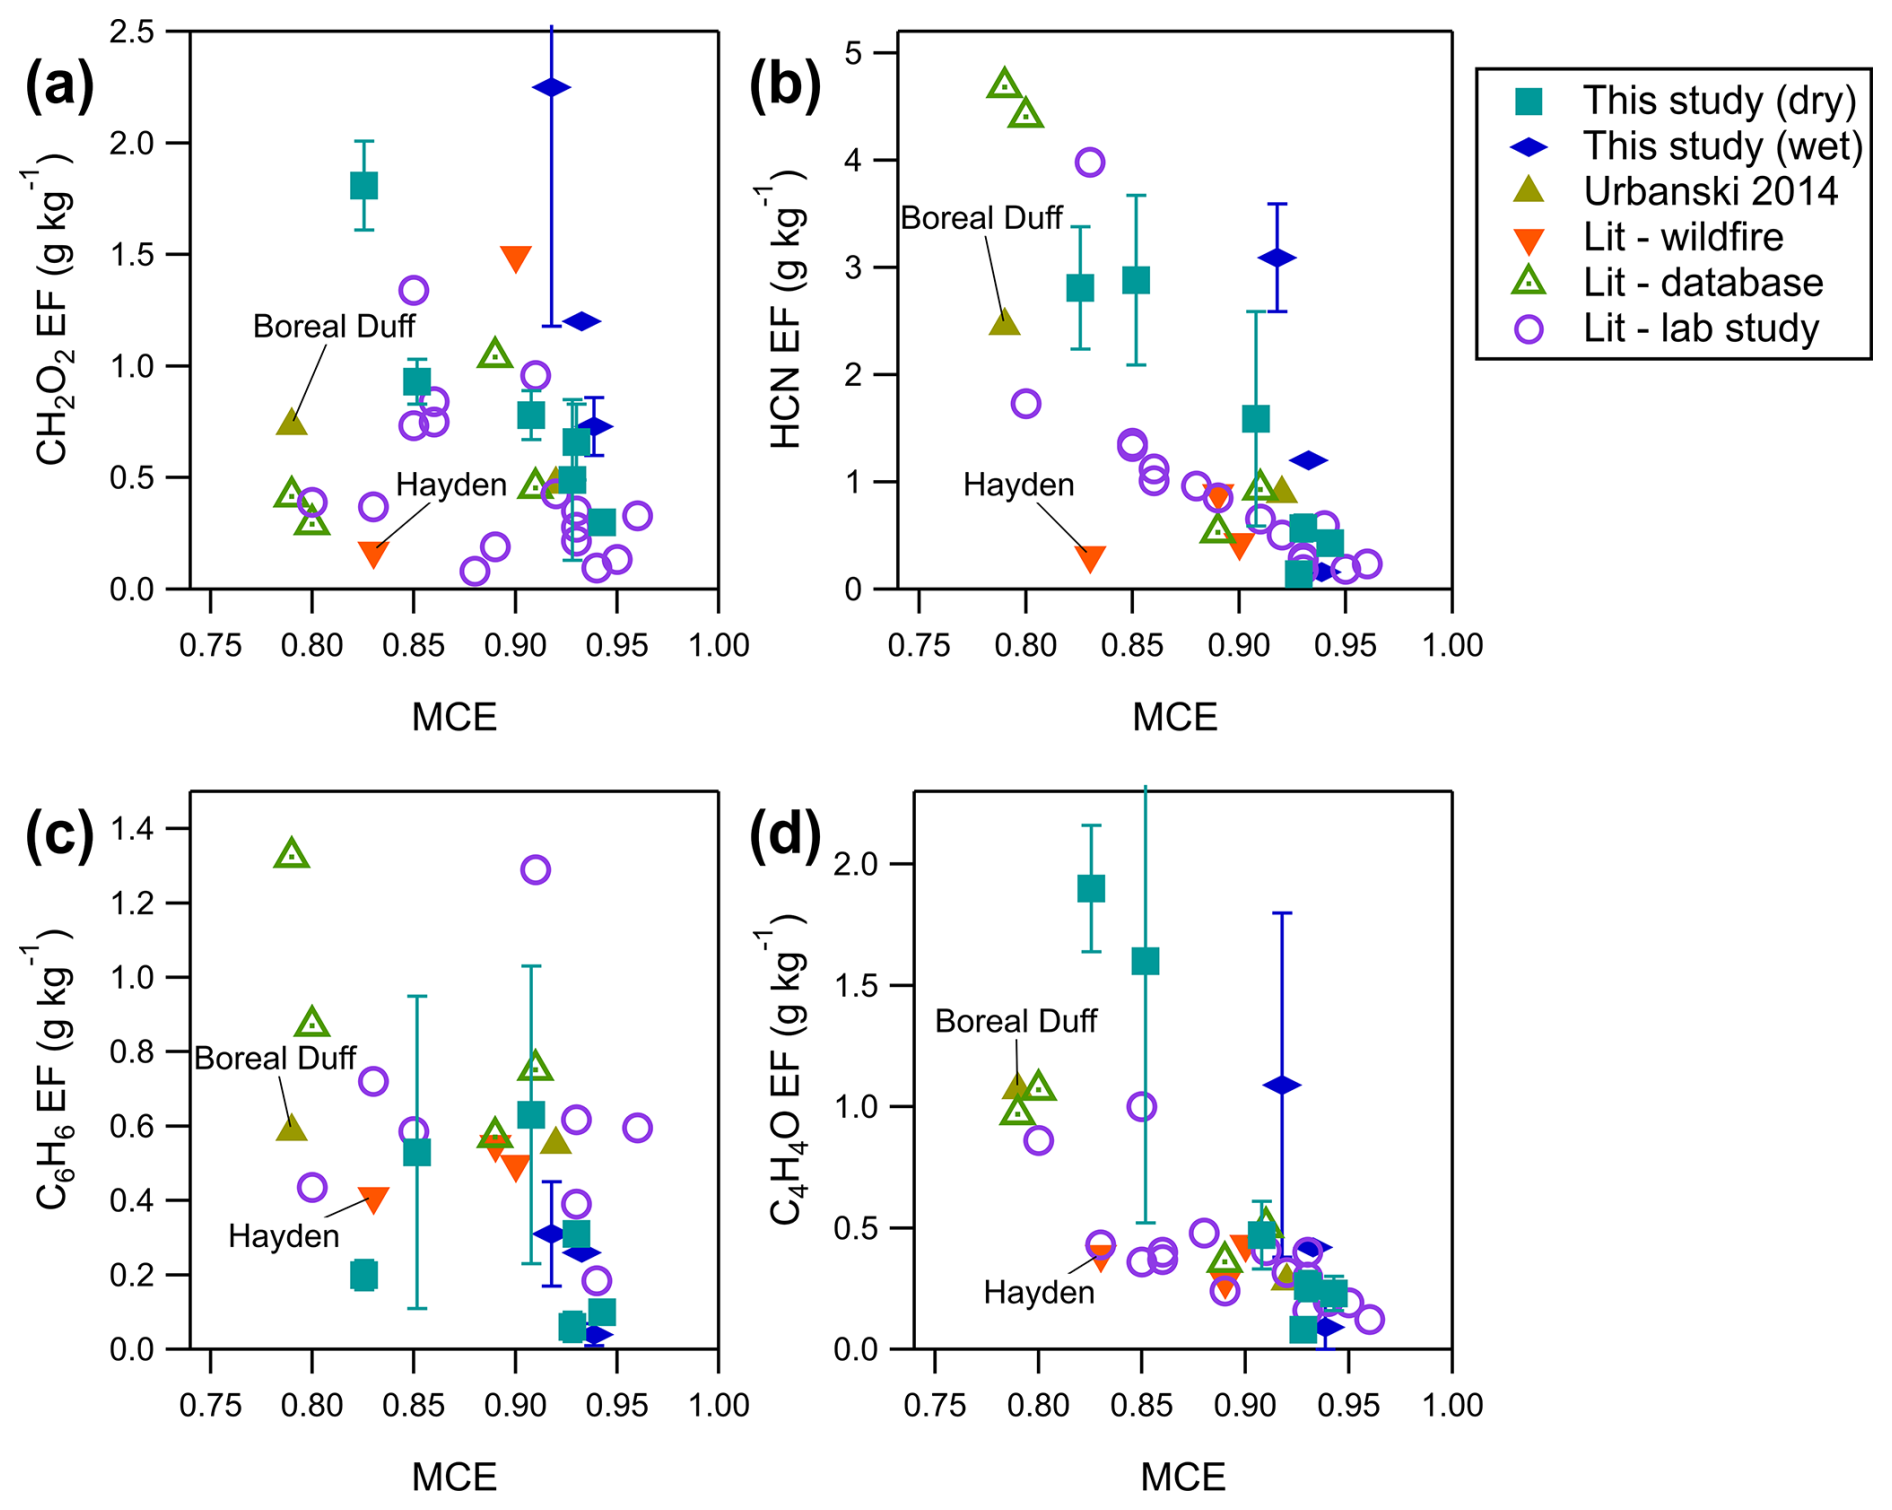
Figure 5Mean overall EF for (a) CH2O2 (formic acid), (b) HCN (hydrogen cyanide), (c) C6H6 (benzene), and (d) C4H4O (furan) as a function of mean fire-integrated MCE for low moisture content fuels (PM, PF, SM, PN, GR, MU; teal squares) and wet fuels (PM, PF, MU; blue diamonds). Error bars represent the standard deviation of the mean. Also shown are EFs from wildfire studies (orange triangles) (Hayden et al., 2022; Simpson et al., 2011; Permar et al., 2021), laboratory studies (purple circles), (Koss et al., 2018; Yokelson et al., 2013; Stockwell et al., 2015; Bertschi et al., 2003; Selimovic et al., 2019) and EF databases/compilations (open green triangles) (Andreae, 2019; Binte Shahid et al., 2024), including Urbanski (2014) “Boreal Forest Duff” and “Wildfire Boreal Forest” (solid green triangles) where available. See Sect. S5 for more information on the literature studies.
As with NMOC, the individual VOC EFs derived from this study (teal squares in Figs. 5 and S5) are inversely proportional to MCE for CH4 (Fig. S5a) and many of the quantified VOCs. However, for several VOCs, the relationship is weaker or less clear, and in some cases, similar or lower EFs are observed for smoldering fuels (i.e., peat fuels) compared to flaming fuels (i.e., GR and MU), despite much lower MCE. For example, this behavior is observed for many CH compounds such as C6H6 (benzene) (Fig. 5c), C8H8 (styrene, Fig. S5m), C10H8 (naphthalene, Fig. S5r), and (monoterpenes, Fig. S5t), as well as some non-CH compounds such as C3H4O3 (pyruvic acid, Fig. S5h). The plots in Figs. 5 and S5 also display literature EF from select wildfire studies (Hayden et al., 2022; Simpson et al., 2011; Permar et al., 2021), laboratory burns (Koss et al., 2018; Yokelson et al., 2013; Stockwell et al., 2015; Bertschi et al., 2003; Selimovic et al., 2019), and EF compilations (Akagi et al., 2011; Andreae, 2019; Binte Shahid et al., 2024; Urbanski, 2014), with additional details in Sect. S5. The literature EF vs MCE relationships in these figures provide additional context for interpreting the literature comparisons presented above (Sect. 3.2) (i.e., for many VOC, high EF for peat fuels are consistent with their low MCE). However, together with the EFs from this study, the additional literature values demonstrate that the relationship between EF and MCE is well constrained and relatively independent of fuel type and/or study type for some VOC (e.g., CH4, HCN, C4H4O) and poorly for others. This indicates that additional factors likely play an important role in determining VOC emissions (Andreae, 2019; Permar et al., 2021).
In particular, VOC emissions are associated with the pyrolysis of biopolymers (i.e., cellulose, hemicellulose, and lignin), with the pyrolysis temperature playing an important role in determining the functionality of emitted species (Sekimoto et al., 2018; Romanias et al., 2024). Aromatization (leading to aromatics such as naphthalene, benzene, and phenol) is a result of high-temperature pyrolysis, whereas depolymerization (leading to furanoids and phenolic compounds such as guaiacol) is a result of low-temperature pyrolysis. As such, Sekimoto et al. (2018) found that high- and low-temperature pyrolysis profiles could adequately describe VOC emissions from controlled laboratory burns of a wide variety of fuels during FIREX 2016. While a transition from high to low MCE may reflect a transition from high- to low-temperature pyrolysis, the correspondence may not be exact, and as a result, MCE may not be the most useful predictor for certain VOC EFs.
It is further expected that the biopolymer content of the fuels, which impacts the pyrolysis pathways (Romanias et al., 2024; Hatch et al., 2018), will also play a role in determining the speciation of emitted VOC. Indeed, higher EF for phenolic species (C6H6O2, C7H8O2) and lower (relative) EF for aromatics for the peat samples (PM, PF) is consistent with the low temperature pyrolysis and high expected lignin content for these fuels (Stockwell et al., 2015; Dyakonov et al., 2008). Additional discrepancies between aircraft-derived wildfire EF vs. laboratory EF (this study and others) may also be attributed to differences associated with aged vs. fresh emissions (Permar et al., 2021).
To further explore VOC emission variability between fuel types, principal component analysis (PCA) was performed using the mean VOC EF data for all fuel types as inputs, with methods and results described and presented in Sect. S7 (Fig. S6). The PCA results further confirm that although MCE plays a dominant role, additional factors (e.g., fuel moisture content) are required to explain VOC emissions variability. The PCA results also emphasize the unique emission behavior of both the dry and wet peat fuels (PM, PF).
3.5 Nitrogen-containing species
Biomass burning is an important source of Nr to the atmosphere. Although total Nr was not measured during this study, analysis of the available nitrogen-containing inorganic and organic gas-phase species reveals important differences amongst the fuels. Figure 6a shows the ∑Nr EF in units of g N kg−1 from nitrogen-containing inorganic (NO, NO2, HONO, NH3) and organic (HCN, HNCO, C2H3N–acetonitrile, C6H5NO3–nitrophenol, and OTHER, which includes C3H3NO2–cyanoacetic acid, C2H3NO–glycolic acid nitrile/methyl isocyanate, C2H5NO3–nitroethanol, and C7H5N–benzonitrile) species as a function of biomass type. Figure 6b shows the percentage contribution of the measured species to the ∑Nr EF. The fuel nitrogen (N) content (Table 1) ranged from 0.27 % (MU) to 1.2 % (GR) and is considerably more variable than fuel carbon content. The measured ∑Nr EFs spanned from 0.71 g N kg−1 for MU (dry) to 6.55 g N kg−1 for PM (dry). These values indicate that, at most, ∼ 64 % of the fuel N is accounted for in PM (dry) (1.02 % fuel N), whereas as little as ∼ 18 % was accounted for in GR (dry), assuming the same N % in the consumed fuel. These ranges are consistent with other studies (Watson et al., 2019). From a total N perspective, approximately half of fuel N is typically emitted as N2 (Burling et al., 2010; Roberts et al., 2020; Lindaas et al., 2021a; Goode et al., 1999; Kuhlbusch et al., 1991), and the low closure of the N budget from the high MCE fuels is consistent with significant denitrification to N2 (and N2O) during high-temperature combustion. The low ∑Nr EF for MU is consistent with the low fuel N content (0.27 %) and low fuel nitrogen to carbon ratio (N C) of 0.01, while the moderate ∑Nr EF for GR is likely due to its higher N content (1.21 %) and high fuel N C ratio (0.03), as other studies have found that fuels with higher N content typically have higher ∑Nr emissions (Turetsky et al., 2011; Lindaas et al., 2021a) with a higher fraction of N-containing VOC (Coggon et al., 2016). However, Fig. S8a and b show that fuel N content on its own cannot fully explain individual Nr EF and ∑Nr EF.
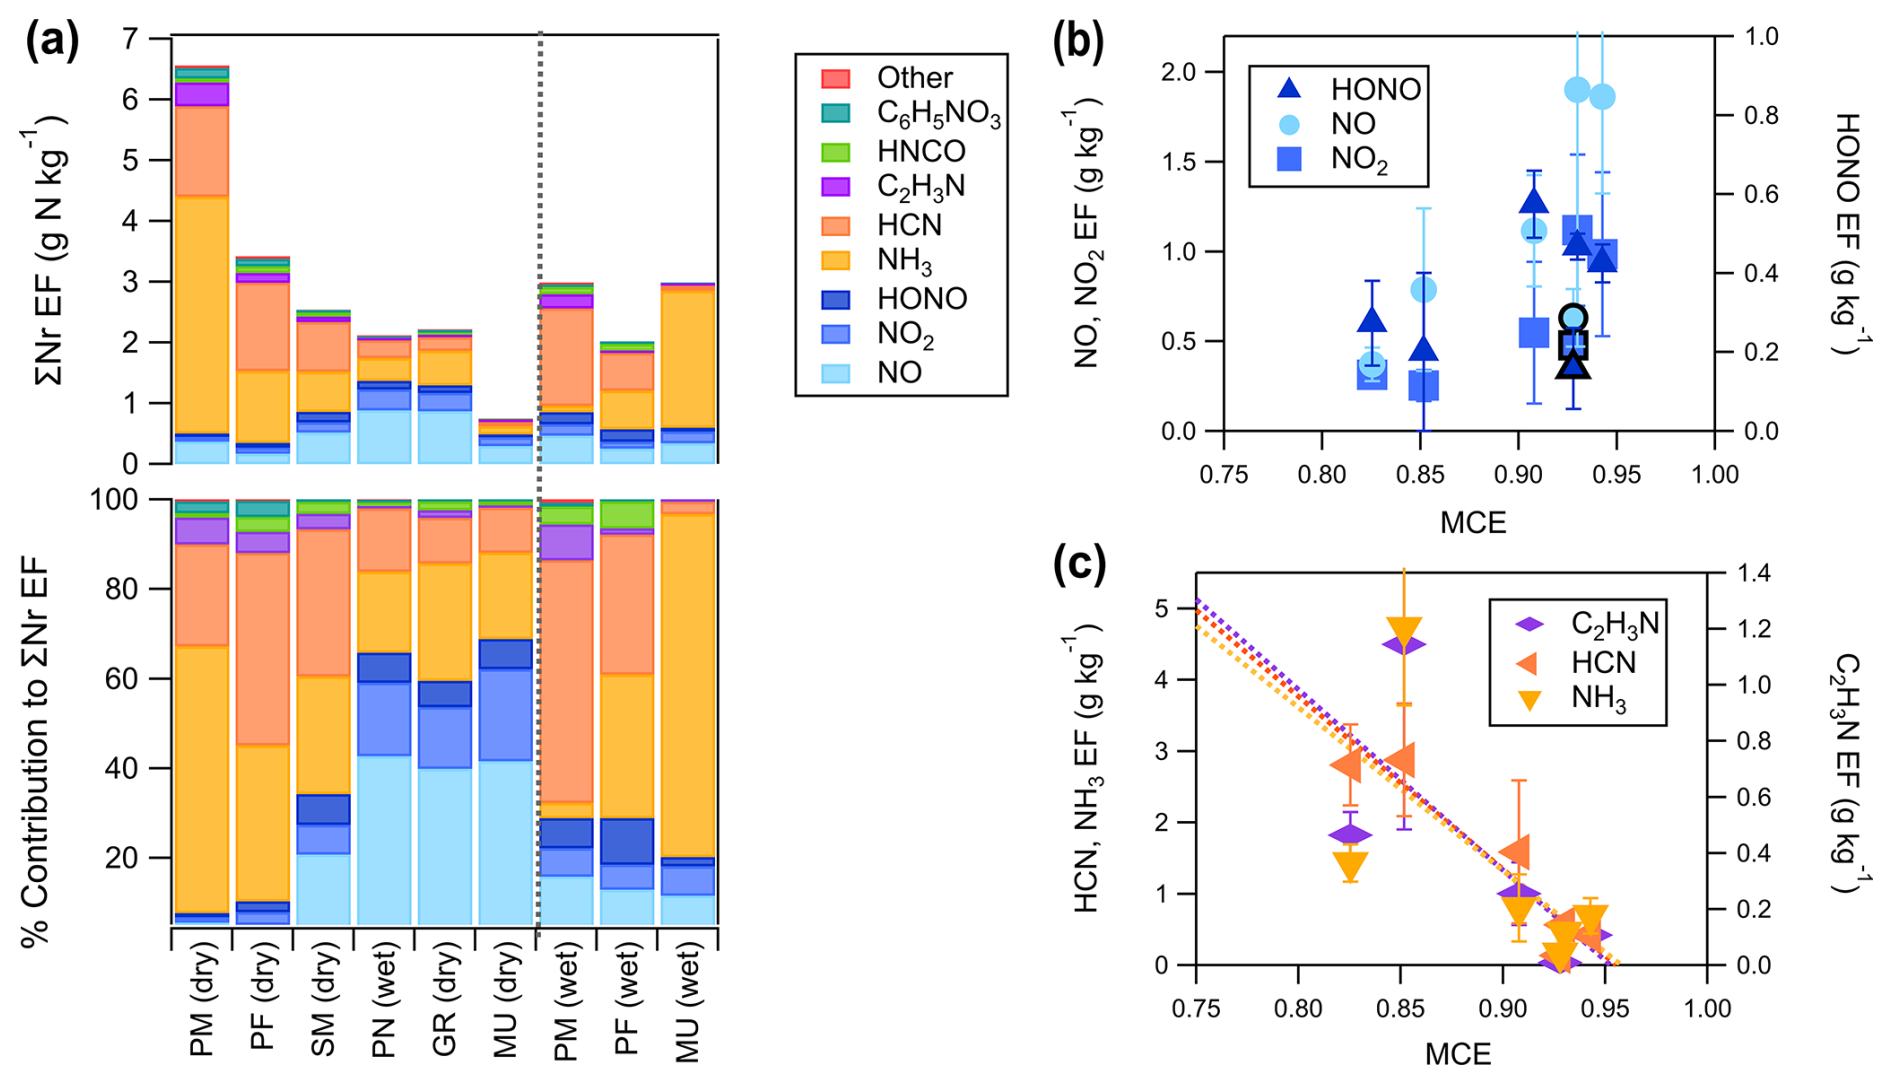
Figure 6(a) EF of Nr species (g N kg−1) on the top panel and their % contribution to ∑Nr on the bottom panel; (b) NO, NO2, and HONO EFs (g kg−1); and (c) HCN, NH3, and C2H3N EFs (g kg−1) as a function of fire-integrated MCE for the low-moisture content fuels [MU (dry), GR (dry), SM (dry), PN (wet), PF (dry), PM (dry)]. MU (dry) EFs are outlined in black (b). Error bars represent the standard deviation of the mean. The dashed lines in (c) are linear fits to the data.
Similar to the carbon budget analysis, the N budget lacks contributions from unreactive nitrogen (N2, N2O) as well as some unmeasured Nr species (HNO3 and other NOy, other N-containing organics such as amines, amides, nitro-compounds, nitriles, and N-heterocyclic compounds), particle-bound N, and N in remaining ash, and full closure is not expected (Roberts et al., 2020; Hayden et al., 2022; Lindaas et al., 2021a; Goode et al., 1999). However, laboratory studies (Burling et al., 2010; Roberts et al., 2020), and aircraft wildfire studies (Hayden et al., 2022; Lindaas et al., 2021a) consistently find that NO, NO2, HONO, HNCO, HCN, C2H3N, and NH3, all of which were measured in this study, are the major contributors to Nr, with a minor contribution from other N-containing VOC (< 5 %–10 %) and little to no measurable HNO3. In the FIREX-2016 laboratory campaign (Roberts et al., 2020), unexplained Nr amounted to ∼ 15 % and was attributed to low-volatility and/or particle-bound nitrogen, similar to Hayden et al. (2022), who found that particle-bound nitrogen (, ) contributed ∼ 23 % to the total measured Nr from a boreal wildfire. Measurements of fine particle ammonium and nitrate by a Soot Particle Aerosol Mass Spectrometer will be addressed in a subsequent BBCan paper.
Figure 6 shows that peat-associated fuels PF (dry) and PM (dry) exhibit elevated emissions and relative contributions from reduced N species (HCN, NH3, C2H3N), which are primarily formed from fuel pyrolysis, and low emissions and relative contributions from oxidized N species (HONO, NO2, NO), which are formed in the flame through rapid oxidation of small N-containing compounds, while the opposite is true for the flaming-dominated fuels (GR and MU). Moraes et al. (2026) also confirm that NOX and NH3 emissions are more closely related to flaming CO2 and smoldering CO, respectively, while Fig. 1 shows that HCN emissions are associated with both flaming and smoldering CO. The distribution of Nr species across fuels and combustion behavior is roughly consistent with the positive matrix factorization analysis performed by Roberts et al. (2020) on Nr emissions from coniferous fuels (FIREX-2016) that found three factors: a combustion (flaming) factor dominated by NO, NO2, and HONO; a high-temperature pyrolysis factor dominated by HCN, HNCO, and nitriles; and a low-temperature pyrolysis factor dominated by NH3, amines, amides, and heterocyclics, similar to the two-factor solution of Sekimoto et al. (2018). High NH3 and HCN EFs and low NOX EFs, which are observed for PM and PF (Fig. 6a), are particularly characteristic of peat fuels that do not sustain flaming combustion and burn at lower temperatures (Watson et al., 2019; Yokelson et al., 1997; Goode et al., 2000) and the pyrolysis of nitrogen heterocycles, which are typically enriched in organic soils compared to woody and leafy fuels, is associated with high HCN emissions (Sekimoto et al., 2018). They are also consistent with top-down estimates demonstrating unexpectedly high NH3 emissions from boreal forest fires (Chen et al., 2025). We note that the PM sample representing peat impacted by human activity had higher ∑Nr and NH3 EFs compared to the natural sample (PF).
While the EF for reduced N species follows an inverse relationship with MCE (Fig. 6c), similar to other VOC, as observed here (Figs. 5 and S5) and elsewhere (Lindaas et al., 2021a), the EF for oxidized N species generally increases with increasing MCE (Fig. 6b). The higher MCE value likely reflects higher combustion temperatures, which promote more efficient oxidation and hence greater emissions of NO, NO2, and HONO (Lindaas et al., 2021b). Again, MU, with its low N fuel content, exhibits distinct behavior, with low EF for these oxidized species compared to other fuels with similar MCE. A relatively weak correlation for the oxidized nitrogen species has been observed by others and is likely due, in part, to variable fuel N, and indeed the correlations for HONO and NO are found to improve slightly when scaling the EF by fuel N or by ∑Nr (see Fig. S8c–e) (Burling et al., 2010). Moreover, flame chemistry involving reactions of HNCO, HCN, NH3, HONO, and NOX is highly complex, and emissions of these species may be due to multiple, temperature-dependent pathways, resulting in non-linear variation in EF with MCE (Burling et al., 2010; Roberts et al., 2020; Goode et al., 2000). Constraining emissions of oxidized nitrogen species is important given that NOX strongly influences photochemical processing in wildfire plumes, which is often expected to operate under NOX-limited conditions (Jaffe and Wigder, 2012; Lin et al., 2024; Voulgarakis and Field, 2015). HONO, a key photolytic precursor of hydroxyl radicals that initiate atmospheric oxidation, significantly influences the chemical evolution of smoke as it disperses (Stutz et al., 2010; Kleffmann, 2007).
The impact of fuel moisture content on the Nr emission profile is also evident in Fig. 6a when comparing dry PF, PM, and MU fuels with their undried counterparts. The HONO NOX ratio is observed to increase for the wet peat fuels, possibly due to the flame chemistry involving NO2 hydrolysis to form HONO (Roberts et al., 2020). Consistent with this, HONO EFs are highest for PF (wet), reaching 0.70 g kg−1 followed by PM (wet) at 0.66 ± 0.08 g kg−1. In addition, the wet peat fuels, which burned a small fraction of fuel mainly by flaming combustion in this study, exhibit higher relative contributions of HCN and HNCO, which are characteristic of high-temperature pyrolysis (Roberts et al., 2020). The wet peat with mulch (PM) fuel had a higher HCN/NH3 than its dry counterpart, which is contrary to the finding of Yokelson et al. (1997) that drier organic soils/peats exhibit higher HCN NH3 ratios, although a large variation in HCN NH3 was observed across fuels in that study. The difference in behavior is likely related to the fact that the wet peat fuels did not sustain smoldering combustion and had lower NH3 emissions. MU (wet), which has a relatively similar VOC profile compared to MU (dry), has a much higher NH3 EF compared to its dry counterpart, further indicating that even small differences in fuel moisture-content can impact Nr emissions.
With respect to prior studies, HNCO and C2H3N EFs largely fall within reported ranges (Fig. 2) with EFs consistent with the literature EF vs. MCE relationships (Figs. S5b and f). HCN is consistently elevated in peat relative to non-peat fuels but still remains within the typical literature range. The HCN EF for the dry peat fuels, PM (2.9 ± 0.8 g kg−1) and PF (2.8 ± 0.6 g kg−1), are in good agreement with one another, the Urbanski (2014) “Boreal Forest Duff” HCN EF (2.5 ± 0.8 g kg−1) (Fig. 6b) and a recent laboratory study of peat from an Alaskan black spruce forest (2.3 ± 0.3 g kg−1), but intermediate to the reported range of HCN EF for other peat fuels (∼ 0.7– 6 g kg−1) (Watson et al., 2019). The low HCN EF for MU (0.14 ± 0.09 g kg−1) is consistent with the low HCN EF for Alaskan black spruce canopy (0.24 ± 0.07 g kg−1) and Albertan Jack pine and black spruce needles and woody debris (0.097 ± 0.067 g kg−1) (Urbanski et al., 2022). HCN and C2H3N are also often used as biomass burning markers/tracers (Goode et al., 1999).
Interestingly, for the dry peat fuels, we observed relatively high but variable EF (ranging from below the detection limit to a maximum of 1.21 and 1.69 g kg−1 for individual burns of PM and PF, respectively) for C6H5NO3 measured from the I-CIMS that we assign as nitrophenol. These EFs are significantly higher than the nitrophenol EFs from the other low moisture-content fuels, ranging from 0.02 g kg−1 for MU up to 0.1 g kg−1 for PN (see Table 1), which are more consistent with other studies (Wang et al., 2017). In addition to being toxic, nitrophenols can contribute to brown carbon (Mohr et al., 2013) and thus influence the radiative budget.
This study demonstrates that ∑Nr emissions from Canadian boreal surface and ground fuels, as well as the Nr speciation profile, particularly with respect to the relative contributions from oxidized and reduced species, are influenced by combustion conditions (i.e., MCE and/or pyrolysis temperature), total fuel N content, and moisture.
3.6 Implications for wildfire emissions in CFFEPS
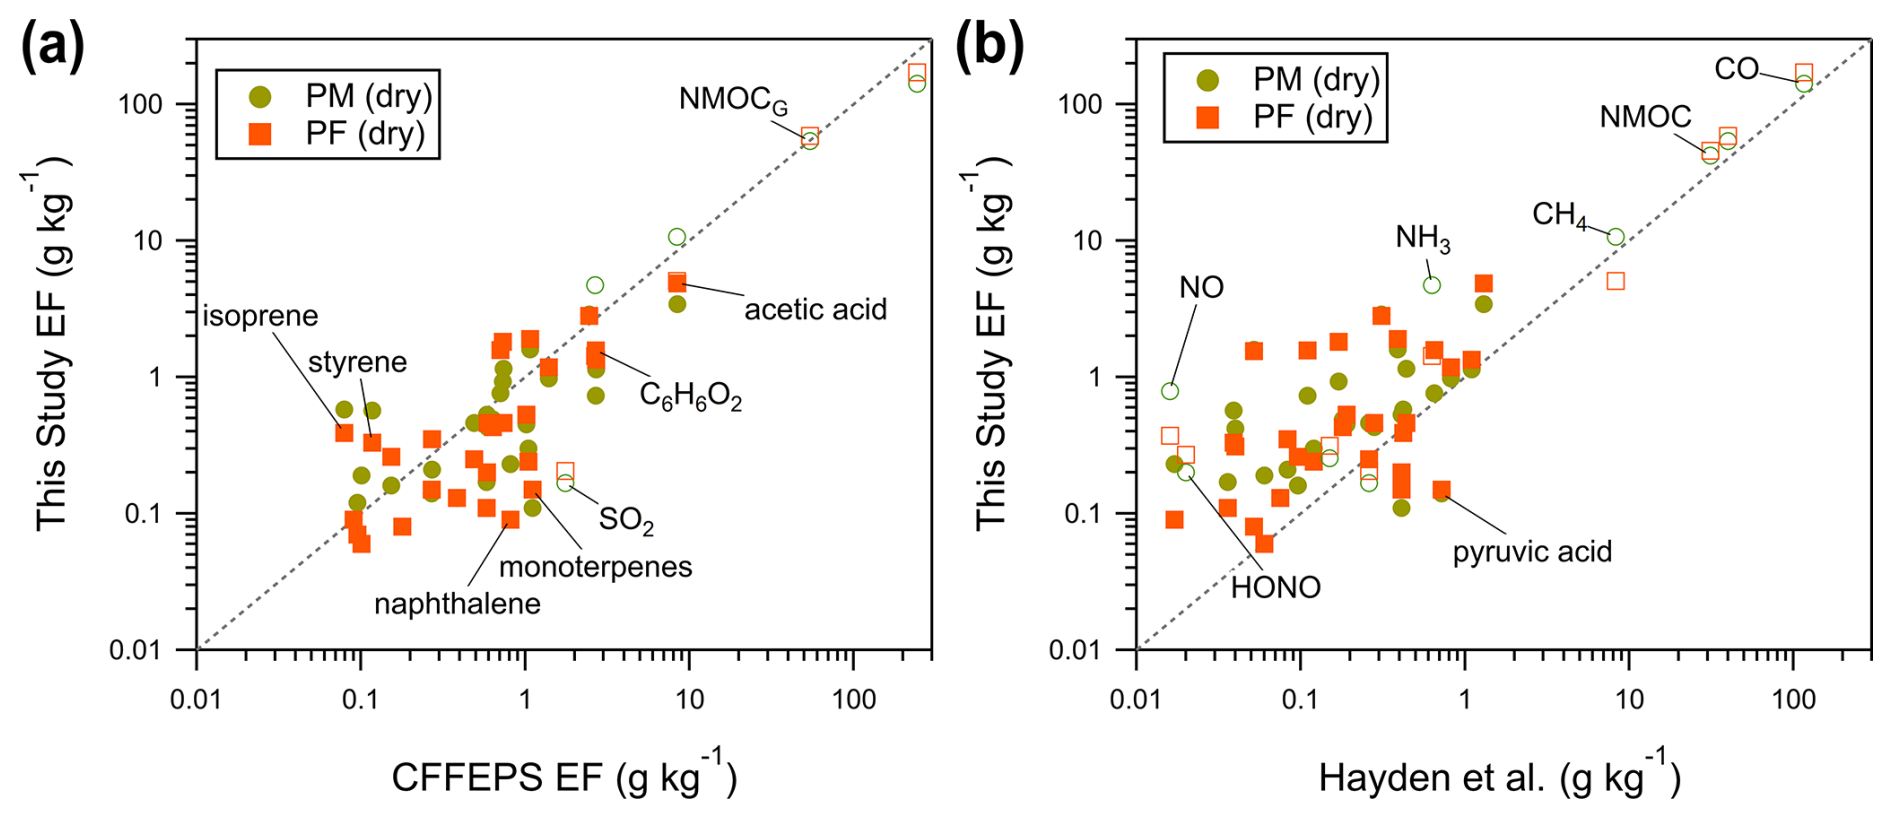
Figure 7EF (g kg−1) for 32 VOC (solid symbols) and other trace gas species (open symbols) (Moraes et al., 2026) for dry peat fuels [PM (dry) – green circle, PF (dry) – orange squares] compared to (a) CFFEPS EFs for residual/smoldering combustion of boreal forest duff/organic soil from Urbanski (2014) and (b) EFs measured by aircraft for a boreal wildfire from Hayden et al. (2022). The dotted line is the 1:1 line. Error bars are omitted for clarity. The identities of select species are shown to highlight key differences/similarities. The same figures are shown in Fig. S10 with positive vertical error bars representing the standard deviations of the measured EFs.
Due to its relevance to Canadian boreal wildfires, the process of estimating emissions using CFFEPS is briefly described here. CFFEPS is the wildfire emissions model in ECCC’s operational air quality forecast system (Moran et al., 2025). Fire emissions are calculated as the product of tabulated EFs (g kg−1), the estimated fire burn area (m−2) and the TFC (kg dry biomass m−1). Fuel consumption in CFFEPS is estimated based on the Canadian Forest FBP system (Natural Resources Canada, 2025b) driven by fire weather conditions for 14 pre-defined FBP fuel types. Combustion is divided into three stages: flaming, smoldering, and residual combustion (details on allocation factors in Sect. S9). Although CFFEPS allows fuel-specific EFs, the current application uses a single set of EFs for all fuels for a given combustion stage.
At present, CFFEPS includes tabulated EFs for PM10, PM2.5, CO, CH4, NMOCG, NOX, NH3, and SO2 other model-required species. Emissions of NMOCG are further speciated to individual VOC using emission speciation profiles for flaming and smoldering/residual combustion, assuming constant MCE values of 0.92 and 0.79, respectively, following Urbanski (2014) and EPA SPECIATEv4.5; henceforward the “CFFEPS profiles”. This is a single set of EF profiles for all fuel types, and as described in the Introduction, the profiles are, for the most part, not based on studies of Canadian boreal wildfires or fuels. Yet, our study adds to the body of literature that demonstrates that NMOCG emission magnitude and speciation profile (i.e., VOC EFs) are impacted by fuel type, combustion behavior, and fuel moisture.
The flaming, smoldering, and residual NMOCG EF used in CFFEPS are 19.85, 33.87, and 56.08 g kg−1, respectively (Chen et al., 2019). Revising our NMOC EF in g C kg−1 to NMOCG EF in g kg−1 for comparison requires knowledge of the NMOC composition and/or mean MW. For a rough comparison, we use the conversion from Hayden et al. (2022) (mean MW of 100 g mol−1 and mean carbon number of 6) to obtain NMOCG EF listed in Table 1. The NMOCG EF for our study, along with the Hayden et al. (2022) (MCE =0.82, NMOC g kg−1) and Urbanski (2014) NMOCG EF for “Wildfire Boreal Forest” (MCE =0.92, NMOC g kg−1) and “Boreal Forest Duff” (MCE =0.79, NMOC g kg−1), are plotted as a function of MCE in Fig. S9. The high total NMOCG EFs for the dry peat fuels [PM (53.8 ± 8.3 g kg−1), PF (58.5 ± 5.3 g kg−1)] lie between the CFFEPS NMOCG EFs for smoldering and residual combustion, near the Urbanski (2014) NMOCG EF, and above the Hayden et al. (2022) NMOCG EF (Fig. S9). Therefore, our results suggest that total NMOCG emissions may be underestimated by CFFEPS for smoldering peat fires. The strong NMOCG-MCE relationship (R2=0.84 we observe may be a useful predictor for total NMOCG emissions. On the other hand, we found that the overall relationship between NMOC (or NMOCG) EF and MCE for MU (dry) deviated from that of the other fuels (Figs. 3 and S9), and the total NMOCG EF for MU (dry) (7.39 ± 3.22 g kg−1) obtained in this study is significantly lower than the CFFEPS NMOCG for flaming combustion. Although MU has a similar fire-integrated MCE as other flaming fuels in this study, it has the highest true combustion efficiency when considering all carbon emissions. The unique emissions behaviour of MU is also noted in the overview paper (Moraes et al., 2026) for other species (i.e., PM2.5, PM10, and mean particle diameter).
Trace gas EFs for PM (dry) and PF (dry) are plotted vs. the CFFEPS smoldering/residual profile EFs in Fig. 7a. The figure includes EF for speciated VOC from this work (solid symbols) as well as other trace gas species (open symbols) reported in the overview paper (Moraes et al., 2026). The speciated VOC EF for the peat fuels are similar to or slightly lower than the corresponding CFFEPS profile EFs, despite the low MCE, with the exception of some CH compounds (e.g., styrene, isoprene). The deviation from linearity indicates differences in interspecies ERs compared to the literature profiles. We also note that differences between our study EFs and the literature EFs could be due to limitations in compound assignment as discussed above (Sect. 2.2). These differences suggest that the current VOC speciation profile used in CFFEPS, and subsequent assignment of individual VOC to lumped species in simplified atmospheric chemical mechanisms may not adequately capture emissions from peat fuels that dominate the boreal forests fuel types in Canada.
Incorporating Canadian-specific EF from this study, as well as recent studies such as Hayden et al. (2022), into emission inventories/databases will improve atmospheric model performance for boreal wildfire and prescribed burning scenarios and provide a more robust basis for air quality and climate assessments. A similar comparison as in Fig. 7a is made between this study and Hayden et al. (2022), aircraft study in Fig. 7b. Overall, the VOCs EF (solid symbols) in this study for peat fuels are consistently similar to or higher than those reported in Hayden et al. (2022), with the exception of only a few compounds (e.g., C3H4O3–pyruvic acid), consistent with the higher degree of smoldering combustion for the peat fuels (i.e., low MCE compared to the wildfire). EFs of inorganic nitrogen species (NO, HONO, and NH3) from the peat-associated fuels were significantly higher. These differences may reflect variations in fuel composition, burning characteristics, and the comparison of fresh emissions in this study with aged aircraft-measured plumes reported by Hayden et al. (2022). Future work to improve emissions in CFFEPS and other wildfire emissions models should focus on deriving EF from boreal biomass types for a greater number of VOC species, particularly low-molecular weight compounds (e.g., C1–C2 VOC) and I/SVOC, compound classes that are both expected to contribute significantly to the total NMOC (Hayden et al., 2022).
Controlled laboratory burns of six Canadian surface and ground fuels were conducted to derive EFs and to systematically assess how variations in fuel characteristics and combustion behavior shape trace gas emissions. Coupling measurements of speciated VOCs with concurrent observations of major carbon species (CO2, CO, CH4), total NMOC, and Nr species (HONO, NH3, NOX) enabled improved understanding of gas-phase carbon and nitrogen emissions associated with boreal wildfires. Canadian boreal peat fuels (i.e., peat with surface mulch, peat with moss) burn with very low MCE and are prone to residual smoldering combustion, resulting in very high NMOC and CO emissions compared to other fuel types. We found that total NMOC emissions were well-described by MCE and with a NMOC-MCE relationship independent of fuel type, with the exception of MU, which has very low NMOC emissions. While the relationship between individual VOC EF and MCE was found to be well-described and relatively independent of fuel identity for several VOC species, this was not universally observed, indicating that predicting EF based on MCE may not be appropriate in all cases (Yokelson et al., 2013; Andreae, 2019; Sekimoto et al., 2018). Differences in emissions behaviour between the peat fuels suggest that human disturbance may affect wildfire emissions from peatlands.
Wildfires consume a diverse combination of surface and crown fuels, with combustion conditions and moisture content in wildland vegetation fluctuating with climate, meteorological conditions, and fuel structure and arrangement. While controlled burn studies such as this one provide key insights, further aircraft studies targeting Canadian boreal wildfires are also needed to capture real-world emissions. Ultimately, integrating high-resolution laboratory data with field measurements will enable more robust simulations of biomass burning emissions and improve predictions of air quality and climate impacts under diverse combustion scenarios.
Data corresponding to this manuscript have been included herein or are available at the data repository Borealis: https://doi.org/10.5683/SP3/OGR3J1 (Afroz, 2026).
The supplement related to this article is available online at https://doi.org/10.5194/acp-26-16101-2026-supplement.
RA, HS, BHI, SGM, AHM, ST, CL, JJBW, OO, AL, and SNW carried out the experiments, with RA, HS, SGM, AHM, ST, OO, and SNW performed data curation and formal analysis. GM prepared and collected samples and, together with SGM, JO, JL, JA, RZ, SNW, and AC, contributed to the study design. JO and RZ planned and oversaw the laboratory campaign. SGM, AC, JO, JL, JA, RZ, and SNW supervised students and personnel and provided scientific guidance. RMS and CM provided instrumentation, with RMS additionally contributing to the study design. RA and SNW prepared the original draft with contributions from all authors. HS, BHI, SGM, JJBW, AL, GM, RMS, CM, AC, JO, JL, JA, and RZ reviewed and commented on the manuscript.
At least one of the (co-)authors is a member of the editorial board of Atmospheric Chemistry and Physics. The peer-review process was guided by an independent editor, and the authors also have no other competing interests to declare.
Publisher's note: Copernicus Publications remains neutral with regard to jurisdictional claims made in the text, published maps, institutional affiliations, or any other geographical representation in this paper. The authors bear the ultimate responsibility for providing appropriate place names. Views expressed in the text are those of the authors and do not necessarily reflect the views of the publisher.
The authors gratefully acknowledge the Northern Forestry Centre for their significant efforts to prepare for and support the lab campaign. RA acknowledges financial support from the Alberta Innovates Graduate Student Scholarship (AI GSS). BHI acknowledges the Natural Sciences and Engineering Research Council of Canada (NSERC) for a graduate student scholarship and Environment and Climate Change Canada (ECCC) for a graduate student supplement. Thank you to Jack Chen and Debora Griffin at ECCC for useful discussion and for reviewing the manuscript.
The study was funded by the Environmental Damages Fund of the Government of Canada through its Climate Action and Awareness Fund.
This paper was edited by Eleanor Browne and reviewed by three anonymous referees.
Abatzoglou, J. T. and Williams, A. P.: Impact of anthropogenic climate change on wildfire across western US forests, Proc. Natl. Acad. Sci. USA, 113, 11770–11775, https://doi.org/10.1073/pnas.1607171113, 2016. a, b
Afroz, R.: Replication data for: Emission factors for gaseous species measured at the individual burn level using I-CIMS and Vocus PTR-MS, Borealis [data set], https://doi.org/10.5683/SP3/OGR3J1, 2026. a
Agee, J. K. and Skinner, C. N.: Basic principles of forest fuel reduction treatments, For. Ecol. Manage., 211, 83–96, https://doi.org/10.1016/j.foreco.2005.01.034, 2005. a, b
Akagi, S. K., Yokelson, R. J., Wiedinmyer, C., Alvarado, M. J., Reid, J. S., Karl, T., Crounse, J. D., and Wennberg, P. O.: Emission factors for open and domestic biomass burning for use in atmospheric models, Atmos. Chem. Phys., 11, 4039–4072, https://doi.org/10.5194/acp-11-4039-2011, 2011. a, b, c, d, e, f, g, h, i, j, k, l, m, n, o
Alvarado, M. J. and Prinn, R. G.: Formation of ozone and growth of aerosols in young smoke plumes from biomass burning: 1. Lagrangian parcel studies, J. Geophys. Res. Atmos., 114, https://doi.org/10.1029/2008JD011144, 2009. a
Amiro, B., Todd, J., Wotton, B., Logan, K., Flannigan, M., Stocks, B., Mason, J., Martell, D., and Hirsch, K. G.: Direct carbon emissions from Canadian forest fires, 1959–1999, Can. J. For. Res., 31, 512–525, https://doi.org/10.1139/x00-197, 2001. a
Amiro, B., Cantin, A., Flannigan, M., and De Groot, W.: Future emissions from Canadian boreal forest fires, Can. J. For. Res., 39, 383–395, https://doi.org/10.1139/X08-154, 2009. a
Andreae, M. O.: Emission of trace gases and aerosols from biomass burning – an updated assessment, Atmos. Chem. Phys., 19, 8523–8546, https://doi.org/10.5194/acp-19-8523-2019, 2019. a, b, c, d, e, f, g, h, i, j, k, l, m
Andreae, M. O. and Merlet, P.: Emission of trace gases and aerosols from biomass burning, Global Biogeochem. Cy., 15, 955–966, https://doi.org/10.1029/2000GB001382, 2001. a, b
Bertschi, I., Yokelson, R. J., Ward, D. E., Babbitt, R. E., Susott, R. A., Goode, J. G., and Hao, W. M.: Trace gas and particle emissions from fires in large diameter and belowground biomass fuels, J. Geophys. Res. Atmos., 108, https://doi.org/10.1029/2002JD002100, 2003. a, b, c
Binte Shahid, S., Lacey, F. G., Wiedinmyer, C., Yokelson, R. J., and Barsanti, K. C.: NEIVAv1.0: Next-generation Emissions InVentory expansion of Akagi et al. (2011) version 1.0, Geosci. Model Dev., 17, 7679–7711, https://doi.org/10.5194/gmd-17-7679-2024, 2024 a, b, c, d, e, f
Biomass Burning in Canada: Addressing Climate and Air Quality Impacts, https://bbcan.net/ (last access: 3 March 2026), 2021. a
Burling, I. R., Yokelson, R. J., Griffith, D. W. T., Johnson, T. J., Veres, P., Roberts, J. M., Warneke, C., Urbanski, S. P., Reardon, J., Weise, D. R., Hao, W. M., and de Gouw, J.: Laboratory measurements of trace gas emissions from biomass burning of fuel types from the southeastern and southwestern United States, Atmos. Chem. Phys., 10, 11115–11130, https://doi.org/10.5194/acp-10-11115-2010, 2010. a, b, c, d, e, f, g, h, i
Campos, I., Abrantes, N., Pereira, P., Micaelo, A. C., Vale, C., and Keizer, J. J.: Forest fires as potential triggers for production and mobilization of polycyclic aromatic hydrocarbons to the terrestrial ecosystem, Land Degrad. Dev., 30, 2360–2370, https://doi.org/10.1002/ldr.3427, 2019. a
Canadian Interagency Forest Fire Centre: Canada Report 2016, https://www.ciffc.ca/sites/default/files/2019-03/2016_canada_report_2017_05_15_v02.pdf (last access: 9 October 2025), 2017. a
Carter, T. S., Heald, C. L., Jimenez, J. L., Campuzano-Jost, P., Kondo, Y., Moteki, N., Schwarz, J. P., Wiedinmyer, C., Darmenov, A. S., da Silva, A. M., and Kaiser, J. W.: How emissions uncertainty influences the distribution and radiative impacts of smoke from fires in North America, Atmos. Chem. Phys., 20, 2073–2097, https://doi.org/10.5194/acp-20-2073-2020, 2020. a, b
Chen, J., Anderson, K., Pavlovic, R., Moran, M. D., Englefield, P., Thompson, D. K., Munoz-Alpizar, R., and Landry, H.: The FireWork v2.0 air quality forecast system with biomass burning emissions from the Canadian Forest Fire Emissions Prediction System v2.03, Geosci. Model Dev., 12, 3283–3310, https://doi.org/10.5194/gmd-12-3283-2019, 2019. a, b, c, d, e, f
Chen, L.-W. A., Moosmüller, H., Arnott, W. P., Chow, J. C., Watson, J. G., Susott, R. A., Babbitt, R. E., Wold, C. E., Lincoln, E. N., and Hao, W. M.: Emissions from laboratory combustion of wildland fuels: Emission factors and source profiles, Environ. Sci. Technol., 41, 4317–4325, https://doi.org/10.1021/es062364i, 2007. a
Chen, L.-W. A., Verburg, P., Shackelford, A., Zhu, D., Susfalk, R., Chow, J. C., and Watson, J. G.: Moisture effects on carbon and nitrogen emission from burning of wildland biomass, Atmos. Chem. Phys., 10, 6617–6625, https://doi.org/10.5194/acp-10-6617-2010, 2010 a, b
Chen, Q., Zhao, Y., Zheng, B., and Zhang, L.: Unexpected high ammonia emissions from boreal fires in 2021 and 2023, Geophys. Res. Lett., 52, e2024GL112396, https://doi.org/10.1029/2024GL112396, 2025. a
Coggon, M. M., Veres, P. R., Yuan, B., Koss, A., Warneke, C., Gilman, J. B., Lerner, B. M., Peischl, J., Aikin, K. C., Stockwell, C. E., Hatch, L. E., Ryerson, T. B., Roberts, J. M., Yokelson, R. J., and de Gouw, J. A.: Emissions of nitrogen-containing organic compounds from the burning of herbaceous and arboraceous biomass: Fuel composition dependence and the variability of commonly used nitrile tracers, Geophys. Res. Lett., 43, 9903–9912, https://doi.org/10.1002/2016GL070562, 2016. a
Copernicus Atmosphere Monitoring Service: Global fire emissions (CAMS GFAS), https://atmosphere.copernicus.eu/global-fire-emissions (last access: 23 December 2025), 2022. a
Crutzen, P. J. and Andreae, M. O.: Biomass burning in the tropics: Impact on atmospheric chemistry and biogeochemical cycles, Science, 250, 1669–1678, https://doi.org/10.1126/science.250.4988.1669, 1990. a
Cubison, M. J., Ortega, A. M., Hayes, P. L., Farmer, D. K., Day, D., Lechner, M. J., Brune, W. H., Apel, E., Diskin, G. S., Fisher, J. A., Fuelberg, H. E., Hecobian, A., Knapp, D. J., Mikoviny, T., Riemer, D., Sachse, G. W., Sessions, W., Weber, R. J., Weinheimer, A. J., Wisthaler, A., and Jimenez, J. L.: Effects of aging on organic aerosol from open biomass burning smoke in aircraft and laboratory studies, Atmos. Chem. Phys., 11, 12049–12064, https://doi.org/10.5194/acp-11-12049-2011, 2011. a
De Gouw, J. and Warneke, C.: Measurements of volatile organic compounds in the earth's atmosphere using proton-transfer-reaction mass spectrometry, Mass Spectrom. Rev., 26, 223–257, https://doi.org/10.1002/mas.20119, 2007. a, b
De Groot, W., Pritchard, J., and Lynham, T.: Forest floor fuel consumption and carbon emissions in Canadian boreal forest fires, Can. J. For. Res., 39, 367–382, https://doi.org/10.1139/X08-192, 2009. a, b
Dyakonov, A. J., Walker, R. T., Brown, C. A., Perini, F. R., Passer, D. S., Guan, J., and Robinson, E. A.: Studies of the formation of smoke phenols, Beitr. Tabakforsch. Int., 23, 68–84, https://doi-org/10.2478/cttr-2013-0850, 2008. a
Foresty Canada, Fire Danger Group: Development and Structure of the Canadian Forest Fire Behaviour Prediction System; Information report ST-X-3, https://ostr-backend-prod.azure.cloud.nrcan-rncan.gc.ca/server/api/core/bitstreams/c2935183-f5eb-4193-8e6e-30669d0c0614/content (last access: 23 December 2025), 1992. a
Gilman, J. B., Lerner, B. M., Kuster, W. C., Goldan, P. D., Warneke, C., Veres, P. R., Roberts, J. M., de Gouw, J. A., Burling, I. R., and Yokelson, R. J.: Biomass burning emissions and potential air quality impacts of volatile organic compounds and other trace gases from fuels common in the US, Atmos. Chem. Phys., 15, 13915–13938, https://doi.org/10.5194/acp-15-13915-2015, 2015. a, b, c, d, e, f
Goode, J. G., Yokelson, R. J., Susott, R. A., and Ward, D. E.: Trace gas emissions from laboratory biomass fires measured by open-path Fourier transform infrared spectroscopy: Fires in grass and surface fuels, J. Geophys. Res. Atmos., 104, 21237–21245, https://doi.org/10.1029/1999JD900360, 1999. a, b, c
Goode, J. G., Yokelson, R. J., Ward, D. E., Susott, R. A., Babbitt, R. E., Davies, M. A., and Hao, W. M.: Measurements of excess O3, CO2, CO, CH4, C2H4, C2H2, HCN, NO, NH3, HCOOH, CH3COOH, HCHO, and CH3OH in 1997 Alaskan biomass burning plumes by airborne Fourier transform infrared spectroscopy (AFTIR), J. Geophys. Res. Atmos., 105, 22147–22166, https://doi.org/10.1029/2000JD900287, 2000. a, b
Government of Canada: Public Safety Canada. Parliamentary Committee Notes: Canadian Wildfires, https://www.publicsafety.gc.ca/cnt/trnsprnc/brfng-mtrls/prlmntry-bndrs/20240322/16-en.aspx (last access: 9 October 2025), 2024. a
Government of Canada: Peatland fires and carbon emissions, https://natural-resources.canada.ca/forest-forestry/wildland-fires/peatland-fires-carbon-emissions#research (last access: 3 March 2026), 2026. a, b
Griffin, D., Chen, J., Anderson, K., Makar, P., McLinden, C. A., Dammers, E., and Fogal, A.: Biomass burning CO emissions: exploring insights through TROPOMI-derived emissions and emission coefficients, Atmos. Chem. Phys., 24, 10159–10186, https://doi.org/10.5194/acp-24-10159-2024, 2024. a
Hatch, L. E., Rivas-Ubach, A., Jen, C. N., Lipton, M., Goldstein, A. H., and Barsanti, K. C.: Measurements of I/SVOCs in biomass-burning smoke using solid-phase extraction disks and two-dimensional gas chromatography, Atmos. Chem. Phys., 18, 17801–17817, https://doi.org/10.5194/acp-18-17801-2018, 2018. a, b
Hayden, K. L., Li, S.-M., Liggio, J., Wheeler, M. J., Wentzell, J. J. B., Leithead, A., Brickell, P., Mittermeier, R. L., Oldham, Z., Mihele, C. M., Staebler, R. M., Moussa, S. G., Darlington, A., Wolde, M., Thompson, D., Chen, J., Griffin, D., Eckert, E., Ditto, J. C., He, M., and Gentner, D. R.: Reconciling the total carbon budget for boreal forest wildfire emissions using airborne observations, Atmos. Chem. Phys., 22, 12493–12523, https://doi.org/10.5194/acp-22-12493-2022, 2022. a, b, c, d, e, f, g, h, i, j, k, l, m, n, o, p, q, r, s, t, u, v, w, x, y
Hecobian, A., Liu, Z., Hennigan, C. J., Huey, L. G., Jimenez, J. L., Cubison, M. J., Vay, S., Diskin, G. S., Sachse, G. W., Wisthaler, A., Mikoviny, T., Weinheimer, A. J., Liao, J., Knapp, D. J., Wennberg, P. O., Kürten, A., Crounse, J. D., Clair, J. St., Wang, Y., and Weber, R. J.: Comparison of chemical characteristics of 495 biomass burning plumes intercepted by the NASA DC-8 aircraft during the ARCTAS/CARB-2008 field campaign, Atmos. Chem. Phys., 11, 13325–13337, https://doi.org/10.5194/acp-11-13325-2011, 2011. a
Hu, Y. and Rein, G.: Development of gas signatures of smouldering peat wildfire from emission factors, Int. J. Wildland Fire, 31, 1014–1032, https://doi.org/10.1071/WF21093, 2022. a
Hu, Y., Fernandez-Anez, N., Smith, T. E., and Rein, G.: Review of emissions from smouldering peat fires and their contribution to regional haze episodes, Int. J. Wildland Fire, 27, 293–312, https://doi.org/10.1071/WF17084, 2018. a, b, c
Hu, Y., Christensen, E., Restuccia, F., and Rein, G.: Transient gas and particle emissions from smouldering combustion of peat, Proc. Combust. Inst., 37, 4035–4042, https://doi.org/10.1016/j.proci.2018.06.008, 2019. a, b
Jaffe, D. A. and Wigder, N. L.: Ozone production from wildfires: A critical review, Atmos. Environ., 51, 1–10, https://doi.org/10.1016/j.atmosenv.2011.11.063, 2012. a, b
Jaffe, D. A., O’Neill, S. M., Larkin, N. K., Holder, A. L., Peterson, D. L., Halofsky, J. E., and Rappold, A. G.: Wildfire and prescribed burning impacts on air quality in the United States, J. Air Waste Manag. Assoc., 70, 583–615, https://doi.org/10.1080/10962247.2020.1749731, 2020. a
Ji, Y., Huey, L. G., Tanner, D. J., Lee, Y. R., Veres, P. R., Neuman, J. A., Wang, Y., and Wang, X.: A vacuum ultraviolet ion source (VUV-IS) for iodide–chemical ionization mass spectrometry: a substitute for radioactive ion sources, Atmos. Meas. Tech., 13, 3683–3696, https://doi.org/10.5194/amt-13-3683-2020, 2020. a, b, c
Kaiser, J. W., Heil, A., Andreae, M. O., Benedetti, A., Chubarova, N., Jones, L., Morcrette, J.-J., Razinger, M., Schultz, M. G., Suttie, M., and van der Werf, G. R.: Biomass burning emissions estimated with a global fire assimilation system based on observed fire radiative power, Biogeosciences, 9, 527–554, https://doi.org/10.5194/bg-9-527-2012, 2012. a
Kallenborn, R., Halsall, C., Dellong, M., and Carlsson, P.: The influence of climate change on the global distribution and fate processes of anthropogenic persistent organic pollutants, J. Environ. Monit., 14, 2854–2869, https://doi.org/10.1039/C2EM30519D, 2012. a
Kleffmann, J.: Daytime sources of nitrous acid (HONO) in the atmospheric boundary layer, Chem. Phys. Chem., 8, 1137–1144, https://doi.org/10.1002/cphc.200700016, 2007. a
Koppmann, R., von Czapiewski, K., and Reid, J. S.: A review of biomass burning emissions, part I: gaseous emissions of carbon monoxide, methane, volatile organic compounds, and nitrogen containing compounds, Atmos. Chem. Phys. Discuss., 5, 10455–10516, https://doi.org/10.5194/acpd-5-10455-2005, 2005. a
Koss, A. R., Warneke, C., Yuan, B., Coggon, M. M., Veres, P. R., and de Gouw, J. A.: Evaluation of NO+ reagent ion chemistry for online measurements of atmospheric volatile organic compounds, Atmos. Meas. Tech., 9, 2909–2925, https://doi.org/10.5194/amt-9-2909-2016, 2016. a
Koss, A. R., Sekimoto, K., Gilman, J. B., Selimovic, V., Coggon, M. M., Zarzana, K. J., Yuan, B., Lerner, B. M., Brown, S. S., Jimenez, J. L., Krechmer, J., Roberts, J. M., Warneke, C., Yokelson, R. J., and de Gouw, J.: Non-methane organic gas emissions from biomass burning: identification, quantification, and emission factors from PTR-ToF during the FIREX 2016 laboratory experiment, Atmos. Chem. Phys., 18, 3299–3319, https://doi.org/10.5194/acp-18-3299-2018, 2018. a, b, c, d, e, f, g, h, i, j, k
Krechmer, J., Lopez-Hilfiker, F., Koss, A., Hutterli, M., Stoermer, C., Deming, B., Kimmel, J., Warneke, C., Holzinger, R., Jayne, J., Worsnop, D., Fuhrer, K., Gonin, M., and de Gouw, J.: Evaluation of a new reagent-ion source and focusing ion–molecule reactor for use in proton-transfer-reaction mass spectrometry, Anal. Chem., 90, 12011–12018, https://doi.org/10.1021/acs.analchem.8b02641, 2018. a
Kreider, M. R., Higuera, P. E., Parks, S. A., Rice, W. L., White, N., and Larson, A. J.: Fire suppression makes wildfires more severe and accentuates impacts of climate change and fuel accumulation, Nat. Commun., 15, 2412, https://doi.org/10.1038/s41467-024-46702-0, 2024. a
Kuhlbusch, T. A., Lobert, J. M., Crutzen, P. J., and Warneck, P.: Molecular nitrogen emissions from denitrification during biomass burning, Nature, 351, 135–137, https://doi.org/10.1038/351135a0, 1991. a
Larkin, N. K., Raffuse, S. M., Huang, S., Pavlovic, N., Lahm, P., and Rao, V.: The comprehensive fire information reconciled emissions (CFIRE) inventory: Wildland fire emissions developed for the 2011 and 2014 US National Emissions Inventory, J. Air Waste Manag. Assoc., 70, 1165–1185, https://doi.org/10.1080/10962247.2020.1802365, 2020. a
Lin, M., Horowitz, L. W., Hu, L., and Permar, W.: Reactive nitrogen partitioning enhances the contribution of Canadian wildfire plumes to US ozone air quality, Geophys. Res. Lett., 51, e2024GL109369, https://doi.org/10.1029/2024GL109369, 2024. a
Lindaas, J., Pollack, I. B., Garofalo, L. A., Pothier, M. A., Farmer, D. K., Kreidenweis, S. M., Campos, T. L., Flocke, F., Weinheimer, A. J., Montzka, D. D., Tyndall, G. S., Palm, B. B., Peng, Q., Thornton, J. A., Permar, W., Wielgasz, C., Hu, L., Ottmar, R. D., Restaino, J. C., Hudak, A. T., Ku, I.-T., Zhou, Y., Sive, B. C., Sullivan, A., Collett, J. L., and Fischer, E. V.: Emissions of reactive nitrogen from Western US wildfires during summer 2018, J. Geophys. Res. Atmos., 126, e2020JD032657, https://doi.org/10.1029/2020JD032657, 2021a. a, b, c, d, e
Lindaas, J., Pollack, I. B., Juncosa Calahorrano, J., O'Dell, K., Garofalo, L. A., Pothier, M. A., Farmer, D. K., Kreidenweis, S. M., Campos, T., Flocke, F., Weinheimer, A. J., Montzka, D. D., Tyndall, G. S., Apel, E. C., Hills, A. J., Hornbrook, R. S., Palm, B. B., Peng, Q., Thornton, J. A., Permar, W., Wielgasz, C., Hu, L., Pierce, J. R., Collett, J. L., Sullivan, A. P., and Fischer, E. V.: Empirical insights into the fate of ammonia in western US wildfire smoke plumes, J. Geophys. Res. Atmos., 126, e2020JD033730, https://doi.org/10.1029/2020JD033730, 2021b. a
Link, M. F., Claflin, M. S., Cecelski, C. E., Akande, A. A., Kilgour, D., Heine, P. A., Coggon, M., Stockwell, C. E., Jensen, A., Yu, J., Huynh, H. N., Ditto, J. C., Warneke, C., Dresser, W., Gemmell, K., Jorga, S., Robertson, R. L., de Gouw, J., Bertram, T., Abbatt, J. P. D., Borduas-Dedekind, N., and Poppendieck, D.: Product ion distributions using H3O+ proton-transfer-reaction time-of-flight mass spectrometry (PTR-ToF-MS): mechanisms, transmission effects, and instrument-to-instrument variability, Atmos. Meas. Tech., 18, 1013–1038, https://doi.org/10.5194/amt-18-1013-2025, 2025 a
Liu, T., Liu, Q., Li, Z., Huo, L., Chan, M., Li, X., Zhou, Z., and Chan, C. K.: Emission of volatile organic compounds and production of secondary organic aerosol from stir-frying spices, Sci. Total Environ., 599, 1614–1621, https://doi-org/10.1016/j.scitotenv.2017.05.147, 2017a. a
Liu, X., Huey, L. G., Yokelson, R. J., Selimovic, V., Simpson, I. J., Müller, M., Jimenez, J. L., Campuzano-Jost, P., Beyersdorf, A. J., Blake, D. R., Butterfield, Z., Choi, Y., Crounse, J. D., Day, D. A., Diskin, G. S., Dubey, M. K., Fortner, E., Hanisco, T. F., Hu, W., King, L. E., Kleinman, L., Meinardi, S., Mikoviny, T., Onasch, T. B., Palm, B. B., Peischl, J., Pollack, I. B., Ryerson, T. B., Sachse, G. W., Sedlacek, A. J., Shilling, J. E., Springston, S., St. Clair, J. M., Tanner, D. J., Teng, A. P., Wennberg, P. O., Wisthaler, A., and Wolfe, G. M.: Airborne measurements of western US wildfire emissions: Comparison with prescribed burning and air quality implications, J. Geophys. Res. Atmos., 122, 6108–6129, https://doi.org/10.1002/2016JD026315, 2017b. a, b
Los Gatos Research: H2S/NH3 Analyzer, https://www.yodify.com/Products/WXYooZ/www.yodify.com/Products/WXYooZ/H-S-NH-Analyzer (last access: 26 December 2025), 2025. a
Majluf, F. Y., Krechmer, J. E., Daube, C., Knighton, W. B., Dyroff, C., Lambe, A. T., Fortner, E. C., Yacovitch, T. I., Roscioli, J. R., Herndon, S. C., Worsnop, D. R., and Canagaratna, M. R.: Mobile near-field measurements of biomass burning volatile organic compounds: Emission ratios and factor analysis, Environ. Sci. Technol. Lett., 9, 383–390, https://doi.org/10.1021/acs.estlett.2c00194, 2022. a, b
May, A. A., Levin, E. J., Hennigan, C. J., Riipinen, I., Lee, T., Collett Jr, J. L., Jimenez, J. L., Kreidenweis, S. M., and Robinson, A. L.: Gas-particle partitioning of primary organic aerosol emissions: 3. Biomass burning, J. Geophys. Res.: Atmos., 118, 11–327, https://doi.org/10.1002/jgrd.50828, 2013. a
Miller, D. J., Sun, K., Zondlo, M. A., Kanter, D., Dubovik, O., Welton, E. J., Winker, D. M., and Ginoux, P.: Assessing boreal forest fire smoke aerosol impacts on US air quality: A case study using multiple data sets, J. Geophys. Res. Atmos., 116, https://doi.org/10.1029/2011JD016170, 2011. a
Mohr, C., Lopez-Hilfiker, F. D., Zotter, P., Prévôt, A. S. H., Xu, L., Ng, N. L., Herndon, S. C., Williams, L. R., Franklin, J. P., Zahniser, M. S., Worsnop, D. R., Knighton, W. B., Aiken, A. C., Gorkowski, K. J., Dubey, M. K., Allan, J. D., and Thornton, J. A.: Contribution of nitrated phenols to wood burning brown carbon light absorption in Detling, United Kingdom during winter time, Environ. Sci. Technol., 47, 6316–6324, https://doi.org/10.1021/es400683v, 2013. a
Moore, B., Thompson, D. K., Schroeder, D., Johnston, J. M., and Hvenegaard, S.: Using infrared imagery to assess fire behaviour in a mulched fuel bed in black spruce forests, Fire, 3, 37, https://doi.org/10.3390/fire3030037, 2020. a
Moraes, A. H., Talebian, S., Afroz, R., Al-Jabiri, M. H., Chan, A. W. H., Chang, R. Y.-W., Chen, K., Corbin, J. C., Drinovec, L., Isenor, B. H., Lee, A., Liggio, J., Liu-Kang, C., Marshall, G., Moallemi, A., Mocnik, G., Moussa, S. G., Olfert, O., Saleh, M., Sipkens, T. A., Shen, H., Wentzell, J. J. B., Wren, S. N., Yus-Díez, J., Hayes, P. L., Abbatt, J. P. D., Olfert, J., and Zhao, R.: Combustion Characteristics and Emission Factors of Trace Gases and Particulate Matter from Biomass Relevant to Canadian Wildfires: Overview of the 2024 BBCan Campaign, Am. Geophys. Union, https://doi.org/10.22541/essoar.15002871/v1, 2026. a, b, c, d, e, f, g, h, i, j, k, l, m, n, o, p
Moran, M. D., Savic-Jovcic, V., Stroud, C. A., Ménard, S., Gong, W., Zhang, J., Zheng, Q., Chen, J., Akingunola, A., Lupu, A., Menelaou, K., and Munoz-Alpizar, R.: Operational chemical weather forecasting with the ECCC online Regional Air Quality Deterministic Prediction System version 023 (RAQDPS023) – Part 1: System description, EGUsphere [preprint], https://doi.org/10.5194/egusphere-2025-4323, 2025. a
Natural Resources Canada: How much forest does Canada have?, https://natural-resources.canada.ca/forest-forestry/state-canada-forests/much-forest-does-canada-have (last access: 9 October 2025), 2025a. a
Natural Resources Canada: Canadian Wildland Fire Information System, FBP Fuel Type Descriptions, https://cwfis.cfs.nrcan.gc.ca/background/fueltypes/c (last access: 23 December 2025), 2025b. a, b, c
Pagonis, D., Krechmer, J. E., de Gouw, J., Jimenez, J. L., and Ziemann, P. J.: Effects of gas–wall partitioning in Teflon tubing and instrumentation on time-resolved measurements of gas-phase organic compounds, Atmos. Meas. Tech., 10, 4687–4696, https://doi.org/10.5194/amt-10-4687-2017, 2017. a
Pagonis, D., Selimovic, V., Campuzano-Jost, P., Guo, H., Day, D. A., Schueneman, M. K., Nault, B. A., Coggon, M. M., DiGangi, J. P., Diskin, G. S., Fortner, E. C., Gargulinski, E. M., Gkatzelis, G. I., Hair, J. W., Herndon, S. C., Holmes, C. D., Katich, J. M., Nowak, J. B., Perring, A. E., Saide, P., Shingler, T. J., Soja, A. J., Thapa, L. H., Warneke, C., Wiggins, E. B., Wisthaler, A., Yacovitch, T. I., Yokelson, R. J., and Jimenez, J. L.: Impact of biomass burning organic aerosol volatility on smoke concentrations downwind of fires, Environ. Sci. Technol., 57, 17011–17021, https://doi.org/10.1021/acs.est.3c05017, 2023. a
Pan, X., Ichoku, C., Chin, M., Bian, H., Darmenov, A., Colarco, P., Ellison, L., Kucsera, T., da Silva, A., Wang, J., Oda, T., and Cui, G.: Six global biomass burning emission datasets: intercomparison and application in one global aerosol model, Atmos. Chem. Phys., 20, 969–994, https://doi.org/10.5194/acp-20-969-2020, 2020. a
Patil Shirish, S., Kelkar Tushar, S., and Bhalerao Satish, A.: Mulching: A soil and water conservation practice, Res. J. Agric. For. Sci., 1, 26–29, https://www.isca.me/AGRI_FORESTRY/Archive/v1/i3/5.ISCA-RJAFS-2013-023.pdf (last access: 17 October 2026), 2013. a
Permar, W., Wang, Q., Selimovic, V., Wielgasz, C., Yokelson, R. J., Hornbrook, R. S., Hills, A. J., Apel, E. C., Ku, I.-T., Zhou, Y., Sive, B. C., Sullivan, A. P., Collett, J. L., Campos, T. L., Palm, B. B., Peng, Q., Thornton, J. A., Garofalo, L. A., Farmer, D. K., Kreidenweis, S. M., Levin, E. J. T., DeMott, P. J., Flocke, F., Fischer, E. V., and Hu, L.: Emissions of trace organic gases from Western US wildfires based on WE-CAN aircraft measurements, J. Geophys. Res. Atmos., 126, e2020JD033838, https://doi.org/10.1029/2020JD033838, 2021. a, b, c, d, e, f, g, h, i, j, k, l
Randerson, J., van der Werf, G., Giglio, L., Collatz, G., and Kasibhatla, P.: Global fire emissions database, version 3.1, ORNL DAAC [data set], https://doi.org/10.3334/ORNLDAAC/1191, 2013. a, b
Rein, G.: Smouldering fires and natural fuels, in: Fire Phenomena and the Earth System: An Interdisciplinary Guide to Fire Science, edited by: Belcher, C. M., John Wiley & Sons, Ltd, Chap. 2, 15–33, https://doi.org/10.1002/9781118529539.ch2, 2013. a
Rein, G., Cleaver, N., Ashton, C., Pironi, P., and Torero, J. L.: The severity of smouldering peat fires and damage to the forest soil, Catena, 74, 304–309, https://doi.org/10.1016/j.catena.2008.05.008, 2008. a
Riva, M., Pospisilova, V., Frege, C., Perrier, S., Bansal, P., Jorga, S., Sturm, P., Thornton, J. A., Rohner, U., and Lopez-Hilfiker, F.: Evaluation of a reduced-pressure chemical ion reactor utilizing adduct ionization for the detection of gaseous organic and inorganic species, Atmos. Meas. Tech., 17, 5887–5901, https://doi.org/10.5194/amt-17-5887-2024, 2024. a, b
Roberts, J. M., Stockwell, C. E., Yokelson, R. J., de Gouw, J., Liu, Y., Selimovic, V., Koss, A. R., Sekimoto, K., Coggon, M. M., Yuan, B., Zarzana, K. J., Brown, S. S., Santin, C., Doerr, S. H., and Warneke, C.: The nitrogen budget of laboratory-simulated western US wildfires during the FIREX 2016 Fire Lab study, Atmos. Chem. Phys., 20, 8807–8826, https://doi.org/10.5194/acp-20-8807-2020, 2020. a, b, c, d, e, f, g, h, i
Rogers, H. M., Ditto, J. C., and Gentner, D. R.: Evidence for impacts on surface-level air quality in the northeastern US from long-distance transport of smoke from North American fires during the Long Island Sound Tropospheric Ozone Study (LISTOS) 2018, Atmos. Chem. Phys., 20, 671–682, https://doi.org/10.5194/acp-20-671-2020, 2020. a
Romanias, M. N., Coggon, M. M., Al Ali, F., Burkholder, J. B., Dagaut, P., Decker, Z., Warneke, C., Stockwell, C. E., Roberts, J. M., Tomas, A., Houzel, N., Coeur, C., and Brown, S. S.: Emissions and Atmospheric Chemistry of Furanoids from Biomass Burning: Insights from Laboratory to Atmospheric Observations, ACS Earth Space Chem., 8, 857–899, https://doi.org/10.1021/acsearthspacechem.3c00226, 2024. a, b, c
Seinfeld, J. H. and Pandis, S. N.: Atmospheric chemistry and physics: from air pollution to climate change, John Wiley & Sons, 3rd edn., ISBN 1119221166, 2016. a
Sekimoto, K., Koss, A. R., Gilman, J. B., Selimovic, V., Coggon, M. M., Zarzana, K. J., Yuan, B., Lerner, B. M., Brown, S. S., Warneke, C., Yokelson, R. J., Roberts, J. M., and de Gouw, J.: High- and low-temperature pyrolysis profiles describe volatile organic compound emissions from western US wildfire fuels, Atmos. Chem. Phys., 18, 9263–9281, https://doi.org/10.5194/acp-18-9263-2018, 2018. a, b, c, d, e, f, g, h, i
Selimovic, V., Yokelson, R. J., McMeeking, G. R., and Coefield, S.: In situ measurements of trace gases, PM, and aerosol optical properties during the 2017 NW US wildfire smoke event, Atmos. Chem. Phys., 19, 3905–3926, https://doi.org/10.5194/acp-19-3905-2019, 2019. a, b, c, d, e, f, g, h
Simon, H., Beck, L., Bhave, P. V., Divita, F., Hsu, Y., Luecken, D., Mobley, J. D., Pouliot, G. A., Reff, A., Sarwar, G., and Strum, M.: The development and uses of EPA’s SPECIATE database, Atmos. Pollut. Res., 1, 196–206, https://doi.org/10.5094/APR.2010.026, 2010. a
Simpson, I. J., Akagi, S. K., Barletta, B., Blake, N. J., Choi, Y., Diskin, G. S., Fried, A., Fuelberg, H. E., Meinardi, S., Rowland, F. S., Vay, S. A., Weinheimer, A. J., Wennberg, P. O., Wiebring, P., Wisthaler, A., Yang, M., Yokelson, R. J., and Blake, D. R.: Boreal forest fire emissions in fresh Canadian smoke plumes: C1–C10 volatile organic compounds (VOCs), CO2, CO, NO2, NO, HCN and CH3CN, Atmos. Chem. Phys., 11, 6445–6463, https://doi.org/10.5194/acp-11-6445-2011, 2011. a, b, c, d, e, f, g, h
Sommers, W. T., Loehman, R. A., and Hardy, C. C.: Wildland fire emissions, carbon, and climate: Science overview and knowledge needs, For. Ecol. Manage., 317, 1–8, https://doi.org/10.1016/j.foreco.2013.12.014, 2014. a
Stockwell, C. E., Yokelson, R. J., Kreidenweis, S. M., Robinson, A. L., DeMott, P. J., Sullivan, R. C., Reardon, J., Ryan, K. C., Griffith, D. W. T., and Stevens, L.: Trace gas emissions from combustion of peat, crop residue, domestic biofuels, grasses, and other fuels: configuration and Fourier transform infrared (FTIR) component of the fourth Fire Lab at Missoula Experiment (FLAME-4), Atmos. Chem. Phys., 14, 9727–9754, https://doi.org/10.5194/acp-14-9727-2014, 2014. a, b
Stockwell, C. E., Veres, P. R., Williams, J., and Yokelson, R. J.: Characterization of biomass burning emissions from cooking fires, peat, crop residue, and other fuels with high-resolution proton-transfer-reaction time-of-flight mass spectrometry, Atmos. Chem. Phys., 15, 845–865, https://doi.org/10.5194/acp-15-845-2015, 2015. a, b, c, d
Stockwell, C. E., Jayarathne, T., Cochrane, M. A., Ryan, K. C., Putra, E. I., Saharjo, B. H., Nurhayati, A. D., Albar, I., Blake, D. R., Simpson, I. J., Stone, E. A., and Yokelson, R. J.: Field measurements of trace gases and aerosols emitted by peat fires in Central Kalimantan, Indonesia, during the 2015 El Niño, Atmos. Chem. Phys., 16, 11711–11732, https://doi.org/10.5194/acp-16-11711-2016, 2016. a, b
Stutz, J., Oh, H.-J., Whitlow, S. I., Anderson, C., Dibb, J. E., Flynn, J. H., Rappenglück, B., and Lefer, B.: Simultaneous DOAS and mist-chamber IC measurements of HONO in Houston, TX, Atmos. Environ., 44, 4090–4098, https://doi.org/10.1016/j.atmosenv.2009.02.003, 2010. a
Teledyne: Nox analyzer (N500, Teledyne API), https://www.teledyne-api.com/en-us/products/n500 (last access: 23 December 2025), 2025. a
Thompson, D., Wotton, B., and Waddington, J.: Estimating the heat transfer to an organic soil surface during crown fire, Int. J. Wildland Fire, 24, 120–129, https://doi.org/10.1071/WF12121, 2015. a
Thompson, D. K., Schroeder, D., Wilkinson, S. L., Barber, Q., Baxter, G., Cameron, H., Hsieh, R., Marshall, G., Moore, B., Refai, R., Rodell, C., Schiks, T., Verkaik, G. J., and Zerb, J.: Recent crown thinning in a boreal black spruce forest does not reduce spread rate nor total fuel consumption: results from an experimental crown fire in Alberta, Canada, Fire, 3, 28, https://doi.org/10.3390/fire3030028, 2020. a
Turetsky, M., Wieder, K., Halsey, L., and Vitt, D.: Current disturbance and the diminishing peatland carbon sink, Geophys. Res. Lett., 29, 21–1, https://doi.org/10.1029/2001GL014000, 2002. a
Turetsky, M. R., Kane, E. S., Harden, J. W., Ottmar, R. D., Manies, K. L., Hoy, E., and Kasischke, E. S.: Recent acceleration of biomass burning and carbon losses in Alaskan forests and peatlands, Nat. Geosci., 4, 27–31, https://doi.org/10.1038/ngeo1027, 2011. a, b, c
Turetsky, M. R., Benscoter, B., Page, S., Rein, G., Van Der Werf, G. R., and Watts, A.: Global vulnerability of peatlands to fire and carbon loss, Nat. Geosci., 8, 11–14, https://doi.org/10.1038/ngeo2325, 2015. a, b
Urbanski, S.: Wildland fire emissions, carbon, and climate: Emission factors, For. Ecol. Manage., 317, 51–60, https://doi.org/10.1016/j.foreco.2013.05.045, 2014. a, b, c, d, e, f, g, h, i, j, k, l, m, n
Urbanski, S. P., Long, R. W., Halliday, H., Lincoln, E. N., Habel, A., and Landis, M. S.: Fuel layer specific pollutant emission factors for fire prone forest ecosystems of the western US and Canada, Atmos. Environ.: X, 16, 100188, https://doi.org/10.1016/j.aeaoa.2022.100188, 2022. a, b, c, d, e, f, g
USEPA: Health effects of wildfire smoke, https://www.airnow.gov/sites/default/files/2021-05/wildfire-smoke-guide-revised-2019-chapters-1-3.pdf (last access: 9 October 2025), 2019. a
Voulgarakis, A. and Field, R. D.: Fire influences on atmospheric composition, air quality and climate, Curr. Pollut. Rep., 1, 70–81, https://doi.org/10.1007/s40726-015-0007-z, 2015. a
Voulgarakis, A., Marlier, M. E., Faluvegi, G., Shindell, D. T., Tsigaridis, K., and Mangeon, S.: Interannual variability of tropospheric trace gases and aerosols: The role of biomass burning emissions, J. Geophys. Res.: Atmos., 120, 7157–7173, https://doi.org/10.1002/2014JD022926, 2015. a
Wang, X., Gu, R., Wang, L., Xu, W., Zhang, Y., Chen, B., Li, W., Xue, L., Chen, J., and Wang, W.: Emissions of fine particulate nitrated phenols from the burning of five common types of biomass, Environ. Pollut., 230, 405–412, https://doi.org/10.1016/j.envpol.2017.06.072, 2017. a
Radke, L. F.: Emissions measurements from vegetation fires: A comparative evaluation of methods and results, in: Fire in the Environment: The Ecological, Atmospheric, and Climatic Importance of Vegetation Fires, Dahlem Workshop Reports: Environmental Sciences Research Report 13, edited by: Crutzen, P. J. and Goldammer, J. G., John Wiley & Sons, Chichester, England, 53–76, https://research.fs.usda.gov/download/treesearch/40604.pdf (last access: 17 October 2026), 1993. a, b
Watson, J. G., Cao, J., Chen, L.-W. A., Wang, Q., Tian, J., Wang, X., Gronstal, S., Ho, S. S. H., Watts, A. C., and Chow, J. C.: Gaseous, PM2.5 mass, and speciated emission factors from laboratory chamber peat combustion, Atmos. Chem. Phys., 19, 14173–14193, https://doi.org/10.5194/acp-19-14173-2019, 2019. a, b, c, d, e, f
Westerling, A. L., Hidalgo, H. G., Cayan, D. R., and Swetnam, T. W.: Warming and earlier spring increase western US forest wildfire activity, Science, 313, 940–943, https://doi.org/10.1126/science.1128834, 2006. a
Wiedinmyer, C., Kimura, Y., McDonald-Buller, E. C., Emmons, L. K., Buchholz, R. R., Tang, W., Seto, K., Joseph, M. B., Barsanti, K. C., Carlton, A. G., and Yokelson, R.: The Fire Inventory from NCAR version 2.5: an updated global fire emissions model for climate and chemistry applications, Geosci. Model Dev., 16, 3873–3891, https://doi.org/10.5194/gmd-16-3873-2023, 2023. a, b
Wilkinson, S., Moore, P., Thompson, D., Wotton, B. M., Hvenegaard, S., Schroeder, D., and Waddington, J. M.: The effects of black spruce fuel management on surface fuel condition and peat burn severity in an experimental fire, Can. J. For. Res., 48, 1433–1440, https://doi.org/10.1139/cjfr-2018-0217, 2018. a
Xiong, Y., Du, K., and Huang, Y.: One-third of global population at cancer risk due to elevated volatile organic compounds levels, npj Clim. Atmos. Sci., 7, 54, https://doi.org/10.1038/s41612-024-00598-1, 2024. a
Yokelson, R. J., Griffith, D. W., and Ward, D. E.: Open-path Fourier transform infrared studies of large-scale laboratory biomass fires, J. Geophys. Res. Atmos., 101, 21067–21080, https://doi.org/10.1029/96JD01800, 1996. a, b, c, d
Yokelson, R. J., Susott, R., Ward, D. E., Reardon, J., and Griffith, D. W.: Emissions from smoldering combustion of biomass measured by open-path Fourier transform infrared spectroscopy, J. Geophys. Res. Atmos., 102, 18865–18877, https://doi.org/10.1029/97JD00852, 1997. a, b, c
Yokelson, R. J., Christian, T. J., Karl, T. G., and Guenther, A.: The tropical forest and fire emissions experiment: laboratory fire measurements and synthesis of campaign data, Atmos. Chem. Phys., 8, 3509–3527, https://doi.org/10.5194/acp-8-3509-2008, 2008. a
Yokelson, R. J., Burling, I. R., Gilman, J. B., Warneke, C., Stockwell, C. E., de Gouw, J., Akagi, S. K., Urbanski, S. P., Veres, P., Roberts, J. M., Kuster, W. C., Reardon, J., Griffith, D. W. T., Johnson, T. J., Hosseini, S., Miller, J. W., Cocker III, D. R., Jung, H., and Weise, D. R.: Coupling field and laboratory measurements to estimate the emission factors of identified and unidentified trace gases for prescribed fires, Atmos. Chem. Phys., 13, 89–116, https://doi.org/10.5194/acp-13-89-2013, 2013. a, b, c, d, e, f, g, h, i, j, k
Young, C. J., Joudan, S., Tao, Y., Wentzell, J. J., and Liggio, J.: High time resolution ambient observations of gas-phase perfluoroalkyl carboxylic acids: implications for atmospheric sources, Environ. Sci. Technol. Lett., 11, 1348–1354, https://doi.org/10.1021/acs.estlett.4c00897, 2024. a, b
Zhan, J., Feng, Z., Liu, P., He, X., He, Z., Chen, T., Wang, Y., He, H., Mu, Y., and Liu, Y.: Ozone and SOA formation potential based on photochemical loss of VOCs during the Beijing summer, Environ. Pollut., 285, 117444, https://doi.org/10.1016/j.envpol.2021.117444, 2021. a