
the Creative Commons Attribution 4.0 License.
the Creative Commons Attribution 4.0 License.
 | 12 Nov 2026
Frequent occurrence of newly formed aerosol particles over wide geographical areas in the Arctic free troposphere and atmospheric boundary layer

Jonas Schaefer
Jörg Hartmann
Benjamin Kirbus
Joshua Müller
Markus Hartmann
Bruno Wetzel
Laura Köhler
Anna-Marie Jörss
Kay Weinhold
Andreas Herber
Zsófia Jurányi
Silvia Henning
Gregory C. Roberts
Manfred Wendisch
Mira L. Pöhlker
Frank Stratmann
New particle formation (NPF) can impact the Arctic radiative energy budget since this region is particularly sensitive to changes in aerosol particle and cloud condensation nuclei concentrations. Prior measurements have predominantly investigated NPF in the Arctic atmospheric boundary layer (ABL), while vertically-resolved studies on newly formed aerosol particles remain scarce. Here, we present an analysis which suggests that NPF may take place throughout the entire lower Arctic troposphere. We have reached this conclusion by analyzing aerosol particle number size distribution data collected during a springtime aircraft campaign (BACSAM II) in the vicinity of Svalbard, the Fram Strait, and northern Greenland. We detected newly formed aerosol particles over distances of hundreds of kilometers, at various altitudes ranging from about 60 to 3900 m, and identified four atmospheric scenarios for their occurrence: newly formed particles in the free troposphere, in the ABL over sea ice, in the vicinity of clouds, and in the ABL over ocean with sea ice floes. Our results indicate that regional Arctic atmospheric processes as well as long-range transport may play key roles in the formation of new particles. In particular, we deduce that one possible mechanism leading to free tropospheric NPF could be associated with warm-air intrusions.
- Article
(8110 KB) - Full-text XML
-
Supplement
(15732 KB) - BibTeX
- EndNote


Aerosol particles are an important component of the global climate system (Forster et al., 2021). They enter the atmosphere either directly by primary emissions or are formed in situ by secondary aerosol particle formation from condensable gases (Seinfeld and Pandis, 2006). The latter process, which generates particles with diameters of initially a few nanometers, is termed new particle formation (NPF, Kulmala et al., 2004). Depending on the atmospheric thermodynamic conditions, subsequent growth can increase particle sizes to values large enough such that the particles may act as cloud condensation nuclei (CCN, Kulmala and Kerminen, 2008; Kerminen et al., 2018). CCN play a crucial role in cloud formation, affecting cloud life time, precipitation formation, and cloud albedo, thereby influencing Earth's radiative energy budget (Andreae and Rosenfeld, 2008; Forster et al., 2021). Globally, about 50 % of CCN are estimated to result from NPF (Gordon et al., 2017; Pierce and Adams, 2009; Merikanto et al., 2009). In the Arctic, with commonly low background aerosol particle number concentrations, NPF is particularly important because of the high susceptibility of Arctic cloud formation (and hence cloud radiative forcing) to changes in aerosol particle and CCN number concentrations under low aerosol levels (Mauritsen et al., 2011; Leaitch et al., 2013; Carslaw et al., 2013; Gordon et al., 2017).
Currently, the Arctic is changing rapidly in response to global climate change (Box et al., 2019; Wendisch et al., 2017, 2023). Among others, these changes manifest in a substantial decrease of the Arctic sea ice cover, especially at the end of the Arctic summer in September (Stroeve et al., 2007). Furthermore, an increase of the near-surface air temperature is observed, which exceeds the global average warming by a factor of two to three (Wendisch et al., 2023). The processes causing the intensified response of the Arctic climate system to global climate change are commonly referred to as Arctic amplification (Serreze and Francis, 2006; Serreze and Barry, 2011; Wendisch et al., 2023). A changing Arctic also entails consequences for the Arctic aerosol population. For example, the decline of the sea ice cover affects both primary emissions from the ocean surface and secondary formation of aerosol particles (Willis et al., 2018; Schmale et al., 2021). Concerning the latter, enhanced emissions of precursor gases from open sea surfaces, leads, or through thinning sea ice have been reported and are expected to proceed as the sea ice fractures and retreats further (Cuevas et al., 2018; Galí et al., 2019). There is indirect evidence reported by Dall'Osto et al. (2017, 2018) who found a correlation between an increase of NPF events and decreasing sea ice extent. Furthermore, altered meridional transport may lead to enhanced aerosol particle and/or precursor transport into the Arctic, for instance, via warm-air intrusions (Dada et al., 2022; Wendisch et al., 2023, 2024), which are expected to occur more frequently in the future (Bintanja et al., 2020; Wendisch et al., 2025). Similarly, Heslin-Rees et al. (2020) showed that changed air circulation patterns resulted in an increased marine influence on the aerosol population at the Arctic Zeppelin station (Svalbard).
NPF has been observed in several locations Arctic-wide (Willis et al., 2018; Schmale and Baccarini, 2021). Most studies were based on measurements conducted during shipborne campaigns (e.g., Wiedensohler et al., 1996; Allan et al., 2015; Baccarini et al., 2020) or at ground-based stations including Alert, Villum, Zeppelin, Tiksi, and Utqiagvik (e.g., Leaitch et al., 2013; Croft et al., 2016; Asmi et al., 2016; Freud et al., 2017; Beck et al., 2021). These stations provide temporally extended datasets and enable the analysis of annual cycles and long-term trends. Yet, inherently, station- and ship-based measurements can hardly provide precise vertical information. However, data on the vertical distribution of NPF are crucial to identify and study key transport and formation processes, and ultimately, to assess the corresponding effects on the Arctic climate (Lee et al., 2019; Schmale et al., 2021; Price et al., 2023). There are remote sensing instruments such as lidar that can provide vertical information on aerosol particles, but these methods mostly miss the required sensitivity to reliably infer quantitative information on NPF. Consequently, to observe and analyze NPF, airborne measurements with balloons, helicopters, or aircraft appear indispensable (Garrett et al., 2002; Weber et al., 2003; Engvall et al., 2008; Khosrawi et al., 2010; Kupiszewski et al., 2013; Willis et al., 2016, 2017; Burkart et al., 2017; Pilz et al., 2024; Pohorsky et al., 2026). Despite these growing efforts to conduct vertically-resolved measurements on aerosol particles in general, and NPF in particular, data on the vertical distribution of NPF in the Arctic are still scarce (e.g., Burkart et al., 2017; Schmale et al., 2021; Pohorsky et al., 2026). Hence, the relative importance of the ABL and the free troposphere as sources of newly formed particles remains elusive. A number of studies reported on the predominant occurrence of NPF close to the surface (Kupiszewski et al., 2013; Willis et al., 2016, 2017; Burkart et al., 2017; Willis et al., 2018), while other measurements detected NPF in the free troposphere as well (Weber et al., 2003; Khosrawi et al., 2010).
In this paper, rather than focusing on the process of NPF itself (i.e., the initial nucleation mechanism), we investigate the occurrence of newly formed particles produced by NPF, which have initial diameters of less than 20 nm (Kulmala et al., 2004). Here, we report on the frequent occurrence of these newly formed particles in the Arctic, found at various altitudes ranging from about 60 to 3900 m above sea level (a.s.l.). The corresponding data were collected during an aircraft campaign carried out in the Fram Strait, surrounding the Svalbard Archipelago, and in the vicinity of Villum Research Station (Station Nord) in Greenland in April 2024.
2.1 Aircraft campaign overview
The airborne campaign “Boundary layer and Aerosol and Cloud Study in the Arctic, based on aircraft and T-Bird Measurements II” (BACSAM II) was conducted from 5 April to 2 May 2024. We carried out eleven research flights (RFs) with the German research aircraft Polar 6 (P6, Wesche et al., 2016), operated by the Alfred Wegener Institute, Helmholtz Centre for Polar and Marine Research (AWI; see Supplement Fig. S1 for a map of all flight paths). With the operational base in Longyearbyen (Svalbard), target areas included the Fram Strait, the Svalbard Archipelago, and the vicinity of Villum Research Station in north-eastern Greenland. Flights were conducted between 7 and 29 April 2024. This time period was characterized by persistent warm air advection driven by low pressure systems south-west of Svalbard, resulting in above-average surface temperatures in Svalbard. Two exceptions with typical cold conditions and high pressure at the beginning of the campaign from 7 to 11 April and from 15 to 17 April occurred. Note that our sampling is potentially biased toward viable flight conditions, i.e., high visibility at Longyearbyen Airport. Furthermore, we mostly preferred cloud-free conditions in the target regions or elevated cloud layers (cloud base ⪆200 m), and no precipitation.
2.2 Aerosol measurements and detection of newly formed particles
Aboard the P6 aircraft, we measured aerosol particle number size distributions (PNSDs) with a mobility particle size spectrometer (MPSS, Wiedensohler et al., 2012, 2018). The custom-built MPSS measures the PNSDs in the particle diameter size range between 10 and 850 nm based on the electric mobility of aerosol particles with a time resolution of about 300 s. In this paper, we only use data up to 600 nm since on some measurement days arcing inside the differential mobility analyzer (DMA) led to artifacts in the PNSDs appearing at larger diameters. The system features a Vienna-type DMA (built by the Leibniz Institute for Tropospheric Research) and a condensation particle counter (CPC, TSI model 3760A, TSI Incorporated, USA). For further details on the MPSS system see Wiedensohler et al. (2012, 2018). The flow in the sampling tubing leading to the MPSS was manually adjusted depending on the true airspeed of the aircraft (typically ≈60 m s−1 during legs in the target area and ≈90 m s−1 during transit flights) to achieve near-isokinetic sampling. As the onboard-temperature was significantly higher than the ambient temperature, the relative humidity of the sampled air in the aerosol inlet was below 40 %. Consequently, all reported particle diameters refer to dry conditions (Jurányi et al., 2025). All particle number concentration data have been corrected to standard conditions (1013 hPa and 273.15 K). Particle losses inside the sampling line from the aerosol inlet to the MPSS due to diffusion, sedimentation, turbulent inertial deposition, and inertial deposition in bends and contractions have been corrected for, based on calculations utilizing the particle loss calculator (von der Weiden et al., 2009, Sect. S2).
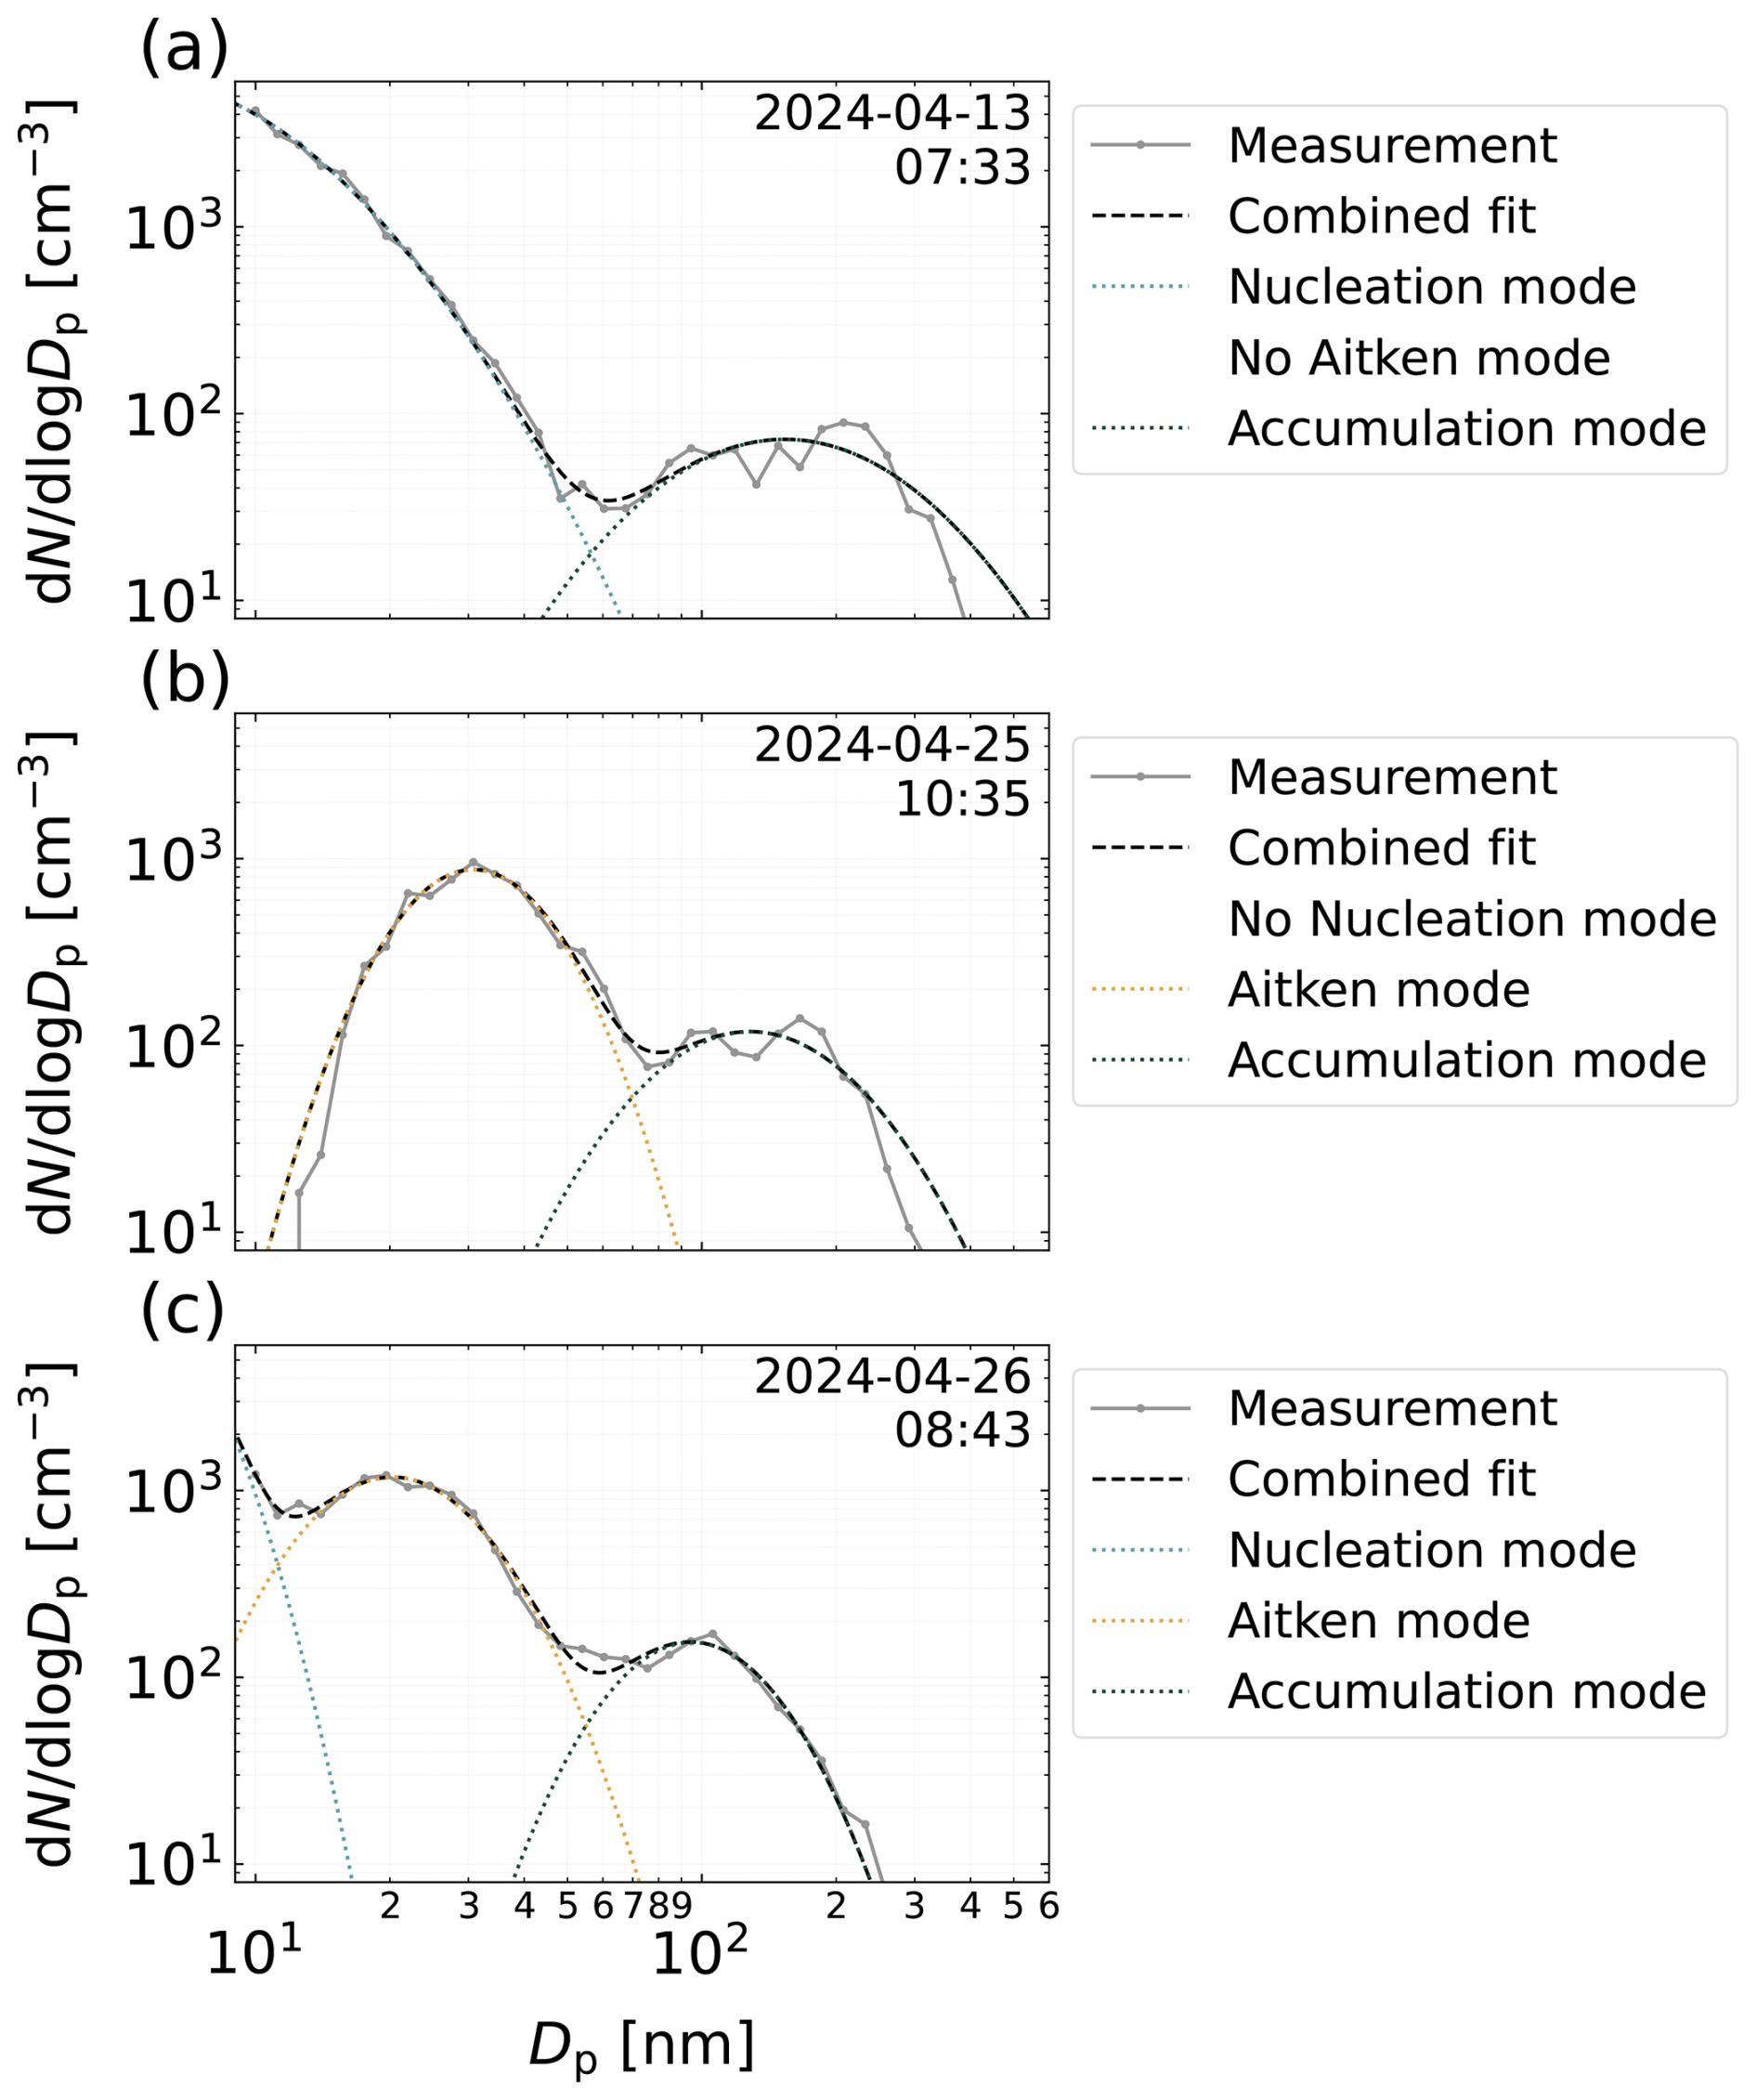
Figure 1Examples of MPSS-measured PNSDs, showing nucleation and/or Aitken, and accumulation modes. The PNSDs in the panels (a) and (c) are considered as indicative for newly formed particles, while the measurement displayed in panel (b) shows no indication for newly formed particles.
Since the minimum diameter of aerosol particles that can be detected with our measurement instrumentation is 10 nm, it is not feasible to clearly identify the exact region where NPF occurred, i.e., where the process of the initial nucleation of particles with sizes of about 2 to 3 nm from condensable gases took place (Kulmala et al., 2004; Kerminen et al., 2018). Nevertheless, particle sizes of 10 nm still imply that these particles were newly formed by secondary particle formation (i.e., by NPF, Kulmala et al., 2004). We hence refer to these particles as newly formed particles and, in this paper, instead on the process of NPF, focus on the occurrence of such secondarily formed particles.
To detect newly formed particles, we fitted mono-modal, bi-modal, or tri-modal log-normal functions to the MPSS-measured PNSDs, with the different modes representing nucleation, Aitken, and accumulation modes, respectively. Following Kulmala et al. (2004), we refer to aerosol particles in the measured dry diameter range from below 10 to 20 nm as nucleation mode particles, from 20 to 90 nm as Aitken mode particles, and from 90 to 600 nm as accumulation mode particles. We consider an MPSS-measured PNSD as indicative for newly formed particles if the fitted distribution features a nucleation mode with a geometric mean diameter below 10 nm, i.e., a mode with a maximum below the lower size limit of the MPSS. The detection of newly formed particles was verified by visual inspection of the fitted PNSDs. Only distributions measured at a constant altitude were considered for quantitative analysis, i.e., PNSDs measured during the aircraft's ascents and descents were not taken into account in quantitative terms. Figure 1 shows examples of three fitted PNSDs, with the data displayed in Fig. 1a and c indicating the presence of newly formed particles, and the data in Fig. 1b the absence of newly formed particles.
2.3 Meteorological measurements
A nose boom was installed at the tip of the aircraft to measure air pressure, temperature, and the three-dimensional wind vector. The nose boom features an Aventech five-hole probe to measure static, dynamic, and differential pressures to derive the wind vector from these data, and an open-wire Pt100 in an unheated Rosemount housing to record air temperature data. These data were measured with a time resolution of 100 Hz. Humidity data are available at 20 Hz from a Vaisala HMT333 in a Rosemount housing installed aboard the aircraft. Surface skin temperature data at 20 Hz are derived from measurements by a KT-19 infrared pyrometer (Heitronics KT-19.85 II). Position and altitude were measured by combining Global Positioning System (GPS) and Inertial Navigation System (INS) data, which were recorded at 100 Hz. See Hartmann et al. (2018) for further details on the instrumentation and data processing.
2.4 Backwards trajectory analysis
Backward trajectories were calculated from ERA5 wind fields (Hersbach et al., 2020) utilizing the Lagrangian analysis tool LAGRANTO (Sprenger and Wernli, 2015). The trajectories were initiated every minute along the flight track of the P6 at the corresponding flight altitude. The trajectories were calculated for 120 h backward in one minute time steps and several meteorological parameters from ERA5 were traced along the trajectory. Based on these parameters, we carry out an analysis of air mass history in Sect. 3. Among others, we determine the last contact of these air masses with clouds based on the specific cloud liquid water content (CLWC) and the specific cloud ice water content (CIWC). Here, we consider an air mass to have been in contact with a cloud if the total water content () exceeds the threshold of CWC>0.01 g kg−1 (McFarquhar and Cober, 2004; Moser et al., 2023, see Sect. S3).
3.1 Geographical and vertical distribution of newly formed particles
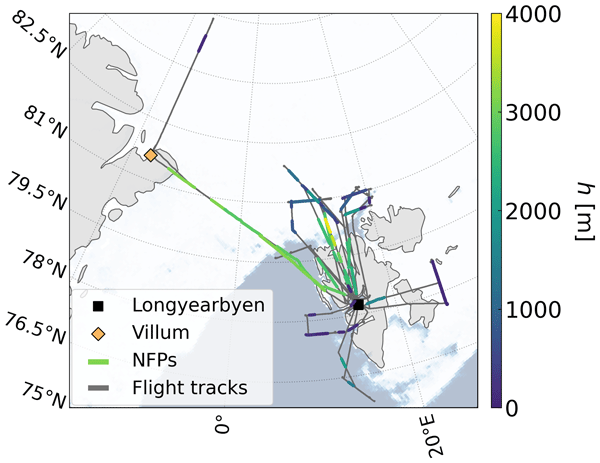
Throughout the entire BACSAM II campaign, we frequently observed newly formed particles over large areas of the Arctic region studied (Fig. 2). Newly formed particles were detected during all eleven research flights, with the first observation of such particles on 7 April 2024, and the last on 29 April 2024. We encountered newly formed particles at various locations (approximately between 76 to 85° N and 15° W to 26° E) and altitudes ranging from about 60 to 3900 m a.s.l. (Fig. 2). The time periods during which we identified newly formed particles amount to an overall duration of about 10 h and 30 min, which corresponds to approximately 29 % of the total measurement time (at constant altitude) of all research flights and a distance flown of about 2770 km.
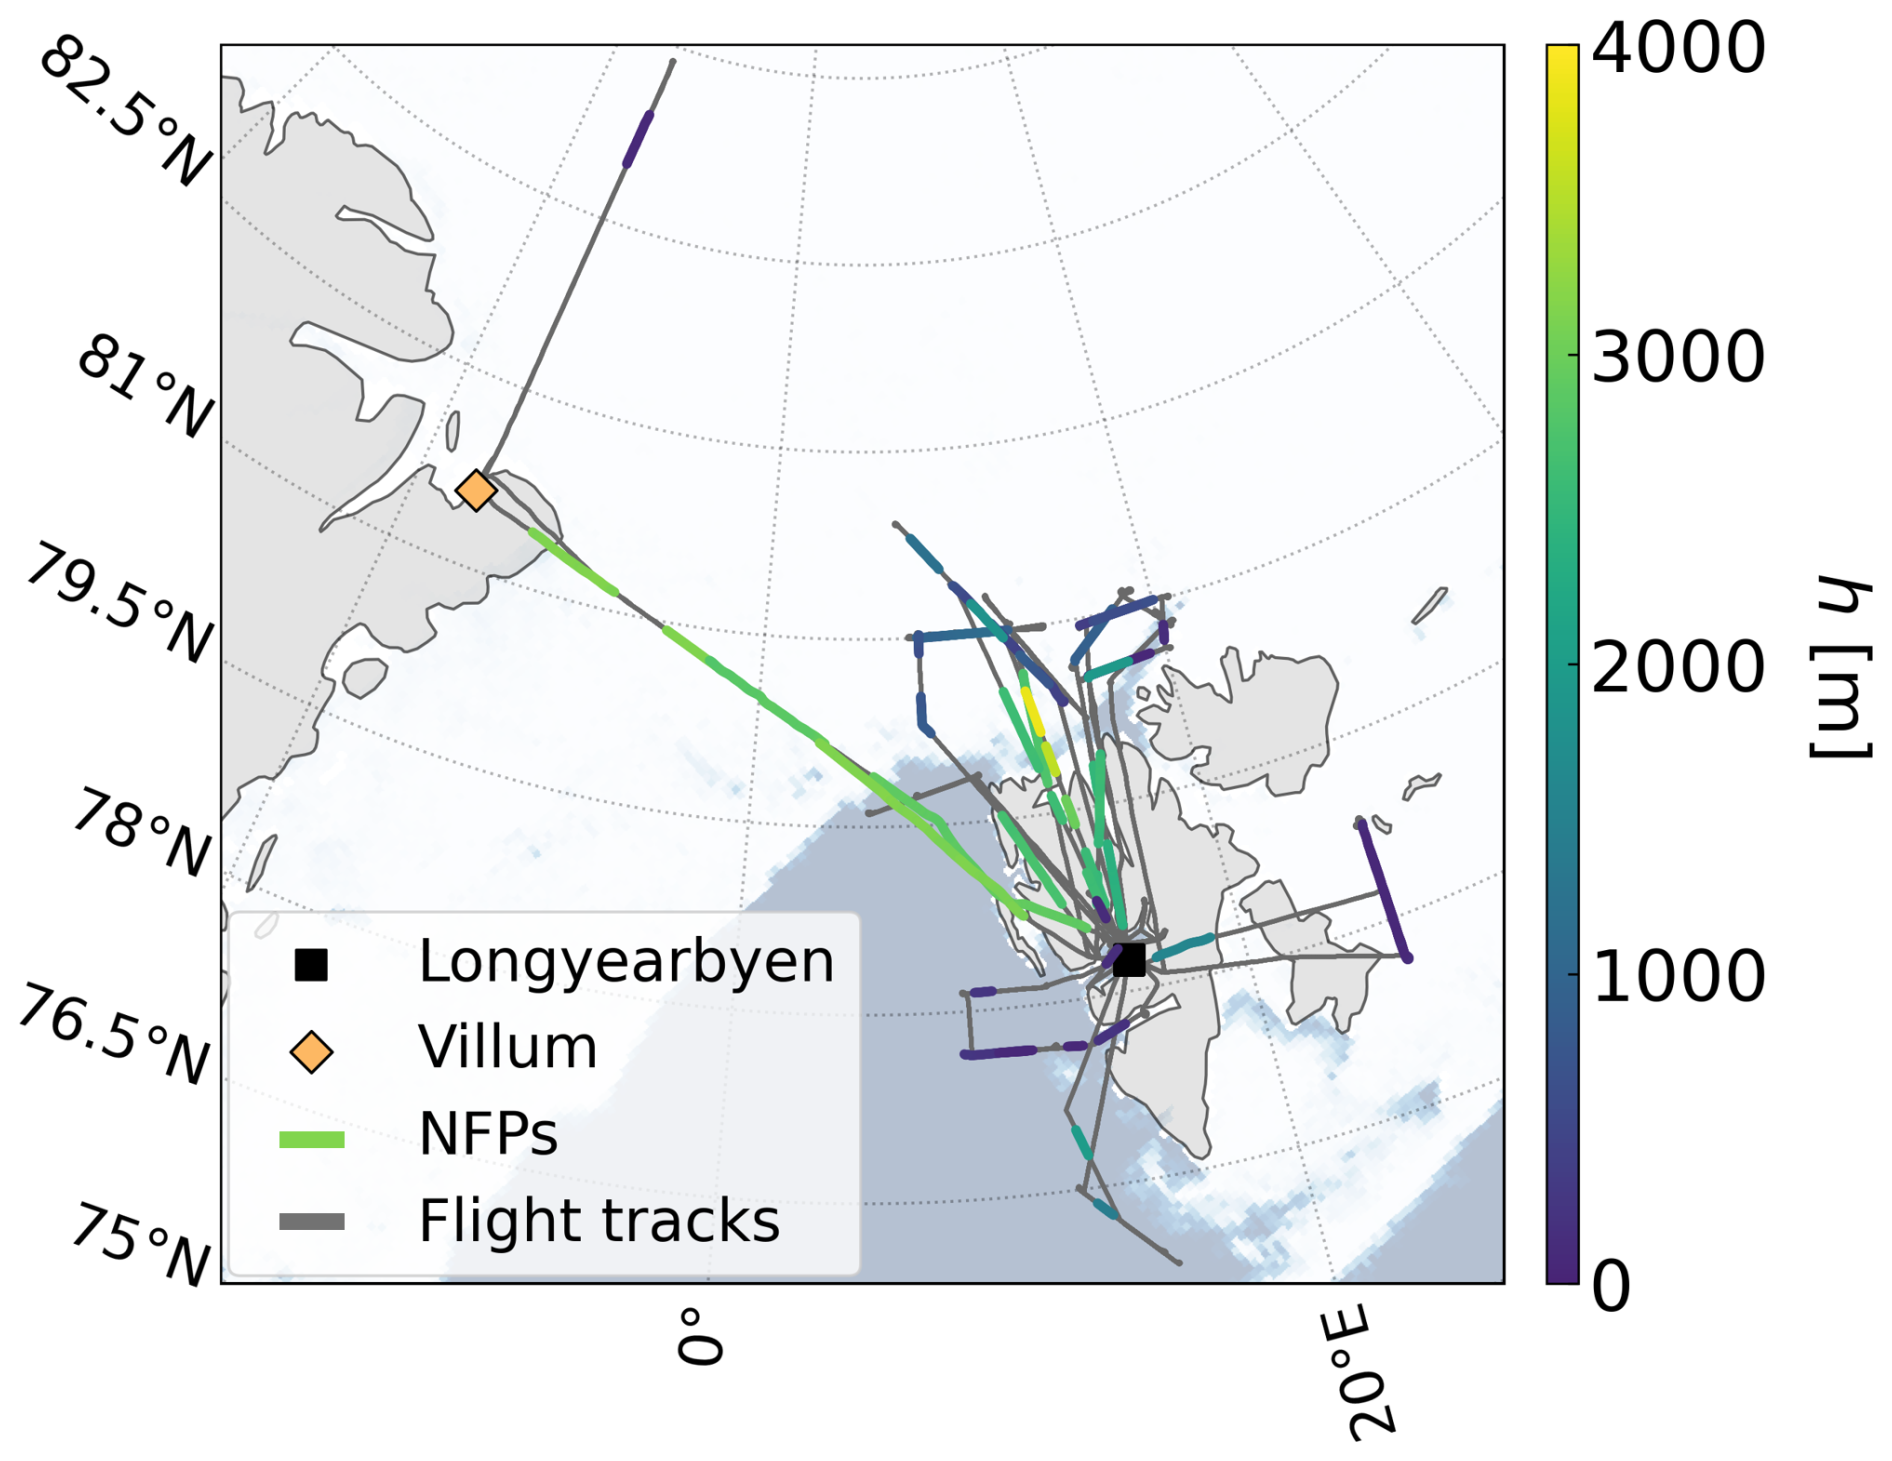
Figure 2Geographical location and altitude at which newly formed particles (NFPs) were observed during the BACSAM II campaign. The flight tracks are shown in gray and the locations where newly formed particles were identified are color-coded by the corresponding flight altitude. The sea ice concentration is shown exemplary for 15 April 2024, during which we encountered newly formed particles at low altitudes over the ice-covered sea east of Svalbard (see Sect. 3.3). The corresponding sea ice data were retrieved from https://www.seaice.uni-bremen.de on 10 June 2024 (Spreen et al., 2008).
Analyzing all measurements featuring newly formed particles in the course of our campaign, we could identify four distinct environmental conditions (based on the in situ data, see Sect. S3; Fig. 3). These cases include newly formed particles in the free troposphere (without clouds being present, Sect. 3.2), newly formed particles at low altitudes in the ABL over sea ice (Sect. 3.3), newly formed particles in the vicinity of clouds (Sect. 3.4), and newly formed particles inside the ABL over ocean with sea ice floes, i.e., the sea surface consisted of both open water and sea ice during the latter observations (Sect. S5). No indications of the presence of newly formed particles were found within or near the ABL over open, completely ice-free ocean (Sect. S5).
Figure 3a depicts the median size distributions of the PNSDs indicating the presence of newly formed particles, for each of the four environments. The highest particle number concentrations in the nucleation mode are found during observations of newly formed particles in the free troposphere. Inside the ABL over sea ice and in cloud vicinity, concentrations in the nucleation mode are smaller by a factor of roughly two. The smallest nucleation mode concentrations are observed inside the ABL over ocean with sea ice floes, with the concentrations being reduced by about one order of magnitude compared to the free tropospheric case.
In the accumulation mode, roughly similar concentrations are observed during newly formed particle-occurrence inside the ABL over ocean with sea ice floes and in cloud vicinity. Inside the ABL over sea ice, accumulation mode concentrations are slightly higher. The lowest accumulation mode concentrations are found in the free troposphere, with the mode being decreased by factors of roughly two to four compared to the other cases.
The reader is referred to Sect. S4 and Fig. S3 regarding the related temperature and relative humidity conditions prevailing during observations of newly formed particles. We will discuss the observations for each of the four categories, which combined represent 92 % of all observations of newly formed particles, in more detail in Sects. 3.2, 3.3, 3.4, and S5.
As mentioned earlier, newly formed particles were detected in a wide range of altitudes between approximately 60 and 3900 m (Fig. 3b). Here, 60 and 3900 m correspond to the minimum and maximum flight altitudes at which measurements were carried out (Fig. 3b). Consequently, we cannot rule out that newly formed particles could be present at altitudes even higher than 3900 m in the target regions during our campaign.
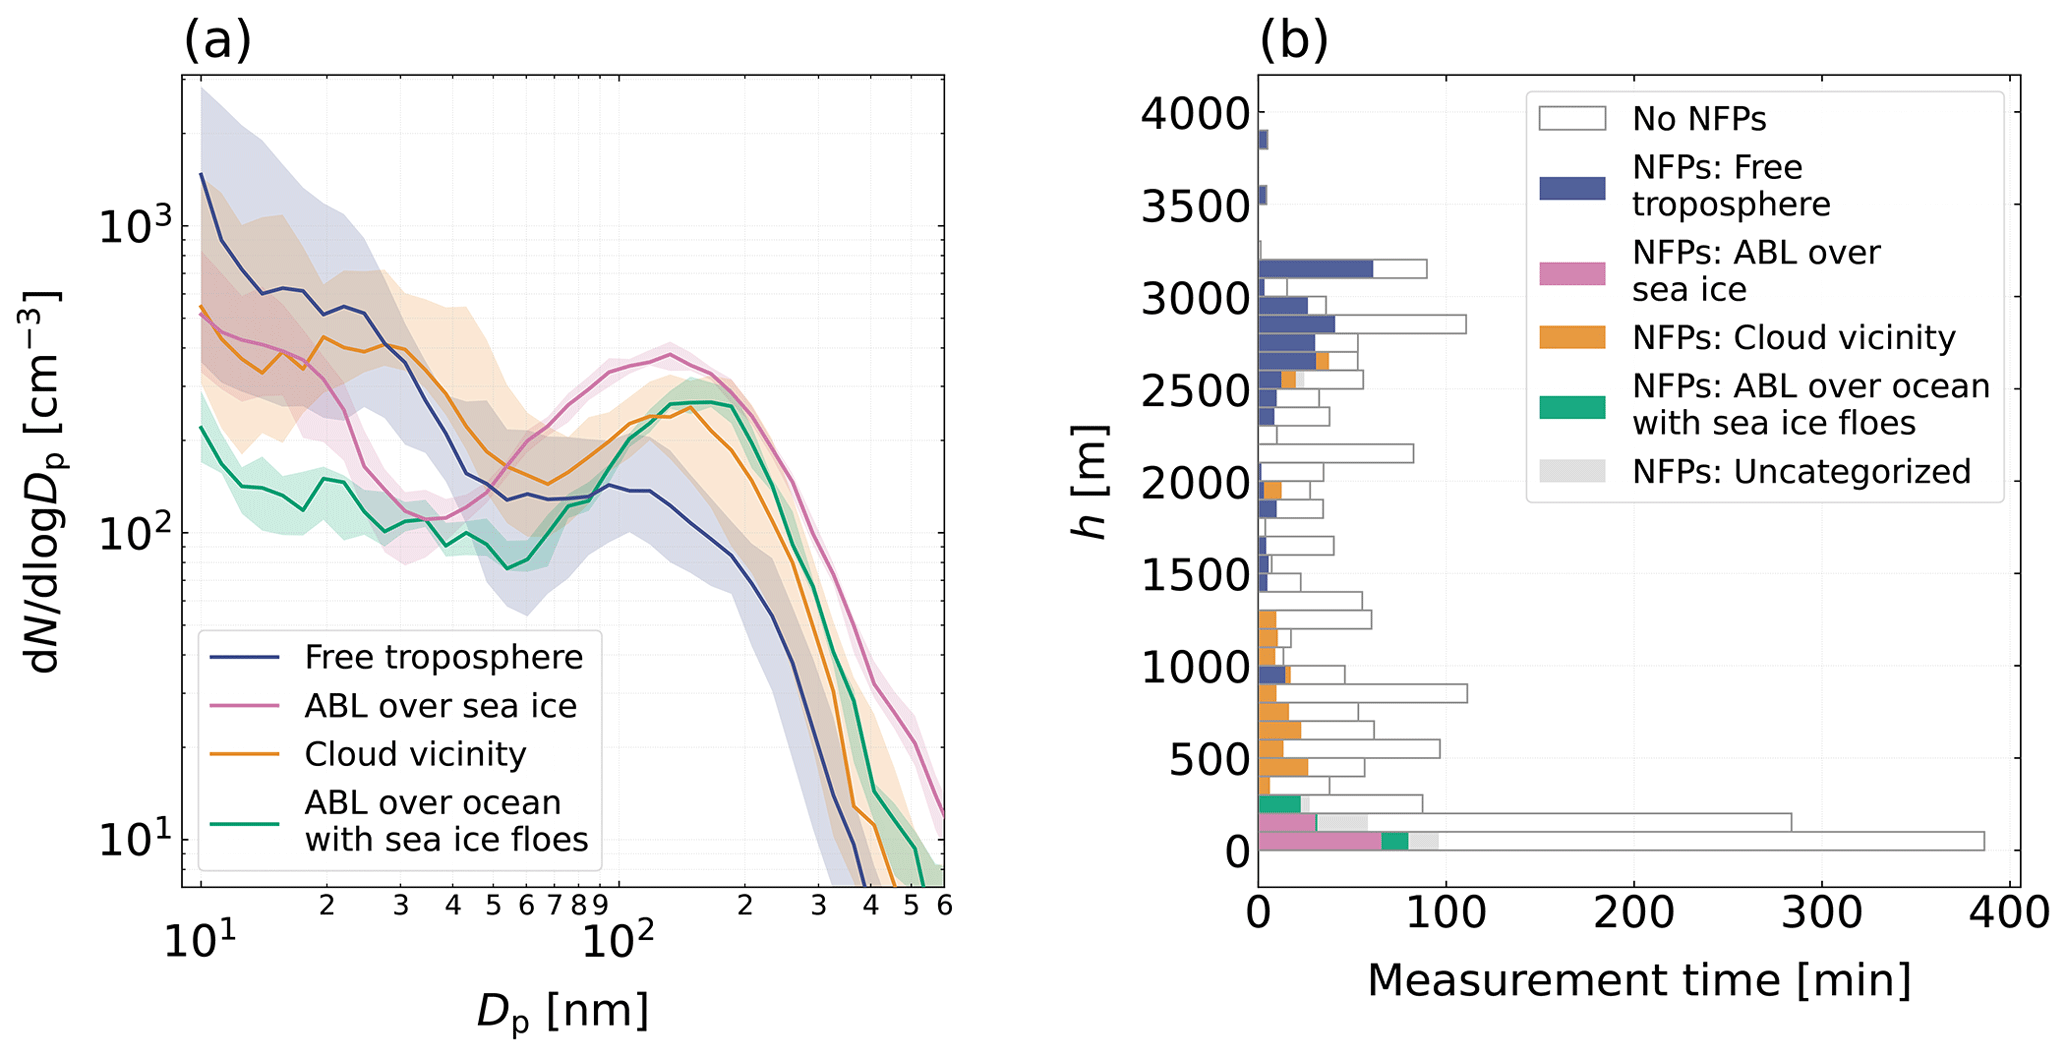
Figure 3(a) Median PNSD of all measurements showing newly formed particles (NFPs) associated with one of the environments described in the main text: newly formed particles in the free troposphere (Sect. 3.2), inside the ABL over sea ice (Sect. 3.3), in the vicinity of clouds (Sect. 3.4), and inside the ABL over ocean with ice floes (Sect. S5). (b) Total measurement time per altitude (grouped into altitude bins with a width of 100 m). Colored bars illustrate the duration of newly formed particle-occurrence in each altitude bin, labeled by the different environments. White bars indicate the absence of newly formed particles. The data are shown as stacked bars.
In the free troposphere, newly formed particles were detected at altitudes between about 900 and 3900 m (Fig. 3b). These observations amount to measurement times of approximately 4 h and 40 min, corresponding to distances flown of ≈1460 km. Inside the ABL over sea ice, at altitudes between roughly 60 and 200 m, newly formed particles were identified during about 1 h and 40 min of measurements (≈350 km), and inside the ABL over ocean with sea ice floes, at altitudes between 60 and 300 m, during approximately 40 min (≈130 km). During about 2 h and 40 min (≈630 km) of measurements in the vicinity of clouds, newly formed particles were observed. Here, these particles were found at altitudes between 300 and 2700 m (Fig. 3b).
Table 1 summarizes the durations of newly formed particle-occurrence for the four environments. Furthermore, based on ERA5 reanalysis data, we present total measurement times spent in the free troposphere, in the ABL over sea ice and over ocean with sea ice floes, and in cloud vicinity throughout the campaign (see Sect. S3 for details). Additionally, relative frequencies of occurrence of newly formed particles for each environment are provided in Table 1. As discussed in Sect. S3, the ERA5-based values are associated with large uncertainties. Consequently, the total measurement times throughout the campaign as well as the frequencies of occurrence should be interpreted solely semi-quantitatively and only provide a very rough estimate.
It should be noted that, for all case studies described below, as well as for the assignment of measurement periods featuring newly formed particles to the four categories free troposphere, cloud vicinity, ABL over sea ice, and ABL over ocean with sea ice floes, we only considered flight sections for which the prevailing conditions could be clearly identified based on the in situ data. If newly formed particles were detected but either, e.g., the ABL height could not be determined for the target region or the absence/presence of clouds close to the aircraft could not be verified, these observations are assigned to the unclassified cases (Sect. S3). Such observations represent 8 % of all PNSDs featuring newly formed particles (≈50 min, ≈200 km of measurements).
Table 1Overview of total measurement time as well as duration and frequency of newly formed particle-occurrence (NFP-occurrence) for the four environments.
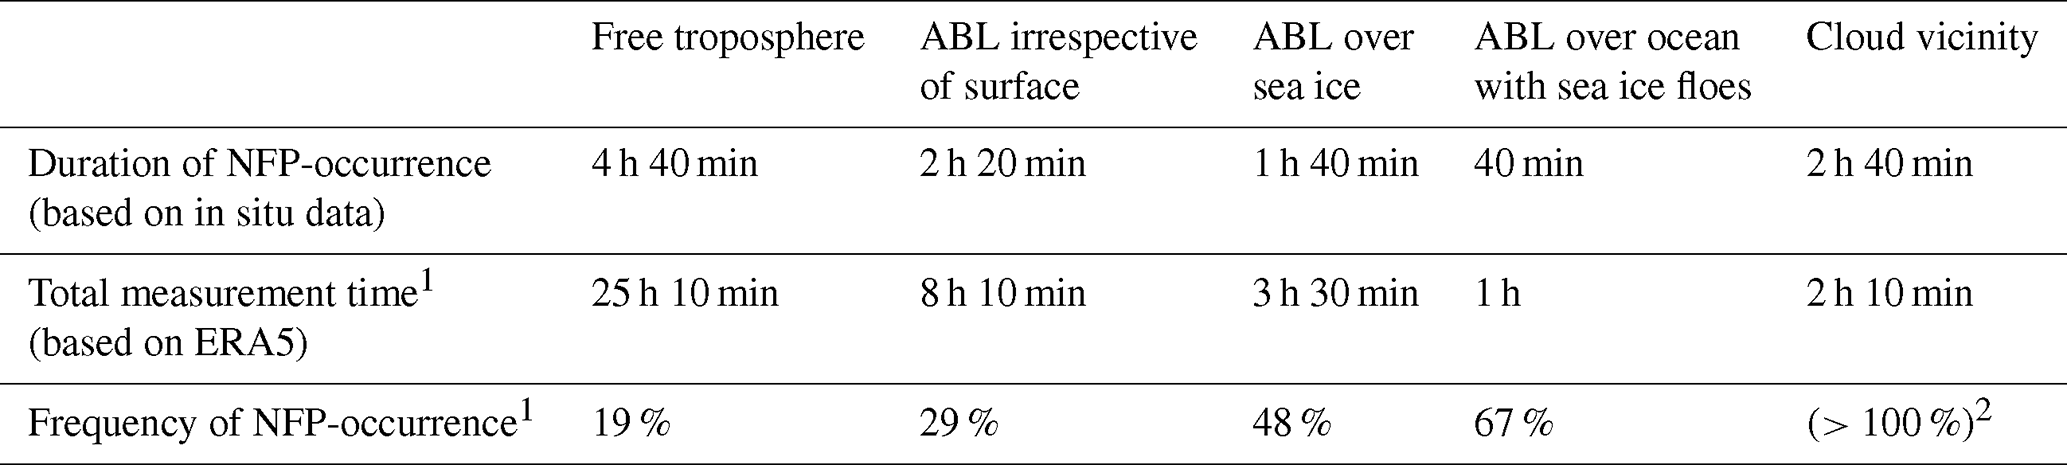
1 Note that the ERA5-based values (i.e., total measurement time and, consequently, frequency of NFP-occurrence) should be considered semi-quantitatively only (see the discussion in the main text and Sect. S3 for details). 2 Nonphysical value, resulting from ERA5 not always predicting clouds throughout all legs which are known to have been carried out in cloud vicinity, according to the in situ observations. Considering those times based on the in situ data instead of the ERA5-based values, a frequency of about 73 % can be reported.
Naturally, during the campaign, sampling times and consequently numbers of PNSDs measured, as well as distances flown at certain altitudes, were not evenly distributed over the investigated altitudes, geographical locations, and synoptic conditions (Fig. 3b). For example, while measurements in the lowest 100 m were carried out for a total duration of almost 400 min (over a distance of about 1480 km), measurements at 3500–3600 and 3800–3900 m were merely performed during one research flight, and at each altitude range for merely 5 to 10 min (27 to 54 km, to feature one full MPSS scan; Fig. 3b). The values of duration and relative frequency of newly formed particle-occurrence reported in this section are thus not intended to constitute representative values for the lower Arctic troposphere. They rather provide a rough overview and represent (semi-quantitative) statistics of the observations made during the BACSAM II campaign.
Nevertheless, despite these limitations with respect to the statistical analysis, our measurements clearly demonstrate that newly formed particles were frequently found throughout the lower Arctic troposphere, and suggest that NPF in the Arctic occurred across large geographical areas and over a wide range of altitudes during our campaign in April 2024.
To further elucidate the atmospheric scenarios under which newly formed particles were observed, and to gain insights into potential precursor gases and their origins, in the following sections, the results of case studies focusing on newly formed particles in the free troposphere, inside the ABL over sea ice, and in the vicinity of clouds will be presented. First, specific examples for these scenarios will be given. Second, to put the given examples into a larger perspective, we will discuss respective backward trajectory analyses for all air masses featuring newly formed particles for each of these three environments. Regarding the presence of newly formed particles inside the ABL over ocean with sea ice floes, as well as the absence of such particles inside the ABL over completely ice-free ocean, the backward trajectory analysis required is somewhat different compared to the other three cases (for example, due to the prevailing meteorological conditions, e.g., air masses passing over the island of Spitsbergen, see Sect. S5 for details). To keep the main text both consistent and concise, these latter observations (inside the ABL over ocean with sea ice floes and over open ocean) are discussed comprehensively in the Supplement in Sect. S5.
3.2 Newly formed particles in the free troposphere
Here, as an illustrative example, we present results concerning newly formed particles in the free troposphere which were encountered on 13 April 2024 during RF04 while transiting from Longyearbyen (Svalbard) to Villum Research Station (northern Greenland) at an altitude of 2890 m (Fig. 4a).
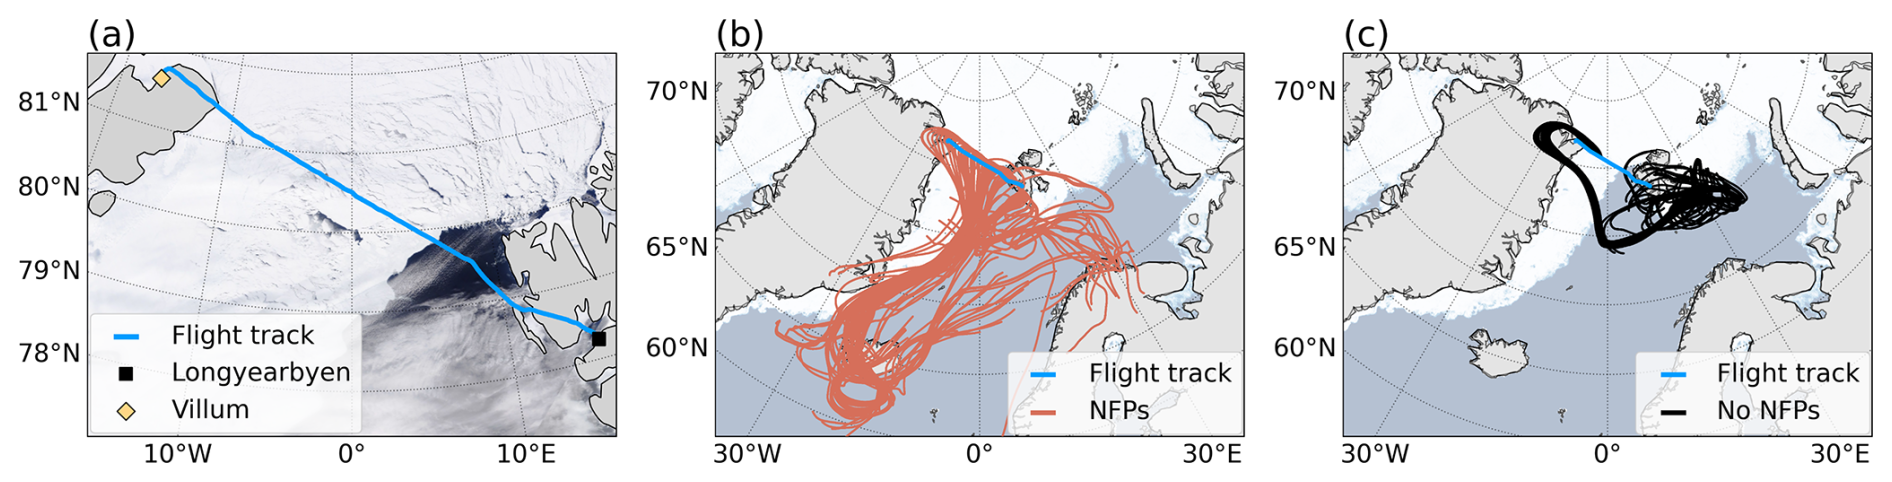
Figure 4(a) Flight track of RF04 on 13 April 2024. The Moderate-resolution Imaging Spectroradiometer (MODIS)-TERRA satellite image was retrieved from https://wvs.earthdata.nasa.gov on 30 April 2024. (b) Five-day backward trajectories associated with newly formed particles (NFPs) along the flight track. (c) Five-day backward trajectories connected to PNSD measurements featuring no newly formed particles. The sea ice concentration data shown in the subplots (b) and (c) were retrieved from https://www.seaice.uni-bremen.de (Spreen et al., 2008).
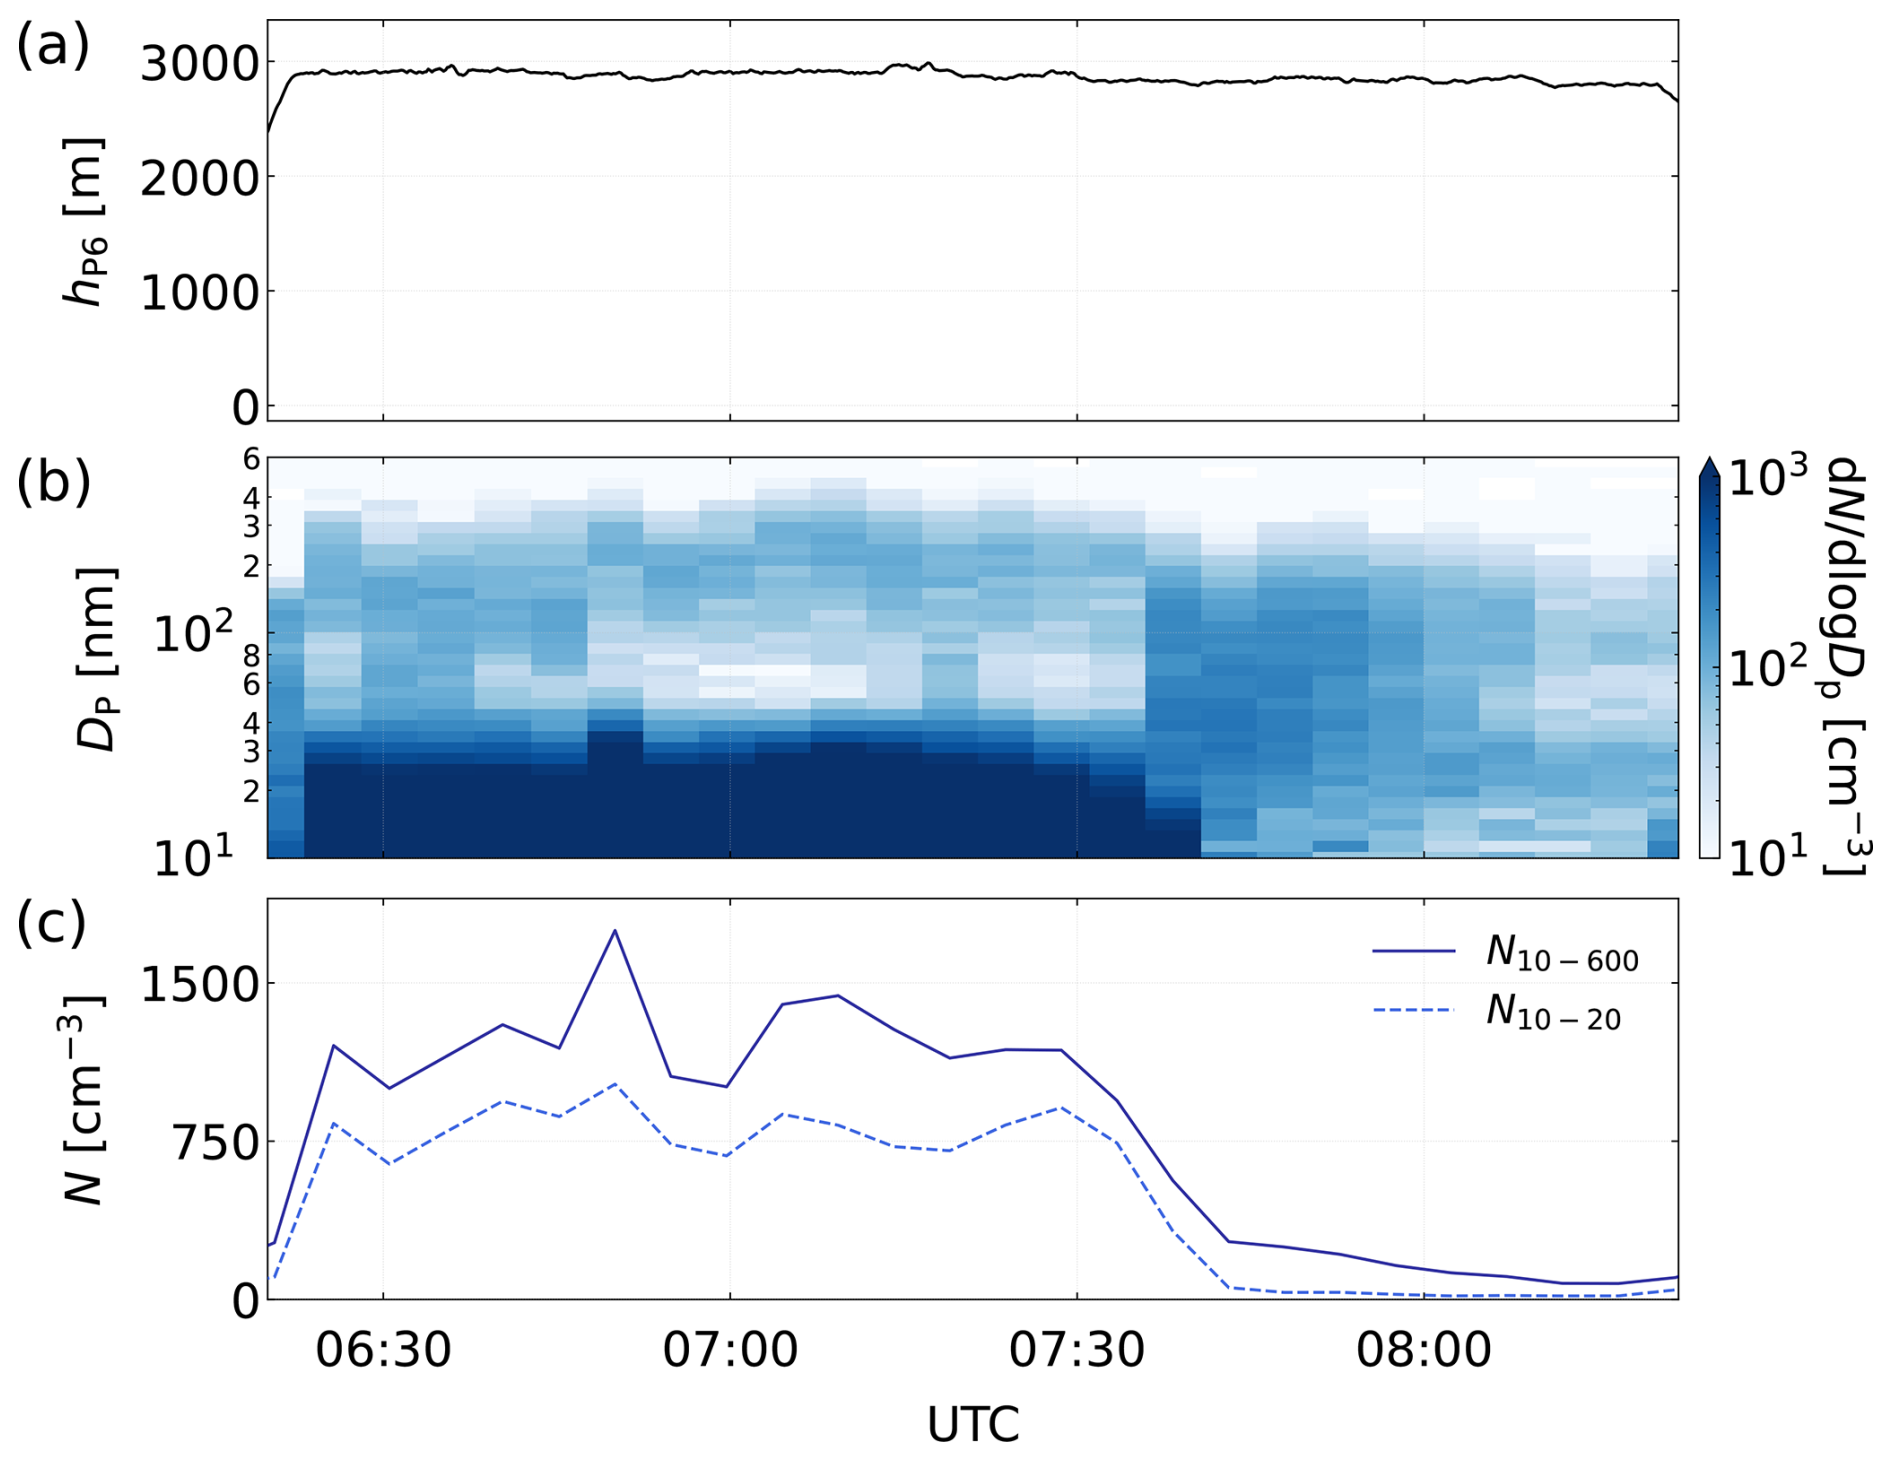
Figure 5(a) P6 altitude during RF04 on 13 April 2024. (b) MPSS-measured PNSD. (c) Integral particle number concentrations in the total measured size range (10 nm nm, solid line) and in the nucleation mode size range (10 nm nm, dashed line), respectively.
In the two days ahead of the flight, a low pressure system located over the east coast of Greenland advected warm and moist air over the sea ice edge in the Fram Strait (Fig. 4b). Within this warm-air intrusion, North Atlantic ABL air was lifted up to the free troposphere. The uplifting over the sea ice edge was accompanied with the formation of precipitating clouds, which dissipated before sampling of the air mass. Consequently, the sampled free tropospheric air was cloud-free. The cumulus clouds visible in the satellite image in Fig. 4a capped the marine ABL, which was located more than 2 km beneath the flight track. Therefore, we expect no influence of these low-level clouds on our measurements in the free troposphere. In addition to the southerly air masses from the Atlantic, air masses originating at higher latitudes close to Svalbard were probed during RF04 (Fig. 4c).
During the time period from about 06:23 to 07:40 UTC, flying at high altitudes (≈ 2890 m), and covering a distance of about 409 km, we encountered elevated number concentrations in the lower MPSS size bins (Fig. 5). The measured PNSDs featured a sharp decline in the size range from 10 to about 60 nm, i.e., we observed the “upper” end of a pronounced nucleation mode (see Fig. S8 for the related median PNSD). Detected particle number concentrations in the size range from 10 to 20 nm reached on average values of about cm−3, which constituted about 68 % of the total particle number concentrations measured in the range from 10 to 600 nm (Fig. 5c). In other words, we detected newly formed particles in the Arctic free troposphere across a large geographical area.
For the time period 07:40 to 08:19 UTC, encountered PNSDs featured no distinct nucleation mode, and number concentrations in the size range from 10 to 20 nm were substantially lower ( cm−3, 17 % of the total MPSS-measured number concentrations, Fig. 5c), i.e., no newly formed particles were present. Notably, the newly formed particles observed during the first part of the transit flight were associated with air masses originating from lower latitudes which were transported into the Arctic within a warm-air intrusion (Fig. 4b), while in the northerly air masses no newly formed particles were detected (Fig. 4c).
Backward trajectory analysis of all air masses featuring newly formed particles in the free troposphere
To further elucidate free tropospheric newly formed particles, which we observed on eight different days, considering all research flights performed during BACSAM II, and utilizing backward trajectories, a systematic analysis of free tropospheric air mass history was carried out. We investigated both free tropospheric air masses that show clear signs of newly formed particles, and free tropospheric air masses that exhibit no indications of newly formed particles. Every minute of each flight, we initiated a five-day backward trajectory at the pressure altitude of the aircraft. Hence, the air sampled during one PNSD measurement, which lasts for approximately 5 min and indicates either the presence or absence of newly formed particles, is represented by five backward trajectories. The results of the analysis are presented in Fig. 6, which depicts median values of meteorological and geographical parameters along the trajectories of all flight sections carried out in the free troposphere throughout the campaign.
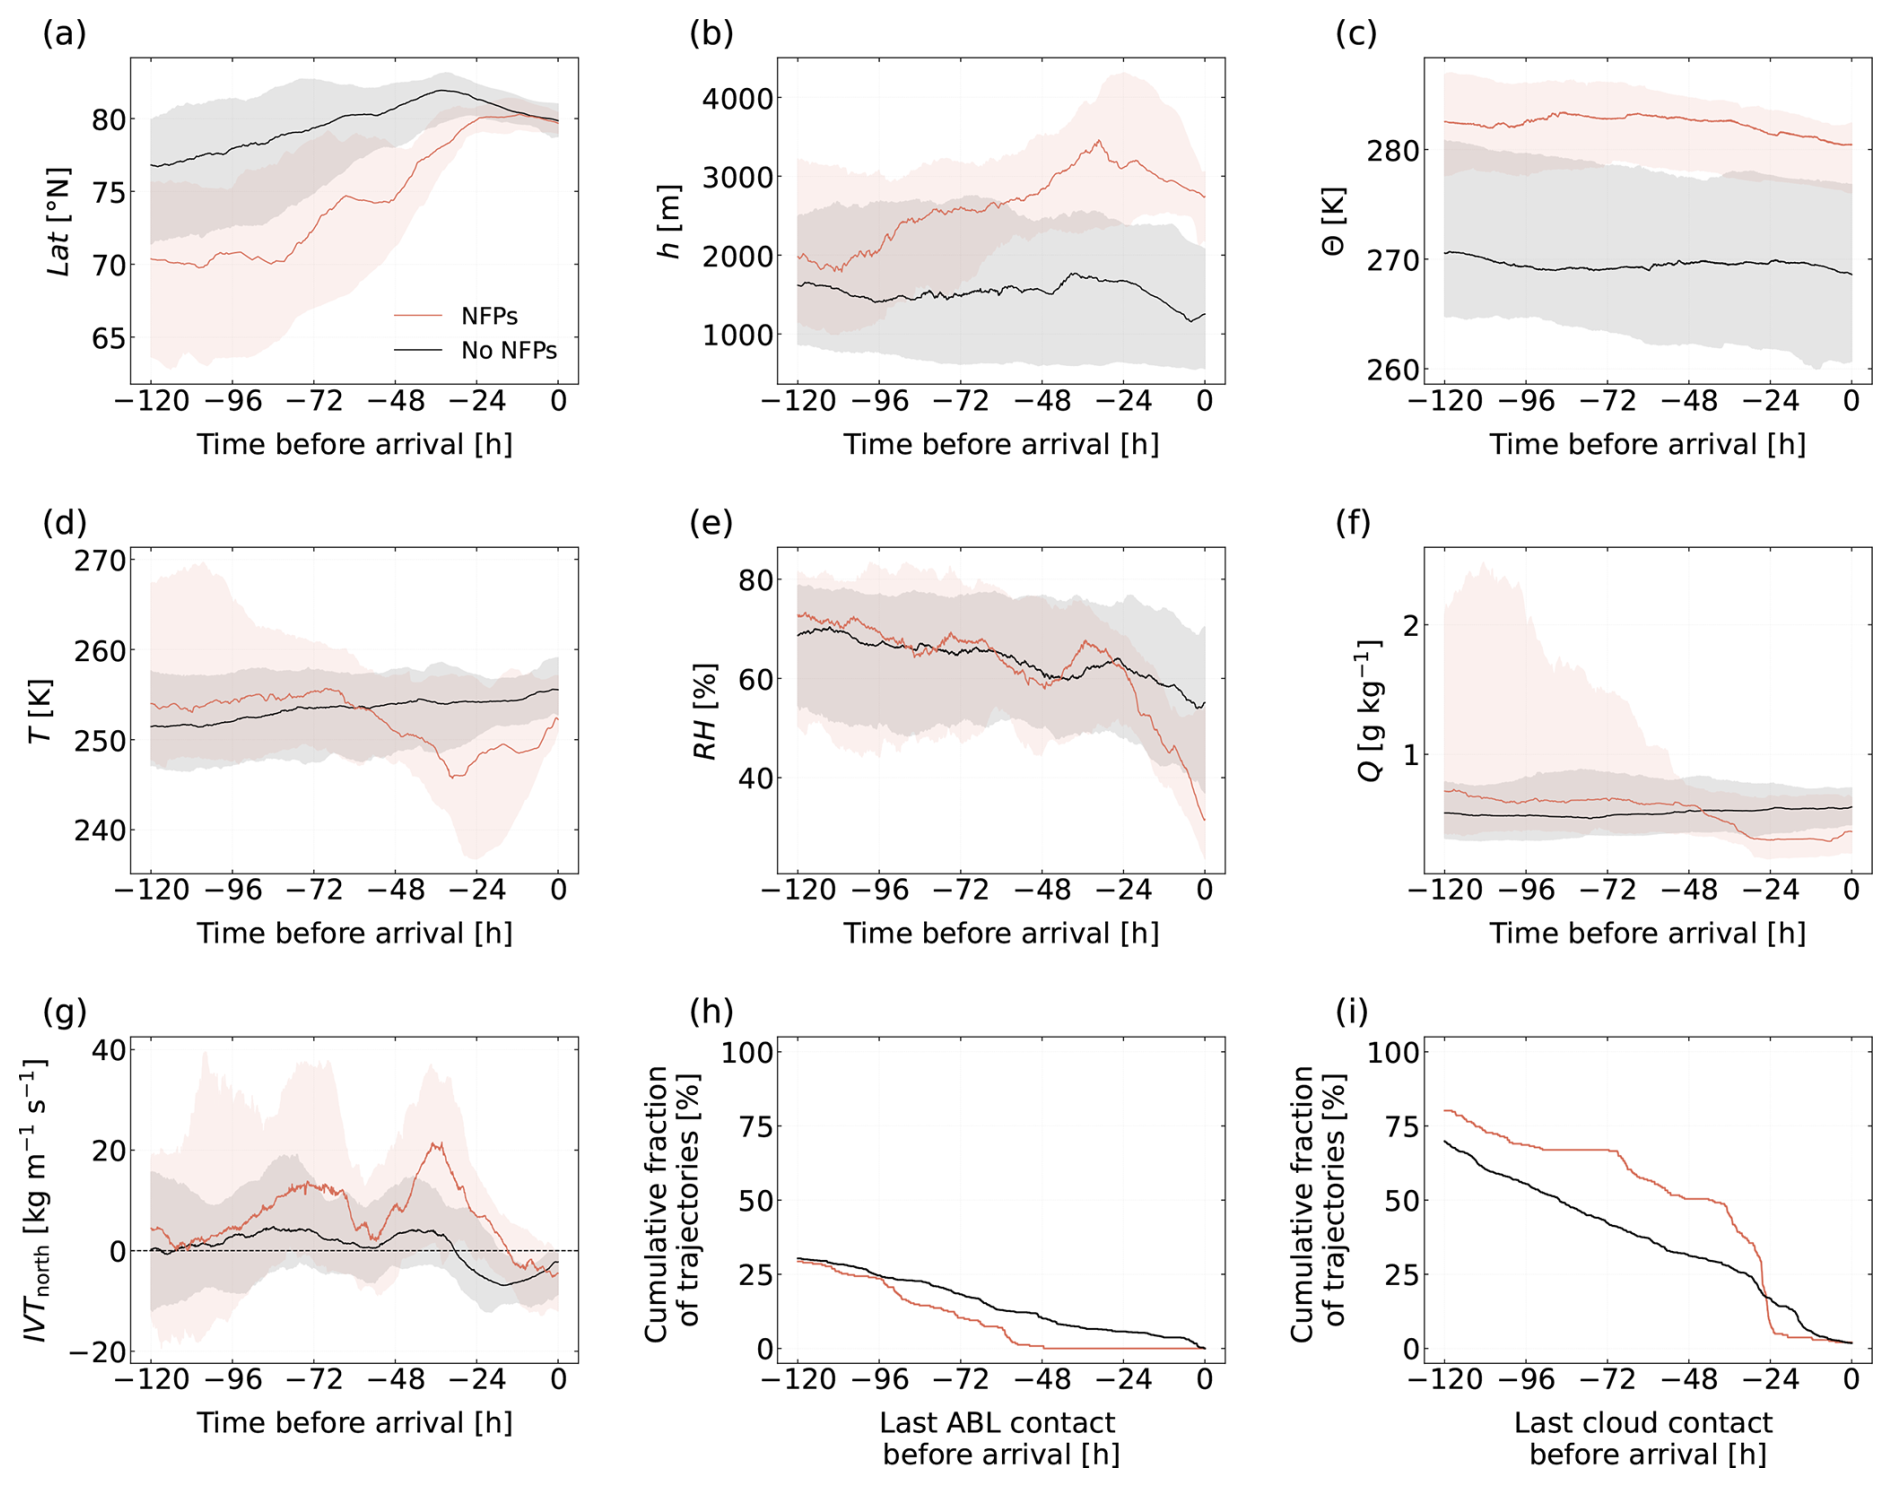
Figure 6Comparison of geographical and meteorological parameters along the backward trajectories of flight sections in the free troposphere between trajectories connected to the presence (red) and absence (black) of newly formed particles (NFPs). Shown, as a function of time prior to arrival at the measurement location, are median values (solid lines) and interquartile ranges (shaded areas) of (a) latitude Lat, (b) altitude h, (c) potential temperature Θ, (d) absolute temperature T, (e) relative humidity RH, (f) specific humidity Q, and (g) northward integrated water vapor transport IVTnorth. The last two subplots show the cumulative fraction of the last contact of the trajectories with the (h) ABL and (i) clouds. Note that if the cumulative fraction does not increase to 100 % at h, this indicates that a fraction of the trajectories was not in contact with the ABL/clouds during the last five days (the maximum time span the calculated trajectories cover).
Predominantly, air masses featuring newly formed particles in the free troposphere originated further south compared to air masses with no indications of free tropospheric newly formed particles, and gradually moved poleward at high altitudes during the five days prior to arrival (Fig. 6a–c). Initially, these air masses connected to newly formed particle were warmer and contained more moisture (Fig. 6d, f). Higher values of northward integrated water vapor transport (IVTnorth) show that in the whole column more water vapor was transported poleward for cases when newly formed particles were observed in the Arctic free troposphere (Fig. 6g). About 60 h before arrival, temperatures of air masses linked to newly formed particles started to decrease, and between 24 to 48 h prior to arrival, specific humidities decreased as well, while for the trajectories featuring no newly formed particles, the specific humidities remained rather constant throughout the last five days. Consequently, air masses associated with newly formed particles became colder and less humid compared to air masses showing no signs of free tropospheric newly formed particles. The latter, i.e., the decrease of specific humidity, might be caused by the formation of precipitating clouds, as already mentioned in the case study above. Considering the 75th percentile of the specific humidity in addition to the median values, the analysis suggests that some precipitation already set in up to roughly 100 h prior to arrival for trajectories connected to newly formed particles. About 80 % of all backward trajectories linked to free tropospheric newly formed particles were in contact with clouds on their way to the measurement location during the previous five days, as well as about 70 % of the backward trajectories featuring no newly formed particles (Fig. 6i). However, no clouds were present during the last 24 h before the measurement for the air masses featuring newly formed particles. For approximately 50 % of the respective trajectories the last contact with clouds occurred between about 24 to 48 h prior to arrival (Fig. 6i). The decrease in specific humidity during the same time period (Fig. 6f) already mentioned above indicates that the removal of clouds, at latest 24 h prior to arrival, could (partly) be caused by precipitation. None of the backward trajectories featuring newly formed particles resided in the ABL during the last 48 h prior to arrival, and about 70 % of the backward trajectories had no contact with the ABL for the last five days (Fig. 6h).
These findings suggest that the cases of newly formed particles in the Arctic free troposphere observed during our campaign are predominantly connected to poleward transport of warm and moist air, as occurring, e.g., during warm-air intrusions (Wendisch et al., 2024). Furthermore, because the trajectories overwhelmingly remained in the free troposphere during the transport to the measurement region, the results indicate that the precursor gases involved in the formation of these particles originated from long-range transport from lower latitudes, with NPF very likely occurring in the Arctic free troposphere. Such a transport pathway for precursor gases resulting in free tropospheric NPF has already been suggested in a modeling study by Price et al. (2023).
The above findings imply a potential role for clouds in the transport and possibly transformation of precursors, e.g., through releasing precursor gases from evaporating cloud droplets (Weber et al., 2001; Wehner et al., 2015). Precipitation caused by these clouds might have also increased the probability for NPF to occur by removing large aerosol particles, thus decreasing the pre-existing particle surface area and consequently reducing scavenging of gaseous precursors and newly formed particles (Perry and Hobbs, 1994; Weber et al., 2001). Interestingly, already Khadir et al. (2023) observed a consistently positive correlation between nucleation mode particles and precipitation rate within the air mass during the transport to Zeppelin research station from about 24 to 96 h prior to arrival, and mostly negative correlations between precipitation rate and nucleation mode particles in the last 12 h. These results were found for data recorded from March to May, i.e., for a similar season as for our campaign, and covered the years from 2010 to 2019. Although with our dataset we cannot robustly identify significant correlations similar to Khadir et al. (2023), our analysis likewise suggests that precipitating clouds (occurring until about 24 h prior to the measurement) might create favorable conditions for NPF to occur by releasing precursors and reducing the existing particle surface area (i.e., decreasing the condensation sink).
The presence of newly formed particles in the Arctic free troposphere has occasionally been reported before (Weber et al., 2003; Khosrawi et al., 2010). For example, Weber et al. (2003) conducted systematic aircraft measurements in the free troposphere of the Canadian Arctic from January to May 2000. During one of 38 research flights, they observed one clear NPF event at an altitude of approximately 4200 m over the Canadian Arctic Archipelago. During the other 37 flights of their campaign, no indications of NPF occurring at high altitudes were found. Similarly, Khosrawi et al. (2010) detected one NPF event in the upper free troposphere at an altitude of 7000 m over Storfjoden (Svalbard). Below 4000 m, nucleation mode particles were reported to occur quite frequently during their campaign centered around Svalbard in May and June 2004. Yet, no further altitude-resolved information or discussion discriminating between ABL and free tropospheric NPF was provided, except for one case study, where in addition to the NPF event at 7000 m, nucleation mode particles were found inside the ABL. Analyzing measurements conducted with a tethered balloon system, Pilz et al. (2024) reported enhanced number concentrations of aerosol particles in the size range from 12 to 150 nm concurrently with low concentrations of particles larger than 150 nm in the summertime Central Arctic during the Multidisciplinary drifting Observatory for the Study of Arctic Climate (MOSAiC) expedition. The authors hypothesized that NPF taking place aloft lead to these elevated concentrations of smaller particles but were unable to constrain potential sources and associated processes due to a limited maximum measurement altitude of 1000 m and because of missing PNSD measurements. Utilizing helicopter (Kupiszewski et al., 2013) and aircraft measurements (Burkart et al., 2017; Willis et al., 2016, 2017), a number of studies reported generally lower concentrations of nucleation mode particles in the Arctic free troposphere compared to the ABL. In these studies, however, several NPF events were observed near the surface.
Similar to the previous observational results, our data show that newly formed particles occurred in the free troposphere. Notably, our observations suggest that these particles prevailed over distances of several hundreds of kilometers.
Whether the formation of clouds and thus cloud radiative forcing could be affected by the presence of newly formed particles in the free troposphere following their potential growth to CCN sizes, remains to be assessed and is both beyond the scope of this article and not feasible with the present dataset. In this regard, e.g. Leck and Bigg (1999), Bigg and Leck (2001) described that during their summertime campaign over the central Arctic Ocean, highly stable conditions prevented mixing between the free troposphere and the ABL. Pointing toward the importance of free tropospheric particles for cloud formation, however, Pohorsky et al. (2026) reported that free tropospheric sources of CCN were required to explain measured cloud droplet number concentrations. This is in line with a large-eddy simulation study by Igel et al. (2017) which demonstrated that elevated aerosol particle layers in the free troposphere could be entrained into the cloud-topped ABL by cloud-induced mixing.
Overall, our results lead us to the hypothesis that meridional transport in combination with cloud processing and precipitation, as occurring in connection with, e.g., warm-air intrusions, may play an important role in free tropospheric Arctic NPF by delivering the ingredients (precursor gases including water vapor) to locations (high altitudes) with favorable conditions (intense solar radiation, low temperatures, small pre-existing particle surface area) for NPF.
3.3 Newly formed particles inside the atmospheric boundary layer over sea ice
Inside the ABL, newly formed particles were detected, e.g., on 15 April 2024 during RF05 while flying east of Svalbard at low altitudes (approximately 70 and 155 m) over sea ice, where cracks as well as open and partly refrozen leads were present (Fig. S9). The associated flight track is shown in Fig. 7a, with Fig. 7b, c depicting the backward trajectories for the air masses encountered along the flight track.
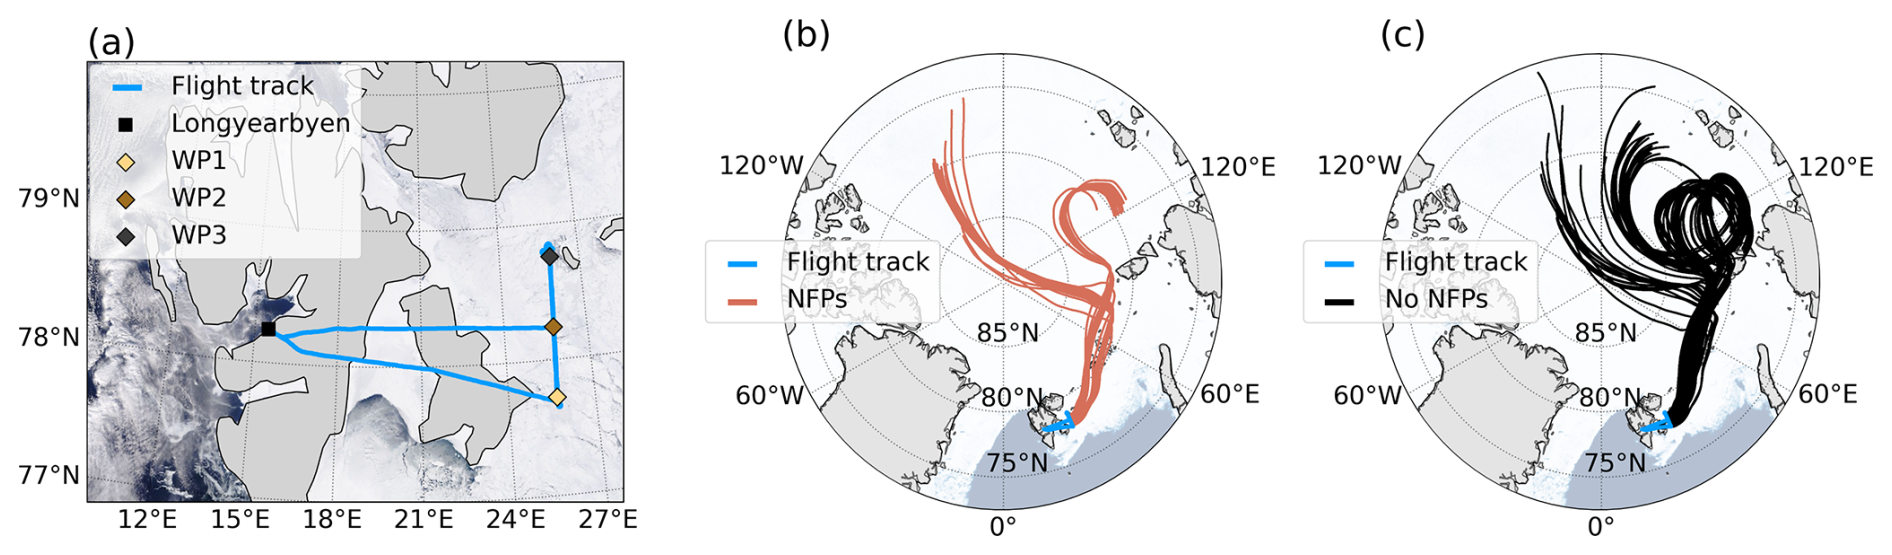
Figure 7(a) Flight track of RF05 on 15 April 2024. The MODIS-TERRA satellite image was retrieved from https://wvs.earthdata.nasa.gov. (b) Five-day backward trajectories associated with newly formed particles (NFPs) along the section of the flight track shown in Fig. 8. (c) Five-day backward trajectories connected to PNSD measurements featuring no newly formed particles. The sea ice concentration data shown in the subplots (b) and (c) were retrieved from https://www.seaice.uni-bremen.de (Spreen et al., 2008).
The area investigated was subject to the anti-cyclonic flow around a high pressure system north of Svalbard, causing cold air advection from the central Arctic to the target region. This meteorological situation resulted in air masses that exclusively originated in the high Arctic and traveled toward the P6 flight track from higher latitudes over sea ice-covered regions (Fig. 7b, c). All the way between waypoint 1 (WP1) and WP3, over a distance of about 115 km, clear sky conditions prevailed (Fig. 7a).
The presence of newly formed particles is indicated by the occurrence of a distinct nucleation mode, i.e., elevated aerosol particle number concentrations in the lower size bins of the PNSDs, which we observed during three consecutive legs at altitudes of ≈70 and ≈155 m between WP1 and WP3 (Fig. 8). Mean number concentrations in the nucleation mode size range reached cm−3 (time period 10:03 to 10:39 UTC), cm−3 (11:08 to 11:22 UTC), and cm−3 (12:17 to 12:40 UTC), accounting for about 40 %, 38 %, and 31 % of the total MPSS-measured aerosol particle number concentrations. In contrast, during the leg at ≈850 m altitude (11:30 to 12:00 UTC) between WP1 and WP3, as well as during the transit to and from the target region at ≈1360 m altitude, the PNSDs featured no nucleation mode and, accordingly, low number concentrations in the sub-20 nm size range (Fig. 8, cm−3, 1 % of the total MPSS-measured particle number concentration at 850 m).
From the vertical profiles of potential temperature obtained during the ascents and descents at WP1, WP2, and WP3 (Fig. 8a), we determine an ABL height of about 190 m in the region of interest (see Fig. S10). Thus, the three legs at 70 and 155 m, during which newly formed particles were detected, were carried out inside the ABL, while the leg at higher altitude (≈850 m), as well as the transits to and from the region of interest, took place in the free troposphere.
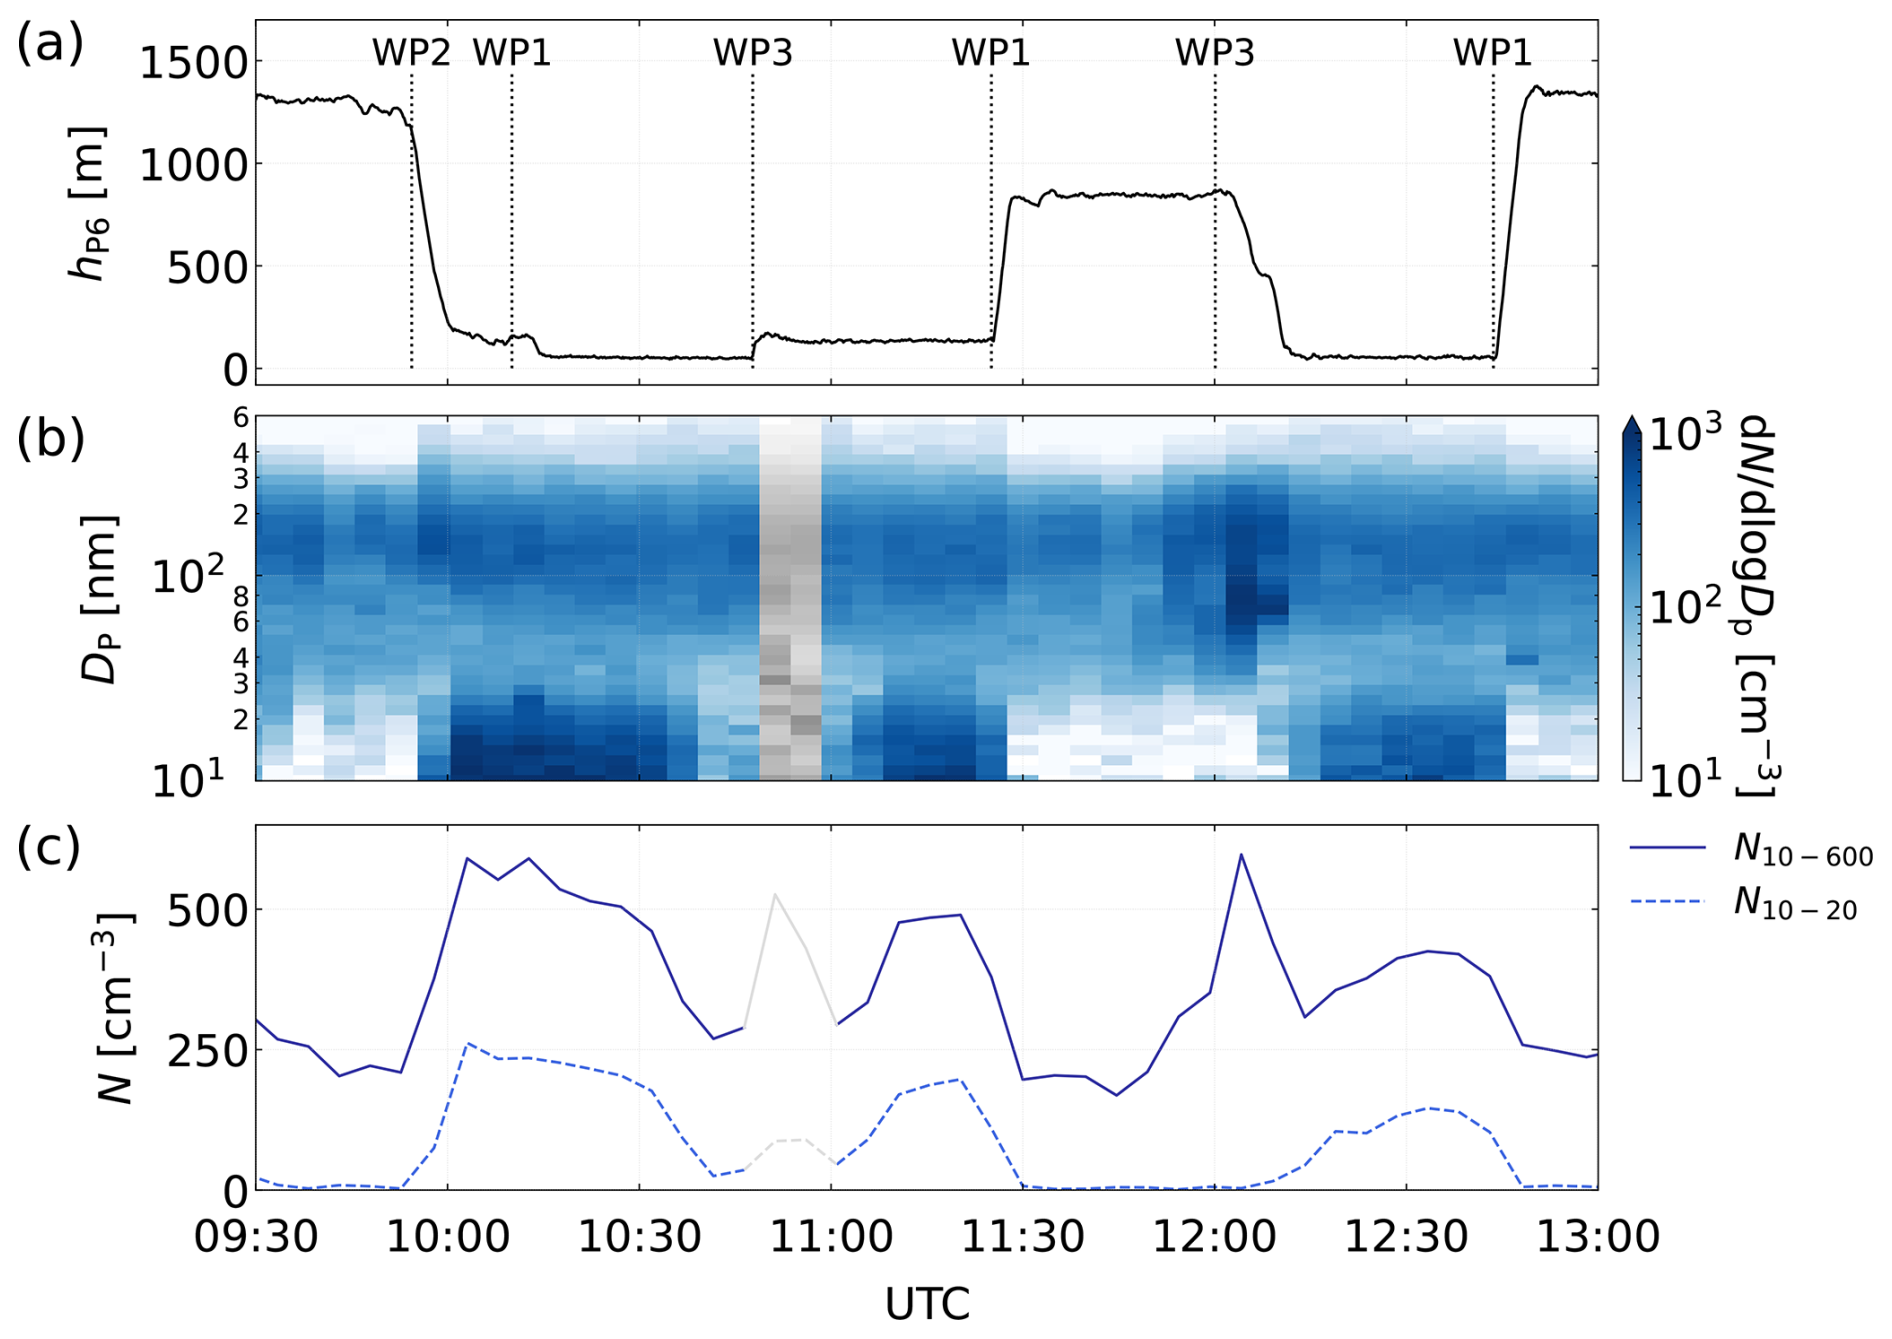
Figure 8(a) P6 altitude during RF05 on 15 April 2024. (b) MPSS-measured PNSD. (c) Integral particle number concentrations in the total measured size range (10 nm nm, solid line) and in the nucleation mode size range (10 nm nm, dashed line), respectively. The data measured from 10:51 to 11:01 UTC are grayed out in panels (b) and (c) since erroneous measurements due to possible sampling of aircraft exhaust cannot be ruled out.
Integral aerosol particle number concentrations in the total measured size range (10 to 600 nm) and in the size range from 10 to 20 nm decreased from WP1 to WP3, i.e., from south to north (Figs. 7a, 8). The spatial variability of the number concentration of nucleation mode particles points toward newly formed particles as the result of regional formation rather than long-range transport. Nucleation mode particles have short atmospheric residence times due to their high diffusion, coagulation with larger particles, and condensational growth out of the nucleation mode size (e.g., Pruppacher and Klett, 2010; Wallace and Hobbs, 2006). These effects tend to smooth out concentration gradients of such small particles, thereby making a contribution from long-range transport to the observed events less likely (Kupiszewski et al., 2013).
Interestingly, the particle number concentrations in the nucleation mode size range from 10 to 20 nm recorded during the legs inside the ABL between WP1 and WP3 (i.e., in the same area) decreased not only spatially, but also over time (Fig. 8c). In addition to the integral values shown above, Fig. S11 depicts median PNSDs for each of the three legs close to the surface individually, which likewise shows that number concentrations of particles in the nucleation mode reduce over time. This temporal variability points toward a regional source as well, since it suggests that we observed an NPF event that becomes weaker throughout the day. However, we are not able to unambiguously resolve if the precursors involved in NPF originated directly from the sea ice-covered measurement region, with various cracks and leads being present (Fig. S9), or if the precursors were transported to the target area from the higher Arctic. But, in our view, it appears feasible to conclude that the spatial and temporal variability of the newly formed particles encountered here (i.e., the decrease of sub-20 nm particles from WP1 to WP3 and throughout the day) and the similar origin of air masses featuring newly formed particles (Fig. 7b) and air masses without newly formed particles (Fig. 7c) rather indicate a regional source.
Backward trajectory analysis of all air masses featuring newly formed particles in the atmospheric boundary layer over sea ice
To further investigate the occurrence of newly formed particles inside the ABL over sea ice, an analysis of air mass history was carried out for the respective observations made during our campaign. Newly formed particles inside the ABL over sea ice were found twice, i.e., on 15 April (case study) and on 13 April for approximately 15 min north of Villum Research Station (see Fig. 2). Figure 9 presents the results of the backward trajectory analysis carried out for both events.
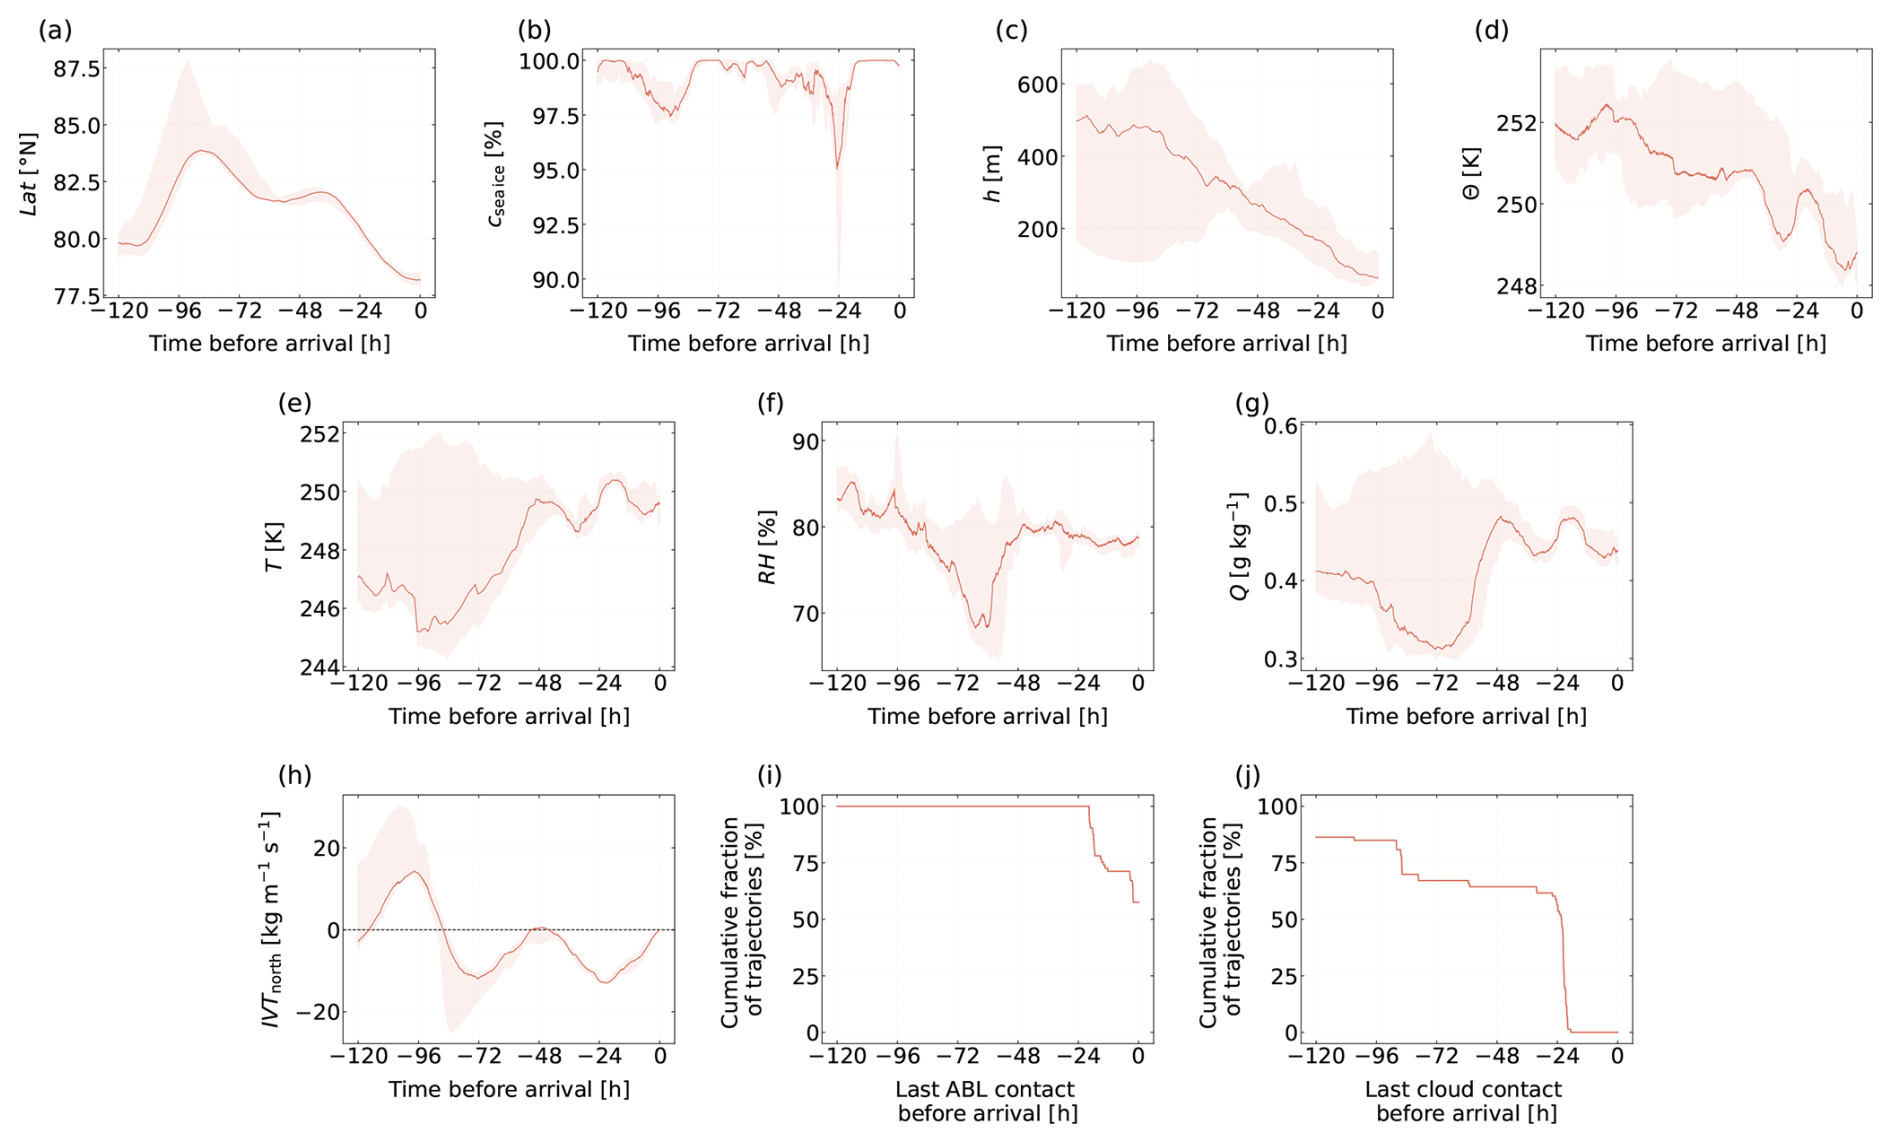
Figure 9Comparison of geographical and meteorological parameters along the backward trajectories of flight sections linked to newly formed particles inside the ABL over sea ice for the events on 13 and 15 April. Shown, as a function of time prior to arrival, are median values (solid lines) and interquartile ranges (shaded areas) of (a) latitude Lat, (b) sea ice concentration csea ice, (c) altitude h, (d) potential temperature Θ, (e) absolute temperature T, (f) relative humidity RH, (g) specific humidity Q, and (h) northward integrated water vapor transport IVTnorth. The last two subplots show the cumulative fraction of the last contact of the trajectories with the (i) ABL and (j) clouds. Note that if the cumulative fraction does not increase to 100 % at h, this indicates that a fraction of the trajectories was not in contact with the ABL/clouds during the last five days (the maximum time span the calculated trajectories cover).
Both days were characterized by cold air masses from northern latitudes which traveled over sea ice-covered regions (median sea ice concentration values between ≈ 95 % and 100 %, Fig. 9a, b, e). The air masses featured low specific humidities, but, due to cold temperatures, high relative humidities (w.r.t. water, Fig. 9e–g). Furthermore, the data suggest that all trajectories resided inside the ABL during the last 24 h (Fig. 9i) before arriving at the P6, providing the possibility for precursor uptake. For about 60 % of the trajectories, the last cloud contact occurred approximately 24 h before arrival in the target region (Fig. 9j). Roughly 15 % of the trajectories were not influenced by clouds on their way to the measurement location during the last five days, including 80 % of all trajectories on 13 April. For both days, the trajectories descended during the last five days, with the lowest altitude along the trajectories reached just before arrival at the aircraft (Fig. 9c). The descent of the backward trajectories again indicates rather regional precursor sources as the gases are very likely emitted from the surface.
NPF in the Arctic ABL in sea ice-covered regions has been observed e.g. by Allan et al. (2015), Sipilä et al. (2016), Baccarini et al. (2020), Beck et al. (2021). In these studies, concurrent chemical measurements suggested a link between iodine species and NPF events. Furthermore, it has been shown for both the Arctic and Antarctica that iodine can be emitted from the sea ice. Potential sources include marine microalgae (diatoms) growing below the sea ice (Hill and Manley, 2009; Atkinson et al., 2012), where the iodine can be emitted through cracks and leads and has been connected to thinning Arctic sea ice (Cuevas et al., 2018). The sea ice itself or the snowpack can also release iodine via abiotic, photo-chemical processes (Gálvez et al., 2016; Kim et al., 2016; Raso et al., 2017). Yet, since we cannot resolve the particle composition of nucleation mode particles nor conducted gas-phase measurements, at this point, we cannot ultimately determine the precursor gases which could have participated in the formation of the newly formed particles observed in this case study. Nevertheless, these previous results suggest the sea ice-covered target area as a plausible source region of precursor gases and newly formed particles.
In summary, from our observations, we hypothesize that the observed presence of newly formed particles in the ABL over sea ice is connected to precursor gases (conceivably iodine components, as reported by Allan et al., 2015; Sipilä et al., 2016; Baccarini et al., 2020; Beck et al., 2021) which originate from natural, most likely regional, but possibly also higher-latitude Arctic sources within the sea ice, from leads, or snow.
3.4 Newly formed particles in the vicinity of clouds
Newly formed particles in the vicinity of clouds were, e.g., encountered on 24 April 2024 during RF08, while flying north of Svalbard over sea ice (open leads and cracks were present, see Fig. S12) with an initially slightly broken and then closed stratocumulus cloud deck (Fig. 10a). Measurements were carried out below cloud base and at cloud top.
On 24 April, a high pressure system was centered directly over Svalbard, resulting in westerly flow in the target region. The air mass probed at altitudes between approximately 600 and 1200 m originated either in the North Atlantic close to Greenland, near Iceland, or northern Scandinavia (Fig. 10b), and was advected from the North Atlantic marine ABL and lifted above the sea ice, where this layer was decoupled from the surface (Sect. S8.2, Fig. S13). At the top of that elevated mixed layer, stratocumulus clouds were present (Fig. 10a), with a cloud base at about 800 m altitude, and cloud top at about 1150 m. The air mass that was probed at about 2100 m in the free troposphere originated in northern Canada and passed over Greenland on its way to the P6 position (Fig. 10c).
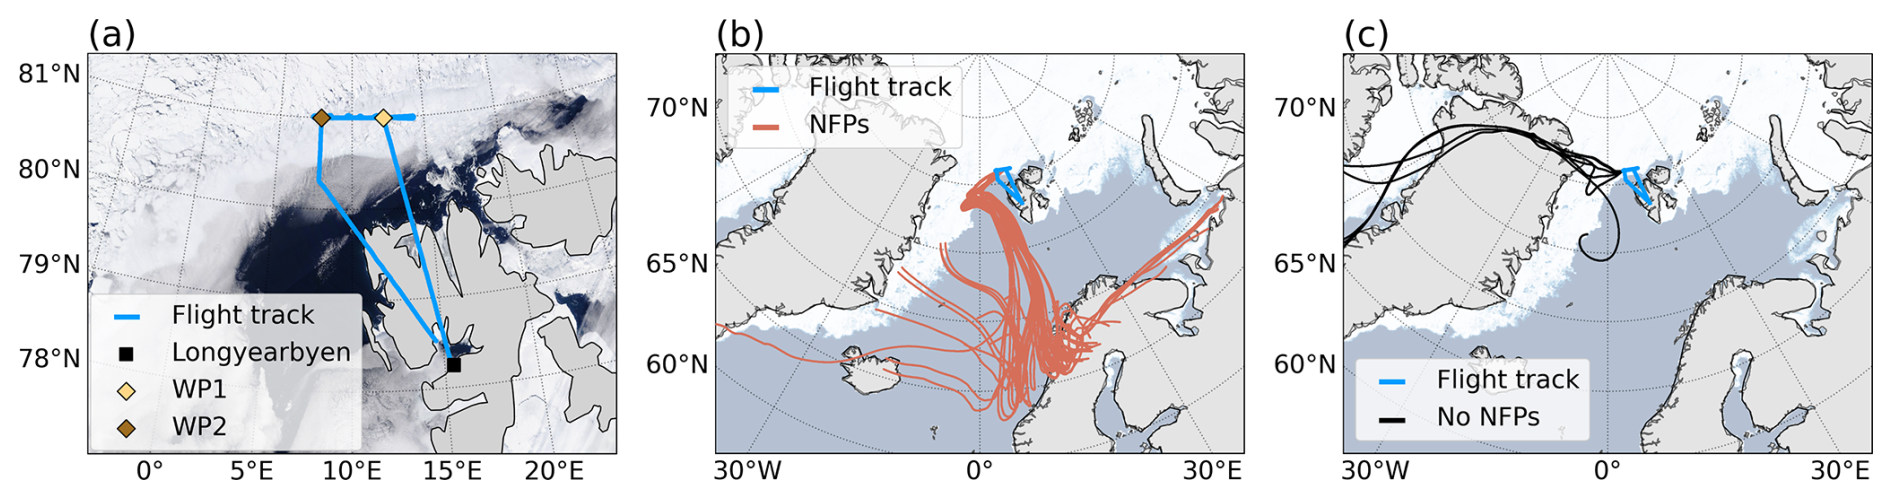
Figure 10(a) Flight track of RF08 on 24 April 2024. The MODIS-TERRA satellite image was retrieved from https://wvs.earthdata.nasa.gov. (b) Five-day backward trajectories associated with newly formed particles (NFPs) along the section of the flight track shown in Fig. 11. (c) Five-day backward trajectories connected to PNSD measurements featuring no newly formed particles. The sea ice concentration data shown in the subplots (b) and (c) were retrieved from https://www.seaice.uni-bremen.de (Spreen et al., 2008).
Here, we specifically discuss the data collected between WP1 and WP2 over a distance of 75 km in the time period between 10:28 and 11:35 UTC. This time period includes a descent from approximately 2100 m down to below cloud level (10:29 to 10:35 UTC), a leg at cloud base (10:35 to 10:52 UTC), an ascent through cloud with subsequent drying away of the ice collected inside cloud, and finally a leg at cloud top (11:07 to 11:35 UTC). With respect to the aerosol particle measurements, the time period from 10:52 to 11:07 UTC, i.e., the ascent through cloud and the subsequent drying away of ice, is excluded from further analysis, as erroneous measurements due to icing of the aerosol inlet and/or droplet shattering (Weber et al., 1998) cannot be ruled out. The MPSS data from this period are grayed out in Fig. 11b, c.
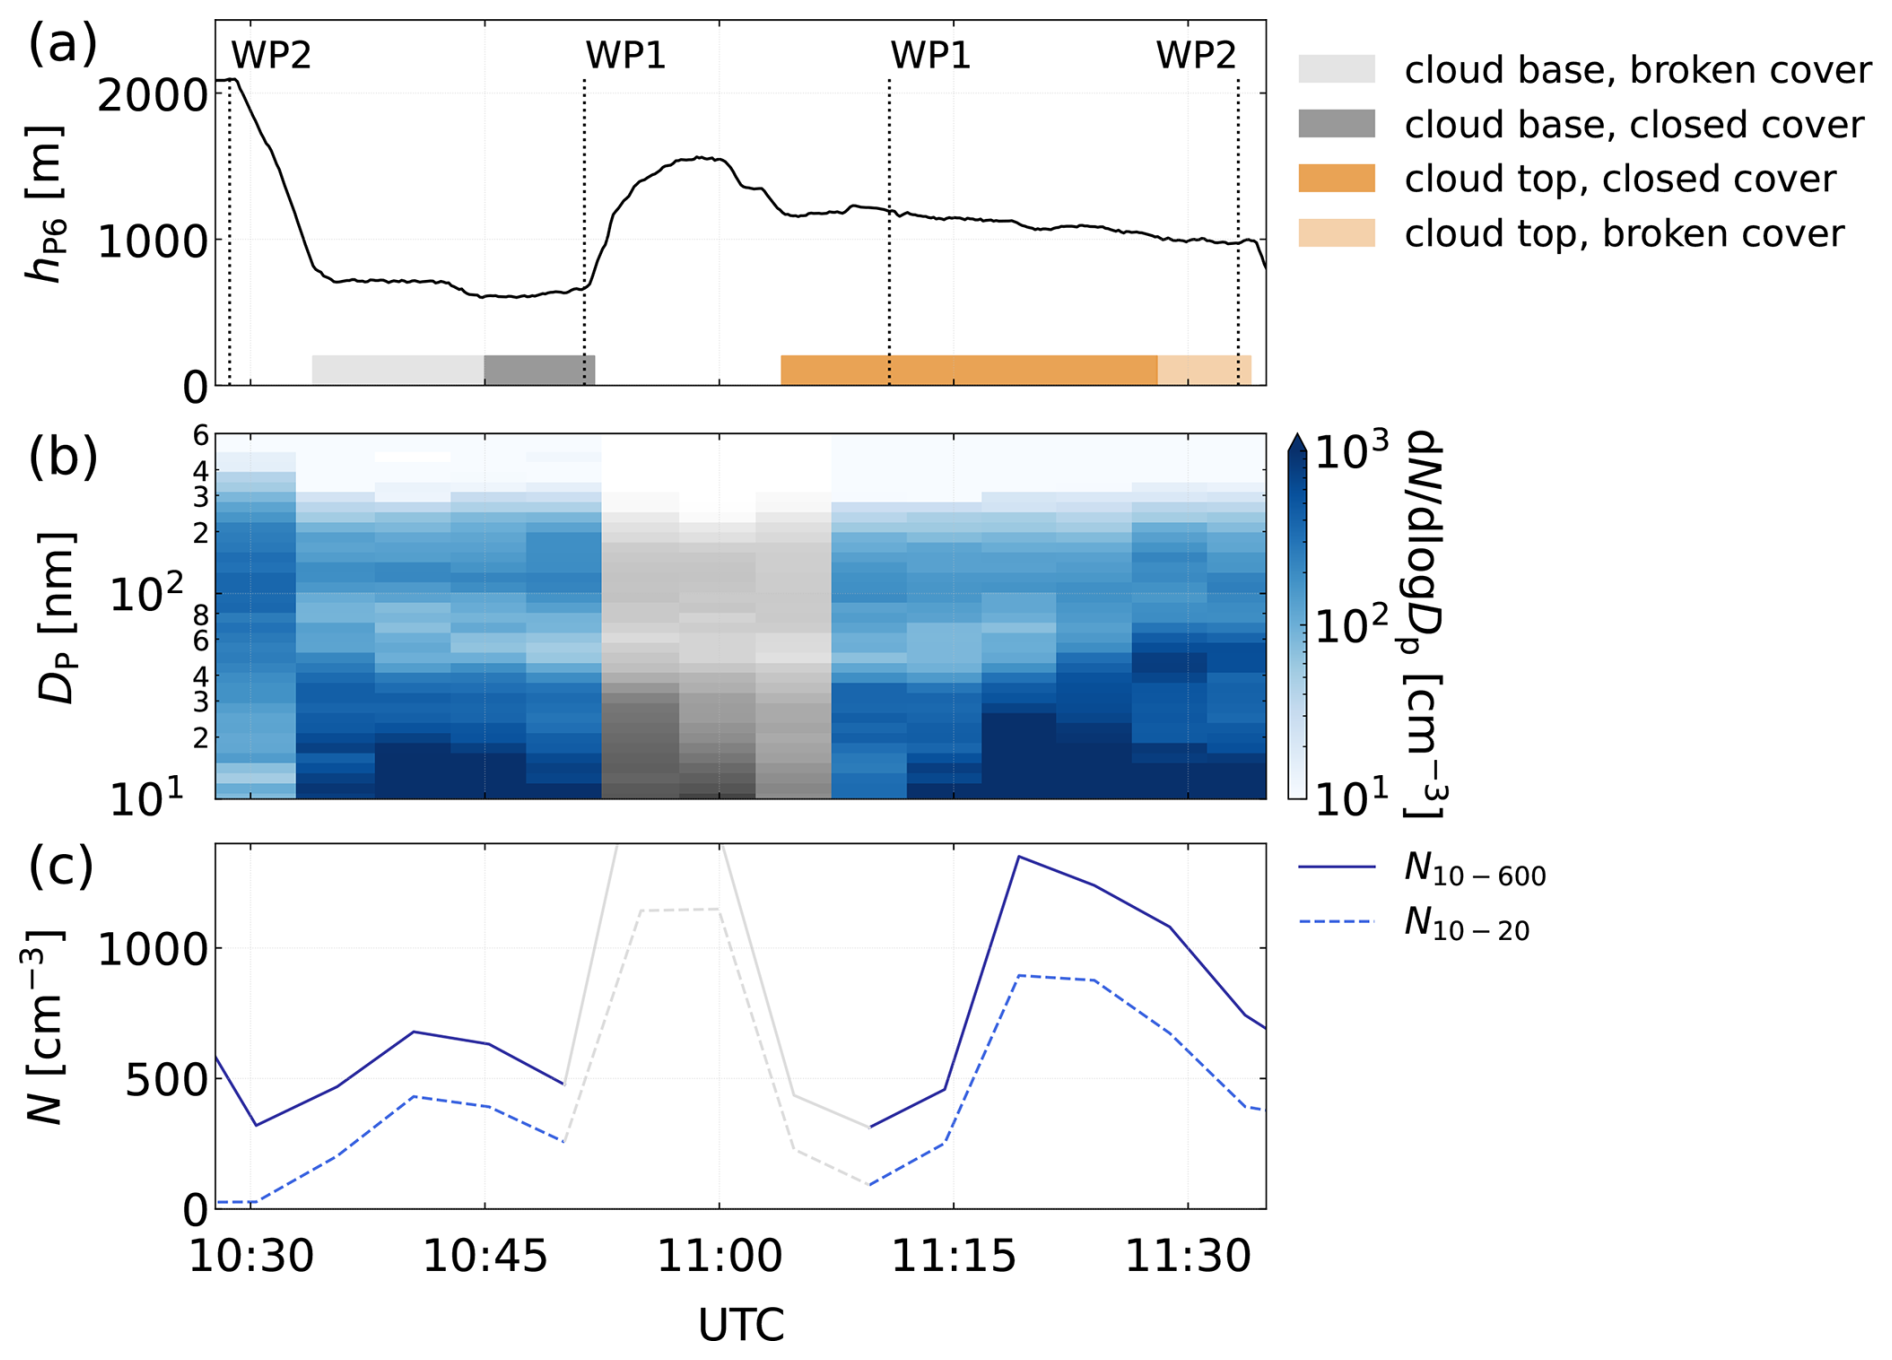
Figure 11(a) P6 altitude during RF08 on 24 April 2024. (b) MPSS-measured PNSD. (c) Integral particle number concentrations in the total measured size range (10 nm nm, solid line) and in the nucleation mode size range (10 nm nm, dashed line), respectively. The data measured from 10:52 to 11:07 UTC are grayed out in panels (b) and (c) since erroneous measurements due to icing of the aerosol inlet and/or droplet shattering cannot be ruled out.
The PNSDs at cloud top and at cloud base featured a pronounced nucleation mode and correspondingly enhanced number concentrations in the nucleation mode size range from 10 to 20 nm, regardless of the cloud cover being closed or broken (Fig. 11). In contrast, in the PNSD measured during the descent toward cloud level around 10:30 UTC, which we assume to be representative for the free troposphere, concentrations in the sub-20 nm size range were low. This PNSD should be considered semi-quantitative only, as it represents an average over an altitude range of more than 1000 m. The presence/absence of particles in the size range from 10 to 20 nm is also clearly visible in Fig. 11c, with particles in the size range below 20 nm contributing approximately 67 %, 60 %, and 9 % to the total aerosol particle number concentrations at cloud top, cloud base, and in the free troposphere, respectively. A more detailed comparison between PNSDs measured at cloud top and at cloud base reveals an interesting effect (Fig. 12). The overall shapes of the distributions are qualitatively similar, with the cloud top and cloud base accumulation mode concentrations following each other rather closely, while the number of Aitken and nucleation mode particles is reduced by roughly a factor of two to three at cloud base, resulting in a more pronounced Hoppel-minimum for the PNSDs measured at cloud base. Even a small shift of the accumulation mode at cloud base to larger sizes can be seen, which could be due to particle growth inside cloud. For the comparison of the PNSDs measured at cloud top and cloud base, we only considered measurements carried out in the exact same geographical area, i.e., measurements between WP1 and WP2 from approximately 10:38 to 10:52 UTC (cloud base) and 11:17 to 11:31 UTC (cloud top). However, as differences are small and spatial and/or temporal variability cannot fully be ruled out, we cannot draw solid quantitative conclusions. To indicate the absence of nucleation mode particles in the free troposphere, the PNSD measured during the descent from 2100 m toward cloud level is also shown in Fig. 12.
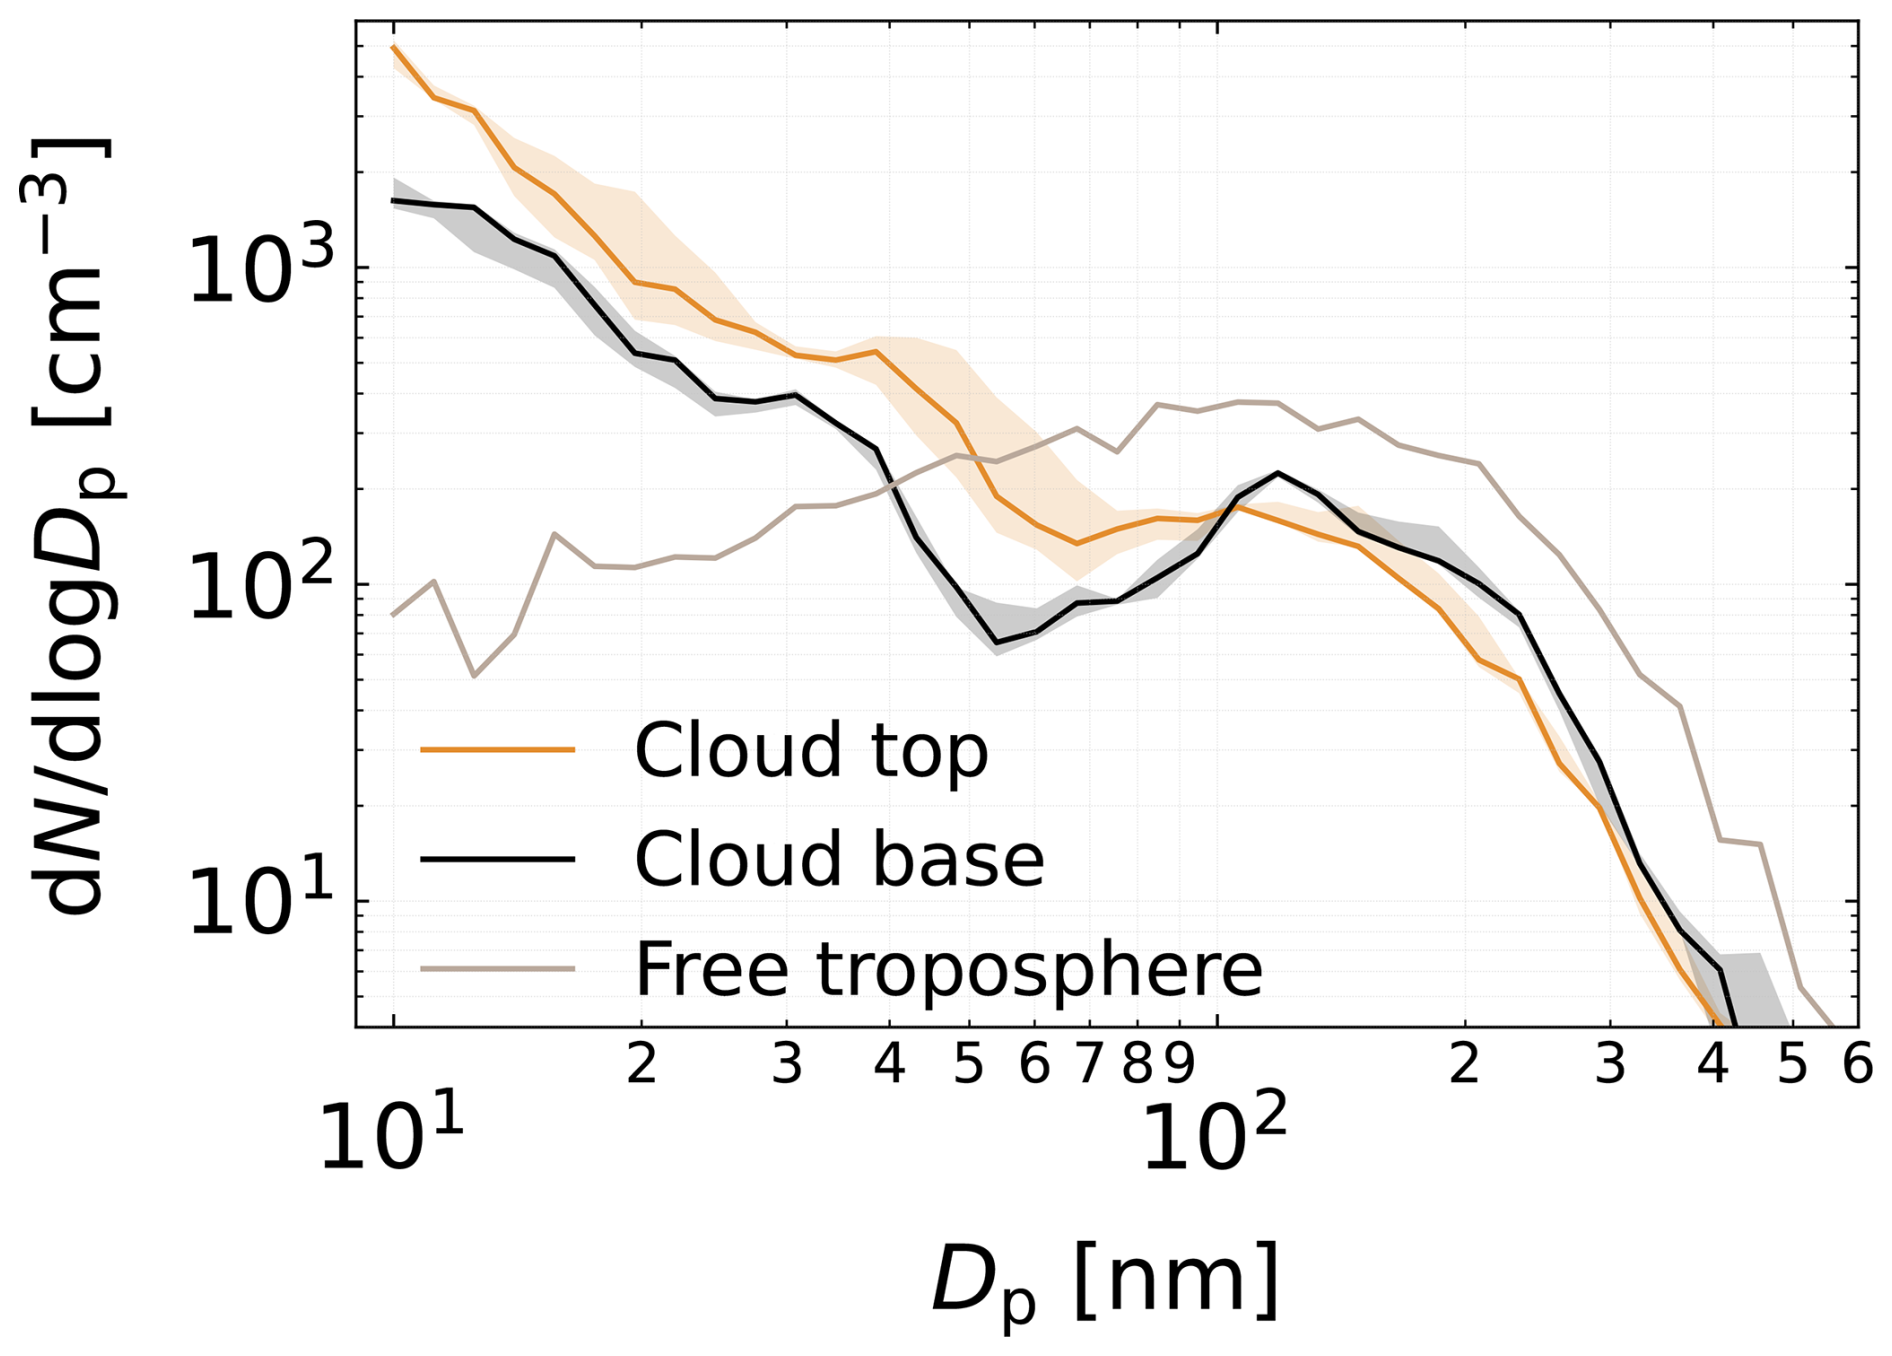
Figure 12Median PNSDs measured at cloud top, cloud base, and in the free troposphere. The shaded areas represent the interquartile ranges.
Backward trajectory analysis of all air masses featuring newly formed particles in the vicinity of clouds
Figure 13 presents the results of the backward trajectory analysis carried out for all PNSD measurements featuring newly formed particles in the vicinity of clouds, which were observed during three different research flights on 23, 24 (case study), and 26 April.
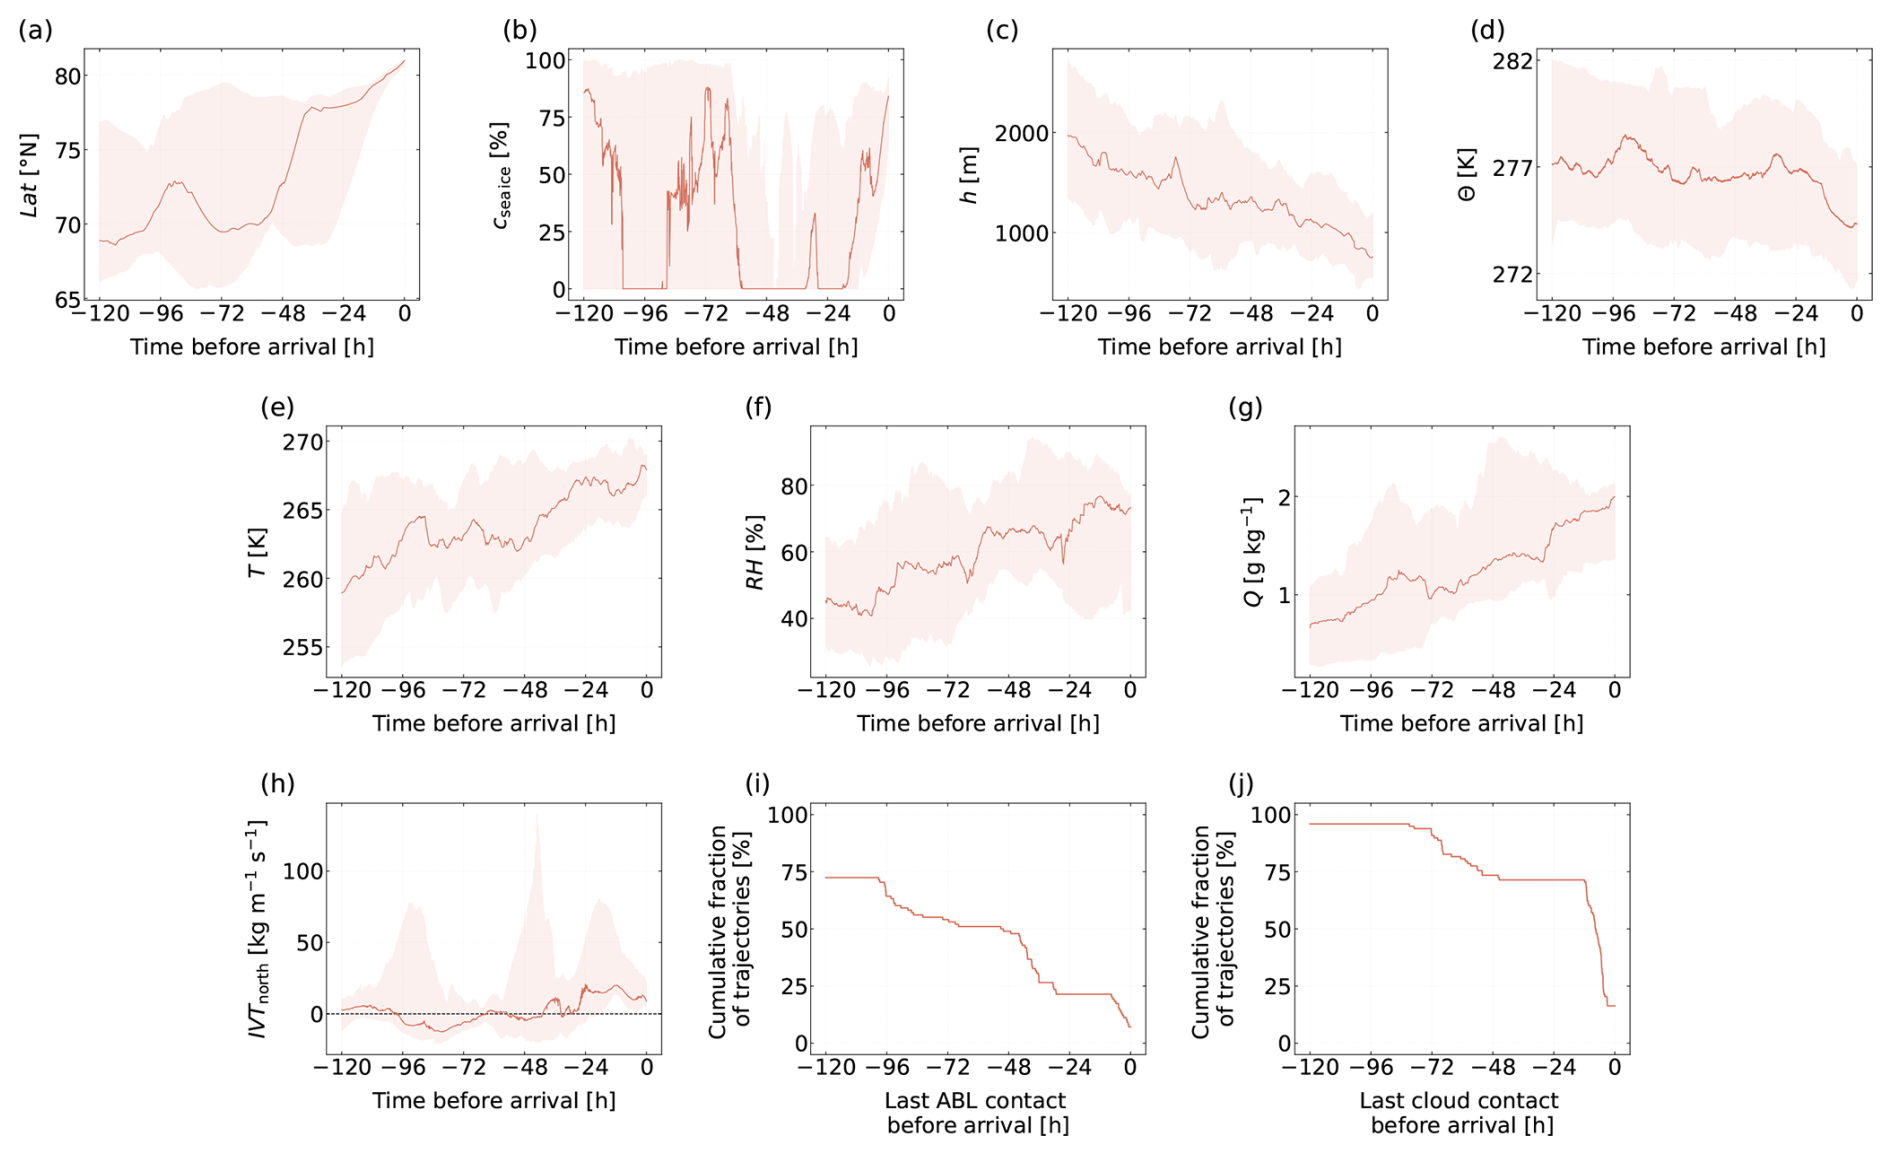
Figure 13Meteorological parameters along backward trajectories linked to newly formed particles detected in the vicinity of clouds. Shown, as a function of time prior to arrival, are median values (solid lines) and interquartile ranges (shaded areas) of (a) latitude Lat, (b) sea ice concentration csea ice, (c) altitude h, (d) potential temperature Θ, (e) absolute temperature T, (f) relative humidity RH, (g) specific humidity Q, and (h) northward integrated water vapor transport IVTnorth. The last two subplots show the cumulative fraction of the last contact of the trajectories with the (i) ABL and (j) clouds. Note that if the cumulative fraction does not increase to 100 % at h, this indicates that a fraction of the trajectories was not in contact with the ABL/clouds during the last five days (the maximum time span the calculated trajectories cover).
Predominantly, the air masses approached from lower latitudes and moved northward, mainly in the last 48 h prior to arrival (Fig. 13a). The trajectories traveled over the open sea in the last 18 to 60 and 90 to 100 h (Fig. 13b), whereby they became warmer and picked up humidity (Fig. 13e–g). Since the moist air masses moved poleward, an increase of IVTnorth is visible in the last 48 h before arrival (Fig. 13h). Almost 75 % of the trajectories were in contact with the ABL during the last five days (Fig. 13i), presenting the opportunity for moisture and gaseous precursor uptake, potentially from the open ocean. In about 90 % of the air masses, clouds had formed within the previous five days (Fig. 13j). The gradual decrease in potential temperature found in the last 24 h prior to arrival (Fig. 13d) might result from the presence of these clouds, i.e., from cloud top radiative cooling.
Cloud tops, due to the prevailing high humidities and high actinic fluxes, which enhance photochemically driven processes, as well as the presence of potential particle precursors released from evaporating droplets, have been reported to be favorable locations for NPF to take place (e.g., Hegg et al., 1990; Clarke et al., 1998; Weber et al., 2001; Keil and Wendisch, 2001; Wehner et al., 2015). In the Arctic, enhanced concentrations of particles in the size range from 20 to 300 nm at the top of stratus clouds were previously observed by Garrett et al. (2002), who suggested that recent particle formation at cloud top lead to these high concentrations. Similarly, a burst of nucleation mode particles within 50 m of the top of an Arctic low-level cloud was recently detected by Pohorsky et al. (2026).
Overall, this leads us to the hypothesis that NPF in the vicinity of the cloud top led to the observed elevated concentrations of newly formed particles at cloud top and cloud base, with the newly formed particles being simultaneously mixed down and cloud processed (wet scavenging and/or growth depending on their size). Such a process is conceivable for a marine ABL with the dynamics of radiatively cooled clouds (radiative cooling rate at cloud top K d−1, Fig. S14, Lonardi et al., 2024) and the related transport and mixing processes (Wood, 2012). Considering the abundance of Arctic stratiform mixed-phase clouds (e.g., Shupe et al., 2013), NPF in the vicinity of such clouds may play an important role in the Arctic aerosol particle and CCN budgets.
In this study, we discussed the frequent occurrence of newly formed aerosol particles in the Arctic troposphere as observed during the airborne measurement campaign BACSAM II, which was conducted from 5 April to 2 May 2024 utilizing the Alfred Wegener Institute's Polar 6 aircraft (Wesche et al., 2016). The Polar 6 was instrumented with dedicated meteorological and aerosol instrumentation collecting data over and around the Svalbard Archipelago, over the Fram Strait, and in the vicinity of Villum Research Station (Station Nord) in Greenland. We observed newly formed particles during all eleven research flights at various locations (approximately between 76 to 85° N and 15° W to 26° E). Newly formed particles were encountered in an altitude range from about 60 to 3900 m a.s.l., i.e., throughout the flight altitude range investigated during the campaign. Specifically, these particles were detected in the free troposphere, inside the atmospheric boundary layer (ABL) over sea ice, in the vicinity of clouds, as well as inside the ABL over ocean with sea ice floes. No clear indications of newly formed particles inside the ABL over open, completely ice-free ocean were found.
Newly formed particles in the free troposphere were encountered across large geographical areas (with individual events spanning distances of hundreds of kilometers) and at different altitudes. Our respective analyses suggest a possibly important role of meridional transport in combination with cloud processing and precipitation for free tropospheric new particle formation (NPF). Such a scenario could be encountered during, e.g., warm-air intrusions which may deliver the precursor gases to atmospheric conditions (high altitudes, intense solar radiation, low temperatures, small pre-existing particle surface area) favorable for NPF. With respect to the newly formed particles detected inside the ABL over sea ice, we hypothesize that these particles are the result of regional NPF events induced by precursor gases (conceivably iodine components) originating from the sea ice, leads, or snow present in the measurement region. However, contributions of higher-latitude Arctic (precursor) sources cannot be ruled out. Concerning newly formed particles observed at both cloud tops and cloud bases, we found indications that these particles are formed at the cloud tops and subsequently mixed down to the cloud bases, with the cloud tops providing a favorable environment for NPF to occur. The presence of newly formed particles inside the ABL over ocean with sea ice floes could partly be related to a phytoplankton bloom which occurred in the respective target region on the day of the research flight. But ultimately, the source of precursors which contributed to the formation of the observed newly formed particles could not be identified. Furthermore, our analysis suggests that during the measurements carried out inside the ABL over open, completely ice-free ocean, no phytoplankton bloom occurred in the target regions, i.e., no indications pointing toward significant emissions of biologically-produced precursors were found. This might explain why no newly formed particles over open ocean were observed during our campaign.
Taken together, our results show that newly formed particles were frequently present and very likely produced in both the Arctic free troposphere and the Arctic ABL during our measurements in spring 2024. In particular, for the first time, our study presents observational results which indicate that NPF in the Arctic free troposphere occurred over distances of several hundreds of kilometers. In this context, a possible mechanism leading to Arctic free tropospheric NPF could be associated with warm-air intrusions. A similar transport pathway of precursor gases and/or newly formed particles from lower latitudes to the Arctic free troposphere was previously suggested in a modeling study by Price et al. (2023), but to date had not been substantiated by analysis of in situ-measured data. We present observational evidence which likewise shows that meridional transport can lead to NPF in the Arctic free troposphere.
Further modeling studies are required to assess the impact of newly formed particles occurring over distances of hundreds of kilometers and a wide range of altitudes inside and above the Arctic ABL on the Arctic aerosol and cloud condensation nuclei (CCN) budgets. In particular, because relatively small, sub-100 nm particles readily act as CCN in the clean Arctic atmosphere, the occurrence of newly formed particles in the free troposphere and the ABL might exert an important influence on Arctic aerosol-cloud-climate interactions. Future observational campaigns would profit from trace gas measurements and fast, size-resolved measurements of particles with diameters of less than 10 nm, e.g., with multiple condensation particle counters featuring different lower cut-off diameters. Such measurements could facilitate the identification of the relevant precursor gases and the precise nucleation region. Importantly, prospective studies should include vertical measurements and target both the Arctic ABL and free troposphere. Here, the use of drop sondes to provide high-resolution profiles of the vertical structure of the atmosphere would be beneficial.
Finally, in a rapidly warming Arctic, where the sea ice continues to retreat, more clouds might be present in the future, and the occurrence of warm-air intrusions is expected to increase, NPF frequency and location will likely be affected by these changes. Especially NPF in the free troposphere, possibly linked to warm-air intrusions, and at the tops of Arctic stratiform clouds, might significantly impact current and future Arctic aerosol and CCN budgets due to its potentially large geographical extent and frequent occurrence, and should therefore be considered in atmospheric models for the prediction of future Arctic weather and climate.
Master tracks are available on PANGAEA for all research flights of the BACSAM II campaign (https://doi.org/10.1594/PANGAEA.971763, Jurányi et al., 2024). Backward trajectory data are available on PANGAEA for all research flights of the BACSAM II campaign (https://doi.org/10.1594/PANGAEA.971694, Kirbus and Wendisch, 2024). PNSD data from all research flights of the BACSAM II campaign are available on PANGAEA (https://doi.org/10.1594/PANGAEA.993546, Simon et al., 2026). Sea ice data were retrieved from https://www.seaice.uni-bremen.de (last access: 10 June 2024) (Spreen et al., 2008). MODIS-TERRA satellite images were retrieved from https://wvs.earthdata.nasa.gov (last access: 30 April 2024). This study has been conducted using E.U. Copernicus Marine Service Information; https://doi.org/10.48670/moi-00281 (E.U. Copernicus Marine Service Information (CMEMS), 2025).
The supplement related to this article is available online at https://doi.org/10.5194/acp-26-16047-2026-supplement.
DJS participated in the data collection and flight planning during the BACSAM II campaign, analyzed and interpreted the data, and wrote the manuscript. JS participated in the data collection and flight planning, discussed the data, and contributed to the writing. JH participated in the data collection and flight planning, and processed the position, nose boom, and humidity data. BK performed the trajectory calculations and supported their analysis. JM participated in the data collection, flight planning, and calculated the radiative heating/cooling rates. ZJ, MH, BW, LK,AMJ, and MW participated in the flight planning, and the data collection and related discussions. KW was responsible for the development of the MPSS system. AH and ZJ functioned as PIs during the campaign. AH, ZJ, SH, GCR, MW, and MLP contributed to the discussion of the results. FS conceived the study, functioned as PI during the campaign, and contributed to data interpretation and writing. All authors read and edited the manuscript.
The contact author has declared that none of the authors has any competing interests.
Publisher's note: Copernicus Publications remains neutral with regard to jurisdictional claims made in the text, published maps, institutional affiliations, or any other geographical representation in this paper. The authors bear the ultimate responsibility for providing appropriate place names. Views expressed in the text are those of the authors and do not necessarily reflect the views of the publisher.
We gratefully acknowledge the funding by the Deutsche Forschungsgemeinschaft (DFG, German Research Foundation) – Project Number 268020496 – TRR 172, within the framework of the Transregional Collaborative Research Center “ArctiC Amplification: Climate Relevant Atmospheric and SurfaCe Processes, and Feedback Mechanisms (AC)³”, as well as the support of the Alfred Wegener Institute, Helmholtz Centre for Polar and Marine Research. The authors used large language models (ChatGPT by OpenAI, Claude by Anthropic) solely to support coding tasks; all scientific reasoning, methodological decisions, analyses, and conclusions were developed independently by the authors.
This research has been supported by the Deutsche Forschungsgemeinschaft (grant no. 268020496 – TRR 172) and the Alfred-Wegener-Institut, Helmholtz-Zentrum für Polar- und Meeresforschung (grant no. AWI_PA_02172).
This paper was edited by Martina Krämer and reviewed by three anonymous referees.
Allan, J. D., Williams, P. I., Najera, J., Whitehead, J. D., Flynn, M. J., Taylor, J. W., Liu, D., Darbyshire, E., Carpenter, L. J., Chance, R., Andrews, S. J., Hackenberg, S. C., and McFiggans, G.: Iodine observed in new particle formation events in the Arctic atmosphere during ACCACIA, Atmos. Chem. Phys., 15, 5599–5609, https://doi.org/10.5194/acp-15-5599-2015, 2015. a, b, c
Andreae, M. and Rosenfeld, D.: Aerosol–cloud–precipitation interactions. Part 1. The nature and sources of cloud-active aerosols, Earth-Sci. Rev., 89, 13–41, https://doi.org/10.1016/j.earscirev.2008.03.001, 2008. a
Asmi, E., Kondratyev, V., Brus, D., Laurila, T., Lihavainen, H., Backman, J., Vakkari, V., Aurela, M., Hatakka, J., Viisanen, Y., Uttal, T., Ivakhov, V., and Makshtas, A.: Aerosol size distribution seasonal characteristics measured in Tiksi, Russian Arctic, Atmos. Chem. Phys., 16, 1271–1287, https://doi.org/10.5194/acp-16-1271-2016, 2016. a
Atkinson, H. M., Huang, R.-J., Chance, R., Roscoe, H. K., Hughes, C., Davison, B., Schönhardt, A., Mahajan, A. S., Saiz-Lopez, A., Hoffmann, T., and Liss, P. S.: Iodine emissions from the sea ice of the Weddell Sea, Atmos. Chem. Phys., 12, 11229–11244, https://doi.org/10.5194/acp-12-11229-2012, 2012. a
Baccarini, A., Karlsson, L., Dommen, J., Duplessis, P., Vüllers, J., Brooks, I. M., Saiz-Lopez, A., Salter, M., Tjernström, M., Baltensperger, U., Zieger, P., and Schmale, J.: Frequent new particle formation over the high Arctic pack ice by enhanced iodine emissions, Nat. Commun., 11, 4924, https://doi.org/10.1038/s41467-020-18551-0, 2020. a, b, c
Beck, L. J., Sarnela, N., Junninen, H., Hoppe, C. J. M., Garmash, O., Bianchi, F., Riva, M., Rose, C., Peräkylä, O., Wimmer, D., Kausiala, O., Jokinen, T., Ahonen, L., Mikkilä, J., Hakala, J., He, X.-C., Kontkanen, J., Wolf, K. K. E., Cappelletti, D., Mazzola, M., Traversi, R., Petroselli, C., Viola, A. P., Vitale, V., Lange, R., Massling, A., Nøjgaard, J. K., Krejci, R., Karlsson, L., Zieger, P., Jang, S., Lee, K., Vakkari, V., Lampilahti, J., Thakur, R. C., Leino, K., Kangasluoma, J., Duplissy, E.-M., Siivola, E., Marbouti, M., Tham, Y. J., Saiz-Lopez, A., Petäjä, T., Ehn, M., Worsnop, D. R., Skov, H., Kulmala, M., Kerminen, V.-M., and Sipilä, M.: Differing mechanisms of new particle formation at two Arctic sites, Geophys. Res. Lett., 48, e2020GL091334, https://doi.org/10.1029/2020GL091334, 2021. a, b, c
Bigg, E. K. and Leck, C.: Cloud-active particles over the central Arctic Ocean, J. Geophys. Res.-Atmos., 106, 32155–32166, https://doi.org/10.1029/1999JD901152, 2001. a
Bintanja, R., van der Wiel, K., van der Linden, E. C., Reusen, J., Bogerd, L., Krikken, F., and Selten, F. M.: Strong future increases in Arctic precipitation variability linked to poleward moisture transport, Sci. Adv., 6, eaax6869, https://doi.org/10.1126/sciadv.aax6869, 2020. a
Box, J. E., Colgan, W. T., Christensen, T. R., Schmidt, N. M., Lund, M., Parmentier, F.-J. W., Brown, R., Bhatt, U. S., Euskirchen, E. S., Romanovsky, V. E., Walsh, J. E., Overland, J. E., Wang, M., Corell, R. W., Meier, W. N., Wouters, B., Mernild, S., Mård, J., Pawlak, J., and Olsen, M. S.: Key indicators of Arctic climate change: 1971–2017, Environ. Res. Lett., 14, 045010, https://doi.org/10.1088/1748-9326/aafc1b, 2019. a
Burkart, J., Willis, M. D., Bozem, H., Thomas, J. L., Law, K., Hoor, P., Aliabadi, A. A., Köllner, F., Schneider, J., Herber, A., Abbatt, J. P. D., and Leaitch, W. R.: Summertime observations of elevated levels of ultrafine particles in the high Arctic marine boundary layer, Atmos. Chem. Phys., 17, 5515–5535, https://doi.org/10.5194/acp-17-5515-2017, 2017. a, b, c, d
Carslaw, K., Lee, L., Reddington, C., Pringle, K., Rap, A., Forster, P., Mann, G., Spracklen, D., Woodhouse, M., Regayre, L., and Pierce, J.: Large contribution of natural aerosols to uncertainty in indirect forcing, Nature, 503, 67–71, https://doi.org/10.1038/nature12674, 2013. a
Clarke, A., Varner, J., Eisele, F., Mauldin, R., Tanner, D., and Litchy, M.: Particle production in the remote marine atmosphere: Cloud outflow and subsidence during ACE 1, J. Geophys. Res.-Atmos., 103, 16397–16409, https://doi.org/10.1029/97JD02987, 1998. a
Croft, B., Wentworth, G. R., Martin, R. V., Leaitch, W. R., Murphy, J. G., Murphy, B. N., Kodros, J. K., Abbatt, J. P., and Pierce, J. R.: Contribution of Arctic seabird-colony ammonia to atmospheric particles and cloud-albedo radiative effect, Nat. Commun., 7, 13444, https://doi.org/10.1038/ncomms13444, 2016. a
Cuevas, C. A., Maffezzoli, N., Corella, J. P., Spolaor, A., Vallelonga, P., Kjær, H. A., Simonsen, M., Winstrup, M., Vinther, B., Horvat, C., Fernandez, R. P., Kinnison, D., Lamarque, J.-F., Barbante, C., and Saiz-Lopez, A.: Rapid increase in atmospheric iodine levels in the North Atlantic since the mid-20th century, Nat. Commun., 9, 1452, https://doi.org/10.1038/s41467-018-03756-1, 2018. a, b
Dada, L., Angot, H., Beck, I., Baccarini, A., Quéléver, L. L., Boyer, M., Laurila, T., Brasseur, Z., Jozef, G., De Boer, G., Shupe, M. D., Henning, S., Bucci, S., Dütsch, M., Stohl, A., Petäjä, T., Daellenbach, K. R., Jokinen, T., and Schmale, J.: A central arctic extreme aerosol event triggered by a warm air-mass intrusion, Nat. Commun., 13, 5290, https://doi.org/10.1038/s41467-022-32872-2, 2022. a
Dall’Osto, M., Beddows, D., Tunved, P., Krejci, R., Ström, J., Hansson, H.-C., Yoon, Y., Park, K.-T., Becagli, S., Udisti, R., Onasch, T., O´Dowd, C. D., Simó, R., and Harrison, R. M.: Arctic sea ice melt leads to atmospheric new particle formation, Sci. Rep., 7, 3318, https://doi.org/10.1038/s41598-017-03328-1, 2017. a
Dall'Osto, M., Geels, C., Beddows, D., Boertmann, D., Lange, R., Nøjgaard, J., Harrison, R. M., Simo, R., Skov, H., and Massling, A.: Regions of open water and melting sea ice drive new particle formation in North East Greenland, Sci. Rep., 8, 6109, https://doi.org/10.1038/s41598-018-24426-8, 2018. a
Engvall, A.-C., Krejci, R., Ström, J., Minikin, A., Treffeisen, R., Stohl, A., and Herber, A.: In-situ airborne observations of the microphysical properties of the Arctic tropospheric aerosol during late spring and summer, Tellus B, 60, 392–404, https://doi.org/10.1111/j.1600-0889.2008.00348.x, 2008. a
E.U. Copernicus Marine Service Information (CMEMS): Global Ocean Colour (Copernicus-GlobColour), Bio-Geo-Chemical, L4 (monthly and interpolated) from Satellite Observations (1997–ongoing), Marine Data Store (MDS) [data set], https://doi.org/10.48670/moi-00281, 2025. a
Forster, P., Storelvmo, T., Armour, K., Collins, W., Dufresne, J.-L., Frame, D., Lunt, D. J., Mauritsen, T., Palmer, M. D., Watanabe, M., Wild, M., and Zhang, H.: The Earth's Energy Budget, Climate Feedbacks, and Climate Sensitivity, in: Climate Change 2021: The Physical Science Basis. Contribution of Working Group I to the Sixth Assessment Report of the Intergovernmental Panel on Climate Change, edited by: Masson-Delmotte, V., Zhai, P., Pirani, A., Connors, S. L., Péan, C., Berger, S., Caud, N., Chen, Y., Goldfarb, L., Gomis, M. I., Huang, M., Leitzell, K., Lonnoy, E., Matthews, J. B. R., Maycock, T. K., Waterfield, T., Yelekçi, O., Yu, R., and Zhou, B., Cambridge University Press, Cambridge, United Kingdom and New York, NY, USA, 923–1054, https://doi.org/10.1017/9781009157896.009, 2021. a, b
Freud, E., Krejci, R., Tunved, P., Leaitch, R., Nguyen, Q. T., Massling, A., Skov, H., and Barrie, L.: Pan-Arctic aerosol number size distributions: seasonality and transport patterns, Atmos. Chem. Phys., 17, 8101–8128, https://doi.org/10.5194/acp-17-8101-2017, 2017. a
Galí, M., Devred, E., Babin, M., and Levasseur, M.: Decadal increase in Arctic dimethylsulfide emission, P. Natl. Acad. Sci. USA, 116, 19311–19317, https://doi.org/10.1073/pnas.190437811, 2019. a
Gálvez, Ó., Baeza-Romero, M. T., Sanz, M., and Saiz-Lopez, A.: Photolysis of frozen iodate salts as a source of active iodine in the polar environment, Atmos. Chem. Phys., 16, 12703–12713, https://doi.org/10.5194/acp-16-12703-2016, 2016. a
Garrett, T. J., Hobbs, P. V., and Radke, L. F.: High Aitken nucleus concentrations above cloud tops in the Arctic, J. Atmos. Sci., 59, 779–783, https://doi.org/10.1175/1520-0469(2001)059<0779:HANCAC>2.0.CO;2, 2002. a, b
Gordon, H., Kirkby, J., Baltensperger, U., Bianchi, F., Breitenlechner, M., Curtius, J., Dias, A., Dommen, J., Donahue, N. M., Dunne, E. M., Duplissy, J., Ehrhart, S., Flagan, R. C., Frege, C., Fuchs, C., Hansel, A., Hoyle, C. R., Kulmala, M., Kürten, A., Lehtipalo, K., Makhmutov, V., Molteni, U., Rissanen, M. P., Stozkhov, Y., Tröstl, J., Tsagkogeorgas, G., Wagner, R., Williamson, C., Wimmer, D., Winkler, P. M., Yan, C., and Carslaw, K. S.: Causes and importance of new particle formation in the present-day and preindustrial atmospheres, J. Geophys. Res.-Atmos., 122, 8739–8760, https://doi.org/10.1002/2017JD026844, 2017. a, b
Hartmann, J., Gehrmann, M., Kohnert, K., Metzger, S., and Sachs, T.: New calibration procedures for airborne turbulence measurements and accuracy of the methane fluxes during the AirMeth campaigns, Atmos. Meas. Tech., 11, 4567–4581, https://doi.org/10.5194/amt-11-4567-2018, 2018. a
Hegg, D. A., Radke, L. F., and Hobbs, P. V.: Particle production associated with marine clouds, J. Geophys. Res.-Atmos., 95, 13917–13926, https://doi.org/10.1029/JD095iD09p13917, 1990. a
Hersbach, H., Bell, B., Berrisford, P., Hirahara, S., Horányi, A., Muñoz-Sabater, J., Nicolas, J., Peubey, C., Radu, R., Schepers, D., Simmons, A., Soci, C., Abdalla, S., Abellan, X., Balsamo, G., Bechtold, P., Biavati, G., Bidlot, J., Bonavita, M., De Chiara, G., Dahlgren,P., Dee, D., Diamantakis, M., Dragani, R., Flemming, J., Forbes, R., Fuentes, M., Geer, A., Haimberger, L., Healy, S., Hogan, R. J., Hólm, E., Janisková, M., Keeley, S., Laloyaux, P., Lopez, P., Lupu, C., Radnoti, G., de Rosnay, P., Rozum, I., Vamborg, F., Villaume, S., and Thépaut, J.-N.: The ERA5 global reanalysis, Q. J. Roy. Meteor. Soc., 146, 1999–2049, https://doi.org/10.1002/qj.3803, 2020. a
Heslin-Rees, D., Burgos, M., Hansson, H.-C., Krejci, R., Ström, J., Tunved, P., and Zieger, P.: From a polar to a marine environment: has the changing Arctic led to a shift in aerosol light scattering properties?, Atmos. Chem. Phys., 20, 13671–13686, https://doi.org/10.5194/acp-20-13671-2020, 2020. a
Hill, V. L. and Manley, S. L.: Release of reactive bromine and iodine from diatoms and its possible role in halogen transfer in polar and tropical oceans, Limnol. Oceanogr., 54, 812–822, https://doi.org/10.4319/lo.2009.54.3.0812, 2009. a
Igel, A. L., Ekman, A. M., Leck, C., Tjernström, M., Savre, J., and Sedlar, J.: The free troposphere as a potential source of arctic boundary layer aerosol particles, Geophys. Res. Lett., 44, 7053–7060, https://doi.org/10.1002/2017GL073808, 2017. a
Jurányi, Z., Stratmann, F., Herber, A., Wendisch, M., and Borrmann, S.: Master tracks in different resolutions during POLAR 6 campaign P6-247_BACSAM2_2024, PANGAEA [data set], https://doi.org/10.1594/PANGAEA.971763, 2024. a
Jurányi, Z., Lüpkes, C., Stratmann, F., Hartmann, J., Schaefer, J., Jörss, A.-M., Schulz, A., Wetzel, B., Simon, D., Gebhard, E., Stöhr, M., Hofmann, P., Kalmbach, D., Grawe, S., Wendisch, M., and Herber, A.: The T-Bird – a new aircraft-towed instrument platform to measure aerosol properties and turbulence close to the surface: introduction to the aerosol measurement system, Atmos. Meas. Tech., 18, 3477–3494, https://doi.org/10.5194/amt-18-3477-2025, 2025. a
Keil, A. and Wendisch, M.: Bursts of Aitken mode and ultrafine particles observed at the top of continental boundary layer clouds, J. Aerosol Sci., 32, 649–660, https://doi.org/10.1016/S0021-8502(00)00102-6, 2001. a
Kerminen, V.-M., Chen, X., Vakkari, V., Petäjä, T., Kulmala, M., and Bianchi, F.: Atmospheric new particle formation and growth: review of field observations, Environ. Res. Lett., 13, 103003, https://doi.org/10.1088/1748-9326/aadf3c, 2018. a, b
Khadir, T., Riipinen, I., Talvinen, S., Heslin-Rees, D., Pöhlker, C., Rizzo, L., Machado, L. A. T., Franco, M. A., Kremper, L. A., Artaxo, P., Petäjä, T., Kulmala, M., Tunved, P., Ekman, A. M. L., Krejci, R., and Virtanen, A.: Sink, Source or Something In-Between? Net Effects of Precipitation on Aerosol Particle Populations, Geophys. Res. Lett., 50, e2023GL104325, https://doi.org/10.1029/2023GL104325, 2023. a, b
Khosrawi, F., Ström, J., Minikin, A., and Krejci, R.: Particle formation in the Arctic free troposphere during the ASTAR 2004 campaign: a case study on the influence of vertical motion on the binary homogeneous nucleation of H2SO4/H2O, Atmos. Chem. Phys., 10, 1105–1120, https://doi.org/10.5194/acp-10-1105-2010, 2010. a, b, c, d
Kim, K., Yabushita, A., Okumura, M., Saiz-Lopez, A., Cuevas, C. A., Blaszczak-Boxe, C. S., Min, D. W., Yoon, H.-I., and Choi, W.: Production of molecular iodine and tri-iodide in the frozen solution of iodide: implication for polar atmosphere, Environ. Sci. Technol., 50, 1280–1287, https://doi.org/10.1021/acs.est.5b05148, 2016. a
Kirbus, B. and Wendisch, M.: Five-day backwards trajectories at one minute resolution along the flight tracks of the Polar 6 research aircraft during BACSAM II, PANGAEA [data set], https://doi.org/10.1594/PANGAEA.971694, 2024. a
Kulmala, M. and Kerminen, V.-M.: On the formation and growth of atmospheric nanoparticles, Atmos. Res., 90, 132–150, https://doi.org/10.1016/j.atmosres.2008.01.005, 2008. a
Kulmala, M., Vehkamäki, H., Petäjä, T., Dal Maso, M., Lauri, A., Kerminen, V.-M., Birmili, W., and McMurry, P.: Formation and growth rates of ultrafine atmospheric particles: a review of observations, J. Aerosol Sci., 35, 143–176, https://doi.org/10.1016/j.jaerosci.2003.10.003, 2004. a, b, c, d, e
Kupiszewski, P., Leck, C., Tjernström, M., Sjogren, S., Sedlar, J., Graus, M., Müller, M., Brooks, B., Swietlicki, E., Norris, S., and Hansel, A.: Vertical profiling of aerosol particles and trace gases over the central Arctic Ocean during summer, Atmos. Chem. Phys., 13, 12405–12431, https://doi.org/10.5194/acp-13-12405-2013, 2013. a, b, c, d
Leaitch, W. R., Sharma, S., Huang, L., Toom-Sauntry, D., Chivulescu, A., Macdonald, A. M., von Salzen, K., Pierce, J. R., Bertram, A. K., Schroder, J. C., Shantz, N. C., Chang, R. Y., and Norman, A.-L.: Dimethyl sulfide control of the clean summertime Arctic aerosol and cloud, Elementa, 1, 000017, https://doi.org/10.12952/journal.elementa.000017, 2013. a, b
Leck, C. and Bigg, E. K.: Aerosol production over remote marine areas-A new route, Geophys. Res. Lett., 26, 3577–3580, https://doi.org/10.1029/1999GL010807, 1999. a
Lee, S.-H., Gordon, H., Yu, H., Lehtipalo, K., Haley, R., Li, Y., and Zhang, R.: New particle formation in the atmosphere: From molecular clusters to global climate, J. Geophys. Res.-Atmos., 124, 7098–7146, https://doi.org/10.1029/2018JD029356, 2019. a
Lonardi, M., Akansu, E. F., Ehrlich, A., Mazzola, M., Pilz, C., Shupe, M. D., Siebert, H., and Wendisch, M.: Tethered balloon-borne observations of thermal-infrared irradiance and cooling rate profiles in the Arctic atmospheric boundary layer, Atmos. Chem. Phys., 24, 1961–1978, https://doi.org/10.5194/acp-24-1961-2024, 2024. a
Mauritsen, T., Sedlar, J., Tjernström, M., Leck, C., Martin, M., Shupe, M., Sjogren, S., Sierau, B., Persson, P. O. G., Brooks, I. M., and Swietlicki, E.: An Arctic CCN-limited cloud-aerosol regime, Atmos. Chem. Phys., 11, 165–173, https://doi.org/10.5194/acp-11-165-2011, 2011. a
McFarquhar, G. M. and Cober, S. G.: Single-scattering properties of mixed-phase Arctic clouds at solar wavelengths: Impacts on radiative transfer, J. Climate, 17, 3799–3813, https://doi.org/10.1175/1520-0442(2004)017<3799:SPOMAC>2.0.CO;2, 2004. a
Merikanto, J., Spracklen, D. V., Mann, G. W., Pickering, S. J., and Carslaw, K. S.: Impact of nucleation on global CCN, Atmos. Chem. Phys., 9, 8601–8616, https://doi.org/10.5194/acp-9-8601-2009, 2009. a
Moser, M., Voigt, C., Jurkat-Witschas, T., Hahn, V., Mioche, G., Jourdan, O., Dupuy, R., Gourbeyre, C., Schwarzenboeck, A., Lucke, J., Boose, Y., Mech, M., Borrmann, S., Ehrlich, A., Herber, A., Lüpkes, C., and Wendisch, M.: Microphysical and thermodynamic phase analyses of Arctic low-level clouds measured above the sea ice and the open ocean in spring and summer, Atmos. Chem. Phys., 23, 7257–7280, https://doi.org/10.5194/acp-23-7257-2023, 2023. a
Perry, K. D. and Hobbs, P. V.: Further evidence for particle nucleation in clear air adjacent to marine cumulus clouds, J. Geophys. Res.-Atmos., 99, 22803–22818, https://doi.org/10.1029/94JD01926, 1994. a
Pierce, J. R. and Adams, P. J.: Uncertainty in global CCN concentrations from uncertain aerosol nucleation and primary emission rates, Atmos. Chem. Phys., 9, 1339–1356, https://doi.org/10.5194/acp-9-1339-2009, 2009. a
Pilz, C., Cassano, J. J., de Boer, G., Kirbus, B., Lonardi, M., Pöhlker, M., Shupe, M. D., Siebert, H., Wendisch, M., and Wehner, B.: Tethered balloon measurements reveal enhanced aerosol occurrence aloft interacting with Arctic low-level clouds, Elementa, 12, https://doi.org/10.1525/elementa.2023.00120, 2024. a, b
Pohorsky, R., Guy, H., Brooks, I. M., Haberstock, L., Fauré, N., Zieger, P., Kojoj, J., Murto, S., Calmer, R., Heutte, B., Lonardi, M., Thomson, E. S., Tjernström, M., Creamean, J., Nenes, A., and Schmale, J.: Contribution of free tropospheric aerosols to Arctic low-level cloud droplets formation and longwave radiative forcing, Atmos. Chem. Phys., 26, 10331–10353, https://doi.org/10.5194/acp-26-10331-2026, 2026. a, b, c, d
Price, R., Baccarini, A., Schmale, J., Zieger, P., Brooks, I. M., Field, P., and Carslaw, K. S.: Late summer transition from a free-tropospheric to boundary layer source of Aitken mode aerosol in the high Arctic, Atmos. Chem. Phys., 23, 2927–2961, https://doi.org/10.5194/acp-23-2927-2023, 2023. a, b, c
Pruppacher, H. R. and Klett, J. D.: Microphysics of clouds and precipitation, https://doi.org/10.1007/978-0-306-48100-0, 2010. a
Raso, A. R. W., Custard, K. D., May, N. W., Tanner, D., Newburn, M. K., Walker, L., Moore, R. J., Huey, L. G., Alexander, L., Shepson, P. B., and Pratt, K. A.: Active molecular iodine photochemistry in the Arctic, P. Natl. Acad. Sci. USA, 114, 10053–10058, https://doi.org/10.1073/pnas.1702803114, 2017. a
Schmale, J. and Baccarini, A.: Progress in unraveling atmospheric new particle formation and growth across the Arctic, Geophys. Res. Lett., 48, e2021GL094198, https://doi.org/10.1029/2021GL094198, 2021. a
Schmale, J., Zieger, P., and Ekman, A. M.: Aerosols in current and future Arctic climate, Nat. Clim. Change, 11, 95–105, https://doi.org/10.1038/s41558-020-00969-5, 2021. a, b, c
Seinfeld, J. H. and Pandis, S. N.: Atmospheric chemistry and physics: from air pollution to climate change, John Wiley & Sons, ISBN 978-0-471-72018-8, 2006. a
Serreze, M. C. and Barry, R. G.: Processes and impacts of Arctic amplification: A research synthesis, Global Planet. Change, 77, 85–96, https://doi.org/10.1016/j.gloplacha.2011.03.004, 2011. a
Serreze, M. C. and Francis, J. A.: The Arctic amplification debate, Climatic Change, 76, 241–264, https://doi.org/10.1007/s10584-005-9017-y, 2006. a
Shupe, M. D., Persson, P. O. G., Brooks, I. M., Tjernström, M., Sedlar, J., Mauritsen, T., Sjogren, S., and Leck, C.: Cloud and boundary layer interactions over the Arctic sea ice in late summer, Atmos. Chem. Phys., 13, 9379–9399, https://doi.org/10.5194/acp-13-9379-2013, 2013. a
Simon, D. J., Schaefer, J., Hartmann, M., Weinhold, K., and Stratmann, F.: Airborne in-situ measurements of aerosol particle number size distributions during the BACSAM II campaign in April 2024, PANGAEA [data set], https://doi.org/10.1594/PANGAEA.993546, 2026. a
Sipilä, M., Sarnela, N., Jokinen, T., Henschel, H., Junninen, H., Kontkanen, J., Richters, S., Kangasluoma, J., Franchin, A., Peräkylä, O., Rissanen, M. P., Ehn, M., Vehkamäki, H., Kurtén, T., Berndt, T., Petäjä, T., Worsnop, D., Ceburnis, D., Kerminen, V.-M., Kulmala, M., and O’Dowd, C.: Molecular-scale evidence of aerosol particle formation via sequential addition of HIO3, Nature, 537, 532–534, https://doi.org/10.1038/nature19314, 2016. a, b
Spreen, G., Kaleschke, L., and Heygster, G.: Sea ice remote sensing using AMSR-E 89-GHz channels, J. Geophys. Res.-Oceans, 113, https://doi.org/10.1029/2005JC003384, 2008. a, b, c, d, e
Sprenger, M. and Wernli, H.: The LAGRANTO Lagrangian analysis tool – version 2.0, Geosci. Model Dev., 8, 2569–2586, https://doi.org/10.5194/gmd-8-2569-2015, 2015. a
Stroeve, J., Holland, M. M., Meier, W., Scambos, T., and Serreze, M.: Arctic sea ice decline: Faster than forecast, Geophys. Res. Lett., 34, https://doi.org/10.1029/2007GL029703, 2007. a
von der Weiden, S.-L., Drewnick, F., and Borrmann, S.: Particle Loss Calculator – a new software tool for the assessment of the performance of aerosol inlet systems, Atmos. Meas. Tech., 2, 479–494, https://doi.org/10.5194/amt-2-479-2009, 2009. a
Wallace, J. M. and Hobbs, P. V.: Atmospheric Science: An Introductory Survey, vol. 92 of International Geophysics Series, Elsevier Academic Press, Amsterdam; Boston, 2nd Edn., ISBN 978-0-12-732951-2, 2006. a
Weber, R., Clarke, A., Litchy, M., Li, J., Kok, G., Schillawski, R., and McMurry, P.: Spurious aerosol measurements when sampling from aircraft in the vicinity of clouds, J. Geophys. Res.-Atmos., 103, 28337–28346, https://doi.org/10.1029/98JD02086, 1998. a
Weber, R., Chen, G., Davis, D., Mauldin III, R., Tanner, D., Eisele, F., Clarke, A., Thornton, D., and Bandy, A.: Measurements of enhanced H2SO4 and 3–4 nm particles near a frontal cloud during the First Aerosol Characterization Experiment (ACE 1), J. Geophys. Res.-Atmos., 106, 24107–24117, https://doi.org/10.1029/2000JD000109, 2001. a, b, c
Weber, R., Orsini, D., Wang, B., Scheuer, E., Talbot, R., Dibb, J. E., Seid, G., DeBell, L., Mauldin, R., Kosciuch, E., Cantrell, C., and Eisele, F.: Investigations into free tropospheric new particle formation in the central Canadian arctic during the winter/spring transition as part of TOPSE, J. Geophys. Res.-Atmos., 108, https://doi.org/10.1029/2002JD002239, 2003. a, b, c, d
Wehner, B., Werner, F., Ditas, F., Shaw, R. A., Kulmala, M., and Siebert, H.: Observations of new particle formation in enhanced UV irradiance zones near cumulus clouds, Atmos. Chem. Phys., 15, 11701–11711, https://doi.org/10.5194/acp-15-11701-2015, 2015. a, b
Wendisch, M., Brückner, M., Burrows, J., Crewell, S., Dethloff, K., Ebell, K., Lüpkes, C., Macke, A., Notholt, J., Quaas, J., Rinke, A., and Tegen, I.: Understanding causes and effects of rapid warming in the Arctic, Eos, https://doi.org/10.1029/2017EO064803, 2017. a
Wendisch, M., Brückner, M., Crewell, S., Ehrlich, A., Notholt, J., Lüpkes, C., Macke, A., Burrows, J. P., Rinke, A., Quaas, J., Maturilli, M., Schemann, V., Shupe, M. D., Akansu, E. F., Barrientos-Velasco, C., Bärfuss, K., Blechschmidt, A.-M., Block, K., Bougoudis, I., Bozem, H., Böckmann, C., Bracher, A., Bresson, H., Bretschneider, L., Buschmann, M., Chechin, D. G., Chylik, J., Dahlke, S., Deneke, H., Dethloff, K., Donth, T., Dorn, W., Dupuy, R., Ebell, K., Egerer, U., Engelmann, R., Eppers, O., Gerdes, R., Gierens, R., Gorodetskaya, I. V., Gottschalk, M., Griesche, H., Gryanik, V. M., Handorf, D., Harm-Altstädter, B., Hartmann, J., Hartmann, M., Heinold, B., Herber, A., Herrmann, H., Heygster, G., Höschel, I., Hofmann, Z., Hölemann, J., Hünerbein, A., Jafariserajehlou, S., Jäkel, E., Jacobi, C., Janout, M., Jansen, F., Jourdan, O., Jurányi, Z., Kalesse-Los, H., Kanzow, T., Käthner, R., Kliesch, L. L., Klingebiel, M., Knudsen, E. M., Kovács, T., Körtke, W., Krampe, D., Kretzschmar, J., Kreyling, D., Kulla, B., Kunkel, D., Lampert, A., Lauer, M., Lelli, L., von Lerber, A., Linke, O., Löhnert, U., Lonardi, M., Losa, S. N., Losch, M., Maahn, M., Mech, M., Mei, L., Mertes, S., Metzner, E., Mewes, D., Michaelis, J., Mioche, G., Moser, M., Nakoudi, K., Neggers, R., Neuber, R., Nomokonova, T., Oelker, J., Papakonstantinou-Presvelou, I., Pätzold, F., Pefanis, V., Pohl, C., van Pinxteren, M., Radovan, A., Rhein, M., Rex, M., Richter, A., Risse, N., Ritter, C., Rostosky, P., Rozanov, V. V., Donoso, E. R., Garfias, P. S., Salzmann, M., Schacht, J., Schäfer, M., Schneider, J., Schnierstein, N., Seifert, P., Seo, S., Siebert, H., Soppa, M. A., Spreen, G., Stachlewska, I. S., Stapf, J., Stratmann, F., Tegen, I., Viceto, C., Voigt, C., Vountas, M., Walbröl, A., Walter, M., Wehner, B., Wex, H., Willmes, S., Zanatta, M., and Zeppenfeld, S.: Atmospheric and surface processes, and feedback mechanisms determining Arctic amplification: A review of first results and prospects of the (𝒜𝒞)3 project, B. Am. Meteorol. Soc., 104, E208–E242, https://doi.org/10.1175/BAMS-D-21-0218.1, 2023. a, b, c, d
Wendisch, M., Crewell, S., Ehrlich, A., Herber, A., Kirbus, B., Lüpkes, C., Mech, M., Abel, S. J., Akansu, E. F., Ament, F., Aubry, C., Becker, S., Borrmann, S., Bozem, H., Brückner, M., Clemen, H.-C., Dahlke, S., Dekoutsidis, G., Delanoë, J., De La Torre Castro, E., Dorff, H., Dupuy, R., Eppers, O., Ewald, F., George, G., Gorodetskaya, I. V., Grawe, S., Groß, S., Hartmann, J., Henning, S., Hirsch, L., Jäkel, E., Joppe, P., Jourdan, O., Jurányi, Z., Karalis, M., Kellermann, M., Klingebiel, M., Lonardi, M., Lucke, J., Luebke, A. E., Maahn, M., Maherndl, N., Maturilli, M., Mayer, B., Mayer, J., Mertes, S., Michaelis, J., Michalkov, M., Mioche, G., Moser, M., Müller, H., Neggers, R., Ori, D., Paul, D., Paulus, F. M., Pilz, C., Pithan, F., Pöhlker, M., Pörtge, V., Ringel, M., Risse, N., Roberts, G. C., Rosenburg, S., Röttenbacher, J., Rückert, J., Schäfer, M., Schaefer, J., Schemann, V., Schirmacher, I., Schmidt, J., Schmidt, S., Schneider, J., Schnitt, S., Schwarz, A., Siebert, H., Sodemann, H., Sperzel, T., Spreen, G., Stevens, B., Stratmann, F., Svensson, G., Tatzelt, C., Tuch, T., Vihma, T., Voigt, C., Volkmer, L., Walbröl, A., Weber, A., Wehner, B., Wetzel, B., Wirth, M., and Zinner, T.: Overview: quasi-Lagrangian observations of Arctic air mass transformations – introduction and initial results of the HALO-(AC)3 aircraft campaign, Atmos. Chem. Phys., 24, 8865–8892, https://doi.org/10.5194/acp-24-8865-2024, 2024. a, b
Wendisch, M., Kirbus, B., Ori, D., Shupe, M. D., Crewell, S., Sodemann, H., and Schemann, V.: Observed and modeled Arctic airmass transformations during warm air intrusions and cold air outbreaks, Atmos. Chem. Phys., 25, 15047–15076, https://doi.org/10.5194/acp-25-15047-2025, 2025. a
Wesche, C., Steinhage, D., and Nixdorf, U.: Polar aircraft Polar5 and Polar6 operated by the Alfred Wegener institute, J. Large-Scale Res. Facil., 2, A87–A87, https://doi.org/10.17815/jlsrf-2-153, 2016. a, b
Wiedensohler, A., Covert, D. S., Swietlicki, E., Aalto, P., Heintzenberg, J., and Leck, C.: Occurrence of an ultrafine particle mode less than 20 nm in diameter in the marine boundary layer during Arctic summer and autumn, Tellus B, 48, 213–222, https://doi.org/10.3402/tellusb.v48i2.15887, 1996. a
Wiedensohler, A., Birmili, W., Nowak, A., Sonntag, A., Weinhold, K., Merkel, M., Wehner, B., Tuch, T., Pfeifer, S., Fiebig, M., Fjäraa, A. M., Asmi, E., Sellegri, K., Depuy, R., Venzac, H., Villani, P., Laj, P., Aalto, P., Ogren, J. A., Swietlicki, E., Williams, P., Roldin, P., Quincey, P., Hüglin, C., Fierz-Schmidhauser, R., Gysel, M., Weingartner, E., Riccobono, F., Santos, S., Grüning, C., Faloon, K., Beddows, D., Harrison, R., Monahan, C., Jennings, S. G., O'Dowd, C. D., Marinoni, A., Horn, H.-G., Keck, L., Jiang, J., Scheckman, J., McMurry, P. H., Deng, Z., Zhao, C. S., Moerman, M., Henzing, B., de Leeuw, G., Löschau, G., and Bastian, S.: Mobility particle size spectrometers: harmonization of technical standards and data structure to facilitate high quality long-term observations of atmospheric particle number size distributions, Atmos. Meas. Tech., 5, 657–685, https://doi.org/10.5194/amt-5-657-2012, 2012. a, b
Wiedensohler, A., Wiesner, A., Weinhold, K., Birmili, W., Hermann, M., Merkel, M., Müller, T., Pfeifer, S., Schmidt, A., Tuch, T., Velarde, F., Quincey, P., Seeger, S., and Nowak, A.: Mobility particle size spectrometers: Calibration procedures and measurement uncertainties, Aerosol Sci. Tech., 52, 146–164, https://doi.org/10.1080/02786826.2017.1387229, 2018. a, b
Willis, M. D., Burkart, J., Thomas, J. L., Köllner, F., Schneider, J., Bozem, H., Hoor, P. M., Aliabadi, A. A., Schulz, H., Herber, A. B., Leaitch, W. R., and Abbatt, J. P. D.: Growth of nucleation mode particles in the summertime Arctic: a case study, Atmos. Chem. Phys., 16, 7663–7679, https://doi.org/10.5194/acp-16-7663-2016, 2016. a, b, c
Willis, M. D., Köllner, F., Burkart, J., Bozem, H., Thomas, J. L., Schneider, J., Aliabadi, A. A., Hoor, P. M., Schulz, H., Herber, A. B., Leaitch, W. R., and Abbatt, J. P. D.: Evidence for marine biogenic influence on summertime Arctic aerosol, Geophys. Res. Lett., 44, 6460–6470, https://doi.org/10.1002/2017GL073359, 2017. a, b, c
Willis, M. D., Leaitch, W. R., and Abbatt, J. P.: Processes controlling the composition and abundance of Arctic aerosol, Rev. Geophys., 56, 621–671, https://doi.org/10.1029/2018RG000602, 2018. a, b, c
Wood, R.: Stratocumulus clouds, Mon. Weather Rev., 140, 2373–2423, https://doi.org/10.1175/MWR-D-11-00121.1, 2012. a