
the Creative Commons Attribution 4.0 License.
the Creative Commons Attribution 4.0 License.
 | 12 Nov 2026
Methane in the Asian Monsoon anticyclone and global UTLS behavior observed in ACE-FTS satellite data

William J. Randel
Laura L. Pan
Shuangxi Fang
Zhaonan Cai
Teresa Campos
Benjamin Gaubert
Methane in the upper troposphere and lower stratosphere (UTLS) plays a critical role in atmospheric composition and radiative forcing, yet the processes governing its vertical structure and variability remain poorly understood. Here, we use high-quality satellite observations from the Atmospheric Chemistry Experiment Fourier Transform Spectrometer (ACE-FTS) to characterize the vertical structure and global seasonal behavior of methane in the UTLS, with emphasis on the role of Asian Summer Monsoon (ASM). In the ASM, a maximum in methane concentration occurs near the tropopause, at a higher altitude than the corresponding carbon monoxide maximum. The largest relative enhancement for methane – the difference between air inside and outside the anticyclone – occurs above the tropopause and extends poleward to the north. This behavior contrasts with carbon monoxide, which is confined within the anticyclone. The seasonal cycle of methane near the tropical tropopause peaks in boreal autumn, following the summer peak in surface fluxes and deep convection. This phase lag reflects the combined effects of ASM transport and subsequent large-scale redistribution following the breakdown of the anticyclone. Positive anomalies occur in the tropical lower stratosphere in boreal winter, consistent with the upwelling branch of the Brewer–Dobson circulation (BDC). Beyond the seasonal cycle, ACE-FTS data show a pronounced hemispheric asymmetry in lower stratospheric methane trends, consistent with reported changes in other long-lived trace constituents. Together, these results provide new observational evidence that ASM transport imprints a distinct methane structure above the tropopause and plays a key role in shaping UTLS variability on a global scale.
- Article
(7166 KB) - Full-text XML
- BibTeX
- EndNote


Methane (CH4) is the second most important anthropogenic greenhouse gas after carbon dioxide. Its atmospheric lifetime of approximately 9–10 years allows methane to be transported over large distances and to influence both tropospheric and stratospheric composition. Understanding the global budget of methane therefore requires careful examination not only of surface sources and sinks, but also of the vertical redistribution processes that connect the lower atmosphere with the upper troposphere and lower stratosphere (UTLS) (Patra et al., 2011; Zeng et al., 2021; Saunois et al., 2025; Fu and Dong, 2026). Methane in the UTLS is especially important for climate forcing. Enhancements near the tropopause strengthen the greenhouse effect, while subsequent oxidation in the stratosphere produces additional water vapor that alters radiative balance and modulates ozone photochemistry (Riese et al., 2012; Fleming et al., 2015). These processes highlight methane in the UTLS as a sensitive driver of short-term climate feedback.
South and Southeast Asia are major CH4 source regions, with emissions dominated by agriculture (including rice cultivation and livestock), waste, natural wetlands. Emissions from these sources increase during the ASM season, likely due to enhanced rainfall (Yu et al., 2023; East et al., 2024; Subramanian et al., 2026). Moreover, the ASM exerts a particularly strong influence on UTLS composition (e.g. Randel et al., 2010). Intense deep convection over South Asia and East Asia can loft boundary air masses, rich in methane and other pollutants, to the upper troposphere within several days (Randel and Park, 2006; Baker et al., 2012; Pan et al., 2016, 2024). The upper tropospheric anticyclone acts as a quasi-closed reservoir in the UTLS, trapping these enhancements for weeks to months (Park et al., 2007; Vogel et al., 2014, 2026). Through subsequent transport by the Brewer-Dobson circulation (BDC), these regional emissions can have consequences for the global stratospheric composition budget (Ploeger et al., 2013, 2017; Vogel et al., 2019; Riese et al., 2025). Given the strong seasonality of regional methane emissions and the efficient transport of boundary pollution into the UTLS by the ASM, an important question is how these emissions and transport processes together contribute to the global distribution and seasonal variability of UTLS methane.
The Atmospheric Chemistry Experiment Fourier Transform Spectrometer (ACE-FTS) provides high-quality vertical profiles of CH4 from the upper troposphere to the stratosphere, with near-global coverage every three months and a long, continuous record since 2004 that provides information on seasonal variability (although tropical observations are limited to four months per year: February, April, August and October), interannual variability, and long-term trends (Bernath et al., 2005). These observations are particularly valuable for examining methane behavior in the UTLS and for placing regional transport signals into a global context (Nassar et al., 2005). The limited tropical sampling of ACE-FTS has been examined in Park et al. (2013) by comparing its CO measurements with those of Microwave Limb Sounding (MLS; Waters et al., 2006). They found reasonable agreement in the large-scale spatial and temporal patterns of seasonal mean CO, supporting the use of ACE-FTS observations to characterize these features despite the sparse sampling.
Previous studies have used ACE-FTS observations to investigate the regional transport signals and large-scale tracer variability. Park et al. (2008) documented enhanced CO and other tropospheric tracers within the Asian monsoon anticyclone, providing evidence of convective transport and chemical isolation. CO is an effective tracer of vertical transport because its free-tropospheric lifetime (∼ 1 month) is substantially longer than typical deep convective transport timescales. Enhanced CO in the UTLS can therefore indicate recent deep convective transport of polluted air, while correlations between CO and other trace gases can help identify source characteristics and common transport pathways.
Park et al. (2013) examined the global distributions and seasonal variability of CO and hydrocarbons in the UTLS based on ACE-FTS measurements. These tracers exhibit semi-annual cycle in the tropical upper troposphere related to seasonally varying sources and deep tropical convection, and a maximum tied to the Asian monsoon anticyclone. Above the tropical tropopause, these species reveal a strong annual cycle related to annual variation of the upward branch of BDC. More recently, Sheese et al. (2025) used ACE-FTS measurements, including CH4, to quantify the contributions of methane oxidation and circulation changes to stratospheric water vapor trends. To address the limited tropical sampling, they supplemented ACE-FTS observations with model simulations and applied multiple linear regression (MLR) to estimate CH4 trends entering the stratosphere.
In this study, we first assess the quality of ACE-FTS observations in the ASM region using high vertical-resolution in-situ measurements from balloon and aircraft that extend into the lower stratosphere. Subsequently, we contrast the observed behavior of CH4 with that of carbon monoxide (CO), which is a tracer of combustion with a shorter photochemical lifetime of ∼ 1 month, also measured by ACE-FTS and widely used to diagnose UTLS transport associated with the ASM anticyclone. We then assess the behavior of CH4 in the global UTLS and characterize the global seasonal cycle and long-term trends. Together, these analyses provide new observational evidence for the role of ASM transport in shaping the distribution and seasonal variability of CH4 in UTLS on a global scale.
2.1 ACE-FTS measurements of CH4 and CO
The Atmospheric Chemistry Experiment–Fourier Transform Spectrometer (ACE-FTS), onboard the Canadian SCISAT satellite launched in 2003, is a high-resolution infrared Michelson spectrometer with a spectral resolution of 0.02 cm−1 that measures solar occultation transmission spectra between 2.2–13.3 µm (Bernath et al., 2005). From these spectra, vertical profiles of trace gases are retrieved with a typical vertical resolution of 3–4 km spanning from about 5 to 75 km altitude. Due to its orbit geometry, ACE-FTS provides ∼ 30 occultations per day with latitude coverage that shifts seasonally, yielding tropical observations primarily for four months each year (February, April, August, and October, e.g. Randel et al., 2012). This study uses the recent version of level 2 data, version 5.2 (v5.2), which provides interpolated data on a 1 km grid (Boone et al., 2023). Validation of the earlier v2.2 methane profiles showed differences of ∼ 5 % below 35 km and ∼ 10 %–15 % at 40–60 km relative to Halogen Occultation Experiment (HALOE) satellite data, and a negative bias of approximately 10 % at 8–20 km relative to Michelson Interferometer for Passive Atmospheric Sounding (MIPAS) (De Mazière et al., 2008). The precision and accuracy are 660 ppt and less than 2 % for CO, and 1200 ppt and 5 %–20 % for CH4, respectively (Schmidt et al., 2024). Overall, ACE-FTS CH4 and CO retrievals are considered robust for UTLS studies when standard quality flags are applied, and they provide a unique multi-decadal record for investigating the seasonal cycle and interannual variability of methane.
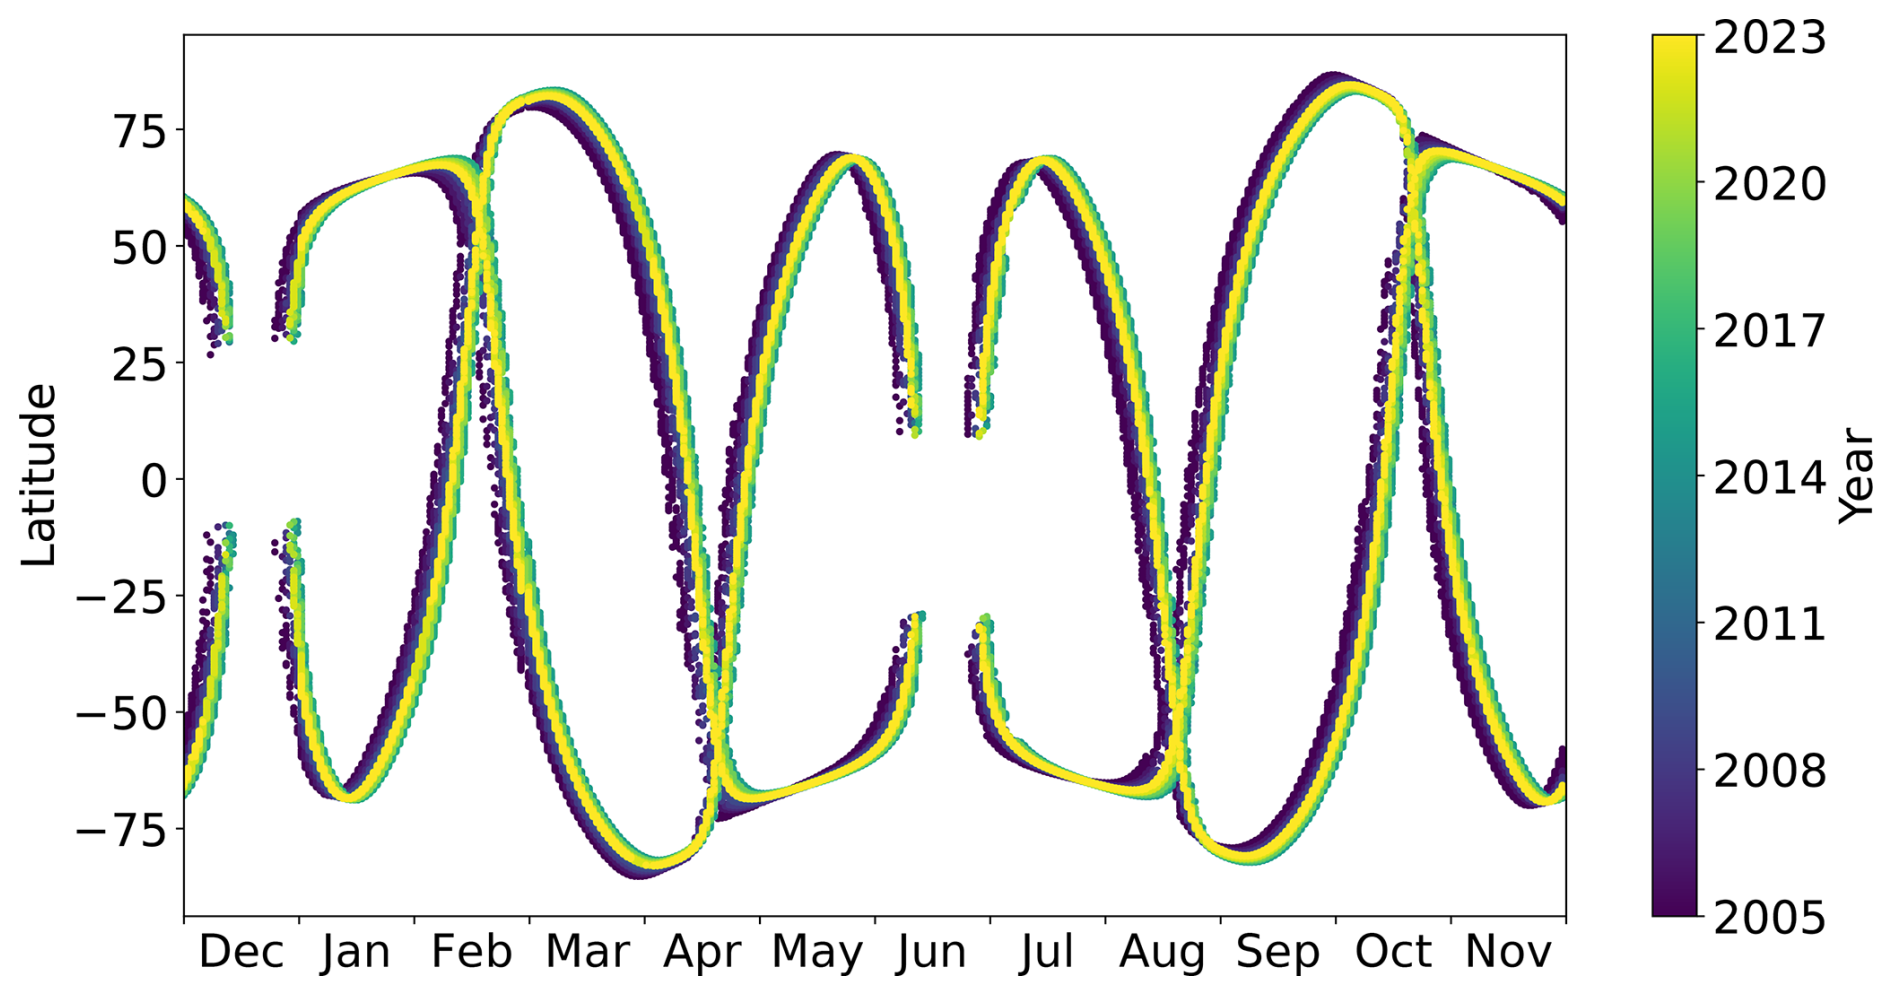
The V5 retrievals from ACE-FTS measurements spanning 2005–2023 are used in this study. ACE-FTS provides near-global coverage approximately every three months (Fig. 1), thus we group the data into four seasons: December–January–February (DJF), March–April–May (MAM), June–July–August (JJA), and September–October–November (SON). As can be seen, the annually repeating measurements in the tropics and ASM region are in February for DJF, April for MAM, August for JJA and October for SON. As a further check on data quality, we examine all profiles within every 30° latitude bands for each season and year, and omit a small number of points falling outside three local standard deviation. Climatological concentrations are then constructed by combining all measurements from 2005 to 2023 for each season. The data are gridded onto a 5° × 10° latitude-longitude grid using a Gaussian-weighted average of measurements within 500 km of each grid box, following an approach similar to Randel et al. (2012).
2.2 In-situ measurements
2.2.1 AirCore observations
The AirCore observations were conducted in August 2019 and 2020 over the Tibetan Plateau to investigate the role of ASM transport in redistributing greenhouse gases. During the campaign, eight vertical profiles of CO2, CH4, and CO were collected using the AirCore technique. The AirCore system consists of a long, thin stainless-steel tube carried aloft by a balloon, which samples the ambient atmosphere during descent from ∼ 25 km to the surface, followed by a laboratory analysis with a Picarro G2401. The average measurement uncertainty of CH4 and CO are less than 10 and 5 ppb below 20 km. Further details of the campaign are provided in Yi et al. (2026).
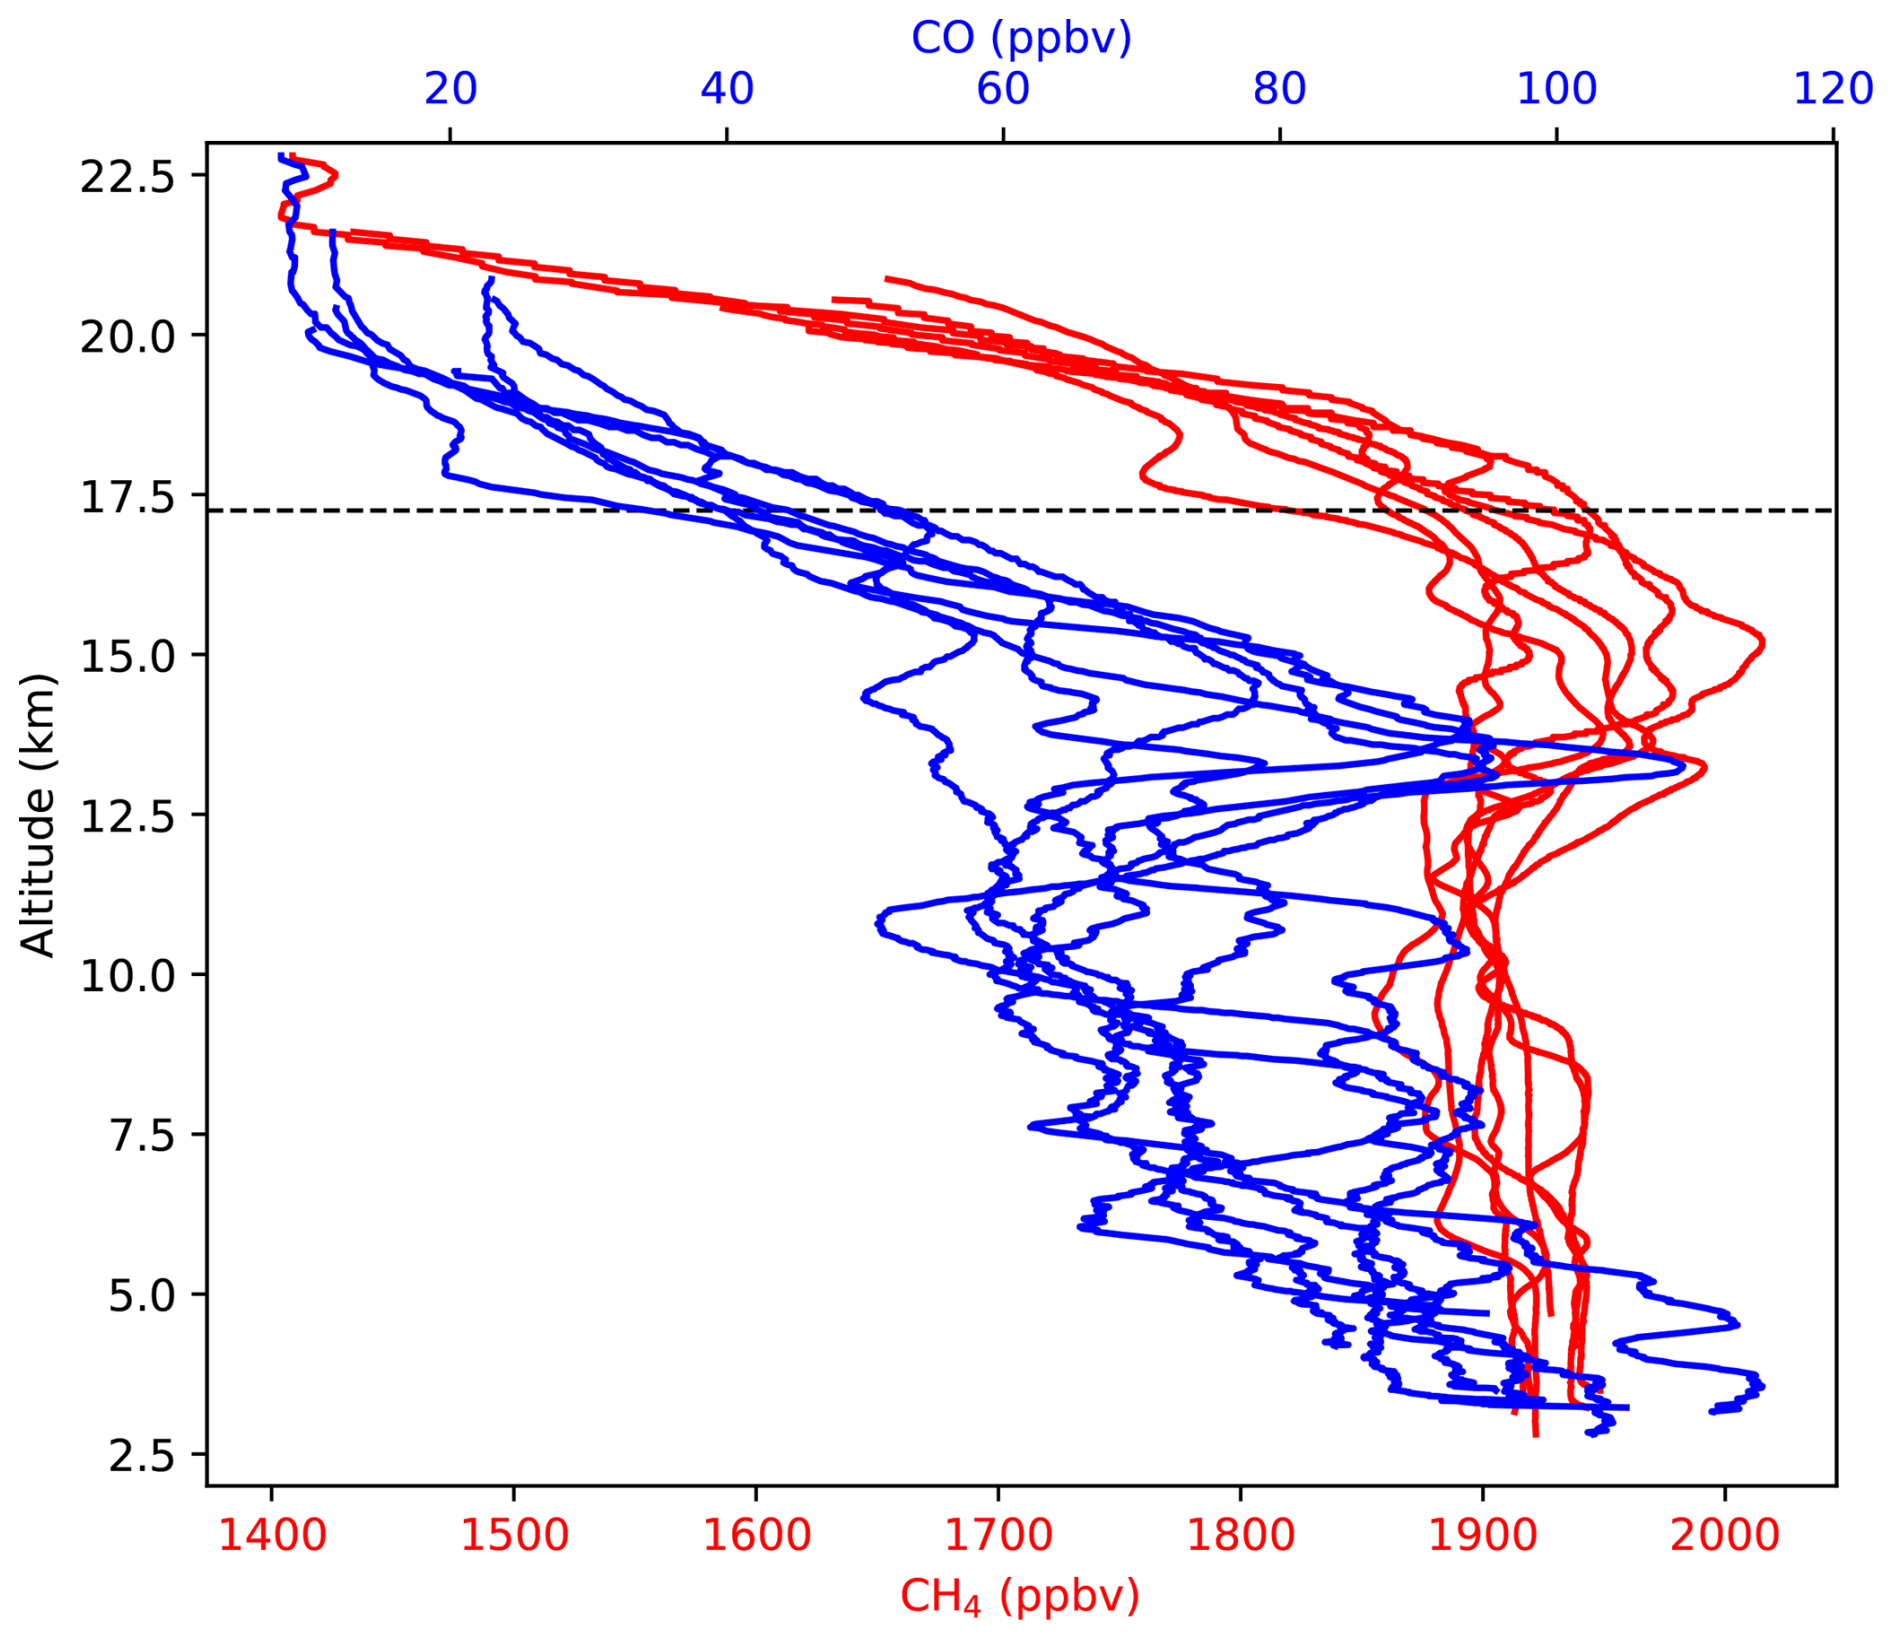
Figure 2CO (blue) and CH4 (red) profiles on Tibetan Plateau in August 2019 and 2020 obtained from AirCore. Black dashed line marks the average lapse-rate tropopause.
Here, we focus on eight CH4 and CO profiles to compare with ACE-FTS measurements and to highlight their contrasting structures near the tropopause, identified from collocated temperature profiles using the WMO definition (Fig. 2). Both species exhibit clear enhancements in the upper troposphere, but with distinct vertical structures: CO decreases rapidly with height beginning about 2 km below the tropopause, whereas CH4 reaches a maximum near the tropopause before sharply declining. Previous studies show that deep convection uplifts surface pollutants to ∼ 13 km within a week, after which air masses are confined within the anticyclone and ascend slowly over weeks to months (Vogel et al., 2019). During this slow ascent, CO decreases due to its shorter photochemical lifetime, whereas CH4 remains relatively stable (Yi et al., 2024). Building on these in situ observations, we use ACE-FTS data to examine the large-scale distributions of CH4 and CO and the role of tropopause-level methane maxima in the global UTLS.
2.2.2 In situ measurements from the ACCLIP campaign
The Asian summer monsoon Chemical and Climate Impact Project (ACCLIP) was a large-scale aircraft campaign conducted over the western Pacific in August 2022 to investigate the impact of the ASM on atmospheric composition in the UTLS. The campaign deployed two research aircrafts equipped with state-of-the-art instruments capable of measuring numerous chemical species. The NCAR Gulfstream-V (GV) primarily operated below ∼ 16 km, while the NASA WB-57 reached altitudes of up to ∼ 20 km. We use CH4 and CO vertical profiles measured by Picarro G2401-mc aboard the NCAR GV and the Whole Air Sampling (WAS) aboard the NASA WB-57 to compare with the ACE-FTS measurements from a broader perspective. The WAS samples were also analyzed by Picarro G2401-mc. For Picarro G2401-mc, CO and CH4 precision are 5 and 0.5 ppbv within 1 min, respectively. The accuracy of CO and CH4 is ±3 % and 5 ± 0.1 %, respectively. Note that the ACCLIP campaign targeted highly polluted regions, whereas the spatial resolution of ACE-FTS is insufficient to fully resolve local structures. Additional details about the ACCLIP campaign are provided in Pan et al. (2025).
2.3 Supplementary data
Meteorological fields from ERA5, the fifth-generation global reanalysis produced by the European Centre for Medium-Range Weather Forecasts (ECMWF; Hersbach et al., 2020), are used to characterize the circulation associated with the observed CH4 and CO distributions. We use ERA5 monthly pressure-level data provided on a regular 0.25° latitude-longitude grid, with 37 standard pressure levels ranging from 1000 to 1 hPa. The time periods are from 2005 to 2023, matching the period of the ACE-FTS analysis. ERA5-based lapse-rate tropopause heights are obtained from Hoffmann and Spang (2022). This product identifies the lapse-rate tropopause using the World Meteorological Organization (WMO) definition in 1957. These heights provide a reference for interpreting the observed CH4 and CO distributions relative to the tropopause. Monthly mean outgoing longwave radiation (OLR) for 2005–2023 is obtained from the Clouds and the Earth's Radiant Energy System (CERES) Energy Balanced and Filled top-of-atmosphere Edition 4.2 product (Loeb et al., 2017, 2024). We use the all-sky Top-of-Atmosphere (TOA) outgoing longwave flux, provided on a 1° latitude-longitude grid in W m−2. Regions with OLR less than 220 W m−2 are used as a proxy for deep convection. For comparison with ACE-FTS observations in the tropics, climatological OLR fields are calculated for February, April, August, and October.
The CH4 surface flux dataset provided by Saunois et al. (2025) is constructed by combining bottom-up emission inventories and model estimate for individual source and sink categories. The prior flux draws on Emission Database for Global Atmospheric Research (EDGAR v7; Crippa et al., 2023) for anthropogenic emissions, with extension based on Food and Agriculture Organization (FAO) agriculture data and includes an alternative configuration using the Greenhouse gas and Air pollutant Interactions and Synergies (GAINS) model for fossil fuel emissions (Höglund-Isaksson et al., 2020). Biomass-burning emissions are obtained from Global Fire Emission Database (GFED) v4.1 (van der Werf et al., 2017), and wetland emissions are represented by the monthly ensemble mean of 11 models reported by Saunois et al. (2020). Additional components include termite emissions, ocean emissions from Weber et al. (2019), geological emissions from Etiope and Schwietzke (2019), and soil methane uptake from the MeMo model (Murguia-Flores et al., 2018). These components are assembled into gridded surface flux fields for use as prior inputs to atmospheric inversions, with temporal variability determined by the underlying inventories and models.
2.4 Multiple linear regression method
To estimate the trends and reconstruct monthly methane time series in the tropics, we apply the Long-term Ozone Trends and Uncertainties in the Stratosphere (LOTUS) regression code (SPARC/IO3C/GAW, 2019), following the standard multiple linear regression (MLR) framework described by Dubé et al. (2023). The model is fitted separately to the available observations in each latitude-altitude bin:
Here, each β is a regression coefficient for each term, the superscripts are the number of highest seasonal harmonic for a given term, , Ai and Bi are the sine and cosine coefficients, respectively, with subscripts i = 1 and i = 2 denote the annual and semi-annual cycles. Time t is expressed in years. QBO(a)(t) and QBO(b)(t) are the first two principal components of the Singapore zonal winds, F10.7(t) is the solar flux at 10.7 cm, ENSO (t) is the multivariate ENSO index, and R(t) is the residual. These predictors are further described in SPARC/IO3C/GAW (2019). Dubé et al. (2023) applied this standard MLR framework to estimate stratospheric N2O trends from ACE-FTS observations.
3.1 Comparison of ACE-FTS with in-situ measurements
ACE-FTS measurements in the ASM region are compared with AirCore observations and ACCLIP campaign. For the AirCore comparison, we select ACE-FTS profiles within 33–41° N and 80–110° E, centered around the AirCore observation location (37.8° N, 95.3° E). To increase the sampling size given the sparse satellite coverage over this region, we include measurements covering 4 recent years from August 2019 to 2022, resulting in a total of 8 profiles. For the ACCLIP campaign, ACE-FTS measurements within 20–40° N and 120–150° E are selected, covering most of the flight tracks. The same 4-year temporal window (August 2019–2022) is used to obtain adequate regional sampling for ACE-FTS, yielding 19 profiles within this region. For each altitude level, the mean and standard deviation are calculated across all selected profiles.
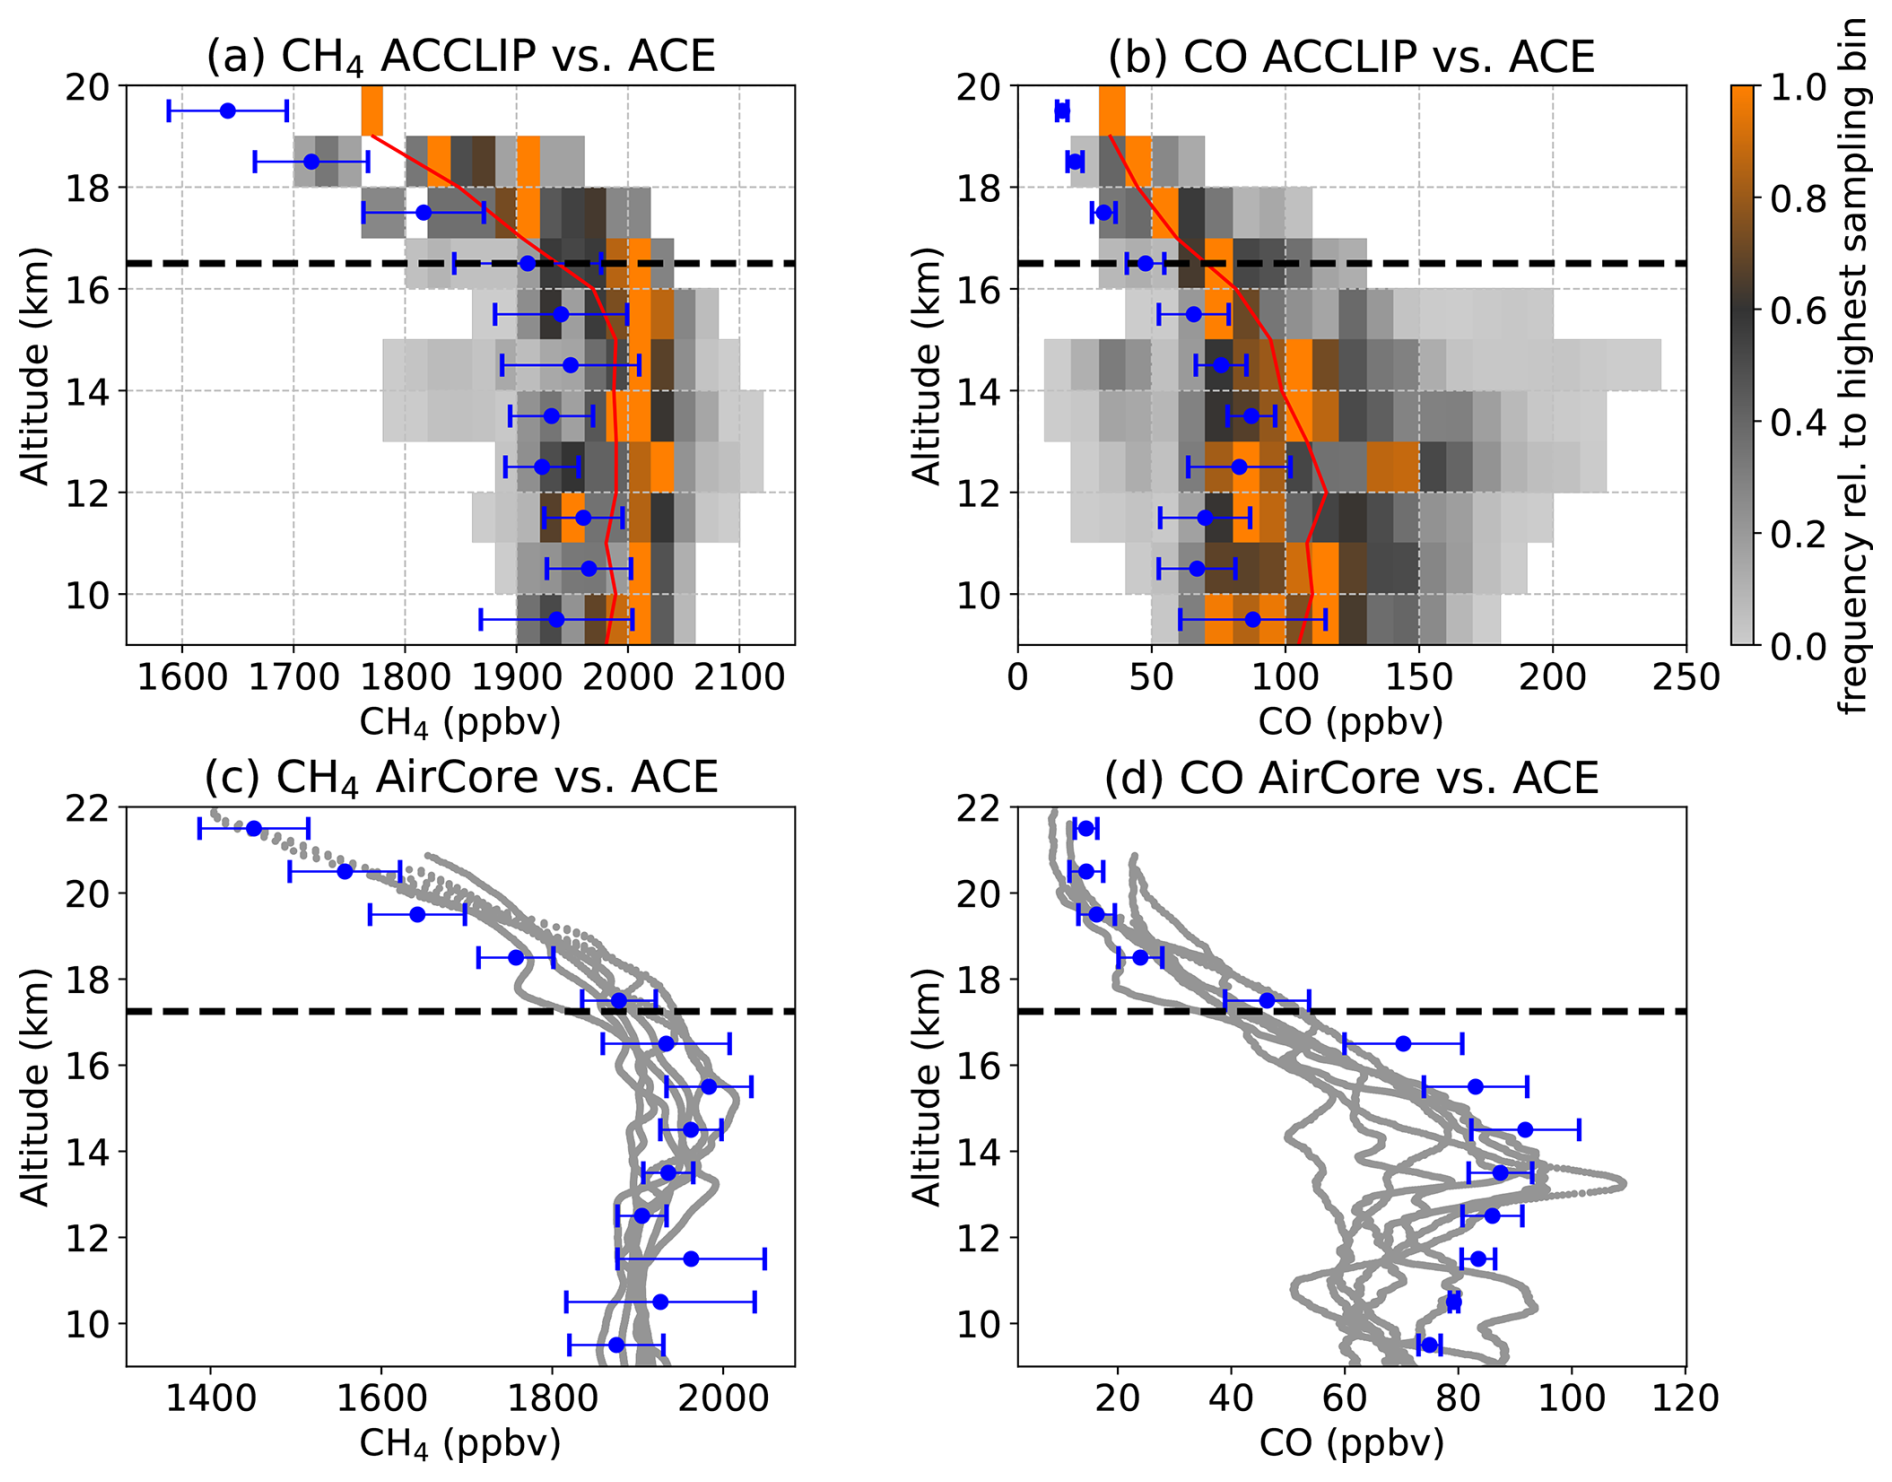
Figure 3Comparison of ACE-FTS measurements with in-situ observations in the ASM region. (a) Layer-normalized relative frequency distributions of CH4 measured during the ACCLIP campaign, with horizontal and vertical bin sizes of 20 ppbv and 0.5 km, respectively. The red line shows the mean CH4 mixing ratio for each vertical bin level. The blue dots represent the mean vertical CH4 profile measured by ACE-FTS, and the blue error bars indicate one sigma standard deviation at each level. The black dashed line indicates the mean tropopause determined from the collocated temperature profiles using the WMO definition; (b) Same as (a), but for CO. (c) Comparison between the AirCore CH4 profiles (gray lines) and the mean ACE-FTS profile (blue dots and error bars, as in a). (d) Same as (c), but for CO.
Comparisons of methane vertical profiles from ACE-FTS, AirCore, and the ACCLIP campaign show overall good agreement (Fig. 3). ACE-FTS captures the broad CH4 enhancement layer between 12 and 16 km and the rapid decrease above 17 km, as expected due to oxidation in the stratosphere. Concentrations are systematically lower than those observed during ACCLIP, which preferentially sampled more polluted air masses. We also include CO to provide a contrast to CH4 under the influence of the ASM anticyclone. The ACE-FTS CO profiles agree well with in-situ measurements, showing the enhancement layer at 13.5–14.5 km followed by a pronounced decrease above, reaching stratospheric background levels at ∼ 19 km.
Overall, ACE-FTS measurements are consistent with the in-situ observations. Both datasets reveal a stronger CH4 enhancement and a sharper gradient near the tropopause than observed for CO, suggesting that CH4 is more efficiently transported upward within the ASM anticyclone, while CO is largely confined to lower altitudes due to its shorter lifetime. The long-term high-quality satellite measurements provide opportunity to investigate the contrasting large-scale behavior between CH4 and CO under the influence of ASM transport and to assess their potential impact on the global UTLS.
3.2 Contrasting Vertical Structures of CH4 and CO in the ASM Anticyclone
Near-global climatological distributions of CH4 and CO in JJA, together with the corresponding climatological stream function indicating the ASM anticyclone, are shown in Fig. 4. The climatological fields are constructed from Gaussian-weighted gridded average of ACE-FTS observations during 2005–2023. Note that the JJA map is a composite primarily consisting of measurements over the tropics in August, the northern subpolar region in July, and the midlatitudes in June, as shown in Fig. 1. With two decades of continuous ACE-FTS observations, the sampling density is sufficiently high at lower latitudes. The gridded results reveal clear enhancements of both CO and CH4 within the region of the ASM anticyclone, with CO showing a larger relative enhancement with respect to the surrounding background. This feature is consistent with Park et al. (2008), who found that enhancements of tropospheric trace species within the anticyclone are closely linked to their photochemical lifetimes, with shorter-lived species exhibiting the larger increases.
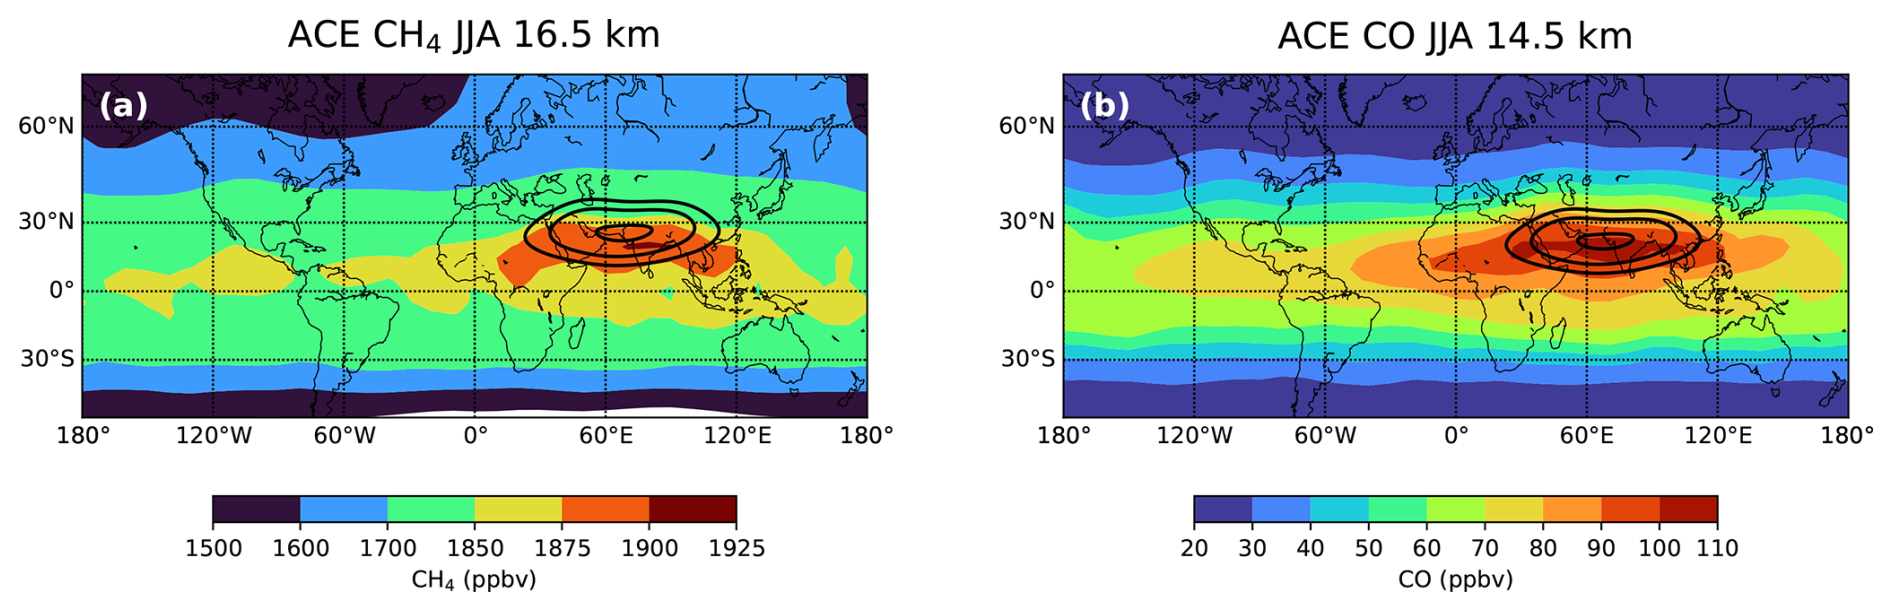
Figure 4Horizontal distributions of JJA climatological mixing ratios from ACE-FTS measurements during 2005–2023. (a) CH4 at 16.5 km and (b) CO at 14.5 km. The black solid contours show selected stream function levels ( m2 s−1; based on the ERA5 data) at the corresponding altitudes, averaged over JJA during 2005–2023, to indicate the climatological location and horizontal extent of the ASM anticyclone. Note that the JJA map predominantly represents measurements over the midlatitudes in June, the northern subpolar region in July, and the tropics in August (see Fig. 1), rather than spatially uniform sampling throughout JJA.
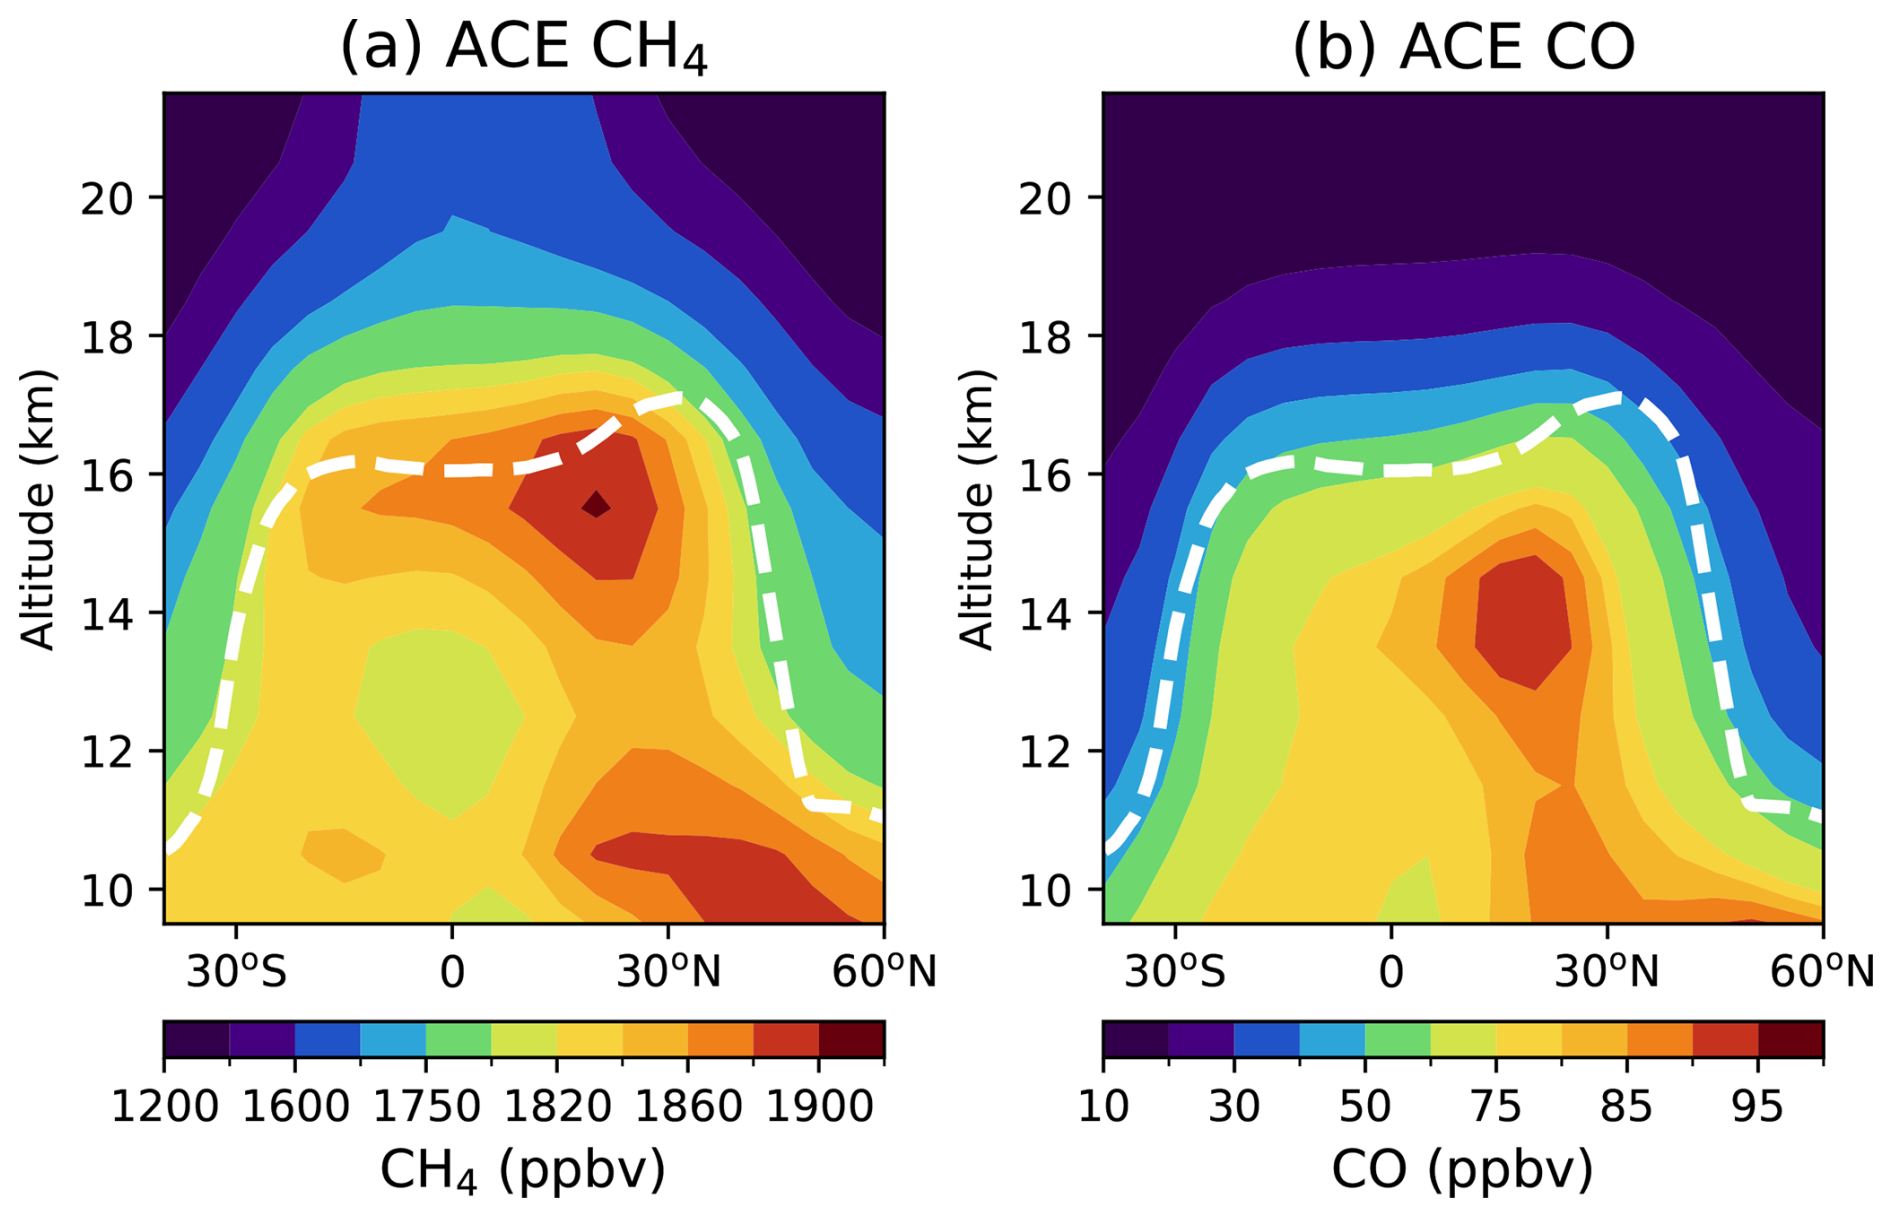
Figure 5Meridional cross-sections of JJA climatological mixing ratios over the ASM region (20–120° E), derived from the horizontal maps shown in Fig. 4. Observed (a) CH4 mixing ratios and (b) CO mixing ratios from ACE-FTS. The white dashed lines denote the JJA climatological lapse-rate tropopause obtained from ERA5 reanalysis during 2005–2023 provided by Hoffmann and Spang (2022). Note that the JJA map predominantly represent measurements over the midlatitudes in June, the northern subpolar region in July, and the tropics in August (see Fig. 1), rather than spatially uniform sampling throughout JJA.
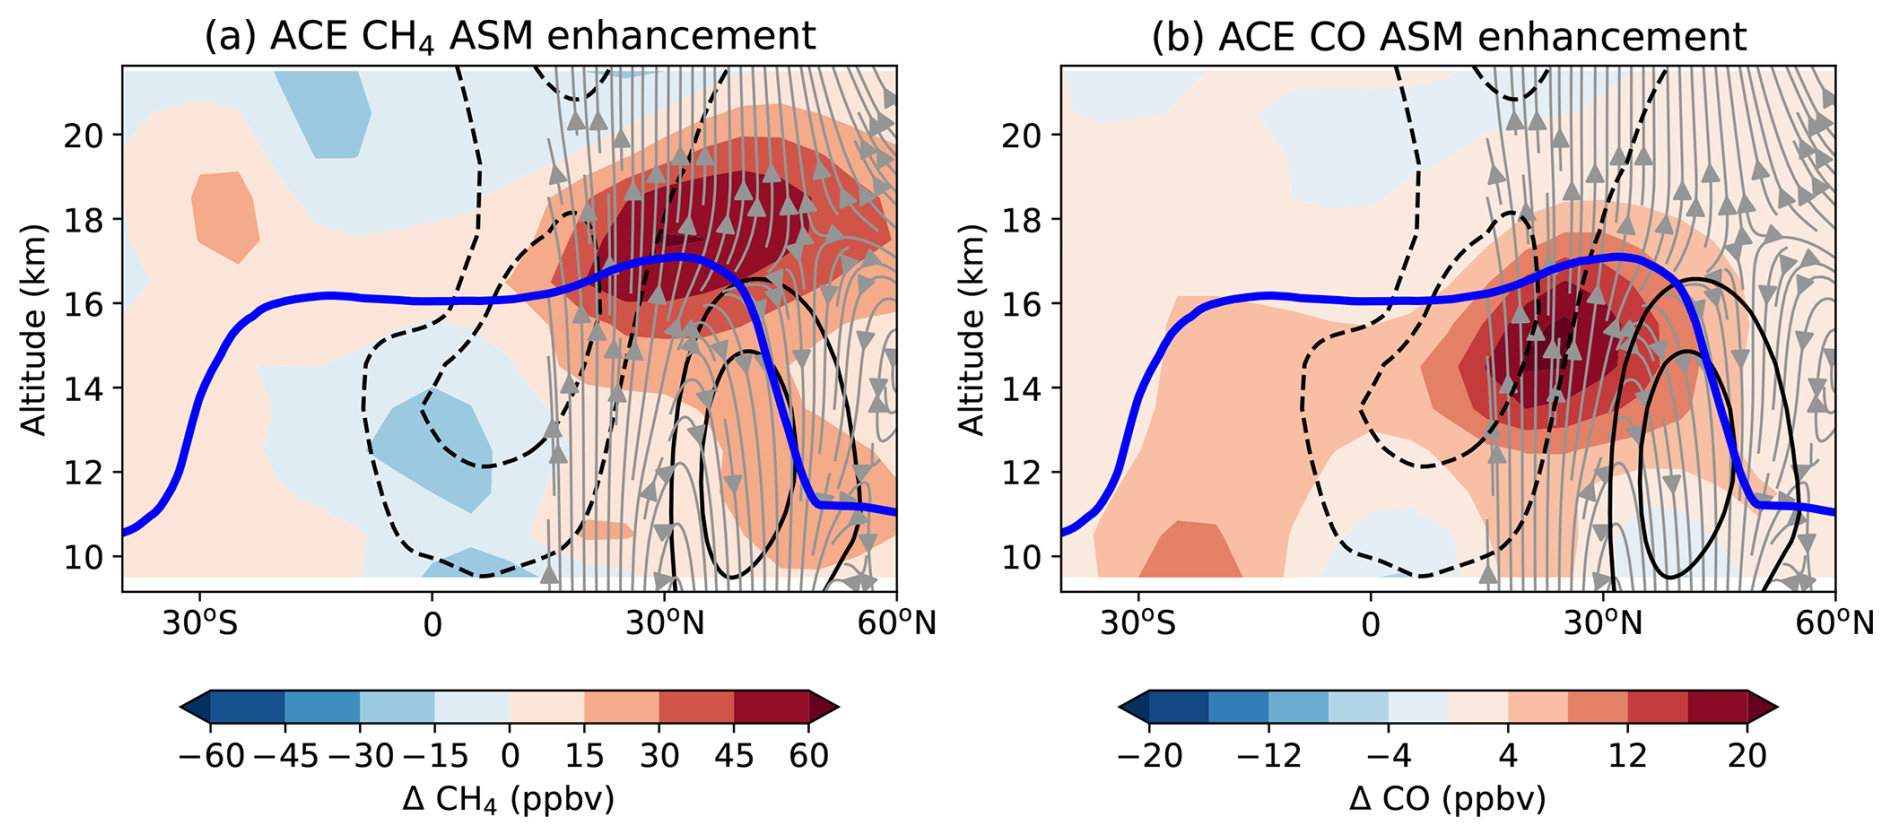
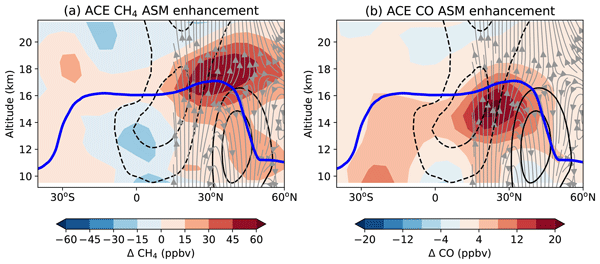
Figure 6Meridional cross sections of the ASM enhancement in (a) CH4 and (b) CO derived from ACE-FTS observations for JJA during 2005–2023, defined as the mean mixing ratio over 20–120° E minus the background mean over all remaining longitudes. Blue lines indicate the lapse-rate tropopause provided by Hoffmann and Spang (2022). Solid and dashed black contours represent westerly (10 and 20 m s−1) and easterly winds (−10 and −20 m s−1), respectively. Gray streamlines, shown only between 15–60° N to cover the ASM region and higher latitude potentially influenced by ASM transport, depict the circulation in the latitude-altitude plane and are constructed from the meridional wind (m s−1) and vertical velocity (mm s−1). All meteorological fields are averaged over 20–120° E during JJA 2005–2023 based on ERA5 reanalysis. Note that the vertical velocity is converted from pressure-coordinate vertical velocity using the hydrostatic relation.
The climatological vertical structure of CH4 and CO within the ASM anticyclone, averaged over 20–120° E, is shown in Fig. 5. Both species exhibit enhanced mixing ratios within the anticyclone (10–30° N), but at different altitudes. For CO, the peak mixing ratio occurs around 14 km, approximately 2 km below the tropopause, whereas for CH4, the highest mixing ratio is found around 16 km, extending across the tropopause. A similar vertical structure of CH4 within the anticyclone has also been reported by Park et al. (2004). These results highlight the contrasting vertical behavior of trace gases with different photochemical lifetimes: CH4 persists into the tropopause region, while CO decays more rapidly, producing a sharp decline at lower altitudes, consistent with in situ observations (von Hobe et al., 2021; Yi et al., 2024).
The JJA enhancements of CO and CH4 inside the anticyclone are further quantified in Fig. 6 by subtracting the profiles outside the anticyclone (longitudes outside of 20–120° E) from those inside (longitudes 20–120° E). The largest CH4 enhancements occur above the tropopause and extend poleward (north) of the anticyclone, whereas CO enhancements are confined within the anticyclone. The methane enhancement structure suggests that long-lived tracers inside the ASM anticyclone are preferentially transported into the northern extratropical lower stratosphere, likely due to weaker confinement on the northern side of the anticyclone above the westerly jet and the tropopause. This result is consistent with Riese et al. (2025), who reported strongly enhanced methane mixing ratios, but no comparable enhancement in CO, for in-situ measurements of high-latitude air masses influenced by export from the ASM region. Previous studies have shown that eastward eddy shedding from the Asian monsoon anticyclone facilitates the transport of tropospheric trace gases into the lower stratosphere at northern mid- and high latitudes (Vogel et al., 2014; Clemens et al., 2022).
3.3 Methane seasonality in the global UTLS
We examine the seasonality of CH4 near the tropopause as observed by ACE-FTS and relate it to surface flux seasonality, with particular emphasize on the role of ASM transport in shaping CH4 variability near the tropical tropopause layer (TTL). Understanding CH4 seasonality in the TTL is critical because this region controls the entry of CH4 into the stratosphere, where CH4 is oxidized to form water vapor (Fu and Dong, 2026).
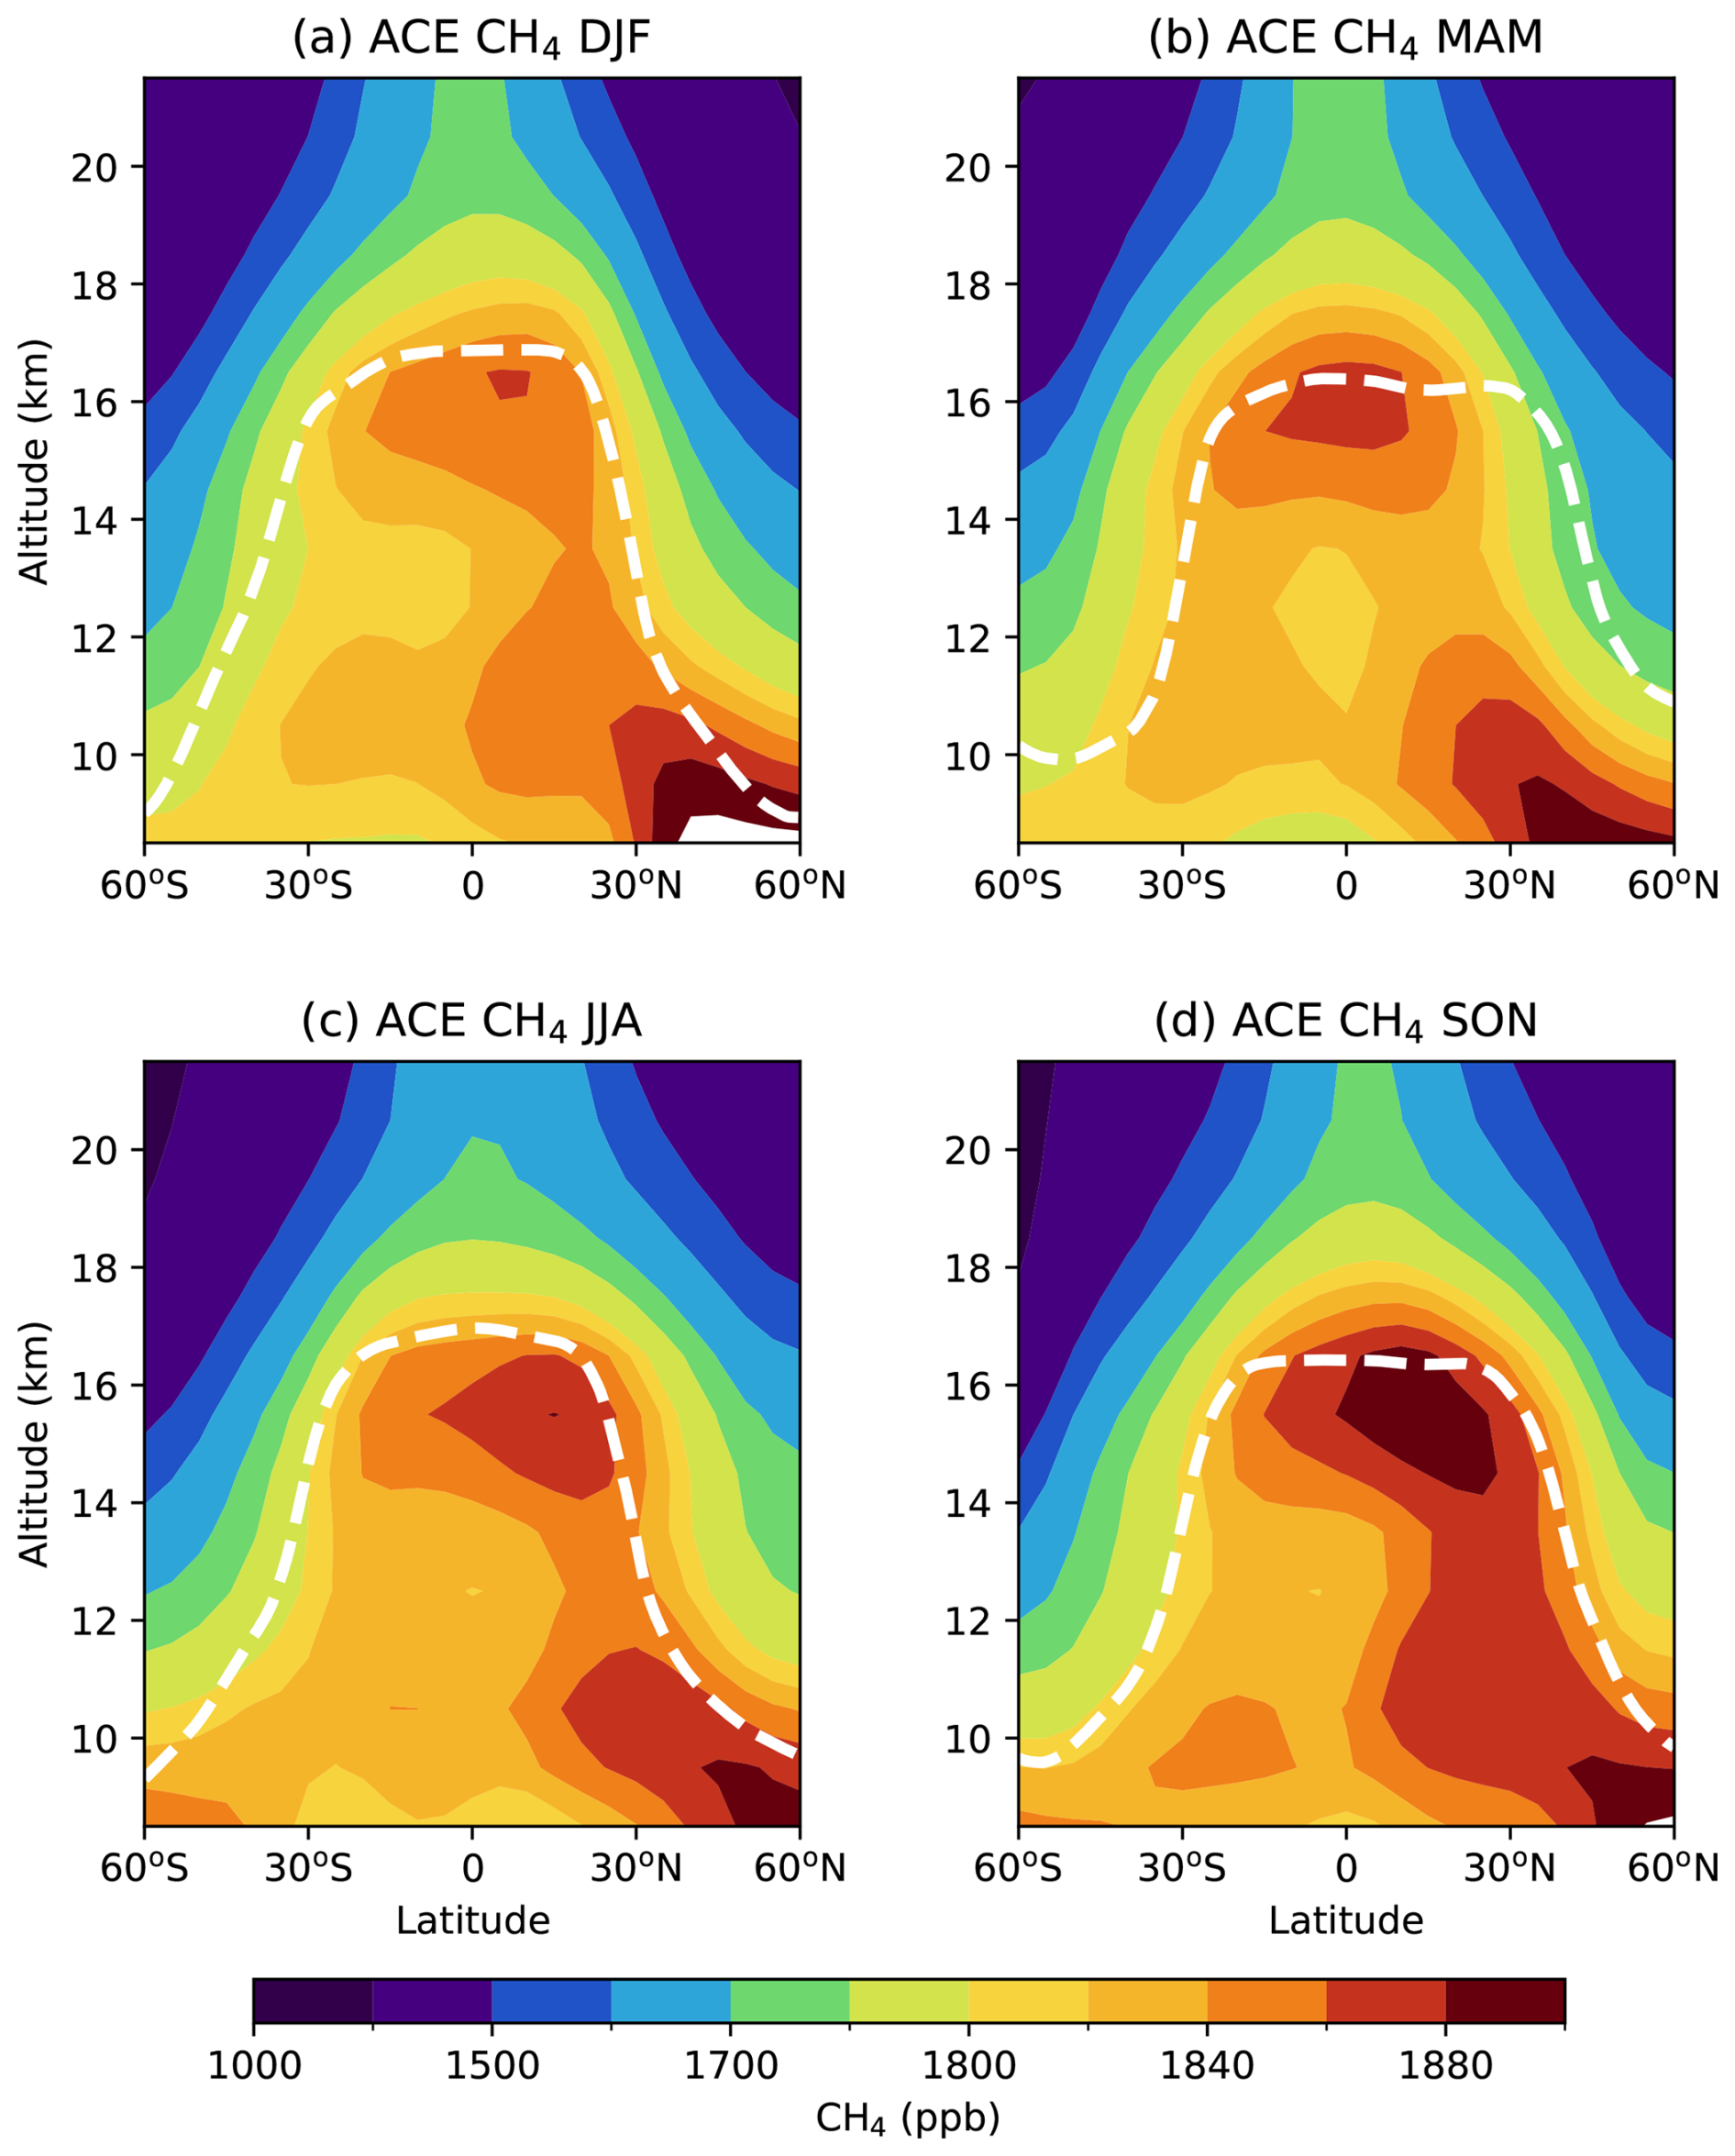
Figure 7Climatological meridional cross sections of zonal mean CH4 for the (a) DJF, (b) MAM, (c) JJA and (d) SON seasons derived from ACE-FTS observations, averaged over period 2005–2023. White dashed lines denote the lapse-rate tropopause provided by Hoffmann and Spang (2022). Unlike the AMA regional distributions in Fig. 5, these panels show the full zonal mean. Note that in the tropics, DJF, MAM, JJA and SON primarily represent observations in February, April, August and October, respectively.
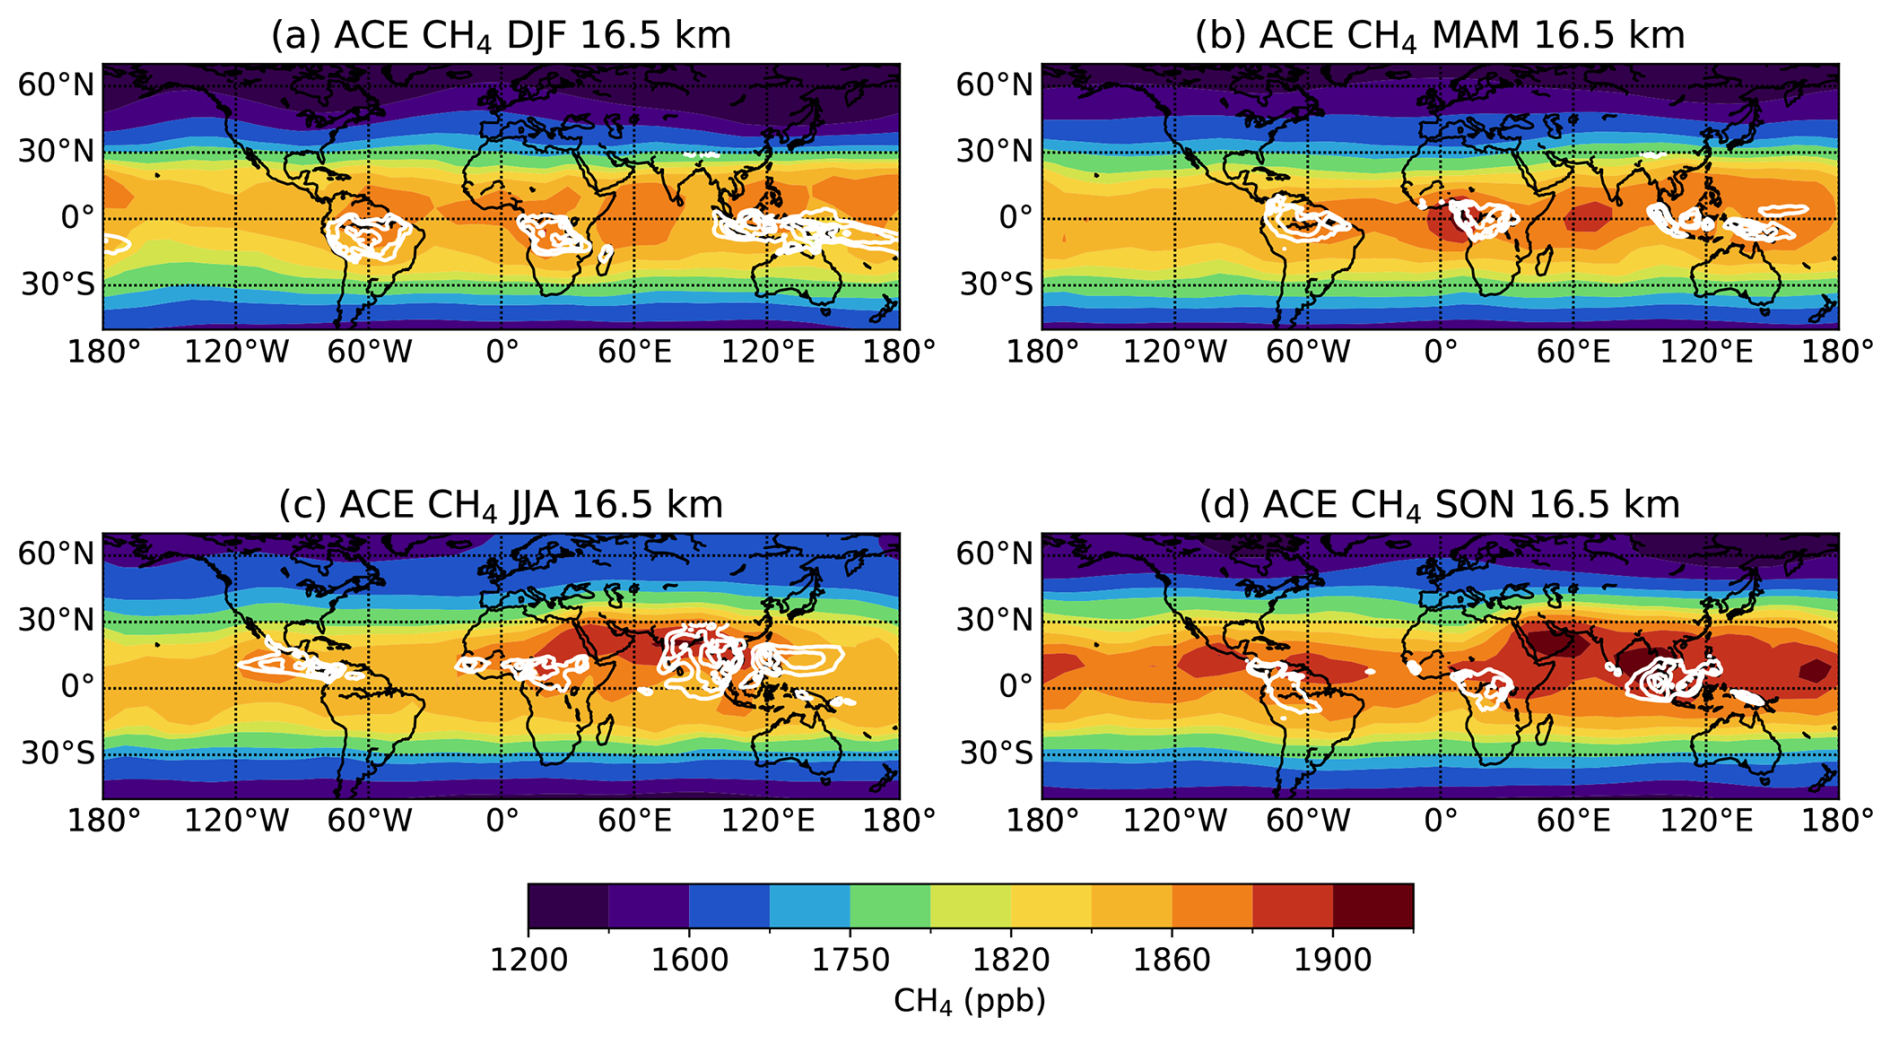
Figure 8Climatological horizontal distributions of CH4 at 16.5 km for (a) DJF, (b) MAM, (c) JJA and (d) SON seasons derived from ACE-FTS observations gridded at 5° latitude by 10° longitude, averaged over the period 2005–2023. The white contours represent outgoing longwave radiation (OLR) from 190 to 220 W m−2 with interval of 10 W m−2, with lower values used as proxy for enhanced deep convection. Note that in the tropics, DJF, MAM, JJA and SON primarily represent observations in February, April, August and October, respectively. The OLR data are monthly means for February, April, August, and October in (a)–(d), respectively, to match the tropical ACE-FTS sampling.
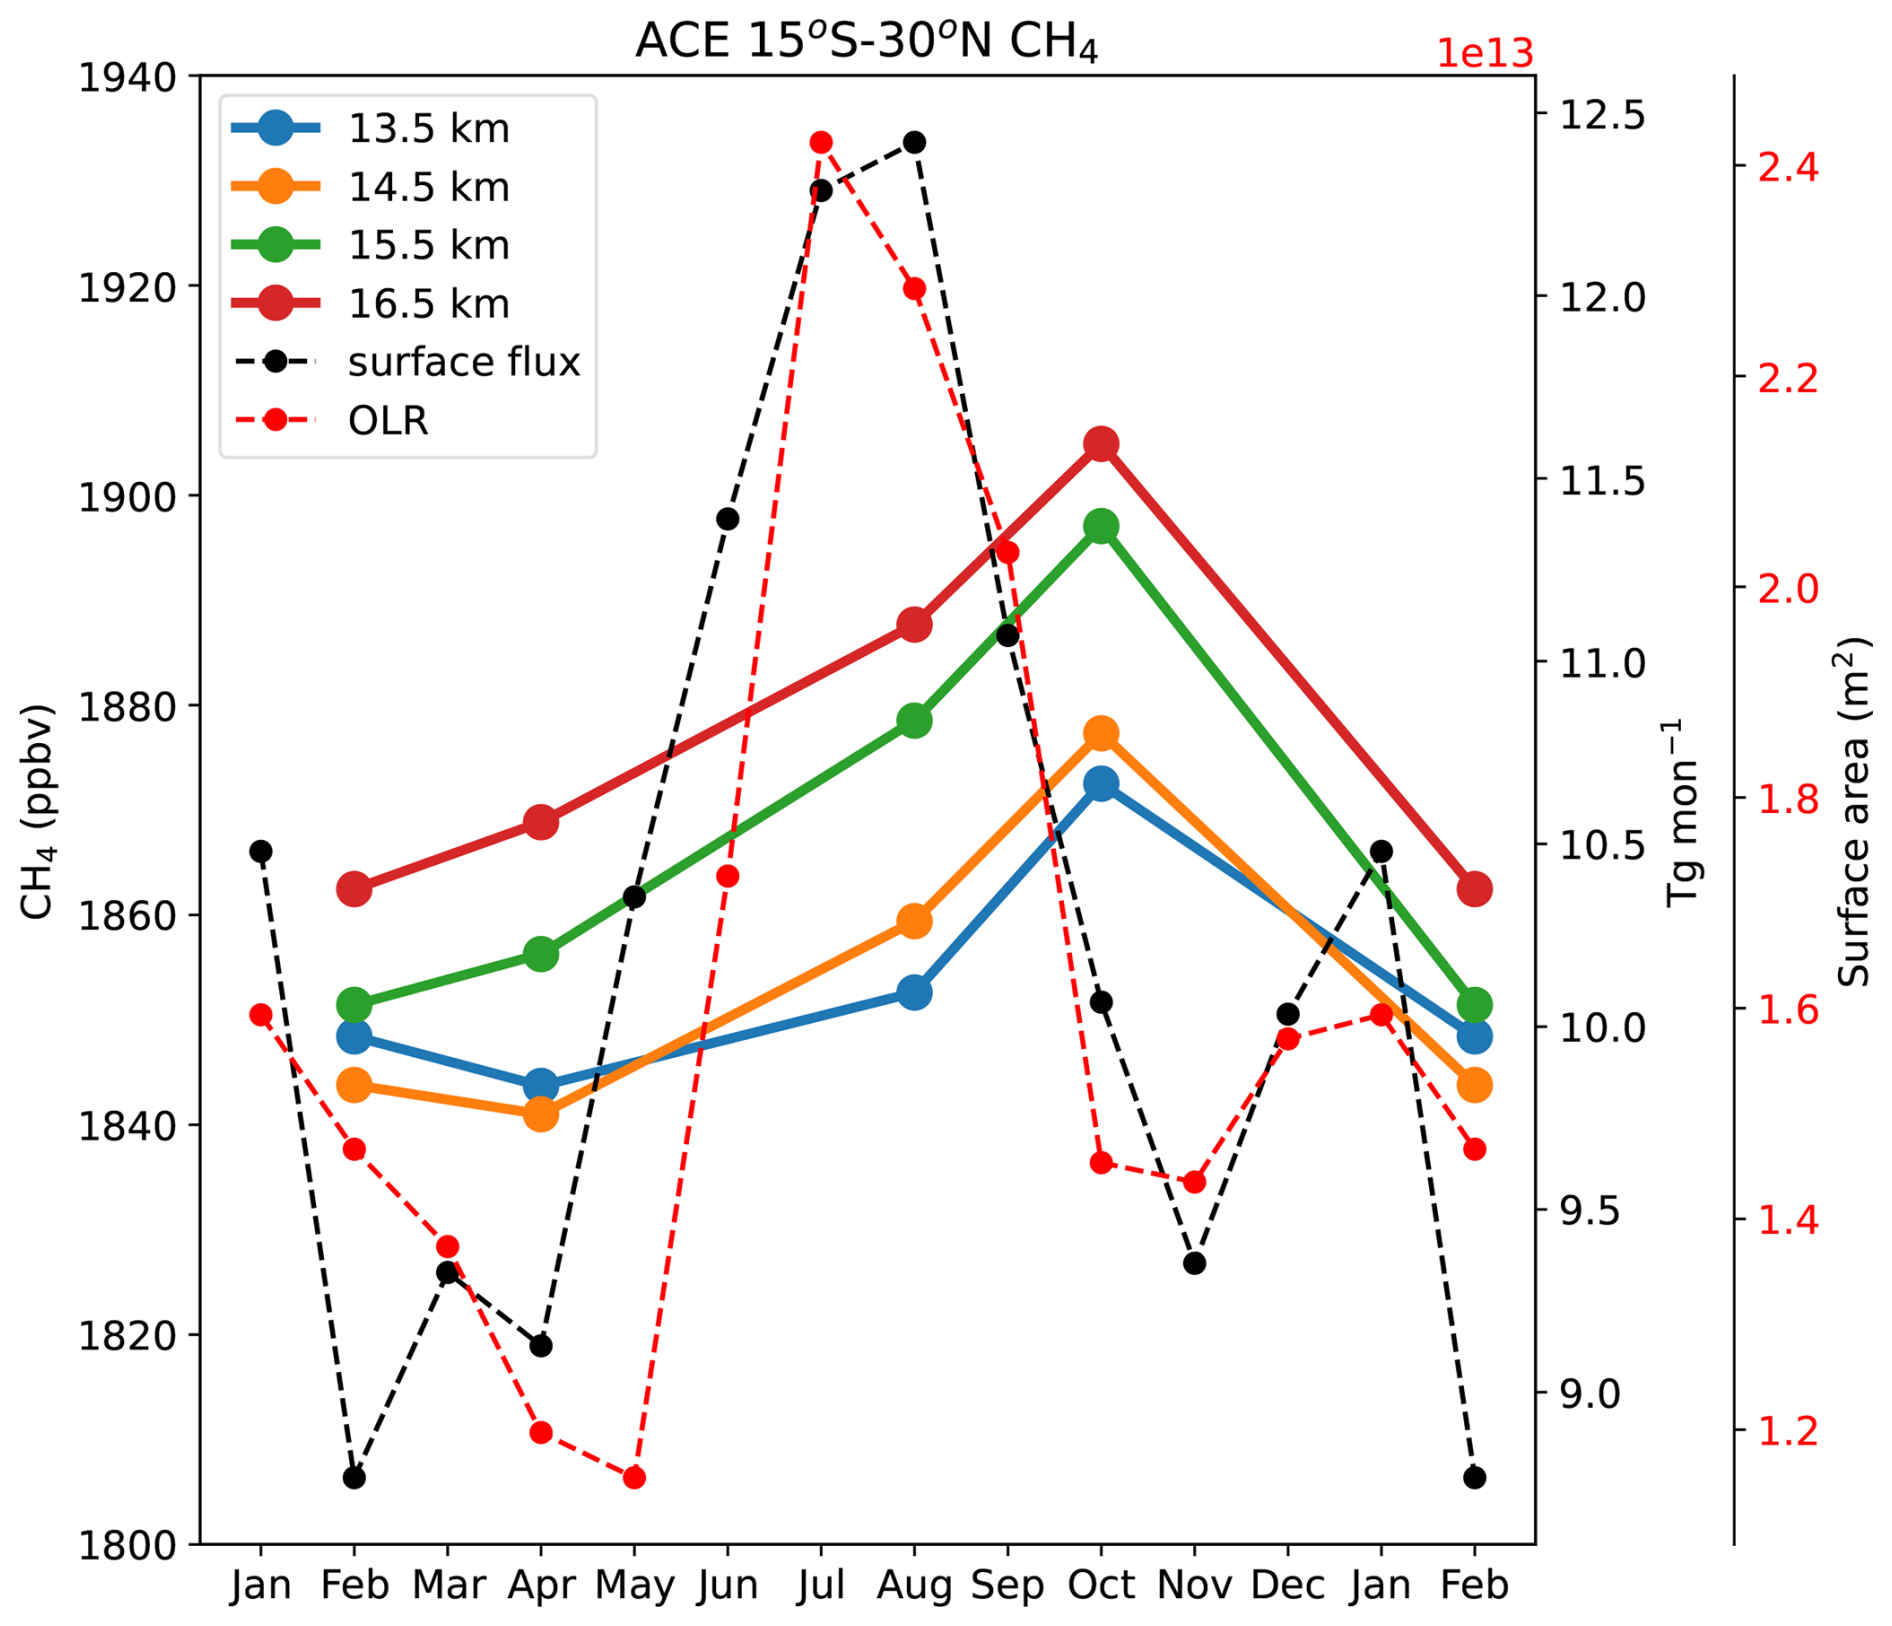
Figure 9Seasonal cycle of ACE-FTS zonal mean CH4 mixing ratio climatology at 13.5–16.5 km averaged over 15° S–30° N (solid lines). Red dashed line indicates the intensity of deep convection to the UTLS, using a proxy of surface area of outgoing longwave radiation less than 220 W m−2 over 15° S–30° N. Black dashed line shows a climatology of CH4 surface flux within the latitude band of 15° S–30° N derived from Saunois et al. (2025).
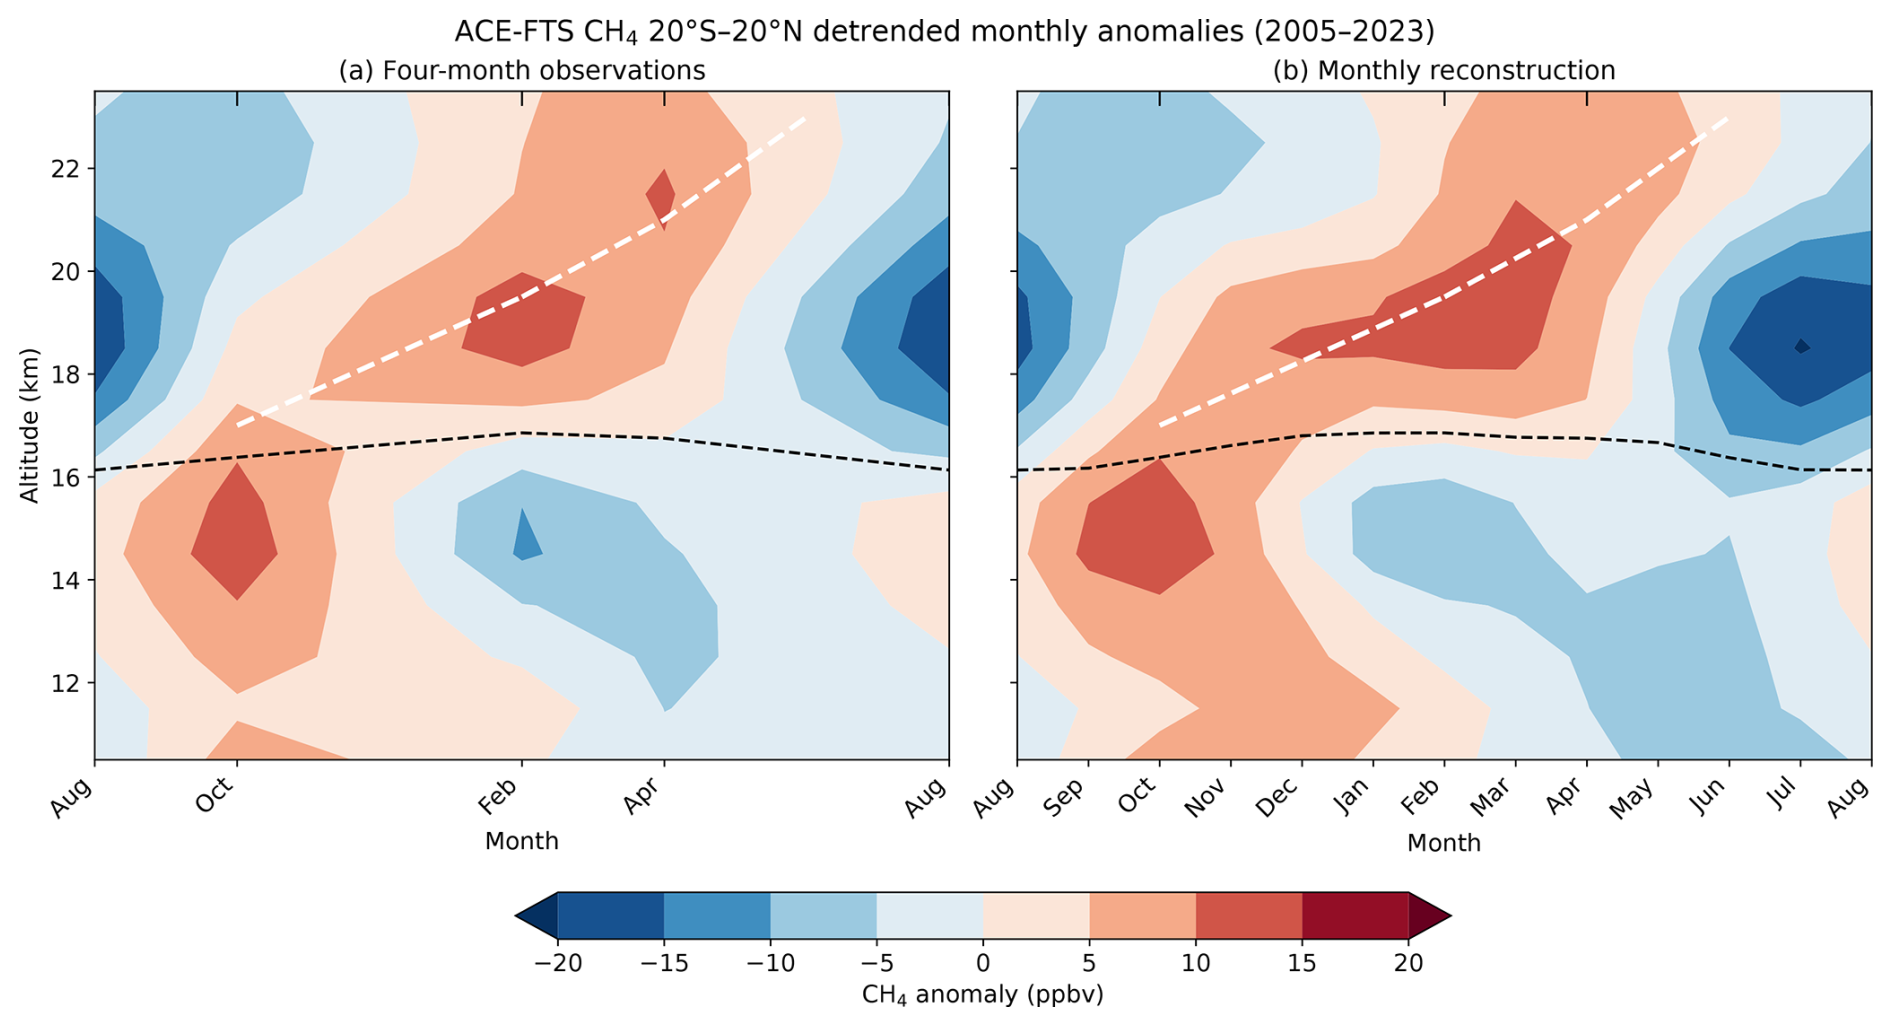
Figure 10Climatological detrended monthly anomalies of ACE-FTS CH4 averaged over 20° S–20° N during 2005–2023, derived from (a) observations in August, October, February and April (b) monthly reconstructions using regression fit including annual and semi-annual cycle. At each altitude, the linear trend is first removed from both observations and reconstructed values. Anomalies are then calculated relative to each year's mean of the four detrended observation months in (a) and the 12 detrended reconstructed months in (b), before averaging each month across the 19 years. Black dashed lines indicate the climatological tropopause height. White dashed lines in (a) trace the maximum anomalies at each altitude to indicate the possible upward progression of positive anomalies. The same white dashed lines are overlaid in (b) for comparison. August is repeated at the right edge to show continuity across the annual cycle.
Climatological zonal mean cross sections of CH4 mixing ratio from ACE-FTS are shown for the four seasons in Fig. 7. Overall behavior shows maximum CH4 mixing ratios in the northern hemispheric (NH) troposphere, due to natural and anthropogenic sources over the continents (Saunois et al., 2025). Additionally, a relative maximum in CH4 persists near the tropical tropopause throughout the year, with the highest values observed during the SON season, when it also extends above the tropopause. Vogel et al. (2019) described isentropic transport from the Asian monsoon anticyclone into the tropics during the upward spiralling within a few months (see their Fig. 14). These transport processes provide a pathway for air mass originating within the anticyclone and in adjacent tropical regions to enter the tropical pipe. This transport pathway may contribute to the observed SON enhancement of CH4 near and above the tropical tropopause.
The climatological horizontal distribution of the CH4 annual cycle at 16.5 km is shown in Fig. 8, together with climatological deep convection indicated by low outgoing longwave radiation (white contours). In JJA, CH4 exhibits a pronounced maximum around the ASM anticyclone. This feature is linked to the deep convection and strong confinement of the anticyclone during ASM (Park et al., 2004; Randel and Park, 2006; Pan et al., 2016). The maximum persists into SON and extends throughout the global tropics. During the boreal autumn season, the chemical composition within the anticyclone can be transported into the tropics as the anticyclone breaks up (Vogel et al., 2015, 2019; Orbe et al., 2015).
We further examine the role of ASM transport in shaping CH4 seasonality in the tropics using the seasonal variability of CH4 surface fluxes obtained from Saunois et al. (2025) and the area of low outgoing longwave radiation (OLR) as a proxy for deep convection over 15° S–30° N (Fig. 9). The surface flux estimates are independent of the ACE-FTS observations used in this study. CH4 surface fluxes and deep convection are both strongest during boreal summer, driving the observed systematic increases in upper tropospheric CH4. The strongest deep convection in boreal summer occurs in the region of the ASM, which is also one of the major summertime methane source regions (Yu et al., 2023). Together with the UTLS anticyclonic circulation, this leads to localized CH4 maxima (e.g. Fig. 4a). The localized CH4 maxima can be transported isentropically from the Asian monsoon anticyclone into the tropics (Vogel et al., 2019). This transport, together with further redistribution of monsoon air during the seasonal break-up of the anticyclone and convective transport at other longitudes, leads to the global UTLS maximum in the tropics in SON.
Variations in the tropical CH4 annual cycle and links between the upper troposphere and lower stratosphere are studied in Fig. 10. Here two versions of seasonal CH4 anomalies (deviations from the annual mean at each altitude) over 20° N–20° S are shown, based on (panel a) the four monthly ACE-FTS samples in August, October, February and April, and (panel b) monthly reconstruction using annual and semi-annual harmonic fits (method described in Sect. 2.4).
The observations show the boreal autumn (October) positive anomaly extends up to and across the tropopause, consistent with the seasonal peak shown in Fig. 7. In the lower stratosphere, there is a predominant annual cycle with a maximum in February and minimum in August, and largest amplitude over 18–20 km. The timing and altitude maximum of this variability suggests a link to the annual cycle in upwelling in the tropical lower stratosphere (BDC, with maximum in boreal winter) acting on the background vertical gradients in CH4 above the tropical tropopause, e.g. Fig. 7. This is similar to the seasonal behavior observed for carbon monoxide and ozone (with opposite sign) in the tropical lower stratosphere (Randel et al., 2007).
The timing of the lower stratosphere CH4 maximum in boreal winter may also suggest some upward propagation of the CH4 maximum near the tropopause in October, as suggested by the white dashed lines in Fig. 10 (with a slope of 8 km yr−1, corresponding to the calculated upwelling velocity). However, this direct association from upper troposphere to lower stratosphere is poorly defined by the lack of ACE-FTS tropical measurements between October–February.
3.4 CH4 trends
Global increases in tropospheric CH4 over recent decades are well-known and increasing trends in upper tropospheric CH4 over the past decades have been previously reported from ACE-FTS measurements (Schmidt et al., 2024). Time series of seasonal ACE-FTS data in the tropical UTLS (15° S–30° N; Fig. 11a) highlight increases over time, along with the repeating seasonal maximum during boreal summer and autumn. Linear trends in these data are estimated using the Long-term Ozone Trends and Uncertainties in the Stratosphere (LOTUS) multivariate regression code (SPARC/IO3C/GAW, 2019). Schmidt et al. (2024) reported a tropospheric methane trend of 6.41 ppb yr−1 during 2012–2018, increasing to 15.12 ppb yr−1 after 2019. Results in Fig. 11b show broad positive trends of +3 % per decade to 4 % per decade in the global troposphere, with a slight relative maximum near the tropical tropopause (which is not statistically significant). The larger trend near the tropical tropopause than above may reflect a more immediate response to the accelerating tropospheric CH4 increase, whereas the response at higher altitude is delayed and smoothed by stratospheric transport and mixing.
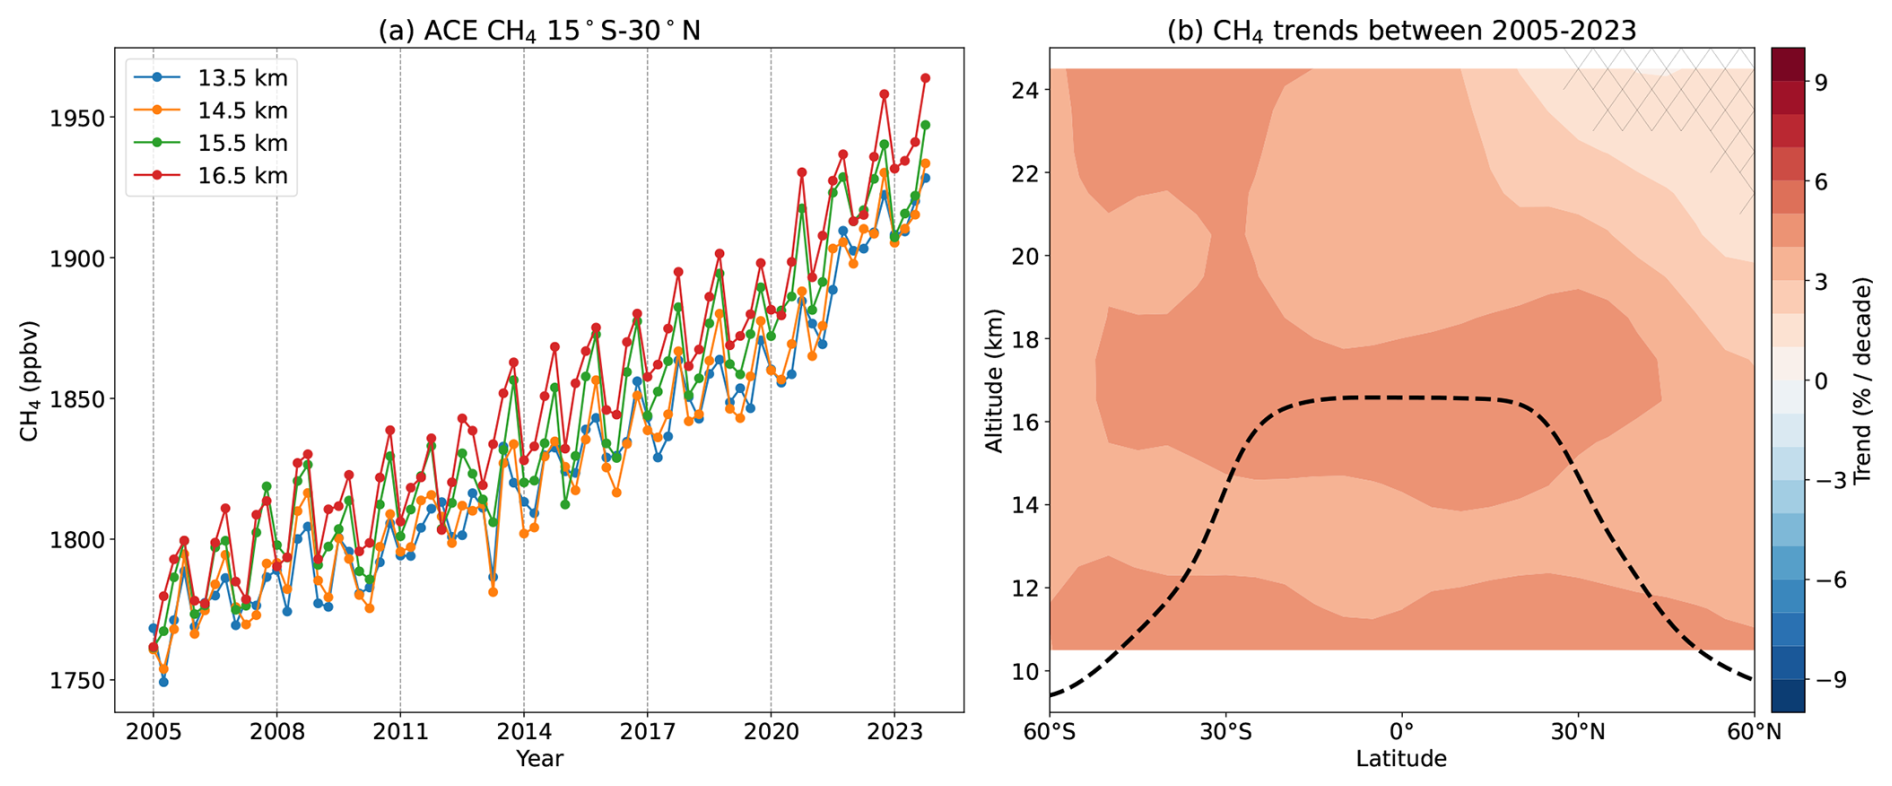
Figure 11(a) Time series of zonal mean CH4 mixing ratio averaged over 15° S–30° N for multiple levels, as obtained from ACE-FTS (colored solid line). (b) CH4 trends in UTLS over the period January 2005–December 2023, as calculated by LOTUS regression code (SPARC/IO3C/GAW, 2019). Hatched regions are insignificant at the 2σ level. Black dashed line represents the WMO-tropopause obtained from ERA5 reanalysis.
In contrast, CH4 trends in the lower stratosphere (above 18 km) show a pronounced hemispheric asymmetry, with near-zero trends in the Northern Hemisphere (NH) and positive trends in the Southern Hemisphere (SH). This pattern is consistent with previously reported hemispheric asymmetries in stratospheric tracer and age-of-air trends after 2000 for other long-lived stratospheric tracers (e.g. Mahieu et al., 2014; Haenel et al., 2015; Han et al., 2019; Strahan et al., 2020; Prignon et al., 2021; Dubé et al., 2023, 2025) and with reanalysis-driven simulations indicating relative aging of air in the NH compared to the SH (Ploeger and Garny, 2022). Stiller et al. (2017) attributed much of the observed age-of-air trend asymmetry to a southward shift of subtropical transport barriers. More recently, Ivaniha et al. (2026) confirmed a southward shift of the tropical pipe in CESM1-WACCM and linked it to nonlinear Quasi-Biennial Oscillation (QBO) effects. These studies suggest that changes in stratospheric transport, including circulation shifts and QBO-related variability, may contribute to the hemispheric asymmetry in our CH4 trends.
This study investigates methane variability associated with ASM transport and its impact on the global UTLS using high-quality ACE-FTS observations. Comparisons against high vertical-resolution AirCore profiles and aircraft measurements demonstrate that ACE-FTS captures both the upper-tropospheric CH4 enhancement and the sharp vertical gradients near the tropopause. Consistent agreement is found for ACE-FTS CO, further supporting the robustness of the ACE-FTS observations. Both ACE-FTS observations and in-situ measurements reveal CH4 and CO enhancements within the anticyclone, with distinct vertical structures: CH4 maximum extends up to the local tropopause, whereas CO decreases sharply about 2 km below it. This highlights distinct transport characteristics of the short- and long-lived tracers associated with the ASM.
The contrast in tracers between the interior and exterior of the anticyclone reveals distinct spatial structures for CH4 and CO: the largest CH4 enhancements occur poleward to the north and above the tropopause, whereas the strongest CO enhancements are found below the tropopause within the anticyclone. The behavior demonstrates that air masses inside the ASM anticyclone are preferentially transported into the northern extratropical lower stratosphere. The methane distribution is consistent with previous study on transport from the ASM anticyclone into the northern extratropical lower stratosphere (Ploeger et al., 2013, 2017; Vogel et al., 2014, 2015; Clemens et al., 2022). These studies identify eastward eddy shedding and quasi-horizontal poleward transport along isentropic surface as pathways by which air within the ASM anticyclone reaches the extratropical lower stratosphere. Our observations provide additional tracer evidence consistent with these transport pathways revealed by the simulation results.
On a global scale, an upper tropospheric CH4 maximum is observed throughout the year in the tropics, maximizing during boreal summer (JJA) and autumn (SON). This climatological maximum likely arises as a result of enhanced deep convection overlying maximum surface CH4 fluxes during boreal summer (Fig. 9). The ASM circulation is part of this boreal summer maximum, and the confining ASM circulation further enhances CH4 in the monsoon region (e.g. Fig. 3a). As the ASM anticyclone dissipates in boreal autumn, this CH4 maximum broadens toward the tropics, and mixing ratios near the tropical tropopause layer reach their seasonal maximum. This evolution is consistent with simulations showing a late-season broadening of monsoon-source tracers toward the tropics (Vogel et al., 2015) and dispersal of anticyclone air across the tropics (Garny and Randel, 2016). Previous studies have identified pathways involving diabatic ascent and quasi-horizontal transport into the tropical stratosphere, followed by further ascent within the tropical pipe (Ploeger et al., 2017; Vogel et al., 2019). Large positive anomalies in the tropical lower stratosphere in the boreal winter suggests a possible role for tropical upwelling associated with the BDC. However, direct association of the positive anomalies from upper troposphere to lower stratosphere is poorly defined by the lack of ACE-FTS tropical measurements between October–February.
ACE-FTS data show the well-known growth in CH4 over time, with increases of 3 % per decade to 4 % per decade throughout the troposphere and UTLS region. A clear hemispheric asymmetry is evident in lower stratospheric trends (above 18 km), with negative values in the NH and positive values in the SH. The spatial pattern is consistent with post-2000 trends in other long-lived tracers and reanalysis-driven simulations reported in recent studies (Mahieu et al., 2014; Haenel et al., 2015; Ploeger and Garny, 2022). They may reflect variability in the strength and spatial structure of the BDC, including shifts in subtropical transport barriers and QBO-related modulation of transport and mixing (Stiller et al., 2017; Ivaniha et al., 2026). But these asymmetric stratospheric CH4 trends have little impact on the ASM or global tropical tropopause region.
Overall, these results highlight the role of the ASM in shaping methane variability in the UTLS and its subsequent influence on global distributions. As emphasized in the Introduction, understanding the redistribution processes that couple the lower atmosphere with the UTLS is important for constraining the global methane budget and evaluating its radiative impacts. The long-record high-quality ACE-FTS methane data provides a unique benchmark for testing model performance and for quantifying the ASM's role in CH4 transport and variability.
The regression fits, obtained using the method described in Sect. 2.4, reproduce the long-term increase and the main seasonal variations in ACE-FTS CH4 observations averaged over 20° S–20° N during 2005–2023 at selected altitudes (Fig. A1).
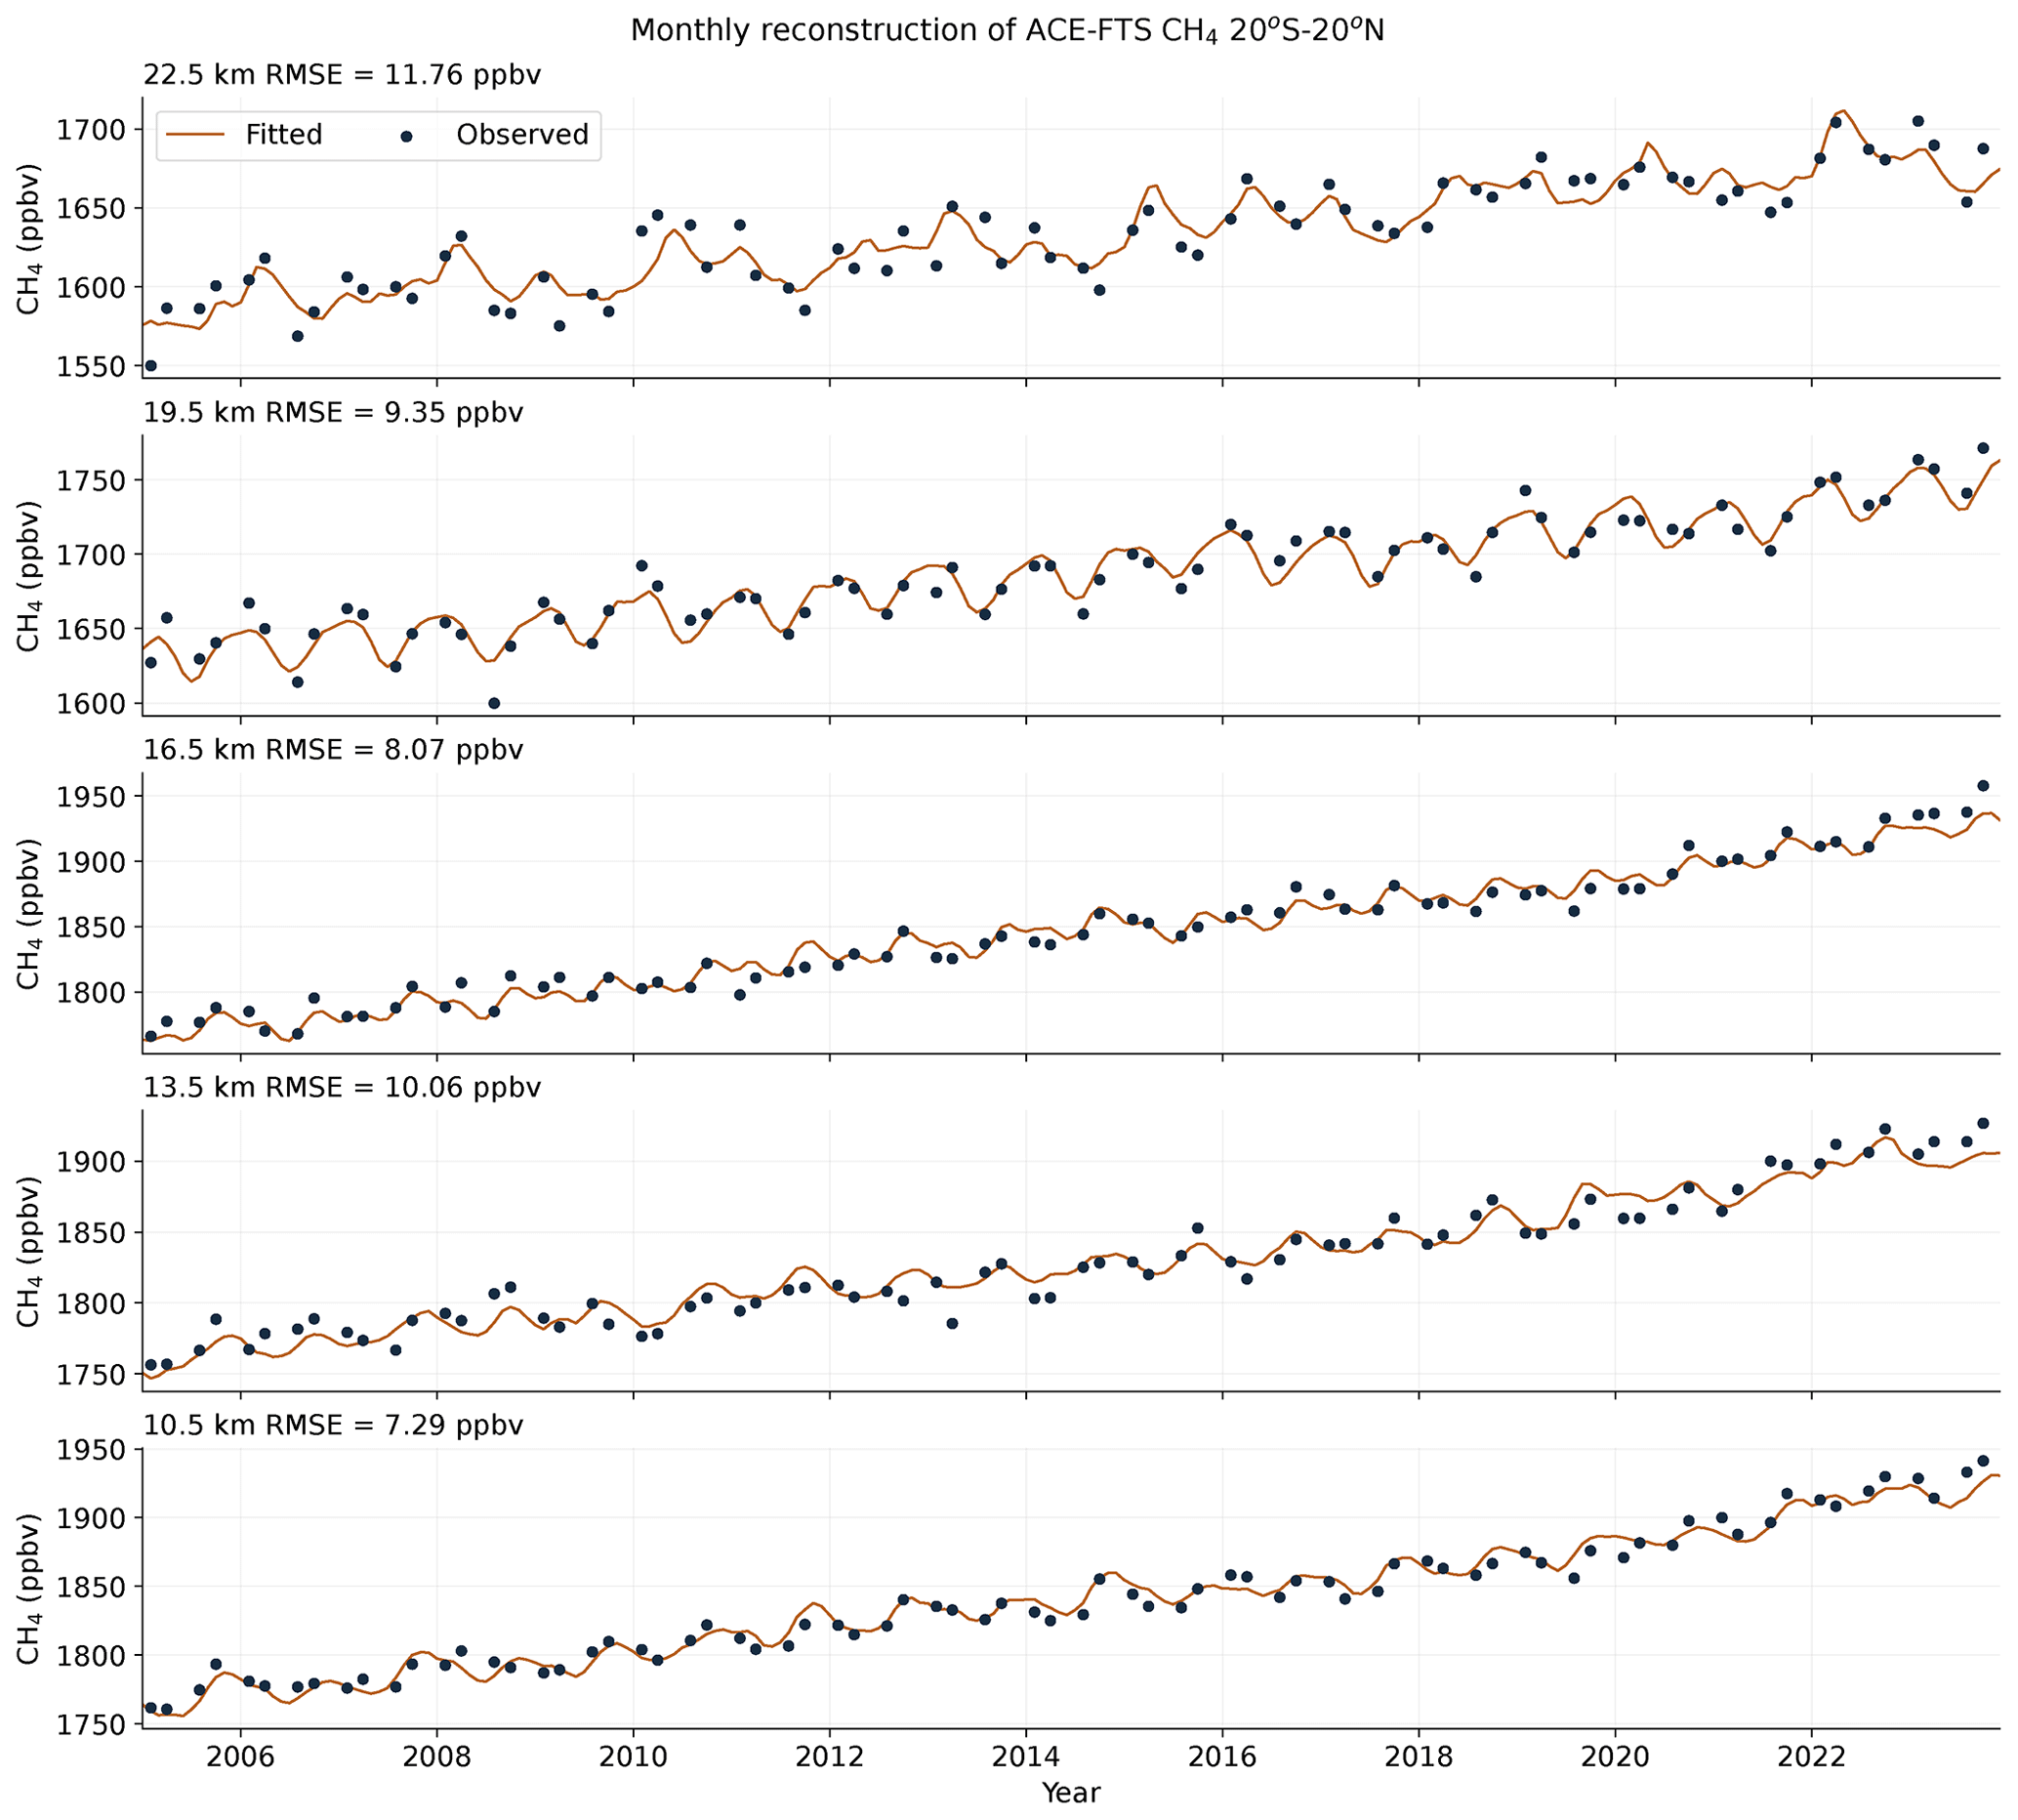
Figure A1Monthly reconstruction of ACE-FTS CH4 mixing ratios averaged over 20° S–20° N at selected altitudes during 2005–2023. Black dots represent observations available in February, April, August, and October. Red lines show monthly reconstructions from regression fits. Regressions were fitted separately at each altitude using only available observations. The root-mean-square error (RMSE) between fitted and observed values is indicated above each panel.
The AirCore data can be accessed through https://doi.org/10.57760/sciencedb.09463 (Cai, 2024). The ACE-FTS satellite data can be accessed through https://databace.scisat.ca (last access: 5 November 2026). The ACCLIP data can be accessed through https://data.eol.ucar.edu/master_lists/generated/acclip/ (last access: 5 November 2026). ERA5 data can be downloaded from https://doi.org/10.24381/cds.6860a573 (Copernicus Climate Change Service, 2023).
WR and YY designed the study; YY and WR performed the data analysis; YY and WR wrote the manuscript. YL, SF, ZC, and YY conducted the AirCore campaign in China. LP and TC conducted the ACCLIP methane and carbon monoxide measurements over the western Pacific; BG provided additional insights on the draft. All authors contribute to the revision of the manuscript.
The contact author has declared that none of the authors has any competing interests.
Publisher's note: Copernicus Publications remains neutral with regard to jurisdictional claims made in the text, published maps, institutional affiliations, or any other geographical representation in this paper. The authors bear the ultimate responsibility for providing appropriate place names. Views expressed in the text are those of the authors and do not necessarily reflect the views of the publisher.
This article is part of the special issue “The tropopause region in a changing atmosphere (TPChange) (ACP/AMT/GMD/WCD inter-journal SI)”. It is not associated with a conference.
We thank the ACE-FTS team for providing the observation data and European Center for Medium-Range Weather Forecasts for providing the ERA5 data product.
This work was supported by the Jing-Jin-Ji Regional Integrated Environmental Improvement-National Science and Technology Major Project of Ministry of Ecology and Environment of China (no. 2025ZD1200701). The National Center for Atmospheric Research is supported by the US National Science Foundation. This work was partially supported under NASA Grant 80NSSC20K0928.
This paper was edited by Luis Millan and reviewed by two anonymous referees.
Baker, A. K., Schuck, T. J., Brenninkmeijer, C. A. M., Rauthe-Schöch, A., Slemr, F., Velthoven, P. F. J., and Lelieveld, J.: Estimating the contribution of monsoon-related biogenic production to methane emissions from South Asia using CARIBIC observations, Geophys. Res. Lett., 39, 813–819, https://doi.org/10.1029/2012gl051756, 2012.
Bernath, P. F., McElroy, C. T., Abrams, M. C., Boone, C. D., Butler, M., Camy-Peyret, C., Carleer, M., Clerbaux, C., Coheur, P.-F., Colin, R., DeCola, P., DeMazière, M., Drummond, J. R., Dufour, D., Evans, W. F. J., Fast, H., Fussen, D., Gilbert, K., Jennings, D. E., Llewellyn, E. J., Lowe, R. P., Mahieu, E., McConnell, J. C., McHugh, M., McLeod, S. D., Michaud, R., Midwinter, C., Nassar, R., Nichitiu, F., Nowlan, C., Rinsland, C. P., Rochon, Y. J., Rowlands, N., Semeniuk, K., Simon, P., Skelton, R., Sloan, J. J., Soucy, M.-A., Strong, K., Tremblay, P., Turnbull, D., Walker, K. A., Walkty, I., Wardle, D. A., Wehrle, V., Zander, R., and Zou, J.: Atmospheric Chemistry Experiment (ACE): Mission overview, Geophys. Res. Lett., 32, https://doi.org/10.1029/2005gl022386, 2005.
Boone, C. D., Bernath, P. F., and Lecours, M.: Version 5 retrievals for ACE-FTS and ACE-imagers, J. Quant. Spectrosc. Ra., 310, 108749, https://doi.org/10.1016/j.jqsrt.2023.108749, 2023.
Cai, Z.: AirCore at northern Tibetan Plateau during Asian Summer Monsoon[DS/OL], V2, Science Data Bank [data set], https://doi.org/10.57760/sciencedb.09463, 2024.
Clemens, J., Ploeger, F., Konopka, P., Portmann, R., Sprenger, M., and Wernli, H.: Characterization of transport from the Asian summer monsoon anticyclone into the UTLS via shedding of low potential vorticity cutoffs, Atmos. Chem. Phys., 22, 3841–3860, https://doi.org/10.5194/acp-22-3841-2022, 2022.
Copernicus Climate Change Service: ERA5 monthly averaged data on pressure levels from 1940 to present, Copernicus Climate Change Service (C3S) Climate Data Store (CDS) [data set], https://doi.org/10.24381/cds.6860a573, 2023.
Crippa, M., Guizzardi, D., Schaaf, E., Monforti-Ferrario, F., and Quadrelli, R.: GHG emissions of all world countries – 2023, Publications Office of the European Union, https://doi.org/10.2760/953322, 2023.
De Mazière, M., Vigouroux, C., Bernath, P. F., Baron, P., Blumenstock, T., Boone, C., Brogniez, C., Catoire, V., Coffey, M., Duchatelet, P., Griffith, D., Hannigan, J., Kasai, Y., Kramer, I., Jones, N., Mahieu, E., Manney, G. L., Piccolo, C., Randall, C., Robert, C., Senten, C., Strong, K., Taylor, J., Tétard, C., Walker, K. A., and Wood, S.: Validation of ACE-FTS v2.2 methane profiles from the upper troposphere to the lower mesosphere, Atmos. Chem. Phys., 8, 2421–2435, https://doi.org/10.5194/acp-8-2421-2008, 2008.
Dubé, K., Tegtmeier, S., Bourassa, A., Zawada, D., Degenstein, D., Sheese, P. E., Walker, K. A., and Randel, W.: N2O as a regression proxy for dynamical variability in stratospheric trace gas trends, Atmos. Chem. Phys., 23, 13283–13300, https://doi.org/10.5194/acp-23-13283-2023, 2023.
Dubé, K., Tegtmeier, S., Ploeger, F., and Walker, K. A.: Hemispheric asymmetry in recent stratospheric age of air changes, Atmos. Chem. Phys., 25, 1433–1447, https://doi.org/10.5194/acp-25-1433-2025, 2025.
East, J. D., Jacob, D. J., Balasus, N., Bloom, A. A., Bruhwiler, L., Chen, Z., Kaplan, J. O., Mickley, L. J., Mooring, T. A., Penn, E., Poulter, B., Sulprizio, M. P., Worden, J. R., Yantosca, R. M., and Zhang, Z.: Interpreting the Seasonality of Atmospheric Methane, Geophys. Res. Lett., 51, 494–505, https://doi.org/10.1029/2024gl108494, 2024.
Etiope, G. and Schwietzke, S.: Global geological methane emissions: An update of top-down and bottom-up estimates, Elem. Sci. Anth., 7, 47, https://doi.org/10.1525/elementa.383, 2019.
Fleming, E. L., George, C., Heard, D. E., Jackman, C. H., Kurylo, M. J., Mellouki, W., Orkin, V. L., Swartz, W. H., Wallington, T. J., Wine, P. H., and Burkholder, J. B.: The impact of current CH4 and N2O atmospheric loss process uncertainties on calculated ozone abundances and trends, J. Geophys. Res.-Atmos., 120, 5267–5293, https://doi.org/10.1002/2014jd022067, 2015.
Fu, Q. and Dong, C.: Global stratospheric methane loss from satellite observations, P. Natl. Acad. Sci., 123, e2529774123, https://doi.org/10.1073/pnas.2529774123, 2026.
Garny, H. and Randel, W. J.: Transport pathways from the Asian monsoon anticyclone to the stratosphere, Atmos. Chem. Phys., 16, 2703–2718, https://doi.org/10.5194/acp-16-2703-2016, 2016.
Haenel, F. J., Stiller, G. P., von Clarmann, T., Funke, B., Eckert, E., Glatthor, N., Grabowski, U., Kellmann, S., Kiefer, M., Linden, A., and Reddmann, T.: Reassessment of MIPAS age of air trends and variability, Atmos. Chem. Phys., 15, 13161–13176, https://doi.org/10.5194/acp-15-13161-2015, 2015.
Han, Y., Tian, W., Chipperfield, M. P., Zhang, J., Wang, F., Sang, W., Luo, J., Feng, W., Chrysanthou, A., and Tian, H.: Attribution of the Hemispheric Asymmetries in Trends of Stratospheric Trace Gases Inferred From Microwave Limb Sounder (MLS) Measurements, J. Geophys. Res.-Atmos., 124, 6283–6293, https://doi.org/10.1029/2018jd029723, 2019.
Hersbach, H., Bell, B., Berrisford, P., Hirahara, S., Horányi, A., Muñoz-Sabater, J., Nicolas, J., Peubey, C., Radu, R., Schepers, D., Simmons, A., Soci, C., Abdalla, S., Abellan, X., Balsamo, G., Bechtold, P., Biavati, G., Bidlot, J., Bonavita, M., Chiara, G. D., Dahlgren, P., Dee, D., Diamantakis, M., Dragani, R., Flemming, J., Forbes, R., Fuentes, M., Geer, A., Haimberger, L., Healy, S., Hogan, R. J., Hólm, E., Janisková, M., Keeley, S., Laloyaux, P., Lopez, P., Lupu, C., Radnoti, G., Rosnay, P. de, Rozum, I., Vamborg, F., Villaume, S., and Thépaut, J.: The ERA5 global reanalysis, Q. J. Roy. Meteor. Soc., 146, 1999–2049, https://doi.org/10.1002/qj.3803, 2020.
Höglund-Isaksson, L., Gmez-Sanabria, A., Klimont, Z., Rafaj, P., and Schpp, W.: Technical potentials and costs for reducing global anthropogenic methane emissions in the 2050 timeframe results from the GAINS model, Environ. Res. Commun., 2, 025004, https://doi.org/10.1088/2515-7620/ab7457, 2020.
Hoffmann, L. and Spang, R.: An assessment of tropopause characteristics of the ERA5 and ERA-Interim meteorological reanalyses, Atmos. Chem. Phys., 22, 4019–4046, https://doi.org/10.5194/acp-22-4019-2022, 2022.
Ivaniha, O., Abalos, M., Calvo, N., Stiller, G. P., Shah, K., and Davis, S.: Stratospheric Subtropical Transport Barriers in CESM1-WACCM and Observations: Climatology, Variability, and Trends, J. Geophys. Res.-Atmos., 131, https://doi.org/10.1029/2025jd045069, 2026.
Loeb, N. G., Doelling, D. R., Wang, H., Su, W., Nguyen, C., Corbett, J. G., Liang, L., Mitrescu, C., Rose, F. G., and Kato, S.: Clouds and the Earth's Radiant Energy System (CERES) Energy Balanced and Filled (EBAF) Top-of-Atmosphere (TOA) Edition 4.0 Data Product, J. Climate, 31, 895–918, https://doi.org/10.1175/jcli-d-17-0208.1, 2017.
Loeb, N. G., Doelling, D. R., Kato, S., Su, W., Mlynczak, P. E., and Wilkins, J. C.: Continuity in Top-of-Atmosphere Earth Radiation Budget Observations, J. Climate, 37, 6093–6108, https://doi.org/10.1175/jcli-d-24-0180.1, 2024.
Mahieu, E., Chipperfield, M. P., Notholt, J., Reddmann, T., Anderson, J., Bernath, P. F., Blumenstock, T., Coffey, M. T., Dhomse, S. S., Feng, W., Franco, B., Froidevaux, L., Griffith, D. W. T., Hannigan, J. W., Hase, F., Hossaini, R., Jones, N. B., Morino, I., Murata, I., Nakajima, H., Palm, M., Paton-Walsh, C., Russell III, J. M., Schneider, M., Servais, C., Smale, D., and Walker, K. A.: Recent Northern Hemisphere stratospheric HCl increase due to atmospheric circulation changes, Nature, 515, 104–107, https://doi.org/10.1038/nature13857, 2014.
Murguia-Flores, F., Arndt, S., Ganesan, A. L., Murray-Tortarolo, G., and Hornibrook, E. R. C.: Soil Methanotrophy Model (MeMo v1.0): a process-based model to quantify global uptake of atmospheric methane by soil, Geosci. Model Dev., 11, 2009–2032, https://doi.org/10.5194/gmd-11-2009-2018, 2018.
Nassar, R., Bernath, P. F., Boone, C. D., Manney, G. L., McLeod, S. D., Rinsland, C. P., Skelton, R., and Walker, K. A.: Stratospheric abundances of water and methane based on ACE-FTS measurements, Geophys. Res. Lett., 32, https://doi.org/10.1029/2005gl022383, 2005.
Orbe, C., Waugh, D. W., and Newman, P. A.: Air-mass origin in the tropical lower stratosphere: The influence of Asian boundary layer air, Geophys. Res. Lett., 42, https://doi.org/10.1002/2015gl063937, 2015.
Pan, L. L., Honomichl, S. B., Kinnison, D. E., Abalos, M., Randel, W. J., Bergman, J. W., and Bian, J.: Transport of chemical tracers from the boundary layer to stratosphere associated with the dynamics of the Asian summer monsoon, J. Geophys. Res.-Atmos., 121, 14159–14174, https://doi.org/10.1002/2016jd025616, 2016.
Pan, L. L., Atlas, E. L., Honomichl, S. B., Smith, W. P., Kinnison, D. E., Solomon, S., Santee, M. L., Saiz-Lopez, A., Laube, J. C., Wang, B., Ueyama, R., Bresch, J. F., Hornbrook, R. S., Apel, E. C., Hills, A. J., Treadaway, V., Smith, K., Schauffler, S., Donnelly, S., Hendershot, R., Lueb, R., Campos, T., Viciani, S., D'Amato, F., Bianchini, G., Barucci, M., Podolske, J. R., Iraci, L. T., Gurganus, C., Bui, P., Dean-Day, J. M., Millán, L., Ryoo, J.-M., Barletta, B., Koo, J.-H., Kim, J., Liang, Q., Randel, W. J., Thornberry, T., and Newman, P. A.: East Asian summer monsoon delivers large abundances of very short-lived organic chlorine substances to the lower stratosphere, P. Natl. Acad. Sci., 121, e2318716121, https://doi.org/10.1073/pnas.2318716121, 2024.
Pan, L. L., Atlas, E. L., Newman, P. A., Thornberry, T., Jucks, K. W., Toon, O. B., Randel, W. J., Liang, Q., Kinnison, D. E., Ueyama, R., Bresch, J. F., Honomichl, S. B., Smith, W. P., Hornbrook, R. S., Ziemba, L., Fujiwara, M., Apel, E. C., Barucci, M., Bianchini, G., Brown, M., Bui, T. P., Campos, T., Chin, M., D'Amato, F., Dean-Day, J., Diskin, G., Franchin, A., Gurganus, C., Iraci, L. T., Kim, J., Koo, J. -H., Lait, L. R., Lesko, K., Podolske, J. R., Rollins, A., Sakai, T., Shiraishi, K., Treadaway, V., Viciani, S., and Waxman, E.: The Asian Summer Monsoon Chemical and Climate Impact Project (ACCLIP): An Overview, J. Geophys. Res.-Atmos., 130, https://doi.org/10.1029/2025jd044417, 2025.
Park, M., Randel, W. J., Kinnison, D. E., Garcia, R. R., and Choi, W.: Seasonal variation of methane, water vapor, and nitrogen oxides near the tropopause: Satellite observations and model simulations, J. Geophys. Res.-Atmos., 109, 302–318, https://doi.org/10.1029/2003jd003706, 2004.
Park, M., Randel, W. J., Gettelman, A., Massie, S. T., and Jiang, J. H.: Transport above the Asian summer monsoon anticyclone inferred from Aura Microwave Limb Sounder tracers, J. Geophys. Res.-Atmos., 112, 309–322, https://doi.org/10.1029/2006jd008294, 2007.
Park, M., Randel, W. J., Emmons, L. K., Bernath, P. F., Walker, K. A., and Boone, C. D.: Chemical isolation in the Asian monsoon anticyclone observed in Atmospheric Chemistry Experiment (ACE-FTS) data, Atmos. Chem. Phys., 8, 757–764, https://doi.org/10.5194/acp-8-757-2008, 2008.
Park, M., Randel, W. J., Kinnison, D. E., Emmons, L. K., Bernath, P. F., Walker, K. A., Boone, C. D., and Livesey, N. J.: Hydrocarbons in the upper troposphere and lower stratosphere observed from ACE-FTS and comparisons with WACCM, J. Geophys. Res.-Atmos., 118, 1964–1980, https://doi.org/10.1029/2012jd018327, 2013.
Patra, P. K., Houweling, S., Krol, M., Bousquet, P., Belikov, D., Bergmann, D., Bian, H., Cameron-Smith, P., Chipperfield, M. P., Corbin, K., Fortems-Cheiney, A., Fraser, A., Gloor, E., Hess, P., Ito, A., Kawa, S. R., Law, R. M., Loh, Z., Maksyutov, S., Meng, L., Palmer, P. I., Prinn, R. G., Rigby, M., Saito, R., and Wilson, C.: TransCom model simulations of CH4 and related species: linking transport, surface flux and chemical loss with CH4 variability in the troposphere and lower stratosphere, Atmos. Chem. Phys., 11, 12813–12837, https://doi.org/10.5194/acp-11-12813-2011, 2011.
Ploeger, F. and Garny, H.: Hemispheric asymmetries in recent changes in the stratospheric circulation, Atmos. Chem. Phys., 22, 5559–5576, https://doi.org/10.5194/acp-22-5559-2022, 2022.
Ploeger, F., Günther, G., Konopka, P., Fueglistaler, S., Müller, R., Hoppe, C., Kunz, A., Spang, R., Grooß, J.-U., and Riese, M.: Horizontal water vapor transport in the lower stratosphere from subtropics to high latitudes during boreal summer, J. Geophys. Res.-Atmos., 118, 8111–8127, https://doi.org/10.1002/jgrd.50636, 2013.
Ploeger, F., Konopka, P., Walker, K., and Riese, M.: Quantifying pollution transport from the Asian monsoon anticyclone into the lower stratosphere, Atmos. Chem. Phys., 17, 7055–7066, https://doi.org/10.5194/acp-17-7055-2017, 2017.
Prignon, M., Chabrillat, S., Friedrich, M., Smale, D., Strahan, S. E., Bernath, P. F., Chipperfield, M. P., Dhomse, S. S., Feng, W., Minganti, D., Servais, C., and Mahieu, E.: Stratospheric Fluorine as a Tracer of Circulation Changes: Comparison Between Infrared Remote-Sensing Observations and Simulations With Five Modern Reanalyses, J. Geophys. Res.-Atmos., 126, https://doi.org/10.1029/2021jd034995, 2021.
Randel, W. J. and Park, M.: Deep convective influence on the Asian summer monsoon anticyclone and associated tracer variability observed with Atmospheric Infrared Sounder (AIRS), J. Geophys. Res.-Atmos., 111, 314–327, https://doi.org/10.1029/2005jd006490, 2006.
Randel, W. J., Park, M., Wu, F., and Livesey, N.: A Large Annual Cycle in Ozone above the Tropical Tropopause Linked to the Brewer–Dobson Circulation, J. Atmos. Sci., 64, 4479–4488, https://doi.org/10.1175/2007JAS2409.1, 2007.
Randel, W. J., Park, M., Emmons, L., Kinnison, D., Bernath, P., Walker, K. A., Boone, C., and Pumphrey, H.: Asian Monsoon Transport of Pollution to the Stratosphere, Science, 328, 611–613, https://doi.org/10.1126/science.1182274, 2010.
Randel, W. J., Moyer, E., Park, M., Jensen, E., Bernath, P., Walker, K., and Boone, C.: Global variations of HDO and ratios in the upper troposphere and lower stratosphere derived from ACE-FTS satellite measurements, J. Geophys. Res.-Atmos., 117, 303–319, https://doi.org/10.1029/2011jd016632, 2012.
Riese, M., Ploeger, F., Rap, A., Vogel, B., Konopka, P., Dameris, M., and Forster, P.: Impact of uncertainties in atmospheric mixing on simulated UTLS composition and related radiative effects, J. Geophys. Res.-Atmos., 117, 305–315, https://doi.org/10.1029/2012jd017751, 2012.
Riese, M., Hoor, P., Rolf, C., Kunkel, D., Vogel, B., Köllner, F., Pöhlker, M., Ploeger, F., Ungermann, J., Woiwode, W., Johansson, S., Bauer, R., Barmpounis, K., Borrmann, S., Brauner, P., Clemens, J., Dragoneas, A., Ekinci, F., Emig, N., Engel, A., Eppers, O., Fadnavis, S., Friedl-Vallon, F., Geldenhuys, M., Günther, G., Grooß, J. U., Hegglin, M. I., Höpfner, M., Jesswein, M., Joppe, P., Kaumanns, J., Kachula, O., Keber, T., Kretschmer, E., Lachnitt, H. C., Lauther, V., Lloyd, P. E., Molleker, S., Müller, R., Neubert, T., Ort, L., Pöschl, U., Pöhlker, C., Rapp, M., Retzlaff, M., Rhode, S., Schneider, J., Schuck, T., Sinnhuber, B.-M., Spelten, N., Strobel, J., Tomsche, L., Turhal, K., Luijt, R. van, Versick, S., Voigt, C., Volk, M., Hobe, M. von, Weyland, F., Zahn, A., Ziereis, H., and Zlotos, L. O.: Long-range transport of polluted Asian summer monsoon air to high latitudes during the PHILEAS campaign in the boreal summer 2023, B. Am. Meteorol. Soc., https://doi.org/10.1175/bams-d-24-0232.1, 2025.
Saunois, M., Stavert, A. R., Poulter, B., Bousquet, P., Canadell, J. G., Jackson, R. B., Raymond, P. A., Dlugokencky, E. J., Houweling, S., Patra, P. K., Ciais, P., Arora, V. K., Bastviken, D., Bergamaschi, P., Blake, D. R., Brailsford, G., Bruhwiler, L., Carlson, K. M., Carrol, M., Castaldi, S., Chandra, N., Crevoisier, C., Crill, P. M., Covey, K., Curry, C. L., Etiope, G., Frankenberg, C., Gedney, N., Hegglin, M. I., Höglund-Isaksson, L., Hugelius, G., Ishizawa, M., Ito, A., Janssens-Maenhout, G., Jensen, K. M., Joos, F., Kleinen, T., Krummel, P. B., Langenfelds, R. L., Laruelle, G. G., Liu, L., Machida, T., Maksyutov, S., McDonald, K. C., McNorton, J., Miller, P. A., Melton, J. R., Morino, I., Müller, J., Murguia-Flores, F., Naik, V., Niwa, Y., Noce, S., O'Doherty, S., Parker, R. J., Peng, C., Peng, S., Peters, G. P., Prigent, C., Prinn, R., Ramonet, M., Regnier, P., Riley, W. J., Rosentreter, J. A., Segers, A., Simpson, I. J., Shi, H., Smith, S. J., Steele, L. P., Thornton, B. F., Tian, H., Tohjima, Y., Tubiello, F. N., Tsuruta, A., Viovy, N., Voulgarakis, A., Weber, T. S., van Weele, M., van der Werf, G. R., Weiss, R. F., Worthy, D., Wunch, D., Yin, Y., Yoshida, Y., Zhang, W., Zhang, Z., Zhao, Y., Zheng, B., Zhu, Q., Zhu, Q., and Zhuang, Q.: The Global Methane Budget 2000–2017, Earth Syst. Sci. Data, 12, 1561–1623, https://doi.org/10.5194/essd-12-1561-2020, 2020.
Saunois, M., Martinez, A., Poulter, B., Zhang, Z., Raymond, P. A., Regnier, P., Canadell, J. G., Jackson, R. B., Patra, P. K., Bousquet, P., Ciais, P., Dlugokencky, E. J., Lan, X., Allen, G. H., Bastviken, D., Beerling, D. J., Belikov, D. A., Blake, D. R., Castaldi, S., Crippa, M., Deemer, B. R., Dennison, F., Etiope, G., Gedney, N., Höglund-Isaksson, L., Holgerson, M. A., Hopcroft, P. O., Hugelius, G., Ito, A., Jain, A. K., Janardanan, R., Johnson, M. S., Kleinen, T., Krummel, P. B., Lauerwald, R., Li, T., Liu, X., McDonald, K. C., Melton, J. R., Mühle, J., Müller, J., Murguia-Flores, F., Niwa, Y., Noce, S., Pan, S., Parker, R. J., Peng, C., Ramonet, M., Riley, W. J., Rocher-Ros, G., Rosentreter, J. A., Sasakawa, M., Segers, A., Smith, S. J., Stanley, E. H., Thanwerdas, J., Tian, H., Tsuruta, A., Tubiello, F. N., Weber, T. S., van der Werf, G. R., Worthy, D. E. J., Xi, Y., Yoshida, Y., Zhang, W., Zheng, B., Zhu, Q., Zhu, Q., and Zhuang, Q.: Global Methane Budget 2000–2020, Earth Syst. Sci. Data, 17, 1873–1958, https://doi.org/10.5194/essd-17-1873-2025, 2025.
Schmidt, M., Bernath, P., Boone, C., Lecours, M., and Steffen, J.: Trends in atmospheric composition between 2004–2023 using version 5 ACE-FTS data, J. Quant. Spectrosc. Ra., 325, 109088, https://doi.org/10.1016/j.jqsrt.2024.109088, 2024.
Sheese, P. E., Walker, K. A., Boone, C. D., and Plummer, D. A.: Quantifying the sources of increasing stratospheric water vapour concentrations, Atmos. Chem. Phys., 25, 5199–5213, https://doi.org/10.5194/acp-25-5199-2025, 2025.
SPARC/IO3C/GAW: SPARC/IO3C/GAW Report on Long-term Ozone Trends and Uncertainties in the Stratosphere, SPARC Report No. 9, GAW Report No. 241, WCRP-17/2018, SPARC, https://doi.org/10.17874/f899e57a20b, 2019.
Stiller, G. P., Fierli, F., Ploeger, F., Cagnazzo, C., Funke, B., Haenel, F. J., Reddmann, T., Riese, M., and von Clarmann, T.: Shift of subtropical transport barriers explains observed hemispheric asymmetry of decadal trends of age of air, Atmos. Chem. Phys., 17, 11177–11192, https://doi.org/10.5194/acp-17-11177-2017, 2017.
Strahan, S. E., Smale, D., Douglass, A. R., Blumenstock, T., Hannigan, J. W., Hase, F., Jones, N. B., Mahieu, E., Notholt, J., Oman, L. D., Ortega, I., Palm, M., Prignon, M., Robinson, J., Schneider, M., Sussmann, R., and Velazco, V. A.: Observed Hemispheric Asymmetry in Stratospheric Transport Trends From 1994 to 2018, Geophys. Res. Lett., 47, https://doi.org/10.1029/2020gl088567, 2020.
Subramanian, R., Thompson, R. L., Vojta, M., Schneising, O., and Stohl, A.: Strong monsoon influence on South Asian methane emissions in 2020 revealed by a Bayesian inversion constrained by satellite observations, Atmos. Chem. Phys., 26, 9757–9777, https://doi.org/10.5194/acp-26-9757-2026, 2026.
van der Werf, G. R., Randerson, J. T., Giglio, L., van Leeuwen, T. T., Chen, Y., Rogers, B. M., Mu, M., van Marle, M. J. E., Morton, D. C., Collatz, G. J., Yokelson, R. J., and Kasibhatla, P. S.: Global fire emissions estimates during 1997–2016, Earth Syst. Sci. Data, 9, 697–720, https://doi.org/10.5194/essd-9-697-2017, 2017.
Vogel, B., Günther, G., Müller, R., Grooß, J.-U., Hoor, P., Krämer, M., Müller, S., Zahn, A., and Riese, M.: Fast transport from Southeast Asia boundary layer sources to northern Europe: rapid uplift in typhoons and eastward eddy shedding of the Asian monsoon anticyclone, Atmos. Chem. Phys., 14, 12745–12762, https://doi.org/10.5194/acp-14-12745-2014, 2014.
Vogel, B., Günther, G., Müller, R., Grooß, J.-U., and Riese, M.: Impact of different Asian source regions on the composition of the Asian monsoon anticyclone and of the extratropical lowermost stratosphere, Atmos. Chem. Phys., 15, 13699–13716, https://doi.org/10.5194/acp-15-13699-2015, 2015.
Vogel, B., Müller, R., Günther, G., Spang, R., Hanumanthu, S., Li, D., Riese, M., and Stiller, G. P.: Lagrangian simulations of the transport of young air masses to the top of the Asian monsoon anticyclone and into the tropical pipe, Atmos. Chem. Phys., 19, 6007–6034, https://doi.org/10.5194/acp-19-6007-2019, 2019.
Vogel, B., Lauther, V., Köllner, F., Ekinci, F., Rolf, C., Strobel, J., van Luijt, R., Volk, C. M., Borrmann, S., Dragoneas, A., Eppers, O., Molleker, S., Hoor, P., Ort, L., Weyland, F., Zahn, A., Clemens, J., Günther, G., Kachula, O., Müller, R., Ploeger, F., and Riese, M.: Continental and marine source regions contributing to the outflow of the Asian summer monsoon anticyclone during the PHILEAS campaign in summer 2023, Atmos. Chem. Phys., 26, 6283–6319, https://doi.org/10.5194/acp-26-6283-2026, 2026.
von Hobe, M., Ploeger, F., Konopka, P., Kloss, C., Ulanowski, A., Yushkov, V., Ravegnani, F., Volk, C. M., Pan, L. L., Honomichl, S. B., Tilmes, S., Kinnison, D. E., Garcia, R. R., and Wright, J. S.: Upward transport into and within the Asian monsoon anticyclone as inferred from StratoClim trace gas observations, Atmos. Chem. Phys., 21, 1267–1285, https://doi.org/10.5194/acp-21-1267-2021, 2021.
Waters, J. W., Froidevaux, L., Harwood, R. S., Jarnot, R. F., Pickett, H. M., Read, W. G., Siegel, P. H., Cofield, R. E., Filipiak, M. J., Flower, D. A., Holden, J. R., Lau, G. K., Livesey, N. J., Manney, G. L., Pumphrey, H. C., Santee, M. L., Wu, D. L., Cuddy, D. T., Lay, R. R., Loo, M. S., Perun, V. S., Schwartz, M. J., Stek, P. C., Thurstans, R. P., Boyles, M. A., Chandra, K. M., Chavez, M. C., Chen, G.-S., Chudasama, B. V., Dodge, R., Fuller, R. A., Girard, M. A., Jiang, J. H., Jiang, Y., Knosp, B. W., LaBelle, R. C., Lam, J. C., Lee, K. A., Miller, D., Oswald, J. E., Patel, N. C., Pukala, D. M., Quintero, O., Scaff, D. M., Snyder, W. V., Tope, M. C., Wagner, P. A., and Walch, M. J.: The Earth Observing System Microwave Limb Sounder (EOS MLS) on the Aura Satellite, IEEE T. Geosci. Remote Sens., 44, 1075–1092, https://doi.org/10.1109/tgrs.2006.873771, 2006.
Weber, T., Wiseman, N. A., and Kock, A.: Global ocean methane emissions dominated by shallow coastal waters, Nat. Commun., 10, 4584, https://doi.org/10.1038/s41467-019-12541-7, 2019.
Xiong, X., Houweling, S., Wei, J., Maddy, E., Sun, F., and Barnet, C.: Methane plume over south Asia during the monsoon season: satellite observation and model simulation, Atmos. Chem. Phys., 9, 783–794, https://doi.org/10.5194/acp-9-783-2009, 2009.
Yi, Y., Cai, Z., Liu, Y., Tao, M., Fang, S., Yang, D., Bai, Z., Liang, M., Yao, B., Bian, J., Honomichl, S. B., Randel, W. J., and Pan, L. L.: AirCore Observations at Northern Tibetan Plateau During the Asian Summer Monsoon, Geophys. Res. Lett., 51, 256–265, https://doi.org/10.1029/2024gl109256, 2024.
Yi, Y., Cai, Z., Liu, Y., Fang, S., Liang, M., Tao, M., Yang, D., Yao, B., Bai, Z., and Bian, J.: Observation of CH4, CO and N2O in the upper troposphere and lower stratosphere over the Qinghai–Tibet Plateau, Environ. Res. Lett., 21, 034009, https://doi.org/10.1088/1748-9326/ae34cd, 2026.
Yu, X., Millet, D. B., Henze, D. K., Turner, A. J., Delgado, A. L., Bloom, A. A., and Sheng, J.: A high-resolution satellite-based map of global methane emissions reveals missing wetland, fossil fuel, and monsoon sources, Atmos. Chem. Phys., 23, 3325–3346, https://doi.org/10.5194/acp-23-3325-2023, 2023.
Zeng, Z.-C., Byrne, B., Gong, F.-Y., He, Z., and Lei, L.: Correlation between paddy rice growth and satellite-observed methane column abundance does not imply causation, Nat. Commun., 12, 1163, https://doi.org/10.1038/s41467-021-21434-7, 2021.