
the Creative Commons Attribution 4.0 License.
the Creative Commons Attribution 4.0 License.
 | 11 Nov 2026
Measurement report: Size-resolved seasonal study of inorganic ions and isotopic carbon signatures of aerosol particles at the Wadden Sea
Katrin Zenker
Peter Redl
Anne Kasper-Giebl
Ulrike Dusek

Measurements of aerosol size-resolved chemical composition and source contribution of carbonaceous aerosols provide a unique opportunity to characterize continental outflow over the sea. Studies at coastal sites usually show an interesting mix of continental and marine aerosol sources. However, few data exist on the size dependence of the aerosol chemical composition and isotopic source apportionment of organic carbon (OC). This study investigates differences in aerosol composition among size-dependent samples collected in different seasons and wind sectors. It also highlights isotope measurements as a tool to study sources and atmospheric processing of OC. Size-resolved measurements of inorganic ions, levoglucosan, and total carbon (TC) were combined with 13C and 14C analysis of OC at different desorption temperatures, which allows to investigate subgroups like secondary organic aerosol (SOA) and aged organic aerosol. The land-sector samples are dominated by nitrate, ammonium, and TC, while sulfate and TC dominated the single sea-sector sample set. Sulfate reached 0.5 µg m−3 in both sea-sector and land-sector samples, indicating a possible contribution from ship-emissions. Fossil OC fractions were highest in particles <250 nm, characteristic for combustion-related traffic emissions. -ratios of ambient OC deviate strongly from expected signatures of primary sources and indicate SOA contribution to more volatile carbon and smaller particles. The -ratios of less volatile OC at larger sizes are consistent with a significant influence of photochemical processing. The results indicate shipping emissions as a possible important contributor to sulfate aerosols in sea-influenced samples and demonstrate the highly processed nature of OC in the European continental outflow.
- Article
(7421 KB) - Full-text XML
- BibTeX
- EndNote


Particulate matter (PM) has a significant impact on human health (e.g. Nel, 2005; Pope and Dockery, 2006) and the global climate (e.g. Boucher et al., 2013; Myhre et al., 2013), due to scattering and absorption of solar radiation. The full extent of this influence is still not yet completely understood, but it is certain, that the size of the airborne particles and their chemical composition play an important role. The size of the particles determines, whether and where particles are deposited in the lung and whether they can enter the blood stream (Pöschl, 2005). Scattering or absorption coefficients of ambient aerosol particles, also depend crucially on their size and chemical composition.
The size and chemical composition of aerosol particles depend on their sources and on transformation processes in the atmosphere. In order to improve e.g. climate models and allow policy makers to develop mitigation strategies for a better air quality, the knowledge about the sources and transformation mechanism of aerosols needs to be improved.
Previous studies showed that in the Netherlands the aerosol chemical composition is dominated by secondary inorganic aerosol (Weijers et al., 2011), which is the sum of sulfate, nitrate and ammonium. The second largest contribution is from carbonaceous constituents and the most important natural source is sea salt.
In general, in Europe the carbonaceous aerosol fraction takes up 30 % to 60 % of PM2.5, i.e. particulate matter with an aerodynamic diameter of smaller than 2.5 µm (e.g. Pöschl, 2005; Fuzzi et al., 2015; Putaud et al., 2004). The total carbon (TC) content of aerosol is usually operationally divided into organic carbon (OC) and elemental carbon (EC) (TC = OC + EC). EC is produced from primary sources during incomplete combustion and is in general inert in the atmosphere. OC is also directly emitted by incomplete combustion and other processes, like cooking, or biogenic activity in the form of e.g. pollen fragments. In addition to these primary sources, secondary organic carbon (SOC) is formed from the oxidation of precursor gases and condenses on pre-existing particles. Contrary to elemental carbon, OC is not inert and its chemical composition is continuously changed by transformation mechanisms in the atmosphere.
Analysis of the carbon isotopes 13C and 14C can give insights into sources and atmospheric chemistry of carbonaceous aerosols (e.g. Szidat et al., 2006; Dusek et al., 2017; Masalaite et al., 2020; Ni et al., 2022). Since 14C has decayed in fossil fuels (Schuur et al., 2016), but is present at a typical contemporary ratio in living biomass, it allows to apportion fossil (14C free) or non-fossil carbon sources for carbonaceous aerosols. The radiocarbon isotopic composition of organic aerosol is not significantly influenced by atmospheric transformation processes. The -ratios of EC and OC also gives an insight into aerosol sources, e.g. enabling to distinguish between C3 and C4 plant types of sources (O'Leary, 1988; Vernooij et al., 2022), but in many regions, including Western Europe, 13C alone is not suitable for source apportionment, because the different source signatures are overlapping (e.g. Martinsson et al., 2017). Nonetheless, the measurement of the 13C isotopic signature of organic aerosol facilitates the characterisation of atmospheric transformation mechanism, as ratios are changed by chemical reactions (e.g. Kirillova et al., 2013; Gensch et al., 2014; Huang et al., 2006).
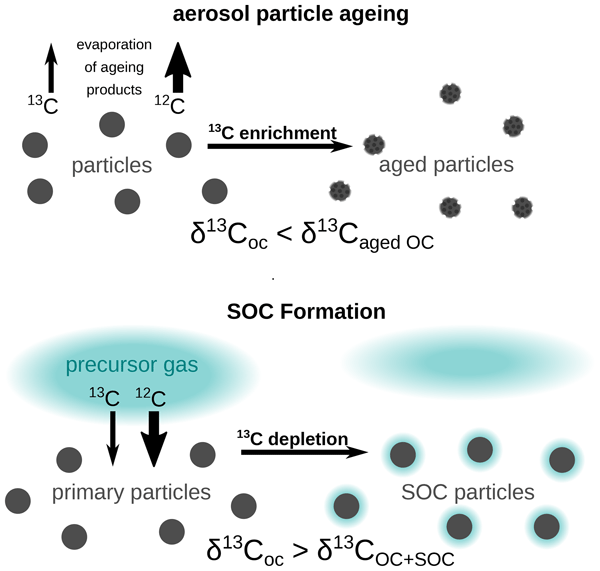
During the formation of secondary organic aerosol (SOA) from precursor volatile organic carbon (VOC), 12C reacts preferentially due to the kinetic isotope effect. The reaction products are therefore expected to be depleted in 13C compared to the precursor gas, if it is not completely consumed. In this case, the ratio in the SOA will be less than in the precursor gas (and usually also the primary OA) and the condensing SOA gradually leads to lower ratio of the overall OC. Since condensing organic vapors will contribute relatively more mass to smaller particle, this effect should be more noticeable at smaller particle sizes.
In the presented study the 13C of organic carbonaceous aerosol was analyzed at three different temperature steps (200, 350, 650 °C), which reflect different volatility fractions of OC-species (Zenker et al., 2020). More volatile OC, associated with freshly emitted primary fossil fuel burning aerosol or newly formed SOA, tends to be evolved from the filter at lower temperature and more thermally stable OC desorbs at higher temperature (Masalaite et al., 2018; Holzinger et al., 2013). Higher thermal stability of organic carbon is often observed after the aerosol is transformed by photochemical or aqueous-phase processes (Masalaite et al., 2017; Ni et al., 2022). These processes, also known as aerosol aging, result in more oxidized and therefore more thermally stable aerosol (Donahue et al., 2009; Holzinger et al., 2013). Considering the particle size distribution, primary anthropogenic combustion sources emit preferentially smaller particles (D50<0.18 µm; Masalaite et al., 2018). On the other hand, aerosol aging is more relevant for larger particles, in the size range of accumulation mode, due to their longer residence time in the atmosphere, which gives transformation processes more time to alter the aerosol (Cubison et al., 2006). Local combustion sources are therefore primarily reflected in the composition of the smaller primary aerosol particles. Sources further away are associated with the long range transport of aerosol, and are therefore displayed at larger particle sizes, which are additionally affected by aging processes.
For the process of photochemical aging it is postulated (e.g. Ni et al., 2022; Masalaite et al., 2020), that OC in the particle becomes gradually enriched in 13C compared to the original particle composition. This is caused by the gradual volatilization of OC, which proceeds faster for 12C containing compounds, because molecular bonds involving 12C are more easily broken. This results in a net loss of the isotopically lighter carbon 12C in the particle. If the particle is only partially oxidized, the remaining OC in the particle is enriched in 13C compared to OC of the original particle.
This study presents results for the mass concentrations of inorganic ions and total carbon, and the carbon isotope ratios and of organic carbon for size-resolved fine aerosol particles. While bulk chemical composition is measured routinely at many European sites, size resolved chemical composition data are much more rare, especially combined with isotope source apportionment of the organic aerosol. This allows more detailed insights into the inorganic and organic chemistry of various size aerosol fractions and related atmospheric transformation mechanisms. Results are based on a year-long sampling campaign, which makes it possible to investigate seasonal variations. The special set-up of the sampling campaign allows to investigate aerosol from the North Sea and aerosol, that is originating from the land and advecting to the sea. This aerosol can probably change the radiation budget of the sea surface as the particle absorb or reflect light. The sampling location very close to the sea is in general of significance, as many aerosol studies are available for continental and urban sites, but much less data exist for coastal sites (Chesselet et al., 1981; Ceburnis et al., 2011; Turšič et al., 2006).
The objective of this study was to characterize the seasonal, air mass and size dependent variation of the aerosol chemical composition and related atmospheric transformation processes at a site close to the Wadden Sea in the Netherlands.
2.1 Sampling and filter handling
A year-long seasonal sampling campaign was conducted during 2015/16 to collect size-resolved aerosol samples at the Lutjewad atmospheric measurement station located directly behind the dyke at the Wadden Sea in the Netherlands. The sampling equipment has been set up on a scaffold at about 10.5 m, which is higher than the dyke (see Fig. A1 in the Appendix). The sampling equipment consisted of a custom-made setup with two impactors (MSP-model 130-HFI) and a weather station.
The impactor setup is shown in Fig. 1. The two impactors are connected to the sampling pump via two controllable solenoid 3-way valves. At any given time either one of the impactors is sampling or the air is flowing through a bypass directly to the pump. The setting of the valves is controlled by a customised LabVIEW program, so that each impactor samples only from a given (custom-defined) wind sector. If air is coming from outside the wind sectors, neither impactor is sampling. Sampling will also only start when the wind velocity is above 2 m s−1 to avoid baffling wind.
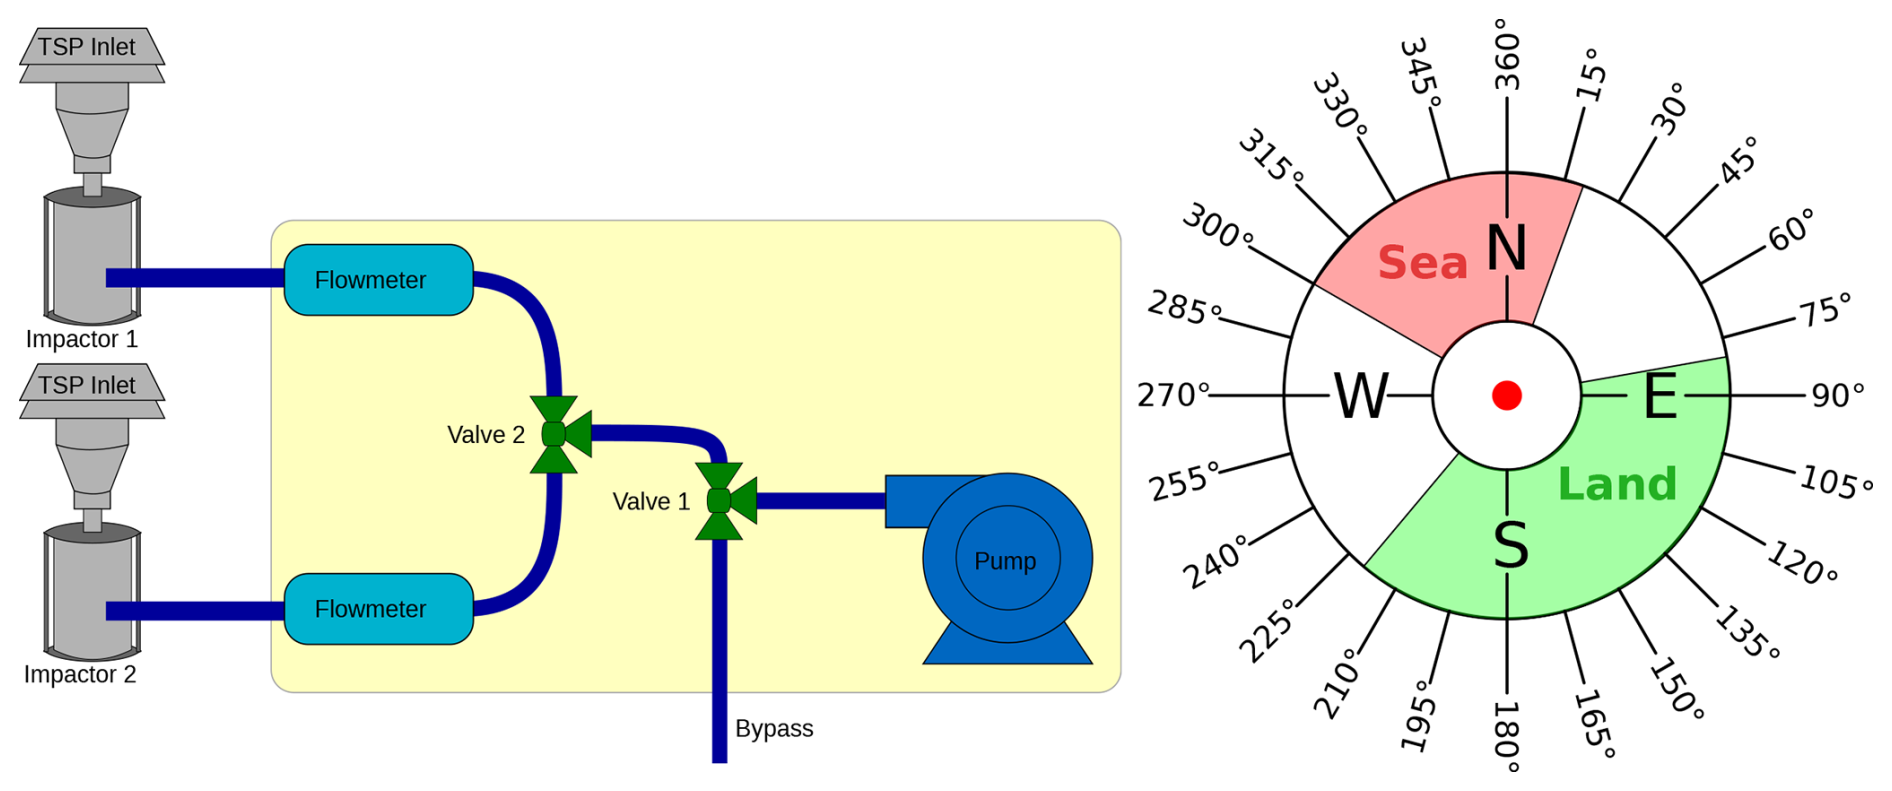
Figure 1Sampling Setup: An outline of the wind direction selective sampling setup with two impactors is shown on the left. The impactors are equipped with a TSP (total suspended particulates) inlet. The flow meters, valves and the pump are in a weather-proof housing (yellow box). The right indicates an example of wind sectors for impactor 1 and 2, e.g. impactor 1 would collect aerosol particles only from “Land” wind directions, impactor 2 only from “Sea” wind directions. If the wind comes from neither sector, the pump samples from the bypass via valve 1.
The location directly at the Wadden Sea made it possible to collect aerosol from a “land” sector (E–SSW) on one impactor and aerosol from the “sea” sector (WSW–NE) on the other. The land sector is mostly influenced by sources in continental Europe including possible transformation processes during long-range transport. This type of aerosol is of special interest, as it will be advected in the direction of the ocean and influence the radiative forcing over the North Sea (Jayaraman et al., 1998). On the other hand the air from the sea sector is likely much cleaner (Fitzgerald, 1991; Ceburnis et al., 2011) and is mainly influenced by marine aerosol or regional sources, e.g. ship emissions from the highly frequented English Channel (Matthias et al., 2010). In addition 72 h back-trajectories were calculated using the HYSPLIT trajectory model (Stein et al., 2015; Rolph et al., 2017) (see Figs. 3 and A3) with a time resolution of one hour and an arrival altitude of 50 m a.g.l. (meter above ground level) for the sampling periods of each impactor.
The high flow cascade impactor had an inlet flow rate of 100 L min−1 and consists of five stages and a back-up filter. It allows sampling in the following aerodynamic particle size ranges: 1.4–2.5, 0.77–1.4, 0.44–0.77, 0.25–0.44, 0–0.25 µm. To convert the measured concentrations to mass size distributions , we assume a lower cut-off size of 0.05 µm for the back-up filter, as the contribution of particles below that size to the measured mass is negligible (Ni et al., 2022). In this study, quartz fibre filters (75 and 90 mm (back-up filter); Pallflex membrane filters, type Tissuquartz 2500QUAT-UP) were used as impaction substrates, which required customization of the distance ring for the last two impactor stages to compensate for the increased filter thickness compared to conventional aluminum foil. The quartz fibre filters were pre-cleaned at 650 °C for two hours and stored in the freezer at about −18 °C, before using them for sampling. After removing the filter samples from the impactor, they were wrapped in pre-cleaned (2 h, 550 °C) aluminum foils and stored in sealed polyethylene bags at about −18 °C in the freezer until analysis. Every part of equipment that came into contact with the samples, including impaction plates and tweezers etc., was first cleaned with acetone, then with ethanol and afterwards air-dried.
The filter sampling was conducted during each season of the year for at least one month, allowing for the collection of at least two complete sets of filter samples per season. A complete set of samples consists of one impactor filter for each particle size range from both the sea and the land wind sector. During the collection period the impactors were left in the sampling setup for approximately two weeks. If sampling took place with the specific sea-sector or land-sector impactor depended on the wind directions during this time period. Table 1 shows the collection periods (11–18 d) in the different seasons for the filter sets from this study. The sampling time per impactor varied between two and eleven days, depending on time periods with wind from a certain sector. At the end of each part of the sampling campaign, i.e. for each season, a complete set of impactor filter samples was left in the impactor in the sampling setup for approximately two weeks without the pump running. This filter set represents the sampling blank.
Table 1Overview of filter samples: start and end dates are the times when the impactors are set up, not actually the start or end of sampling.
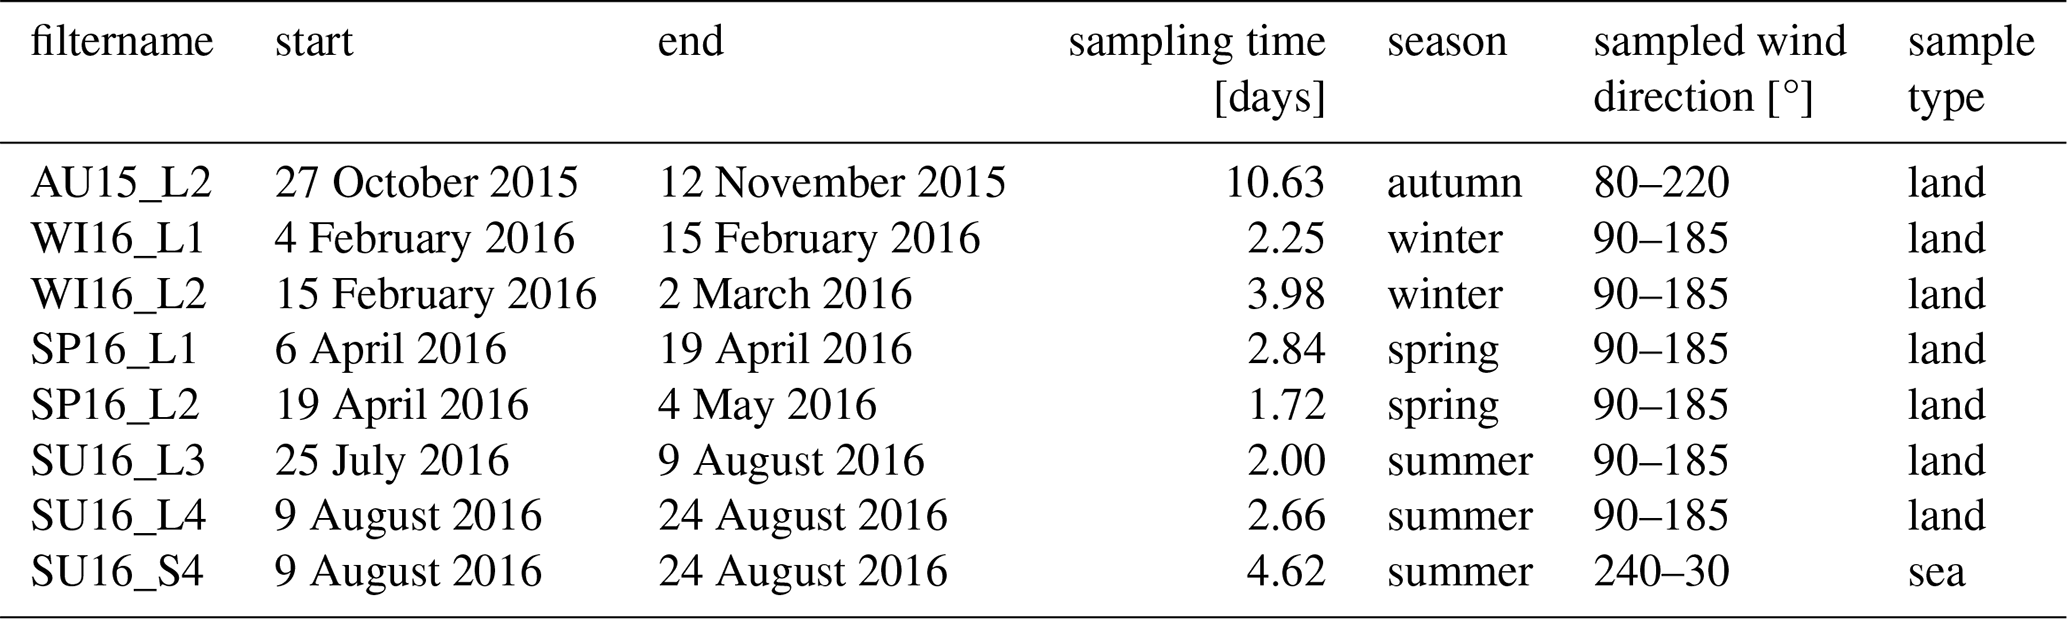
Filter samples for this measurement report were selected mainly according to the possibility of performing all the planned measurements, i.e. analyses of ions and levoglucosan, measurement of total carbon concentrations and isotopic analysis of organic carbon. Unfortunately only one sample from the sea wind sector could be analyzed, as the others did not contain enough particle mass. TC measurements and isotopic analyses were performed at the Centre for Isotope Research, University of Groningen in the Netherlands, while analyses of ions and levoglucosan were conducted at the Research Group Environmental Analytics, Institute of Chemical Technologies and Analytics, TU Wien in Austria. Depending on the TC mass of the impactor filter samples, aliquots were taken and sent to Vienna. Approximately one eighth of the filter sample area was cut for the land-sector filter sets and one quarter was taken for the sea-sector filter set. Each sample aliquot was separately wrapped in pre-cleaned aluminum foil and packed in sealed polyethylene bags. The parcel containing the aliquots was sent to Vienna by express post with an ice pack.
Due to the limitations in the available particle mass for this measurement study only a small number of filter sets could be analyzed for the different seasons of the year, see Table 1. The statements in the discussion section of this publication should therefore be interpreted as indications rather than as a comprehensive characterization of seasonal conditions or the study region.
2.2 Analyses of ions and levoglucosan
Determination of anions (Cl−, NO, NO, SO), cations (Na+, NH, K+, Ca2+, Mg2+) and levoglucosan was performed with ion chromatography. For analyses of ions, sample aliquots were extracted with 3 mL ultrapure water and ultrasonic agitation, followed by centrifugation. Analyses of anions was done with a Dionex ICS1100 system (Thermo Fisher Scientific Inc.) using AS22 and AG22 columns, a self-regenerating suppressor and conductivity detection. The eluent was 4.5 mM Na2CO3 1.4 mM NaHCO3, at a flow rate of 1 mL min−1. Cations were analyzed with a Dionex Aquion system (Thermo Fisher Scientific Inc.) equipped with CS16 and CG16 columns, a self-regenerating suppressor and a conductivity detector. The eluent was 38 mM methanesulfonic acid at an eluent flow of 1 mL min−1. Calibration was done with external standards, prepared from Merck stock solutions. Detection limits were at 0.01 µg mL−1 for all ions. Levoglucosan was determined via anion-exchange chromatography and pulsed amperometric detection (HPAE-PAD) with an Dionex ICS3000 system using a CarboPacMA1 as an analytical and a guard column. Gradient elution was done with sodium hydroxide, using concentrations of 480–650 mM at a flow rate of 0.4 mL min−1. Detection limit was at 0.015 µg mL−1 for levoglucosan.
2.3 Measurement of total carbon concentrations
The total carbon concentration of the size-resolved aerosol filter samples was determined with a commercial thermo-optical OC-EC analyzer (Sunset Laboratory Inc., Model 5L). The samples were analyzed with a custom TC protocol, that combusts the sample in a mixture of helium and 2 % oxygen for 5.5 min at a temperature of 870 °C. The limit of detection for the measurement of carbon concentrations is given by the manufacturer of the OC-EC analyzer as 0.2 µg cm−2. The measured total carbon concentrations have been corrected for the instrument blank and the sampling blank. The instrument blank was measured daily and sample concentrations were corrected using the instrument blank determined on the corresponding measurement day. The instrument blank for this study was on average 0.27 µg cm−2 with a standard deviation of 0.15 µg cm−2 (n = 58). The sampling blanks were analyzed with the EUSAAR_2 protocol (Cavalli et al., 2010) and contained only organic carbon with an average concentration of 0.69 µg cm−2 with a standard deviation of 0.24 µg cm−2 (n = 18).
OC/EC analysis of the impactor filter samples was not possible due to the inhomogeneous deposits on the impactor samples.
2.4 Measurement of δ(13C) signatures
The stable carbon isotope ratio R() of OC in a sample is given in the delta notation, which is defined as follows:
The reference is the international Vienna Pee Dee Belemnite (VPDB) standard and delta values are expressed in ‰. In the following text δ(13C) is used as the short form of δ(, sample reference).
A detailed description of the setup and the measurement procedure is given in Zenker et al. (2020). Briefly, measurements of δ(13C) values are conducted with a system that combines a OC-EC analyzer (Sunset Laboratory Inc., Model 5L), where OC is converted to CO2, with a continuous flow isotope ratio mass spectrometer (IRMS) (Micromass now Isoprime, model Optima). The interface between these two instruments serves to collect, purify and concentrate the extracted CO2 from the aerosol filter samples. In the Sunset oven the organic carbon is desorbed in helium carrier gas at three different temperature steps (200, 350, 650 °C). The manganese dioxide (MnO2) catalyst in the Sunset OC-EC analyzer ensures the complete oxidation of the carbon released during the different desorption steps to CO2.
Thermal desorption for the δ(13C) analysis is performed in an inert helium atmosphere, where OC charring can occur and the resulting charred carbon is not included in the subsequent isotope analysis. Previous studies have estimated that this does not strongly alter the δ(13C) signature (Dusek et al., 2013; Zenker et al., 2020; Yao et al., 2022b).
For the analysis of the coastal filter samples, the system described by Zenker et al. (2020) was updated to include a reduction oven, which is installed downstream of the Sunset OC-EC analyzer. This oven contains copper and silver to remove traces of oxygen, nitrogen oxides and halogens at a temperature of 600 °C. This treatment was found to significantly improve the repeatability of the filter samples from this coastal location, but is usually not necessary for filters from other locations.
δ(13C) values were calculated with respect to two reference gas peaks, measured before and after the sample peak. If these two values differ by more than 1 ‰, this certain measurement is rejected from further analysis. δ(13C) values calculated with respect to the first reference peak are presented in this study. δ(13C) signatures are calibrated using a two-point linear scale correction based on two different reference materials, which are measured every day. The linear scale correction uses a weekly average of these reference materials and is applied to all samples measured in the respective week. These two in-house reference materials are both caffeines and one of them is enriched in 13C. Their nominal δ(13C) values are −38.2 ‰ and 0.61 ‰. A third international reference material is analyzed every day and is used for quality control. This internationally agreed upon secondary reference material is L-Valine (Schimmelmann et al., 2016) and has a reference value of ‰, which is in the range of the expected δ(13C) values of aerosol particle samples. The average δ(13C) value of the measured L-Valine reference for a time span of about two years is −24.07 ‰ and the standard deviation amounts to 0.22 ‰. This is an indicator for the precision and the uncertainty of the δ(13C) values presented in this work.
2.5 Measurement of the fraction modern of carbon (F(14C))
The radiocarbon isotopic composition of an aerosol filter sample is reported as fraction modern (F(14C)) according to the nomenclature established by Reimer et al. (2004):
Hereby the ratio of the sample is given in relation to the ratio of the standard (oxalic acid, OxII). The factor 0.7459 converts the ratio of OxII to the value defined by international agreement as representative for an unperturbed atmosphere in the year 1950. The ratio of both the sample and the standard are normalized to a δ(13C) of −25 ‰. In the following text F(14C) is used as the short form of F(, sample OxII).
In this study F(14C) of organic carbon is presented. The combustion, extraction and conversion to CO2 was done using the Automated Aerosol Combustion (AAC) system described in Dusek et al. (2019). Briefly, the aerosol filter sample was combusted in pure oxygen at 375 °C for 8 min. The separation of CO2 from other interfering gases (e.g. SO2, NOx, H2O or halogens) is done with the help of a reduction oven containing copper and silver, and two water traps. Until analysis the CO2 is stored in evacuated flame sealed glass tubes.
For the F(14C) analysis, extraction at 375 °C in pure oxygen extracts approximately 80 % of the organic carbon as defined by thermal-optical analysis, with the most refractory OC omitted due to potential overlap with EC. However, the use of oxygen largely prevents charring, and the less refractory carbon fractions are extracted with an efficiency close to 100 %.
For radiocarbon measurement the CO2 is transferred via the gas inlet system to the ion source of the Mini Carbon Dating System (MICADAS). This accelerator mass spectrometer is described in more detail in Synal et al. (2007). The F(14C) values are corrected for the memory effect, the instrument background is subtracted and finally all values are normalized to the average of the oxalic acid (OxII) gaseous standard, which are analyzed in every batch (Wacker et al., 2010). Furthermore secondary standards are analyzed alongside the unknown samples, which serve as a control of the measurement and data correction (Aerts-Bijma et al., 2021).
To correct for the contamination introduced during combustion in the AAC, small amounts of standard material undergo the same process of combustion and radiocarbon measurement. Here OxII serves for the determination of the fossil contamination and a 14C free background wood standard serves to determine the modern contamination.
3.1 Chromatographic analysis and total carbon concentrations
Figure 2 shows an overview of the mass size distributions of all analyzed chemical constituents: inorganic ions, levoglucosan and total carbon. The different icons indicate a specific set of impactor filters and the different colors characterize a specific season of the year (winter – blue, spring – green, summer – red, autumn – gray; exception: yellow – summer, sample type “sea”; also consider Table 1).
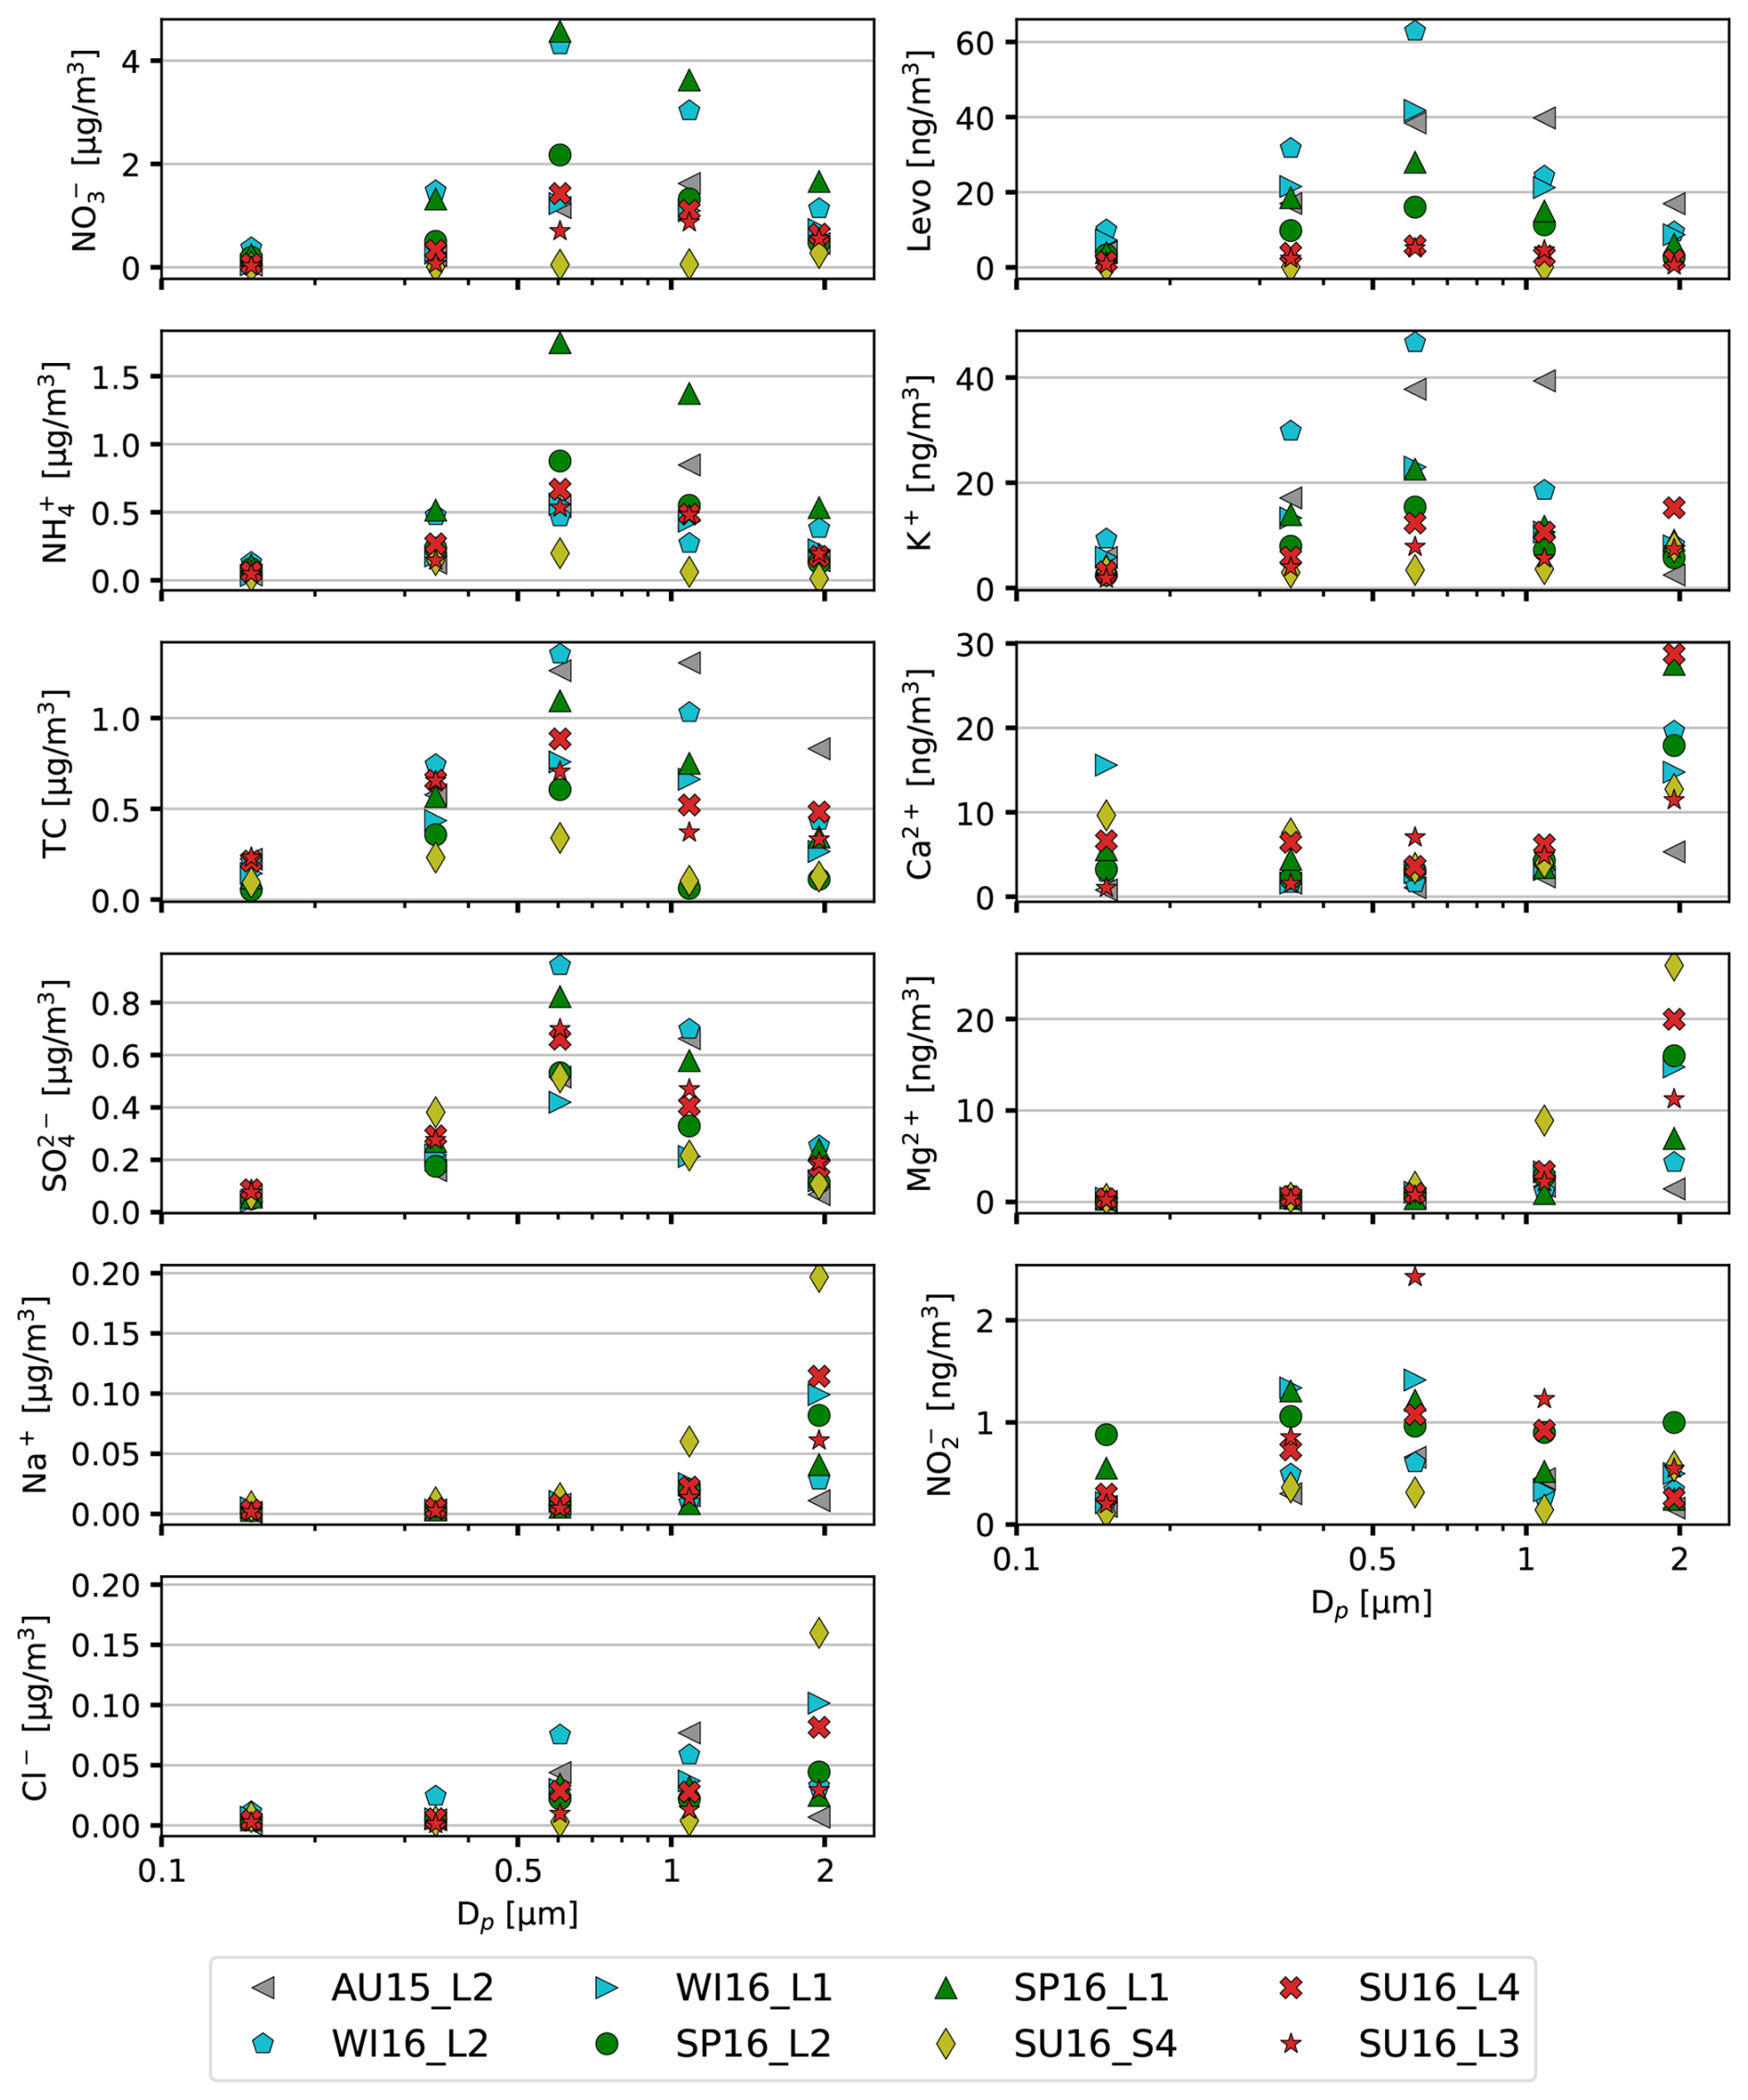
Figure 2Mass size distributions of TC and inorganic ions (): The shown impactor filter samples are collected in different seasons of the year. The color coding is as follows: winter – blue, spring – green, summer – red, autumn – gray; exception: yellow – summer, sample type “sea”; cf. Fig. A2 for concentrations in mol m−3; also consider Table 1; accompanying dataset is available at https://doi.org/10.5281/zenodo.19990975 (Zenker et al., 2026).
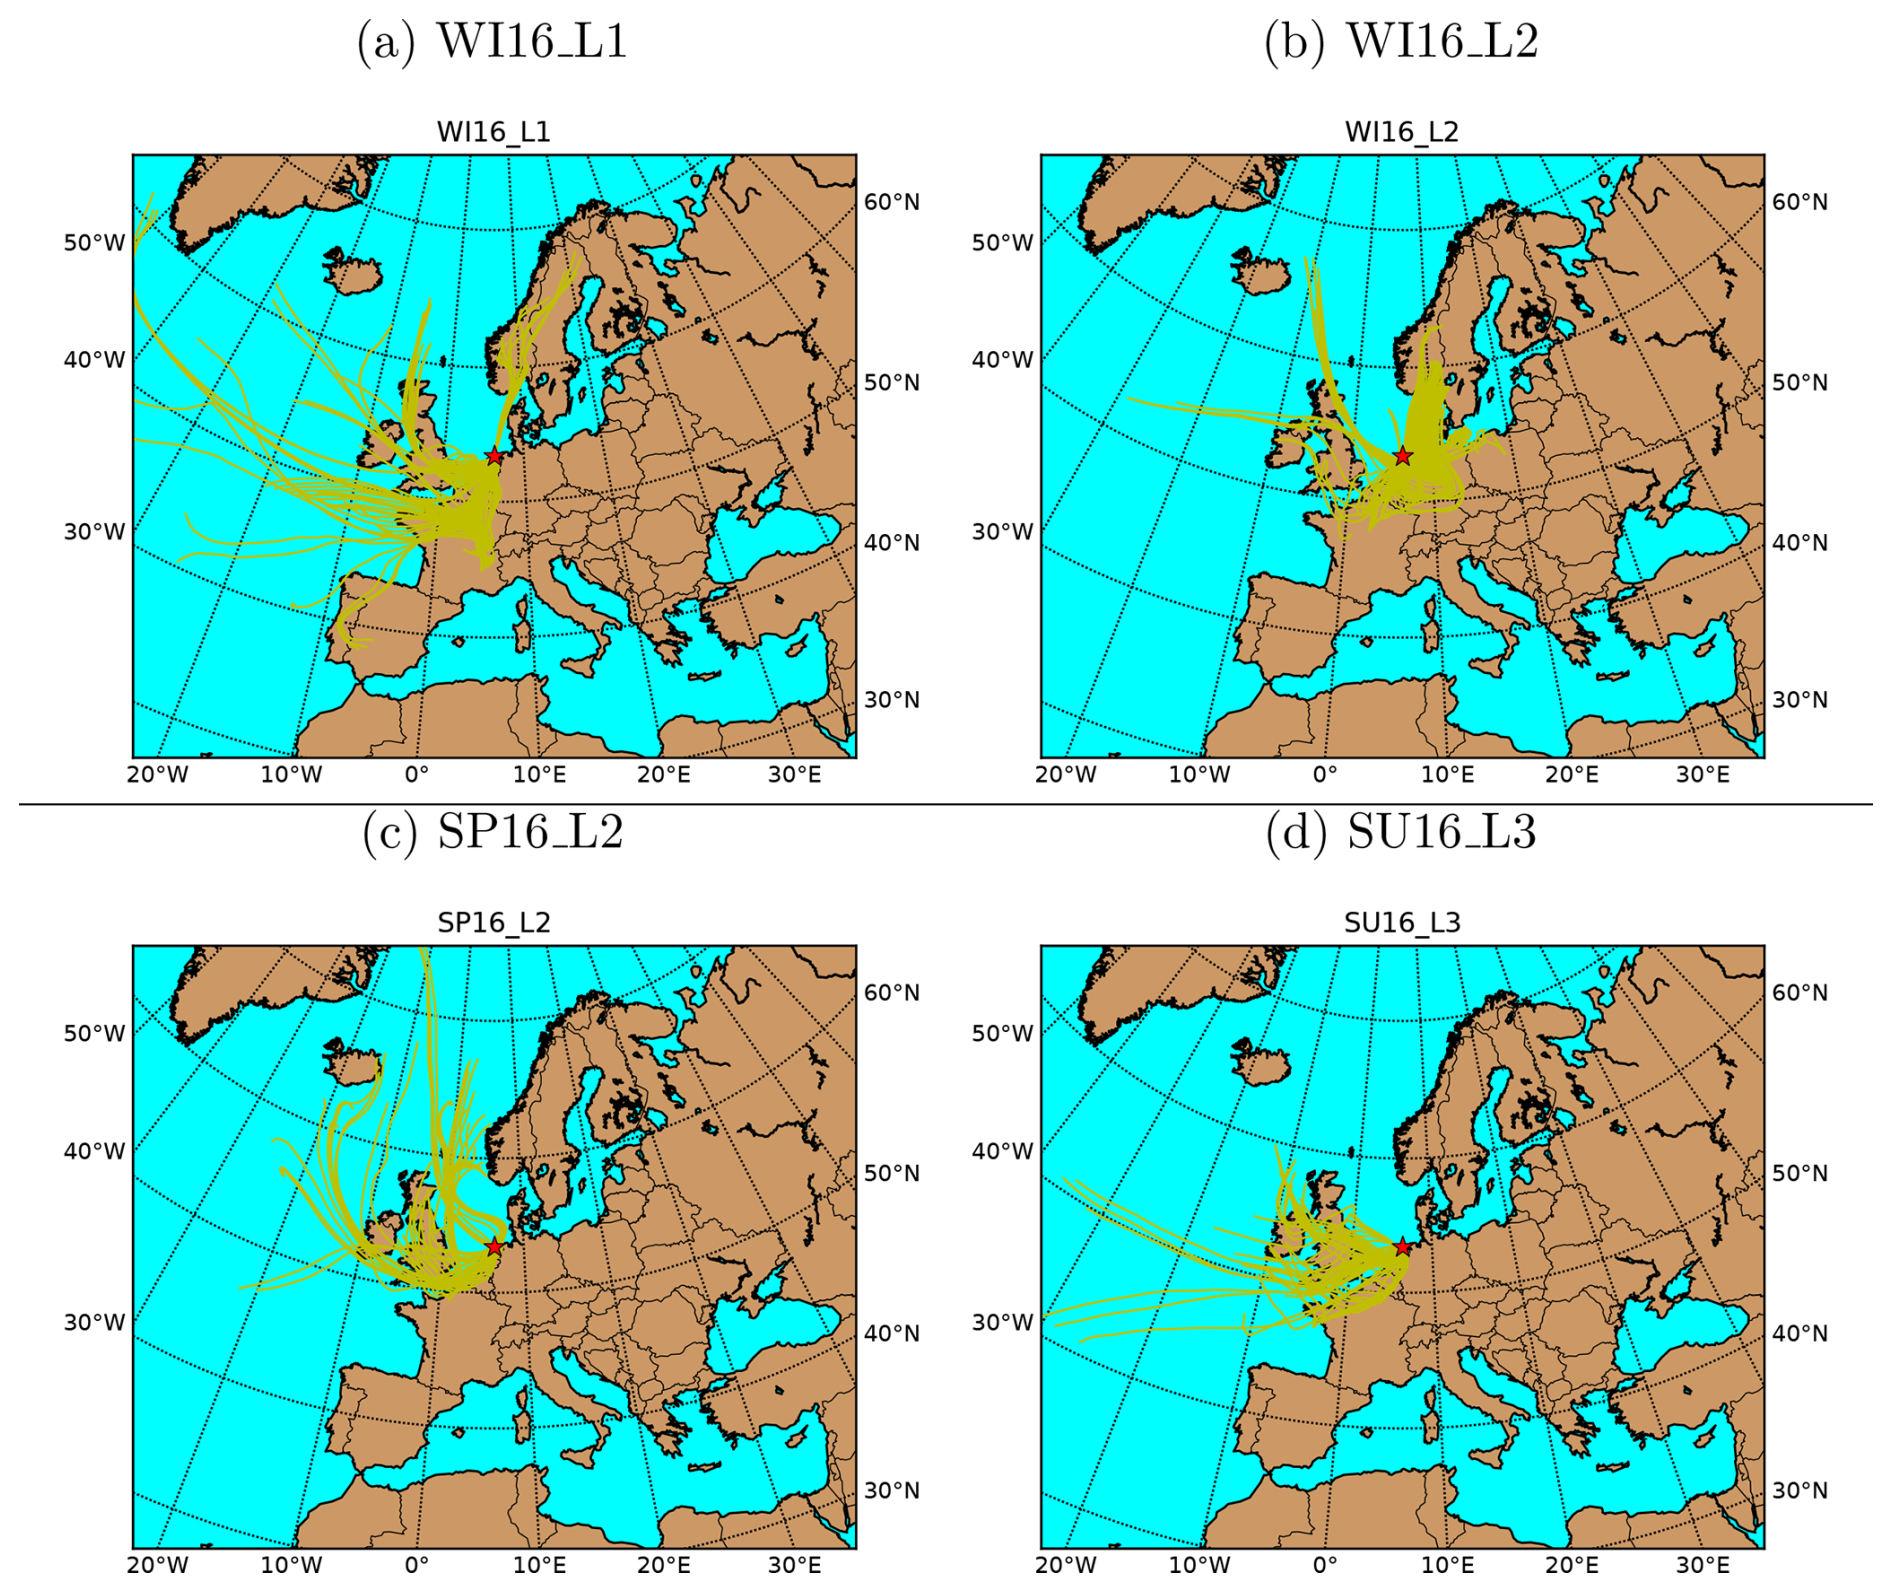
Figure 3 highlights the relative contribution of the main constituents (NH, NO, SO, TC, Na+, Cl−) for four typical impactor samples. Figure 3a and b compare in more detail the mass fractions of a sample collected in spring (SP16_L1) to a sample collected in autumn (AU15_L2) to highlight seasonal differences. Figure 3c and d show two filter sets collected in summer during the same time period; one set from the land (SU16_L4) and the other from the sea wind sector (SU16_S4). In addition the 72 h back-trajectories (HYSPLIT trajectory model, time resolution one hour, arrival altitude 50 m a.g.l.) are shown for each filter set.
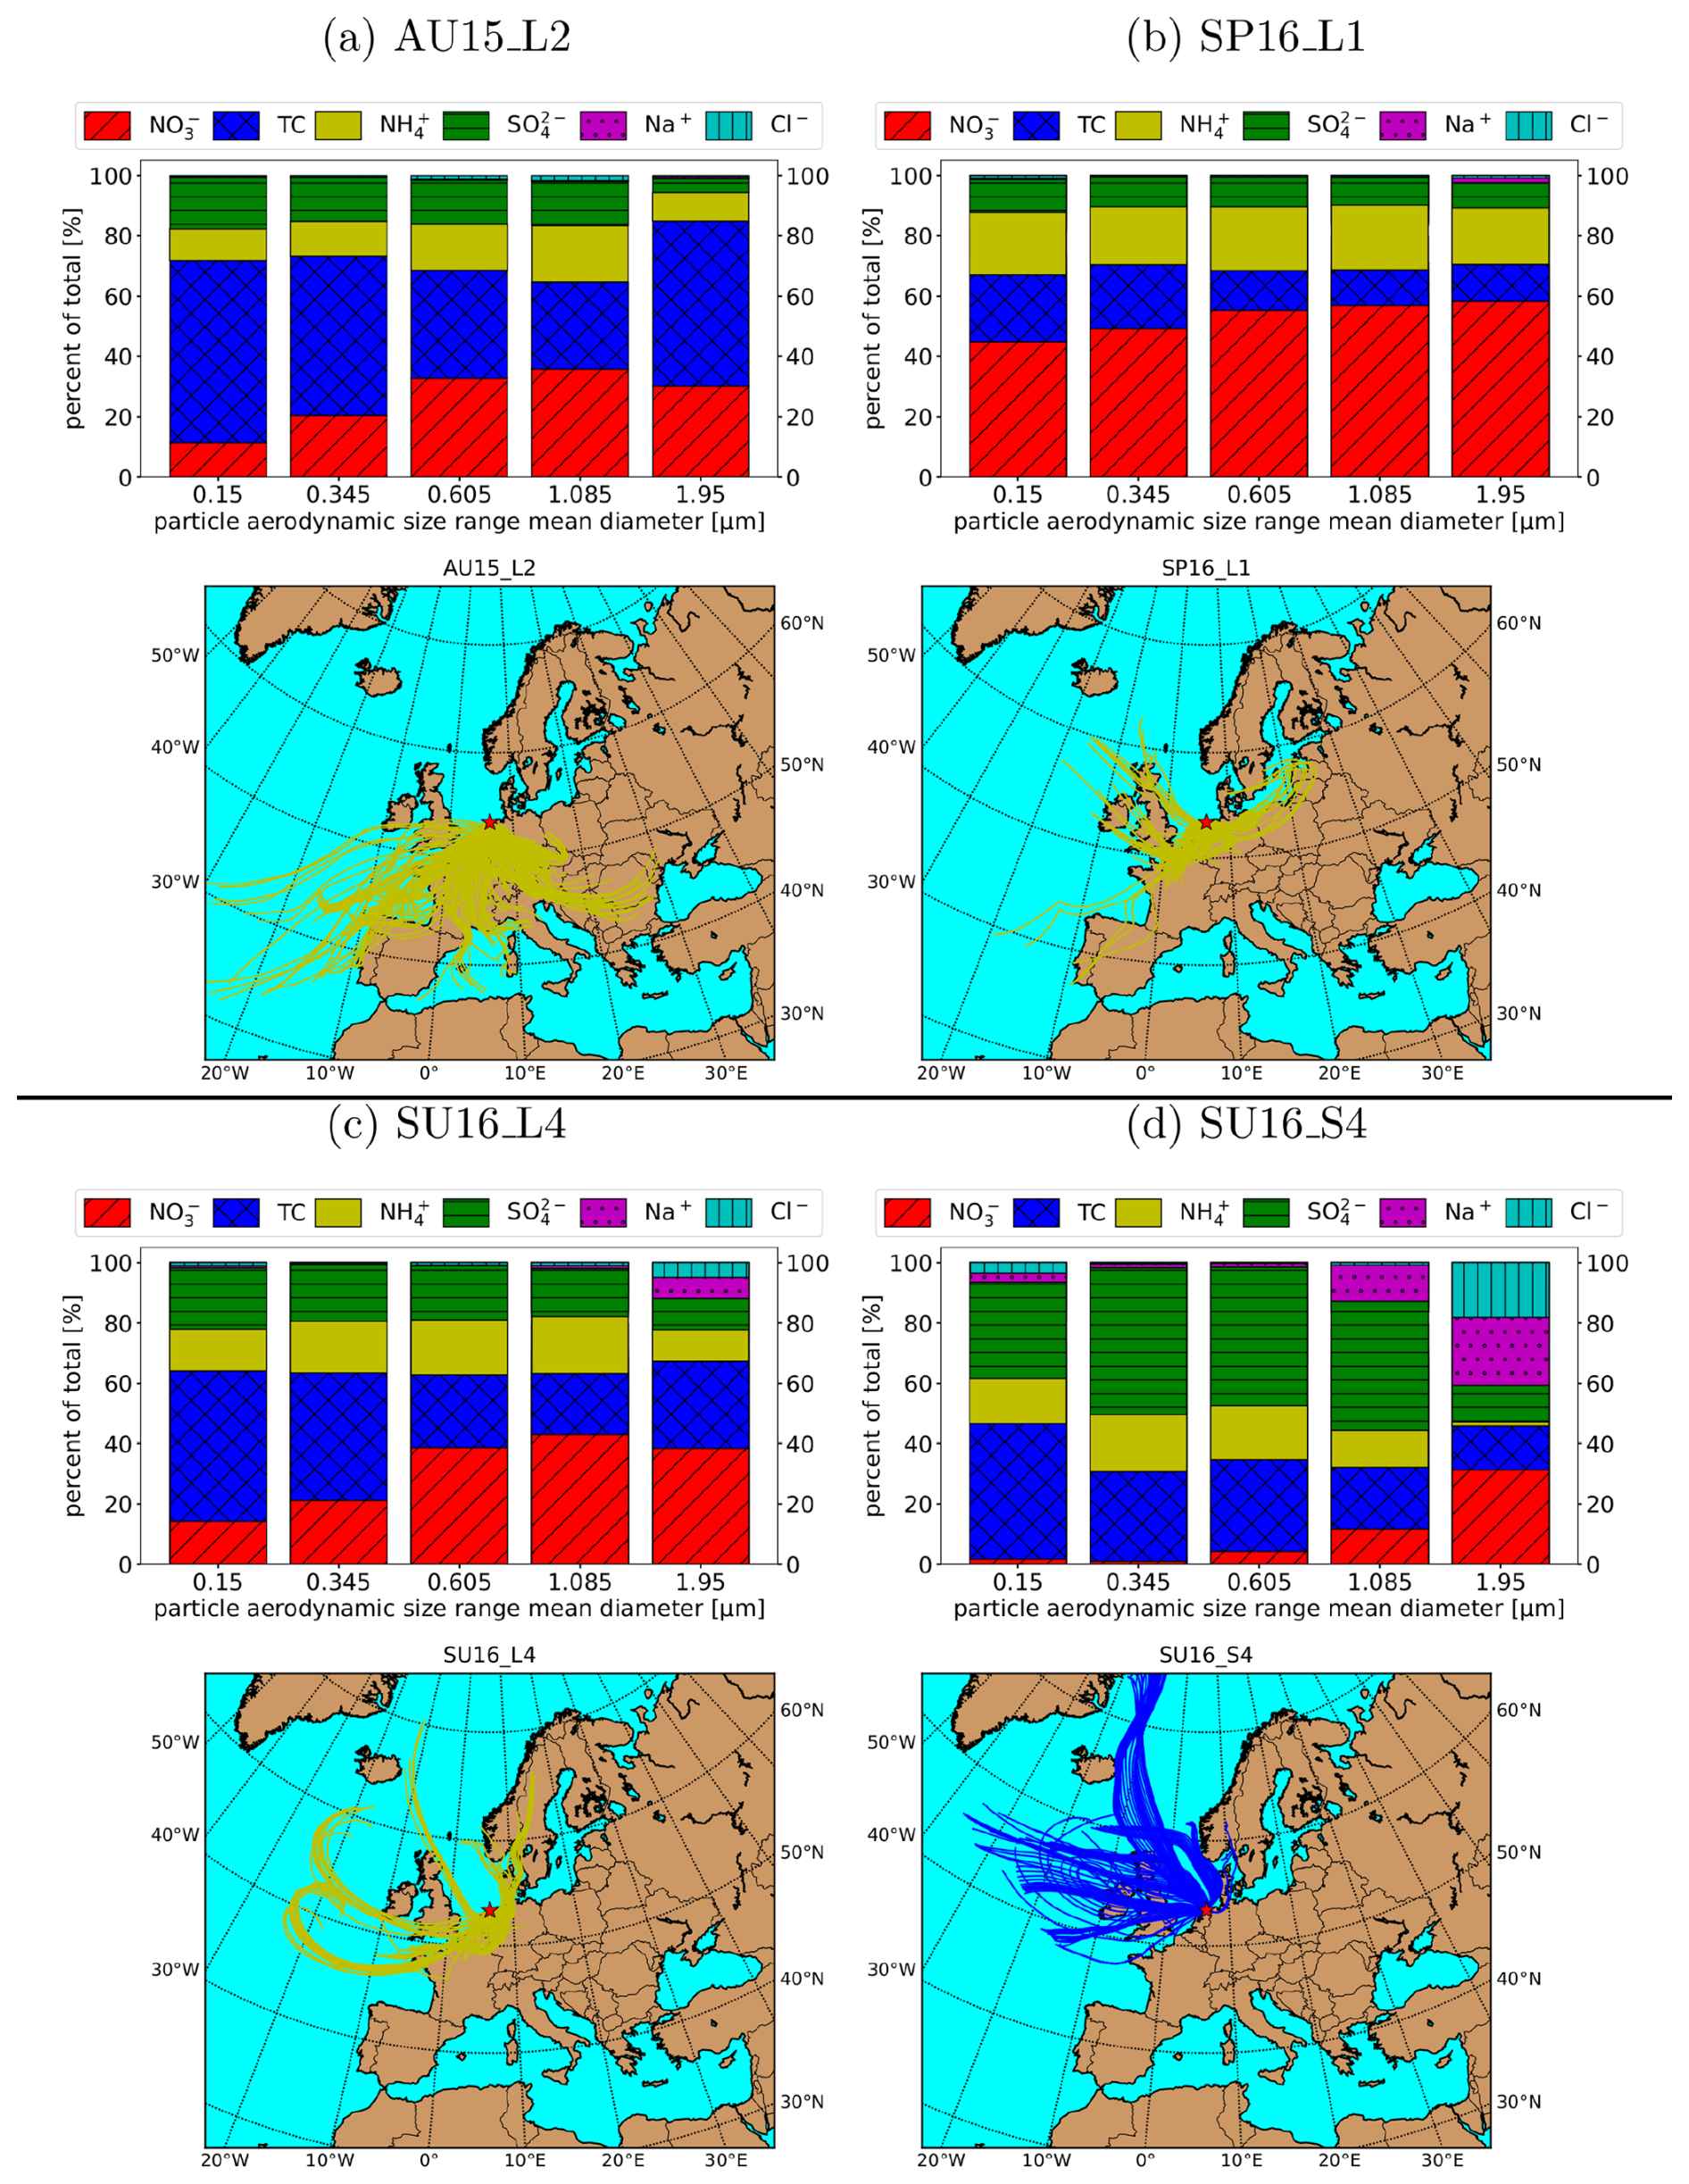
Figure 3Aerosol mass contribution of the main constituents (NH, NO, SO, TC, Na+, Cl−) in dependence of the particle size: The full bar (100 %) is the sum of the six constituents. Shown is a filter set from autumn (a) and one from spring (b). In the bottom a filter set with continental influence (c) is compared to a set from a sea-influenced episode (d), both sets are collected in the same time period. For each filter set the 72 h back-trajectories (HYSPLIT trajectory model, time resolution one hour, arrival altitude 50 m a.g.l.) are shown.
As observed in earlier studies (Weijers et al., 2011; Mensah et al., 2012; Schlag et al., 2016) in the Netherlands the largest contribution to the aerosol particle mass comes from nitrate, ammonium and total carbon. The outflow aerosol from the land to the sea is dominated by ammonium nitrate as the main water soluble species. A main reason for the large influence of ammonium nitrate is the combination of intensive agriculture, responsible for high ammonia emissions, and the high traffic and industrialization, which emit nitrogen oxides. Most inorganic components show the highest mass concentrations at a size range between 0.5 and 1 µm, indicative of aged aerosol. This shows that the measurement site is influenced mainly by long range transport and not so much by local sources. The size distribution changes with air mass origin (Turšič et al., 2006) and residence time in the atmosphere, as can be seen comparing the filter set from autumn with the set from summer. For the autumn sample, the back-trajectories (see Fig. 3) show a long residence time over continental Europe and the mode of the mass distribution is at large particle diameters of around 1 µm. The summer sample on the contrary mostly has a much shorter residence time over land close to the sampling site and the mode of the size distribution is at smaller diameters of around 0.6 µm.
Particulate ammonium is the main cation to neutralize the most important atmospheric anions to form ammonium nitrate, ammonium sulfate and ammonium chloride. Formation of ammonium nitrate requires high concentrations of NH3, because the more stable ammonium sulfate is preferentially produced. Ammonium nitrate is semi-volatile and consequently the mass concentration of particulate nitrate depends on temperature, with lower concentration in summer compared to the colder periods of the year. Especially high particulate nitrate concentrations occur in samples collected at the end of the winter period (WI16_L2) and in spring samples with maximum concentrations between 0.5 and 1 µm (WI16_L2: (0.6 µm, 4.3 µg m−3), (1.1 µm, 3.0 µg m−3); SP16_L1: (0.6 µm, 4.6 µg m−3), (1.1 µm, 3.6 µg m−3)). The highest mass concentrations of ammonium can be found in spring samples for particle sizes ranging from 0.44 to 1.4 µm (SP16_L1: (0.6 µm, 1.75 µg m−3), (1.1 µm, 1.4 µg m−3)), related to fertilizer use. The lowest concentrations are observed for samples from the sea-influenced sector (0.01–0.2 µg m−3), with the lowest relative contribution to the mass of the particles from the highest size range. Otherwise, differences in concentrations between samples collected during different seasons are not very strong. Currently, it is up for debate if reducing emissions of NH3 or NOx are more beneficial for reducing particulate matter (Gu et al., 2021; Guo et al., 2018; Jonson et al., 2022). However, our data show especially high contributions of ammonium nitrate to particulate matter, when ammonia emissions through fertilizer use are high in spring. Since NOx emissions are much more constant over the year, this indicates that low ammonia availability is at least partially a limiting factor for ammonium nitrate formation.
The particle mass concentration of sulfate does not show any distinct seasonal pattern among the analyzed samples. In Fig. 2 the total mass of sulfate is shown. The proportion of non-sea salt sulfate was calculated with sodium as a reference for sea salt and was found to be more than 97 % for all particle sizes except the largest size range for the land-sector filter set. Aerosol particles from the largest size range (1.4–2.5 µm) show a clear impact from sea salt emission sources with a proportion of up to 21 % sulfate from sea salt and mainly for filter sets (e.g. in Fig. 3c) under the influence of regional and coastal air masses. The sea-sector filter set has a proportion of 7 % sulfate mass from sea salt in the size range of 0.77 to 1.4 µm and 46 % in the size range of 1.4 to 2.5 µm. For the remaining particle size ranges of the sea-sector filter set the non-sea salt sulfate mass represents more than 98 % of total sulfate. Furthermore for the sea-sector filter set, sulfate is the main component next to TC for all sizes besides the largest collected size range. For sulfate aerosols, the ocean itself is a source with e.g. a total concentration of non-sea salt SO of around 43 ng m−3 on average for a remote station on the Svalbard Islands (Moroni et al., 2016). The sea-sector filter shows much higher SO concentrations than this (0.1–0.5 µg m−3), suggesting that the combustion of sulfur-containing fossil fuels by ship engines, as an important emission source of the precursor gas SO2 (Aakko-Saksa et al., 2023), may contribute to the observed sulfate concentrations. Since TC represents the second-largest fraction of the sub-micron aerosol mass in the sea-sector filter, this is consistent with a contribution from ship emissions to the observed aerosol at this coastal location. However, TC is not specific to shipping emissions, and the back-trajectories of the sea-sector filters (see Fig. 3d) show that part of the air masses passed over Great Britain, indicating a possible influence by other sulfate sources, such as vehicular traffic emissions. The relative mass contribution of nitrate in the sea-sector filter samples is negligible for particles smaller than 0.44 µm (see Fig. 3d). This may indicate a stronger influence of ship emissions, as the particle mass from ship emissions is generally dominated by sulfate and organic matter (Ausmeel et al., 2020). In contrast, measurements of the London plume (McMeeking et al., 2012) showed a substantial nitrate contribution of 24 % to sub-micron aerosol, comparable to the contributions of sulfate (24 %) and organic aerosol (29 %). The absence of a similarly strong nitrate contribution in the sub-micron particles of the sea-sector filter samples therefore supports the interpretation that shipping emissions may represent an important source of the observed aerosol. However, the low nitrate contribution and high sulfate and TC concentrations in the sea-sector filter set are consistent with an influence from shipping emissions but do not allow unique source attribution. In general, sulfate is the only major species (except for NaCl), where the absolute mass concentrations of the sea-sector filter is within the range of the land-sector filters and even exceeds the land-sector filters (for size range around 0.35 µm sea-sector filter: 0.4 µg m−3, land-sector filter: 0.16–0.3 µg m−3). Therefore most likely ship emissions may represent also a very relevant source not only locally, but for coastal locations in the Netherlands in general. Nonetheless the absolute concentrations of ammonium sulfate are much lower than those of TC and ammonium nitrate, which is most likely related to the substantial reductions in SO2 emissions from major sources, including the industrial sector, following the implementation of emission-control measures and regulations (Wever et al., 2021).
The total carbon mass shows higher concentrations in the winter and autumn samples, which is most likely due to domestic biomass burning with the starting cold season. Potassium and levoglucosan, typical biomass burning tracers, also show clearly higher values in autumn and winter samples and lower values in summer samples and for the sea-sector filter set. Local and regional sources seem to make a significant contribution, because these tracers are especially enriched in the lower size ranges compared to the other analyzed components. The contribution of carbon from traffic emissions is assumed to be constant throughout the seasons. Local traffic emissions would cause elevated TC mass concentrations in the lower size ranges, as the combustion of fuel produces small aerosol particles. Our samples do not show this influence, which underlines the rural character of the measurement site. The sea-sector filter set, which was collected in summer, shows the lowest TC mass concentrations overall (0.1–0.34 µg m−3), but for the smallest size range TC concentrations are comparable to other samples (0.05–0.23 µg m−3). The source of TC cannot be uniquely identified, but shipping emissions may be one possible contributor. In general, one would expect for a rural station higher TC concentrations in summer than in winter or autumn as biogenic secondary organic material contributes strongly to the aerosol mass. The measured concentrations do not show this and it was also not observed in earlier studies in the Netherlands (Dusek et al., 2017). The main reason here is probably the higher planetary boundary layer in summer than in the colder seasons. However, in the smallest two size classes, the mass concentrations of TC in the summer samples are comparable to or even higher than those in the autumn and winter samples. This indicates, that biogenic SOA, produced regionally in the Netherlands during the summer, probably contributes more strongly to smaller particle sizes. This is supported by air mass back trajectories, which during the summer show air mass origin over the Atlantic and transport over the Benelux and Northern France resulting in regional pollution advected to the site. In autumn, the air is coming from central Europe representing integrated European outflow and much longer aging times.
Sea salt is a source of the following analyzed ions, stated from the highest to the lowest proportion by weight appearing in sea salt: chloride (Cl−), sodium (Na+), sulfate (SO), magnesium (Mg2+), calcium (Ca2+), potassium (K+) (Millero, 1996). Particles with diameters >1 µm account for most of the PM2.5 sea salt aerosol mass, which is reflected in the aerosol mass size distributions shown in Fig. 2. Therefore, even though sea salt can significantly contribute to PM2.5, the contributions to the sub-micron range are very low. Obviously the sea-sector filter set shows the highest chloride, sodium and magnesium mass concentrations for the highest size range, where the sodium chloride mass accounts for 40 % of the total constituents (Fig. 3d). Even the land-sector filter set from the same time period (SU16_L4) shows a significant contribution from sea salt for the highest size range, which is related to air masses originating over the sea before crossing land as shown by the corresponding trajectories.
Despite the fact that chloride takes up the largest mass proportion of the sea salt constituents, its mass concentration or rather the concentration in mol m−3 (see Fig. A2) is lower than sodium for the largest size range in the coastal aerosol samples. The difference is even clearer for the impactor stages with mean diameters of around 0.6 and 1 µm (see Fig. A2), where sodium shows elevated values in the sea-sector filter compared to the other samples, but chloride does not. This is consistent with the ageing of sea spray through reaction with nitric acid (HNO3), forming gas-phase hydrogen chloride (HCl) and particulate-phase sodium nitrate (NaNO3) (Warneck, 1999; ten Brink, 1998). Given the proximity of the sampling site to the coast, this reaction may occur on relatively short timescales after the air mass makes contact with the coast. Laboratory studies have demonstrated rapid HNO3 uptake and chloride depletion in deliquesced NaCl particles under atmospherically relevant conditions (Liu et al., 2007). For the largest size range, the chloride is much less depleted than for the smaller sizes.
In the middle size ranges (mean diameters of around 0.35 and 1 µm), chloride mass concentrations (cf. concentrations in mol m−3 in Fig. A2) are higher than sodium mass concentrations for the land-sector filters, especially in samples collected in winter and autumn. Chloride is then likely present in the form of ammonium chloride (NH4Cl), a semi-volatile compound, which explains higher concentrations in the samples collected during the colder seasons. Magnesium shows a very similar size distribution as sodium with the largest values for the sea-sector filter set and at larger particle sizes, indicating that its main source is sea spray.
Calcium has a very distinct mass size distribution with elevated values for the lowest and the highest size range. An emission source for calcium is sea salt, but this has only a minor contribution. Another important source is mineral crust material, especially limestone (Warneck, 1999), which produces primary coarse mode particles by wind erosion. In general dry conditions and high wind velocities cause more mineral crustal material to become airborne. This explains the high particle mass concentrations for the largest size range and increased values for winter and spring samples for this size range. Elevated values for the lowest size range could occur, because of particle bounce in the impactor (Dzubay et al., 1976), which causes large particle not to be collected on their size corresponding impaction plate, but to bounce off and eventually end up on the back-up filter (lowest size range). This happens especially with dry particles, such as mineral dust. However, particle bounce is less likely on quartz fibre filter compared to smooth substrates. The reason for elevated particle mass concentrations of calcium in the lowest size range remains unclear.
3.2 Fraction Modern of Organic Carbon
Figure 4 shows the fraction modern of organic carbon (F(14C, OC)) as a function of particle size for the analyzed aerosol filter samples. An F(14C) of 0 % corresponds to pure fossil origin of the OA, whereas F(14C) of around 100 % indicates biogenic origin. The particle size is shown as the geometric mean of the lower and the upper cut-off-size of the relevant impactor stage. If two stages were combined in order to have enough material for the analysis of the ratio (i.e. for some spring and summer samples), the geometric mean of the lower cut-off diameter for the smaller stage and the upper cut-off for the larger stage is used. Some of the autumn filter samples have been analyzed twice and the values show a high repeatability for F(14C, OC).
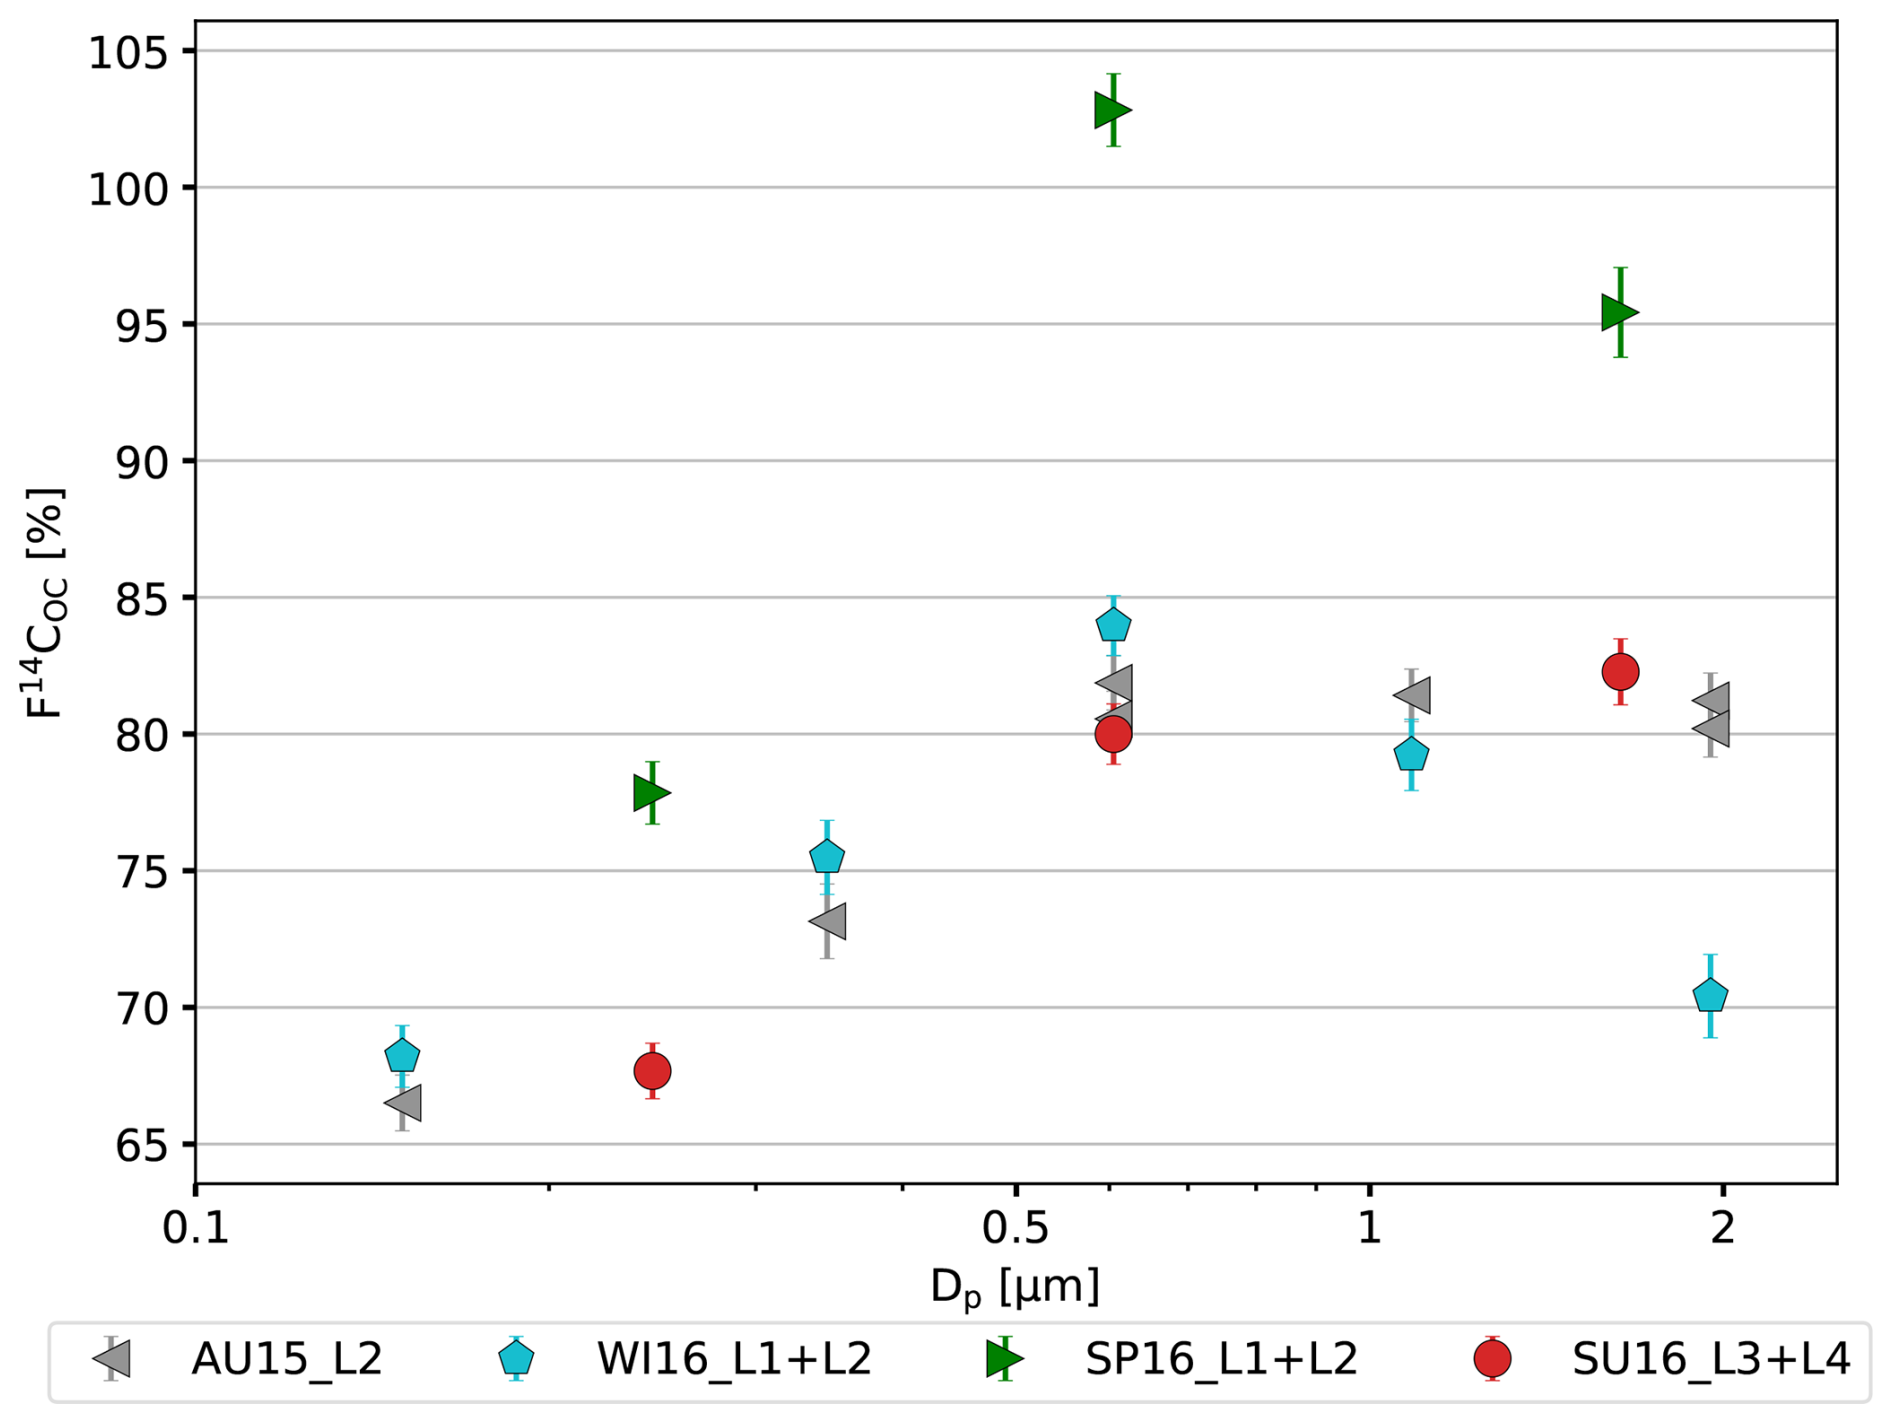
Figure 4Fraction modern of organic carbon (F(14C, OC)) in dependence of the particle size range: The particle size was calculated as the geometric mean of the lower and upper cut-off diameters of the corresponding impactor stage. In case filters from different impactor stages were combined the geometric mean of the lower cut-off diameter for the smaller stage and the upper cut-off for the larger stage is used. The shown impactor filter samples are collected in different seasons of the year. The color coding is as follows: winter – blue, spring – green, summer – red, autumn – gray; also consider Table 1.
The organic carbon of all filter samples is clearly dominated by modern sources, as the lowest F(14C, OC) value is about 67 %. The highest F(14C, OC) occurs in spring samples with a value of about 103 % in the size range that covers particle sizes from 0.44 to 0.77 µm, which is very close to the F(14C) of atmospheric carbon dioxide of approximately 104 % (Levin et al., 2010). In general, the impactor samples taken in spring show elevated F(14C, OC) compared to samples from the other seasons. For samples from all seasons F(14C, OC) is lowest at small particle sizes and increases towards the particle size range of 0.44 to 0.77 µm. Usually, a slight decrease for the larger particles can be observed. Even for this relatively remote coastal site in the Netherlands quite far from major roads and urban centres a clear influence of fossil sources on the smaller particles is evident. These particles most likely originate from regional vehicular and/or ship traffic. For the winter samples this trend is clearest. F(14C, OC) is 68 % for the smallest size range, increases to 84 % for the middle size range and decreases to 70 % for the largest size range. To our knowledge, this is the first time that this significant size dependence in the fossil contribution to OC has been demonstrated in Western Europe. In contrast a study in a megacity in China showed no significant size dependence in fossil contribution to OC (Ni et al., 2022).
The main sources for contemporary carbon are biogenic SOA and biomass burning, but previous studies (Dusek et al., 2017; Yttri et al., 2011; Genberg et al., 2011) show, that also primary biogenic particles, e.g. pollen fragments, or cooking emissions (Zotter et al., 2014) can contribute to high values of the fraction modern. In this remote area cooking is not a very likely source as there are only small villages within 20 km of the site.
Higher values of F(14C, OC) in spring compared to all other seasons were also observed in another seasonal study of radiocarbon in the Netherlands (Dusek et al., 2017). In this study, F(14C, OC) was analyzed for PM2.5 without any size dependence. Average values of F(14C, OC) for summer (71 %), autumn (78 %) and winter (74 %) varied within a narrow range of about ±4 %, but the average F(14C, OC) in spring was much higher with a value of 89 %. This is roughly comparable to the weighted average over the whole size range in our study (summer 75 %, autumn 78 %, winter 76 %, spring 90 %). Dusek et al. (2017) discuss, that elevated values of F(14C, OC) in spring are most likely caused by biogenic SOA and prevalent during the growing season. In the highly agricultural region of the Netherlands maximum biogenic SOA production thus seems to occur in spring and not in summer, such as in other, more forested, regions.
The reason for the elevated F(14C, OC) values in spring remains unclear. Enhanced secondary organic aerosol formation associated with agricultural activities, increased biogenic precursor emissions, or contributions from primary biological particles such as pollen fragments are all possible explanations. However, the available dataset does not allow us to distinguish between these possible mechanisms. Further targeted investigations are therefore needed to better understand the processes responsible for the elevated F(14C, OC) values observed in the spring samples.
F(14C) of SOA depends on the origin of the precursor gases that are involved in the formation of secondary organic carbon. If these gases primarily originate from fossil sources, then the formed particulate matter will have low F(14C) values. In our case an influence from modern sources on SOA is more prominent, as F(14C, OC) is above 65 % for all size ranges and sources surrounding the sampling station are predominantly biogenic. Even though biogenic sources and SOA production are mainly enhanced in warmer seasons, F(14C, OC) in winter samples shows similar values to summer samples. This is likely caused by biomass burning as an important source for OC in winter and autumn, which increases F(14C, OC). Biomass burning in the Netherlands mostly occurs in residential heating with fire wood or pellets. This type of heating is more common in rural areas than in cities.
3.3 δ(13C) signatures of Organic Carbon
Figure 5 shows the δ(13C) values of organic carbon (δ(13C, OC)) as a function of particle size for different desorption temperatures (200, 350 650 °C). The color coding for the samples from different seasons of the year is the same as used in Fig. 2 (winter – blue, spring – green, summer – red, autumn – gray; exception: yellow – summer, sample type “sea”; see Table 1). The shaded horizontal areas show the range of typical δ(13C, OC) values for particles emitted from primary sources, as expected for this region (Zenker et al., 2020; Masalaite et al., 2026). Non fossil sources, namely biomass burning, are shown in green and traffic emissions are shown in gray. For biomass burning aerosol the range encompasses emissions from burning of alder, oak, birch, ash (Masalaite et al., 2026) and Quercus ilex (oak) (Zenker et al., 2020) wood. These biomass burning sources represent characteristic material for heating, that can be bought, e.g. in the form of pellets, on the Dutch market. Traffic emissions were measured on filters collected in a tunnel of a main city traffic street in Naples (Zenker et al., 2020) and directly collected from a city bus exhaust (Zenker et al., 2020). These samples are selected as they represent a typical mixture of traffic emissions, that can be expected in Western Europe. Unfortunately not so many source reference measurements are published so far for this type of analysis with the different temperature steps, especially focused on the Western European region.
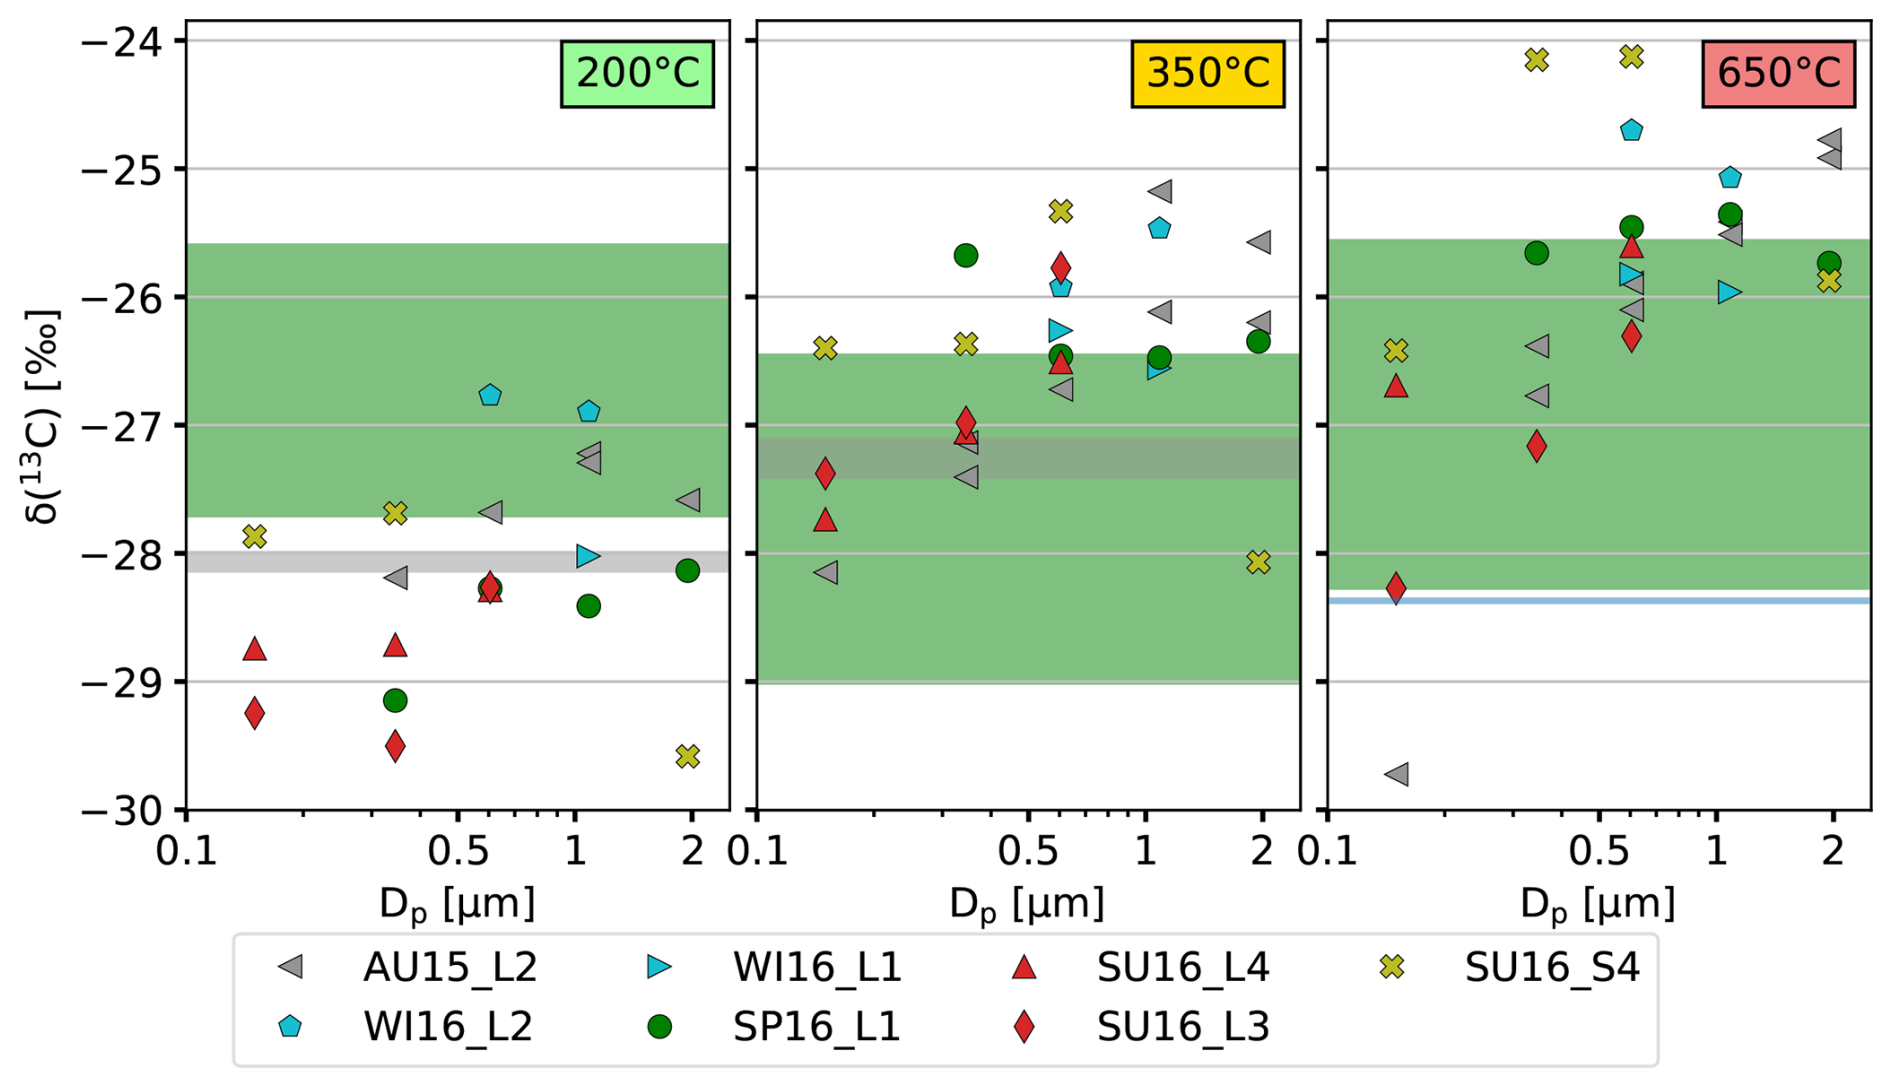
Figure 5δ(13C, OC) depending on particle size and temperature step (200, 350, 650 °C): The shown impactor filter samples are collected during different seasons of the year. The color coding is as follows: winter – blue, spring – green, summer – red, autumn – gray; exception: yellow – summer, sample type “sea”; also consider Table 1. The typical uncertainty of the values is 0.22 ‰, as explained in Sect. 2.4. The shaded horizontal areas show the range of typical δ(13C, OC) values for particles emitted from primary sources, as expected for this region (Zenker et al., 2020; Masalaite et al., 2026) (biomass burning – green, traffic emissions – gray).
For some impactor filter sets δ(13C, OC) values were not available for every particle size, as e.g. the measurement did not satisfy the quality control or not enough filter material was left after chemical analysis and the analysis of the ratio. On that account for some seasons, especially winter, it is not possible to draw a comprehensive conclusion for the trends of the δ(13C, OC) values over the whole particle size range. The measurement of the autumn filter set (AU15_L2) was repeated for some size ranges. Most of these δ(13C, OC) values are repeatable within the measurement uncertainty.
An overall increase of δ(13C, OC) can be observed with increasing desorption temperature. This was also observed in previous studies on ambient aerosol (Ni et al., 2023, 2022; Masalaite et al., 2020). Since the same increase is typically not necessarily observed in source samples (Zenker et al., 2020; Yao et al., 2022a; Vernooij et al., 2022), we conclude that it is related either to differences in contributing sources at the investigated desorption temperatures or to different atmospheric transformation processes that influence the particular OC fractions.
Considering the particle size distribution, the δ(13C, OC) values tend to increase with increasing particle size. This increase in δ(13C, OC) with increasing particle size is more pronounced for higher desorption temperatures and less evident at 200 °C. At higher temperatures many δ(13C, OC) values, especially for the size range 0.44 to 0.77 µm and larger, are higher than the δ(13C, OC) values of the possible primary sources. The filter sets from summer and autumn show a clearer increase of δ(13C, OC) with increasing particle size, especially for 350 °C and 650 °C. Ni et al. (2022) found an increasing mass fraction of OC at 650 °C for larger particles and also higher δ(13C, OC) (650 °C) values with increasing particle size. The observation was explained with photochemical aging of the aerosol, as it especially occurred in combination with low and moderate PM2.5 pollution events, where regional aged aerosol contributes significantly to urban pollution. At 200 °C most δ(13C, OC) values are lower compared to the primary sources (horizontal green and gray areas). This is especially the case for filters from spring and summer, where δ(13C, OC) values are all lower than the values of the primary sources. Lower values of δ(13C, OC) for the OC fraction desorbed at 200 °C were also found for samples from the Tibetian Plateau (Ni et al., 2023), different sampling areas in Lithuania (Masalaite et al., 2020) and samples collected in Beijing (Ni et al., 2022).
3.4 Combined Interpretation of Isotopic Measurements
Figure 6 compares calculated δ(13C, OC, prim) (black squares) based on a hypothetical mixture of only primary sources (in this case, traffic emissions and biomass burning) to the measured δ(13C, OC) (red circles) for autumn. The hypothetical primary source mix is based on the F(14C, OC) values from Fig. 4, which give the relative contribution of fossil and modern sources to OC. For example a F(14C, OC) value of 80 % means, that roughly 80 % of OC originated from modern sources and 20 % originated from fossil sources. The δ(13C, OC) values assigned to fossil and modern primary sources are represented by the values for vehicular sources and biomass burning, respectively, as shown in Fig. 5 by the shaded areas. For the calculation the respective δ(13C, OC) values of the sources are averaged and are depicted as horizontal lines in Fig. 6 for every temperature step. Modern sources, represented here by biomass burning, are shown as green line and fossil sources, represented here by traffic sources, are shown as gray line. The calculation of the theoretical δ(13C, OC, prim) is summarized in the following equation:
104 % is the F(14C) value of atmospheric carbon dioxide (Levin et al., 2010). Equation (3) provides an illustrative two-endmember comparison between modern and fossil OC and should not be interpreted as a unique quantitative source apportionment. Modern OC may originate from sources other than biomass burning, while fossil OC is not necessarily attributable to only vehicular traffic.
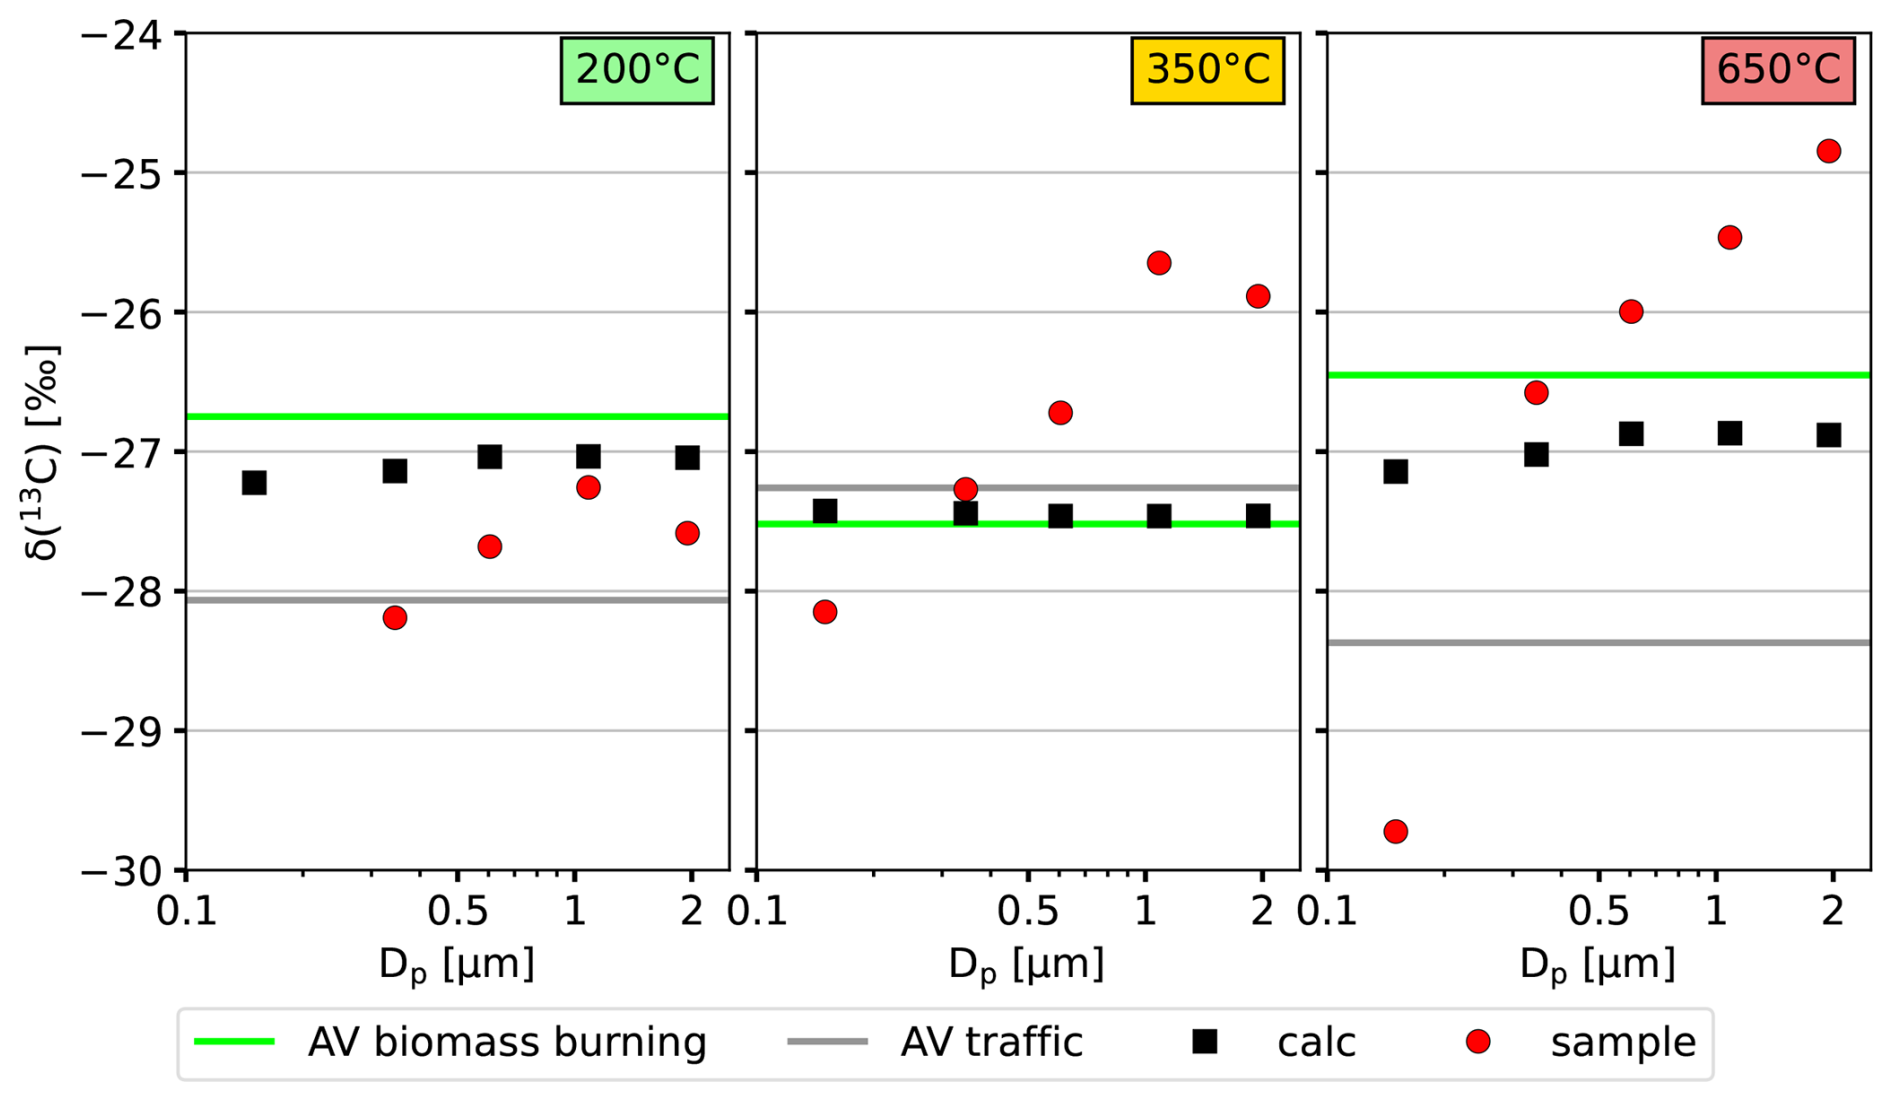
Figure 6Comparison of averaged analyzed δ(13C, OC) of samples from autumn (AU15_L2) (red) and thereoretical calculated δ(13C, OC, prim) (black): The calculation is based on the F(14C, OC) of the respective filter set and average values of δ(13C, OC) from source filter (biomass burning and traffic). Average δ(13C, OC) of the source filter are shown as lines for the different temperature steps (biomass burning – green line; traffic – gray line).
The most obvious observation from Fig. 6 is the low variability (< 1 ‰) of the calculated δ(13C, OC, prim) with changing particle size compared to values of the real sample. The calculated δ(13C, OC, prim) do not vary strongly with the temperature step or particle size. This is also in line with findings of a study investigating the δ(13C) of OC in primary emissions (Zenker et al., 2020), where δ(13C, OC) did not vary much with changing desorption temperature. Basically, if the organic aerosol were dominated by a primary source mix, without the contribution of SOA or aging processes, we would expect δ(13C, OC) to vary only in a relatively narrow range.
On the contrary, the δ(13C, OC) of the sampled aerosol particles show an increase with increasing particle size. This means smaller, on average less aged particles have lower δ(13C) values than larger particles. With respect to desorption temperature, at 200 °C all values of δ(13C, OC) of the samples are depleted compared to the calculated values. For the higher temperatures (350 and 650 °C) the measured δ(13C, OC) values are, except for the smallest particle size range, enriched compared to the theoretical δ(13C, OC, prim).
The depletion at 200 °C is most likely caused by the influence of recently formed SOA as it tends to desorb at lower temperatures (Meusinger et al., 2017). Due to the kinetic isotope effect, 12C is preferred during the formation of SOA from the precursor gas and accumulates in the reaction products that condense on the aerosol. As a consequence the ratio in the formed SOA will be less than in the precursor gas and likely less than in the primary organic particle matter. If incomplete, this process leads to a depletion of 13C (i. e. low δ(13C) values) in the particle phase of the aerosol. The original primary particle, not influenced by atmospheric transformation processes, is in our case represented by the theoretical δ(13C, OC, prim). SOA condenses on all particles, irrespective of their size. However, proportionally more SOA is added to the smaller particles. The lower δ(13C, OC) values of the smaller particles observed in this study are consistent with this fact. Since SOA can also contain low- and non-volatile compounds, a similar effect and size dependence can also be seen for higher desorption temperatures. However, for higher desorption temperatures only the smallest particles are depleted in 13C compared to the estimated primary signature. As shown in Fig. 5, δ(13C, OC) is especially depleted in the spring and summer samples, compared to samples from the other seasons and the primary source values. This is consistent with enhanced SOA formation in these warmer seasons.
The enrichment of the measured δ(13C, OC) compared to δ(13C, OC, prim), especially at 650 °C, is most likely caused by aerosol aging. Photochemical aging causes a net loss of organic carbon from the particle and the isotopically lighter carbon 12C is preferentially lost. If the particle is only partially oxidized, the remaining carbon in the particle is enriched in 13C compared to carbon of the original particle. As reflected by the δ(13C, OC) of the samples (see also Fig. 5), aerosol aging is more relevant for larger particles (accumulation mode) as these particles have a longer residence time in the atmosphere and therefore are involved in long range transport. The smaller particles (see Fig. 5) show δ(13C, OC) close to the primary emission sources at higher desorption temperatures. The increase of the measured δ(13C, OC) values with particle size is much stronger at 650 °C than for lower temperatures. Especially for this filter set from autumn the influence of aged regional aerosol is larger than the effect of SOA production.
Size-resolved aerosol filter samples in the sub-micrometer size range were collected at a site close to the Wadden Sea in the Netherlands during a year-long sampling campaign, with a sampling period of at least one month in each season. Eight filter sets collected during the year-long sampling campaign, covering different seasons, contained sufficient material to perform the complete analytical suite. The filter samples were analyzed for mass concentration of different inorganic ions and total carbon, as well as for the 13C signature of organic carbon desorbed at three different temperature steps (200, 350, 650 °C) and the 14C isotopic signatures of total OC to investigate seasonal changes of the chemical composition of aerosol particles and related atmospheric transformation processes.
Chemical analysis of size-resolved aerosol filter samples in the sub-micrometer size range shows that the largest contributions to aerosol particle mass are from nitrate, ammonium and carbon. This is in line with earlier studies and is typical for the Netherlands where the agricultural sector is a major source for pollutants, especially at rural sites.
Most ion mass concentrations show a typical seasonal trend depending on sources and the volatility of the formed inorganic salts. For example, particulate nitrate shows lower mass concentrations in the analyzed summer samples compared to the analyzed winter samples, because temperatures are higher in summer and ammonium nitrate, the main form of nitrate in this region, is semi-volatile.
In contrast, sulfate does not display any clear seasonal pattern among the analyzed samples, as sulfuric acid and ammonium sulfate have a very low volatility. A similar mass size distribution of sulfate was observed in samples from the sea- and land-sector. The elevated sulfate concentrations in the single sea-sector sample are consistent with a possible contribution from shipping emissions, which are likely an important source of the observed sulfate. However, the available measurements do not allow shipping emissions to be identified as the exclusive source.
Other inorganic ions, whose main emission source is sea salt, like chloride, sodium or magnesium, show a very distinct mass size distribution with elevated values for the largest size range. Even though NaCl is present in the PM2.5 mass, only a small mass fraction occurs in the sub-micron range.
A second objective of this study was to demonstrate the potential of carbon isotopes to provide more detailed insights into sources and processing of carbonaceous aerosols. The size distribution of F(14C, OC) shows a similar trend for all analyzed samples collected in different seasons of the year with in general high values of larger than 67 %, which indicates that non-fossil sources are dominant. F(14C, OC) values in spring samples show even higher values, with the highest value of more than 100 % in the size range of 0.44 to 0.77 µm. To our knowledge, this is the first time that this significant size dependence in the fossil contribution to OC has been demonstrated in Western Europe. In contrast a study in a megacity in China showed no significant size dependence in fossil contribution to OC. High values of F(14C, OC) in autumn and winter samples are likely related to a substantial contribution from biomass burning for residential heating, especially as during these seasons the size distribution of levoglucosan is very similar to the size distribution of TC. The size distribution of F(14C, OC) is consistent with an input from regional traffic, with lower values for the smallest size ranges, which correspond to the size range of primary traffic particles. However, these observations do not uniquely establish biomass burning or regional traffic as the respective sources. The clearly modern values of F(14C, OC) observed in samples from different seasons, although similar, likely result from a combination of different effects; biomass burning in autumn and winter and contributions from biogenic SOA and/or primary biological material in spring and summer. An earlier study in the Netherlands, that analyzed F(14C, OC) of PM2.5 without any size dependence showed a similar seasonal trend with higher values of F(14C, OC) in spring compared to all other seasons. The elevated F(14C, OC) values observed in the spring samples may be related to enhanced biogenic SOA formation, primary biological material, or other sources of modern carbon, but the available dataset does not allow these contributions to be distinguished.
δ(13C, OC) values increase with increasing desorption temperature (200, 350, 650 °C) and larger aerosol particles tend to show higher δ(13C, OC). This is consistent with the theory that SOA formation can be traced by low δ(13C) values, whereas photochemical aging by increasing δ(13C) values. However, source mixing and differences among the thermal fractions may also contribute to the observed δ(13C, OC) patterns. Similar observations were also made in earlier studies for other regions of the world. This holds promise that 13C signatures can be used to gain more quantitative insights into atmospheric formation and processing of organic aerosol.
The broader implications of the chemical composition and OC sources pertain especially to the European outflow over the North Sea, where it will impact the radiative balance and clouds. The outflow is characterized by high ammonium nitrate concentrations, which will have a major influence on cloud activation and radiative forcing. We also find a relatively minor contribution of fossil sources to organic aerosol in the analyzed samples. The observed isotope patterns are consistent with increasing contributions from SOA at smaller particle sizes, especially in spring and summer, while the larger particles show patterns consistent with stronger atmospheric processing. However, these interpretations are not unique, and source mixing and differences among thermal fractions may also contribute to the observed isotope patterns. Better source characterization and controlled laboratory studies of isotope effects during chemical processing are needed to further constrain the contributions of SOA and atmospheric aging.
Overall, the dataset highlights the strong size dependence of aerosol composition and carbon isotopes at coastal sites and demonstrates the potential of combined size-resolved chemical and isotopic measurements to better characterize sources and atmospheric transformation processes of organic aerosol.
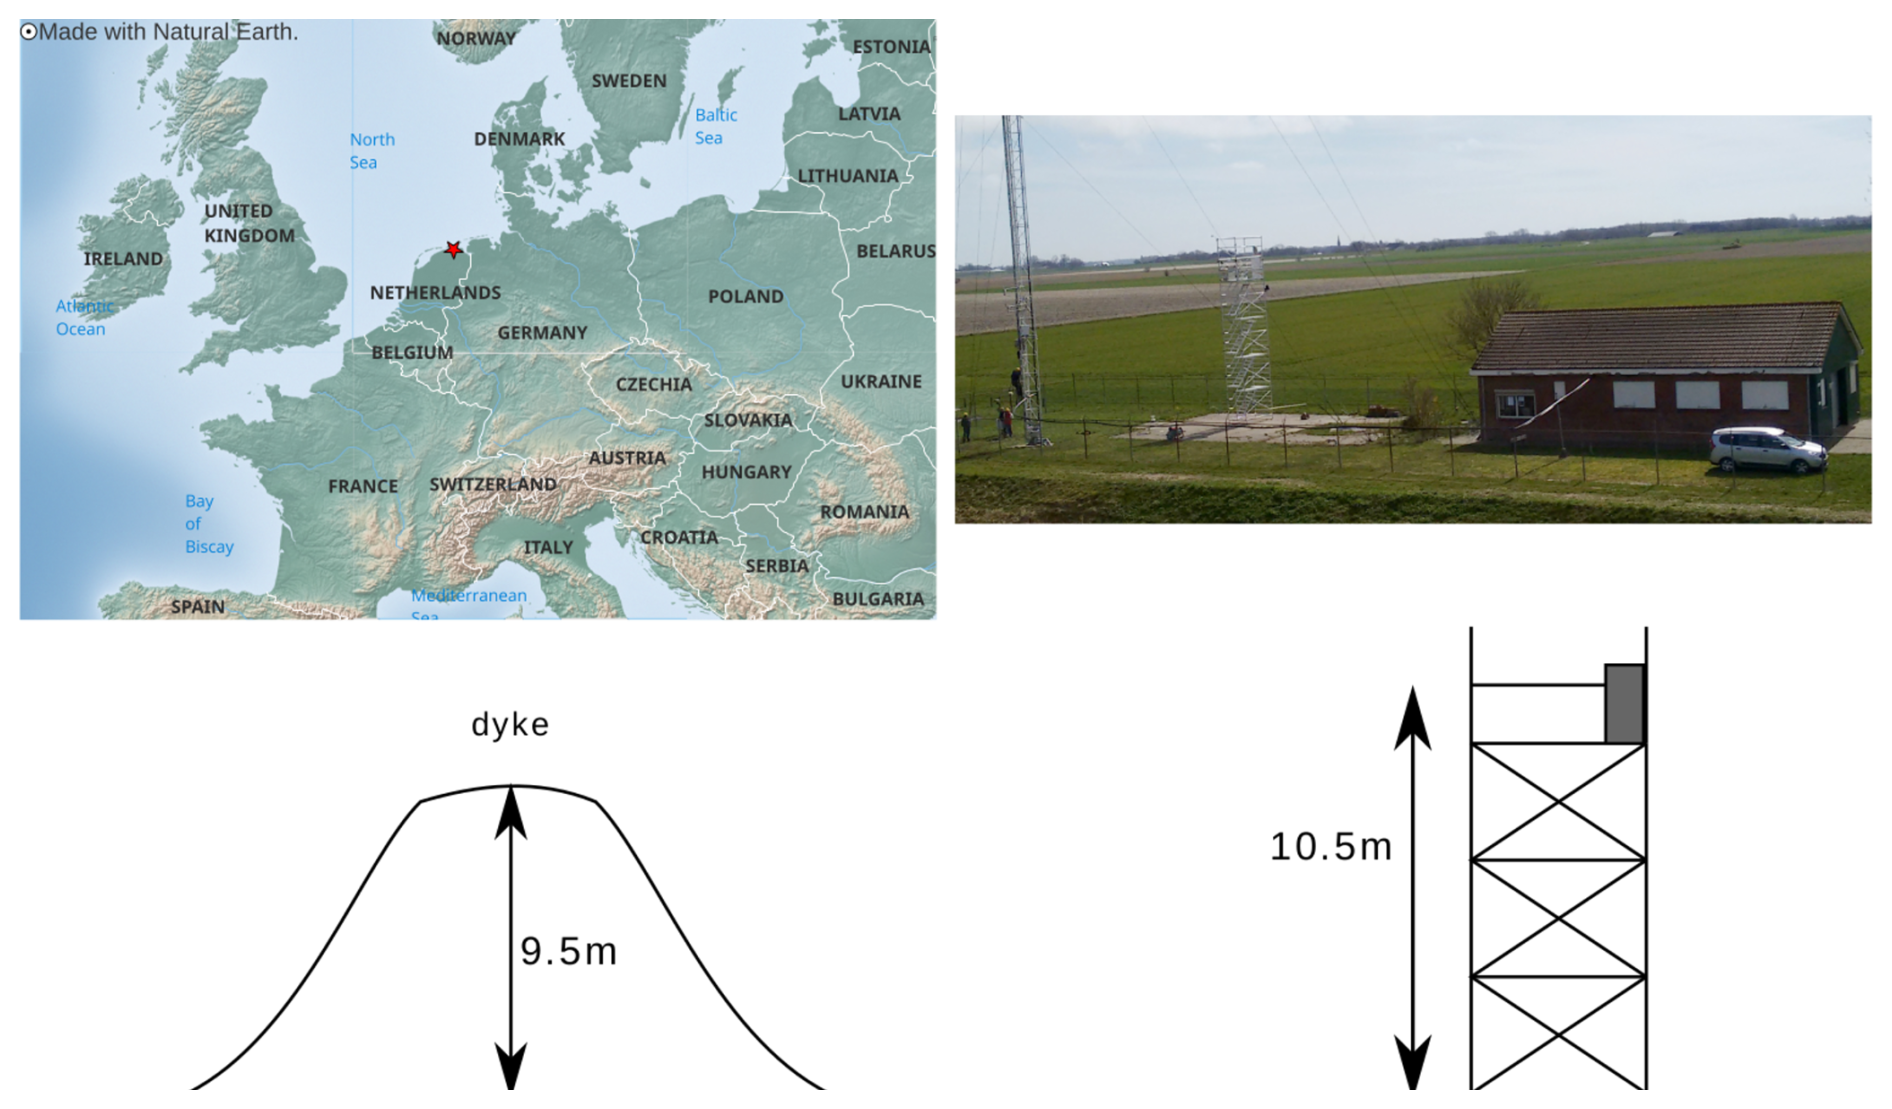
Figure A1Sampling Site: top left shows the position within Europe, top right shows the measurement station Lutjewad and the bottom shows the proportion of the scaffolding, with the sampling equipment on top, to the dyke.
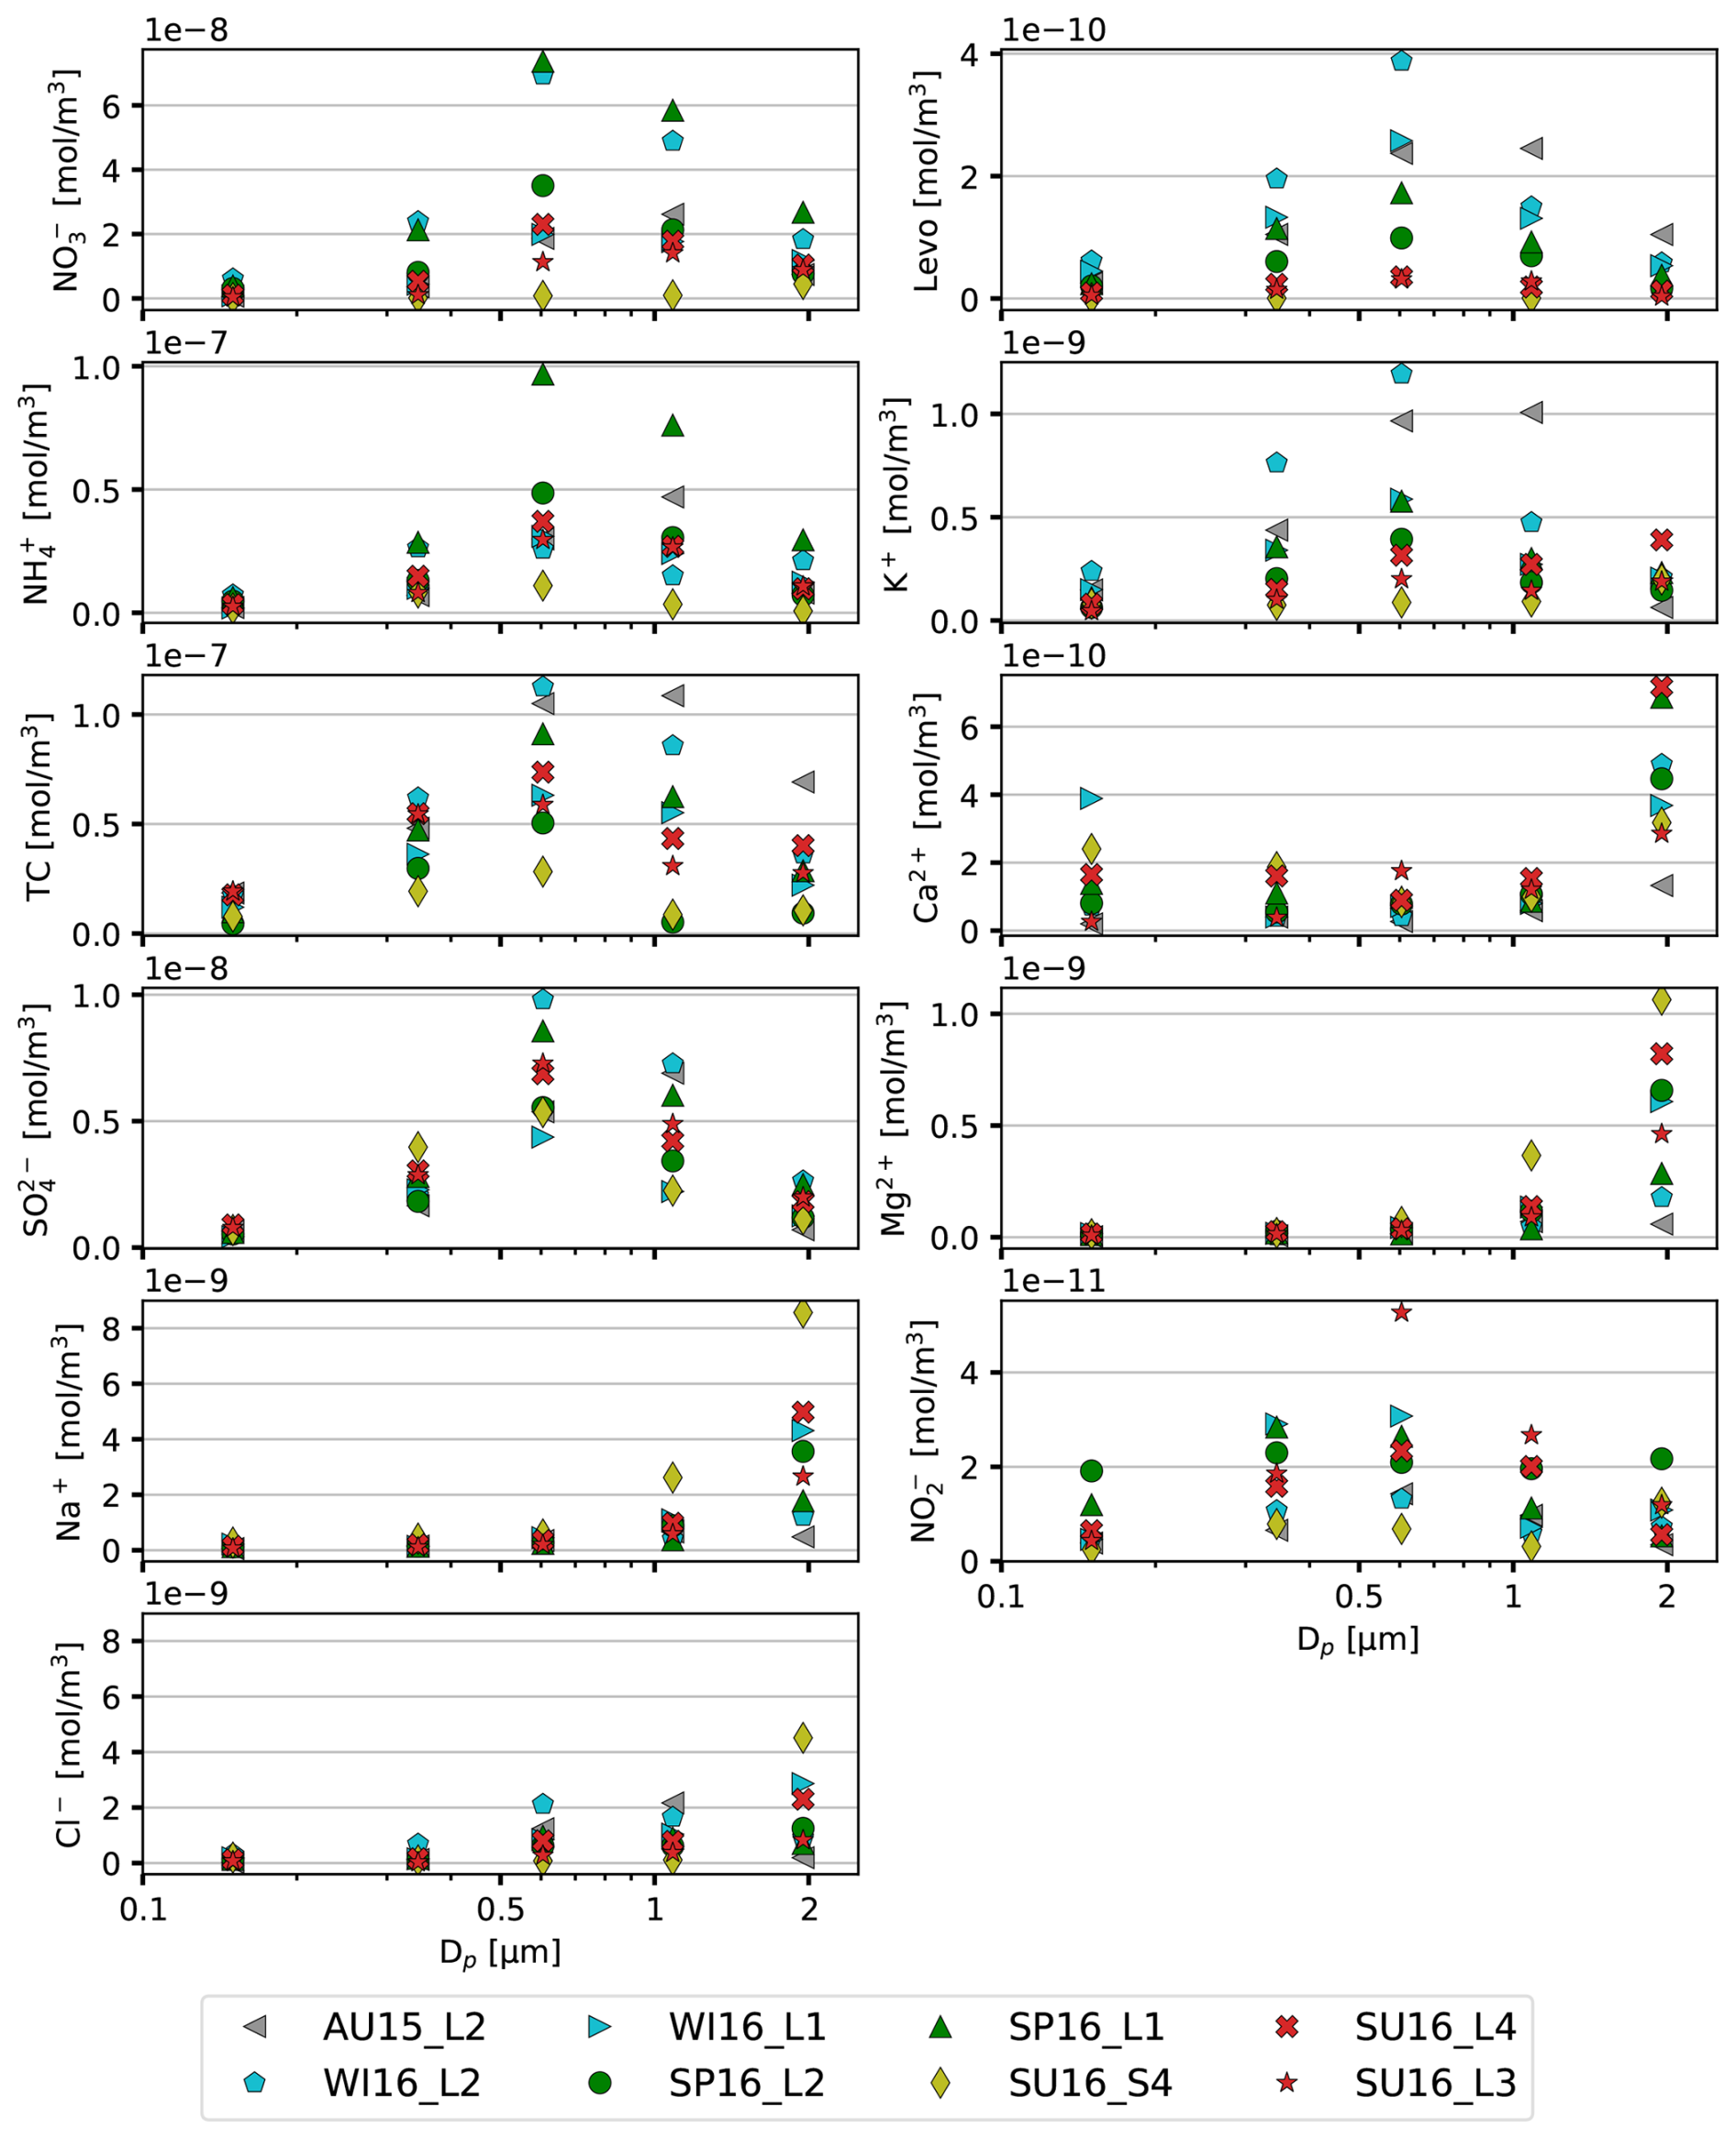
Figure A2Size distributions of the amount of substance of TC and inorganic ions: The shown impactor filter samples are from different seasons of the year. The color coding is as follows: winter – blue, spring – green, summer – red, autumn – gray; exception: yellow – summer, sample type “sea”; also consider Table 1; accompanying dataset is available at https://doi.org/10.5281/zenodo.19990975 (Zenker et al., 2026).
The dataset accompanying this publication is available at https://doi.org/10.5281/zenodo.19990975 (Zenker et al., 2026).
Peter Redl and Anne Kasper-Giebl performed the experimental and data analysis for the chromatographic analysis at the Institute of Chemical Technologies and Analytics, Vienna University of Technology and provided valuable comments for the manuscript. Furthermore Anne Kasper-Giebl wrote the method description “Analyses of ions and levoglucosan”. Ulrike Dusek conceived the idea and supervised the project and revised the manuscript. Katrin Zenker conducted the sampling campaign and performed the experimental and data analysis for the measurement of total carbon, F(14C, OC) and δ(13C, OC) and wrote the main part of the manuscript.
The contact author has declared that none of the authors has any competing interests.
Publisher's note: Copernicus Publications remains neutral with regard to jurisdictional claims made in the text, published maps, institutional affiliations, or any other geographical representation in this paper. The authors bear the ultimate responsibility for providing appropriate place names. Views expressed in the text are those of the authors and do not necessarily reflect the views of the publisher.
The authors like to thank Bert Kers, Marcel de Vries and Romke Tjoelker for their help during the measurement campaign. We thereby like to emphasize the importance of support from technical staff during scientific work. Furthermore we like to thank Henk Jansen for his daily technical support during laboratory measurements and Dipayan Paul and Marc Bleeker for conducting the AMS measurements. The authors also like to thank Anni E. Kortesmaa for her improvements of the 13C measurement setup by including a reduction oven, Koen Oosterveen for further 13C laboratory measurements and Max Cosjin for 14C data corrections. This long-term measurement campaign could not have been accomplished without the research facility Lutjewad, part of the Ruisdael Observatory, which is co-financed by the Dutch Research Council. Such measurement stations are crucial for long and continuous atmospheric observations that allow to learn about atmospheric processes and to provide long data sets, which are essential for the development of atmospheric models.
This research is supported by the Ruisdael observatory, which is co-financed by the Dutch Research Council (NWO; grant number 184.034.015).
This paper was edited by Jan Kaiser and reviewed by three anonymous referees.
Aakko-Saksa, P. T., Lehtoranta, K., Kuittinen, N., Järvinen, A., Jalkanen, J.-P., Johnson, K., Jung, H., Ntziachristos, L., Gagné, S., Takahashi, C., Karjalainen, P., Rönkkö, T., and Timonen, H.: Reduction in greenhouse gas and other emissions from ship engines: Current trends and future options, Prog. Energ. Combust., 94, 101055, https://doi.org/10.1016/j.pecs.2022.101055, 2023. a
Aerts-Bijma, A. T., Paul, D., Dee, M. W., Palstra, S. W. L., and Meijer, H. A. J.: AN INDEPENDENT ASSESSMENT OF UNCERTAINTY FOR RADIOCARBON ANALYSIS WITH THE NEW GENERATION HIGH-YIELD ACCELERATOR MASS SPECTROMETERS, Radiocarbon, 63, 1–22, https://doi.org/10.1017/RDC.2020.101, 2021. a
Ausmeel, S., Eriksson, A., Ahlberg, E., Sporre, M. K., Spanne, M., and Kristensson, A.: Ship plumes in the Baltic Sea Sulfur Emission Control Area: chemical characterization and contribution to coastal aerosol concentrations, Atmos. Chem. Phys., 20, 9135–9151, https://doi.org/10.5194/acp-20-9135-2020, 2020. a
Boucher, O., Randall, D., Artaxo, P., Bretherton, C., Feingold, G., Forster, P., Kerminen, V.-M., Kondo, Y., Liao, H., Lohmann, U., Rasch, P., Satheesh, S. K., Sherwood, S., Stevens, B., and Zhang, X. Y.: Clouds and Aerosols, in: Climate Change 2013: The Physical Science Basis. Contribution of Working Group I to the Fifth Assessment Report of the Intergovernmental Panel on Climate Change, edited by: Stocker, T., Qin, D., Plattner, G.-K., Tignor, M., Allen, S., Boschung, J., Nauels, A., Xia, Y., Bex, V., and Midgley, P., chap. 7, 571–658, Cambridge University Press, Cambridge, United Kingdom and New York, NY, USA, ISBN 978-1-107-66182-0, https://doi.org/10.1017/CBO9781107415324.016, 2013. a
Cavalli, F., Viana, M., Yttri, K. E., Genberg, J., and Putaud, J.-P.: Toward a standardised thermal-optical protocol for measuring atmospheric organic and elemental carbon: the EUSAAR protocol, Atmos. Meas. Tech., 3, 79–89, https://doi.org/10.5194/amt-3-79-2010, 2010. a
Ceburnis, D., Garbaras, A., Szidat, S., Rinaldi, M., Fahrni, S., Perron, N., Wacker, L., Leinert, S., Remeikis, V., Facchini, M. C., Prevot, A. S. H., Jennings, S. G., Ramonet, M., and O'Dowd, C. D.: Quantification of the carbonaceous matter origin in submicron marine aerosol by 13C and 14C isotope analysis, Atmos. Chem. Phys., 11, 8593–8606, https://doi.org/10.5194/acp-11-8593-2011, 2011. a, b
Chesselet, R., Fontugne, M., Buat-Ménard, P., Ezat, U., and Lambert, C. E.: The origin of particulate organic carbon in the marine atmosphere as indicated by its stable carbon isotopic composition, Geophys. Res. Lett., 8, 345–348, https://doi.org/10.1029/GL008i004p00345, 1981. a
Cubison, M. J., Alfarra, M. R., Allan, J., Bower, K. N., Coe, H., McFiggans, G. B., Whitehead, J. D., Williams, P. I., Zhang, Q., Jimenez, J. L., Hopkins, J., and Lee, J.: The characterisation of pollution aerosol in a changing photochemical environment, Atmos. Chem. Phys., 6, 5573–5588, https://doi.org/10.5194/acp-6-5573-2006, 2006. a
Donahue, N. M., Robinson, A. L., and Pandis, S. N.: Atmospheric organic particulate matter: From smoke to secondary organic aerosol, Atmos. Environ., 43, 94–106, https://doi.org/10.1016/j.atmosenv.2008.09.055, 2009. a
Dusek, U., Meusinger, C., Oyama, B., Ramon, W., de Wilde, P. A., Holzinger, R., and Röckmann, T.: A thermal desorption system for measuring δ13C ratios on organic aerosol, J. Aerosol Sci., 66, 72–82, https://doi.org/10.1016/j.jaerosci.2013.08.005, 2013. a
Dusek, U., Hitzenberger, R., Kasper-Giebl, A., Kistler, M., Meijer, H. A. J., Szidat, S., Wacker, L., Holzinger, R., and Röckmann, T.: Sources and formation mechanisms of carbonaceous aerosol at a regional background site in the Netherlands: insights from a year-long radiocarbon study, Atmos. Chem. Phys., 17, 3233–3251, https://doi.org/10.5194/acp-17-3233-2017, 2017. a, b, c, d, e
Dusek, U., Cosijn, M. M., Ni, H., Huang, R.-J., Meijer, H. A. J., and van Heuven, S.: Technical Note: An Automated System for Separate Combustion of Elemental and Organic Carbon for 14C Analysis of Carbonaceous Aerosol, Aerosol Air Qual. Res., 19, 2604–2611, https://doi.org/10.4209/aaqr.2019.06.0287, 2019. a
Dzubay, T. G., Hines, L. E., and Stevens, R. K.: Particle bounce errors in cascade impactors, Atmos. Environ., 10, 229–234, https://doi.org/10.1016/0004-6981(76)90095-0, 1976. a
Fitzgerald, J. W.: Marine aerosols: A review, Atmos. Environ. A-Gen., 25, 533–545, https://doi.org/10.1016/0960-1686(91)90050-H, 1991. a
Fuzzi, S., Baltensperger, U., Carslaw, K., Decesari, S., Denier van der Gon, H., Facchini, M. C., Fowler, D., Koren, I., Langford, B., Lohmann, U., Nemitz, E., Pandis, S., Riipinen, I., Rudich, Y., Schaap, M., Slowik, J. G., Spracklen, D. V., Vignati, E., Wild, M., Williams, M., and Gilardoni, S.: Particulate matter, air quality and climate: lessons learned and future needs, Atmos. Chem. Phys., 15, 8217–8299, https://doi.org/10.5194/acp-15-8217-2015, 2015. a
Genberg, J., Hyder, M., Stenström, K., Bergström, R., Simpson, D., Fors, E. O., Jönsson, J. Å., and Swietlicki, E.: Source apportionment of carbonaceous aerosol in southern Sweden, Atmos. Chem. Phys., 11, 11387–11400, https://doi.org/10.5194/acp-11-11387-2011, 2011. a
Gensch, I., Kiendler-Scharr, A., and Rudolph, J.: Isotope ratio studies of atmospheric organic compounds: Principles, methods, applications and potential, Int. J. Mass Spectrom., 365–366, 206–221, https://doi.org/10.1016/j.ijms.2014.02.004, 2014. a
Gu, B., Zhang, L., Van Dingenen, R., Vieno, M., Van Grinsven, H. J. M., Zhang, X., Zhang, S., Chen, Y., Wang, S., Ren, C., Rao, S., Holland, M., Winiwarter, W., Chen, D., Xu, J., and Sutton, M. A.: Abating ammonia is more cost-effective than nitrogen oxides for mitigating PM2.5 air pollution, Science, 374, 758–762, https://doi.org/10.1126/science.abf8623, 2021. a
Guo, H., Otjes, R., Schlag, P., Kiendler-Scharr, A., Nenes, A., and Weber, R. J.: Effectiveness of ammonia reduction on control of fine particle nitrate, Atmos. Chem. Phys., 18, 12241–12256, https://doi.org/10.5194/acp-18-12241-2018, 2018. a
Holzinger, R., Goldstein, A. H., Hayes, P. L., Jimenez, J. L., and Timkovsky, J.: Chemical evolution of organic aerosol in Los Angeles during the CalNex 2010 study, Atmos. Chem. Phys., 13, 10125–10141, https://doi.org/10.5194/acp-13-10125-2013, 2013. a, b
Huang, L., Brook, J. R., Zhang, W., Li, S. M., Graham, L., Ernst, D., Chivulescu, A., and Lu, G.: Stable isotope measurements of carbon fractions (OC/EC) in airborne particulate: A new dimension for source characterization and apportionment, Atmos. Environ., 40, 2690–2705, https://doi.org/10.1016/j.atmosenv.2005.11.062, 2006. a
Jayaraman, A., Lubin, D., Ramachandran, S., Ramanathan, V., Woodbridge, E., Collins, W. D., and Zalpuri, K. S.: Direct observations of aerosol radiative forcing over the tropical Indian Ocean during the January–February 1996 pre-INDOEX cruise, J. Geophys. Res.-Atmos., 103, 13827–13836, https://doi.org/10.1029/98JD00559, 1998. a
Jonson, J. E., Fagerli, H., Scheuschner, T., and Tsyro, S.: Modelling changes in secondary inorganic aerosol formation and nitrogen deposition in Europe from 2005 to 2030, Atmos. Chem. Phys., 22, 1311–1331, https://doi.org/10.5194/acp-22-1311-2022, 2022 a
Kirillova, E. N., Andersson, A., Sheesley, R. J., Kruså, M., Praveen, P. S., Budhavant, K., Safai, P. D., Rao, P. S. P., and Gustafsson, Ö.: 13C- and 14C-based study of sources and atmospheric processing of water-soluble organic carbon (WSOC) in South Asian aerosols, J. Geophys. Res.-Atmos., 118, 614–626, https://doi.org/10.1002/jgrd.50130, 2013. a
Levin, I., Naegler, T., Kromer, B., Diehl, M., Francey, R., Gomez-Pelaez, A., Steele, P., Wagenbach, D., Weller, R., and Worthy, D.: Observations and modelling of the global distribution and long-term trend of atmospheric 14CO2, Tellus B, 62, 26–46, https://doi.org/10.1111/j.1600-0889.2009.00446.x, 2010. a, b
Liu, Y., Cain, J. P., Wang, H., and Laskin, A.: Kinetic Study of Heterogeneous Reaction of Deliquesced NaCl Particles with Gaseous HNO3 Using Particle-on-Substrate Stagnation Flow Reactor Approach, J. Phys. Chem. A, 111, 10026–10043, https://doi.org/10.1021/jp072005p, 2007. a
Martinsson, J., Andersson, A., Sporre, M. K., Friberg, J., Kristensson, A., Swietlicki, E., Olsson, P.-A., and Eriksson Stenström, K.: Evaluation of δ13C in Carbonaceous Aerosol Source Apportionment at a Rural Measurement Site, Aerosol Air Qual. Res., 17, 2081–2094, https://doi.org/10.4209/aaqr.2016.09.0392, 2017. a
Masalaite, A., Holzinger, R., Remeikis, V., Röckmann, T., and Dusek, U.: Characteristics, sources and evolution of fine aerosol (PM1) at urban, coastal and forest background sites in Lithuania, Atmos. Environ., 148, 62–76, https://doi.org/10.1016/j.atmosenv.2016.10.038, 2017. a
Masalaite, A., Holzinger, R., Ceburnis, D., Remeikis, V., Ulevičius, V., Röckmann, T., and Dusek, U.: Sources and atmospheric processing of size segregated aerosol particles revealed by stable carbon isotope ratios and chemical speciation, Environ. Pollut., 240, 286–296, https://doi.org/10.1016/j.envpol.2018.04.073, 2018. a, b
Masalaite, A., Remeikis, V., Zenker, K., Westra, I., Meijer, H. A. J., and Dusek, U.: Seasonal changes of sources and volatility of carbonaceous aerosol at urban, coastal and forest sites in Eastern Europe (Lithuania), Atmos. Environ., 225, 117374, https://doi.org/10.1016/j.atmosenv.2020.117374, 2020. a, b, c, d
Masalaite, A., Holzinger, R., Plukis, A., Kairys, N., Meijer, H. A. J., and Dusek, U.: Chemical and isotopic characterization of carbonaceous aerosol particles from burning of different fuels, Atmos. Res., 336, 108895, https://doi.org/10.1016/j.atmosres.2026.108895, 2026. a, b, c
Matthias, V., Bewersdorff, I., Aulinger, A., and Quante, M.: The contribution of ship emissions to air pollution in the North Sea regions, Environ. Pollut., 158, 2241–2250, https://doi.org/10.1016/j.envpol.2010.02.013, 2010. a
McMeeking, G. R., Bart, M., Chazette, P., Haywood, J. M., Hopkins, J. R., McQuaid, J. B., Morgan, W. T., Raut, J.-C., Ryder, C. L., Savage, N., Turnbull, K., and Coe, H.: Airborne measurements of trace gases and aerosols over the London metropolitan region, Atmos. Chem. Phys., 12, 5163–5187, https://doi.org/10.5194/acp-12-5163-2012, 2012. a
Mensah, A. A., Holzinger, R., Otjes, R., Trimborn, A., Mentel, Th. F., ten Brink, H., Henzing, B., and Kiendler-Scharr, A.: Aerosol chemical composition at Cabauw, The Netherlands as observed in two intensive periods in May 2008 and March 2009, Atmos. Chem. Phys., 12, 4723–4742, https://doi.org/10.5194/acp-12-4723-2012, 2012. a
Meusinger, C., Dusek, U., King, S. M., Holzinger, R., Rosenørn, T., Sperlich, P., Julien, M., Remaud, G. S., Bilde, M., Röckmann, T., and Johnson, M. S.: Chemical and isotopic composition of secondary organic aerosol generated by α-pinene ozonolysis, Atmos. Chem. Phys., 17, 6373–6391, https://doi.org/10.5194/acp-17-6373-2017, 2017. a
Millero, F. J.: Chemical oceanography, 2nd edn., CRC Press, ISBN 978-0-8493-8423-3, 1996. a
Moroni, B., Cappelletti, D., Ferrero, L., Crocchianti, S., Busetto, M., Mazzola, M., Becagli, S., Traversi, R., and Udisti, R.: Local vs. long-range sources of aerosol particles upon Ny-Ålesund (Svalbard Islands): mineral chemistry and geochemical records, Rend. Fis. Acc. Lincei, 27, 115–127, https://doi.org/10.1007/s12210-016-0533-7, 2016. a
Myhre, G., Shindell, D., Bréon, F.-M., Collins, W., Fuglestvedt, J., Huang, J., Koch, D., Lamarque, J.-F., Lee, D., Mendoza, B., Nakajima, T., Robock, A., Stephens, G., Takemura, T., and Zhang, H.: Anthropogenic and Natural Radiative Forcing, in: Climate Change 2013: The Physical Science Basis. Contribution of Working Group I to the Fifth Assessment Report of the Intergovernmental Panel on Climate Change, edited by: Stocker, T., Qin, D., Plattner, G.-K., Tignor, M., Allen, S., Boschung, J., Nauels, A., Xia, Y., Bex, V., and Midgley, P., chap. 8, 659–740, Cambridge University Press, Cambridge, United Kingdom and New York, NY, USA, ISBN 978-1-107-66182-0, https://doi.org/10.1017/CBO9781107415324.018, 2013. a
Nel, A.: Air Pollution-Related Illness: Effects of Particles, Science, 308, 804–806, https://doi.org/10.1126/science.1108752, 2005. a
Ni, H., Huang, R.-J., Yao, P., Cosijn, M. M., Kairys, N., Zhong, H., and Dusek, U.: Organic aerosol formation and aging processes in Beijing constrained by size-resolved measurements of radiocarbon and stable isotopic 13C, Environ. Int., 158, 106890, https://doi.org/10.1016/j.envint.2021.106890, 2022. a, b, c, d, e, f, g, h
Ni, H., Yao, P., Zhu, C., Qu, Y., Tian, J., Ma, Y., Yang, L., Zhong, H., Huang, R.-J., and Dusek, U.: Non-Fossil Origin Explains the Large Seasonal Variation of Highly Processed Organic Aerosol in the Northeastern Tibetan Plateau (3,200 m a.s.l.), Geophys. Res. Lett., 50, e2023GL104710, https://doi.org/10.1029/2023GL104710, 2023. a, b
O'Leary, M. H.: Carbon Isotopes in Photosynthesis: Fractionation techniques may reveal new aspects of carbon dynamics in plants, BioScience, 38, 328–336, https://doi.org/10.2307/1310735, 1988. a
Pope III, C. A. and Dockery, D. W.: Health Effects of Fine Particulate Air Pollution: Lines that Connect, J. Air Waste Manage., 56, 709–742, https://doi.org/10.1080/10473289.2006.10464485, 2006. a
Pöschl, U.: Atmospheric Aerosols: Composition, Transformation, Climate and Health Effects, Angew. Chem. Int. Edit., 44, 7520–7540, https://doi.org/10.1002/anie.200501122, 2005. a, b
Putaud, J.-P., Raes, F., Van Dingenen, R., Brüggemann, E., Facchini, M.-C., Decesari, S., Fuzzi, S., Gehrig, R., Hüglin, C., Laj, P., Lorbeer, G., Maenhaut, W., Mihalopoulos, N., Müller, K., Querol, X., Rodriguez, S., Schneider, J., Spindler, G., ten Brink, H., Tørseth, K., and Wiedensohler, A.: A European aerosol phenomenology – 2: chemical characteristics of particulate matter at kerbside, urban, rural and background sites in Europe, Atmos. Environ., 38, 2579–2595, https://doi.org/10.1016/j.atmosenv.2004.01.041, 2004. a
Reimer, P. J., Brown, T. A., and Reimer, R. W.: Discussion: Reporting and Calibration of post-bomb 14C Data, Radiocarbon, 46, 1299–1304, https://doi.org/10.1017/S0033822200033154, 2004. a
Rolph, G., Stein, A., and Stunder, B.: Real-time Environmental Applications and Display sYstem: READY, Environ. Modell. Softw., 95, 210–228, https://doi.org/10.1016/j.envsoft.2017.06.025, 2017. a
Schimmelmann, A., Qi, H., Coplen, T. B., Brand, W. A., Fong, J., Meier-Augenstein, W., Kemp, H. F., Toman, B., Ackermann, A., Assonov, S., Aerts-Bijma, A. T., Brejcha, R., Chikaraishi, Y., Darwish, T., Elsner, M., Gehre, M., Geilmann, H., Gröning, M., Hélie, J.-F., Herrero-Martín, S., Meijer, H. A. J., Sauer, P. E., Sessions, A. L., and Werner, R. A.: Organic Reference Materials for Hydrogen, Carbon, and Nitrogen Stable Isotope-Ratio Measurements: Caffeines, n-Alkanes, Fatty Acid Methyl Esters, Glycines, L-Valines, Polyethylenes, and Oils, Anal. Chem., 88, 4294–4302, https://doi.org/10.1021/acs.analchem.5b04392, 2016. a
Schlag, P., Kiendler-Scharr, A., Blom, M. J., Canonaco, F., Henzing, J. S., Moerman, M., Prévôt, A. S. H., and Holzinger, R.: Aerosol source apportionment from 1-year measurements at the CESAR tower in Cabauw, the Netherlands, Atmos. Chem. Phys., 16, 8831–8847, https://doi.org/10.5194/acp-16-8831-2016, 2016. a
Schuur, E. A. G., Druffel, E., and Trumbore, S. E.: Radiocarbon and Climate Change – Mechanisms, Applications and Laboratory Techniques, Springer Cham, ISBN 978-3-319-25641-2, 2016. a
Stein, A. F., Draxler, R. R., Rolph, G. D., Stunder, B. J. B., Cohen, M. D., and Ngan, F.: NOAA's HYSPLIT Atmospheric Transport and Dispersion Modeling System, B. Am. Meteorol. Soc., 96, 2059–2077, https://doi.org/10.1175/BAMS-D-14-00110.1, 2015. a
Synal, H.-A., Stocker, M., and Suter, M.: MICADAS: A new compact radiocarbon AMS system, Nucl. Instrum. Meth. B, 259, 7–13, https://doi.org/10.1016/j.nimb.2007.01.138, 2007. a
Szidat, S., Jenk, T. M., Synal, H.-A., Kalberer, M., Wacker, L., Hajdas, I., Kasper-Giebl, A., and Baltensperger, U.: Contributions of fossil fuel, biomass-burning, and biogenic emissions to carbonaceous aerosols in Zurich as traced by 14C, J. Geophys. Res.-Atmos., 111, D07206, https://doi.org/10.1029/2005JD006590, 2006. a
ten Brink, H. M.: Reactive uptake of HNO3 and H2SO4 in sea-salt (NaCl) particles, J. Aerosol Sci., 29, 57–64, https://doi.org/10.1016/S0021-8502(97)00460-6, 1998. a
Turšič, J., Podkrajšek, B., Grgić, I., Ctyroky, P., Berner, A., Dusek, U., and Hitzenberger, R.: Chemical composition and hygroscopic properties of size-segregated aerosol particles collected at the Adriatic coast of Slovenia, Chemosphere, 63, 1193–1202, https://doi.org/10.1016/j.chemosphere.2005.08.040, 2006. a, b
Vernooij, R., Dusek, U., Popa, M. E., Yao, P., Shaikat, A., Qiu, C., Winiger, P., van der Veen, C., Eames, T. C., Ribeiro, N., and van der Werf, G. R.: Stable carbon isotopic composition of biomass burning emissions – implications for estimating the contribution of C3 and C4 plants, Atmos. Chem. Phys., 22, 2871–2890, https://doi.org/10.5194/acp-22-2871-2022, 2022. a, b
Wacker, L., Christl, M., and Synal, H.-A.: Bats: A new tool for AMS data reduction, Nucl. Instrum. Meth. B, 268, 976–979, https://doi.org/10.1016/j.nimb.2009.10.078, 2010. a
Warneck, P.: Chemistry of the Natural Atmosphere, Academic Press, 2nd Edn., ISBN 9780080529066, 1999. a, b
Weijers, E. P., Schaap, M., Nguyen, L., Matthijsen, J., Denier van der Gon, H. A. C., ten Brink, H. M., and Hoogerbrugge, R.: Anthropogenic and natural constituents in particulate matter in the Netherlands, Atmos. Chem. Phys., 11, 2281–2294, https://doi.org/10.5194/acp-11-2281-2011, 2011. a, b
Wever, D., Coenen, P. W. H. G., Dröge, R., Geilenkirchen, G. P., van Huijstee, J., 't Hoen, M., Honig, E., te Molder, R. A. B., Smeets, W. L. M., van Zanten, M. C., and van der Zee, T.: Informative Inventory Report 2021: Emissions of Transboundary Air Pollutants in the Netherlands 1990–2019, Tech. Rep. 2021-0005, National Institute for Public Health and the Environment (RIVM), Bilthoven, the Netherlands, https://doi.org/10.21945/RIVM-2021-0005, 2021. a
Yao, P., Huang, R.-J., Ni, H., Kairys, N., Yang, L., Meijer, H. A., and Dusek, U.: 13C signatures of aerosol organic and elemental carbon from major combustion sources in China compared to worldwide estimates, Sci. Total Environ., 810, 151284, https://doi.org/10.1016/j.scitotenv.2021.151284, 2022a. a
Yao, P., Ni, H., Paul, D., Masalaite, A., Huang, R.-J., Meijer, H. A., and Dusek, U.: An automated method for thermal-optical separation of aerosol organic/elemental carbon for 13C analysis at the sub-µgC level: A comprehensive assessment, Sci. Total Environ., 804, 150031, https://doi.org/10.1016/j.scitotenv.2021.150031, 2022b. a
Yttri, K. E., Simpson, D., Nøjgaard, J. K., Kristensen, K., Genberg, J., Stenström, K., Swietlicki, E., Hillamo, R., Aurela, M., Bauer, H., Offenberg, J. H., Jaoui, M., Dye, C., Eckhardt, S., Burkhart, J. F., Stohl, A., and Glasius, M.: Source apportionment of the summer time carbonaceous aerosol at Nordic rural background sites, Atmos. Chem. Phys., 11, 13339–13357, https://doi.org/10.5194/acp-11-13339-2011, 2011. a
Zenker, K., Sirignano, C., Riccio, A., Chianese, E., Calfapietra, C., Prati, M. V., Masalaite, A., Remeikis, V., Mook, E., Meijer, H. A. J., and Dusek, U.: δ13C signatures of organic aerosols: Measurement method evaluation and application in a source study, J. Aerosol Sci., 145, 105534, https://doi.org/10.1016/j.jaerosci.2020.105534, 2020. a, b, c, d, e, f, g, h, i, j, k
Zenker, K., Kasper-Giebl, A., Redl, P., and Dusek, U.: Dataset for “Measurement report: Size-resolved seasonal study of inorganic ions and isotopic carbon signatures of aerosol particles at the Wadden Sea”, Zenodo [data set], https://doi.org/10.5281/zenodo.19990975, 2026. a, b, c
Zotter, P., El Haddad, I., Zhang, Y., Hayes, P. L., Zhang, X., Lin, Y.-H., Wacker, L., Schnelle-Kreis, J., Abbaszade, G., Zimmermann, R., Surratt, J. D., Weber, R., Jimenez, J. L., Szidat, S., Baltensperger, U., and Prévôt, A. S. H.: Diurnal cycle of fossil and nonfossil carbon using radiocarbon analyses during CalNex, J. Geophys. Res.-Atmos., 119, 6818–6835, https://doi.org/10.1002/2013JD021114, 2014. a