
the Creative Commons Attribution 4.0 License.
the Creative Commons Attribution 4.0 License.
 | 11 Nov 2026
Drivers of biogenic secondary organic aerosol from the past to the future

Colette L. Heald
Jesse H. Kroll
Biogenic secondary organic aerosol (SOA) makes up a substantial fraction of atmospheric fine particulate mass, with implications for climate and human health. However, its chemical formation processes remain poorly understood and are often oversimplified in 3D models. Recent studies have found that the peroxy radical (RO2) isomerization and the RO2 accretion reactions (RO2 + RO2) can lead to SOA formation. We expand the RO2 chemical mechanism in the Community Earth System Model version 2 to include these two additional pathways for biogenic SOA formed through the OH oxidation of volatile organic compounds (VOCs). Using this mechanism, we quantify the contribution of each RO2 pathway to biogenic SOA formation and examine how these contributions evolve from the pre-industrial (PI) to present-day (PD) and future (F). We find that in PD conditions, RO2 isomerization accounts for nearly half of monoterpene SOA, while the contribution from RO2 + RO2 pathways is minor. From PI to F, the RO2 fate varies in response to atmospheric NOx levels and climate, but the contribution from RO2 isomerization is consistently high for monoterpenes, underscoring the importance of representing this pathway in SOA parameterizations. Total biogenic SOA formed through OH oxidation decreases by 41 % from PI to PD and increases by 112 % from PD to F. This evolution from PI to F is largely driven by changes in biogenic VOC emissions, rather than shifts in chemistry or thermodynamic partitioning. Our results highlight the need to better constrain RO2 pathways for SOA formation through laboratory studies and represent this RO2 chemistry in SOA modeling.
- Article
(17522 KB) - Full-text XML
-
Supplement
(1390 KB) - BibTeX
- EndNote


Aerosols impact the Earth's climate by directly scattering and absorbing radiation as well as indirectly altering cloud properties (Forster et al., 2021). They also contribute to air pollution and the associated harm to human health (Burnett et al., 2018). Organic aerosol (OA) makes up a substantial fraction (20 %–90 %) of submicron particulate mass in the troposphere, with formation of secondary organic aerosol (SOA) generally outweighing primary OA (Jimenez et al., 2009; Zhang et al., 2007). Biogenic sources are estimated to be a major contributor to global SOA formation (Hallquist et al., 2009; Hodzic et al., 2016; Kanakidou et al., 2005; Tilmes et al., 2019). Despite this, there remain large uncertainties in our understanding of biogenic SOA, largely due to the complex chemical processes involved in the formation of SOA.
SOA is formed through the oxidation of volatile organic compounds (VOCs) followed by gas-to-particle conversion of the products. VOC oxidation generates organic peroxy radicals (RO2), the chemical fate of which is a determining factor in SOA formation. Historically, chamber studies explored SOA formation when RO2 reacts with NO under high-NOx (polluted) conditions and with HO2 under low-NOx (clean) conditions (Kroll et al., 2005, 2006; Ng et al., 2007; Song et al., 2005). For small biogenic VOC (BVOC) molecules (e.g., isoprene and monoterpenes), the SOA yields (i.e., the mass of SOA formed per mass of VOC reacted) are generally larger for the RO2 + HO2 pathway than the RO2 + NO pathway, because the products formed from the former reaction are less volatile (Kroll et al., 2006; Presto et al., 2005). But this NOx dependence is reversed in the oxidation of large VOC molecules (e.g., sesquiterpenes) (Ng et al., 2007).
Recent studies have elucidated additional RO2 reaction pathways for SOA formation. Chamber experiments on α-pinene oxidation have shown that RO2 unimolecular isomerization, also known as autooxidation, generates large amounts of extremely low-volatility products that can easily condense to form SOA (Ehn et al., 2014). The reaction rates of isomerization highly depend on the chemical structures of RO2 (Bianchi et al., 2019; Vereecken and Nozière, 2020; Otkjær et al., 2018; Borcher et al., 2026). For some RO2 species, the isomerization is sufficiently fast and can outcompete bimolecular reactions (Xu et al., 2019; Xu et al., 2022). Also, isomerization rates exhibit a large positive temperature dependence, enhancing the relative importance of this pathway at higher temperatures (Bianchi et al., 2019). In addition, chamber experiments with α-pinene and aromatic compounds have revealed that RO2 self- and cross- reactions (i.e., RO2 + RO2 reactions) can rapidly form accretion (dimer) products, which feature remarkably low volatility and are thus effective sources for SOA (Berndt et al., 2018a, b; Zhao et al., 2018). The reaction rates of the RO2 + RO2 reactions are highly uncertain, with measured rates varying by up to 2 orders of magnitude in these chamber studies.
VOC oxidation and the subsequent RO2 chemistry are often simplified in SOA parameterizations in regional and global models. In earlier models lacking comprehensive chemical mechanisms, emissions of SOA or gas-phase condensable organic products were scaled directly from VOC emissions with fixed mass yields (Chin et al., 2002; Colarco et al., 2010; Liu et al., 2012). A more advanced approach is to oxidize VOC into two or more condensable product bins (Bergman et al., 2022; Chung and Seinfeld, 2002; Hoyle et al., 2007; Lou et al., 2020; Tilmes et al., 2019; Tsimpidi et al., 2014). However, this method does not account for the NOx dependence of the RO2 fate, and some models use only the low-NOx conditions for biogenic SOA, assuming that most biogenic emissions are oxidized in relatively clean environments (e.g., Lou et al., 2020; Tilmes et al., 2019; Tsimpidi et al., 2014). The first explicit treatment of NOx-dependent RO2 chemistry was introduced by Henze et al. (2008), who parameterized aromatic SOA yields from both the low-NOx and high-NOx pathways as products of the RO2 + HO2 and RO2 + NO reactions, respectively. Some large-scale models have adopted this approach for both anthropogenic and biogenic SOA (Hodzic et al., 2016; Jo et al., 2021; Pye et al., 2010). More recently, a few attempts have been made to include the isomerization and RO2 + RO2 reaction pathways with more comprehensive RO2 chemistry in large scale models (Mayhew et al., 2025; Xu et al., 2022; Zhao et al., 2020, 2024). Xu et al. (2022) represent the two pathways for RO2 generated from isoprene and monoterpene OH reactions and ozonolysis in a chemical transport model. However, they do not couple the gas-phase chemistry with aerosol formation and use the formed low-volatility gas-phase products as an analogue for SOA. Mayhew et al. (2025) examined the accretion reactions for all the RO2 generated in the same chemical transport model, but the isomerization of terpene RO2 is precluded. Zhao et al. (2020) developed an RO2-pathway (including autooxidation and dimerization) SOA formation scheme for monoterpenes, which they implement in a regional model over the Amazon. This scheme was subsequently implemented in a global climate model to better simulate organic-mediated nucleation (Zhao et al., 2024). To our knowledge, the impact of these two newly identified RO2 fates on total biogenic SOA formation has not yet been explored in a global model.
The RO2 fate and biogenic SOA formation under different climate conditions are controlled by complex interactions between natural biogenic VOC emissions, anthropogenic emissions, and climate factors (e.g., temperature, CO2 concentrations). For example, global biogenic VOC emissions are influenced by anthropogenic land use change (Heald and Geddes, 2016; Shi et al., 2025; Unger, 2014), temperatures (Guenther et al., 2012), and CO2 level (Arneth et al., 2007; Heald et al., 2009). Changes in anthropogenic NO emissions may perturb the RO2 + NO pathway and thus shift the RO2 fate and SOA formation (Jo et al., 2021). Also, global warming from the past to the future may lead to opposing effects – increasing SOA formation through accelerating RO2 isomerization while reducing SOA by pushing gas-particle partitioning toward the gas-phase. The role of these factors on biogenic SOA formation remains poorly constrained, partly due to a lack of representation of comprehensive RO2 chemistry in the SOA parameterizations in global climate models. As a result, the SOA loadings under different climate conditions are not well assessed, which imposes large uncertainties in the aerosol-induced climate radiative forcing and potential climate feedback involving biogenic SOA.
In this study, we incorporate the latest understanding of RO2 chemistry for biogenic SOA initially formed from gas-phase OH-initiated oxidation in a global climate model. We focus on the fate of the initial RO2 formed upon VOC oxidation. We note that SOA can also form through VOC reaction with other oxidants (e.g., O3 and NO3) and through multiphase chemistry. Although these pathways also involve RO2 chemistry, their specific RO2 fates are not the primary focus of this study and thus they are excluded from our analysis. Our work aims to answer three questions: (1) How does our recent understanding of RO2 fate alter the global simulated burden of OH-initiated biogenic SOA?; (2) What fraction of RO2 undergoes each reaction pathway (i.e., RO2 fate) and how much SOA is formed through each pathway?; and (3) How does the burden of SOA and RO2 fate change from the past to the present and to the future?
2.1 CESM2.2
Our study uses the Community Earth System Model version 2.2 (CESM2.2; Danabasoglu et al., 2020). The atmosphere component of CESM2.2 is the Community Atmosphere Model version 6 with full chemistry (CAM6-Chem; Emmons et al., 2020). CAM6-Chem incorporates the MOZART-TS2 gas-phase chemistry (Model of Ozone And Related chemical Tracers; Schwantes et al., 2020) with the volatility basis set (VBS) scheme for SOA formation (Tilmes et al., 2019). The VBS scheme considers the OH, O3, and NO3 gas-phase oxidation of six BVOC species, including isoprene (ISOP), four monoterpenes (MTERP) – α-pinene (APIN), β-pinene (BPIN), limonene (LIMON), and myrcene (MYRC) – and one lumped sesquiterpene, beta-caryophyllene (BCARY). Our work focuses on ISOP and MTERP. BCARY SOA is not considered, due to the large uncertainties surrounding the reaction sequence leading to formation and negligible contribution (<1 %) to total OH-initiated biogenic SOA. The OH-oxidation accounts for the high-NOx (RO2 + NO) and low-NOx (RO2 + HO2) conditions (Hodzic et al., 2016; Jo et al., 2021) (Table 1). The VBS reactions produce semi-volatile SOA precursor gases (SOAG) into five logarithmically spaced bins based on their saturation concentration (C*). These bins have C* of 0.01, 0.1, 1, 10, and 100 µg m−3 at 300 K and are designated as SOAG0, SOAG1, SOAG2, SOAG3, SOAG4 in the model, respectively. The enthalpy of vaporization (ΔHvap) for the five bins is 153, 142, 131, 120, and 109 kJ mol−1 (Epstein et al., 2010; Hodzic et al., 2016), respectively. The SOAGs undergo gas-aerosol partitioning and form SOA in the Aitken and accumulation modes of the 4-mode version of the Modal Aerosol Model (MAM4; Liu et al., 2016). SOA is subject to photolysis loss at a constant rate of 0.04 % of (Hodzic et al., 2015). The MOZART-TS2 gas phase mechanism includes a more comprehensive BVOC gas-phase oxidation than is treated in the default VBS scheme. In addition to the reactions of RO2s with HO2 and NO, its OH-oxidation mechanism includes the reactions of MTERP RO2s with NO3, CH3O2, CH3CO3, and selected RO2 species, as well as reactions of ISOP RO2s with CH3O2 and CH3CO3, along with the isomerization and dissociation of ISOP RO2s. These additional RO2 loss pathways are not connected to SOA simulation. Also, the MOZART-TS2 reactions do not form SOAG.
Table 1BVOC OH oxidation and RO2 reactions in default CAM6-Chem VBS. For simplicity in this table, we use MTERP to represent the four monoterpenes in CAM6-Chem (APIN, BPIN, LIMON, and MYRC). ISOPO2VBS (C5H9O3) and MTERPO2VBS (C10H17O3) are first-generation peroxy radicals formed from isoprene (ISOP) and monoterpene (MTERP) oxidation by OH in VBS, respectively. Chemical formula for other species can be found in Table S2 of Schwantes et al. (2020).
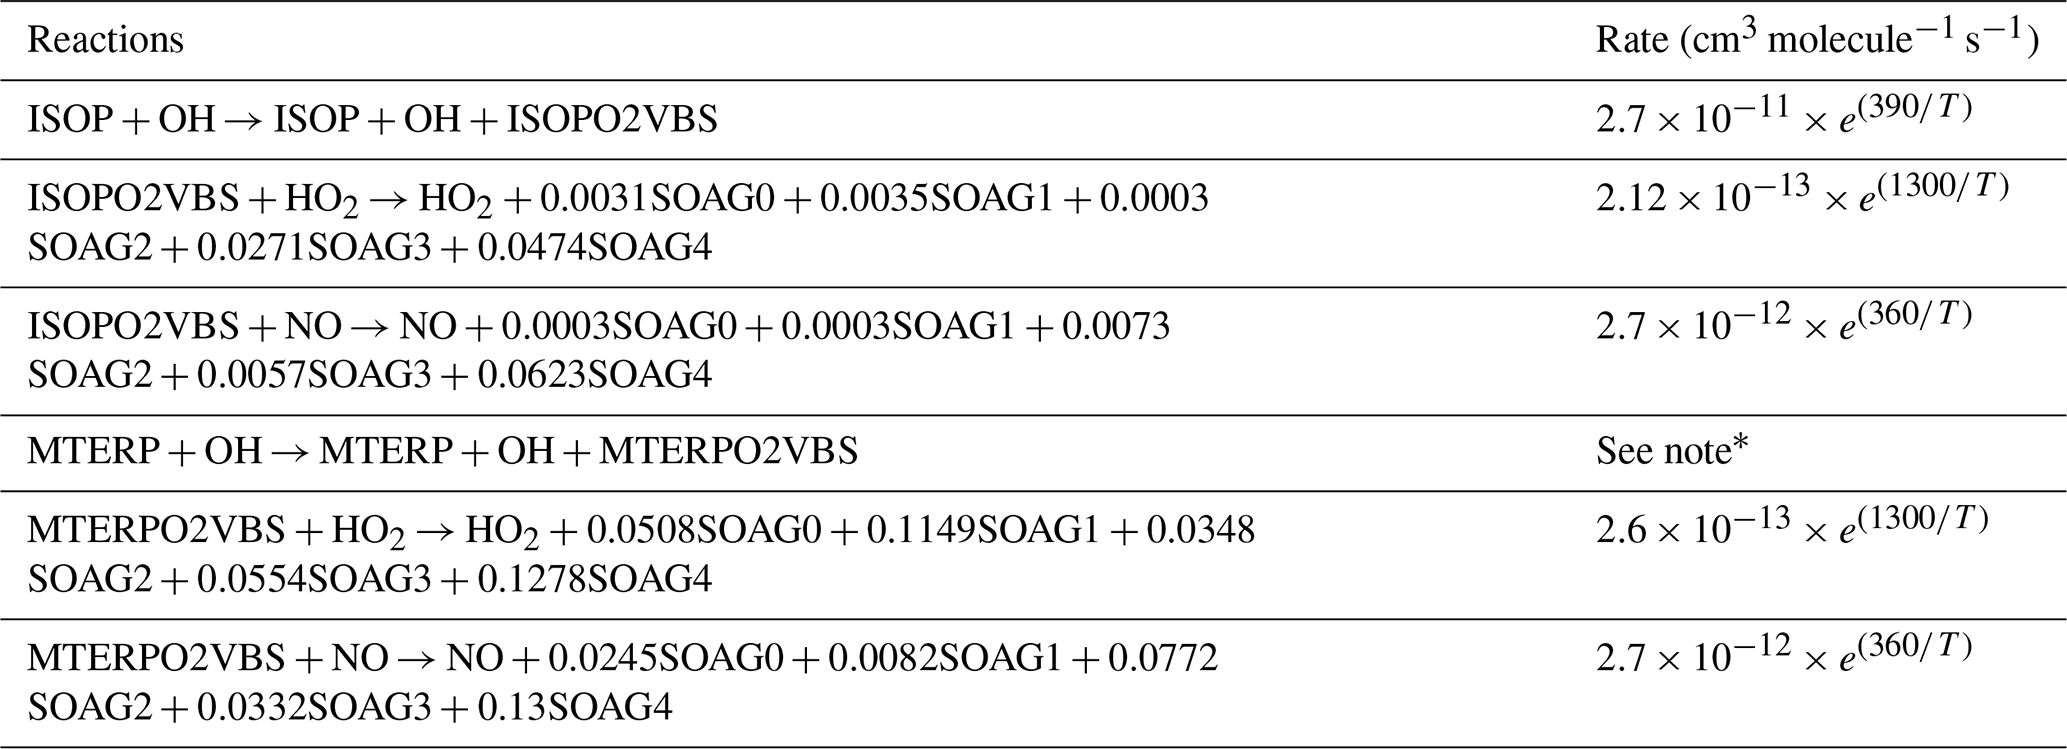
* The reaction rates for the OH oxidation of APIN, BPIN, LIMON, and MYRC are , , , and cm3 molecule−1 s−1, respectively.
CAM6-Chem is coupled with the land component of CESM2 – the Community Land Model version 5 (CLM5, Lawrence et al., 2019). The model is run with the satellite phenology biogeochemistry configuration, where the land use and leaf area index are prescribed and not impacted by changes in CO2 and climate. CLM5 includes the Model of Emissions of Gases and Aerosols from Nature (MEGAN) version 2.1 (Guenther et al., 2012), which prognostically calculates BVOC emissions accounting for vegetation types, light, temperature, leaf age, and CO2. In MEGAN, ISOP emissions are inhibited by elevated CO2 level (Heald et al., 2009), while this effect does not influence MTERP emissions.
2.2 Expanded RO2 chemistry
To improve the representation of biogenic SOA formation, we expand the RO2 chemistry in the VBS scheme. As mentioned above, we focus on the RO2 reactions related to OH-initiated biogenic SOA formation from MTERP and ISOP oxidation, which represents 58 % of total biogenic SOA in the baseline CAM6-chem under present-day (PD) climate conditions (estimated from the BASE experiment as described in Sect. 2.4). Hereafter, the RO2 reactions and the formed SOA exclusively refer to those initiating from + OH reactions. We note that our mechanism focuses on gas-phase reactions, whereas the SOA formation through heterogeneous chemistry is not considered as in baseline CAM6-Chem and many other models (e.g., Lou et al., 2020; Bergman et al., 2022; Kirkevåg et al., 2018). The aqueous-phase reactions are particularly important for isoprene SOA formation (Marais et al., 2016; Paulot et al., 2009). Ignoring these pathways may overemphasize sensitivity to volatility and overlook the impact of SO2 emissions on SOA formation through perturbations in aerosol acidity (Jo et al., 2021; Marais et al., 2016). Also, we only represent the fate of the first generation RO2, though later generation RO2 are included in the RO2 + RO2 reactions (see below for more details). Following the treatment in default MOZART-TS2, the RO2 formed from the four MTERPs are lumped together in the modified VBS and assumed to have the same yields and reaction rates for the RO2 reactions, due to a lack of comprehensive speciated data. We note that MTERP species have different structures and thus different distributions of reaction products. For example, LIMON has been found to have generally higher SOA yields than the other MTERPs (Lee et al., 2006; Pye et al., 2010). Therefore, the lumping treatment may bias the MTERP SOA burden and distributions.
Our modifications primarily focus on incorporating isomerization and RO2 + RO2 reactions for the first-generation MTERP-RO2 (Table 2). Following Pye et al. (2019), we allow 22 % of the formed MTERP-RO2 to undergo isomerization and with a 50 % yield to the lowest volatility bin of SOAG (SOAG0) (Table 2, part 1). This is implemented by partitioning the total MTERP-RO2 into two species (0.78 and 0.22 fractions) that undergo identical chemistry, except that only the latter is allowed to isomerize. The 22 % branching ratio is taken from the revised product yield of APINCO2 in the Table S1 of Pye et al. (2019), following the mechanism in Berndt et al. (2016) and Vereecken et al. (2007). The 50 % SOA yield is calculated following Eq. (S1) from Pye et al (2019) and their Table S2. To maintain computational efficiency and accommodate the complexity of the chemical mechanism in global models (consistent with the representation of other RO2 pathways in the VBS), we collapse the multi-step autooxidation in Pye et al. (2019) into a single-step reaction, by only representing the first-generation branching point and the final SOA yield. In the original mechanism of Pye et al. (2019), the subsequent reactions of the first generation RO2 and its products are also NOx-dependent, with reactions with NO forming volatile compounds and competing with subsequent autooxidation. The SOA yield (50 %) in our implementation is the maximum yield, assuming no subsequent competing bimolecular reactions. Therefore, our simplification does not fully represent the sensitivity of isomerization yields to NOx, which may particularly result in overestimation of SOA formation from isomerization under high-NOx conditions. This bias can influence our estimates of the SOA trends from the past to the future, as further discussed in Sect. 3.2. The temperature-dependent isomerization reaction rate was estimated using a rate constant of 0.28 s−1 at 293 K (Pye et al., 2019) and an activation energy barrier of 18 kcal mol−1 (Bianchi et al., 2019). It is important to note that the branching ratio, SOA yields, and reaction rates are subjected to significant uncertainties, and we have applied the values from Pye et al. (2019) for α-pinene to all monoterpenes. This may introduce substantial uncertainty into our mechanism, given differences in the related parameters for other MTERPs. For example, Piletic and Kleindienst (2022) suggest that the branching ratio of RO2 that can isomerize is similar for α-pinene and β-pinene but is likely higher for limonene. However, these uncertainties are generally poorly constrained. Also, the isomerization rate used in this study may lie at the lower end – Xu et al. (2019) reported unimolecular rate constants of 4 ± 2 and 16 ± 5 s−1 at 296 K for α-pinene and β-pinene, respectively. Nevertheless, even with these slower rates, isomerization remains relatively fast compared with competing bimolecular reactions, especially under clean and/or warm conditions (Fig. 1). Overall, more chamber experiments and ambient observations are needed to better constrain the MTERP-RO2 isomerization pathway. The fast rate, along with the high SOAG yields, leads to rapid production of large amounts of SOA from isomerization. Moreover, isomerization is highly temperature-dependent as compared to the bimolecular reactions (Fig. 1).
Table 2Newly implemented reactions for MTERP-RO2 (MTERPO2VBS) in VBS. Units for isomerization reaction rate constants are s−1 and those for the RO2 + RO2 reactions and other terpene RO2 reactions are cm3 molecule−1 s−1.
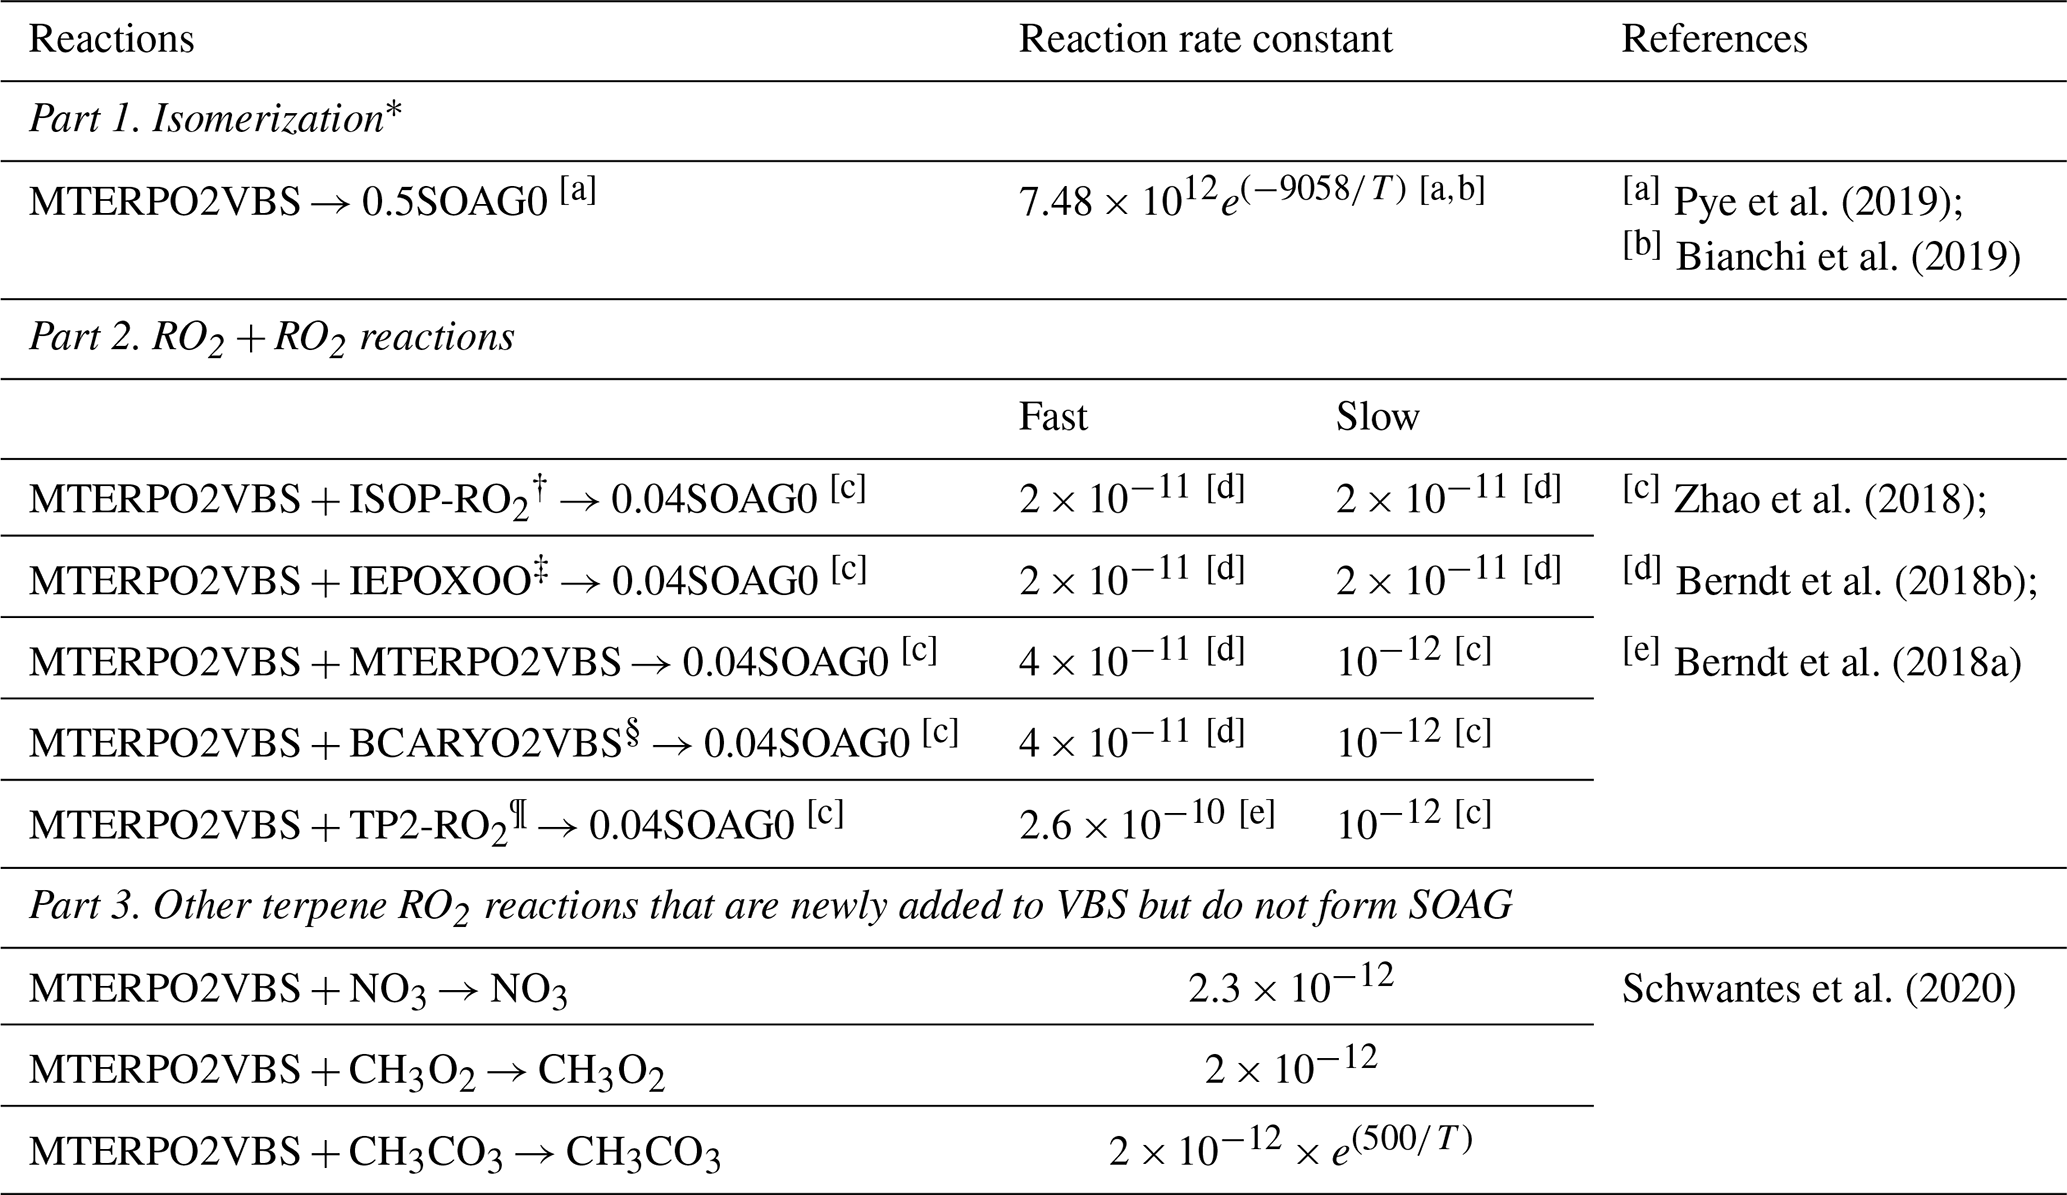
* Only 22 % of MTERPO2VBS can isomerize (Pye et al., 2019). † ISOP-RO2 denotes six first generation ISOP-RO2 species from MOZART-TS2, including ISOPED1O2, ISOPB1O2, ISOPZD1O2, ISOPED4O2, ISOPB4O2, and ISOPZD4O2. ‡ IEPOXOO (C5H9O5) is the peroxy radical formed from IEPOX + OH. § BCARYO2VBS (C15H25O3, also referred to as BCARY-RO2 in the text) is the first-generation RO2 generated from BCARY + OH. ¶ TP2-RO2 denotes RO2 formed through terpenes ozonolysis and those from the second and later generation oxidation in MOZART-TS2 (Schwantes et al., 2020), including TERP1OOHO2, TERP2OOHO2, TERPA1O2, TERPA2CO3, TERPA2O2, TERPA3CO3, TERPA3O2, TERPA4O2, TERPACO3, TERPF1O2, and TERPF2O2.
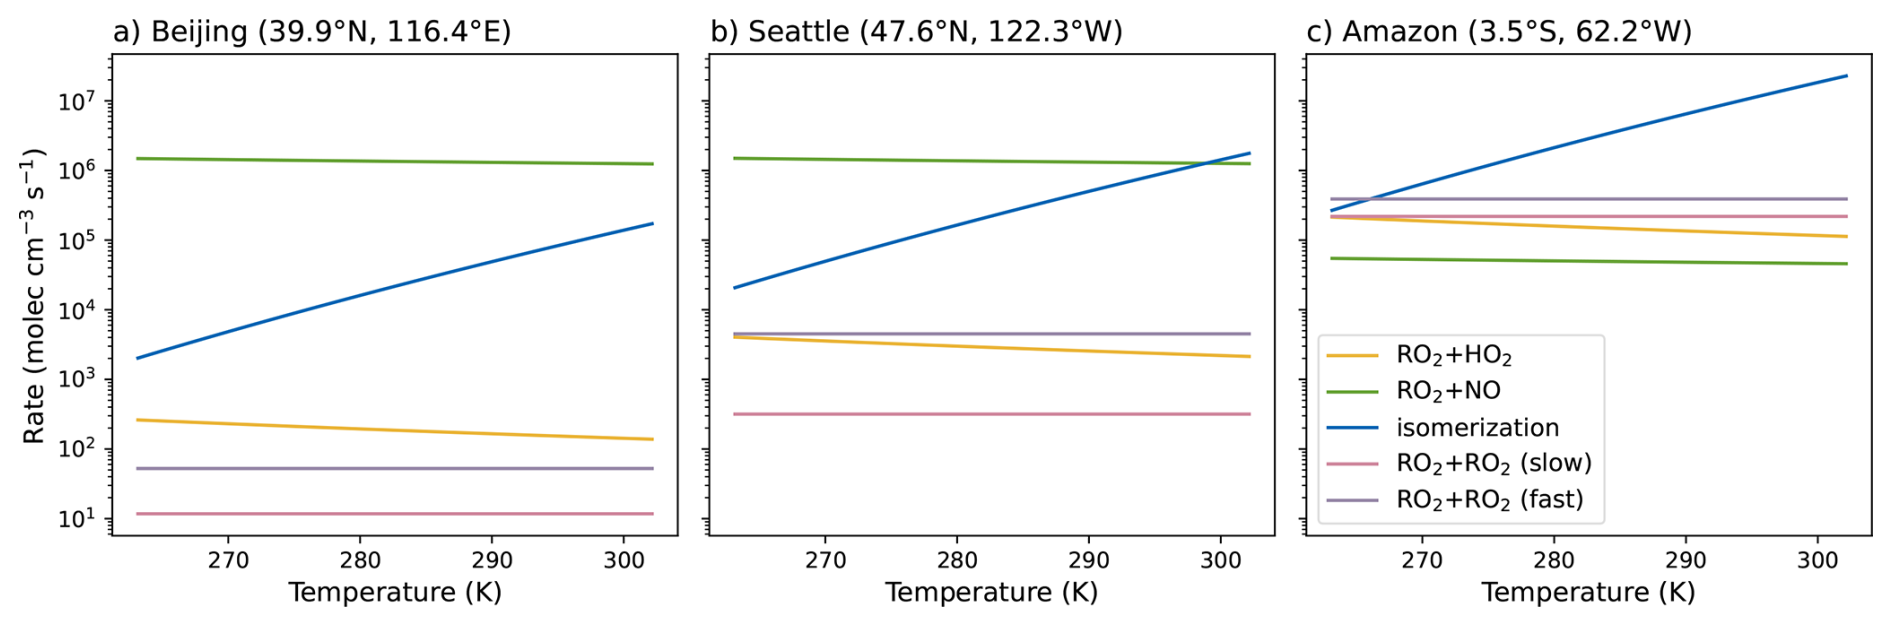
Figure 1Loss rates for various MTERP-RO2 reactions as a function of temperature at (a) Beijing, (b) Seattle, and (c) Amazon. The rates are calculated based on reactant concentrations in June from the NEW_slow experiment, except for the fast RO2 + RO2 reactions, which use results from the NEW_fast experiment.
Next, we introduce RO2 + RO2 for MTERP-RO2, considering the reactions with first-generation ISOP-RO2, IEPOXOO, first-generation MTERP-RO2 and BCARY-RO2 (formed through the BCARY + OH reaction), the terpene RO2 formed through terpene ozonolysis and the second or later generation oxidation (Table 2, part 2). These reactants are produced in MOZART-TS2. The reactions with nitrogen-containing biogenic RO2 and RO2 formed from the oxidation of other organics are not included. We note that for the same set of reactions, the rate coefficients reported by different laboratory studies vary by up to two orders of magnitude (Berndt et al., 2018a, b; Zhao et al., 2018), highlighting the substantial uncertainty associated with these reactions rates. Therefore, following Xu et al. (2022), we classified and tested the RO2 + RO2 reaction rates as either fast or slow combinations. Moreover, the SOA yields of the RO2 + RO2 reactions are another source of uncertainty. Zhao et al. (2018) conducted experiments on α-pinene oxidation and reported a lower-limit dimer formation branching ratio of 4 %. They estimated that the volatility of these accretion products is well below 0.01 µg m−3. Therefore, we assume all the RO2 + RO2 reactions form 4 % of SOAG0. This 4 % molar yield is also incorporated in the modeling study of Xu et al. (2022). However, it is noted that SOAG0 has a fixed molar mass of 250 g mol−1, while the molar mass of the accretion products varies from 302 to 438 g mol−1. Ideally, the molar yield should be scaled according to the molar mass ratio of the dimers to SOAG0, and our current fixed yield likely results in a modest underprediction of RO2 + RO2 SOA. In addition, this fixed yield is likely an uncertain simplification, since the yields of accretion products are expected to be higher for reactions involving larger and/or more oxygenated RO2 species (Berndt et al., 2018b; Franzon, 2023). The SOA formed through non-accretion products from the RO2 + RO2 reactions is neglected, which likely underpredicts SOA formed through this pathway. Overall, our representation of SOA formed through RO2 + RO2 reactions likely lies at the lower end. Moreover, to examine the RO2 fate and contribution to SOA formation from each reaction, we track SOA formed from individual BVOC reactions separately in our experiments. SOA formed through MTERP-RO2 + ISOP-RO2 are classified as MTERP SOA.
Finally, we characterize the fates of the RO2 that are included in the MOZART chemistry but do not form SOA in the VBS. For MTERP-RO2, we implement their reactions with NO3, CH3O2, and CH3CO3 in the VBS (Table 2, part 3). Assuming these reactions do not form SOA may result in some underprediction in total MTERP SOA amount. Mayhew et al. (2025) reported that reactions with CH3CO3 can contribute to regional SOA formation by implementing accretion reactions generated by a chemical mechanism generator into a chemical transport model. A laboratory study also implies that highly oxygenated organic compounds (HOM) alkoxy radicals formed through HOM-RO2 + RO2 reactions may undergo isomerization and propagate low volatility HOM formation (Kang et al., 2025). However, these pathways are not well constrained. For ISOP-RO2, instead of generating a new RO2 species (i.e., ISOPO2VBS in Table 1), we directly use the six ISOP-RO2 (ISOPED1O2, ISOPB1O2, ISOPZD1O2, ISOPED4O2, ISOPB4O2, and ISOPZD4O2) formed from the MOZART-TS2 chemistry in the RO2 + HO2 and RO2 + NO reactions in VBS (i.e., replace the ISOP reactions in Table 1 with those in Table 3, part 1). In this way, the VBS and MOZART-TS2 are coupled for ISOP-RO2, and additional key ISOP-RO2 reactions (isomerization, dissociation, and reactions with CH3O2, and CH3CO3) (Table 3, part 2) are considered in the VBS. These reactions do not form SOAG but represent additional loss pathways for RO2 within the VBS, which would reduce SOA formation via competition with the SOAG-producing reactions. In our mechanism, we assume that ISOP-RO2 isomerization does not form SOAG because the isomerization products are volatile (D'Ambro et al., 2017). However, a recent study found that isomerization of ISOP-RO2 forms SOA with molar yields of 0.13 %–0.35 % (Berndt et al., 2025), suggesting that the global total isoprene SOA yields in our simulations may be a lower limit. In addition, we did not represent ISOP-RO2 + ISOP-RO2 reactions, which may potentially contribute to ISOP-RO2 fate and SOA formation but are highly uncertain (Wennberg et al., 2018).
Table 3ISOP-RO2 reactions in the modified VBS and the related RO2 fate in MOZART. Units for reaction rate constants are cm3 molecule−1 s−1, except for specific notations.
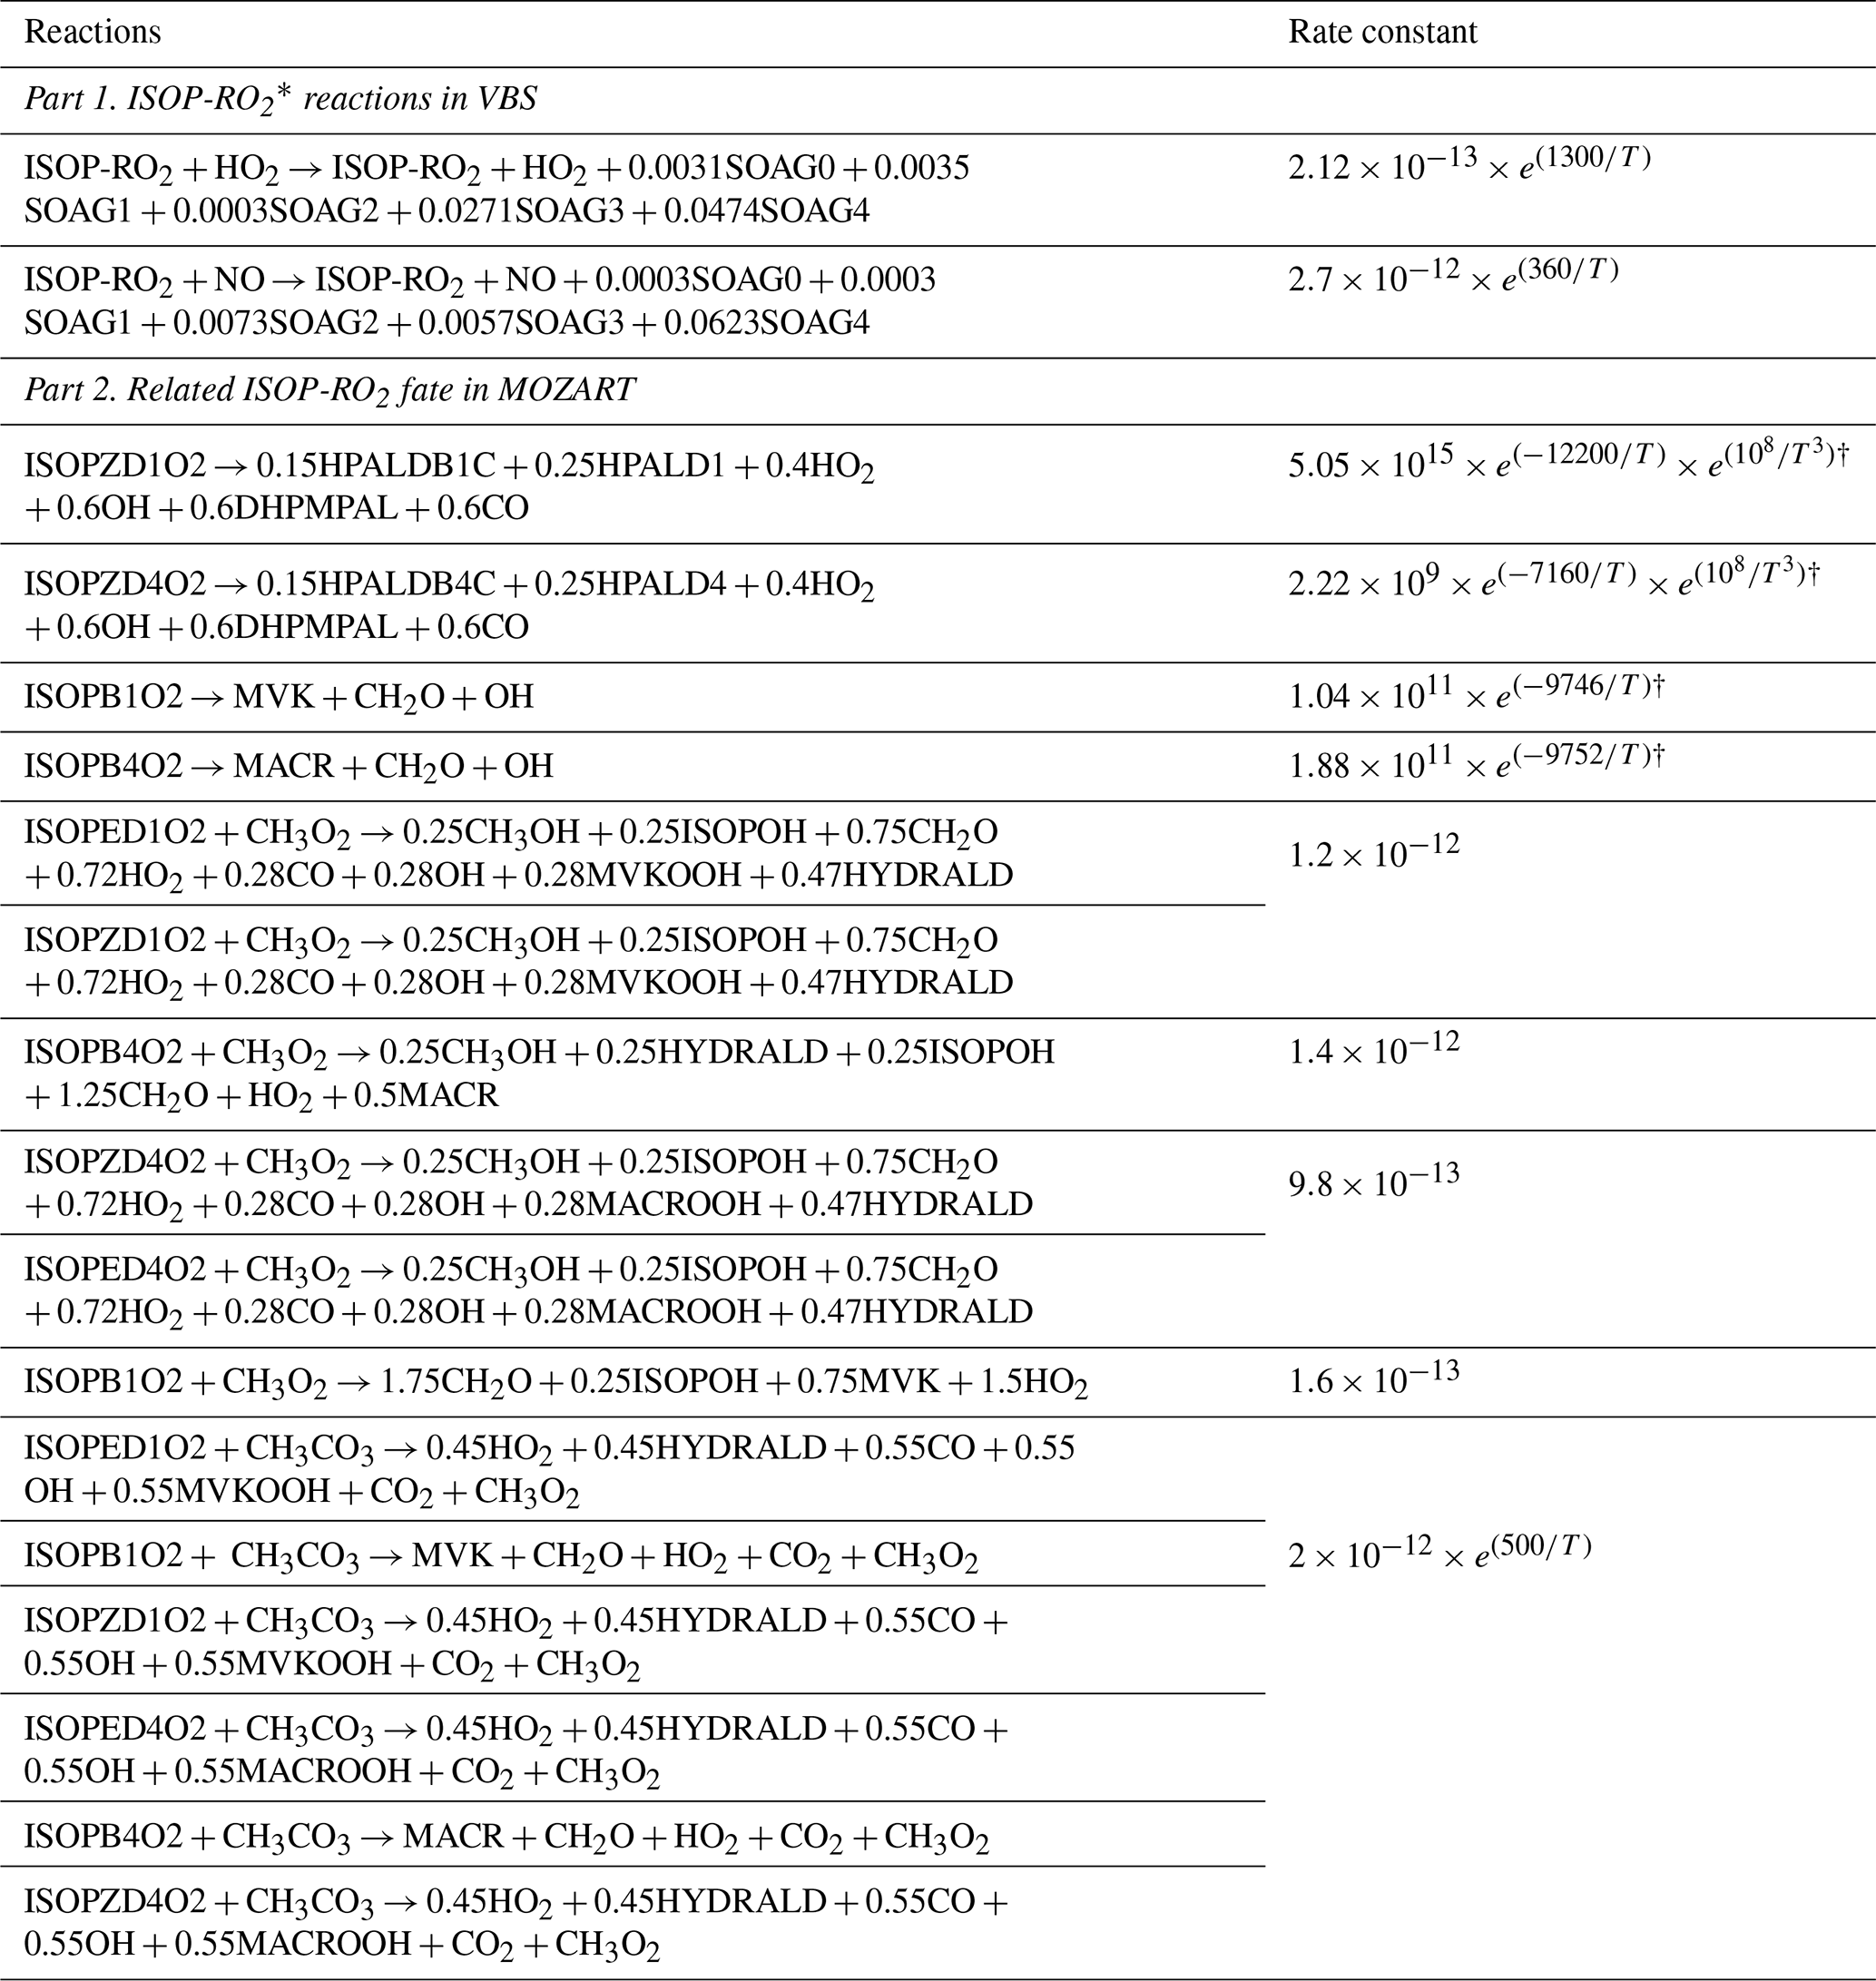
* ISOP-RO2 denotes six first generation ISOP-RO2 species from MOZART-TS2, including ISOPED1O2, ISOPB1O2, ISOPZD1O2, ISOPED4O2, ISOPB4O2, and ISOPZD4O2. † Units: s−1.
2.3 Modifications to SOA photolysis
Another source of uncertainty lies in the representation of SOA photolysis. The standard CAM6-Chem assumes that all SOA is subject to photolysis at a constant rate. However, laboratory studies have reported a photo-recalcitrant fraction ranging from 7 % to 90 % (O'Brien and Kroll, 2019; Sun and Smith, 2024; Zawadowicz et al., 2020). Neglecting this fraction likely results in an overestimation of SOA photochemical loss and thus an underprediction of SOA mass in model simulations. Therefore, as a simple step to mimic the photo-recalcitrant fraction as observed in laboratory studies, we turn off the photolysis of SOA in the lowest volatility bin. This modification results in a mean photo-recalcitrant fraction of 29 % in the modified mechanism (calculated based on 1-year experiment using NEW_slow chemical mechanism; see Sect. 2.4 for details about NEW_slow). However, this simplification may overemphasize the isomerization and RO2 + RO2 reactions, which form SOA solely in the lowest volatility bin (Table 2, part 1 and part 2). We conduct a sensitivity experiment to show that this does not substantially change the fraction of SOA from each RO2 pathway (see details in Sect. S1). In addition, the SOA photolysis rate is another important source of uncertainty. Some chamber experiments show that the rate can reach as high as 2 % of (Henry and Donahue, 2012; Krapf et al., 2016), while recent laboratory studies reported rate of 0.025 % (Baboomian et al., 2020; Sun and Smith, 2024). Since the rate used in standard CAM6-Chem (0.04 % ) is in general agreement with the more recent studies (Baboomian et al., 2020; Sun and Smith, 2024), we leave the photolysis rate unchanged.
2.4 Experiments
We conduct three sets of CAM6-Chem experiments with prescribed sea surface temperature (SST) and sea ice. First, we compare the default configuration with the modified RO2 chemistry through three experiments: BASE, NEW_fast, and NEW_slow. The BASE experiment represents the default chemical mechanism (with our updates to the treatment of SOA photolysis), while NEW_fast and NEW_slow incorporate modified RO2 chemistry with fast and slow RO2 + RO2 reaction rates, respectively. These three experiments utilize SST, sea ice, CO2 concentrations, anthropogenic and natural emissions of aerosols and reactive gases, and land use data from 2010, representing PD conditions. Second, we perform two experiments – the PI and F experiments – with modified RO2 chemistry that incorporates slow RO2 + RO2 reaction rates under pre-industrial (PI; 1850) and future (F; 2100) conditions (i.e., SST, CO2 concentrations, anthropogenic and natural emissions, and land use). Detailed settings for the PI, PD, and F conditions are provided in Sect. S2. The future conditions follow the Shared Socioeconomic Pathway 5-8.5 (hereafter SSP5), which assumes a fossil-based economy with high CO2 levels and projected temperature increase (Riahi et al., 2017). This is also a strong pollution control scenario, which reduces future anthropogenic emissions of aerosols and reactive gases compared to PD levels (Rao et al., 2017). We chose SSP5 because it is considered as the most severe scenario, providing the strongest contrast to PD and PI in temperature and CO2 level. However, it is noted that SSP5 is an extreme case and debated to be implausible (Hausfather and Peters, 2020). Thus, the magnitude (though not the sign) of our PD to F results may be significantly different if considering another future scenario. By comparing PI and F with the NEW_slow (PD) experiment, we investigate how the RO2 fate and SOA formation change from the past to present and future. Finally, to isolate the chemistry impacts, we conduct two additional experiments that are the same as PI and F, except with fixed BVOC emissions at PD level (i.e., PI_PDB and F_PDB). All experiments are performed with a horizontal resolution of 0.9° × 1.25° and 32 vertical layers. The model is integrated for 11 years in a free-running configuration and using cyclically repeated one-year input data. Therefore, the simulated results represent repeated time-slice forcing. The first simulation year is treated as spin-up, and the results are shown as 10-year averages to minimize interannual climate variability.
3.1 SOA formation in PD
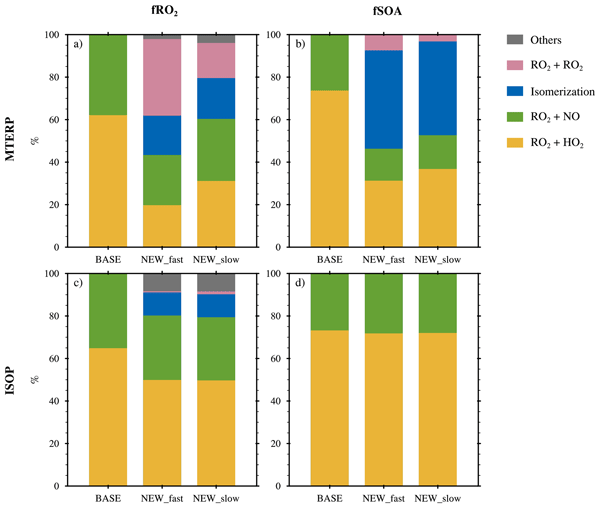
We examine the globally and annually averaged RO2 fate (fRO2) and the contribution of each reaction pathway to total SOA (fSOA) in PD in Fig. 2. To calculate fRO2, we scale the fRO2 for individual RO2 species with the corresponding branching ratios and weight the gridded fRO2 by RO2 concentrations (see Sect. S3 for more details).
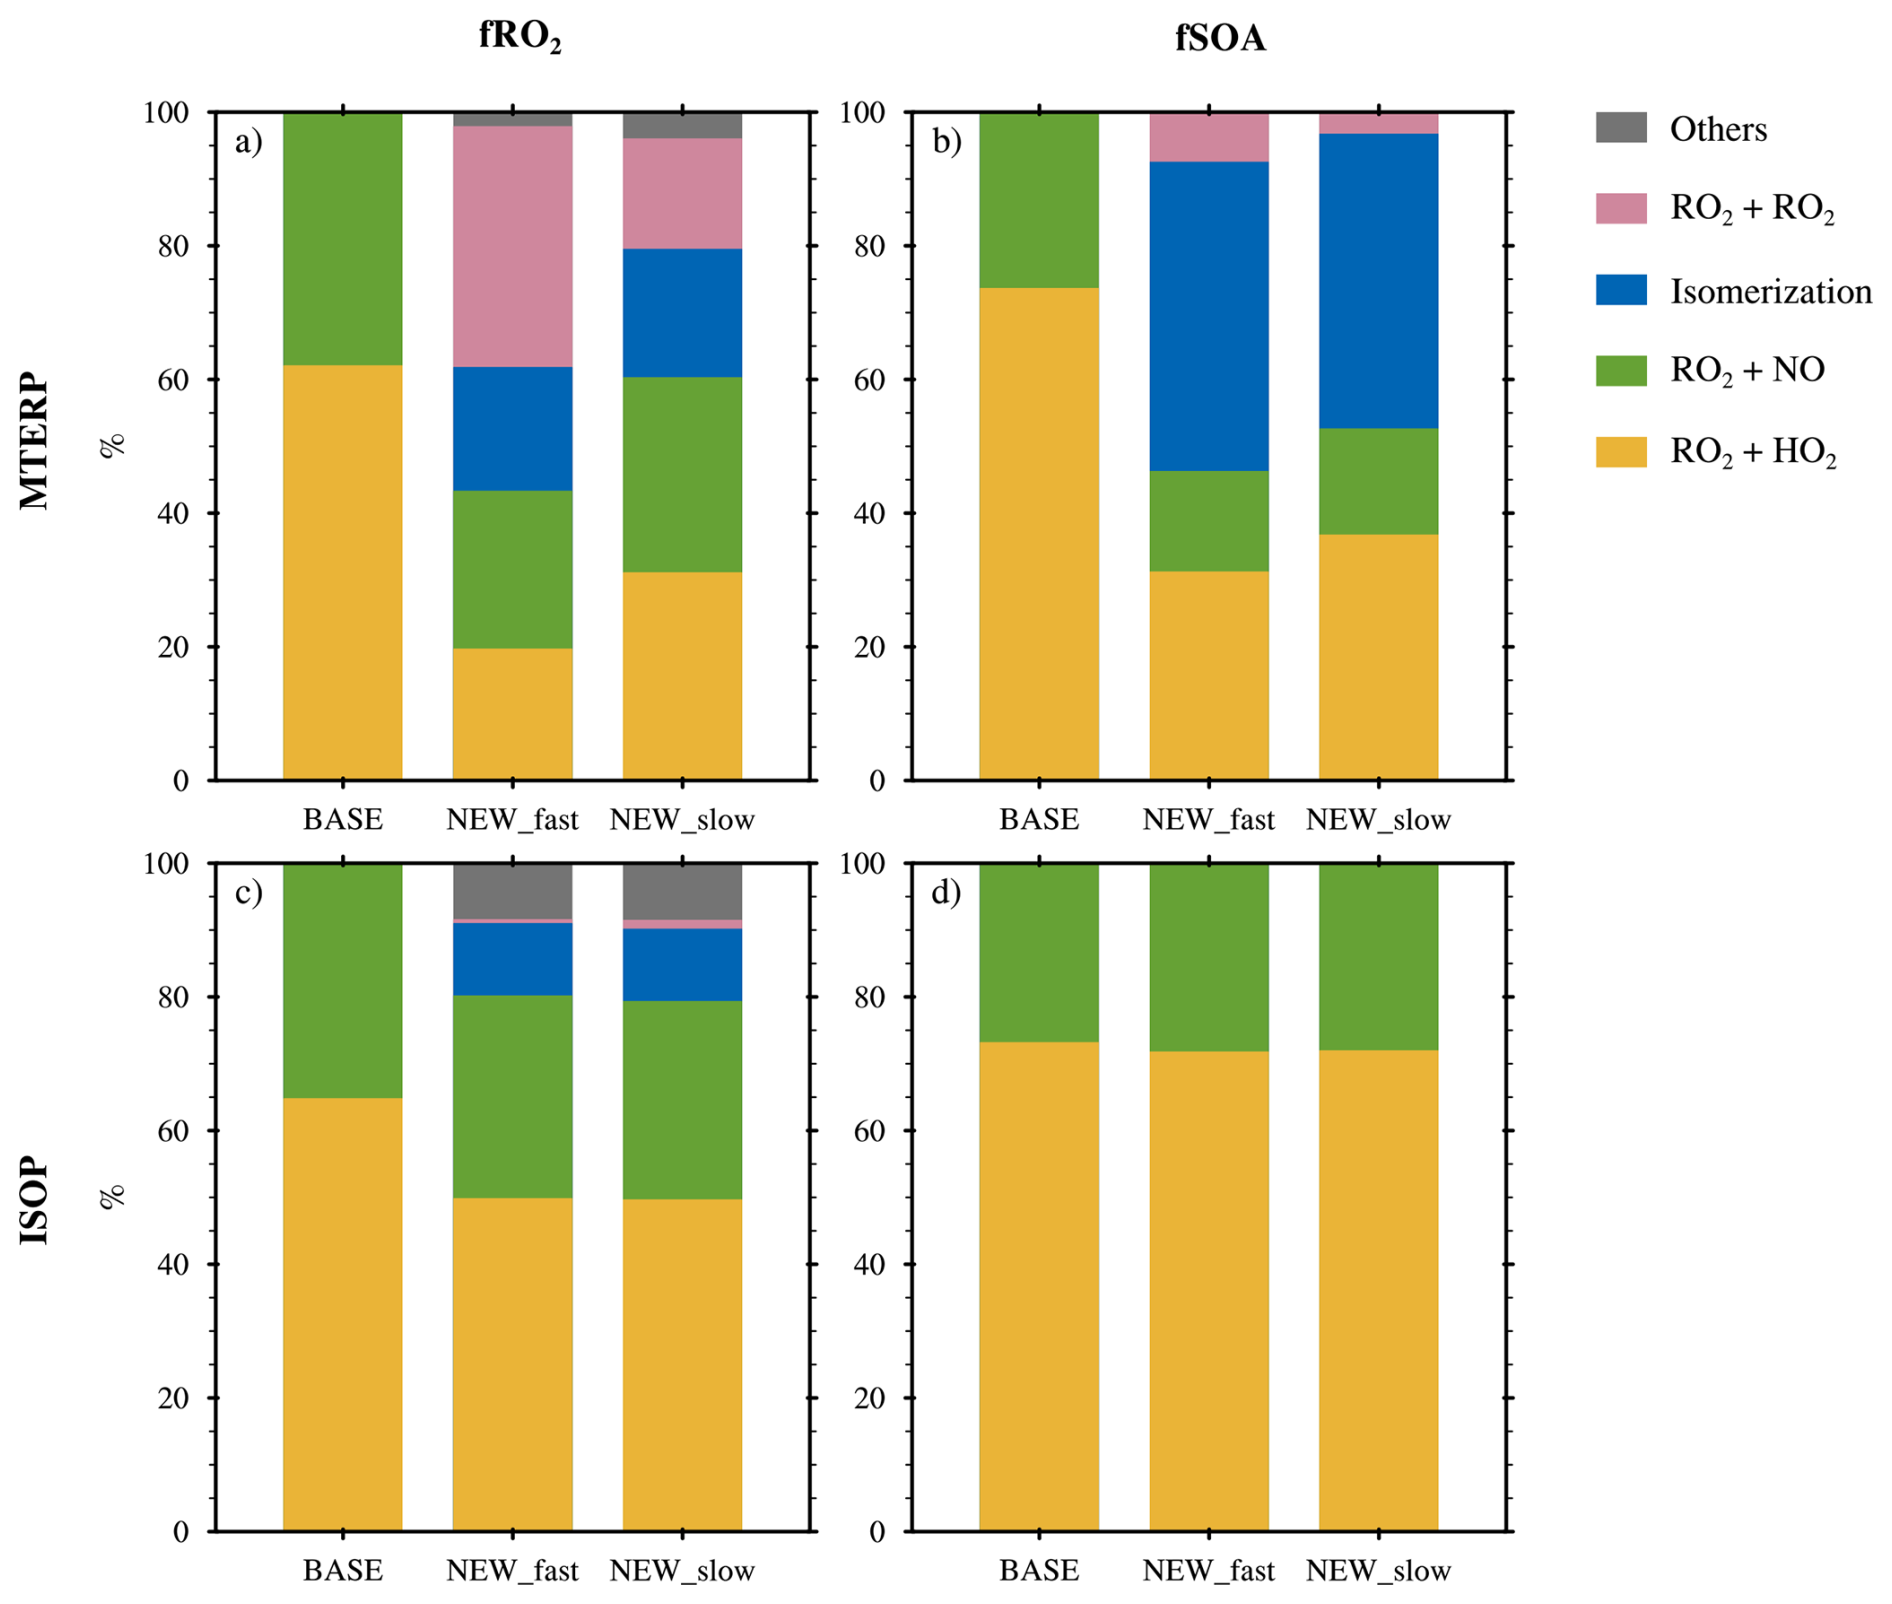
Figure 2Vertically integrated and globally and annually averaged RO2 fate (fRO2; left panel) weighted by gridded RO2 concentrations and the percentage contribution of each reaction pathway to total SOA burden (fSOA; right panel) for MTERP (upper panel) and ISOP (lower panel). Results are shown for the BASE, NEW_fast, and NEW_slow experiments. Different reactions are categorized by colors. For MTERP-RO2, the RO2 + RO2 reactions include those between MTERP-RO2 and ISOP-RO2, IEPOXOO, MTERP-RO2 itself, BCARY-RO2, and later generations of terpene RO2 (Table 2, part 2), while the reactions with NO3, CH3O2, and CH3CO3 are included in “Others” (Table 2, part 3). For ISOP-RO2, the RO2 + RO2 reactions include ISOP-RO2 + MTERP-RO2 and ISOP-RO2 + BCARY-RO2 reactions, while “Others” include ISOP-RO2 decomposition and the reactions with CH3O2 and CH3CO3. To avoid double counting, we classify the SOA formed through ISOP-RO2 + MTERP-RO2 solely as MTERP SOA.
For MTERP-RO2, isomerization accounts for ∼ 19 % of fRO2 in the two NEW experiments (Fig. 2a). Since we assume that only 22 % of MTERP-RO2 can isomerize, this contribution is substantial, indicating that isomerization is nearly saturated in this branch because the reaction rate of isomerization generally exceeds that of bimolecular reactions (Fig. 1). This agrees with Xu et al. (2022), who also found isomerization to be the dominant fate for the MTERP-RO2 branch that can undergo unimolecular reaction. Isomerization forms a large amount of low volatility products, making it a major contributor to total MTERP SOA formation (46 % in NEW_fast and 44 % in NEW_slow) (Fig. 2b). This highlights the important role of including MTERP-RO2 isomerization in SOA formation parameterizations. We note that uncertainties in model parameters discussed in Sect. 2.2 and 2.3 could alter the estimated contribution of the isomerization pathway. In particular, the upper-limit 50 % yield and applying the photo-recalcitrant fraction only to the lowest volatility bin (see Sect. S1) could over-emphasize isomerization. Conversely, neglecting higher branching ratios and yields for limonene SOA may underestimate the importance of isomerization for total SOA formation from monoterpenes.
The contribution of MTERP RO2 + RO2 reactions to fRO2 depends on the reactions rates (36 % with faster reaction rates in NEW_fast and 17 % with slower reaction rates in NEW_slow). However, their contribution to total MTERP SOA is minor (8 % in NEW_fast and 3 % in NEW_slow). This is likely an underprediction, because only 4 % of SOAG0 is formed through these reactions, and SOA formation through non-accretion products is neglected (as discussed in Sect. 2.2). Overall, the newly included reactions account for 40 %–57 % of fRO2 and 47 %–54 % of fSOA in the NEW experiments, significantly modifying the MTERP-RO2 chemistry from the BASE experiment. MTERP-RO2 reactions with HO2 and NO account for 20 % and 24 % of fRO2 in NEW_fast, and 31 % and 29 % in NEW_slow, respectively (Fig. 2a). Compared with BASE (fRO2 for the HO2 pathway is 62 %), the contributions of RO2 + HO2 to fRO2 in the NEW experiments are largely supplemented by the isomerization and accretion reactions, which also favor clean conditions. We note that Xu et al. (2022) show a higher RO2 fate from MTERP-RO2 + HO2 reaction, which may indicate different global distributions of NO and VOCs. For fSOA, the contribution from MTERP-RO2 + HO2 (31 %–37 %) is higher than that from MTERP-RO2 + NO (15 %–16 %), as expected, because products formed through reactions with NO are generally more volatile than those formed through reactions with HO2. Reactions with NO3, CH3O2, and CH3CO3 only account for 2 %–4 % of fRO2. Thus, should any of these reactions form SOA, their contribution to the total MTERP SOA is likely to be minor.
The two NEW experiments have identical isoprene RO2 chemistry and thus show similar fRO2 distributions for ISOP-RO2, with the exception that the NEW_slow has a slightly larger RO2 + RO2 fate than NEW_fast due to higher terpene RO2 concentrations resulting from slower MTERP-RO2 + RO2 reaction rates (Fig. 2c). In NEW_slow, contributions from RO2 + HO2, RO2 + NO, isomerization, RO2 + RO2, and other reactions are 50 %, 30 %, 11 %, 1 %, and 9 %, respectively. Compared to BASE, the NEW experiments show 20 %–21 % additional RO2 loss due to the newly introduced reactions. However, these reactions do not produce SOA precursors and thus the relative contributions to ISOP SOA are similar in all three experiments. The contributions to fSOA in NEW_slow from RO2 + HO2 and RO2 + NO are 72 % and 28 %, respectively.
The global distributions of fRO2 from NEW_slow are shown in Fig. 3. The contribution from MTERP-RO2 isomerization is generally spatially uniform over the land, with exceptions over highly polluted environments (e.g., Eastern China), where the isomerization pathway is of little importance (Fig. 3a). Its contribution maximizes in North Africa, tropical South America, and Australia, driven by high temperatures over these regions. The MTERP-RO2 + RO2 reactions contribute significantly (up to 40 %) over tropical forests, including the Amazon, Congo Basin, and Southeast Asia (Fig. 3b). These regions have strong MTERP emissions and thus high RO2 concentrations, favoring RO2 cross and self-reactions. In addition, for both ISOP-RO2 and MTERP-RO2, reactions with NO dominate the RO2 fate over terrestrial polluted regions with high NO emissions, accounting for more than 50 % of fRO2 in the US, most of Eurasia, the Sahel and surrounding areas, and Southern Africa (Fig. 3d and g). In contrast, RO2 + HO2 reactions become more important in relatively clean regions, such as the tropical and boreal forests as well as the ocean (Fig. 3c and f). Spatial distributions of the annual mean surface MTERP-RO2 and ISOP-RO2 reaction rates are shown in Figs. S1 and S2, respectively.
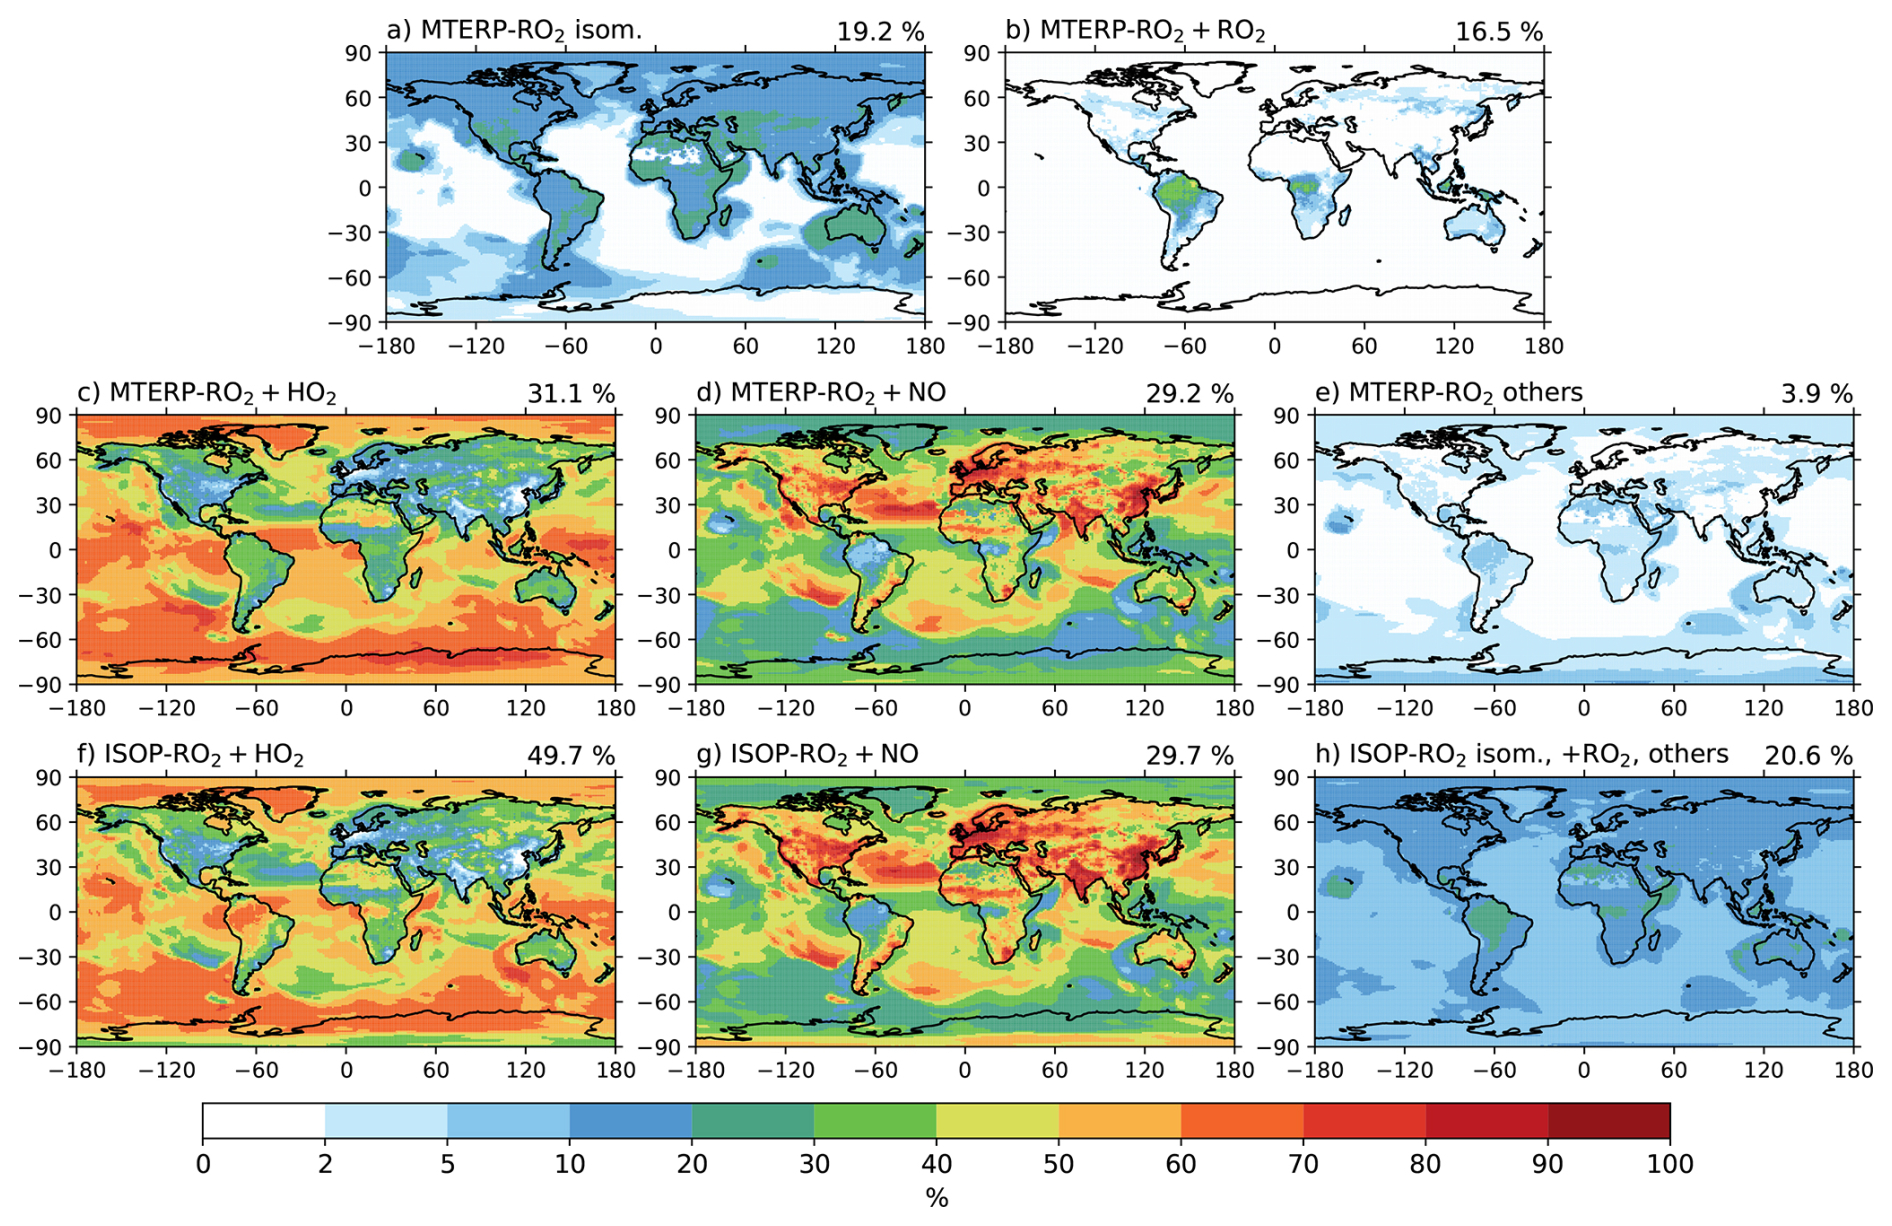
Figure 3Vertically integrated and annually averaged fRO2 in % for MTERP-RO2 reactions (panels a–e) and ISOP-RO2 reactions (panels f–h) from NEW_slow. The sum of reactions for the same RO2 (i.e., the sum of a to e and f to h, respectively) is equal to 100 %. Global mean fRO2 weighted by gridded RO2 concentrations are shown at the top right of each panel.
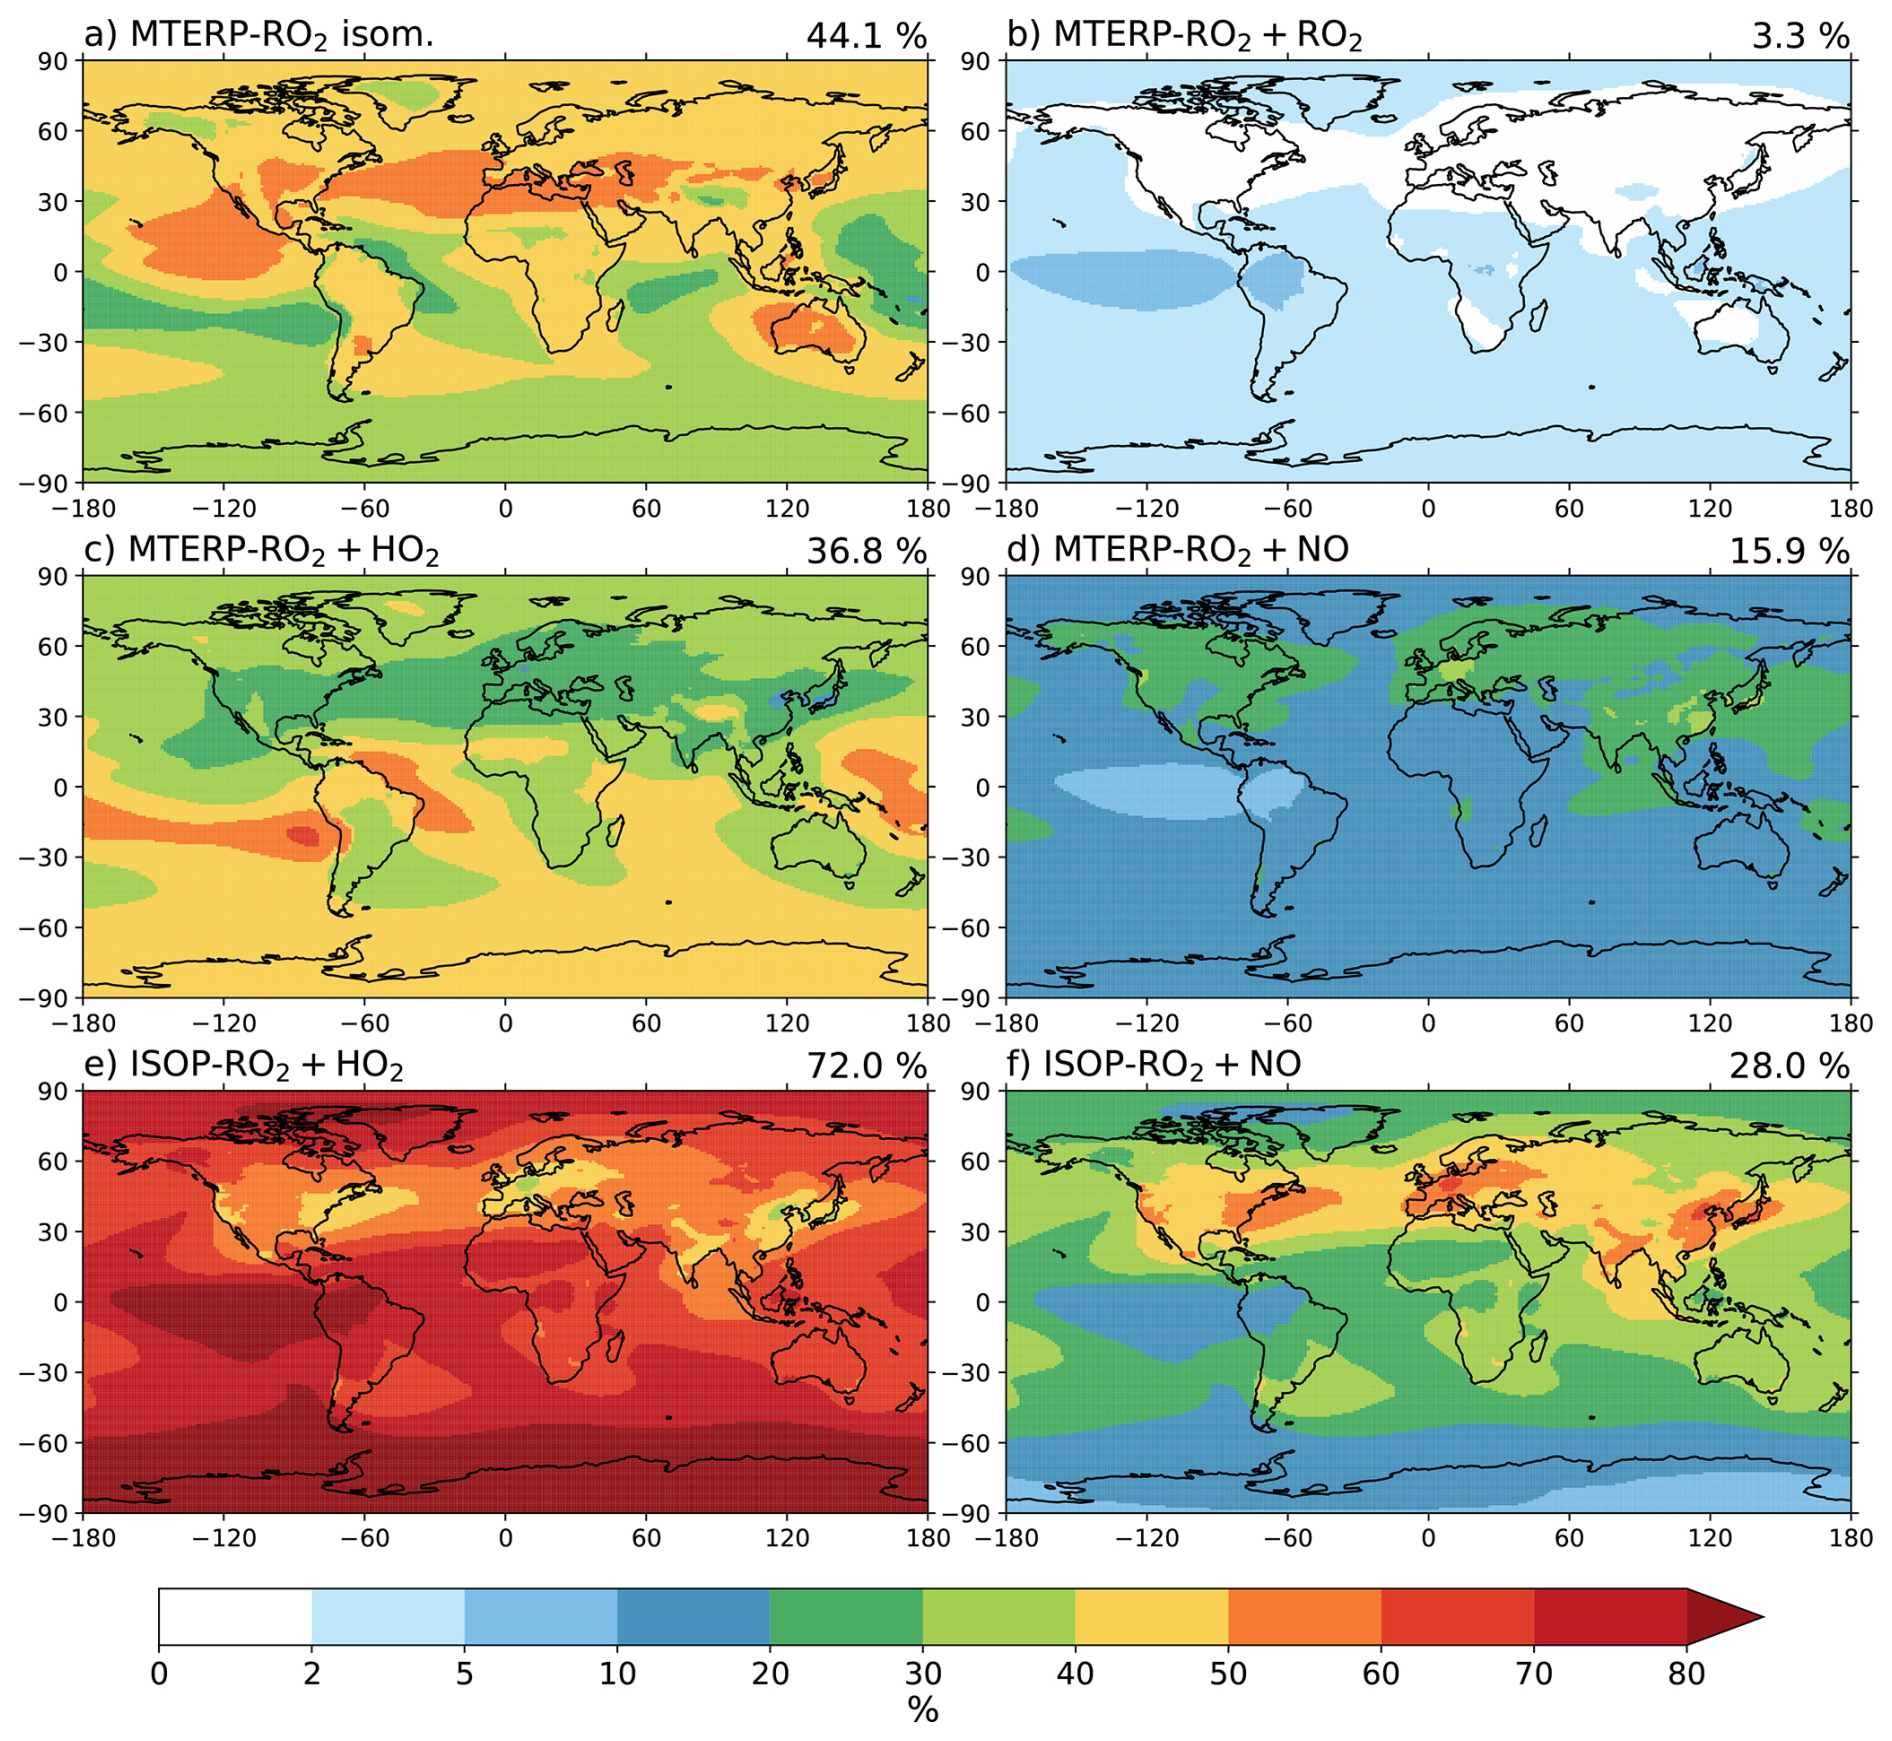
Figure 4Vertically integrated and annually averaged fSOA in % for MTERP-RO2 reactions (panels a–d) and ISOP-RO2 reactions (panel e–f) from NEW_slow. The sum of reactions for the same RO2 (i.e., the sum of a to d and e to f, respectively) is equal to 100 %. Global mean fSOA are shown at the top right of each panel.
Figure 4 shows the global distributions of fSOA in NEW_slow. Isomerization accounts for more than 40 % of MTERP SOA in the North Hemisphere and across land in the Southern Hemisphere (Fig. 4a). RO2 + HO2 reactions is another major pathway, contributing 20 %–40 % of MTERP SOA formation in the Northern Hemisphere and 30 %–60 % in the Southern Hemisphere (Fig. 4c). MTERP-RO2 + NO contributes 20 %–40 % over the polluted regions in the Northern Hemisphere but less than 20 % elsewhere (Fig. 4d). The contribution from MTERP-RO2 + RO2 reactions is minor globally (Fig. 4b), due to the small SOA yields and the relatively slow reactions rates. We note that our findings differ from Mayhew et al. (2025) – who identify a critical contribution from the RO2 + RO2 reactions to the SOA in tropical forest regions. The conservative SOA yields for this pathway applied in our simulations likely contribute to this discrepancy. Moreover, Mayhew et al. (2025) did not account for isomerization of terpene RO2, which may compete with the RO2 + RO2 reactions, and they include the accretion reactions of a broader range of RO2 species, including those of anthropogenic origin. The different treatments and results from various studies highlight the substantial uncertainties that remain in our understanding of RO2 + RO2 reactions. For ISOP SOA, RO2 + HO2 is responsible for more than 60 % of SOA formation most of the globe, except in North America, Europe, and South and East Asia (Fig. 4e), where RO2 + NO contributes 40 %–60 % because of the high local NO emissions (Fig. 4f).
The newly added isomerization and RO2 + RO2 reactions compete with the RO2 + HO2 and RO2 + NO reactions, leading to decreased MTERP SOA formation through the latter two pathways in the NEW experiments compared with BASE (Fig. 5a). At the same time, including isomerization increases MTERP SOA by more than 50 %, while the RO2 + RO2 reactions account for additional 4 %–9 % increase. The isomerization pathway produces a large amount of low-volatility products and is thus more efficient in SOA formation than the RO2 + HO2 and RO2 + NO pathways. Therefore, compared to BASE, total MTERP SOA increases by 19 % (0.029 Tg) in NEW_fast and 30 % (0.046 Tg) in NEW_slow. The increase in NEW_slow is higher than that in NEW_fast, because RO2 + HO2 and RO2 + NO contribute more in NEW_slow due to slower RO2 + RO2 reaction rates (Fig. 2a), and these two pathways form more SOA than the accretion reaction. The total MTERP SOA increases globally in the two NEW experiments compared to BASE, except over the Amazon and in Congo Forest in NEW_fast (Fig. 6a–c), where the RO2 + RO2 reactions contribute substantially to the RO2 fate. For ISOP SOA, the newly implemented reactions introduce extra losses of ISOP-RO2 that compete with the RO2 + HO2 and RO2 + NO reactions but do not form SOA. As a result, the ISOP SOA decreases by 16 % in the two NEW experiments (0.038 Tg in NEW_fast and 0.037 Tg in NEW_slow) (Fig. 5b), and the decrease is globally consistent (Fig. 6d–f).
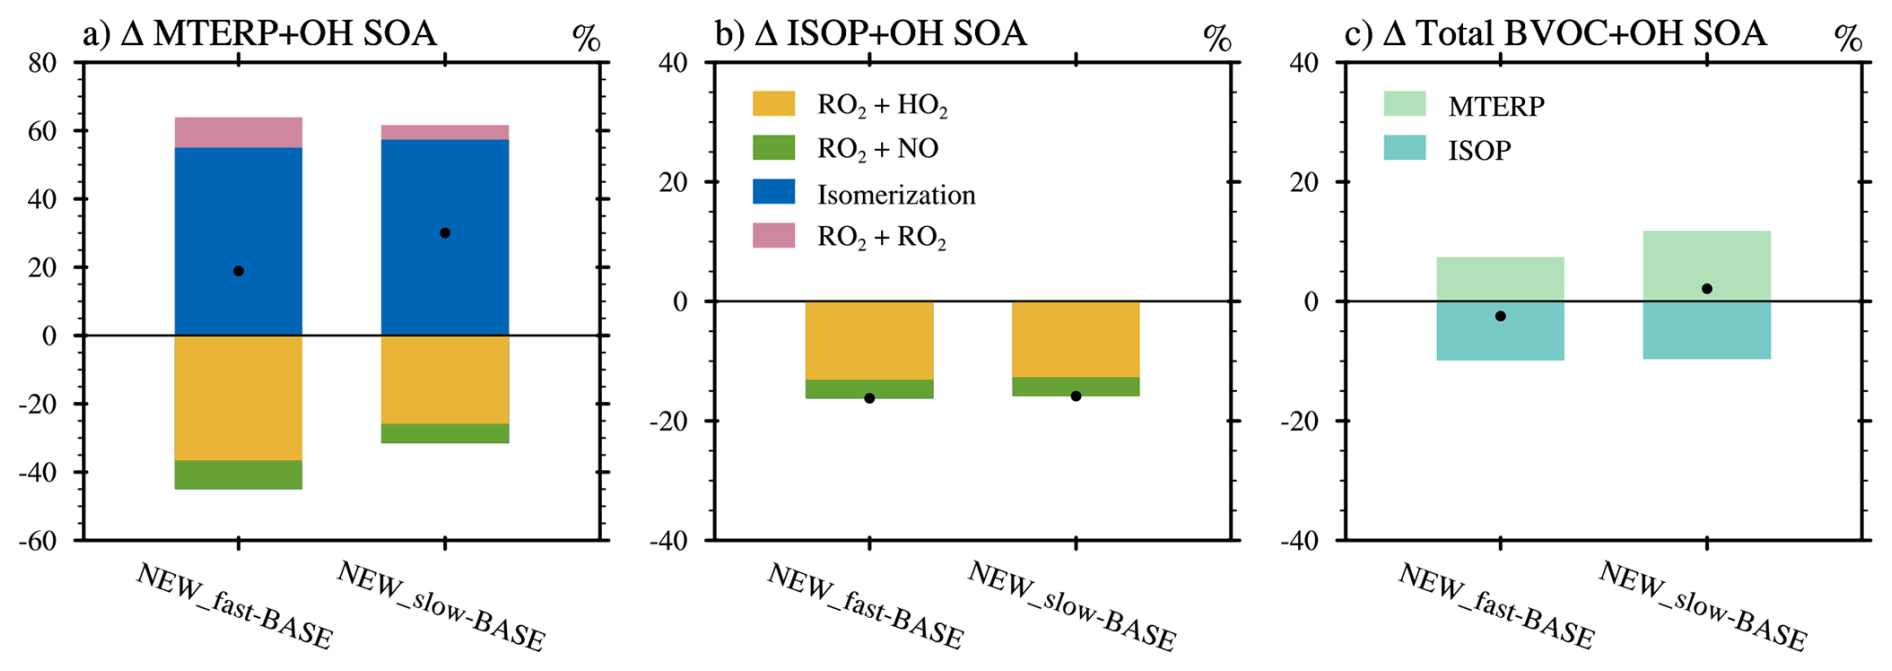
Figure 5Percentage changes from BASE to NEW_fast and NEW_slow in the global burden of (a) MTERP + OH SOA and (b) ISOP + OH SOA. Different reactions are categorized by colors. Panel (c) shows the percentage change in the total BVOC + OH SOA burden, with VOC precursors shown in shades of green. The percentages are calculated with respect to BASE. Black dots in all three panels are global total changes.
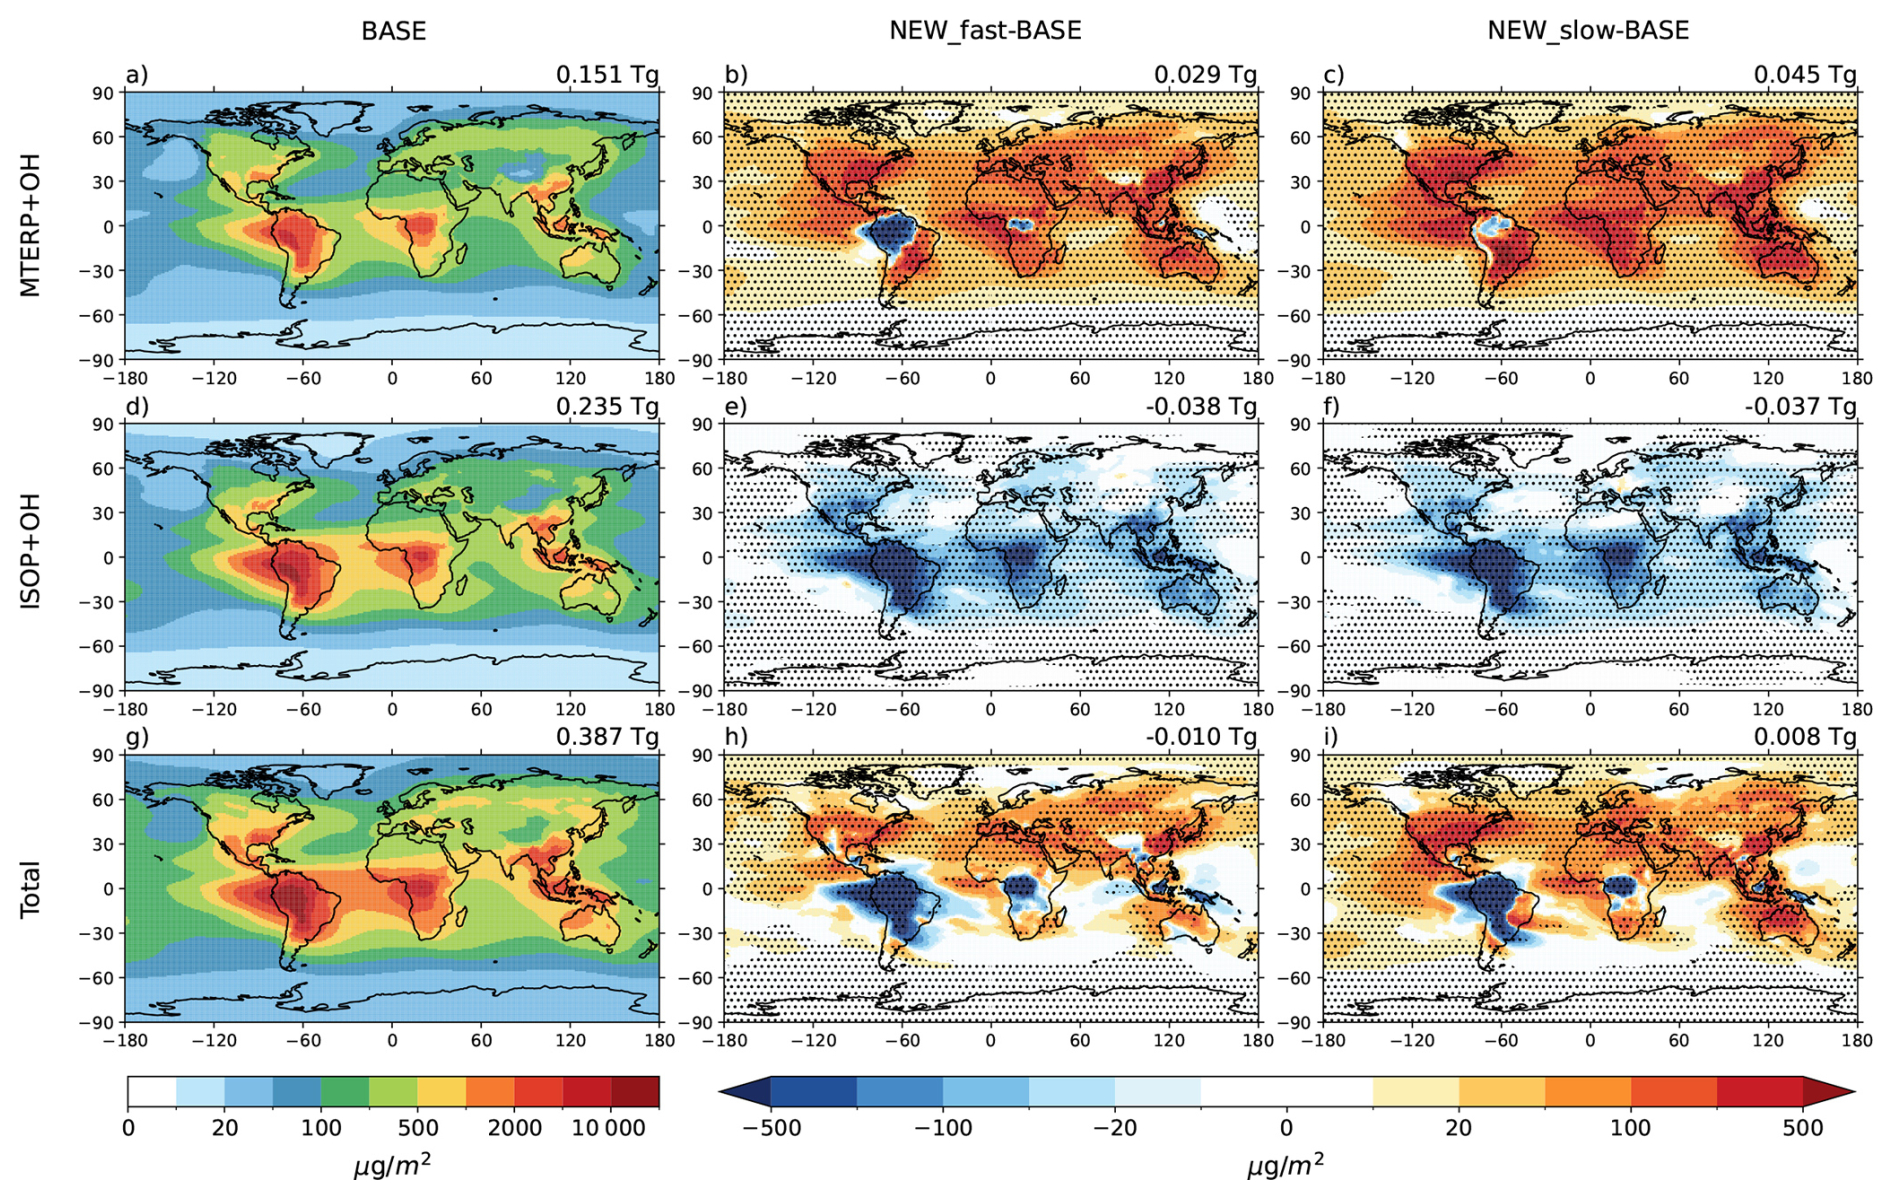
Figure 6Global distributions of SOA column concentrations from BASE (left panel), and the differences between NEW_fast and BASE (middle panel), as well as between NEW_slow and BASE (right panel). Top, middle, and bottom panels show results for SOA burden from MTERP + OH, ISOP + OH, and Total SOA burden from OH oxidation. Dotted regions on the middle and right panels are where the changes are significant to the 0.05 levels, based on Welch's t-test using yearly annual means from the 10-year experiments. Global average changes in burden are shown above each panel.
The increase in MTERP SOA compensates for the ISOP SOA decrease (Fig. 5c). As a result, even though the RO2 chemistry and SOA contribution are significantly altered (Fig. 2), total biogenic SOA in the two NEW experiments is similar to that in BASE (<3 % difference). Globally, the NEW experiments predict a decrease from BASE over the tropical forest regions (Fig. 6g–i), which is dominated by ISOP SOA (Fig. 6d–f), and an increase over the rest of the world due to changes in MTERP SOA (Fig. 6a–c). We note that these results are based on our choices of SOA yields, reaction rates, and branching ratios from various laboratory studies. The measurements from different laboratory studies can vary widely, indicating large uncertainties associated with these results. Moreover, a recent study suggests that previous chamber experiments used to inform SOA yields do not fully represent atmospheric RO2 fates (Kenagy et al., 2024). Furthermore, Goss et al. (2025) suggest that the reaction conditions and RO2 fate in many experiments are dynamic and may differ from previous interpretations. In particular, they infer that isomerization was an important RO2 pathway for previous experiments under low-NOx conditions used to estimate VBS yields for the RO2 + HO2 pathway. This suggests that some isomerization may have already been included in the RO2 + HO2 pathway yields, and our newly implemented isomerization pathway may double count these contributions. Overall, these large uncertainties highlight the urgent need to better constrain parameters related to SOA formation in the laboratory.
3.2 Changes in SOA formation from PI to F
Biogenic SOA formation is impacted by biogenic VOC emissions, anthropogenic emissions, and temperature. These factors vary globally over time and thus the biogenic SOA formation can be different from the past to the future. In this section, we examine the RO2 fate and biogenic SOA formation in PI (1850), PD (2010), and F (2100 following SSP5).
Global mean CO2 mixing ratios in our simulations are 284, 389, and 1135 ppm in PI, PD, and F, respectively. In response to the elevated global CO2 levels, global mean surface temperature increases by 0.9 K from PI to PD and 5.9 K from PD to F (Fig. 7a and b). The temperature increase is more severe over the Arctic than the rest of the world, which is known as Arctic amplification. The NO emissions increase by 86.7 Tg yr−1 from PI to PD (78 % as compared to PD; all the percentage changes in this section are reported as compared to PD hereafter) and decrease by 37.2 Tg yr−1 (34 %) from PD to F (Fig. 7c and d). The changes in NO emissions are dominated by changes in anthropogenic emissions. However, North Africa exhibits decreases in NO emissions from PI to PD and increases from PD to F, driven by changes in biomass burning emissions. From PI to PD, global MTERP emissions decrease slightly by 7.9 Tg yr−1 (6 %) (Fig. 7e), due to the compensating effects of deforestation and global warming. In contrast, global ISOP emission decrease more substantially (85.3 Tg yr−1; 22 %) (Fig. 7g), because the ISOP emissions are further inhibited by increases in CO2. BVOC emissions decrease over regions with strong deforestation, including Eastern US, South and East Asia, South America, and Central Africa except the Congo Forest, while the temperature-driven emission increase occurs over the areas with none or little deforestation (e.g., the center of the Amazon forest). The increase over France and Central Europe is related to a local reforestation from PI to PD. In the Congo forest and Southern Africa, MTERP emissions increase over this region in response to temperature increases, while ISOP emissions decrease due to the dominating effect of CO2 inhibition and deforestation. From PD to F, the steep temperature increase in the SSP5 projection results in strong BVOC emission increases – 177.6 Tg yr−1 (139 %) for MTERP emission and 129.3 Tg yr−1 (33 %) for ISOP emission (Fig. 7f and h). The MTERP emissions increase globally despite the impact of the moderate deforestation from PD to F, while localized ISOP emission decreases occur over the US, Central Africa, Brazil, and Argentina due to the deforestation and CO2 inhibition. We note large uncertainties remain in modeling BVOC emissions (Cao et al., 2021; Guenther et al., 2012), and the predicted changes between different climate conditions may vary depending on whether/how changing vegetation is represented (e.g. Jo et al., 2023). The oxidant levels also vary in response to the changes in NO and VOC emissions (Fig. 8). From PI to PD, the surface concentrations of HOx (i.e., OH and HO2) generally increase, primarily due to NO emission increase (Fig. 8a and c). However, in regions characterized by increased NO and decreased VOC emissions (e.g., East US, Europe, and East Asia), the OH-to-HO2 ratio increases from PI to PD, leading to a reduction in HO2 concentrations and thus decreasing the RO2 + HO2 fate over these regions. From PD to F, the NO emission decrease and the substantial increase in VOC emissions reduces the OH-to-HO2 ratio. As a result, OH (HO2) surface concentrations generally decrease (increase) over land (Fig. 8b and d). The decrease in OH decreases total OH-initiated SOA formation, while the HO2 increase contributes to a higher RO2 + HO2 fate. The oxidant changes aloft are in general consistent with the surface changes (not shown), except that HO2 increases slightly over the polluted regions from PI to PD. The oxidant changes can also be impacted by changes in VOC emissions from anthropogenic and biomass burning sources (Fig. S3). The trends in anthropogenic VOC emissions are generally opposite to the changes in BVOC emissions, likely counteracting some of the impacts of BVOC emissions on oxidant changes. Other than the abovementioned factors, the emissions of primary organic aerosols increase from PI to PD and decrease from PD to F (not shown), which can impact gas-particle partitioning accordingly.
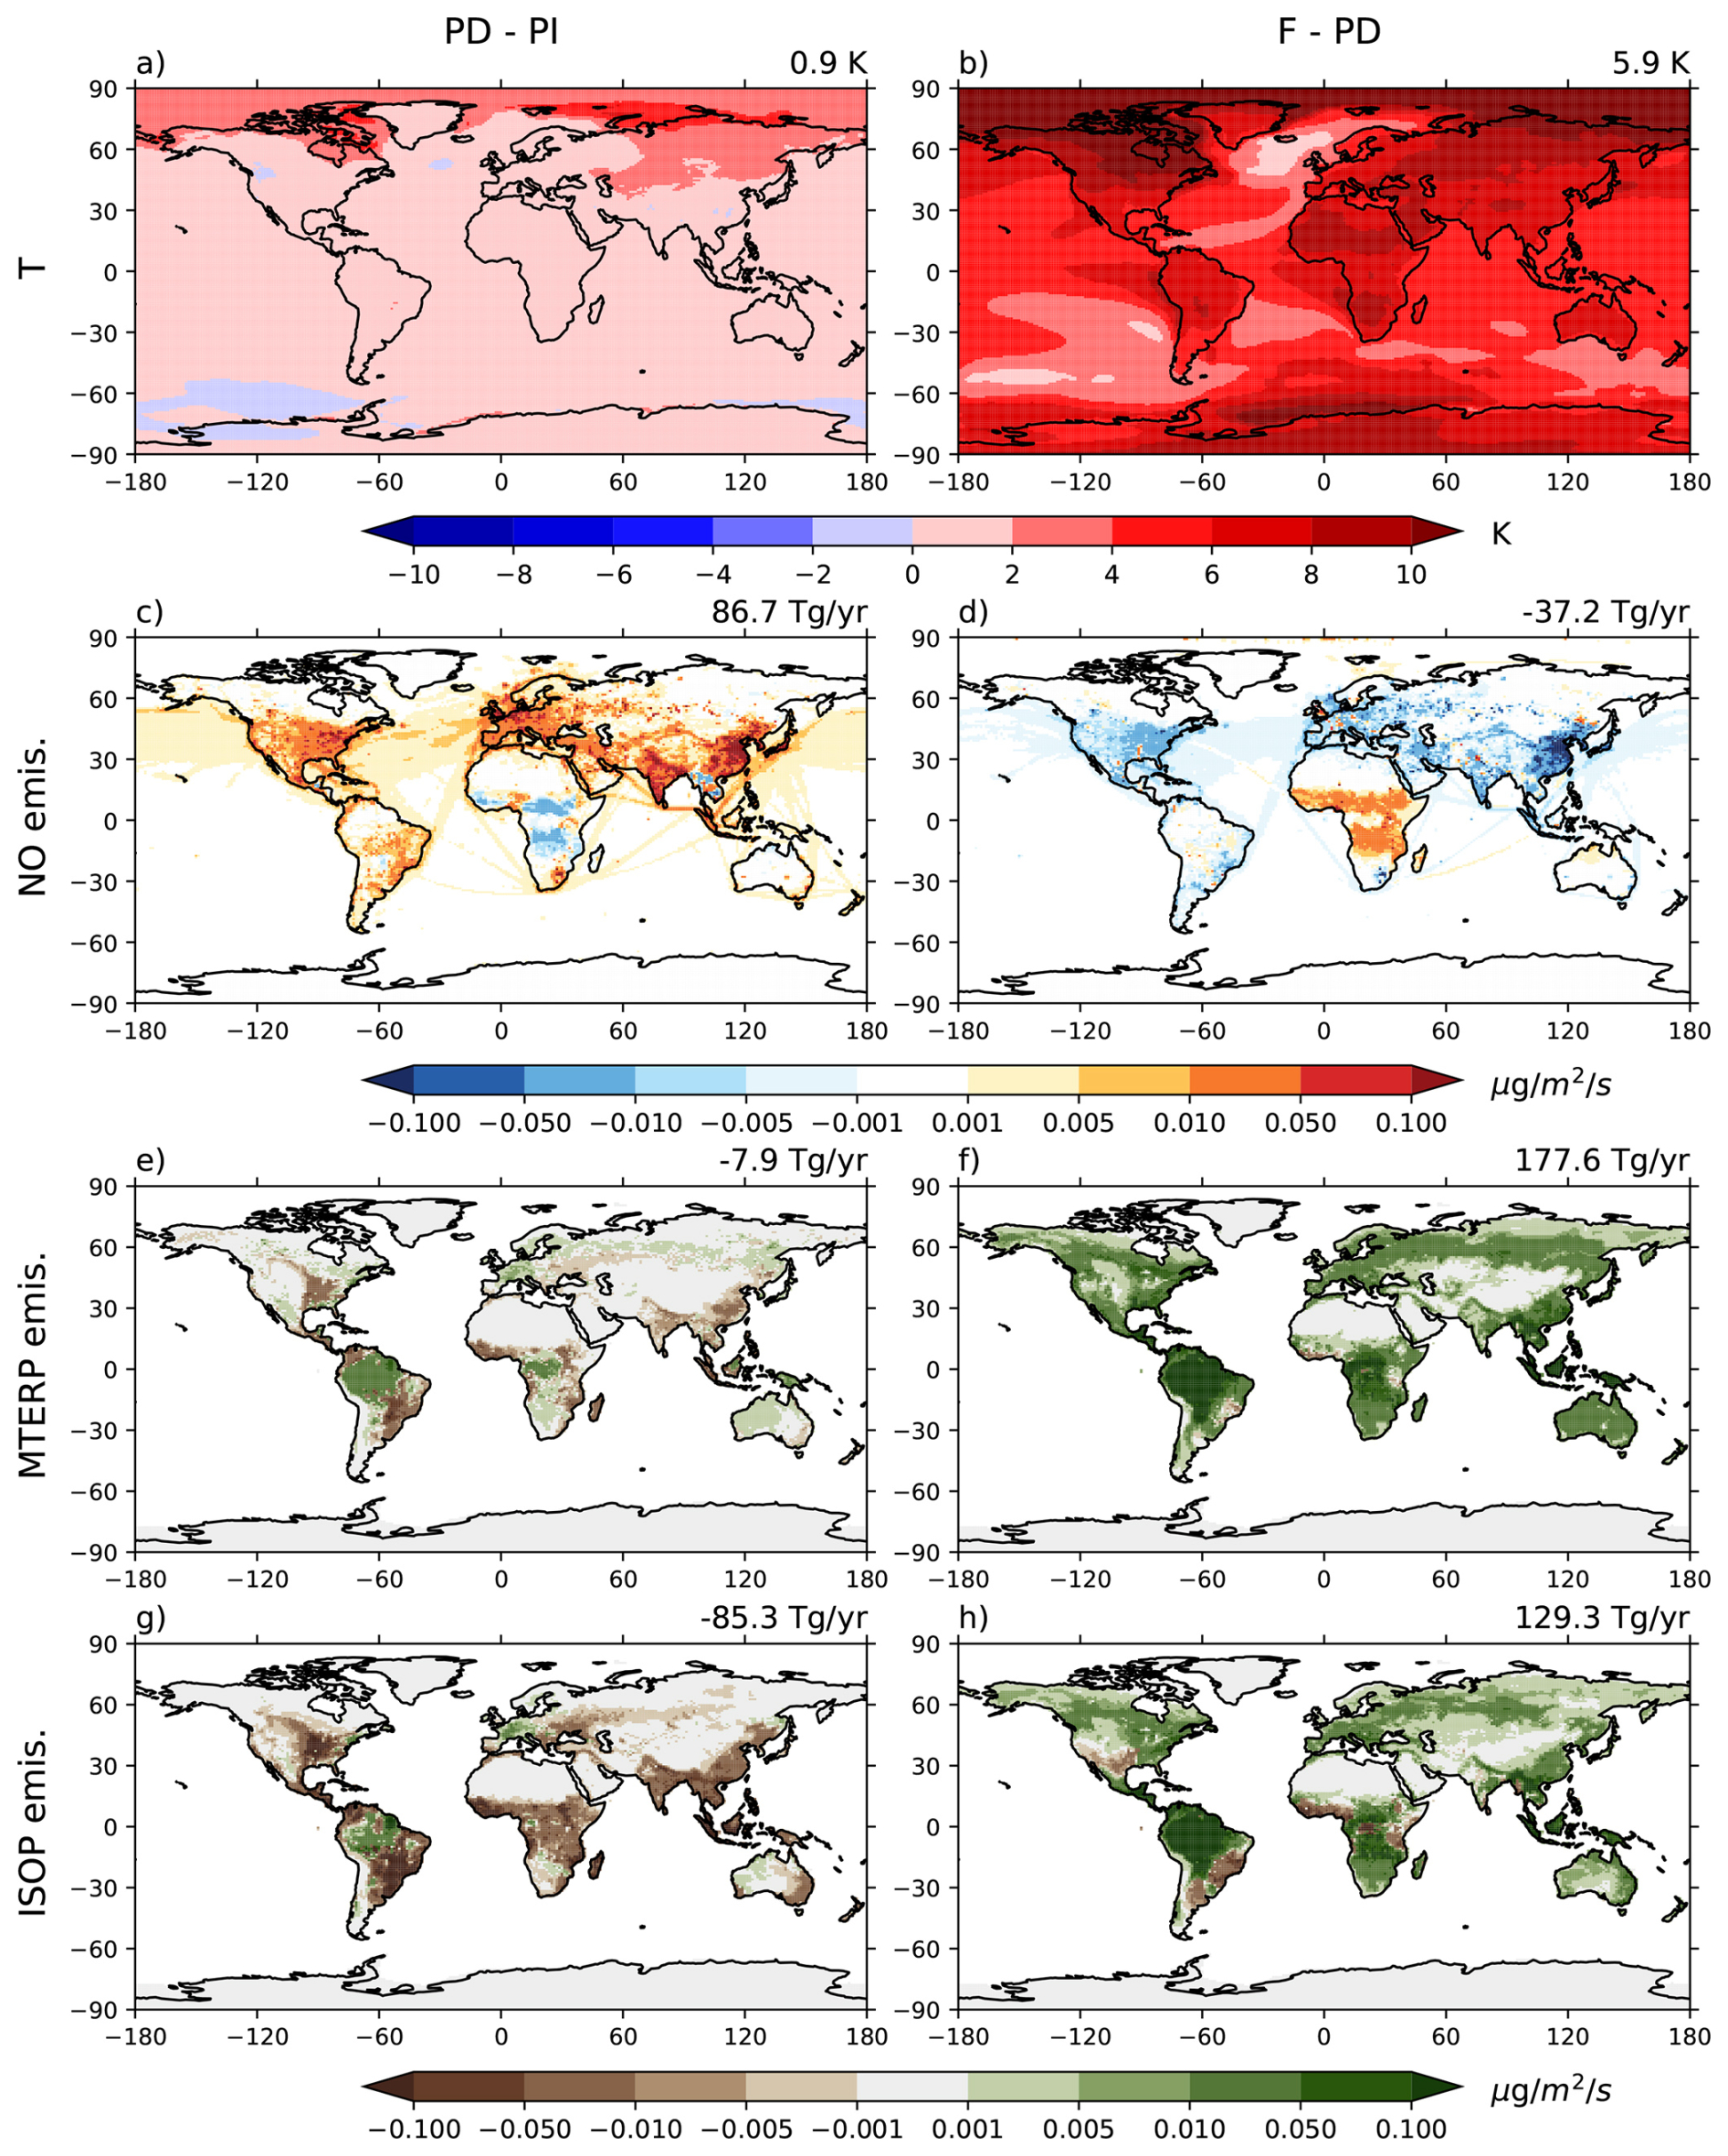
Figure 7Global distributions of changes in surface temperatures (first row), NO emissions (second row), MTERP emissions (third row), and ISOP emissions (fourth row) from PI to PD (left column) and PD to F (right column). Global average changes in temperatures and global total changes in emissions are shown above each panel.
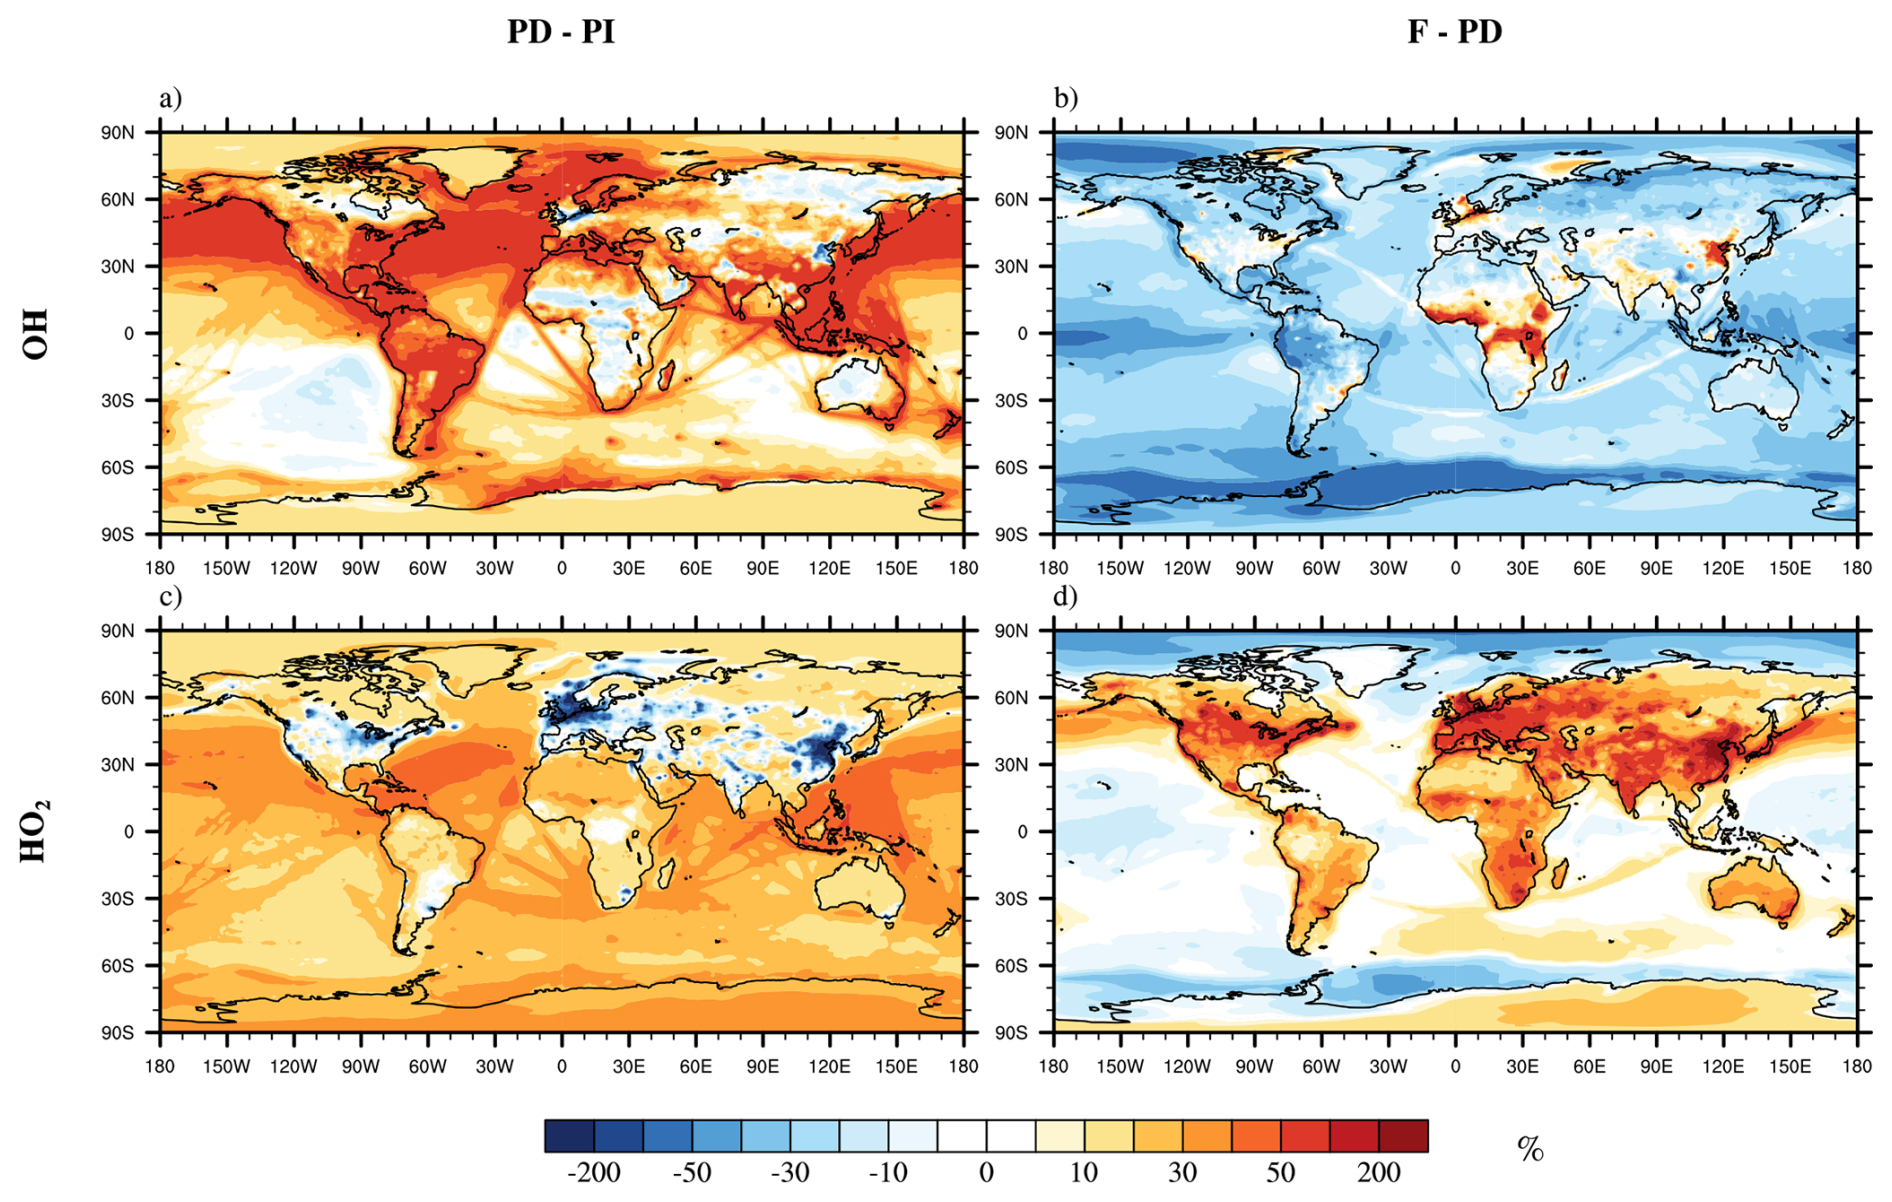
Figure 8Global distributions of percentage changes in surface concentrations of OH (top row) and HO2 (bottom row) from PI to PD (left column) and from PD to F (right column). All percentage changes are calculated with respect to PD levels.
The fRO2 and fSOA for MTERP-RO2 and ISOP-RO2 in PI, PD, and F are shown in Fig. 9. Since NO emissions peak in PD, + NO contributes the most to fRO2 and fSOA in this period compared to PI and F. Isomerization consistently dominates the MTERP-RO2 fate in its branch under all climate conditions – accounting for 19 % in PI and PD, and slightly higher in F with 20 % due to the extreme warming that further accelerates this pathway in F (Fig. 9a). Its contribution to total MTERP SOA is substantial and increases from 38 % in PI to 44 % in PD and further to 51 % in F (Fig. 9b), highlighting the critical role of MTERP isomerization to SOA formation across all climate conditions. The isomerization fSOA increases from PI to PD and to F reflect not only the fRO2, but also how SOA volatility responds to temperature changes (i.e. the gas-phase is favored under higher temperatures for more semi-volatile SOA), which favors the contribution from isomerization. It is noted that the simplified representation of the isomerization process may overpredict SOA formed through this pathway under high-NOx conditions (see Sect. 2.2 for details). Since the NO emissions peak in PD (Fig. 7c and d), this high bias is likely to be more significant in PD than in PI and F, which may impact the continuous increasing trend in isomerization SOA contribution from PI to F and would further reduce the minimum predicted SOA in PD (see Fig. 10a and the discussion below). In addition, our results may be oversensitive to volatility, due to the absence of aqueous phase isoprene SOA formation pathways.
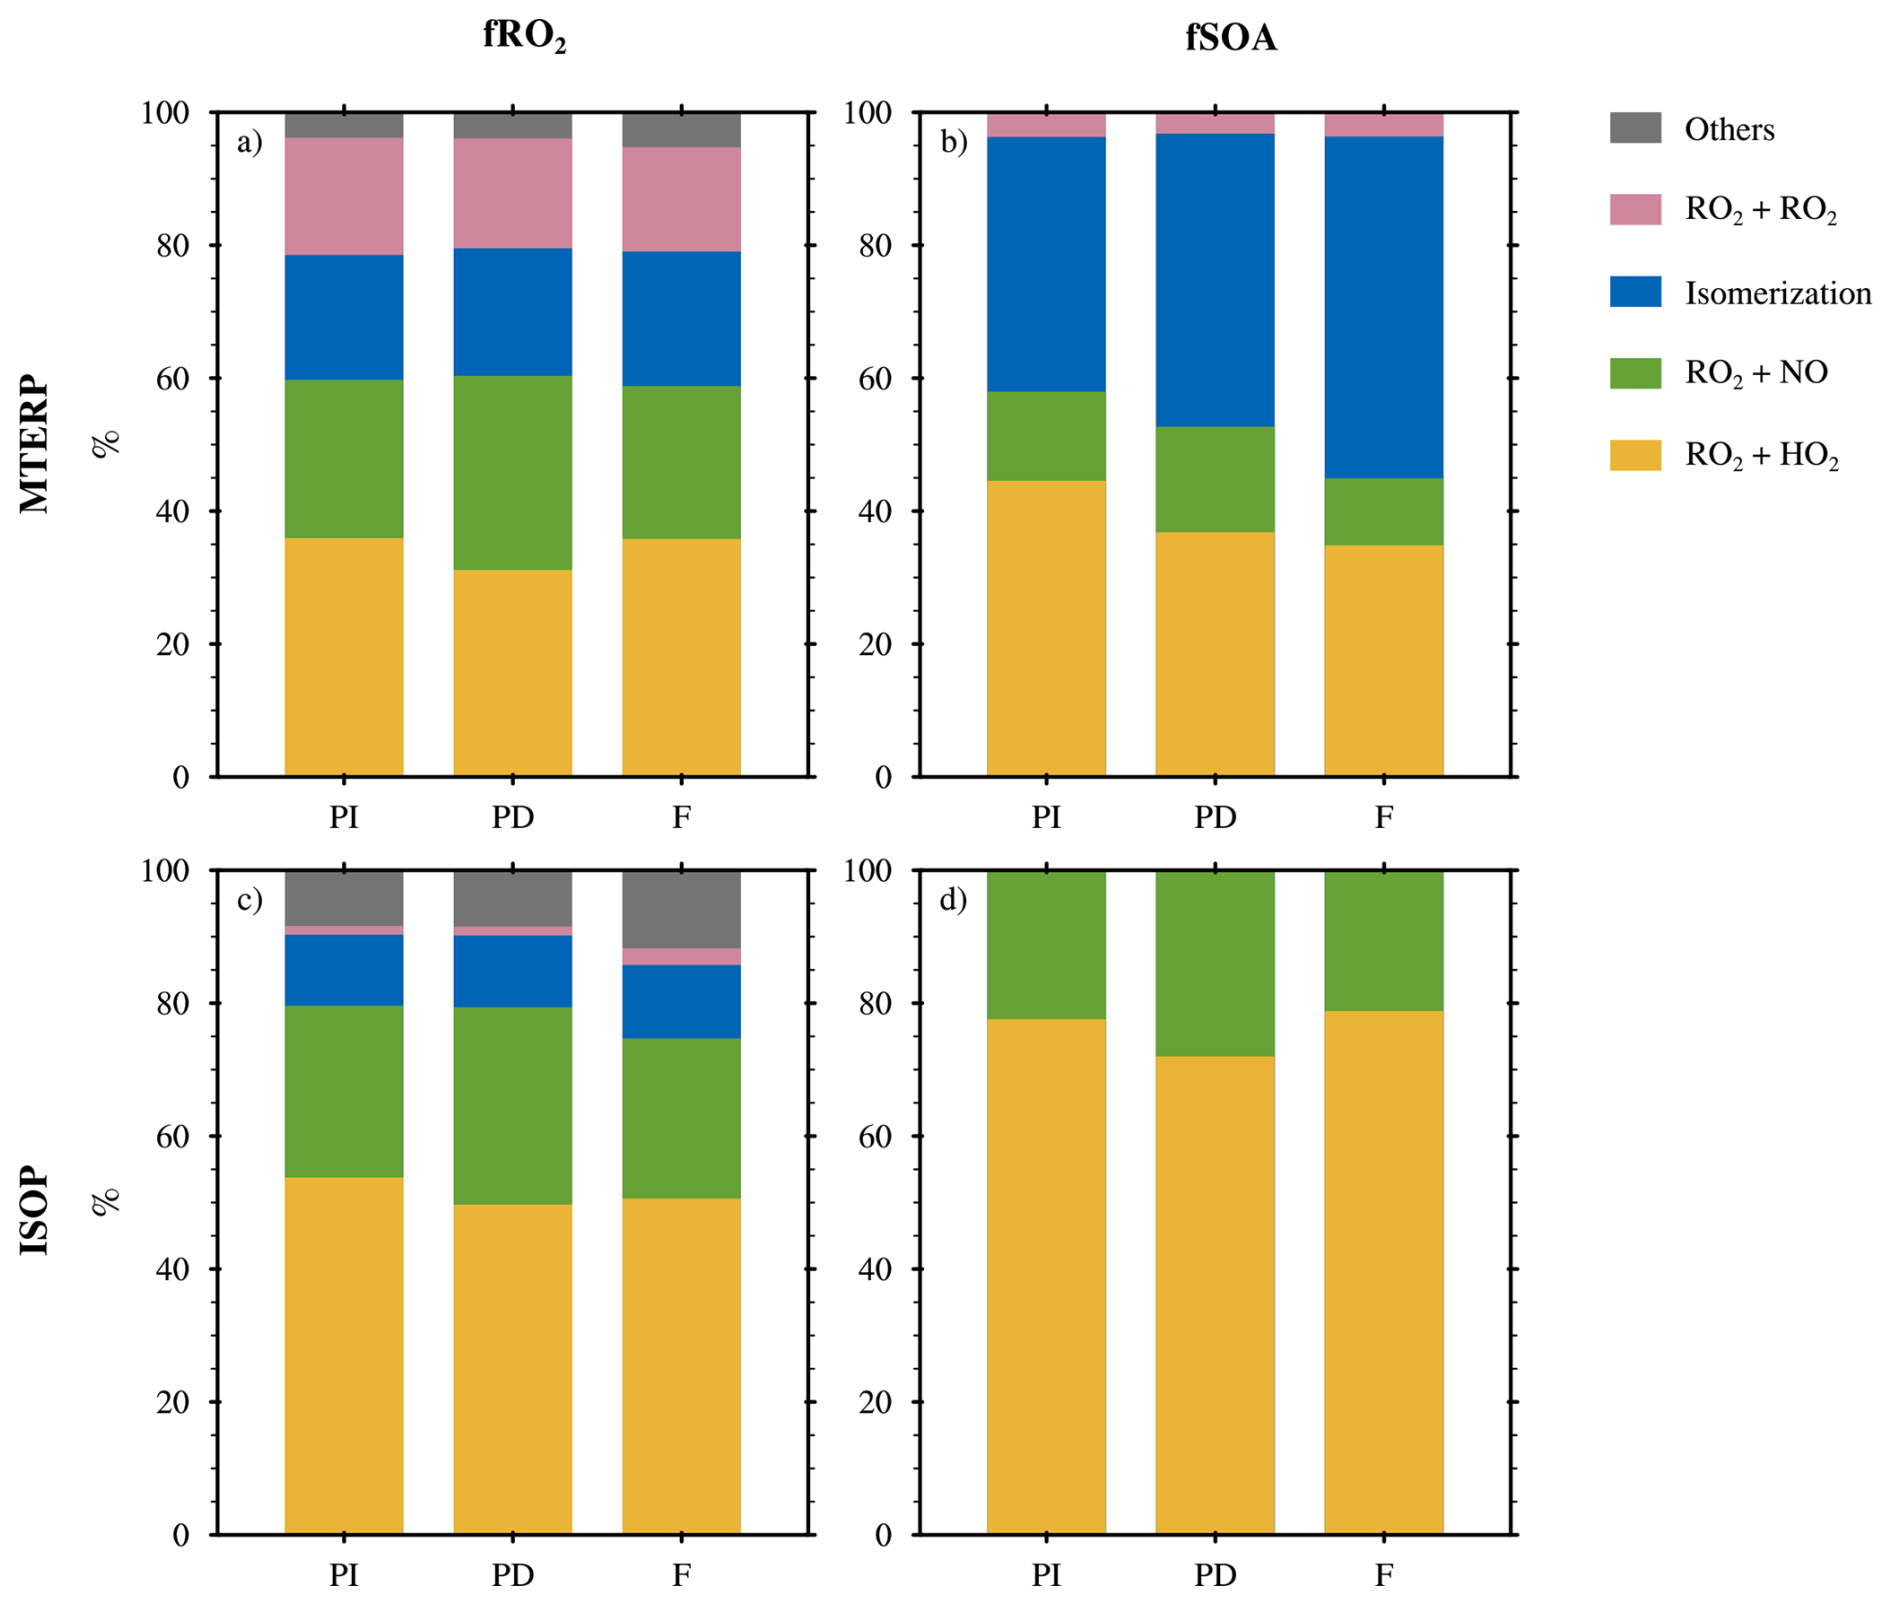
Figure 9Same as Fig. 2, except that results are shown for PI, PD, and F climate conditions. All the experiments follow the same RO2 chemistry as in NEW_slow.
From PI to PD, the MTERP and ISOP SOA burden decreases by 23 % (0.045 Tg) and 59 % (0.117 Tg), respectively (Fig. 10a and b). The global distributions of SOA burden changes generally follow the changes in BVOC emissions (Figs. 11, 7e, and g), except for the RO2 + NO pathway. The changes in SOA formed through the MTERP-RO2 + NO pathway are associated with changes in NO emissions (Figs. 11d and 7c), driven by the influence of NO on both RO2 chemistry (Fig. 9a) and OH concentrations (Fig. 8a). The impacts of NO emission changes on SOA formed through ISOP-RO2 + NO is also evident over the west coast of the US, East Asia, and Southeast Asia, despite the strong ISOP emission decrease (Fig. 11f). The decrease in MTERP and ISOP SOA burden are both dominated by the reduction in the RO2 + HO2 pathway (Fig. 10a and b), which is caused by VOC emission decreases (Fig. 7e and g) and higher NO fate in PD (Fig. 9a and c). The shift in RO2 fate from RO2 + HO2 to RO2 + NO reduces SOA formed through bimolecular reactions, since the products from the latter pathway are more volatile. In addition, the overall SOA decrease results in less condensation, which further decreases SOA burden. As a result, the decrease in SOA burden is stronger than that in the corresponding VOC emissions.
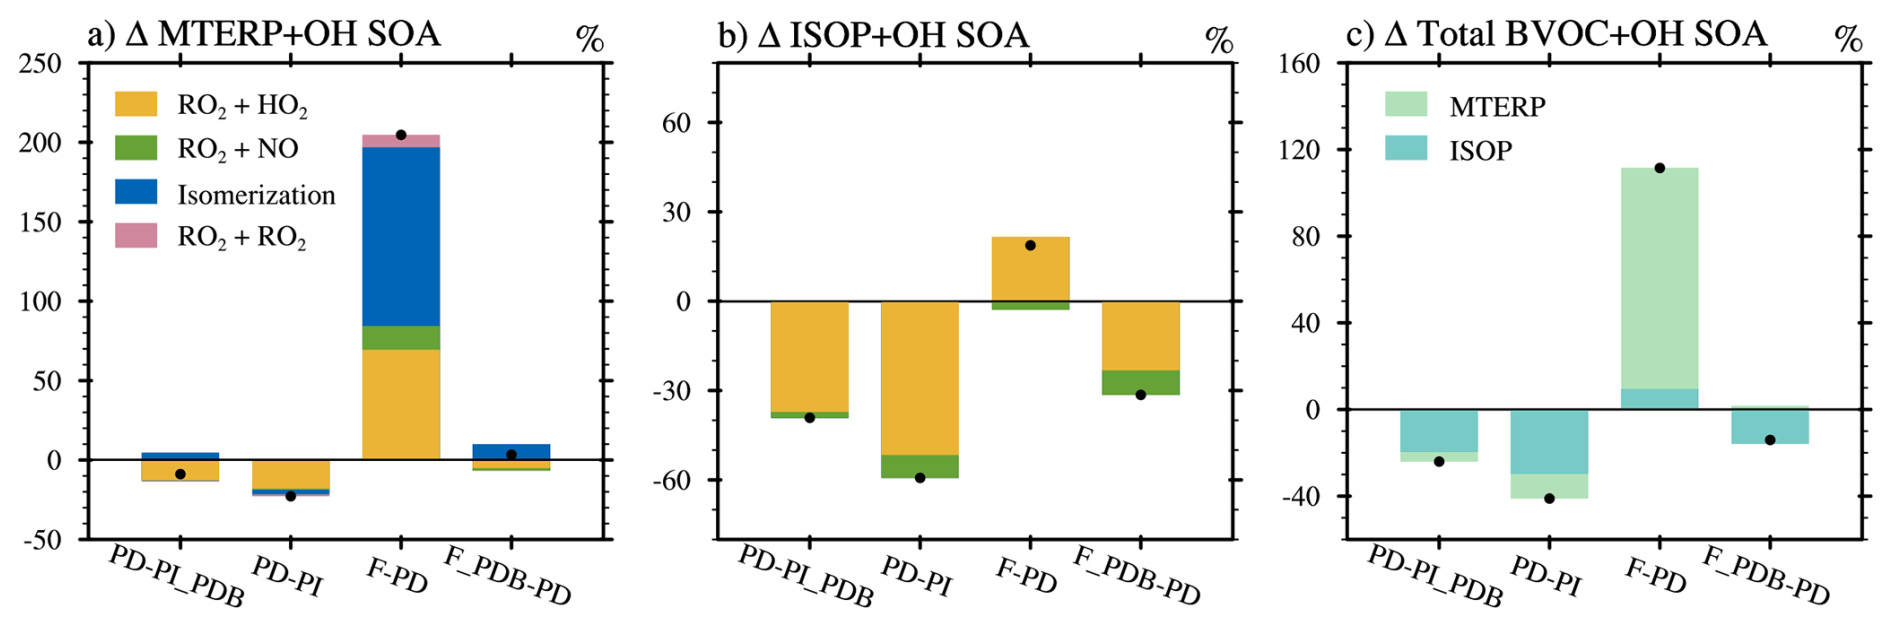
Figure 10Same as Fig. 5, except showing historical and future changes in SOA burden. All the percentages are calculated with respect to PD.
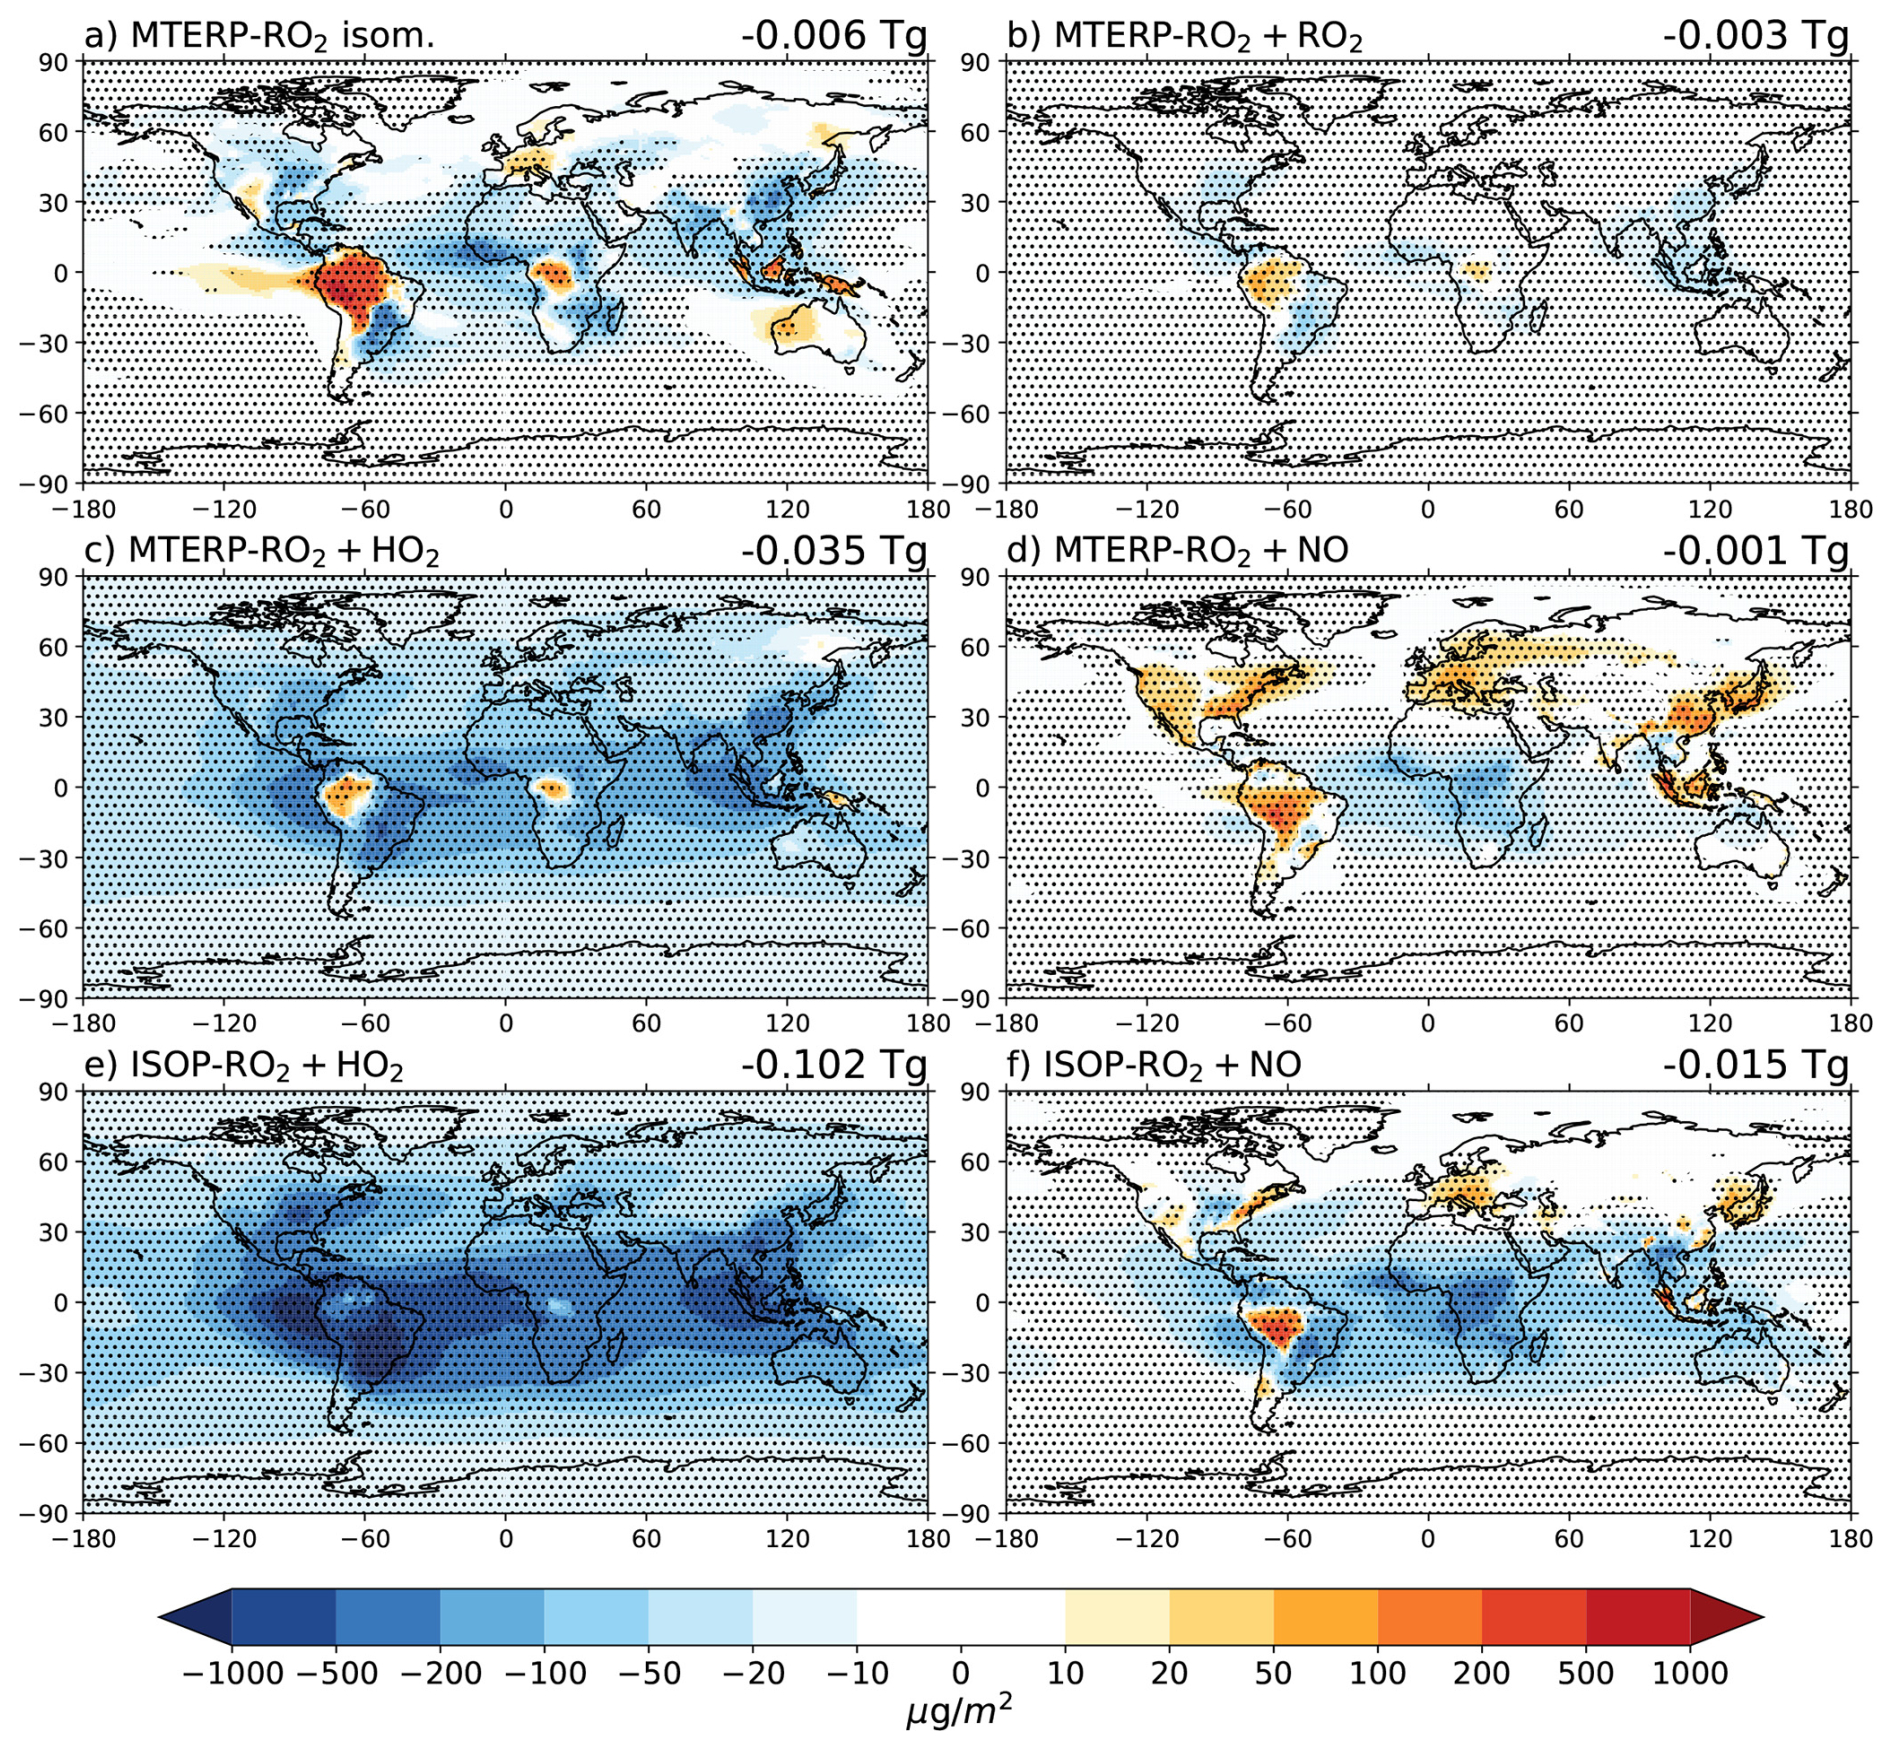
Figure 11Changes in annual mean SOA column concentrations from PI to PD, calculated as PD minus PI, through (a) MTERP-RO2 isomerization, (b) MTERP-RO2 + RO2, (c) MTERP-RO2 + HO2, (d) MTERP-RO2 + NO, (e) ISOP-RO2 + HO2, (f) ISOP-RO2 + NO reaction pathways. Dotted regions are where the changes are significant to the 0.05 levels, based on Welch's t-test using yearly annual means from the 10-year experiments. Global changes in total burden are shown above each panel.
From PD to F, the substantial increase in MTERP emissions enhances SOA formation via all RO2 pathways globally (Figs. 7f, 10a, and 12a–d). This increase in SOA promotes additional condensation, which in turn further amplifies SOA production. However, the warming in F tends to push the gas-particle partitioning towards gas phase and reduces the condensation of precursor gases, partly offsetting the SOA increase. We note that the assumed ΔHvap values in CAM6-Chem lead to strong evaporation in response to temperature increase. If a smaller ΔHvap were used, the overall increase in SOA would be greater due to weaker changes in gas-particle partitioning. Overall, the MTERP SOA burden increases by 205 % (0.403 Tg) (Fig. 10a). Isomerization is the dominant contributor to this increase, because the low volatility products it forms are less prone to evaporation under increasing temperature. However, the increase from isomerization may be slightly overpredicted due to turning off the photolysis of SOA from the lowest volatility bin (see also Sect. S1). Indeed, we notice that the MTERP SOA lifetime due to photolytic loss is longer in F than PD (Table S1), likely because a large fraction of MTERP SOA is formed through isomerization in F but not photolyzed. The increase in SOA formed through the isomerization pathway may also be related to the favoring of this pathway under the extreme warming in SSP5. However, such impact is likely limited, since isomerization is already nearly saturated in PD and the fRO2 increase from PD to F is minor (Fig. 9a). The total ISOP SOA increases by 19 % (0.037 Tg) from PD to F (Fig. 10b). This is dominated by the increase in SOA formed through the RO2 + HO2 pathway (Fig. 12e), which is driven by ISOP emission increases (Fig. 7h) and a shift in RO2 fate from the RO2 + NO pathway toward the RO2 + HO2 pathway (Fig. 9c) due to reductions in NO emissions and increases in HO2 concentrations from PD to F (Figs. 7d and 8d). Wet removal is another critical factor that can impact the evolution of SOA burden. We find that SOA lifetime due to wet deposition varies from PI to F, contributing, in particular, to the simulated burden decrease from PI to PD (Table S1).
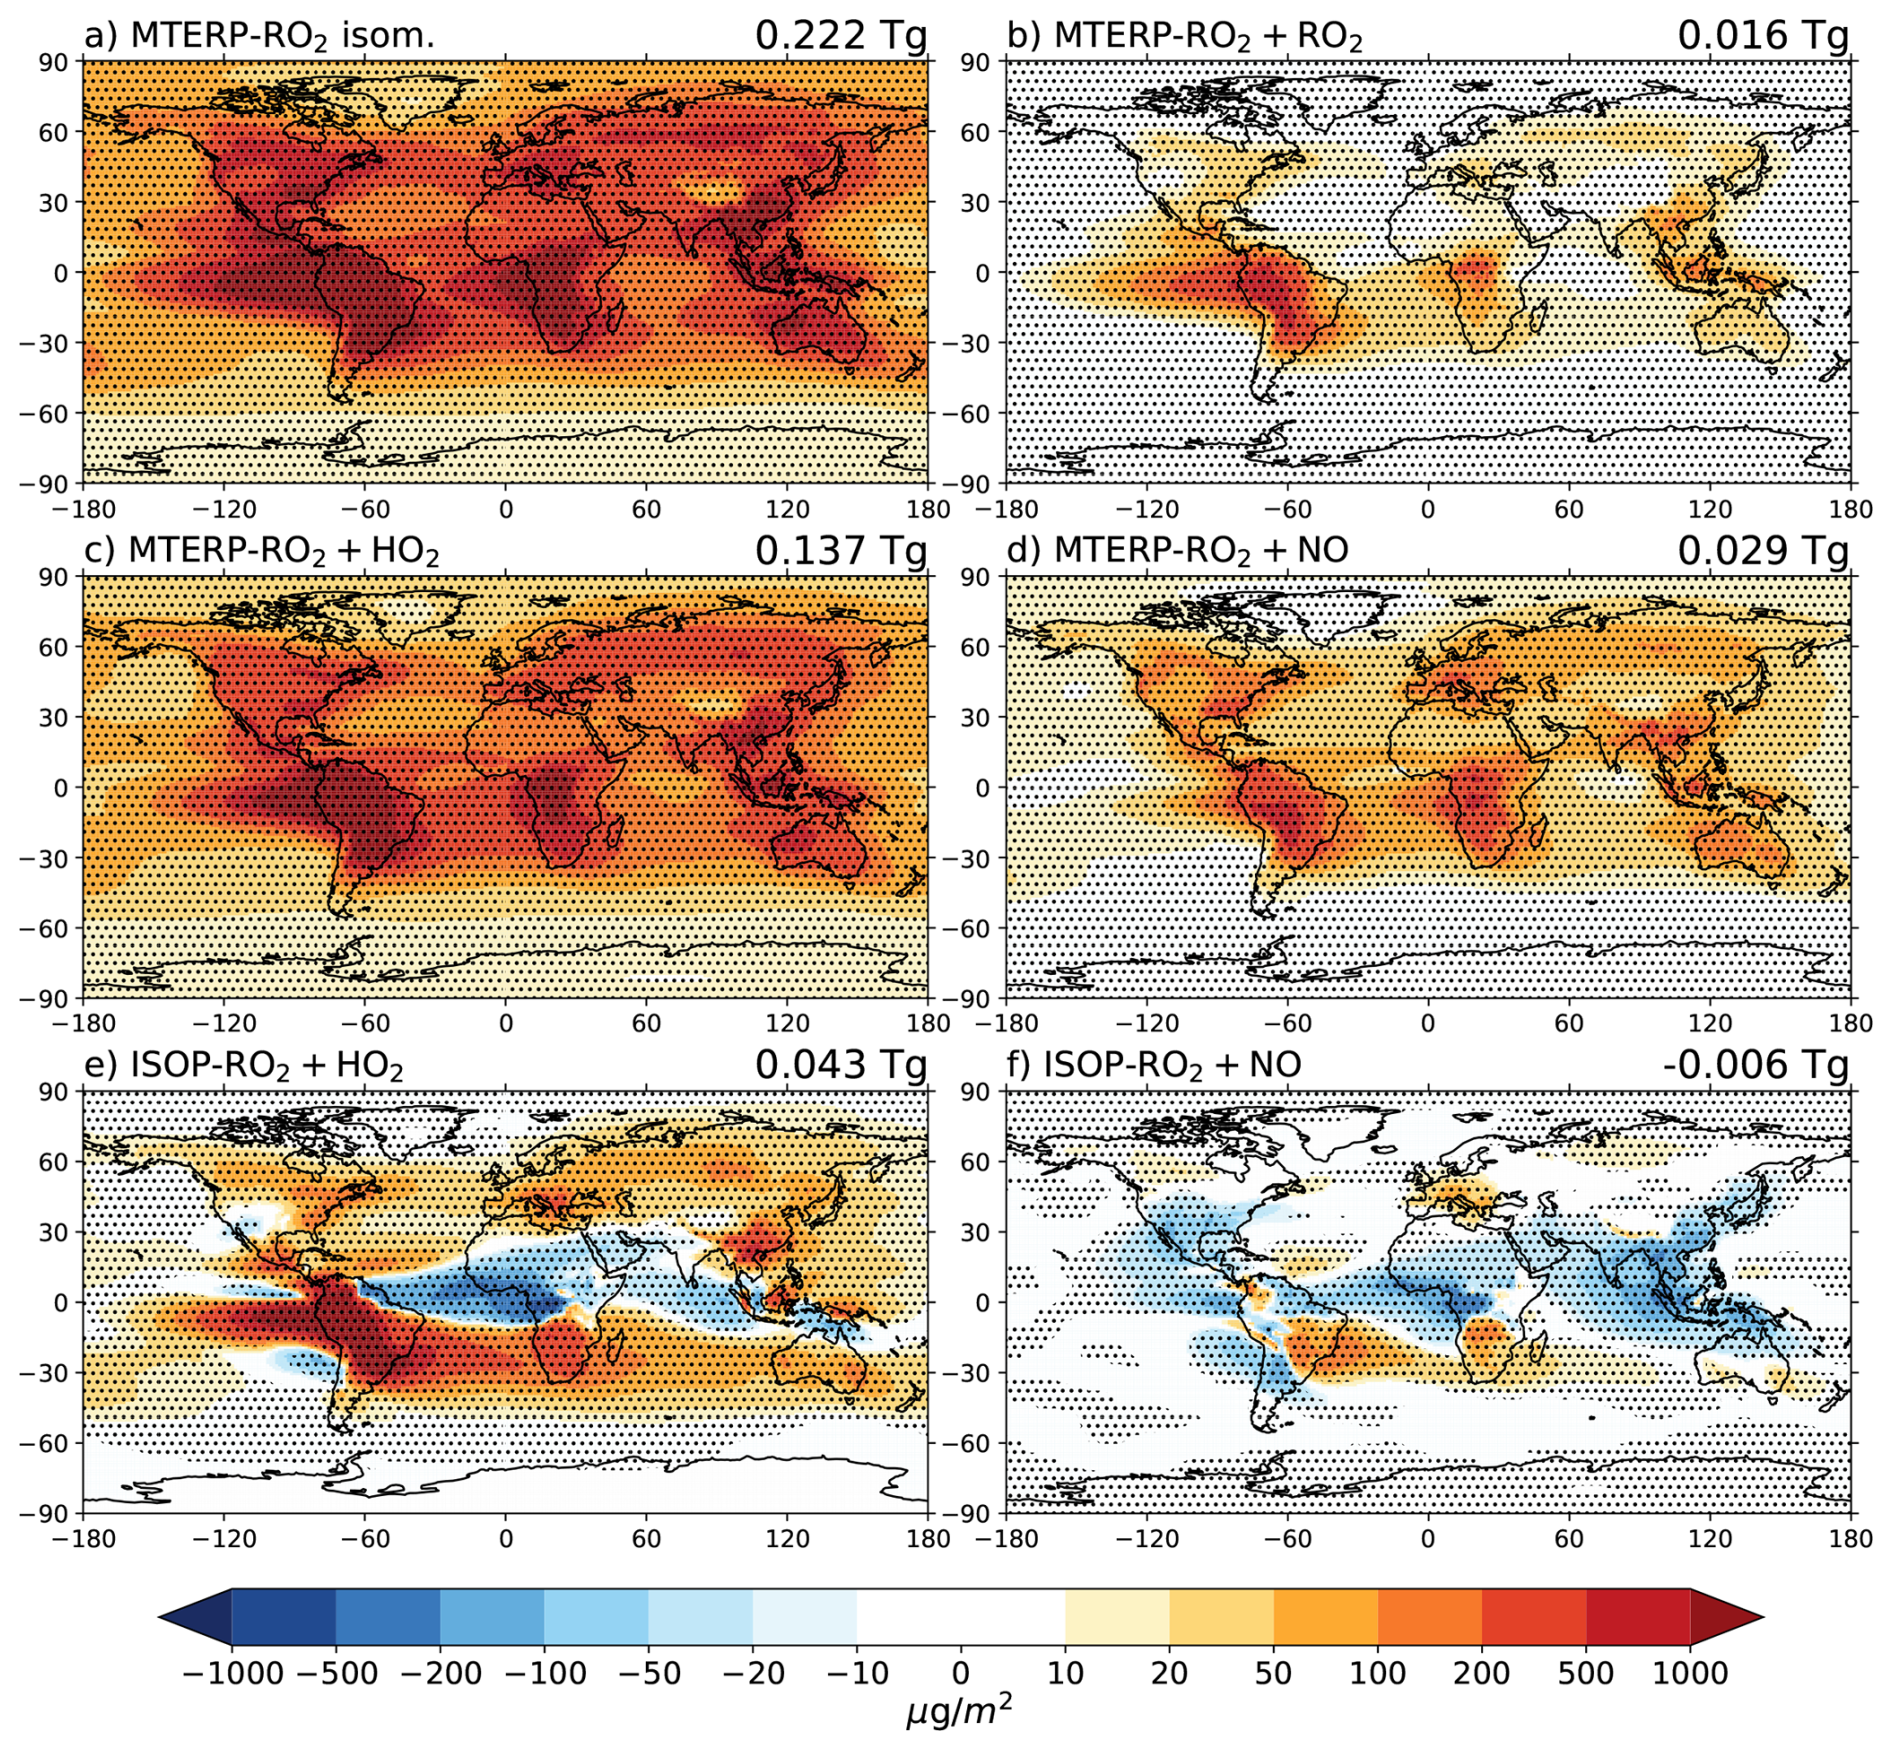
Figure 12Same as Fig. 11, except for changes from PD to F, calculated as F minus PD.
Overall, the total BVOC SOA decreases by 41 % (0.162 Tg) from PI to PD, mainly due to reductions in ISOP SOA (Fig. 10c). In contrast, from PD to F, it increases by 112 % (0.440 Tg), primarily due to enhanced MTERP SOA. These changes are largely driven by changes in BVOC emissions, with contributions from changes in wet removal, RO2 chemical fate, and gas-particle partitioning. Also, the PD-to-F changes largely depend on the selected future scenario. Using an alternative scenario with different NO emissions, temperature, and/or CO2 level can lead to substantially different results.
To further isolate how the chemistry is perturbed in different climate conditions, we compare PD with PI_PDB and F_PDB (Fig. 10) – these two experiments are the same as PI and F, respectively, but have VOC emissions fixed at the PD level (see details in Sect. 2.4). When removing the impacts of BVOC emission changes, MTERP SOA from isomerization increases from both PI_PDB to PD and PD to F_PDB, reflecting the acceleration of MTERP-RO2 isomerization with increasing temperatures. In contrast, the SOA formed through bimolecular reactions declines continuously from the past to the present and the future. The decrease from PI_PDB to PD is mainly due to the decreased SOA formation through the RO2 + HO2 pathway as a result of the shift of RO2 fate under higher NO emissions in PD, while the reduction from PD to F_PDB results from stronger warming that shifts gas-particle partitioning toward the gas phase. Overall, about half of the simulated decrease in total biogenic SOA from PI to PD is due to chemistry, thermodynamics, and wet deposition (24 % from PI_PDB to PD compared to 41 % from PI to PD; Fig. 10c and Table S1). Chemical and thermodynamics factors lead to a moderate decrease (14 %) from PD to F_PDB (Fig. 10c); this effect is overwhelmed by the increase in BVOC emissions from PD to F.
In this study, we expand the biogenic SOA formation mechanism in CESM2.2 based on the latest understanding of RO2 chemistry. Specifically, we implement the isomerization and RO2 + RO2 reaction pathways for monoterpene SOA formation and add isoprene product reactions included in MOZART but absent from the standard VBS. Both fast and slow RO2 + RO2 reaction rates combinations are tested.
We find that MTERP isomerization plays a critical role in SOA formation. The RO2 branch capable of isomerization is nearly saturated due to its fast reaction rate and this pathway contributes almost half of MTERP SOA formation by producing large amounts of low-volatility products. The RO2 + RO2 reactions contribute moderately to the MTERP RO2 fate but make a minor contribution to the MTERP SOA formation. However, we note that the SOA contribution from RO2 + RO2 reactions is likely underestimated, due to the low and fixed yields applied to the reactions along with the absence of SOA formation from non-accretion products. The updated RO2 chemistry increases MTERP SOA by 19 %–30 % compared with the baseline configuration, mainly due to the isomerization pathway. In addition, because of extra RO2 loss introduced by the newly implemented reactions, the ISOP SOA decreases by 16 %. The increase in MTERP SOA and the decrease in ISOP SOA compensate for each other. As a result, the total biogenic SOA burden is similar in the baseline and new configurations, despite the substantial changes in RO2 chemistry and SOA formation pathways.
With the new chemistry, we investigate how the RO2 fate and the SOA formation varies from the past to the present and the future. We find that for MTERP, the isomerization pathway is nearly saturated under all climate conditions, with a higher contribution in F because of the extreme global warming that further accelerates this pathway. The contribution from the RO2 + NO pathway to both the RO2 fate and SOA formation peaks in PD, due to higher NO emissions in PD than PI and F. The total biogenic SOA decreases by nearly half from PI to PD and is doubled from PD to F. The changes in SOA are dominated by changes in BVOC emissions, with contributions from shifts in RO2 chemical fate and gas-particle partitioning playing a more important role in the changes from PI to PD.
We simulate large changes in the fate of biogenic RO2 and SOA burden from the past to the future. RO2 chemistry plays an important role in determining SOA formation but is still subject to substantial uncertainties. To improve the representation of SOA in 3D models and better quantify their climate impacts, more laboratory studies are needed to constrain the uncertainties on the reaction rates and SOA yields for isomerization and RO2 + RO2 reactions as well as the isomerization branching ratio. Additional work is needed to translate laboratory SOA yields into model parameterizations that balance chemical complexity with computational efficiency.
This work is based on CESM2.2 (https://github.com/ESCOMP/CESM/releases/tag/release-cesm2.2.2, NCAR, 2023). The modified chemical mechanisms and the data shown in the figures are available on Zenodo (https://doi.org/10.5281/zenodo.21877569, Shi et al., 2026).
The supplement related to this article is available online at https://doi.org/10.5194/acp-26-15853-2026-supplement.
YS, CLH, and JHK formulated the overarching research goals and aims. YS and CLH designed the methodology. YS developed the model code, performed the simulations, analyzed the results, and created the figures. YS and CLH wrote the initial draft of this paper. All authors reviewed this paper.
The contact author has declared that none of the authors has any competing interests.
Publisher's note: Copernicus Publications remains neutral with regard to jurisdictional claims made in the text, published maps, institutional affiliations, or any other geographical representation in this paper. The authors bear the ultimate responsibility for providing appropriate place names. Views expressed in the text are those of the authors and do not necessarily reflect the views of the publisher.
We acknowledge high-performance computing support from the Derecho system (Computational and Information Systems Laboratory, 2023) provided by the NSF National Center for Atmospheric Research (NCAR), sponsored by the National Science Foundation. PNNL is operated for DOE by the Battelle Memorial Institute under contract no. DE-AC06-76RLO1830.
This work was supported by the U.S. Department of Energy (DE-SC0022017) grant to CLH and JHK at MIT. YS also acknowledges the support of Linus Pauling Distinguished Postdoctoral Fellowship program (Proposal Scope 86140) through the Laboratory Directed Research and Development Program at Pacific Northwest National Laboratory (PNNL).
This paper was edited by Stefania Gilardoni and reviewed by four anonymous referees.
Arneth, A., Miller, P. A., Scholze, M., Hickler, T., Schurgers, G., Smith, B., and Prentice, I. C.: CO2 inhibition of global terrestrial isoprene emissions: Potential implications for atmospheric chemistry, Geophys. Res. Lett., 34, https://doi.org/10.1029/2007GL030615, 2007.
Baboomian, V. J., Gu, Y., and Nizkorodov, S. A.: Photodegradation of Secondary Organic Aerosols by Long-Term Exposure to Solar Actinic Radiation, ACS Earth Space Chem., 4, 1078–1089, https://doi.org/10.1021/acsearthspacechem.0c00088, 2020.
Bergman, T., Makkonen, R., Schrödner, R., Swietlicki, E., Phillips, V. T. J., Le Sager, P., and van Noije, T.: Description and evaluation of a secondary organic aerosol and new particle formation scheme within TM5-MP v1.2, Geosci. Model Dev., 15, 683–713, https://doi.org/10.5194/gmd-15-683-2022, 2022.
Berndt, T., Richters, S., Jokinen, T., Hyttinen, N., Kurtén, T., Otkjær, R. V., Kjaergaard, H. G., Stratmann, F., Herrmann, H., Sipilä, M., Kulmala, M., and Ehn, M.: Hydroxyl radical-induced formation of highly oxidized organic compounds, Nat. Commun., 7, 13677, https://doi.org/10.1038/ncomms13677, 2016.
Berndt, T., Mentler, B., Scholz, W., Fischer, L., Herrmann, H., Kulmala, M., and Hansel, A.: Accretion Product Formation from Ozonolysis and OH Radical Reaction of α-Pinene: Mechanistic Insight and the Influence of Isoprene and Ethylene, Environ. Sci. Technol., 52, 11069–11077, https://doi.org/10.1021/acs.est.8b02210, 2018a.
Berndt, T., Scholz, W., Mentler, B., Fischer, L., Herrmann, H., Kulmala, M., and Hansel, A.: Accretion Product Formation from Self- and Cross-Reactions of RO2 Radicals in the Atmosphere, Angew. Chem. Int. Edit., 57, 3820–3824, https://doi.org/10.1002/anie.201710989, 2018b.
Berndt, T., Hoffmann, E. H., Tilgner, A., and Herrmann, H.: Highly oxidized products from the atmospheric reaction of hydroxyl radicals with isoprene, Nat. Commun., 16, 2068, https://doi.org/10.1038/s41467-025-57336-1, 2025.
Bianchi, F., Kurtén, T., Riva, M., Mohr, C., Rissanen, M. P., Roldin, P., Berndt, T., Crounse, J. D., Wennberg, P. O., Mentel, T. F., Wildt, J., Junninen, H., Jokinen, T., Kulmala, M., Worsnop, D. R., Thornton, J. A., Donahue, N., Kjaergaard, H. G., and Ehn, M.: Highly Oxygenated Organic Molecules (HOM) from Gas-Phase Autoxidation Involving Peroxy Radicals: A Key Contributor to Atmospheric Aerosol, Chem. Rev., 119, 3472–3509, https://doi.org/10.1021/acs.chemrev.8b00395, 2019.
Borcher, J. E., Salo, V.-T., Golin Almeida, T., and Kjaergaard, H. G.: Hydrogen Shift Reactions in Nonhydrocarbon Peroxy Radicals, J. Phys. Chem. A, 130, 1375–1383, https://doi.org/10.1021/acs.jpca.5c06832, 2026.
Burnett, R., Chen, H., Szyszkowicz, M., Fann, N., Hubbell, B., Pope, C. A., Apte, J. S., Brauer, M., Cohen, A., Weichenthal, S., Coggins, J., Di, Q., Brunekreef, B., Frostad, J., Lim, S. S., Kan, H., Walker, K. D., Thurston, G. D., Hayes, R. B., Lim, C. C., Turner, M. C., Jerrett, M., Krewski, D., Gapstur, S. M., Diver, W. R., Ostro, B., Goldberg, D., Crouse, D. L., Martin, R. V., Peters, P., Pinault, L., Tjepkema, M., van Donkelaar, A., Villeneuve, P. J., Miller, A. B., Yin, P., Zhou, M., Wang, L., Janssen, N. A. H., Marra, M., Atkinson, R. W., Tsang, H., Quoc Thach, T., Cannon, J. B., Allen, R. T., Hart, J. E., Laden, F., Cesaroni, G., Forastiere, F., Weinmayr, G., Jaensch, A., Nagel, G., Concin, H., and Spadaro, J. V.: Global estimates of mortality associated with long-term exposure to outdoor fine particulate matter, P. Natl. Acad. Sci. USA, 115, 9592–9597, https://doi.org/10.1073/pnas.1803222115, 2018.
Cao, Y., Yue, X., Liao, H., Yang, Y., Zhu, J., Chen, L., Tian, C., Lei, Y., Zhou, H., and Ma, Y.: Ensemble projection of global isoprene emissions by the end of 21st century using CMIP6 models, Atmos. Environ., 267, 118766, https://doi.org/10.1016/j.atmosenv.2021.118766, 2021.
Chin, M., Ginoux, P., Kinne, S., Torres, O., Holben, B. N., Duncan, B. N., Martin, R. V., Logan, J. A., Higurashi, A., and Nakajima, T.: Tropospheric Aerosol Optical Thickness from the GOCART Model and Comparisons with Satellite and Sun Photometer Measurements, Journal of the Atmospheric Sciences, 59, 461–483, https://doi.org/10.1175/1520-0469(2002)059<0461:TAOTFT>2.0.CO;2, 2002.
Chung, S. H. and Seinfeld: Global distribution and climate forcing of carbonaceous aerosols, J. Geophys. Res., 107, 4407, https://doi.org/10.1029/2001JD001397, 2002.
Colarco, P., Da Silva, A., Chin, M., and Diehl, T.: Online simulations of global aerosol distributions in the NASA GEOS-4 model and comparisons to satellite and ground-based aerosol optical depth, J. Geophys. Res., 115, 2009JD012820, https://doi.org/10.1029/2009JD012820, 2010.
Computational and Information Systems Laboratory: Derecho: HPE Cray EX System (University Community Computing), NSF National Center for Atmospheric Research, Boulder, CO, https://doi.org/10.5065/qx9a-pg09, 2023.
D'Ambro, E. L., Møller, K. H., Lopez-Hilfiker, F. D., Schobesberger, S., Liu, J., Shilling, J. E., Lee, B. H., Kjaergaard, H. G., and Thornton, J. A.: Isomerization of Second-Generation Isoprene Peroxy Radicals: Epoxide Formation and Implications for Secondary Organic Aerosol Yields, Environ. Sci. Technol., 51, 4978–4987, https://doi.org/10.1021/acs.est.7b00460, 2017.
Danabasoglu, G., Lamarque, J.-F., Bacmeister, J., Bailey, D. A., DuVivier, A. K., Edwards, J., Emmons, L. K., Fasullo, J., Garcia, R., Gettelman, A., Hannay, C., Holland, M. M., Large, W. G., Lauritzen, P. H., Lawrence, D. M., Lenaerts, J. T. M., Lindsay, K., Lipscomb, W. H., Mills, M. J., Neale, R., Oleson, K. W., Otto-Bliesner, B., Phillips, A. S., Sacks, W., Tilmes, S., van Kampenhout, L., Vertenstein, M., Bertini, A., Dennis, J., Deser, C., Fischer, C., Fox-Kemper, B., Kay, J. E., Kinnison, D., Kushner, P. J., Larson, V. E., Long, M. C., Mickelson, S., Moore, J. K., Nienhouse, E., Polvani, L., Rasch, P. J., and Strand, W. G.: The Community Earth System Model Version 2 (CESM2), J. Adv. Model. Earth Sy., 12, e2019MS001916, https://doi.org/10.1029/2019MS001916, 2020.
Ehn, M., Thornton, J. A., Kleist, E., Sipilä, M., Junninen, H., Pullinen, I., Springer, M., Rubach, F., Tillmann, R., Lee, B., Lopez-Hilfiker, F., Andres, S., Acir, I.-H., Rissanen, M., Jokinen, T., Schobesberger, S., Kangasluoma, J., Kontkanen, J., Nieminen, T., Kurtén, T., Nielsen, L. B., Jørgensen, S., Kjaergaard, H. G., Canagaratna, M., Maso, M. D., Berndt, T., Petäjä, T., Wahner, A., Kerminen, V.-M., Kulmala, M., Worsnop, D. R., Wildt, J., and Mentel, T. F.: A large source of low-volatility secondary organic aerosol, Nature, 506, 476–479, https://doi.org/10.1038/nature13032, 2014.
Emmons, L. K., Schwantes, R. H., Orlando, J. J., Tyndall, G., Kinnison, D., Lamarque, J., Marsh, D., Mills, M. J., Tilmes, S., Bardeen, C., Buchholz, R. R., Conley, A., Gettelman, A., Garcia, R., Simpson, I., Blake, D. R., Meinardi, S., and Pétron, G.: The Chemistry Mechanism in the Community Earth System Model Version 2 (CESM2), J. Adv. Model. Earth Syst., 12, https://doi.org/10.1029/2019MS001882, 2020.
Epstein, S. A., Riipinen, I., and Donahue, N. M.: A semiempirical correlation between enthalpy of vaporization and saturation concentration for organic aerosol, Environ. Sci. Technol., 44, 743–748, https://doi.org/10.1021/es902497z, 2010.
Forster, P., T. Storelvmo, K. Armour, W. Collins, J.-L. Dufresne, Frame, D., Lunt, D. J., Mauritsen, T., Palmer, M. D., Watanabe, M., Wild, M., and Zhang, H.: The Earth's Energy Budget, Climate Feedbacks, and Climate Sensitivity, in Climate Change 2021: The Physical Science Basis. Contribution of Working Group I to the Sixth Assessment Report of the Intergovernmental Panel on Climate Change, edited by: Masson-Delmotte, V., Zhai, P., Pirani, A., Connors, S. L., Péan, C., Berger, S., Caud, N., Chen, Y., Goldfarb, L., Gomis, M. I., Huang, M., Leitzell, K., Lonnoy, E., Matthews, J. B. R., Maycock, T. K., Waterfield, T., Yelekçi, O., Yu, R., and Zhou, B., Cambridge University Press, Cambridge, United Kingdom and New York, NY, USA, 923–1054, https://doi.org/10.1017/9781009157896.009, 2021.
Franzon, L.: Simple physical model for the estimation of irreversible dissociation rates for bimolecular complexes, J. Phys. Chem. A, 127, 5956–5966, https://doi.org/10.1021/acs.jpca.3c01890, 2023.
Goss, M. B., Kenagy, H. S., Heald, C. L., and Kroll, J. H.: Re-Examining Chemical Conditions of Past Chamber Studies of Secondary Organic Aerosol Formation, ACS EST Air, 2, 2117–2130, https://doi.org/10.1021/acsestair.5c00112, 2025b.
Guenther, A. B., Jiang, X., Heald, C. L., Sakulyanontvittaya, T., Duhl, T., Emmons, L. K., and Wang, X.: The Model of Emissions of Gases and Aerosols from Nature version 2.1 (MEGAN2.1): an extended and updated framework for modeling biogenic emissions, Geosci. Model Dev., 5, 1471–1492, https://doi.org/10.5194/gmd-5-1471-2012, 2012.
Hallquist, M., Wenger, J. C., Baltensperger, U., Rudich, Y., Simpson, D., Claeys, M., Dommen, J., Donahue, N. M., George, C., Goldstein, A. H., Hamilton, J. F., Herrmann, H., Hoffmann, T., Iinuma, Y., Jang, M., Jenkin, M. E., Jimenez, J. L., Kiendler-Scharr, A., Maenhaut, W., McFiggans, G., Mentel, Th. F., Monod, A., Prévôt, A. S. H., Seinfeld, J. H., Surratt, J. D., Szmigielski, R., and Wildt, J.: The formation, properties and impact of secondary organic aerosol: current and emerging issues, Atmos. Chem. Phys., 9, 5155–5236, https://doi.org/10.5194/acp-9-5155-2009, 2009.
Hausfather, Z. and Peters, G. P.: Emissions – the “business as usual” story is misleading, Nature, 577, 618–620, https://doi.org/10.1038/d41586-020-00177-3, 2020.
Heald, C. L. and Geddes, J. A.: The impact of historical land use change from 1850 to 2000 on secondary particulate matter and ozone, Atmos. Chem. Phys., 16, 14997–15010, https://doi.org/10.5194/acp-16-14997-2016, 2016.
Heald, C. L., Wilkinson, M. J., Monson, R. K., Alo, C. A., Wang, G., and Guenther, A.: Response of isoprene emission to ambient CO2 changes and implications for global budgets, Glob. Change Biol., 15, 1127–1140, https://doi.org/10.1111/j.1365-2486.2008.01802.x, 2009.
Henry, K. M. and Donahue, N. M.: Photochemical Aging of α-Pinene Secondary Organic Aerosol: Effects of OH Radical Sources and Photolysis, J. Phys. Chem. A, 116, 5932–5940, https://doi.org/10.1021/jp210288s, 2012.
Henze, D. K., Seinfeld, J. H., Ng, N. L., Kroll, J. H., Fu, T.-M., Jacob, D. J., and Heald, C. L.: Global modeling of secondary organic aerosol formation from aromatic hydrocarbons: high- vs. low-yield pathways, Atmos. Chem. Phys., 8, 2405–2420, https://doi.org/10.5194/acp-8-2405-2008, 2008.
Hodzic, A., Madronich, S., Kasibhatla, P. S., Tyndall, G., Aumont, B., Jimenez, J. L., Lee-Taylor, J., and Orlando, J.: Organic photolysis reactions in tropospheric aerosols: effect on secondary organic aerosol formation and lifetime, Atmos. Chem. Phys., 15, 9253–9269, https://doi.org/10.5194/acp-15-9253-2015, 2015.
Hodzic, A., Kasibhatla, P. S., Jo, D. S., Cappa, C. D., Jimenez, J. L., Madronich, S., and Park, R. J.: Rethinking the global secondary organic aerosol (SOA) budget: stronger production, faster removal, shorter lifetime, Atmos. Chem. Phys., 16, 7917–7941, https://doi.org/10.5194/acp-16-7917-2016, 2016.
Hoyle, C. R., Berntsen, T., Myhre, G., and Isaksen, I. S. A.: Secondary organic aerosol in the global aerosol – chemical transport model Oslo CTM2, Atmos. Chem. Phys., 7, 5675–5694, https://doi.org/10.5194/acp-7-5675-2007, 2007.
Jimenez, J. L., Canagaratna, M. R., Donahue, N. M., Prevot, A. S. H., Zhang, Q., Kroll, J. H., DeCarlo, P. F., Allan, J. D., Coe, H., Ng, N. L., Aiken, A. C., Docherty, K. S., Ulbrich, I. M., Grieshop, A. P., Robinson, A. L., Duplissy, J., Smith, J. D., Wilson, K. R., Lanz, V. A., Hueglin, C., Sun, Y. L., Tian, J., Laaksonen, A., Raatikainen, T., Rautiainen, J., Vaattovaara, P., Ehn, M., Kulmala, M., Tomlinson, J. M., Collins, D. R., Cubison, M. J., E., Dunlea, J., Huffman, J. A., Onasch, T. B., Alfarra, M. R., Williams, P. I., Bower, K., Kondo, Y., Schneider, J., Drewnick, F., Borrmann, S., Weimer, S., Demerjian, K., Salcedo, D., Cottrell, L., Griffin, R., Takami, A., Miyoshi, T., Hatakeyama, S., Shimono, A., Sun, J. Y., Zhang, Y. M., Dzepina, K., Kimmel, J. R., Sueper, D., Jayne, J. T., Herndon, S. C., Trimborn, A. M., Williams, L. R., Wood, E. C., Middlebrook, A. M., Kolb, C. E., Baltensperger, U., and Worsnop, D. R.: Evolution of Organic Aerosols in the Atmosphere, Science, 326, 1525–1529, https://doi.org/10.1126/science.1180353, 2009.
Jo, D. S., Hodzic, A., Emmons, L. K., Tilmes, S., Schwantes, R. H., Mills, M. J., Campuzano-Jost, P., Hu, W., Zaveri, R. A., Easter, R. C., Singh, B., Lu, Z., Schulz, C., Schneider, J., Shilling, J. E., Wisthaler, A., and Jimenez, J. L.: Future changes in isoprene-epoxydiol-derived secondary organic aerosol (IEPOX SOA) under the Shared Socioeconomic Pathways: the importance of physicochemical dependency, Atmos. Chem. Phys., 21, 3395–3425, https://doi.org/10.5194/acp-21-3395-2021, 2021.
Jo, D. S., Tilmes, S., Emmons, L. K., Wang, S., and Vitt, F.: A new simplified parameterization of secondary organic aerosol in the Community Earth System Model Version 2 (CESM2; CAM6.3), Geosci. Model Dev., 16, 3893–3906, https://doi.org/10.5194/gmd-16-3893-2023, 2023.
Kanakidou, M., Seinfeld, J. H., Pandis, S. N., Barnes, I., Dentener, F. J., Facchini, M. C., Van Dingenen, R., Ervens, B., Nenes, A., Nielsen, C. J., Swietlicki, E., Putaud, J. P., Balkanski, Y., Fuzzi, S., Horth, J., Moortgat, G. K., Winterhalter, R., Myhre, C. E. L., Tsigaridis, K., Vignati, E., Stephanou, E. G., and Wilson, J.: Organic aerosol and global climate modelling: a review, Atmos. Chem. Phys., 5, 1053–1123, https://doi.org/10.5194/acp-5-1053-2005, 2005.
Kang, S., Wildt, J., Pullinen, I., Vereecken, L., Wu, C., Wahner, A., Zorn, S. R., and Mentel, T. F.: Formation of highly oxygenated organic molecules from α-pinene photooxidation: evidence for the importance of highly oxygenated alkoxy radicals, Atmos. Chem. Phys., 25, 15715–15740, https://doi.org/10.5194/acp-25-15715-2025, 2025.
Kirkevåg, A., Grini, A., Olivié, D., Seland, Ø., Alterskjær, K., Hummel, M., Karset, I. H. H., Lewinschal, A., Liu, X., Makkonen, R., Bethke, I., Griesfeller, J., Schulz, M., and Iversen, T.: A production-tagged aerosol module for Earth system models, OsloAero5.3 – extensions and updates for CAM5.3-Oslo, Geosci. Model Dev., 11, 3945–3982, https://doi.org/10.5194/gmd-11-3945-2018, 2018.
Kenagy, H. S., Heald, C. L., Tahsini, N., Goss, M. B., and Kroll, J. H.: Can we achieve atmospheric chemical environments in the laboratory? An integrated model-measurement approach to chamber SOA studies, Science Advances, 10, eado1482, https://doi.org/10.1126/sciadv.ado1482, 2024.
Krapf, M., El Haddad, I., Bruns, E. A., Molteni, U., Daellenbach, K. R., Prévôt, A. S. H., Baltensperger, U., and Dommen, J.: Labile Peroxides in Secondary Organic Aerosol, Chem, 1, 603–616, https://doi.org/10.1016/j.chempr.2016.09.007, 2016.
Kroll, J. H., Ng, N. L., Murphy, S. M., Flagan, R. C., and Seinfeld, J. H.: Secondary organic aerosol formation from isoprene photooxidation under high-NO x conditions, Geophys. Res. Lett., 32, https://doi.org/10.1029/2005GL023637, 2005.
Kroll, J. H., Ng, N. L., Murphy, S. M., Flagan, R. C., and Seinfeld, J. H.: Secondary Organic Aerosol Formation from Isoprene Photooxidation, Environ. Sci. Technol., 40, 1869–1877, https://doi.org/10.1021/es0524301, 2006.
Lawrence, D. M., Fisher, R. A., Koven, C. D., Oleson, K. W., Swenson, S. C., Bonan, G., Collier, N., Ghimire, B., Kampenhout, L. van, Kennedy, D., Kluzek, E., Lawrence, P. J., Li, F., Li, H., Lombardozzi, D., Riley, W. J., Sacks, W. J., Shi, M., Vertenstein, M., Wieder, W. R., Xu, C., Ali, A. A., Badger, A. M., Bisht, G., Broeke, M. van den, Brunke, M. A., Burns, S. P., Buzan, J., Clark, M., Craig, A., Dahlin, K., Drewniak, B., Fisher, J. B., Flanner, M., Fox, A. M., Gentine, P., Hoffman, F., Keppel-Aleks, G., Knox, R., Kumar, S., Lenaerts, J., Leung, L. R., Lipscomb, W. H., Lu, Y., Pandey, A., Pelletier, J. D., Perket, J., Randerson, J. T., Ricciuto, D. M., Sanderson, B. M., Slater, A., Subin, Z. M., Tang, J., Thomas, R. Q., Martin, M. V., and Zeng, X.: The Community Land Model Version 5: Description of New Features, Benchmarking, and Impact of Forcing Uncertainty, J. Adv. Model. Earth Sy., 11, 4245–4287, https://doi.org/10.1029/2018MS001583, 2019.
Lee, A., Goldstein, A. H., Kroll, J. H., Ng, N. L., Varutbangkul, V., Flagan R. C., and Seinfeld, J. H.: Gas-phase products and secondary aerosol yields from the photooxidation of 16 different terpenes, J. Geophys. Res., 111, D17305, https://doi.org/10.1029/2006JD007050, 2006.
Liu, X., Easter, R. C., Ghan, S. J., Zaveri, R., Rasch, P., Shi, X., Lamarque, J.-F., Gettelman, A., Morrison, H., Vitt, F., Conley, A., Park, S., Neale, R., Hannay, C., Ekman, A. M. L., Hess, P., Mahowald, N., Collins, W., Iacono, M. J., Bretherton, C. S., Flanner, M. G., and Mitchell, D.: Toward a minimal representation of aerosols in climate models: description and evaluation in the Community Atmosphere Model CAM5, Geosci. Model Dev., 5, 709–739, https://doi.org/10.5194/gmd-5-709-2012, 2012.
Liu, X., Ma, P.-L., Wang, H., Tilmes, S., Singh, B., Easter, R. C., Ghan, S. J., and Rasch, P. J.: Description and evaluation of a new four-mode version of the Modal Aerosol Module (MAM4) within version 5.3 of the Community Atmosphere Model, Geosci. Model Dev., 9, 505–522, https://doi.org/10.5194/gmd-9-505-2016, 2016.
Lou, S., Shrivastava, M., Easter, R. C., Yang, Y., Ma, P.-L., Wang, H., Cubison, M. J., Campuzano-Jost, P., Jimenez, J. L., Zhang, Q., Rasch, P. J., Shilling, J. E., Zelenyuk, A., Dubey, M., Cameron-Smith, P., Martin, S. T., Schneider, J., and Schulz, C.: New SOA Treatments Within the Energy Exascale Earth System Model (E3SM): Strong Production and Sinks Govern Atmospheric SOA Distributions and Radiative Forcing, J. Adv. Model. Earth Sy., 12, e2020MS002266, https://doi.org/10.1029/2020MS002266, 2020.
Marais, E. A., Jacob, D. J., Jimenez, J. L., Campuzano-Jost, P., Day, D. A., Hu, W., Krechmer, J., Zhu, L., Kim, P. S., Miller, C. C., Fisher, J. A., Travis, K., Yu, K., Hanisco, T. F., Wolfe, G. M., Arkinson, H. L., Pye, H. O. T., Froyd, K. D., Liao, J., and McNeill, V. F.: Aqueous-phase mechanism for secondary organic aerosol formation from isoprene: application to the southeast United States and co-benefit of SO2 emission controls, Atmos. Chem. Phys., 16, 1603–1618, https://doi.org/10.5194/acp-16-1603-2016, 2016.
Mayhew, A. W., Franzon, L., Bates, K. H., Kurtén, T., Lopez-Hilfiker, F. D., Mohr, C., Rickard, A. R., Thornton, J. A., and Haskins, J. D.: The global importance of gas-phase peroxy radical accretion reactions for secondary organic aerosol loading, Atmos. Chem. Phys., 25, 17027–17046, https://doi.org/10.5194/acp-25-17027-2025, 2025.
NCAR: Community Earth System Model Version 2.2.2, GitHub [code], https://github.com/ESCOMP/CESM/releases/tag/release-cesm2.2.2 (last access: 5 April 2024), 2023.
Ng, N. L., Chhabra, P. S., Chan, A. W. H., Surratt, J. D., Kroll, J. H., Kwan, A. J., McCabe, D. C., Wennberg, P. O., Sorooshian, A., Murphy, S. M., Dalleska, N. F., Flagan, R. C., and Seinfeld, J. H.: Effect of NOx level on secondary organic aerosol (SOA) formation from the photooxidation of terpenes, Atmos. Chem. Phys., 7, 5159–5174, https://doi.org/10.5194/acp-7-5159-2007, 2007.
O'Brien, R. E. and Kroll, J. H.: Photolytic Aging of Secondary Organic Aerosol: Evidence for a Substantial Photo-Recalcitrant Fraction, J. Phys. Chem. Lett., 10, 4003–4009, https://doi.org/10.1021/acs.jpclett.9b01417, 2019.
Otkjær, R. V., Jakobsen, H. H., Tram, C. M., and Kjaergaard, H. G.: Calculated Hydrogen Shift Rate Constants in Substituted Alkyl Peroxy Radicals, J. Phys. Chem. A, 122, 8665–8673, https://doi.org/10.1021/acs.jpca.8b06223, 2018.
Paulot, F., Crounse, J. D., Kjaergaard, H. G., Kürten, A., St. Clair, J. M., Seinfeld, J. H., and Wennberg, P. O.: Unexpected epoxide formation in the gas-phase photooxidation of isoprene, Science, 325, 730-733, https://doi.org/10.1126/science.1172910, 2009.
Piletic, I. R. and Kleindienst, T. E.: Rates and yields of unimolecular reactions producing highly oxidized peroxy radicals in the OH-induced autoxidation of α-pinene, β-pinene, and limonene, J. Phys. Chem. A, 126, 88–100, https://doi.org/10.1021/acs.jpca.1c07961, 2022.
Presto, A. A., Huff Hartz, K. E., and Donahue, N. M.: Secondary Organic Aerosol Production from Terpene Ozonolysis. 2. Effect of NOx Concentration, Environ. Sci. Technol., 39, 7046–7054, https://doi.org/10.1021/es050400s, 2005.
Pye, H. O. T., Chan, A. W. H., Barkley, M. P., and Seinfeld, J. H.: Global modeling of organic aerosol: the importance of reactive nitrogen (NOx and NO3), Atmos. Chem. Phys., 10, 11261–11276, https://doi.org/10.5194/acp-10-11261-2010, 2010.
Pye, H. O. T., D'Ambro, E. L., Lee, B. H., Schobesberger, S., Takeuchi, M., Zhao, Y., Lopez-Hilfiker, F., Liu, J., Shilling, J. E., Xing, J., Mathur, R., Middlebrook, A. M., Liao, J., Welti, A., Graus, M., Warneke, C., de Gouw, J. A., Holloway, J. S., Ryerson, T. B., Pollack, I. B., and Thornton, J. A.: Anthropogenic enhancements to production of highly oxygenated molecules from autoxidation, P. Natl. Acad. Sci. USA, 116, 6641–6646, https://doi.org/10.1073/pnas.1810774116, 2019.
Rao, S., Klimont, Z., Smith, S. J., Van Dingenen, R., Dentener, F., Bouwman, L., Riahi, K., Amann, M., Bodirsky, B. L., van Vuuren, D. P., Aleluia Reis, L., Calvin, K., Drouet, L., Fricko, O., Fujimori, S., Gernaat, D., Havlik, P., Harmsen, M., Hasegawa, T., Heyes, C., Hilaire, J., Luderer, G., Masui, T., Stehfest, E., Strefler, J., van der Sluis, S., and Tavoni, M.: Future air pollution in the Shared Socio-economic Pathways, Global Environ. Change, 42, 346–358, https://doi.org/10.1016/j.gloenvcha.2016.05.012, 2017.
Riahi, K., van Vuuren, D. P., Kriegler, E., Edmonds, J., O'Neill, B. C., Fujimori, S., Bauer, N., Calvin, K., Dellink, R., Fricko, O., Lutz, W., Popp, A., Cuaresma, J. C., Kc, S., Leimbach, M., Jiang, L., Kram, T., Rao, S., Emmerling, J., Ebi, K., Hasegawa, T., Havlik, P., Humpenöder, F., Da Silva, L. A., Smith, S., Stehfest, E., Bosetti, V., Eom, J., Gernaat, D., Masui, T., Rogelj, J., Strefler, J., Drouet, L., Krey, V., Luderer, G., Harmsen, M., Takahashi, K., Baumstark, L., Doelman, J. C., Kainuma, M., Klimont, Z., Marangoni, G., Lotze-Campen, H., Obersteiner, M., Tabeau, A., and Tavoni, M.: The Shared Socioeconomic Pathways and their energy, land use, and greenhouse gas emissions implications: An overview, Global Environmental Change, 42, 153–168, https://doi.org/10.1016/j.gloenvcha.2016.05.009, 2017.
Schwantes, R. H., Emmons, L. K., Orlando, J. J., Barth, M. C., Tyndall, G. S., Hall, S. R., Ullmann, K., St. Clair, J. M., Blake, D. R., Wisthaler, A., and Bui, T. P. V.: Comprehensive isoprene and terpene gas-phase chemistry improves simulated surface ozone in the southeastern US, Atmos. Chem. Phys., 20, 3739–3776, https://doi.org/10.5194/acp-20-3739-2020, 2020.
Shi, Y., Heald, C. L., and Val Martin, M.: Future Anthropogenic Land Use Change Impacts on Carbonaceous Aerosol and Implications for Climate and Air Quality, Geophys. Res. Lett., 52, e2024GL110962, https://doi.org/10.1029/2024GL110962, 2025.
Shi, Y., Heald, C. L., and Kroll, J. H.: Drivers of biogenic secondary organic aerosol from the past to the future, Zenodo [data set], https://doi.org/10.5281/zenodo.21877569, 2026.
Song, C., Na, K., and Cocker, D. R.: Impact of the Hydrocarbon to NOx Ratio on Secondary Organic Aerosol Formation, Environ. Sci. Technol., 39, 3143–3149, https://doi.org/10.1021/es0493244, 2005.
Sun, M. and Smith, G. D.: Photolytic Mass Loss of Humic Substances Measured with a Quartz Crystal Microbalance, ACS Earth Space Chem., https://doi.org/10.1021/acsearthspacechem.4c00134, 2024.
Tilmes, S., Hodzic, A., Emmons, L. K., Mills, M. J., Gettelman, A., Kinnison, D. E., Park, M., Lamarque, J. -F., Vitt, F., Shrivastava, M., Campuzano-Jost, P., Jimenez, J. L., and Liu, X.: Climate Forcing and Trends of Organic Aerosols in the Community Earth System Model (CESM2), J. Adv. Model. Earth Syst., 11, 4323–4351, https://doi.org/10.1029/2019MS001827, 2019.
Tsimpidi, A. P., Karydis, V. A., Pozzer, A., Pandis, S. N., and Lelieveld, J.: ORACLE (v1.0): module to simulate the organic aerosol composition and evolution in the atmosphere, Geosci. Model Dev., 7, 3153–3172, https://doi.org/10.5194/gmd-7-3153-2014, 2014.
Unger, N.: Human land-use-driven reduction of forest volatiles cools global climate, Nat. Clim. Change, 4, 907–910, https://doi.org/10.1038/nclimate2347, 2014.
Vereecken, L. and Nozière, B.: H migration in peroxy radicals under atmospheric conditions, Atmos. Chem. Phys., 20, 7429–7458, https://doi.org/10.5194/acp-20-7429-2020, 2020.
Vereecken, L., Müller, J.-F., and Peeters, J.: Low-volatility poly-oxygenates in the OH-initiated atmospheric oxidation of α-pinene: impact of non-traditional peroxyl radical chemistry, Phys. Chem. Chem. Phys., 9, 5241–5248, https://doi.org/10.1039/B708023A, 2007.
Wennberg, P. O., Bates, K. H., Crounse, J. D., Dodson, L. G., McVay, R. C., Mertens, L. A., Nguyen, T. B., Praske, E., Schwantes, R. H., Smarte, M. D., St. Clair, J. M., Teng, A. P., Zhang, X., and Seinfeld, J. H.: Gas-Phase Reactions of Isoprene and Its Major Oxidation Products, Chem. Rev., 118, 3337–3390, https://doi.org/10.1021/acs.chemrev.7b00439, 2018.
Xu, L., Møller, K. H., Crounse, J. D., Otkjær, R. V., Kjaergaard, H. G., and Wennberg, P. O.: Unimolecular Reactions of Peroxy Radicals Formed in the Oxidation of α-Pinene and β-Pinene by Hydroxyl Radicals, J. Phys. Chem. A, 123, 1661–1674, https://doi.org/10.1021/acs.jpca.8b11726, 2019.
Xu, R., Thornton, J. A., Lee, B. H., Zhang, Y., Jaeglé, L., Lopez-Hilfiker, F. D., Rantala, P., and Petäjä, T.: Global simulations of monoterpene-derived peroxy radical fates and the distributions of highly oxygenated organic molecules (HOMs) and accretion products, Atmos. Chem. Phys., 22, 5477–5494, https://doi.org/10.5194/acp-22-5477-2022, 2022.
Zawadowicz, M. A., Lee, B. H., Shrivastava, M., Zelenyuk, A., Zaveri, R. A., Flynn, C., Thornton, J. A., and Shilling, J. E.: Photolysis Controls Atmospheric Budgets of Biogenic Secondary Organic Aerosol, Environ. Sci. Technol., 54, 3861–3870, https://doi.org/10.1021/acs.est.9b07051, 2020.
Zhang, Q., Jimenez, J. L., Canagaratna, M. R., Allan, J. D., Coe, H., Ulbrich, I., Alfarra, M. R., Takami, A., Middlebrook, A. M., Sun, Y. L., Dzepina, K., Dunlea, E., Docherty, K., DeCarlo, P. F., Salcedo, D., Onasch, T., Jayne, J. T., Miyoshi, T., Shimono, A., Hatakeyama, S., Takegawa, N., Kondo, Y., Schneider, J., Drewnick, F., Borrmann, S., Weimer, S., Demerjian, K., Williams, P., Bower, K., Bahreini, R., Cottrell, L., Griffin, R. J., Rautiainen, J., Sun, J. Y., Zhang, Y. M., and Worsnop, D. R.: Ubiquity and dominance of oxygenated species in organic aerosols in anthropogenically-influenced Northern Hemisphere midlatitudes, Geophys. Res. Lett., 34, https://doi.org/10.1029/2007GL029979, 2007.
Zhao, B., Shrivastava, M., Donahue, N. M., Gordon, H., Schervish, M., Shilling, J. E., Zaveri, R. A., Wang, J., Andreae, M. O., Zhao, C., Gaudet, B., Liu, Y., Fan, J., and Fast, J. D.: High concentration of ultrafine particles in the Amazon free troposphere produced by organic new particle formation, P. Natl. Acad. Sci. USA, 117, 25344–25351, https://doi.org/10.1073/pnas.2006716117, 2020.
Zhao, B., Donahue, N. M., Zhang, K., Mao, L., Shrivastava, M., Ma, P.-L., Shen, J., Wang, S., Sun, J., Gordon, H., Tang, S., Fast, J., Wang, M., Gao, Y., Yan, C., Singh, B., Li, Z., Huang, L., Lou, S., Lin, G., Wang, H., Jiang, J., Ding, A., Nie, W., Qi, X., Chi, X., and Wang, L.: Global variability in atmospheric new particle formation mechanisms, Nature, 631, 98–105, https://doi.org/10.1038/s41586-024-07547-1, 2024.
Zhao, Y., Thornton, J. A., and Pye, H. O. T.: Quantitative constraints on autoxidation and dimer formation from direct probing of monoterpene-derived peroxy radical chemistry, P. Natl. Acad. Sci. USA, 115, 12142–12147, https://doi.org/10.1073/pnas.1812147115, 2018.