
the Creative Commons Attribution 4.0 License.
the Creative Commons Attribution 4.0 License.
 | 10 Nov 2026
Revisiting the parameterization of ice nucleation of dust particles under mixed-phase cloud conditions from laboratory measurements

Dust aerosol plays a key role in cloud formation and evolution due to its high atmospheric abundance and efficient ice nucleation ability (INA). A generalized parameterization of dust-induced ice formation in climate models remains challenging, because dust INA varies substantially with mineral composition, aerosol generation methods, and atmospheric aging processes. In this study, we revisited the INA of dust particles under mixed-phase cloud conditions (MPC, −38 < T < 0 °C) compiled from previous laboratory studies. Our results indicate that INA of dust particles with different mineral compositions exhibit variability spanning up to 6 orders of magnitude in INA at −38 < T < −2 °C. When accounting for mineralogical differences, aerosol generation methods whether particles are dry-dispersed or wet-suspended also contribute to the reported variability. This sample preparation difference likely arises from variations in water-particle interactions time scales that are longer in the suspension than the aerosol measurements. Aging generally reduces dust INA, with chemical reactions inducing the strongest reduction, followed by thermal treatments and water/aqueous aging. Based on these findings, we developed a suite of ns-based parameterizations to represent INA of dust particles with mixed and specific mineral composition. We also proposed parameterizations based on De (spherical equivalent particle diameter within a droplet), which predict droplet freezing across the full MPC temperature range using a single expression. These empirical parameterizations capture the general INA trends of dust particles and are expected to improve the accuracy of predictions of dust-induced cloud formation in climate models.
- Article
(3641 KB) - Full-text XML
-
Supplement
(1968 KB) - BibTeX
- EndNote


Aerosol particles can trigger ice formation from liquid water or water vapor in the atmosphere by serving as ice nucleating particles (INPs), a process known as heterogeneous ice nucleation. Unlike homogeneous freezing of cloud droplets in the absence of an INP (T < −38 °C), heterogeneous ice nucleation occurs at less extreme temperatures (T ≳ −38 °C) and lower ice supersaturation conditions. This difference arises because INPs provide a surface that lowers the energy barrier required for forming critical ice embryos. Heterogeneous ice nucleation is particularly important for mixed-phase clouds (MPCs), where homogeneous freezing rates are too low at T ≳ −38 °C. Quantifying aerosol ice nucleation is therefore fundamental for predicting cloud phase, precipitation and radiative properties (Burrows et al., 2022; Murray et al., 2021). The physicochemical properties and ice nucleation ability (INA) of INPs vary with their emission sources and can be modified by complex atmospheric aging processes (Kanji et al., 2017). This variability complicates the identification of ice nucleation mechanisms of INPs and the parameterization of their ice formation in climate models, limiting our ability to simulate aerosol–cloud interactions and their climate impacts (Burrows et al., 2022; Murray et al., 2021; McGraw et al., 2023).
Over the past three decades, significant progress has been made in characterizing the INA of atmospherically relevant INP species, as reviewed by many studies (Hoose and Möhler, 2012; Kanji et al., 2017; Murray et al., 2012; Huang et al., 2021; Huang et al., 2025). Among these species, mineral dust originating from desert, arid soil and volcanic sources are considered the most important INPs, due to the high atmospheric abundance and generally strong INA under MPC relevant conditions (T < −8 °C), as reported by numerous field and laboratory studies (Hoose and Möhler, 2012; Kanji et al., 2017; Murray et al., 2012). Based on these experimental findings, ice formation parameterizations have been developed to represent the INA of dust particles. Table S1 in the Supplement summarizes existing parameterizations derived from immersion freezing measurements of dust particles. Immersion freezing is considered the dominant ice nucleation pathway in MPCs (Ansmann et al., 2008; de Boer et al., 2011), in which an INP is immersed within a supercooled droplet and triggers droplet freezing. In general, two major types of parameterization approach have been developed: (i) classical nucleation theory (CNT)-based parameterizations (Marcolli et al., 2007; Chen et al., 2008; Murray et al., 2011; Niedermeier et al., 2011a; Savre and Ekman, 2015), which estimate heterogeneous ice nucleation rates (Jhet, Table S1) of INPs based on environmental variables (e.g., temperature and ice saturation ratio) and the contact angle (θ) between the ice embryo and INP surface (Chen et al., 2008; Savre and Ekman, 2015; Niedermeier et al., 2011a; Marcolli et al., 2007; Murray et al., 2011). The contact angle was determined based on surface properties of aerosol particles, and different assumptions were therefore made across studies. More details can be found in Table S1. (ii) empirical parameterizations (DeMott et al., 2010, 2015; Chen et al., 2024), which relate INP concentrations to physicochemical properties of aerosol particles, such as size distribution and surface area. For example, previous studies developed parameterizations to predict INP concentrations based on the number of dust aerosol particles larger than 500 nm (DeMott et al., 2010, 2015) or 1 µm (Mignani et al., 2021; Chen et al., 2024), by observing a strong correlation between these two variables. Another widely used parameter is the active site density of dust particles, which assumes that ice nucleation is triggered by active sites located on the particle surface. A greater number of active sites corresponds to a higher probability of particles forming ice. To enable comparison across different particle types and experimental conditions, the number of active sites is typically normalized by particle surface area or mass, resulting in the active site surface density (ns) and mass density (nm), respectively. Parameterizations are developed accordingly by fitting the temperature dependency of ns or nm (listed in Table S1). INP concentration in the atmosphere can then be estimated from ns or nm if particle size distribution or mass is known. As summarized in Table S1, most existing dust INP parameterizations are derived either from a single study or from measurements on individual mineral species. Although some studies measured natural dust with complex composition, they are often restricted to samples collected from certain locations (Kanji et al., 2019; Boose et al., 2016). In addition, most parameterizations are constrained to narrow temperature ranges (Table S1), largely due to the detection limits of utilized ice nucleation techniques. As a result, current parameterizations may not adequately capture the variability of dust INA under atmospherically relevant conditions, where particles exhibit diverse mineral compositions and nucleate ice across a wide range of MPC temperatures. Parameterizations capable of representing dust INA from multiple sources and across the full MPC temperature range are required.
Experimental methods also contribute to discrepancies in reported INA of dust particles (Hiranuma et al., 2015; Emersic et al., 2015; DeMott et al., 2018). Two common aerosol generation techniques used in the laboratory for immersion freezing studies (Hiranuma et al., 2015; Emersic et al., 2015; DeMott et al., 2018) are: dry dispersion of aerosol particles, typically measured using ice nucleation chambers, and wet suspension of particles using droplet freezing techniques (DFTs). Hiranuma et al. (2015) compared INA of illite particles measured by 17 different instruments and found that ns values measured by dry and wet generation techniques differed by up to 3 orders of magnitude. They attributed this difference to surface changes in particles induced by water interactions, such as ion dissolution, which are likely more pronounced in wet suspensions (DFTs). Similarly, Emersic et al. (2015) observed higher ns values for illite and kaolinite particles when measured using a cloud chamber compared to DFTs. They proposed an alternative explanation that dust particles may coagulate in suspension, thereby reducing the effective particle surface area available for ice nucleation. These studies point to the importance of particle–water interactions in determining the INA of dust particles. In dry dispersion and wet suspension measurements, differences in concentration and water contact time of particles may influence such interactions and contribute to variations in dust INA, an aspect that remains poorly quantified and constrained.
Atmospheric aging of dust particles, including chemical reactions with trace gases and aqueous interactions with water or salt solutions, further modifies the INA of dust particles (Huang et al., 2025; Kanji et al., 2017). The aging effects can vary with both mineral composition and aging pathways. For example, montmorillonite (Salam et al., 2007; Salam et al., 2008) and K-feldspar (Kumar et al., 2018, 2019b; Chen et al., 2023a) exhibit enhanced INA after exposure to ammonia (NH3) gas or NH3/ solutions. In contrast, Kumar et al. (2019b) indicated that the INA of quartz is decreased in alkaline solutions, which may be caused by the increased dissolution of quartz under alkaline conditions. Chemical aging or coating of dust particles (e.g., natural desert dust (Kanji et al., 2019), Arizona Test Dust (Knopf and Koop, 2006; Sullivan et al., 2010; Niedermeier et al., 2011b), illite (Kulkarni et al., 2014; Augustin-Bauditz et al., 2014), kaolinite (Tobo et al., 2012; Wex et al., 2014; Augustin-Bauditz et al., 2014) and feldspar (Augustin-Bauditz et al., 2014; Kulkarni et al., 2014)) with acids and organic aerosol, leads to a reduction in their INA. Harrison et al. (2019) indicate that the INA of certain quartz species remains unchanged even after months of immersion in water or salt solutions. These results highlight the complexity and composition-specific nature of dust aging, suggesting that both dust type and aging pathway need to be considered when developing parameterizations for representing INA of aged dust particles.
In general, previous studies suggest that accounting for dust composition, atmospheric aging effects, and uncertainties related to measurement methods is important for interpreting the INA of dust particles and accurately representing their ice nucleation by parameterizations. In this work, we revisit the INA of dust particles reported for MPC conditions (i.e., −38 < T < 0 °C, above water saturation) using data compiled from previous laboratory studies. Specifically, we assessed the influence of mineral aerosol composition, generation methods and simulated aging pathways on INA of dust particles. Based on our findings, we propose revised empirical mineral dust INP parameterizations valid for immersion freezing throughout the MPC temperature range, accounting for measurement methods and aging pathways.
2.1 Data collection
The ice nucleation data for mineral dust particles were compiled from 25 published laboratory studies conducted between 2007 and 2023, as summarized in Table S2. These studies were identified through keyword-based searches in Web of Science and Google Scholar. The datasets combined digitized data from figures in literature, open-access repositories, and directly from corresponding authors (see Acknowledgments for details). All data included in our work were published, no unpublished data were considered.
The collected studies focused on the INA of dust particles in the immersion mode with diverse mineral compositions, subjected to varied aging treatments, and generated and measured using both dry-dispersion and wet-suspension methods. Specifically, the dust particles investigated include natural dust from desert and volcanic sources, as well as particles composed mainly of nominally single mineral species, such as illite, quartz, kaolinite, feldspar, and montmorillonite. Ice formation data for Arizona Test Dust (ATD, Powder Technology Inc.) are also included, a formerly widely used surrogate of atmospheric dust in ice nucleation research. Soil dust particles from agricultural sources were excluded, due to their substantially different INA compared to desert and volcanic dust, resulting from their higher organic content and will be addressed in a separate study. In laboratory measurements, dust particles were subjected to various chemical and physical treatments to mimic their atmospheric aging and to evaluate the associated impacts on their INA. These treatments included immersion in water or salt and acid solutions (hereafter referred to as water aging and aqueous aging), thermal treatment, and chemical aging either through exposure to reactive gases or through coating with inorganic and organic acids or secondary organic aerosol (hereafter referred to as gas chemical aging and coating). More details about the aging treatments can be found in Table S2.
2.2 Metrics to quantify INA of immersion mode dust particles
Different ice nucleation metrics have been established to quantify and compare INA of dust particles, as summarized by Kanji et al. (2017). In this work, we use ns to compare the INA of different dust types and to develop primary ice nucleation parameterizations. ns indicates the number of ice nucleation events occurring per unit of particle surface. ns is based on the singular description of ice nucleation, which assumes a strong temperature dependence and time is neglected because of the secondary importance of time compared to temperature for dust particles (Welti et al., 2012; Kanji et al., 2013; Budke and Koop, 2015; Wright and Petters, 2013; Vali and Snider, 2015). This choice is motivated by several advantages. ns is an aerosol-aware metric that accounts for particle size and surface characteristics, which aids the mechanistic interpretation of dust INA based on aerosol physicochemical properties. Compared to other available metrics (e.g., nm), ns has the most extensive data coverage among the collected studies, enabling broader and more consistent cross-comparisons. In addition, ns can be readily incorporated into climate models to predict the number of ice crystals induced by dust INPs, if particle size (i.e., surface area) is known. In the present work, the ns are either taken from previous studies or derived based on reported ice nucleation results and particle surface area. While all ns are derived based on the following equations (Eqs. 1–4), the specific equations used differ depending on the measurement methods, i.e., chamber experiments with dry-dispersed aerosol (Eqs. 1 and 2) and DFTs with wet-suspended particles (Eqs. 3 and 4). Table S3 reports for which sources we calculated ns based on the particle surface reported in the source of the study and for which ones the ns was directly reported.
Dry-dispersed aerosol (chamber experiments):
Here, AF (Eq. 2) is the ice activated fraction of aerosol particles, which is calculated based on the number of formed ice crystals (Nice crystals) and total number of aerosol particles (Ntotal particles) measured in the chamber experiments. Sp (Eq. 1) represents the surface area of a single aerosol particle.
Wet-suspended particles (DFT experiments):
Here, FF (Eq. 4) is the frozen fraction of droplets determined from the number of frozen droplets (Nfrozen droplets) and total number of detected droplets (Ntotal droplets) in the droplet freezing measurements. Sd (Eq. 3) represents the surface area of particles immersed within a droplet.
To account for the stochastic nature (time dependence) of ice nucleation, the time dependent metrics-heterogeneous ice nucleation rate (Jhet, ), can be calculated based on following equations (Eqs. 5 and 6). Jhet describes the number of nucleation events per unit particle surface and unit time. Similar to ns, Jhet values are either taken from previous studies or derived from reported ice nucleation results and residence time of aerosol particles or droplets for aerosol (Eq. 5) and suspension measurements (Eq. 6), respectively. Table S3 indicates for which study Jhet was calculated and for which ones the Jhet was directly reported.
In chamber experiments, Jhet,dry is derived based on the residence time (t) of aerosol particles exposed to ice formation conditions (Eq. 5). In DFT measurements (Jhet,wet, Eq. 6), ΔNfrozen denotes the number of droplets that freeze within the time interval Δt from t1 to t2. Nunfrozen is the number of droplets that remain unfrozen at time t1. Δt can be calculated based on the reported cooling rate in each freezing experiment. The residence time of aerosol particles in chamber measurements or the cooling rates in DFTs used in each study are provided in Table S2. We note that the practice of using cooling rate or chamber residence times can underestimate Jhet, because the real time of nucleation could be less than the residence time or the time interval at a given temperature (cooling rate). Since the true ice nucleation time is not possible to observe as we only detect freezing once a crystal has nucleated and grown to detectable sizes, the nucleation rates presented are a lower limit. We further note that compared to ns, Jhet scales the INA of dust particles by the time of an ice formation event. Therefore, if different datasets are measured with identical cooling rates or residence times, the relative ordering of their Jhet values will remain consistent with that of ns.
3.1 The INA of dust particles with different compositions
A compilation of ns values of dust particles with different mineral compositions is shown in Fig. 1. ns values exhibit substantial variability across the studied temperature range (−42 < T < −2 °C), for example, at T = −20 °C, ns spans 7 orders of magnitude ranging from 5.0 × 10³ to 1.7 × 10¹¹ m−2. This variability likely arises from multiple factors, including dust composition, measurement methods and aging processes, we therefore conduct a more detailed investigation into these aspects below.
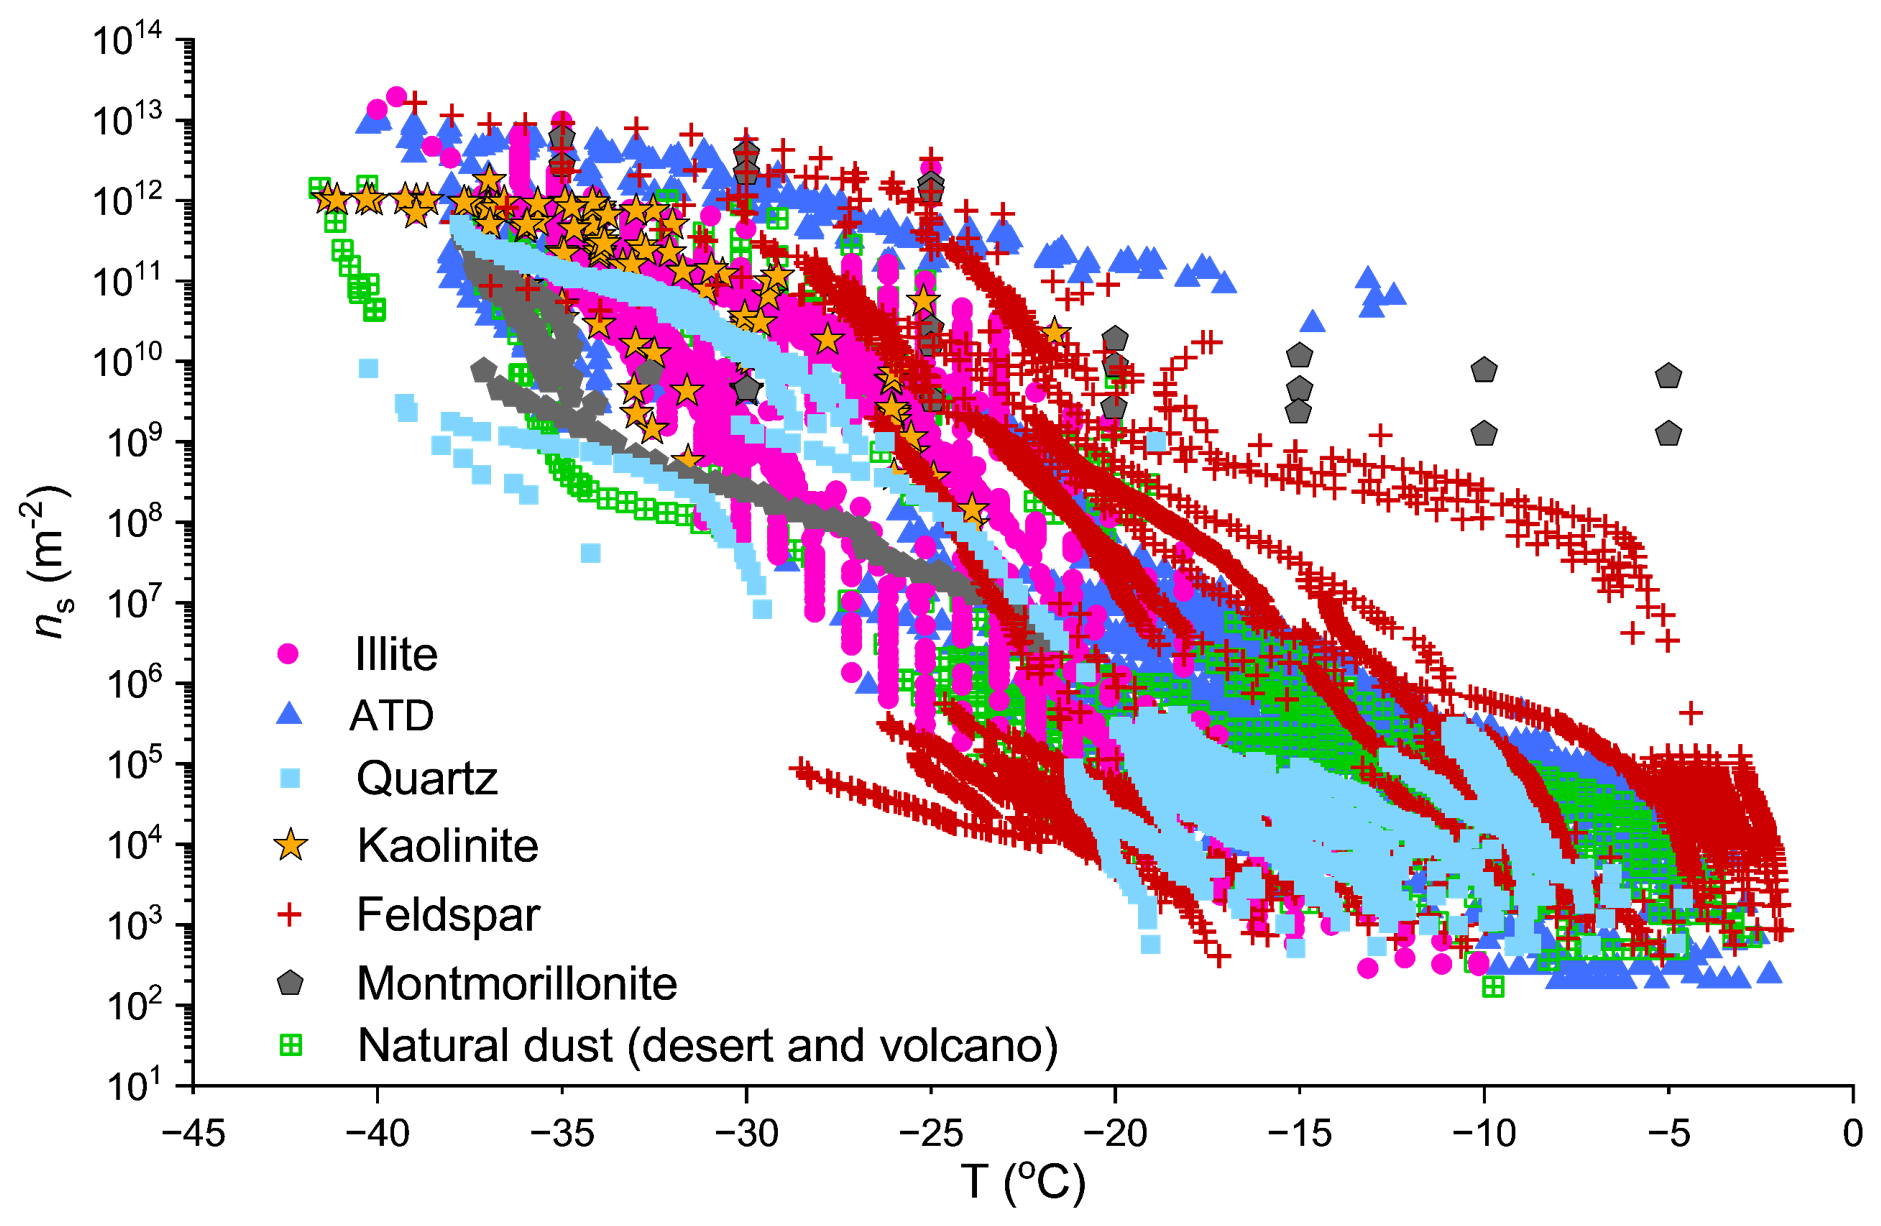
Figure 1The INA of dust particles with different mineral compositions, represented by the ice active site surface density (ns). The dust species included in our analysis are illite (pink, circle), Arizona Test Dust (ATD, dark blue, triangle), quartz (light blue, square), kaolinite (orange, star), feldspar (red, plus sign), montmorillonite (gray, pentagon) and natural desert and volcanic dust (green, square with cross). ns datasets used in this figure were obtained from the studies listed in Table S3.
The ns data were binned into 1 °C intervals at −38 < T < −2 °C and shown as boxplots in Fig. S1 in the Supplement. The median ns values among different dust species differ by 0–6 orders of magnitude at identical temperatures (−38 < T < −2 °C), highlighting the influence of mineral composition on dust INA. Previous studies have reported that feldspar, particularly potassium-rich feldspar (K-feldspar), tends to exhibit higher INA compared to other dust species (Peckhaus et al., 2016; Atkinson et al., 2013; Augustin-Bauditz et al., 2014; Chen et al., 2023b; Harrison et al., 2016). Consistent with these findings, feldspars (plus signs in Fig. 1 and red box in Fig. S1) in the present study generally exhibit the highest ns values at T 2 °C and initiated freezing at the warmest temperature (≈ −2 °C) compared to other dust species. For example, the extremely efficient dust particles at −20 < T < −5 °C and at T < −20 °C were from K-feldspar measured by Peckhaus et al. (2016) and Augustin-Bauditz et al. (2014), respectively. Some ATD (dark blue, triangle) (Kanji et al., 2013; Perkins et al., 2019) and natural volcanic dust (green, squares with cross) measured by Fahy et al. (2022) also display relatively high ns values at warm freezing temperature (≈ −2 °C). Such high INA of ATD and volcanic dust was attributed to the presence of K-feldspar in these particles, as supported by mineral and chemical characterizations of ATD (Chen et al., 2023b; Broadley et al., 2012) and volcanic dust (Fahy et al., 2022). The ns boxplots of different dust species (Fig. S1) show a similar trend, with K-feldspar exhibiting the highest INA followed by ATD. However, not all feldspars are as ice-active as K-feldspar. As shown in Figs. 1 and S1, non-potassium-rich feldspars can exhibit ns values as low as those of quartz and illite (Harrison et al., 2016) at −21 < T < −5 °C. Similar variability of ns is also observed for other dust species, including illite, ATD and quartz (Figs. 1 and S1). This variability can be partly explained by the inherent complexity of chemical composition, crystal structure and surface properties of dust, even for particles within the same mineral group. For example, several studies (Peckhaus et al., 2016; Harrison et al., 2016) found that K-feldspar exhibits higher INA than calcium-rich feldspars. The high INA of K-feldspar has been linked to surface defects with a particular crystallographic face (Kiselev et al., 2017) and to the kosmotropic (structure making) characteristic of K+ in the surface layer (Zolles et al., 2015). Although Kumar et al. (2018) indicate that the high INA of K-feldspar may not be due to the presence of K+, they observed decreased INA of K-feldspar when more K+-containing solutes are added to dust suspensions. Whale et al. (2017) examined different types of feldspars and showed that the exceptional INA of alkali feldspars arises from specific topographical features: the perthitic microtexture resulting from phase separation into Na- and K-rich regions. This would explain the variability in ice nucleation across the feldspar group, with the Na/K feldspars showing superior INA than other feldspars which lack such microtextural features. Harrison et al. (2019) measured the INA of 10 types of α-quartz samples and found that ns varied 1–2 orders of magnitude at T ≈ −13 °C.
3.2 INA of dust particles from different measurement methods and ice formation parameterization development
In addition to the compositional diversity of dust particles, the variability in ns can also arise from differences in measurement methods, as suggested by Hiranuma et al. (2015) and Emersic et al. (2015). Accordingly, we divided the ns values of each dust component into two groups: dry-dispersed aerosol (aerosol, hollow circles) and wet-suspended particles (suspension, solid circles) and shown in Fig. 2. The datasets are categorized into seven mineralogical species, including K-feldspar, other non-potassium-rich feldspars, quartz, illite, kaolinite, montmorillonite and ATD. Across most mineralogical groups, differences between aerosol and suspension ns values at overlapping temperatures are observed. For example, aerosol ns of K-feldspar is up to 2 orders of magnitude higher than suspension ns at T = −20 °C.
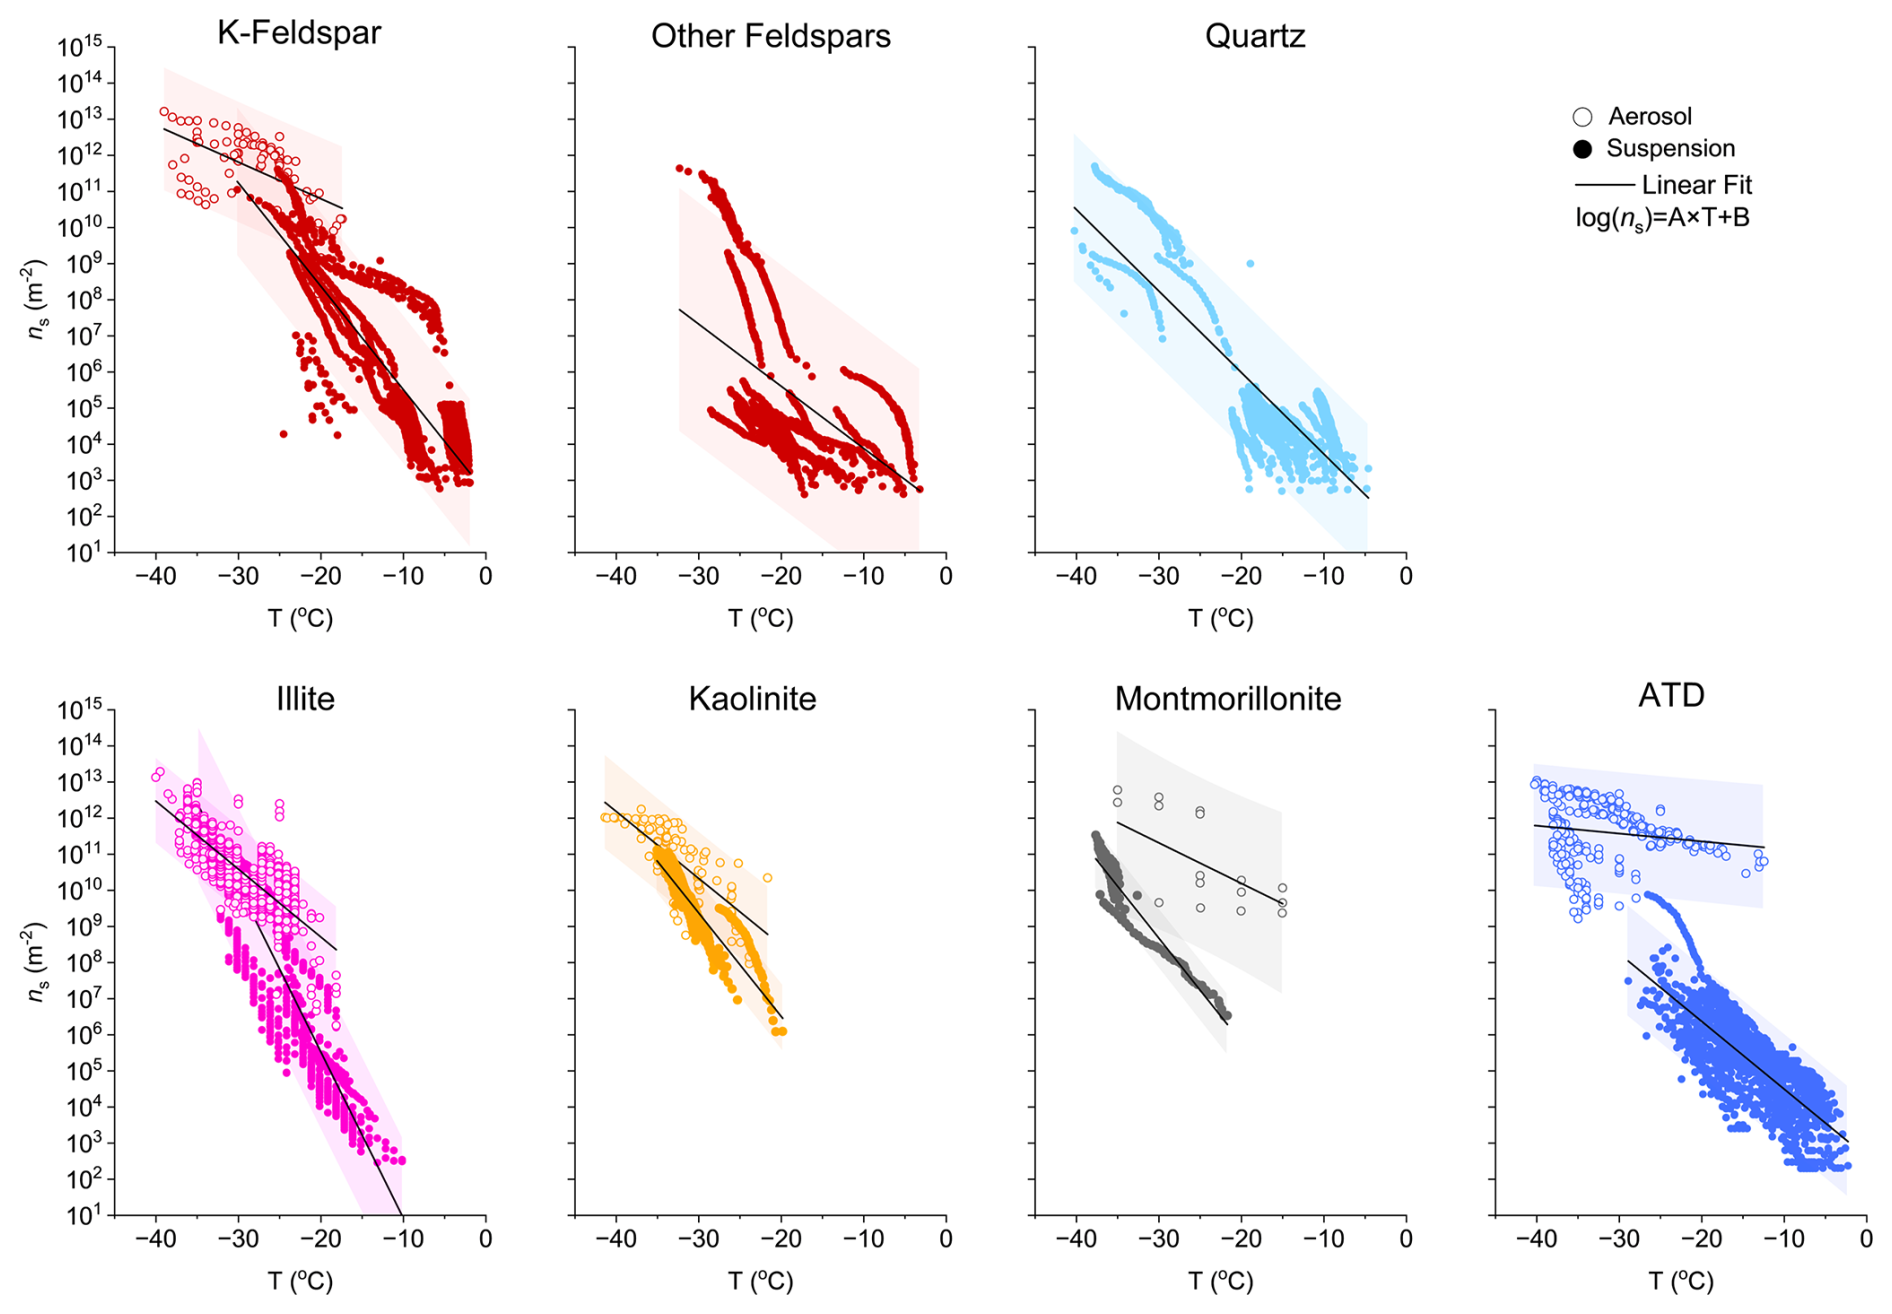
Figure 2ns of dust particles with specific mineral compositions. Empty and filled data points denote measurements using dry-dispersed aerosol and wet suspended particles, respectively. K-feldspar and non-potassium-rich feldspars are shown separately due to their distinct INA. For quartz and non-potassium-rich feldspars, only data from suspension measurements are available. Solid lines indicate linear fits of log(ns) versus temperature, plotted separately for each measurement method. The values for fitting parameters (A and B) for each plot are listed in Table S4. The data used in this figure were obtained from the studies listed in Table S3. The shaded area indicates 95 % prediction band of each fitting curve. The aerosol ns data points measured at T > −10 °C for ATD and montmorillonite are excluded from parameterization development, as these measurements are likely to reach the lower limit of detection for aerosol instruments.
Figure S2 presents boxplots of ns separated by methods for different dust compositions. The median ns values between aerosol and suspension differ by 1–5 orders of magnitude at overlapping temperatures (Fig. S2). Specifically, the median ns values between aerosol and suspension methods differ by up to 3 orders of magnitude at −31 < T < −18 °C for illite, by 3–5 orders of magnitude at −27 < T < −21 °C for ATD and up to 1 order of magnitude at −35 < T < −30 °C for kaolinite. K-feldspar and kaolinite nsshow the closest agreement between the two methods, with differences generally within an order of magnitude. This comparison cannot be made for quartz and other non-potassium-rich feldspars because of the lack of aerosol ns data for these dust species. We also acknowledge that these method-based comparisons within individual dust groups are still subject to uncertainties arising from compositional differences within individual dust categories. For example, the composition of ATD is known to vary with particle size (Vlasenko et al., 2005), which may influence its INA. Within the non–potassium-rich feldspar group, albite (Na-end member) exhibits a higher ns compared to anorthite (the calcium-end member) (Harrison et al., 2016). Nevertheless, the consistent differences observed across multiple groups suggest that measurement method contributing to the variability in reported dust INA cannot be excluded but this is likely convoluted by changes in composition.
Figure 3a compiles data from different compositions, showing that aerosol measurements (red) generally yield larger ns values compared to suspension measurements (blue). The corresponding ns boxplots for the combined data are shown in Fig. S3a. The median values of aerosol ns are up to 6 orders of magnitude higher than suspension ns at −38 < T < −18 °C, with the ns gap narrowing with decreasing temperatures. These findings confirm that measurement method is a large source of ns variability and that the magnitude of this effect depends on dust composition. In addition, wet suspension ns exhibits two distinct regimes of increases (Figs. 3a and S3a), with a steeper temperature dependence observed at −38 < T < −18 °C compared to −18 < T < −3 °C.
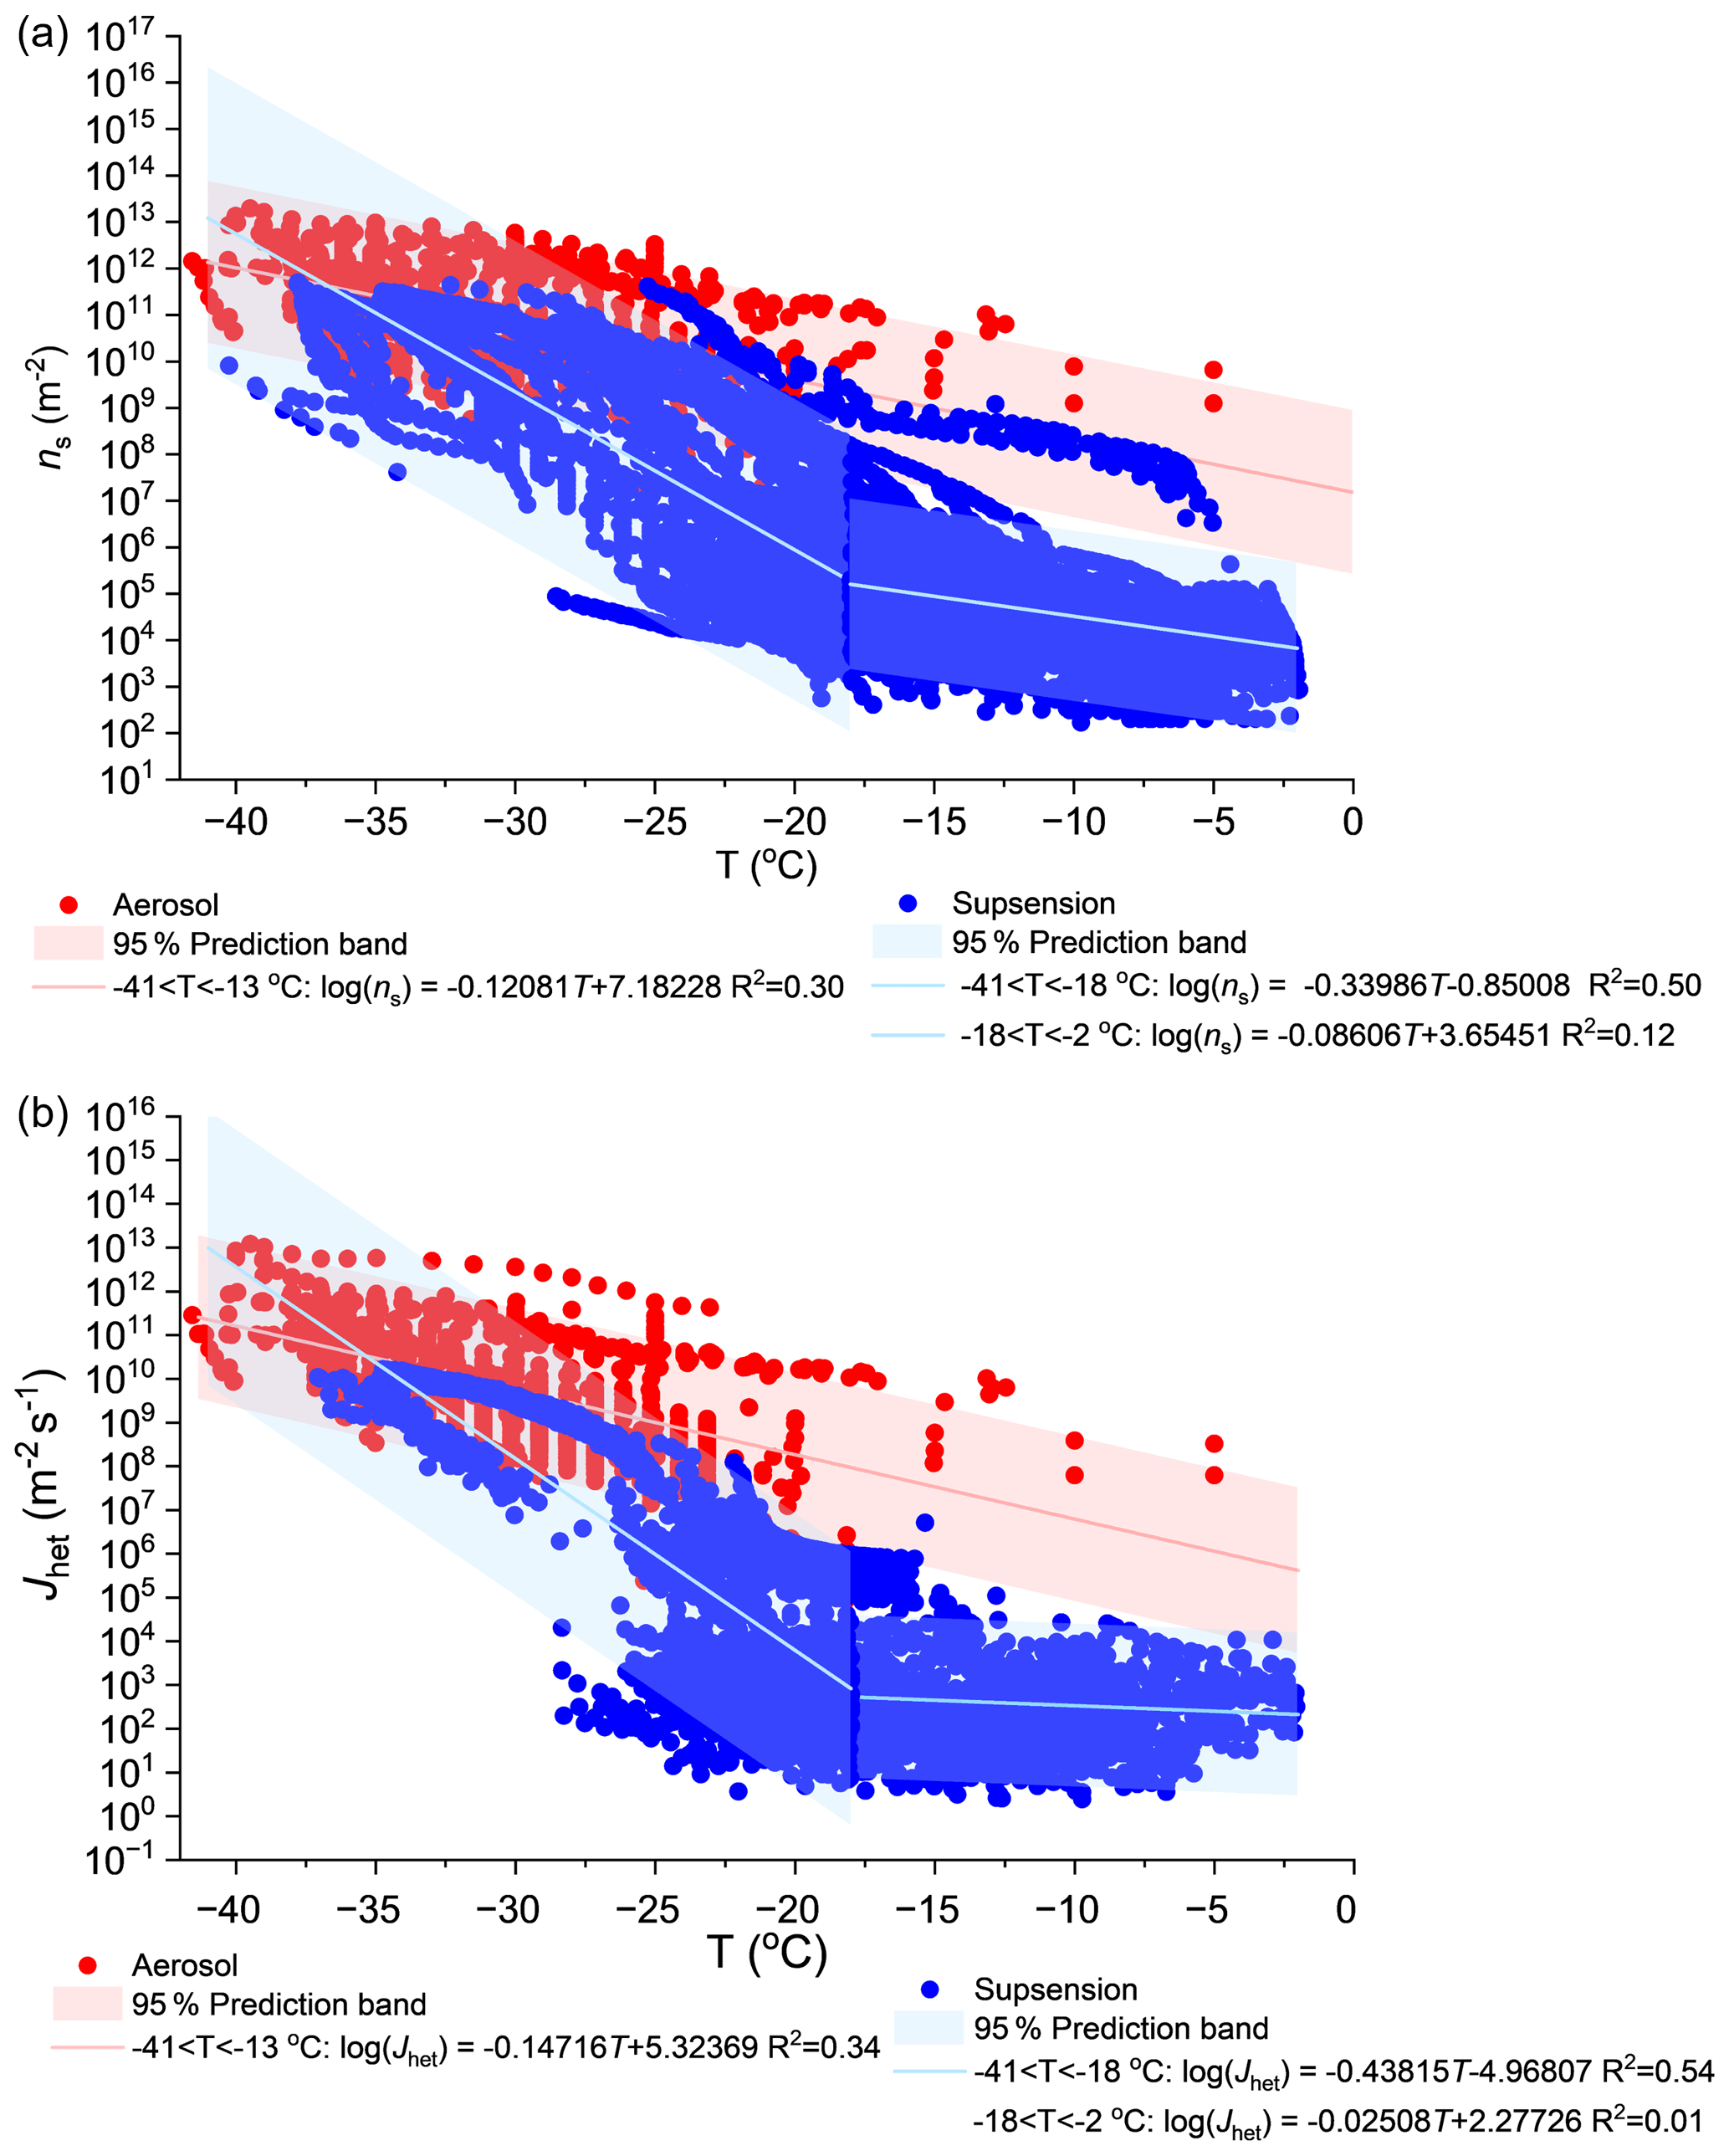
Figure 3(a) ns and (b) Jhet of dust particles obtained from two measurement methods, dry-dispersed dust aerosol measured using ice nucleation chambers (aerosol, red) and wet-suspended particles measured using DFTs (suspension, blue). Solid lines are fitting curves of ns or Jhet versus temperatures, which are in the form: log(ns or (values for parameter A and B are listed in this figure). The temperature range indicated for each fitting curve is the range within which the experimental data are reported. These curves, as shown in this figure, can be extrapolated up to −2 °C for practical modeling applications. The aerosol ns data points measured at T > −10 °C are shown for completeness but are excluded from parameterization development, as these measurements are likely to reach the lower limit of detection for aerosol instruments.
To account for the time-dependent nature of ice nucleation, the Jhet was estimated using Eqs. (5) and (6) and shown in Fig. 3b. The corresponding Jhet boxplots are shown in Fig. S3b. Similar to ns, aerosol Jhet values are systematically higher than suspension Jhet values (Fig. 3b), with differences in median Jhet values up to 6 orders of magnitude at −37 < T < −19 °C (Fig. S3b). The gap between aerosol and suspension Jhet narrows with decreasing temperature and becomes comparable (within 1 order of magnitude) at T < −27 °C. Similar to ns, suspension Jhet also shows a stronger temperature dependence at −42 < T < −18 °C while remain relatively constant at T > −18 °C. The two-step temperature dependence of both ns and Jhet underscores the necessity of explicitly incorporating this feature into ice formation parameterizations. Neglecting this feature may lead to an underestimation of dust INA at colder temperatures (T < −18 °C) and overestimation of ns and Jhet at warmer temperatures (T > −18 °C).
The difference between aerosol and suspension ns and Jhet may be attributed to differences in water-particle interactions between two methods (Emersic et al., 2015; Hiranuma et al., 2015). In DFTs (suspension), particles are suspended in water droplets prior to freezing measurements, whereas in chamber experiments (aerosol), particles activate into cloud droplets in situ within a few seconds. This different timescale of water-particle contact can cause varying degrees of particle surface alteration, thereby influencing their INA (Hiranuma et al., 2015). This process, known as water aging (Harrison et al., 2019; Kumar et al., 2019a), its impact on dust INA is further explored in Sect. 3.3. Another potential factor may be the difference in particle concentrations within droplets generated by the two methods. Some suspension samples in DFTs may be prepared at higher particle concentrations, whereas chamber measurements detect freezing of droplets activated from individual particles. As noted by Emersic et al. (2015), high particle concentrations may cause coagulation either within suspensions or within the formed droplets, reducing the effective surface area available for nucleation and thereby lowering INA.
We calculated the spherical equivalent diameter (De) of dust particles contained in a droplet for both measurement methods. The diameter of the spherical equivalent particle is calculated based on , where the Sp is the surface area of an individual aerosol particle in aerosol measurement, and Sd is the total surface area of suspended particles in a droplet in suspension measurement. The De method treats the combined surface area of multiple particles as that of a single INP. The underlying assumption is that a multi-particle droplet (those measured by DFT) can be conceptually dispersed into many smaller, single-particle droplets. Given that the freezing of a droplet is triggered by the most active ice-nucleating site on particle surface and the probability of encountering such an active site scales with the total particle surface area, the De method normalizes a muti-particle droplet into an equivalent single INP that shares the same ice-nucleating probability. This approach enables a direct comparison among different ice nucleation measurements. The relationship between De and droplet freezing temperatures (T) is shown in Fig. 4, where the freezing temperature corresponds to the point at which 50 % of droplets (FF = 50 %) are frozen in the suspension measurements, and at which 10 % of particles (AF = 10 %) are ice-activated in the aerosol measurements. The freezing temperatures at FF = 50 % and AF = 10 % are the representative freezing thresholds for suspension and aerosol measurements, respectively. While a 50 % FF captures the median freezing behavior of a droplet population where aerosol particles are aggregated in individual droplets, achieving a 50 % AF in aerosol measurements is often impractical due to the measurement on single sub-micron aerosol particles in droplets and therefore the inherent rarity of INPs. The lower INA of some aerosol species in a single droplet leads to lower detected INA. Consequently, a 10 % AF is adopted as a widely reported, statistically significant threshold for evaluating the ice-active state of aerosols in chamber experiments. We note that the selection of different frozen or active fraction threshold may lead to a shift in the threshold freezing temperature.
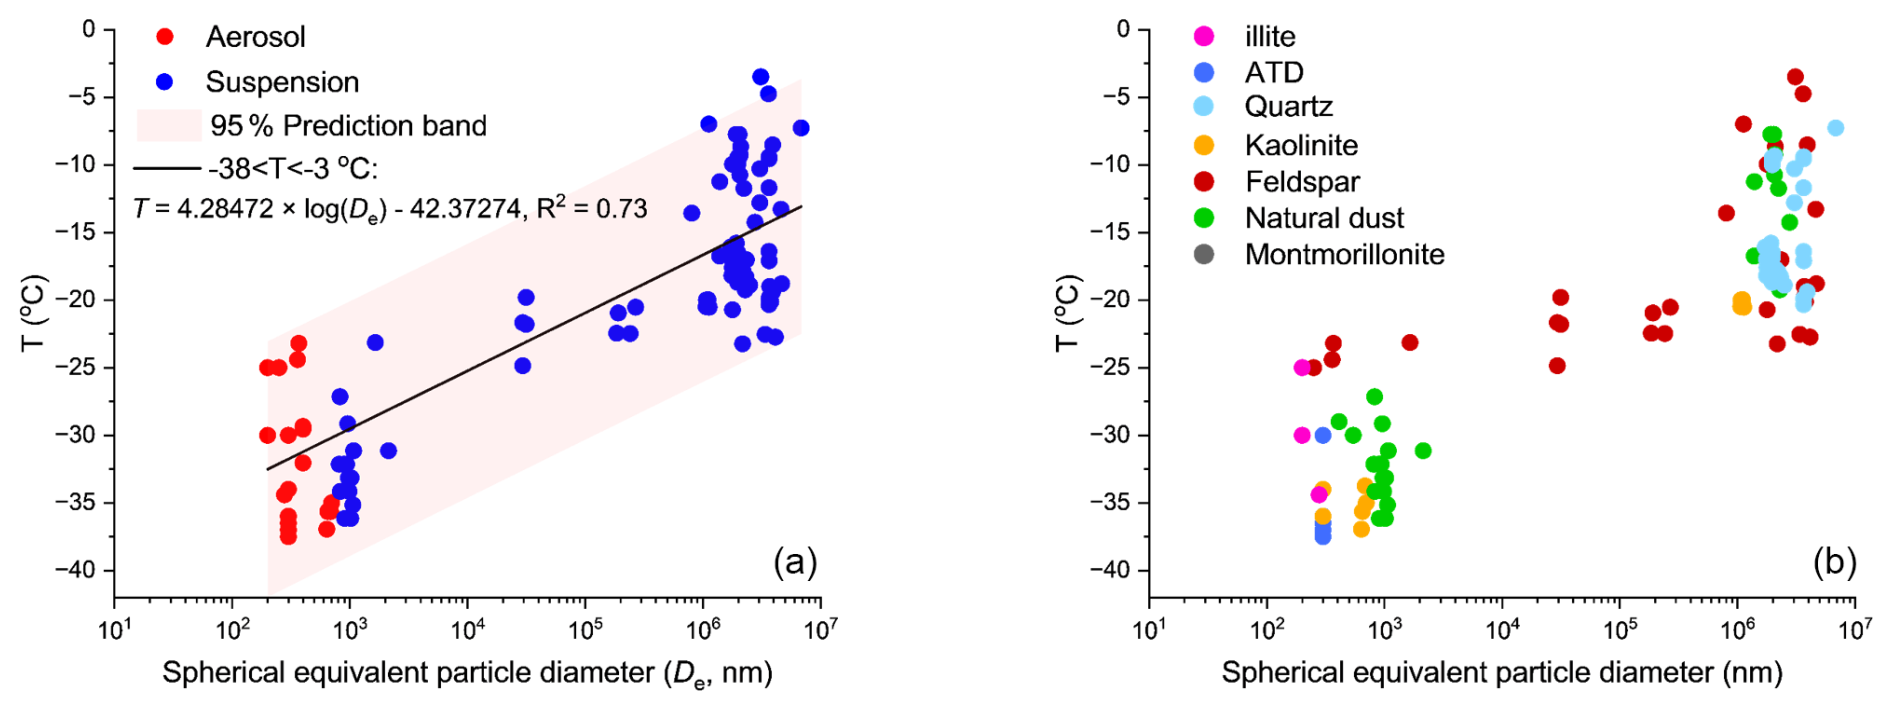
Figure 4Spherical equivalent diameter (De) of dust particles in droplets derived from (a) aerosol (red) and suspension (blue) measurements, and (b) dust particles with different mineral compositions. The temperature shown in this figure represents the point at which 50 % of droplets (FF = 50 %) are frozen in the suspension measurements, and at which 10 % of particles (AF = 10 %) are ice activated in the aerosol measurements. De is calculated from studies in which Sp and Sd were provided or could be derived. The solid line is the fitting curve of freezing temperature versus log(De), which are in the form: (values for parameter A and B are listed in this figure).
The freezing temperature of dust particles increases with De, with 80 % of suspension measurements showing De values about 1 order of magnitude larger than aerosol measurements at identical freezing temperatures (Fig. 4a). For example, suspension De values (≈ 10–7000 µm) are 1–3 orders of magnitude larger than those from aerosol measurements at T = −25 °C. Particles with different mineral compositions indicate a similar trend (Fig. 4b), with larger suspension De values. This explains why suspension droplet experiments freeze at warmer temperatures than droplets activated from individual aerosol particles (Fig. 4), as a greater particle surface area increases the probability of ice formation. At high particle concentrations in suspension measurements, coagulation may occur which cannot be fully verified in this study. Should it occur, coagulation could reduce the effective surface area available for ice nucleation but would only be relevant if water were unable to access the aggregated regions of the dust particles. Since ns is obtained by normalizing freezing ability of droplets with the suspension BET surface area, the calculated ns may be lower than those that would be obtained in the absence of coagulation (i.e., a case similar to aerosol measurement with individual particles).
In this work, it is not possible to provide direct observational evidence for particle coagulation or its impact on INA of dust particles. Nevertheless, we noted that there are few suspension measurements with De (≈ 1 µm) at −38 < T < −22 °C that also occur for aerosol measurements (Fig. 4), suggesting that agreement between the two methods is observed at sufficiently low particle suspension concentrations. These data correspond to suspension measurements with picoliter-size droplets (compared to microliter-droplet measurements) at warmer temperatures and therefore result in dust equivalent particle sizes (≈ 1 µm) that are more atmospherically relevant. Simulations by Emersic et al. (2015) suggest that picoliter-size droplets are unlikely to contain multiple particles, reducing the likelihood of significant coagulation effects compared to microliter-sized droplets. Consequently, the freezing behavior of picoliter-size droplets is more comparable to droplets activated from single particles in aerosol measurements. Many DFT measurements employ serial dilution to probe suspensions with different INP concentration ranges and overlapping INP concentrations are often observed across the dilution series. These dilution results combined with our De data (Fig. 4), suggest that particle coagulation is not expected in all suspension experiments, but could not be excluded as a possibility under conditions of high particle concentrations.
This interpretation is also consistent with Figs. 3 and S3, where the ns and Jhet difference between two methods decreases with decreasing temperatures. This is because DFT measurements at relatively lower temperatures (−38 < T < −19 °C) were conducted using picoliter-size droplets (Table S2) (Atkinson et al., 2013; Hiranuma et al., 2015; Zolles et al., 2015) with low particle concentration and minimal potential for particle coagulation. These findings suggest that coagulation effect may be one possible factor contributing to the different ns values obtained between two methods, especially that observed for relatively warm temperatures.
The findings presented in Sect. 3.1 and the current section highlight that both chemical composition and measurement methods are important factors causing the observed variability in the INA of dust particles. Building upon these findings, we develop specific parameterizations in the following sections to systematically represent the INA of dust particles. We fitted the ns and Jhet temperature dependent parameterizations using a log-linear form:
This log-linear form is an empirical parameterization chosen to summarize the compiled datasets, capturing the general trend of temperature dependence of ns and Jhet. Alternative fitting approaches, including polynomial and exponential forms, were also tested but did not improve the representation of the data. The fitted parameters (A,B) and coefficients of determination (R2) for different measurement methods are indicated in Fig. 3 and summarized in Table S4. For example, aerosol ns shows a weak correlation with temperatures at −41 < T < −13 °C, expressed as follows. To represent the INA of dust aerosol across the entire MPC temperature range, this fitted relationship was extrapolated to T = −2 °C (Fig. 3a).
As discussed above, suspension ns exhibits two-step temperature dependence, with a stronger temperature dependence at −41 < T < −18 °C and a weaker dependence at −18 < T < −2 °C. Accordingly, the suspension ns data were fitted separately in two temperature regimes. The resulting parameterizations are summarized below:
−41 < T < −18 °C:
−18 < T < −2 °C:
The prediction band at the 95 % confidence level (shaded area in Fig. 3) captures most data points (Fig. 3a), indicating the strong predictive capability of the developed ns parameterizations. Specifically, 4449 out of 4661 and 5062 out of 5321 ns values for suspension measurements at T < −18 °C and T > −18 °C were captured, and 1462 out of 1535 for aerosol measurements were captured. Similar parameterizations were developed for Jhet with the resulting functions shown in Fig. 3b.
Given the distinct INA among dust particles with different compositions, we also developed ns parameterizations for individual dust species (K-feldspar, non-potassium feldspar, quartz, illite, kaolinite, montmorillonite and ATD), as indicated by the log-linear fits in Fig. 2 and summarized in Table S4. These composition-specific parameterizations (Fig. 2 and Table S4) are intended for estimating atmospheric INP contributions from individual mineral types. They are therefore suitable in regions where a single mineral dominates the dust population, if its local abundances are known. In contrast, the parameterizations developed from the dataset of all dust types (Fig. 3) represent the average freezing behavior of dust particles with mixed mineral compositions, which are suitable for predicting INPs in an atmosphere with compositionally diverse dust or for global-average applications. Applying ns-based parameterizations for aerosol and suspension requires distinguishing whether dust particles have been influenced by water exposure, necessitating additional physicochemical characterization of particle surfaces. To address this limitation, an De-based parameterization was developed by fitting De as a function of droplet freezing temperature:
−38 < T < −3 °C:
As shown in Fig. 4a, this De parameterization is independent of measurement method and predicts the freezing temperature of droplets directly from the surface area of immersed particles. Although this parameterization applies to a wide particle size range up to 7000 µm under specific experimental conditions (Fig. 4), it fully covers particle sizes relevant for atmospheric dust (De < 10 µm). It is applicable across the MPC temperature regime and can be readily used whenever particle size information is available. The 95 % prediction band (shaded area in Fig. 4) demonstrates the strong predictive capability of the developed De parameterization, with 120 out of 122 data points successfully captured. We also note the variability in freezing temperature observed at similar De values (Fig. 4), indicating that other factors other than De, including droplet volume, dust mineral composition and other experimental conditions, may also influence droplet freezing.
3.3 ns of dust particles subjected to different aging processes
The INA changes resulting from various aging processes are also investigated. Experimental details of aging treatments are provided in Table S2. Figure 5 shows ns data for fresh (solid colors) and aged (faded colors) dust particles, with dry aerosol (Fig. 5a) and wet suspension (Fig. 5b) shown separately. For both aerosol and suspension, fresh (solid colors) and aged particles (faded colors) exhibit differences in ns at identical temperatures. This indicates that atmospheric aging modifies the INA of dust particles. To quantify these differences, ns data were binned into 1 °C intervals and are shown in Fig. S4. For aerosol measurements (Fig. S4a), the median ns values of fresh (solid color) and aged (faded color) particles differ by 1–2 orders of magnitude at −41 < T < −20 °C. A similar difference is observed in fresh and aged suspension ns at −27 < T < −3 °C (Fig. S4b). These differences are notably smaller than those caused by measurement methods. For example, the difference between ns from dry-dispersion and wet-suspension can reach up to 6 orders of magnitude in the same temperature range (Figs. 3 and S3). To statistically evaluate the impact of aging on the INA of dust particles, significance analyses were performed for both aerosol (−41 < T < −20 °C) and suspension measurements (−27 < T < −3 °C). The results yielded statistically significant differences (p < 0.05) between fresh and aged samples in both measurement methods, indicating that the aging process alters the INA of dust particles. The details about the significance analyses are provided in Tables S5 and S6 and Text S1 in the Supplement.
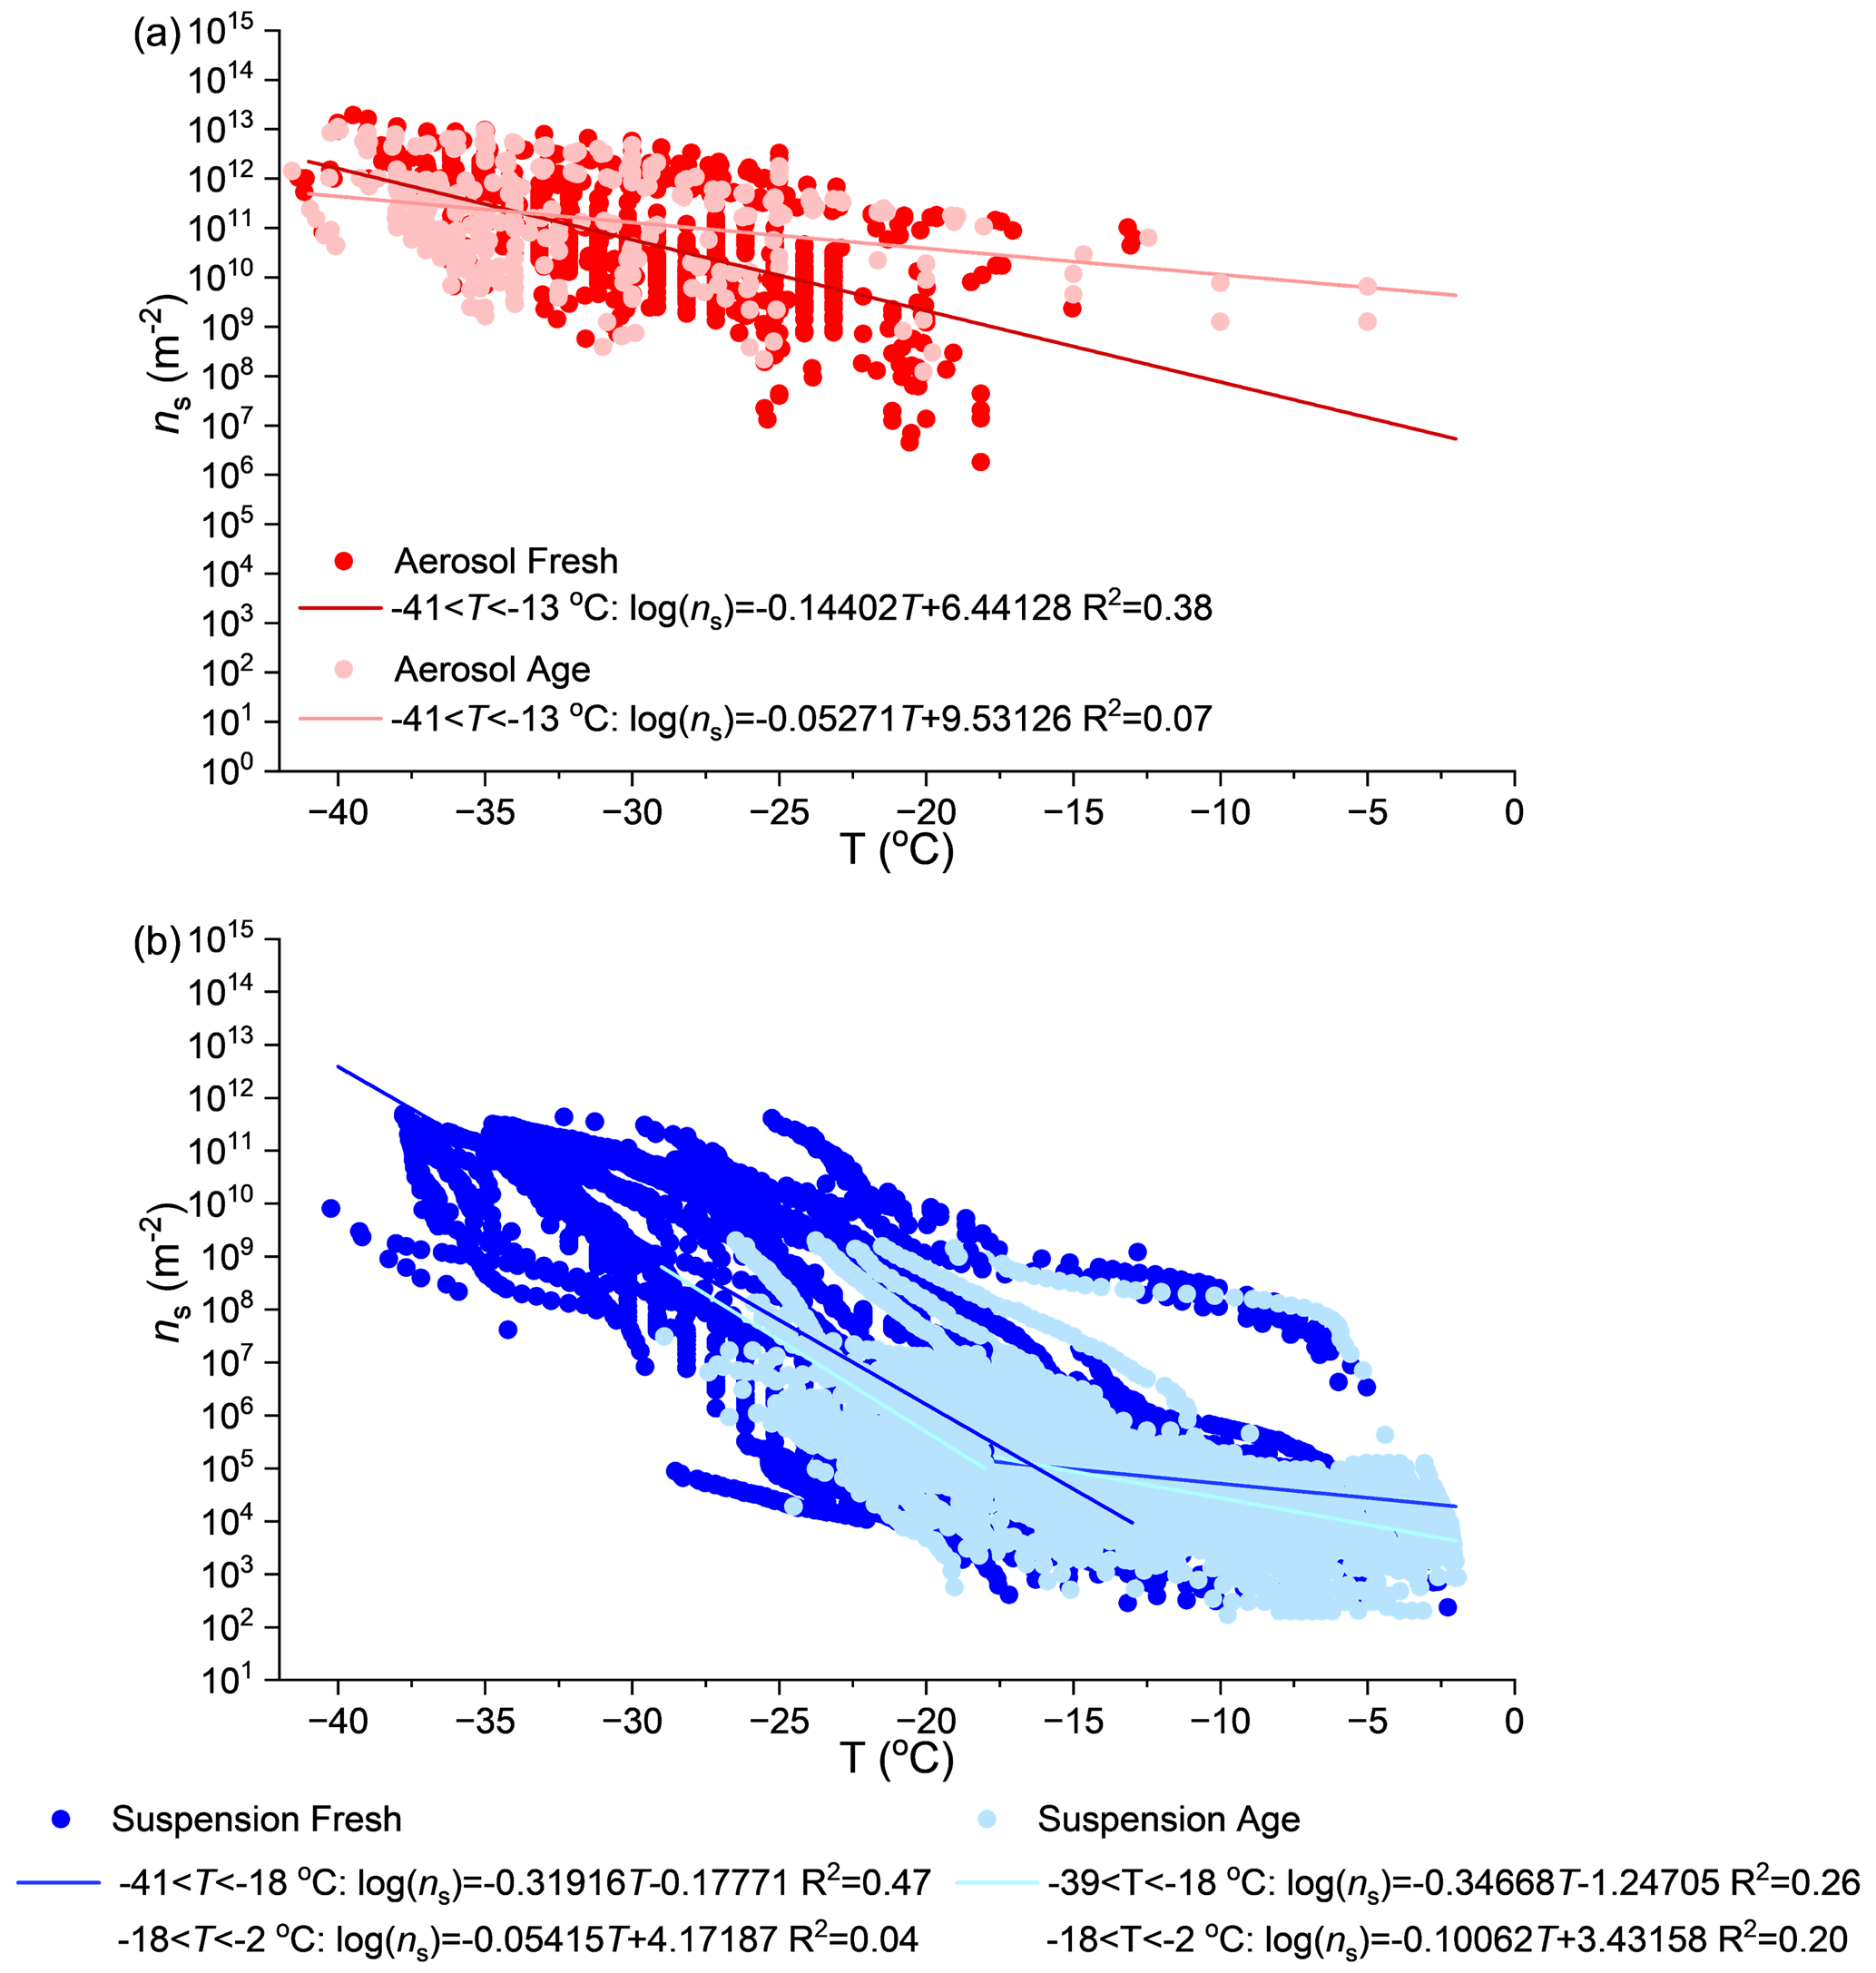
Figure 5ns of dust particles measured freshly (solid colors) and after aging treatments (faded colors) from (a) aerosol and (b) suspension methods. The parameterizations to predict ns of dust particles are of the form: (values for parameter A and B are listed in this figure and Table S4). For ns from suspension measurements, parameterizations are developed in two different temperature regimes (T < −18 °C and T > −18 °C), respectively. The data used in this figure was obtained from the studies listed in Table S2. The aerosol ns data points measured at T > −10 °C are shown for completeness but are excluded from parameterization development, as these measurements are likely to reach the lower limit of detection for aerosol instruments.
In addition, ns of both fresh and aged particles from suspension measurements (Fig. S4b) exhibit a stronger temperature dependence at lower temperature (−38 < T < −18 °C) and a weaker dependence at higher temperature (−18 < T < −3 °C). This feature aligns with the observation when fresh and aged datasets are combined (Fig. S3). Therefore, ns parameterizations for fresh and aged particles are developed by explicitly considering their temperature dependence, as shown in Fig. 5. For both fresh and aged aerosol measurements, the ns parameterizations are extrapolated to T = −2 °C (Fig. 5a) to represent the INA of dust particles that have experienced minimal interaction with water across the entire MPC temperature range.
Based on Figs. 5 and S4, it is challenging to draw a conclusion on how the aging process will impact the INA of dust particles, since aging does not consistently increase or decrease ns at different temperatures. The direction and magnitude of the aging effect may depend on the specific dust species and the aging pathways. To account for this, Fig. S5 provides elaborated ns boxplots for individual dust species, including K-feldspar, non-potassium-rich feldspars, quartz, ATD and natural dust (separated desert and volcanic dust). Clay particles (illite, kaolinite, and montmorillonite) are not shown due to limited data from two methods for comparison between fresh and aged particles. Given the significant contribution of clay particles to dust mass (Atkinson et al., 2013), additional measurements are needed to quantify the aging effect on their INA. Figure S5 indicates that aging may have different effects on INA of different dust species. Specifically, ATD and natural dust (both desert and volcanic dust) show a decrease of 1–2 orders of magnitude in ns at −39 < T < −3 °C after aging, with the effect becoming more pronounced at lower temperatures. In contrast, the ns changes of K-feldspar and quartz particles are generally within 1 order of magnitude, indicating that these dust species are relatively insensitive to aging. This observation is consistent with Harrison et al. (2016), who found most K-feldspars exhibited no significant change in INA after water aging. While Harrison et al. (2019) noted that certain quartz can be highly sensitive to water aging, only one of the three samples exhibited a pronounced decrease in ns after 10 months of water aging, whereas ns decrease of other quartz samples were within 1 order of magnitude. Their findings therefore align with our results showing insensitivity of quartz to aging treatments. The response of non-potassium-rich feldspar (“other feldspars” in Fig. S5) (Harrison et al., 2019; Peckhaus et al., 2016) to aging process, including albite and anorthite, is more variable. Depending on temperature, aging can increase, decrease or leave their ns unchanged (Fig. S5). For most temperatures, the ns changes of other feldspars remain within 1 order of magnitude. An exception occurs at −25 < T < −23 °C, where the ns of aged particles increased by 2–5 orders of magnitude compared to fresh particles. This occurs because most fresh non-potassium-rich feldspars exhibit relatively low INA. However, one aged sample from Harrison et al. (2016) displayed markedly higher INA, which strongly influenced the median ns values. This variability reflects both the compositional diversity of feldspars and the limited number of available datasets for aged non-potassium-rich feldspars, as indicated in Fig. S5. Overall, our results suggest that feldspars (both K-feldspar and other feldspars) and quartz are generally insensitive to aging process compared to the natural dust and ATD samples presented here.
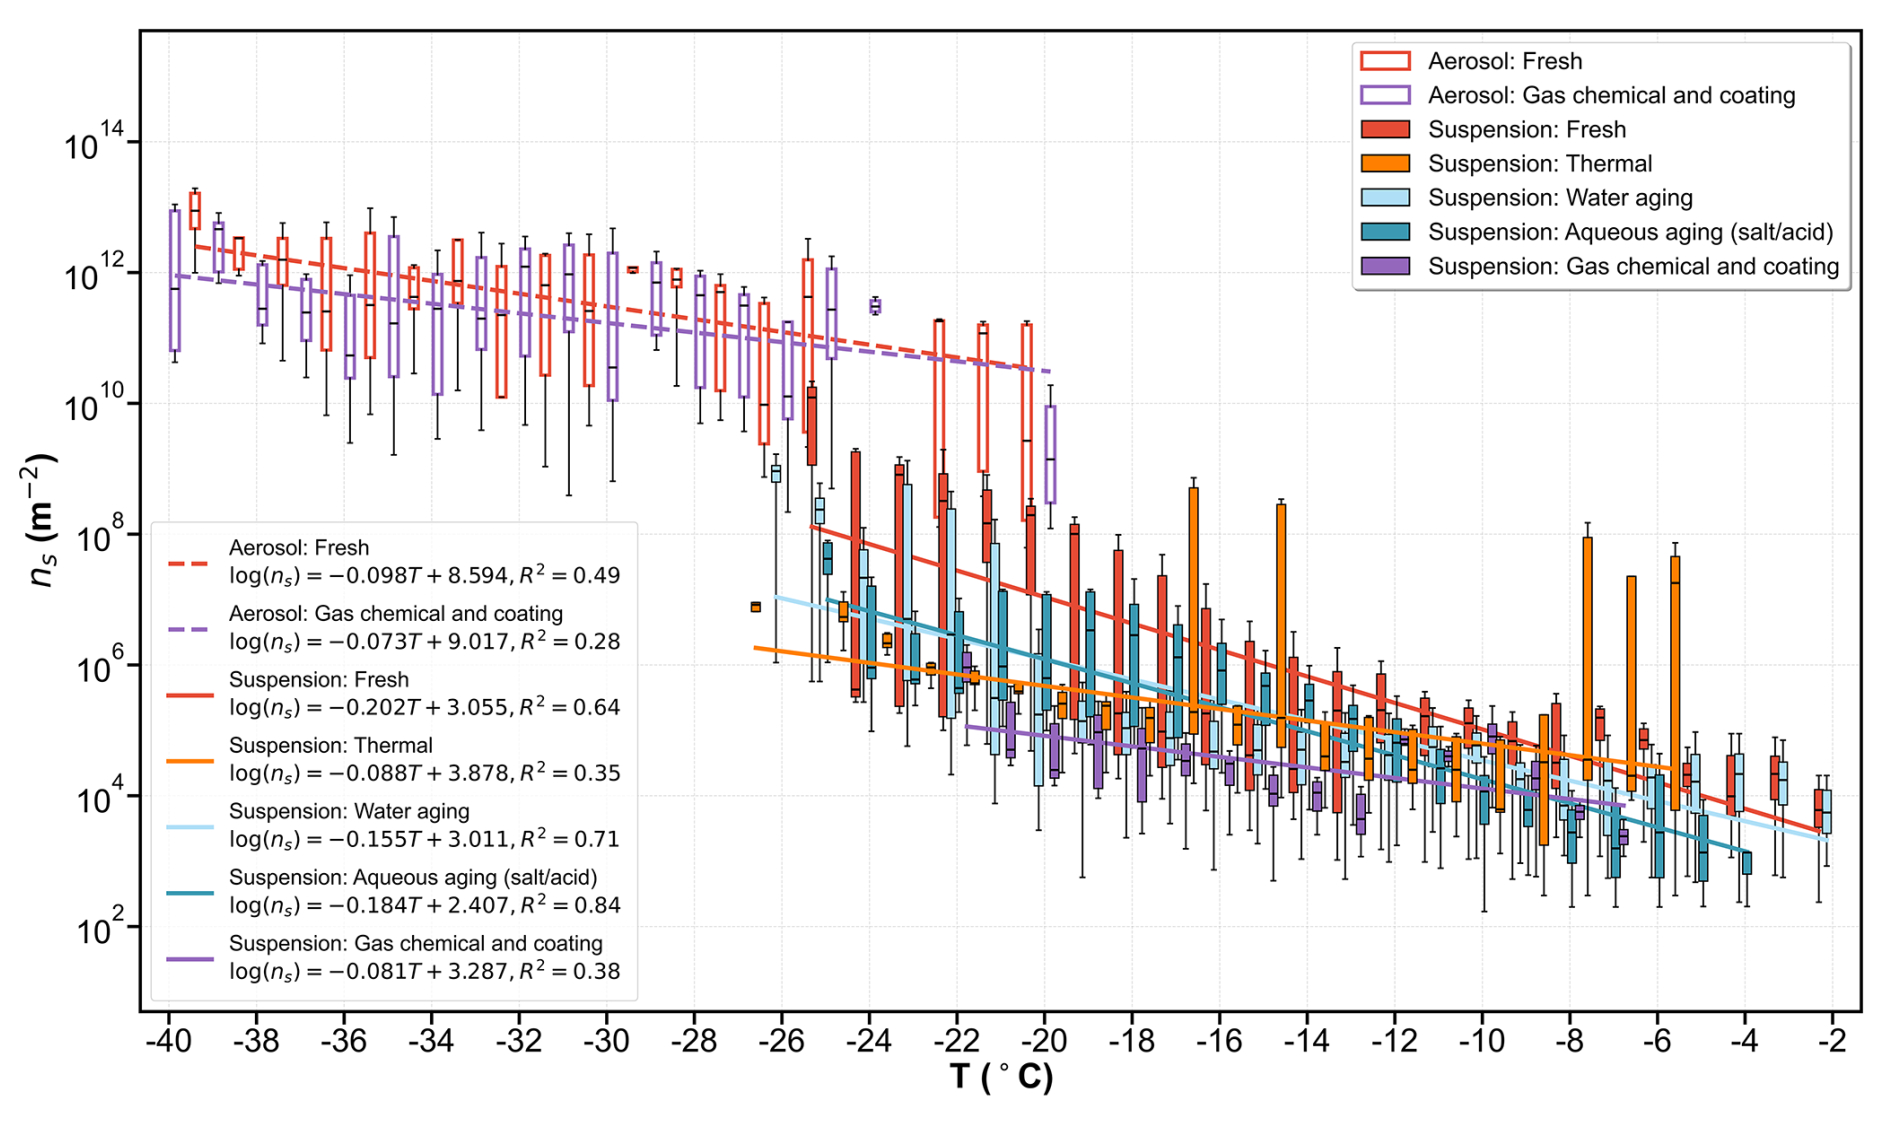
Figure 6ns of dust particles measured freshly (red) and after being subjected to different aging processes, including water aging (light blue), aqueous aging (dark blue), thermal treatment (orange), gas chemical reactions and coating (purple). The datasets obtained from dry-dispersed aerosol (open box) and wet-suspended particles (solid box) are shown separately. Only ns data from selected studies is presented, including results obtained from feldspar, quartz, ATD and natural dust, in which both fresh and aged dust particles of the same type were measured (more details in Table S3). The parameterizations to predict ns of dust particles aged through different processes are of the form: .
We further investigate how different aging pathways influence the dust INA and develop corresponding ns parameterizations. As mentioned in the methodology, laboratory aging treatments (Table S2) are categorized into four groups: water aging, aqueous aging (salt and acid solutions), gas chemical and coating, and thermal treatments. The resulting ns boxplots of dust particles subjected to these aging processes are presented in Fig. 6. It should be noted that only studies reported paired measurements of fresh and aged ns for the same dust type are considered. This restriction is necessary because ns values vary strongly among mineral species, and some species may have measurements only for the fresh state. Including such incomplete datasets could bias the median ns of fresh dust. For example, if the relatively low ns of fresh quartz (Fig. 1) was included and compared to aged feldspar ns with exceptionally high INA (Fig. 1), the overall median ns for fresh dust would be artificially lowered, confounding the assessment of aging effects. A similar artifact was observed in the case of non-potassium-rich feldspars (Fig. S5) at −25 < T < −23 °C, where the median ns of aged particles appears higher than fresh particles, due to the inclusion of datasets lacking paired measurements. For reference, the ns derived from the complete datasets (without this restriction) is presented in Fig. S6. As expected, ns values of fresh dust overlap with those from different aging processes, making it difficult to isolate the impact of each aging process (Fig. S6). This is because the larger number of the fresh ns datasets compared to aged ns and their strong variability caused by mineral compositions. To minimize this bias, we therefore focus on paired datasets of fresh and aged ns and develop parameterizations accordingly (Fig. 6).
As shown in Fig. 6, aging pathways exert variable impacts on the INA of dust particles from both aerosol (open box) and suspension (solid box) measurements at −40 < T < −2 °C. The aerosol and suspension ns across different aging pathways vary by 1–2 and 1–4 orders of magnitude at −40 < T < −20 °C and −26 < T < −2 °C, respectively. By fitting the median ns values at different temperatures, we find that aged particles subjected to all aging pathways (both aerosol and suspension) generally exhibit lower INA than fresh particles (red curves). This aligns with most studies (Table S2), which report reduced INA after various aging treatments.
For suspension measurements, aging via chemical reactions and coating causes the most significant decrease in dust INA (purple curves), followed by thermal treatment (orange curves). Aqueous aging of dust particles in water (light blue curves) or salt/acid solutions (dark blue curves) also decreases INA of dust particles. The impacts from aqueous and water aging are similar but weaker than those induced by chemical and thermal treatment. This trend is also supported by a case study of ATD, the only dust species for which INA has been reported under all aging treatments. Figure S7 explicitly shows the ns boxplots of fresh and aged ATD. Specifically, suspension measurements of ATD show the largest decrease in ns under gas chemical and coating aging, followed by thermal treatment. The impact of water and aqueous aging are similar but less significant compared to the other two aging processes. The results from ATD confirm that the general conclusion drawn from selective studies (Fig. 6) is representative of the aging impact on individual dust species. Given the different magnitudes of aging effects, we developed separate ns parameterizations for dust particles subjected to distinct aging processes, as listed in Fig. 6. However, to represent the INA of bulk fresh and aged particles, we would recommend using parameterizations listed in Fig. 5, which better capture the average INA of dust particles with diverse compositions.
These findings regarding water/aqueous aging are consistent with previous studies, which report that immersion in solutions generally lowers the INA of dust particles. For example, Reischel and Vali (1975) reported suppression of freezing in kaolinite-containing particles by NaI, KI, NaCl, CsCl and K2SO4. Abdelmonem et al. (2017) observed a reduction in the INA of α-alumina immersed in solutions of various pHs. Exceptions occur for ammonia or ammonium salts, where increases in INA have been observed for quartz (Whale et al., 2018), kaolinite (Reischel and Vali, 1975; Kumar et al., 2019b) and feldspars (Klumpp et al., 2022; Whale, 2022; Whale et al., 2018). Whale (2022) attributed this enhancement to the disruption of thermodynamically unfavorable hydrogen ordering in ice clusters induced by water-orienting nucleating surfaces (i.e., dust surfaces) in -containing solutions. In contrast, Kumar et al. (2019b) hypothesized that the adsorption of NH3 and on the feldspar and kaolinite promotes the arrangement of water molecules into an ice-like pattern through hydrogen bonding, and thereby enhancing the ice nucleation of dust particles. These exceptions highlight the variability in the freezing behavior of different dust species in response to diverse aging processes (Fig. 6). Therefore, the fitting curves in Fig. 6 represent the average INA of aged dust particles with mixed mineral compositions and interact with various solutes. We note that the actual dust INA may deviate from these average trends in specific atmospheric environments where certain reactive solutes (e.g., ammonium salts) dominate the aging pathways. A reduction in INA after aging has also been observed in natural dust samples (Fig. S5), indicating that this general aging effect is representative of atmospheric dust behavior. We also note that data for water and aqueous aging of dry-dispersed dust particles (aerosol) are very limited. This makes the evaluation of water and aqueous aging impact on dust particles from dry dispersion not feasible, we thereby encourage further studies on this aspect. Nevertheless, the finding that water/aqueous aging generally reduces dust INA, may help explain the difference in ns between dust particles generated by dry dispersion and wet suspension (Sect. 3.2). Because dust particles in suspensions remain in contact with water for longer periods during sample preparation, they may exhibit lower ns values relative to dry dispersed particles. We therefore emphasize that water should be considered a reactive medium in ice nucleation studies. In particular, the preparation and storage duration of dust suspensions may introduce uncertainties in quantifying the INA of dust particles and should be carefully controlled.
In this study, we systematically revisited the INA of dust particles under mixed-phase cloud conditions using a comprehensive dataset compiled from previous laboratory measurements. We assessed the impact of mineral composition, measurement methods and various aging processes on the INA of dust particles, represented by ns. Our results indicate that ns of dust particles exhibit substantial variability across the studied temperature range (−42 < T < −2 °C), for example at T = −20 °C, ns spans from 5.0 × 10³ to 1.7 × 10¹¹ m−2. Such significant variability can partly be attributed to the compositional diversity of dust particles. K-feldspar rich particles can trigger immersion freezing at the warmest temperature (≈ −2 °C) compared to other dust species with the same surface area (equivalent to particle sizes of 107 nm), including clay and quartz particles. Even within a single mineral group, ns varies significantly, for example, ns of K-feldspar is up to 6 orders of magnitude higher than that of non-potassium-rich feldspar at −37 < T < −4 °C.
Measurement methods exert a systematic influence on dust ns. Dry-dispersed particles generally demonstrate higher ns than those produced from wet suspensions, with difference of up to 6 orders of magnitude at −38 < T < −18 °C. This method-related difference likely arises from particle-water interactions occurring within droplets or suspensions, including particle coagulation and surface modification induced by water exposure. Compared with dry-dispersed aerosol measurements, suspension experiments, particularly under conditions of higher particle concentrations may lead to particle coagulation within droplets, which can reduce the effective surface area available for ice nucleation. However, this should not influence the results of freezing if the water molecules can access the aggregated surfaces of the particles in the droplet. Moreover, particles experience different water-contact times in aerosol and suspension measurements, which may contribute to differences in their INA. The difference between aerosol and suspension methods has been systematically shown for illite NX before (Hiranuma et al., 2015), but here we extend this analysis to other dust species including ATD, quartz, kaolinite, feldspars and montmorillonite.
To capture the variability in the dust INA caused by mineral composition and measurement methods, we developed ns-based parameterizations to predict INP numbers contributed by dust. Two types of parameterizations were established: those based on ns of dust across mineral compositions, representing the average INA of dust particles; and those based on composition-specific ns, reflecting the INA of dust with specific mineral compositions. All parameterizations are expressed in log-linear form: , with separate fits for dry and wet measurements. Suspension-derived ns exhibits a two-regime temperature dependence, characterized by a steeper increase at T < −18 °C and a weaker increase at −18 < T < −2 °C. We developed segmented parameterizations that explicitly represent these two temperature regimes, thereby improving the prediction of dust INPs under different temperature conditions. Moreover, we developed a parameterization based on the spherical equivalent particle size within a droplet (De), by assuming the surface area available for ice nucleation in a droplet comes from a single INP. This De based parameterization predicts immersion freezing temperature of dust particles in a log-linear form at −38 < T < −3 °C: . Unlike the ns parameterizations, it does not require distinguishing between measurement methods and temperature regimes, allowing for representing droplet freezing over the entire MPC temperature range with a single expression.
We also investigated the impact of atmospheric aging on dust INA. The aging processes studied include water and aqueous aging with salt or acid solutions, thermal treatment, and chemical aging through exposure to reactive gases or coating with inorganic or organic aerosol. Our results indicate that aging modifies dust INA in composition- and process- specific ways. While ns of most dust particles reduced after aging by 1–4 orders of magnitude at −40 < T < −2 °C, K-feldspar and quartz exhibit limited sensitivity to aging treatments. Among aging treatments, chemical reactions with gas or coating with organic/inorganic compounds induce the strongest reduction in dust INA, followed by thermal treatments. Water and aqueous aging produce a similar but smaller reduction in dust ns (2 orders of magnitude at −26 < T < −2 °C) compared to other treatments. This finding confirms that water can act as a reactive medium that alters the ice nucleation of dust particles. It also highlights the importance of controlling the particle-water contact during the preparation, storage, and measurement of dust suspensions to evaluate the water aging effect. Based on these results, we developed aging process-specific ns parameterizations to represent the INA of aged particles.
All ns-based parameterizations can be applied to estimate the contribution of dust aerosol to INP concentrations and primary ice formation in different atmospheric scenarios, if the corresponding surface area or mass fraction of dust particles is known. The parameterizations that represent the average freezing ability of dust particles are appropriate for atmospheres with compositionally diverse dust or for application of the global-average. The composition-specific parameterizations are tailored to conditions where the INP population is largely governed by a single mineral type, making them more suitable for regional or local applications. When composition-based ns parameterizations are used to estimate INP concentrations for a specific mineral group, the effective surface area should ideally be calculated by scaling the total dust surface area by the surface area fraction of that mineral. However, since the surface area fraction of individual minerals is generally unknown, the mass fraction is commonly used as a proxy (Price et al., 2018). To illustrate the application of a composition-specific parameterization, we used the illite ns from our aerosol parameterization, which is 107.76346 m−2at T = −15 °C (Fig. 2 and Table S4). The assumed total dust surface area concentration in the atmosphere is 50 µm2 cm−3 taken from Harrison et al. (2019). When considering that illite can account for 2 %–70 % mass fraction of transported airborne dust, with an average of ≈ 45 % (Murray et al., 2012), this estimate leads to an INP concentration of ≈ 1.3 L−1. In comparison, the dust INP concentration reported in Kanji et al. (2017) is 0.1–10 L−1 at T = −15 °C, where the higher range is expected to be present in dust events. When the parameterization from Fig. 3 (Table S4) is used (relevant for global average applications), the total dust surface area concentration can be used directly, without the need to scale based on a single mineral. The aerosol ns is 108.99443 m−2 at T = −15 °C (Fig. 3 and Table S4). Using the same total dust surface area concentration, this gives an estimated dust INP concentration of ≈ 50 L−1 at T = −15 °C, higher than the aforementioned range of 0.1–10 L−1. Using the suspension ns parameterization or assuming a lower dust surface area concentration would yield a lower estimated dust INP concentration.
Wet-suspended dust particles generally exhibit lower INA (ns) than dry-dispersed aerosol, likely due to water-mediated processes. Because aerosol instruments typically have short water-particle contact times, they capture the INA of dust particles under conditions of rapid water activation followed by ice nucleation. Therefore, ns parameterizations derived from dry-dispersed aerosol would be representative of dust particles undergoing limited water-mediated processing. In contrast, suspension methods evaluate the INA of particles with longer water interaction time, therefore ns parameterizations derived from suspension measurements are representative of particles that have undergone water-induced changes. Applying aerosol and suspension ns-based parameterizations to atmospheric conditions requires additional information on water-particle interactions (e.g., particle concentration, solutes and interaction time) and further physicochemical characterizations of dust particles. De-based parameterizations provide a simplified empirical alternative. It links immersion freezing temperatures of dust particles directly to particle size even when details of particle-water interactions are unknown. This approach is independent of measurement methods and allows prediction of dust freezing without the need to consider complex aging trajectories in models. In addition, ns is derived by assuming that the distribution and properties of active sites do not change with particle size. This assumption introduces uncertainties in dust INA, because atmospheric dust tends to be polydisperse and exhibits size-dependent variations in mineral composition and surface structure that may alter its freezing activity. In contrast, De-based parameterizations account for size-dependent variations in droplet freezing behavior by assigning freezing temperatures of droplets according to particle size (total particle surface).
Similar to water/aqueous aging, chemical reactions and thermal processes also reduce dust INA, though to different extents. The aging process-specific ns parameterizations developed here therefore provide a more realistic representation of INA for aged dust particles. When applying these parameterizations in climate models, it is important to consider the atmospheric history of dust plumes. For example, dust transported through regions with severe air pollution may be better represented by parameterizations for chemically aged particles, whereas dust plumes that remain over oceans for extended periods may be better represented by parameterizations for water- or aqueous-aged particles.
Overall, this study provides physically informed parameterizations for representing dust INA under MPC conditions. Nevertheless, several limitations remain and further studies are warranted. In the present work, a binary classification of measurement methods (i.e., aerosol versus suspension) was adopted. We note that studies using both methods encompass a wide range of experimental techniques and conditions, including differences in sample preparation, particle concentration, residence time and droplet size (as listed in Table S2). These variations can introduce uncertainty in dust INA even within the same measurement category, which is not explicitly accounted for in the present work. We therefore encourage future studies to carefully control and document sample preparation and experimental conditions, which will help minimize differences arising from methodological variability and enable a direct comparison across studies. INP data for dry-dispersed dust aerosol of different compositions, such as clay and quartz particles are still limited, introducing uncertainties in developing composition-specific and aerosol-derived ns parameterizations. In addition, given that mineralogical compositions strongly influence the INA of dust particles and that compositional variability exists across particle sizes even within the same dust category, we recommend that future research present mineralogical analyses alongside ice nucleation measurements. If the composition of natural desert dust and its corresponding mass or surface area fractions are known, a compositionally weighted parameterization can be developed based on the existing composition-specific parameterizations to describe the INA of natural dust.
The aging process-specific parameterizations developed here are based solely on suspension measurements, as comparative experiments on fresh and aqueous-aged of dry-dispersed dust particles are scarce. In addition, these aging parameterizations do not account for the time scale of aging. Future studies should systematically investigate time-dependent aging to improve INP predictions across different stages of dust plume evolution. To further evaluate the developed parameterizations, INP concentrations predicted by ns-based and De-based parameterizations should be inter-compared, to those from existing INP parameterizations, and to field observations influenced by dust emissions. This will be addressed in a separate study. These comparisons will aid in quantifying the differences in estimated ice production when different parameterizations are applied, and evaluate biases compared to observed atmospheric INP concentrations. For implementation of aging-specific parameterizations in climate models, it is important to distinguish and represent fresh and aged dust particles subjected to different aging processes within the aerosol emission schemes, and to integrate this information with the developed parameterizations to better estimate primary ice formation induced by dust under diverse atmospheric scenarios.
The Python scripts used in this study were developed specifically for data processing and plotting. They have not been packaged for public distribution but are available from the corresponding author upon request.
The data used in this work are available through the following DOI: https://doi.org/10.3929/ethz-c-000806331 (Chen and Kanji, 2026).
The supplement related to this article is available online at https://doi.org/10.5194/acp-26-15813-2026-supplement.
JC collected INP datasets from available resources. JC and ZAK developed dust ice formation parameterizations, wrote and reviewed the manuscript. ZAK acquired the funding and supervised the project.
The contact author has declared that neither of the authors has any competing interests.
Publisher's note: Copernicus Publications remains neutral with regard to jurisdictional claims made in the text, published maps, institutional affiliations, or any other geographical representation in this paper. The authors bear the ultimate responsibility for providing appropriate place names. Views expressed in the text are those of the authors and do not necessarily reflect the views of the publisher.
All datasets used in this work are published and were compiled from digitized figures in the literature, open-access repositories, or data provided directly by corresponding authors. We specifically acknowledge the following researchers for sharing their INP data: Dr. Alexei Kiselev (Karlsruhe Institute of Technology), Prof. Benjamin Murray (University of Leeds), Dr. Heike Wex (Leibniz Institute for Tropospheric Research), Dr. Gourihar Kulkarni (Pacific Northwest National Laboratory), Prof. Naruki Hiranuma (West Texas A&M University), Dr. Russell J. Perkins (Colorado State University), and Dr. Xiadi Lan Chen (Guangzhou Institute of Geochemistry).
This project has received funding from Horizon Europe Programme under Grant Agreement No. 101137680 via project CERTAINTY (Cloud-aERosol inTeractions & their impActs IN The earth sYstem). This work has received funding from the Swiss State Secretariat for Education, Research and Innovation (SERI).
This paper was edited by Ivy Tan and reviewed by four anonymous referees.
Abdelmonem, A., Backus, E. H. G., Hoffmann, N., Sánchez, M. A., Cyran, J. D., Kiselev, A., and Bonn, M.: Surface-charge-induced orientation of interfacial water suppresses heterogeneous ice nucleation on α-alumina (0001), Atmos. Chem. Phys., 17, 7827–7837, https://doi.org/10.5194/acp-17-7827-2017, 2017.
Ansmann, A., Tesche, M., Althausen, D., Müller, D., Seifert, P., Freudenthaler, V., Heese, B., Wiegner, M., Pisani, G., Knippertz, P., and Dubovik, O.: Influence of Saharan dust on cloud glaciation in southern Morocco during the Saharan Mineral Dust Experiment, J. Geophys. Res.-Atmos., 113, https://doi.org/10.1029/2007JD008785, 2008.
Atkinson, J. D., Murray, B. J., Woodhouse, M. T., Whale, T. F., Baustian, K. J., Carslaw, K. S., Dobbie, S., O'sullivan, D., and Malkin, T. L.: The importance of feldspar for ice nucleation by mineral dust in mixed-phase clouds, Nature, 498, 355, https://doi.org/10.1038/nature12278, 2013.
Augustin-Bauditz, S., Wex, H., Kanter, S., Ebert, M., Niedermeier, D., Stolz, F., Prager, A., and Stratmann, F.: The immersion mode ice nucleation behavior of mineral dusts: A comparison of different pure and surface modified dusts, Geophys. Res. Lett., 41, 7375–7382, https://doi.org/10.1002/2014GL061317, 2014.
Boose, Y., Welti, A., Atkinson, J., Ramelli, F., Danielczok, A., Bingemer, H. G., Plötze, M., Sierau, B., Kanji, Z. A., and Lohmann, U.: Heterogeneous ice nucleation on dust particles sourced from nine deserts worldwide – Part 1: Immersion freezing, Atmos. Chem. Phys., 16, 15075–15095, https://doi.org/10.5194/acp-16-15075-2016, 2016.
Broadley, S. L., Murray, B. J., Herbert, R. J., Atkinson, J. D., Dobbie, S., Malkin, T. L., Condliffe, E., and Neve, L.: Immersion mode heterogeneous ice nucleation by an illite rich powder representative of atmospheric mineral dust, Atmos. Chem. Phys., 12, 287–307, https://doi.org/10.5194/acp-12-287-2012, 2012.
Budke, C. and Koop, T.: BINARY: an optical freezing array for assessing temperature and time dependence of heterogeneous ice nucleation, Atmos. Meas. Tech., 8, 689–703, https://doi.org/10.5194/amt-8-689-2015, 2015.
Burrows, S. M., McCluskey, C. S., Cornwell, G., Steinke, I., Zhang, K., Zhao, B., Zawadowicz, M., Raman, A., Kulkarni, G., China, S., Zelenyuk, A., and DeMott, P. J.: Ice-Nucleating Particles That Impact Clouds and Climate: Observational and Modeling Research Needs, Rev. Geophys., 60, e2021RG000745, https://doi.org/10.1029/2021RG000745, 2022.
Chen, J. and Kanji, Z.: Revisiting the Parameterization of Ice Nucleation of Dust Particles under Mixed-Phase Cloud Conditions from Laboratory Measurements, ETH Zurich [data set], https://doi.org/10.3929/ethz-c-000806331, 2026.
Chen, J., Wu, Z., Gong, X., Qiu, Y., Chen, S., Zeng, L., and Hu, M.: Anthropogenic Dust as a Significant Source of Ice-Nucleating Particles in the Urban Environment, Earths Future, 12, e2023EF003738, https://doi.org/10.1029/2023EF003738, 2024.
Chen, J.-P., Hazra, A., and Levin, Z.: Parameterizing ice nucleation rates using contact angle and activation energy derived from laboratory data, Atmos. Chem. Phys., 8, 7431–7449, https://doi.org/10.5194/acp-8-7431-2008, 2008.
Chen, L., Worthy, S. E., Gu, W., Bertram, A. K., and Tang, M.: The Effects of Aminium and Ammonium Cations on the Ice Nucleation Activity of K-Feldspar, J. Geophys. Res.-Atmos., 128, e2023JD039971, https://doi.org/10.1029/2023JD039971, 2023a.
Chen, L., Peng, C., Chen, J., Chen, J., Gu, W., Jia, X., Wu, Z., Wang, Q., and Tang, M.: Effects of heterogeneous reaction with NO2 on ice nucleation activities of feldspar and Arizona Test Dust, J. Environ. Sci., 127, 210–221, https://doi.org/10.1016/j.jes.2022.04.034, 2023b.
de Boer, G., Morrison, H., Shupe, M. D., and Hildner, R.: Evidence of liquid dependent ice nucleation in high-latitude stratiform clouds from surface remote sensors, Geophys. Res. Lett., 38, https://doi.org/10.1029/2010GL046016, 2011.
DeMott, P. J., Prenni, A. J., Liu, X., Kreidenweis, S. M., Petters, M. D., Twohy, C. H., Richardson, M. S., Eidhammer, T., and Rogers, D. C.: Predicting global atmospheric ice nuclei distributions and their impacts on climate, P. Natl. Acad. Sci. USA., 107, 11217–11222, https://doi.org/10.1073/pnas.0910818107, 2010.
DeMott, P. J., Prenni, A. J., McMeeking, G. R., Sullivan, R. C., Petters, M. D., Tobo, Y., Niemand, M., Möhler, O., Snider, J. R., Wang, Z., and Kreidenweis, S. M.: Integrating laboratory and field data to quantify the immersion freezing ice nucleation activity of mineral dust particles, Atmos. Chem. Phys., 15, 393–409, https://doi.org/10.5194/acp-15-393-2015, 2015.
DeMott, P. J., Möhler, O., Cziczo, D. J., Hiranuma, N., Petters, M. D., Petters, S. S., Belosi, F., Bingemer, H. G., Brooks, S. D., Budke, C., Burkert-Kohn, M., Collier, K. N., Danielczok, A., Eppers, O., Felgitsch, L., Garimella, S., Grothe, H., Herenz, P., Hill, T. C. J., Höhler, K., Kanji, Z. A., Kiselev, A., Koop, T., Kristensen, T. B., Krüger, K., Kulkarni, G., Levin, E. J. T., Murray, B. J., Nicosia, A., O'Sullivan, D., Peckhaus, A., Polen, M. J., Price, H. C., Reicher, N., Rothenberg, D. A., Rudich, Y., Santachiara, G., Schiebel, T., Schrod, J., Seifried, T. M., Stratmann, F., Sullivan, R. C., Suski, K. J., Szakáll, M., Taylor, H. P., Ullrich, R., Vergara-Temprado, J., Wagner, R., Whale, T. F., Weber, D., Welti, A., Wilson, T. W., Wolf, M. J., and Zenker, J.: The Fifth International Workshop on Ice Nucleation phase 2 (FIN-02): laboratory intercomparison of ice nucleation measurements, Atmos. Meas. Tech., 11, 6231–6257, https://doi.org/10.5194/amt-11-6231-2018, 2018.
Emersic, C., Connolly, P. J., Boult, S., Campana, M., and Li, Z.: Investigating the discrepancy between wet-suspension- and dry-dispersion-derived ice nucleation efficiency of mineral particles, Atmos. Chem. Phys., 15, 11311–11326, https://doi.org/10.5194/acp-15-11311-2015, 2015.
Fahy, W. D., Maters, E. C., Giese Miranda, R., Adams, M. P., Jahn, L. G., Sullivan, R. C., and Murray, B. J.: Volcanic ash ice nucleation activity is variably reduced by aging in water and sulfuric acid: the effects of leaching, dissolution, and precipitation, Environ. Sci.-Atmos., 2, 85–99, https://doi.org/10.1039/D1EA00071C, 2022.
Harrison, A. D., Whale, T. F., Carpenter, M. A., Holden, M. A., Neve, L., O'Sullivan, D., Vergara Temprado, J., and Murray, B. J.: Not all feldspars are equal: a survey of ice nucleating properties across the feldspar group of minerals, Atmos. Chem. Phys., 16, 10927–10940, https://doi.org/10.5194/acp-16-10927-2016, 2016.
Harrison, A. D., Lever, K., Sanchez-Marroquin, A., Holden, M. A., Whale, T. F., Tarn, M. D., McQuaid, J. B., and Murray, B. J.: The ice-nucleating ability of quartz immersed in water and its atmospheric importance compared to K-feldspar, Atmos. Chem. Phys., 19, 11343–11361, https://doi.org/10.5194/acp-19-11343-2019, 2019.
Hiranuma, N., Augustin-Bauditz, S., Bingemer, H., Budke, C., Curtius, J., Danielczok, A., Diehl, K., Dreischmeier, K., Ebert, M., Frank, F., Hoffmann, N., Kandler, K., Kiselev, A., Koop, T., Leisner, T., Möhler, O., Nillius, B., Peckhaus, A., Rose, D., Weinbruch, S., Wex, H., Boose, Y., DeMott, P. J., Hader, J. D., Hill, T. C. J., Kanji, Z. A., Kulkarni, G., Levin, E. J. T., McCluskey, C. S., Murakami, M., Murray, B. J., Niedermeier, D., Petters, M. D., O'Sullivan, D., Saito, A., Schill, G. P., Tajiri, T., Tolbert, M. A., Welti, A., Whale, T. F., Wright, T. P., and Yamashita, K.: A comprehensive laboratory study on the immersion freezing behavior of illite NX particles: a comparison of 17 ice nucleation measurement techniques, Atmos. Chem. Phys., 15, 2489–2518, https://doi.org/10.5194/acp-15-2489-2015, 2015.
Hoose, C. and Möhler, O.: Heterogeneous ice nucleation on atmospheric aerosols: a review of results from laboratory experiments, Atmos. Chem. Phys., 12, 9817–9854, https://doi.org/10.5194/acp-12-9817-2012, 2012.
Huang, S., Hu, W., Chen, J., Wu, Z., Zhang, D., and Fu, P.: Overview of biological ice nucleating particles in the atmosphere, Environ. Int., 146, 106197, https://doi.org/10.1016/j.envint.2020.106197, 2021.
Huang, Z., Hu, W., Chen, J., Zhu, J., Wu, Z., Zhang, Y., and Fu, P.: Atmospheric aging effects on aerosol ice nucleation, Earth-Sci. Rev., 269, 105176, https://doi.org/10.1016/j.earscirev.2025.105176, 2025.
Kanji, Z. A., Welti, A., Chou, C., Stetzer, O., and Lohmann, U.: Laboratory studies of immersion and deposition mode ice nucleation of ozone aged mineral dust particles, Atmos. Chem. Phys., 13, 9097–9118, https://doi.org/10.5194/acp-13-9097-2013, 2013.
Kanji, Z. A., Ladino, L. A., Wex, H., Boose, Y., Burkert-Kohn, M., Cziczo, D. J., and Krämer, M.: Overview of Ice Nucleating Particles, Meteor. Mon., 58, 1.1–1.33, https://doi.org/10.1175/AMSMONOGRAPHS-D-16-0006.1, 2017.
Kanji, Z. A., Sullivan, R. C., Niemand, M., DeMott, P. J., Prenni, A. J., Chou, C., Saathoff, H., and Möhler, O.: Heterogeneous ice nucleation properties of natural desert dust particles coated with a surrogate of secondary organic aerosol, Atmos. Chem. Phys., 19, 5091–5110, https://doi.org/10.5194/acp-19-5091-2019, 2019.
Kiselev, A., Bachmann, F., Pedevilla, P., Cox, S. J., Michaelides, A., Gerthsen, D., and Leisner, T.: Active sites in heterogeneous ice nucleation—the example of K-rich feldspars, Science, 355, 367–371, https://doi.org/10.1126/science.aai8034, 2017.
Klumpp, K., Marcolli, C., and Peter, T.: The impact of (bio-)organic substances on the ice nucleation activity of the K-feldspar microcline in aqueous solutions, Atmos. Chem. Phys., 22, 3655–3673, https://doi.org/10.5194/acp-22-3655-2022, 2022.
Knopf, D. A. and Koop, T.: Heterogeneous nucleation of ice on surrogates of mineral dust, J. Geophys. Res.-Atmos., 111, https://doi.org/10.1029/2005JD006894, 2006.
Kulkarni, G., Sanders, C., Zhang, K., Liu, X., and Zhao, C.: Ice nucleation of bare and sulfuric acid-coated mineral dust particles and implication for cloud properties, J. Geophys. Res.-Atmos., 119, 9993–10011, https://doi.org/10.1002/2014JD021567, 2014.
Kumar, A., Marcolli, C., Luo, B., and Peter, T.: Ice nucleation activity of silicates and aluminosilicates in pure water and aqueous solutions – Part 1: The K-feldspar microcline, Atmos. Chem. Phys., 18, 7057–7079, https://doi.org/10.5194/acp-18-7057-2018, 2018.
Kumar, A., Marcolli, C., and Peter, T.: Ice nucleation activity of silicates and aluminosilicates in pure water and aqueous solutions – Part 2: Quartz and amorphous silica, Atmos. Chem. Phys., 19, 6035–6058, https://doi.org/10.5194/acp-19-6035-2019, 2019a.
Kumar, A., Marcolli, C., and Peter, T.: Ice nucleation activity of silicates and aluminosilicates in pure water and aqueous solutions – Part 3: Aluminosilicates, Atmos. Chem. Phys., 19, 6059–6084, https://doi.org/10.5194/acp-19-6059-2019, 2019b.
Marcolli, C., Gedamke, S., Peter, T., and Zobrist, B.: Efficiency of immersion mode ice nucleation on surrogates of mineral dust, Atmos. Chem. Phys., 7, 5081–5091, https://doi.org/10.5194/acp-7-5081-2007, 2007.
McGraw, Z., Storelvmo, T., Polvani, L. M., Hofer, S., Shaw, J. K., and Gettelman, A.: On the Links Between Ice Nucleation, Cloud Phase, and Climate Sensitivity in CESM2, Geophys. Res. Lett., 50, e2023GL105053, https://doi.org/10.1029/2023GL105053, 2023.
Mignani, C., Wieder, J., Sprenger, M. A., Kanji, Z. A., Henneberger, J., Alewell, C., and Conen, F.: Towards parameterising atmospheric concentrations of ice-nucleating particles active at moderate supercooling, Atmos. Chem. Phys., 21, 657–664, https://doi.org/10.5194/acp-21-657-2021, 2021.
Murray, B. J., Broadley, S. L., Wilson, T. W., Atkinson, J. D., and Wills, R. H.: Heterogeneous freezing of water droplets containing kaolinite particles, Atmos. Chem. Phys., 11, 4191–4207, https://doi.org/10.5194/acp-11-4191-2011, 2011.
Murray, B. J., O'Sullivan, D., Atkinson, J. D., and Webb, M. E.: Ice nucleation by particles immersed in supercooled cloud droplets, Chem. Soc. Rev., 41, 6519–6554, https://doi.org/10.1039/c2cs35200a, 2012.
Murray, B. J., Carslaw, K. S., and Field, P. R.: Opinion: Cloud-phase climate feedback and the importance of ice-nucleating particles, Atmos. Chem. Phys., 21, 665–679, https://doi.org/10.5194/acp-21-665-2021, 2021.
Niedermeier, D., Shaw, R. A., Hartmann, S., Wex, H., Clauss, T., Voigtländer, J., and Stratmann, F.: Heterogeneous ice nucleation: exploring the transition from stochastic to singular freezing behavior, Atmos. Chem. Phys., 11, 8767–8775, https://doi.org/10.5194/acp-11-8767-2011, 2011a.
Niedermeier, D., Hartmann, S., Clauss, T., Wex, H., Kiselev, A., Sullivan, R. C., DeMott, P. J., Petters, M. D., Reitz, P., Schneider, J., Mikhailov, E., Sierau, B., Stetzer, O., Reimann, B., Bundke, U., Shaw, R. A., Buchholz, A., Mentel, T. F., and Stratmann, F.: Experimental study of the role of physicochemical surface processing on the IN ability of mineral dust particles, Atmos. Chem. Phys., 11, 11131–11144, https://doi.org/10.5194/acp-11-11131-2011, 2011b.
Peckhaus, A., Kiselev, A., Hiron, T., Ebert, M., and Leisner, T.: A comparative study of K-rich and Na/Ca-rich feldspar ice-nucleating particles in a nanoliter droplet freezing assay, Atmos. Chem. Phys., 16, 11477–11496, https://doi.org/10.5194/acp-16-11477-2016, 2016.
Perkins, R. J., Gillette, S. M., Hill, T. C., and DeMott, P. J.: The labile nature of ice nucleation by Arizona Test Dust, ACS Earth Space Chem., 4, 133–141, https://doi.org/10.1021/acsearthspacechem.9b00304, 2019.
Price, H., Baustian, K., McQuaid, J., Blyth, A., Bower, K., Choularton, T., Cotton, R., Cui, Z., Field, P., and Gallagher, M.: Atmospheric ice-nucleating particles in the dusty tropical Atlantic, J. Geophys. Res.-Atmos., 123, 2175–2193, https://doi.org/10.1002/2017JD027560, 2018.
Reischel, M. T. and Vali, G.: Freezing nucleation in aqueous electrolytes, Tellus, 27, 414–427, https://doi.org/10.3402/tellusa.v27i4.9989, 1975.
Salam, A., Lohmann, U., and Lesins, G.: Ice nucleation of ammonia gas exposed montmorillonite mineral dust particles, Atmos. Chem. Phys., 7, 3923–3931, https://doi.org/10.5194/acp-7-3923-2007, 2007.
Salam, A., Lesins, G., and Lohmann, U.: Laboratory study of heterogeneous ice nucleation in deposition mode of montmorillonite mineral dust particles aged with ammonia, sulfur dioxide, and ozone at polluted atmospheric concentrations, Air Qual. Atmos. Hlth., 1, 135–142, https://doi.org/10.1007/s11869-008-0019-6, 2008.
Savre, J. and Ekman, A. M. L.: A theory-based parameterization for heterogeneous ice nucleation and implications for the simulation of ice processes in atmospheric models, J. Geophys. Res.-Atmos., 120, 4937–4961, https://doi.org/10.1002/2014JD023000, 2015.
Sullivan, R. C., Petters, M. D., DeMott, P. J., Kreidenweis, S. M., Wex, H., Niedermeier, D., Hartmann, S., Clauss, T., Stratmann, F., Reitz, P., Schneider, J., and Sierau, B.: Irreversible loss of ice nucleation active sites in mineral dust particles caused by sulphuric acid condensation, Atmos. Chem. Phys., 10, 11471–11487, https://doi.org/10.5194/acp-10-11471-2010, 2010.
Tobo, Y., DeMott, P. J., Raddatz, M., Niedermeier, D., Hartmann, S., Kreidenweis, S. M., Stratmann, F., and Wex, H.: Impacts of chemical reactivity on ice nucleation of kaolinite particles: A case study of levoglucosan and sulfuric acid, Geophys. Res. Lett., 39, https://doi.org/10.1029/2012GL053007, 2012.
Vali, G. and Snider, J. R.: Time-dependent freezing rate parcel model, Atmos. Chem. Phys., 15, 2071–2079, https://doi.org/10.5194/acp-15-2071-2015, 2015.
Vlasenko, A., Sjögren, S., Weingartner, E., Gäggeler, H. W., and Ammann, M.: Generation of Submicron Arizona Test Dust Aerosol: Chemical and Hygroscopic Properties, Aerosol Sci. Tech., 39, 452–460, https://doi.org/10.1080/027868290959870, 2005.
Welti, A., Lüönd, F., Kanji, Z. A., Stetzer, O., and Lohmann, U.: Time dependence of immersion freezing: an experimental study on size selected kaolinite particles, Atmos. Chem. Phys., 12, 9893–9907, https://doi.org/10.5194/acp-12-9893-2012, 2012.
Wex, H., DeMott, P. J., Tobo, Y., Hartmann, S., Rösch, M., Clauss, T., Tomsche, L., Niedermeier, D., and Stratmann, F.: Kaolinite particles as ice nuclei: learning from the use of different kaolinite samples and different coatings, Atmos. Chem. Phys., 14, 5529–5546, https://doi.org/10.5194/acp-14-5529-2014, 2014.
Whale, T. F.: Disordering effect of the ammonium cation accounts for anomalous enhancement of heterogeneous ice nucleation, J. Chem, Phys., 156, https://doi.org/10.1063/5.0084635, 2022.
Whale, T. F., Holden, M. A., Kulak, A. N., Kim, Y. Y., Meldrum, F. C., Christenson, H. K., and Murray, B. J.: The role of phase separation and related topography in the exceptional ice-nucleating ability of alkali feldspars, Phys. Chem. Chem. Phys., 19, 31186–31193, https://doi.org/10.1039/c7cp04898j, 2017.
Whale, T. F., Holden, M. A., Wilson, Theodore W., O'Sullivan, D., and Murray, B. J.: The enhancement and suppression of immersion mode heterogeneous ice-nucleation by solutes, Chem. Sci., 9, 4142–4151, https://doi.org/10.1039/C7SC05421A, 2018.
Wright, T. P. and Petters, M. D.: The role of time in heterogeneous freezing nucleation, J. Geophys. Res.-Atmos., 118, 3731–3743, https://doi.org/10.1002/jgrd.50365, 2013.
Zolles, T., Burkart, J., Häusler, T., Pummer, B., Hitzenberger, R., and Grothe, H.: Identification of ice nucleation active sites on feldspar dust particles, J. Chem. Phy. A, 119, 2692–2700, https://doi.org/10.1021/jp509839x, 2015.