
the Creative Commons Attribution 4.0 License.
the Creative Commons Attribution 4.0 License.
 | 10 Nov 2026
Correct use of radiative efficiencies in calculating global warming potentials and other emission metrics
William J. Collins

Øivind Hodnebrog
Keith P. Shine
James B. Burkholder
The calculations of Global Warming Potentials (GWPs) and other related climate emission metrics should use radiative efficiencies that are calculated using the mean atmospheric mole fraction, rather than the surface mole fraction as is commonly used. We quantify this correction and show it leads to an upward revision of GWP values. For species with lifetimes greater than a few years, the revision is an increase of a few percent e.g., 7 % for trichlorofluoromethane (CFC-11). For species with lifetimes of the order of a year or less, this correction can lead to increases in the GWPs of over ten percent, which could impact on stakeholder decisions on the desirability of using such gases.
- Article
(1191 KB) - Full-text XML
- BibTeX
- EndNote


The Global Warming Potential (GWP) of a species is given by the ratio of the absolute global warming potential (AGWP) to that of CO2. The AGWPs are the radiative forcing following a 1 kg pulse emission integrated over a specified time horizon H with units of W m−2 yr kg−1 (e.g., Shine et al., 1990).
Here Ax is the radiative forcing from 1 kg of species x (i.e. units of W m−2 kg−1), and Rx(t) is the time evolution of the atmospheric mass of the species following the pulse emission. Hence, the AGWPs are proportional to the radiative efficiency defined per unit mass of the emitted species.
Values of radiative efficiency for many species have been calculated (Etminan et al., 2016; Hodnebrog et al., 2020) but are usually reported defined per change in surface mole fraction. This letter sets out to clarify the importance of using the appropriate conversion from mole fraction to mass when calculating GWPs and other climate emission metrics.
The radiative efficiencies for atmospheric species are typically calculated using sophisticated radiative transfer models (RTMs) in which the mole fractions of the species of interest are varied. The radiative efficiencies are then calculated as the ratio of the radiative forcing change to the mole fraction change, for small changes in mole fraction. Originally calculations used constant profiles of mole fraction with height (e.g., Pinnock et al., 1995) but vertical profile information from models or observations was later adopted for many species (Etminan et al., 2016; Freckleton et al., 1998; Jain et al., 2000; Myhre et al., 1998; Myhre and Stordal, 1997; Naik et al., 2000). This is now done routinely in international assessments for halogenated gases using parameterisations based on species lifetime (Hodnebrog et al., 2013, 2020). These radiative efficiencies are typically reported per change in surface mole fraction (Etminan et al., 2016; Freckleton et al., 1998; Hodnebrog et al., 2013, 2020; Jain et al., 2000; Myhre et al., 1998; Myhre and Stordal, 1997; Naik et al., 2000) where “surface” refers to the perturbation imposed in the lowest layer in the RTM. Species that are destroyed in the stratosphere (N2O, chlorofluorocarbons (CFCs)) will have lower mole fractions in the stratosphere than at the surface. Species that have very short tropospheric lifetimes (comparable to the vertical mixing timescales in the troposphere) such as some hydrocarbons and halocarbons will have significantly lower mole fractions in the upper troposphere than at the surface. In both cases the radiative forcing will be less (for the same surface mole fraction change) than if a constant profile were used, and so the radiative efficiency will be lower too. Figure 1a shows the adjustments to the radiative efficiency for species destroyed in the stratosphere (dashed red line) and troposphere (dashed blue line) based on parameterisations1 derived in Hodnebrog et al. (2013). The adjustments can be considered to comprise two components, a correction due to the spatial distribution of the species (radiative efficiency per mass is greatest in the upper troposphere and lower stratosphere (Maycock et al., 2021) and over relatively cloud-free regions of higher surface temperature) and a correction because of the lower atmospheric mass of a species for a given surface mole fraction (solid lines in Fig. 1a).
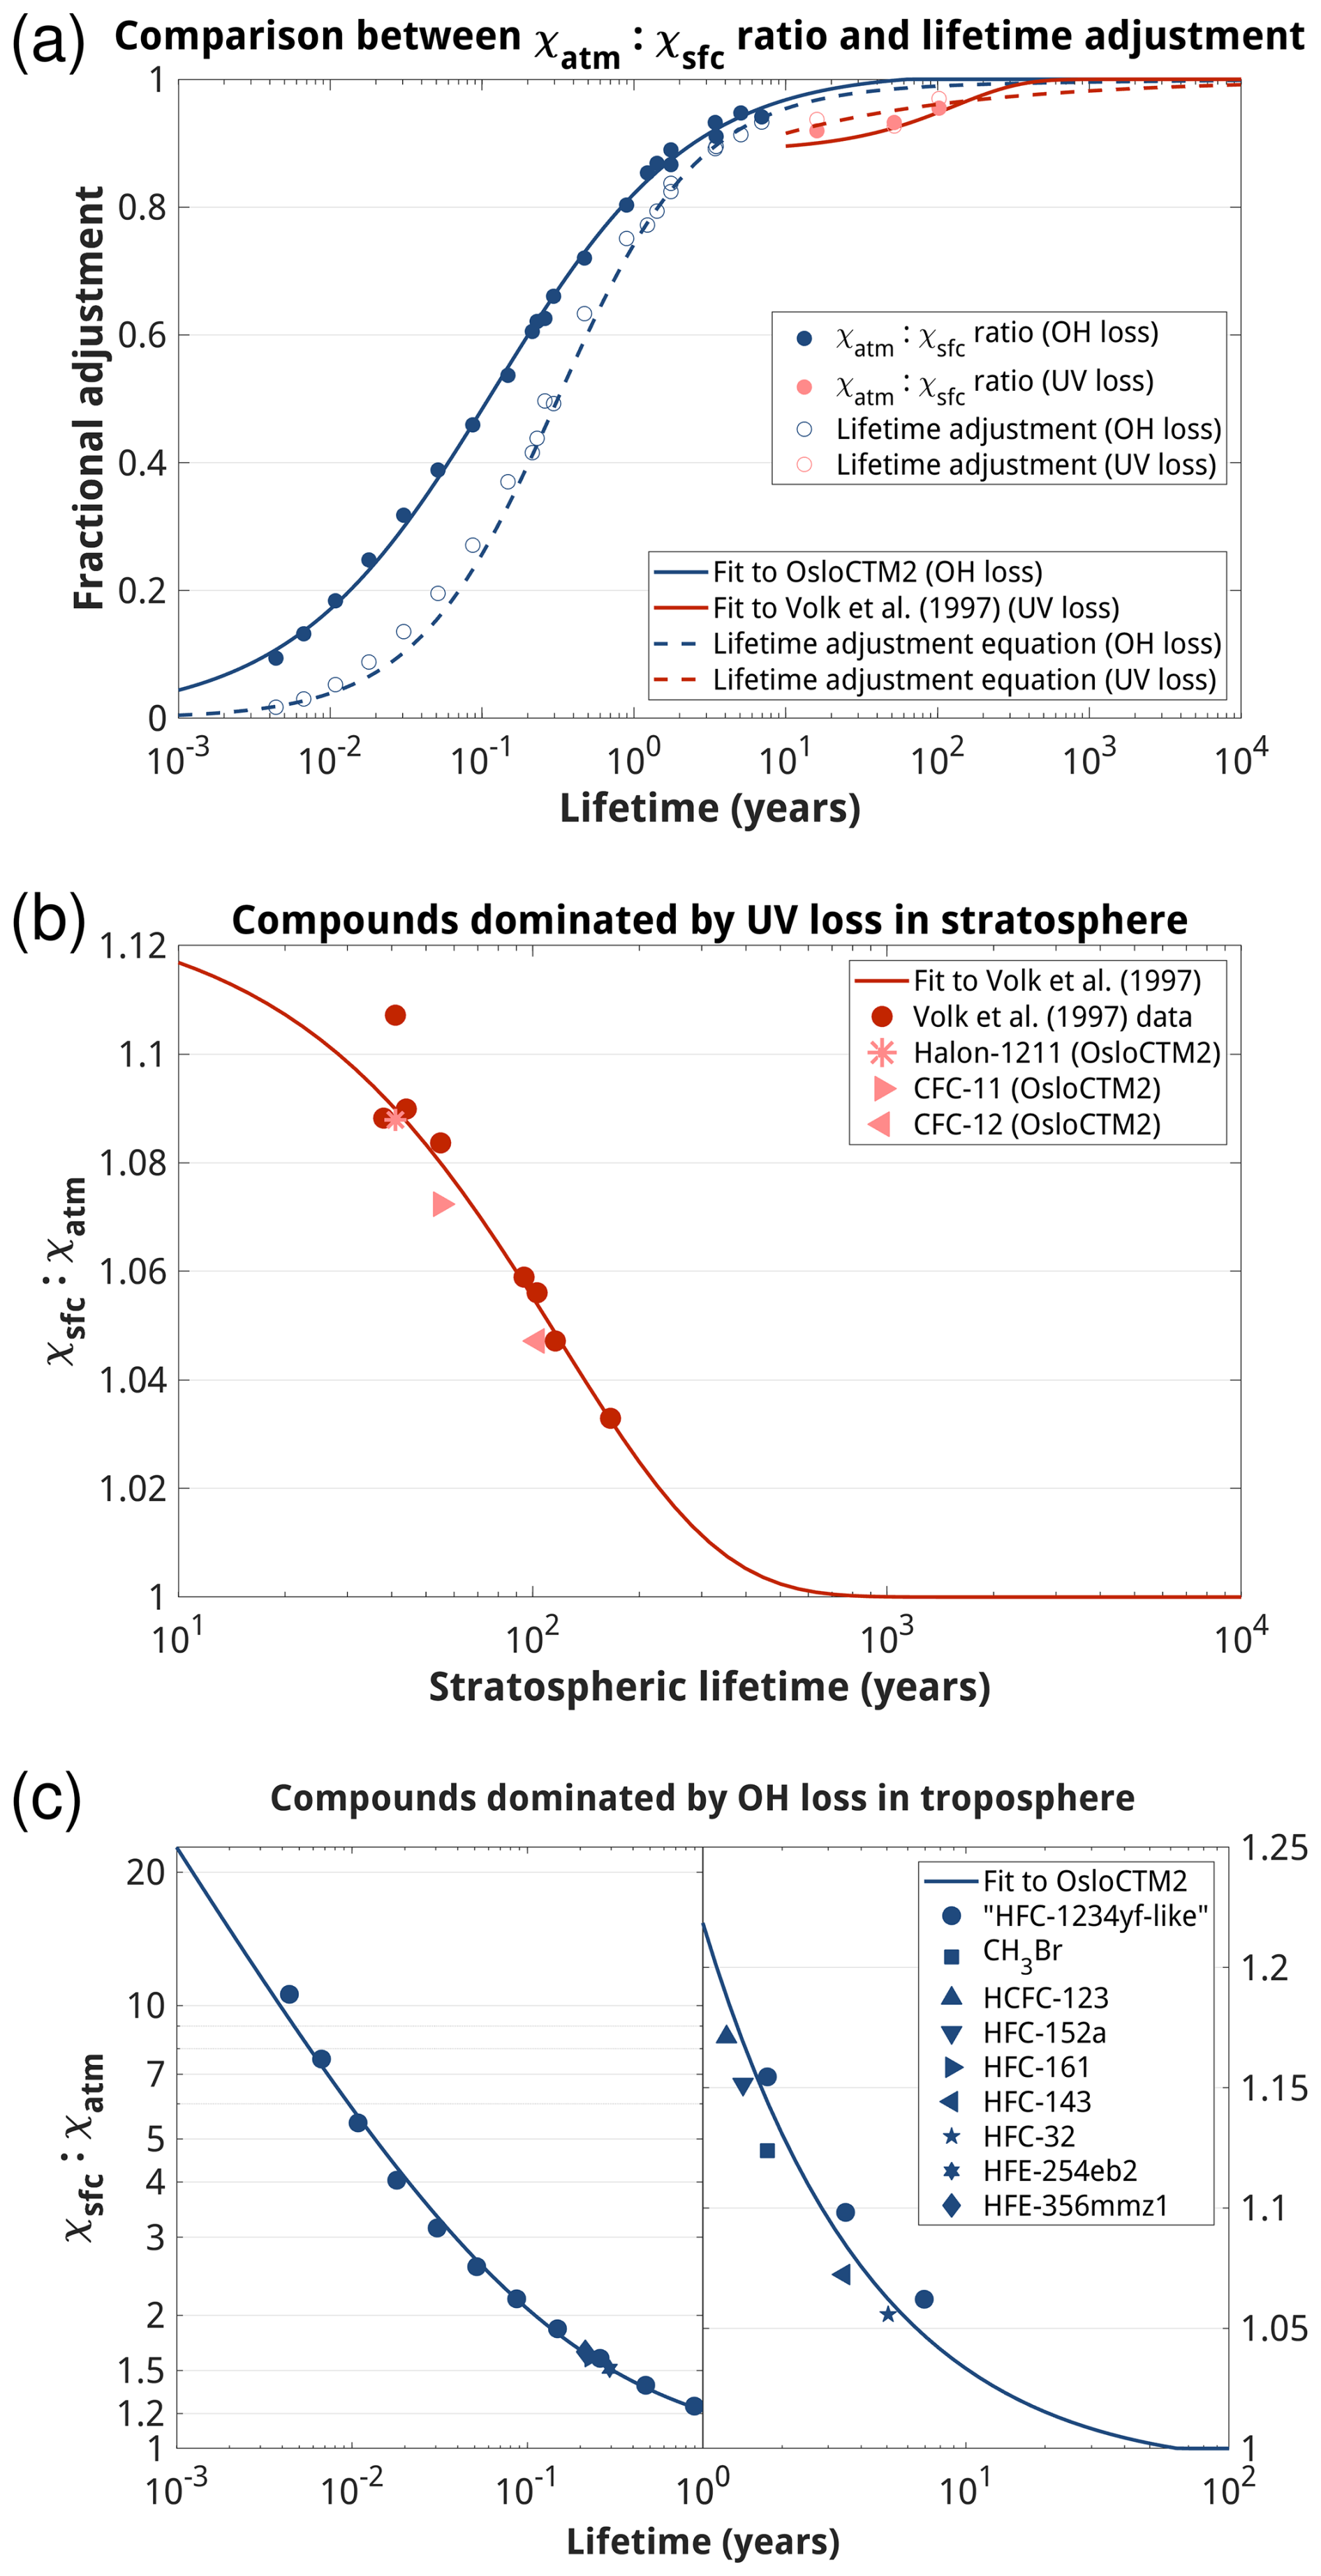
Figure 1(a) Comparison between the ratio of mean atmospheric-to-surface mole fraction (χatm : χsfc; filled circles) and the lifetime adjustment that corrects RE to account for non-homogeneous atmospheric distribution (open circles) based on OsloCTM2 simulations (see Fig. 9 and associated discussion in Hodnebrog et al., 2013). (b) Ratio χsfc : χatm from the OsloCTM2 simulations, and from observations in Volk et al. (1997) and associated fit from Collins et al. (2026b) (see Eq. 4), against stratospheric lifetimes from WMO (2022). (c) Ratio χsfc : χatm against total lifetimes from OsloCTM2 simulations in Hodnebrog et al. (2013) and associated fit (see Eq. 5). Note that in (a), red filled circles and solid red line are plotted against stratospheric lifetimes and not total lifetimes.
A key use of radiative efficiencies is to determine the radiative forcing from observed changes in surface mole fractions of different species (Forster et al., 2021), although for species with a steep vertical gradient (lifetime < 1 year) the definitions of “surface” in the RTM may not correspond exactly to the definition of “surface” in the observations which are determined from measurements representative of the well-mixed lower troposphere (Gulev et al., 2021). Accounting for the declining mole fractions with height has allowed a more complete determination of their climate effects (Hodnebrog et al., 2013). These adjustments however make them less useful for directly determining GWPs which are based on radiative efficiency per mass. To calculate GWPs it is important to know what vertical profile has been used for the species in the radiation calculations so that the radiative efficiencies can be correctly converted to a mass basis.
In the climate assessments from the Intergovernmental Panel on Climate Change (IPCC) and the ozone assessments from the World Meteorological Organization (WMO) (Forster et al., 2021; WMO, 2022), the conversion from mole fraction to mass has been done using the following formula (Aamaas et al., 2013; Shine et al., 2005)
where Ax and RE are the radiative efficiencies given in W m−2 kg−1 and W m−2 ppb−1, respectively, Mair is the mean molecular weight of dry air (28.97 kg kmol−1), Mx is the molecular weight of species x, and TM is the total dry air mass of the atmosphere (5.1352 × 10¹⁸ kg; Trenberth and Smith, 2005). This conversion is appropriate if the RE is defined per mean atmospheric mole fraction change, but not if it is defined per surface mole fraction change since the assumed mass burden will be incorrect. In the latter case a correction factor is needed (Collins et al., 2026b) that is the ratio of the change in surface mole fraction Δχsfc to the change in mass-weighted mean atmospheric mole fraction Δχatm, i.e. Eq. (2) should be modified to
Physically, the radiative efficiency per mean atmospheric mole fraction (i.e. the whole term in parentheses in Eq. 3) is higher because a lower Δχatm (or equivalently a lower change in atmospheric burden) is required to generate the same forcing as a 1 ppb change in χsfc.
Ideally the ratio should be that used in the original RTM calculations, but that is not available in all cases, so we fit empirical functions to allow values to be derived for any species. Values of for a range of species were calculated in Volk et al. (1997). These were species where the main effect on the vertical profile came from destruction in the stratosphere. Collins et al. (2026b) derived the following empirical fit to the data in Volk et al. (1997):
τstrat is the stratospheric lifetime of a species in years (WMO, 2022). Note the reciprocal of this term is similar to the “fill factor c” in Prather et al. (2012) although they use the tropospheric mole fraction in the denominator. Figure 1b shows that OsloCTM2 results from Hodnebrog et al. (2013) align well with the empirical fit that is based on Volk et al. (1997). The root mean squared error (RMSE) in the ratio using the fit is less than 0.008.
To calculate the ratio for species with short tropospheric lifetimes we fit to OsloCTM2 results for a range of molecules that react with OH in the troposphere in Hodnebrog et al. (2013) using a similar form of equation to their lifetime adjustment (τ is the total atmospheric lifetime in years).
Figure 1c shows this fit on top of the ratio against lifetime for all the OsloCTM2 simulations. For species with a lifetime greater than 1 year (right hand panel of Fig. 1c) the RMSE in the ratio using the fit is less than 0.002. For species with a lifetime less than 1 year (left hand panel of Fig. 1c) we calculate a fractional uncertainty of 5 % of the ratio. For these species the mole fraction also varies horizontally in the radiative efficiency calculations so χsfc is the global mean mole fraction in the lowest model layer, both in the determination of radiative efficiency and in the fit in Fig. 1c. Equation (4) should be used for species where stratospheric loss through photolysis is more important (shorter stratospheric partial lifetime). Equation (5) should be used for species where loss through OH in the troposphere has the shorter partial lifetime.
Table 1 shows, for a few selected molecules, how correcting for the impacts GWP100 values (i.e. for H=100 years). Although we use here GWP100 values from Forster et al. (2021) and WMO (2022) for illustration, the correction factors are appropriate for all climate metrics that use radiative efficiency at all timescales. For CFC-11 the increase is just over 7 %. For some shorter-lived HFCs the effect can be very large, suggesting the previous determinations of GWP100 were underestimated by over 10 %.
Table 1The effect on GWP100 of correcting the approach for converting RE values from per ppb to per kg, compared to the previous approach, for a selection of molecules. For CH4, N2O, CFC-11, CFC-12 and Halon-1211 explicit correction factors are used as described in the text. For CFC-113 Eq. (4) is used, and Eq. (5) is used for the other halogenated compounds. Uncertainties arising from the use of the equations are provided for these species. Lifetimes, REs and AGWP are as in WMO (2022) for the halogenated species, and in Forster et al. (2021) (We use here the GWP100 values from the Errata to the IPCC AR6 https://www.ipcc.ch/report/ar6/wg1/downloads/report/IPCC_AR6_WGI_Errata.pdf (last access: 1 September 2026) rather than from the tables initially published in Forster et al. (2021)) for CH4 and N2O. Note uncertainties in GWP100 are around 40 % for most of these species (Smith et al., 2021).
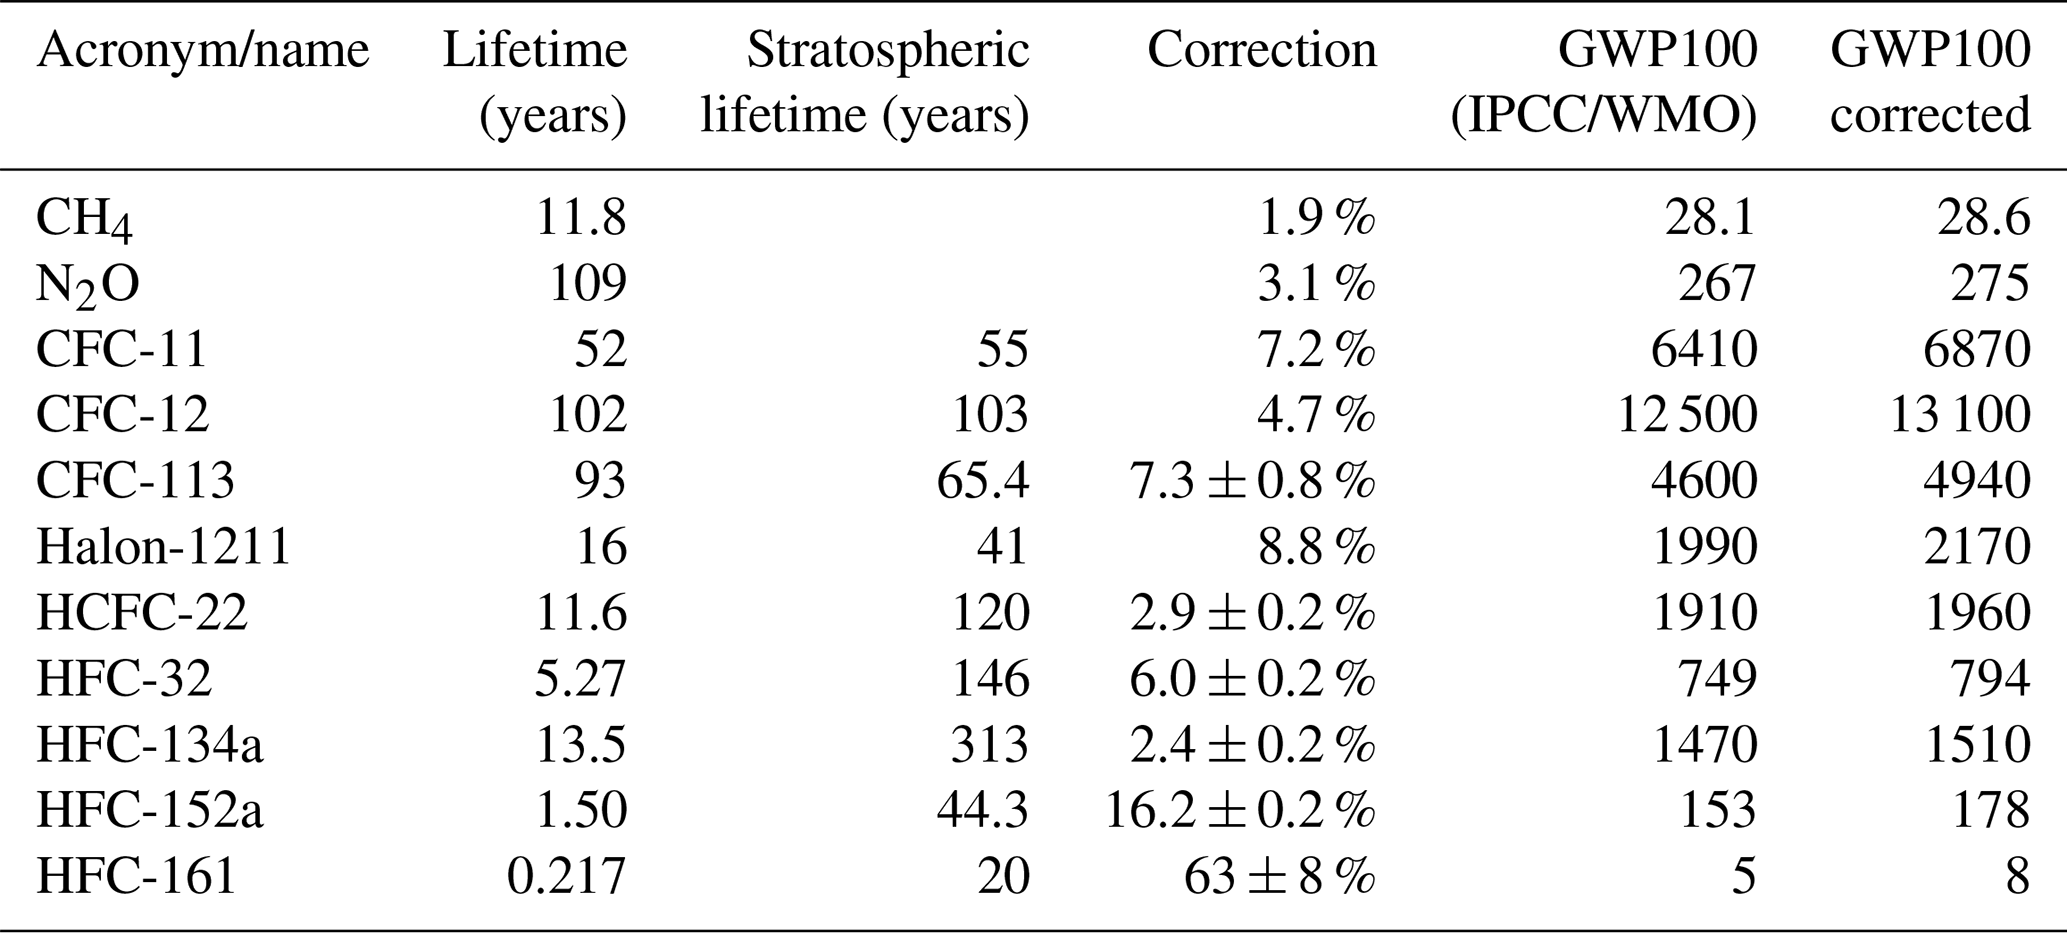
The methane and nitrous oxide radiative efficiencies used in the IPCC 6th Assessment (Forster et al., 2021) come from Etminan et al. (2016). The profiles of methane and nitrous oxide used in that study were from Myhre and Stordal (1997) (see Data Availability) with values of of 1.019 and 1.031 respectively. Note these ratios are less than expected from Eq. (4). If the ratios used in the original radiative efficiency calculations are known, it is more appropriate to use these than Eqs. (4) or (5). In Hodnebrog et al. (2020) the explicit ratios for CFC-11, CFC-12 and Halon-1211 are 1.072, 1.047 and 1.088 respectively (Fig. 1b).
The factor discussed above is necessary to correct radiative efficiencies that have been reported per change in surface mole fraction when RE per change in mean atmospheric mole fraction is required, such as in the calculation of GWPs. This ratio should strictly be the ratio of the changes as used in the radiative efficiency calculations which is not necessarily that observed in the atmosphere or derived from models. Hence, we correct the methane and nitrous oxide radiative efficiencies using the profiles used in Etminan et al. (2016) rather than from Eq. (4). For CO2, the radiative efficiency calculations from Etminan et al. (2016) and parameterised in Meinshausen et al. (2020) used a constant profile with height so do not need a correction. For halogenated species the ratios shown in Fig. 1c are taken from the profiles used to calculate the radiative efficiencies in Hodnebrog et al. (2013, 2020) so are appropriate to correct the reported values. For studies other than Etminan et al. (2016) and Hodnebrog et al. (2013, 2020) the correction should ideally be taken from the profiles used in the RTM; however if these are not available our uncertainty analysis shows that Eqs. (4) and (5) are able to estimate the ratio to within less than 1 %. Although the GWP100 values for species with lifetimes less than a year are very uncertain and depend, for example, on where the species are emitted, they are widely reported and used; hence even for these it is important to correct systematic underestimates of over 10 %.
We have shown here the application to the GWP, but as most climate emission metrics (for example, GWP* and global temperature-change potential – GTP) scale with the radiative efficiency per mass (e.g., Forster et al., 2021) these will be similarly affected, as will calculations of GWP for different time horizons.
However, calculations of radiative forcing from observed changes in surface mole fractions using radiative efficiencies should not use this correction. We recommend that, in future, calculations or assessments of radiative efficiencies report both the radiative forcing per surface mole fraction change and per mean-atmospheric mole fraction change.
We have shown that it is inconsistent to use radiative efficiency (per surface mole fraction) calculations in the standard GWP formulation if the radiative efficiency calculations account for decreases in atmospheric mole fraction above the surface. Since these calculations account for a decreased atmospheric mass of the species, this must also be accounted for in the conversion to radiative efficiency per mass; otherwise, the inconsistency will cause errors in the GWP calculation.
For species where the main decrease in mole fraction occurs in the stratosphere, the effect is only around 5 % to 7 % but, nevertheless, neglect of the correction leads to a systematic underestimate of the GWP. For species with short tropospheric lifetimes (of the order of a year or less) the underestimates can be 10 %, or even larger.
Correcting these underestimates could bring the GWP100 for some species over critical legislative thresholds (see, for example, Sect. 4 of Hodnebrog et al., 2020) and thus impact on their perceived desirability for use for certain applications. For instance, the GWP100 for HFC-32 increases from 749 to 794 (Table 1). It is recommended that the corrections provided in this letter are applied to GWP values and other climate emission metrics from the IPCC Assessment Reports and WMO Ozone Assessments.
The data for the figure are available from Zenodo with the DOI https://doi.org/10.5281/zenodo.18485657 (Hodnebrog, 2026). The methane and nitrous oxide profiles used in Etminan et al. (2016) come originally from Myhre and Stordal (1997) and are provided as text files with the DOI https://doi.org/10.5281/zenodo.21791080 (Collins et al., 2026a).
WJC and ØH conceived the study. ØH analysed the data. All authors contributed to drafting and reviewing the text.
The contact author has declared that none of the authors has any competing interests.
Publisher's note: Copernicus Publications remains neutral with regard to jurisdictional claims made in the text, published maps, institutional affiliations, or any other geographical representation in this paper. The authors bear the ultimate responsibility for providing appropriate place names. Views expressed in the text are those of the authors and do not necessarily reflect the views of the publisher.
WJC and KPS were supported by the UK Natural Environment Research Council (NERC) Grant “Investigating Halocarbon Impacts on the global environment”. ØH was supported by the Research Council of Norway).
This research has been supported by the UK Research and Innovation, Natural Environment Research Council (grant no. NE/X004198/1) and the Norges Forskningsråd (grant no. 336227).
This paper was edited by Michael Byrne and James Lee and reviewed by Michael Prather and Chris Smith.
Aamaas, B., Peters, G. P., and Fuglestvedt, J. S.: Simple emission metrics for climate impacts, Earth Syst. Dynam., 4, 145–170, https://doi.org/10.5194/esd-4-145-2013, 2013.
Collins, W., Myhre, G., and Hodnebrog, Ø.: Methane and Nitrous oxide profiles from Myhre and Stordal 1997, Zenodo [data set], https://doi.org/10.5281/zenodo.21791080, 2026a.
Collins, W. J., Daniel, J. S., Chipperfield, M. P., Cussac, M., Deushi, M., Faluvegi, G., Griffiths, P., Hodnebrog, Ø., Horowitz, L. W., Keeble, J., Kinnison, D., Naik, V., O'Connor, F. M., Shindell, D., Tilmes, S., Tsigaridis, K., Wang, Z., and Weber, J.: Indirect climate forcing from ozone depleting substances, EGUsphere [preprint], https://doi.org/10.5194/egusphere-2025-6033, 2026b.
Etminan, M., Myhre, G., Highwood, E. J., and Shine, K. P.: Radiative forcing of carbon dioxide, methane, and nitrous oxide: A significant revision of the methane radiative forcing, Geophys. Res. Lett., https://doi.org/10.1002/2016GL071930, 2016.
Forster, P., Storelvmo, T., Armour, K., Collins, W., Dufresne, J.-L., Frame, D., Lunt, D. J., Mauritsen, T., Palmer, M. D., Watanabe, M., Wild, M., and Zhang, H.: The Earth's Energy Budget, Climate Feedbacks and Climate Sensitivity, in: Climate Change 2021: The Physical Science Basis, Contribution of Working Group I to the Sixth Assessment Report of the Intergovernmental Panel on Climate Change, edited by: Masson-Delmotte, V., Zhai, P., Pirani, A., Connors, S. L., Pean, C., Berger, S., Caud, N., Chen, Y., Goldfarb, L., Gomis, M. I., Huang, M., Leitzell, K., Lonnoy, E., Matthews, J. B. R., Maycock, T. K., Waterfield, T., Yelekci, O., Yu, R., and Zhou, B., Cambridge University Press, Cambridge, United Kingdom and New York, NY, USA, 923–1054, https://doi.org/10.1017/9781009157896.009, 2021.
Freckleton, R. S., Highwood, E. J., Shine, K. P., Wild, O., Law, K. S., and Sanderson, M. G.: Greenhouse gas radiative forcing: Effects of averaging and inhomogeneities in trace gas distribution, Q. J. Roy. Meteor. Soc., 124, 2099–2127, https://doi.org/10.1002/qj.49712455014, 1998.
Gulev, S. K., Thorne, P. W., Ahn, J., Dentener, F. J., Domingues, C. M., Gerland, S., Gong, D., Kaufman, D. S., Nnamchi, H. C., Quaas, J., Rivera, J. A., Sathyendranath, S., Smith, S. L., Trewin, B., von Schuckmann, K., and Vose, R. S.: Changing State of the Climate System, in: Climate Change 2021: The Physical Science Basis, Contribution of Working Group I to the Sixth Assessment Report of the Intergovernmental Panel on Climate Change, edited by: Masson-Delmotte, V., Zhai, P., Pirani, A., Connors, S. L., Péan, C., Berger, S., Caud, N., Chen, Y., Goldfarb, L., Gomis, M. I., Huang, M., Leitzell, K., Lonnoy, E., Matthews, J. B. R., Maycock, T. K., Waterfield, T., Yelekçi, O., Yu, R., and Zhou, B., Cambridge University Press, Cambridge, United Kingdom and New York, NY, USA, 287–422, https://doi.org/10.1017/9781009157896.004, 2021.
Hodnebrog, Ø.: Figure 1, Zenodo [data set], https://doi.org/10.5281/zenodo.18485657, 2026.
Hodnebrog, Ø., Etminan, M., Fuglestvedt, J. S., Marston, G., Myhre, G., Nielsen, C. J., Shine, K. P., and Wallington, T. J.: Global warming potentials and radiative efficiencies of halocarbons and related compounds: A comprehensive review, Rev. Geophys., 51, 300–378, https://doi.org/10.1002/ROG.20013, 2013.
Hodnebrog, Ø., Aamaas, B., Fuglestvedt, J. S., Marston, G., Myhre, G., Nielsen, C. J., Sandstad, M., Shine, K. P., and Wallington, T. J.: Updated Global Warming Potentials and Radiative Efficiencies of Halocarbons and Other Weak Atmospheric Absorbers, Rev. Geophys., 58, e2019RG000691, https://doi.org/10.1029/2019RG000691, 2020.
Jain, A. K., Briegleb, B. P., Minschwaner, K., and Wuebbles, D. J.: Radiative forcings and global warming potentials of 39 greenhouse gases, J. Geophys. Res.-Atmos., 105, 20773–20790, https://doi.org/10.1029/2000JD900241, 2000.
Maycock, A. C., Smith, C. J., Rap, A., and Rutherford, O.: On the Structure of Instantaneous Radiative Forcing Kernels for Greenhouse Gases, J. Atmos. Sci., 78, 949–965, https://doi.org/10.1175/JAS-D-19-0267.1, 2021.
Meinshausen, M., Nicholls, Z. R. J., Lewis, J., Gidden, M. J., Vogel, E., Freund, M., Beyerle, U., Gessner, C., Nauels, A., Bauer, N., Canadell, J. G., Daniel, J. S., John, A., Krummel, P. B., Luderer, G., Meinshausen, N., Montzka, S. A., Rayner, P. J., Reimann, S., Smith, S. J., van den Berg, M., Velders, G. J. M., Vollmer, M. K., and Wang, R. H. J.: The shared socio-economic pathway (SSP) greenhouse gas concentrations and their extensions to 2500, Geosci. Model Dev., 13, 3571–3605, https://doi.org/10.5194/gmd-13-3571-2020, 2020.
Myhre, G. and Stordal, F.: Role of spatial and temporal variations in the computation of radiative forcing and GWP, J. Geophys. Res.-Atmos., 102, 11181–11200, https://doi.org/10.1029/97JD00148, 1997.
Myhre, G., Highwood, E. J., Shine, K. P., and Stordal, F.: New estimates of radiative forcing due to well mixed greenhouse gases, Geophys. Res. Lett., https://doi.org/10.1029/98GL01908, 1998.
Naik, V., Jain, A. K., Patten, K. O., and Wuebbles, D. J.: Consistent sets of atmospheric lifetimes and radiative forcings on climate for CFC replacements: HCFCs and HFCs, J. Geophys. Res.-Atmos., 105, 6903–6914, https://doi.org/10.1029/1999JD901128, 2000.
Pinnock, S., Hurley, M. D., Shine, K. P., Wallington, T. J., and Smyth, T. J.: Radiative forcing of climate by hydrochlorofluorocarbons and hydrofluorocarbons, J. Geophys. Res., 100, 23227–23238, https://doi.org/10.1029/95JD02323, 1995.
Prather, M. J., Holmes, C. D., and Hsu, J.: Reactive greenhouse gas scenarios: Systematic exploration of uncertainties and the role of atmospheric chemistry, Geophys. Res. Lett., 39, 9803, https://doi.org/10.1029/2012GL051440, 2012.
Shine, K. P., Derwent, R. G., Wuebbles, D. J., and Morcrette, J.-J.: Radiative Forcing of Climate, in: Climate Change: The IPCC Scientific Assessment, edited by: Houghton, J. T., Jenkins, J. G., and Ephraums, J. J., Cambridge University Press, Cambridge, United Kingdom and New York, NY, USA, 41–68, ISBN 0-521-40720-6, 1990.
Shine, K. P., Fuglestvedt, J. S., Hailemariam, K., and Stuber, N.: Alternatives to the Global Warming Potential for comparing climate impacts of emissions of greenhouse gases, Climate Change, 68, 281–302, https://doi.org/10.1007/s10584-005-1146-9, 2005.
Smith, C., Nicholls, Z. R. J., Armour, K., Collins, W., Forster, P., Meinshausen, M., Palmer, M. D., and Watanabe, M.: The Earth's Energy Budget, Climate Feedbacks, and Climate Sensitivity Supplementary Material, in: Climate Change 2021: The Physical Science Basis, Contribution of Working Group I to the Sixth Assessment Report of the Intergovernmental Panel on Climate Change, edited by: Masson-Delmotte, V., Zhai, P., Pirani, A., Connors, S. L., Péan, C., Berger, S., Caud, N., Chen, Y., Goldfarb, L., Gomis, M. I., Huang, M., Leitzell, K., Lonnoy, E., Matthews, J. B. R., Maycock, T. K., Waterfield, T., Yelekçi, O., Yu, R., and Zhou, B., https://www.ipcc.ch/report/ar6/wg1/downloads/report/IPCC_AR6_WGI_Chapter07_SM.pdf (last access: September 2026), 2021.
Trenberth, K. E. and Smith, L.: The Mass of the Atmosphere: A Constraint on Global Analyses, J. Climate, 18, 864–875, https://doi.org/10.1175/JCLI-3299.1, 2005.
Volk, C. M., Elkins, J. W., Fahey, D. W., Dutton, G. S., Gilligan, J. M., Loewenstein, M., Podolske, J. R., Chan, K. R., and Gunson, M. R.: Evaluation of source gas lifetimes from stratospheric observations, J. Geophys. Res.-Atmos., 102, 25543–25564, https://doi.org/10.1029/97JD02215, 1997.
WMO: Scientific Assessment of Ozone Depletion: 2022, GAW Report No. 278, Geneva, 509 pp., ISBN 978-9914-733-97-6, https://library.wmo.int/idurl/4/58360 (last access: September 2026), 2022.
for stratospheric destruction, for tropospheric destruction, where τ is the total lifetime.