
the Creative Commons Attribution 4.0 License.
the Creative Commons Attribution 4.0 License.
 | 05 Nov 2026
Uncovering the seasonal trends of VOC production from ozonolysis of seawater
Frances E. Hopkins

Daniel P. Phillips
Yinghao Chen
Peter S. Liss
Mingxi Yang
Large uncertainty exists in the role that the ocean plays as a net source for atmospheric volatile organic carbon (VOC) compounds, in part because of poorly quantified processes near the air–sea interface. Laboratory studies imply that heterogeneous reactions of ozone at the ocean surface may be a key source of VOCs to the marine atmosphere, but the representativeness of such experiments for the chemically complex surface ocean waters is unclear due to limited field evidence. Here, we determined the production ratios of select VOCs formed during ozonolysis of fresh, natural seawater from laboratory experiments under turbulent conditions using a proton-transfer-reaction quadrupole mass spectrometer (PTR-MS). To quantify seasonal variability, near-surface water samples were collected from a temperate marine station during different seasons and measured for ozone-driven VOC production ratios. In all experiments, out of the VOCs monitored the dominant products of ozonolysis were 69 (C5H), followed by 59 (acetone/propanal) and 45 (acetaldehyde). Clear seasonal differences in VOC production imply that marine biogeochemistry likely drives the availability and composition of VOC precursors. Further ozonolysis experiments using diluted VOC precursors (senescent algal culture, fatty acids, certified natural organic matter (NOM)) resulted in different VOC production compared to those using natural seawater. Our results show that ocean biogeochemical cycling is a key driver of variability in ozone-driven VOC production at the sea surface.
- Article
(2961 KB) - Full-text XML
-
Supplement
(1436 KB) - BibTeX
- EndNote


Volatile organic compounds (VOCs) affect atmospheric chemistry, air quality, climate, and the oxidative capacity of the atmosphere (Bloss et al., 2005; Kirkby et al., 2016; Kim et al., 2017). By reacting with hydroxyl (OH) radicals, VOCs control OH reactivity and modulate the atmospheric lifetime of methane (Bloss et al., 2005). Oxidation of some VOCs also produces secondary aerosols that serve as cloud condensation nuclei, affecting cloud properties and Earth's radiative balance both directly through scattering and indirectly via cloud-mediated processes (Lambe et al., 2015; Ahlberg et al., 2017; Moore et al., 2024). In the remote marine atmosphere, where aerosol concentrations are low, VOC-driven chemistry strongly influences particle formation and cloud microphysics (McCoy et al., 2015; Rocco et al., 2021). VOC oxidation further contributes to tropospheric ozone formation, with consequences for air quality and human health (Finlayson-Pitts and Pitts, 1993; Thames et al., 2020; Xu et al., 2025).
The surface oceans are a source of VOCs to the atmosphere (Carpenter et al., 2012), but large uncertainty exists in the role the ocean plays as a net source for atmospheric VOCs because of a lack of field observations and poorly quantified production and consumption processes near the air–sea interface. Until recently, studies of marine VOC fluxes tended to focus on the bulk air-sea exchange, which depend on the concentrations of VOCs in bulk seawater and overlying air. In the ocean, VOCs comprise a key part of the dissolved organic matter (DOM) pool, serving as both products of, and substrates for, microbial activity (Kiene and Bates, 1990; McGenity et al., 2018). Photosynthesis by phytoplankton also drives biotic production of some VOCs, which diffuse across cell membranes into the surrounding seawater. VOCs can further be released when phytoplankton are infected by viruses or grazed (Wohl et al., 2023). Bacteria use this supply of VOCs for energy and growth. Environmental drivers (light, mixed layer depth, nutrients) can shift the plankton community physiology or composition and are likely to alter the VOC cycling (Halsey and Giovannoni, 2023). However, the relative contributions of different phytoplankton groups, bacterial communities, and metabolic pathways that are responsible for VOC production and consumption remain very poorly understood to date (Carpenter et al., 2012; Halsey and Giovannoni, 2023).
In addition to bulk air-sea exchange, recent studies show that VOCs are emitted from the sea surface microlayer (SML) via abiotic reactions (Zhou et al., 2014; Brüggemann et al., 2017; Mungall et al., 2017; Novak and Bertram, 2020). The SML – the ocean's skin – can become enriched in organic matter and surfactants, composed of biogenically produced proteins and lipids (Wurl et al., 2011), and serves as an active interface for photochemistry and heterogeneous chemistry that can produce VOCs (Zhou and Mopper, 1997; Zhou et al., 2014; Brüggemann et al., 2017). A number of recent studies using aged or artificial seawater demonstrate that heterogeneous reactions with ozone at the sea surface are a potentially significant source of VOCs (Chang et al., 2004; Zhou et al., 2014; Schneider et al., 2019; Wang et al., 2023; Kilgour et al., 2024; Schneider et al., 2024). The majority of these studies used quiescent, artificial, or natural seawater with the use of additives to explore potential VOC precursor compounds (Zhou et al., 2014; Schneider et al., 2019; Wang et al., 2023; Kilgour et al., 2024; Schneider et al., 2024). In some cases, seawater samples that had undergone storage processing/freezing were used (Zhou et al., 2014; Schneider et al., 2019; Kilgour et al., 2024), with unknown implications for the concentrations and characteristics of organic VOC precursors. It is unclear how representative these experiments are of the chemically complex and usually turbulent natural sea surface. There is little understanding in how biogeochemistry in fresh seawater influences the production of VOCs, especially on a seasonal timescale.
Here we describe ozonolysis experiments using fresh, sub-surface (< 2 m depth) seawater collected from the Western English Channel during different seasons (Spring 2017, Autumn 2018, Summer–Autumn 2020). A turbulent bubble column was used to quantify production ratios of select VOCs during different phases of the annual temperate plankton seasonal cycle. In parallel, we performed experiments using additions of potential VOC precursors (senescent algal culture, fatty acids, Suwannee River certified natural organic material (NOM)) to organics-depleted seawater to explore the potential origin of the precursor organics for VOC production.
2.1 Collection of seawater and ancillary measurements
Surface seawater from 1.8 ± 0.3 m depth was routinely sampled from the station L4 of the Western Channel Observatory, located ∼ 13 km southwest of Plymouth, U.K (50.3° N, 04.22° W, full water depth ∼ 55 m) by the RV Plymouth Quest using 10 L Niskin bottles mounted on a rosette sampler, alongside a Seabird 19 + CTD. Sub-samples were transferred directly into overflowing acid-washed 5 L glass bottles, sealed with ground glass stoppers with no headspace and transported to the laboratory in a dark cool box. Experiments were carried out between 3 and 24 h after sample collection to minimize biological or chemical transformation of DOM. No significant relationships were observed for the duration between seawater sampling and VOC production measurements. Measurement campaigns were undertaken over contrasting seasons: late winter/spring (14 February–3 May 2017), summer/autumn (15 June–12 October 2020) and autumn/winter (4 September–5 November 2018). Chlorophyll a concentrations measured by fluorometry (Fig. 3c), and cell counts for total eukaryotes (Fig. 3d) and heterotrophic nanoflagellates and bacteria (Fig. 3e) measured by flow cytometry were sampled, processed and analysed according to the Standard Operating Procedures of the Western Channel Observatory (https://www.westernchannelobservatory.org.uk/data.php, last access: 4 November 2026).
2.2 Ozone experiment setup
Unlike previous ozonolysis studies that rely on quiescent or gently mixed waters (Schneider et al., 2019; Kilgour et al., 2024; Schneider et al., 2024), our approach uses a bubble-column system designed to emulate the high-surface-area, highly dynamic conditions produced by wave breaking in the surface ocean. This provides a complementary perspective because (1) bubbles generated during wave breaking entrain atmospheric O3 and can deliver it directly into the near-surface water column, and (2) bubbles are known to efficiently scavenge surface-active organic matter from the water column and concentrate it at the gas–water interface. Our setup therefore enables investigation of O3–seawater reactions under conditions that more closely mimic bubble-rich marine environments.
Ozonolysis experiments were carried out using an acid-washed, custom-built 1.45 L cylindrical borosilicate glass column fitted with a fine glass frit, beneath which a gas inlet entered a ∼ 0.2 L void. Silicone tubing was used to siphon 1.2 L of water sample into the column above the frit, minimising bubble formation and contact between the sample and lab air. A headspace of 0.25 L was maintained in the column above the sample, which also contained the gas outlet.
We briefly describe the experimental methods here, with detailed methods given in the Supplement. A mass flow controller (MFC; Bronkhorst ELFLOW Select series) was used to deliver a constant flow (150 sccm) of zero air (BOC BTCA 178 synthetic air) further scrubbed of organics using a custom-built Pt catalyst heated to 450 °C at 150 standard cubic centimetres per minute (sccm) to the gas inlet beneath the frit, resulting in a dense and turbulent plume of bubbles passing through the sample. The bubble interface area (Abub) was estimated to be 360 cm2 from , where Vbub represents the total bubble displacement volume (∼ 3 mL) and d approximates the diameter of a single bubble (∼ 0.5 mm). Vbub was measured by observing the volume displacement with and without the gas flow, while dbub was estimated photographically using a ruler as a reference. The bubble interface area is on the order of six times the cross-sectional area of the glass column, and the bubble residence time in the water phase was ∼ 1.2 s.
Ozone was generated from the artificial air using a corona discharge (Enaly 1000BT-12 ozone generator) and mixed into the zero-air stream feeding the experimental column. Mean ozone input mixing ratios differ between experiments conducted in spring, summer, and autumn – 7.7 ± 0.7, 1.7 ± 0.7, and 2.1 ± 1.1 ppmv, respectively. These inputs are substantially higher than typical ambient marine ozone levels (by approximately 25–150 ×) but were intentionally used to obtain (1) strong VOC production, and (2) high signal: noise ratio for the ozone measurement under the experimental constraints. Gas-phase ozone in the column headspace was monitored every 10 s using a dual-channel ozone analyser (2B Technologies Model 205). Because the analyser requires a relatively high inlet flow (∼ 2 L min−1), a large make-up flow of zero air (dilution factor of ∼ 12) was added to meet the instrument's flow requirements, hence the need for high ozone input. The VOC production vs. ozone input relationship was experimentally determined to be linear at ozone input mixing ratio below ∼ 4 ppmv (see Fig. S2 in the Supplement). Gas-phase VOC concentrations in the outflowing air from the column headspace were quantified using a proton-transfer-reaction mass spectrometer (PTR-quadrupole-MS, Ionicon Analytik), as described in Phillips et al. (2021). The PTR-MS was operated in multiple ion detection mode, mainly monitoring 45 (acetaldehyde), 59 (acetone/propanal), 63 (DMS) and 69 (C5H). The quadrupole mass dwell time was set to 50 ms for H3O+ and 500 ms for each VOC. Overall, the temporal resolution of the measurement was 3.1–7.7 s (0.13–0.27 Hz), depending on the number of ions monitored. A certified VOC gas standard (Apel-Riemer Environmental Inc.) was used to routinely calibrate the PTR-MS. The limit of detection (LOD) was defined as 3σ of repeated blank measurements following Wohl et al. (2019) and LOD values for 45, 59, and 69 are shown in the Supplement. Full details of PTR-MS data processing are shown in the Supplement.
2.3 Implementation of ozone experiments
Each experiment comprised four stages, some of which were repeated as the experiment progressed (Fig. 1). In stage one (S1), the ozone generator was on, and the bubble column was bypassed to measure the ozone input. In stage two (S2), the ozone generator was off, and the bubble column was bypassed to measure the dry VOC blanks. In stage three (S3), with the ozone generator remaining off, zero air was passed through the water sample in the column, resulting in the transfer of dissolved VOCs from water phase into gas phase and flushing the column headspace. After 20–30 min, measured VOCs stabilised, and the sample air was assumed to be in approximate steady-state with the seawater sample. In stage four (S4), ozone was added to the zero-air stream, and after ∼ 1–2 min measured VOCs started to increase. In contrast, ozone only became measurable ∼ 5 min after ozone addition. VOC mixing ratios peaked sooner than ozone because ozone was lost entirely at the beginning to DOM and other aqueous compounds (e.g. I−). We compute the VOC peak height by taking the difference between the steady-state point during the latter phase of stage three and the peak maximum during S4. We compute the VOC peak gradient by linear regression through the initial linear portion of the peak during stage four. Typically, two Milli-Q samples were run to check for column cleanliness and also provide a humid VOC blank, followed by triplicate seawater samples. Ozone and VOC were measured continuously throughout all four stages.
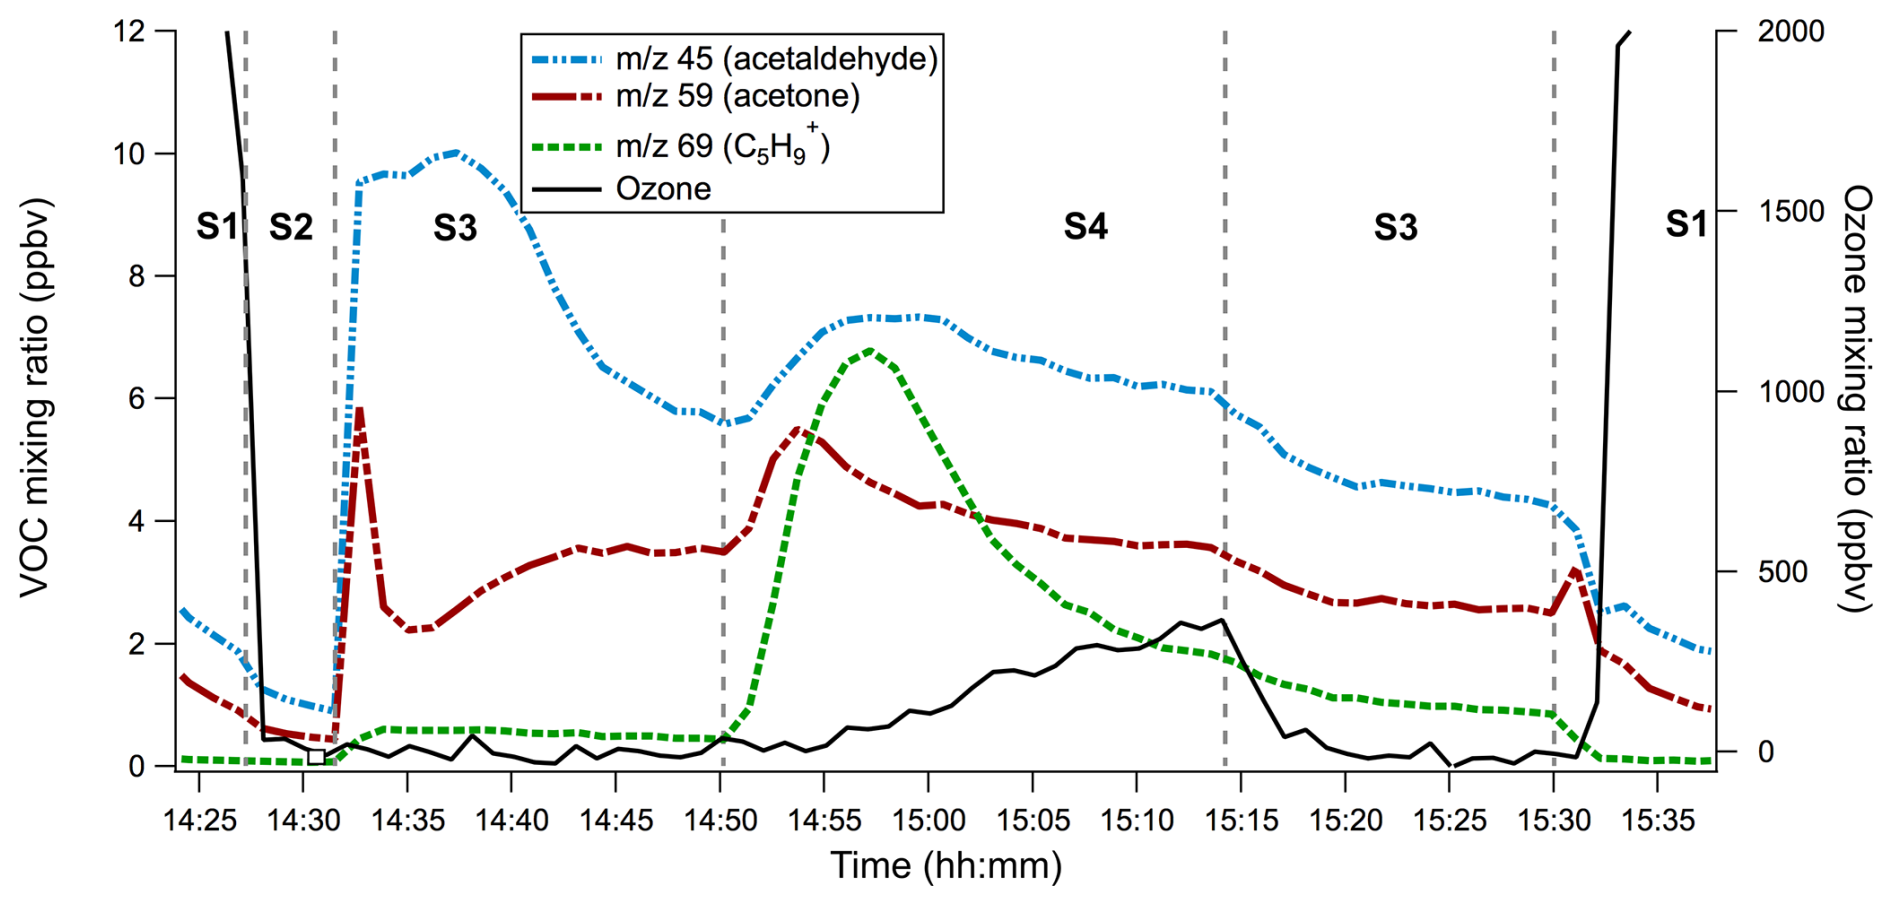
Figure 1Time series of VOC mixing ratio (ppbv) and ozone mixing ratio (ppbv) during a typical ozoneaddition experiment, showing the response of 69 (C5H), 59 (acetone/propanal) and 45 (acetaldehyde). The four experimental stages are indicated by S1–S4, demarcated by grey dashed lines. S1: column bypass for ozone measurement, S2: column bypass for dry VOC blank, S3: zero air directed through column for background seawater VOC measurements, S4: ozone added to zero air stream to oxidise sample. In this example. S3 and S1 were repeated towards the end of the experiment.
2.4 Reactant addition experiments
To explore potential biological VOC precursors and determine oxidation products, specific reactants were diluted in aged VOC-free seawater (aged in dark, gas-tight glass bottles for ∼ 1 month at 20 °C) and added to the bubble column, using the same experimental procedure as described for natural seawater above. Additions included: (1) Axenic algal culture (E. huxleyi Rutgers 607) which had been grown to senescence, added directly to the column by briefly removing the column cap and pipetting into the water sample (5–20 mL); (2) NOM sourced from the International Humic Substances Society (Suwannee River), dissolved in 10 mL of aged seawater and poured into the column (0–10 mg L−1 column concentration); For each of these reactant addition experiments, the concentrations of the reactants were diluted to be of the same order of magnitude compared to the surface ocean dissolved organic carbon (DOC) concentration (ca. 100 µmol C L−1).
3.1 Evaluating seasonal variability in ozone-driven VOC production
VOC production from the ozonolysis of natural surface seawater showed clear seasonal variability that corresponded closely to the seasonal phytoplankton dynamics of the Western English Channel. Figure 2 shows the VOC peak height (Fig. 2A) and the peak gradient (Fig. 2B) following ozonolysis for the three most abundant ions detected by the PTR-MS. In late winter/early spring (DOY 45–80) the VOC response was stable at around 3 ppbv and 0.02 ppbv s−1 for all compounds. DOY 80 onwards saw a more pronounced response to ozonolysis, with a rapid rise in the peak height of acetone/propanal ( 59), alongside a more gradual rise in peak height of 69 and acetaldehyde ( 45) (Fig. 2A). This period saw rises of 65 %, 136 % and 348 % in peak heights of 45, 59 and 69, respectively, compared to the weeks preceding DOY 80. Peak gradients of 69 and 59 significantly increased over this period, from around 0.02 ppbv s−1 on DOY 85 to > 0.10 ppbv s−1 on DOY 120, with a less pronounced response for 45.
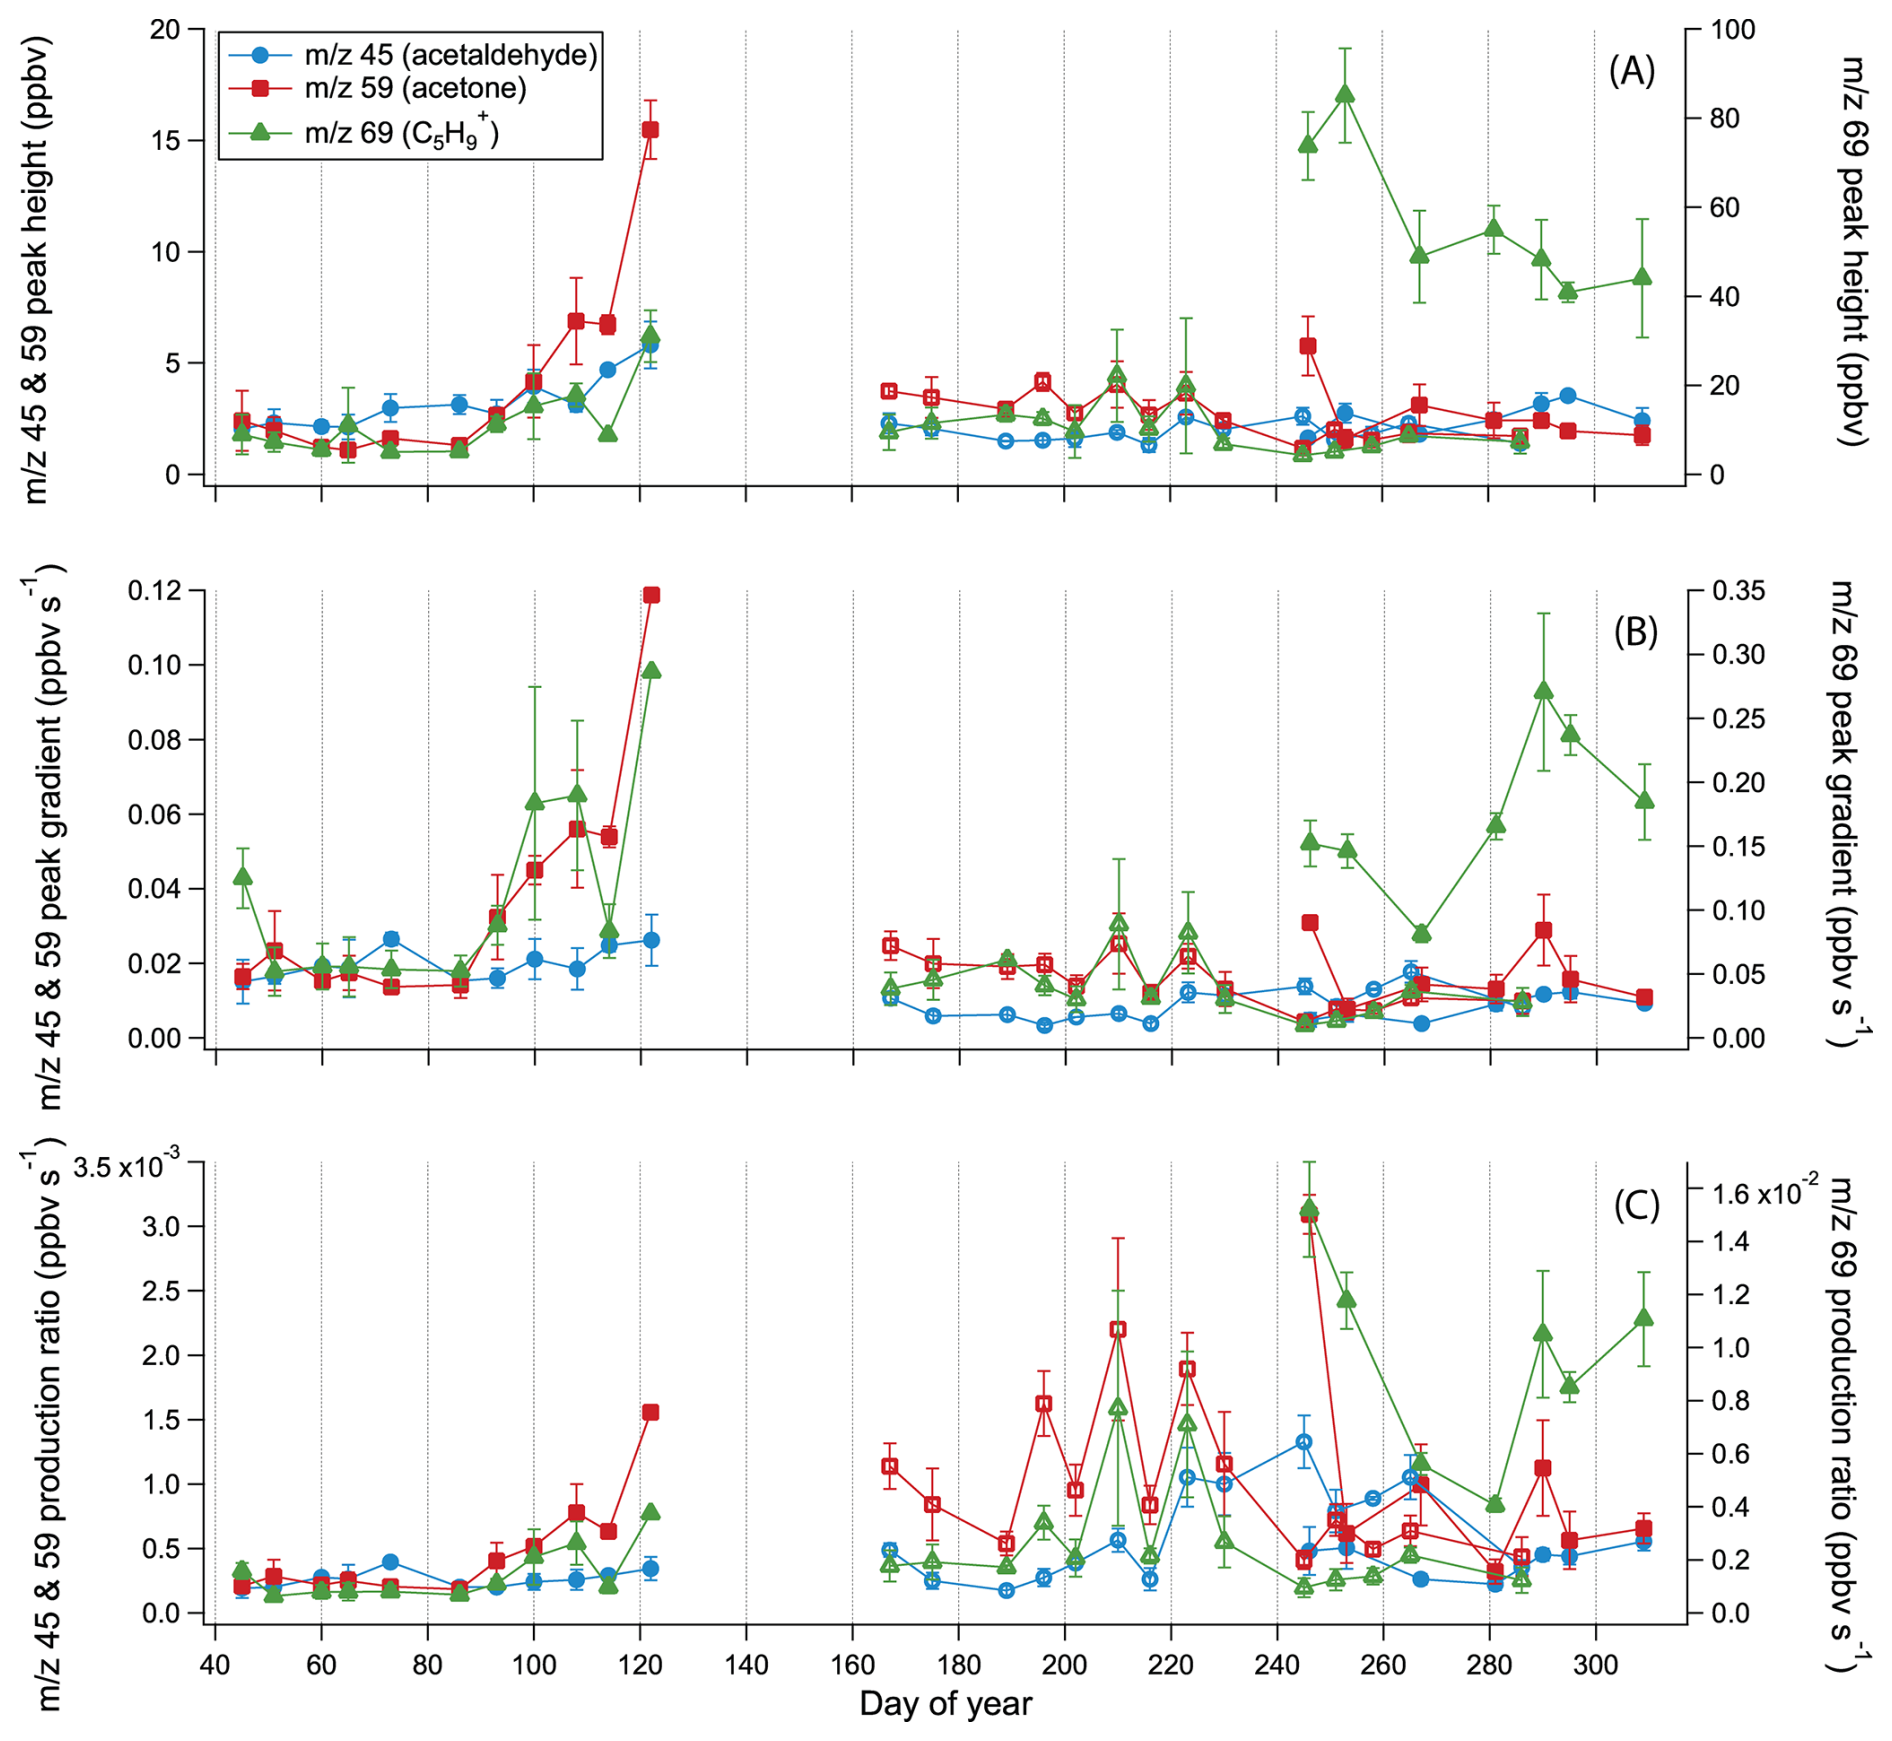
Figure 2Peak height (ppbv, ±1 SD) (A), peak gradient (ppbv s−1, ±1 SD) (B) and production ratio (C) across a virtual seasonal cycle (combining data from 2017, 2018 and 2020) for 45 (acetaldehyde, blue), 59 (acetone/propanal, red) and 69 (C5H, green), following ozonolysis of natural seawater from station L4 in the Western English Channel.
As the ozone input mixing ratio used during these experiments varied between 1 and 8 ppm, we normalized the measured VOC production to the ozone input. To do so, we start with the mass balance equation for the VOCs in the headspace:
where CVOC represents headspace VOC mixing ratio, P(VOC) represents the net production of VOC, Vair represents headspace volume and F(air) represents gas flow rate.
As the peak height gradient () is maximum in the first few seconds, when CVOC is still minimal, the Fair CVOC term (Eq. 1, second term RHS) is initially small and insignificant. Removing this term leads to a simplification of PVOC:
The ozone (O3) input (deposition, ) can be computed as:
where and represent ozone input (from the generator) and in the headspace respectively. In the first few minutes of oxidation, all ozone added to the sample is reacted and so can be assumed to be zero. The dimensionless VOC production ratio (ratio of VOC produced for a given ozone input; Fig. 2C) is calculated by dividing Eq. (2) by the approximation of Eq. (3):
Figure 3 shows the decadal averages of key oceanographic parameters at this station in weekly bins (Fig. 3a: Temperature, Fig. 3b: Salinity, Fig. 3c: Chlorophyll, Fig. 3d: Total eukaryotes, Fig. 3e: Total heterotrophic nanoflagellates and bacteria), overlaid with measurements relating to the period of this study. The site is characterised by typical temperate shelf seas dynamics, with a seasonal temperature range of 8 to 16 °C, and a large seasonal chlorophyll cycle. The L4 site is close enough to the coast to be regularly influenced by the River Tamar's freshwater plume, resulting in an average salinity of ∼ 35.0 punctuated by small dips in salinity caused by the river outflow. The period of change in VOC production from DOY 80–120 coincided with the onset of the spring bloom at station L4, with rapid rises in chlorophyll a between DOY 80–90, and a rapid rise in abundance of eukaryotes (Fig. 3c–d). This infers that the rise in abundance of phytoplankton results in the increased availability of key VOC precursors.
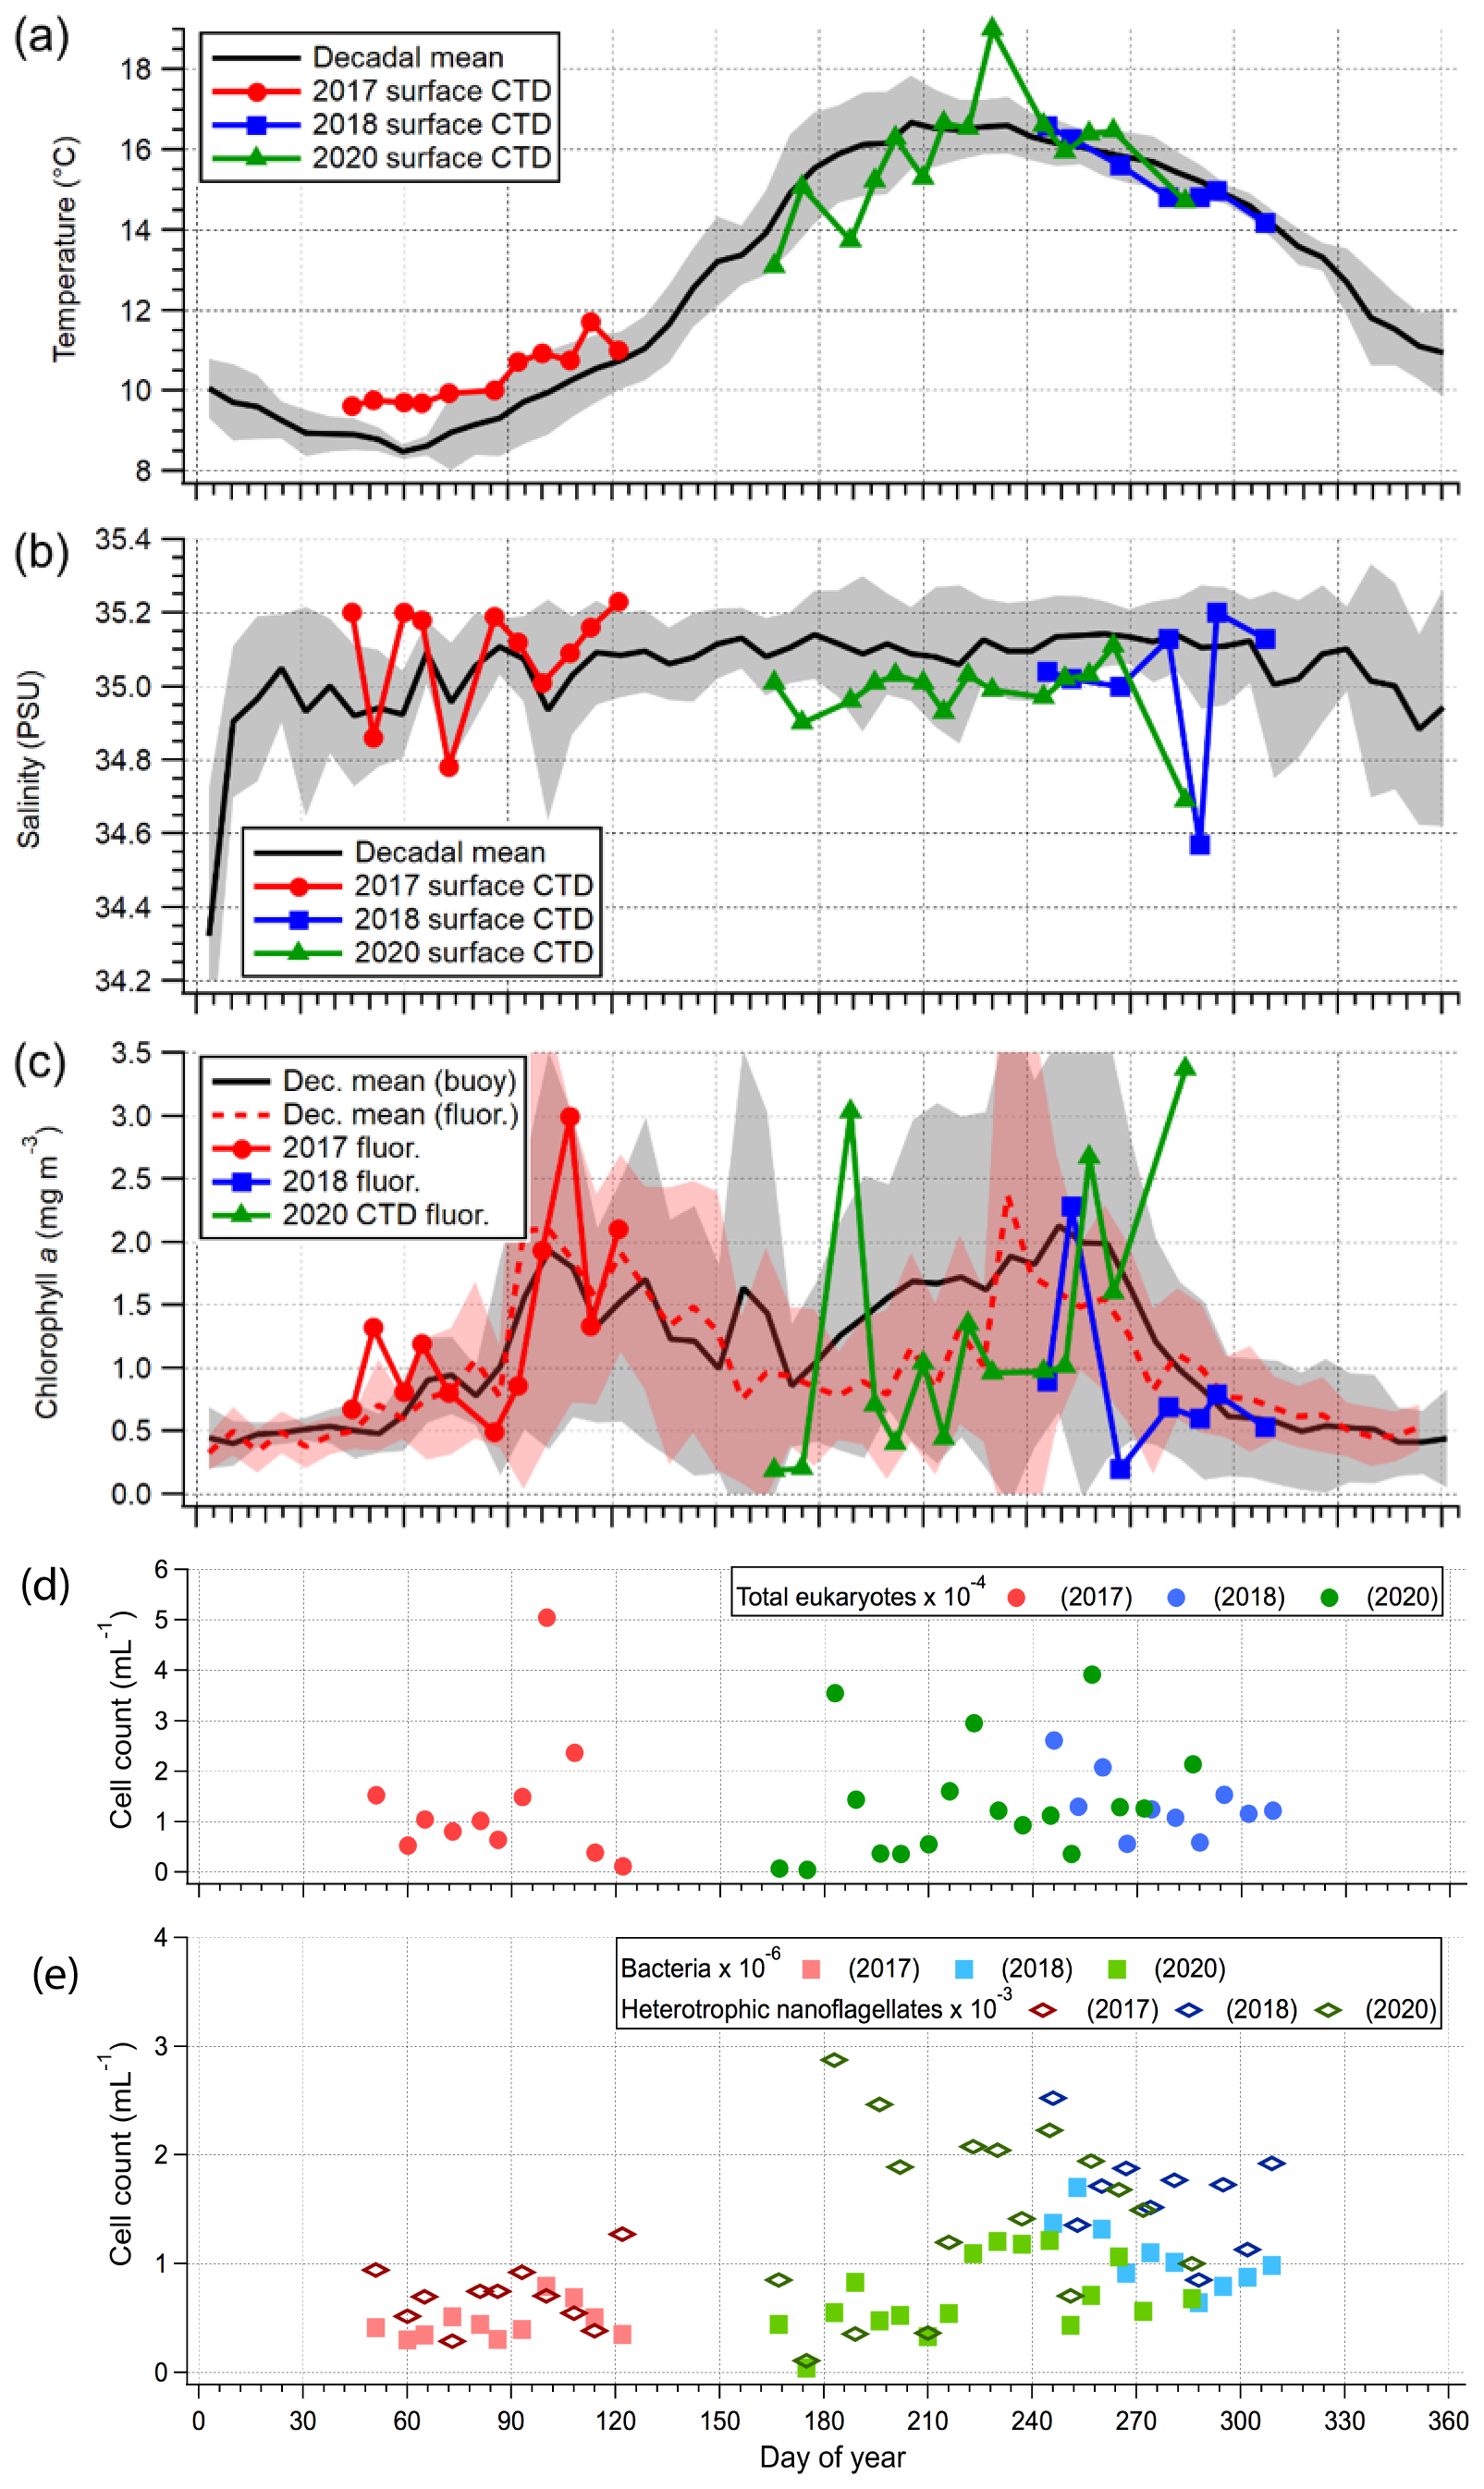
Figure 3Decadal averages (2009–2019) of surface (a) temperature and (b) salinity from the RV Plymouth Quest CTD at L4, (c) chlorophyll a concentration from the L4 buoy, laboratory fluorescence measurements (2017 and 2018) and CTD fluorescence measurements (2020), (d) abundance (cells mL−1) of total eukaryotes and (e) abundance (cells mL−1) of heterotrophic nanoflagellates and bacteria in L4 seawater. Shaded regions for the decadal averages, where available, are 1σ.
Following the initial spring bloom, chlorophyll a remains > 1.0 mg m−3 (compared to < 0.5 mg m−3 in winter months), with the temporal dynamics reflecting a succession of blooms of different groups of plankton, followed by a further autumn peak (DOY 260), characterised by an annual maximum in chlorophyll a concentrations (Fig. 3c–e) (Smyth et al., 2010). The variable VOC production ratios during the period DOY 165–250 is likely reflective of the impact of this highly biodynamic environment on VOC precursors. The production ratios of 59 and 69 were markedly variable and on average significantly higher (452 % and 155 %, respectively) than the late winter period (before DOY 80). The 45 production ratio was relatively low during the early summer period (DOY 165–220) but rose by almost 300 % during later summer (DOY 220–250).
The late autumn bloom (DOY 250–280) is a period of high productivity at L4 (Fig. 3), characterised by an order of magnitude increase in production yields of 69 with a mean of 95.3 ± 38.0 compared to 8.8 ± 3.5 during later winter, and less marked but significant increases in production of 45 and 59 (216 % and 208 %, respectively). The highly elevated production of 69 continued beyond the end of the autumn bloom, even as chlorophyll a concentration dropped back down to ∼ 0.5 mg m−3 (Fig. 3c). Elevated DOC concentrations in autumn have previously been observed in the nearby Celtic Sea (Carr et al., 2019), and our observations may indicate the presence of residual DOC remaining in surface waters following the period of high autumn productivity. During this latter part of the growth season, the abundance of heterotrophic nanoflagellates and bacteria also reached their highest levels (Fig. 3e), implying a regime dominated by grazing, senescence and decay, conducive to the production of DOC (Lønborg et al., 2020). Despite broadly similar temporal trends, no significant relationships were detected between VOC production ratios and concurrent chlorophyll-a or microbial abundance (r2 < 0.3), indicating that precursor composition rather than bulk biological abundance is a key control on VOC production.
The VOC production ratios presented here are normalised to total ozone input and therefore implicitly include ozone consumption by competing seawater reactants. Recent observations from a trans-Atlantic study indicate that iodide contributes, on average, approximately half of ozone reactivity in temperate waters (Yang et al., 2025). Consequently, the reported production ratios should be interpreted as an effective VOC production efficiency per mole of ozone lost from the system, rather than yields based solely on the fraction of ozone reacting with DOM. To demonstrate this, we performed experiments with the same bubble-column system (see Supplement, Fig. S3) showing that increasing iodide concentration reduced 45 (acetaldehyde) and 59 (acetone) production ratios, consistent with competition between iodide and DOM for available ozone.
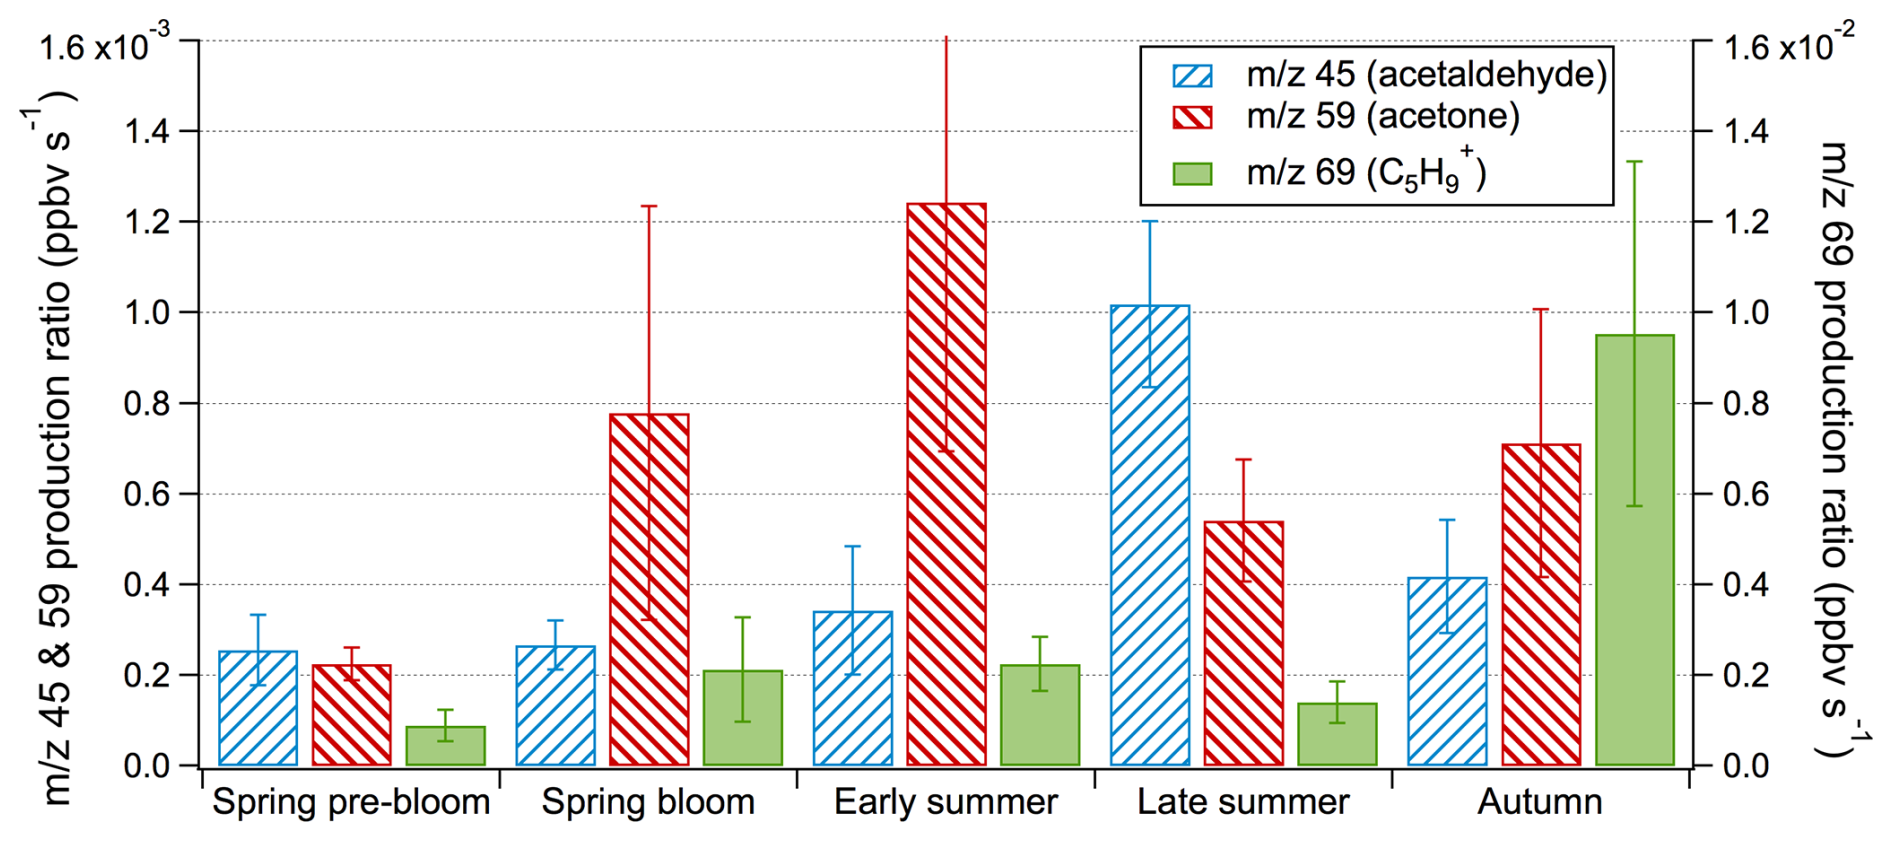
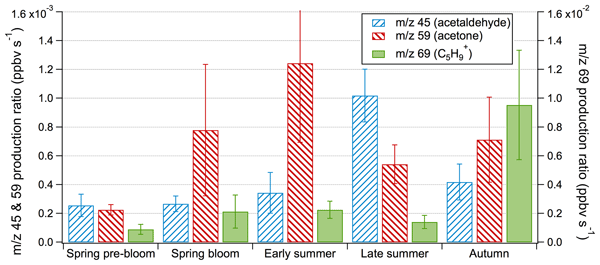
Figure 4Seasonal comparison of VOC ( 45 (acetaldehyde), 59 (acetone), 69 (C5H)) production ratio (±1 SD) from heterogeneous oxidation of natural surface seawater from station L4 in the Western English Channel.
The seasonal data is summarised in Fig. 4, allowing comparison of the production ratios for each species during each season. 59 production is associated with the spring bloom and early summer – a period of vigorous phytoplankton growth. 45 production peaks in the late summer, coincident with shifts in plankton community structure, and as discussed above. 69 production dominates the autumn signal, showing some relationship with the abundance of grazers and bacteria. The seasonal trends we observed in VOC production imply different precursors and/or production pathways for these different compounds, which may reflect: (i) the seasonal succession of the phytoplankton community (Fig. 3c–e), (ii) the shifting abundance of organisms grazing on phytoplankton which alters DOC concentrations (e.g. heterotrophic nanoflagellates, Fig. 3e), (iii) the community structure and activity of the microbial community which may alter the availability or characteristics of VOC precursors (bacteria abundance shown in Fig. 3e), (iv) chemical processing/photooxidation of organic matter over the course of the summer months.
The suite of VOC products observed in the present experiments is generally consistent with compounds previously reported during ozonolysis of seawater and sea-surface microlayer samples. Wang et al. (2023) also observed the formation of acetaldehyde ( 45) and acetone/propanal ( 59), as well as hexanal, heptanal, octanal and nonanal during ozone-driven reactions with sea-surface microlayer samples collected from the South China Sea, while Schneider et al. (2024) reported acetaldehyde ( 45) and acetone/propanal ( 59) production from the oxidation of Arctic seawater and sea-surface microlayer samples. Kilgour et al. (2024) focused primarily on total VOC production and did not identify acetaldehyde or acetone/propanal as major products in experiments with coastal seawater. These studies did not consider the role of seasonality in influencing the influence of ozonolysis on VOC production.
Table 1Mean VOC production ratio from the ozone heterogeneous oxidation of WCO L4 seawater. “All data” is the average of the entire seasonal study.

Quantitative comparison between studies is complicated by substantial methodological differences. The flow-reactor studies employed by Wang et al. (2023), Schneider et al. (2024) and Kilgour et al. (2024) preferentially isolate chemistry occurring within a stable surface film, whilst the bubble-column approach generates a continuously renewed gas-water interface through bubble entrainment. The production ratios measured in the present study (acetaldehyde: 0.026–0.102; acetone/propanal: 0.023–0.124; 0.08–0.0095 for 69 (see Table 1) for summary) are lower than the laboratory total VOC yields reported by Kilgour et al. (2024) (0.43–0.62) but overlap with their field-derived estimates (0.04–0.06). This closer agreement with the field-derived estimates of Kilgour et al. (2024) may indicate that bubble-column approach better captures VOC production under naturally turbulent ocean conditions. In addition, the production ratios reported here are normalised to total ozone uptake and therefore include ozone consumption by competing pathways that do not generate the VOCs measured in this study.
3.2 Assessing potential VOC precursors in laboratory ozonolysis experiments
Our experiments above clearly demonstrate that reactions between ozone and natural seawater lead to production of VOCs, consistent with other recent work (Schneider et al., 2019, 2024; Kilgour et al., 2024). In this section, we explore potential biological VOC precursors through the addition of specific reactants to aged seawater in the experimental bubble column. Initially, additions of increasing volumes of senescent axenic algal culture (Emiliania huxleyi) showed increasing VOC peak height and production ratio (Fig. 5). Peak height of 59 and 45 were similar in magnitude to measurements with natural seawater, with the maximum addition of culture yielding similar peak heights to those observed during the spring bloom. This indicates that the DOM released from phytoplankton (in this case E. huxleyi) contains key VOC precursors to produce these compounds. Interestingly, 69 was produced at much lower levels here relative to experiments with natural seawater, which may indicate that the full range of precursors necessary for VOC production may be dependent on natural processing of water such as bacterial metabolism of DOM, which would have been minimized under axenic culture conditions. Given the highly complex composition and spatio-temporal variability of marine DOM, a commercially certified standard is not available. We thus used a standardised Suwannee River nominal organic matter (NOM) (International Humic Substances Society) as a proxy. Additions of increasing amounts of NOM to aged seawater using a relatively high ozone input of ∼ 9 ppmv resulted in substantial ozone uptake (qualitatively similar to Martino et al., 2012) but negligible production of VOCs monitored here – evidence that unsaturated terrestrial/riverine DOM is not fully representative of VOC precursors found in surface seawater (Yang et al., 2025).

Figure 5Peak height (A) and production ratio (B) for 45 (acetaldehyde), 59 (acetone) and 69 (C5H) following ozone heterogeneous oxidation of aged seawater with the addition of diluted, senescent Emiliania huxleyi culture. The uncertainty on peak heights is approximately 0.07, 0.06 and 0.09 ppb for 59, 69 and 45, respectively.
This study demonstrates that ozone-driven production of VOCs from natural surface seawater exhibits strong seasonal variability, closely tied to biological activity. VOC production, particularly for compounds detected at 45, 59, and 69, (acetaldehyde, acetone/propanal and C5H) increased markedly during periods of phytoplankton growth and bloom succession, with the highest yields observed during the autumn bloom and subsequent periods dominated by microbial remineralization. These findings indicate that phytoplankton dynamics, microbial community structure, and DOC composition are key controls on the availability of ozone-reactive precursors in the surface ocean, and aligns with recent observations of a relationship between surface ocean biological proxies (chlorophyll a and CDOM) and ozone uptake across the Atlantic Ocean (Yang et al., 2025).
Our experimental results using specific potential precursors further support this conclusion. While the addition of axenic algal cultures (e.g., Emiliania huxleyi) enhanced VOC production – especially for acetaldehyde and acetone/propanal – the lack of 69 production implies the importance of microbial processing or community-derived DOM in the natural environment.
Overall, our findings support the hypothesis that ozone-seawater interactions contribute to seasonal variations in marine VOC emissions. This underlines the need for future work to better constrain the role of biological precursors, characterize the reactivity of a broader suite of DOM compounds, and assess the relative importance of different oceanic interfaces (e.g., SML vs. whitecaps) in VOC production. Better integration of satellite-derived proxies (e.g., Chlorophyll a, CDOM) and in situ biological observations with VOC measurements may also enable upscaling of these processes on large scales and over seasons.
The data used in Fig. 3 were obtained from the Western Channel Observatory (WCO), a long-term marine monitoring programme operated by the Plymouth Marine Laboratory. All WCO datasets are publicly available and can be accessed through the WCO data portal at: https://www.westernchannelobservatory.org.uk (last access: 4 November 2026). All other data presented in this paper are shown in Tables S5–S10 in the Supplement.
The supplement related to this article is available online at https://doi.org/10.5194/acp-26-15583-2026-supplement.
FEH and MY designed the experimental setup, and experiments were carried out by YC and DPP. YC and DPP performed the data analysis. FEH prepared the manuscript with contributions from all co-authors.
The contact author has declared that none of the authors has any competing interests.
Publisher's note: Copernicus Publications remains neutral with regard to jurisdictional claims made in the text, published maps, institutional affiliations, or any other geographical representation in this paper. The authors bear the ultimate responsibility for providing appropriate place names. Views expressed in the text are those of the authors and do not necessarily reflect the views of the publisher.
We gratefully acknowledge Philip Nightingale for his valuable insights and constructive discussions throughout this work and thank Claire Reeves and Parvadha Suntharalingam for their guidance and supervision of Daniel Philips during his PhD studies.
We would like to thank the support from the crew and scientific sampling team of the Plymouth Quest for their support in the collection of water samples for the seasonal study at station L4, funded by the UK Natural Environment Research Council (NERC) through its National Capability Long-term Single Centre Science Programme, Climate Linked Atlantic Sector Science, grant number NE/R015953/1. PL was lead supervisor for DPP's EnvEast DTP Grant (NE/L002582/1). This work contributes to the ACSIS (NE/N018044/1) and COCO-VOC (NE/Z000335/1) projects, which supported MY and FH.
This research has been supported by the Natural Environment Research Council (grant nos. NE/N018044/1, NE/R015953/1, and NE/Z000335/1).
This paper was edited by Quanfu He and reviewed by three anonymous referees.
Ahlberg, E., Falk, J., Eriksson, A., Holst, T., Brune, W. H., Kristensson, A., Roldin, P., and Svenningsson, B.: Secondary organic aerosol from VOC mixtures in an oxidation flow reactor, Atmos. Environ., 161, 210–220, https://doi.org/10.1016/j.atmosenv.2017.05.005, 2017.
Bloss, W. J., Evans, M. J., Lee, J. D., Sommariva, R., Heard, D. E., and Pilling, M. J.: The oxidative capacity of the troposphere: Coupling of field measurements of OH and a global chemistry transport model, Faraday Discuss., 130, 425–436, https://doi.org/10.1039/B419090D, 2005.
Brüggemann, M., Hayeck, N., Bonnineau, C., Pesce, S., Alpert, P. A., Perrier, S., Zuth, C., Hoffmann, T., Chen, J., and George, C.: Interfacial photochemistry of biogenic surfactants: A major source of abiotic volatile organic compounds, Faraday Discuss., 200, 59–74, https://doi.org/10.1039/C7FD00022G, 2017.
Carpenter, L. J., Archer, S. D., and Beale, R.: Ocean–atmosphere trace gas exchange, Chem. Soc. Rev., 41, 6473–6506, https://doi.org/10.1039/C2CS35121H, 2012.
Carr, N., Davis, C. E., Blackbird, S., Daniels, L. R., Preece, C., Woodward, M., and Mahaffey, C.: Seasonal and spatial variability in the optical characteristics of DOM in a temperate shelf sea, Prog. Oceanogr., 177, 101929, https://doi.org/10.1016/j.pocean.2018.02.022, 2019.
Chang, W., Heikes, B. G., and Lee, M.: Ozone deposition to the sea surface: Chemical enhancement and wind speed dependence, Atmos. Environ., 38, 1053–1059, https://doi.org/10.1016/j.atmosenv.2003.10.047, 2004.
Finlayson-Pitts, B. J. and Pitts, J. N.: Atmospheric chemistry of tropospheric ozone formation: Scientific and regulatory implications, Air Waste, 43, 1091–1100, https://doi.org/10.1080/1073161X.1993.10467187, 1993.
Halsey, K. H. and Giovannoni, S. J.: Biological controls on marine volatile organic compound emissions: A balancing act at the sea–air interface, Earth-Sci. Rev., 240, 104360, https://doi.org/10.1016/j.earscirev.2023.104360, 2023.
Kiene, R. P. and Bates, T. S.: Biological removal of dimethyl sulphide from sea water, Nature, 345, 702–705, https://doi.org/10.1038/345702a0, 1990.
Kilgour, D. B., Novak, G. A., Claflin, M. S., Lerner, B. M., and Bertram, T. H.: Production of oxygenated volatile organic compounds from the ozonolysis of coastal seawater, Atmos. Chem. Phys., 24, 3729–3742, https://doi.org/10.5194/acp-24-3729-2024, 2024.
Kim, M. J., Novak, G. A., Zoerb, M. C., Yang, M., Blomquist, B. W., Huebert, B. J., Cappa, C. D., and Bertram, T. H.: Air–sea exchange of biogenic volatile organic compounds and the impact on aerosol particle size distributions, Geophys. Res. Lett., 44, 3887–3896, https://doi.org/10.1002/2017GL072975, 2017.
Kirkby, J., Duplissy, J., Sengupta, K., Frege, C., Gordon, H., Williamson, C., Heinritzi, M., Simon, M., Yan, C., Almeida, J., and Tröstl, J.: Ion-induced nucleation of pure biogenic particles, Nature, 533, 521–526, https://doi.org/10.1038/nature17953, 2016.
Lambe, A. T., Chhabra, P. S., Onasch, T. B., Brune, W. H., Hunter, J. F., Kroll, J. H., Cummings, M. J., Brogan, J. F., Parmar, Y., Worsnop, D. R., Kolb, C. E., and Davidovits, P.: Effect of oxidant concentration, exposure time, and seed particles on secondary organic aerosol chemical composition and yield, Atmos. Chem. Phys., 15, 3063–3075, https://doi.org/10.5194/acp-15-3063-2015, 2015.
Lønborg, C., Carreira, C., Jickells, T., and Álvarez-Salgado, X. A.: Impacts of global change on ocean dissolved organic carbon (DOC) cycling, Front. Mar. Sci., 7, 466, https://doi.org/10.3389/fmars.2020.00466, 2020.
Martino, M., Lézé, B., Baker, A. R., and Liss, P. S.: Chemical controls on ozone deposition to water, Geophys. Res. Lett., 39, L05807, https://doi.org/10.1029/2012GL051172, 2012.
McCoy, D. T., Burrows, S. M., Wood, R., Grosvenor, D. P., Elliott, S. M., Ma, P.-L., Rasch, P. J., and Hartmann, D. L.: Natural aerosols explain seasonal and spatial patterns of Southern Ocean cloud albedo, Sci. Adv., 1, e1500157, https://doi.org/10.1126/sciadv.1500157, 2015.
McGenity, T. J., Crombie, A. T., and Murrell, J. C.: Microbial cycling of isoprene, the most abundantly produced biological volatile organic compound on Earth, ISME J., 12, 931–941, https://doi.org/10.1038/s41396-018-0072-6, 2018.
Moore, A. N., Cancelada, L., Ke'La, A., and Prather, K. A.: Secondary aerosol formation from mixtures of marine volatile organic compounds in a potential aerosol mass oxidative flow reactor, Environ. Sci.: Atmos., 4, 351–361, https://doi.org/10.1039/d3ea00169e, 2024.
Mungall, E. L., Abbatt, J. P. D., Wentzell, J. J. B., Lee, A. K. Y., Thomas, J. L., Blais, M., Gosselin, M., Miller, L. A., Papakyriakou, T., and Willis, M. D.: Microlayer source of oxygenated volatile organic compounds in the summertime marine Arctic boundary layer, P. Natl. Acad. Sci. USA, 114, 6203–6208, https://doi.org/10.1073/pnas.1620571114, 2017.
Novak, G. A. and Bertram, T. H.: Reactive VOC production from photochemical and heterogeneous reactions occurring at the air–ocean interface, Acc. Chem. Res., 53, 1014–1023, https://doi.org/10.1021/acs.accounts.9b00038, 2020.
Phillips, D. P., Hopkins, F. E., Bell, T. G., Liss, P. S., Nightingale, P. D., Reeves, C. E., Wohl, C., and Yang, M.: Air–sea exchange of acetone, acetaldehyde, DMS and isoprene at a UK coastal site, Atmos. Chem. Phys., 21, 10111–10132, https://doi.org/10.5194/acp-21-10111-2021, 2021.
Rocco, M., Dunne, E. M., Peltola, M., Barr, N., Williams, J., Colomb, A., Safi, K., Saint-Macary, A., Marriner, A., and Deppeler, S.: Oceanic phytoplankton are a potentially important source of benzenoids to the remote marine atmosphere, Commun. Earth Environ., 2, 175, https://doi.org/10.1038/s43247-021-00253-0, 2021.
Schneider, S. R., Collins, D. B., Lim, C. Y., Zhu, L., and Abbatt, J. P. D.: Formation of secondary organic aerosol from the heterogeneous oxidation by ozone of a phytoplankton culture, ACS Earth Space Chem., 3, 2298–2306, https://doi.org/10.1021/acsearthspacechem.9b00213, 2019.
Schneider, S. R., Collins, D. B., Boyer, M., Chang, R. Y.-W., Gosselin, M., Irish, V. E., Miller, L. A., and Abbatt, J. P. D.: Abiotic emission of volatile organic compounds from the ocean surface: Relationship to seawater composition, ACS Earth Space Chem., https://doi.org/10.1021/acsearthspacechem.4c00163, 2024.
Smyth, T. J., Fishwick, J. R., Al-Moosawi, L., Cummings, D. G., Harris, C., Kitidis, V., Rees, A. P., Martinez-Vicente, V., and Woodward, E. M. S.: A broad spatio-temporal view of the Western English Channel observatory, J. Plankton Res., 32, 585–601, https://doi.org/10.1093/plankt/fbp128, 2010.
Thames, A. B., Brune, W. H., Miller, D. O., Allen, H. M., Apel, E. C., Blake, D. R., Bui, T. P., Commane, R., Crounse, J. D., Daube, B. C., Diskin, G. S., DiGangi, J. P., Elkins, J. W., Hall, S. R., Hanisco, T. F., Hannun, R. A., Hintsa, E., Hornbrook, R. S., Kim, M. J., McKain, K., Moore, F. L., Nicely, J. M., Peischl, J., Ryerson, T. B., St. Clair, J. M., Sweeney, C., Teng, A., Thompson, C. R., Ullmann, K., Wennberg, P. O., and Wolfe, G. M.: Missing OH reactivity in the global marine boundary layer, Atmos. Chem. Phys., 20, 4013–4029, https://doi.org/10.5194/acp-20-4013-2020, 2020.
Wang, Y., Zeng, J., Wu, B., Song, W., Hu, W., Liu, J., Yang, Y., Yu, Z., Wang, X., and Gligorovski, S.: Production of volatile organic compounds by ozone oxidation chemistry at the South China Sea surface microlayer, ACS Earth Space Chem., 7, 1306–1313, https://doi.org/10.1021/acsearthspacechem.3c00102, 2023.
Wohl, C., Capelle, D., Jones, A., Sturges, W. T., Nightingale, P. D., Else, B. G. T., and Yang, M.: Segmented flow coil equilibrator coupled to a proton-transfer-reaction mass spectrometer for measurements of a broad range of volatile organic compounds in seawater, Ocean Sci., 15, 925–940, https://doi.org/10.5194/os-15-925-2019, 2019.
Wohl, C., Güell-Bujons, Q., Castillo, Y. M., Calbet, A., and Simó, R.: Volatile organic compounds released by Oxyrrhis marina grazing on Isochrysis galbana, Oceans, 4, 535–548, https://doi.org/10.3390/oceans4020011, 2023.
Wurl, O., Wurl, E., Miller, L., Johnson, K., and Vagle, S.: Formation and global distribution of sea-surface microlayers, Biogeosciences, 8, 121–135, https://doi.org/10.5194/bg-8-121-2011, 2011.
Xu, F., Hu, K., Lu, S.-H., Guo, S., Wu, Y.-C., Xie, Y., Zhang, H.-H., and Hu, M.: Enhanced marine VOC emissions driven by terrestrial nutrient inputs and their impact on urban air quality in coastal regions, Environ. Sci. Technol., 59, 8140–8154, https://doi.org/10.1021/acs.est.4c12655, 2025.
Yang, M., Phillips, D. P., Hopkins, F. E., Liss, P. S., Suntharalingam, P., Carpenter, L. J., Chance, R., Brown, L. V., Stapleton, C. G., and Jones, M. R.: Marine biogeochemical control on ozone deposition over the ocean, Geophys. Res. Lett., 52, e2024GL113187, https://doi.org/10.1029/2024GL113187, 2025.
Zhou, S., Gonzalez, L., Leithead, A., Finewax, Z., Thalman, R., Vlasenko, A., Vagle, S., Miller, L. A., Li, S.-M., Bureekul, S., Furutani, H., Uematsu, M., Volkamer, R., and Abbatt, J.: Formation of gas-phase carbonyls from heterogeneous oxidation of polyunsaturated fatty acids at the air–water interface and of the sea surface microlayer, Atmos. Chem. Phys., 14, 1371–1384, https://doi.org/10.5194/acp-14-1371-2014, 2014.
Zhou, X. and Mopper, K.: Photochemical production of low-molecular-weight carbonyl compounds in seawater and surface microlayer and their air–sea exchange, Mar. Chem., 56, 201–213, https://doi.org/10.1016/S0304-4203(96)00076-X, 1997.