
the Creative Commons Attribution 4.0 License.
the Creative Commons Attribution 4.0 License.
 | 04 Nov 2026
Impacts of synoptic circulation types on nocturnal ozone increase in the North China Plain: meteorological drivers and physical mechanisms
Huanpeng Wang

Xuejiao Deng
Haomin Huang
Daiqi Ye
Nocturnal ozone (O3) increase (NOI) has become common worldwide, raising the risk of O3 pollution. While weather types serve as critical drivers of NOI, their specific dynamic influences remain poorly understood. Using ground observations and reanalysis datasets, this study identified the relationship between weather types and NOI days in a representative city in the North China Plain, and revealed the meteorological characteristics and physical mechanisms driving these events. During 2021–2023, 370–444 NOI days were observed, with the occurrence predominantly concentrated between 00:00 and 06:00 local time (69.53 %). After screening, a total of 171 representative NOI days were finally identified to characterize the overall occurrence of local NOI events. Based on the Lamb-Jenkinson method, the representative NOI days were classified into four primary weather types: A-type (57.89 %), S-type (19.88 %), WNE-type (14.04 %), and C-type (8.19 %). A-type was dominated by high-pressure anticyclones with calm conditions, whereas C-type was controlled by low-pressure systems and influenced by moist airflows. S-type was located in the transition zone between high and low pressure, influenced by southern geostrophic winds, and WNE-type was characterized by high-pressure systems with W-N-E geostrophic flows. Distinct mechanical triggers for NOI were further resolved for different types: A-type is dominated by high-pressure subsidence; C-type is driven by cold-pool downdrafts and convective motions; whereas both S-type and WNE-type are primarily controlled by synoptically-driven intense wind shear. This study elucidates the diverse dynamical pathways of weather-driven NOI, providing mechanistic insights for improving O3 forecasting and mitigation strategies in urban environments.
- Article
(15621 KB) - Full-text XML
-
Supplement
(2798 KB) - BibTeX
- EndNote


Surface ozone (O3), a typical secondary pollutant, poses significant risks to human health due to its strong oxidative properties (Paoletti, 2009; Monks et al., 2009). Excessive O3 can lead to increased incidence and mortality rates of asthma, cardiovascular and respiratory diseases (Liu et al., 2023; Cheng et al., 2022; Gilardi et al., 2023; Zhao et al., 2022). Formed primarily through photochemical reactions of volatile organic compounds (VOCs) and nitrogen oxides (NOx) under sunlight (Li et al., 2022b, a; Wang et al., 2023a), O3 typically peaks during the daytime and declines at night due to deposition and NOx titration (Li et al., 2022b; Shen et al., 2024; He et al., 2021; Zhu et al., 2020). In China, despite successful reductions in particulate matter (PM) since the 2013 Air Pollution Prevention and Control Action Plan, O3 pollution has intensified, particularly in the North China Plain (NCP) (Shen et al., 2024; Xu et al., 2021; Dong et al., 2020; Song et al., 2022). Meanwhile, recent observations in the NCP have revealed an unexpected phenomenon of nocturnal O3 increase (NOI) (He et al., 2021; Zhu et al., 2020).
NOI events, characterized by unexpected rises in nighttime O3 concentrations (at least 10 µg m−3 h−1 (Zhu et al., 2020)), challenge the conventional understanding of O3 (Wang et al., 2023b; Xue et al., 2023; Chen et al., 2024b). Although a quantitative threshold of a 10 µg m−3 hourly increase may appear modest during a clean night, the scientific and environmental significance of NOI episodes extends far beyond simple numerical detection. First, NOI events can occasionally result in a rapid surge in nighttime O3 levels surpassing 160 µg m−3 (Wang et al., 2023c; Zhu et al., 2024), directly posing nocturnal threats to human health and plant stomatal uptake (Chowdhury et al., 2022; Hoshika et al., 2019). More critically, even when absolute concentrations remain moderate, the horizontal or vertical transport of O3-rich air that typically triggers NOI significantly elevates the surface O3 baseline for the following morning. This higher initial baseline accelerates daytime accumulation, effectively exacerbating subsequent daytime photochemical smog (Wang et al., 2025). Furthermore, unexpected nighttime O3 increments fundamentally alter the nocturnal atmospheric oxidative capacity (AOC). The enhanced O3 facilitates dark reactions with nitrogen dioxide (NO2) to generate nitrate radicals (NO3) and dinitrogen pentoxide (N2O5), critical precursors for particulate nitrate and secondary organic aerosols (SOA), thereby linking NOI directly to regional fine particulate matter (PM2.5) pollution (Wang et al., 2023b). NOI events, usually driven by horizontal and vertical transport processes, are linked to meteorological phenomena such as sea-land winds (Nair et al., 2002), valley winds (Sánchez et al., 2005; Xue et al., 2023), low-level jets and convective storms (Zhu et al., 2020; Wu et al., 2023).
Apart from emissions of O3 precursors, meteorological conditions play a crucial role in O3 formation (Dong et al., 2020). Weather conditions of high temperature, low humidity, and strong solar radiation are conducive to the photochemical generation of O3 (Liang et al., 2022; Chen et al., 2024b). The environment of low wind speed and high-pressure often leads to stagnant weather conditions, resulting in localized O3 accumulation (Liu et al., 2025). These weather conditions are largely determined by local synoptic circulation types (Xu et al., 2021; Song et al., 2022; Chen et al., 2024b; Li et al., 2023). For example, Shen et al. (2024) found that persistent O3 pollution events over Wuxi from 2014 to 2021 were primarily associated with subtropical high-pressure and weak pressure systems, characterized by dry and hot local weather conditions. Ji et al. (2023) reported that high O3 concentrations in southeastern coastal areas of China from 2015 to 2020 were mainly linked to high-pressure anticyclonic activity, which frequently occurs in spring. You et al. (2024) observed that O3 pollution in the Pearl River Delta region during autumn from 2015 to 2021 was often influenced by the Siberian high-pressure system, with significant cross-regional transport from the northeast. However, while the synoptic and meteorological drivers of daytime photochemical O3 are well-established, their specific dynamic roles in governing nighttime NOI remain underexplored, particularly in rapidly urbanizing regions like the NCP.
Located in the southern NCP, Xinxiang is bordered by the Taihang Mountains to the north and the Yellow River to the south (Fig. S1a in the Supplement). As a densely populated urban center, Xinxiang features a typical temperate continental monsoon climate, characterized by hot, humid summers and cold, dry winters. Furthermore, serving as a major industrial and transportation hub, the city experiences intense anthropogenic emissions. As shown in Fig. S1b, the primary precursors for O3 (i.e., NOx and VOCs) predominantly originate from industrial facilities (e.g., chemical and manufacturing plants) that are densely distributed across the surrounding suburban areas, and intense vehicular exhaust along a highly interconnected network of major transportation arteries traversing the region. These multi-source regional emissions enclose the urban core, exerting a profound influence on the atmospheric chemistry at the four urban background stations (Fig. S1c). This unique topography, combined with these high baseline emissions and specific climatological conditions, makes Xinxiang a critical case study for understanding NOI. This study aims to bridge the gap between synoptic-scale drivers and local NOI occurrences. By integrating three-year (2021–2023) high-frequency observations with the Lamb-Jenkinson method, we (1) investigate the temporal variability characteristics of NOI, (2) identify the dominant synoptic circulation types conducive to NOI, and (3) unravel the distinct physical mechanisms that govern NOI under different weather types. These insights not only enhance our understanding of the nocturnal O3 budget but also provide a scientific basis for improving O3 forecasting and mitigation strategies in urban environments.
2.1 Data sources
Hourly ground observation data including O3 concentration, temperature, relative humidity, wind speed, wind direction, and precipitation were obtained from four national monitoring stations in Xinxiang (named Development Zone (KF), Environmental Protection East Hospital (DY), Environmental Protection West Court (XY), and Municipal Party School (DX), respectively). It is important to note that all four stations are officially classified as urban evaluation sites located within the urban areas of Xinxiang. In this study, these four stations were deliberately selected due to their strong spatial representativeness over the urban core and their high data completeness. Because these stations share a consistent urban typology, they experience highly comparable baseline chemical environments (e.g., similar baseline nitrogen monoxide (NO) titration sinks and anthropogenic precursor availability). This spatial consistency is a crucial methodological design: it effectively minimizes random micro-scale chemical biases and isolated emission noise. By strictly controlling for these localized chemical heterogeneities, we ensure that the concurrent NOI events captured by this network genuinely reflect the overarching regional synoptic forcing and its subsequent, synchronized mechanical disruption of the local boundary layer, rather than random chemical artifacts. Detailed station information is provided in Fig. S1c. Sea level pressure (SLP) data and 17-layer vertical profiles (500–1000 hPa) of vorticity, wind speed (WS), wind direction, temperature (T), relative humidity (RH) and O3 concentration were acquired from the Modern-Era Retrospective Analysis for Research and Applications dataset (MERRA-2, Version 2, with a spatial resolution of 0.5° × 0.625° and temporal resolutions of 1 h for surface data and 3 h for 3D vertical profiles) (https://disc.gsfc.nasa.gov/, last access: 3 December 2025). Specifically, the SLP data from MERRA-2 was used to perform the Lamb-Jenkinson synoptic weather classification. This dataset was constructed by NASA Global Modeling and Assimilation Office (GMAO) using the Goddard Earth Observing System (GEOS) assimilation model, and has been widely applied in weather typing studies worldwide (Zhang et al., 2022; Gelaro et al., 2017; Molod et al., 2015; Li et al., 2020). Additionally, specific humidity (850 hpa), planetary boundary layer height (PBLH), friction velocity (U*), and convective available potential energy (CAPE) were derived from the ERA5 reanalysis dataset (https://www.ecmwf.int/en/forecasts/dataset/ecmwf-reanalysis-v5, last access: 3 December 2025) (with a spatial resolution of 0.25° × 0.25° and an hourly temporal resolution) provided by the European Centre for Medium-Range Weather Forecasts (ECMWF), which offers superior boundary layer parameters (Hersbach et al., 2020; Bell et al., 2021). Throughout the subsequent calculations, MERRA-2 was consistently employed for the 1000 to 500 hPa vertical profiling, while ERA5 was dedicated to the specific 850 hPa humidity and boundary layer meteorological parameters (e.g., PBLH, U*, CAPE). Notably, the 850 hPa pressure level (approximately 1500 m above ground level) was specifically selected for the spatial wind field analysis. Because this altitude generally resides just above the planetary boundary layer, the airflow is largely free from localized surface friction and complex topographic disturbances. Consequently, it serves as the most representative level for identifying mesoscale horizontal advection, low-level jets, and regional synoptic transport pathways that drive O3 redistribution.
2.2 Definition of NOI events and NOI days
Specifically, an NOI event is flagged when a single monitoring station records an hourly O3 concentration increment exceeding 10 µg m−3 during nighttime (20:00–06:00 local time, LT; UTC+8, Beijing Time) (He et al., 2021; Zhu et al., 2020). This absolute increment threshold is widely adopted in current literature (Zhu et al., 2024, 2020; He et al., 2022; Wang et al., 2025) because it acts as an indicator for detecting the abrupt physical intrusion of O3-rich air masses into local surface. While the absolute baseline concentrations and temporal trajectories of O3 are crucial for evaluating human health exposure and long-term air quality attainment, the primary objective of this study is to isolate the underlying synoptic and meteorological transport mechanisms. Regardless of the initial surface baseline, a sudden hourly surge of > 10 µg m−3 effectively and consistently flags that sudden dynamic transport processes (whether via robust horizontal advection, massive vertical subsidence, or other regional intrusions) have completely overpowered the steady local nocturnal depletion (e.g., NO titration and dry deposition). Therefore, this increment-based metric provides the most robust and objective foundation for our dynamical and meteorological analysis.
Considering the seasonal variation in local sunrise time, we excluded NOI events occurring after 05:00 LT from April to September, when the sunrise occurs relatively early. Since nighttime generally lasts from 20:00 to 06:00 LT the next day, it constitutes a continuous process. Therefore, a day is classified as an NOI day if such events occur from 20:00 to 06:00 LT the next day (excluding April to September, for which the window is 20:00 to 05:00 LT). By strictly confining the concept of NOI days to this continuous nocturnal window, we ensure that our dynamic analysis remains completely isolated from daytime photochemical interference. Furthermore, to accurately characterize the specific atmospheric background driving these nighttime intrusions, it is important to note that the subsequent calculations and classifications are not based on daily average results. Instead, we strictly used the nighttime average fields (i.e., averaged over the continuous nocturnal window) corresponding to the identified NOI events. This temporal matching effectively prevented the transient nocturnal dynamic signals from being diluted by daytime meteorological variations. To further investigate the temporal occurrence characteristics within this continuous night, we subsequently categorized these NOI days into three descriptive types. Rather than using arbitrary mathematical intervals, the specific timeframes for these types were chosen to perfectly align with the distinct physical evolution phases of the nocturnal boundary layer: (1) Early-night NOI (EN): The event occurs only between 20:00 and 23:00 LT, corresponding to the transitional boundary layer phase; (2) Late-night NOI (LN): The event occurs only between 00:00 and 06:00 LT, corresponding to the highly stable surface inversion phase; (3) Whole-night NOI (WN): The event occurs across both periods, persisting continuously through the night.
2.3 Lamb-Jenkinson synoptic circulation classification approach
The Lamb-Jenkinson synoptic circulation classification approach serves as a precise and efficient meteorological classification method, which has been widely used in many studies (Zhu et al., 2007; Duan et al., 2020; Wu et al., 2020; Wang et al., 2023d). In this study, 16 grid points were selected around Xinxiang in accordance with Lamb-Jenkinson approach. The grid points cover the region from 25 to 45° N and 100 to 130° E, with a grid spacing of 5° in latitude and 10° in longitude (Fig. S2). To accurately capture the synoptic background driving NOI events and to eliminate daytime boundary layer convective perturbations, the classification was performed using strictly nocturnal SLP fields rather than daily averages. Furthermore, a seasonally-adjusted nocturnal window was applied based on local sunrise times, consistent with the nocturnal time window adopted for NOI. Based on SLP data from the selected grid points, 6 circulation indices were calculated (Zhou et al., 2023; You et al., 2024; Liu et al., 2019). The corresponding calculation formulas and circulation indices are introduced as follows:
where u and v represent the zonal and meridional components of the geostrophic wind, respectively. V is the geostrophic wind. ξu and ξv are the meridional gradient of u and the zonal gradient of v, respectively. ξ is the geostrophic vorticity. P1–P16 are SLP at 16 grid points. α, α1, and α2 represent the latitude of the grid points of P8, P12, and P4, respectively. When v<0, b1 is the geostrophic wind direction. When v>0, b2 is the geostrophic wind direction.
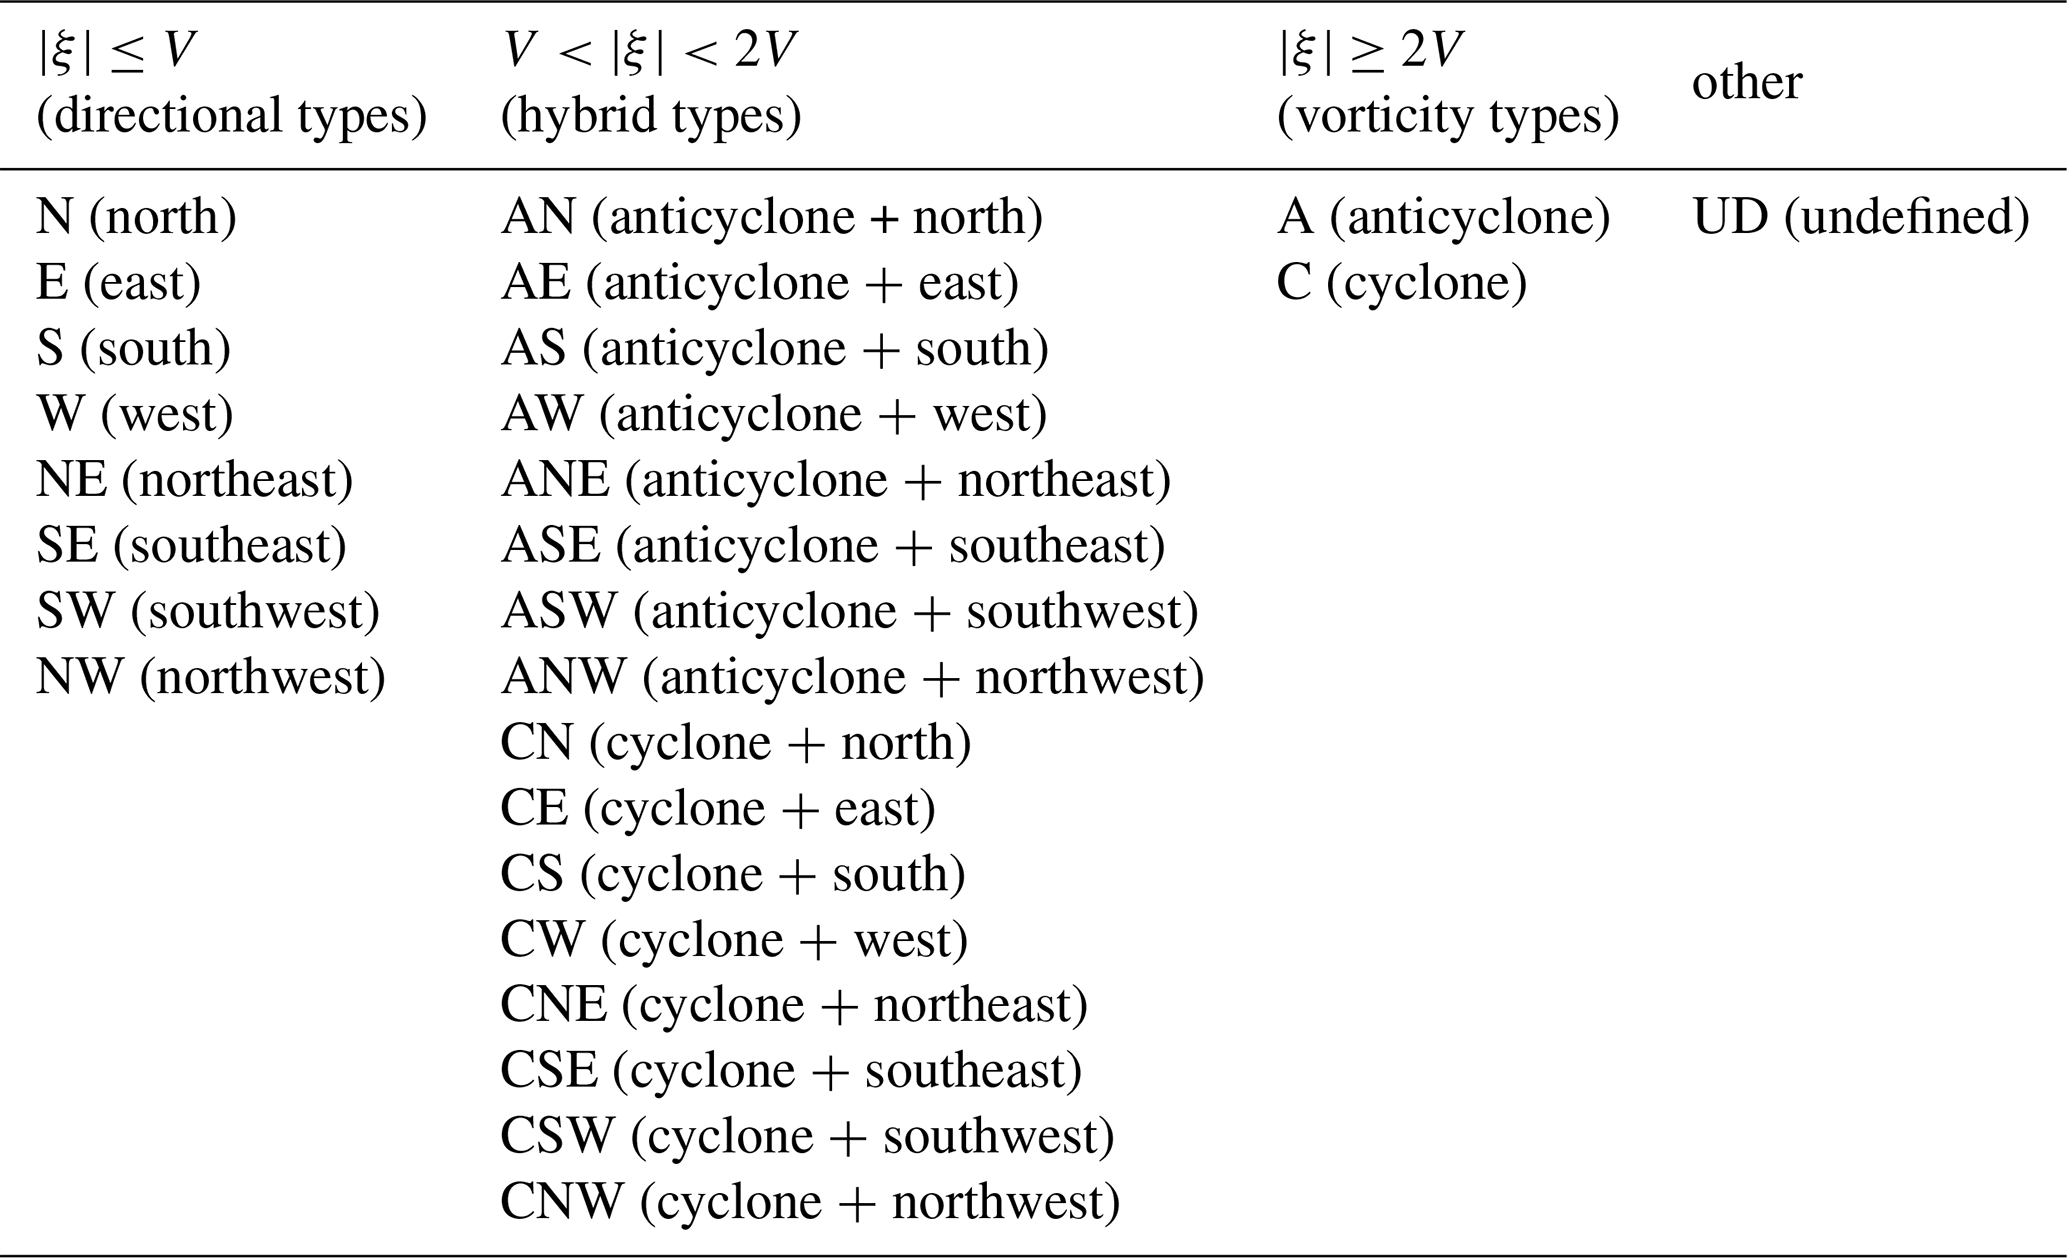
According to each circulation index and geostrophic wind direction, 27 weather types were classified (Table 1) (You et al., 2024; Liu et al., 2019).
2.4 HYSPLIT and CWT
The hybrid single particle lagrangian integrated trajectory (HYSPLIT) is a common model for investigating meteorological transmission channels (Chen et al., 2024a; Cheng et al., 2024; Shi et al., 2024; Stein et al., 2015). It can efficiently and accurately determine the transport trajectories of different pollutants, classify and aggregate the backward trajectories during the study period through the Euler clustering method, and output air mass trajectories with different proportions. In this study, the HYSPLIT model (run via the TrajStat plugin/MeteoInfo) was used to identify backward trajectories for Xinxiang during the period from 2021 to 2023. The model inputs hourly meteorological data from the Global Data Assimilation System with a spatial resolution of 1° × 1° (ftp://arlftp.arlhq.noaa.gov/pub/archives/gdas1, last access: 3 December 2025). Taking the starting point (central location of Xinxiang: 35.30° N, 113.88° E) as a reference, 48 h backward trajectories terminating at 100 m above ground level were calculated at 1 h intervals for all identified representative NOI days. Using these air mass trajectories, we mapped O3 concentrations to specific geographic grids to apply Concentration-Weighted Trajectory (CWT) analysis. Briefly, the CWT approach calculates the weighted average concentration of air mass trajectories passing through each 1° × 1° grid cell, thereby quantitatively identifying the relative contributions of potential upwind source regions to local O3 spikes (Shi et al., 2024; Wang et al., 2024). To mitigate statistical uncertainties from grid cells with sparse trajectory endpoints, an empirical weighting function Wij was incorporated. The complete mathematical formulations and calculation parameters for the CWT methodology are detailed in Text S1 in the Supplement.
3.1 Characteristics of NOI days
3.1.1 Temporal variation of NOI days and NOI occurrence time
Figure 1 illustrates the monthly variation of NOI days at national monitoring stations in Xinxiang from 2021 to 2023. The DX station recorded the highest cumulative NOI days (444 d), while KF exhibited the lowest frequency (370 d). Additionally, all stations showed similar monthly variation trends: NOI days progressively increased from January to March, peaking in March (42–47 d), and then maintained high-level fluctuations from April to September. Subsequently, the frequency declines sharply from October to December, reaching annual minima (15–26 d). This indicated that warm seasons favor NOI occurrence. However, it is crucial to emphasize that a high regional O3 background does not trivially dictate the occurrence of NOI. While the warm season provides a highly concentrated aloft reservoir, the actual occurrence of an NOI event (which must vigorously overpower the intense local nocturnal NO titration typical of urban environments) strictly requires the concurrent presence of specific dynamic meteorological triggers.
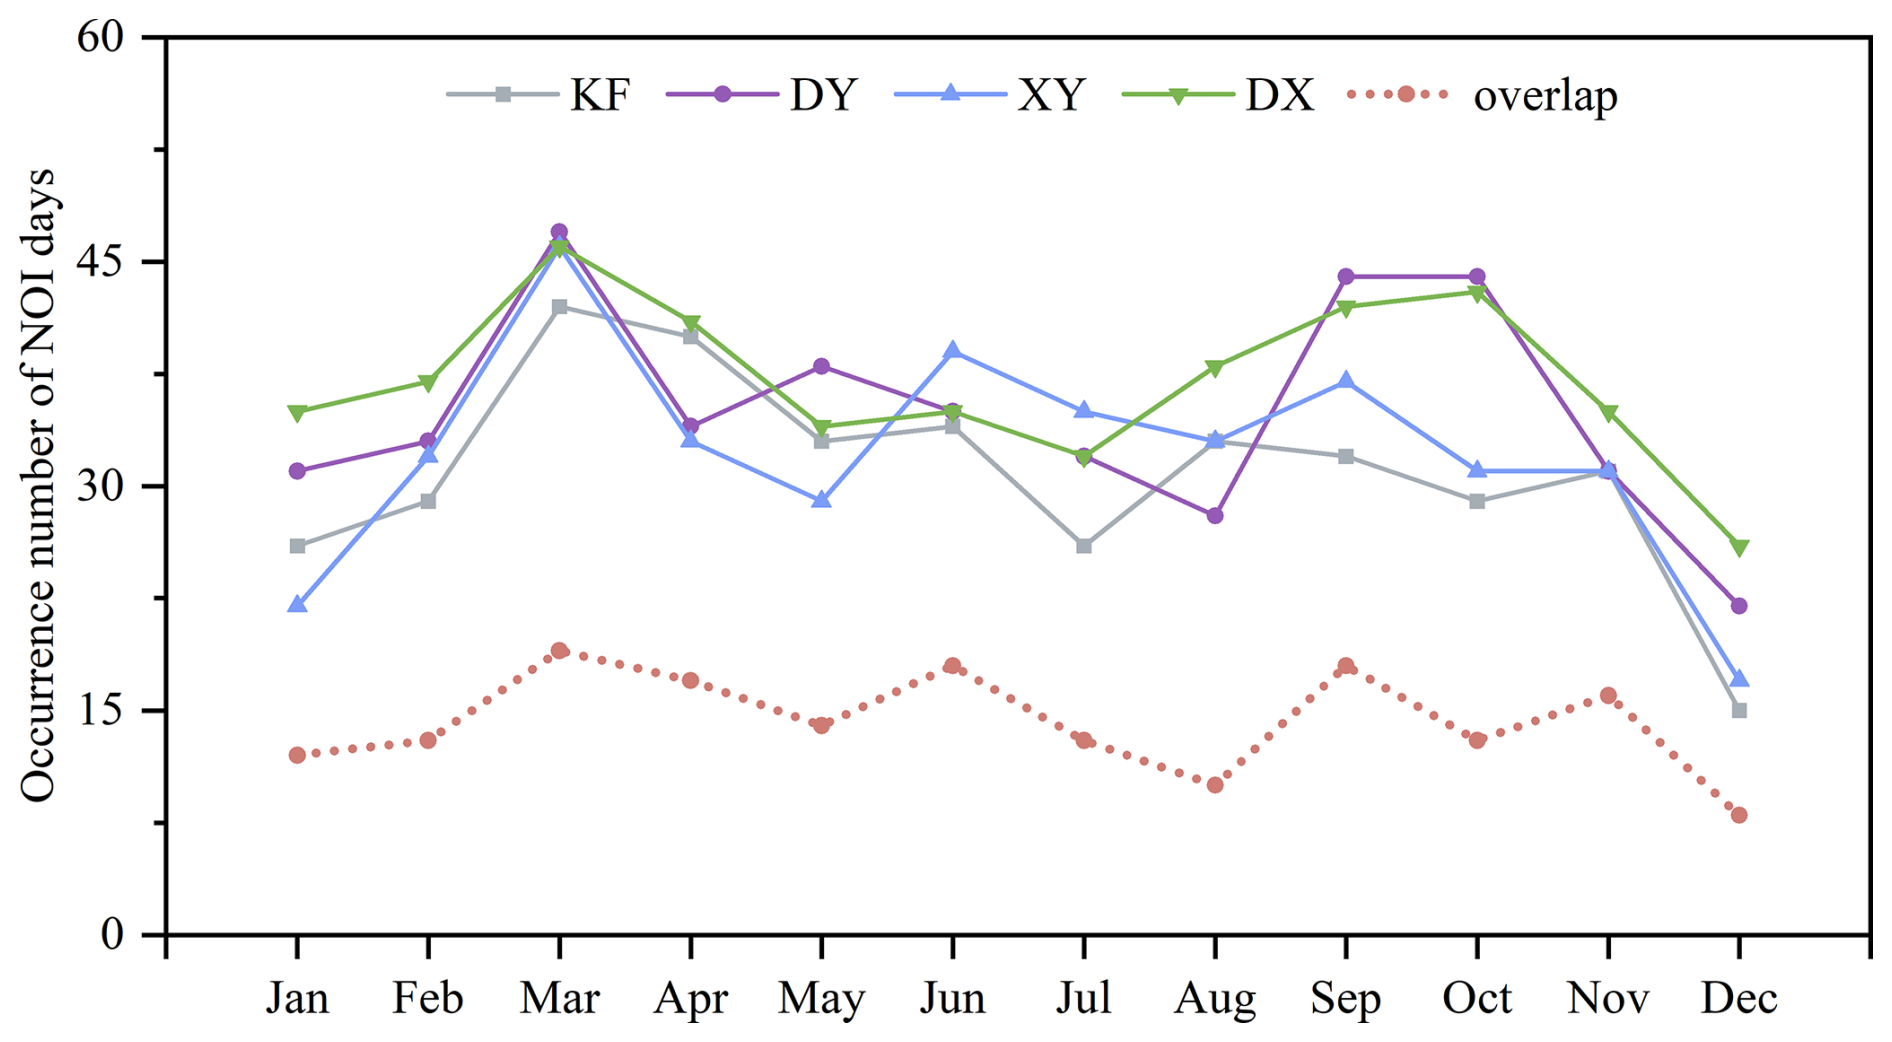
Figure 1Monthly variation of NOI days at national monitoring stations in Xinxiang, 2021–2023 (overlap: representative NOI days with completely coincident dates across the four stations).
Figure S3 further demonstrates monthly variations of NOI occurrence time. LN dominated with 69.53 % occurrence frequency across all months, followed by EN (21.69 %) and WN (8.78 %). This indicated that NOI events in Xinxiang tended to occur from 00:00 to 06:00 LT compared with those occurring between 20:00 and 23:00 LT. From a boundary-layer dynamics perspective, the absolute dominance of post-midnight events (LN) indicates that most NOI occurs when the nocturnal surface inversion is fully established and highly stable. Consequently, triggering these events requires substantial active mechanical forcing (e.g., intense wind shear or subsidence) capable of breaking this deep stability, which directly motivates the detailed synoptic and dynamical mechanism analysis in Sect. 3.3 and 3.4.
Furthermore, LN generally increased from March to September (68.24 %–80.60 %) compared with other months (60.54 %–67.50 %), while EN exhibited an opposite trend (Fig. S3). This reflected that warm seasons, characterized by richer daytime O3 accumulation in the residual layer, would intensify the occurrence frequency of LN.
3.1.2 Impact of NOI occurrence time on O3 levels
Given the significant temporal variation characteristics of NOI days, different occurrence times may exert distinct impacts on the overall O3 diurnal cycle. Therefore, we further analyzed the O3 diurnal variations on NOI days categorized by their occurrence time across different seasons (Fig. 2). Notably, in winter, compared with EN, LN exhibited higher initial O3 concentrations at the onset (around 18:00 LT), but maintained slightly lower levels throughout the late night and morning hours. This dampened afternoon peak is likely a direct consequence of this lower morning baseline. In winter, when daytime photochemical production is inherently limited, the maximum absolute O3 concentration heavily depends on the morning carry-over levels. Consequently, starting from a lower morning baseline naturally constrains the subsequent afternoon peak. Unlike the typical continuous depletion observed on non-NOI event nights, WN frequently exhibited anomalous night peaks or maintained near-stable, elevated concentrations throughout the dark hours. These features directly reflect the continuous and intense nature of the dynamical intrusions during WN periods, which effectively offset the local chemical depletion (NO titration). In contrast, in spring and summer, LN consistently showed both higher nocturnal/morning O3 concentrations and higher afternoon peaks than EN, indicating a generally more intense overall O3 pollution burden associated with LN events. Furthermore, except for autumn where EN and WN exhibited comparable O3 levels, WN generally displayed higher O3 concentrations than EN in other seasons. This indicates that EN exhibited the lowest overall O3 levels among the three categories, implying that the meteorological conditions triggering EN are relatively the least conducive to overall O3 accumulation. Overall, the total average O3 concentrations followed the order: WN (78.02 µg m−3) ≈ LN (77.96 µg m−3) > EN (72.42 µg m−3). The results that WN and LN exhibited comparably high overall levels underscores that prolonged or late-night dynamical intrusions pose a more severe O3 pollution burden. Moreover, the robustness of these diurnal differences is visually confirmed by the shaded error bands (representing ±1 standard error of the mean). We hypothesize that these temporal discrepancies are intrinsically linked to the distinct evolutionary characteristics of specific weather types, which serve as the primary physical triggers modulating both the timing and varying intensities of NOI events.
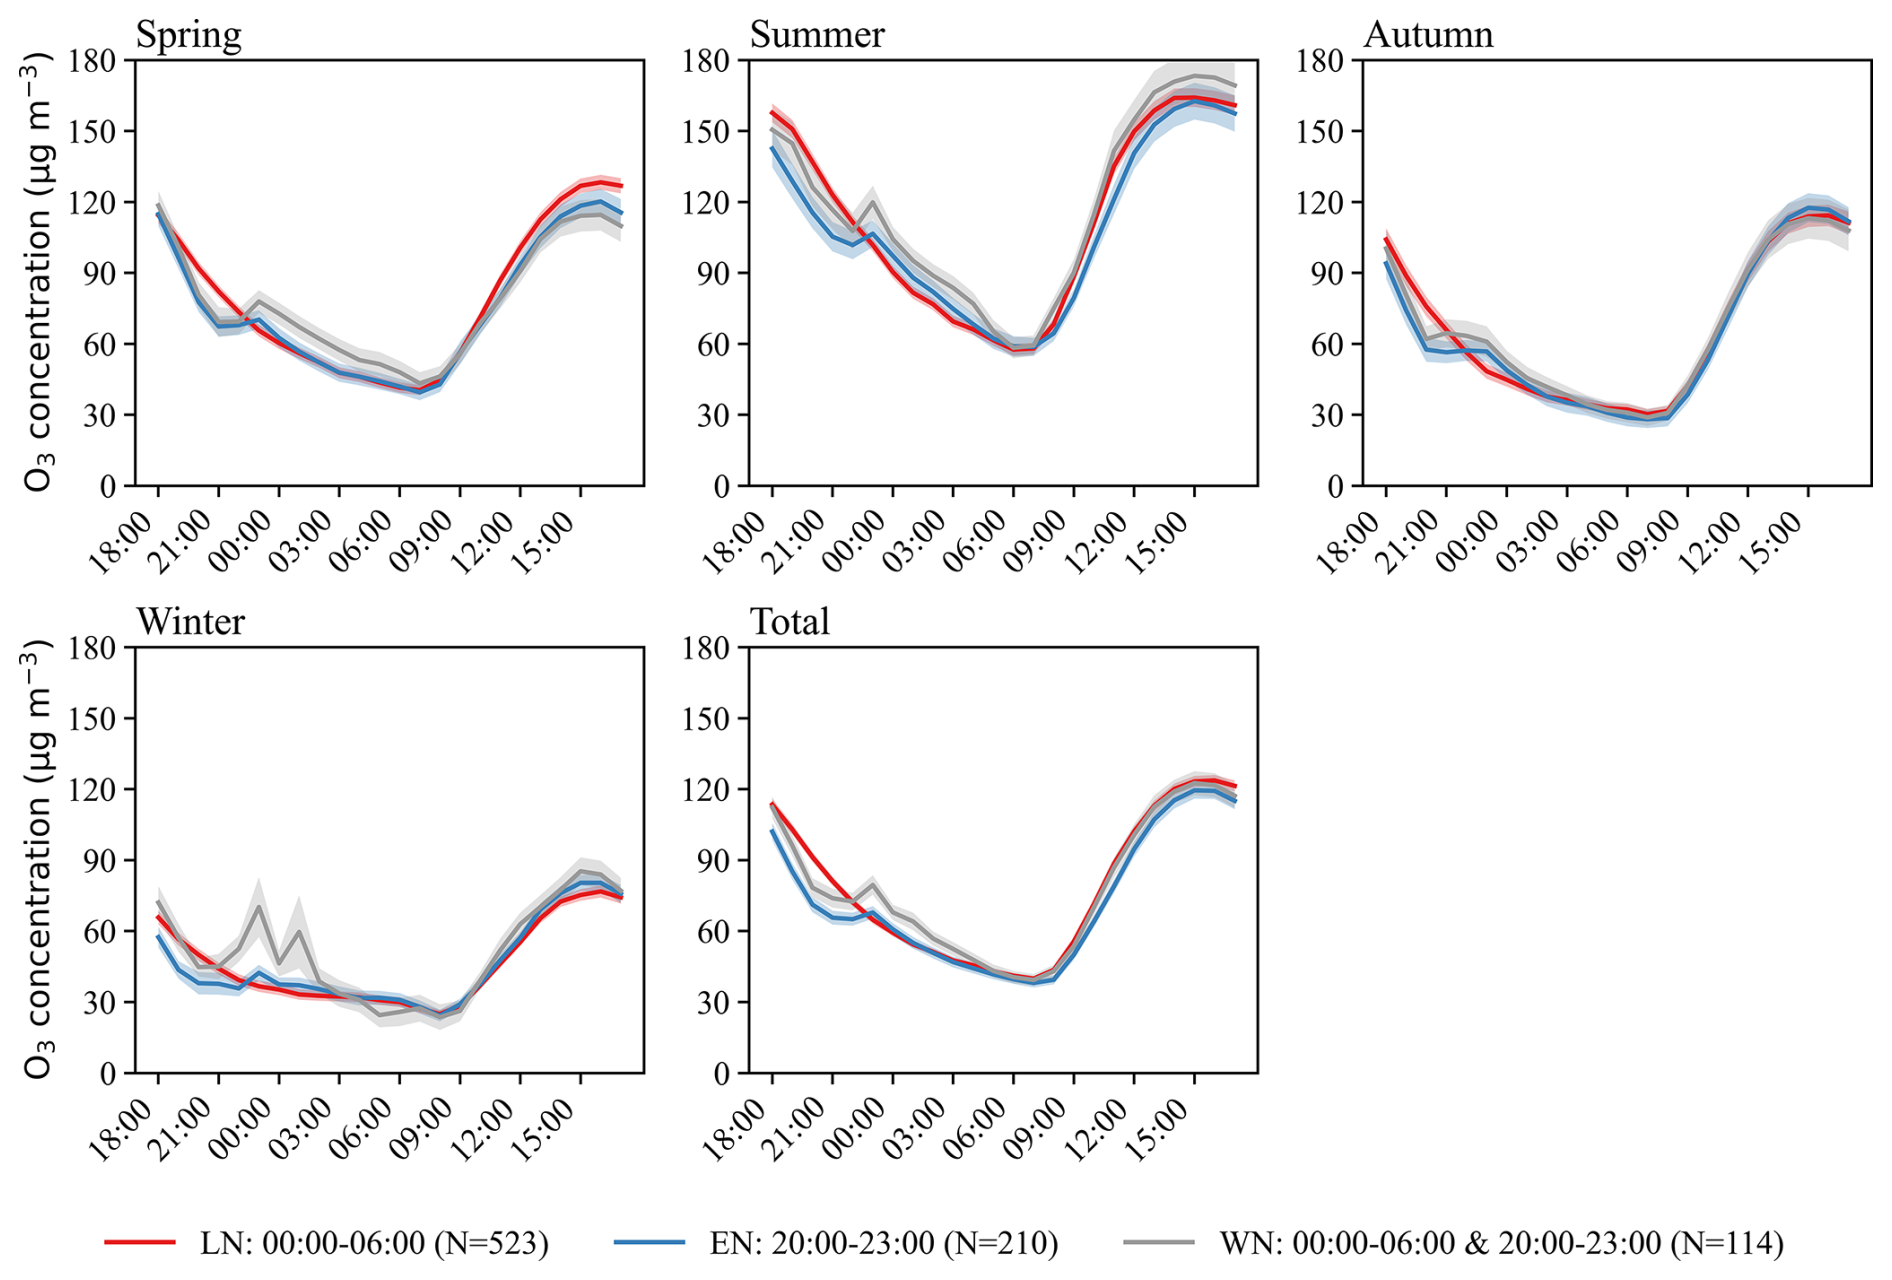
Figure 2O3 diurnal variations of NOI days under different NOI occurrence time in different seasons. The solid colored lines represent the composite mean O3 concentrations for LN (red), EN (blue), and WN (grey). The shaded bands denote the bounds of ±1 standard error of the mean (SEM), visualizing the statistical variance. The number of occurrences (N) for each specific category is indicated in the legend.
Given the discrepancy in the occurrence dates of NOI days in different stations in Xinxiang, standardizing the dates of local NOI days is essential to investigate the weather type characteristics of NOI days. We established unified occurrence dates through cross-analysis of multi-station data (Fig. 3), and found that KF, XY, DX, and DY had 171 NOI days occurring on the same days during 2021–2023 in Xinxiang. Thus, these 171 NOI days were selected as representatives to characterize the overall occurrence of local NOI days. It is worth noting that non-overlapping NOI events frequently occur among the different stations, highlighting the inevitable influence of random localized emission noise and uncoordinated micro-environmental fluctuations. To rigorously isolate the overarching synoptic-scale meteorological drivers from these random local chemical/emission noises, this study specifically focused on representative events where NOI occurred simultaneously across all stations. Rather than neglecting local boundary-layer processes, these simultaneous occurrences serve as robust indicators of powerful regional episodes. They demonstrate that the large-scale synoptic forcing was sufficiently intense to synchronize the local boundary-layer dynamics (e.g., vertical wind shear and turbulent mixing) across the entire urban region. This rigorous screening ensures that the localized physical mechanisms evaluated in subsequent sections are systematically driven by macro-weather types, rather than coincidental local perturbations. Furthermore, the monthly variation of these representative regional events (indicated by the “overlap” dotted line in Fig. 1) consistently matches the seasonal trends observed at individual stations (e.g., distinct peaks in March and September, and dips in January and December). This indicated that the representative NOI days could effectively reflect the occurrence of NOI days in Xinxiang and were scientifically valid.
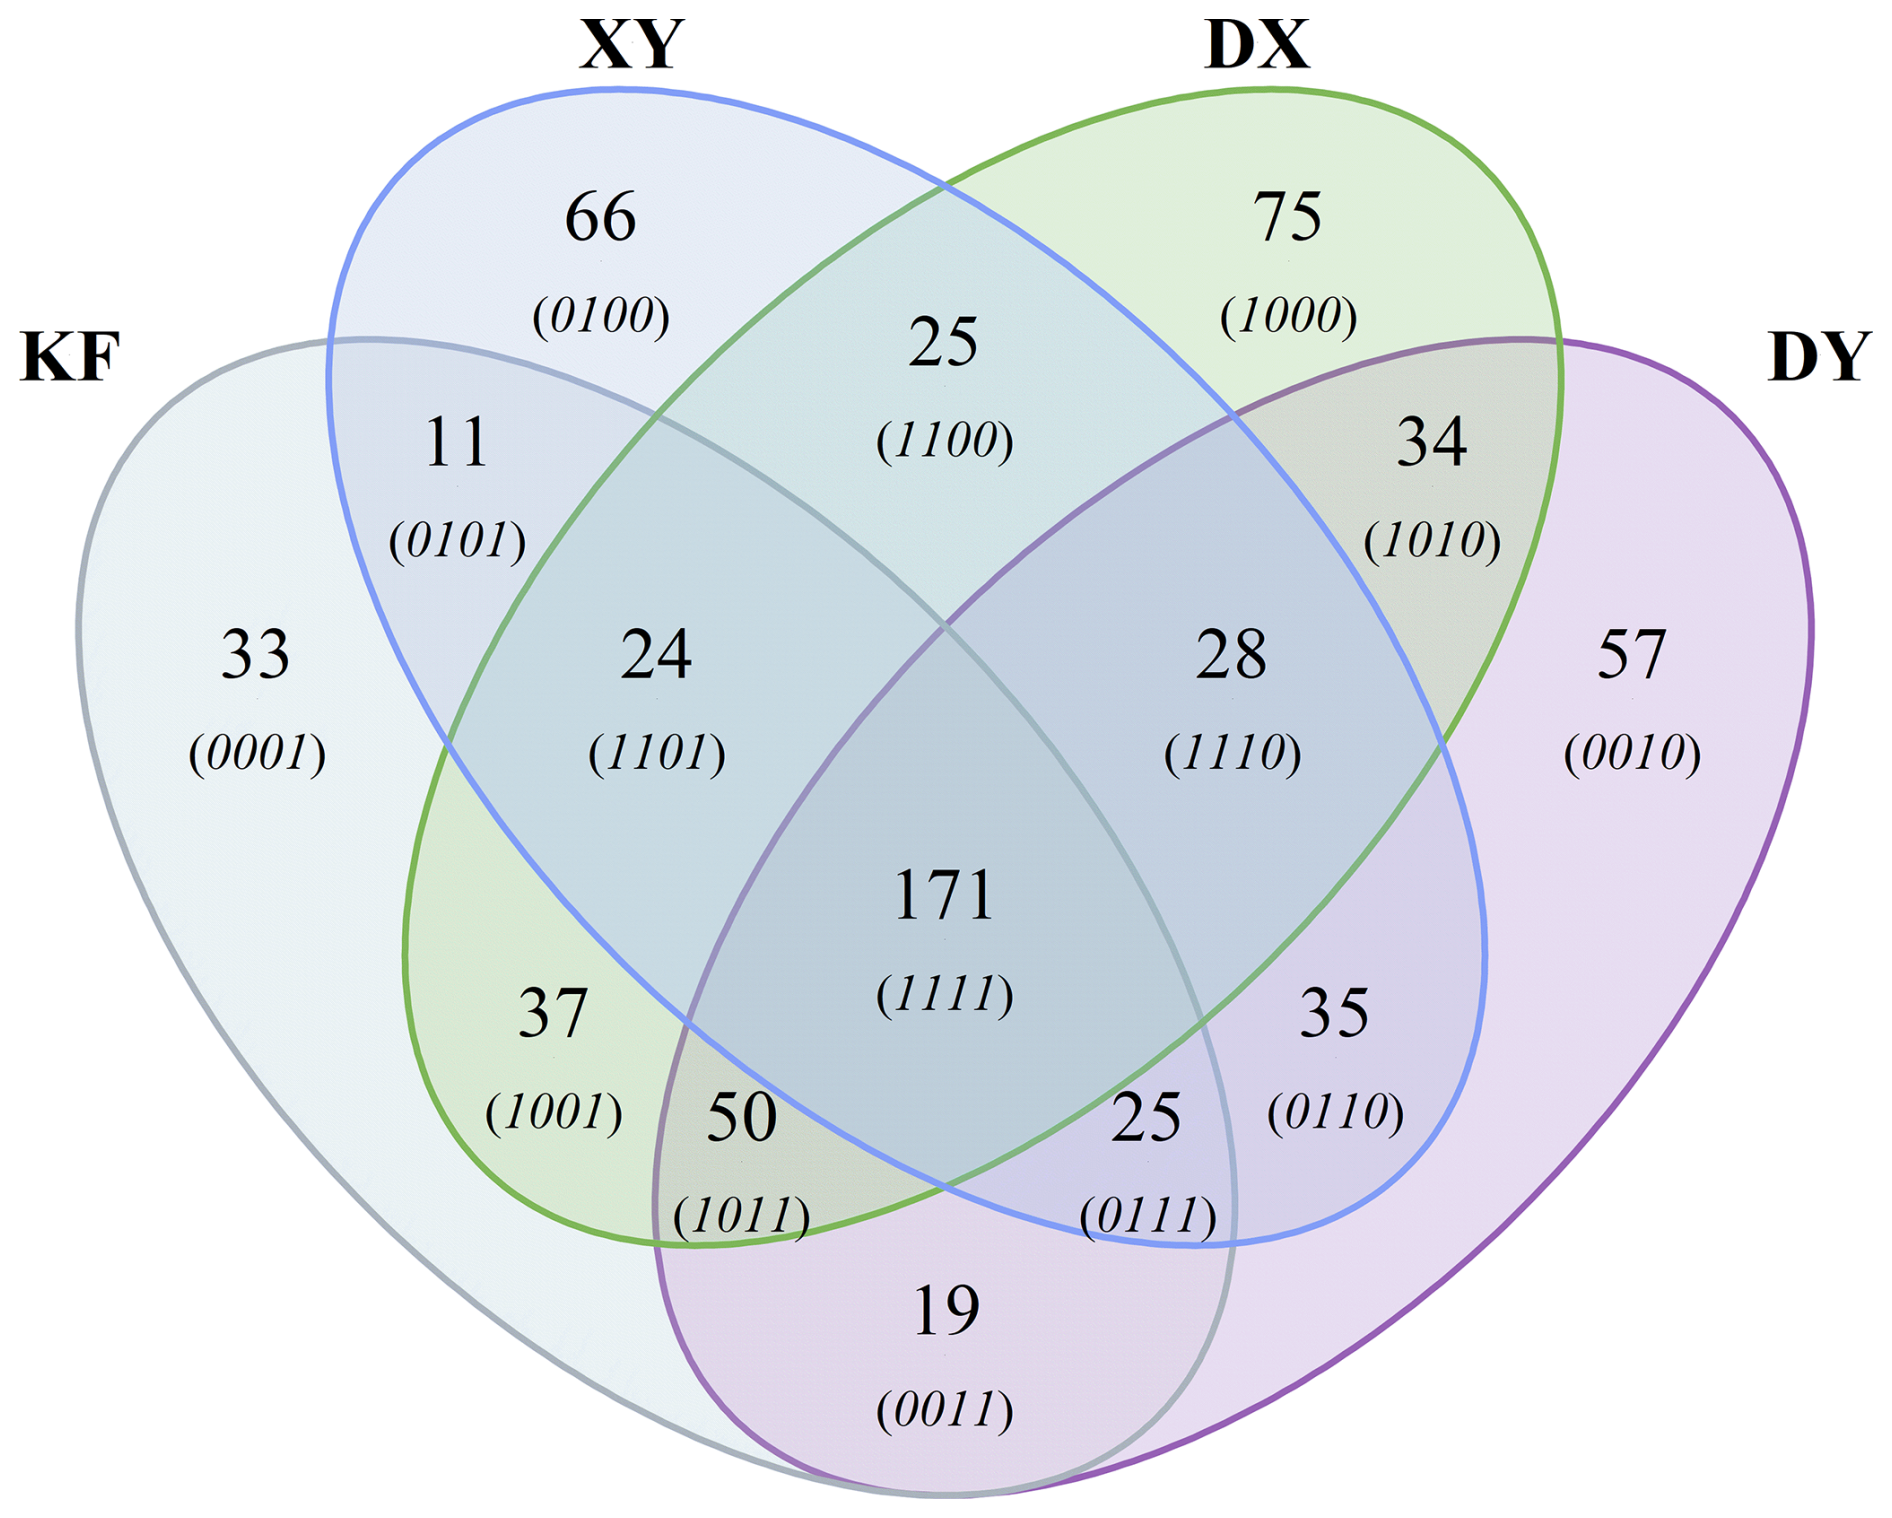
Figure 3Overlapping occurrences of NOI days at national monitoring stations in Xinxiang, 2021–2023. The four-digit binary codes in parentheses indicate the specific occurrence status of NOI events across the four stations (in the order of DX, XY, DY, and KF). A digit of 1 represents the occurrence of the event, and 0 represents non-occurrence (e.g., (1111) denotes cooccurrence at all four stations, while (1000) denotes occurrence only at the DX station).
3.2 Weather types of representative NOI days
To ensure the utmost methodological clarity, the analytical thread connecting the aforementioned steps is explicitly outlined as follows: First, local NOI events were identified at individual stations based on the absolute increment metric. Second, through the cross-analysis described above, exactly 171 simultaneous regional NOI days were extracted to filter out localized noise. Finally, the subsequent meteorological characterizations and synoptic classifications were strictly executed based exclusively on these 171 representative days.
The Lamb-Jenkinson synoptic circulation classification method was utilized to categorize weather types for representative NOI days. The categorization results are presented in Table S1 in the Supplement (which sums to exactly 171 d). 20 weather types were identified from 171 representative NOI days, including 2 vorticity types (named A and C), 8 directional types (including S, SE, SW, W, NW, N, NE and E) and 10 hybrid types (named AE, ANE, AS, ASE, ASW, CN, CS, CSE, CSW and CW). Among them, vorticity types accounted for 49.12 % of the total, with anticyclonic type A alone contributing 77 d. Directional and hybrid types accounted for 33.92 % and 16.96 %, respectively. Figure S4 displays the mean SLP of representative NOI days under different weather types from 2021 to 2023. It can be seen that the position of high- and low-pressure centers exhibit certain discrepancies among different weather types. Furthermore, to explicitly validate that this SLP-based classification accurately captures airflow characteristics in lower troposphere, Fig. S5 illustrates the spatial distributions of mean SLP overlaid with 850 hPa wind fields for the 20 identified weather types. The spatial patterns demonstrate a high degree of physical consistency, wherein the surface pressure gradients align with the 850 hPa wind field. This confirms that the SLP-based Lamb-Jenkinson method is highly robust and effectively represents synoptic circulation background of upper boundary-layer.

Figure 4Proportion of four primary weather types and days of each weather type during representative NOI days in Xinxiang, 2021–2023.
Liu et al. (2019) noted that northern China is frequently affected by large-scale weather systems such as the Yellow River cyclone, the Siberian high, and the Western Pacific subtropical high. These interactions induce frequent shifts in weather classifications and the seasonal migration of high- and low-pressure centers, resulting in distinct monthly meteorological patterns. According to the position of central system and different meteorological elements of each classification, the 20 weather types were classified into four primary weather types: (1) A-type (weather types related with high-pressure), including A, AE, ANE, AS, ASE and ASW; (2) C-type (weather types related with low pressure), including C, CN, CS, CSE, CSW and CW; (3) S-type (geostrophic wind direction to the south), including S, SE and SW; (4) WNE-type (geostrophic wind direction between west-north-east), including W, NW, N, NE and E. Figure 4 illustrates the proportion of four primary weather types and the days of each weather type. As shown in Fig. 4, representative NOI days predominantly occurred under A-type weather types (99 d, 57.89 % of the total), followed by S-type (34 d, 19.88 %), WNE-type (24 d, 14.04 %), and C-type (14 d, 8.19 %). These findings indicated that the meteorological conditions of A-type were most conducive to the occurrence of NOI days.
Notably, to extract the overarching dynamical mechanisms and reduce the statistical noise of the 20 specific Lamb-Jenkinson weather types, we quantitatively clustered them into four major archetypes: Anticyclonic (A-type), Cyclonic (C-type), Southerly (S-type), and West-North-East (WNE-type). Rather than subjective grouping, this clustering was rigorously based on their shared physical topology: specifically, the polarity of SLP anomalies, geostrophic vorticity, and the primary azimuth of geostrophic wind vectors. The detailed quantitative criteria for each of the four weather types are provided in Text S2. To further validate the physical distinctness of this categorization, composite analysis of the synoptic fields and Analysis of Variance (ANOVA) on localized boundary layer variables were conducted.
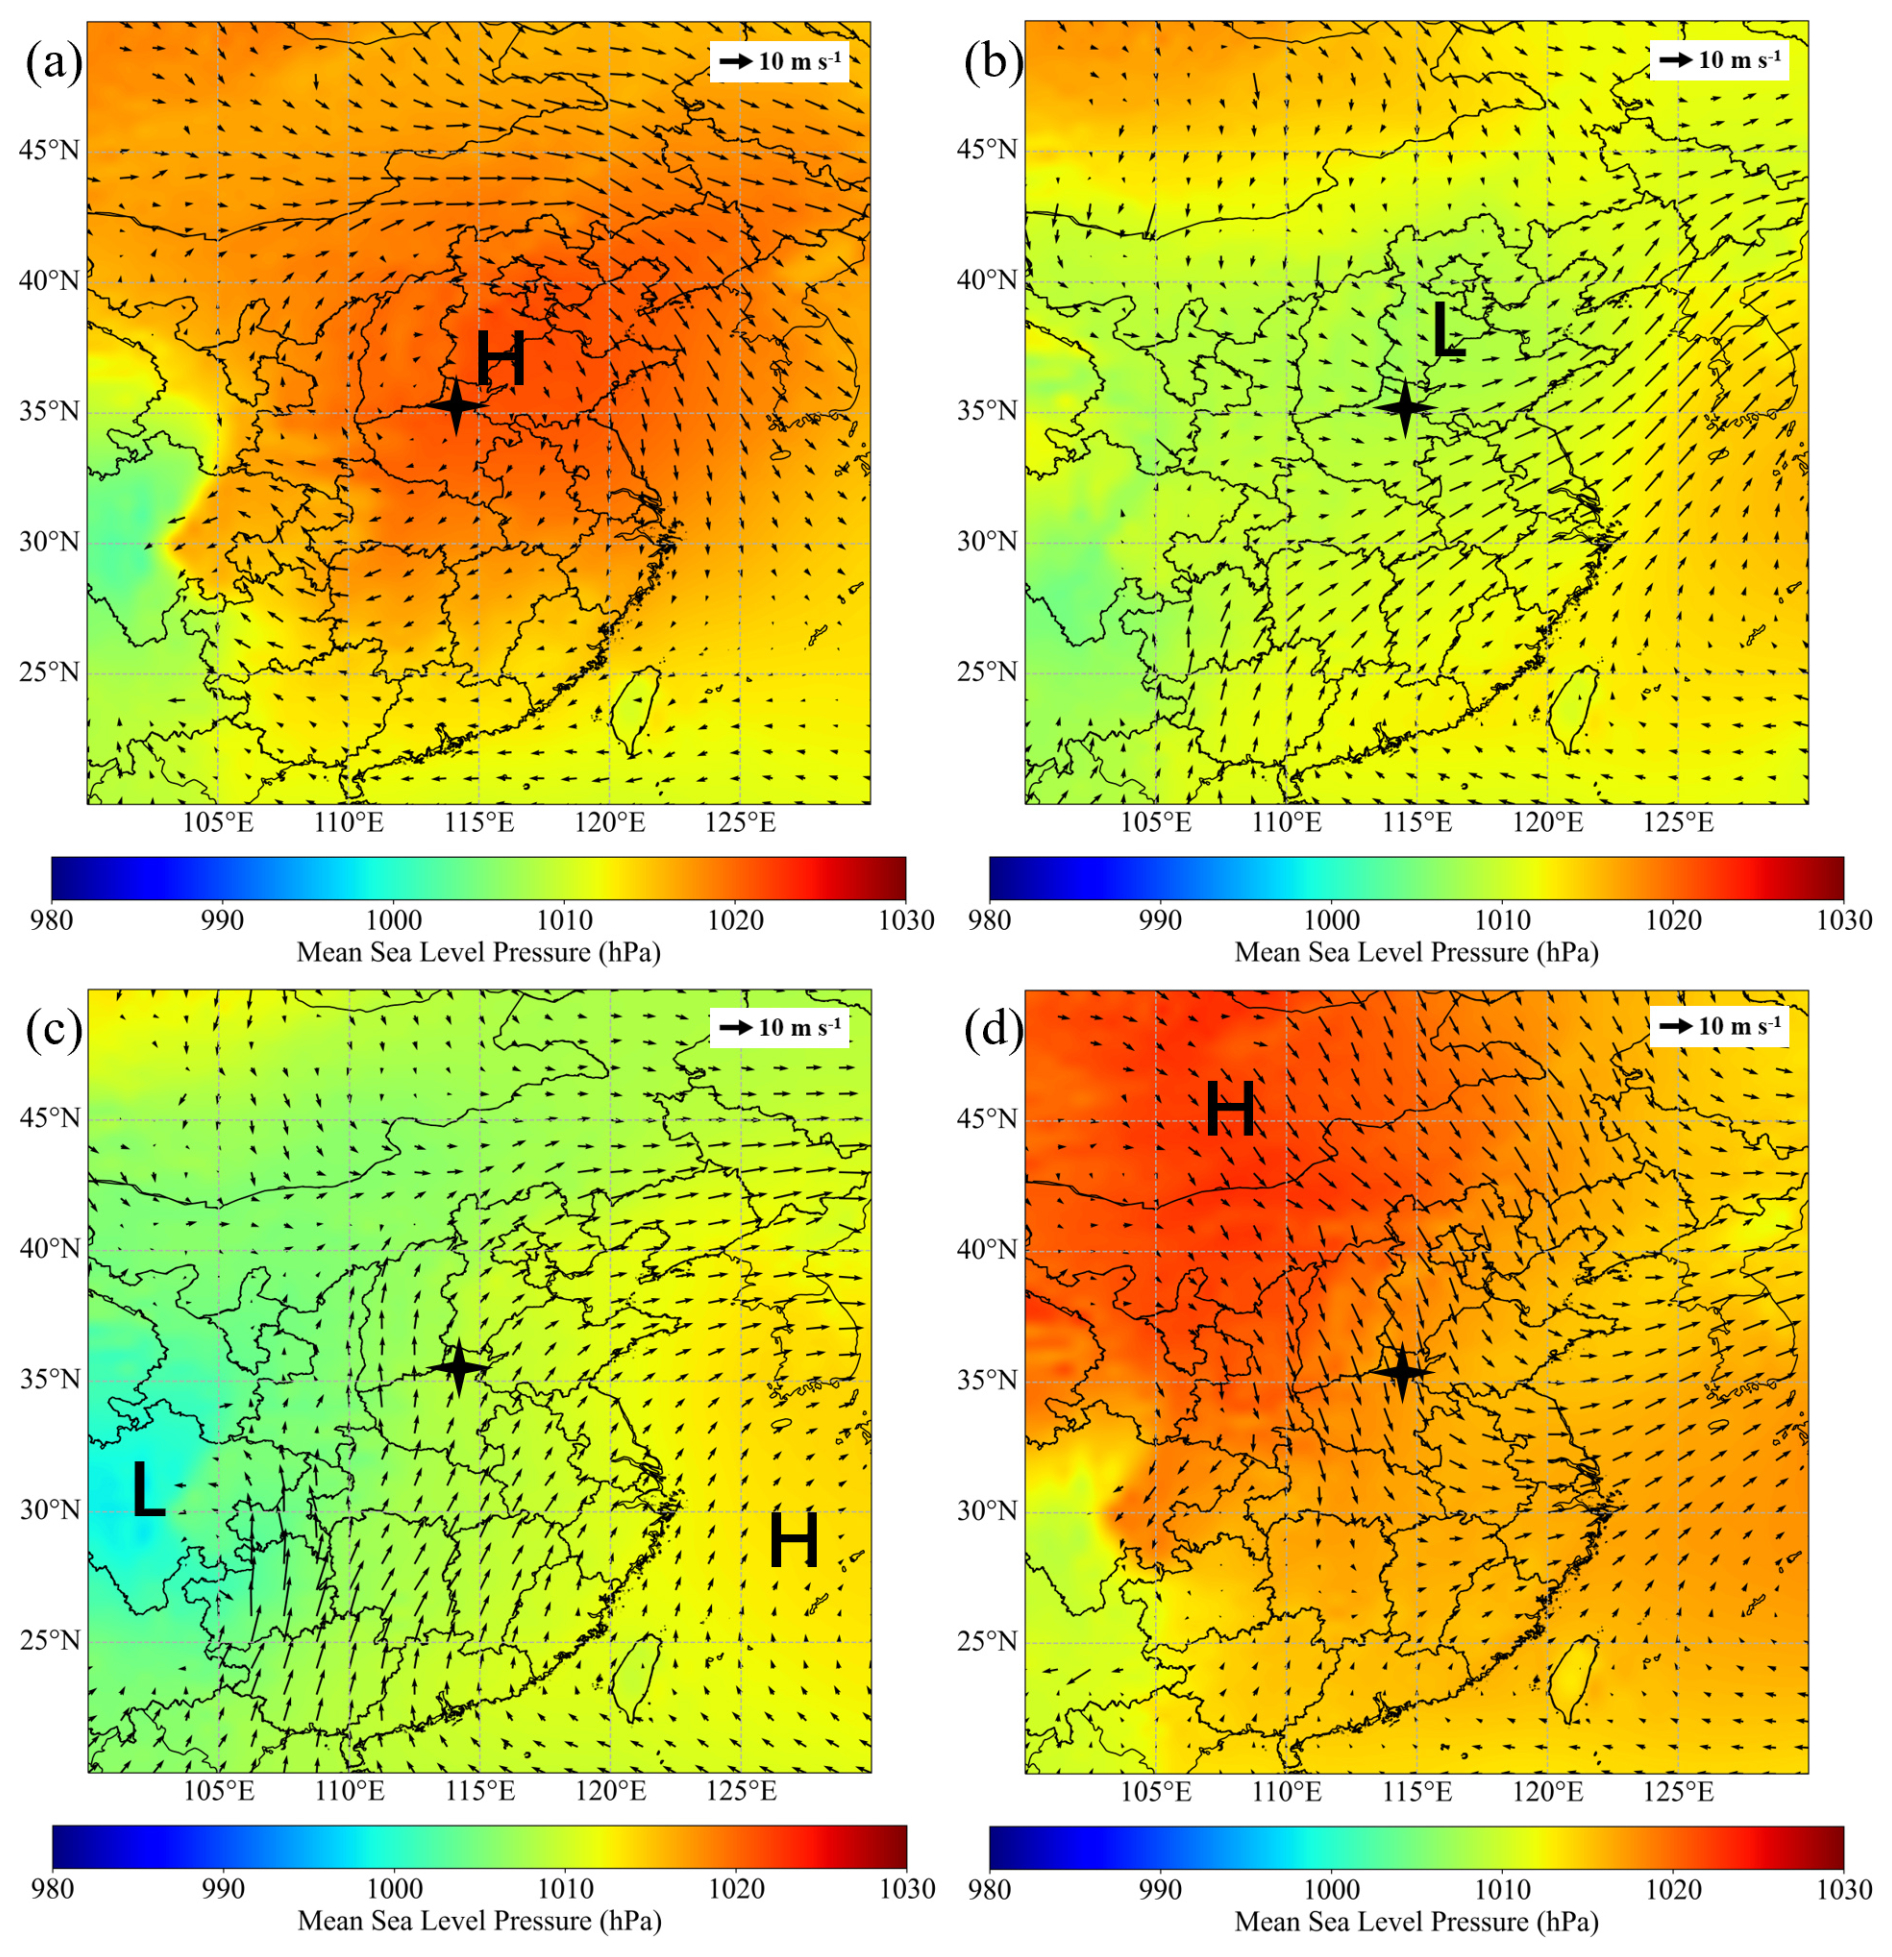
Figure 5Spatial distribution of composite mean SLP and 850 hPa wind fields under different weather categories: (a) A-type, (b) C-type, (c) S-type, (d) WNE-type (asterisk indicates the location of Xinxiang; “H” and “L” stand for high-pressure and low-pressure, respectively).
To verify that the four grouped weather types possess fundamentally distinct atmospheric backgrounds, we analyzed their composite mean SLP and 850 hPa wind fields (Fig. 5). The spatial distributions unequivocally demonstrate distinct synoptic forcings: A-type is dominated by a strong, uniform high-pressure center over the study region (Fig. 5a); C-type is characterized by cyclonic curvature and low-pressure system (Fig. 5b); S-type is driven by intense southerly advection between a western low and an eastern high (Fig. 5c); and WNE-type features strong northeasterly flows driven by a massive continental high to the northwest (Fig. 5d). Furthermore, to statistically confirm that these different synoptic structures translate into distinctly different local thermodynamic environments, a One-Way ANOVA was performed on the nocturnal anomalies of key meteorological variables (T, RH, WS, PBLH and U*) across the four groups. The resulting statistical distributions and data spreads are visually compared in Fig. 6, while the precise quantitative parameters and significance test results are detailed in Table S2. To strictly isolate the meteorological perturbations driven by synoptic systems and to eliminate the influence of seasonal and interannual backgrounds, the nocturnal anomalies (Δ) for key meteorological variables were calculated as the difference between the NOI days' specific nocturnal average and the corresponding monthly nocturnal mean. The results show that the inter-group differences are highly statistically significant (all p<0.01), definitively proving that our quantitative classification objectively separates fundamentally different boundary layer environments.
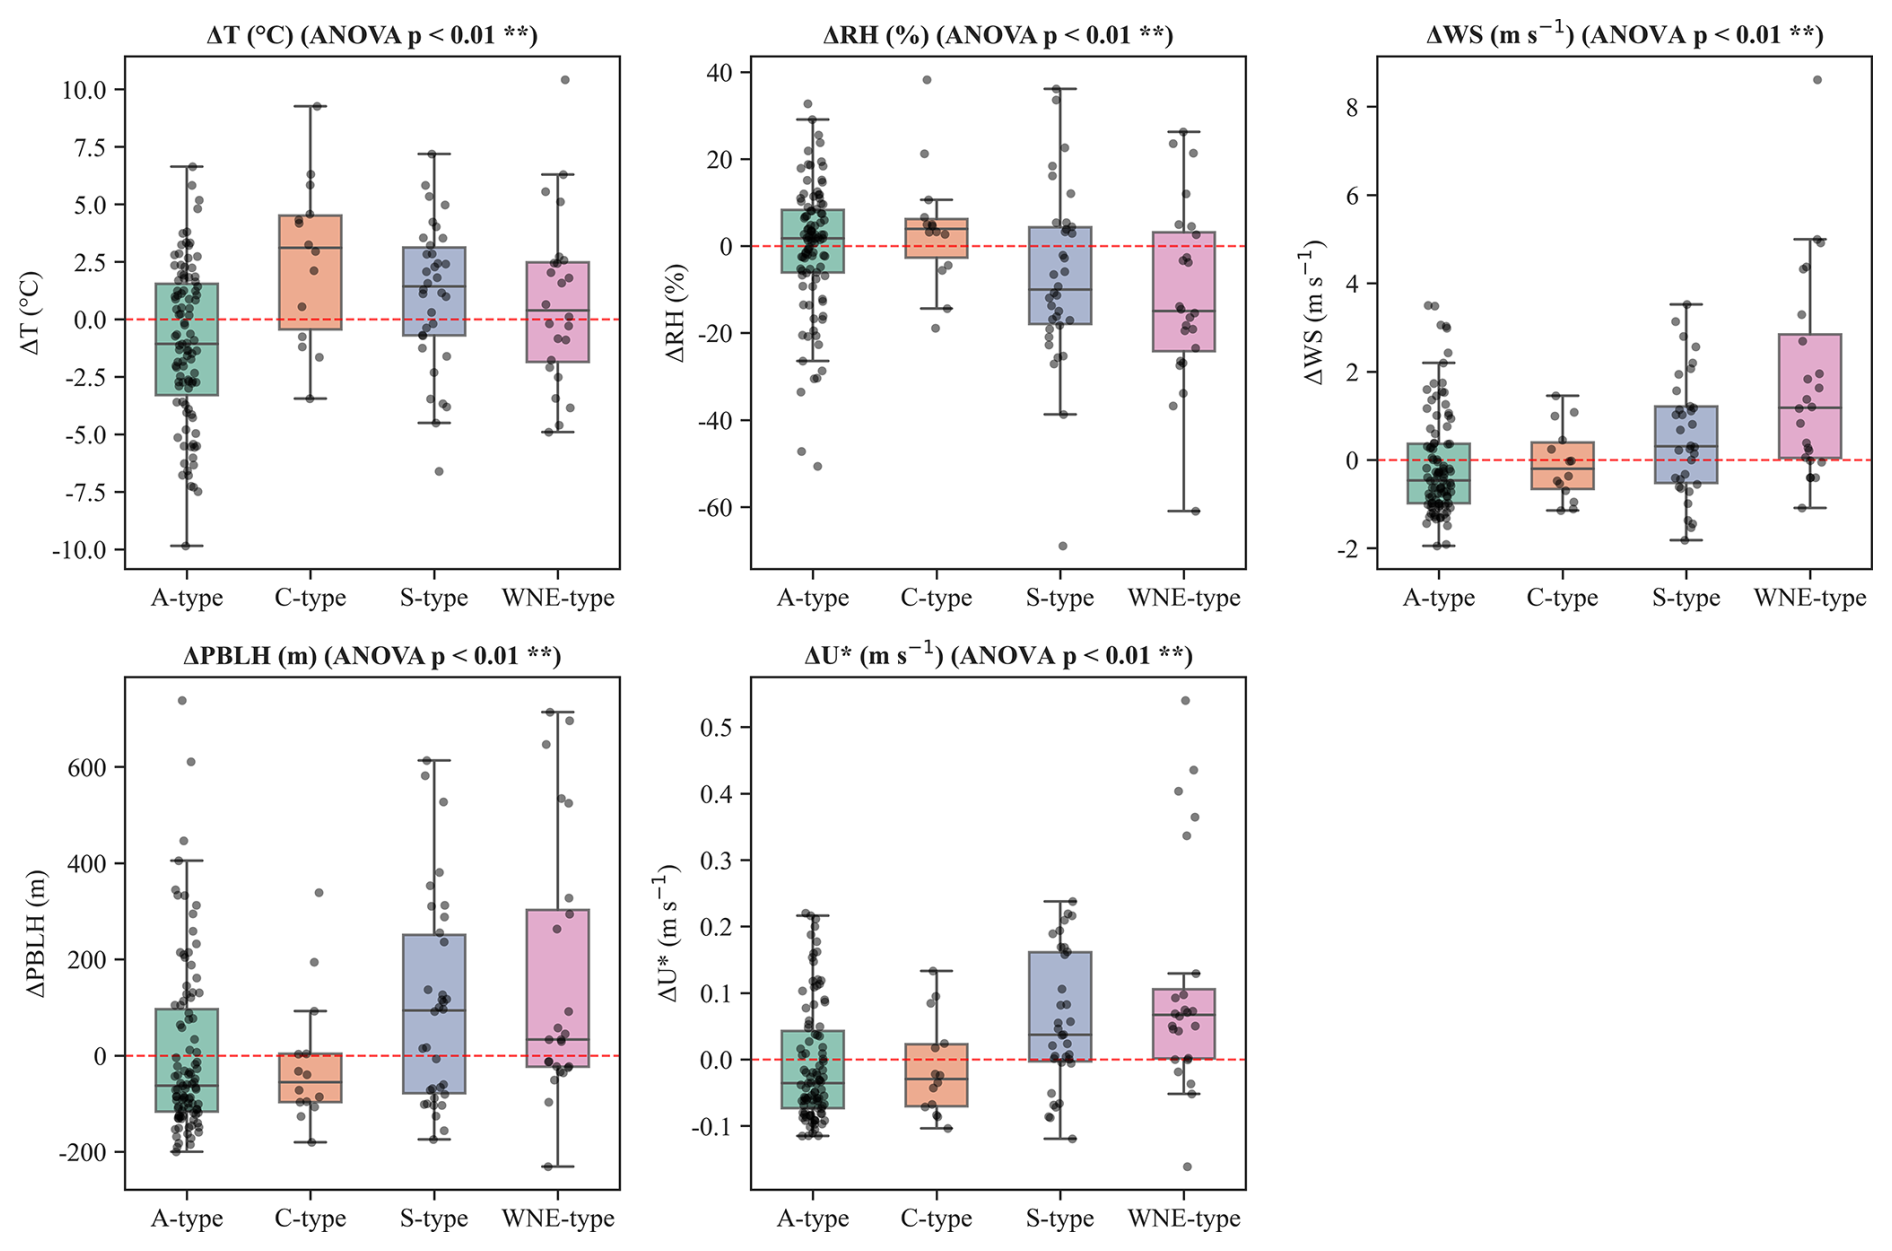
Figure 6One-Way ANOVA results for key meteorological variables (T, RH, WS, PBLH and U*) of different synoptic categories. In each boxplot, the central black solid line indicates the median. The horizontal red dashed line denotes the zero-anomaly reference.
3.3 Meteorological characteristics of primary weather types
As established in Sect. 3.1, the vast majority of NOI events in Xinxiang occur during the LN period. During this phase, the nocturnal boundary layer is characterized by a fully established surface inversion, creating a highly stable thermodynamic environment. To trigger downward O3 transport under such extreme stability, localized residual turbulence is entirely insufficient. Instead, it requires massive, active mechanical forcing capable of physically breaking the inversion layer. Because such powerful mechanical triggers are fundamentally governed by macro-scale weather systems, identifying the specific synoptic circulations is the critical next step to unravel the forcing mechanisms behind these NOI events.
It should be noted that while seasonal variations significantly influence the daytime photochemical generation and absolute background concentrations of O3, the nocturnal occurrence of NOI is predominantly driven by physical transport. As validated by the seasonal comparison (Fig. S6 and Text S3), while the absolute intensity of meteorological variables naturally fluctuates across seasons, the fundamental dynamical frameworks for a given weather type (e.g., the general orientation of horizontal pressure gradients and patterns of vertical motions) maintain functionally comparable mechanical triggers. Therefore, rather than focusing on seasonal background variations, our study focuses on elucidating these primary, synoptically-driven local meteorological drivers that trigger NOI.
The representative NOI days in Xinxiang were classified into four weather types (A-type, C-type, S-type, and WNE-type), with each exhibiting distinct meteorological features. Figure 7 illustrates the spatial distributions of 850 hPa wind fields under four weather types. Under A-type, Xinxiang was located near a high-pressure center, with an outward-rotating wind field at 850 hPa (Figs. 5a and 7a), indicating the presence of an anticyclonic high-pressure system. Driven by this synoptic forcing, Xinxiang experienced extremely calm conditions. As explicitly demonstrated by the nocturnal anomalies in Fig. 6 and Table S2, A-type was characterized by negative anomalies in wind speed (mean: ΔWS .10 m s−1) and friction velocity (mean: .01 m s−1), alongside a strongly constrained boundary layer (mean: ΔPBLH =3.56 m, representing negligible expansion). This indicates that the overriding high-pressure system creates a highly stable environment. The explicit intrusion process of O3 under this subsidence will be further verified in Sect. 3.4.
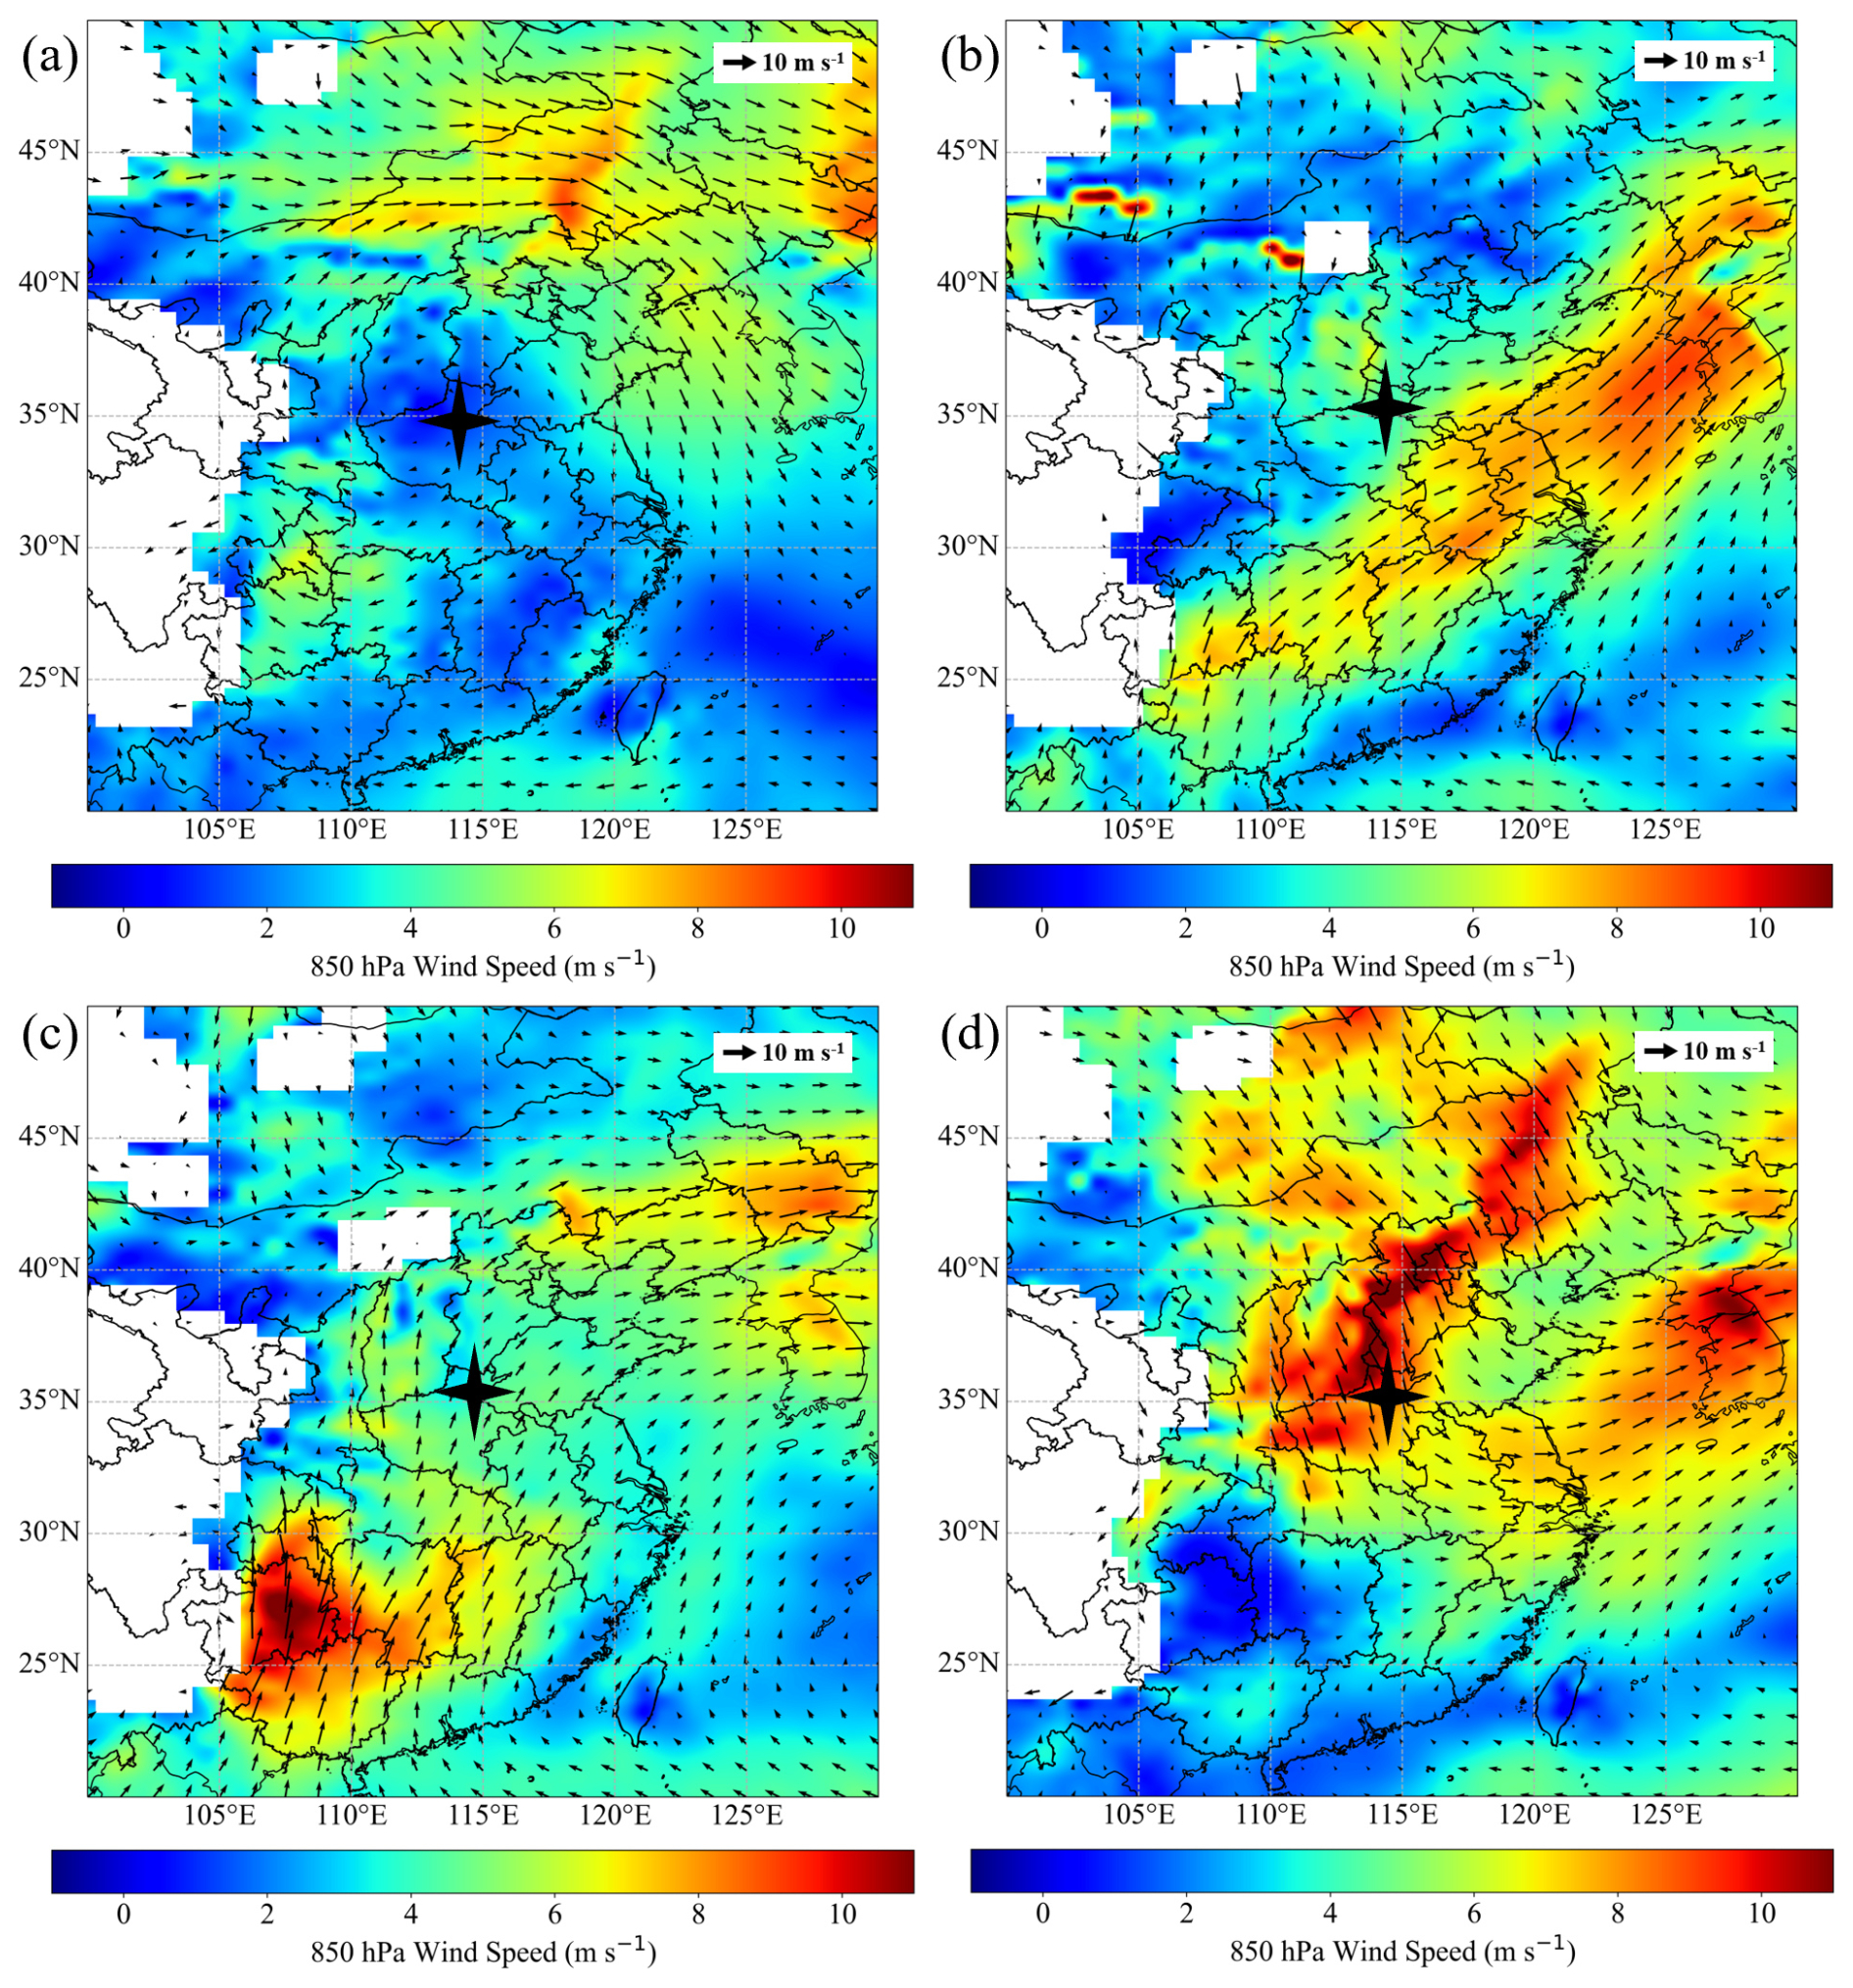
Figure 7Spatial distribution of wind field at 850 hPa under different weather types: (a) A-type, (b) C-type, (c) S-type, (d) WNE-type (asterisk indicates the location of Xinxiang).
Under C-type, Xinxiang was dominated by low-pressure systems (Fig. 5b). At 850 hPa, a strong airflow originating near the coastal region of Guangxi Province moved continuously northeastward (Fig. 7b). This airflow not only moved at a high speed, but also likely carried substantial moisture, significantly enhancing atmospheric instability in its trajectory and surrounding regions (including Xinxiang), intensifying convective activity, and increasing the risk of heavy rainfall. Combined with the water vapor flux and divergence fields at 850 hPa, we find that the intense southwest warm-wet moisture transport belt under C-type is extremely prominent. Significant moisture convergence is observed along the entire path of this belt (including Xinxiang) (Fig. S7). Notably, the local meteorological anomalies perfectly capture this advection, with C-type uniquely coinciding with distinct positive anomalies in temperature (mean: ΔT=2.60 °C) and the highest relative humidity anomaly among all weather types (mean: ΔRH =4.08 %). This localized warm and highly humid environment, dynamically coupled with a cyclonic low-pressure background, significantly amplifies atmospheric thermodynamic instability, highly favoring the development of regional convection and precipitation. Consequently, rather than uniform large-scale subsidence, NOI under C-type is primarily triggered by convective motions and the subsequent development of cold pools.
S-type represents a dynamic environment driven by distinct horizontal advection. Under S-type, Xinxiang was situated in a tight pressure gradient, typically between a western low and an eastern high (Figs. 5c and 7c). Driven by this synoptic setup, continuous southerly geostrophic winds prevailed over the region. As detailed in Table S2, S-type produced significant positive anomalies in local wind speed (mean: ΔWS =0.54 m s−1) and friction velocity (mean: .06 m s−1). These specific values rigorously demonstrate that beyond facilitating regional horizontal transport (which will be explicitly traced in Sect. 3.4.1), the southerly advection directly generates substantial localized mechanical turbulence at the surface, physically lifting the nocturnal boundary layer (mean: ΔPBLH =102.41 m). This localized mechanical shear serves as the direct trigger for breaking nocturnal stability, subsequently entraining O3-rich air from the elevated residual layer down to the surface and triggering NOI events.
Although Xinxiang often featured a massive continental high-pressure system (e.g., the Siberian High) to the northwest under WNE-type (Fig. 5d), their local dynamics are fundamentally different from the pure subsidence of A-type. At 850 hPa, the region was obviously influenced by a northwestern airflow (Fig. 7d), consistent with the geostrophic wind characteristics of WNE-type. Unlike A-type, where the study area sits calmly at the high-pressure center, under WNE-type, Xinxiang was located at the densely packed periphery of the advancing high. Consequently, the macroscopic forcing shifts to intense horizontal pressure gradients (Figs. 5d and 7d). This kinematic distinction is perfectly captured by the localized surface anomalies (Table S2). WNE-type exhibited the most extreme positive anomalies among all categories, with local wind speed (mean: ΔWS =1.74 m s−1) and friction velocity (mean: .11 m s−1) far exceeding other types. Driven by this intense horizontal advection and wind shear, the nocturnal boundary layer experienced massive mechanical lifting (mean: ΔPBLH =156.22 m). Furthermore, this intense mechanical mixing effectively breaks the nocturnal surface inversion, bringing slightly warmer air from aloft downward (detailed mechanism analysis is presented in Sect. 3.4.2). This vigorous downward mixing of the elevated residual layer shares conceptual similarities with the nocturnal fumigation-like processes documented in other literature (Wu et al., 2023; He et al., 2022), which also explains the observed positive temperature anomaly (mean: ΔT=0.77 °C). Therefore, despite the high-pressure background, it is this extraordinarily strong localized shear and turbulent mixing, that serves as the primary mechanical driver forcing O3 downward to the surface during WNE-type. Combined with rapid dispersion of local NO emissions under high winds that greatly mitigates nighttime titration, vigorous vertical entrainment counteracts both horizontal diffusion and titration loss of O3, and ultimately causes a net O3 surge.
3.4 Physical mechanisms of NOI days under different weather types
3.4.1 3D regional transport and synoptic subsidence
To explore the triggering factors for the occurrence of NOI days under the four weather types, we investigated the 3D regional backward trajectories and CWT spatial distributions (Figs. 8, 9 and S8). While horizontal advection determines the regional source regions, the vertical profiles of these trajectories provide crucial Lagrangian evidence of downward transport.
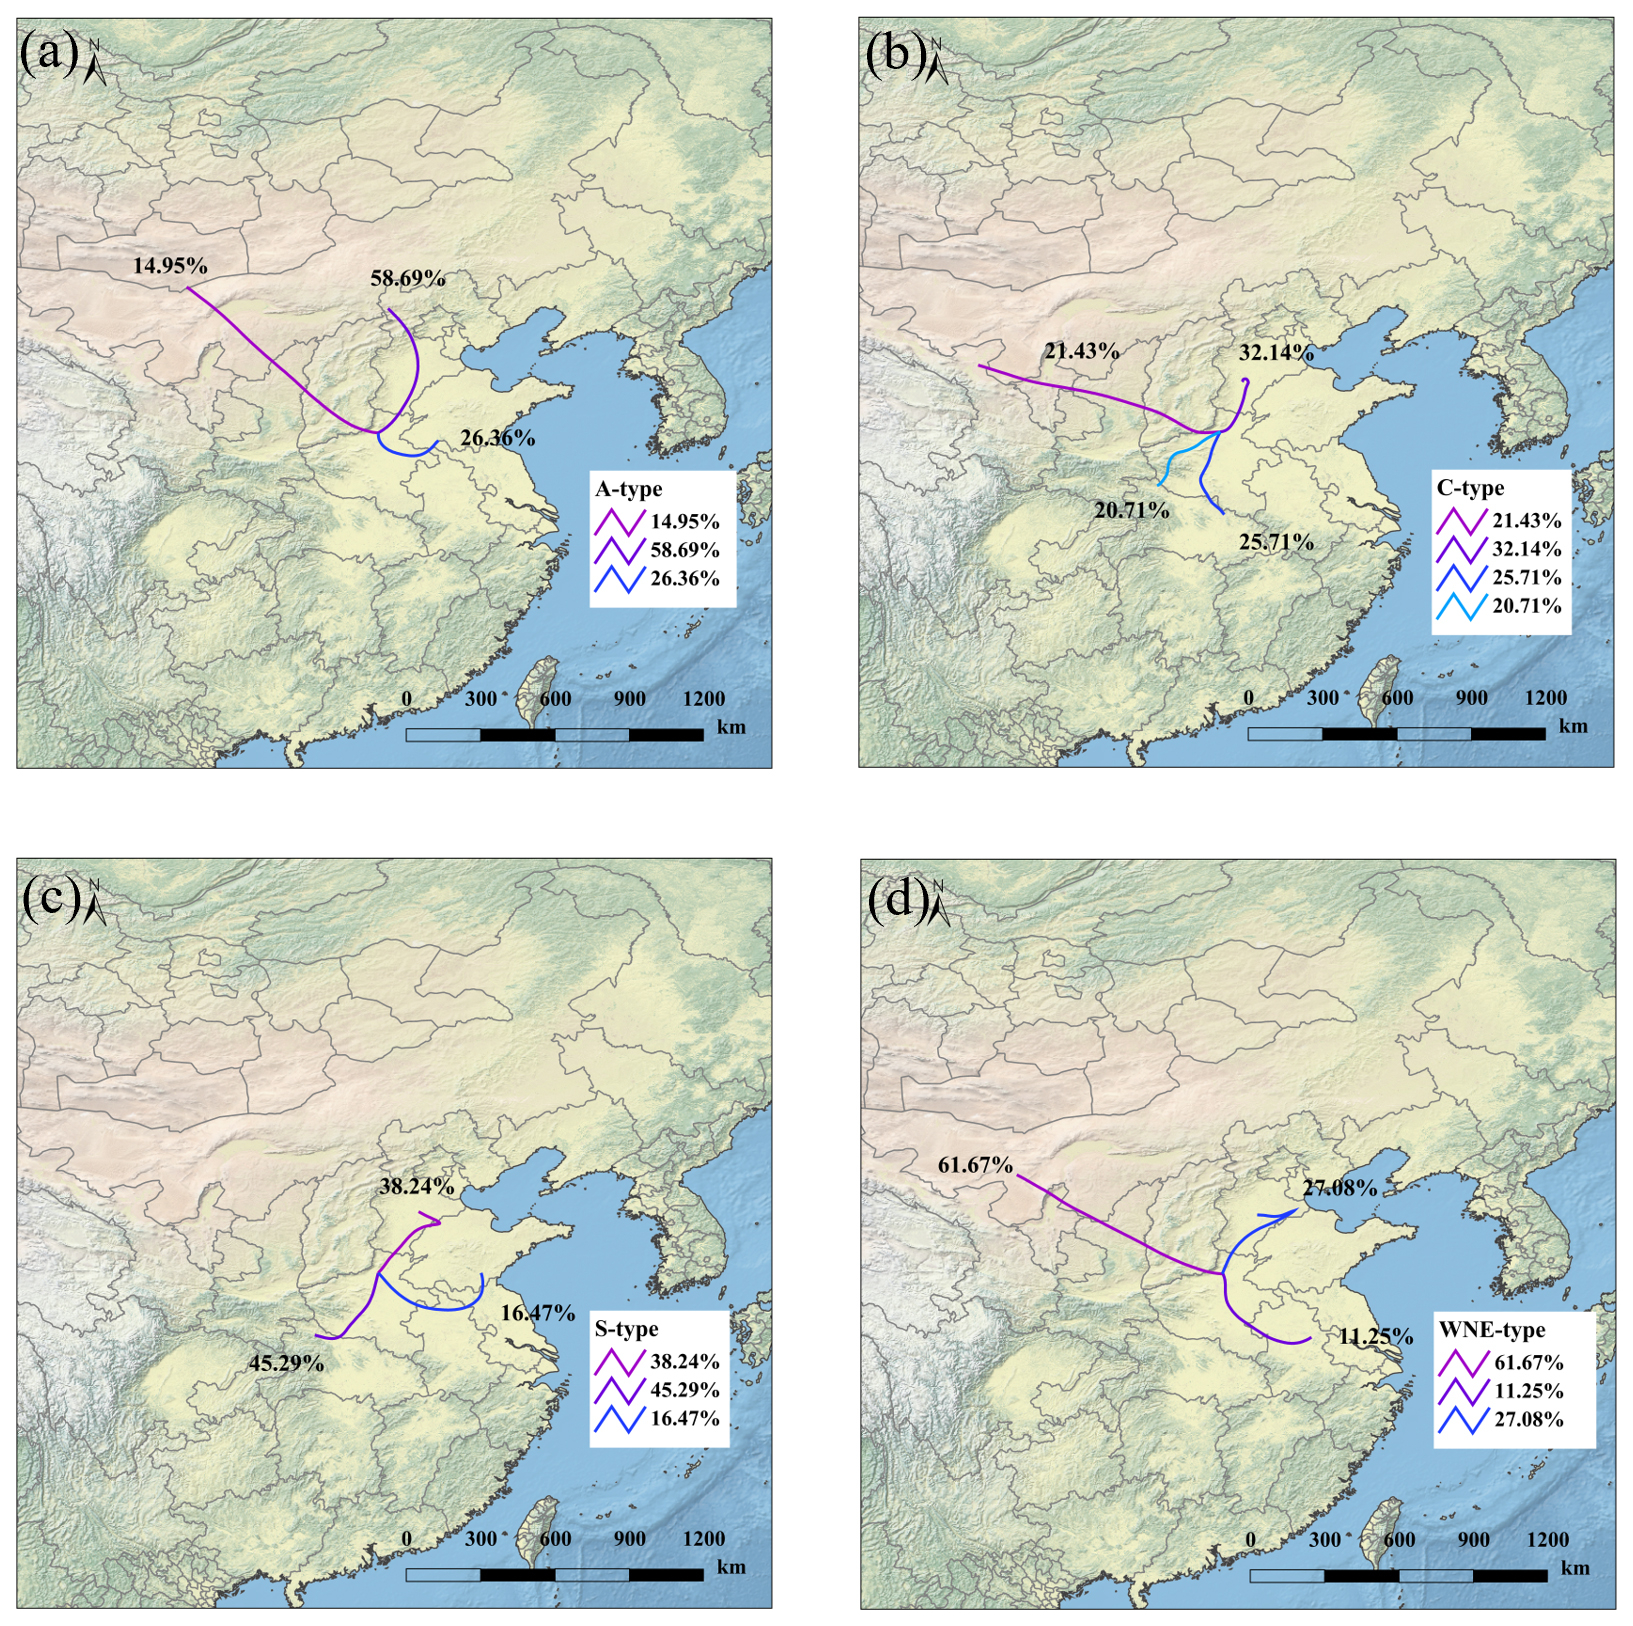
Figure 8Clustered backward trajectories under different weather types: (a) A-type, (b) C-type, (c) S-type, (d) WNE-type. The base maps were created using publicly available geographic data from Natural Earth (https://www.naturalearthdata.com/, last access: 29 October 2026).
Under A-type, air masses predominantly originated from the north (58.69 %) (Fig. 8a). Crucially, the 3D altitude profiles (Fig. S8a–b) reveal that these dominant clusters originated from significantly high altitudes (∼ 800 hPa) 48 h prior, exhibiting continuous and massive subsidence as they approached Xinxiang. When these subsiding trajectories passed over the high O3 potential source areas in northern Henan and western Shandong (CWT: 90–100 µg m−3; Fig. 9a), regions well-documented for their heavy industrial facilities and intense precursor emissions (Lu et al., 2019; Li et al., 2019). During the daytime, these abundant anthropogenic precursors fuel intense photochemical O3 production over these areas. By nightfall, this locally generated O3 is preserved aloft within the residual layer. Consequently, when the large-scale subsiding trajectories passed over these regions during nocturnal hours, they directly entrained this O3-rich air from the residual layer downwards into the surface of our study domain, rather than merely transporting unreacted precursors.
Under C-type, the airflow exhibited shorter trajectories and slower movement. Notably, the trajectory profile (Fig. S8c–d) captures an extremely dramatic vertical intrusion, where a specific cluster (21.43 %) plunged from the lower free troposphere (∼ 700 hPa, > 2000 m) down to the boundary layer. This intense vertical transport, coupled with high CWT values (∼ 80 µg m−3) over central/northern Henan (Fig. 9b), highlights the profound impact of deep vertical exchange driven by the cyclonic system.
Influenced by strong geostrophic winds under S-type, southwest airflow pathways dominated (Fig. 8c). The CWT analysis (Fig. 9c) identified a vast high-value source region (WCWT > 100 µg m−3) encompassing the Central China urban agglomeration to the south, a vast region where intense anthropogenic NOx and VOCs emissions continuously fuel massive daytime photochemical O3 accumulation. The vertical profiles (Fig. S8e–f) confirm that a major portion of this southerly advection (∼ 45.29 %) subsided from the upper boundary layer (∼ 880 hPa). Furthermore, as suggested by the multiple trajectory origins, additional source regions indeed contributed via subsidence. The second-largest cluster (∼ 38.24 %) also exhibited subsiding characteristics, descending from ∼ 910 hPa (originating from the northeast). Meanwhile, the remaining cluster (∼ 16.47 %) represented lower-altitude horizontal transport originating from the southeast. This comprehensively demonstrates that NOI events under S-type are a superimposed result of multi-source origins, where massive downward subsidence from multiple altitudes couples with regional horizontal advection to collectively elevate the nocturnal O3 burden.
Finally, under WNE-type, the horizontal airflow was mainly concentrated on the northwest direction, accounting for 61.67 % (Fig. 8d). The corresponding 3D altitude profiles (Fig. S8g–h) still capture a clear downward transport signal, revealing that this primary cluster originated from the upper residual layer (∼ 800 hPa) 48 h prior and subsided continuously. As these subsiding air masses passed over the potential source regions localized in central and northern Henan (CWT: 70–80 µg m−3; Fig. 9d), they facilitated the downward entrainment and transport of O3 to Xinxiang.
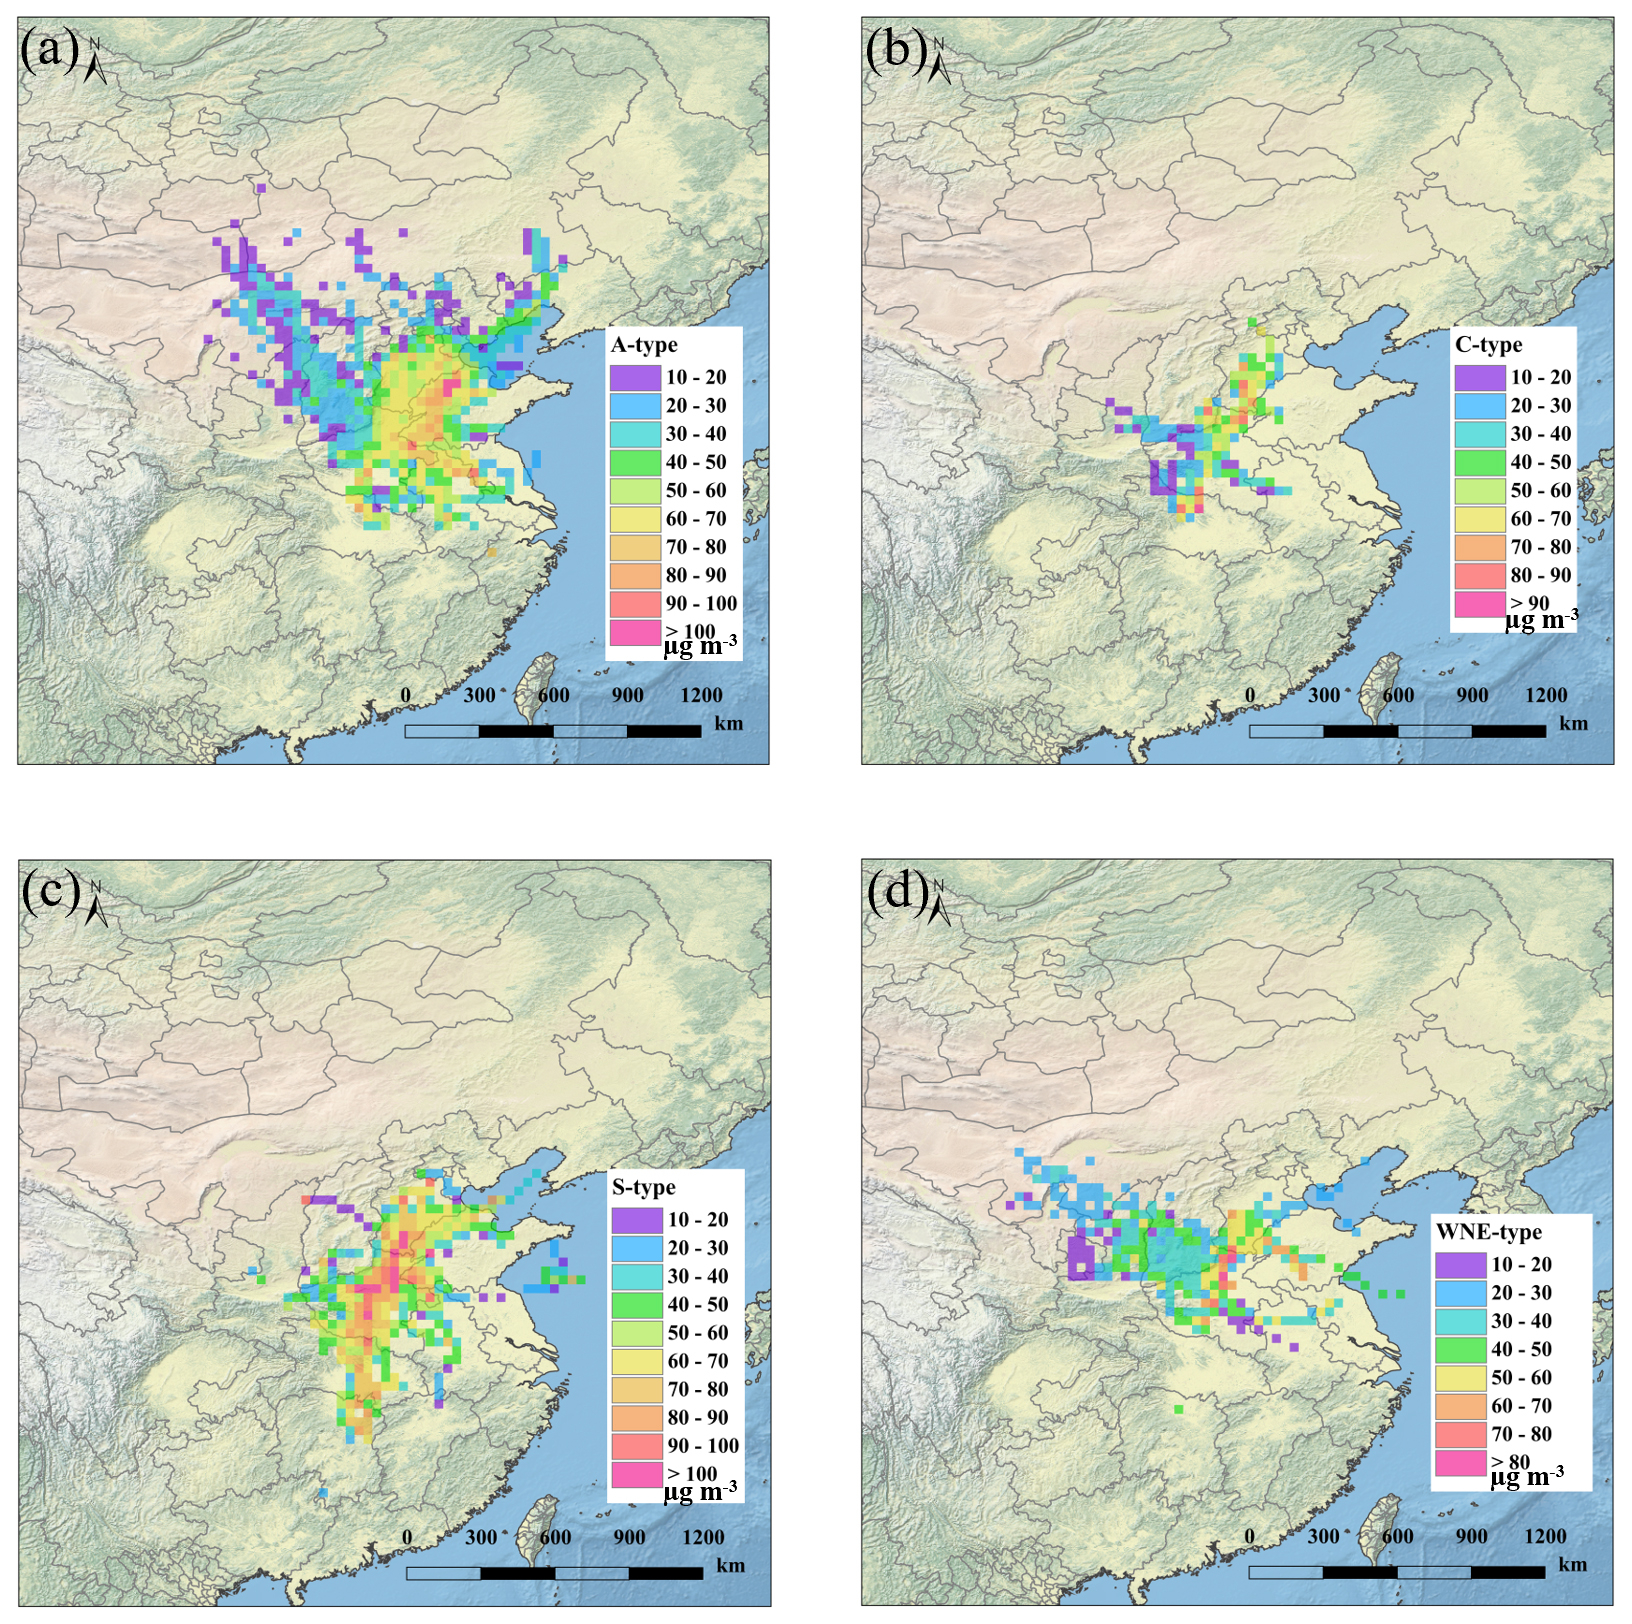
Figure 9Concentration weighted trajectory (CWT) analysis under different weather types: (a) A-type, (b) C-type, (c) S-type, (d) WNE-type. The base maps were created using publicly available geographic data from Natural Earth (https://www.naturalearthdata.com/, last access: 29 October 2026).
In summary, the 3D trajectory analysis demonstrates that the nocturnal O3 spikes in Xinxiang are not merely driven by surface-level horizontal advection. Across all four weather types, the surface-arriving air masses systematically originated from the upper boundary layer or lower free troposphere, providing undeniable Lagrangian evidence of continuous downward O3 transport from high-altitude reservoirs.
3.4.2 Vertical mixing and mechanical triggers
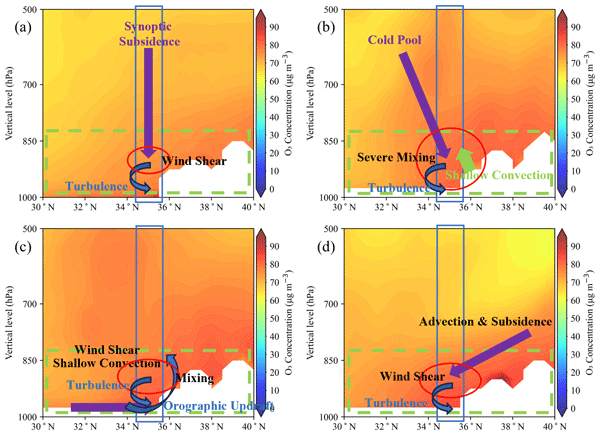
As established in Sect. 3.4.1, 3D trajectories confirm the synoptic delivery of air masses from high altitudes. However, to translate these high-altitude arrivals into surface NOI events, specific vertical transport mechanisms are required. To validate this process, we analyzed the vertical profiles of pressure velocity (Fig. 10), thermodynamic stability (Fig. S9), O3 concentrations (Fig. 12), and surface turbulence metrics (Fig. 11).
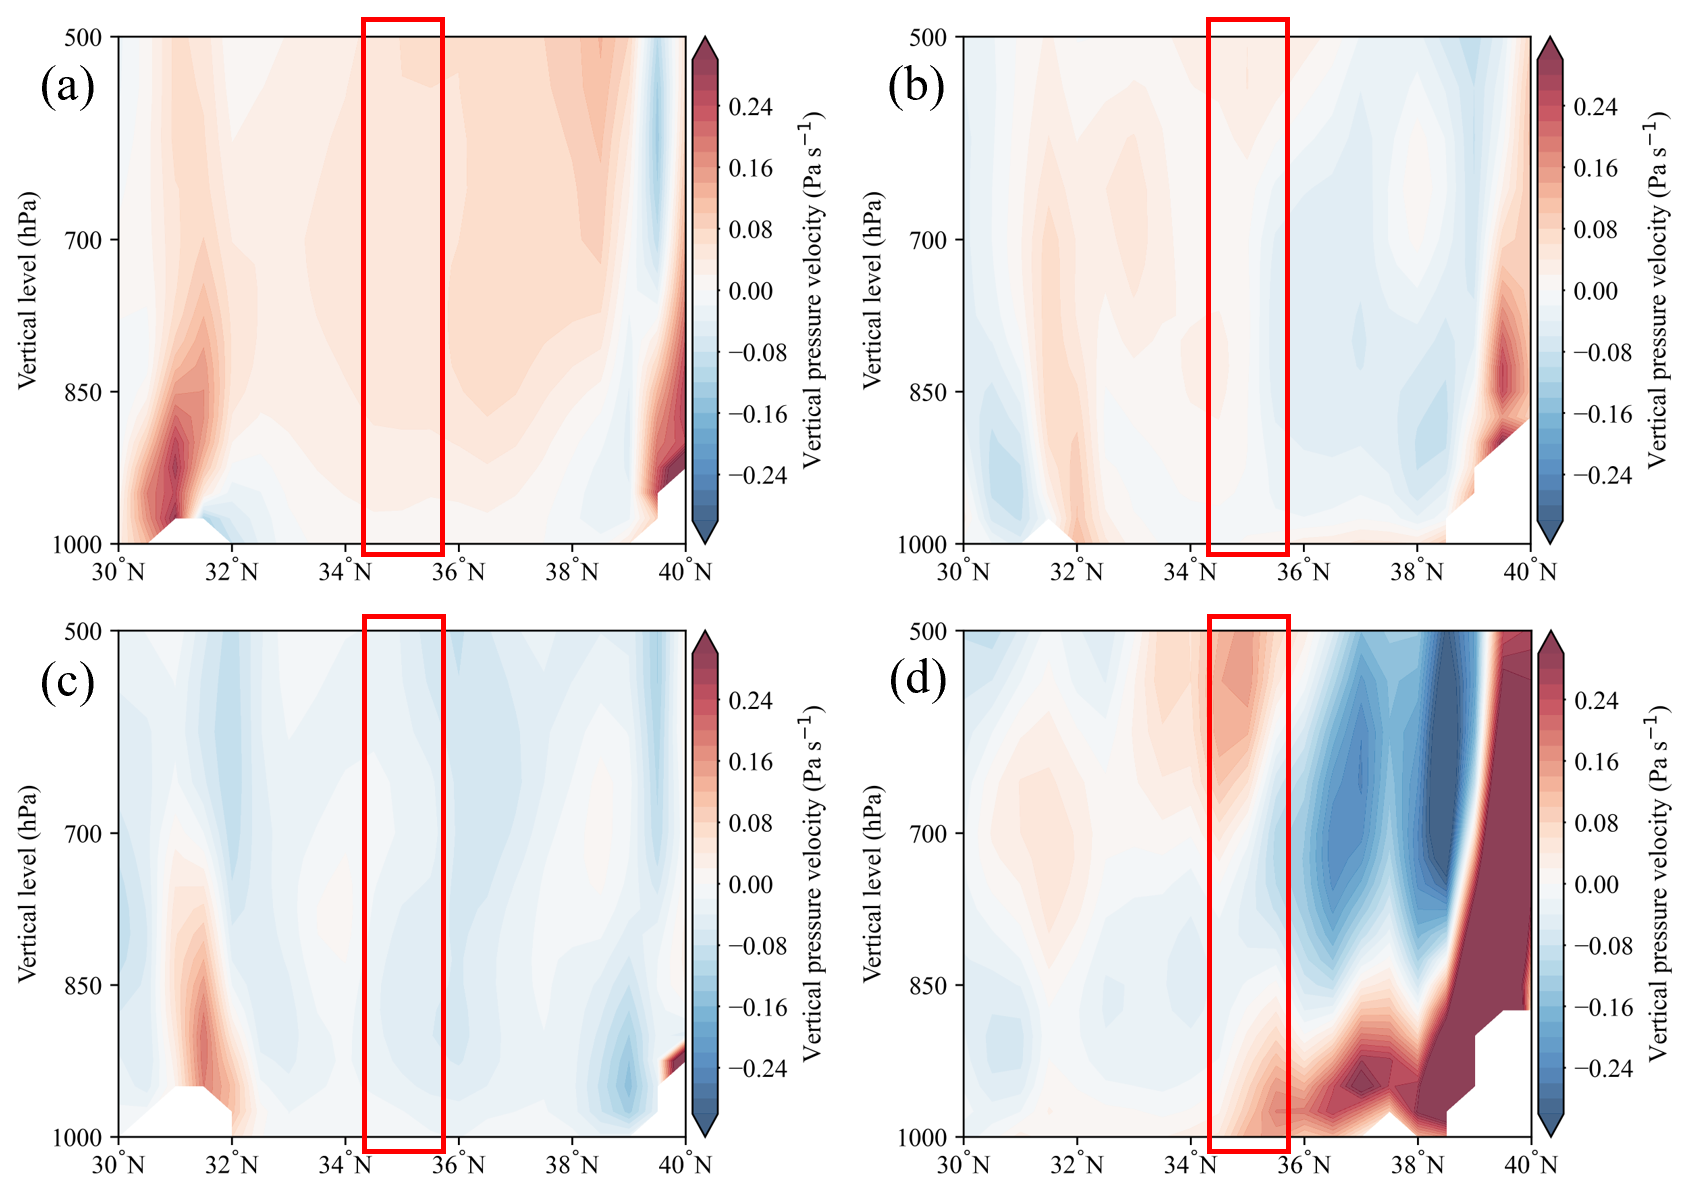
Figure 10Vertical profiles of pressure velocity under different weather types: (a) A-type, (b) C-type, (c) S-type, (d) WNE-type (red rectangles indicate the region of Xinxiang). In terms of vertical pressure velocity, negative values correspond to upward motion, while positive values indicate subsidence.
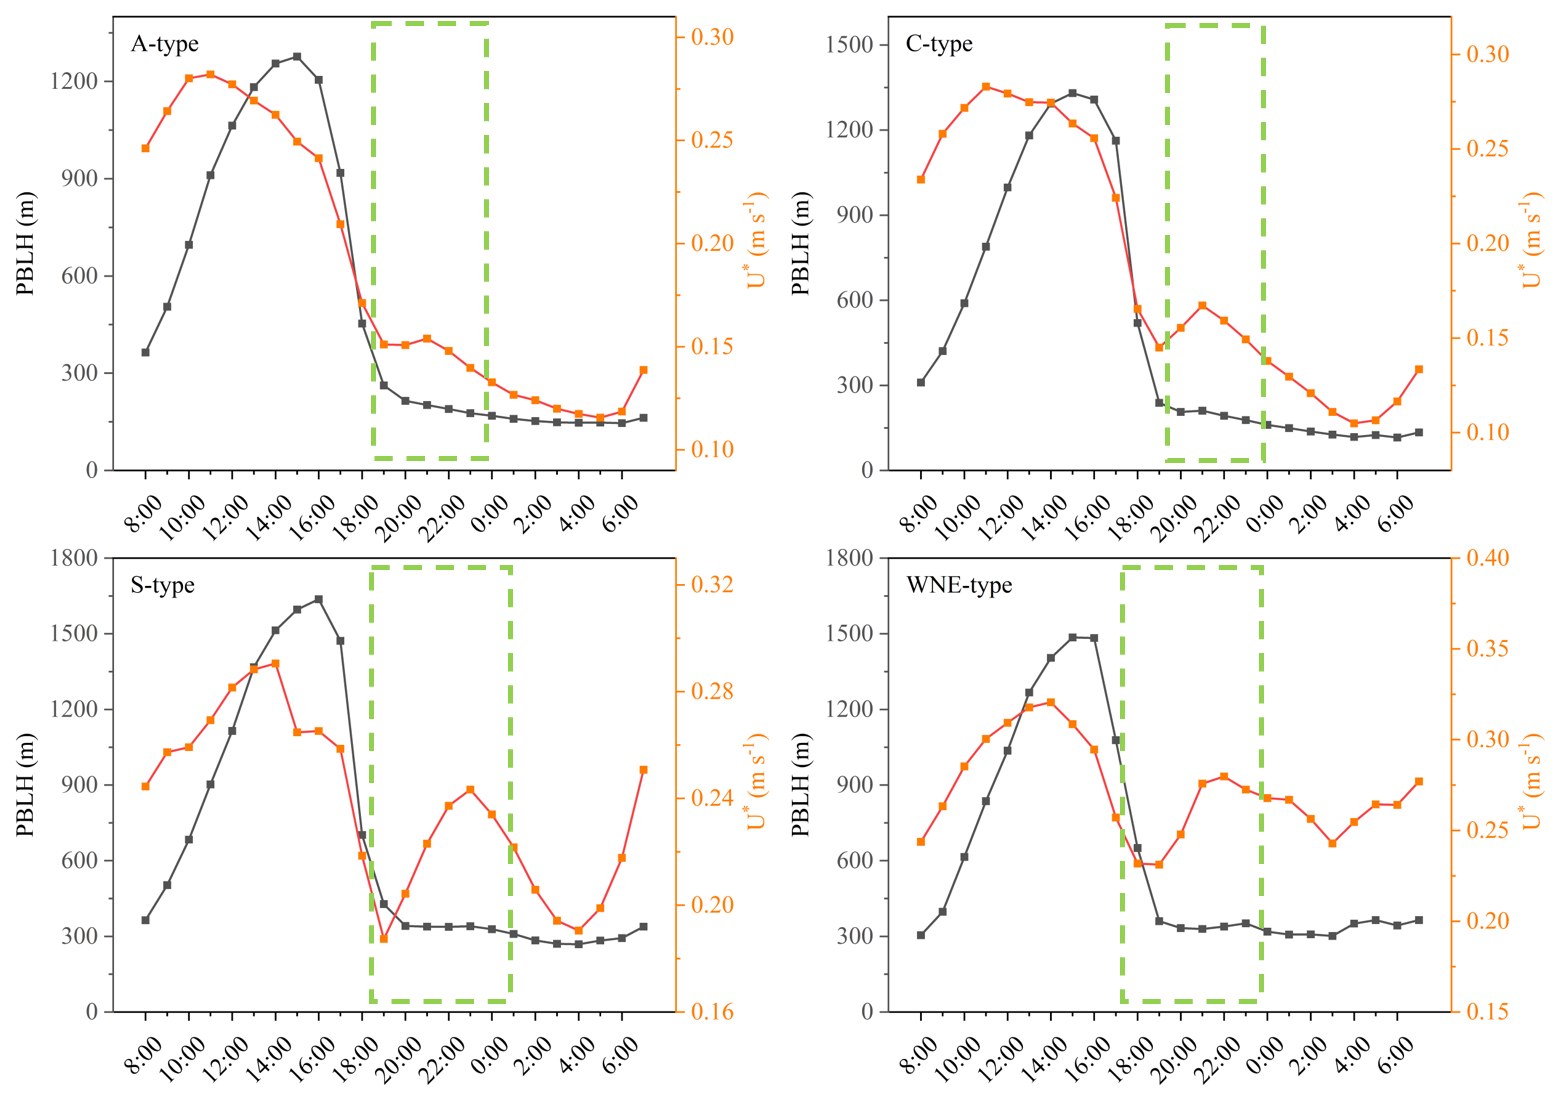
Figure 11Diurnal variations of planetary boundary layer height (PBLH) and friction velocity (U*) in Xinxiang under four weather types (green dashed lines rectangles indicate the fluctuations of PBLH or U* during the night).
The vertical O3 profiles (Fig. 12) first confirm the fundamental prerequisite for NOI across all weather types: following sunset, a distinct nocturnal residual layer (RL) forms, clearly indicated by the high O3 concentrations. Shielded from surface NO titration and dry deposition, this RL successfully retains high daytime O3, serving as the localized O3 reservoir waiting to be tapped by downward forcing.
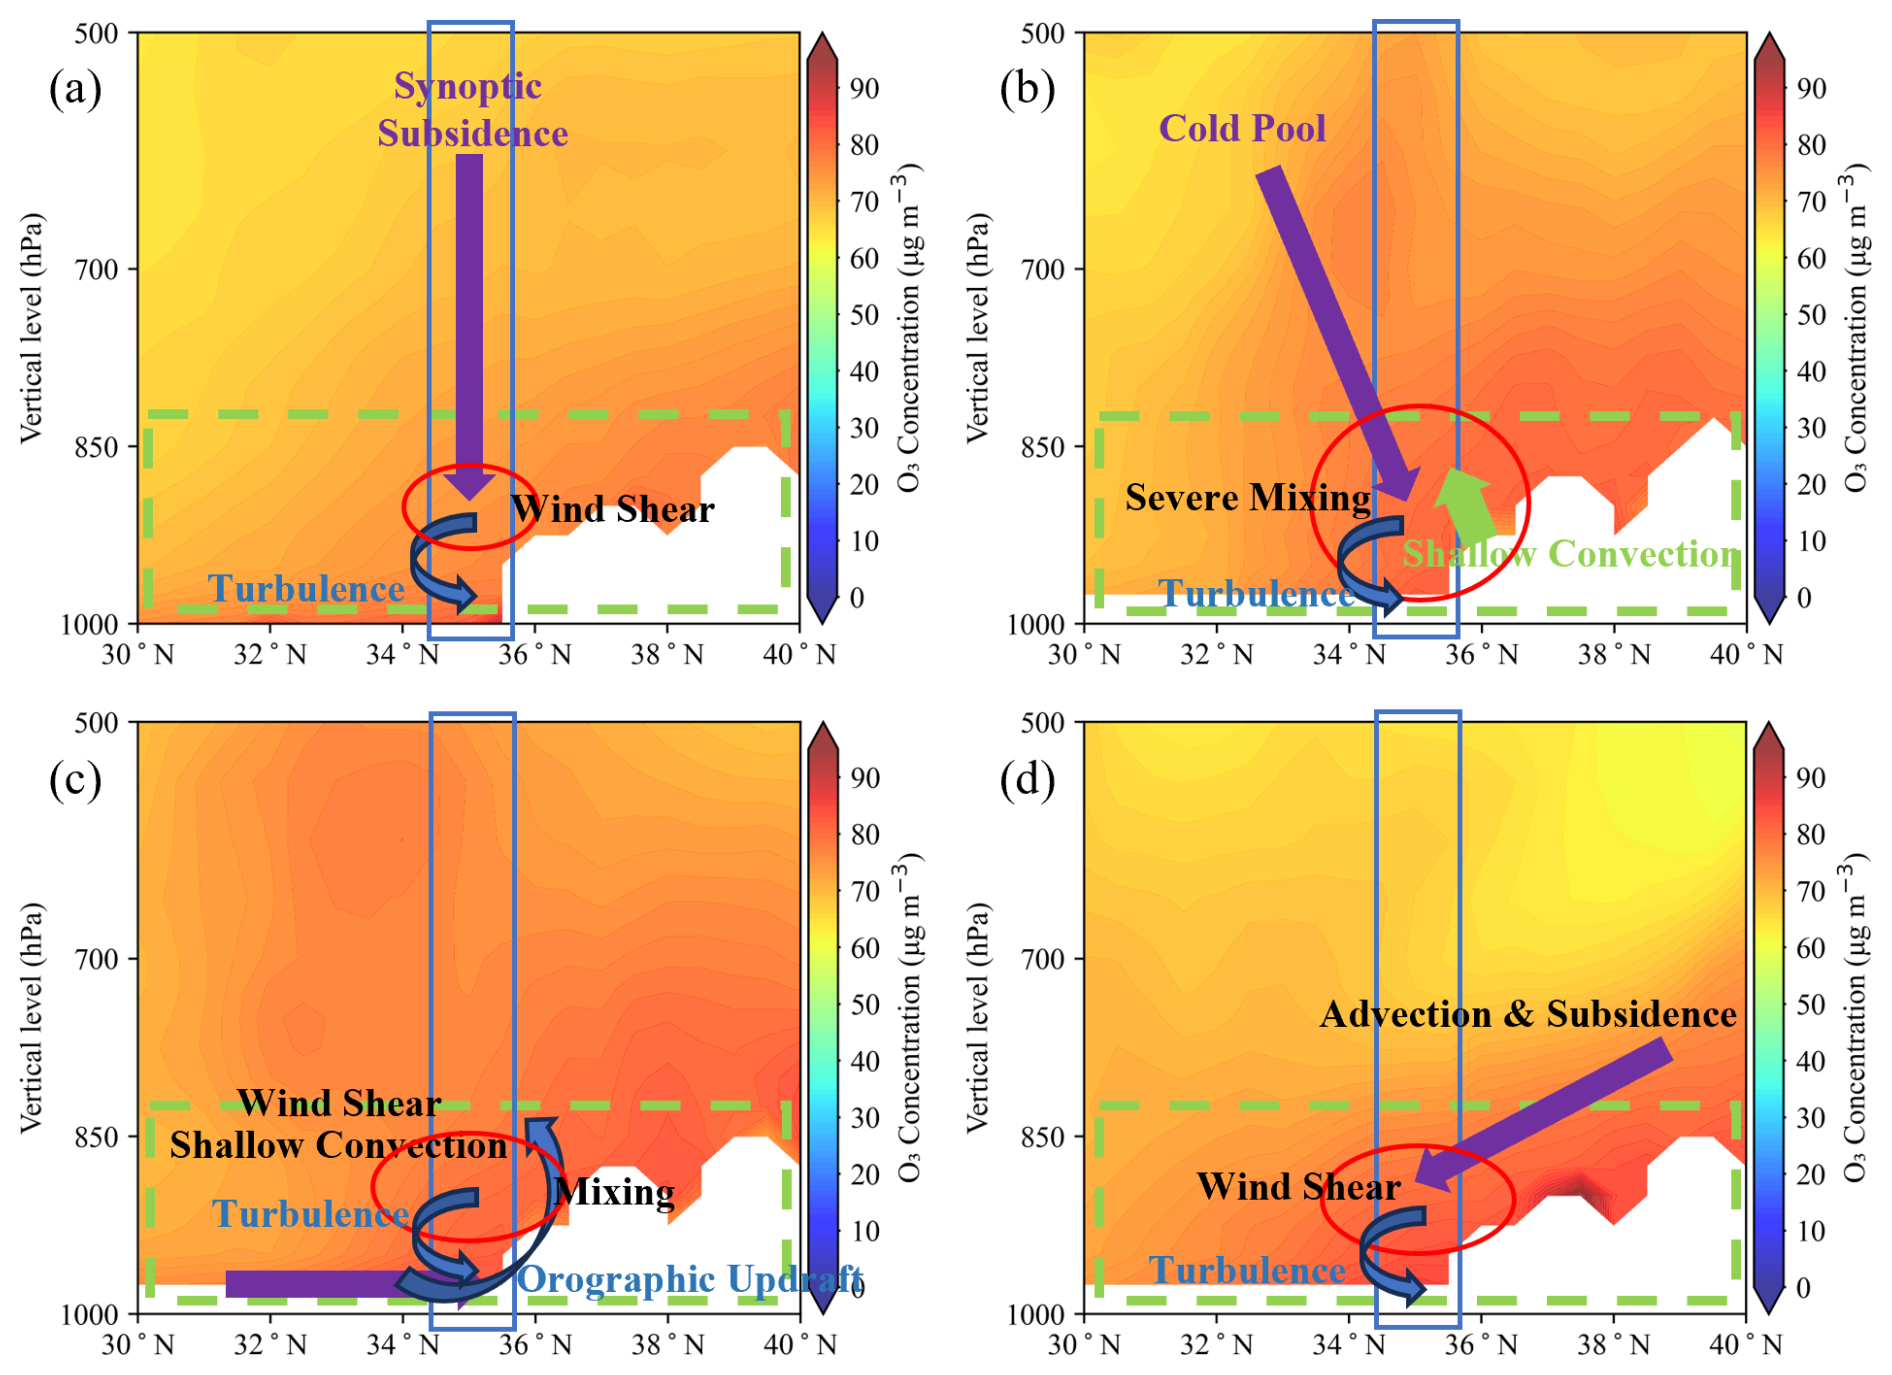
Figure 12Conceptual diagram synthesizing the transport mechanisms of O3 under four weather types: (a) A-type, (b) C-type, (c) S-type, (d) WNE-type. The background contours represent the vertical profiles of average O3 concentrations (green rectangles indicate regions with high O3 concentration), while blue rectangles denote Xinxiang.
For A-type, the intrusion is primarily initiated by the systematic macroscopic subsidence of the continental high-pressure system. As explicitly shown in Fig. 10a, a robust macro-scale downdraft dominates the vertical column over the Xinxiang region. This subsidence induces profound adiabatic compression, forming a significant low-level temperature inversion (1000–950 hPa) accompanied by low mid-level RH (Fig. S9). The inversion layer acts as a dynamic barrier, leading to marked vertical gradients in horizontal wind and sinking velocity and generating localized vertical wind shear. While the overall nocturnal surface environment remains highly stable and suppressed (consistent with the negative mean ΔU* anomaly in Table S2), this localized shear interaction triggers intermittent, transient bursts of mechanical turbulence. These brief turbulent eddies, evidenced by the distinct nocturnal fluctuations in U* (Fig. 11), provide enough mechanical mixing to efficiently entrain the O3-rich air from the residual layer down to the surface.
Under C-type, vertical mixing is dominated by localized mesoscale thermodynamics rather than uniform synoptic subsidence. As seen in Fig. 10b, the vertical velocity field exhibits a complex coexistence of localized downdrafts and updrafts. The thermodynamic profiles (Fig. S9) corroborate this with a temperature inversion and mid-level dry air entrainment. This aligns perfectly with the cold pool mechanism: following convective rainfall, surface evaporative cooling generates a dense, subsiding pool of cold air. Simultaneously, the moderate CAPE values (86–314 J kg−1) indicate residual thermodynamic instability driving localized shallow convection. The intense collision between these subsiding cold pools and localized convective motions creates severe turbulent mixing. This translates into the sharp nocturnal fluctuations in U* (Fig. 11), thereby increasing instability and dragging O3-rich air from the RL into the surface.
The local triggering mechanism under S-type relies fundamentally on intense mechanical shear overriding macro-scale lifting. S-type features strong southerly geostrophic winds. As this intense airflow approaches Xinxiang, it is forced upward by the Taihang Mountains, generating pronounced macro-scale orographic updrafts (Fig. 10c). However, to achieve the downward transport of O3 against this macroscopic background lifting, a highly aggressive, localized boundary-layer mixing mechanism is essential. Specifically, the moderate CAPE values (257–295 J kg−1) indicate persistent thermodynamic instability (Fig. S9), which fuels localized shallow convective motions within the nocturnal boundary layer. Simultaneously, anomalously strong near-surface horizontal winds (mean: ΔWS =0.54 m s−1; Table S2) forcefully interact with surface friction, inducing severe mechanical wind shear. The powerful synergy of this thermal instability and mechanical shear explicitly manifests as massive, sharp nocturnal spikes in U* and PBLH (Table S2 (mean: ΔPBLH =102.41 m, m s−1) and Fig. 11). Ultimately, this exceptionally enhanced turbulent mixing mechanically erodes the stable nocturnal inversion, overpowering the macroscopic updrafts to aggressively drag aloft O3 from the residual layer down to the surface.
Finally, under WNE-type, downward transport is facilitated by an advection-driven mechanical shear mechanism. As explicitly shown in Fig. 10d, the lower troposphere (below 850 hPa) is dominated by intense macro-scale subsidence. This induces a strong temperature inversion and extreme thermodynamic stability, corroborated by low CAPE values (22–23 J kg−1) (Fig. S9), meaning thermal convective motions are completely suppressed. However, WNE-type is simultaneously driven by intense horizontal advection. As this robust horizontal airflow passes over Xinxiang, intense near-surface vertical wind shear is produced. This macroscopic advective forcing translates directly into massive nocturnal spikes in boundary-layer turbulence, explicitly captured by U* and PBLH (Table S2 (mean: ΔPBLH =156.22 m, .11 m s−1) and Fig. 11). This enhanced nocturnal turbulence drives the downward transport of O3 from the residual layer to the surface, thereby triggering the NOI events.
To conceptually synthesize the aforementioned transport mechanisms, we constructed a comprehensive schematic diagram (Fig. 12). This visual summary explicitly illustrates the distinct dynamical pathways for each weather type, highlighting how synoptic forcings and local topography act upon the boundary layer, thereby triggering surface NOI.
This study systematically investigated the synoptic drivers and underlying physical mechanisms governing NOI in a representative city in the North China Plain from 2021 to 2023. A high frequency of 370–444 NOI days was identified, with a distinct seasonal peak during the warm season (March–September). Approximately 69.53 % of these events occurred between 00:00 and 06:00 local time, suggesting that the post-midnight period is highly susceptible to episodic perturbations of atmospheric stability, which facilitate the downward intrusion of O3-rich air from the residual layer to the surface.
Subsequently, based on the Lamb-Jenkinson method, we categorized the synoptic backgrounds into four primary weather types: A-type (57.89 %), S-type (19.88 %), WNE-type (14.04 %), and C-type (8.19 %). Rather than simple seasonal dependencies, the occurrences and varying intensities of NOI were primarily determined by the distinct thermodynamic environments and evolutionary characteristics of these specific synoptic circulations. Specifically, A-type was characterized by a highly stable and suppressed local environment driven by anticyclones; C-type was dominated by low-pressure systems and moist advection, favouring atmospheric instability and convective activities; S-type was driven by a tight synoptic pressure gradient featuring strong southerly geostrophic advection, while WNE-type featured strong northwestern flows interacting with massive continental highs.
Under all four weather types, the development of NOI was significantly influenced by transport processes, which dictated the accumulation of upstream precursors and O3. Furthermore, 3D regional trajectories provided Lagrangian evidence that the surface-arriving air masses systematically subsided from the upper residual layer or lower free troposphere (∼ 880 to 700 hPa). Ultimately, translating these high-altitude arrivals into surface NOI events relied on distinct local mechanical triggers. Under A-type, vertical transport was driven by systematic high-pressure subsidence; C-type was primarily triggered by severe mesoscale mixing from colliding cold-pool downdrafts and shallow convective motions; S-type was heavily dependent on a powerful synergy of localized convective instability and mechanical shear to overpower macro-scale orographic updrafts; WNE-type was facilitated by an advection-driven mechanical shear mechanism that overwhelmed the thermodynamic stability.
Overall, our results demonstrate how synoptic-scale circulations and local boundary-layer dynamics couple to cause NOI events. From an operational forecasting perspective, anticipating these events requires a hierarchical monitoring framework. As suggested by our findings, early warning systems should first track the onset of the identified primary synoptic weather types to anticipate large-scale subsidence and advection. Crucially, this macro-scale tracking must be combined with the real-time monitoring of localized boundary-layer metrics, particularly U* and PBLH, which serve as the direct mechanical triggers for downward transport. This combined approach of monitoring synoptic forcings alongside localized turbulent triggers offers an important physical perspective on the nocturnal O3 budget and provides actionable guidance for developing precise early warning systems and dynamic pollution control strategies in urban environments.
The Global Data Assimilation System (GDAS1) dataset from the National Centers for Environmental Prediction (NCEP) is available at ftp://arlftp.arlhq.noaa.gov/pub/archives/gdas1 (last access: 3 December 2025). The ERA5 reanalysis data can be accessed via https://www.ecmwf.int/en/forecasts/dataset/ecmwf-reanalysis-v5 (last access: 3 December 2025). The MERRA-2 data is obtained from https://gmao.gsfc.nasa.gov/gmao-products/merra-2 (last access: 3 December 2025).
The supplement related to this article is available online at https://doi.org/10.5194/acp-26-15523-2026-supplement.
HW and LF designed the research. HW conducted data analysis and simulations, with all co-authors advancing the overall analysis further. HW wrote the paper with support from all co-authors.
The contact author has declared that none of the authors has any competing interests.
Publisher's note: Copernicus Publications remains neutral with regard to jurisdictional claims made in the text, published maps, institutional affiliations, or any other geographical representation in this paper. The authors bear the ultimate responsibility for providing appropriate place names. Views expressed in the text are those of the authors and do not necessarily reflect the views of the publisher.
This work was supported by the Demonstration research project on collaborative prevention and control of fine particulate matter and ozone pollution in Xinxiang (DQGG202133).
This paper was edited by Xavier Querol and reviewed by three anonymous referees.
Bell, B., Hersbach, H., Simmons, A., Berrisford, P., Dahlgren, P., Horányi, A., Muñoz-Sabater, J., Nicolas, J., Radu, R., Schepers, D., Soci, C., Villaume, S., Bidlot, J. R., Haimberger, L., Woollen, J., Buontempo, C., and Thépaut, J. N.: The ERA5 global reanalysis: Preliminary extension to 1950, Q. J. Roy. Meteor. Soc., 147, 4186–4227, https://doi.org/10.1002/qj.4174, 2021.
Chen, X., Huang, B., Li, M., Xiao, R., Cai, M., Zhou, Z., Ma, S., Gao, W., and Zhou, Z.: A prediction index of the volatile organic compounds pollution conditions in a chemical industrial park based on atmospheric stability, Sci. Total Environ., 919, 170862, https://doi.org/10.1016/j.scitotenv.2024.170862, 2024a.
Chen, Z., Liu, R., Wu, S., Xu, J., Wu, Y., and Qi, S.: Diurnal variation characteristics and meteorological causes of autumn ozone in the Pearl River Delta, China, Sci. Total Environ., 908, 168469, https://doi.org/10.1016/j.scitotenv.2023.168469, 2024b.
Cheng, J., Tong, S., Su, H., and Xu, Z.: Association between sub-daily exposure to ambient air pollution and risk of asthma exacerbations in Australian children, Environ. Res., 212, 113556, https://doi.org/10.1016/j.envres.2022.113556, 2022.
Cheng, X., Yu, J., Chen, L., Sun, Y., Zhang, H., Gao, S., Kong, S., Zheng, H., and Wang, H.: Influence of pollution control measures on the reduction of black carbon in an urban site of megacity, Tianjin, China based on ground-monitored and MERRA-2 reanalysis data, Sci. Total Environ., 912, 169466, https://doi.org/10.1016/j.scitotenv.2023.169466, 2024.
Chowdhury, F. I., Arteaga, C., Alam, M. S., Alam, I., and Resco de Dios, V.: Drivers of nocturnal stomatal conductance in C3 and C4 plants, Sci. Total Environ., 814, 151952, https://doi.org/10.1016/j.scitotenv.2021.151952, 2022.
Dong, Y., Li, J., Guo, J., Jiang, Z., Chu, Y., Chang, L., Yang, Y., and Liao, H.: The impact of synoptic patterns on summertime ozone pollution in the North China Plain, Sci. Total Environ., 735, 139559, https://doi.org/10.1016/j.scitotenv.2020.139559, 2020.
Duan, W., Chen, M., Huang, S., Dai, M., Wang, X., and Xu, L.: PM2.5 prediction based on Lamb-Jenkinson method and LSTM neural network, Environ. Sci. Technol., 43, 92-97, https://doi.org/10.19672/j.cnki.1003-6504.2020.01.014, 2020.
Gelaro, R., McCarty, W., Suárez, M. J., Todling, R., Molod, A., Takacs, L., Randles, C. A., Darmenov, A., Bosilovich, M. G., Reichle, R., Wargan, K., Coy, L., Cullather, R., Draper, C., Akella, S., Buchard, V., Conaty, A., da Silva, A. M., Gu, W., Kim, G.-K., Koster, R., Lucchesi, R., Merkova, D., Nielsen, J. E., Partyka, G., Pawson, S., Putman, W., Rienecker, M., Schubert, S. D., Sienkiewicz, M., and Zhao, B.: The modern-era retrospective analysis for research and applications, version 2 (MERRA-2), J. Climate, 30, 5419–5454, https://doi.org/10.1175/JCLI-D-16-0758.1, 2017.
Gilardi, L., Marconcini, M., Metz-Marconcini, A., Esch, T., and Erbertseder, T.: Long-term exposure and health risk assessment from air pollution: impact of regional scale mobility, Int. J. Health Geogr., 22, 11, https://doi.org/10.1186/s12942-023-00333-8, 2023.
He, C., Lu, X., Wang, H., Wang, H., Li, Y., He, G., He, Y., Wang, Y., Zhang, Y., Liu, Y., Fan, Q., and Fan, S.: The unexpected high frequency of nocturnal surface ozone enhancement events over China: characteristics and mechanisms, Atmos. Chem. Phys., 22, 15243–15261, https://doi.org/10.5194/acp-22-15243-2022, 2022.
He, Y., Wang, H., Wang, H., Xu, X., Li, Y., and Fan, S.: Meteorology and topographic influences on nocturnal ozone increase during the summertime over Shaoguan, China, Atmos. Environ., 256, 118459, https://doi.org/10.1016/j.atmosenv.2021.118459, 2021.
Hersbach, H., Bell, B., Berrisford, P., Hirahara, S., Horányi, A., Muñoz-Sabater, J., Nicolas, J., Peubey, C., Radu, R., Schepers, D., Simmons, A., Soci, C., Abdalla, S., Abellan, X., Balsamo, G., Bechtold, P., Biavati, G., Bidlot, J., Bonavita, M., De Chiara, G., Dahlgren, P., Dee, D., Diamantakis, M., Dragani, R., Flemming, J., Forbes, R., Fuentes, M., Geer, A., Haimberger, L., Healy, S., Hogan, R. J., Hólm, E., Janisková, M., Keeley, S., Laloyaux, P., Lopez, P., Lupu, C., Radnoti, G., de Rosnay, P., Rozum, I., Vamborg, F., Villaume, S., and Thépaut, J. N.: The ERA5 global reanalysis, Q. J. Roy. Meteor. Soc., 146, 1999–2049, https://doi.org/10.1002/qj.3803, 2020.
Hoshika, Y., De Carlo, A., Baraldi, R., Neri, L., Carrari, E., Agathokleous, E., Zhang, L., Fares, S., and Paoletti, E.: Ozone-induced impairment of night-time stomatal closure in O3-sensitive poplar clone is affected by nitrogen but not by phosphorus enrichment, Sci. Total Environ., 692, 713–722, https://doi.org/10.1016/j.scitotenv.2019.07.288, 2019.
Ji, X., Hong, Y., Lin, Y., Xu, K., Chen, G., Liu, T., Xu, L., Li, M., Fan, X., Wang, H., Zhang, H., Chen, Y., Yang, C., Lin, Z., and Chen, J.: Impacts of synoptic patterns and meteorological factors on distribution trends of ozone in Southeast China during 2015–2020, J. Geophys. Res.-Atmos., 128, e2022JD037961, https://doi.org/10.1029/2022JD037961, 2023.
Li, K., Jacob, D. J., Shen, L., Lu, X., De Smedt, I., and Liao, H.: Increases in surface ozone pollution in China from 2013 to 2019: anthropogenic and meteorological influences, Atmos. Chem. Phys., 20, 11423–11433, https://doi.org/10.5194/acp-20-11423-2020, 2020.
Li, L., Xie, F., Li, J., Gong, K., Xie, X., Qin, Y., Qin, M., and Hu, J.: Diagnostic analysis of regional ozone pollution in Yangtze River Delta, China: A case study in summer 2020, Sci. Total Environ., 812, 151511, https://doi.org/10.1016/j.scitotenv.2021.151511, 2022a.
Li, M., Zhang, Q., Zheng, B., Tong, D., Lei, Y., Liu, F., Hong, C., Kang, S., Yan, L., Zhang, Y., Bo, Y., Su, H., Cheng, Y., and He, K.: Persistent growth of anthropogenic non-methane volatile organic compound (NMVOC) emissions in China during 1990–2017: drivers, speciation and ozone formation potential, Atmos. Chem. Phys., 19, 8897–8913, https://doi.org/10.5194/acp-19-8897-2019, 2019.
Li, T., Wu, N., Chen, J., Chan, P.-W., Tang, J., and Wang, N.: Vertical exchange and cross-regional transport of lower-tropospheric ozone over Hong Kong, Atmos. Res., 292, 106877, https://doi.org/10.1016/j.atmosres.2023.106877, 2023.
Li, X.-B., Yuan, B., Wang, S., Wang, C., Lan, J., Liu, Z., Song, Y., He, X., Huangfu, Y., Pei, C., Cheng, P., Yang, S., Qi, J., Wu, C., Huang, S., You, Y., Chang, M., Zheng, H., Yang, W., Wang, X., and Shao, M.: Variations and sources of volatile organic compounds (VOCs) in urban region: insights from measurements on a tall tower, Atmos. Chem. Phys., 22, 10567–10587, https://doi.org/10.5194/acp-22-10567-2022, 2022b.
Liang, D., Yan, H., Tian, Y., Liu, Y., Hao, S., Bai, H., Zhang, G., and Deng, W.: Identification of key controlling factors of ozone pollution in Jinan, northern China over 2013–2020, Front. Ecol. Evol., 10, 930569, https://doi.org/10.3389/fevo.2022.930569, 2022.
Liu, B., Wang, L., Zhang, L., Liao, Z., Wang, Y., Sun, Y., Xin, J., and Hu, B.: Analysis of severe ozone–related human health and weather influence over China in 2019 based on a high-resolution dataset, Environ. Sci. Pollut. Res. Int., 30, 111536-111551, https://doi.org/10.1007/s11356-023-30178-4, 2023.
Liu, J., Wang, L., Li, M., Liao, Z., Sun, Y., Song, T., Gao, W., Wang, Y., Li, Y., Ji, D., Hu, B., Kerminen, V.-M., Wang, Y., and Kulmala, M.: Quantifying the impact of synoptic circulation patterns on ozone variability in northern China from April to October 2013–2017, Atmos. Chem. Phys., 19, 14477–14492, https://doi.org/10.5194/acp-19-14477-2019, 2019.
Liu, N., He, G., Wang, H., He, C., Wang, H., Liu, C., Wang, Y., Wang, H., Li, L., Lu, X., and Fan, S.: Rising frequency of ozone-favorable synoptic weather patterns contributes to 2015–2022 ozone increase in Guangzhou, J. Environ. Sci., 148, 502–514, https://doi.org/10.1016/j.jes.2023.09.024, 2025.
Lu, X., Zhang, L., Chen, Y., Zhou, M., Zheng, B., Li, K., Liu, Y., Lin, J., Fu, T.-M., and Zhang, Q.: Exploring 2016–2017 surface ozone pollution over China: source contributions and meteorological influences, Atmos. Chem. Phys., 19, 8339–8361, https://doi.org/10.5194/acp-19-8339-2019, 2019.
Molod, A., Takacs, L., Suarez, M., and Bacmeister, J.: Development of the GEOS-5 atmospheric general circulation model: evolution from MERRA to MERRA2, Geosci. Model Dev., 8, 1339–1356, https://doi.org/10.5194/gmd-8-1339-2015, 2015.
Monks, P. S., Granier, C., Fuzzi, S., Stohl, A., Williams, M. L., Akimoto, H., Amann, M., Baklanov, A., Baltensperger, U., Bey, I., Blake, N., Blake, R. S., Carslaw, K., Cooper, O. R., Dentener, F., Fowler, D., Fragkou, E., Frost, G. J., Generoso, S., Ginoux, P., Grewe, V., Guenther, A., Hansson, H. C., Henne, S., Hjorth, J., Hofzumahaus, A., Huntrieser, H., Isaksen, I. S. A., Jenkin, M. E., Kaiser, J., Kanakidou, M., Klimont, Z., Kulmala, M., Laj, P., Lawrence, M. G., Lee, J. D., Liousse, C., Maione, M., McFiggans, G., Metzger, A., Mieville, A., Moussiopoulos, N., Orlando, J. J., O'Dowd, C. D., Palmer, P. I., Parrish, D. D., Petzold, A., Platt, U., Pöschl, U., Prévôt, A. S. H., Reeves, C. E., Reimann, S., Rudich, Y., Sellegri, K., Steinbrecher, R., Simpson, D., ten Brink, H., Theloke, J., van der Werf, G. R., Vautard, R., Vestreng, V., Vlachokostas, C., and von Glasow, R.: Atmospheric composition change – global and regional air quality, Atmos. Environ., 43, 5268–5350, https://doi.org/10.1016/j.atmosenv.2009.08.021, 2009.
Nair, P. R., Chand, D., Lal, S., Modh, K. S., Naja, M., Parameswaran, K., Ravindran, S., and Venkataramani, S.: Temporal variations in surface ozone at Thumba (8.6°N, 77°E)-a tropical coastal site in India, Atmos. Environ., 36, 603–610, https://doi.org/10.1016/S1352-2310(01)00527-1, 2002.
Paoletti, E.: Ozone and Mediterranean ecology: plants, people, problems, Environ. Pollut., 157, 1397–1398, https://doi.org/10.1016/j.envpol.2009.03.001, 2009.
Sánchez, M. L., De Torre, B., García, M. A., and Pérez, I.: Ozone concentrations at a high altitude station in the Central Massif (Spain), Chemosphere, 60, 576–584, https://doi.org/10.1016/j.chemosphere.2004.12.079, 2005.
Shen, L., Diao, Y., Zhao, T., Gu, X., and Shi, S. S.: Meteorological influence on persistent O3 pollution events in Wuxi in the Yangtze River Delta, China, Sci. Total Environ., 917, 170484, https://doi.org/10.1016/j.scitotenv.2024.170484, 2024.
Shi, J., Wu, X., Han, X., Zhong, Y., Wang, Z., and Ning, P.: Characterization and sources of carbonaceous aerosols in southwest plateau of China: Effects of biomass burning and low oxygen concentration, Atmos. Environ., 318, 120250, https://doi.org/10.1016/j.atmosenv.2023.120250, 2024.
Song, A., Yan, Y., Kong, S., Ma, J., and Tong, Z.: Impact of synoptic climate system interaction on surface ozone in China during 1950–2014, Atmos. Environ., 279, 119126, https://doi.org/10.1016/j.atmosenv.2022.119126, 2022.
Stein, A. F., Draxler, R. R., Rolph, G. D., Stunder, B. J., Cohen, M. D., and Ngan, F.: NOAA's HYSPLIT atmospheric transport and dispersion modeling system, B. Am. Meteorol. Soc., 96, 2059–2077, https://doi.org/10.1175/BAMS-D-14-00110.1, 2015.
Wang, D., Zhou, J., Han, L., Tian, W., Wang, C., Li, Y., and Chen, J.: Source apportionment of VOCs and ozone formation potential and transport in Chengdu, China, Atmos. Pollut. Res., 14, 101730, https://doi.org/10.1016/j.apr.2023.101730, 2023a.
Wang, G., Liu, X., Kong, F., Zhu, Z., Yan, P., Gao, W., and Zhao, N.: Characteristics of fine particulate matter in Linyi during the 24th Olympic winter Games: An insight into the components, sources, transport pathways, and source distribution, Atmos. Pollut. Res., 15, 102034, https://doi.org/10.1016/j.apr.2023.102034, 2024.
Wang, H., Fan, L., Deng, X., Huang, H., and Ye, D.: Research on the characteristics and triggering factors of concurrent events of ozone pollution and nocturnal ozone increase in Xinxiang, China, Atmos. Environ., 361, 121494, https://doi.org/10.1016/j.atmosenv.2025.121494, 2025.
Wang, H., Wang, H., Lu, X., Lu, K., Zhang, L., Tham, Y. J., Shi, Z., Aikin, K., Fan, S., Brown, S. S., and Zhang, Y.: Increased night-time oxidation over China despite widespread decrease across the globe, Nat. Geosci., 16, 217-223, https://doi.org/10.1038/s41561-022-01122-x, 2023b.
Wang, K., Xie, F., Sulaymon, I. D., Gong, K., Li, N., Li, J., and Hu, J.: Understanding the nocturnal ozone increase in Nanjing, China: Insights from observations and numerical simulations, Sci. Total Environ., 859, 160211, https://doi.org/10.1016/j.scitotenv.2022.160211, 2023c.
Wang, Y., Liu, R., and Xin, F.: Impact of atmospheric circulation patterns on ozone changes in the Pearl River Delta from 2015 to 2020, Environ. Sci., 44, 3080–3088, https://doi.org/10.13227/j.hjkx.202206106, 2023d.
Wu, J., Li, C., Ma, Z., Sun, Z., Zhu, X., and Dong, F.: Influence of meteorological conditions on ozone pollution at Shangdianzi station based on weather classification, Environ. Sci., 41, 4864–4873, https://doi.org/10.13227/j.hjkx.202003307, 2020.
Wu, Y., Chen, W., You, Y., Xie, Q., Jia, S., and Wang, X.: Quantitative impacts of vertical transport on the long-term trend of nocturnal ozone increase over the Pearl River Delta region during 2006–2019, Atmos. Chem. Phys., 23, 453–469, https://doi.org/10.5194/acp-23-453-2023, 2023.
Xu, J., Huang, X., Wang, N., Li, Y., and Ding, A.: Understanding ozone pollution in the Yangtze River Delta of eastern China from the perspective of diurnal cycles, Sci. Total Environ., 752, 141928, https://doi.org/10.1016/j.scitotenv.2020.141928, 2021.
Xue, Y., Wang, L., Jing, Y., Zhang, T., He, S., Ho, K. F., Huang, Y., Chen, L., Cui, L., and Cao, J.: Asian monsoon and local valley wind caused transport of volatile organic compounds episode across Qinling Mountain in China, J. Geophys. Res.-Atmos., 128, e2022JD038256, https://doi.org/10.1029/2022JD038256, 2023.
You, Y., Wang, X., Wu, Y., Chen, W., Chen, B., and Chang, M.: Quantified the influence of different synoptic weather patterns on the transport and local production processes of O3 events in Pearl River Delta, China, Sci. Total Environ., 912, 169066, https://doi.org/10.1016/j.scitotenv.2023.169066, 2024.
Zhang, Y., Li, J., Li, J., Pan, X., Wang, W., Zhu, L., Wang, Z., Chen, X., Yang, W., and Wang, Z.: An intercomparison of ozone taken from the Copernicus atmosphere monitoring service and the second Modern-Era retrospective analysis for research and applications over China during 2018 and 2019, J. Environ. Sci., 114, 514–525, https://doi.org/10.1016/j.jes.2022.01.045, 2022.
Zhao, Y., An, X., Sun, Z., Li, Y., and Hou, Q.: Identification of health effects of complex air pollution in China, Int. J. Env. Res. Pub. He., 19, 12652, https://doi.org/10.3390/ijerph191912652, 2022.
Zhou, M., Zeng, Y., Li, J., Zhou, Y., Zhu, D., Luo, C., Zhuang, Y., Zhang, C., Wang, B., and Situ, S.: lmpact of atmospheric circulation patterns and volatile organic compounds on ozone pollution in Foshan City, Guangdong Province, Acta Sci. Circumst., 43, 215–225, https://doi.org/10.13671/j.hjkxxb.2023.0121, 2023.
Zhu, L., Han, X., Xu, L., Guan, X., Gong, A., Liu, H., and Zhang, M.: Nocturnal ozone enhancement in Shandong Province, China, in 2020–2022: Spatiotemporal distribution and formation mechanisms, Sci. Total Environ., 925, 171542, https://doi.org/10.1016/j.scitotenv.2024.171542, 2024.
Zhu, X., Ma, Z., Li, Z., Wu, J., Guo, H., Yin, X., Ma, X., and Qiao, L.: Impacts of meteorological conditions on nocturnal surface ozone enhancement during the summertime in Beijing, Atmos. Environ., 225, 117368, https://doi.org/10.1016/j.atmosenv.2020.117368, 2020.
Zhu, Y., Chen, D., Li, W., and Zhang, P.: Lamb-Jenkinson circulation type classification system and its application in China, J. Nanjing Inst. Meteor., 30, 289–297, https://doi.org/10.13878/j.cnki.dqkxxb.2007.03.001, 2007.