
the Creative Commons Attribution 4.0 License.
the Creative Commons Attribution 4.0 License.
 | 03 Nov 2026
Springtime East Asian dust heating contributes to interannual poleward shift of the North Pacific storm track
Anbao Zhu

Haiming Xu
Jiechun Deng
Zilin Wang
Tianshuai Li
Aijun Ding
The North Pacific storm track plays a key role in shaping climate across the Arctic and western North America by modulating precipitation and temperature, yet its interannual sensitivity to springtime East Asian dust remains poorly understood. Based on the Modern-Era Retrospective analysis for Research and Applications, Version 2 (MERRA-2) reanalysis data from 1980 to 2022, we find that anomalously high springtime East Asian dust loading is robustly associated with a systematic poleward shift of the North Pacific storm track on interannual timescales. It is revealed that shortwave absorption by the trans-Pacific dust plume coincides with warming in the 850–400 hPa layer and an anomalous anticyclonic circulation over the North Pacific. This thermal perturbation restructures the meridional temperature gradient and shifts the zone of maximum Eady growth rate poleward, thereby relocating the preferred region for baroclinic eddy development to higher latitudes. The Weather Research and Forecasting model coupled with Chemistry (WRF-Chem) sensitivity experiments reproduce the spatial pattern of the storm track response, supporting the proposed radiative–dynamical pathway. These findings indicate that natural dust aerosols can modulate large-scale North Pacific atmospheric dynamics on interannual timescales and suggest that springtime dust variability should be considered in regional climate assessments.
- Article
(13717 KB) - Full-text XML
-
Supplement
(7415 KB) - BibTeX
- EndNote


Storm tracks are regions where extratropical cyclones preferentially form, develop, and dissipate (Shaw et al., 2016). They are largely characterized by transient eddy activities that drive midlatitude atmospheric circulation (Chang et al., 2002). The North Pacific storm track is a major branch of the Northern Hemisphere storm track system. It originates near the East Asian coastal stationary trough (Blackmon, 1976) and is sustained by baroclinic instability that converts mean-flow available potential energy into eddy kinetic energy through the equator-to-pole temperature gradient (Simmons and Hoskins, 1978; Chang et al., 2002). The North Pacific storm track plays a key role in the climate system. It accounts for much of the poleward transport of heat, moisture, and momentum across the North Pacific basin, delivering them into the Arctic and western North America (Trenberth and Stepaniak, 2003; Salathé, 2006). Through this transport, it heavily influences regional weather patterns and midlatitude extreme events, including severe winds and heavy precipitation over both the North Pacific and western North America (Salathé, 2006; Pfahl et al., 2014; Chemke and Yuval, 2026). Spring is particularly important because the North Pacific storm track undergoes its most rapid meridional migration of the annual cycle (Hoskins and Hodges, 2019), and the storm track configuration during this transition governs the frequency of deep stratosphere-to-troposphere mass transport over western North America (Lin et al., 2015; Breeden et al., 2021). Yet springtime storm track variability has nonetheless received far less attention than its wintertime counterpart. Therefore, it is essential to understand its variability, particularly in spring, for regional weather forecasting and climate prediction (Shaw et al., 2016).
East Asia is one of the world's major source regions of mineral dust aerosols (Kok et al., 2023). Every spring, dust plumes originate from the Taklimakan and Gobi Deserts and are transported eastward by mid-latitude westerlies, forming an extensive aerosol belt over the North Pacific (Huang et al., 2014; Yu et al., 2019). Dust accounts for more than 50 % of the total aerosol column mass over the North Pacific in spring, the highest fraction among the four seasons (Hu et al., 2019). Unlike predominantly scattering aerosols, mineral dust exhibits substantial shortwave absorption due to its iron oxide content (Sokolik and Toon, 1999), producing notable radiative heating within the atmospheric column (Chen et al., 2017). This radiative heating modulates large-scale atmospheric circulation and weather systems, with documented effects on the Indian summer monsoon (Lau et al., 2006; Jin et al., 2021), Atlantic hurricanes (Sun and Zhao, 2020; Xian et al., 2020), Mongolian cyclones (Chen et al., 2023), and particle and ozone pollution in East China (Wang et al., 2020). Observational records also show a recent increase in severe dust storms over East Asia (Yin et al., 2022, 2026), leading to substantial perturbations on radiative energy balance (Gui et al., 2022). The increasing frequency of these extreme events underscores the need to evaluate the climatic impacts of springtime dust variability.
Although the influence of aerosols on the North Pacific storm track has received increasing attention, most previous studies have focused on wintertime anthropogenic aerosols. Modelling studies demonstrate that East Asian anthropogenic emissions induce an equatorward shift of the subtropical jet and the North Pacific storm track in boreal winter, primarily by cooling the surface through aerosol–radiation interactions (Ming et al., 2011; Zhou and Deng, 2013; Wang et al., 2015; Liu et al., 2019). Furthermore, through aerosol–cloud interactions, anthropogenic aerosols that act as cloud condensation nuclei enhance deep convective clouds and intensify mid-latitude cyclones, resulting in approximately 7 % more precipitation within the wintertime Pacific storm track (Zhang et al., 2007; Wang et al., 2014a, b). However, during spring, when the East Asian–North Pacific aerosol regime transitions from anthropogenic-dominated to dust-dominated (Zhu et al., 2007; Bao et al., 2009), the storm track response to springtime dust remains largely unexplored. Notably, satellite-based analyses reveal that wintertime East Asian aerosols significantly enhance deep convective clouds in the North Pacific storm track. Interestingly, this signal disappears in spring, even though the aerosol optical depth (AOD) reaches its annual maximum during this season (Bender et al., 2012). This seasonal contrast suggests that springtime dust aerosols may exert fundamentally different effects on the storm track compared to wintertime anthropogenic aerosols. Moreover, previous assessments of aerosol effects on the North Pacific storm track have largely addressed the response to long-term emission changes, whereas the response to year-to-year aerosol variability remains unclear.
This study investigates the interannual impact of springtime East Asian dust aerosols on the North Pacific storm track by using reanalysis data from 1980 to 2022, along with modelling sensitivity experiments. Specifically, this research aims to determine how East Asian dust aerosols affect the North Pacific storm track during spring on an interannual timescale and to identify the underlying physical mechanisms. The remainder of the paper is organized as follows. Section 2 describes the data and methodology. Section 3 presents the observational evidence and physical mechanisms, which are further verified by modelling simulations. Finally, Sect. 4 discusses the implications and limitations.
2.1 Data
The primary dataset used in this study is the Modern Era Retrospective analysis for Research and Applications, Version 2 (MERRA-2). It is provided by the National Aeronautics and Space Administration Global Modeling and Assimilation Office (GMAO) (Gelaro et al., 2017). We utilize MERRA-2 for both aerosol and meteorological fields to ensure dynamic consistency. The data are provided on a 0.5° by 0.65° spatial grid with 72 vertical levels. The MERRA-2 aerosol data are generated using the Goddard Chemistry Aerosol Radiation and Transport (GOCART) model coupled with the Goddard Earth Observing System (GEOS-5) data assimilation system. The GOCART model simulates five aerosol species: dust, black carbon, organic carbon, sulfate, and sea salt. Furthermore, GEOS-5 assimilates bias-corrected AOD from various observation platforms. These include the Advanced Very High Resolution Radiometer (AVHRR) instrument over oceans (Heidinger et al., 2014), the Moderate Resolution Imaging Spectroradiometer (MODIS) instrument from Terra and Aqua satellites (Levy et al., 2010), the Multiangle Imaging Spectroradiometer (MISR) instrument over desert regions (Kahn et al., 2005), and ground-based AERONET stations (Holben et al., 1998).
We use the monthly mean dust column mass density from MERRA-2 to represent the atmospheric dust loading over East Asia and the North Pacific. Recent evaluations indicate that MERRA-2 slightly underestimates absolute dust concentrations compared to ground-based retrievals. However, it exhibits a high temporal correlation with station observations (Zhang et al., 2024). Because MERRA-2 accurately captures the spatiotemporal variability of dust aerosols, this product is widely used in climate analyses (Wang et al., 2021; Li et al., 2023; Fu et al., 2026). We also use the AOD from the 1° MODIS Terra Level-3 monthly product (MOD08_M3) (Gupta et al., 2016) to evaluate the model's simulation of dust aerosol spatial distribution. Alongside the aerosol data, we utilize MERRA-2 atmospheric variables, including geopotential height, air temperature, vertical velocity, and horizontal winds. Additionally, we obtain monthly precipitation data on a 2.5° by 2.5° grid from the Climate Prediction Center Merged Analysis of Precipitation (CMAP) dataset (Xie and Arkin, 1997). We also use the satellite-vegetation-based estimate of East Asian spring dust emission from Fu et al. (2026) as an independent dust metric. It is derived from Global Inventory Modeling and Mapping Studies (GIMMS; 1982–2015) and MODIS (2001–2023) vegetation products, which agree closely over their overlap period. Regressions onto this emission index are performed for 1982–2022, the period covered by both datasets. Both the spring North Atlantic Oscillation (NAO) index and the preceding-winter (December to February) Oceanic Niño Index (ONI) are obtained from the National Oceanic and Atmospheric Administration (NOAA) Climate Prediction Center.
2.2 Storm track definition and statistical methods
We define storm track activity using two metrics. The first is the upper-tropospheric transient eddy geopotential height variance at 300 hPa (). The second is the lower-tropospheric transient eddy meridional heat flux at 850 hPa (). Together, these two metrics provide a comprehensive three-dimensional representation of storm track activity (Chang et al., 2002). We calculate the transient variance and heat flux using daily MERRA-2 data. A 2.5–6 d bandpass filter is applied to these daily data to isolate synoptic-scale fluctuations. To quantify atmospheric baroclinicity, we compute the maximum Eady growth rate (EGR) defined as:
where f is the Coriolis parameter, N is the Brunt-Väisälä frequency, and is the vertical shear of the zonal wind (Lindzen and Farrell, 1980). Both N and the vertical wind shear are calculated from daily MERRA-2 data using finite differences between adjacent pressure levels, based on 17 levels from 1000 to 100 hPa (1000, 950, 900, 850, 800, 750, 700, 650, 600, 550, 500, 450, 400, 350, 300, 200 and 100 hPa).
The MERRA-2 and CMAP data span the period from 1980 to 2022. , and EGR are first calculated from daily data and then averaged over spring (March to May). All other variables are obtained by averaging monthly means over spring. This yields one value per year for every variable. To isolate interannual variability, Fourier analysis is applied at each grid point to these spring-mean time series. The first four harmonics, which represent fluctuations with periods longer than about 10 years, are defined as the interdecadal component. The residual after removing the time mean and these harmonics is defined as the interannual component (Awan and Bae, 2016; Zhu et al., 2021). All quantities analysed below refer to interannual anomalies unless otherwise stated. Regressions throughout this study are performed against a dust index that has been normalized by its own standard deviation. Specifically, for a dust index D with interannual standard deviation σD and standardized form , the regression coefficient of an interannual anomaly field Y is obtained as the least-squares slope
Because is dimensionless, β retains the physical unit of Y and represents the response of Y to a one-standard-deviation increase of the dust index.
On interannual timescales, the variability of the North Pacific storm track is closely linked to the El Niño Southern Oscillation (ENSO). During El Niño events, the Pacific storm track typically shifts equatorward and extends downstream (Seager et al., 2010; Jiang et al., 2013). To remove the ENSO-driven circulation signal before examining the dust effect, we employ partial regression methods (Cai et al., 2011; Liguori et al., 2022). Specifically, we use the ONI averaged over the preceding winter (December to February), when ENSO typically peaks, as the ENSO indicator and linearly regress out its signal from all variables before regressing the storm track fields onto the dust index. Furthermore, we use empirical orthogonal function (EOF) analysis to extract dominant variability patterns. Finally, the statistical significance of all correlation and regression results is evaluated using a two-tailed Student's t test.
2.3 Model configuration and experimental design
We use the Weather Research and Forecasting model coupled with Chemistry (WRF-Chem) version 3.9.1. This model simulates meteorological processes and dust activities over East Asia and the North Pacific during the boreal spring. The simulation domain spans from East Asia to the central North Pacific. It employs a regular latitude and longitude projection with 381 by 131 grid points centred at 50° N and 160° E (Fig. S1 in the Supplement). The horizontal resolution is 0.5° by 0.5°, which corresponds to approximately 55 km. The vertical grid contains 45 levels extending from the surface up to 50 hPa. Initial and boundary meteorological conditions are derived from the National Centres for Environmental Prediction (NCEP) Final Analysis (FNL) data (NCEP/National Weather Service/NOAA/U.S. Department of Commerce, 2000). These data have a 1° spatial resolution and update every 6 h. Additionally, we incorporate sea surface temperature data from the NCEP real time global sea surface temperature analysis.
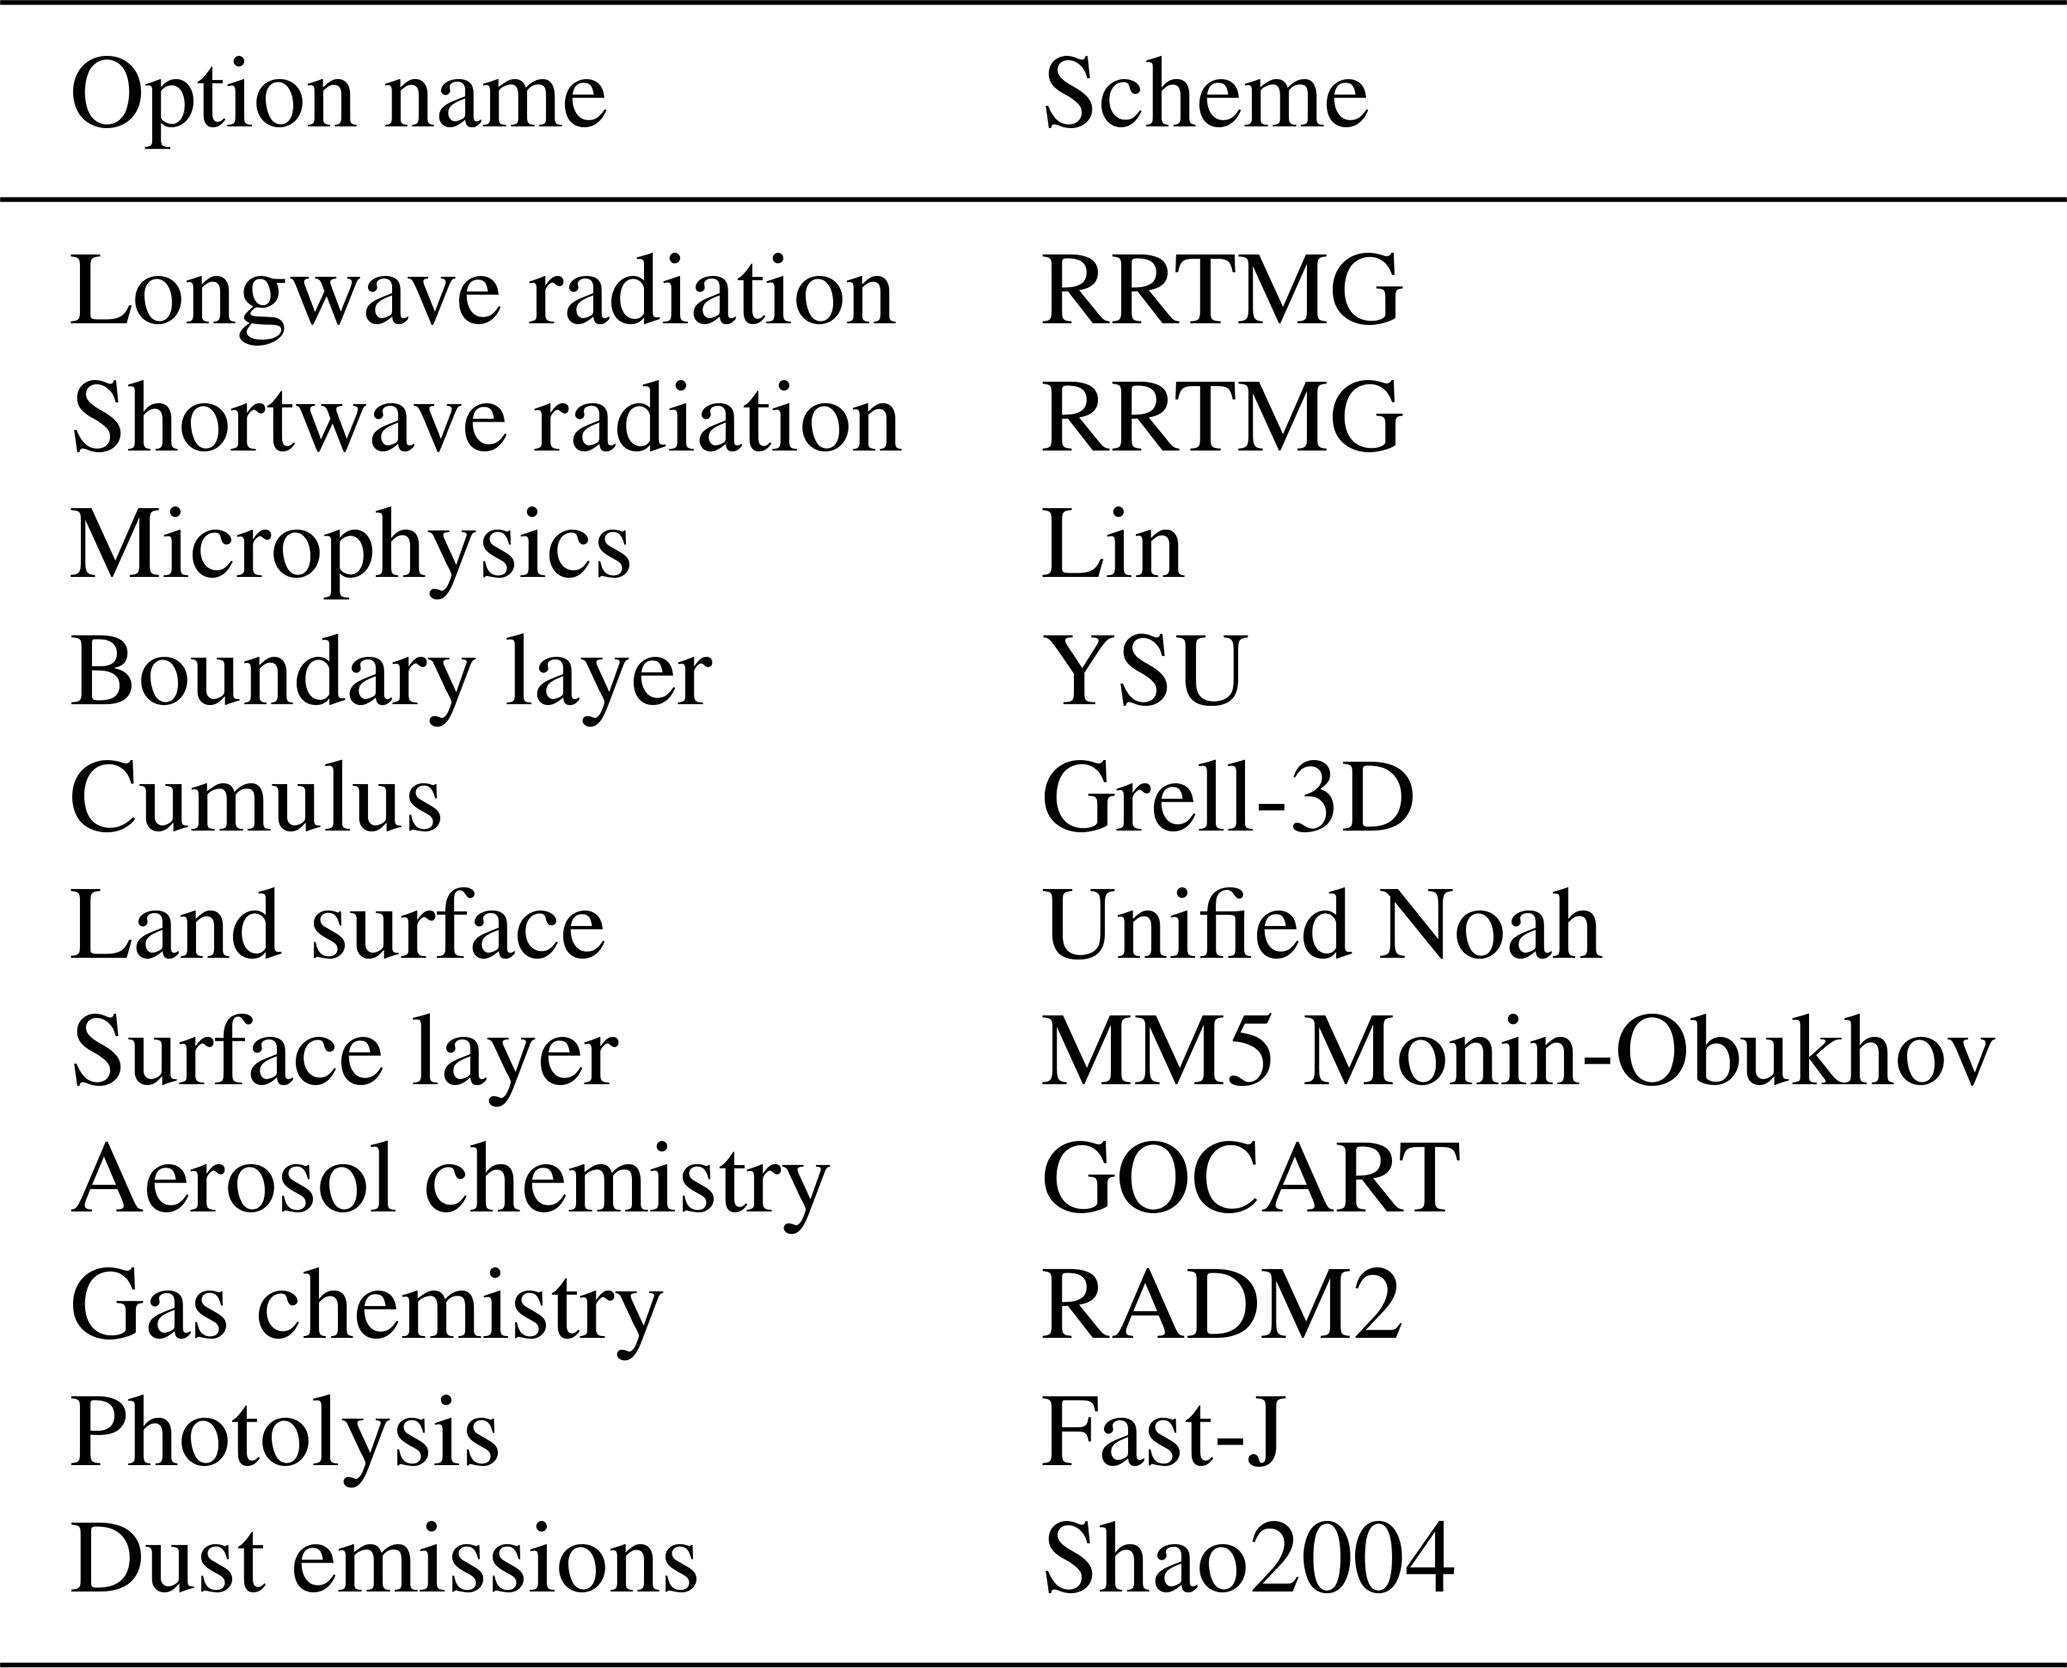
We configure the model with a comprehensive suite of physical and chemical parameterization schemes. Table 1 summarizes these specific options. For cloud and precipitation processes, we select the Lin microphysics scheme (Chen and Sun, 2002) and the Grell-3D ensemble cumulus scheme (Grell, 1993; Grell and Dévényi, 2002). The Rapid Radiative Transfer Model for General Circulation Models (RRTMG) calculates both shortwave and longwave radiation while accounting for aerosol radiative effects (Iacono et al., 2008). Planetary boundary layer processes are parameterized using the Yonsei University (YSU) scheme (Hong et al., 2006). This is coupled with the MM5 Monin-Obukhov surface layer scheme and the Unified Noah land surface model to represent surface physics and land atmosphere interactions (Pahlow et al., 2001; Chen et al., 2010). For atmospheric chemistry, we employ the second-generation Regional Acid Deposition Model (RADM2) for gas phase reactions (Stockwell et al., 1990), alongside the Fast-J photolysis scheme. The GOCART module simulates aerosol chemistry (Chin et al., 2002). Aerosol optical properties are computed using the Maxwell Garnett approximation (Bohren and Huffman, 1983). Finally, we adopt the Shao 2004 dust emission scheme (Shao, 2004). Previous studies demonstrate its excellent performance in simulating dust emissions and the spatiotemporal variability of dust mass concentrations over East Asia (Tang et al., 2018; Zhao et al., 2020; Idrissa et al., 2024).
Table 1Physical and chemical parameterizations used in WRF-Chem model.
We design two sets of simulations to test whether dust radiative heating alone can reproduce the physical pathway inferred from the reanalysis. The control experiment (CTRL) incorporates full dust emissions. In contrast, the sensitivity experiment (NoDust) completely disables dust emissions. We attribute the atmospheric differences between the CTRL and NoDust simulations directly to the effects of dust aerosols. We select the year 2018 as our study period because the East Asian dust loading during this year significantly exceeded the climatological mean (Fig. 2b). To enhance the statistical robustness of our results, we conduct seven ensemble members for each experiment. These ensemble members are initialized 1 d apart from 19 to 25 February 2018. All simulations conclude on 31 May 2018. We treat February as the model spin-up period and exclude it from the final analysis. Consequently, our analysis focuses strictly on the boreal spring season from March to May 2018. Because the experiments cover a single spring, they cannot reproduce the interannual relationship diagnosed from the reanalysis or determine whether dust is its dominant cause. They are instead designed as a process-level verification of the proposed mechanism. Since the two experiments share identical meteorological initial and boundary conditions, their difference isolates the dust effect from concurrent circulation variability.
3.1 Observed association between East Asian dust and the North Pacific storm track
As shown in Fig. 1, Asian dust loading peaks over the Taklimakan and Gobi deserts and extends eastward over the North Pacific, spatially overlapping with the storm track region, characterized by (red contours) and (orange contours). This spatial collocation suggests the potential for dynamical interactions between dust aerosols and storm track activity, motivating the present investigation. To further characterize the spatiotemporal variability of East Asian dust loading, we apply EOF analysis to the spring dust column mass density anomalies over 1980–2022, with spring defined as March–April–May (MAM). The leading EOF mode (EOF1; Fig. 2a) explains approximately 46 % of the total variance and is characterized by same-sign loading across East Asia, with the largest amplitude over the Taklimakan and Gobi deserts. This pattern is consistent with the known structure of dust variability, in which the most pronounced fluctuations are concentrated over the major source regions (Guo et al., 2019).
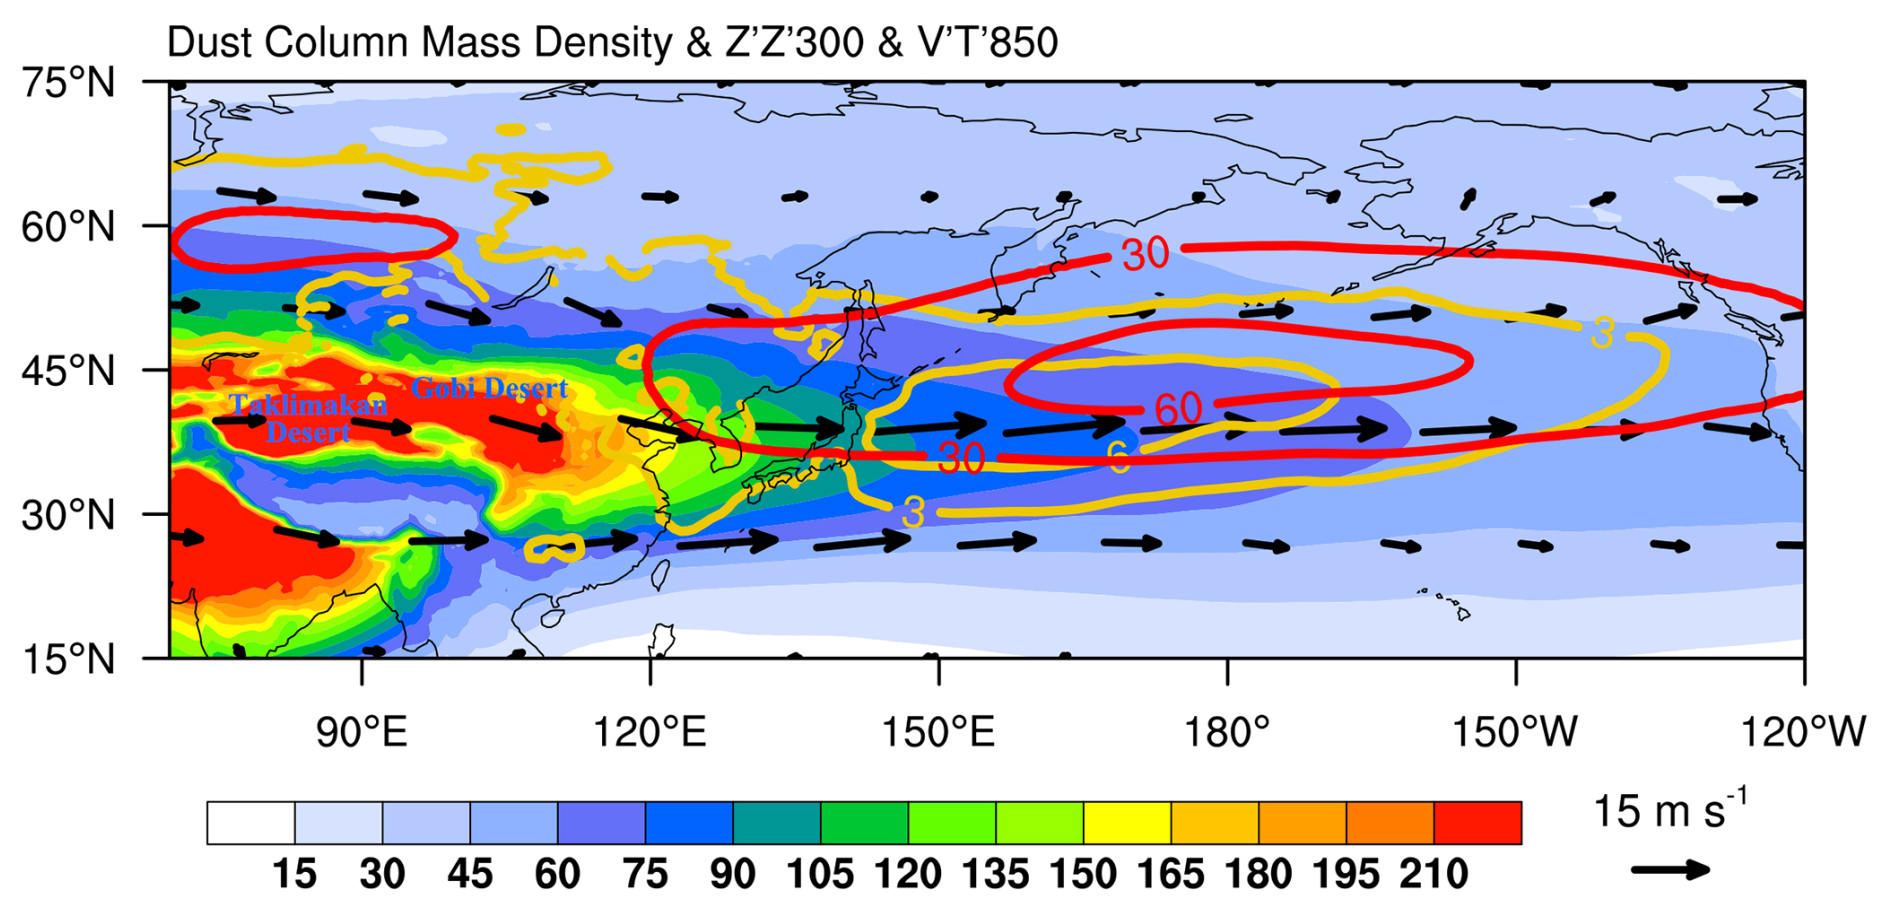
Figure 1Spatial distribution of climatological spring (March–April–May, MAM) mean dust column mass density (shading; mg m−2), 500 hPa wind (vector; m s−1), transient eddy meridional heat flux at 850 hPa (, EMHF; orange contour with interval of 3 K m s−1) and transient variances of geopotential height at 300 hPa (, EGHV; red contour with interval of 30 dagpm2) averaged over 1980–2022.
Based on this spatial pattern, we define an East Asian dust index (EADI) as the area-averaged dust column mass density over the key region (35–47° N, 76–118° E; black box in Fig. 2a) where the variance is largest. The resulting EADI is highly correlated with the EOF1 principal component (PC1), with a correlation coefficient exceeding 0.97 (Fig. 2b), confirming that the EADI effectively captures both interannual and interdecadal variability of spring East Asian dust loading. The temporal evolution of EADI reveals two distinct timescales of variability. On the interdecadal timescale, an abrupt increase occurs around 1999, coinciding with a phase reversal in PC1 from negative to positive, which has been linked to changes in 10 m wind speed over dust source regions (Guo et al., 2019). On the interannual timescale, the EADI exhibits substantial year-to-year fluctuations, reflecting the large variability in dust emission and transport processes (Yu et al., 2019). Given that interannual variability constitutes an important component of total dust variability, this study focuses on the North Pacific storm track response to the interannual dust variability over East Asia. The interdecadal component is therefore removed (Sect. 2.2), so that the storm track response discussed below reflects year-to-year dust variations rather than the long-term change in dust loading.
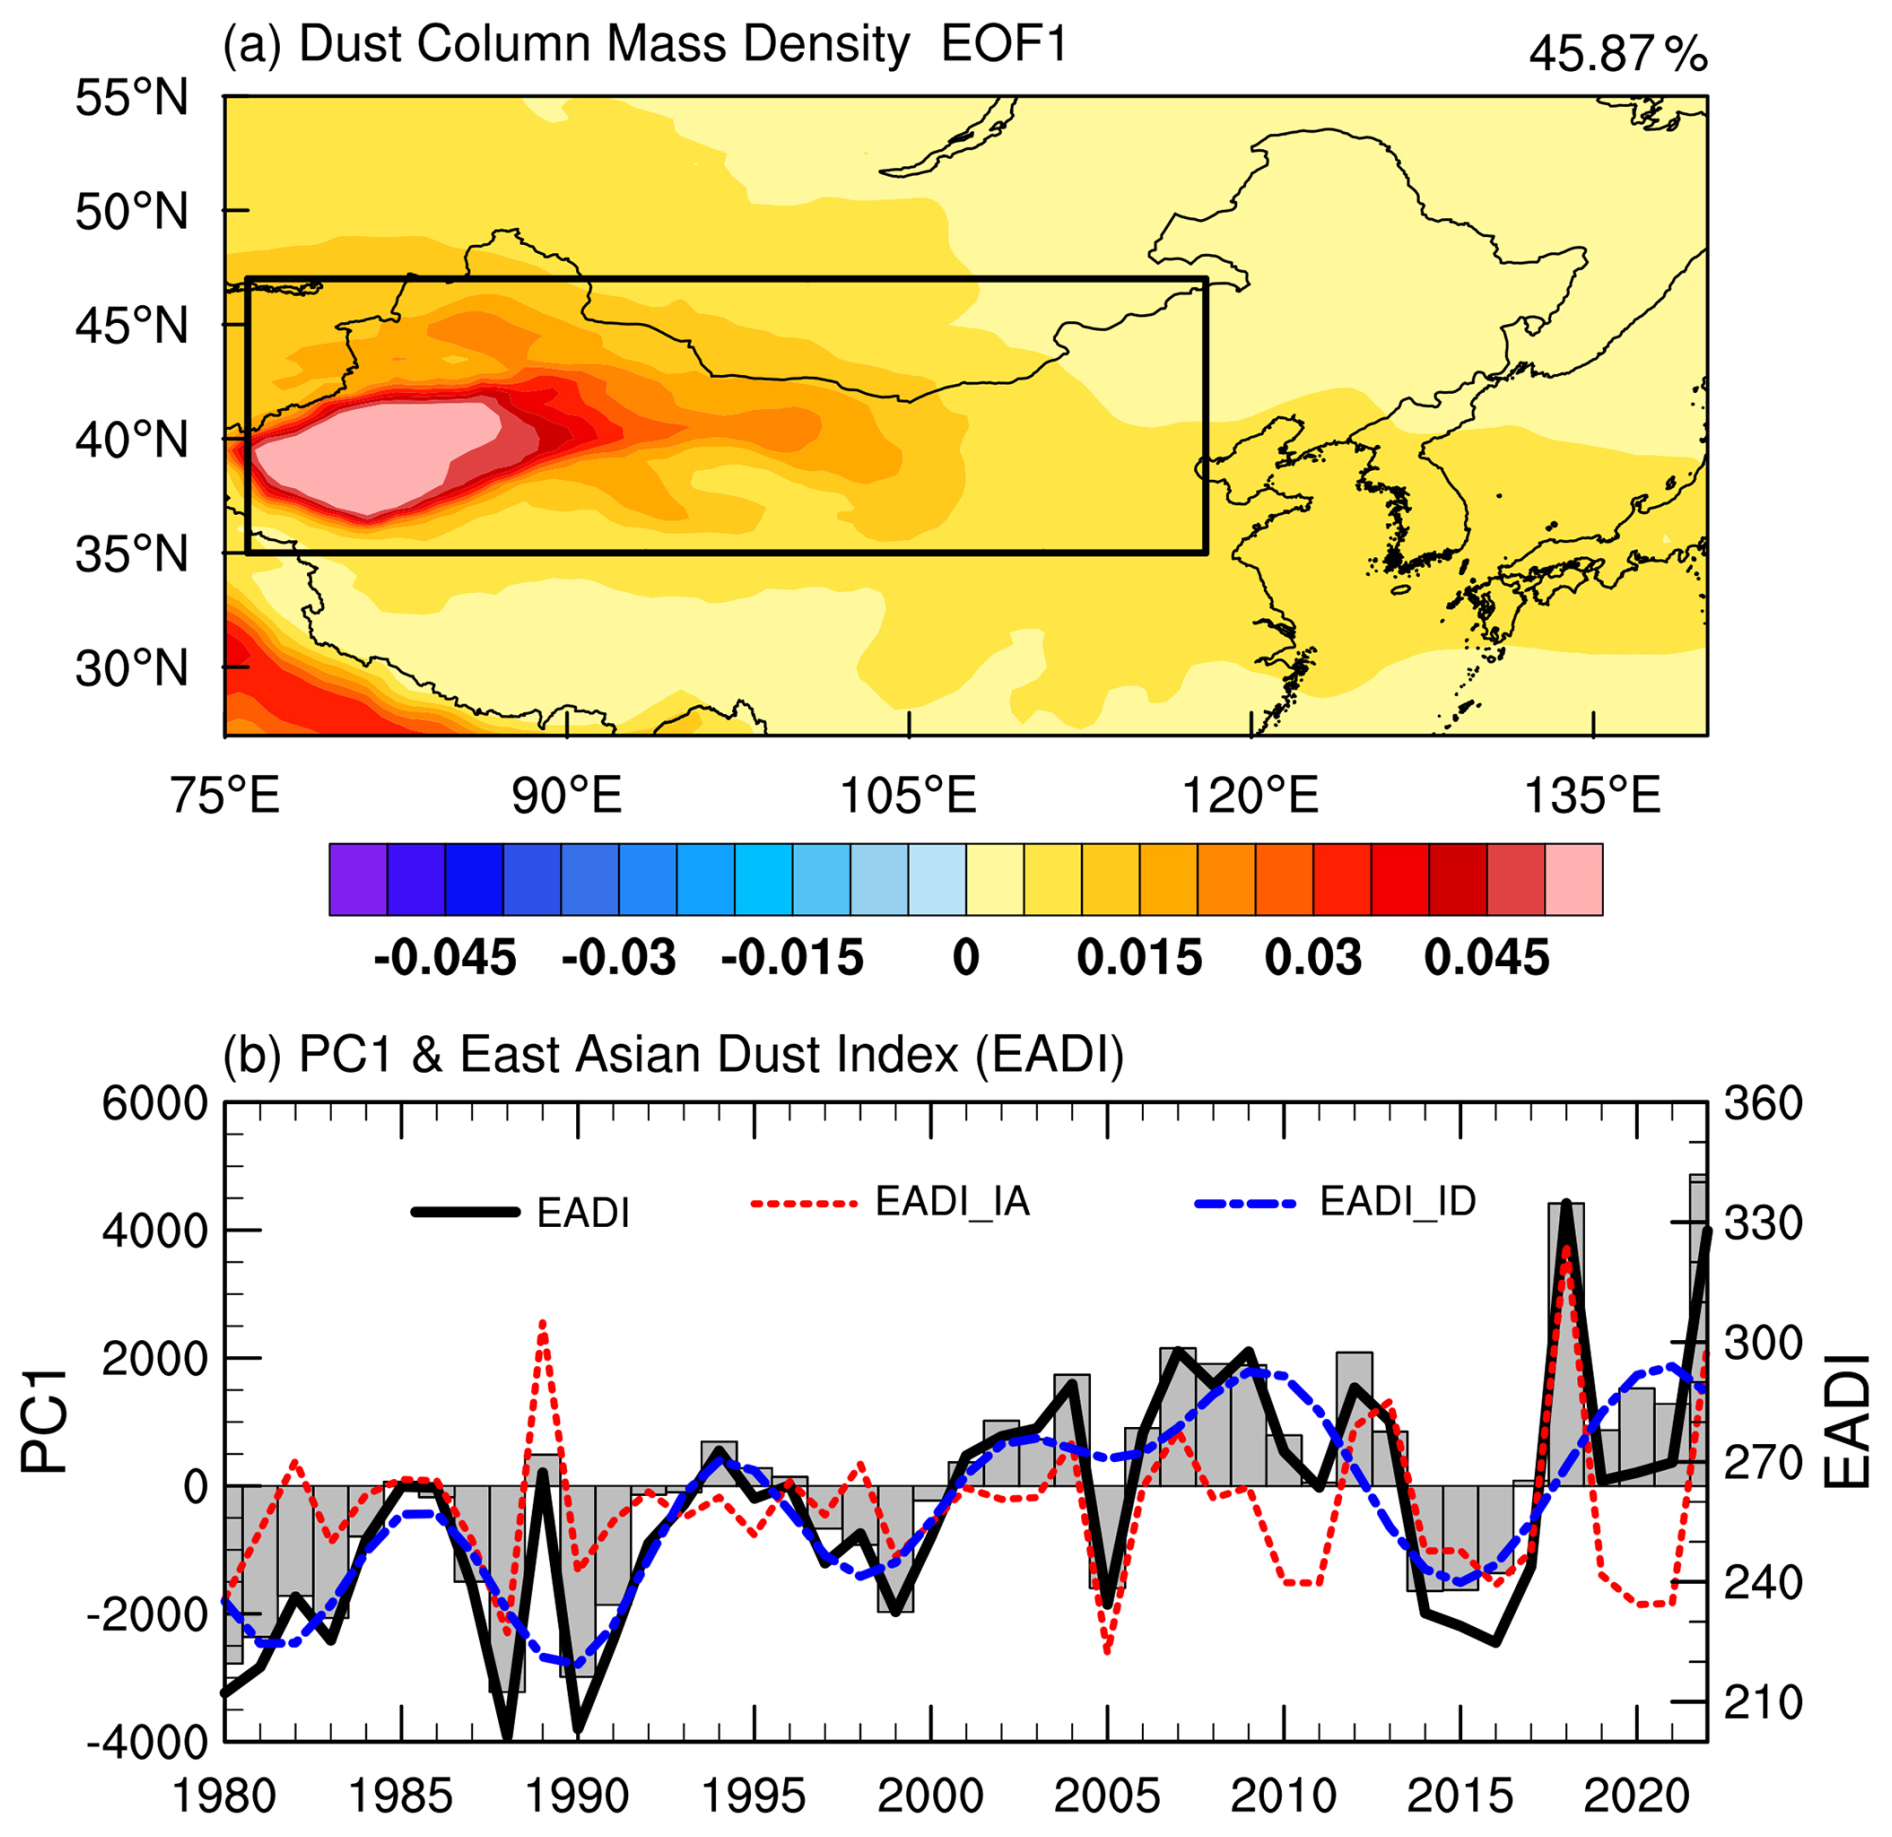
Figure 2(a) Spatial pattern (shading) and (b) principal component (gray bars) of the first EOF mode of MAM mean dust column mass density over East Asia during 1980–2022. The spring East Asian dust index (EADI; black solid line) defined as dust column mass density averaged over East Asia (76–118° E, 35–47° N; the black box in a) is also plotted in (b), together with its interannual component (EADI_IA; red dashed line) and interdecadal component (EADI_ID; blue dashed line). The interdecadal component is the sum of the first four Fourier harmonics (periods longer than about 10 years), and the interannual component is the residual.
To investigate the interannual relationship between East Asian dust loading and the North Pacific storm track, Fig. 3 presents the regression of anomalous and onto the interannual component of the EADI. Both fields exhibit a meridional dipole pattern that is approximately symmetric about the climatological storm track axis, suggesting a systematic poleward displacement of storm track activity during high-dust springs (relative to low-dust springs). Specifically, significant negative anomalies appear over the East China Sea and the east-central North Pacific, with the largest reduction reaching approximately 7.5 dagpm2 (∼15 % of the climatological mean). Meanwhile, significant positive anomalies exceeding 2.0 dagpm2 (more than 8 % of the climatological mean) emerge over eastern Siberia and the Bering Sea (Fig. 3a). A similar dipole structure is evident in : negative anomalies extend zonally along the southern flank of the climatological heat flux maximum, with the reduction more pronounced over the downstream region of the storm track. Concurrently, prominent positive anomalies cover eastern Siberia, the Kamchatka Peninsula, and Alaska (Fig. 3b). These results suggest that increased springtime East Asian dust loading is associated with a poleward shift of both the North Pacific storm track and its transient meridional heat transport on interannual timescales. The precipitation response corroborates this poleward shift, with reduced rainfall along the southern flank and a slight enhancement near the Bering Sea (Fig. S2).
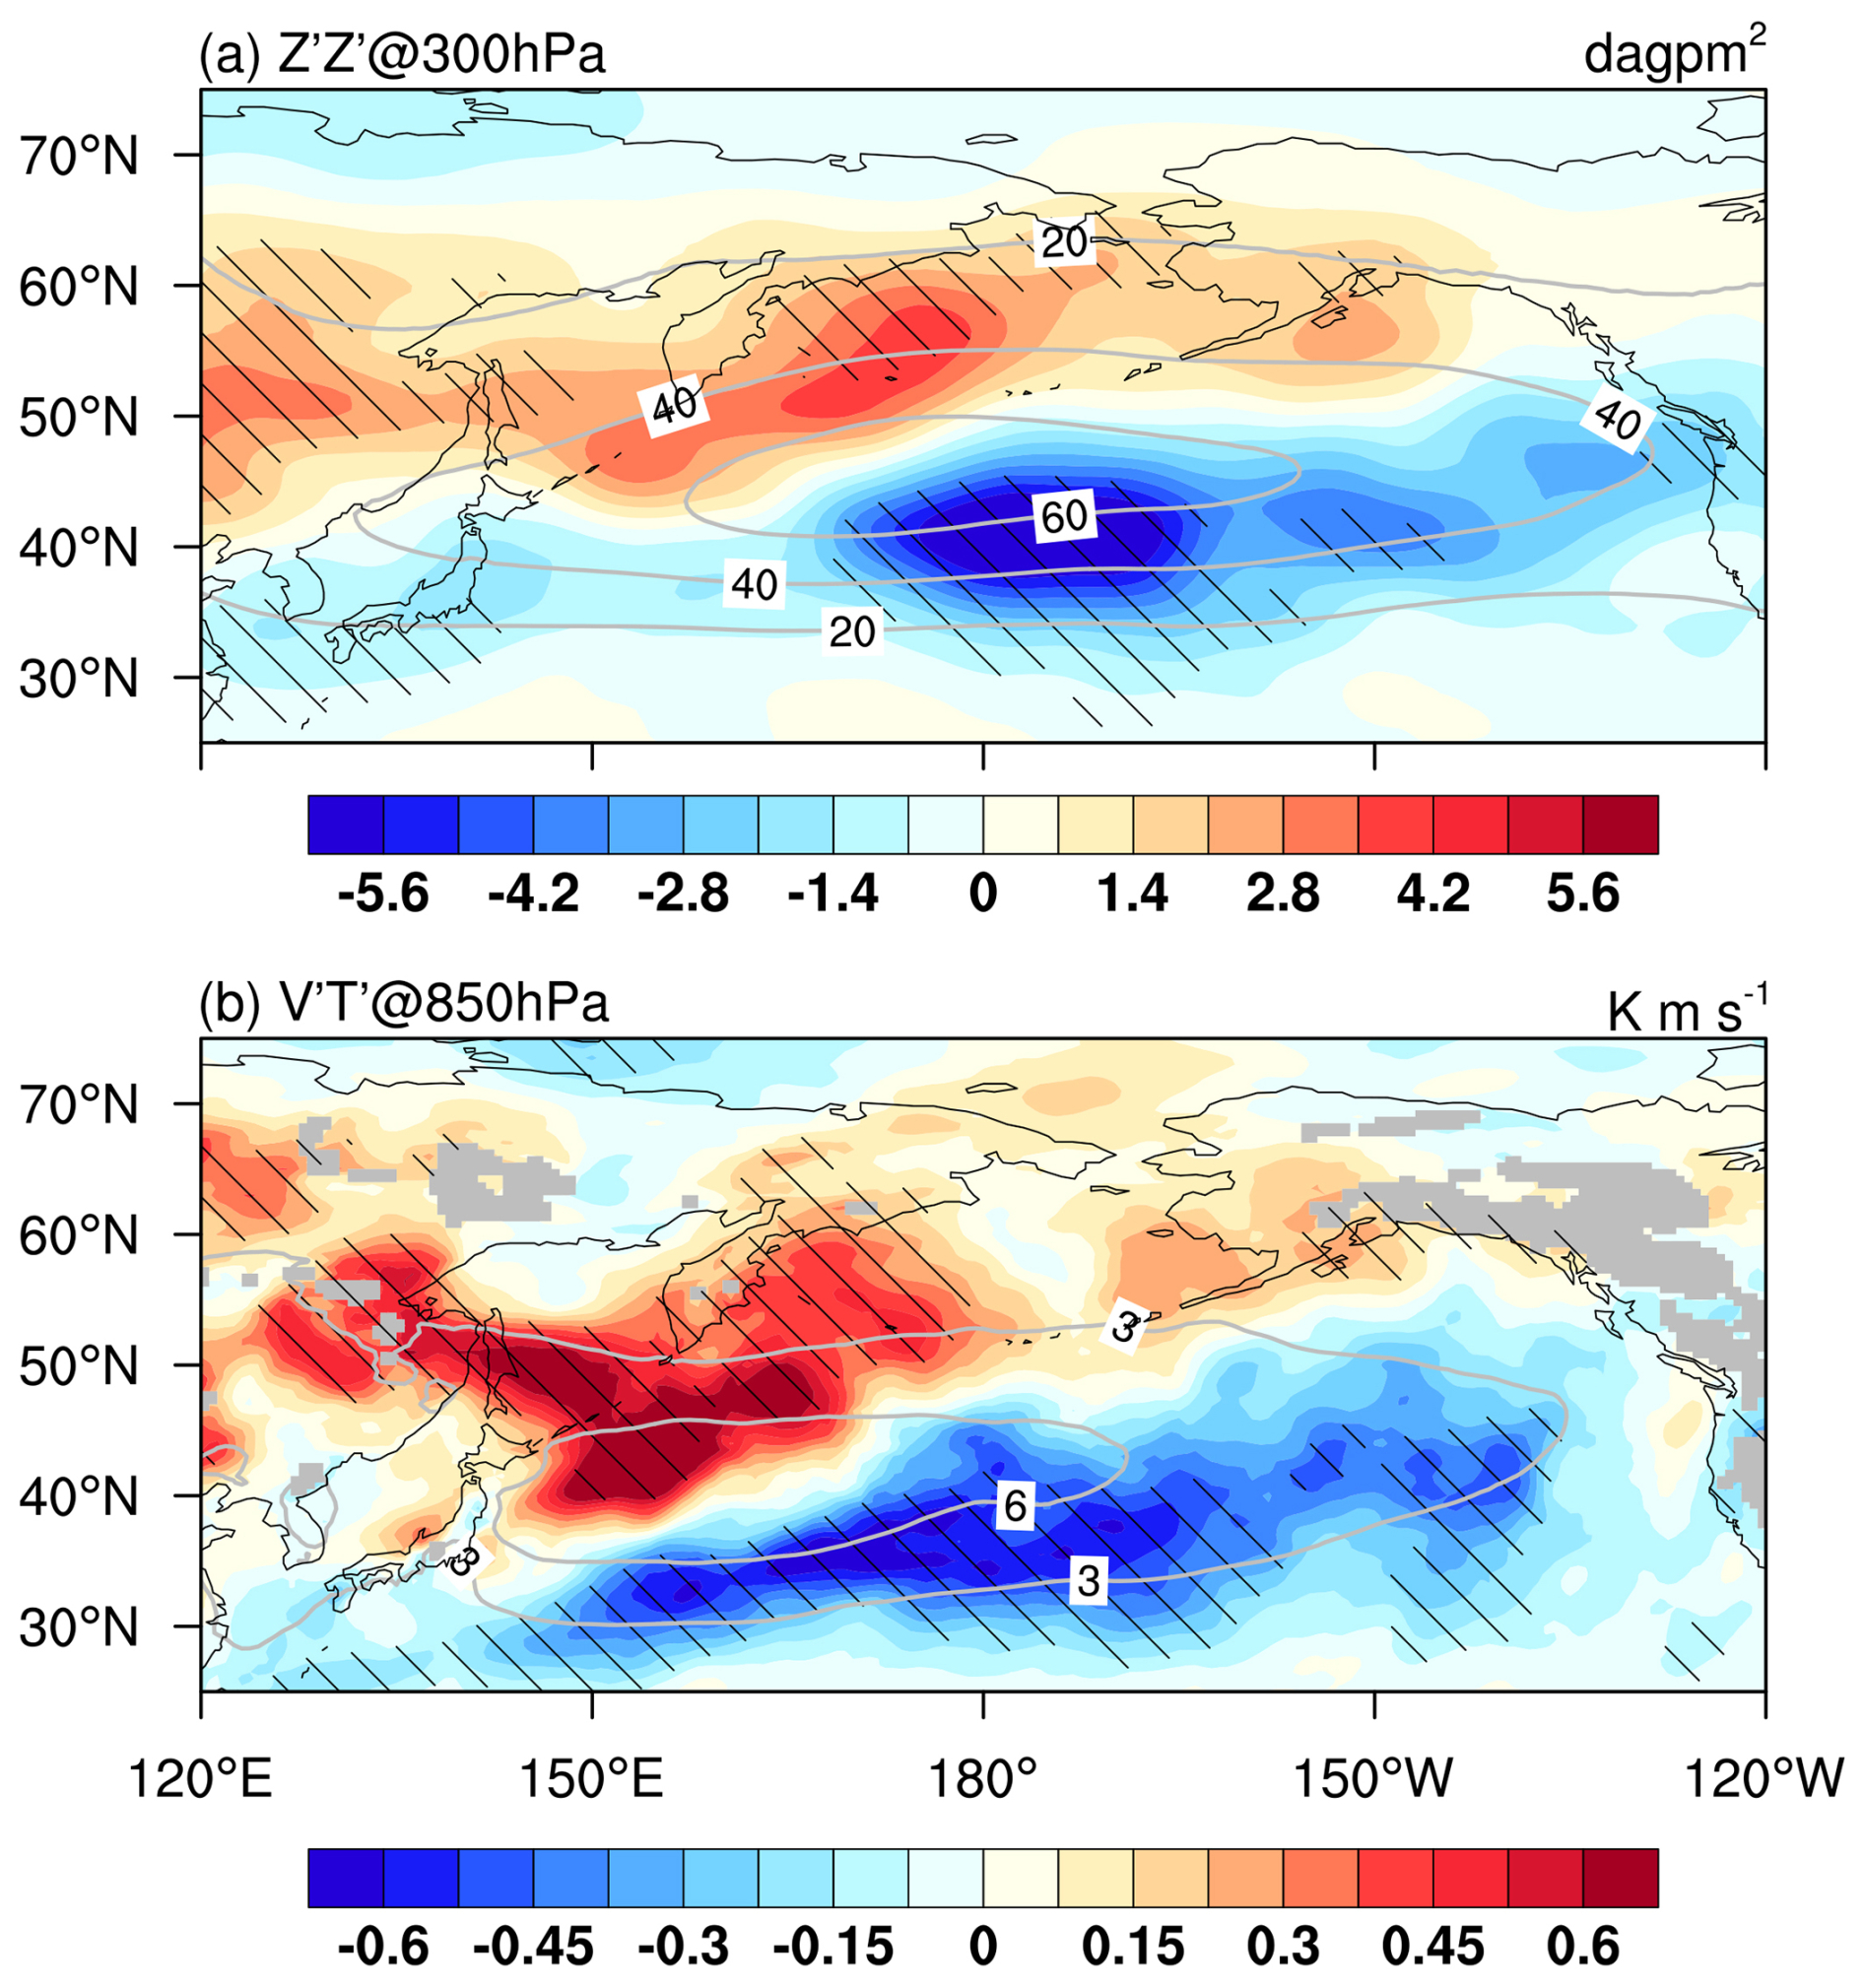
Figure 3Regressions of anomalies in (a) transient variances of 300 hPa geopotential height (; shading; dagpm2) and (b) 850 hPa transient eddy meridional heat flux (; shading; K m s−1) onto the standardized EADI_IA; the shading therefore gives the response per one standard deviation of EADI_IA. Grey contours denote the climatological spring mean of (a) and (b) . Hatching denotes the anomalies statistically significant at the 95 % confidence level based on the Student's t test.
To further quantify this relationship, we define storm track position indices as the difference in area-averaged and between a northern box and a southern box on the poleward and equatorward flanks of the climatological storm track (Fig. S3a–b). Positive indices therefore denote a poleward displacement of the storm track. Both position indices covary with the interannual variations of the EADI and dust PC1 (Fig. S3c), with correlation coefficients ranging from 0.36 to 0.47, all significant at the 95 % confidence level. The EADI alone explains about 22 % and 15 % of the interannual variance in the and position indices, respectively. The remaining variance likely reflects internal atmospheric variability and other drivers, including large-scale circulation anomalies that may influence both dust emission and the storm track.
The relationship is robust to the choice of dust index and to the removal of other circulation modes. The dipole in Fig. 3 is essentially unchanged when the concurrent spring NAO signal is removed in addition to ENSO (Fig. S4). Regressing the storm track metrics onto the independent emission estimate of Fu et al. (2026) reproduces the same dipole with the same sign and location (Fig. S5). Because dust emission is governed mainly by source-region surface wind and land surface conditions, this agreement suggests that the storm track signal is not simply an artefact of the circulation that transports dust across the Pacific. Source-region wind is nevertheless related to the large-scale circulation, so a common driver cannot be fully excluded with reanalysis data alone.
3.2 Possible radiative–dynamical mechanism linking dust aerosol and the storm tracks
Having established the statistical association between East Asian dust loading and the poleward shift of the North Pacific storm track, we then examine the possible underlying physical mechanisms. Dust aerosols perturb the radiative energy balance by scattering and absorbing solar radiation, which redistributes radiative energy and can modify the large-scale circulation. We therefore first examine the shortwave (SW) absorption within the atmospheric column associated with East Asian dust loading (Fig. 4). Under clear-sky conditions, absorption by mineral dust increases the SW energy retained in the atmosphere by 0.3–0.6 W m−2 over the dust polluted region (Fig. 4a), directly heating the atmospheric column. The absorption is stronger under all-sky conditions (Fig. 4b). When dust resides above cloud layers, the underlying clouds act as a bright reflective surface that enhances multiple scattering between the aerosol and cloud layers and thereby amplifies the atmospheric absorption, consistent with the satellite-based analysis of Xu et al. (2017). These magnitudes are broadly consistent with previous estimates over the North Pacific (Zhu et al., 2007; Hu et al., 2019). The corresponding SW flux changes at the top of the atmosphere and at the surface are shown in Fig. S6. Their all-sky minus clear-sky differences exhibit a meridional dipole that mainly reflects the cloud redistribution accompanying the storm track shift, and they are therefore not used here to identify the thermal driver.
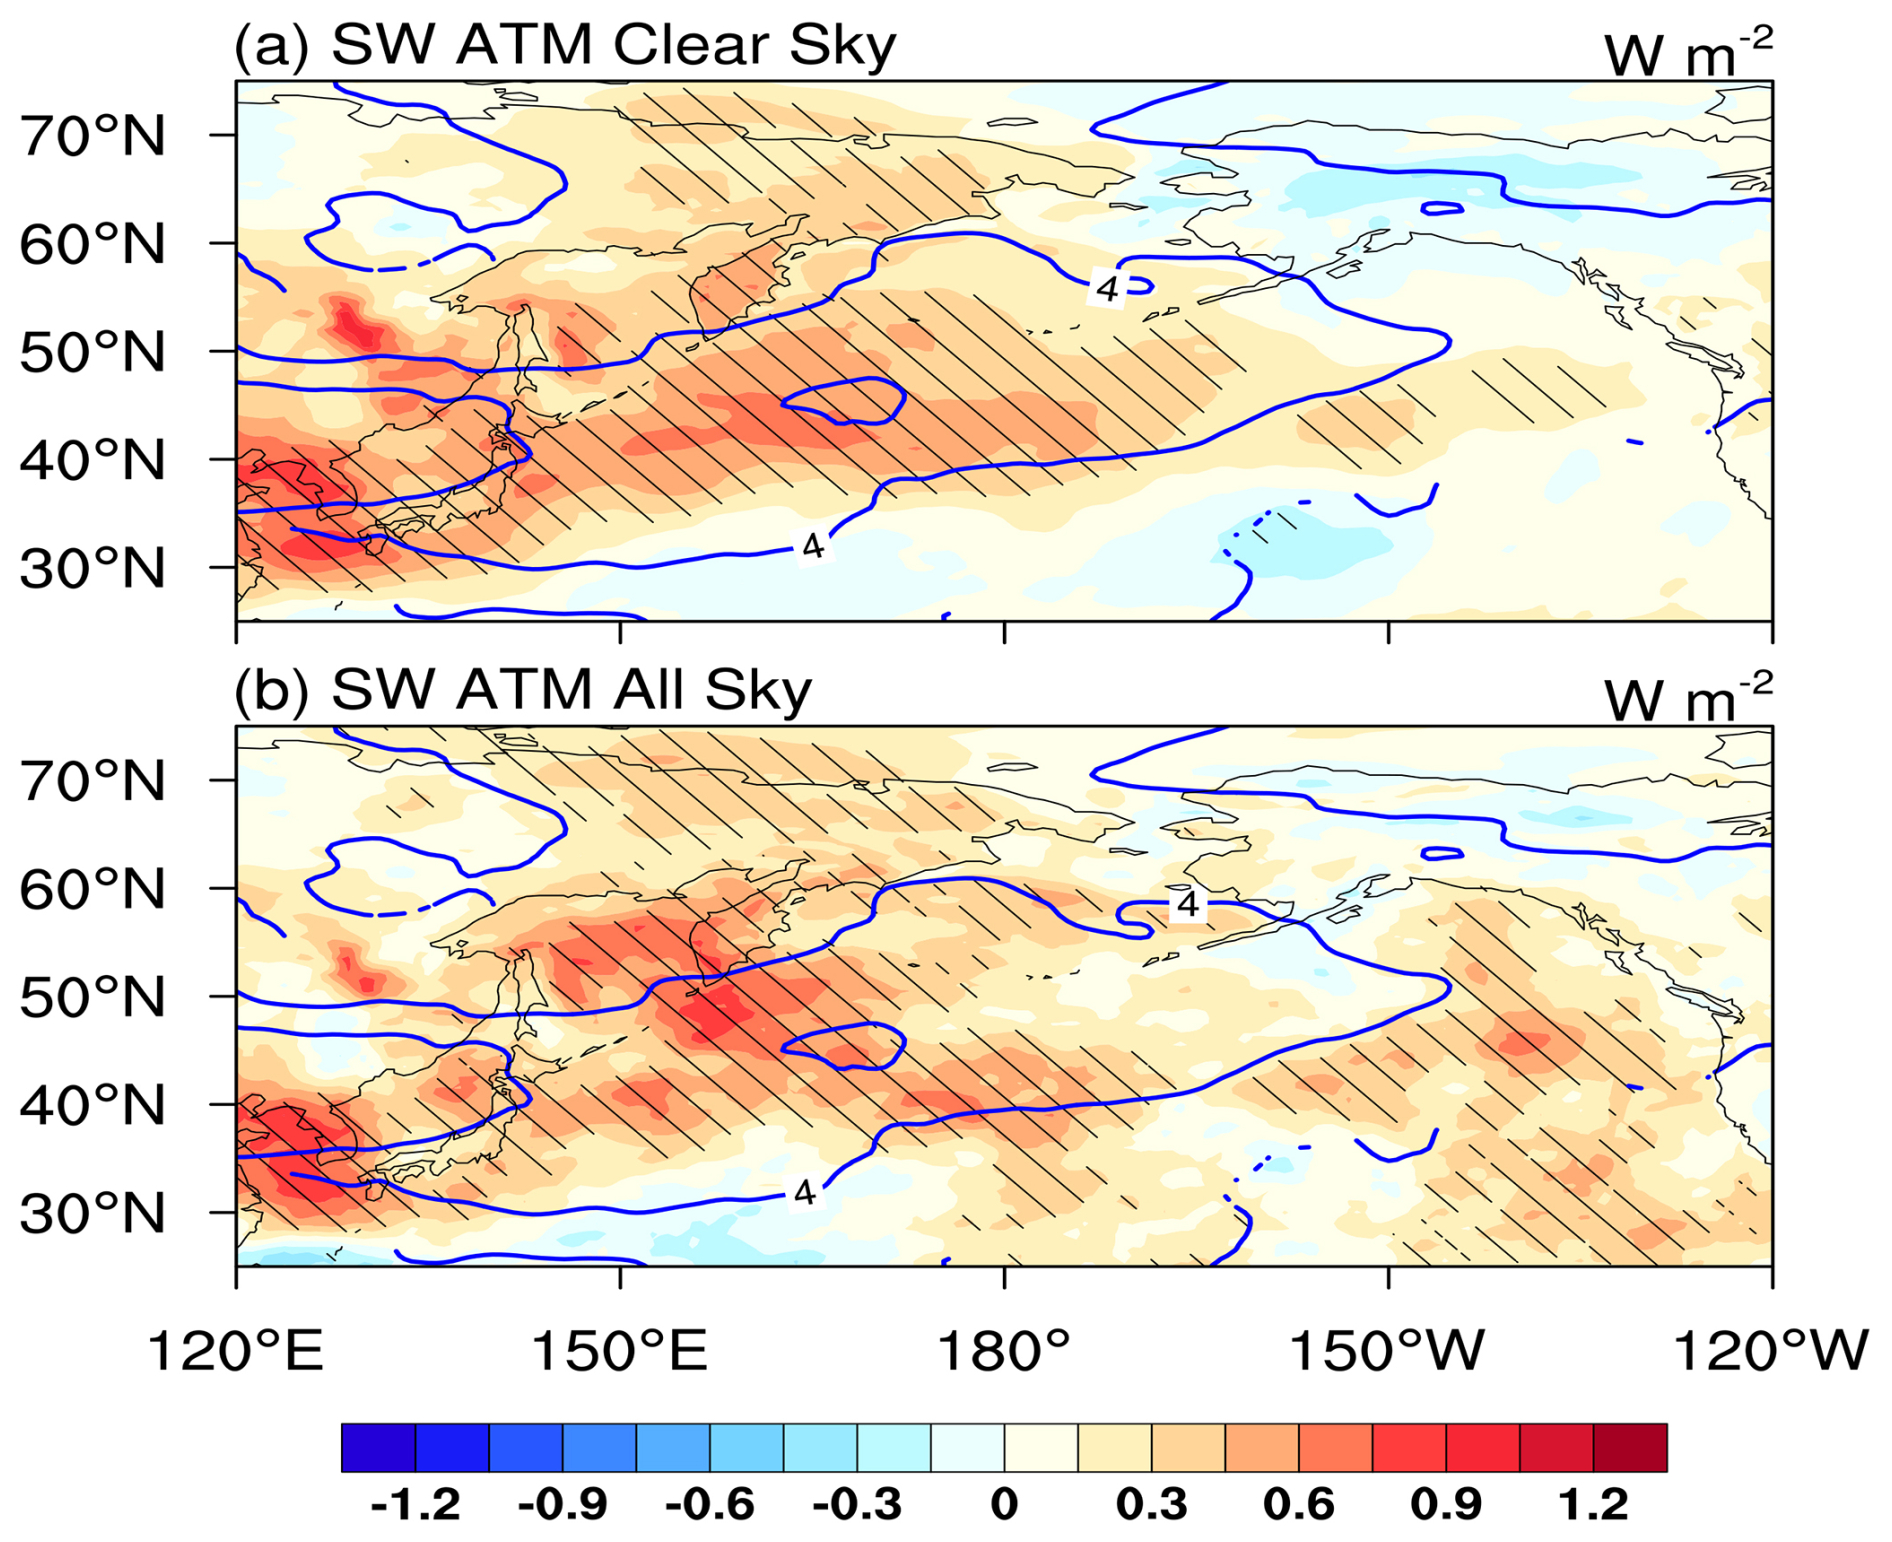
Figure 4Regressions of anomalies in shortwave radiative fluxes (shading; W m−2) in the atmosphere (ATM) and dust column mass density (blue contour with interval of 2 mg m−2) onto the standardized EADI_IA for (a) clear-sky conditions and (b) all-sky conditions. The regressed fields therefore give the response per one standard deviation of EADI_IA. Positive values denote increased SW absorption within the atmospheric column. Hatching indicates that the regressed anomalies in shortwave radiative fluxes are statistically significant at the 95 % confidence level based on a Student's t test.
The enhanced shortwave absorption documented above is expected to warm the mid-troposphere and subsequently modify the large-scale circulation. Figure 5a shows the 850–400 hPa averaged temperature and 500 hPa wind anomalies regressed onto the interannual EADI. A zonally elongated band of significant positive temperature anomalies extends from East Asia across the North Pacific between approximately 30 and 60° N, closely matching the spatial distribution of the dust plume. The warming maximum exceeds 0.6 K over the central North Pacific near 45° N, 170° E, where dust loading is most concentrated. This spatial collocation suggests that the mid-tropospheric warming is closely related to dust aerosol absorption. In response to this robust diabatic heating, the atmospheric column expands, thereby exciting an anomalous high-pressure system. This thermodynamic adjustment is clearly characterized by a large-scale anticyclonic circulation anomaly in the 500 hPa wind field over the North Pacific basin. Furthermore, the anomalous southerly winds near 165° E (Fig. 5a), embedded within the western flank of this anticyclone, may advect warmer subtropical air poleward, providing a supplementary positive temperature tendency.
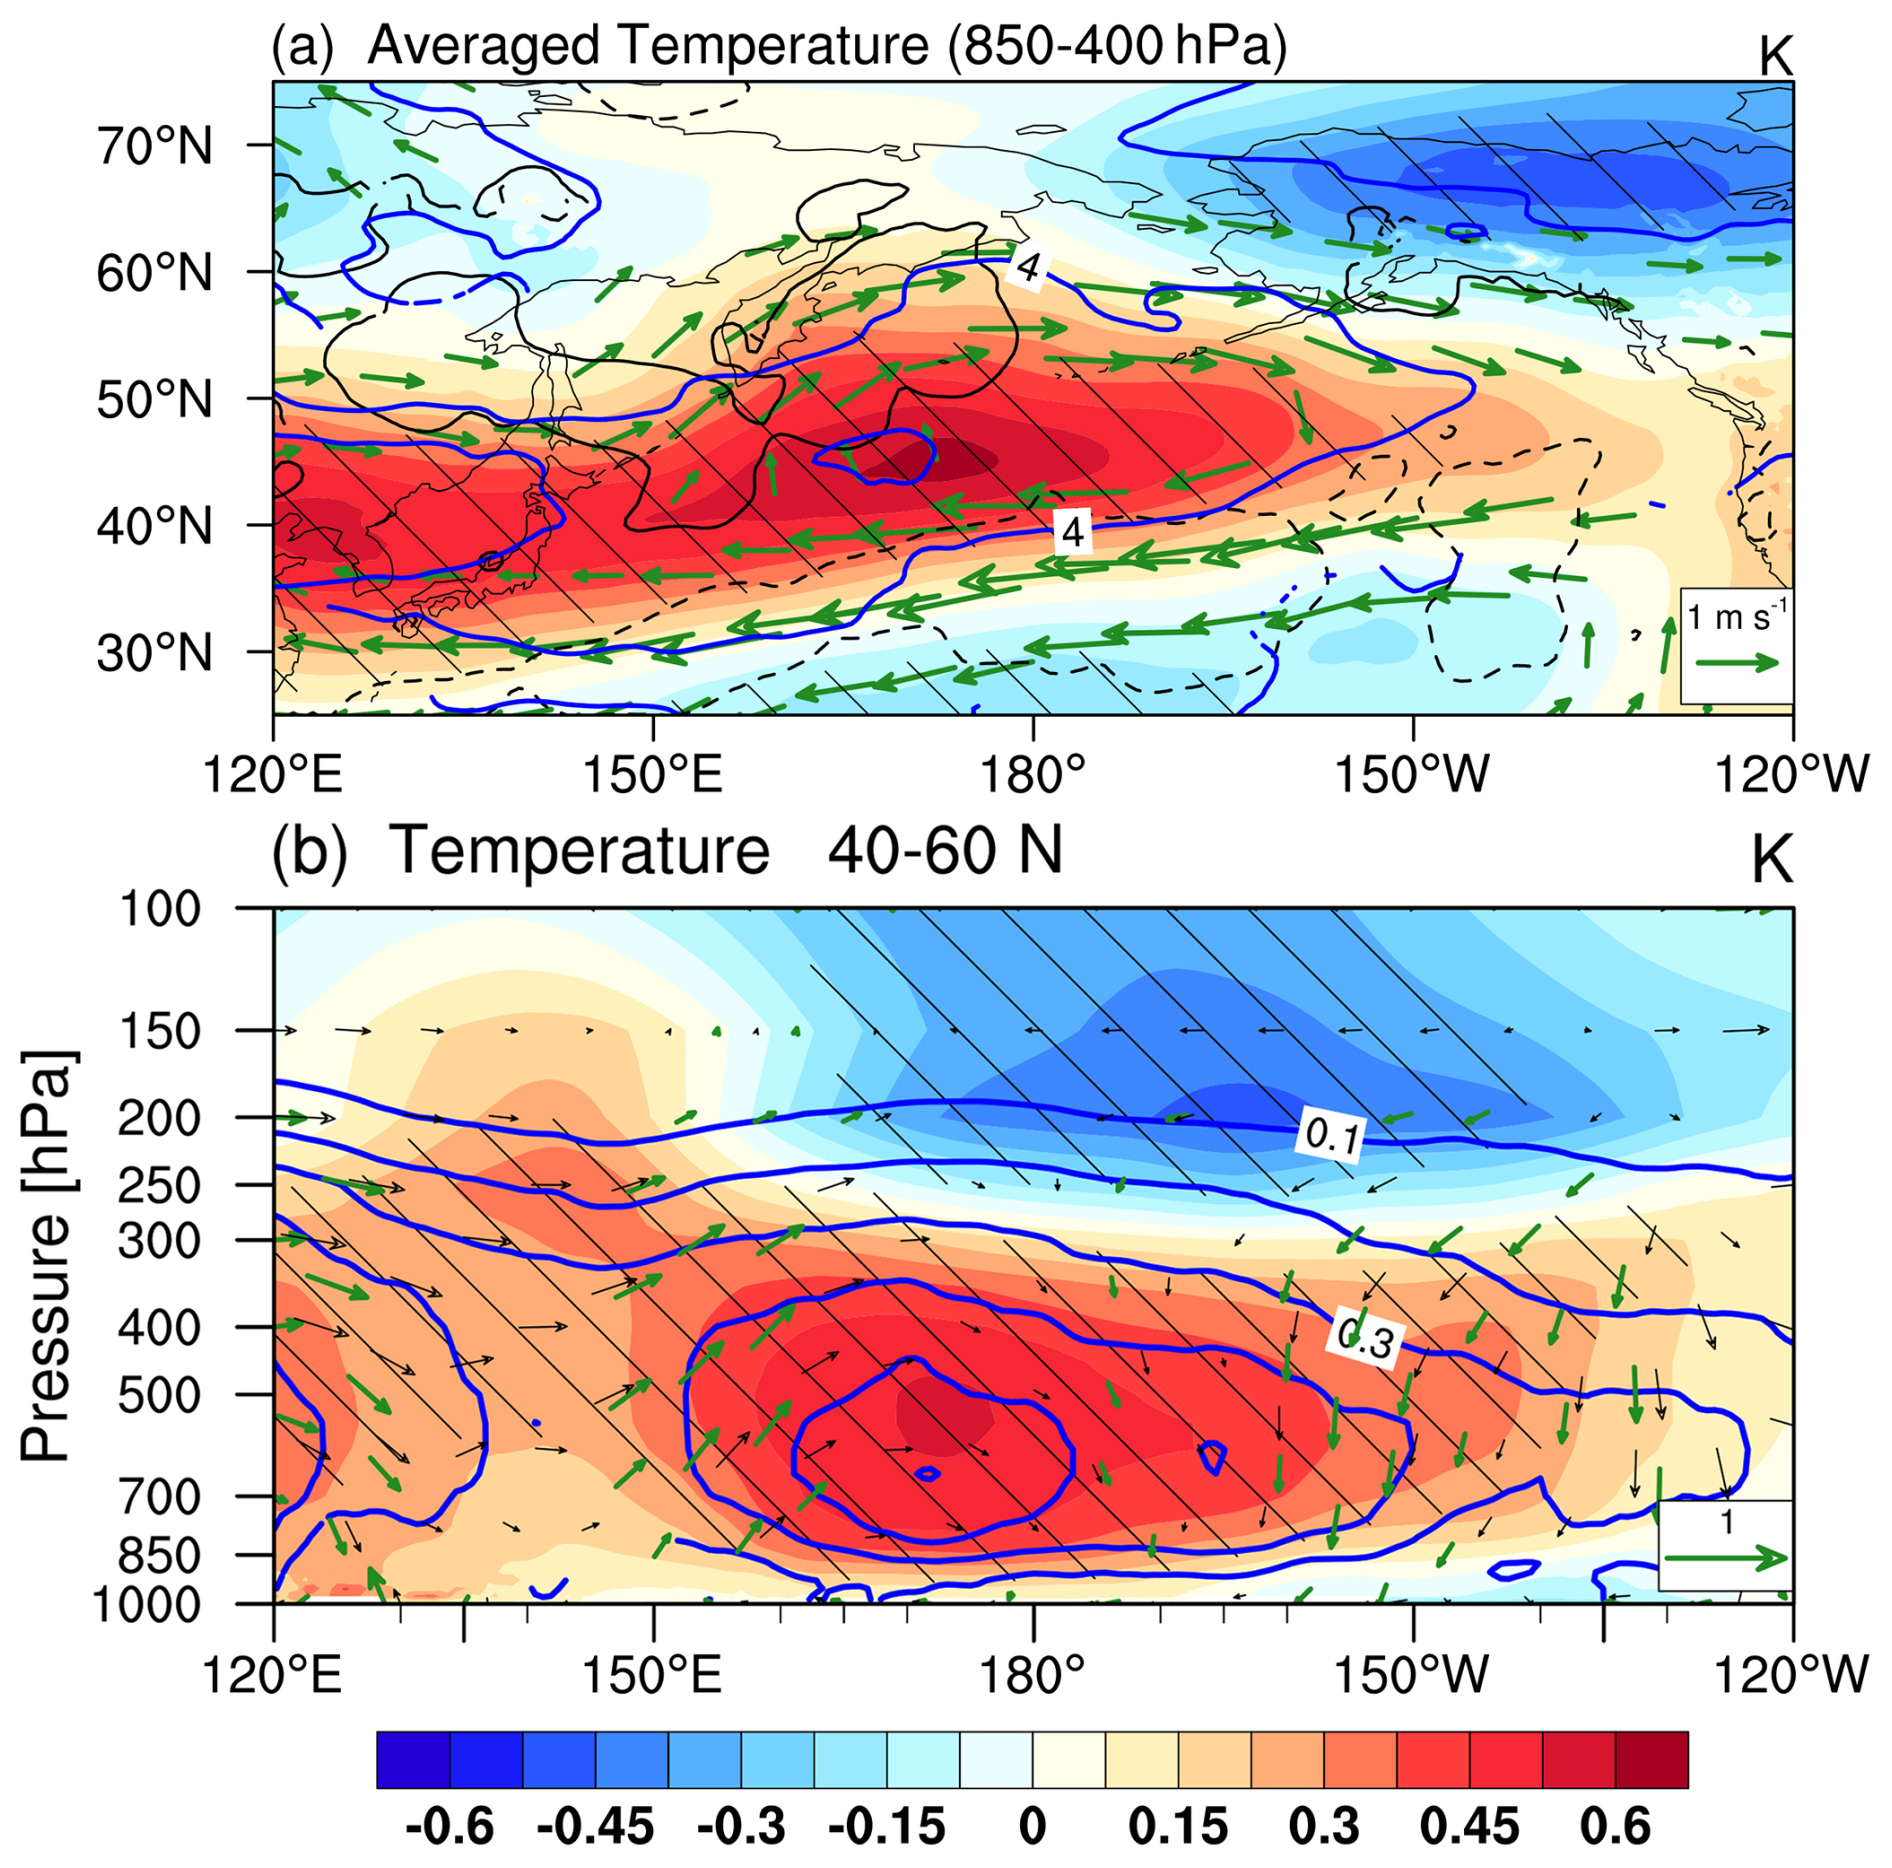
Figure 5(a) Regressions of anomalies in averaged temperature between 850 and 400 hPa (shading; K), 500 hPa wind (vector; m s−1), and dust column mass density (blue contours with an interval of 2 mg m−2) onto the standardized EADI_IA. (b) Pressure-longitude cross section of the regressed anomalies in temperature (shading; K), zonal and vertical winds (vectors), and dust mass concentration (blue contours with an interval of 0.1 µg m−3) averaged over the latitudinal band of 40 to 60° N. Black contours in (a) denote the statistically significant regions of the regressed anomalies shown in Fig. 3b. Hatching and green vectors indicate that the regressed anomalies in temperature and wind are statistically significant at the 95 % confidence level based on a Student's t test, respectively.
The vertical structure of the temperature response is further examined in Fig. 5b, which shows the regression of meridionally averaged (40–60° N) temperature and dust mass concentration anomalies onto the interannual EADI. The eastward-transported dust plume is primarily confined below 300 hPa level. This vertical distribution aligns well with previous satellite-based studies of individual trans-Pacific dust transport events (Guo et al., 2017; Voss and Evan, 2020). Correspondingly, the dust-related atmospheric heating is highly concentrated in the middle and lower troposphere. A significant warm layer is collocated with the dust mass concentration anomalies, featuring a maximum warming center between 850 and 400 hPa. Beyond direct shortwave absorption, large-scale dynamical feedbacks may further reinforce this mid-tropospheric warming. The anomalous anticyclonic circulation established over the central North Pacific (Fig. 5a) is associated with subsidence to its east (east of ∼180° E, Fig. 5b), which likely contributes additional adiabatic warming through descending motion.
The dust-related mid-tropospheric warming is concentrated in a zonal band over the central North Pacific (Fig. 5a), which is expected to modify the meridional temperature gradient (MTG). Through thermal wind balance, the altered MTG adjusts the vertical wind shear and thereby the atmospheric baroclinicity. As shown in Fig. 6a, the 700 hPa MTG increases on the poleward flank and decreases on the equatorward flank of its climatological maximum (grey contours). This dipole pattern is a thermodynamically consistent consequence of the localized dust heating center identified above. The vertical cross-section averaged between 135° E and 135° W (Fig. 6c) further confirms this structure, revealing a robust positive MTG anomaly north of 45° N and a negative anomaly to the south. These MTG anomalies are closely collocated with the northern and southern boundaries of the dust-related warming center.
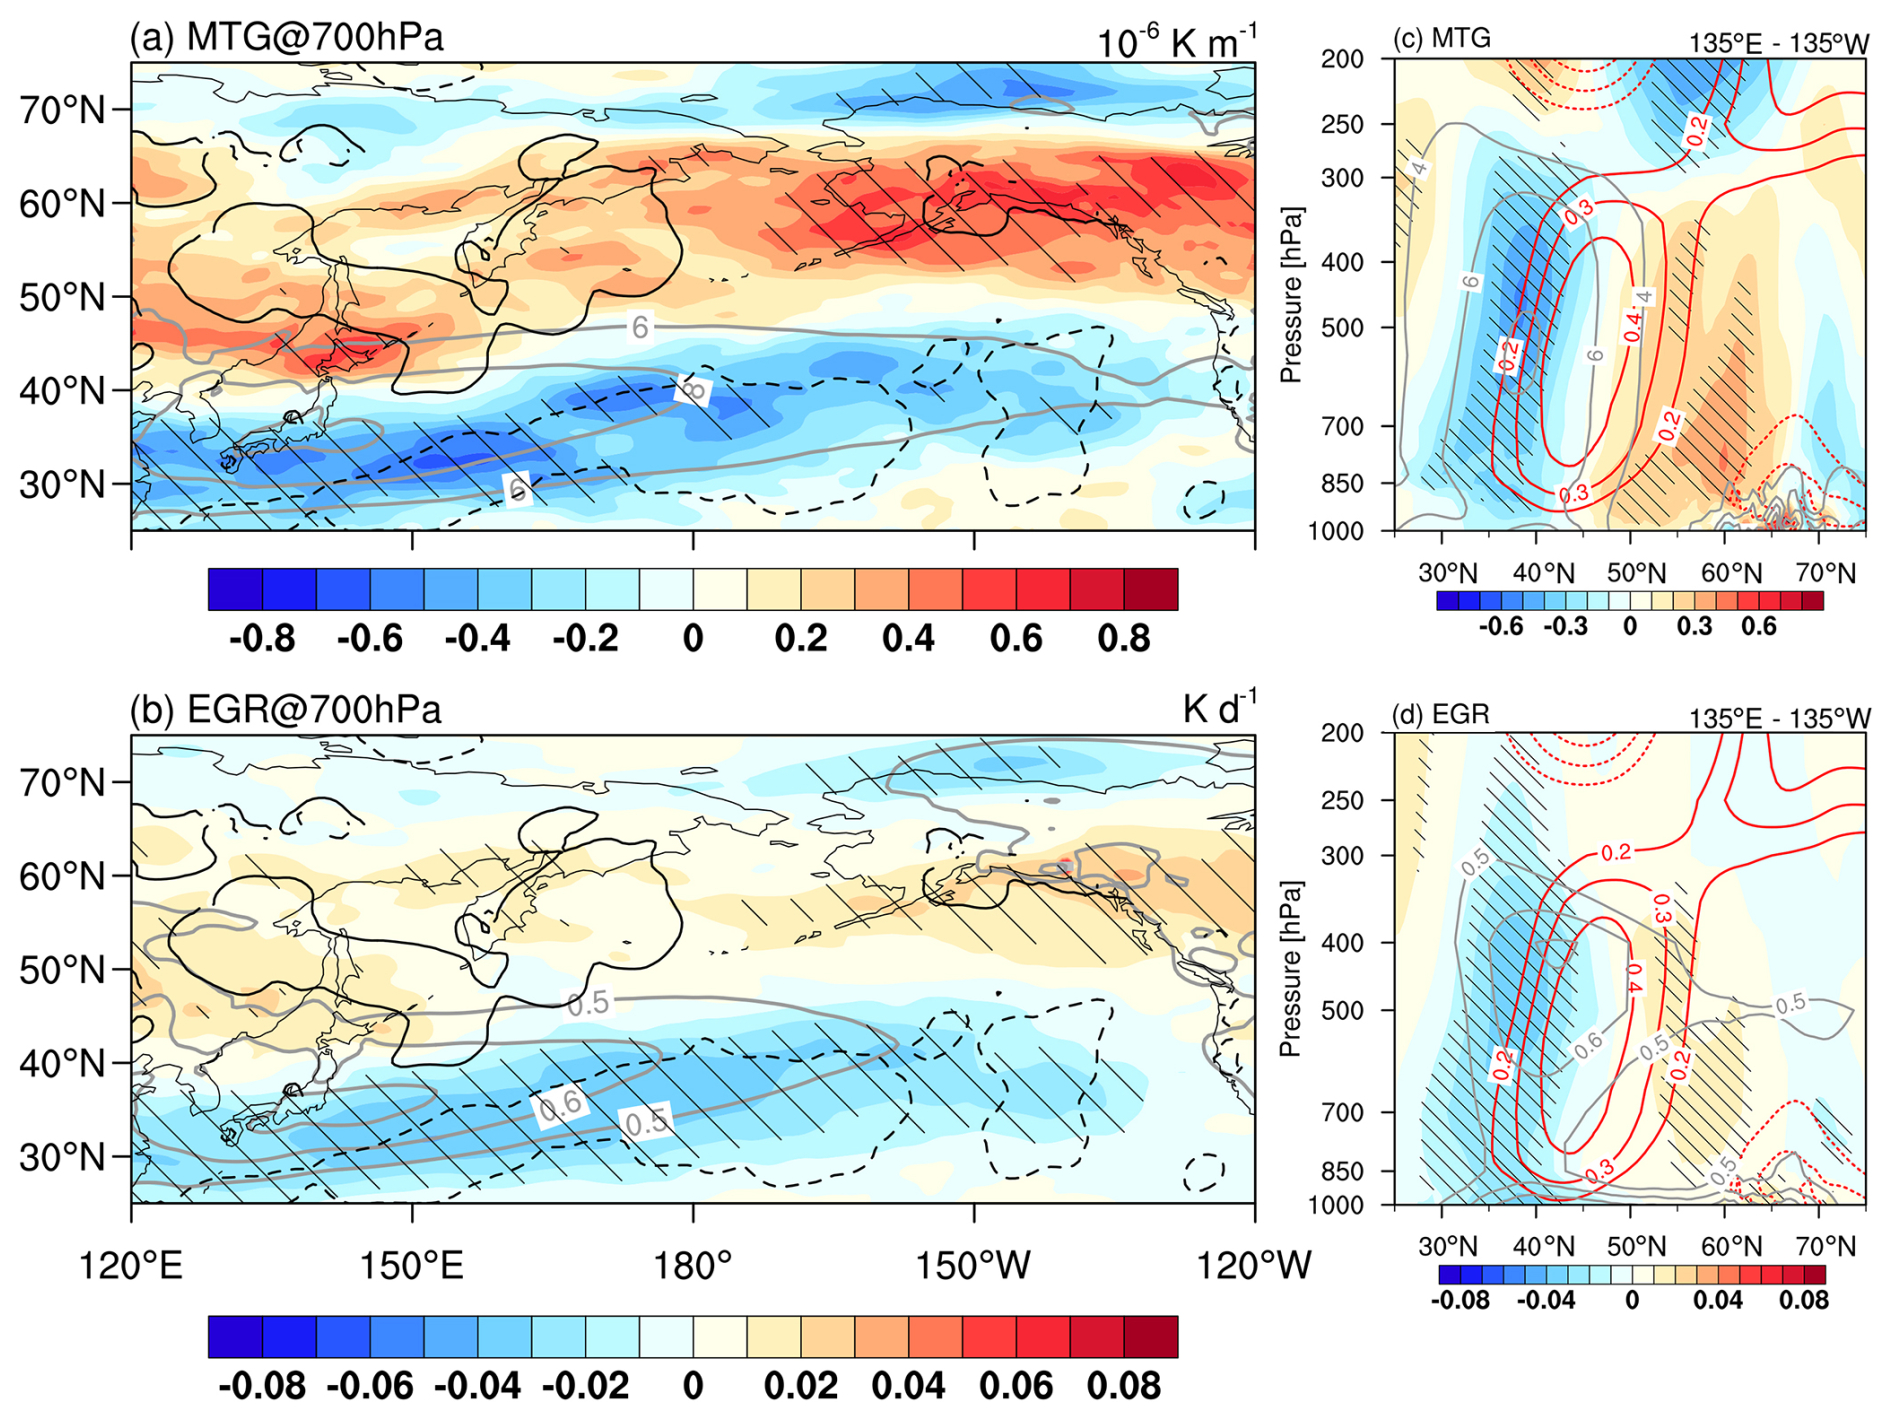
Figure 6Regressions of anomalies in (a) the 700 hPa meridional temperature gradient (MTG; shading; 10−6 K m−1) and (b) the 700 hPa maximum Eady growth rate (EGR; shading; K d−1) onto the standardized EADI_IA. Panels (c) and (d) display the meridional vertical cross sections of the regressed (c) MTG and (d) EGR anomalies averaged from 135° E to 135° W. Black contours in (a) and (b) denote the statistically significant regions of the regressed anomalies shown in Figure 3b. Red contours in (c) and (d) represent the regressed temperature anomalies (K), with solid and dashed lines indicating positive and negative values, respectively. Grey contours in (a), (c) and (b), (d) denote the climatological spring mean MTG (interval of K m−1) and EGR (interval of 0.1 K d−1), respectively. Hatching indicates that the regressed MTG and EGR anomalies are statistically significant at the 95 % confidence level based on a Student's t test.
Because baroclinic instability is fundamentally governed by the MTG, the EGR exhibits an almost identical spatial response (Lindzen and Farrell, 1980; Simmonds and Lim, 2009). At 700 hPa (Fig. 6b), the baroclinicity strengthens on the poleward flank and weakens on the equatorward flank of the climatological EGR maximum (grey contours), mirroring the dipole in the storm track metrics (Fig. 3). The vertical profile of the EGR anomalies (Fig. 6d) closely mirrors that of the MTG throughout the lower and middle troposphere. Importantly, the spatial distribution of these EGR anomalies matches the regions of significant storm track changes, indicating that the baroclinic adjustment directly shapes the optimal zone for transient eddy growth (Chang et al., 2002).
The preceding observational analysis outlines a consistent physical pathway for the dust effect on the North Pacific storm track. Springtime East Asian dust absorbs shortwave radiation, warming the mid-troposphere. This heating restructures the meridional temperature gradient and alters atmospheric baroclinicity. As a result, the favorable zone for baroclinic eddy growth shifts to higher latitudes. We next examine whether this pathway can be reproduced by dust radiative forcing alone in WRF-Chem sensitivity experiments.
3.3 Process-level verification of the proposed mechanism with WRF-Chem sensitivity experiments
To test the pathway inferred above, we compare the CTRL and NoDust ensemble simulations for spring 2018. The CTRL experiment reasonably reproduces the observed spring circulation at 500 hPa, the trans-Pacific transport pathway of the dust plume, and the spatial patterns of both storm track metrics (Fig. S7). The model is therefore suitable for examining the process-level response of the storm track to dust radiative forcing.
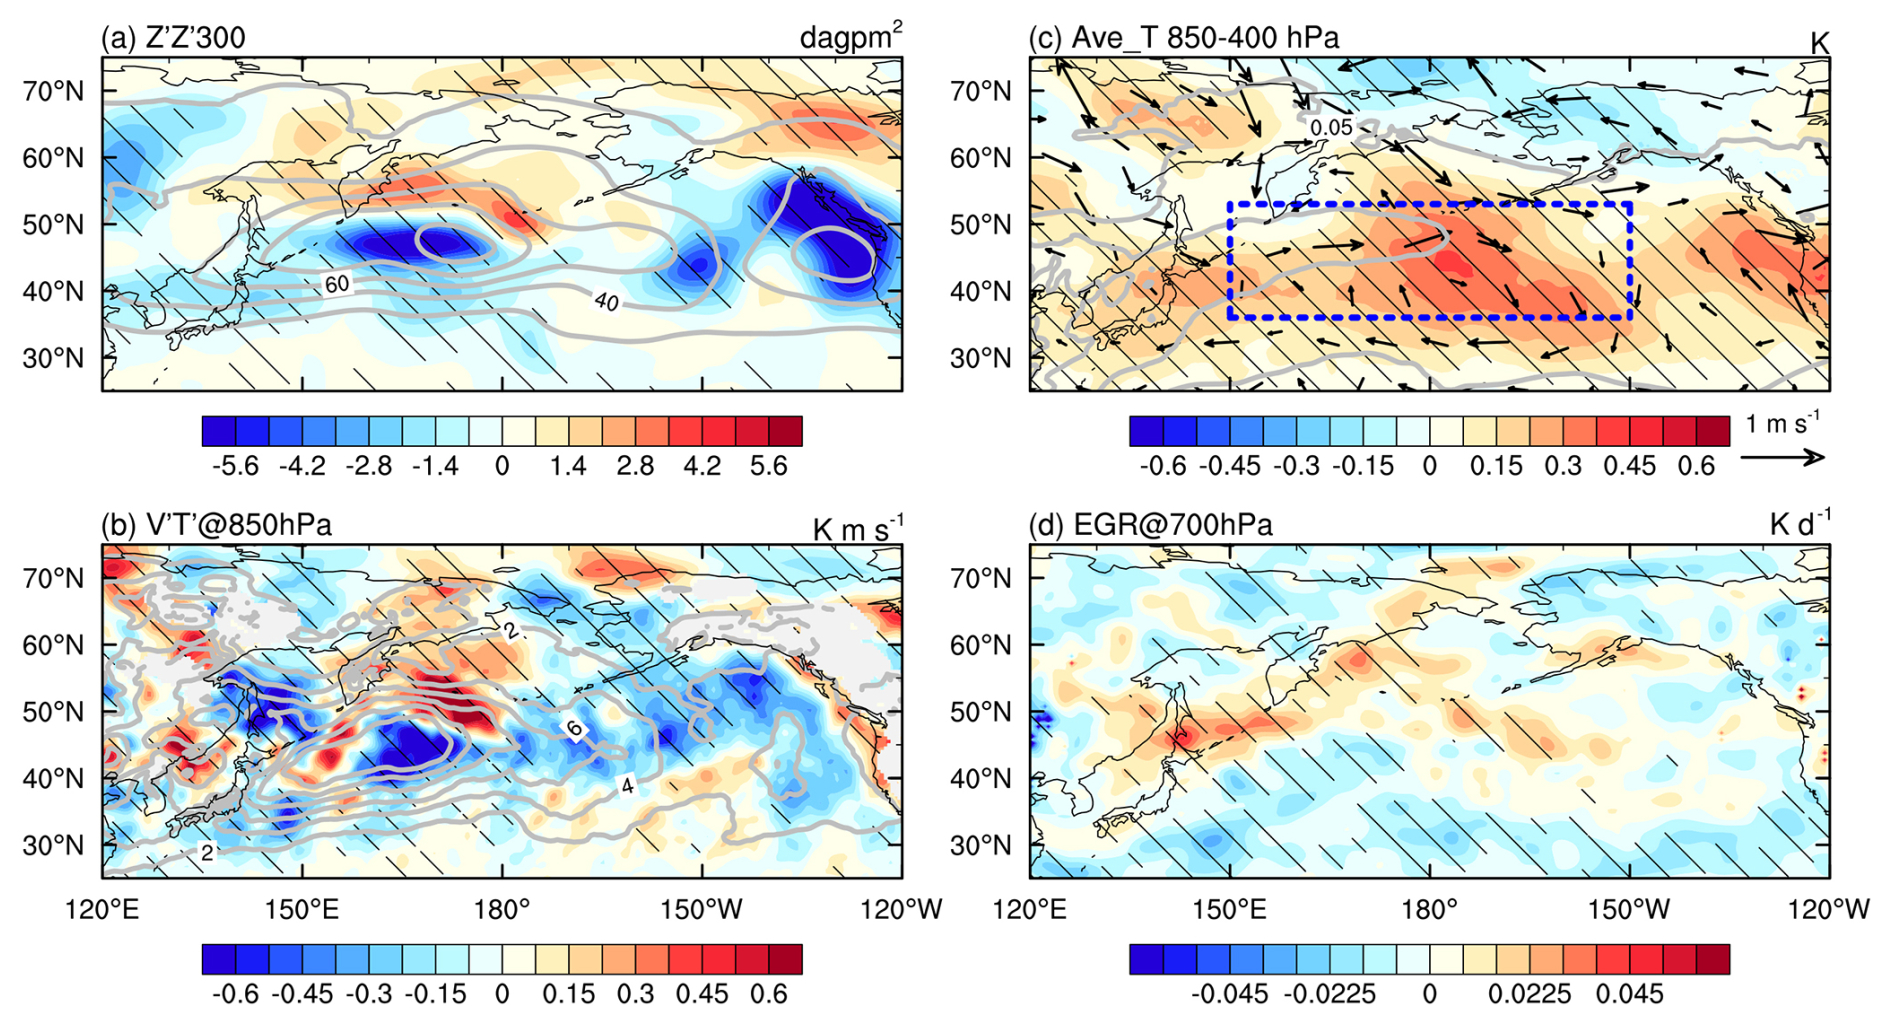
Figure 7Differences (CTRL minus NoDust) in (a) (shading; dagpm2), and (b) (shading; K m s−1), (c) averaged temperature between 850 and 400 hPa (shading; K), 500 hPa wind (vectors; m s−1), and AOD (grey contours), and (d) 700 hPa EGR (shading; K d−1). Grey contours in (a) and (b) represent the corresponding values in the CTRL experiment. The blue dashed box in (c) marks the region used for the heating rate budget in Figure S8. Hatching indicates that the differences are statistically significant at the 95 % confidence level based on a Student's t test.
The simulated responses are consistent with the pathway inferred from the reanalysis. Dust radiative forcing produces a pronounced warming in the mid-troposphere (850 to 400 hPa) over the North Pacific, accompanied by an anomalous anticyclonic circulation at 500 hPa (Fig. 7c). The spatial pattern of this warming closely follows the simulated dust AOD. The heating modifies the atmospheric baroclinicity, so that the EGR at 700 hPa increases on the northern flank of the climatological storm track and decreases on the southern flank (Fig. 7d). Correspondingly, both and shift poleward (Fig. 7a and b). These results indicate that dust radiative heating alone can shift the North Pacific storm track poleward, which supports the physical pathway inferred from the reanalysis.
The heating rate budget averaged over the main warming region (150° E–150° W, 35–53° N; blue dashed box in Fig. 7c) further identifies the source of this warming (Fig. S8). Shortwave radiation is the only positive heating term and peaks near 400 hPa, whereas longwave radiation and latent heating make weak negative contributions. The net heating profile therefore closely follows the shortwave term, indicating that the simulated warming arises mainly from dust shortwave absorption.
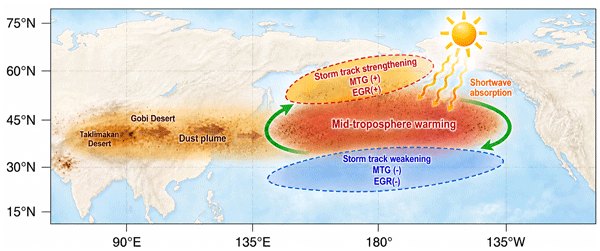
This study shows that interannual variations in springtime East Asian dust loading are systematically associated with a poleward shift of the North Pacific storm track. Using MERRA-2 reanalysis data spanning 1980–2022, we identify a statistically robust association between anomalously high East Asian dust loading and a meridional dipole pattern in storm track activity, characterized by weakening on the equatorward flank and strengthening on the poleward flank. The underlying mechanism follows a coherent physical pathway (Fig. 8). Specifically, shortwave absorption by the trans-Pacific dust plume heats the mid-troposphere (850–400 hPa), which excites an anomalous anticyclonic circulation. This circulation restructures the meridional temperature gradient into a north-positive/south-negative dipole pattern, and consequently shifts the zone of maximum Eady growth rate poleward, favoring baroclinic eddy development at higher latitudes. Model sensitivity experiments for spring 2018 reproduce the spatial pattern of this response, indicating that dust shortwave absorption alone can produce a poleward shift of the storm track.
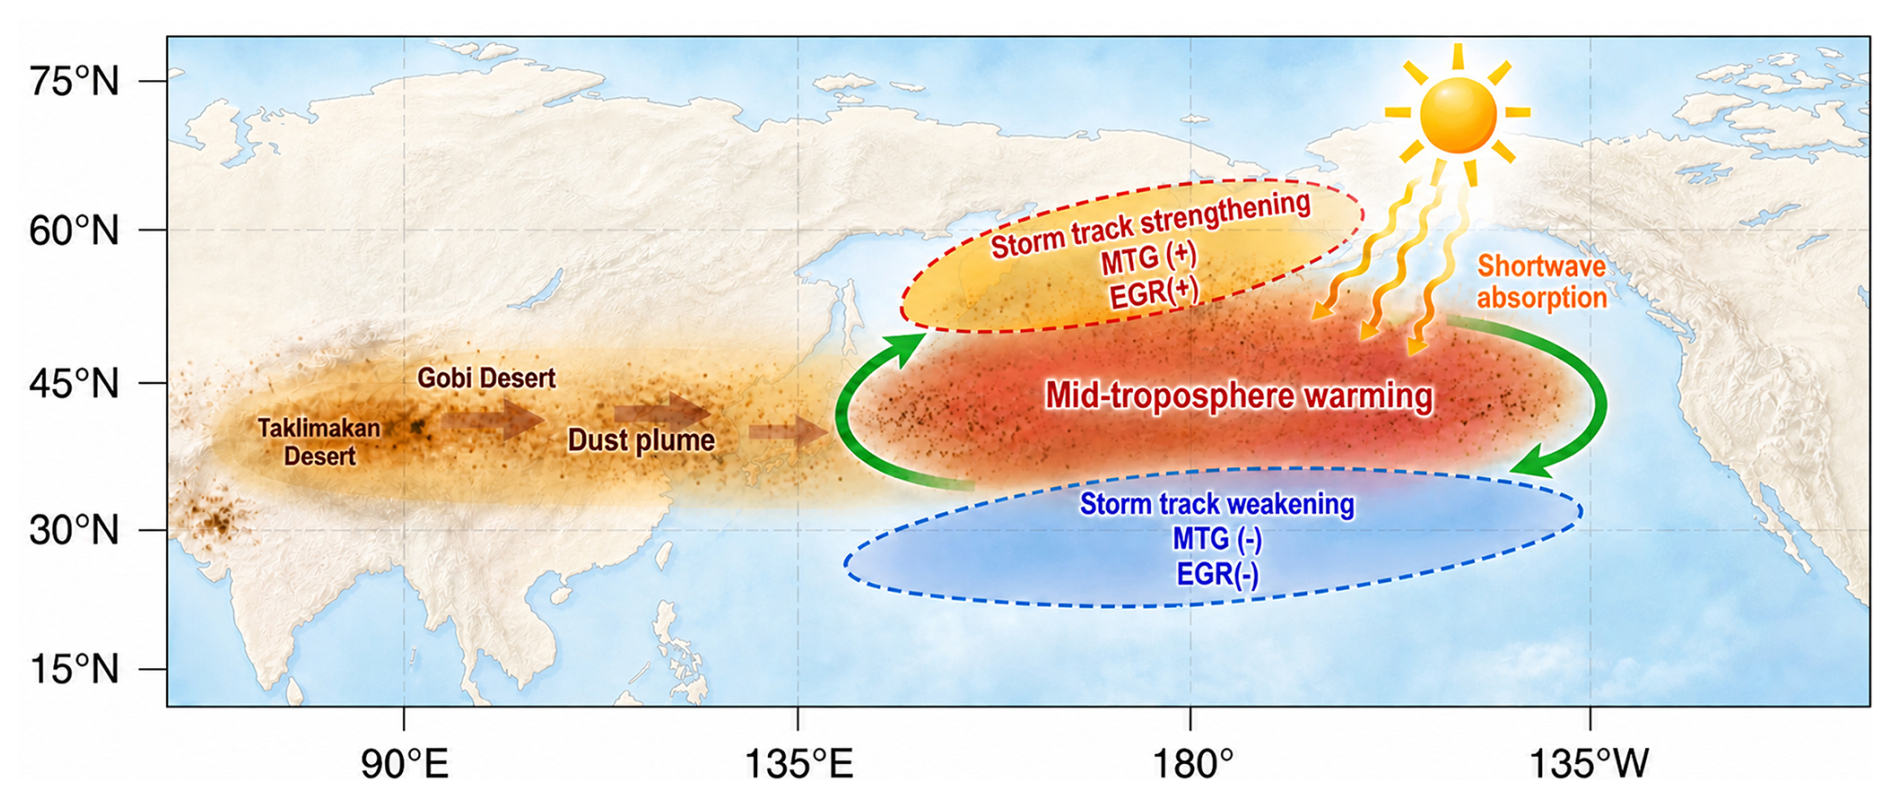
Figure 8Schematic diagram illustrating the physical mechanism by which springtime East Asian dust aerosols favour a poleward shift of the North Pacific storm track. Dust emitted from East Asian sources is transported eastward across the North Pacific by mid-latitude westerlies. Shortwave absorption by the dust plume warms the mid-troposphere, enhancing (reducing) the meridional temperature gradient (MTG) on the poleward (equatorward) flank. The resulting dipole in the maximum Eady growth rate (EGR) favours storm track strengthening at higher latitudes and weakening at lower latitudes, producing a net poleward displacement.
It is important to distinguish the effects of dust aerosols from those of anthropogenic aerosols on the North Pacific storm track. Previous studies have shown that long-term changes in East Asian anthropogenic emissions predominantly intensify the wintertime storm track through aerosol-cloud interactions and associated latent heat release (Zhang et al., 2007; Wang et al., 2014a). In contrast, our findings highlight that interannual variations in springtime dust aerosols mainly alter the latitudinal position of the storm track via aerosol-radiation interactions, a response attributable to the direct radiative heating of the dust layer. Because mid-latitude transient eddies transport heat, moisture, and momentum poleward (Shaw et al., 2016; Tamarin-Brodsky and Kaspi, 2017; Hoskins and Hodges, 2019), a shift in the storm track position redistributes these fluxes and carries consequences well beyond the North Pacific. The enhanced transient meridional heat flux near the Bering Sea (Fig. 3b) may accelerate springtime Arctic sea ice melting and trigger subsequent climate feedbacks (Overland and Pease, 1982; Huang et al., 2019; Peng et al., 2021). Downstream over North America, a poleward shift redirects the landfall of moisture transport and has been linked to drier conditions over the southwestern United States and wetter conditions along the higher latitude coast (Salathé, 2006; Chemke and Yuval, 2026). The storm track position also regulates the frequency of deep tropopause folds that bring stratospheric ozone into the lower troposphere over western North America, an effect that peaks in spring (Lin et al., 2015; Breeden et al., 2021). Assessing these consequences requires dedicated analysis beyond the scope of the present study, but they indicate that springtime dust variability, including its interannual component, deserves attention in regional climate assessments.
The WRF-Chem experiments are intended to verify the proposed mechanism rather than to quantify the sensitivity of the storm track to dust. The simulated responses in both temperature and storm track metrics are weaker than those inferred from the observational regression analysis, even after the difference in North Pacific dust burden between the 2018 experiment and a one-standard-deviation EADI anomaly is considered. Several factors may contribute to this discrepancy. The regional model domain excludes dust transported from the Middle East and North Africa (Creamean et al., 2013; Hu et al., 2019; Zhou et al., 2024; Huang et al., 2025), which lowers the simulated dust burden over the North Pacific. East Asian dust also mixes with anthropogenic aerosols during long-range transport, and such internally mixed dust aerosols can be more than 50 % more absorbing than pure dust (Tian et al., 2018). This enhancement is not represented because anthropogenic emissions were excluded by design. In addition, the four-band shortwave radiation scheme used in our WRF-Chem configuration (Zhao et al., 2012) tends to underestimate dust shortwave heating rates relative to schemes with finer spectral resolution (Feng et al., 2025). Finally, dust particles can act as ice nucleating particles and alter the energy budget through aerosol-cloud interactions (Uno et al., 2009; Zeng et al., 2023; Chen et al., 2024), which are not included in the current configuration.
The source codes of WRF-Chem model are available at https://www2.mmm.ucar.edu/wrf/users/download/get_source.html (UCAR, 2026). The FNL data are available at https://doi.org/10.5065/D6M043C6 (NCEP/National Weather Service/NOAA/U.S. Department of Commerce, 2000). MERRA-2 reanalysis data are available at https://doi.org/10.5067/2E096JV59PK7 (GMAO, 2015). The MODIS AOD are available at https://doi.org/10.5067/MODIS/MOD08_M3.061 (Platnick et al., 2015). CMAP precipitation data are available at https://disc.gsfc.nasa.gov/datasets (last access: 2 November 2026) (Xie and Arkin, 1997). The NAO index and ONI are available at https://www.cpc.ncep.noaa.gov/products/precip/CWlink/pna/nao.shtml and https://www.cpc.ncep.noaa.gov/products/analysis_monitoring/ensostuff/ONI_v5.php, respectively (NOAA CPC, 2026a, b). Dust emission data are available at https://doi.org/10.11888/Terre.tpdc.301534 (Fu, 2026).
The supplement related to this article is available online at https://doi.org/10.5194/acp-26-15445-2026-supplement.
XH, HX and AZ conceptualized the research goals and developed the methodology, including the experimental setup. AZ carried out the investigation, performed the formal analysis, and visualized the results. JD and AD also contributed to the supervision of the work. LX, ZW, KD and TL contributed to data curation. AZ prepared the manuscript with contributions from all co-authors, and all authors contributed to the writing (review and editing) of the final article.
The contact author has declared that none of the authors has any competing interests.
Publisher's note: Copernicus Publications remains neutral with regard to jurisdictional claims made in the text, published maps, institutional affiliations, or any other geographical representation in this paper. The authors bear the ultimate responsibility for providing appropriate place names. Views expressed in the text are those of the authors and do not necessarily reflect the views of the publisher.
We are grateful to the High Performance Computing Center (HPCC) of Nanjing University for doing the numerical calculations in this paper on its blade cluster system. We also thank all the corresponding institutions for providing their data for this study. Additionally, we acknowledge the use of the GPT image 2 model (OpenAI) for the visual optimization of the schematic diagram presented in Fig. 8, while emphasizing that the scientific concepts and physical mechanisms depicted therein remain entirely the work of the authors.
This work was supported by the National Natural Science Foundation of China (grant no. 42588101) and the New Cornerstone Science Foundation through the XPLORER PRIZE.
This paper was edited by Kevin Grise and reviewed by two anonymous referees.
Awan, J. A. and Bae, D.-H.: Features and interdecadal variability of droughts in the homogeneous rainfall zones over the East Asian monsoon region, Int. J. Climatol., 36, 1943–1953, https://doi.org/10.1002/joc.4471, 2016.
Bao, Z., Wen, Z., and Wu, R.: Variability of aerosol optical depth over east Asia and its possible impacts, J. Geophys. Res.-Atmos., 114, D14214, https://doi.org/10.1029/2008JD010603, 2009.
Bender, F. A.-M., Ramanathan, V., and Tselioudis, G.: Changes in extratropical storm track cloudiness 1983–2008: observational support for a poleward shift, Clim. Dynam., 38, 2037–2053, https://doi.org/10.1007/s00382-011-1065-6, 2012.
Blackmon, M. L.: A Climatological Spectral Study of the 500 mb Geopotential Height of the Northern Hemisphere, J. Atmos. Sci., 33, 1607–1623, https://doi.org/10.1175/1520-0469(1976)033<1607:ACSSOT>2.0.CO;2, 1976.
Bohren, C. F. and Huffman, D. R.: Absorption and Scattering of Light by Small Particles, John Wiley & Sons, New York, USA, https://doi.org/10.1002/9783527618156, 1983.
Breeden, M. L., Butler, A. H., Albers, J. R., Sprenger, M., and Langford, A. O.: The spring transition of the North Pacific jet and its relation to deep stratosphere-to-troposphere mass transport over western North America, Atmos. Chem. Phys., 21, 2781–2794, https://doi.org/10.5194/acp-21-2781-2021, 2021.
Cai, W., van Rensch, P., Cowan, T., and Hendon, H. H.: Teleconnection Pathways of ENSO and the IOD and the Mechanisms for Impacts on Australian Rainfall, J. Climate, 24, 3910–3923, https://doi.org/10.1175/2011JCLI4129.1, 2011.
Chang, E. K. M., Lee, S., and Swanson, K. L.: Storm Track Dynamics, J. Climate, 15, 2163–2183, https://doi.org/10.1175/1520-0442(2002)015<02163:STD>2.0.CO;2, 2002.
Chemke, R. and Yuval, J.: Climate change shifts the North Pacific storm track polewards, Nature, 649, 626–630, https://doi.org/10.1038/s41586-025-09895-y, 2026.
Chen, J., Xu, J., Wu, Z., Meng, X., Yu, Y., Ginoux, P., DeMott, P. J., Xu, R., Zhai, L., Yan, Y., Zhao, C., Li, S.-M., Zhu, T., and Hu, M.: Decreased dust particles amplify the cloud cooling effect by regulating cloud ice formation over the Tibetan Plateau, Sci. Adv., 10, eado0885, https://doi.org/10.1126/sciadv.ado0885, 2024.
Chen, S., Huang, J., Qian, Y., Zhao, C., Kang, L., Yang, B., Wang, Y., Liu, Y., Yuan, T., Wang, T., Ma, X., and Zhang, G.: An overview of mineral dust modeling over East Asia, J. Meteorol. Res., 31, 633–653, https://doi.org/10.1007/s13351-017-6142-2, 2017.
Chen, S.-H. and Sun, W.-Y.: A One-dimensional Time Dependent Cloud Model, J. Meteorol. Soc. Jpn. II, 80, 99–118, https://doi.org/10.2151/jmsj.80.99, 2002.
Chen, Y., Yang, K., Zhou, D., Qin, J., and Guo, X.: Improving the Noah Land Surface Model in Arid Regions with an Appropriate Parameterization of the Thermal Roughness Length, J. Hydrometeorol., 11, 995–1006, https://doi.org/10.1175/2010JHM1185.1, 2010.
Chen, Y., Chen, S., Zhou, J., Zhao, D., Bi, H., Zhang, Y., Alam, K., Yu, H., Yang, Y., and Chen, J.: A super dust storm enhanced by radiative feedback, npj Clim. Atmos. Sci., 6, 90, https://doi.org/10.1038/s41612-023-00418-y, 2023.
Chin, M., Ginoux, P., Kinne, S., Torres, O., Holben, B. N., Duncan, B. N., Martin, R. V., Logan, J. A., Higurashi, A., and Nakajima, T.: Tropospheric Aerosol Optical Thickness from the GOCART Model and Comparisons with Satellite and Sun Photometer Measurements, J. Atmos. Sci., 59, 461–483, https://doi.org/10.1175/1520-0469(2002)059<0461:TAOTFT>2.0.CO;2, 2002.
Creamean, J. M., Suski, K. J., Rosenfeld, D., Cazorla, A., DeMott, P. J., Sullivan, R. C., White, A. B., Ralph, F. M., Minnis, P., Comstock, J. M., Tomlinson, J. M., and Prather, K. A.: Dust and Biological Aerosols from the Sahara and Asia Influence Precipitation in the Western U.S., Science, 339, 1572–1578, https://doi.org/10.1126/science.1227279, 2013.
Feng, J., Zhao, C., Du, Q., Yang, Z., and Jin, C.: Amending the algorithm of aerosol–radiation interactions in WRF-Chem (v4.4), Geosci. Model Dev., 18, 585–603, https://doi.org/10.5194/gmd-18-585-2025, 2025.
Fu, Y.: Processed dust emission data and code for “Beyond the horizon: long-term benefits of vegetation restoration for dust mitigation in Eastern Asia”, National Tibetan Plateau Data Center [data set], https://doi.org/10.11888/Terre.tpdc.301534, 2026.
Fu, Y., Wu, C., Gao, S., Peñuelas, J., Camarero, J. J., Zhang, J., Li, D., Zheng, X., Li, Z., Wang, Y., Liang, E., and Piao, S.: Vegetation greening drives long-term dust mitigation in Eastern Asia, Nat. Commun., 17, 1729, https://doi.org/10.1038/s41467-026-68427-y, 2026.
Gelaro, R., McCarty, W., Suárez, M. J., Todling, R., Molod, A., Takacs, L., Randles, C. A., Darmenov, A., Bosilovich, M. G., Reichle, R., Wargan, K., Coy, L., Cullather, R., Draper, C., Akella, S., Buchard, V., Conaty, A., da Silva, A. M., Gu, W., Kim, G.-K., Koster, R., Lucchesi, R., Merkova, D., Nielsen, J. E., Partyka, G., Pawson, S., Putman, W., Rienecker, M., Schubert, S. D., Sienkiewicz, M., and Zhao, B.: The Modern-Era Retrospective Analysis for Research and Applications, Version 2 (MERRA-2), J. Climate, 30, 5419–5454, https://doi.org/10.1175/JCLI-D-16-0758.1, 2017.
Global Modeling and Assimilation Office (GMAO): MERRA-2 instM_3d_asm_Np: 3d, Monthly mean, Instantaneous, Pressure-Level, Assimilation, Assimilated Meteorological Fields V5.12.4, Goddard Earth Sciences Data and Information Services Center (GES DISC) [data set], https://doi.org/10.5067/2E096JV59PK7, 2015.
Grell, G. A.: Prognostic Evaluation of Assumptions Used by Cumulus Parameterizations, Mon. Weather Rev., 121, 764–787, https://doi.org/10.1175/1520-0493(1993)121<0764:PEOAUB>2.0.CO;2, 1993.
Grell, G. A. and Dévényi, D.: A generalized approach to parameterizing convection combining ensemble and data assimilation techniques, Geophys. Res. Lett., 29, 38-1–38-4, https://doi.org/10.1029/2002GL015311, 2002.
Gui, K., Yao, W., Che, H., An, L., Zheng, Y., Li, L., Zhao, H., Zhang, L., Zhong, J., Wang, Y., and Zhang, X.: Record-breaking dust loading during two mega dust storm events over northern China in March 2021: aerosol optical and radiative properties and meteorological drivers, Atmos. Chem. Phys., 22, 7905–7932, https://doi.org/10.5194/acp-22-7905-2022, 2022.
Guo, J., Lou, M., Miao, Y., Wang, Y., Zeng, Z., Liu, H., He, J., Xu, H., Wang, F., Min, M., and Zhai, P.: Trans-Pacific transport of dust aerosols from East Asia: Insights gained from multiple observations and modeling, Environ. Pollut., 230, 1030–1039, https://doi.org/10.1016/j.envpol.2017.07.062, 2017.
Guo, J., Xu, H., Liu, L., Chen, D., Peng, Y., Yim, S. H.-L., Yang, Y., Li, J., Zhao, C., and Zhai, P.: The Trend Reversal of Dust Aerosol Over East Asia and the North Pacific Ocean Attributed to Large-Scale Meteorology, Deposition, and Soil Moisture, J. Geophys. Res.-Atmos., 124, 10450–10466, https://doi.org/10.1029/2019JD030654, 2019.
Gupta, P., Levy, R. C., Mattoo, S., Remer, L. A., and Munchak, L. A.: A surface reflectance scheme for retrieving aerosol optical depth over urban surfaces in MODIS Dark Target retrieval algorithm, Atmos. Meas. Tech., 9, 3293–3308, https://doi.org/10.5194/amt-9-3293-2016, 2016.
Heidinger, A. K., Foster, M. J., Walther, A., and Zhao, X.: The Pathfinder Atmospheres–Extended AVHRR Climate Dataset, B. Am. Meteorol. Soc., 95, 909–922, https://doi.org/10.1175/BAMS-D-12-00246.1, 2014.
Holben, B. N., Eck, T. F., Slutsker, I., Tanré, D., Buis, J. P., Setzer, A., Vermote, E., Reagan, J. A., Kaufman, Y. J., Nakajima, T., Lavenu, F., Jankowiak, I., and Smirnov, A.: AERONET – A Federated Instrument Network and Data Archive for Aerosol Characterization, Remote Sens. Environ., 66, 1–16, https://doi.org/10.1016/S0034-4257(98)00031-5, 1998.
Hong, S.-Y., Noh, Y., and Dudhia, J.: A New Vertical Diffusion Package with an Explicit Treatment of Entrainment Processes, Mon. Weather Rev., 134, 2318–2341, https://doi.org/10.1175/MWR3199.1, 2006.
Hoskins, B. J. and Hodges, K. I.: The Annual Cycle of Northern Hemisphere Storm Tracks. Part I: Seasons, J. Climate, 32, 1743–1760, https://doi.org/10.1175/JCLI-D-17-0870.1, 2019.
Hu, Z., Huang, J., Zhao, C., Ma, Y., Jin, Q., Qian, Y., Leung, L. R., Bi, J., and Ma, J.: Trans-Pacific transport and evolution of aerosols: spatiotemporal characteristics and source contributions, Atmos. Chem. Phys., 19, 12709–12730, https://doi.org/10.5194/acp-19-12709-2019, 2019.
Huang, J., Wang, T., Wang, W., Li, Z., and Yan, H.: Climate effects of dust aerosols over East Asian arid and semiarid regions, J. Geophys. Res.-Atmos., 119, 11398–11416, https://doi.org/10.1002/2014JD021796, 2014.
Huang, Y., Dong, X., Xi, B., and Deng, Y.: A survey of the atmospheric physical processes key to the onset of Arctic sea ice melt in spring, Clim. Dynam., 52, 4907–4922, https://doi.org/10.1007/s00382-018-4422-x, 2019.
Huang, Z., Liu, Q., Dong, Q., Hu, Z., Zhang, X., Li, Z., and Wang, Y.: Eastward Transport of African Dust and Its Climatic and Environmental Impacts, Adv. Earth Sci., 40, 1–14, https://doi.org/10.11867/j.issn.1001-8166.2025.004, 2025 (in Chinese).
Iacono, M. J., Delamere, J. S., Mlawer, E. J., Shephard, M. W., Clough, S. A., and Collins, W. D.: Radiative forcing by long-lived greenhouse gases: Calculations with the AER radiative transfer models, J. Geophys. Res.-Atmos., 113, D13103, https://doi.org/10.1029/2008JD009944, 2008.
Idrissa, N. F., Zhao, C., Zhiyuan, H., Feng, J., and Du, Q.: Long-range transport impact of a severe dust storm over the Yangtze River Basin region and its modeling sensitivity to dust emission scheme, Atmos. Res., 310, 107612, https://doi.org/10.1016/j.atmosres.2024.107612, 2024.
Jiang, T., Deng, Y., and Li, W.: Local kinetic energy budget of high-frequency and intermediate-frequency eddies: winter climatology and interannual variability, Clim. Dynam., 41, 961–976, https://doi.org/10.1007/s00382-013-1684-1, 2013.
Jin, Q., Wei, J., Lau, W. K. M., Pu, B., and Wang, C.: Interactions of Asian mineral dust with Indian summer monsoon: Recent advances and challenges, Earth-Sci. Rev., 215, 103562, https://doi.org/10.1016/j.earscirev.2021.103562, 2021.
Kahn, R. A., Gaitley, B. J., Martonchik, J. V., Diner, D. J., Crean, K. A., and Holben, B.: Multiangle Imaging Spectroradiometer (MISR) global aerosol optical depth validation based on 2 years of coincident Aerosol Robotic Network (AERONET) observations, J. Geophys. Res.-Atmos., 110, D10S04, https://doi.org/10.1029/2004JD004706, 2005.
Kok, J. F., Storelvmo, T., Karydis, V. A., Adebiyi, A. A., Mahowald, N. M., Evan, A. T., He, C., and Leung, D. M.: Mineral dust aerosol impacts on global climate and climate change, Nat. Rev. Earth Environ., 4, 71–86, https://doi.org/10.1038/s43017-022-00379-5, 2023.
Lau, K. M., Kim, M. K., and Kim, K. M.: Asian summer monsoon anomalies induced by aerosol direct forcing: the role of the Tibetan Plateau, Clim. Dynam., 26, 855–864, https://doi.org/10.1007/s00382-006-0114-z, 2006.
Levy, R. C., Remer, L. A., Kleidman, R. G., Mattoo, S., Ichoku, C., Kahn, R., and Eck, T. F.: Global evaluation of the Collection 5 MODIS dark-target aerosol products over land, Atmos. Chem. Phys., 10, 10399–10420, https://doi.org/10.5194/acp-10-10399-2010, 2010.
Li, Y., Xu, F., Feng, J., Du, M., Song, W., Li, C., and Zhao, W.: Influence of the previous North Atlantic Oscillation (NAO) on the spring dust aerosols over North China, Atmos. Chem. Phys., 23, 6021–6042, https://doi.org/10.5194/acp-23-6021-2023, 2023.
Liguori, G., McGregor, S., Singh, M., Arblaster, J., and Di Lorenzo, E.: Revisiting ENSO and IOD Contributions to Australian Precipitation, Geophys. Res. Lett., 49, e2021GL094295, https://doi.org/10.1029/2021GL094295, 2022.
Lin, M., Fiore, A. M., Horowitz, L. W., Langford, A. O., Oltmans, S. J., Tarasick, D., and Rieder, H. E.: Climate variability modulates western US ozone air quality in spring via deep stratospheric intrusions, Nat. Commun., 6, 7105, https://doi.org/10.1038/ncomms8105, 2015.
Lindzen, R. S. and Farrell, B.: A Simple Approximate Result for the Maximum Growth Rate of Baroclinic Instabilities, J. Atmos. Sci., 37, 1648–1654, https://doi.org/10.1175/1520-0469(1980)037<1648:ASARFT>2.0.CO;2, 1980.
Liu, Z., Ming, Y., Wang, L., Bollasina, M., Luo, M., Lau, N.-C., and Yim, S. H.-L.: A Model Investigation of Aerosol-Induced Changes in the East Asian Winter Monsoon, Geophys. Res. Lett., 46, 10186–10195, https://doi.org/10.1029/2019GL084228, 2019.
Ming, Y., Ramaswamy, V., and Chen, G.: A Model Investigation of Aerosol-Induced Changes in Boreal Winter Extratropical Circulation, J. Climate, 24, 6077–6091, https://doi.org/10.1175/2011JCLI4111.1, 2011.
NCEP/National Weather Service/NOAA/U.S. Department of Commerce: NCEP FNL Operational Model Global Tropospheric Analyses, continuing from July 1999, NSF National Center for Atmospheric Research [data set], https://doi.org/10.5065/D6M043C6, 2000.
NOAA CPC: North Atlantic Oscillation (NAO) monthly index, NOAA Climate Prediction Center [data set], https://www.cpc.ncep.noaa.gov/products/precip/CWlink/pna/nao.shtml, last access: 25 September 2026a.
NOAA CPC: Oceanic Niño Index (ONI), version 5, NOAA Climate Prediction Center [data set], https://www.cpc.ncep.noaa.gov/products/analysis_monitoring/ensostuff/ONI_v5.php, last access: 25 September 2026b.
Overland, J. E. and Pease, C. H.: Cyclone Climatology of the Bering Sea and Its Relation to Sea Ice Extent, Mon. Weather Rev., 110, 5–13, https://doi.org/10.1175/1520-0493(1982)110<0005:CCOTBS>2.0.CO;2, 1982.
Pahlow, M., Parlange, M. B., and Porté-Agel, F.: On Monin–Obukhov Similarity In The Stable Atmospheric Boundary Layer, Bound.-Lay. Meteorol., 99, 225–248, https://doi.org/10.1023/A:1018909000098, 2001.
Peng, L., Zhang, X., Kim, J.-H., Cho, K.-H., Kim, B.-M., Wang, Z., and Tang, H.: Role of Intense Arctic Storm in Accelerating Summer Sea Ice Melt: An In Situ Observational Study, Geophys. Res. Lett., 48, e2021GL092714, https://doi.org/10.1029/2021GL092714, 2021.
Pfahl, S., Madonna, E., Boettcher, M., Joos, H., and Wernli, H.: Warm Conveyor Belts in the ERA-Interim Dataset (1979–2010). Part II: Moisture Origin and Relevance for Precipitation, J. Climate, 27, 27–40, https://doi.org/10.1175/JCLI-D-13-00223.1, 2014.
Platnick, S., Meyer, K. G., King, M. D., Wind, G., Amarasinghe, N., Marchant, B., Arnold, G. T., Zhang, Z., Hubanks, P. A., Holz, R. E., Yang, P., Ridgway, W. L., and Riedi, J.: MODIS Atmosphere L3 Monthly Product (MOD08_M3), NASA MODIS Adaptive Processing System, Goddard Space Flight Center [data set], https://doi.org/10.5067/MODIS/MOD08_M3.061, 2015.
Salathé Jr., E. P.: Influences of a shift in North Pacific storm tracks on western North American precipitation under global warming, Geophys. Res. Lett., 33, L19820, https://doi.org/10.1029/2006GL026882, 2006.
Seager, R., Naik, N., Ting, M., Cane, M. A., Harnik, N., and Kushnir, Y.: Adjustment of the atmospheric circulation to tropical Pacific SST anomalies: Variability of transient eddy propagation in the Pacific–North America sector, Q. J. Roy. Meteor. Soc., 136, 277–296, https://doi.org/10.1002/qj.588, 2010.
Shao, Y.: Simplification of a dust emission scheme and comparison with data, J. Geophys. Res.-Atmos., 109, D10202, https://doi.org/10.1029/2003JD004372, 2004.
Shaw, T. A., Baldwin, M., Barnes, E. A., Caballero, R., Garfinkel, C. I., Hwang, Y. T., Li, C., O'Gorman, P. A., Rivière, G., Simpson, I. R., and Voigt, A.: Storm track processes and the opposing influences of climate change, Nat. Geosci., 9, 656–664, https://doi.org/10.1038/ngeo2783, 2016.
Simmonds, I. and Lim, E.-P.: Biases in the calculation of Southern Hemisphere mean baroclinic eddy growth rate, Geophys. Res. Lett., 36, L01707, https://doi.org/10.1029/2008GL036320, 2009.
Simmons, A. J. and Hoskins, B. J.: The Life Cycles of Some Nonlinear Baroclinic Waves, J. Atmos. Sci., 35, 414–432, https://doi.org/10.1175/1520-0469(1978)035<0414:TLCOSN>2.0.CO;2, 1978.
Sokolik, I. N. and Toon, O. B.: Incorporation of mineralogical composition into models of the radiative properties of mineral aerosol from UV to IR wavelengths, J. Geophys. Res.-Atmos., 104, 9423–9444, https://doi.org/10.1029/1998JD200048, 1999.
Stockwell, W. R., Middleton, P., Chang, J. S., and Tang, X.: The second generation regional acid deposition model chemical mechanism for regional air quality modeling, J. Geophys. Res.-Atmos., 95, 16343–16367, https://doi.org/10.1029/JD095iD10p16343, 1990.
Sun, Y. and Zhao, C.: Influence of Saharan Dust on the Large-Scale Meteorological Environment for Development of Tropical Cyclone Over North Atlantic Ocean Basin, J. Geophys. Res.-Atmos., 125, e2020JD033454, https://doi.org/10.1029/2020JD033454, 2020.
Tamarin-Brodsky, T. and Kaspi, Y.: Enhanced poleward propagation of storms under climate change, Nat. Geosci., 10, 908–913, https://doi.org/10.1038/s41561-017-0001-8, 2017.
Tang, Y., Han, Y., Ma, X., and Liu, Z.: Elevated heat pump effects of dust aerosol over Northwestern China during summer, Atmos. Res., 203, 95–104, https://doi.org/10.1016/j.atmosres.2017.12.004, 2018.
Tian, P., Zhang, L., Ma, J., Tang, K., Xu, L., Wang, Y., Cao, X., Liang, J., Ji, Y., Jiang, J. H., Yung, Y. L., and Zhang, R.: Radiative absorption enhancement of dust mixed with anthropogenic pollution over East Asia, Atmos. Chem. Phys., 18, 7815–7825, https://doi.org/10.5194/acp-18-7815-2018, 2018.
Trenberth, K. E. and Stepaniak, D. P.: Covariability of Components of Poleward Atmospheric Energy Transports on Seasonal and Interannual Timescales, J. Climate, 16, 3691–3705, https://doi.org/10.1175/1520-0442(2003)016<3691:COCOPA>2.0.CO;2, 2003.
University Corporation for Atmospheric Research (UCAR): WRF Modeling System Download, UCAR [code], https://www2.mmm.ucar.edu/wrf/users/download/get_source.html, last access: 1 May 2026.
Uno, I., Eguchi, K., Yumimoto, K., Takemura, T., Shimizu, A., Uematsu, M., Liu, Z., Wang, Z., Hara, Y., and Sugimoto, N.: Asian dust transported one full circuit around the globe, Nat. Geosci., 2, 557–560, https://doi.org/10.1038/ngeo583, 2009.
Voss, K. K. and Evan, A. T.: A New Satellite-Based Global Climatology of Dust Aerosol Optical Depth, J. Appl. Meteorol. Clim., 59, 83–102, https://doi.org/10.1175/JAMC-D-19-0194.1, 2020.
Wang, M., Lau, W. K. M., and Wang, J.: Impact of middle east dust on subseasonal-to-seasonal variability of the Asian summer monsoon, Clim. Dynam., 58, 2041–2057, https://doi.org/10.1007/s00382-021-05694-z, 2021.
Wang, Y., Wang, M., Zhang, R., Ghan, S. J., Lin, Y., Hu, J., Pan, B., Levy, M., Jiang, J. H., and Molina, M. J.: Assessing the effects of anthropogenic aerosols on Pacific storm track using a multiscale global climate model, P. Natl. Acad. Sci. USA, 111, 6894–6899, https://doi.org/10.1073/pnas.1403364111, 2014a.
Wang, Y., Zhang, R., and Saravanan, R.: Asian pollution climatically modulates mid-latitude cyclones following hierarchical modelling and observational analysis, Nat. Commun., 5, 3098, https://doi.org/10.1038/ncomms4098, 2014b.
Wang, Y., Jiang, J. H., and Su, H.: Atmospheric responses to the redistribution of anthropogenic aerosols, J. Geophys. Res.-Atmos., 120, 9625–9641, https://doi.org/10.1002/2015JD023665, 2015.
Wang, Z., Huang, X., Wang, N., Xu, J., and Ding, A.: Aerosol-Radiation Interactions of Dust Storm Deteriorate Particle and Ozone Pollution in East China, J. Geophys. Res.-Atmos., 125, e2020JD033601, https://doi.org/10.1029/2020JD033601, 2020.
Xian, P., Klotzbach, P. J., Dunion, J. P., Janiga, M. A., Reid, J. S., Colarco, P. R., and Kipling, Z.: Revisiting the relationship between Atlantic dust and tropical cyclone activity using aerosol optical depth reanalyses: 2003–2018, Atmos. Chem. Phys., 20, 15357–15378, https://doi.org/10.5194/acp-20-15357-2020, 2020.
Xie, P. and Arkin, P. A.: Global Precipitation: A 17-Year Monthly Analysis Based on Gauge Observations, Satellite Estimates, and Numerical Model Outputs, B. Am. Meteorol. Soc., 78, 2539–2558, https://doi.org/10.1175/1520-0477(1997)078<2539:GPAYMA>2.0.CO;2, 1997.
Xu, H., Guo, J., Wang, Y., Zhao, C., Zhang, Z., Min, M., Miao, Y., Liu, H., He, J., Zhou, S., and Zhai, P.: Warming effect of dust aerosols modulated by overlapping clouds below, Atmos. Environ., 166, 393–402, https://doi.org/10.1016/j.atmosenv.2017.07.036, 2017.
Yin, Z., Wan, Y., Zhang, Y., and Wang, H.: Why super sandstorm 2021 in North China?, Natl. Sci. Rev., 9, nwab165, https://doi.org/10.1093/nsr/nwab165, 2022.
Yin, Z., Huo, Q., Hu, D., Huang, Y., and Wang, H.: Why record-breaking gale and nationwide dust in China in April 2025, Sci. Bull., 71, 463–465, https://doi.org/10.1016/j.scib.2025.11.054, 2026.
Yu, Y., Kalashnikova, O. V., Garay, M. J., and Notaro, M.: Climatology of Asian dust activation and transport potential based on MISR satellite observations and trajectory analysis, Atmos. Chem. Phys., 19, 363–378, https://doi.org/10.5194/acp-19-363-2019, 2019.
Zeng, Y., Wang, M., Zhao, C., Zhu, Y., Rosenfeld, D., and Huang, K.-E.: Extremely High Concentrations of Ice Particles in East Asian Dust-Infused Baroclinic Storm (DIBS) Cirrus Shield: Dominant Role of Dust Ice Nucleation Effect, J. Geophys. Res.-Atmos., 128, e2022JD038034, https://doi.org/10.1029/2022JD038034, 2023.
Zhang, R., Li, G., Fan, J., Wu, D. L., and Molina, M. J.: Intensification of Pacific storm track linked to Asian pollution, P. Natl. Acad. Sci. USA, 104, 5295–5299, https://doi.org/10.1073/pnas.0700618104, 2007.
Zhang, X., Li, L., Che, H., Dubovik, O., Derimian, Y., Holben, B., Gupta, P., Eck, T. F., Lind, E. S., Toledano, C., Xia, X., Zheng, Y., Gui, K., and Zhang, X.: Aerosol Components Derived from Global AERONET Measurements by GRASP: A New Value-Added Aerosol Component Global Dataset and Its Application, B. Am. Meteorol. Soc., 105, E1822–E1848, https://doi.org/10.1175/BAMS-D-23-0260.1, 2024.
Zhao, C., Liu, X., and Leung, L. R.: Impact of the Desert dust on the summer monsoon system over Southwestern North America, Atmos. Chem. Phys., 12, 3717–3731, https://doi.org/10.5194/acp-12-3717-2012, 2012.
Zhao, J., Ma, X., Wu, S., and Sha, T.: Dust emission and transport in Northwest China: WRF-Chem simulation and comparisons with multi-sensor observations, Atmos. Res., 241, 104978, https://doi.org/10.1016/j.atmosres.2020.104978, 2020.
Zhou, R. and Deng, Y.: A model analysis of the interactions between East Asian anthropogenic aerosols and North Pacific atmospheric transients in boreal winter, J. Geophys. Res.-Atmos., 118, 306–316, https://doi.org/10.1029/2012JD018649, 2013.
Zhou, T., Zhou, X., Yang, Z., Córdoba-Jabonero, C., Wang, Y., Huang, Z., Da, P., Luo, Q., Zhang, Z., Shi, J., Bi, J., and Alikhodja, H.: Transboundary transport of non-east and East Asian dust observed at Dunhuang, northwest China, Atmos. Environ., 318, 120197, https://doi.org/10.1016/j.atmosenv.2023.120197, 2024.
Zhu, A., Ramanathan, V., Li, F., and Kim, D.: Dust plumes over the Pacific, Indian, and Atlantic oceans: Climatology and radiative impact, J. Geophys. Res.-Atmos., 112, D16208, https://doi.org/10.1029/2007JD008427, 2007.
Zhu, A., Xu, H., Deng, J., Ma, J., and Li, S.: El Niño–Southern Oscillation (ENSO) effect on interannual variability in spring aerosols over East Asia, Atmos. Chem. Phys., 21, 5919–5933, https://doi.org/10.5194/acp-21-5919-2021, 2021.