
the Creative Commons Attribution 4.0 License.
the Creative Commons Attribution 4.0 License.
 | 29 Oct 2026
Evaluation of the GOSAT/GOSAT-2 XCO2 proxy XCH4 product by comparison with TCCON observations over China
Xinran Jiang
Gerrit de Leeuw

Jeon-Teo Dong
Andrew Gerald Barr
Wei Wang
Minqiang Zhou
Zhengqiang Li
Methane (CH4) is the second most important well-mixed greenhouse gas after carbon dioxide (CO2) and its accurate monitoring supports China's “dual carbon” goals. Satellites enable global CH4 monitoring using various sensors and retrieval techniques. The XCO2 proxy method derives the column-averaged dry-air mole fraction of CH4 (XCH4) from the ratio and an independent XCO2 estimate, exploiting the overlapping absorption bands of CH4 and CO2 near 1.6 µm and assuming similar vertical distributions to reduce common retrieval errors. In this study, four XCO2 proxy methane products, GOSAT SRPR, OCPR, FOCAL Proxy, and GOSAT-2 SRPR, are evaluated using Total Carbon Column Observing Network (TCCON) ground-based observations at the Hefei and Xianghe sites in China. GOSAT products show lower bias and RMSE at Xianghe than at Hefei, while GOSAT-2 products are similar at both sites, with lower bias, RMSE, and standard deviation compared with the GOSAT products and approximately 51 % of retrievals meeting GCOS requirements. All products, except OCPR, overestimate XCH4 at Hefei and underestimate XCH4 at Xianghe, due to XCO2 model errors and spatial differences associated with regional and local methane emissions affecting both sites. Furthermore, the overestimation of the ratio implies that the fundamental assumption of the XCO2 proxy method is not fulfilled, primarily due to systematic positive biases in the satellite-retrieved XCH4 used in the proxy calculation. This study provides key error characteristics and spatial-seasonal biases in current satellite proxy methane products over China, supporting future retrieval optimization.
- Article
(27446 KB) - Full-text XML
- BibTeX
- EndNote


Methane (CH4), as the world's second-largest anthropogenic greenhouse gas after carbon dioxide (CO2), exerts a profound impact on the Earth's climate (Hansen and Sato, 2001). Since the end of the 20th Century, the rapid increase of globally averaged CH4 concentrations has attracted widespread international concern, prompting numerous countries, including China, to establish “carbon neutrality” and “carbon peak” targets (Van Soest et al., 2021). Following the Sixth Assessment Report (AR6), released by the Intergovernmental Panel on Climate Change (IPCC) in 2023, global surface temperatures are undergoing significant shifts. The global surface temperature for the period 2011–2020 increased by 1.09 °C relative to 1850–1900, with human activities contributing an estimated 1.07 °C. Well-mixed greenhouse gases (GHGs) contributed an estimated 1.0–2.0 °C to warming, which was partially offset by anthropogenic aerosol cooling (IPCC, 2023). Recent data from the World Meteorological Organization (WMO) (WMO, 2025) indicates that the 2024 global mean near-surface temperature reached 1.55 ± 0.13 °C above pre-industrial levels, marking the first calendar year in the 175-year observational record with an annual mean temperature exceeding 1.5 °C. It should be noted that this single-year value is significantly influenced by natural variability such as El Niño events, and does not indicate that the long-term warming trend of the climate system has systematically crossed the 1.5 °C threshold set by the Paris Agreement. The latest 2025 climate report (WMO, 2026) records a slight temperature drop to 1.43 °C, while the overall warming trend and climate imbalance continue to worsen. As CH4 has a much shorter atmospheric lifetime than CO2, its rapid reduction is more achievable and could mitigate ∼0.3 °C of warming on short term at no additional cost (UNEP and CCAC, 2021). Although the atmospheric concentration of CH4 is less than 1 % of that of CO2, the 20-year Global Warming Potential (GWP20) for fossil and non-fossil CH4 is 82.5 and 79.7 times that of CO2, while the 100-year GWP (GWP100) stands at 29.8 and 27.0 (IPCC, 2021). The Global Methane Pledge (GMP) proposes a 30 % reduction in methane emissions by 2030 to mitigate the rate of global warming (Predybaylo et al., 2025). China, currently the world's largest methane emitter, plays a decisive role in these efforts (Alvarez et al., 2018; Tian et al., 2022).
As a potent greenhouse gas, the accurate quantification of methane emissions is important for climate mitigation and a critical factor for nations to fulfill international emission reduction responsibilities (Costantiello et al., 2025). Satellite remote sensing, characterized by its extensive spatial coverage and consistent global measurement standards, has become a core instrument for monitoring methane concentrations (Jacob et al., 2016). However, satellite observations are limited to spectral radiance intensities. Retrieving XCH4 mole fractions (i.e. the vertical column density of CH4 divided by the vertical column density of dry air) requires high-precision algorithms to solve the radiative transfer equation, which accounts for atmospheric and surface optical properties (Bovensmann et al., 1999). While satellite data provide the basis for concentration monitoring, determining emissions further necessitates inversion models that accurately describe atmospheric physical transport processes. Consequently, the development of efficient and robust retrieval algorithms poses a central challenge in satellite methane remote sensing research. To support such climate actions, the Global Climate Observing System (GCOS) has set stringent requirements for column-averaged dry-air methane (XCH4) observations, specifying a breakthrough measurement uncertainty (2-sigma) of 10 ppb and a long-term stability of 2 ppb per decade (GCOS, 2022).
Satellite retrieval methods for methane are primarily categorized into two categories: physics-driven methods and data-driven methods. Physics-driven methods are based on radiative transfer theory, extracting concentration information by simulating the absorption and scattering of solar radiation within the atmosphere. A Full Physics (FP) algorithm (Hu et al., 2016; Lorente et al., 2022) constructs rigorous radiative transfer equations and employs iterative optimization techniques to simultaneously retrieve methane concentrations and auxiliary parameters, such as aerosol properties and surface albedo, thereby achieving an optimal estimation of the atmospheric state. To enhance computational efficiency, certain physical methods adopt specific simplification strategies. Differential Optical Absorption Spectroscopy (DOAS) (Buchwitz et al., 2000; Schneising et al., 2008; Schneising et al., 2019) focuses on the Beer-Lambert Law to extract narrow-band gas absorption signals through spectral filtering, while the Photon Path Length Probability Density Function (PPDF) (Oshchepkov et al., 2008; Andrey et al., 2013) utilizes probability distribution functions from a statistical physics perspective to describe the equivalent path length of photons, correcting for optical path offsets induced by multiple scattering. Data-driven methods – such as machine learning and deep learning algorithms – bypass explicit physical formulations, but utilize large-scale datasets to identify complex nonlinear mappings between observed spectra and methane concentrations, offering a highly efficient alternative for large-scale data processing (Lippert et al., 2026; Brence et al., 2023; Mauceri et al., 2022).
The Proxy method (Parker et al., 2015, 2020) serves as a simplified retrieval scheme within the physics-driven framework. The Proxy method requires the use of a sensor which measures high-resolution spectra over a wavelength range that is sensitive to both gases (in this case CH4 and CO2) in close proximity. Taking advantage of the overlapping absorption bands of CH4 and CO2 near 1.6 µm and assuming similar vertical distributions, the spectral radiances observed by the sensor in this waveband have traversed similar optical paths, which is thus assumed to ensure similar atmospheric perturbations and surface effects. By retrieving the vertical column densities or column-averaged dry air mole fractions (XCH4 and XCO2) and calculating the ratio (), systematic optical path errors induced by aerosol scattering, surface reflection, and other atmospheric effects are effectively eliminated. The XCO2 Proxy method discussed in this study, refers to the retrieval of XCH4, by multiplication of the ratio with an independent estimate of XCO2, such as XCO2 model data. As compared to XCH4, XCO2 is relatively stable and therefore serves as a reliable reference for accurate XCH4 retrieval. Due to its robust physical performance when addressing complex atmospheric interference, the Proxy algorithm has been extensively implemented across multiple major satellite missions (Schepers et al., 2012). Compared with conventional full-physics retrievals, this method exhibits lower sensitivity to instrument-level inconsistencies (e.g., radiometric calibration drift and spectral band mismatching), and is more robust against instrument-related biases, making it more suitable for long-term dataset retrievals. In addition, its inherent tolerance to moderate aerosol scattering significantly improves the effective data yield, especially in complex atmospheric environments (Chevallier et al., 2010a; Parker et al., 2015).
In this study, the quality of different products resulting from application of the XCO2 Proxy method to retrieve XCH4 from GOSAT and GOSAT-2 observations over China will be evaluated through comparison with ground-based data from the Total Carbon Column Observing Network (TCCON) sites at Hefei and Xianghe. The results of this comparison are expected to provide a scientific basis for the monitoring and assessment of methane emissions in China, thereby contributing data and analysis results from satellite observations over China to global methane emission research.
2.1 GOSAT/GOSAT-2
In this study, data products are used from the Greenhouse Gases Observing Satellite (GOSAT) and its successor, GOSAT-2. GOSAT was launched on 23 January 2009, through a joint effort by the Japan Aerospace Exploration Agency (JAXA), the Japanese Ministry of the Environment (MOE), and the National Institute for Environmental Studies (NIES). GOSAT was the world's first scientific satellite dedicated to the precise monitoring of CO2 and CH4 concentrations from space (Yokota et al., 2009). Its core scientific mission aims to fill greenhouse gas monitoring gaps over oceans and remote regions via high-frequency global observations, to accurately assess carbon sources and sinks at sub-continental scales, and to improve the understanding of global carbon cycle mechanisms and their impacts on climate change (Butz et al., 2011). GOSAT operates in a sun-synchronous quasi-recurrent orbit at an altitude of approximately 666 km and an inclination of about 98°, with a local equator crossing time at 13:00 ± 15 min and a revisit period of 3 d, ensuring high-frequency coverage for most parts of the Earth.
The primary payload aboard GOSAT is the Thermal and Near-infrared Sensor for Carbon Observation (TANSO), which consists of two components: the Fourier Transform Spectrometer (TANSO-FTS) and the Cloud and Aerosol Imager (TANSO-CAI) (Yokota et al., 2009). TANSO-FTS measures radiation in four spectral bands including the near infrared band at 0.76 µm (oxygen absorption band), two Short-Wave Infrared (SWIR) bands at 1.6 µm (CO2 and CH4 absorption bands) and 2.0 µm (CO2), and a wide Thermal Infrared (TIR) band extending from 5.5 to 14.3 µm. The spectral resolution of the SWIR bands (Bands 1–3) is approximately 0.27 cm−1 (full width at half maximum, FWHM). Spectra of reflected solar radiation and thermal radiation emitted by the Earth-atmosphere system are analyzed and the intensities of characteristic absorption lines are used to retrieve the total columns and vertical distributions of the concentrations of CO2 and CH4. The nadir footprint diameter of TANSO-FTS is approximately 10.5 km (Kuze et al., 2016). TANSO-CAI utilizes four channels with wavelengths ranging from the visible to the near-infrared to simultaneously acquire cloud and aerosol information along the observation path at spatial resolutions of 0.5 to 1.5 km. This information is used to filter out contaminated data and perform atmospheric corrections (Yokota et al., 2009). Over land, the instruments primarily use a nadir observation mode, whereas, over ocean they observe in the sun glint to capture solar specular reflection to improve the signal-to-noise ratio. GOSAT's design objective is to control the relative observation precision of CO2 and CH4 within 4 ppm (approximately 1 %) and 34 ppb, respectively, providing robust scientific data supporting the implementation of global climate agreements and the formulation of carbon emission reduction policies (Butz et al., 2011).
GOSAT-2 was launched on 29 October 2018, and operates in a sun-synchronous quasi-recurrent orbit at an altitude of approximately 613 km with a local equator crossing time at 13:00 and a revisit period of 6 d. GOSAT-2 was developed to continue and enhance the global greenhouse gas observation capability of GOSAT, with improvements in sensor design and observation efficiency and a slightly better signal-to-noise ratio (Suto et al., 2021; Imasu et al., 2023). Its core payload is TANSO-FTS-2, with an expanded spectral coverage of five bands, adding the capability to detect carbon monoxide (CO). The SWIR bands have a spectral sampling interval of 0.2 cm−1, with FWHM values better than 0.4 cm−1 for Band 1 and 0.27 cm−1 for Bands 2 and 3. The mission was designed with target uncertainties of 0.5 ppm for CO2 and 5 ppb for CH4 over a 500 km spatial mesh and with a 1-month observational period (Imasu et al., 2023; ESA eoPortal, 2026).
GOSAT/TANSO-FTS performs discrete grid observations and revisits the same nominal observation points every 3 d, with a three-point cross-track sampling pattern used for routine observations since August 2010 (Japan Aerospace Exploration Agency et al., 2011). In contrast, GOSAT-2/TANSO-FTS-2 has a 6 d revisit cycle and employs a fully programmable pointing system, allowing more flexible spatial sampling. Its intelligent pointing function can redirect the line of sight toward nearby clearer areas when clouds are detected around the scheduled footprint, increasing the number of clear-sky retrievals over land by approximately 1.8 times relative to standard pointing. However, intelligent pointing is switched off over calibration/validation (Cal/Val) sites and user-specified sites in current GOSAT-2 operations to enable repeated observations of the same target locations (Suto et al., 2021).
2.2 TCCON data
TCCON (Wunch et al., 2015; Laughner et al., 2024) is a global network of ground-based Fourier Transform Spectrometers (FTS) that measure direct near-infrared solar spectra within the 4000–9000 cm−1 range, with temporal high-resolution. At these wavelengths, adverse effects of high uncertainties associated with scattered light are avoided. These spectra are used to retrieve vertical column densities of a variety of gases, such as CO2, CH4, N2O, HF, CO, H2O, and HDO, using a non-linear least-squares spectral fitting algorithm. Ground-based FTS observations achieve exceptionally high precision; the single measurement precision for XCO2 is approximately 0.15 % (∼0.6 ppm) and for XCH4 it is 0.2 % (∼4 ppb) (Toon et al., 2009). For the GGG2020 retrieval framework underlying the current data release, the estimated error budgets are below 0.16 % (∼0.6 ppm) for XCO2 and below 0.4 % (∼7 ppb) for XCH4 for solar zenith angles below 82° (Laughner et al., 2024). These high-precision observational data serve as a reference for the validation of satellite-retrieved greenhouse gas products such as CO2 and CH4. The TCCON observations used in this study were obtained from the GGG2020.1 data release, a minor update to the GGG2020 product released in June 2026 (GGG2020 Data Changes, 2026).
Established in 2004, TCCON joined the WMO Global Atmosphere Watch (GAW) as a contributing network in 2009. Currently, China hosts two TCCON stations: the Hefei station and the Xianghe station (Hong et al., 2024).
2.2.1 Hefei
The Hefei station is located within the campus of the Anhui Institute of Optics and Fine Mechanics, Chinese Academy of Sciences (AIOFM-CAS), in the western suburbs of Hefei, Anhui Province, China. The site is adjacent to the 207.5 km2 Shushan Lake (the Dongpu Reservoir) to the southwest (see Fig. 1a) (Wang et al., 2017). The immediately adjacent, extensive water surface acts as a natural buffer, effectively mitigating direct interference from localized urban emissions. The region is characterized by prevailing southeasterly winds in summer and northwesterly winds in winter. Relevant information is provided in Table 1.
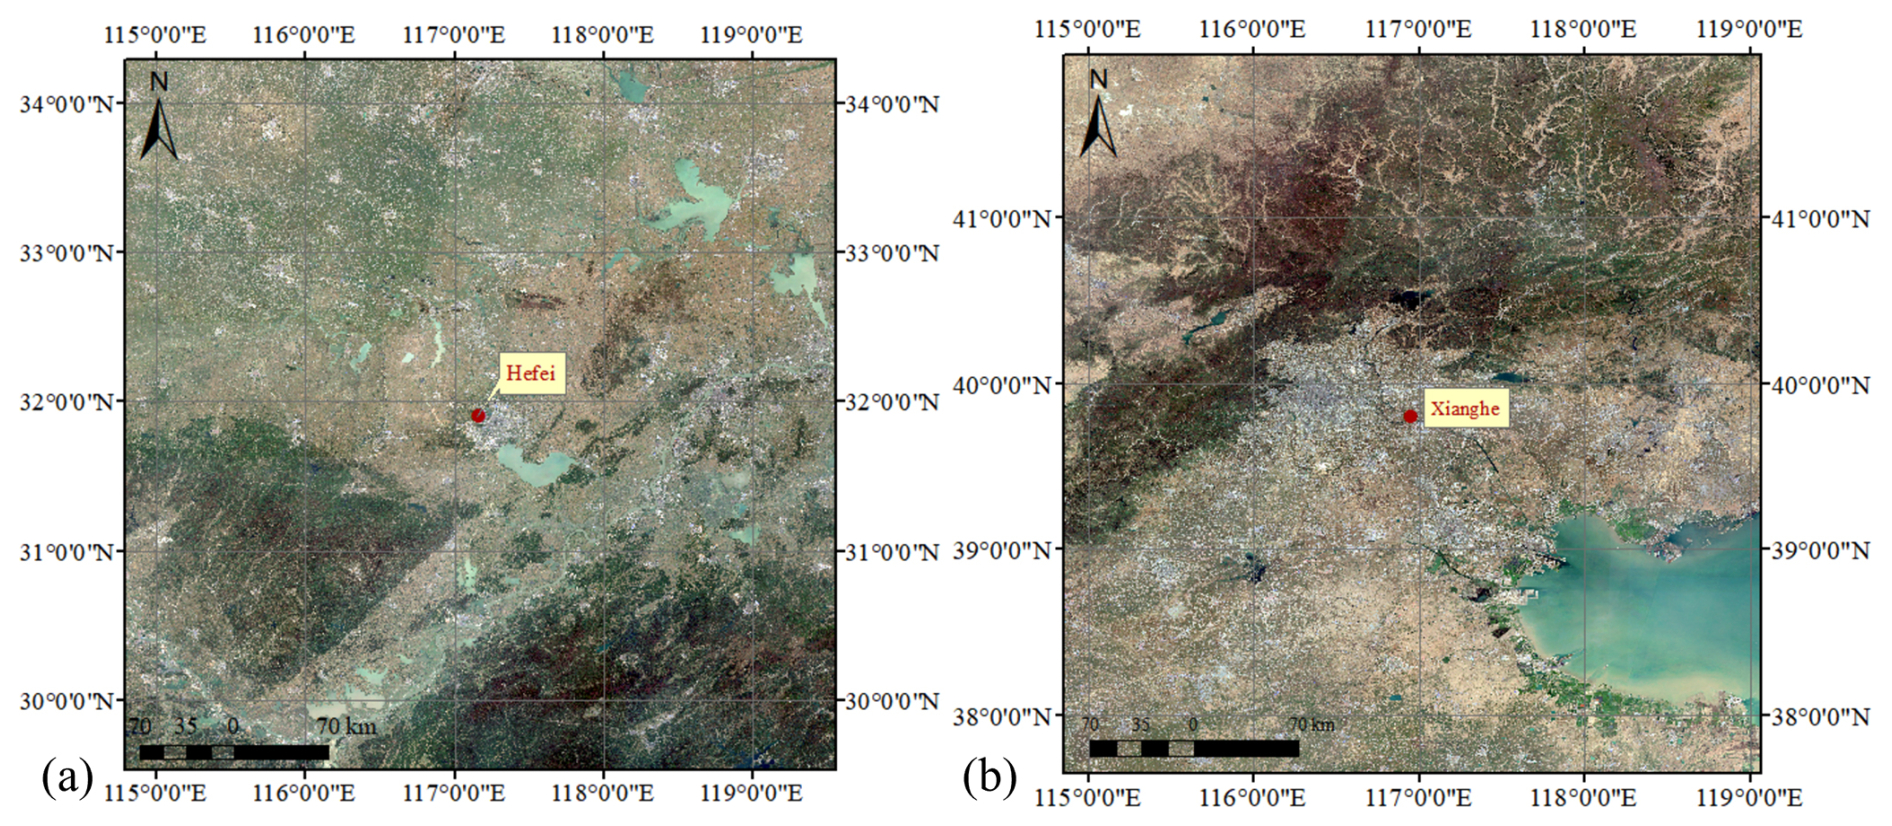
Figure 1Locations of the TCCON stations used in this study: (a) Hefei site and (b) Xianghe site. Sources: Copernicus Sentinel-2 | Powered by Esri.

Hefei was the first observation station in China that joined TCCON. The instrumentation includes a high-resolution FTS (IFS125HR, Bruker, Germany), a solar tracker (Tracker-A Solar 547, Bruker, Germany), and a meteorological station (ZENO 3200, Coastal Environmental Systems, USA). Since its installation in April 2014, the instrument has operated almost continuously, with the exception of a two-months data gap between December 2014 and February 2015 due to scanner issues. Prior to 27 July 2015, only near-infrared (NIR) solar spectra were collected; since then, NIR and mid-infrared (MIR) solar spectra have been collected alternately during routine observations (Wang et al., 2017). The core measurement objectives of this station include the total column concentrations and vertical mixing ratio profiles of CO2, CH4, and other key greenhouse gases (Zhou et al., 2022). The Hefei site is also part of the Sun-Sky Radiometer Observation Network (SONET), employing a sun photometer to track aerosol optical characteristics synchronously (Li et al., 2018).
2.2.2 Xianghe
The Xianghe station is located in Daluotun Village, Shuyang Town, Xianghe County, Hebei Province, China. Relevant information is provided in Table 1. The station is run by the Institute of Atmospheric Physics, Chinese Academy of Sciences. Situated approximately 50 km east of Beijing and 70 km north of Tianjin, the station is located at a transportation and transit hub within the Beijing-Tianjin-Hebei region (see Fig. 1b) (Ran et al., 2016). Xianghe County experiences a mid-latitude monsoon climate, characterized by prevailing southeasterly winds in summer and northwesterly winds in winter. The maximum summer temperature can reach 38 °C, while the minimum winter temperature drops to −10 °C. Precipitation mainly occurs in the summer, with occasional extreme precipitation events when daily rainfall exceeds 100 mm. The surface type surrounding the station consists of desert and rock, with flat terrain typical of rural areas. There are small towns, farmland, and irrigated agricultural zones in the vicinity of the Xianghe station. The region is influenced by emissions from significant greenhouse gas sources, particularly of anthropogenic origin, and is further influenced by emissions from major cities such as Beijing and Tianjin, resulting in a certain degree of air pollution. Heavy pollution occurs under weather conditions conducive to the formation of haze. The geographical location of the Xianghe station makes it a critical site for studying greenhouse gas emissions and atmospheric pollution in North China. Operating since 1974, the station was upgraded in June 2018 with a high-resolution FTS (Bruker IFS 125HR, Germany) and a solar tracker for solar absorption measurements. This system primarily measures XCO2, XCH4 and XCO (Ji et al., 2020; Zhou et al., 2022). Additionally, a CIMEL CE318 sun photometer (Cimel Electronique, France) has been operational at the site as part of the Aerosol Robotic Network (AERONET), providing synchronous measurements of aerosol optical properties (Li et al., 2007).
2.3 CO2 Proxy retrieval algorithms and data products
Based on the principles detailed in the introduction, the XCO2 Proxy algorithm retrieves XCH4 by calculating the ratio of the columns retrieved in the 1.65 µm (CH4) and 1.61 µm (CO2) absorption bands to cancel out common optical path errors. The final XCH4 is derived as follows:
where XCO2 (model) represents the independent XCO2 estimate derived from atmospheric transport models. This model-based value serves as a reliable reference to scale the retrieved ratio into absolute XCH4, while ensuring robustness against scattering interference. XCH4,raw and XCO2,raw represent the directly retrieved column-averaged dry-air mole fractions of CH4 and CO2, respectively.
In this study, four proxy XCH4 products derived from three distinct algorithms were selected: OCPR, SRPR, and FOCAL Proxy, with SRPR products from application to both GOSAT and GOSAT-2 data. The basic specifications of these products are summarized in Table 2. Detailed descriptions of the principles underlying each algorithm are provided in the following subsections.

2.3.1 OCPR XCH4 algorithm
The OCPR (OCO-2 Proxy) algorithm was developed by the University of Leicester and is currently maintained by the Institute of Environmental Physics (IUP) at the University of Bremen. The algorithm is based on the University of Leicester retrieval framework originally developed for the Orbiting Carbon Observatory (OCO) and OCO-2 missions and subsequently adapted to process GOSAT SWIR spectra as part of the Copernicus Climate Change Service (C3S) greenhouse gas suite (Boesch and Di Noia, 2024, 2023). Technically, OCPR employs a decoupled retrieval strategy – distinct from coupled schemes – by independently retrieving XCH4 and XCO2 from the 1.65 µm (CH4) and 1.61 µm (CO2) bands before calculating their ratio to mitigate light-path errors. The independent estimate of XCO2 used in the OCPR algorithm is the median of multi-model ensemble XCO2 model data from GEOS-Chem (Bey et al., 2001; Peters et al., 2007), NOAA Carbon Tracker (Peters et al., 2007), and LMDZ/MACC-II (Hourdin et al., 2006; Inness et al., 2013). Comparison of the v9.0 product used in this study with TCCON shows a bias, and a fixed global correction factor of −9.06 ppb has been officially adopted to compensate for the observed mean bias (Parker et al., 2020).
The OCPR data product was validated against ground-based TCCON observations, as detailed in the Product User Guide and Specification (PUGS) (Boesch and Di Noia, 2023). For land observations between April 2009 and December 2017, the mean bias and standard deviation of the XCH4 OCPR product are −1.25 and 13.81 ppb (Boesch and Di Noia, 2023).
The spatial distributions of XCH4 across the study area, retrieved from GOSAT using the OCPR algorithm, are presented in Fig. 2 as seasonal averages in each of the years 2016 to 2022. The maps in Fig. 2 show the significant year-to-year increase of XCH4, with strong seasonal differences, and spatial variations across China with a pronounced “high in the southeast and low in the northwest” pattern. High XCH4 occurs primarily over densely populated and highly industrialized regions in Southeast China. The seasonal variations, with highest concentrations during the summer and lowest during the spring, are closely related to wetland methane emissions (East et al., 2024). The spatiotemporal variations stem not only from anthropogenic emissions, such as industrial and agricultural activities, but are also significantly modulated by the seasonal enhancement of biogeochemical processes, wetland emissions (East et al., 2024) and rice cultivation (Shen et al., 2024).
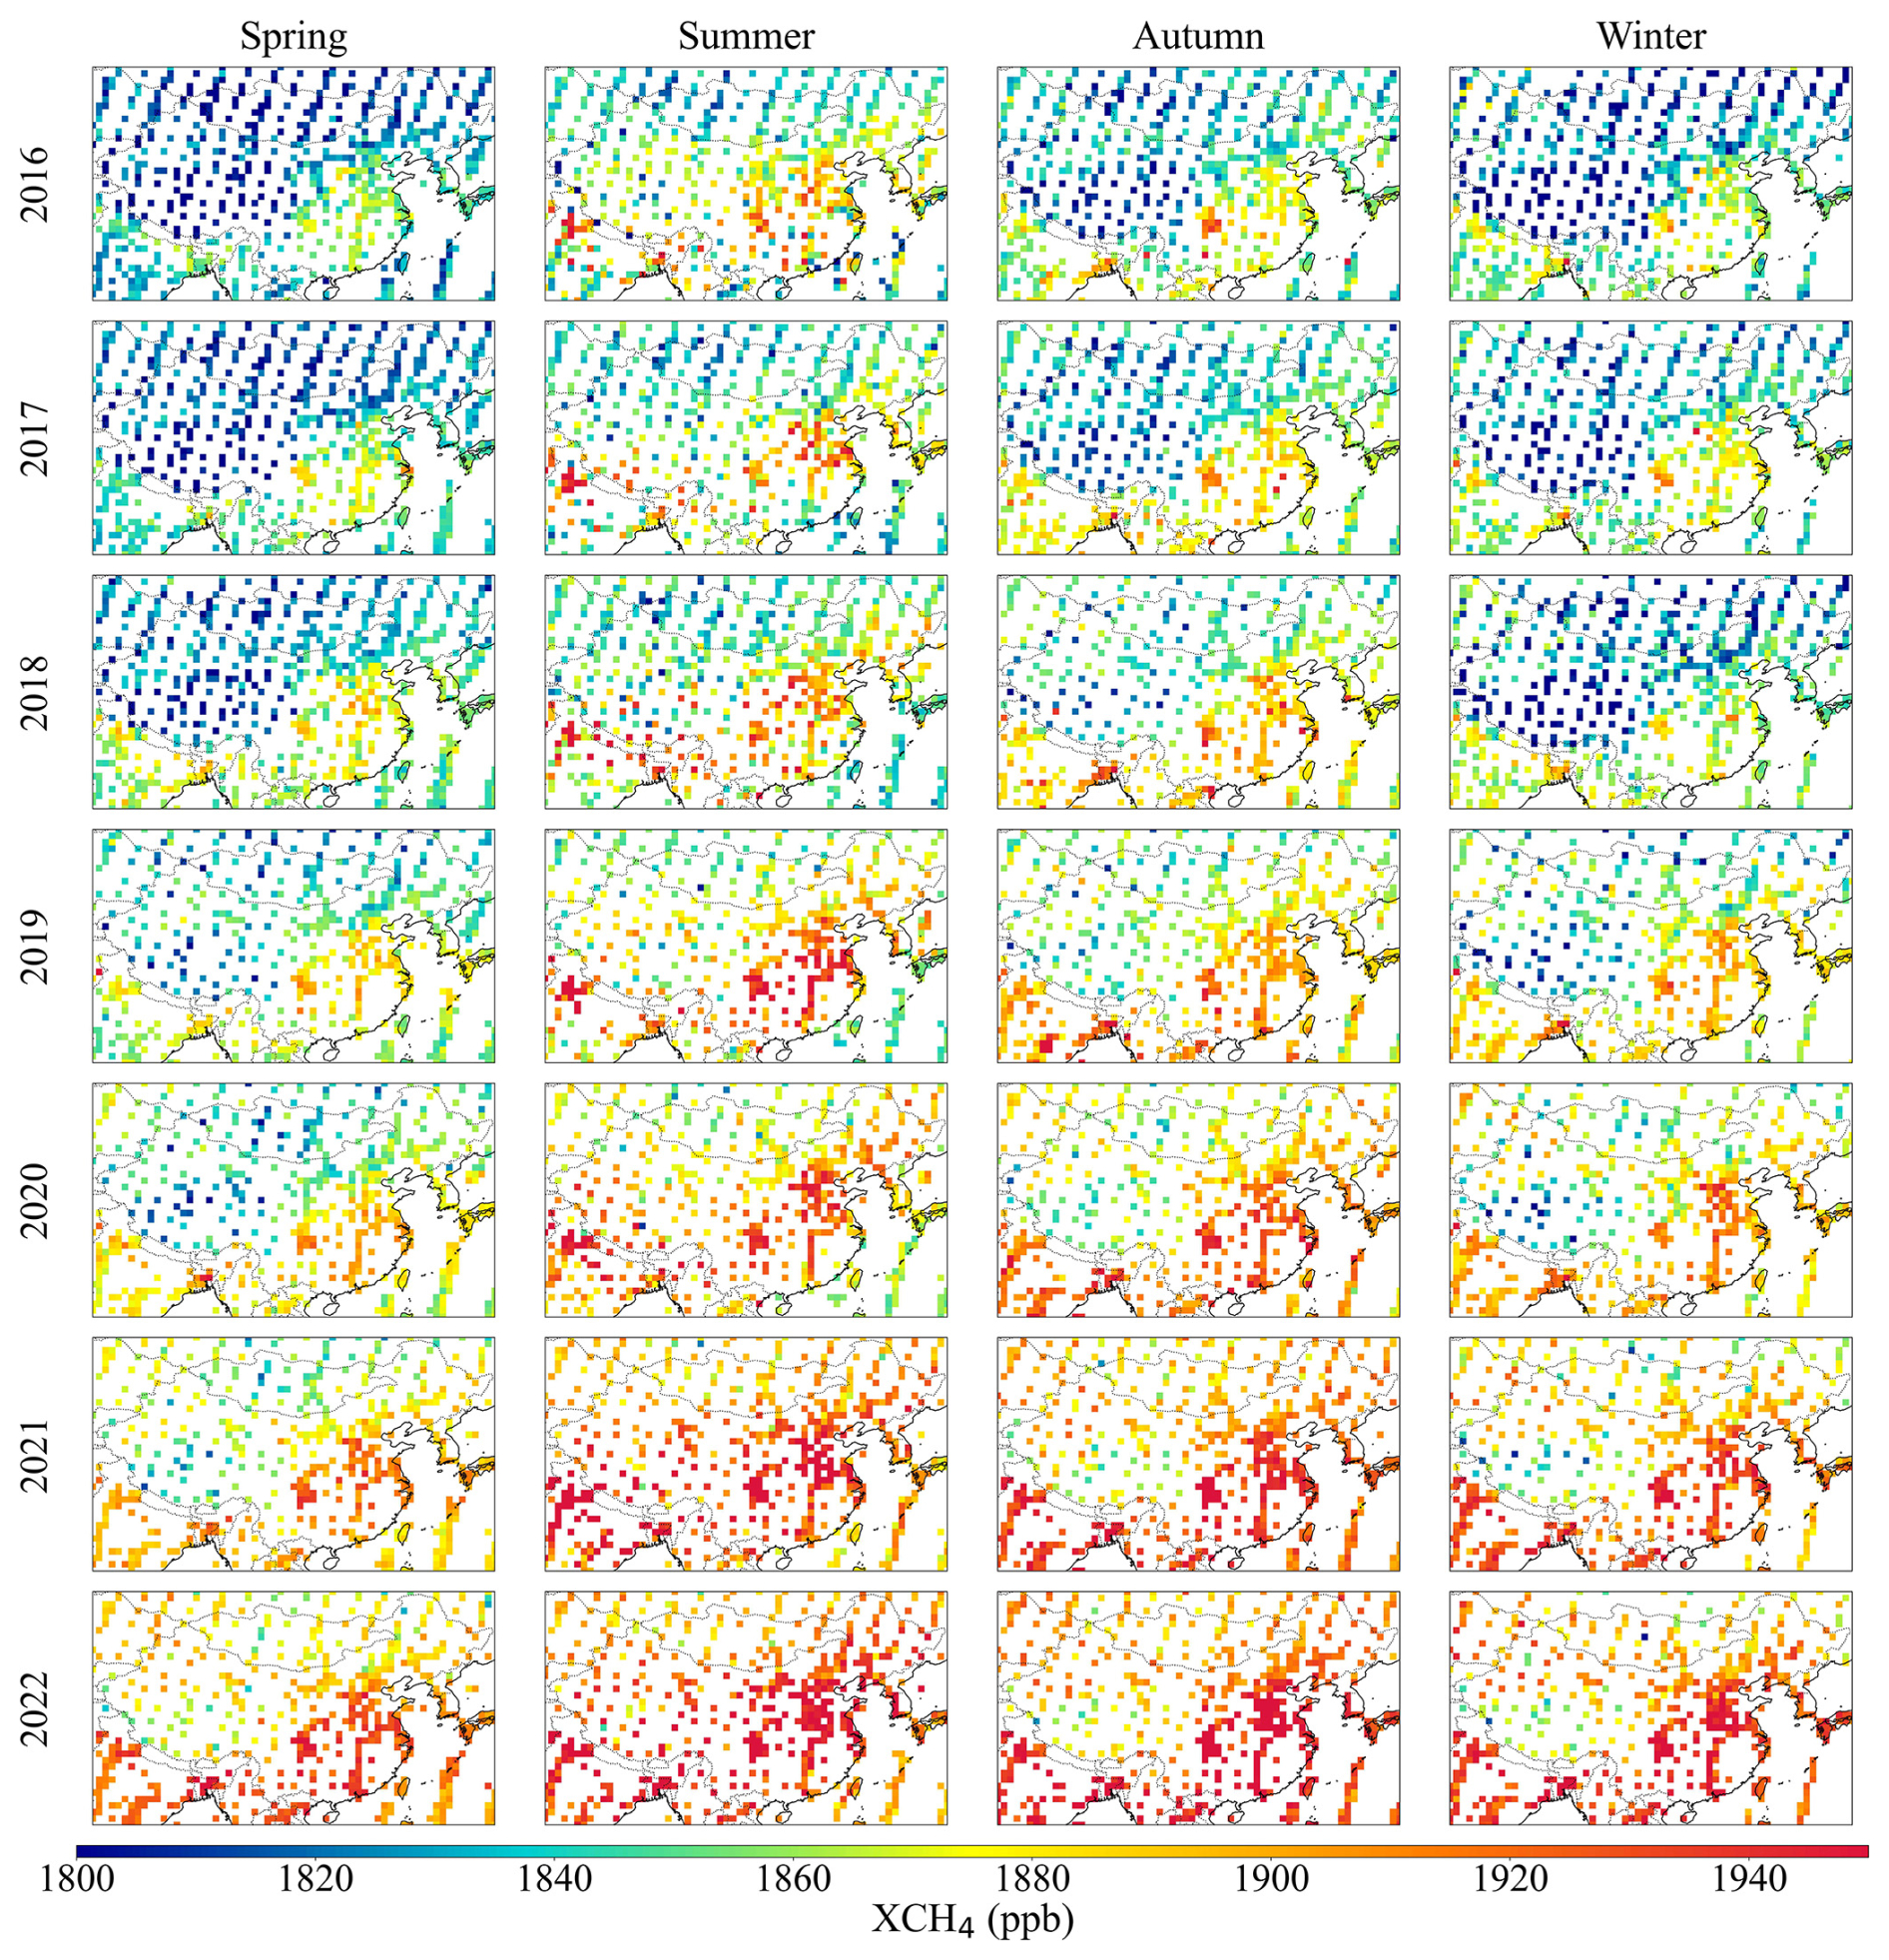
Figure 2Maps of seasonal mean of GOSAT OCPR XCH4 for the years 2016–2022. GOSAT data courtesy of JAXA/NIES/MOE.
2.3.2 SRPR XCH4 algorithm
The SRPR (SRON-RemoTeC Proxy) algorithm was developed by the Space Research Organization Netherlands (SRON) (Wu, 2021a; Butz et al., 2009; Butz et al., 2010). SRPR employs a non-scattering forward model together with a coupled retrieval scheme that simultaneously fits CH4 and CO2 within a single state vector to ensure consistent light-path treatment; however, the 1.6 µm band is treated as two separate spectral windows. To derive the final XCH4 product, XCO2 from the CAMS model (Lloret et al., 2024; Agustí-Panareda et al., 2023; Chevallier et al., 2010b) is incorporated as the independent estimate. In this study, the GOSAT (Version 2.3.9) and GOSAT-2 (Version 2.2.0) products are utilized (Table 2).
To ensure the required high precision, the SRPR XCH4 products undergo a systematic bias correction. Following the bias correction of the SRFP Full Physics XCH4 product, a linear bias correction model was established for land observations:
where α represents the retrieved albedo at 1600 nm (Barr et al., 2025). XCH4corr is the corrected result, while XCH4 is the original result before correction. In the Proxy product, the use of the non-scattering forward model makes the bias in XCH4 almost insensitive to surface albedo, which is a consequence of the exclusion of an aerosol model in the state vector. The result is a minimal b value and a nearly constant bias correction across varying levels of surface albedo (α).
The precision of the GOSAT SRPR product exhibits significant mode dependency with the high-gain mode showing the best quality. For GOSAT, correction coefficients are tuned by gain mode: high-gain mode (low albedo): a=0.9869, b=0.01788; medium-gain mode (high albedo): a=0.98446, b=0.01892 (Wu, 2021b). For both satellites the correction parameters were determined by a regression fit to minimize the difference with TCCON observations (Barr et al., 2025).
The GOSAT-2 SRPR XCH4 product used in this study was released in September 2026. In a recent publication, Barr et al. (2025) applied quality filtering to the GOSAT-2 product based on a random forest model, which significantly improved the product. A further improved version is underway, following the release of an updated L1b product version.
The spatial distributions of GOSAT and GOSAT-2 SRPR derived XCH4 are presented in the maps in Figs. A1 and A2 (see Appendix A), showing seasonal averages for the years 2016–2023 (GOSAT) and 2019–2025 (GOSAT-2).
2.3.3 FOCAL Proxy XCH4 algorithm
The Fast atmospheric traCe gAs retrievaL (FOCAL) algorithm has been developed by the IUP, University of Bremen (Noël et al., 2021). Within its forward model, FOCAL incorporates a single scattering layer approximation to simulate the atmospheric light path. This mechanism explicitly accounts for the scattering effects of aerosols and thin clouds during the simultaneous retrieval of XCH4 and XCO2 total columns (Noël et al., 2022). To derive the final proxy XCH4 data, the ratio of these retrieved columns is multiplied with independent XCO2 estimates from the SLIMCO2 model (Reuter et al., 2020) following the normalization procedure outlined in Sect. 2.2.
To account for the non-linear residual biases and the underestimation of error bars inherent in the proxy method, the IUP Bremen team has implemented a two-step post-processing calibration for the FOCAL Proxy XCH4 product (Version 3.0), consisting of bias correction and uncertainty recalibration (Noël et al., 2022). The bias correction utilizes a Random Forest Regression model with 10 predictors such as retrieved water vapor, solar zenith angle, and solar-induced chlorophyll fluorescence to refine the retrieved XCH4. Subsequently, the uncertainty recalibration is performed via a linear function to ensure that the final uncertainty parameters accurately reflect the dispersion of the retrieved values relative to the reference benchmark:
where ΔXretr represents the raw uncertainty generated by the proxy method. The coefficients are set to ac=7.951 ppb and bc=0.67 to ensure that the corrected uncertainty realistically reflects the dispersion of the retrieved values relative to the reference data (Noël et al., 2021, 2022). Validation against TCCON data demonstrates that the FOCAL Proxy XCH4 product exhibits exceptional retrieval accuracy. For the GOSAT satellite, the mean bias of single observations is approximately −2.10 ppb with a standard deviation of 13.59 ppb. The seasonally averaged spatial distributions of the GOSAT FOCAL Proxy XCH4 product over China for the years 2021–2023 are presented in Fig. A3 of Appendix A.
2.4 Aerosol Optical Depth (AOD) Supplementary Data
To evaluate the influence of aerosol loading on the retrieval accuracy of greenhouse gases, AOD data were incorporated in this study as a key auxiliary parameter. The AOD data were obtained from Sun photometers from the SONET site (Li et al., 2018) in Hefei and the AERONET site (Holben et al., 2001, 1998; Li et al., 2007; Xuehua et al., 2015) in Xianghe. Sun photometers provide AOD from direct sun measurements, at a range of wavelengths, every 15 min during daylight hours. Figure 3 presents the daily mean time series of ground-based AOD at 1640 nm for the Hefei (orange) and Xianghe (blue) sites. The Hefei data set suffers from an approximately four-year data gap between 2018 and 2022, while data at the Xianghe station are available for the periods from March 2019 to June 2020 and from July 2022 to December 2023. The Xianghe site is a typical urban/industrial background station, whereas, the Hefei site represents a low-aerosol background. However, during most of the available measurement periods shown in Fig. 3, AOD values at the Xianghe site are generally lower than those at the Hefei site. At Xianghe, high-AOD pollution events are often associated with extensive cloud cover, which can reduce the availability of quality-assured AERONET observations. Consequently, some very high-AOD observations may be excluded by AERONET cloud screening, leading to an underrepresentation of these events in the available data (Eck et al., 2018).
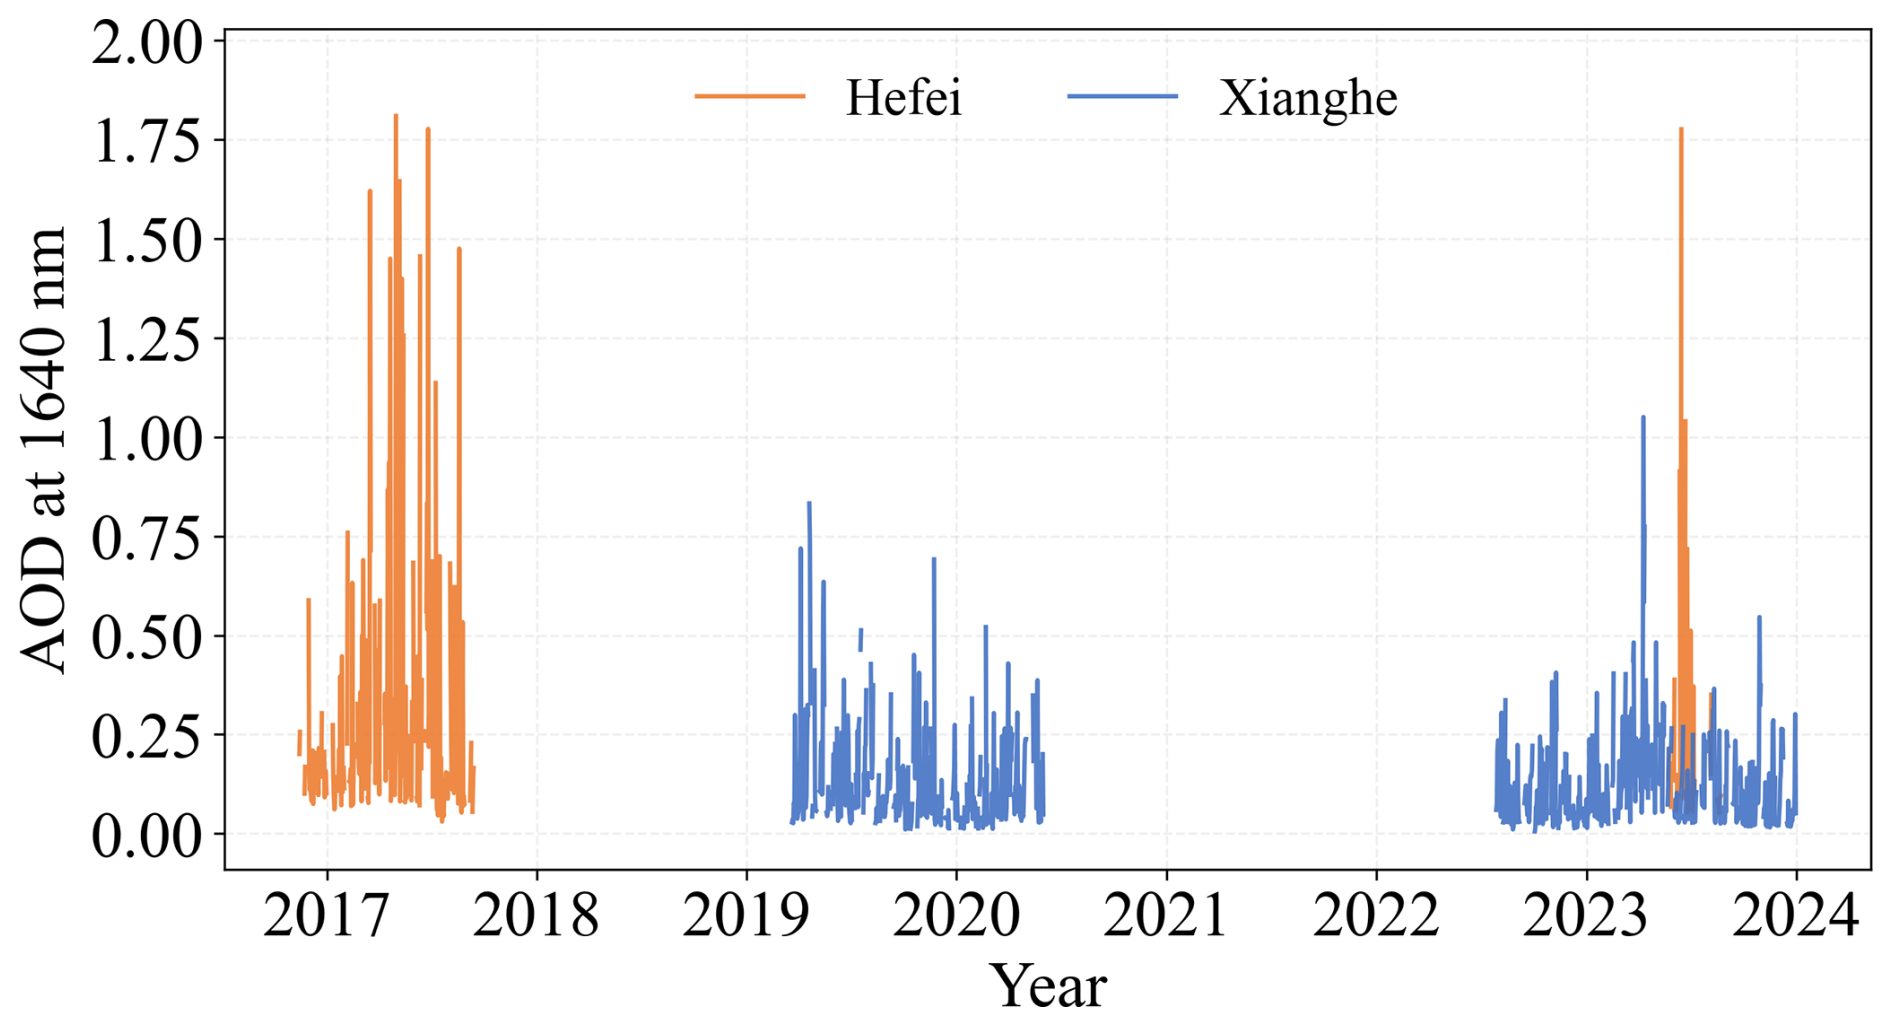
Figure 3Daily mean time series of ground-based AOD at 1640 nm for the Hefei (orange) and Xianghe (blue) sites.
2.5 Validation Methods and Metrics
To quantitatively evaluate the accuracy and reliability of different retrieval algorithms, five key statistical metrics are introduced in this study: mean bias (Bias), root-mean-square error (RMSE), Pearson's correlation coefficient (R), centered root-mean-square error (CRMSE), and Normalized Standard Deviation (NSD). RMSE is used to quantify the overall difference between satellite retrievals and ground-based observations, accounting for both systematic bias and random fluctuations. CRMSE filters out the influence of the mean bias to specifically measure the variability of retrieval values relative to their own mean. These metrics are calculated as follows:
where N represents the total number of matched data points, Xproxy,i denotes the ith XCH4 retrieved by the satellite proxy algorithm, XTCCON,i is the corresponding TCCON reference data, and represent their respective arithmetic means and σproxy and σTCCON denote the standard deviations of the retrieved XCH4 and the TCCON reference data.
The validation results are evaluated against the standards defined by the GCOS (GCOS, 2022), which stipulates a target accuracy of 10 ppb for XCH4 products to support climate change studies.
In this study, the quality control protocols specified in the respective product user manuals are strictly followed for all satellite datasets to ensure data reliability. Only observations with a quality flag of zero (xch4_quality_flag = 0) are selected for analysis, representing the highest retrieval quality. This filtering process inherently incorporates a series of rigorous screening criteria, including constraints on the convergence metric, SNR thresholds, and the exclusion of samples with extreme aerosol loading or significant surface albedo fluctuations (Boesch and Di Noia, 2023; Wu, 2021b; Barr and Borsdorff, 2023).
The XCH4 data products retrieved from GOSAT and GOSAT-2 data, using the four proxy CH4 retrieval algorithms discussed in Sect. 2.2, have been validated versus the TCCON reference data at the Hefei and Xianghe stations. GOSAT and GOSAT-2 observations were selected when the satellite footprint centers were within ±2.5° in both latitude and longitude of each TCCON station, and for each overpass a spatial mean was calculated for all valid pixels within the matching area (Parker et al., 2020). TCCON measurements were averaged within ±2 h of the satellite overpass time to account for short-term atmospheric variability and ensure a robust temporal match.
Given that the Xianghe station is situated within the polluted Beijing-Tianjin-Hebei region, local emissions can lead to significant increases in near-surface concentrations. Such local emission plumes can be sensitively detected by ground-based instruments, but due to spatial averaging effects, satellite observations often fail to capture localized enhancements. This discrepancy in spatial representativeness can introduce validation errors, thus, it is essential to filter out data affected by local pollution. In the Xianghe region, anthropogenic incomplete combustion is the primary source of co-emitted CO and CH4, while biogenic sources like agriculture or wetlands have less influence on short-term variability. As demonstrated in Yang et al. (2020), a strong positive correlation (R=0.82) exists between the daily anomalies of XCO (ΔXCO) and XCH4 (ΔXCH4). Following the methodology of Yang et al. (2020), ΔXCO was used as a reliable diagnostic tracer to screen the data for regional pollution events. First, the data were detrended for seasonal and long-term variations and ΔXCO anomalies were used to represent net deviations from the background. Based on the analysis of the ΔXCO variations, +36 ppb was selected as the threshold value above which pollution occurs and these events were excluded for further analysis.
The XCO2 Proxy method consists of three parts as explained in Sect. 2.2 and shown in Eq. (1). The first step is the retrieval of XCH4 and XCO2 and determine the ratio of the results. The second step is to determine an independent estimate of XCO2, and the final XCH4 result is obtained by the multiplication of this ratio with the independent estimate of XCO2. Below, each of the products is evaluated by comparison with TCCON reference data. We first validate the final XCH4 product retrieved using the XCO2 Proxy method described by Eq. (1) in Sect. 3.1, followed by an assessment of the individual intermediate components in Sect. 3.2 and 3.3.
3.1 Validation of XCH4
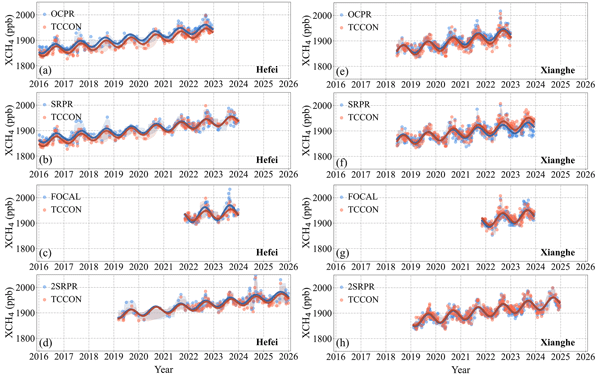
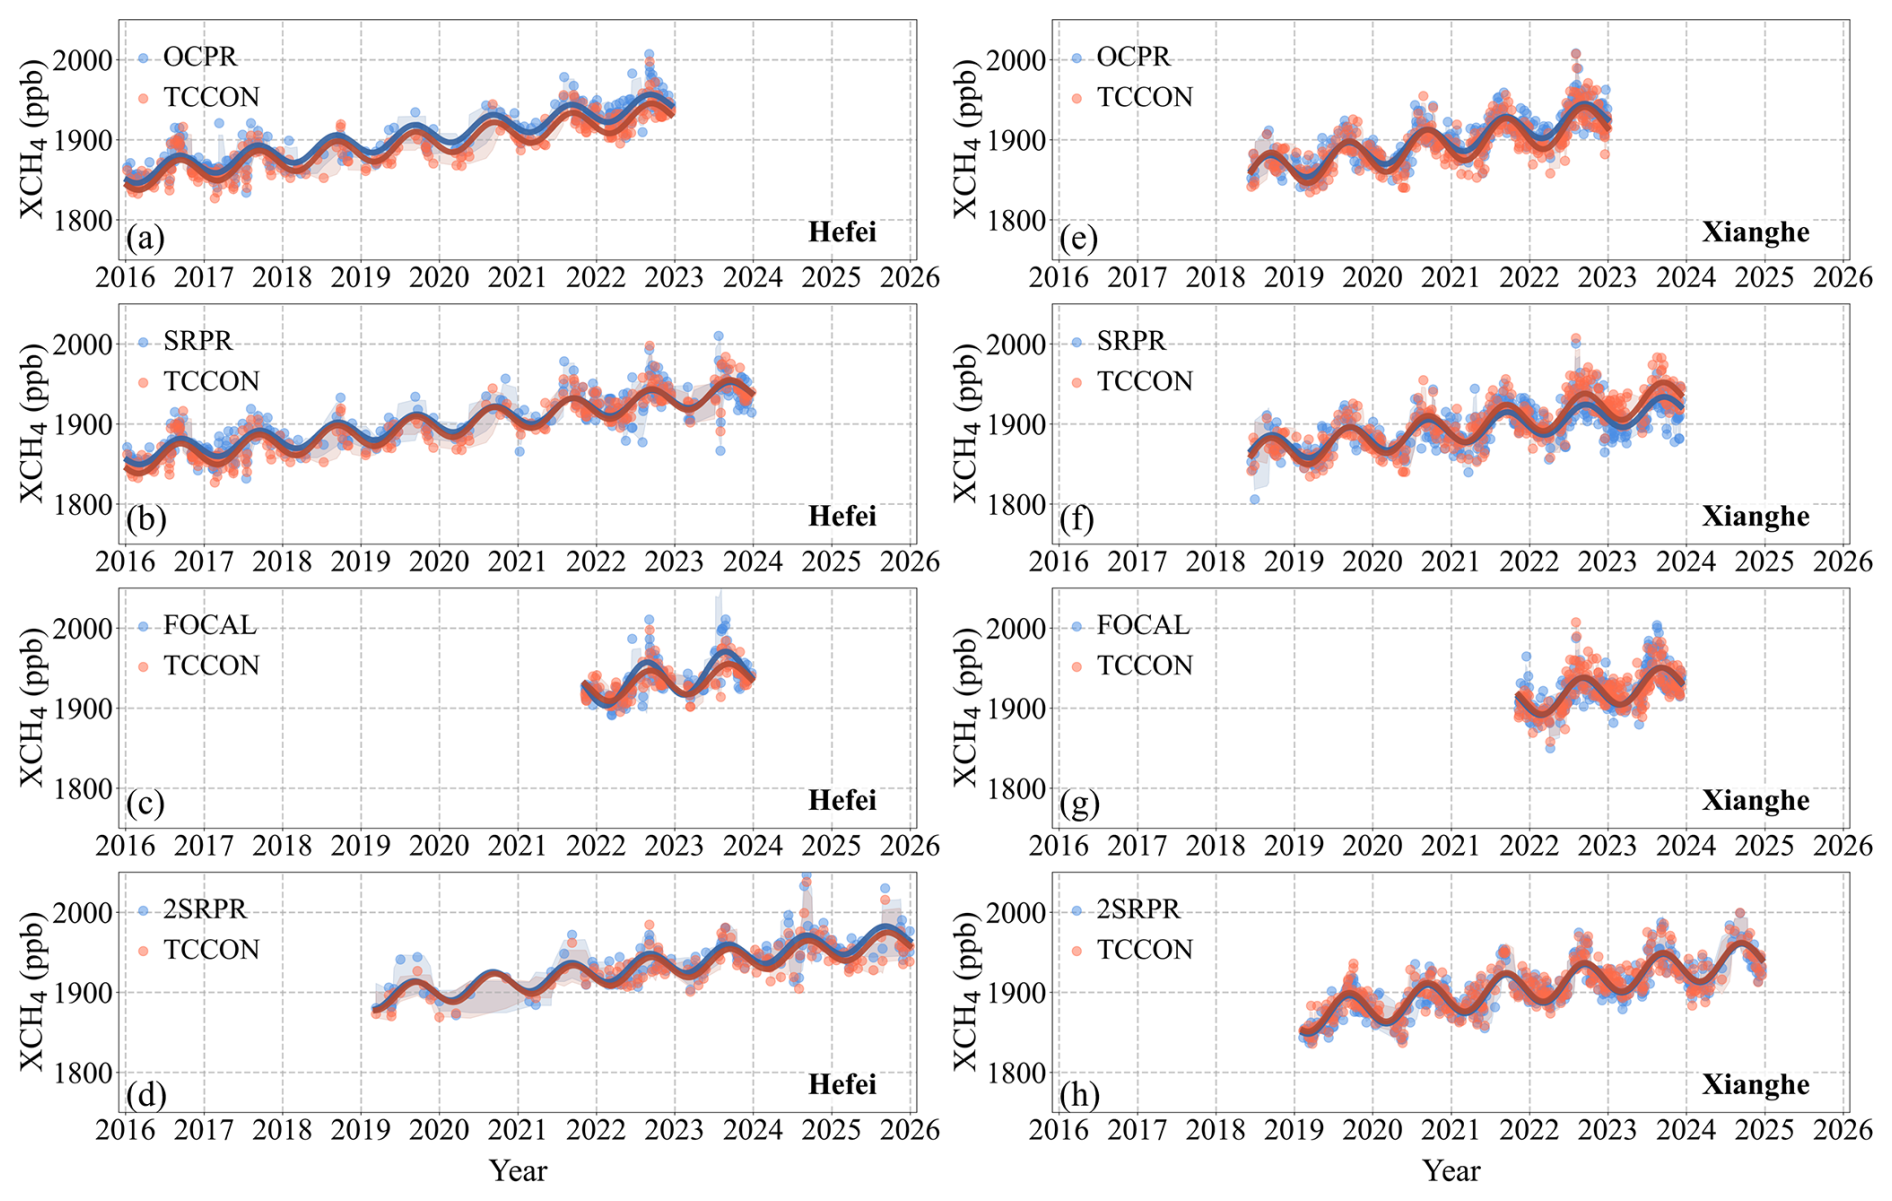
Time series of XCH4 at the Hefei (a–d) and Xianghe (e–h) sites are presented in Fig. 4. The datasets include four satellite retrieval products – OCPR, SRPR, FOCAL Proxy (indicated as FOCAL), all applied to GOSAT, and SRPR (2SRPR) applied to GOSAT-2 – together with ground-based TCCON observations. To capture the long-term evolution and inter-annual fluctuations of XCH4, a non-linear composite regression model was fitted to the data points:
where y(t) denotes the fitted XCH4 concentration at time t, and t is the time in fractional years. a0−3 represent the free fit parameters, which are iteratively determined using the non-linear least squares regression method.
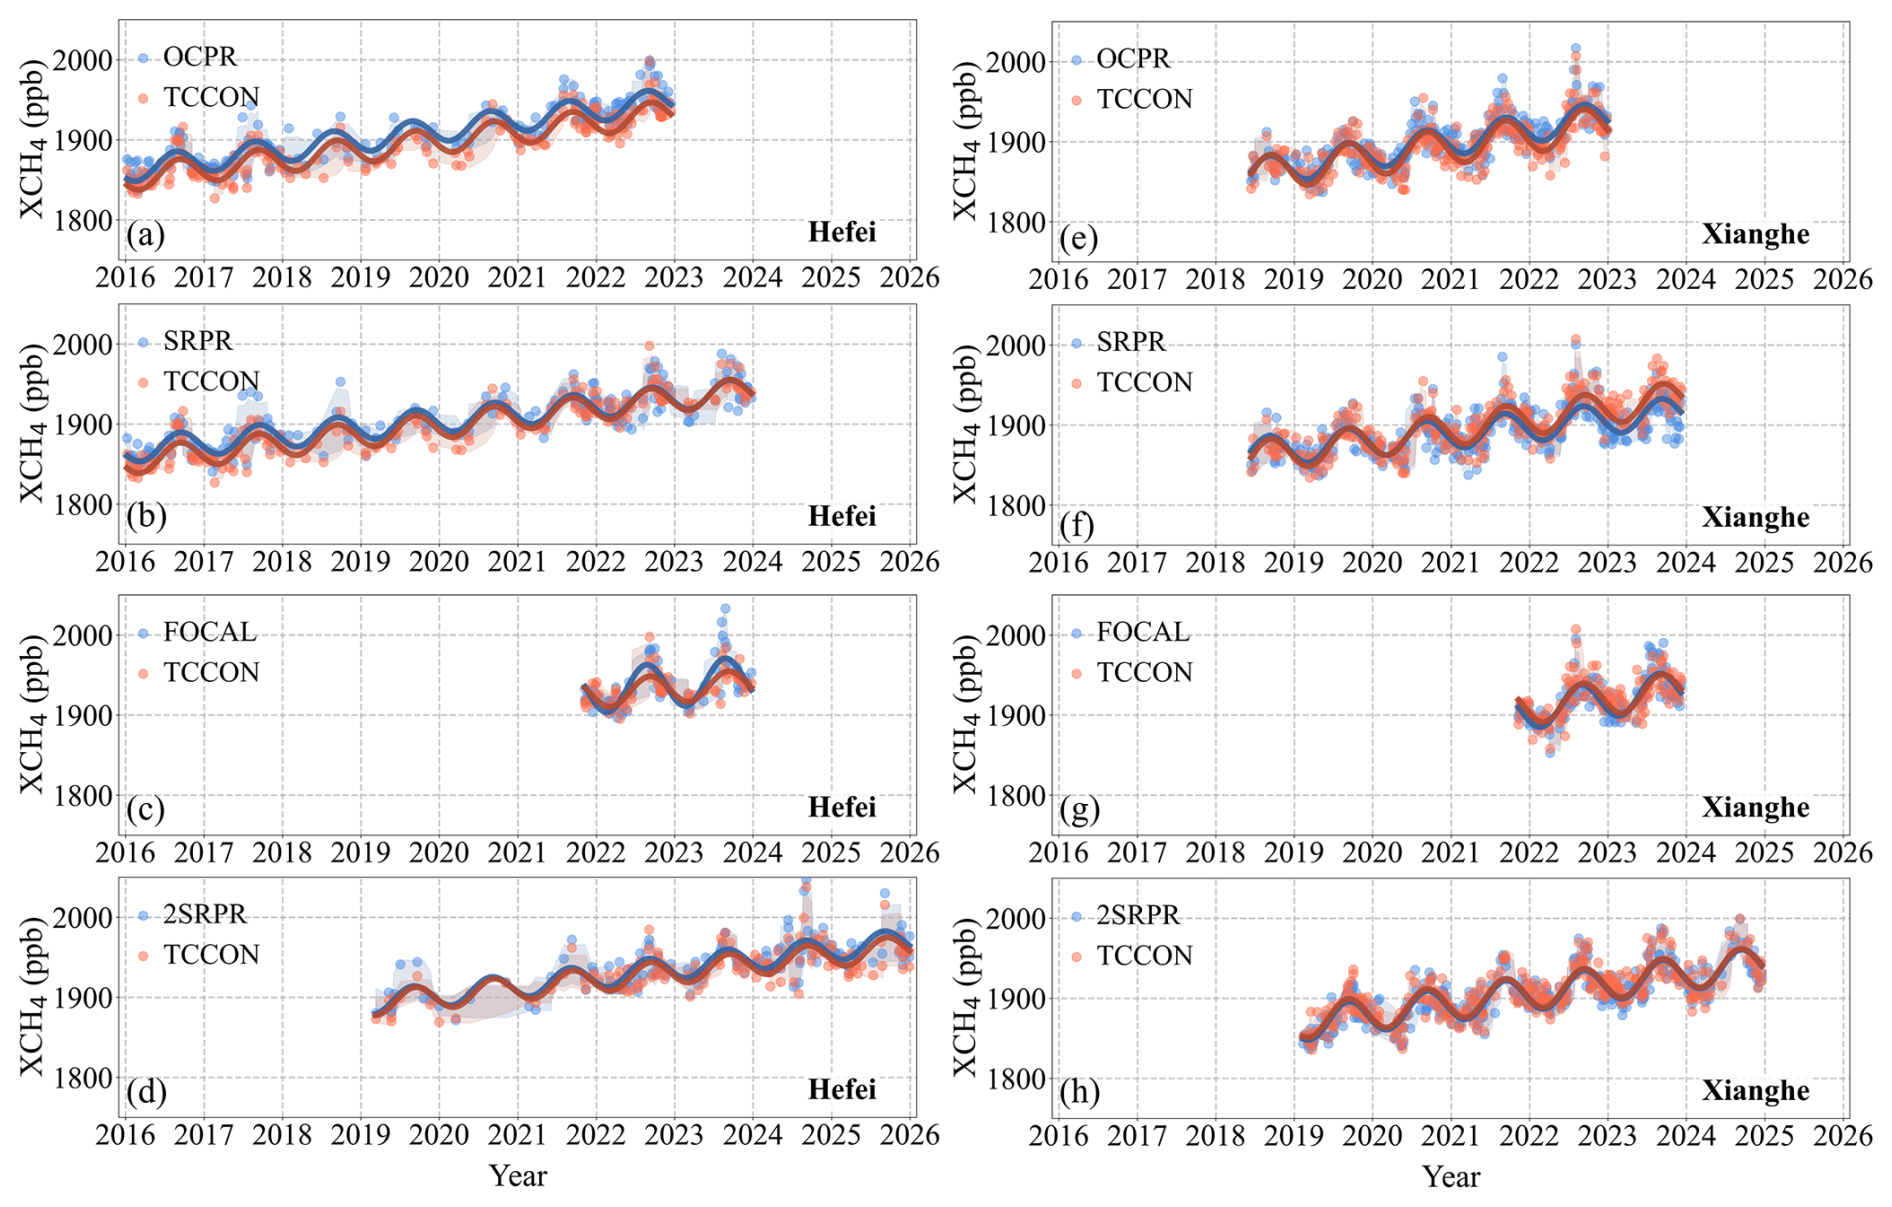
Figure 4Time Series of XCH4 data retrieved by each algorithm (see legend and text), against TCCON reference data for the Hefei (a–d) and Xianghe (e–h) sites. The blue scatter points represent the XCO2 Proxy XCH4 products, the red scatter points denote the TCCON reference data, and the curves are the corresponding fitted lines calculated using Eq. (10). The shaded area represents the ±1 standard deviation of the corresponding data points.
Figure 4 shows distinct seasonal cycles at both sites, with concentrations peaking in summer and autumn and minima in spring and winter. The number of ground-based observations at the Xianghe site is larger than at Hefei, which is attributed to its more advantageous meteorological conditions (Lorente et al., 2022). The methane concentrations at Hefei are larger than at Xianghe. The temporal variations of all four satellite products closely trace those of the TCCON observations, at both sites, but with some clear deviations too. At the Hefei site, the number of matched data samples was small between 2018 and 2021, which renders the evaluation of the data products more sensitive to outliers than in Xianghe, resulting in significant dispersion and larger uncertainty envelopes (shaded areas).
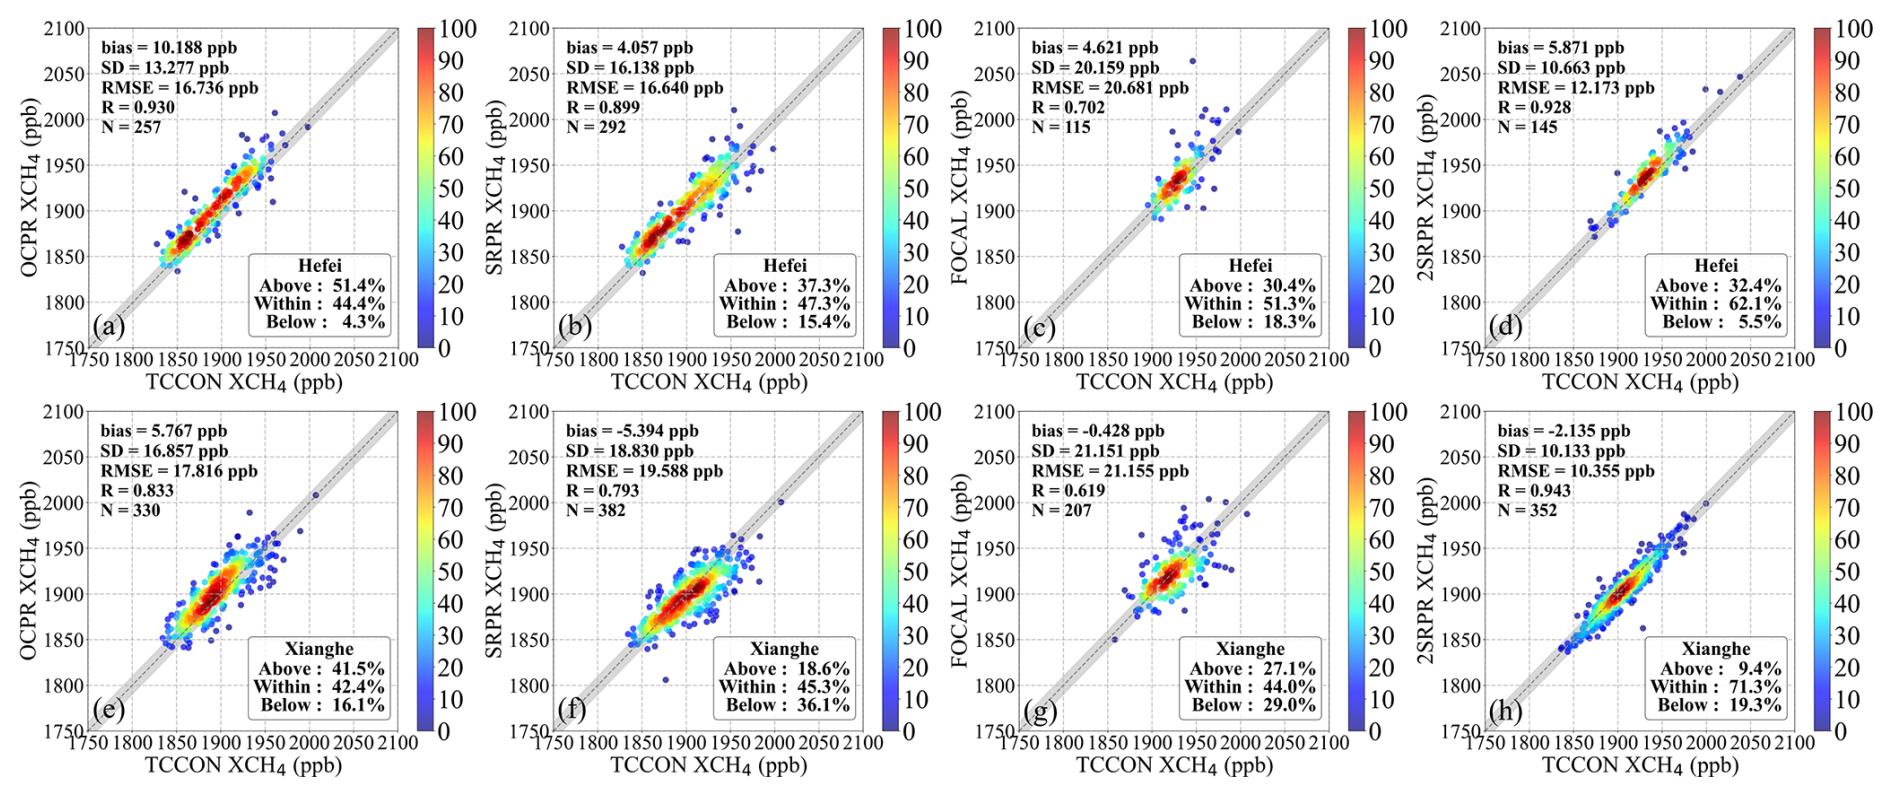
To quantitatively evaluate these observations, site-specific scatter-density plots of the satellite products versus TCCON observations are provided in Fig. 5 and the statistical metrics are provided in Table 3. The scatter-density plots show distinctly different bias at Hefei and Xianghe: all products show a systematic overestimation (positive bias) in Hefei, whereas at the Xianghe site, the bias for all products except OCPR is negative. In particular, the GOSAT OCPR XCH4 is overestimated at the Hefei site (Fig. 4a), with a bias as high as +13.1 ppb and 61.9 % of the data pairs above the GCOS requirement of ±10 ppb (33.5 % within the GCOS requirements), in spite of the high correlation (R=0.937). This systematic offset is clearly visible in Fig. 4 throughout the whole year. At the Xianghe site, the performance of the OCPR algorithm is better, with 50.2 % of the data within the 10 ppb GCOS requirement.
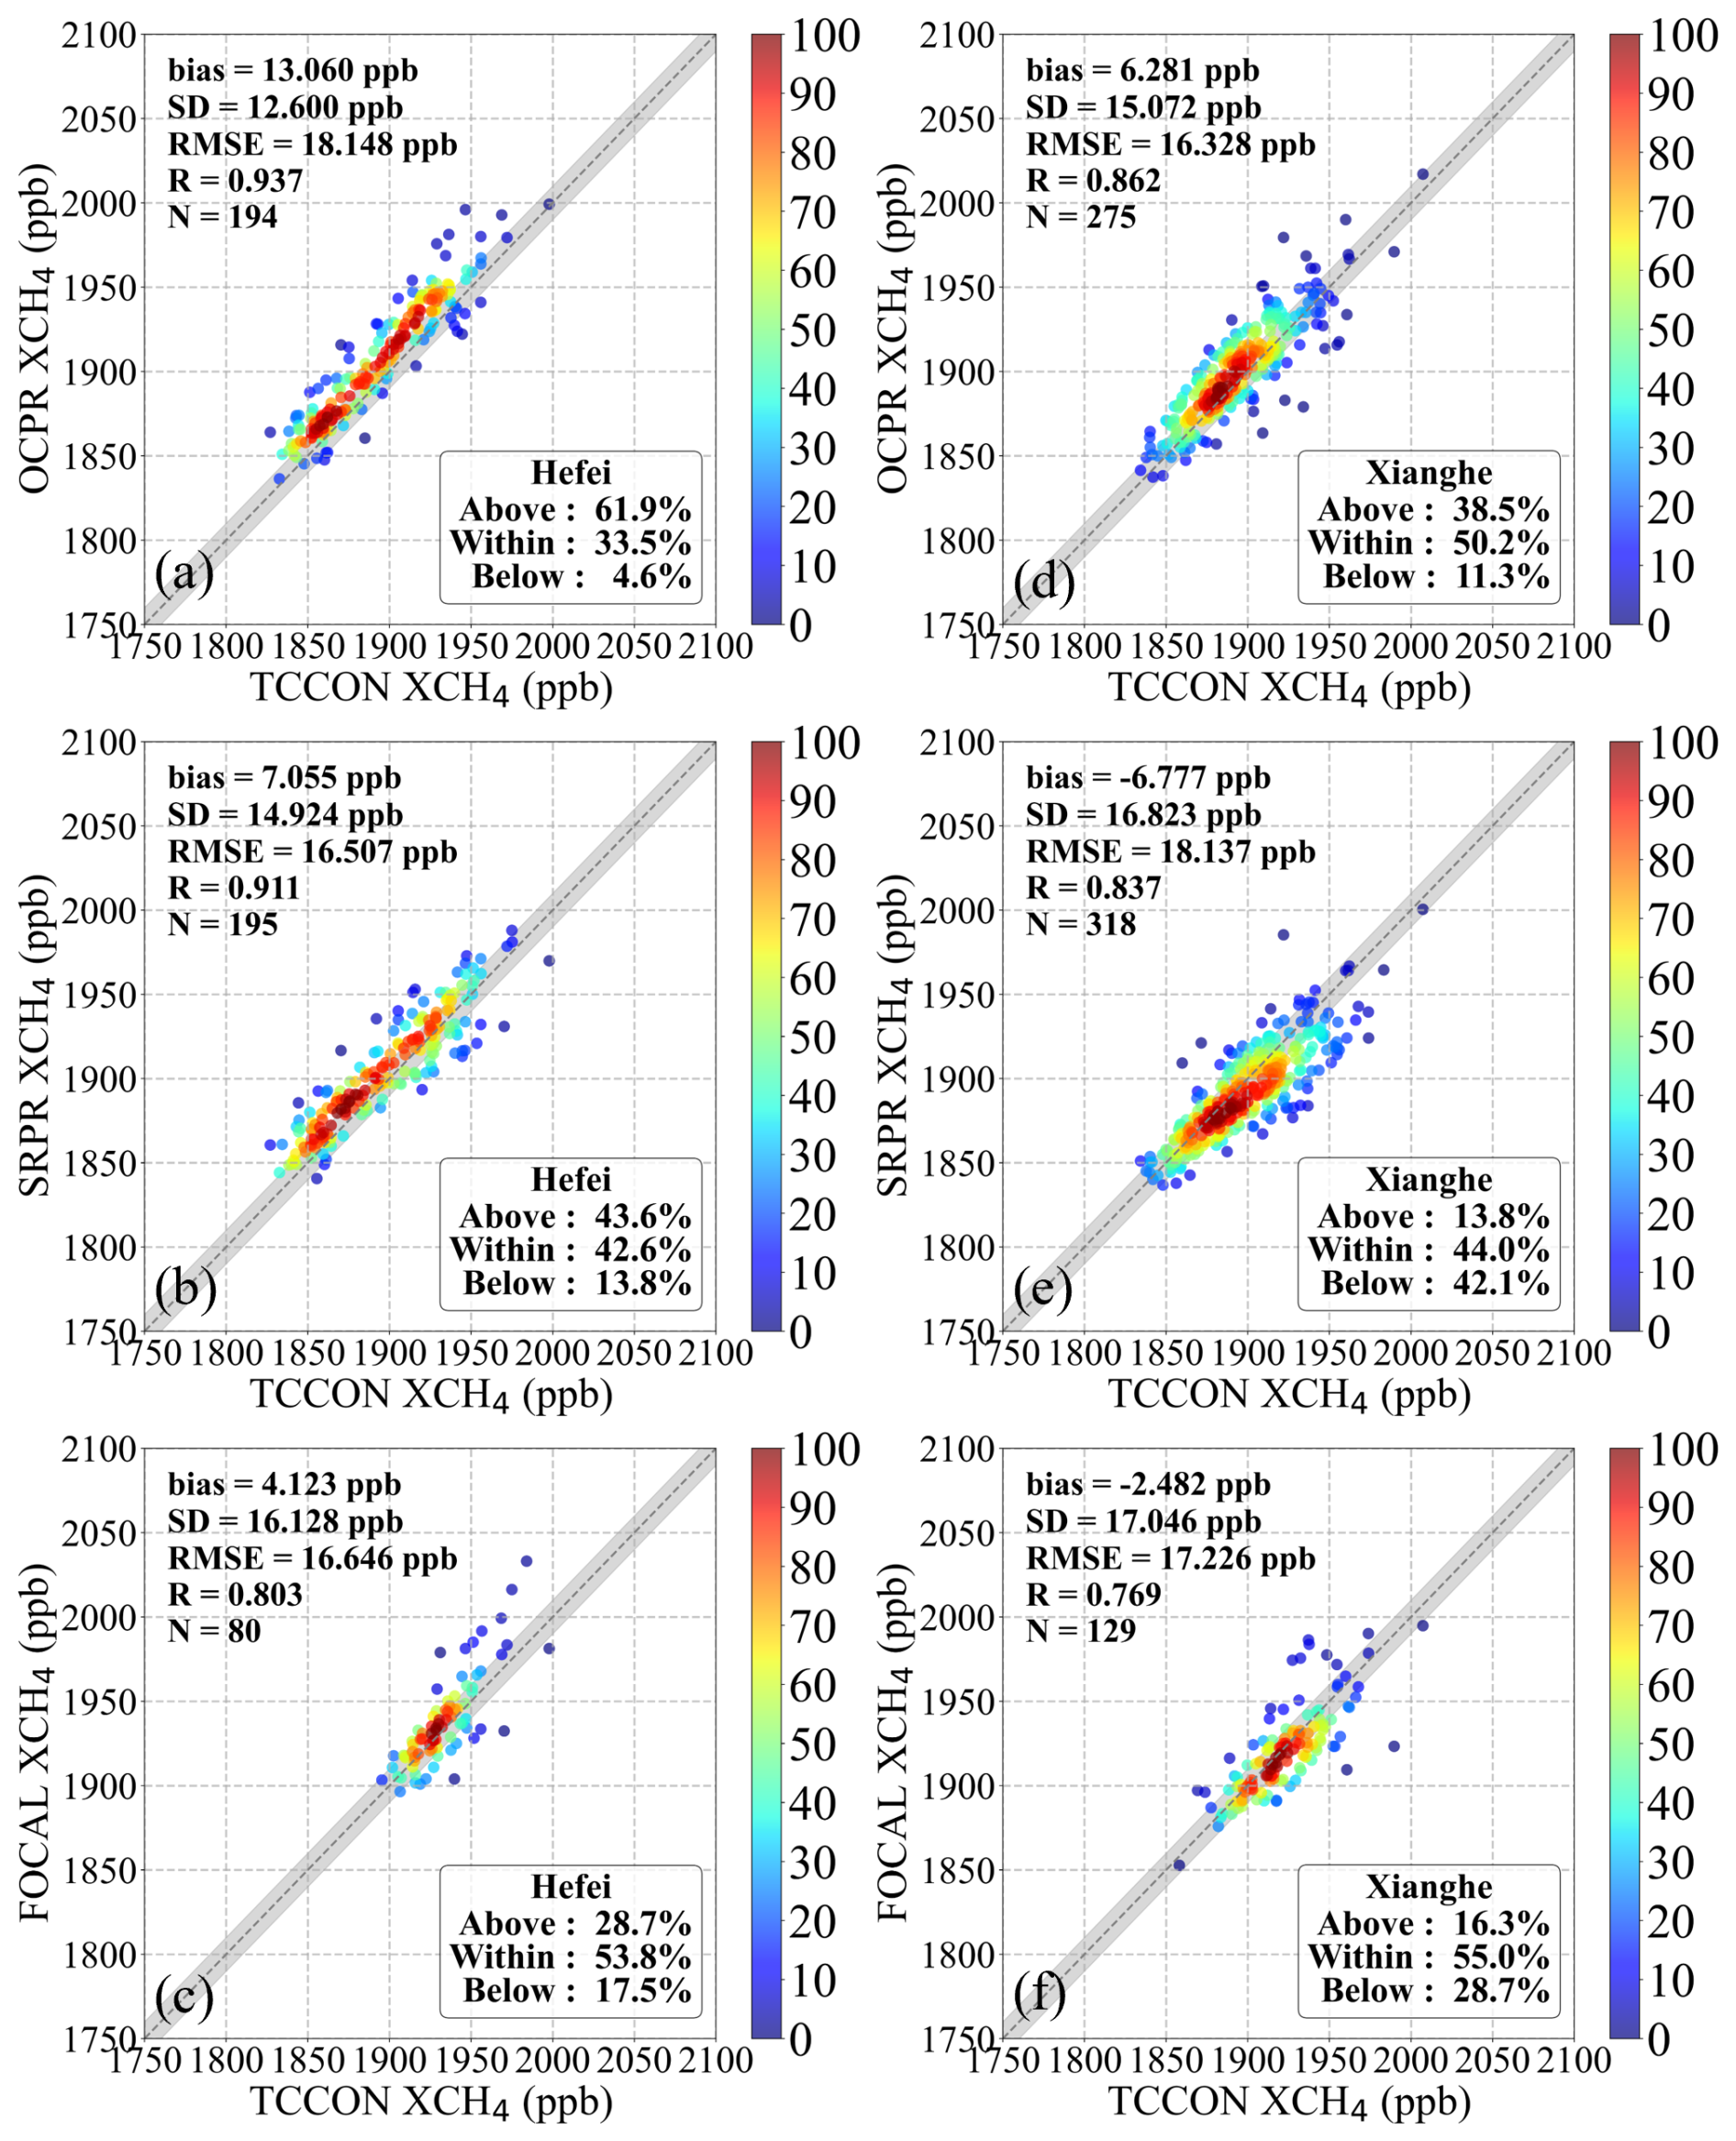
Figure 5Scatter density plots of GOSAT XCH4 data retrieved by each algorithm (as indicated along the vertical axes) against TCCON reference data for the individual Hefei (a–c) and Xianghe (d–f) sites. The density of the data points in % are color coded following the color bars to the right. Validation metrics are presented in the legend at the top-left. The dashed line indicates the 1:1 reference, with the grey shaded area representing an envelope of 10 ppb, consistent with the GCOS precision requirements for XCH4. The correspondence with the GCOS requirements is presented in the legend in the lower right corner, where “Within” denotes the percentage of data points within the GCOS envelope, while “Above” and “Below” represent the proportions of points falling above and below this range, respectively.
Table 3Main statistics of the four Proxy XCH4 products of GOSAT versus TCCON ground-based observations for the Hefei and Xianghe sites.
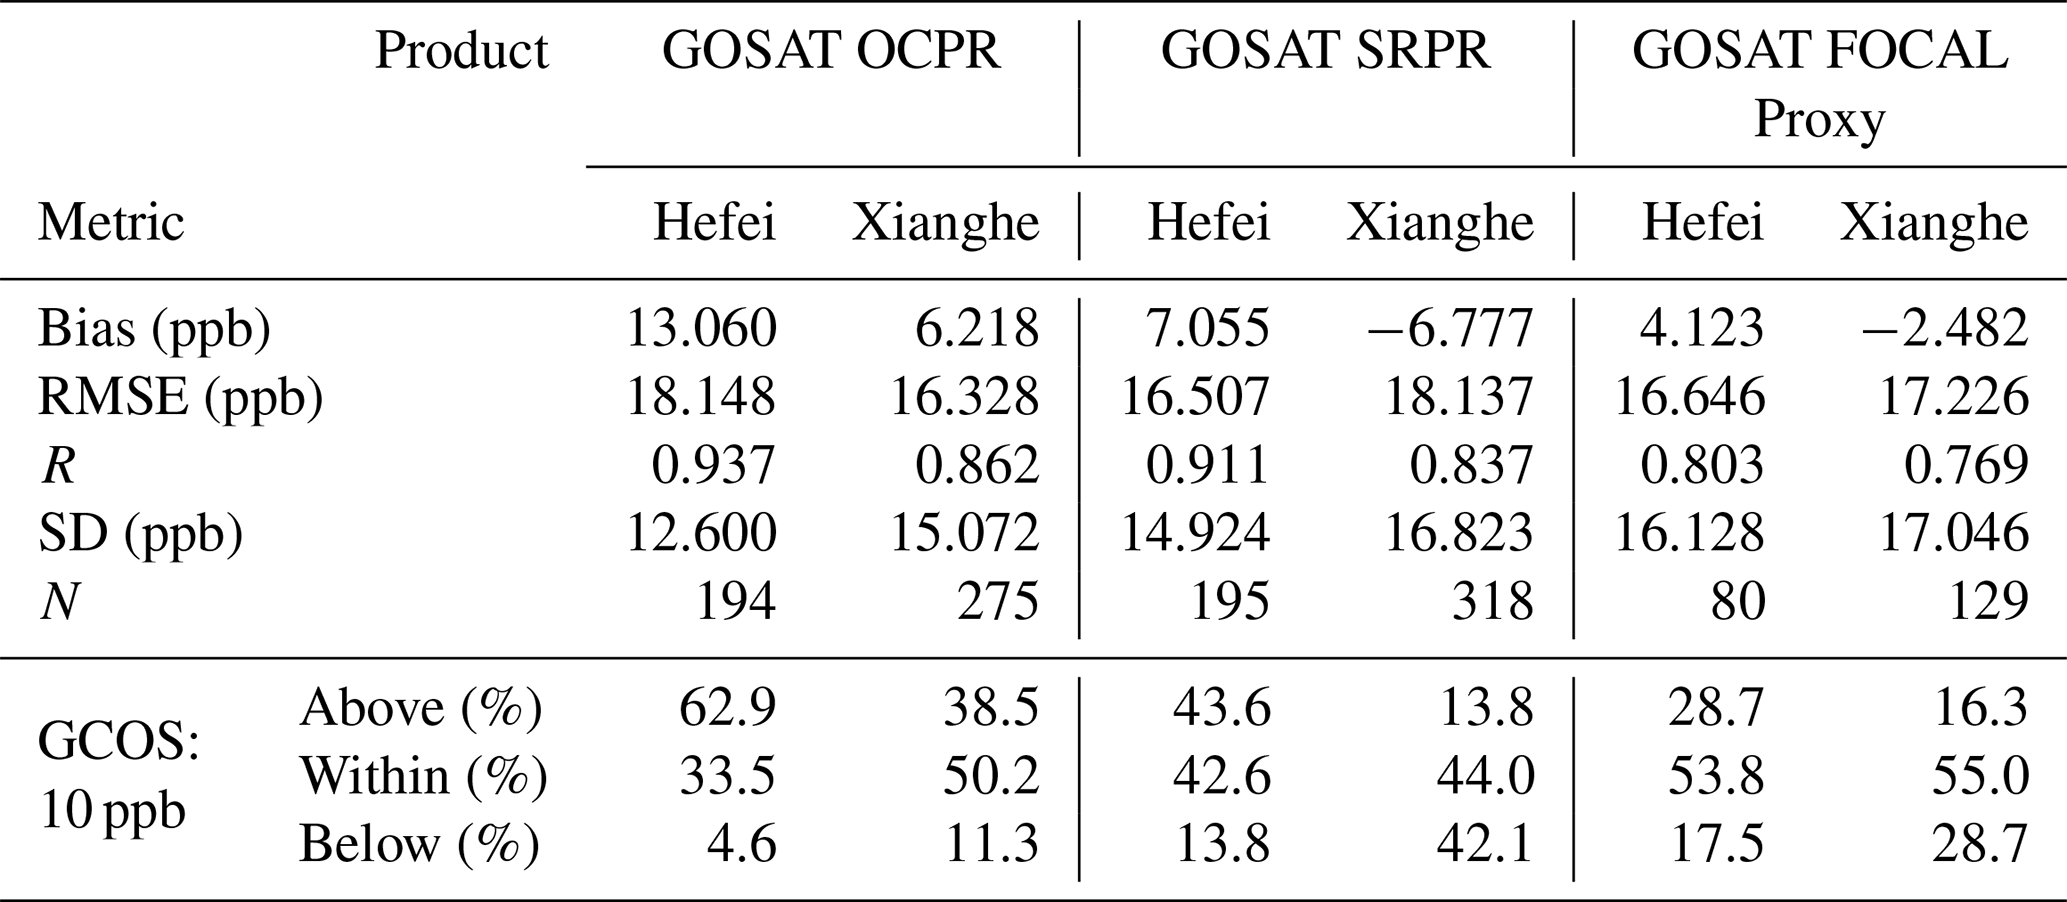
The comparison of the GOSAT SRPR product with the TCCON data shows that the RMSE and SD are similar, the correlation R is higher at Hefei than at Xianghe and there are large differences between the bias and the compliance with GCOS requirements. SRPR significantly overestimates XCH4 in Hefei, with 43.6 % of the observations above the GCOS requirements (42.6 % within), resulting in a positive bias of +7.0 ppb. In Xianghe the compliance with the GCOS requirements is slightly higher (44.0 %), but a large underestimation is observed with 42.1 % of the data points below the GCOS requirements and a negative bias of −6.8 ppb.
The evaluation of the GOSAT FOCAL Proxy product shows that more than 50 % of the data points meet the GCOS requirements at both sites. However, the short time series provide a limited number of observations that precludes robust statistical results and makes it difficult to effectively neutralize random errors through averaging. This product exhibits the lowest correlation (R≈0.8) at both sites.
Overall, the performance of the three GOSAT products is comparable overall, although their performance characteristics vary across different metrics and between the two sites, with no single product consistently outperforming the others at both sites. OCPR shows relatively high correlations but a pronounced positive bias at Hefei, while FOCAL has the highest proportion of data meeting the GCOS requirement at both sites but relatively low correlations. SRPR generally shows intermediate performance among the three GOSAT products across the evaluated metrics.
To further assess the performance differences between GOSAT and GOSAT-2 based on the same SRPR product, Fig. 6 and Table 4 compares GOSAT SRPR with GOSAT-2 SRPR over the common time range at each site. The performance of the GOSAT-2 SRPR is better than GOSAT SRPR, with the lower RMSE (9.7–10.6 ppb), lower SD (9.0–10.3 ppb) and the higher correlation (R≈0.9) at both sites. In Hefei, 75.6 % of the data points fall within the GCOS target; however, a systematic overestimation is observed at Hefei, with 20.7 % of the data pairs above the GCOS requirements and a positive bias of +3.7 ppb. At the Xianghe site 69.9 % of the data points meet the GCOS requirements, but 20.6 % fall below this range, resulting in a negative bias of −2.5 ppb.
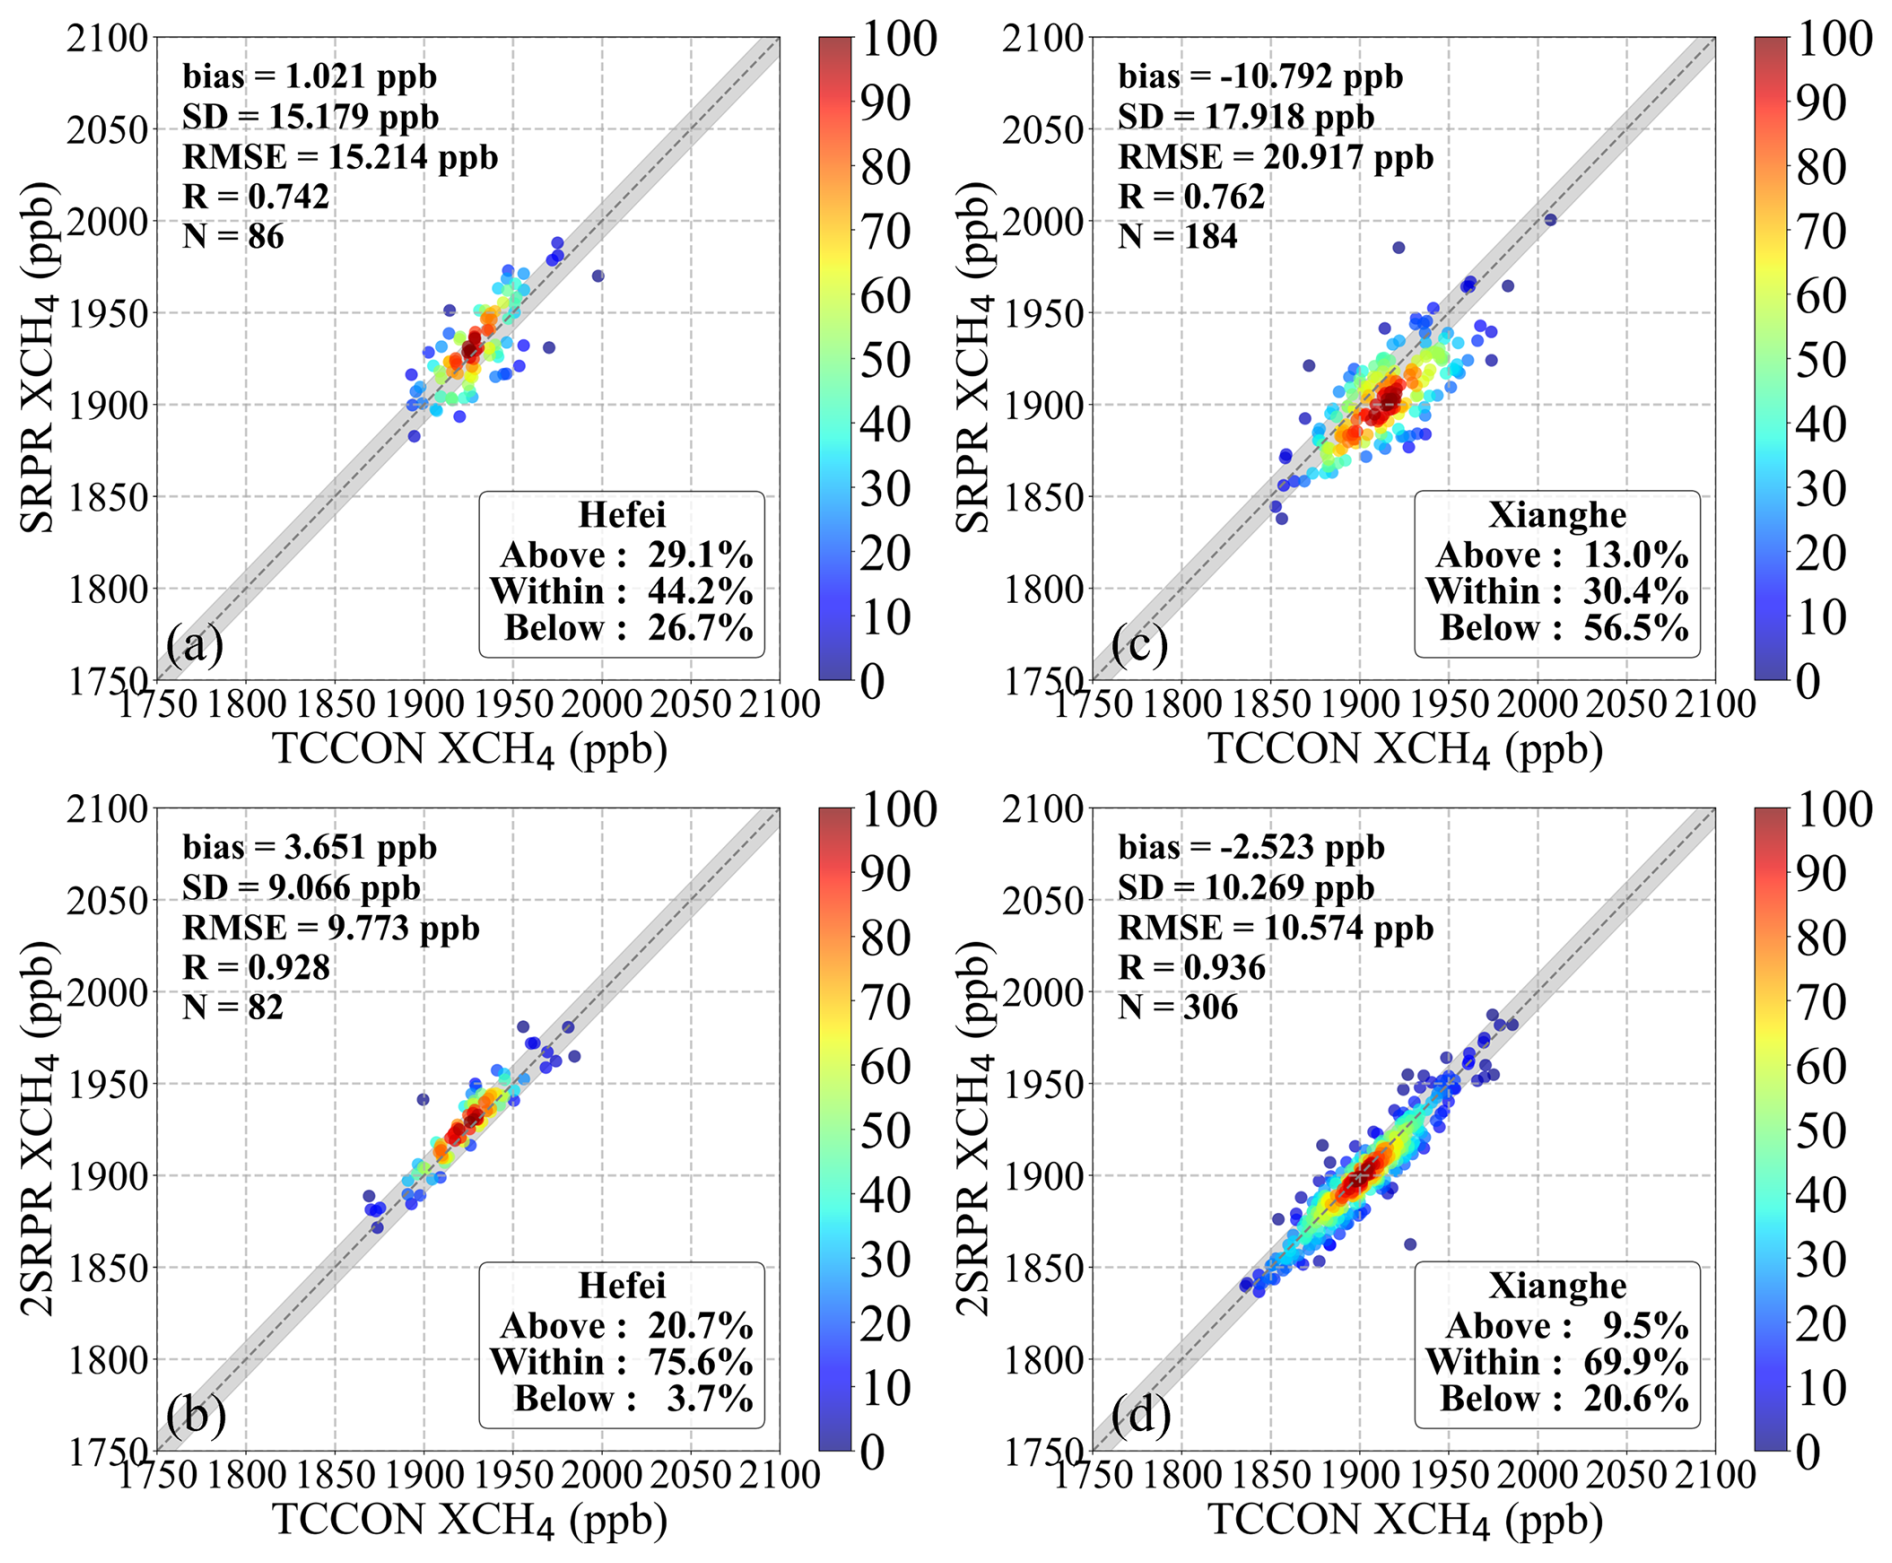
Figure 6As Fig. 5, but for GOSAT SRPR and GOSAT-2 SRPR over their common observation period at the Hefei (a, b) and Xianghe (c, d) sites.
Table 4As Table 3, but for GOSAT SRPR and GOSAT-2 SRPR over their common observation period.
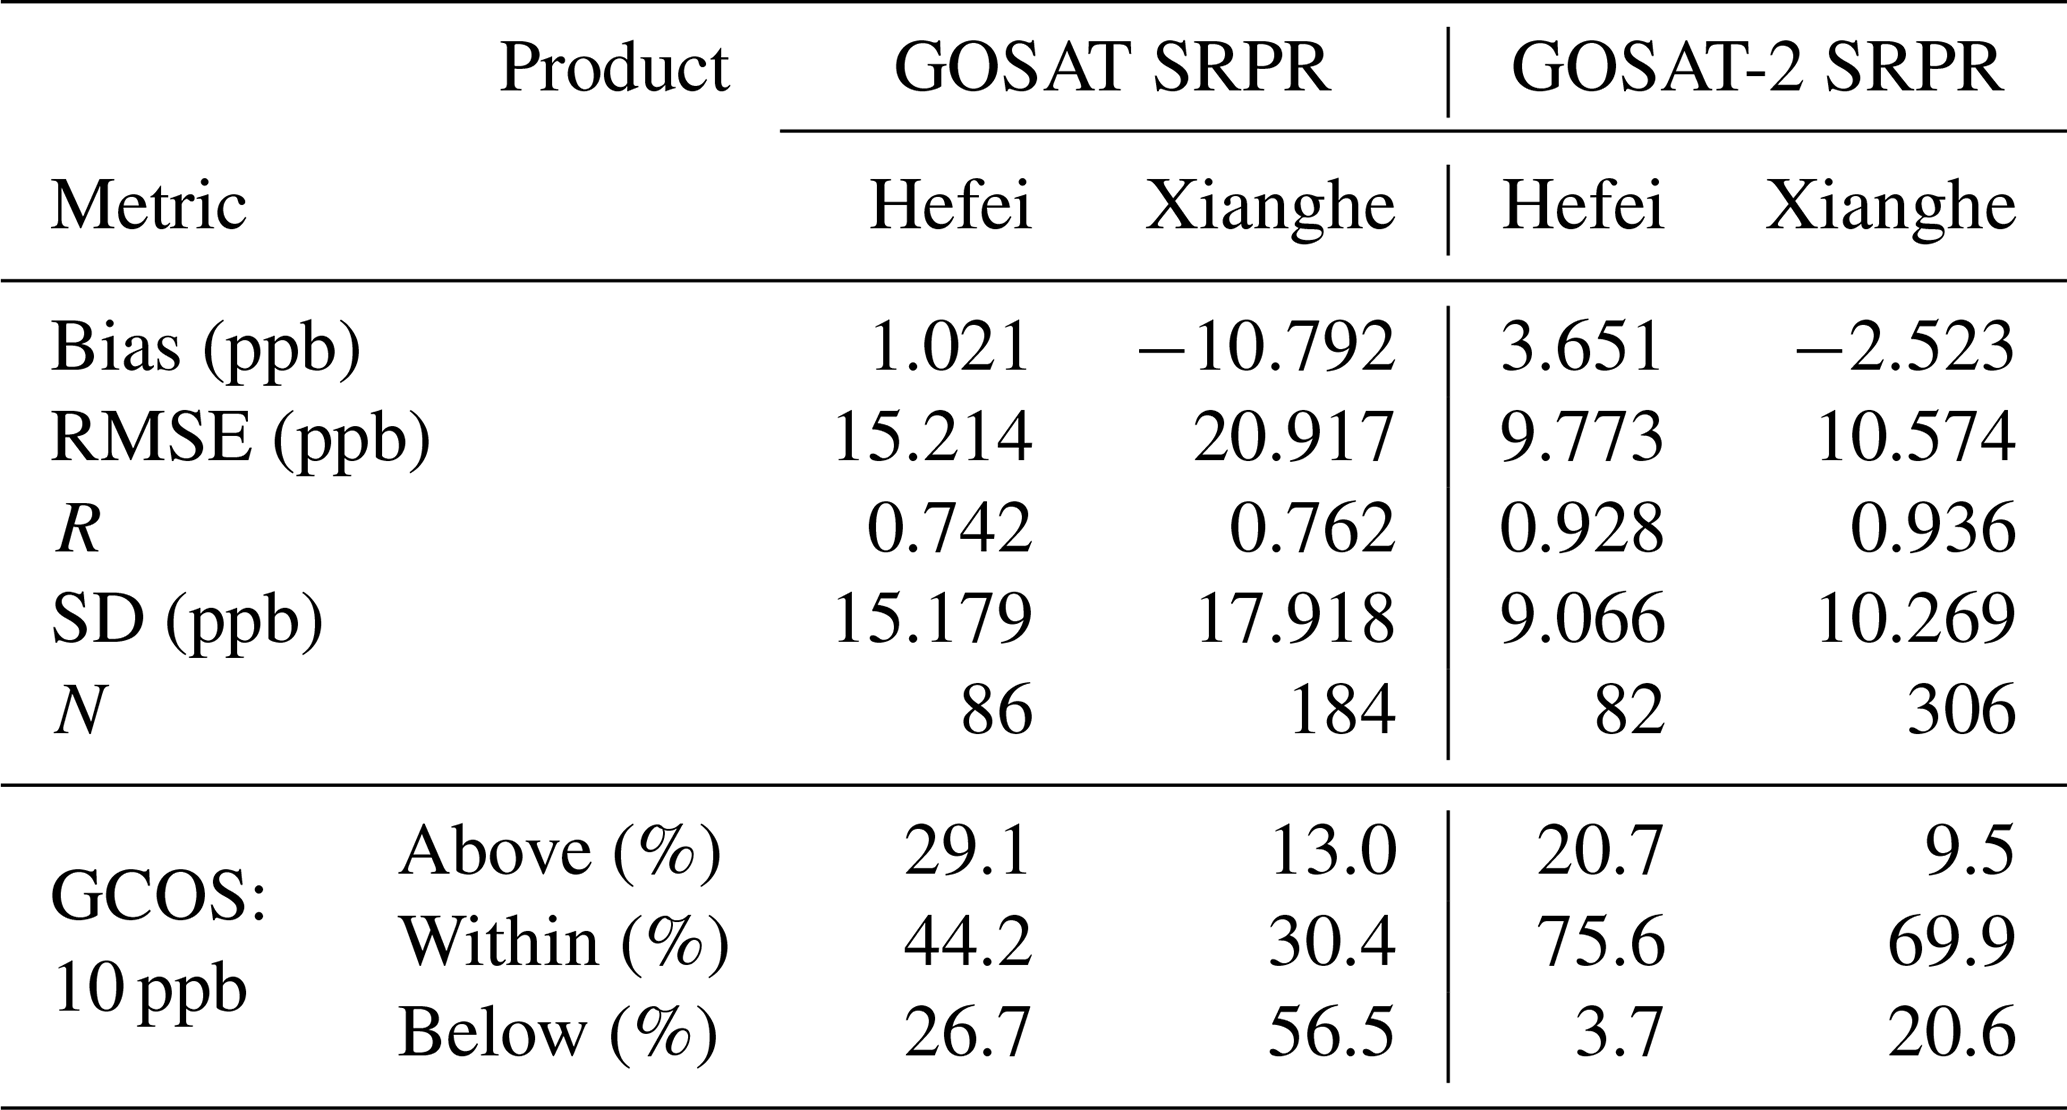
This discussion shows that the performance of GOSAT-2 SRPR is overall better than that of the other three products, with lower bias, RMSE and SD. When the matching radius is expanded from ±2.5 to ±5° (Appendix B), the statistical metrics of the products show varying degrees of change (Fig. B2). Nevertheless, GOSAT-2 SRPR still exhibits the best overall performance among the four products, indicating that the relative performance of the products is broadly robust to the choice of matching radius.
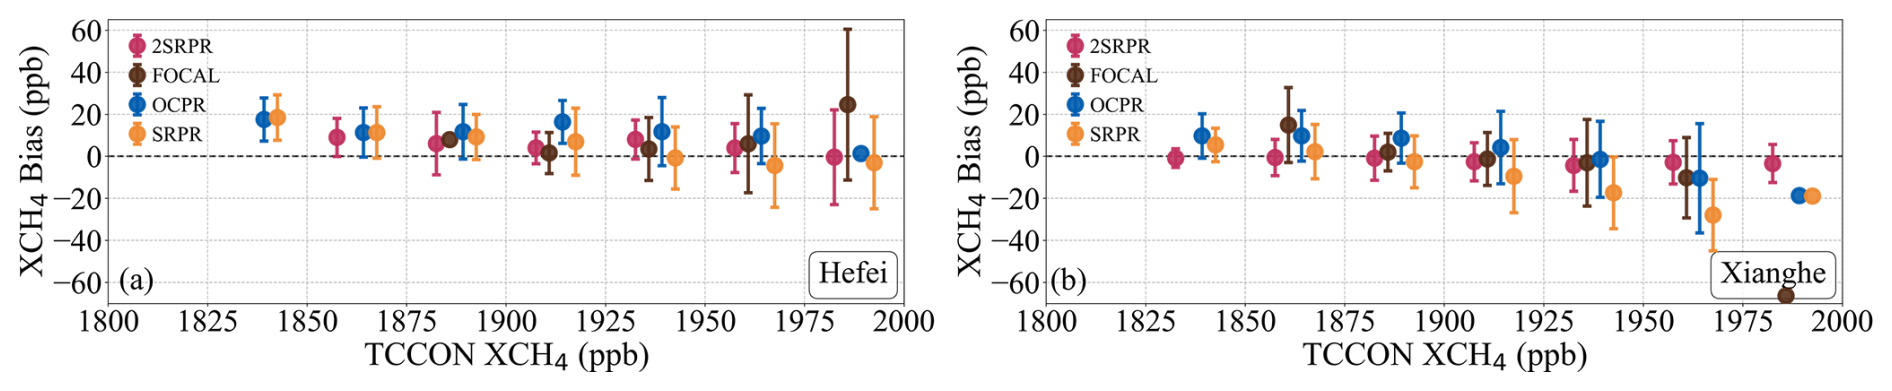
The biases of the four Proxy XCH4 products relative to TCCON observations, averaged in XCH4 bins of 25 ppb, are presented in Fig. 7 as a function of the TCCON-reference XCH4. At the Hefei site, the mean biases of the four Proxy XCH4 products generally exhibit a positive offset, with variations primarily concentrated between 0 and 20 ppb, except for SRPR for which the mean bias is slightly negative in the two largest bins. The biases are largest for the lower XCH4 and overall decreases with increasing XCH4. The GOSAT FOCAL Proxy (brown) covers a narrower concentration range, with a notable absence of observation data in the low-to-medium range (<1900 ppb); the error bars are significantly larger at the high concentrations, indicating higher retrieval uncertainty. OCPR (blue) shows an overall higher bias, averaging between 10 and 20 ppb. For GOSAT SRPR (orange) the mean bias variations for XCH4 smaller 1900 ppb are similar to those of OCPR, but decreases toward zero as XCH4 concentrations increase further. The mean bias of the GOSAT-2 SRPR product (magenta) is smaller overall and generally fluctuates around zero.
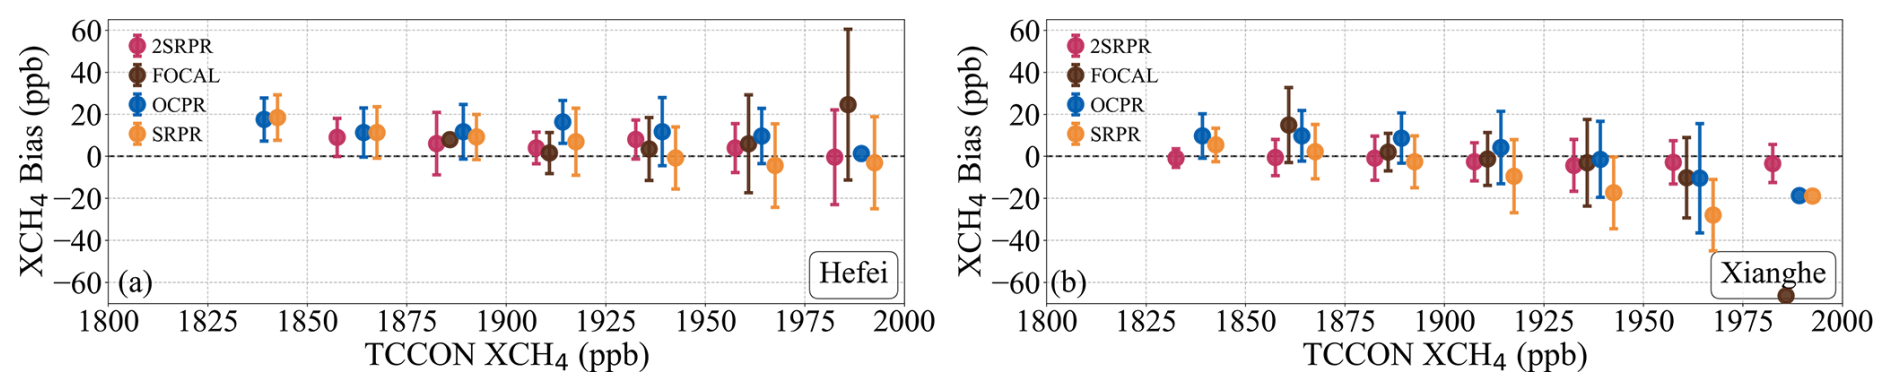
Figure 7Variation of the mean XCH4 bias, i.e. bias averaged in XCH4 bins with a width of 25 ppb, with TCCON-reference XCH4 for (a) Hefei site; (b) Xianghe site. Error bars indicate the standard deviation of the bias in each bin. The colors indicate the four different proxy algorithms, see legends.
At the Xianghe site the biases are smaller than at Hefei, as indicated above. The mean bias of all products except GOSAT-2 SRPR decrease with increasing XCH4 and become negative when XCH4 exceeds 1900 ppb, particularly for GOSAT SRPR and the GOSAT FOCAL Proxy. In contrast, the mean bias of GOSAT-2 SRPR generally fluctuates around zero.
The variations in the biases of the satellite-retrieved XCH4 as function of the TCCON reference XCH4 data during different seasons are presented for the two sites in Fig. 8. The number of valid matchups (n) for each product and season is also shown in the figure. The sample availability varies among seasons, particularly at the Hefei site, where the number of observations in summer is relatively small for all four products (n=12–32). The data range varies across seasons, reflecting the higher concentrations in summer and autumn than in winter and spring; notably, the mentioned large variations occur during summer. At the Hefei site (Fig. 8a–d), the positive bias of GOSAT OCPR is most prominent with high values across the entire XCH4 range during spring and summer. The various proxy products show smaller fluctuations of the mean bias among the four data sets during autumn and winter. GOSAT-2 SRPR generally exhibits small biases with limited variations across seasons, except at high XCH4 concentrations in summer, where the error bars become notably larger. The relatively small summer sample size may partly contribute to the larger variability represented by these error bars.
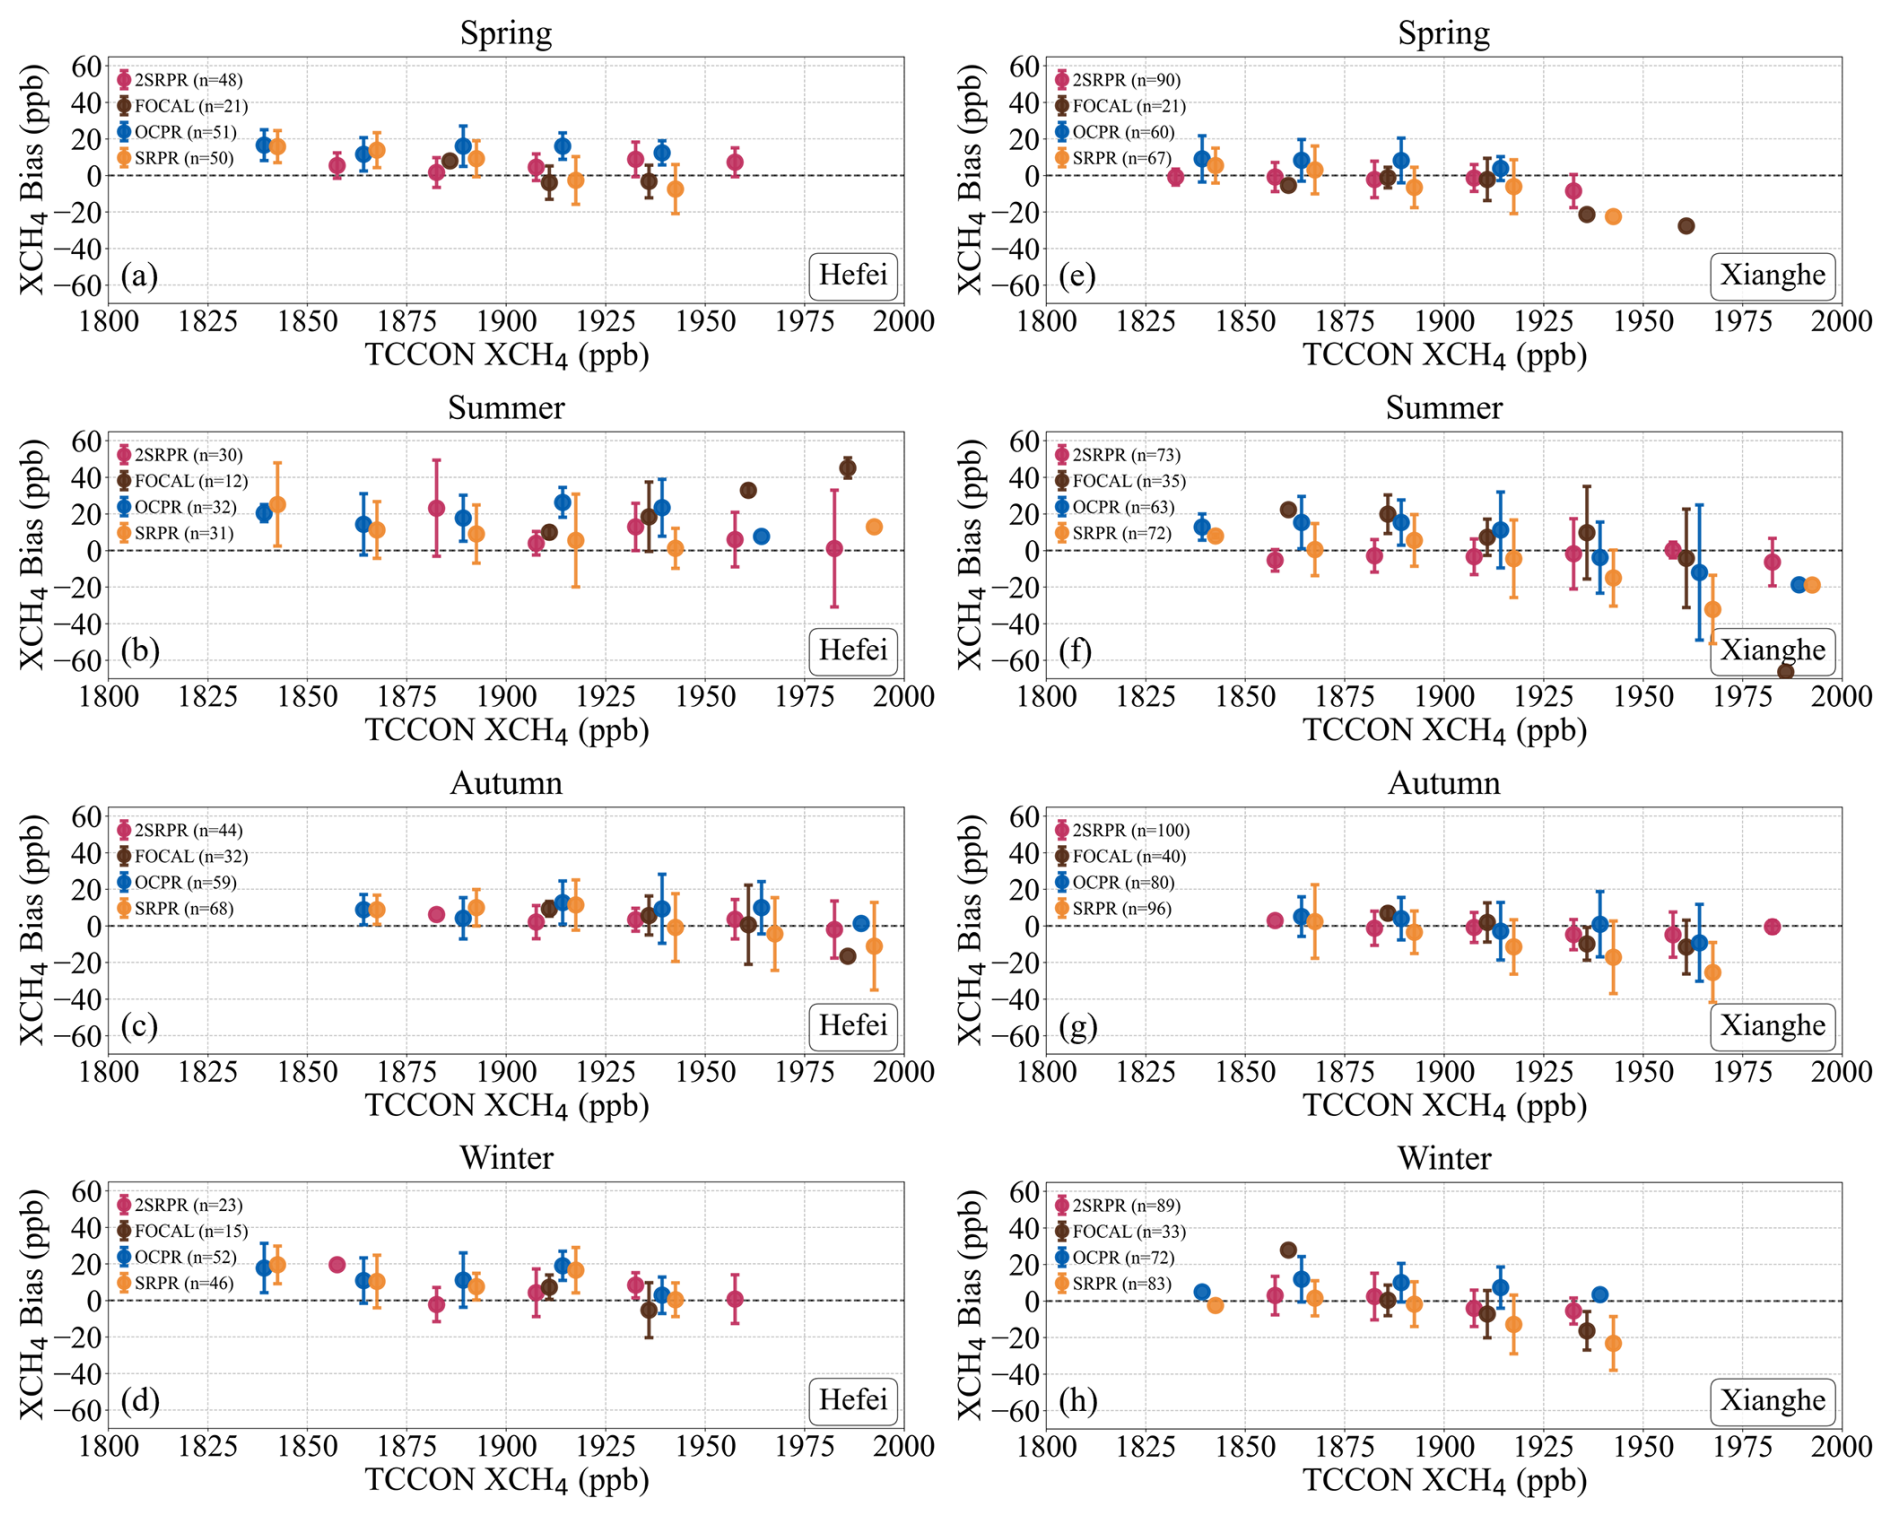
Figure 8As Fig. 7, but broken down by season, for the Hefei (a–d) and Xianghe (e–h) sites. In spring the data are averaged over March, April and May (a, e), in summer over June, July and August (b, f), in autumn over September, October and November (c, g) and in winter over December, January and February (d, h). The values of n in the legends denote the number of valid Satellite – TCCON matchups used for each seasonal analysis.
At the Xianghe site (Fig. 8e–h), GOSAT OCPR shows positive biases in the low-to-medium concentration ranges, while other products fluctuate around the zero line. Except for GOSAT-2 SRPR, the other products all present a consistent decrease as XCH4 increases, manifesting as negative biases at high concentrations.
The four Proxy products at the Hefei and Xianghe sites are further evaluated through the Taylor diagram plotted in Fig. 9, using the correlation coefficient (R, Eq. 7), the Centered Root-Mean-Square Error (CRMSE, Eq. 8) and the Normalized Standard Deviation (NSD, Eq. 9). The mean bias is excluded from this evaluation to focus on the statistical consistency and precision of the products.
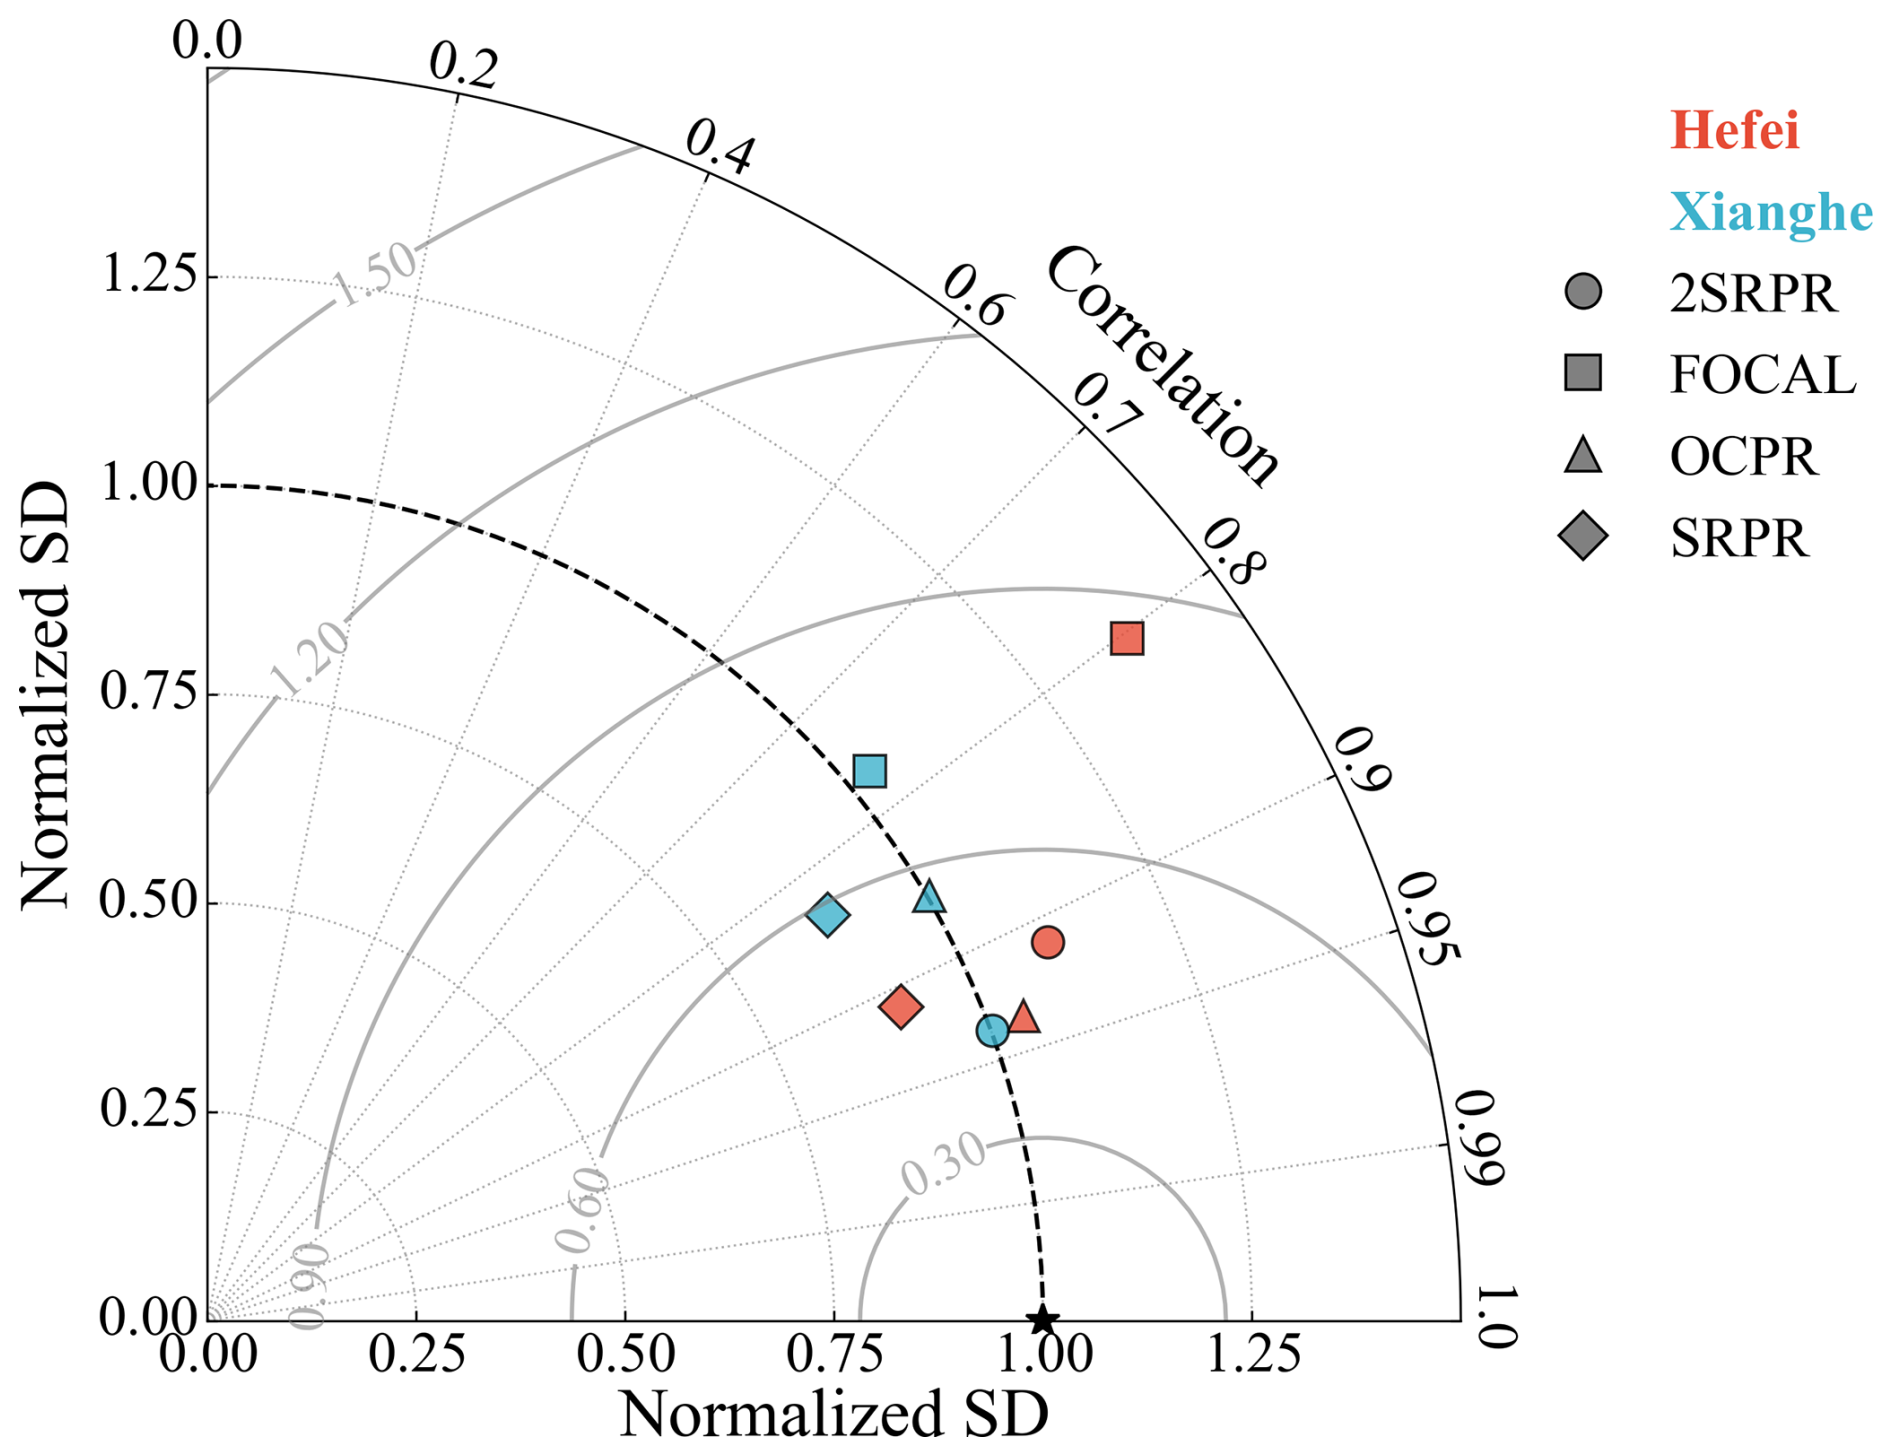
Figure 9Taylor diagram of CO2 Proxy XCH4 products relative to TCCON reference data. Blue and red markers denote the Hefei and Xianghe sites, respectively, with different symbols indicating the XCH4 proxy products as indicated in the legend. The radial distance from the origin represents the Normalized Standard Deviation (Normalized SD). The azimuthal angle denotes the Correlation Coefficient (R). The Centered Root Mean Square Error (CRMSE) is indicated by the gray dashed concentric semicircles centered at the reference point (the geometric distance to the reference point).
In the Taylor diagram, the distance of the OCPR RMSE to the reference point (star, where R=1 and NSD=1), representing the CRMSE, is relatively small, in spite of having the highest bias value in Table 3. This confirms that the high OCPR RMSE is primarily driven by systematic bias rather than by random fluctuations. At the Xianghe site, all products except GOSAT SRPR are generally distributed close to NSD=1, indicating that their variability amplitudes are comparable to that of the TCCON observations. At the Hefei site, GOSAT FOCAL Proxy (squares) shows lower precision and stability, with an NSD significantly greater than 1.0, indicating substantially larger variability than the TCCON observations. Notably, GOSAT SRPR shows relatively low NSD values at both sites, indicating smaller standard deviations than the TCCON observations.
3.2 Validation of XCO2 estimates used in the proxy algorithms
The four XCO2 proxy algorithms discussed in this paper use different independent estimates of XCO2 for the final calculation of XCH4 (Eq. 1), based on different models as indicated in the algorithm descriptions. In this section, the XCO2 estimates used in the proxy algorithms are evaluated versus TCCON reference data. For the FOCAL proxy, the XCO2 estimates are not directly accessible within the satellite products, therefore only the model results for the other three products are validated.
The time series of the model XCO2 data used in the GOSAT SRPR proxy algorithm is presented in Fig. 10, together with the TCCON XCO2 data at the Hefei and Xianghe sites. Similar time series for the OCPR and GOSAT-2 SRPR products are presented in Fig. A6 (Appendix A). The time series show seasonal variations similar to those of XCH4 in Fig. 4, but with a phase lag of approximately six months. XCO2 peaks by the end of winter and early spring and minima occur by the end of summer and early autumn. This phase shift is attributed to the asynchronous seasonal variations in the sources and sinks of CH4 and CO2: the peak of CH4 emissions occurs in summer due to vigorous microbial methanogenesis from organic matter decomposition (East et al., 2024), whereas the peak of CO2 uptake occurs in summer due to robust photosynthesis, resulting in the observed minimum by the end of summer (Yuan et al., 2019).

Figure 10As Fig. 4, but for model XCO2 data used in GOSAT SRPR XCH4 retrieval algorithm at the Hefei (a) and the Xianghe (b) sites.
At the Hefei site (Fig. 10a), the uncertainties (shaded areas) for both the SRPR modeled XCO2 and the TCCON reference data between 2018 and 2021, as well as in 2023, are much larger than at other times, due to the sparsity of coincident observation points during these periods. The time series show that the model XCO2 are initially slightly larger than the TCCON observations, whereas in later years the TCCON observations are larger. At the Xianghe site (Fig. 10b), the modeled XCO2 data are noticeably smaller than the TCCON reference data, especially during the spring peaks, with gradually increasing differences toward the end of the time series.
The time series at both TCCON sites show the evolution of the model XCO2 resulting in a very pronounced underestimation in 2023. This is primarily attributable to the sharp surge in emissions driven by the rapid recovery of socio-economic activities in the post-pandemic era (Ahmed and Stern, 2023), which was not captured because the CAMS model values used by the SRPR algorithm only extended to 2015 and were subsequently extrapolated year by year using the 2016 growth rate (3 ppm), rather than reflecting actual emission changes (Wu, 2021b).
The time series observations are confirmed by the scatter density plots of the XCO2 model data used in the GOSAT SRPR XCH4 retrieval algorithms versus the TCCON reference data presented in Fig. 11 for both the Hefei and Xianghe sites. Results for other products are presented in Fig. A5 (see Appendix A). The data for the Hefei site (Fig. 11a) show two clusters, one for low XCO2 (402–409 ppm) where the estimates used in SRPR are slightly overestimated, as in Fig. 10a at the beginning of the time series, and one for higher XCO2 (415–421 ppm) where the estimates used in SRPR are underestimated, resulting in an overall bias of −0.49 ppm. At the Xianghe site only one cluster is observed and the model XCO2estimates used in SRPR are underestimated resulting in an overall bias of −2.40 ppm. The fraction within the GCOS requirements is low at both sites. The RMSE at the Hefei site (2.25 ppm) is smaller than at the Xianghe site (3.66 ppm). These discrepancies contribute to the uncertainty in the retrieval process.
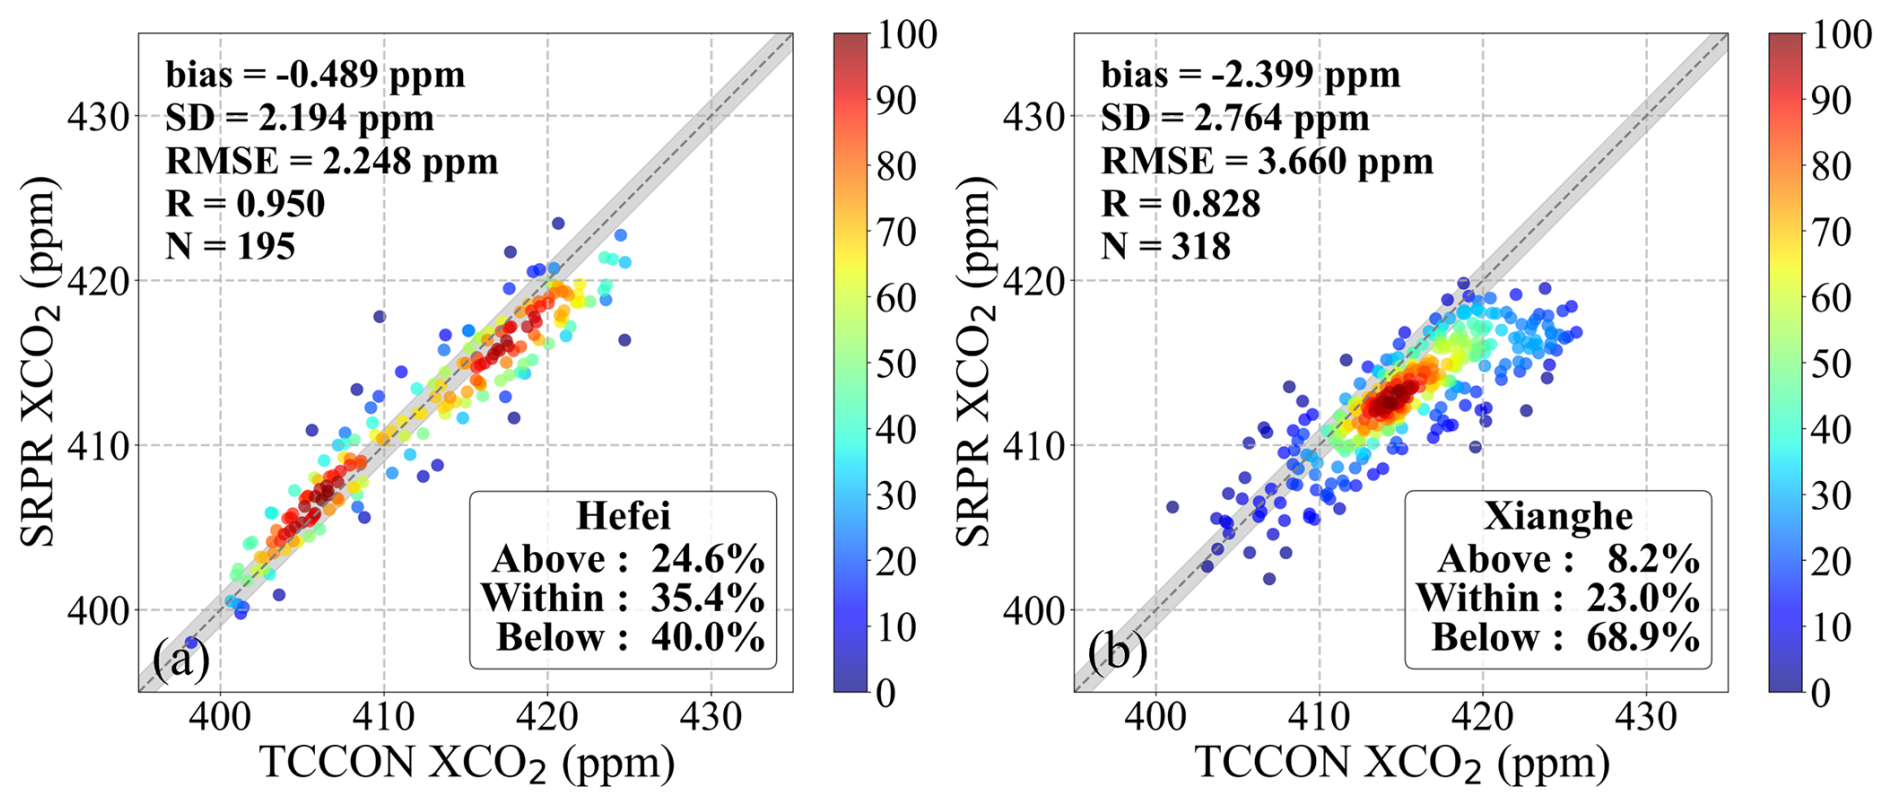
Figure 11As Fig. 5, but for model XCO2 data used in the GOSAT SRPR XCH4 retrieval algorithm, at the Hefei (a) and at the Xianghe (b) sites. The grey shaded area indicates an envelope of ±1 ppm, which is consistent with the GCOS precision requirements for XCO2.
Density scatterplots for the OCPR and GOSAT-2 SRPR XCH4 retrieval algorithms and TCCON reference data in Fig. A5 show somewhat different characteristics which vary across algorithms and by site. Like SRPR, OCPR shows two clusters at the Hefei site and a single cluster at the Xianghe site, with a small overestimation in both cases. The GOSAT-2 SRPR algorithm does not show a clear under- or overestimations (Fig. A5b and d), resulting in a small positive bias at Hefei (0.68 ppm) and a small negative bias at Xianghe (−1.12 ppm). The fractions within the GCOS requirements (54.6 % at Hefei and 36.8 % at Xianghe) are larger than for other data products.
3.3 Validation of ratio
Time series of the ratios determined using the GOSAT SRPR CO2 proxy algorithm are presented in Fig. 12, together with ratios determined from the TCCON observations. Results for GOSAT-2 SRPR (2SRPR) and OCPR products are presented in Fig. A6 (see Appendix A). ratios cannot be directly extracted from the FOCAL proxy product datasets. The time series in Figs. 12 and A6 show a distinct seasonal variation with maxima in summer and autumn and minima in winter and spring, similar to the XCH4 time series in Fig. 3. XCH4 governs the seasonal variation of the ratio time series because the relative amplitudes are much larger for XCH4 than for XCO2. The data in Fig. 12 show that the large uncertainties observed at the Hefei site between 2018 and 2022 are primarily due to the small number of valid Satellite – TCCON matchups, mainly due to the limited availability of TCCON observations within the ±2 h temporal collocation window.

Figure 12As Fig. 4, but for time series of ratios determined using the GOSAT SRPR CO2 proxy algorithm at the Hefei (a) and the Xianghe (b) sites.
It is evident that the ratios used in the SRPR XCO2 proxy algorithm are systematically larger than the ratios derived from the TCCON reference observations. This is also clearly observed in the density scatter plots between the ratios of the retrieval results and the TCCON reference data in Fig. 13. Results for other products are presented in Fig. A7 for both sites separately (see Appendix A). These density scatterplots confirm the substantial and consistent systematic positive biases at both sites, for all three proxy XCH4 products. The bias at the Hefei site (0.066 ppb ppm−1) is somewhat larger than that at the Xianghe site (0.053 ppb ppm−1). Despite the systematic overestimation, the SRPR product shows extremely high correlation with the TCCON reference data (R of 0.911 and 0.918, respectively), and its data fluctuation characteristics are highly synchronized with those of the reference data. Furthermore, the data in Fig. A7 show that the OCPR and GOSAT-2 SRPR algorithms are consistent with GOSAT SRPR in terms of retrieval trends and bias characteristics.
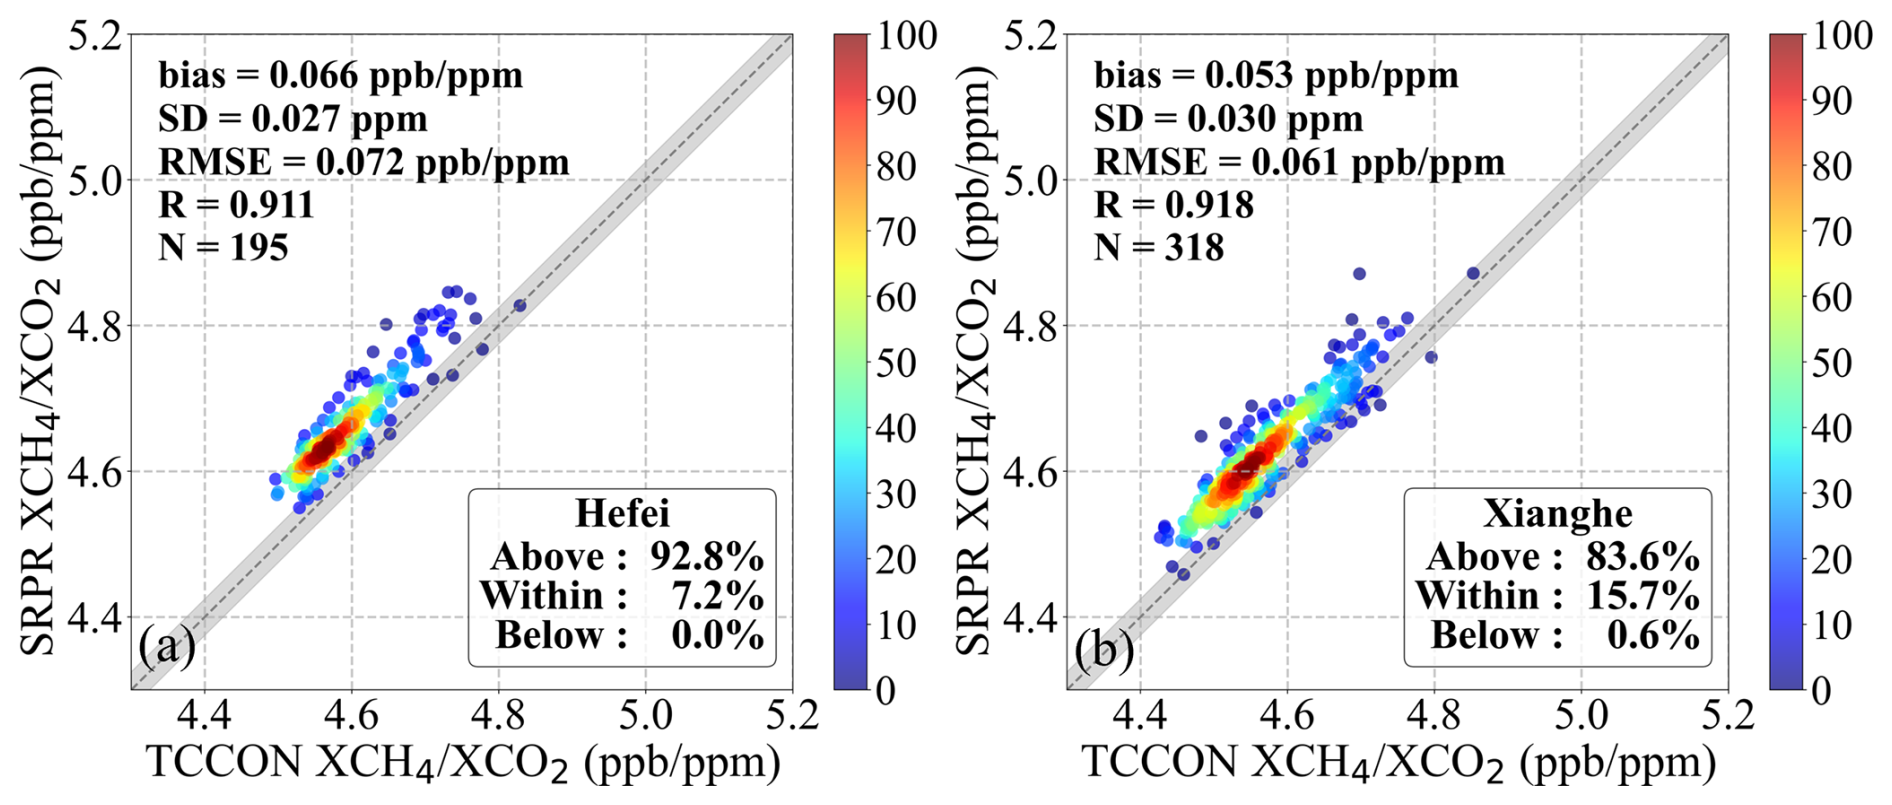
Figure 13As Fig. 5, but for the ratios determined using the GOSAT SRPR algorithm at the Hefei (a) and the Xianghe (b) sites. The grey shaded area represents an envelope of ±0.025 ppb ppm−1, which is derived from the GCOS precision requirements for XCH4 (10 ppb) and XCO2 (1 ppm) through the error propagation formula.
In the analysis of the ratios, all proxy XCH4 products exhibited a pronounced and systematic positive bias across both sites. Consequently, we conducted a separate analysis on the XCH4,raw and XCO2,raw values (referred to hereafter as raw XCH4 and raw XCO2, respectively), the directly retrieved quantities used to form the proxy ratio in Eq. (1); the time series of GOSAT and GOSAT-2 SRPR are presented in Figs. A8 and A9 of Appendix A, while the respective scatterplots are displayed in Figs. A10 and A11. Both GOSAT and GOSAT-2 SRPR raw XCH4 exhibit a slightly positive bias, which is notably more pronounced at the Xianghe site. For the raw XCO2 of the GOSAT SRPR product, a systematic negative bias is observed, which gradually decreases in magnitude as TCCON XCO2 increases. Conversely, GOSAT-2 SRPR exhibits a distinct positive bias that increases with increasing TCCON XCO2. Furthermore, both satellite generations show a stronger seasonality than the TCCON references across both sites, with large uncertainties. These findings indicate that the persistent overestimation observed in the proxy ratios is predominantly governed by the deviations in raw XCH4. Consequently, the fundamental assumption underlying the application of the XCO2 Proxy method – that scattering-induced errors cancel out between the two species – is not fully fulfilled in real-world observations. Hence, empirical post-retrieval corrections based on TCCON observations are indispensable for delivering accurate final products. Additionally, since the raw comparisons reveal a distinct time dependence (as shown in Figs. A8 and A9), the bias corrections must be adjusted and updated regularly.
As described in Sect. 2.2, the proxy method is based on the assumption that effects of surface reflectance and aerosols on the retrieval results are the same for XCH4 and XCO2, when these mixing rations are retrieved using the same instrument at the same time and at close wavelengths and thus, cancel out in the ratio (Barr et al., 2025). The ratio is multiplied with XCO2 obtained from an independent method to determine the actual XCH4. However, as shown from the comparison with the TCCON-derived ratio, there is a substantial bias in the SRPR derived ratios at both the Hefei and Xianghe sites (Sect. 3.3). In this section we investigate whether this bias may be caused by a residual influence of aerosols, after filtering the data by using XCO as a tracer to filter out significant anthropogenic pollution events (ΔXCO<36 ppb) (see Sect. 3). To this end, the bias in the retrieved XCH4 is evaluated by comparison with AOD at 1640 nm, averaged during ±30 min of the satellite overpass. Figure 14 shows the mean bias in XCH4 retrieved using each of the four proxy algorithms as function of AOD, where the bias is averaged in AOD bins with a bin width of 0.1.
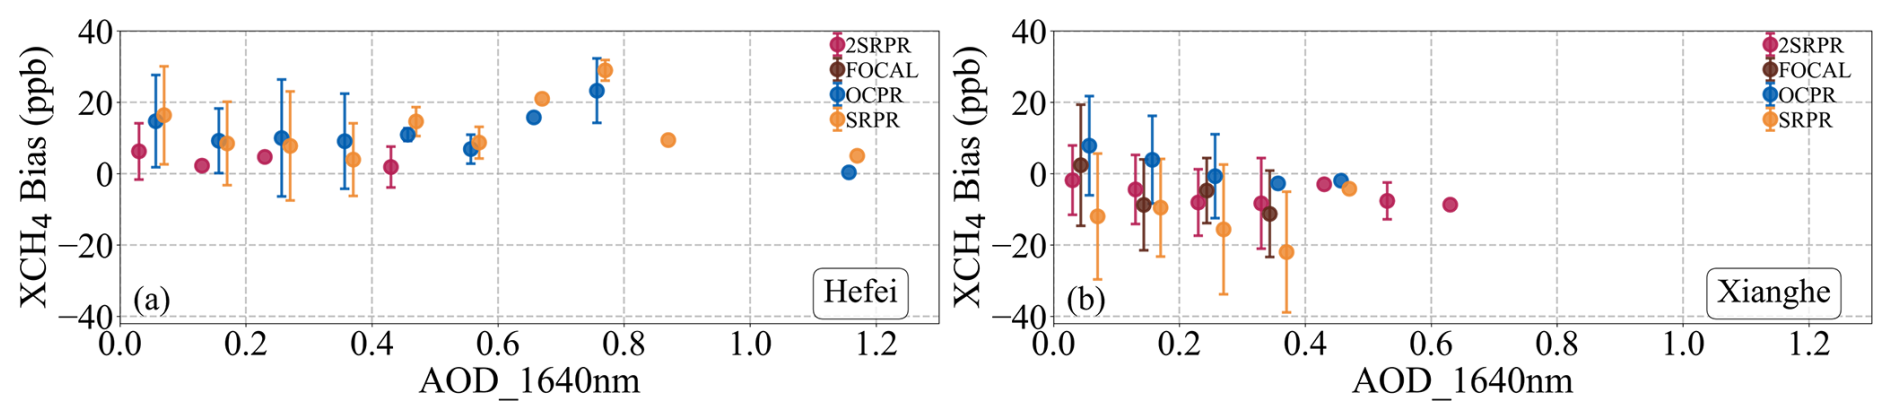
Figure 14Variation of the mean XCH4 bias, as function of AOD at 1640 nm, where the bias is averaged in AOD bins with a bin width of 0.1. Error bars indicate the standard deviation in each bin. The XCH4 bias was determined for each of the four proxy algorithms as indicted in the legend.
The data in Fig. 14 shows the distinct regional differences in bias characteristics relative to AOD between the Hefei and Xianghe sites. At the Hefei site, the mean XCH4bias is positive over the whole AOD range for all four products. For AOD below approximately 0.4, the biases generally remain within about 0–15 ppb and show a slight overall decreasing tendency with increasing AOD. For AOD>0.5, the number of retrieval data points is sparse (mainly single retrieval results in each AOD bin and only for GOSAT OCPR and SRPR) with a monotonously increasing bias; the biases under these high-AOD conditions are predominantly positive, with some values exceeding 20 ppb. At the Xianghe site, all products are predominantly negatively biased, with the biases generally tending to become more negative as AOD increases. The GOSAT OCPR bias is predominantly positive, with the mean bias decreasing from approximately +5 to +10 ppb under low-AOD conditions to values close to zero as AOD increases. GOSAT SRPR shows the most pronounced negative bias, which becomes increasingly negative with increasing AOD and decreases to below −20 ppb at an AOD of approximately 0.4. GOSAT-2 SRPR exhibits relatively small biases, with values close to zero at low AOD and decreasing slightly to approximately −5 to −10 ppb as AOD increases; at AOD>0.4, the negative bias becomes smaller again and shifts toward zero. GOSAT FOCAL proxy is also predominantly negatively biased and, despite some fluctuations, shows an overall tendency toward more negative values with increasing AOD. When AOD exceeds 0.3, the scarcity of valid observation samples leads to a scattered data distribution, making the analysis in high-aerosol environments highly susceptible to individual outliers. Notably, the biases for these high-AOD situations are consistently positive at the Hefei site, whereas at the Xianghe site they are negative.
5.1 Time Series Analysis of Bias
Time series of relative bias (defined below, Eq. 11) for XCH4, model XCO2, and the ratio at the Xianghe site are presented in Fig. 15 and for the Hefei site they are presented in Fig. A12 (Appendix A). The relative XCH4 bias is defined by Eq. (11):
where Xproxy and XTCCON represent the XCH4 values retrieved from the satellite and the TCCON ground-based observations, respectively. The relative bias provides a normalized metric to assess the percentage deviation of satellite retrievals from the ground-based benchmark and is used here to facilitate a comparison between the three data products used in the XCH4 proxy algorithm (Eq. 1). To elucidate the origins of the retrieval errors, the contributions of different components to the results from each algorithm are quantitatively assessed using linear decomposition. Using Eq. (1), the impact of each component on the final retrieval accuracy can be quantitatively assessed through the linear decomposition of relative biases:
where δX represents the relative bias of X. Higher-order terms are neglected here.

Figure 15Time series of the relative bias for GOSAT OCPR (a), GOSAT SRPR (b), GOSAT-2 SRPR (c) at the Xianghe site. Relative bias is calculated using Eq. (11).
For the GOSAT OCPR product (Fig. 15a), the ratio bias generally fluctuates around zero, whereas the model XCO2 bias becomes predominantly positive after approximately 2020. During the same period, the final XCH4 bias is also mainly positive. The short-term variations in XCH4 generally resemble those of the ratio bias, while the model XCO2 bias varies more smoothly.
For the GOSAT SRPR algorithms (Fig. 15b), the model XCO2 bias is generally negative, whereas the ratio bias remains positive during most of the time series. Between 2018 and 2022, the two components have opposite signs and partially compensate for each other, resulting in a final XCH4 bias that remains close to zero. From late 2022 onward, the negative model XCO2 bias increases markedly, reaching approximately −1.0 % to −1.5 %, while the ratio bias remains positive but smaller in magnitude. Consequently, the final XCH4 bias also becomes markedly negative during this period. This pronounced decrease is attributed to the limited temporal availability of the model data.
For GOSAT-2 SRPR (Fig. 15c), the biases of both components are generally smaller in magnitude than those of GOSAT SRPR. The model XCO2 bias is mainly negative, whereas the ratio bias is generally close to zero or moderately positive. During 2021–2022, the biases of both components are relatively small, and the final XCH4 bias are therefore also close to zero. In 2023, the negative model XCO2 bias increases, accompanied by a negative bias in the final XCH4. Around 2024, the positive ratio bias increases, while the magnitude of the negative final XCH4 bias decreases. Toward the end of the time series, all three relative biases gradually approach zero.
Overall, the comparison shows that the negative bias at the Xianghe site around 2023 is mainly associated with the substantially negative bias in model XCO2 during the same period. Overall, the final Proxy XCH4 bias is related not only to the magnitudes of the biases in the retrieved ratio and model XCO2, but also to whether the two components compensate or reinforce each other. A small final bias may therefore arise either from small biases in both components or from cancellation between biases of opposite signs.
5.2 Spatial Analysis of Bias
As analyzed in Sect. 3.1, extending the spatial domain to a broader ±5° spatial extent introduces substantial spatial variation, and therefore we adopted a ±2.5° spatial extent. While Table 3 provides the mean bias averaged over the ±2.5° validation area, spatial variability may still persist inside this spatial extent. Therefore, the influence of this localized spatial variation within the selected spatial extent on the overall comparison results was evaluated. To this end, the study area was partitioned into 0.1°×0.1° latitude-longitude grids. Individual residuals, obtained by subtracting the corresponding TCCON measurements from each matched satellite observation, were projected into the grid cells based on their geographic coordinates. To eliminate random noise from individual observations and represent the overall bias level of the region, the median value of all matched data point residuals within a single grid cell was calculated as the representative value for that grid cell. These values were then plotted using a color scale representing the XCH4 bias. The spatial distributions of the biases for the four XCH4 products at the Xianghe site are presented in Fig. 16, and for the Hefei site in Fig. A13 (Appendix A).
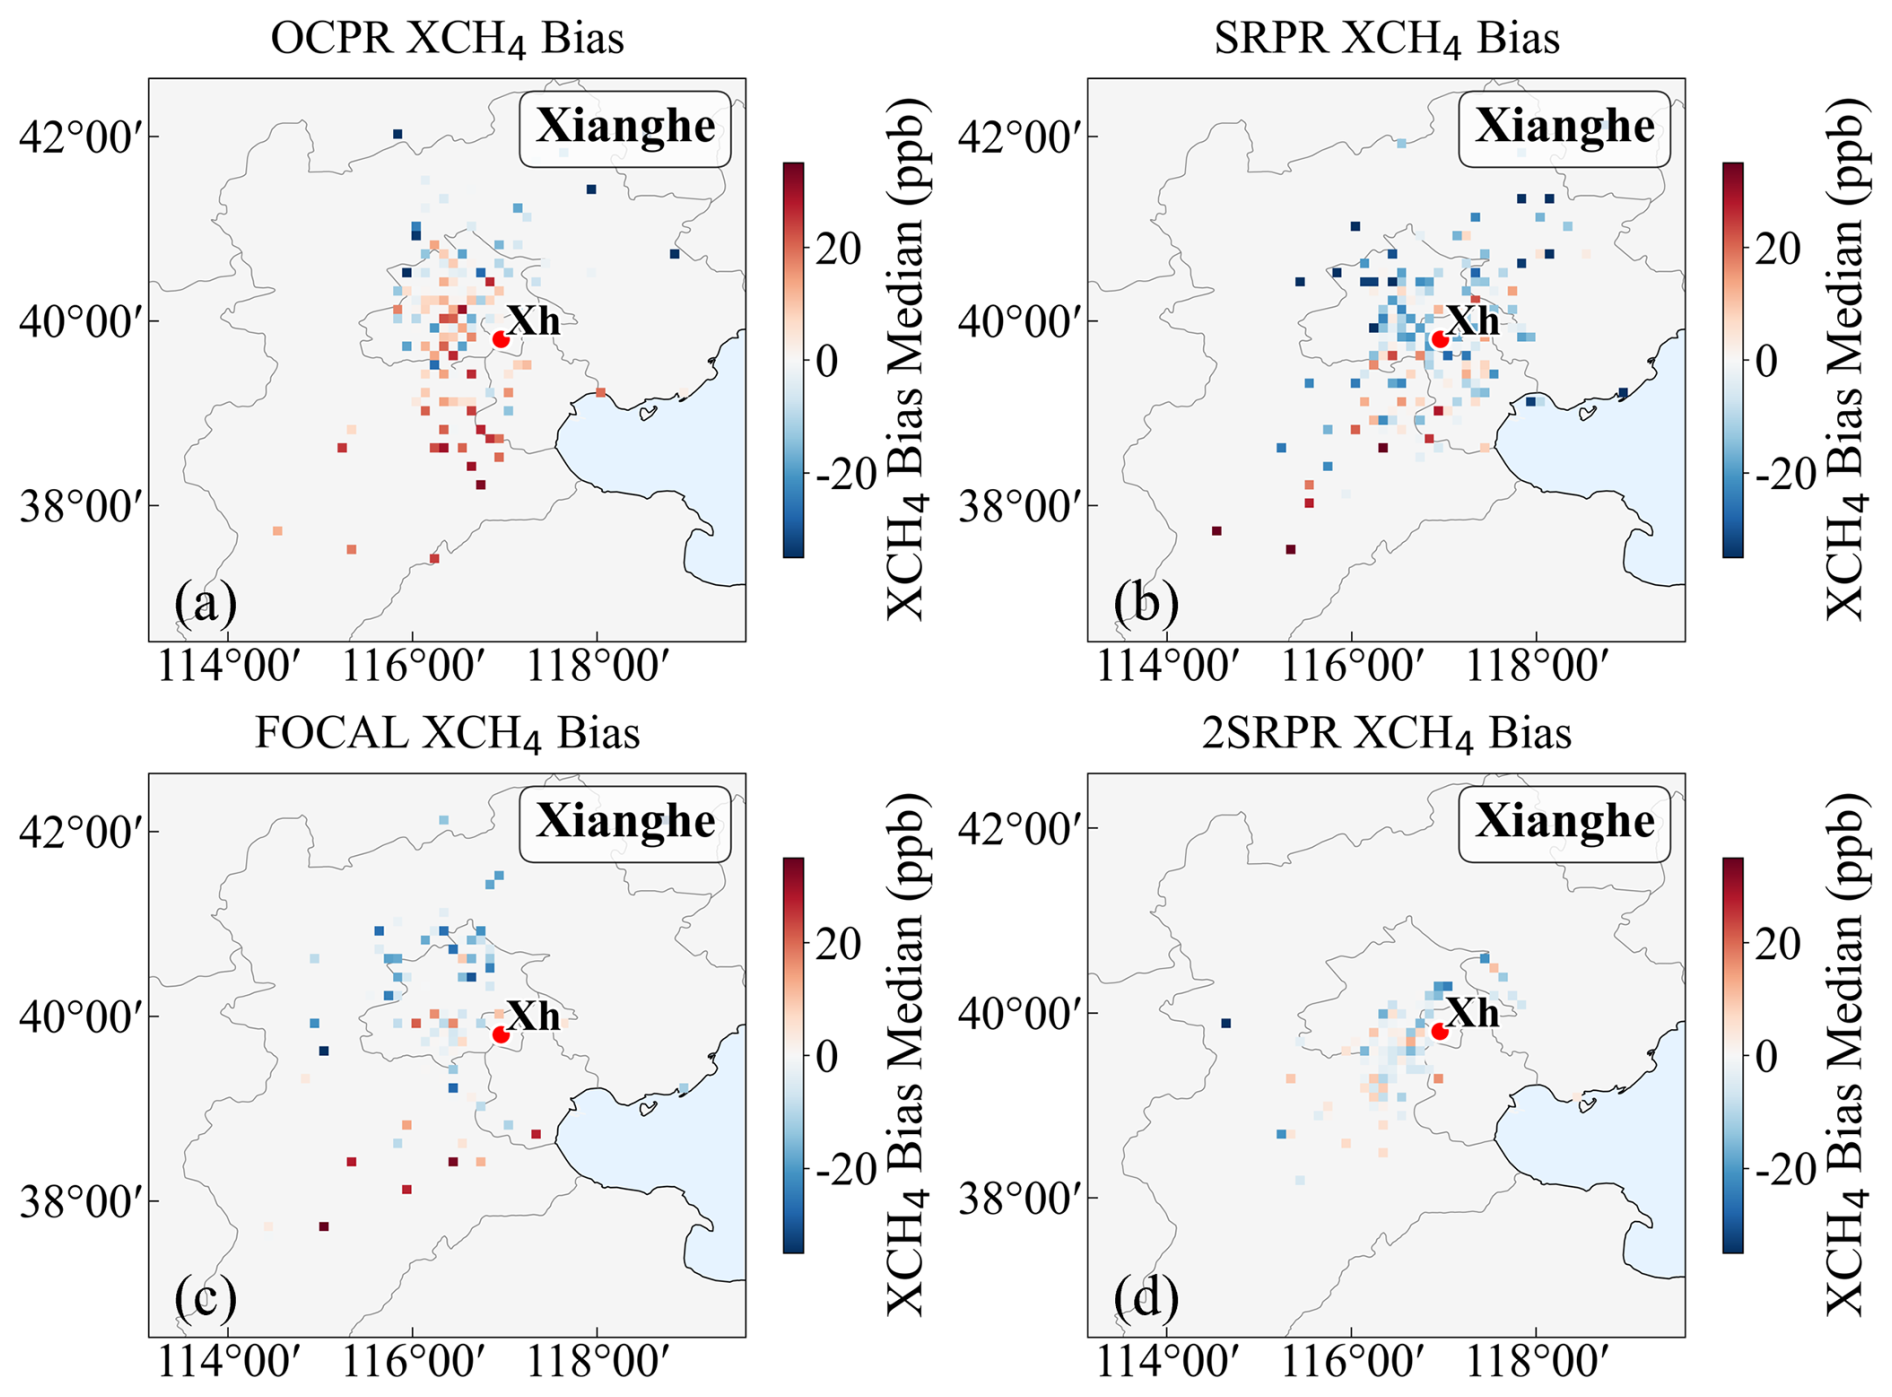
Figure 16Spatial variation of the median XCH4 biases (see text for explanation) around the Xianghe site on a 0.1° by 0.1° latitude-longitude grid.
The data in Fig. 16a shows the occurrence of the largest positive biases for the OCPR XCH4 product around the Xianghe site and especially to the south, with median values ranging between +10 and +30 ppb. While Table 3 provides an overall mean bias of 6.3 ppb for the validation area, Fig. 16a demonstrates that this single statistical value masks significant intra-region variability. Specifically, the strong overestimation over the southern regions is partially offset by the negative biases distributed across the northern parts of the domain. The GOSAT SRPR XCH4 bias is generally negative near the site but transitions to overestimation in the southern region. The GOSAT-2 SRPR XCH4 product around Xianghe is distributed over a closer range to the TCCON site, with an overall negative bias. The data coverage of the GOSAT FOCAL Proxy XCH4 product is sparse and generally shows a negative bias to the northwest of the site, while to the southwest the biases are mostly positive. The distinct spatial heterogeneities and the shift toward positive biases observed in the southern areas across these products are likely due to the strong spatial gradients of XCH4. Compared with the other products, OCPR may include more observations over urban or potentially methane-enhanced areas to the south of the Xianghe site, where satellite footprints may capture higher XCH4 concentrations than those measured at the TCCON site, contributing to its extensive positive biases. This spatial discrepancy primarily reflects the inherent representation errors between the localized TCCON point measurements and the larger footprints of satellite observations within the matching domain. Notably, the spatial consistency of the GOSAT-2 product is significantly improved compared to the other GOSAT products. As detailed in Sect. 2.3.2, the GOSAT-2 b parameter (0.00158) is smaller, which minimizes the influence of surface albedo variations on XCH4 retrieval results.
Similar plots of the spatial variation of the biases at the Hefei site are presented in Fig. A13. These data show that positive biases dominate in the inland areas to the west of the site, whereas slightly negative biases are found in the coastal regions to the northeast.
Statistical analysis in Sect. 3.1 reveals a significant systematic discrepancy in XCH4 retrieval biases between the two sites: a prevalent overestimation at the Hefei site and a general underestimation at the Xianghe site (with the exception of OCPR). Given its proximity to anthropogenic emission sources in the North China Plain, the TCCON measurements at Xianghe likely exceed the regional background levels captured by satellite sampling (Yang et al., 2020), leading to a negative offset. At the Hefei site, the satellite tracks primarily pass over the western inland areas, where methane concentrations are relatively high (Fig. 2). Due to this geographic offset, satellite observations capture the higher concentrations to the west rather than matching the local TCCON reference levels, leading to an overestimation.
These spatial differences indicate that regional and local methane emissions may affect the representativeness of satellite–TCCON comparisons at both sites. As the satellite observations used in this study were not acquired in target mode over Hefei and Xianghe (Suto et al., 2021), the ±2.5° matching domain includes measurements from different locations that may be influenced by different emission and transport conditions. The uneven distribution of anthropogenic methane emissions produces spatial variations in atmospheric CH4 concentrations, particularly in urban and emission-intensive regions of northern China (Han et al., 2025). Methane emitted from urban and other emission-intensive areas can be transported and dispersed by atmospheric processes, with variations in wind fields, vertical atmospheric motions, and terrain influencing the spatial distribution of methane enhancements (Gao et al., 2026; Zheng et al., 2026). These processes may contribute to spatial differences in XCH4 between satellite footprints and TCCON observations.
Four Proxy XCH4 satellite retrieval products (GOSAT OCPR, SRPR, FOCAL Proxy, and GOSAT-2 SRPR) were evaluated using ground-based observation data from the TCCON sites in Hefei and Xianghe, China. All products effectively capture the long-term increase of XCH4 in China and the distinct seasonal cycles (maxima in summer/autumn and minima in spring/winter). Spatially, they consistently capture the distinct south-to-north and east-to-west variations, showing a prominent “high in the southeast and low in the northwest” pattern.
In terms of site-specific validation, the performance of the GOSAT products (OCPR, SRPR, FOCAL Proxy) is better at Xianghe, whereas the GOSAT-2 SRPR product exhibits comparable performance across both sites. GOSAT OCPR shows the most severe systematic overestimation at the Hefei site. GOSAT SRPR exhibits opposite bias signs at the two sites. Although the GOSAT FOCAL Proxy performs relatively well in the low-to-medium concentration range (>50 % meeting GCOS requirements at both sites), it is constrained by a limited sample size, leading to larger error bars at high concentrations. Within the common validation period, GOSAT-2 SRPR shows the lowest RMSE and the highest correlation at both sites, with 75.6 % and 69.9 % of the data within the GCOS target range. Expanding the spatial matching range affects the quantitative validation metrics because of increased spatial representativeness differences, but the overall relative performance of the products remains broadly consistent.
Component decomposition shows that the final Proxy XCH4 bias results from the combined effects of biases in the retrieved ratio and the XCO2 model. A small final XCH4 bias may arise from compensation between component biases of opposite signs. Therefore, product performance depends not only on the magnitude of the bias in each individual component, but also on the temporal stability of the error balance between the two components. Analysis of raw constituents indicates that the ratio overestimation is primarily driven by the positive bias in raw XCH4, while raw XCO2 exhibits systematic biases (negative for GOSAT, decreasing with concentration; positive for GOSAT-2, increasing with concentration). This demonstrates that the proxy method's error-cancellation assumption is not fully met, necessitating experimental post-retrieval corrections. The spatial analysis further indicates that these discrepancies are also driven by the spatial inconsistency between satellite and ground-based measurements. At the Hefei site, the satellite tracks pass over areas with high methane concentrations to the west of the site, leading to the occurrence of positive bias. At the Xianghe site, TCCON point measurements are significantly higher than the regional background captured by satellite footprints, leading to a systematic underestimation. The data presented indicate that the two TCCON sites in China are affected by local and regional emission sources which, together with variations in horizontal and vertical transport, result in inhomogeneous distributions of XCH4 which in turn affect the representativeness of satellite–TCCON comparisons.
The influence of aerosols on the retrieval results should be eliminated by using the CO2 Proxy method. However, the evaluation of the influence of AOD (at 1640 nm) shows the occurrence of an AOD-dependent bias at both sites, but with distinctly different effects. At the Hefei site, the XCH4 biases are predominantly positive and decrease slightly with increasing AOD at 1640 nm below 0.4. At the Xianghe site, OCPR remains positively biased but approaches zero as AOD increases, whereas the other products show negative biases that generally become more pronounced with increasing AOD. Furthermore, the GOSAT-2 SRPR products show high stability under low aerosol concentrations at both sites.
Overall, GOSAT-2 SRPR provides the highest accuracy and correlation under stringent spatial matching conditions, within the validation conditions examined in this study, indicating its potential for refined regional methane monitoring in China. GOSAT OCPR exhibits a notable systematic positive offset, it effectively captures consistent spatiotemporal trends and can serve as a reference for long-term dynamic analysis. However, in practical applications, the limitations of this method must be fully considered. The core assumption of the XCO2 Proxy method – namely, that scattering-induced errors are eliminated when simultaneous measurements are used with the same sensor – is not fully met. The persistent overestimation in proxy ratios is predominantly driven by the positive bias in raw XCH4. Furthermore, the evaluation of AOD effects reveals significant, site-specific residual biases, directly demonstrating that the method's ability to eliminate aerosol-induced errors is limited. Therefore, empirical corrections are essential and must be regularly updated to account for the distinct temporal variations observed in the raw biases. It should also be noted that the present validation is limited to the Hefei and Xianghe TCCON sites. Although the two sites represent different atmospheric conditions, they cannot fully characterize the performance of satellite products across China. The site-dependent biases identified in this study indicate that satellite XCH4 products may exhibit regionally varying performance. Therefore, broader multi-site validation and region-specific bias correction are needed to further improve satellite-based methane monitoring in China. In addition, regional and local methane emissions introduce spatial representativeness uncertainties into satellite–TCCON comparisons. Methane enhancements are influenced by three-dimensional atmospheric transport, while cloud and aerosol conditions can affect the availability of valid satellite retrievals, resulting in uneven spatial sampling. These effects cannot be fully accounted for by simple filtering based on surface wind direction and speed. Future validation studies should therefore consider the combined influence of atmospheric transport, emission-related concentration gradients, and observation sampling to better distinguish spatial representativeness errors from satellite retrieval biases. Since the accuracy of Proxy products is inherently constrained by the XCO2 model accuracy, future applications should prioritize differential bias correction schemes across different climate zones and improve the spatiotemporal resolution and local emission representation of models in high-emission regions, thereby providing more reliable data support for refined methane monitoring in China.
Appendix A provides figures supplementary to those in the main text, offering a comprehensive evaluation of the retrieval performance for the four products across both site environments while limiting the number of similar figures.
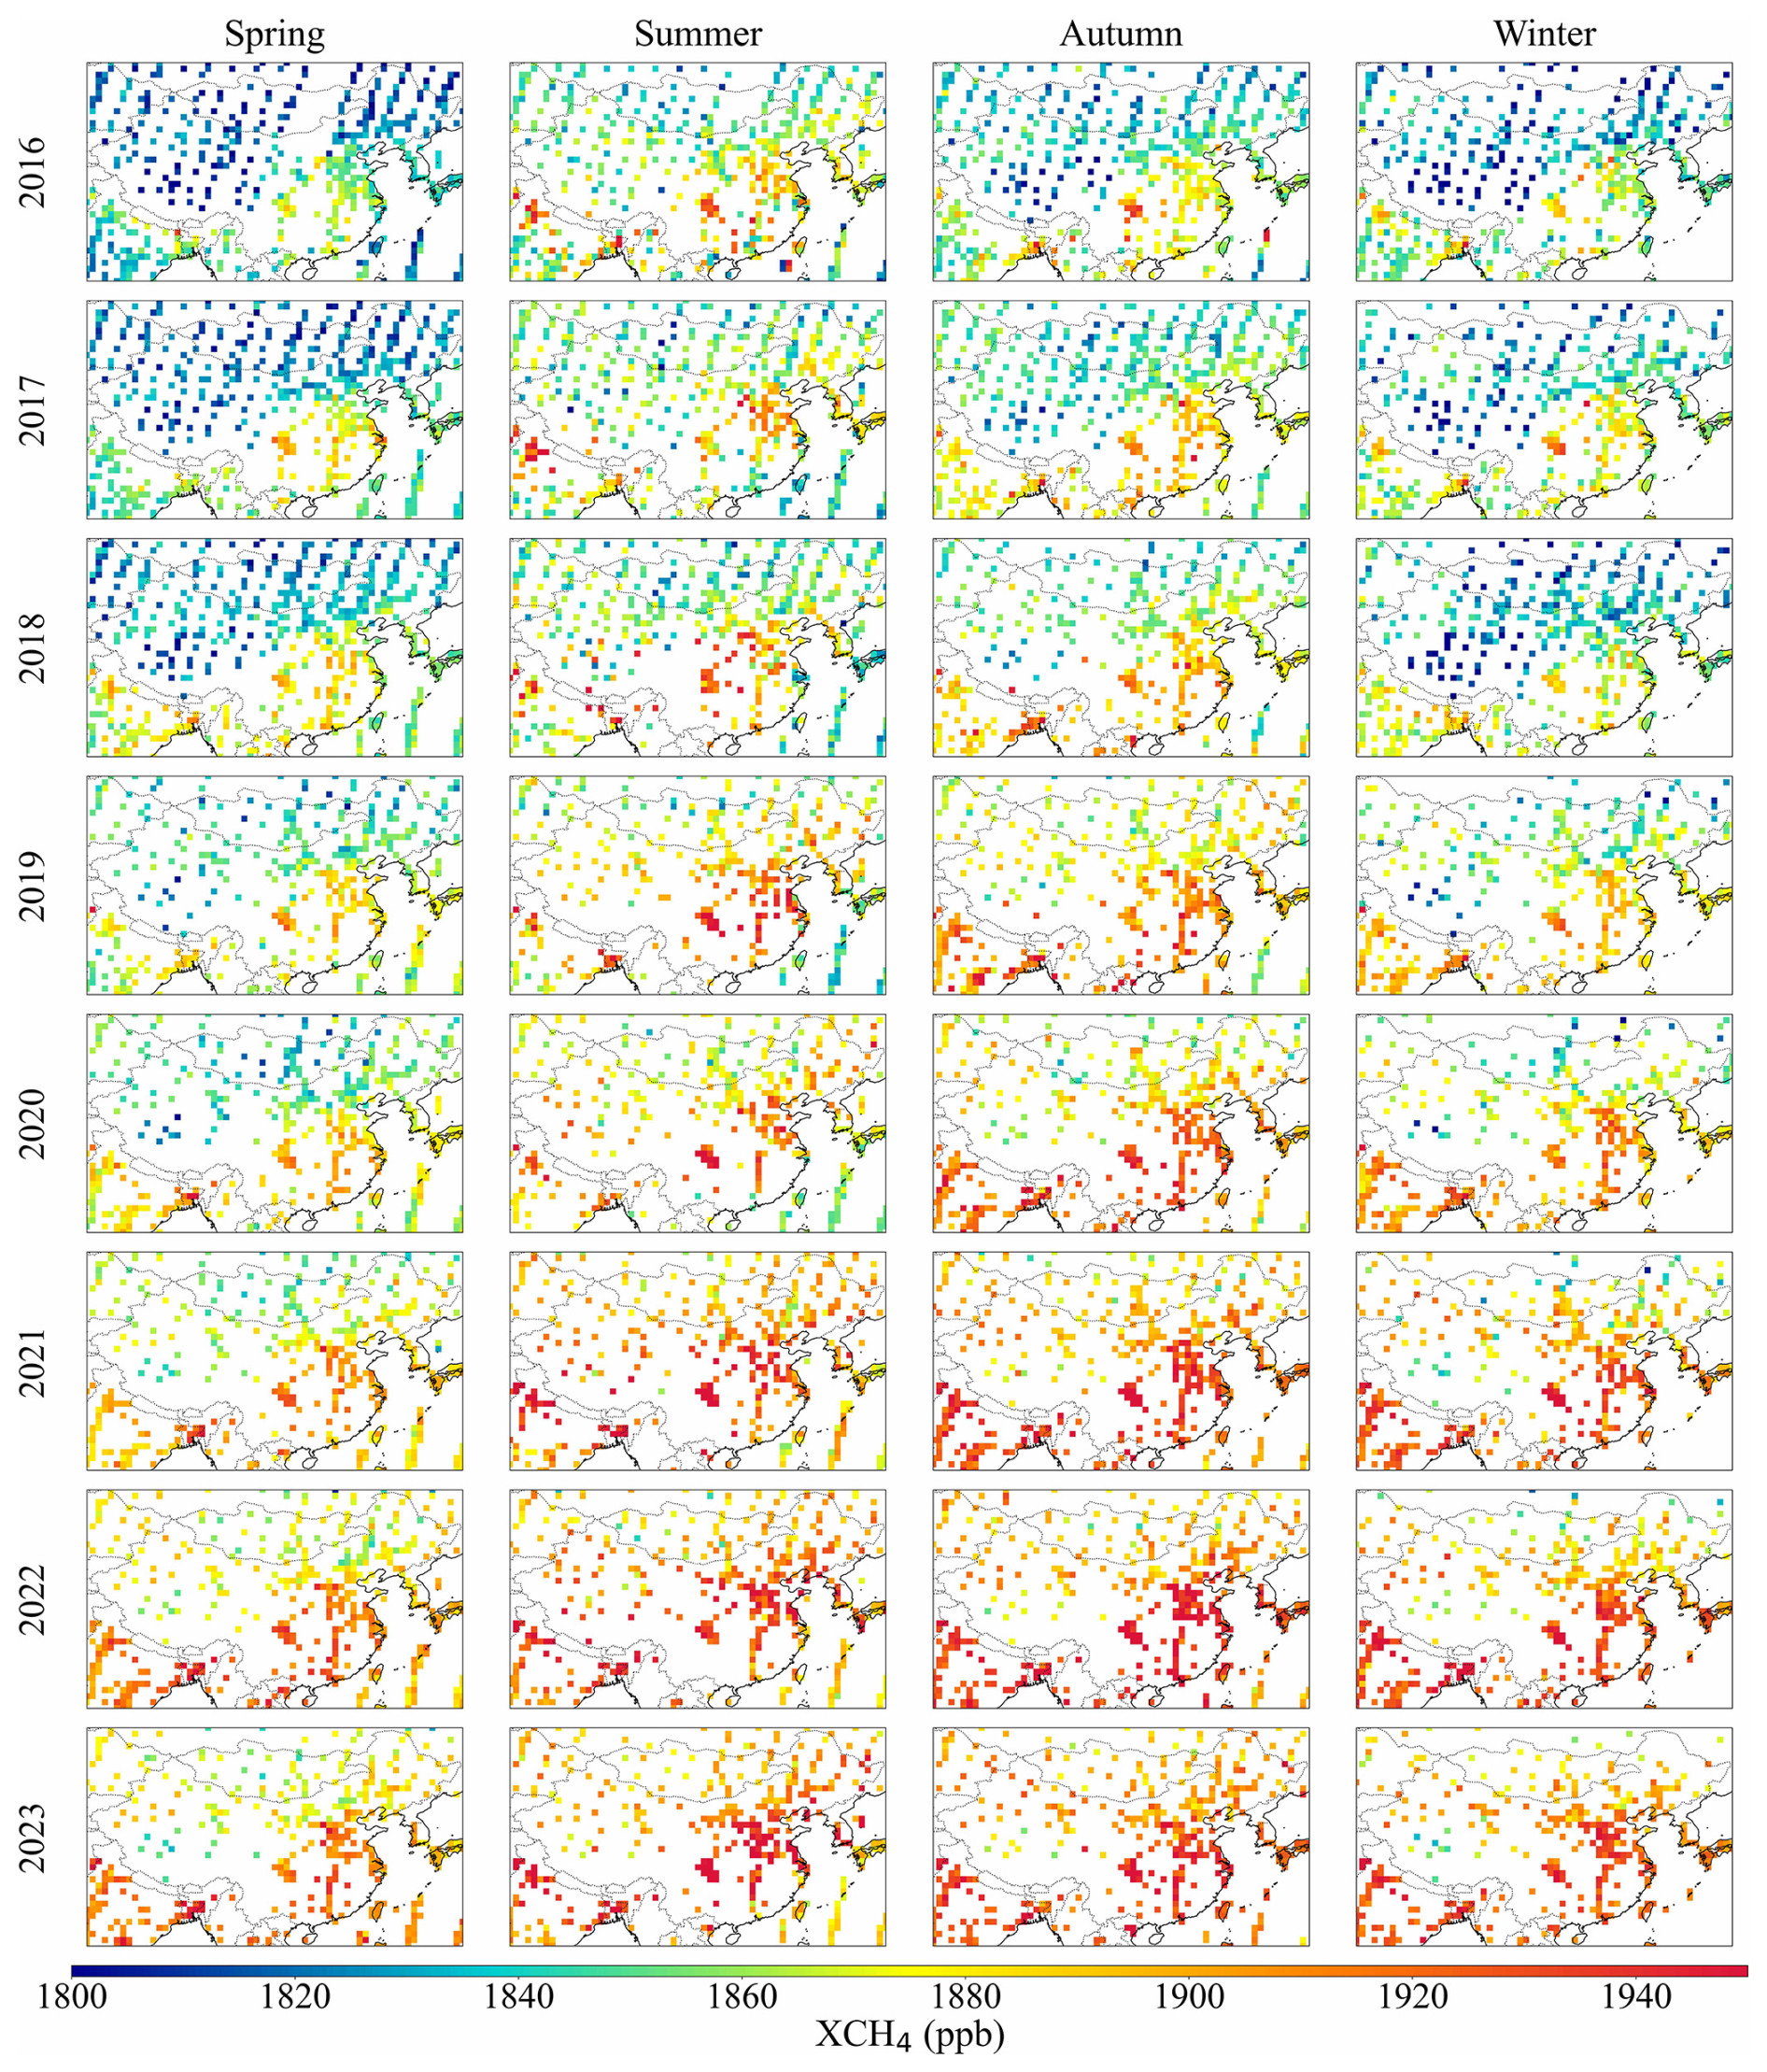
Figure A1Maps of seasonal mean GOSAT SRPR XCH4 for the years 2016–2023.
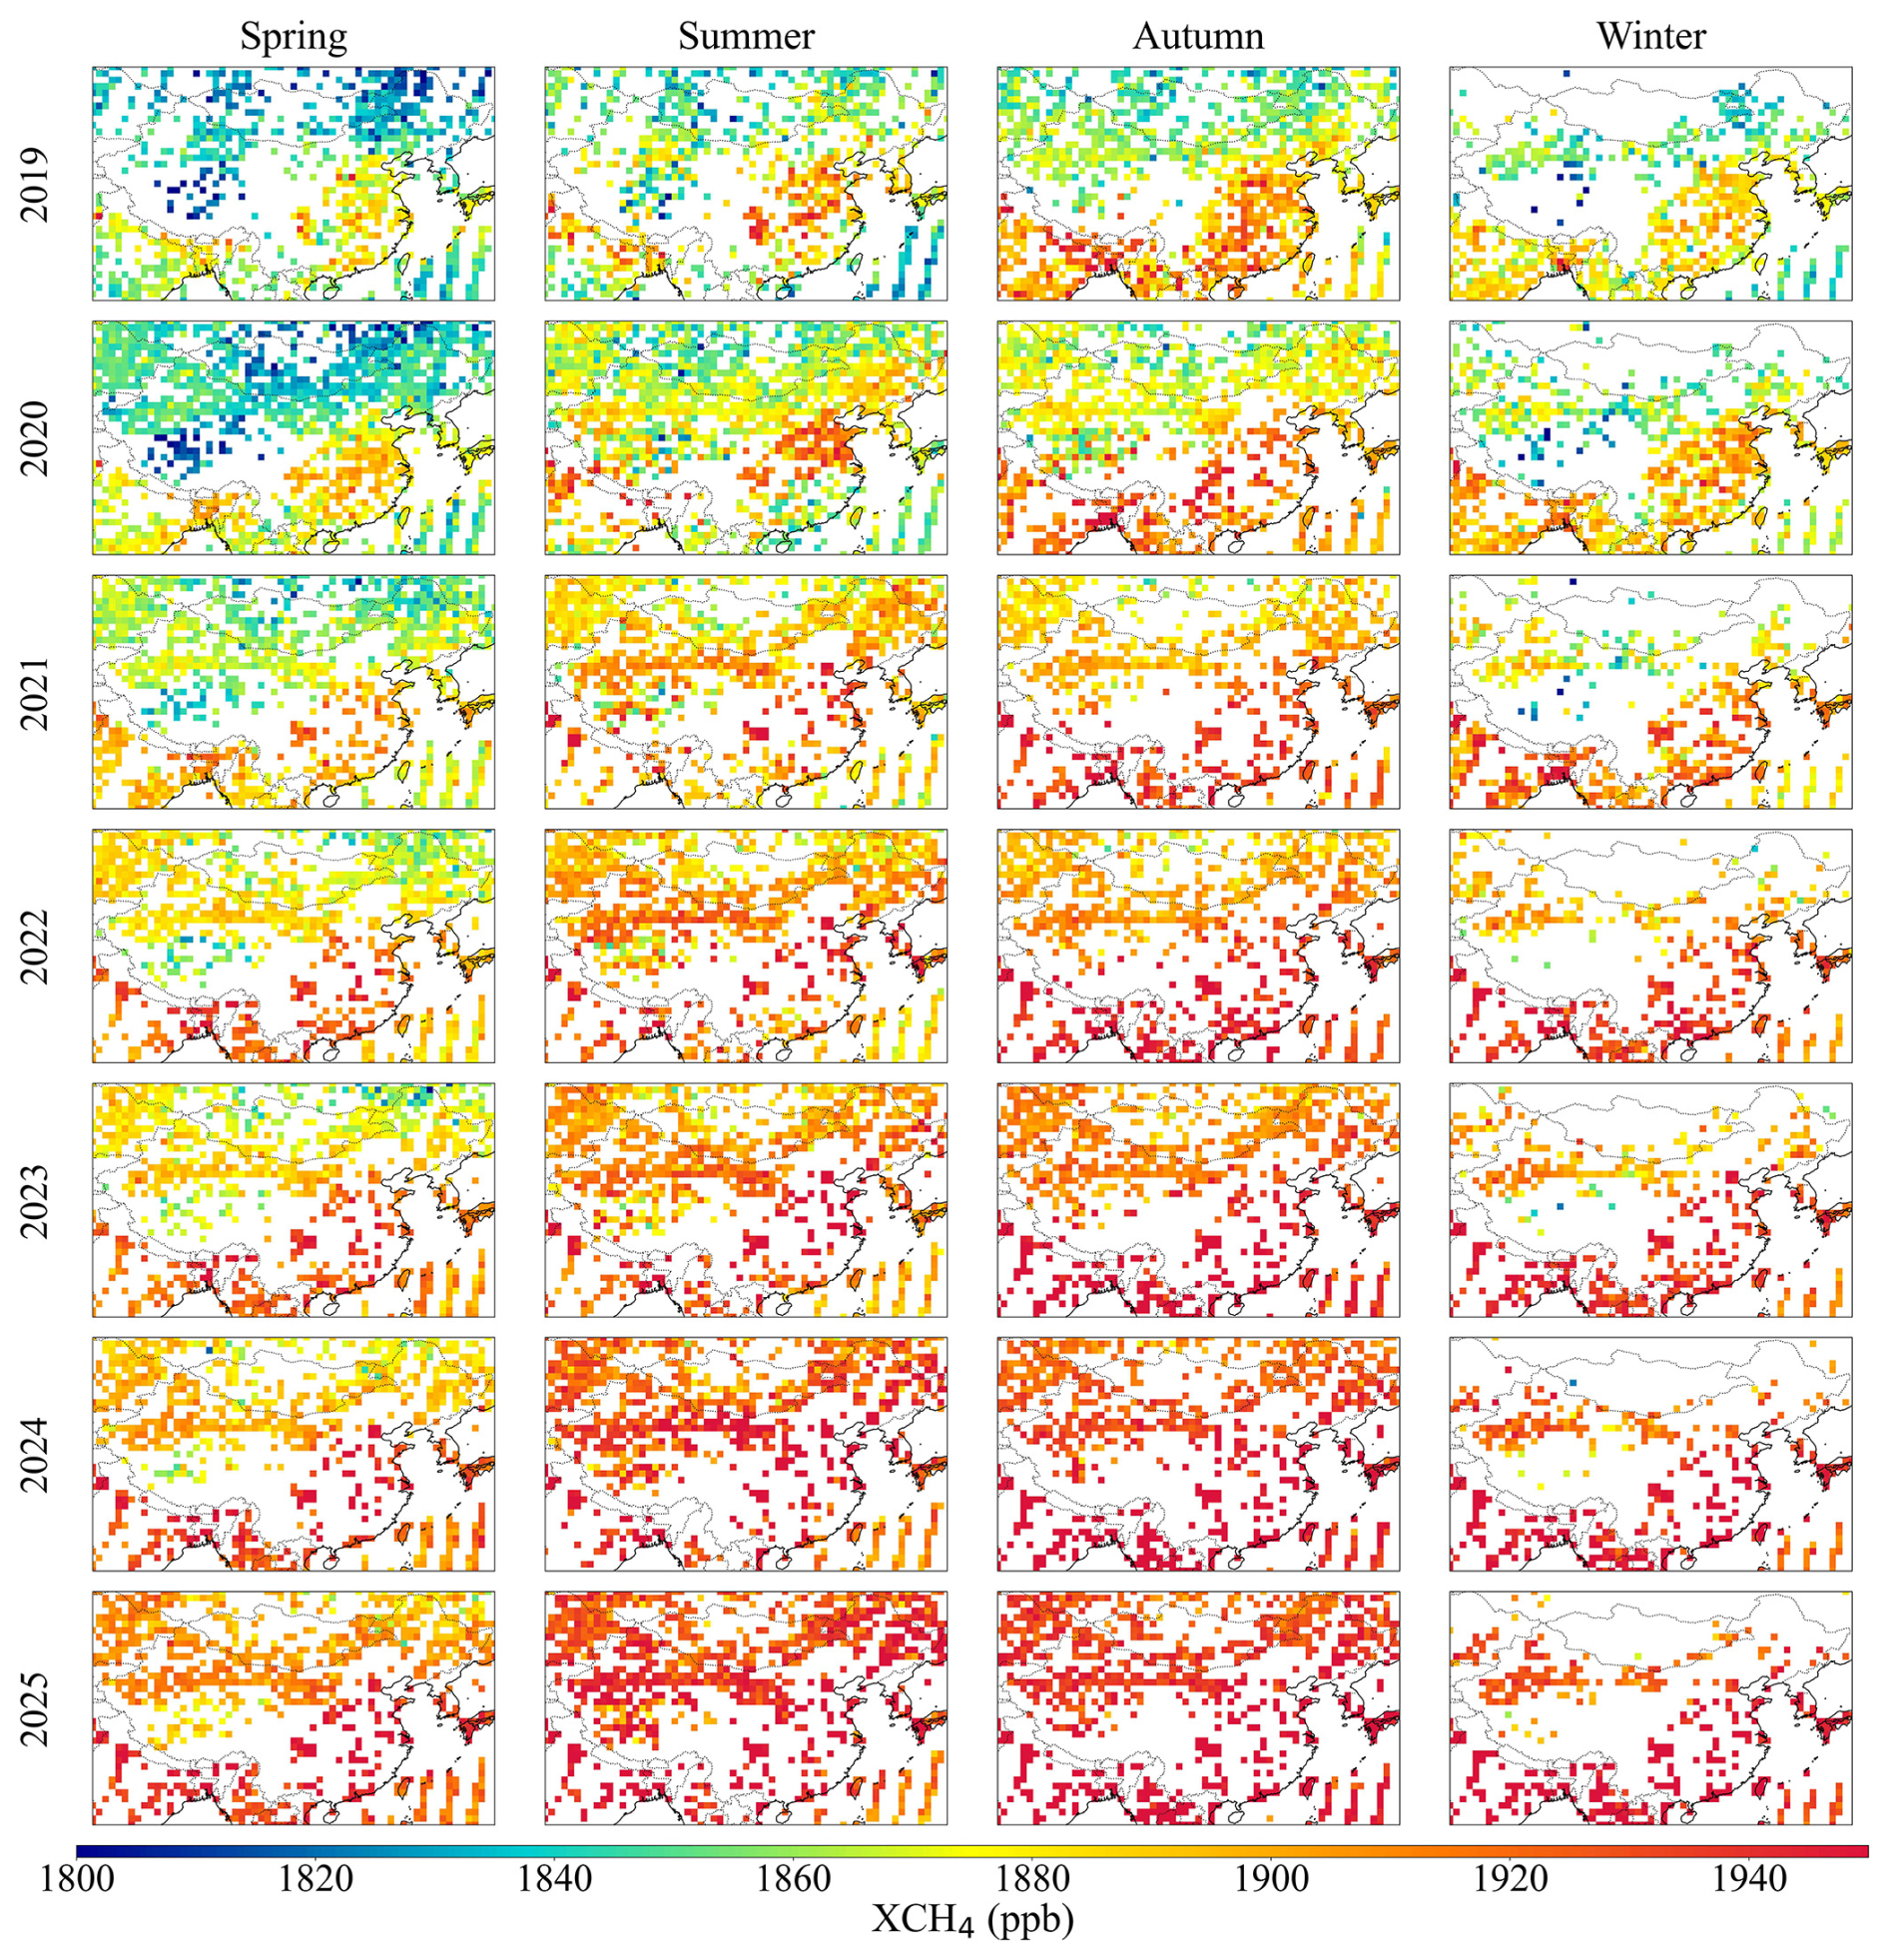
Figure A2Maps of seasonal mean GOSAT-2 SRPR XCH4 for the years 2019–2025.
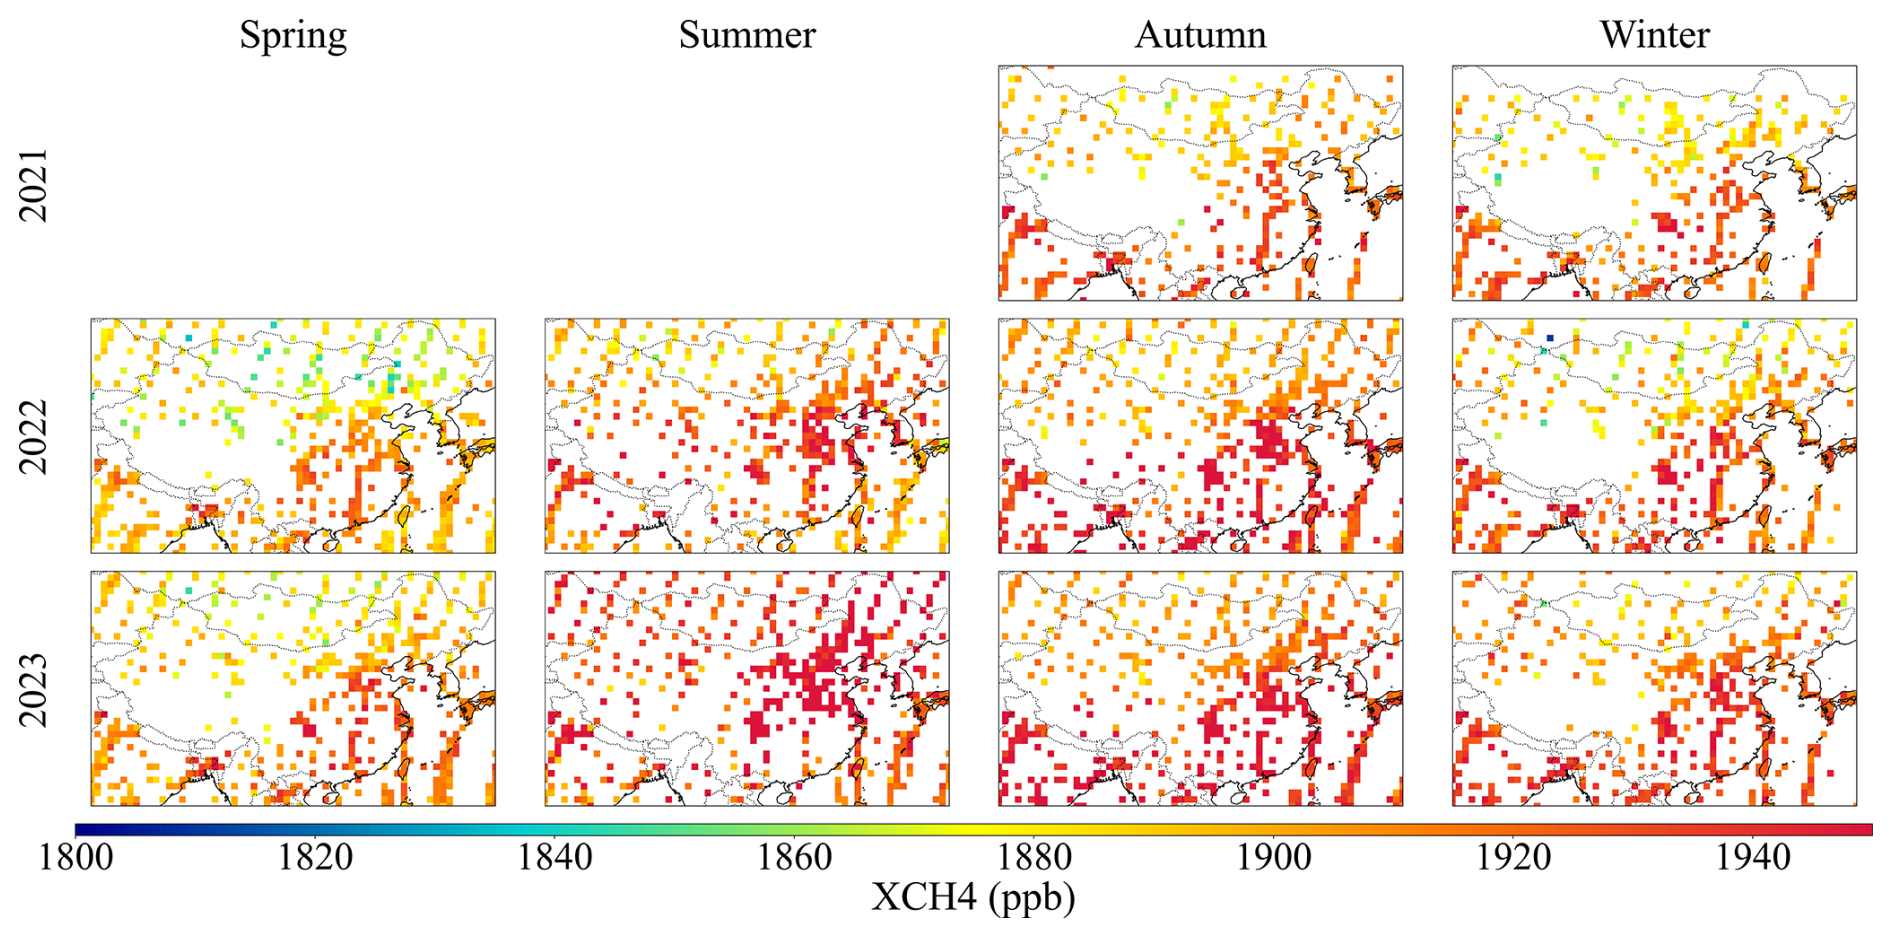
Figure A3Maps of seasonal mean GOSAT FOCAL Proxy XCH4 for the years 2021–2023.
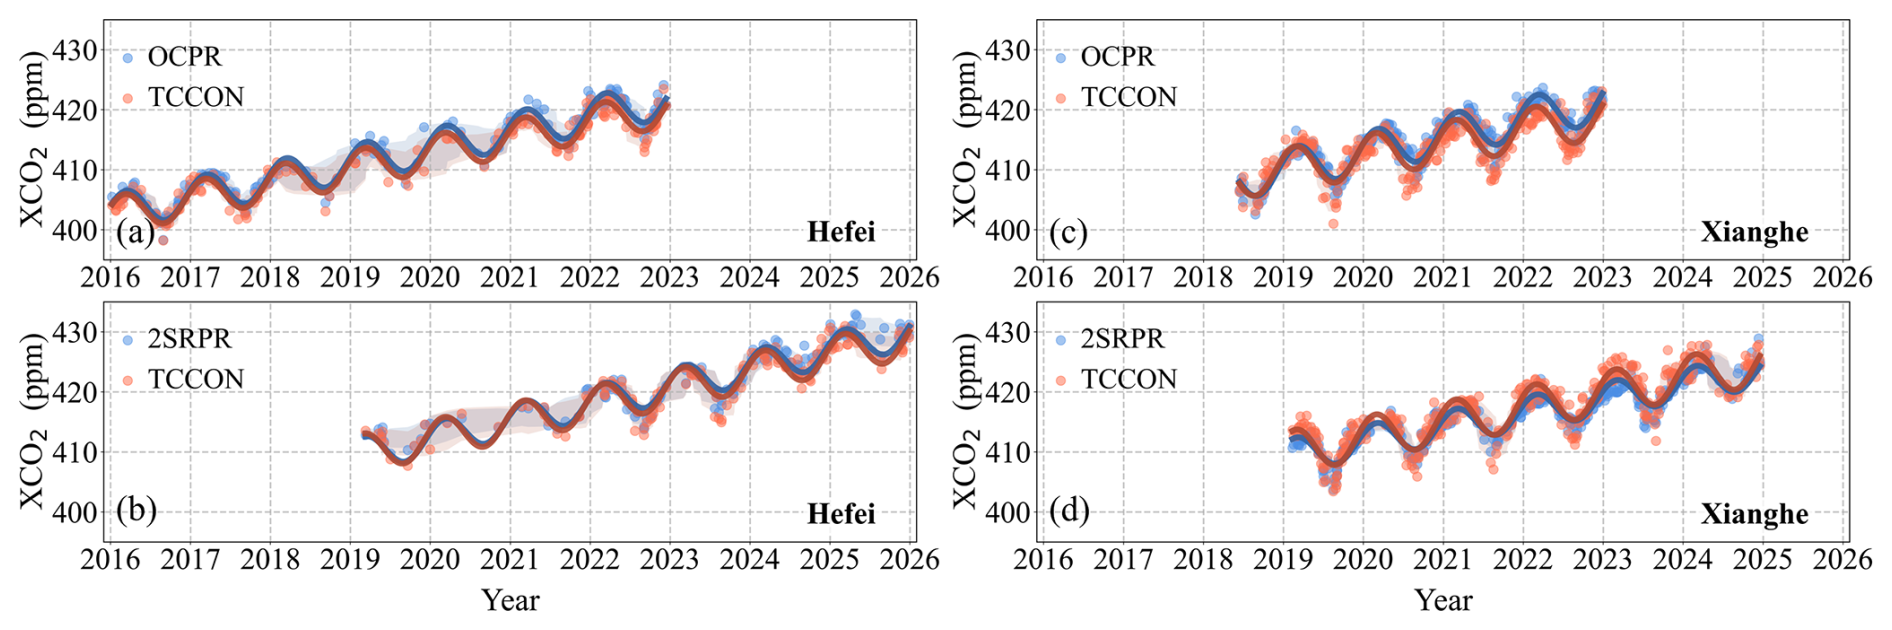
Figure A4As Fig. 4, but for model XCO2 data used in GOSAT OCPR and GOSAT-2 SRPR XCH4 retrieval algorithms (see text), compared with TCCON data over Hefei (a, b) and Xianghe (c, d) sites.
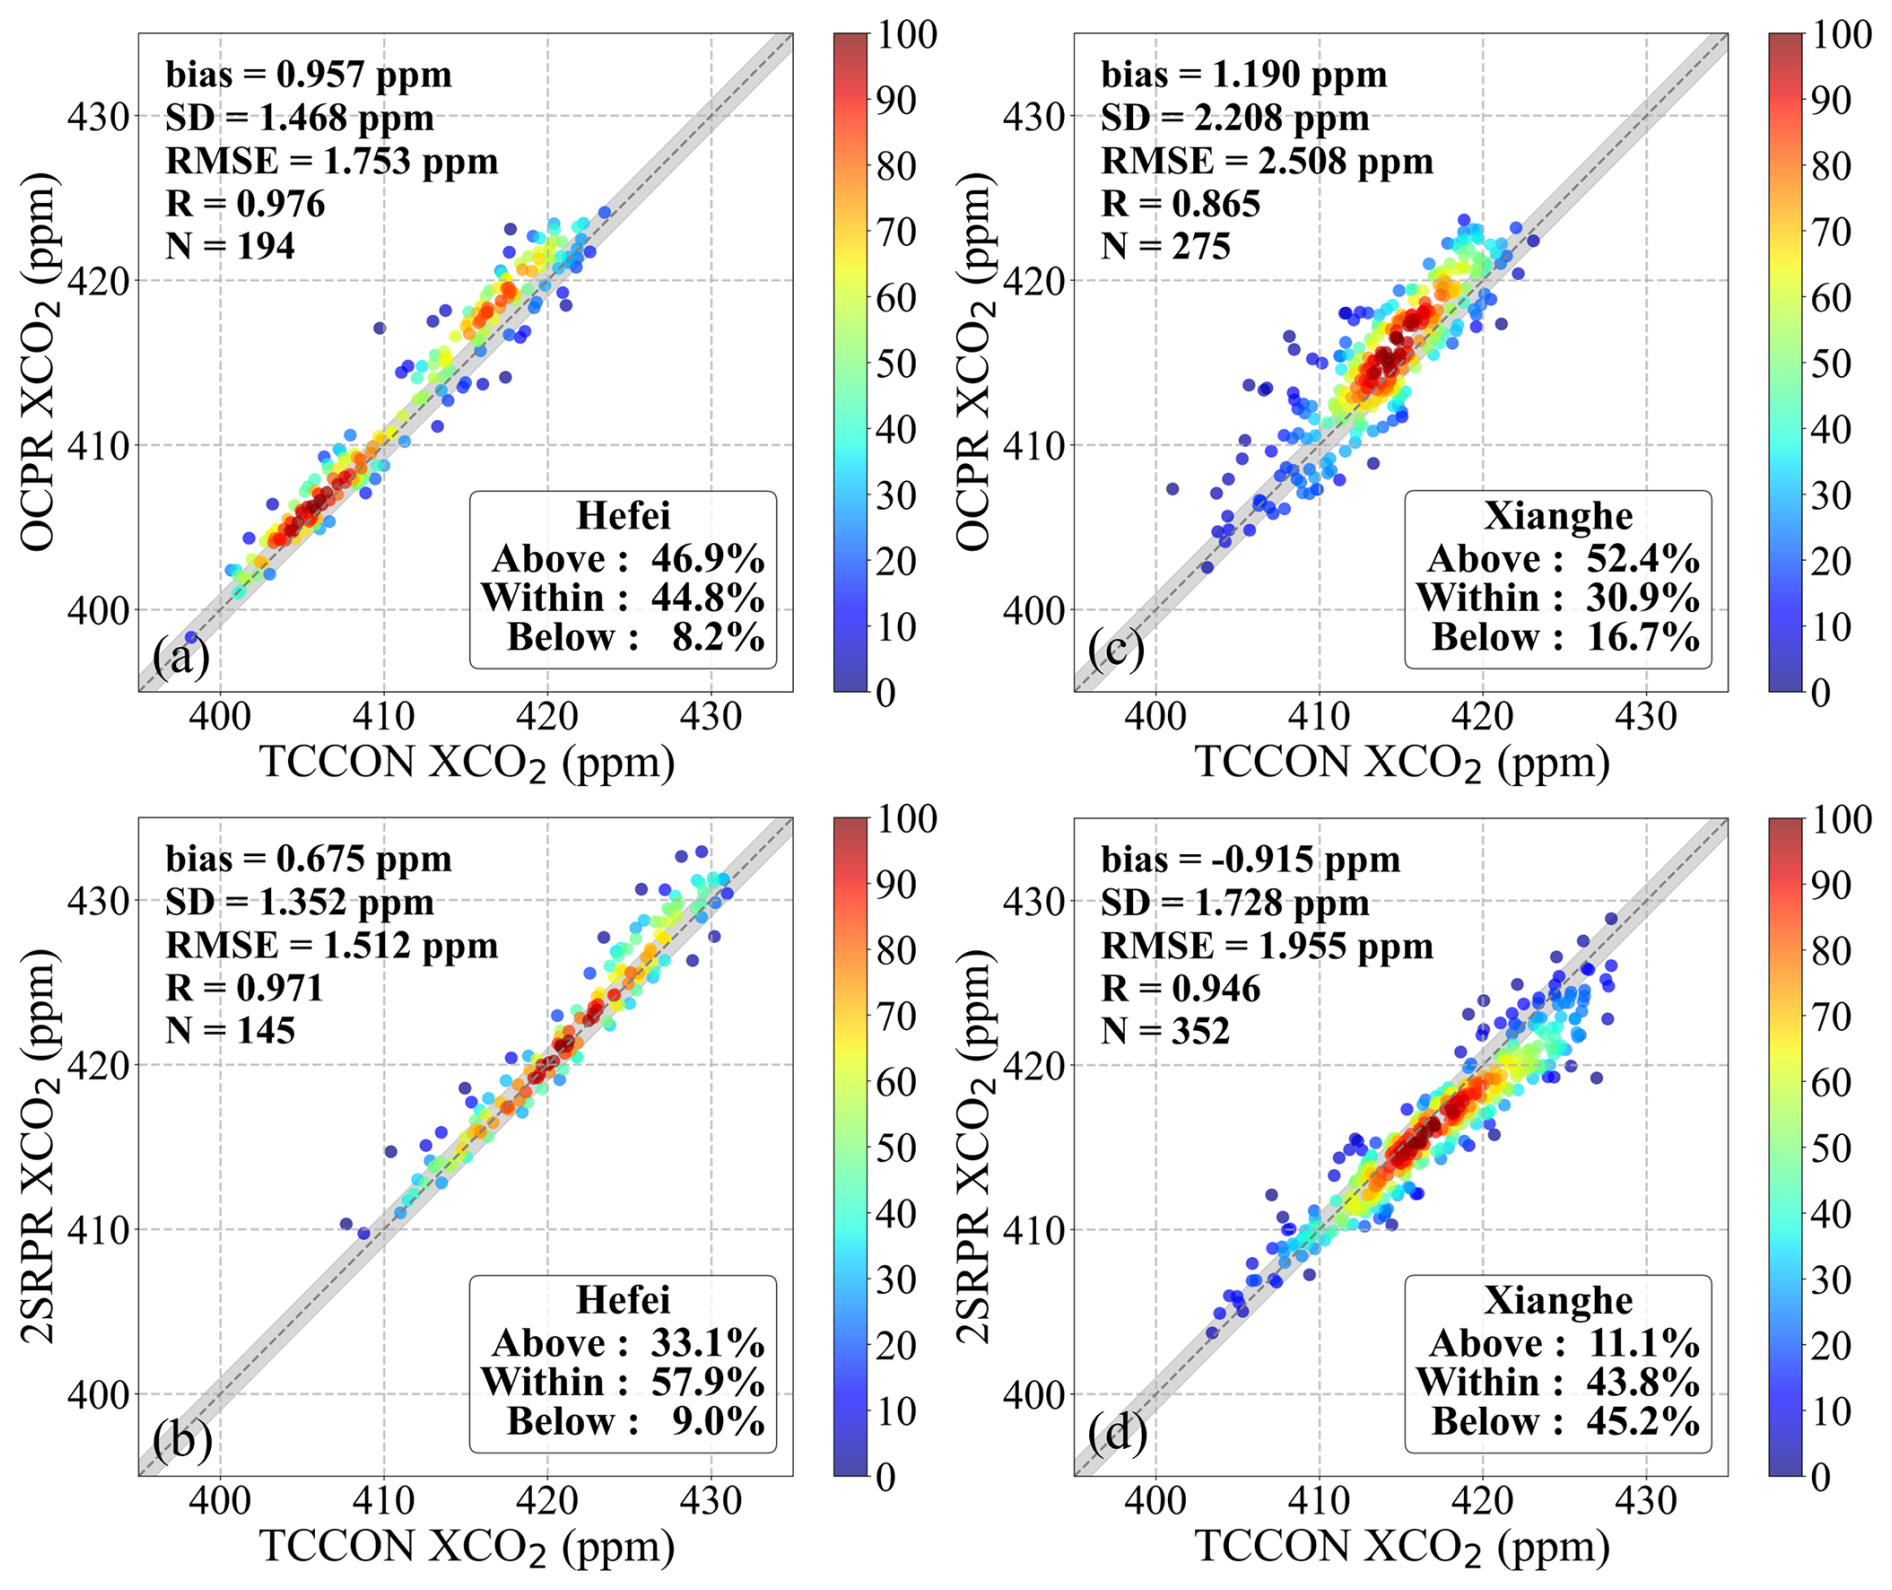
Figure A5As Fig. 5, but for XCO2 model data retrieved by the GOSAT OCPR and GOSAT-2 SRPR XCH4 retrieval algorithms for the Hefei (a, c) and Xianghe (b, d) sites.
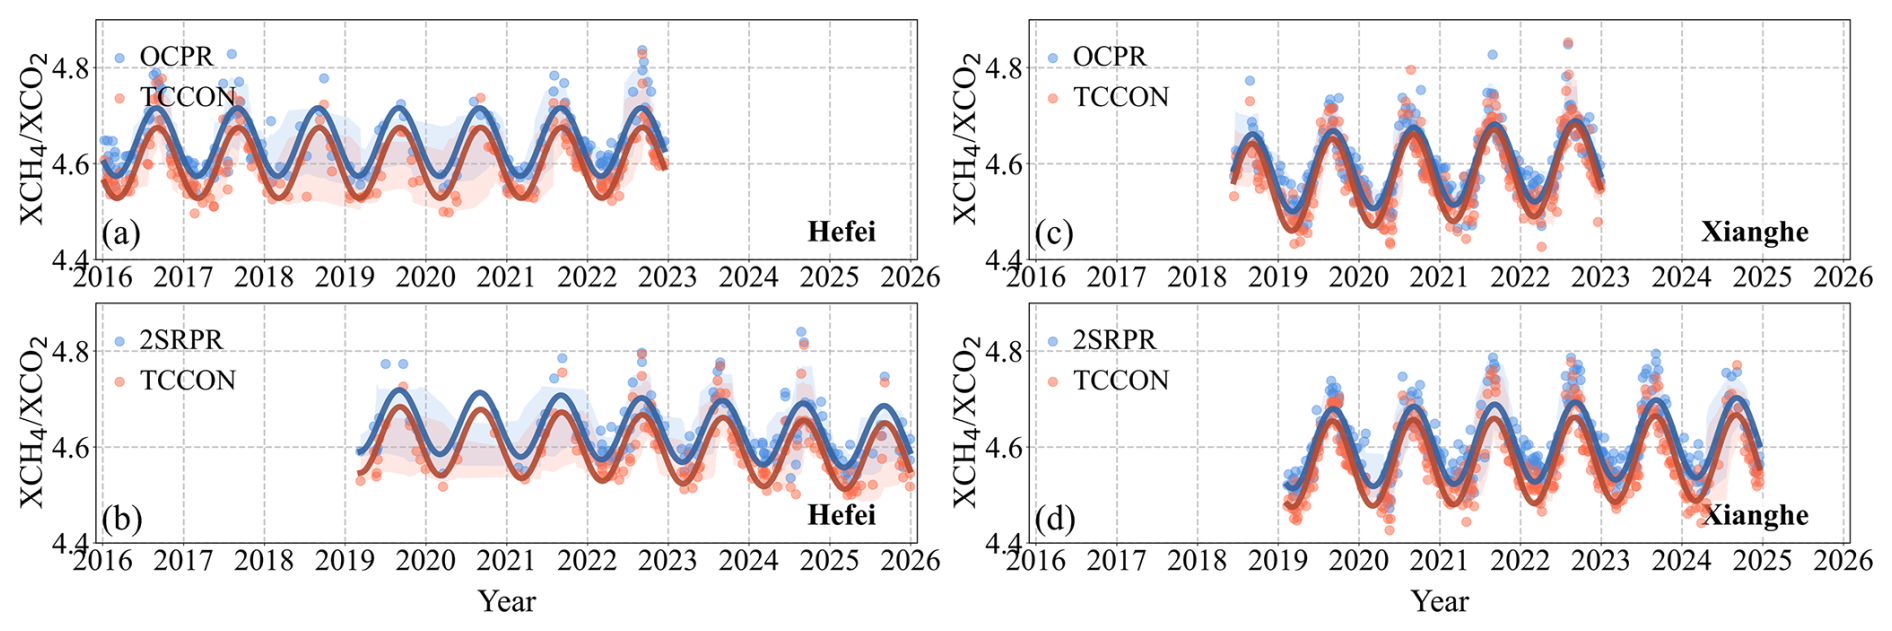
Figure A6As Fig. 4, but for ratios determined using the GOSAT OCPR and GOSAT-2 SRPR XCH4 retrieval algorithms.
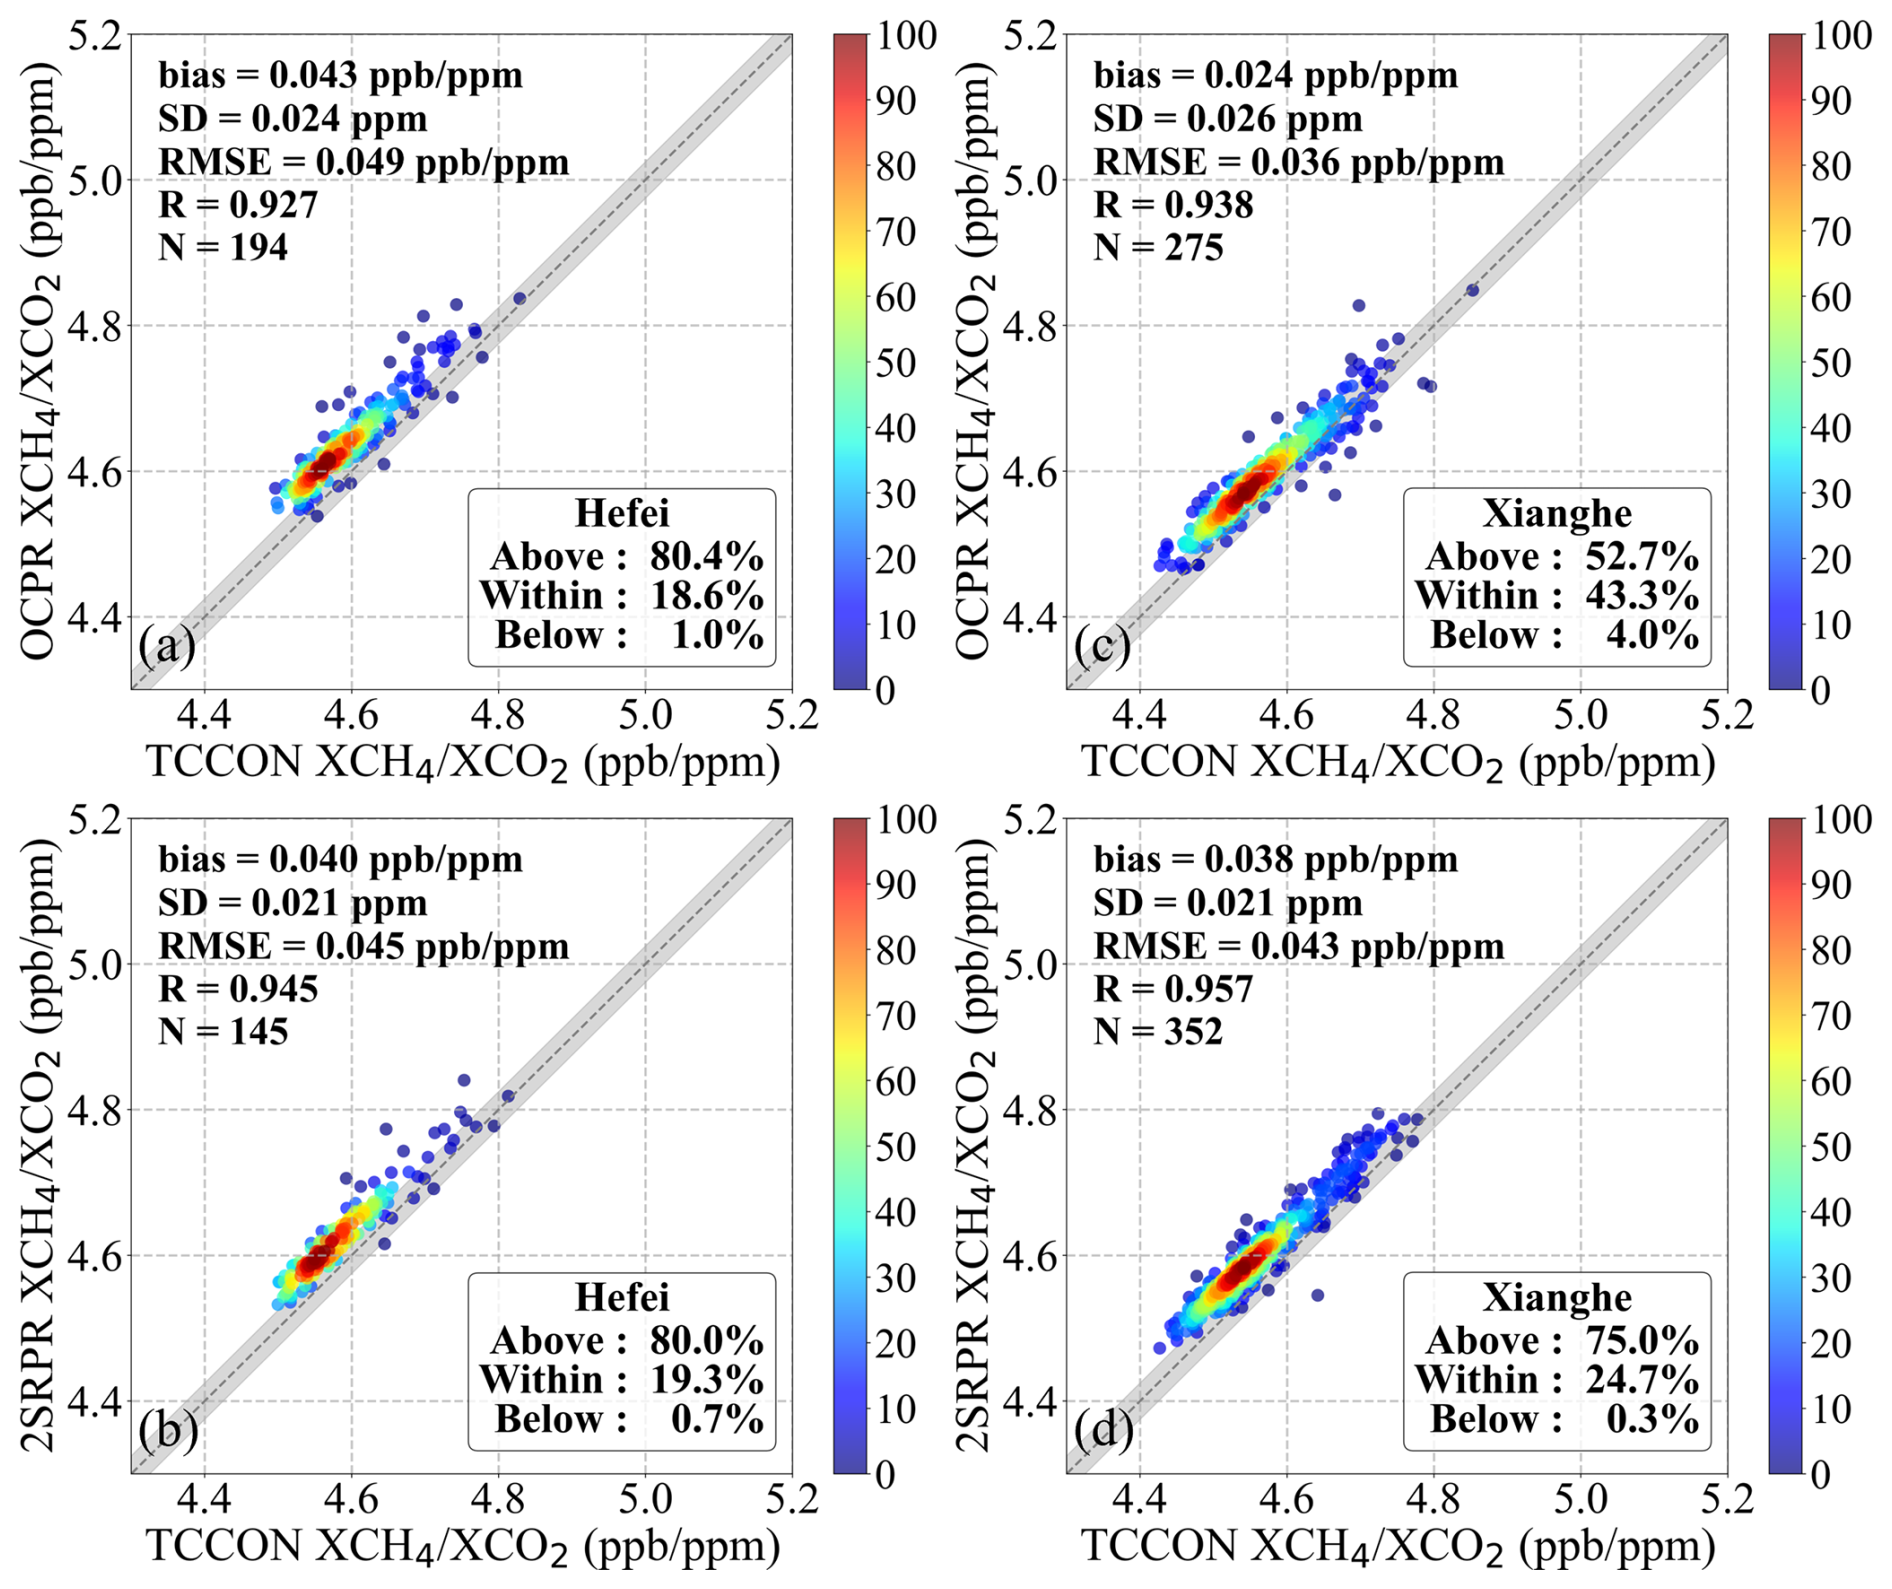
Figure A7As Fig. 5, but for ratios determined using the GOSAT OCPR and GOSAT-2 SRPR XCH4 retrieval algorithms for Hefei (a, c) and Xianghe (b, d).
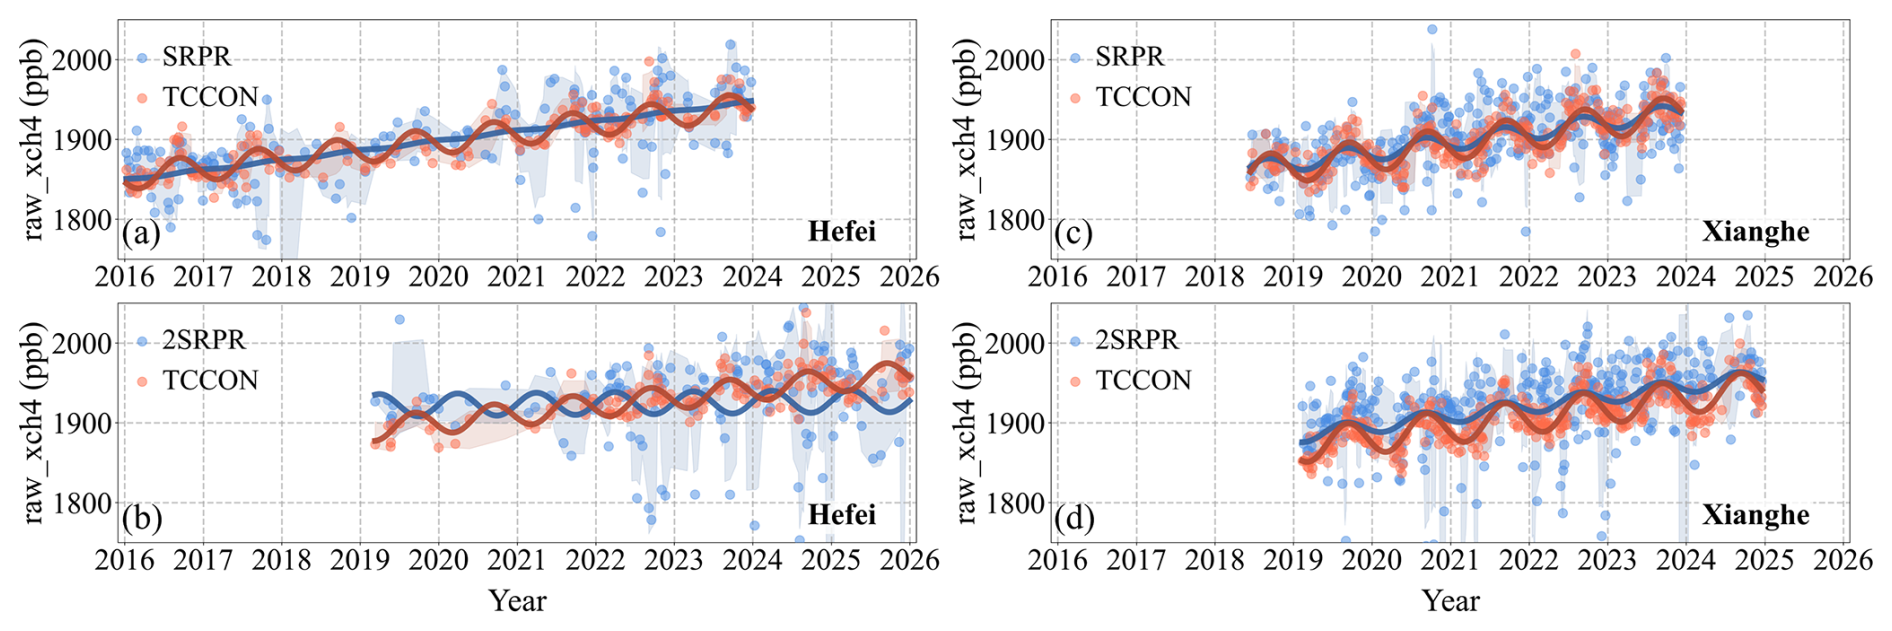
Figure A8As Fig. 4, but for the raw XCH4 used to calculate the ratios for the SRPR retrieval algorithms.
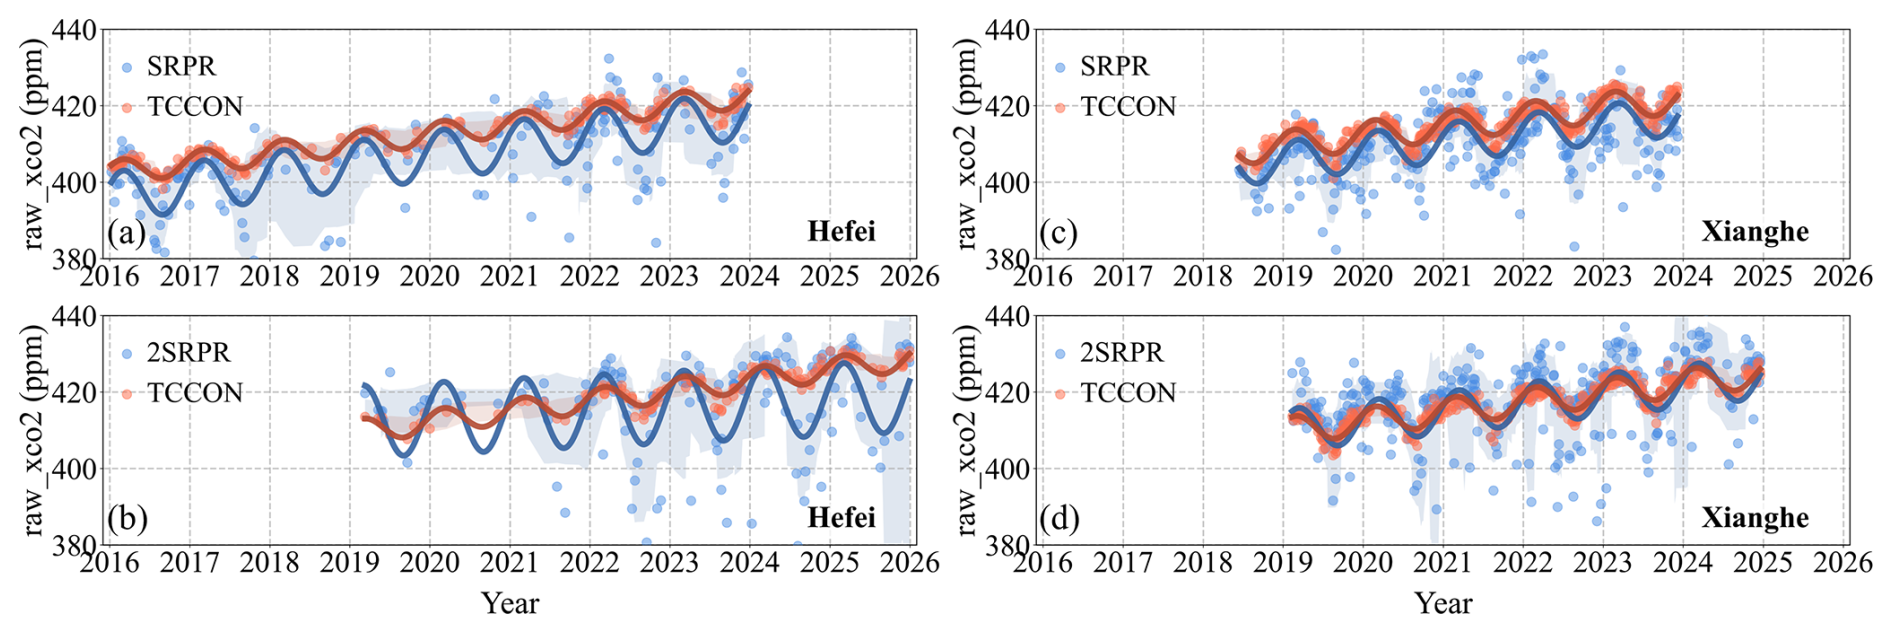
Figure A9As Fig. 4, but for the raw XCO2 used to calculate the ratios for the SRPR retrieval algorithms.
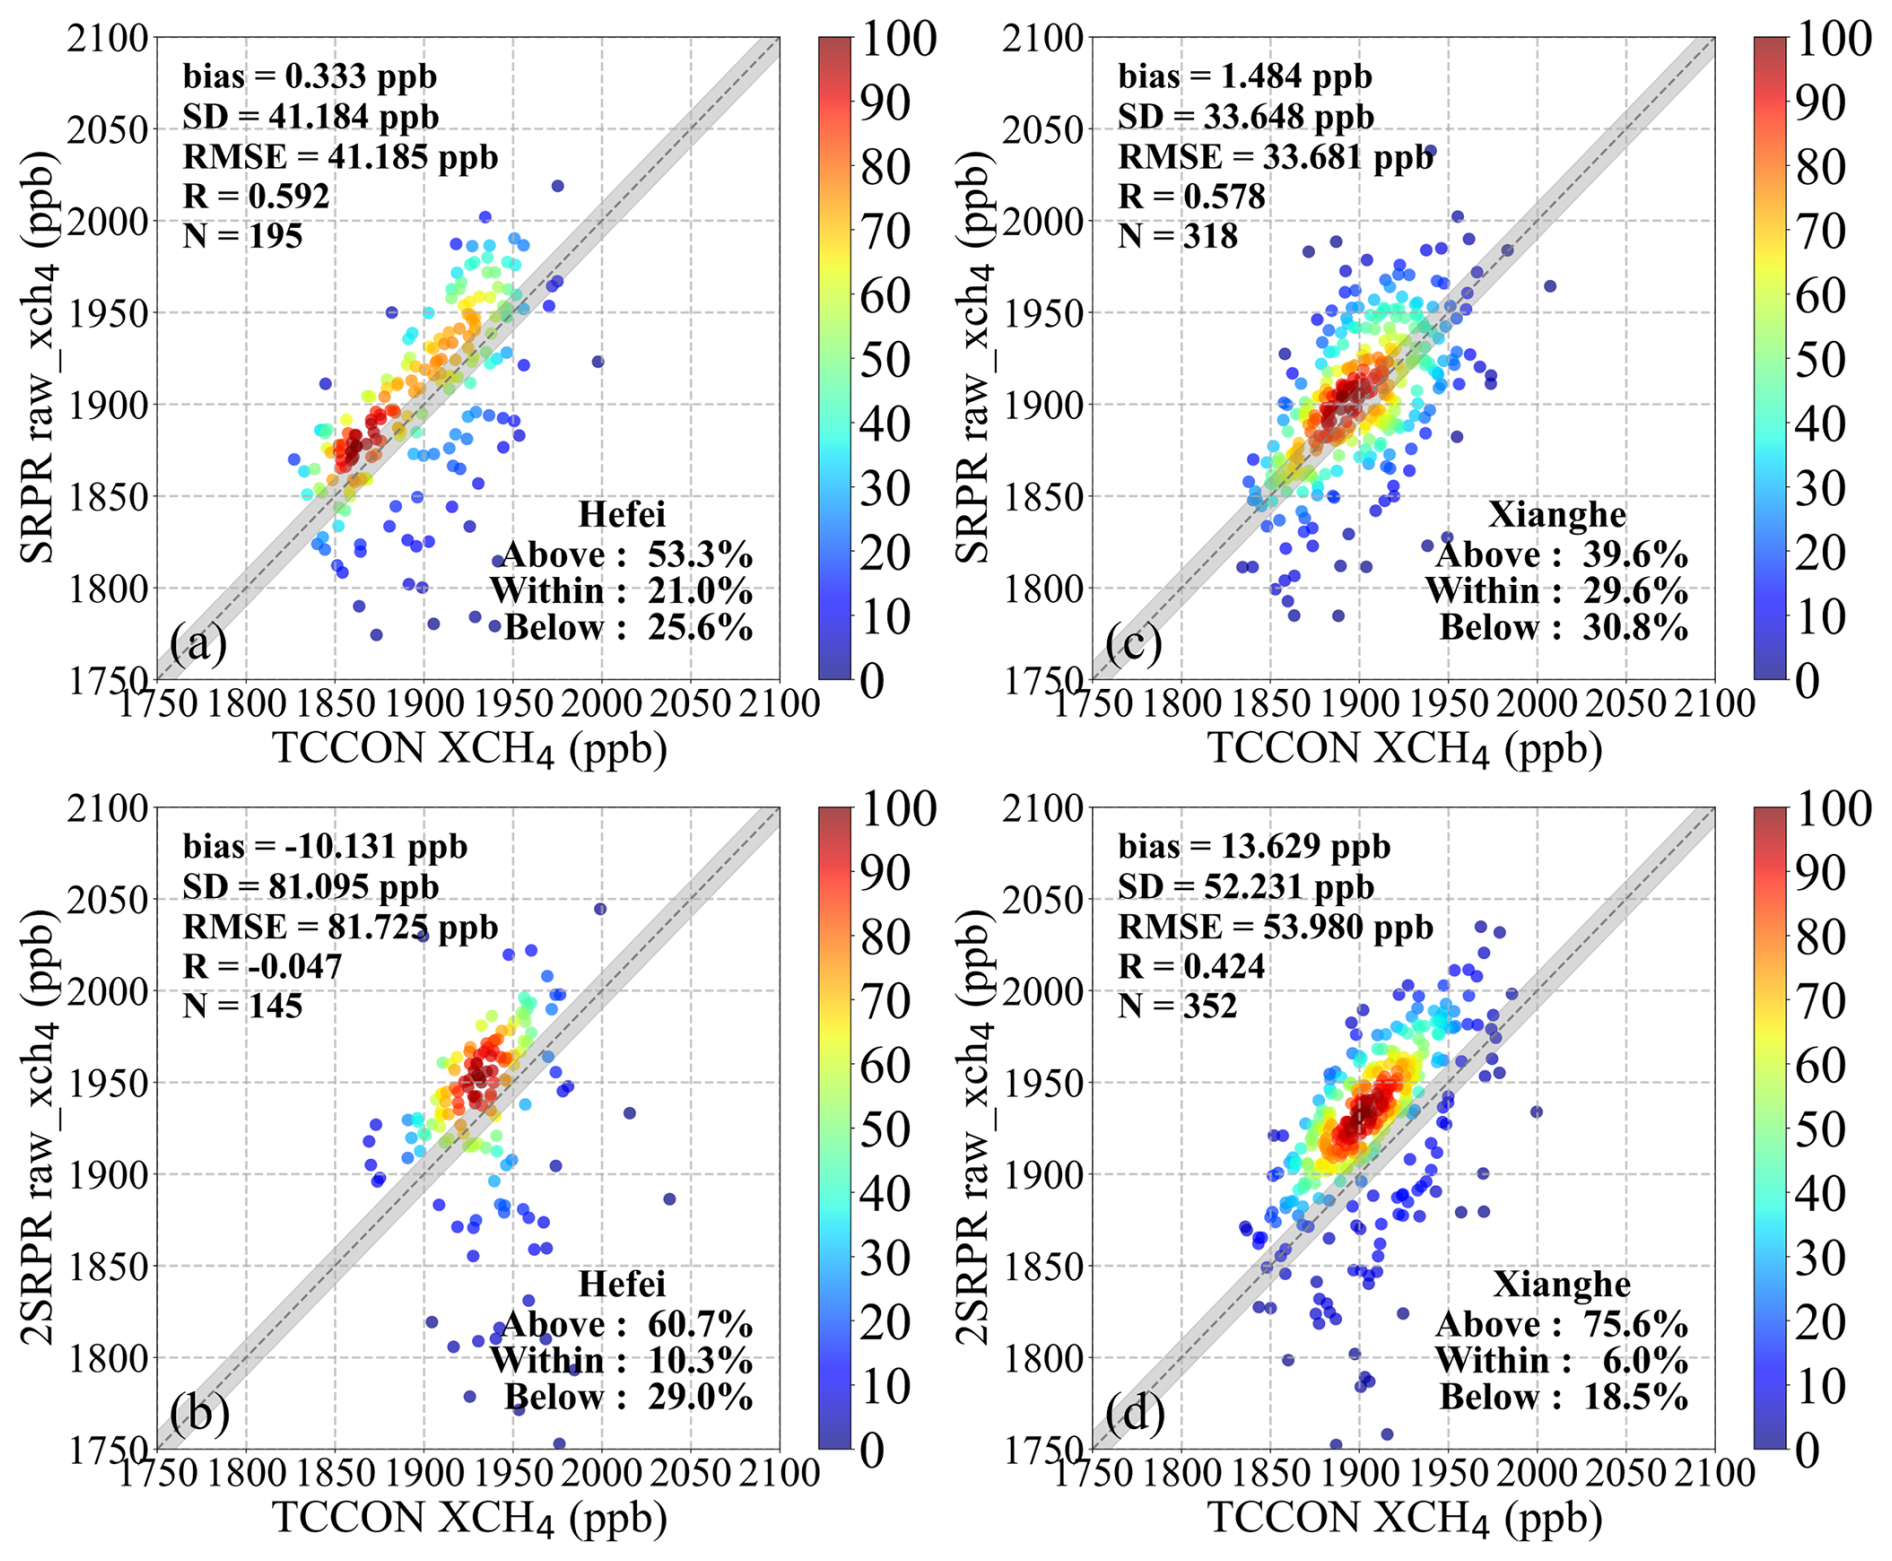
Figure A10As Fig. 5, but for the raw XCH4 used to calculate the ratios for the SRPR retrieval algorithms.
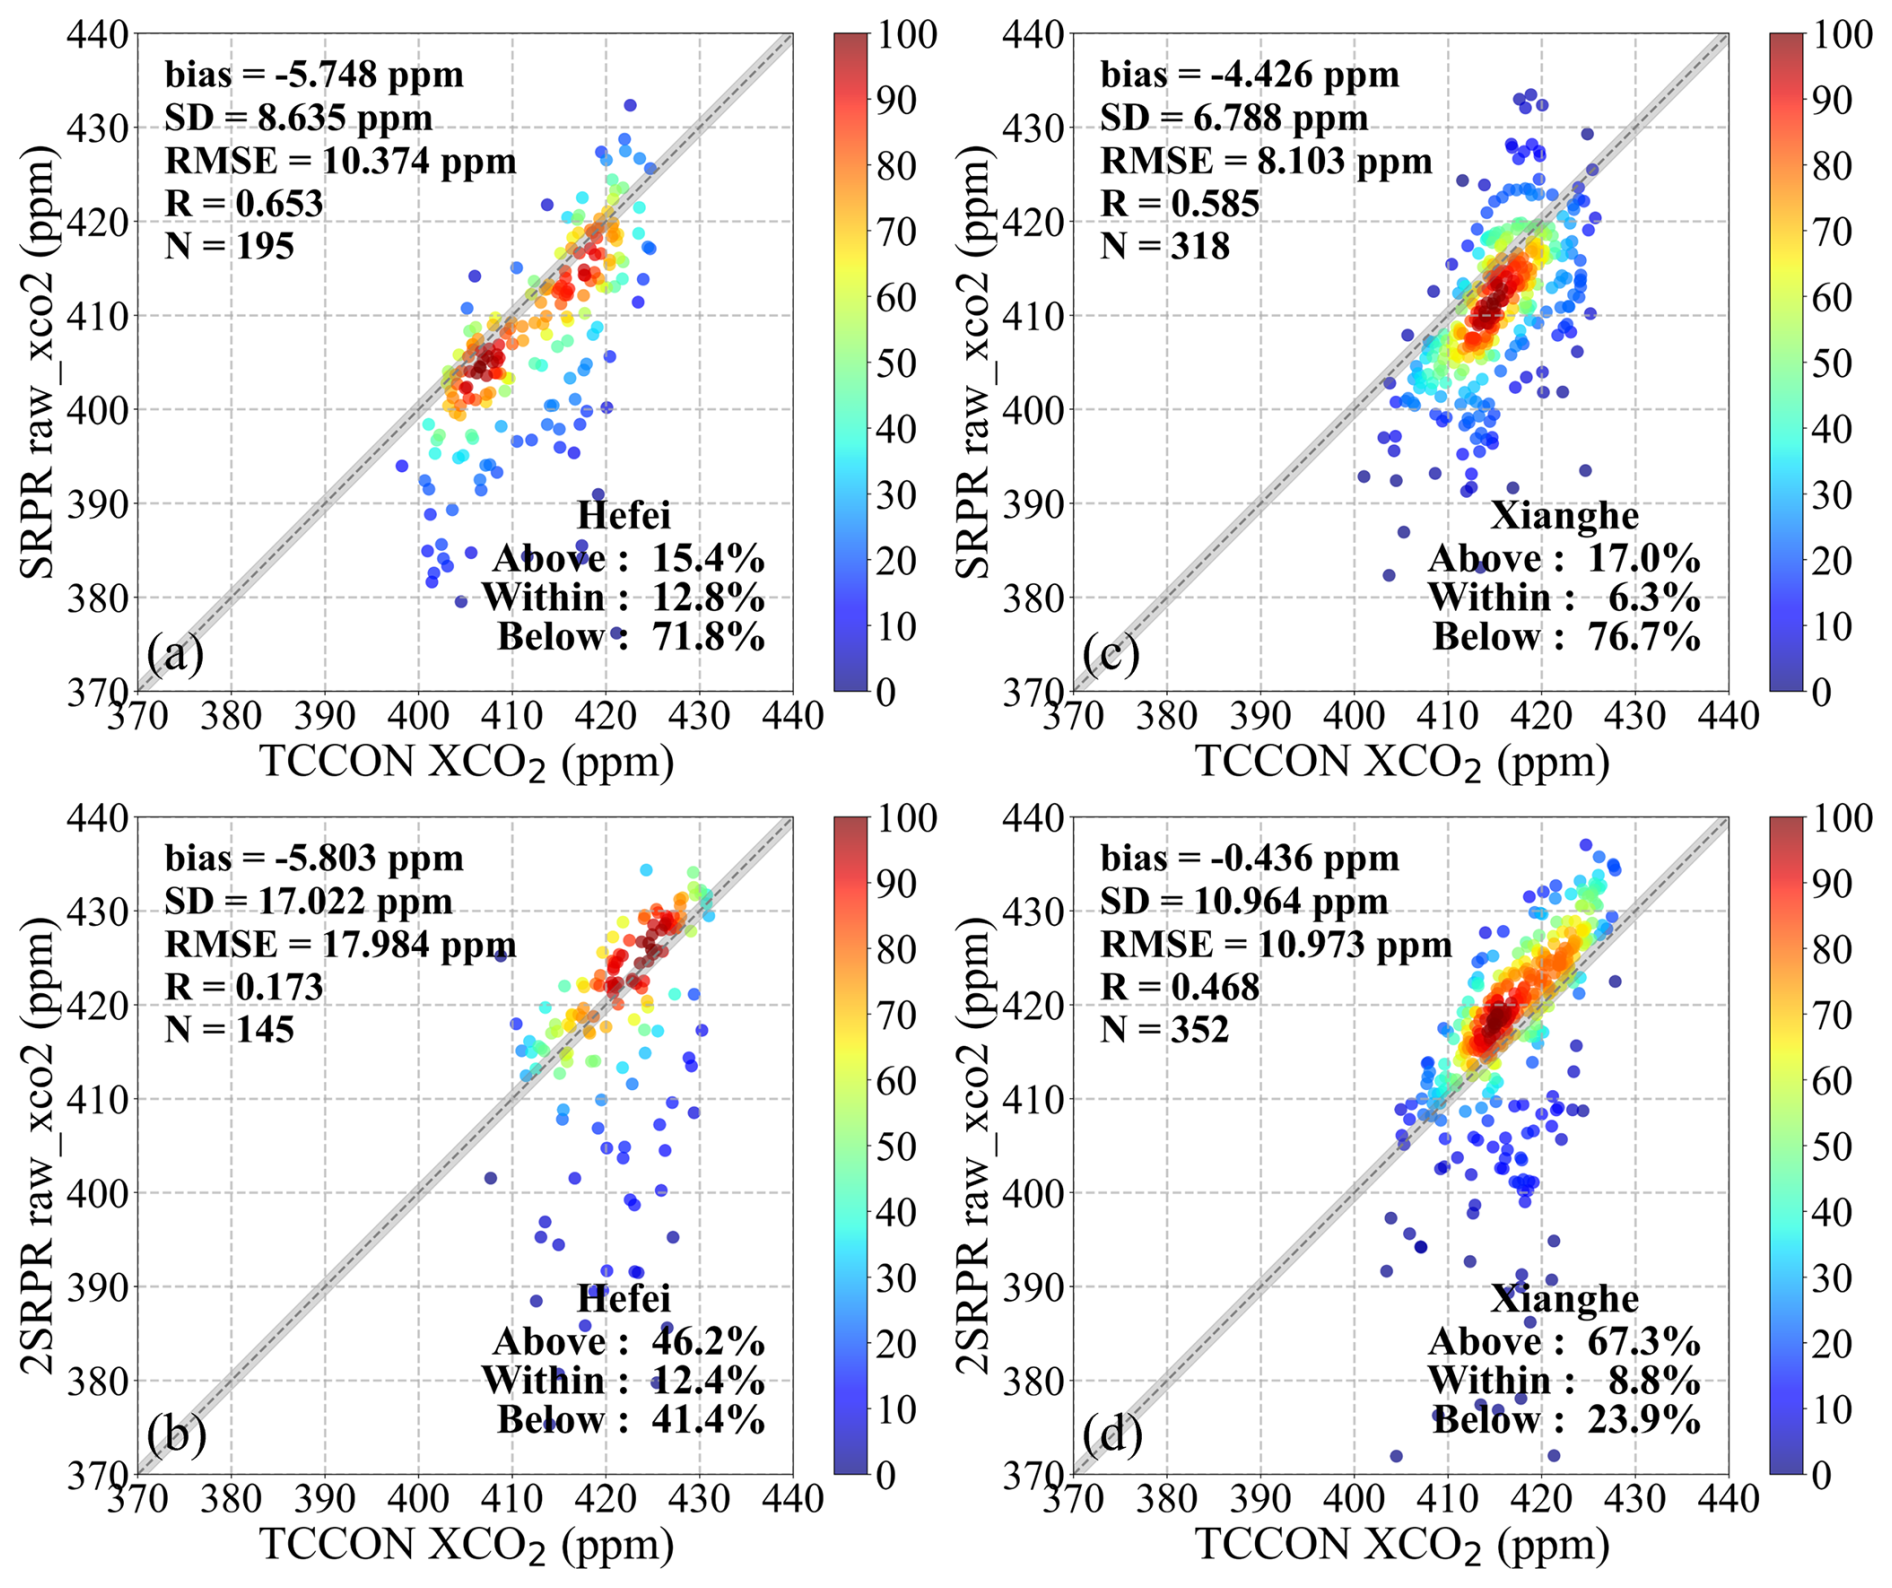
Figure A11As Fig. 5, but for the raw XCO2 used to calculate the ratios for the SRPR retrieval algorithms.

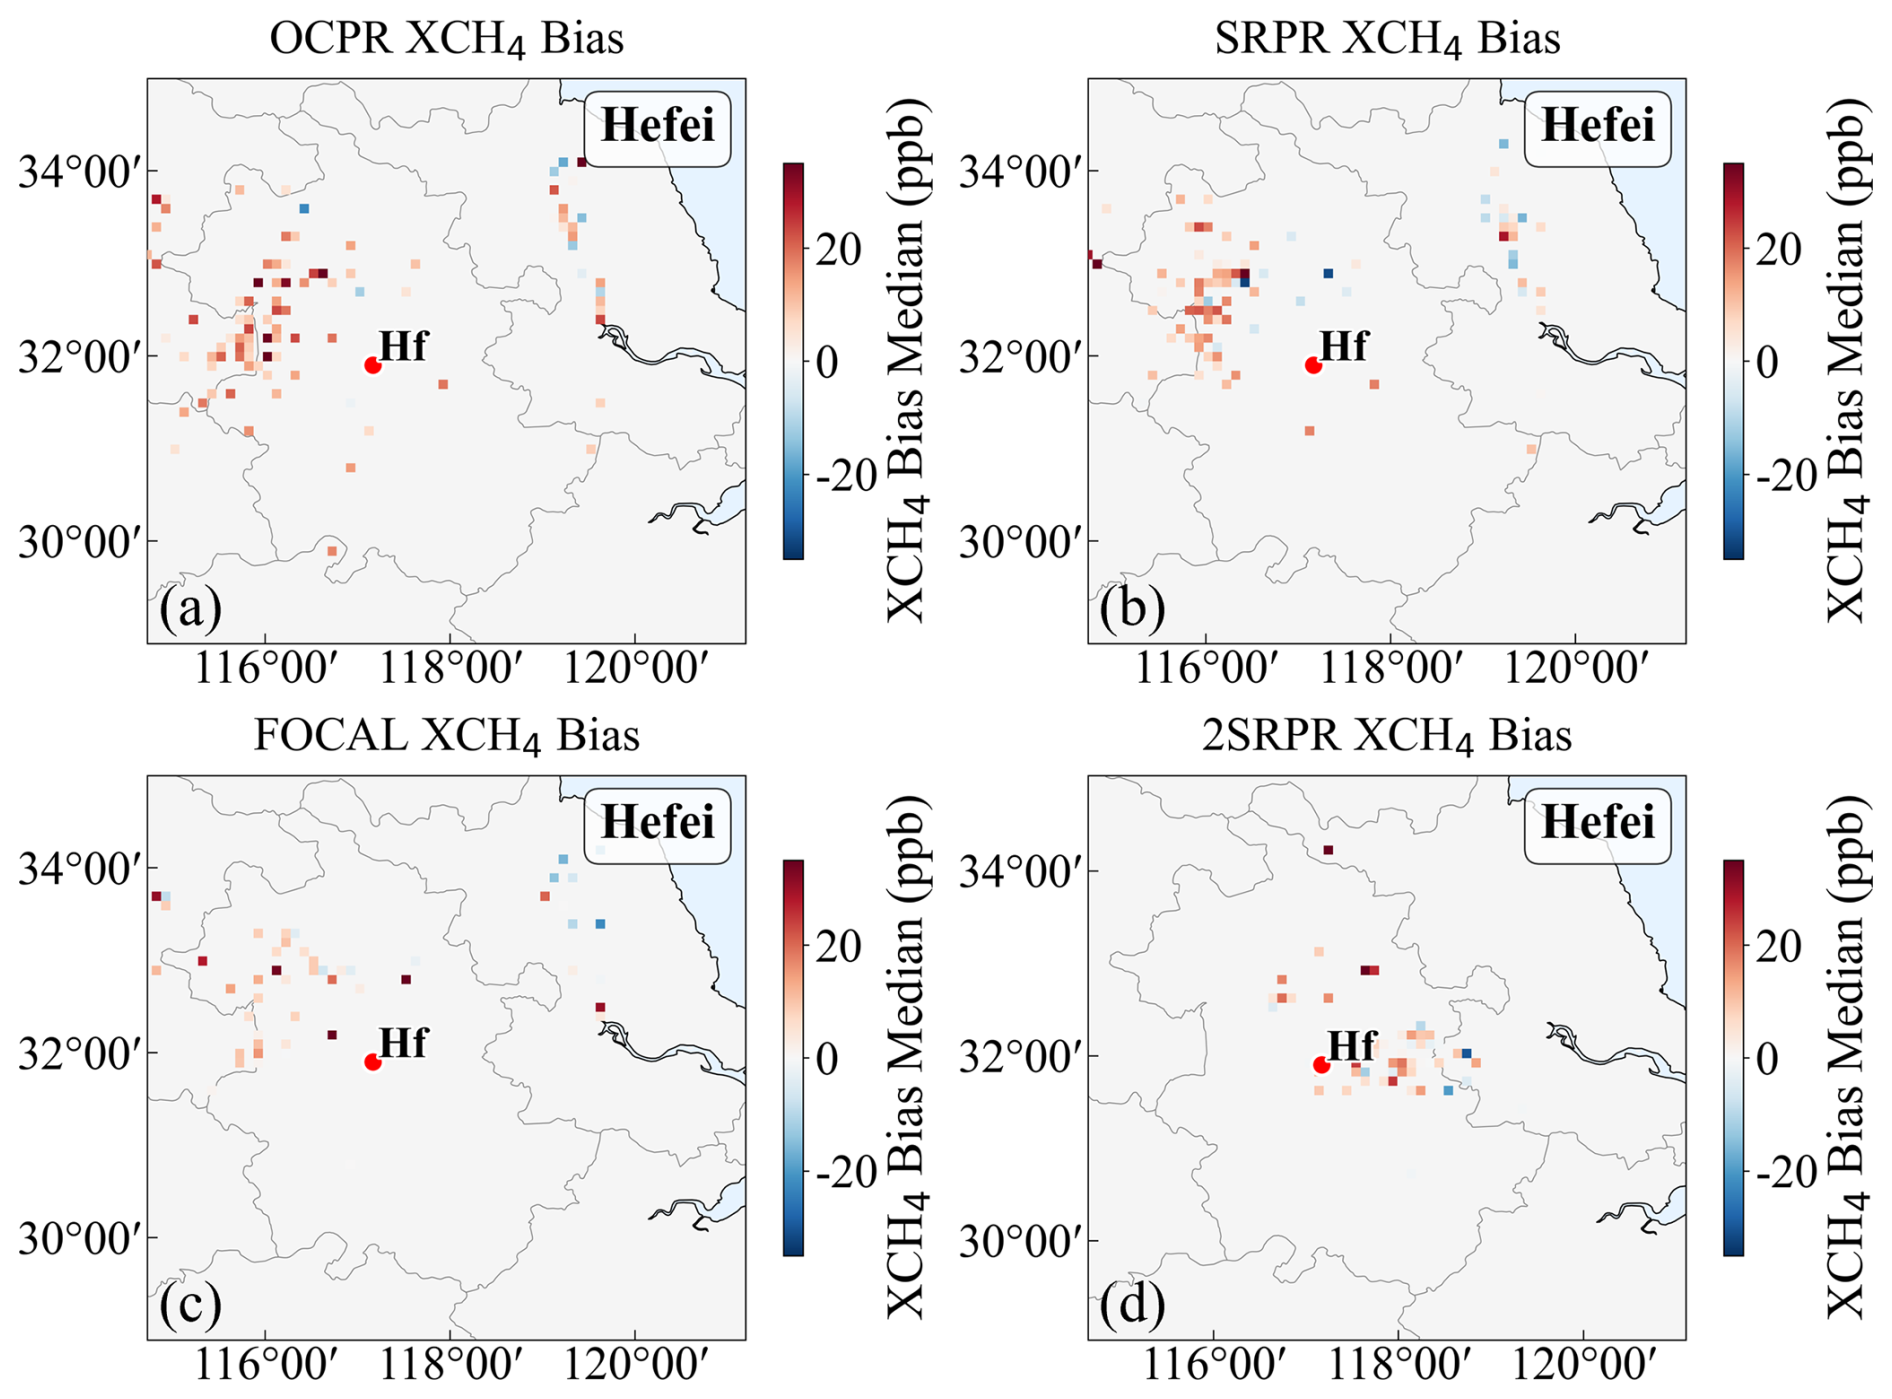
Figure A13As Fig. 16, but for Hefei site.
In addition to the spatial matching scheme used in the main text (with data averaged within a ±2.5° spatial window), also a broader spatial matching scheme has been incorporated with GOSAT and GOSAT-2 observations averaged within a ±5° spatial window centered at each TCCON site. For each satellite overpass, a spatial representative value was derived by averaging all valid pixels within this window. TCCON measurements were averaged within a ±2 h window relative to the satellite overpass time, thereby accounting for short-term atmospheric variability. Final data pairs were strictly filtered to retain only those instances where valid satellite and ground-based measurements co-existed within these defined spatiotemporal windows. The validation results are shown in Figs. B1–B3.
The GOSAT OCPR XCH4 (v9.0), and GOSAT SRPR XCH4 (v2.3.9) datasets used in this study were obtained from the Copernicus Climate Data Store (CDS) (https://doi.org/10.24381/cds.b25419f8, Copernicus Climate Change Service, Climate Data Store, 2018). The GOSAT FOCAL Proxy XCH4 (v3.0) data product was sourced from the University of Bremen, Institute of Environmental Physics (IUP), Carbon and Greenhouse Gas Group (https://www.iup.uni-bremen.de/~ghguser/gosat_focal/NRT_v3.0/data/, last access: 20 October 2026). The GOSAT-2 SRPR XCH4 (v2.2.0) dataset was obtained from the SRON Scientific GOSAT-2 Level 2 Data Products for XCH4 archive on Zenodo (https://doi.org/10.5281/zenodo.22637354, SRON Netherlands Institute for Space Research, 2026).
The TCCON data are available at https://tccondata.org/ (last access: 20 October 2026). The specific datasets are available via their respective DOIs: https://doi.org/10.14291/tccon.ggg2020p1.hefei01.R1 (Liu et al., 2026) (Hefei) and https://doi.org/10.14291/tccon.ggg2020p1.xianghe01.R0 (Zhou et al., 2026) (Xianghe).
The AERONET data are available at https://aeronet.gsfc.nasa.gov/ (last access: 20 October 2026). And the SONET data are made available by request through a data use agreement and application form with Dr. Li Li (email: lili3@radi.ac.cn).
All authors contributed to the study's conception and design. Xinran Jiang performed the experiments and wrote the original draft of the manuscript. Gerrit de Leeuw and Cheng Fan provided guidance on research design. Wei Wang and Minqiang Zhou, as the principal investigators of the TCCON sites used in this study, provided support for the TCCON ground-based observations and satellite validation. Andrew Gerald Barr provided guidance and suggestions on the use of the SRPR products in this study. Gerrit de Leeuw, Cheng Fan, Jeon-Teo Dong, Andrew Gerald Barr, Wei Wang, Minqiang Zhou and Zhengqiang Li contributed to the review, commentary, revision of the manuscript and finalized it. All authors read, reviewed, and approved the final manuscript.
The contact author has declared that none of the authors has any competing interests.
Publisher's note: Copernicus Publications remains neutral with regard to jurisdictional claims made in the text, published maps, institutional affiliations, or any other geographical representation in this paper. The authors bear the ultimate responsibility for providing appropriate place names. Views expressed in the text are those of the authors and do not necessarily reflect the views of the publisher.
The study contributes to the ESA/MOST cooperation project Dragon 6 “Air Quality Monitoring and Analysis in Populous areas in China” (AQMAP).
The TCCON data were obtained from the TCCON Data Archive hosted by CaltechDATA at https://tccondata.org/ (last access: 20 October 2026). We thank the TCCON community for providing the ground-based remote sensing data used in this study.
We thank Prof. Pucai Wang and Xiangao Xia for their efforts in establishing and maintaining the Xianghe AERONET site, and Prof. Rufang Ti for the effort in establishing and maintaining the Hefei SONET site.
This work was supported by the Jing-Jin-Ji Regional Integrated Environmental Improvement-National Science, the Technology Major Project of Ministry of Ecology and Environment of China (grant no. 2025ZD1200900), the Chinese Academy of Sciences President's International Fellowship Initiative (grant no. 2025PVA0014_Y1). The Xianghe TCCON measurements are supported by the State Key Laboratory of Atmospheric Environment and Extreme Meteorology (grant no. 2024QN04).
This paper was edited by Jason Cohen and reviewed by two anonymous referees.
Agustí-Panareda, A., Barré, J., Massart, S., Inness, A., Aben, I., Ades, M., Baier, B. C., Balsamo, G., Borsdorff, T., Bousserez, N., Boussetta, S., Buchwitz, M., Cantarello, L., Crevoisier, C., Engelen, R., Eskes, H., Flemming, J., Garrigues, S., Hasekamp, O., Huijnen, V., Jones, L., Kipling, Z., Langerock, B., McNorton, J., Meilhac, N., Noël, S., Parrington, M., Peuch, V.-H., Ramonet, M., Razinger, M., Reuter, M., Ribas, R., Suttie, M., Sweeney, C., Tarniewicz, J., and Wu, L.: Technical note: The CAMS greenhouse gas reanalysis from 2003 to 2020, Atmos. Chem. Phys., 23, 3829–3859, https://doi.org/10.5194/acp-23-3829-2023, 2023.
Ahmed, K. and Stern, D. I.: China's carbon emissions trend after the pandemic, Environmental Challenges, 13, 100787, https://doi.org/10.1016/j.envc.2023.100787, 2023.
Alvarez, R. A., Zavala-Araiza, D., Lyon, D. R., Allen, D. T., Barkley, Z. R., Brandt, A. R., Davis, K. J., Herndon, S. C., Jacob, D. J., Karion, A., Kort, E. A., Lamb, B. K., Lauvaux, T., Maasakkers, J. D., Marchese, A. J., Omara, M., Pacala, S. W., Peischl, J., Robinson, A. L., Shepson, P. B., Sweeney, C., Townsend-Small, A., Wofsy, S. C., and Hamburg, S. P.: Assessment of methane emissions from the U. S. oil and gas supply chain, Science, 361, 186–188, https://doi.org/10.1126/science.aar7204, 2018.
Andrey, B., Sergey, O., Tatsuya, Y., Yukio, Y., Isamu, M., Osamu, U., Dmitry, B., and Shamil, M.: Retrievals of atmospheric CO2, CH4 and optical path modifications from the GOSAT observations, Proc.SPIE, in: Remote Sensing of Clouds and the Atmosphere XVIII; and Optics in Atmospheric Propagation and Adaptive Systems XVI, 17 October 2013, 889008, https://doi.org/10.1117/12.2028486, 2013.
Barr, A. and Borsdorff, T.: Product User Guide and Specification (PUGS) – ANNEX C for product CH4_GO2_SRPR (v2.0.1, 2019–2022), SRON Netherlands Institute for Space Research, the Netherlands, https://www.iup.uni-bremen.de/carbon_ghg/docs/C3S/CDR7_2003-2022/C3S2_312a_Lot2_CDR7_PUGS_GHG_ANNEX-C_v7.2.pdf (last access: 27 September 2026), 2023.
Barr, A. G., Landgraf, J., Martinez-Velarte, M., Vrekoussis, M., Sussmann, R., Morino, I., Strong, K., Zhou, M., Velazco, V. A., Ohyama, H., Warneke, T., Hase, F., and Borsdorff, T.: Five years of GOSAT-2 retrievals with RemoTeC: XCO2 and XCH4 data products with quality filtering by machine learning, Atmos. Meas. Tech., 18, 6093–6123, https://doi.org/10.5194/amt-18-6093-2025, 2025.
Bey, I., Jacob, D. J., Yantosca, R. M., Logan, J. A., Field, B. D., Fiore, A. M., Li, Q., Liu, H. Y., Mickley, L. J., and Schultz, M. G.: Global modeling of tropospheric chemistry with assimilated meteorology: Model description and evaluation, J. Geophys. Res.-Atmos., 106, 23073–23095, https://doi.org/10.1029/2001JD000807, 2001.
Boesch, H. and Di Noia, A.: Product User Guide and Specification (PUGS) – ANNEX A for products CO2_GOS_OCFP, CH4_GOS_OCFP (v7.3, 2009–2021) & CH4_GOS_OCPR (v9.0, 2009–2021), University of Bremen, Bremen, https://www.iup.uni-bremen.de/carbon_ghg/docs/C3S/CDR7_2003-2022/C3S2_312a_Lot2_CDR7_PUGS_GHG_ANNEX-A_v7.2.pdf (last access: 27 September 2026), 2023.
Boesch, H. and Di Noia, A.: Algorithm Theoretical Basis Document (ATBD) – ANNEX A for products CO2_GOS_OCFP (v7.3), CH4_GOS_OCFP (v7.3) & CH4_GOS_OCPR (v9.0) (CDR7, 2009–2022), University of Bremen, Bremen, C3S2_312a_Lot2_D-WP1_ATBD-2023-GHG_ANNEX-A_v7.1b, https://www.iup.uni-bremen.de/carbon_ghg/docs/C3S/CDR7_2003-2022/C3S2_312a_Lot2_CDR7_ATBD_GHG_ANNEX-A_v7.1b.pdf (last access: 27 September 2026), 2024.
Bovensmann, H., Burrows, J. P., Buchwitz, M., Frerick, J., Noël, S., Rozanov, V. V., Chance, K. V., and Goede, A. P. H.: SCIAMACHY: Mission Objectives and Measurement Modes, J. Atmos. Sci., 56, 127–150, https://doi.org/10.1175/1520-0469(1999)056<0127:SMOAMM>2.0.CO;2, 1999.
Brence, J., Tanevski, J., Adams, J., Malina, E., and Džeroski, S.: Surrogate models of radiative transfer codes for atmospheric trace gas retrievals from satellite observations, Mach. Learn., 112, 1337–1363, https://doi.org/10.1007/s10994-022-06155-2, 2023.
Buchwitz, M., Rozanov, V. V., and Burrows, J. P.: A near-infrared optimized DOAS method for the fast global retrieval of atmospheric CH4, CO, CO2, H2O, and N2O total column amounts from SCIAMACHY Envisat-1 nadir radiances, J. Geophys. Res.-Atmos., 105, 15231–15245, https://doi.org/10.1029/2000JD900191, 2000.
Butz, A., Hasekamp, O. P., Frankenberg, C., and Aben, I.: Retrievals of atmospheric CO2 from simulated space-borne measurements of backscattered near-infrared sunlight: accounting for aerosol effects, Appl. Optics, 48, 3322–3336, https://doi.org/10.1364/AO.48.003322, 2009.
Butz, A., Hasekamp, O. P., Frankenberg, C., Vidot, J., and Aben, I.: CH4 retrievals from space-based solar backscatter measurements: Performance evaluation against simulated aerosol and cirrus loaded scenes, J. Geophys. Res.-Atmos., 115, https://doi.org/10.1029/2010JD014514, 2010.
Butz, A., Guerlet, S., Hasekamp, O., Schepers, D., Galli, A., Aben, I., Frankenberg, C., Hartmann, J. M., Tran, H., Kuze, A., Keppel-Aleks, G., Toon, G., Wunch, D., Wennberg, P., Deutscher, N., Griffith, D., Macatangay, R., Messerschmidt, J., Notholt, J., and Warneke, T.: Toward accurate CO2 and CH4 observations from GOSAT, Geophys. Res. Lett., 38, https://doi.org/10.1029/2011GL047888, 2011.
Chevallier, F., Feng, L., Bösch, H., Palmer, P. I., and Rayner, P. J.: On the impact of transport model errors for the estimation of CO2 surface fluxes from GOSAT observations, Geophys. Res. Lett., 37, https://doi.org/10.1029/2010GL044652, 2010a.
Chevallier, F., Ciais, P., Conway, T. J., Aalto, T., Anderson, B. E., Bousquet, P., Brunke, E. G., Ciattaglia, L., Esaki, Y., Fröhlich, M., Gomez, A., Gomez-Pelaez, A. J., Haszpra, L., Krummel, P. B., Langenfelds, R. L., Leuenberger, M., Machida, T., Maignan, F., Matsueda, H., Morguí, J. A., Mukai, H., Nakazawa, T., Peylin, P., Ramonet, M., Rivier, L., Sawa, Y., Schmidt, M., Steele, L. P., Vay, S. A., Vermeulen, A. T., Wofsy, S., and Worthy, D.: CO2 surface fluxes at grid point scale estimated from a global 21 year reanalysis of atmospheric measurements, J. Geophys. Res.-Atmos., 115, https://doi.org/10.1029/2010JD013887, 2010b.
Copernicus Climate Change Service, Climate Data Store: Methane data from 2002 to present derived from satellite observations, Copernicus Climate Change Service (C3S) Climate Data Store (CDS) [data set], https://doi.org/10.24381/cds.b25419f8, 2018,
Costantiello, A., Laureti, L., Quarto, A., and Leogrande, A.: Methane Emissions in the ESG Framework at the World Level, Methane, 4, 3, https://doi.org/10.3390/methane4010003, 2025.
East, J. D., Jacob, D. J., Balasus, N., Bloom, A. A., Bruhwiler, L., Chen, Z., Kaplan, J. O., Mickley, L. J., Mooring, T. A., Penn, E., Poulter, B., Sulprizio, M. P., Worden, J. R., Yantosca, R. M., and Zhang, Z.: Interpreting the Seasonality of Atmospheric Methane, Geophys. Res. Lett., 51, e2024GL108494, https://doi.org/10.1029/2024GL108494, 2024.
Eck, T. F., Holben, B. N., Reid, J. S., Xian, P., Giles, D. M., Sinyuk, A., Smirnov, A., Schafer, J. S., Slutsker, I., Kim, J., Koo, J. H., Choi, M., Kim, K. C., Sano, I., Arola, A., Sayer, A. M., Levy, R. C., Munchak, L. A., O'Neill, N. T., Lyapustin, A., Hsu, N. C., Randles, C. A., Da Silva, A. M., Buchard, V., Govindaraju, R. C., Hyer, E., Crawford, J. H., Wang, P., and Xia, X.: Observations of the Interaction and Transport of Fine Mode Aerosols With Cloud and/or Fog in Northeast Asia From Aerosol Robotic Network and Satellite Remote Sensing, J. Geophys. Res.-Atmos., 123, 5560–5587, https://doi.org/10.1029/2018JD028313, 2018.
ESA eoPortal: GOSAT-2 (Greenhouse gases Observing Satellite-2)/Ibuki-2, https://www.eoportal.org/satellite-missions/gosat-2 (last access: 20 October 2026), 2026.
Gao, Y., Fan, C., Li, Z., de Leeuw, G., Ding, J., Han, Y., He, Z., Zhao, Y., Wang, Z., Zhang, Y., Zhang, Y., and van der A, R.: Evaluation of satellite-derived methane emissions from coal mines using the Gaussian plume model in a topographically complex area, Atmos. Environ., 375, 122004, https://doi.org/10.1016/j.atmosenv.2026.122004, 2026.
GCOS: The 2022 GCOS ECVs Requirements, World Meteorological Organization, Geneva, Switzerland, GCOS-245, https://library.wmo.int/records/item/58111-the-2022-gcos-ecvs-requirements-gcos-245 (last access: 27 September 2026), 2022.
GGG2020 Data Changes: https://tccon-wiki.caltech.edu/Main/GGG2020DataChanges, last access: 8 September 2026.
Han, P., Zeng, N., Yao, B., Zhang, W., Quan, W., Wang, P., Wang, T., Zhou, M., Cai, Q., Zhang, Y., Liang, R., Sun, W., and Liu, S.: Spatiotemporal variations in atmospheric CH4 concentrations and enhancements in northern China based on a comprehensive dataset: ground-based observations, TROPOMI data, inventory data, and inversions, Atmos. Chem. Phys., 25, 4965–4988, https://doi.org/10.5194/acp-25-4965-2025, 2025.
Hansen, J. E. and Sato, M.: Trends of measured climate forcing agents, P. Natl. Acad. Sci. USA, 98, 14778–14783, https://doi.org/10.1073/pnas.261553698, 2001.
Holben, B. N., Eck, T. F., Slutsker, I., Tanré, D., Buis, J. P., Setzer, A., Vermote, E., Reagan, J. A., Kaufman, Y. J., Nakajima, T., Lavenu, F., Jankowiak, I., and Smirnov, A.: AERONET – A Federated Instrument Network and Data Archive for Aerosol Characterization, Remote Sens. Environ., 66, 1–16, https://doi.org/10.1016/s0034-4257(98)00031-5, 1998.
Holben, B. N., Tanré, D., Smirnov, A., Eck, T. F., Slutsker, I., Abuhassan, N., Newcomb, W. W., Schafer, J. S., Chatenet, B., Lavenu, F., Kaufman, Y. J., Castle, J. V., Setzer, A., Markham, B., Clark, D., Frouin, R., Halthore, R., Karneli, A., O'Neill, N. T., Pietras, C., Pinker, R. T., Voss, K., and Zibordi, G.: An emerging ground-based aerosol climatology: Aerosol optical depth from AERONET, J. Geophys. Res.-Atmos., 106, 12067–12097, https://doi.org/10.1029/2001JD900014, 2001.
Hong, X., Gao, Y., Wang, J., Zhang, C., Chen, H., Ni, Y., Wang, W., Sun, Y., Zhu, Y., Tang, Z., Wang, Y., Ma, N., and Liu, C.: Evaluating the performance of carbon dioxide and methane observations from carbon-monitoring satellite products over China, Sci. Total Environ., 955, 176896, https://doi.org/10.1016/j.scitotenv.2024.176896, 2024.
Hourdin, F., Musat, I., Bony, S., Braconnot, P., Codron, F., Dufresne, J.-L., Fairhead, L., Filiberti, M.-A., Friedlingstein, P., Grandpeix, J.-Y., Krinner, G., LeVan, P., Li, Z.-X., and Lott, F.: The LMDZ4 general circulation model: climate performance and sensitivity to parametrized physics with emphasis on tropical convection, Clim. Dynam., 27, 787–813, https://doi.org/10.1007/s00382-006-0158-0, 2006.
Hu, H., Hasekamp, O., Butz, A., Galli, A., Landgraf, J., Aan de Brugh, J., Borsdorff, T., Scheepmaker, R., and Aben, I.: The operational methane retrieval algorithm for TROPOMI, Atmos. Meas. Tech., 9, 5423–5440, https://doi.org/10.5194/amt-9-5423-2016, 2016.
Imasu, R., Matsunaga, T., Nakajima, M., Yoshida, Y., Shiomi, K., Morino, I., Saitoh, N., Niwa, Y., Someya, Y., Oishi, Y., Hashimoto, M., Noda, H., Hikosaka, K., Uchino, O., Maksyutov, S., Takagi, H., Ishida, H., Nakajima, T. Y., Nakajima, T., and Shi, C.: Greenhouse gases Observing SATellite 2 (GOSAT-2): mission overview, Progress in Earth and Planetary Science, 10, 33, https://doi.org/10.1186/s40645-023-00562-2, 2023.
Inness, A., Baier, F., Benedetti, A., Bouarar, I., Chabrillat, S., Clark, H., Clerbaux, C., Coheur, P., Engelen, R. J., Errera, Q., Flemming, J., George, M., Granier, C., Hadji-Lazaro, J., Huijnen, V., Hurtmans, D., Jones, L., Kaiser, J. W., Kapsomenakis, J., Lefever, K., Leitão, J., Razinger, M., Richter, A., Schultz, M. G., Simmons, A. J., Suttie, M., Stein, O., Thépaut, J.-N., Thouret, V., Vrekoussis, M., Zerefos, C., and the MACC team: The MACC reanalysis: an 8 yr data set of atmospheric composition, Atmos. Chem. Phys., 13, 4073–4109, https://doi.org/10.5194/acp-13-4073-2013, 2013.
IPCC: Climate Change 2021: The Physical Science Basis. Contribution of Working Group I to the Sixth Assessment Report of the Intergovernmental Panel on Climate Change, Cambridge University Press, Cambridge, United Kingdom and New York, NY, USA, https://doi.org/10.1017/9781009157896, 2021.
IPCC: Climate Change 2023: Synthesis Report. Contribution of Working Groups I, II and III to the Sixth Assessment Report of the Intergovernmental Panel on Climate Change, edited by: Core Writing Team, Lee, H., and Romero, J., Geneva, Switzerland, 35–115, https://doi.org/10.59327/IPCC/AR6-9789291691647, 2023.
Jacob, D. J., Turner, A. J., Maasakkers, J. D., Sheng, J., Sun, K., Liu, X., Chance, K., Aben, I., McKeever, J., and Frankenberg, C.: Satellite observations of atmospheric methane and their value for quantifying methane emissions, Atmos. Chem. Phys., 16, 14371–14396, https://doi.org/10.5194/acp-16-14371-2016, 2016.
Japan Aerospace Exploration Agency, National Institute for Environmental Studies, and Ministry of the Environment: GOSAT/IBUKI Data Users Handbook, Japan Aerospace Exploration Agency, National Institute for Environmental Studies, Ministry of the Environment, Tsukuba, Japan, https://data2.gosat.nies.go.jp/doc/GOSAT_HB_E_1stEdition_for_HP.pdf (last access: 27 September 2026), 2011.
Ji, D., Zhou, M., Wang, P., Yang, Y., Wang, T., Sun, X., Hermans, C., Yao, B., and Wang, G.: Deriving Temporal and Vertical Distributions of Methane in Xianghe Using Ground-based Fourier Transform Infrared and Gas-analyzer Measurements, Adv. Atmos. Sci., 37, 597–607, https://doi.org/10.1007/s00376-020-9233-4, 2020.
Kuze, A., Suto, H., Shiomi, K., Kawakami, S., Tanaka, M., Ueda, Y., Deguchi, A., Yoshida, J., Yamamoto, Y., Kataoka, F., Taylor, T. E., and Buijs, H. L.: Update on GOSAT TANSO-FTS performance, operations, and data products after more than 6 years in space, Atmos. Meas. Tech., 9, 2445–2461, https://doi.org/10.5194/amt-9-2445-2016, 2016.
Laughner, J. L., Toon, G. C., Mendonca, J., Petri, C., Roche, S., Wunch, D., Blavier, J.-F., Griffith, D. W. T., Heikkinen, P., Keeling, R. F., Kiel, M., Kivi, R., Roehl, C. M., Stephens, B. B., Baier, B. C., Chen, H., Choi, Y., Deutscher, N. M., DiGangi, J. P., Gross, J., Herkommer, B., Jeseck, P., Laemmel, T., Lan, X., McGee, E., McKain, K., Miller, J., Morino, I., Notholt, J., Ohyama, H., Pollard, D. F., Rettinger, M., Riris, H., Rousogenous, C., Sha, M. K., Shiomi, K., Strong, K., Sussmann, R., Té, Y., Velazco, V. A., Wofsy, S. C., Zhou, M., and Wennberg, P. O.: The Total Carbon Column Observing Network's GGG2020 data version, Earth Syst. Sci. Data, 16, 2197–2260, https://doi.org/10.5194/essd-16-2197-2024, 2024.
Li, Z., Xia, X., Cribb, M., Mi, W., Holben, B., Wang, P., Chen, H., Tsay, S.-C., Eck, T. F., Zhao, F., Dutton, E. G., and Dickerson, R. E.: Aerosol optical properties and their radiative effects in northern China, J. Geophys. Res.-Atmos., 112, https://doi.org/10.1029/2006JD007382, 2007.
Li, Z. Q., Xu, H., Li, K. T., Li, D. H., Xie, Y. S., Li, L., Zhang, Y., Gu, X. F., Zhao, W., Tian, Q. J., Deng, R. R., Su, X. L., Huang, B., Qiao, Y. L., Cui, W. Y., Hu, Y., Gong, C. L., Wang, Y. Q., Wang, X. F., Wang, J. P., Du, W. B., Pan, Z. Q., Li, Z. Z., and Bu, D.: Comprehensive Study of Optical, Physical, Chemical, and Radiative Properties of Total Columnar Atmospheric Aerosols over China: An Overview of Sun–Sky Radiometer Observation Network (SONET) Measurements, B. Am. Meteorol. Soc., 99, 739–755, https://doi.org/10.1175/BAMS-D-17-0133.1, 2018.
Lippert, F., Barr, A. G., Herreras-Giralda, M., Momoi, M., Rejano, F., Lu, S., Hasekamp, O., Dubovik, O., Malina, E., and Landgraf, J.: Accelerating greenhouse gas retrievals with neural network-based forward models, EGUsphere [preprint], https://doi.org/10.5194/egusphere-2026-4724, 2026.
Liu, C., Wang, W., Sun, Y., and Shan, C.: TCCON data from Hefei (PRC), Release GGG2020.1.R1 (Version R1), CaltechDATA [data set], https://doi.org/10.14291/tccon.ggg2020p1.hefei01.R1, 2026.
Lloret, Z., Chevallier, F., and Cozic, A.: Refining the Global Picture: the Impact of Increased Resolution on CO2 Atmospheric Inversions using OCO-2 XCO2 retrievals, Authorea [preprint], https://doi.org/10.22541/au.171052488.85903583/v1, 2024.
Lorente, A., Borsdorff, T., Martinez-Velarte, M. C., Butz, A., Hasekamp, O. P., Wu, L., and Landgraf, J.: Evaluation of the methane full-physics retrieval applied to TROPOMI ocean sun glint measurements, Atmos. Meas. Tech., 15, 6585–6603, https://doi.org/10.5194/amt-15-6585-2022, 2022.
Mauceri, S., O'Dell, C. W., McGarragh, G., and Natraj, V.: Radiative Transfer Speed-Up Combining Optimal Spectral Sampling With a Machine Learning Approach, Frontiers in Remote Sensing, 3, https://doi.org/10.3389/frsen.2022.932548, 2022.
Noël, S., Reuter, M., Buchwitz, M., Borchardt, J., Hilker, M., Bovensmann, H., Burrows, J. P., Di Noia, A., Suto, H., Yoshida, Y., Buschmann, M., Deutscher, N. M., Feist, D. G., Griffith, D. W. T., Hase, F., Kivi, R., Morino, I., Notholt, J., Ohyama, H., Petri, C., Podolske, J. R., Pollard, D. F., Sha, M. K., Shiomi, K., Sussmann, R., Té, Y., Velazco, V. A., and Warneke, T.: XCO2 retrieval for GOSAT and GOSAT-2 based on the FOCAL algorithm, Atmos. Meas. Tech., 14, 3837–3869, https://doi.org/10.5194/amt-14-3837-2021, 2021.
Noël, S., Reuter, M., Buchwitz, M., Borchardt, J., Hilker, M., Schneising, O., Bovensmann, H., Burrows, J. P., Di Noia, A., Parker, R. J., Suto, H., Yoshida, Y., Buschmann, M., Deutscher, N. M., Feist, D. G., Griffith, D. W. T., Hase, F., Kivi, R., Liu, C., Morino, I., Notholt, J., Oh, Y.-S., Ohyama, H., Petri, C., Pollard, D. F., Rettinger, M., Roehl, C., Rousogenous, C., Sha, M. K., Shiomi, K., Strong, K., Sussmann, R., Té, Y., Velazco, V. A., Vrekoussis, M., and Warneke, T.: Retrieval of greenhouse gases from GOSAT and GOSAT-2 using the FOCAL algorithm, Atmos. Meas. Tech., 15, 3401–3437, https://doi.org/10.5194/amt-15-3401-2022, 2022.
Oshchepkov, S., Bril, A., and Yokota, T.: PPDF-based method to account for atmospheric light scattering in observations of carbon dioxide from space, J. Geophys. Res.-Atmos., 113, https://doi.org/10.1029/2008JD010061, 2008.
Parker, R. J., Boesch, H., Byckling, K., Webb, A. J., Palmer, P. I., Feng, L., Bergamaschi, P., Chevallier, F., Notholt, J., Deutscher, N., Warneke, T., Hase, F., Sussmann, R., Kawakami, S., Kivi, R., Griffith, D. W. T., and Velazco, V.: Assessing 5 years of GOSAT Proxy XCH4 data and associated uncertainties, Atmos. Meas. Tech., 8, 4785–4801, https://doi.org/10.5194/amt-8-4785-2015, 2015.
Parker, R. J., Webb, A., Boesch, H., Somkuti, P., Barrio Guillo, R., Di Noia, A., Kalaitzi, N., Anand, J. S., Bergamaschi, P., Chevallier, F., Palmer, P. I., Feng, L., Deutscher, N. M., Feist, D. G., Griffith, D. W. T., Hase, F., Kivi, R., Morino, I., Notholt, J., Oh, Y.-S., Ohyama, H., Petri, C., Pollard, D. F., Roehl, C., Sha, M. K., Shiomi, K., Strong, K., Sussmann, R., Té, Y., Velazco, V. A., Warneke, T., Wennberg, P. O., and Wunch, D.: A decade of GOSAT Proxy satellite CH4 observations, Earth Syst. Sci. Data, 12, 3383–3412, https://doi.org/10.5194/essd-12-3383-2020, 2020.
Peters, W., Jacobson, A. R., Sweeney, C., Andrews, A. E., Conway, T. J., Masarie, K., Miller, J. B., Bruhwiler, L. M. P., Pétron, G., Hirsch, A. I., Worthy, D. E. J., van der Werf, G. R., Randerson, J. T., Wennberg, P. O., Krol, M. C., and Tans, P. P.: An atmospheric perspective on North American carbon dioxide exchange: CarbonTracker, P. Natl. Acad. Sci. USA, 104, 18925–18930, https://doi.org/10.1073/pnas.0708986104, 2007.
Predybaylo, E., Lelieveld, J., Pozzer, A., Gromov, S., Zimmermann, P., Osipov, S., Klingmüller, K., Steil, B., Stenchikov, G., and McCabe, M.: Surface temperature and ozone responses to the 2030 Global Methane Pledge, Climatic Change, 178, 78, https://doi.org/10.1007/s10584-025-03908-5, 2025.
Ran, L., Deng, Z. Z., Wang, P. C., and Xia, X. A.: Black carbon and wavelength-dependent aerosol absorption in the North China Plain based on two-year aethalometer measurements, Atmos. Environ., 142, 132–144, https://doi.org/10.1016/j.atmosenv.2016.07.014, 2016.
Reuter, M., Buchwitz, M., Schneising, O., Noël, S., Bovensmann, H., Burrows, J. P., Boesch, H., Di Noia, A., Anand, J., Parker, R. J., Somkuti, P., Wu, L., Hasekamp, O. P., Aben, I., Kuze, A., Suto, H., Shiomi, K., Yoshida, Y., Morino, I., Crisp, D., O'Dell, C. W., Notholt, J., Petri, C., Warneke, T., Velazco, V. A., Deutscher, N. M., Griffith, D. W. T., Kivi, R., Pollard, D. F., Hase, F., Sussmann, R., Té, Y. V., Strong, K., Roche, S., Sha, M. K., De Mazière, M., Feist, D. G., Iraci, L. T., Roehl, C. M., Retscher, C., and Schepers, D.: Ensemble-based satellite-derived carbon dioxide and methane column-averaged dry-air mole fraction data sets (2003–2018) for carbon and climate applications, Atmos. Meas. Tech., 13, 789–819, https://doi.org/10.5194/amt-13-789-2020, 2020.
Schepers, D., Guerlet, S., Butz, A., Landgraf, J., Frankenberg, C., Hasekamp, O., Blavier, J. F., Deutscher, N. M., Griffith, D. W. T., Hase, F., Kyro, E., Morino, I., Sherlock, V., Sussmann, R., and Aben, I.: Methane retrievals from Greenhouse Gases Observing Satellite (GOSAT) shortwave infrared measurements: Performance comparison of proxy and physics retrieval algorithms, J. Geophys. Res.-Atmos., 117, https://doi.org/10.1029/2012JD017549, 2012.
Schneising, O., Buchwitz, M., Burrows, J. P., Bovensmann, H., Reuter, M., Notholt, J., Macatangay, R., and Warneke, T.: Three years of greenhouse gas column-averaged dry air mole fractions retrieved from satellite – Part 1: Carbon dioxide, Atmos. Chem. Phys., 8, 3827–3853, https://doi.org/10.5194/acp-8-3827-2008, 2008.
Schneising, O., Buchwitz, M., Reuter, M., Bovensmann, H., Burrows, J. P., Borsdorff, T., Deutscher, N. M., Feist, D. G., Griffith, D. W. T., Hase, F., Hermans, C., Iraci, L. T., Kivi, R., Landgraf, J., Morino, I., Notholt, J., Petri, C., Pollard, D. F., Roche, S., Shiomi, K., Strong, K., Sussmann, R., Velazco, V. A., Warneke, T., and Wunch, D.: A scientific algorithm to simultaneously retrieve carbon monoxide and methane from TROPOMI onboard Sentinel-5 Precursor, Atmos. Meas. Tech., 12, 6771–6802, https://doi.org/10.5194/amt-12-6771-2019, 2019.
Shen, N., Tan, J., Wang, W., Xue, W., Wang, Y., Huang, L., Yan, G., Song, Y., and Li, L.: Long-term changes of methane emissions from rice cultivation during 2000–2060 in China: Trends, driving factors, predictions and policy implications, Environ. Int., 191, 108958, https://doi.org/10.1016/j.envint.2024.108958, 2024.
SRON Netherlands Institute for Space Research: SRON Scientific GOSAT-2 Level 2 Data Products for XCO2 and XCH4 (Version 2.2.0), SRON [data set], https://doi.org/10.5281/zenodo.22637354, 2026.
Suto, H., Kataoka, F., Kikuchi, N., Knuteson, R. O., Butz, A., Haun, M., Buijs, H., Shiomi, K., Imai, H., and Kuze, A.: Thermal and near-infrared sensor for carbon observation Fourier transform spectrometer-2 (TANSO-FTS-2) on the Greenhouse gases Observing SATellite-2 (GOSAT-2) during its first year in orbit, Atmos. Meas. Tech., 14, 2013–2039, https://doi.org/10.5194/amt-14-2013-2021, 2021.
Tian, Y., Hong, X., Shan, C., Sun, Y., Wang, W., Zhou, M., Wang, P., Lin, P., and Liu, C.: Investigating the Performance of Carbon Monoxide and Methane Observations from Sentinel-5 Precursor in China, Remote Sensing, 14, 6045, https://doi.org/10.3390/rs14236045, 2022.
Toon, G., Blavier, J.-F., Washenfelder, R., Wunch, D., Keppel-Aleks, G., Wennberg, P., Connor, B., Sherlock, V., Griffith, D., Deutscher, N., and Notholt, J.: Total Column Carbon Observing Network (TCCON), in: Advances in Imaging, Vancouver, 26 April 2009, JMA3, https://doi.org/10.1364/FTS.2009.JMA3, 2009.
UNEP and CCAC: Global Methane Assessment: Benefits and Costs of Mitigating Methane Emissions, United Nations Environment Programme, Nairobi, Kenya, https://www.unep.org/resources/report/global-methane-assessment-benefits-and-costs-mitigating-methane-emissions (last access: 27 September 2026), 2021.
van Soest, H. L., den Elzen, M. G. J., and van Vuuren, D. P.: Net-zero emission targets for major emitting countries consistent with the Paris Agreement, Nat. Commun., 12, https://doi.org/10.1038/s41467-021-22294-x, 2021.
Wang, W., Tian, Y., Liu, C., Sun, Y., Liu, W., Xie, P., Liu, J., Xu, J., Morino, I., Velazco, V. A., Griffith, D. W. T., Notholt, J., and Warneke, T.: Investigating the performance of a greenhouse gas observatory in Hefei, China, Atmos. Meas. Tech., 10, 2627–2643, https://doi.org/10.5194/amt-10-2627-2017, 2017.
WMO: State of the Global Climate 2024, World Meteorological Organization, Geneva, Switzerland, WMO-No. 1368, 42, https://wmo.int/publication-series/state-of-global-climate/state-of-global-climate-2024 (last access: 27 September 2026), 2025.
WMO: State of the Global Climate 2025, World Meteorological Organization, Geneva, Switzerland, WMO-No. 1391, 46, https://wmo.int/publication-series/state-of-global-climate/state-of-global-climate-2025, last access: 27 September 2026.
Wu, L. H.: Algorithm Theoretical Basis Document (ATBD) – ANNEX C for product CH4_GOS_SRPR (v2.3.9, 2009–mid2020), SRON Netherlands Institute for Space Research, Groningen, https://www.iup.uni-bremen.de/carbon_ghg/docs/C3S/CDR5_2003-mid2020/C3S_D312b_Lot2.1.3.2-v3.0_ATBD-GHG_ANNEX-C_v5.0.pdf (last access: 27 September 2026), 2021a.
Wu, L. H.: Product User Guide and Specification (PUGS) – ANNEX C for product CH4_GOS_SRPR (v2.3.9, 2009–mid2020), SRON Netherlands Institute for Space Research, the Netherlands, https://www.iup.uni-bremen.de/carbon_ghg/docs/C3S/CDR5_2003-mid2020/C3S_D312b_Lot2.3.2.3-v3.0_PUGS-GHG_ANNEX-C_v5.0.pdf (last access: 27 September 2026), 2021b.
Wunch, D., Toon, G. C., Sherlock, V., Deutscher, N. M., Liu, C., Feist, D. G., and Wennberg, P. O.: The Total Carbon Column Observing Network's GGG2014 Data Version, CaltechDATA, Pasadena, California, https://doi.org/10.14291/TCCON.GGG2014.DOCUMENTATION.R0/1221662, 2015.
Xuehua, F., Xia, X., and Chen, H.: Comparison of column-integrated aerosol optical and physical properties in an urban and suburban site on the North China Plain, Adv. Atmos. Sci., 32, 477–486, https://doi.org/10.1007/s00376-014-4097-0, 2015.
Yang, Y., Zhou, M., Langerock, B., Sha, M. K., Hermans, C., Wang, T., Ji, D., Vigouroux, C., Kumps, N., Wang, G., De Mazière, M., and Wang, P.: New ground-based Fourier-transform near-infrared solar absorption measurements of XCO2, XCH4 and XCO at Xianghe, China, Earth Syst. Sci. Data, 12, 1679–1696, https://doi.org/10.5194/essd-12-1679-2020, 2020.
Yokota, T., Yoshida, Y., Eguchi, N., Ota, Y., Tanaka, T., Watanabe, H., and Maksyutov, S.: Global Concentrations of CO2 and CH4 Retrieved from GOSAT: First Preliminary Results, SOLA – Scientific Online Letters on the Atmosphere, 5, 160–163, https://doi.org/10.2151/sola.2009-041, 2009.
Yuan, Y., Ries, L., Petermeier, H., Trickl, T., Leuchner, M., Couret, C., Sohmer, R., Meinhardt, F., and Menzel, A.: On the diurnal, weekly, and seasonal cycles and annual trends in atmospheric CO2 at Mount Zugspitze, Germany, during 1981–2016, Atmos. Chem. Phys., 19, 999–1012, https://doi.org/10.5194/acp-19-999-2019, 2019.
Zheng, B., Hu, W., Necki, J., Tiwari, P., Cohen, J. B., and Qin, K.: Novel lightweight based coal mine methane emission framework exhibits transferability between observations in Poland and Shanxi, Environmental Research Communications, 8, 065064, https://doi.org/10.1088/2515-7620/ae67e9, 2026.
Zhou, M., Wang, P., Kumps, N., Hermans, C., and Nan, W.: TCCON data from Xianghe, China, Release GGG2020.R0 (R0), CaltechDATA [data set], https://doi.org/10.14291/tccon.ggg2020.xianghe01.R0, 2022.
Zhou, M., Wang, P., Kumps, N., Hermans, C., and Nan, W.: TCCON data from Xianghe, China, Release GGG2020.1.R0 (Version R0), CaltechDATA [data set], https://doi.org/10.14291/tccon.ggg2020p1.xianghe01.R0, 2026.
- Abstract
- Introduction
- Data
- Validation against TCCON
- Influence of aerosols on XCH4
- Discussion
- Conclusions
- Appendix A: Supplementary Validation Results
- Appendix B: Results from Alternative Matching Schemes
- Data availability
- Author contributions
- Competing interests
- Disclaimer
- Acknowledgements
- Financial support
- Review statement
- References