the Creative Commons Attribution 4.0 License.
the Creative Commons Attribution 4.0 License.
 | 29 Jan 2026
Seasonal variability, sources, and parameterization of ice-nucleating particles in the Rocky Mountain region: importance of soil dust and biological contributions
Ruichen Zhou
Drew Juergensen
Kevin Barry
Kelton Ayars
Oren Dutton
Paul DeMott
Sonia Kreidenweis
Atmospheric ice-nucleating particles (INPs) significantly influence cloud microphysics and aerosol-cloud interactions. Understanding INPs in mountain regions is important for predicting impacts on regional clouds and precipitation. In this study, we conducted comprehensive measurements of immersion-freezing INPs at Mt. Crested Butte in the Rocky Mountains from September 2021 to June 2023 as part of the Surface Atmosphere Integrated Field Laboratory (SAIL) campaign. The average number concentration of INPs active at −20 °C was 2 L−1, with distinct seasonal variation characterized by high summer concentrations and low winter concentrations. Aerosol sources were resolved, and INP concentrations were correlated with a coarse dust aerosol type, which dominates PM10 in this region. Calculating IN active surface site densities (ns) further supporting the primary contribution from coarse dust to INPs. Treatment with H2O2 indicated substantial contributions (91 % on average) from organic INPs across all activation temperatures, suggesting that supermicron organic-containing soil dust dominates the INPs in this region. Heat-labile INPs, likely biological in origin, were identified as dominant at °C through heat treatment of samples and showed significantly lower contributions in winter (∼ 96 % reduction). Parameterizations based on ns for the INPs observed in this mountainous region were developed, which effectively reproduced measured INP concentrations, particularly when accounting for seasonal differences. This study provides the first long-term, comprehensive characterization of INPs for the Upper Colorado River Basin region and offers a parameterization potentially useful for predicting INPs in other remote continental regions.
- Article
(12565 KB) - Full-text XML
-
Supplement
(4395 KB) - BibTeX
- EndNote


Atmospheric aerosols play critical roles in forming clouds, and inadequate understanding of aerosol-cloud interactions presents one of the largest uncertainties in predicting global climate (IPCC, 2022; Seinfeld et al., 2016). The subset of aerosol particles that serves as ice-nucleating particles (INPs) can trigger heterogeneous freezing of cloud water droplets, allowing them to freeze above the homogeneous freezing temperature (approximately −38 °C) (Hoose and Möhler, 2012). Among the mechanisms of heterogeneous freezing, this immersion freezing process is considered the most important process for mixed-phase clouds, which are common at midlatitudes in all seasons (Kanji et al., 2017; de Boer et al., 2011). These INPs are responsible for a significant proportion of initial cloud ice phase formation, thus impacting the Earth's radiative balance and precipitation (Lohmann and Feichter, 2005; Kanji et al., 2017; Burrows et al., 2022). Although INPs are increasingly a focus of study, the sources and abundances of INPs are not well characterized for many regions.
Various aerosol sources have been found to contribute to INPs, including natural and anthropogenic sources (Kanji et al., 2017). Atmospheric mineral dust particles are considered a dominant contributor of INPs throughout much of the troposphere (Murray et al., 2012; Hoose and Möhler, 2012), and they produce high INP concentrations in a mass or surface area basis at temperatures lower than −15 °C (Atkinson et al., 2013; Kiselev et al., 2017). Mineral INPs are inorganic components that are lofted from rock or soil and can undergo long range transport to remote areas (Knippertz and Stuut, 2014). In contrast, soil dusts from agricultural or grazed fields (arable soils) were suggested to contribute 25 % of the global dust burden (Ginoux et al., 2012), and were found to initiate ice nucleation at temperatures as high as −6 °C (Garcia et al., 2012; O'Sullivan et al., 2014). Organics in arable soil dust are suggested as the main contributors to their ice nucleating ability (Tobo et al., 2014; Hill et al., 2016). Biomass burning aerosols and fly ash also contribute to INP populations and have received increasing attention under global warming and the accompanying more frequent and intense wildfires (Prenni et al., 2012; McCluskey et al., 2014; Umo et al., 2015). Biomass burning aerosols typically present lower ice nucleating ability, defined as the IN active surface site density for ice nucleation on particle surfaces (i.e., INP concentration/aerosol surface area concentration), compared to dust particles, while atmospheric aging can potentially enhance their ice nucleating ability (Jahl et al., 2021). Biogenic aerosols, such as primary biological particles composed of bacteria, pollen, fungal spores, and their fragments, were identified in the 1970s as important INP sources (Vali and Schnell, 2024; Schnell and Vali, 2024). They typically can activate ice formation at a warmer temperature than other INPs listed above and thus may control first ice formation in clouds (Pratt et al., 2009; Creamean et al., 2013; Tobo et al., 2013). Besides these INP sources, marine aerosol (Wilson et al., 2015; McCluskey et al., 2018b), secondary organic aerosol, and fuel-combustion aerosols can contribute to INPs (Kanji et al., 2017).
To estimate INPs for use in numerical cloud models, early parameterizations were typically based on empirical relationships between INPs and temperature or supersaturation alone (Bigg, 1953; Meyers et al., 1992). These parameterizations could show large biases compared to field observations. DeMott et al. (2010) proposed a widely used parameterization based on temperature and number concentrations of particles larger than 0.5 µm in diameter, which has been applied in global and regional models due to its convenience and independence from detailed aerosol composition (Miltenberger et al., 2018; Storelvmo et al., 2011; Burrows et al., 2022). However, recent studies highlight the need for more physically based and source-specific parameterizations (Burrows et al., 2022; Shi and Liu, 2019; DeMott et al., 2015). Laboratory and field studies have shown that different aerosol types (e.g., mineral dust, biological particles, marine aerosols) exhibit distinct ice-nucleating efficiencies (Hoose and Möhler, 2012; Kanji et al., 2017). Parameterizations based on the ice-nucleating IN active surface site density (ns(T)) have been developed for various aerosol types under immersion freezing conditions (Niemand et al., 2012; DeMott et al., 2015; Harrison et al., 2019; McCluskey et al., 2018a; Umo et al., 2015; Schill et al., 2020; Tobo et al., 2014; O'Sullivan et al., 2014). Further field observations and laboratory studies are needed to improve these parameterizations and reduce uncertainties in INP predictions.
Mountainous regions, covering approximately one-quarter of the global land surface, play a critical role in regional and global hydrological and climatic systems. Importantly, they are sources of freshwater supporting nearly half of the world's population (Viviroli et al., 2007). Cloud and precipitation formation in mountainous areas are strongly influenced by aerosol–cloud interactions (Lynn et al., 2007). The presence, variability, and sources of INPs in mountain areas can significantly affect cloud phase, lifetime, and precipitation efficiency (Creamean et al., 2013; Lynn et al., 2007). However, INP observations in mountain environments, especially for long-term continuous measurements, are limited (Lacher et al., 2018; Sun et al., 2024; Conen et al., 2015), hampering our understanding of INP major sources, seasonal variation, and the influence of complex mountain terrain on their vertical distribution. Improved understanding of INPs in mountainous regions is essential for better representation of clouds and precipitation formation in weather and climate models, and for predicting future changes in water availability under global climate change regimes.
The Surface Atmosphere Integrated Field Laboratory (SAIL) Campaign, conducted from September 2021 to June 2023 in the Upper Colorado River Basin of the Rocky Mountains, included aims to improve understanding of how aerosols, particularly long-range transported dust and wildfire smoke, affect the surface energy and water balance through their impacts on cloud, precipitation, and surface albedo, and how these effects vary by season (Feldman et al., 2023). This campaign provided a unique opportunity to investigate INPs in the Colorado Rocky Mountains over a nearly two-year period. This study presents comprehensive measurements of immersion-freezing INPs, including their seasonal and temperature-dependent variability, as well as associations with aerosol sources. We further explore different INP compositional types, biological/heat-labile, other organic, and inorganic INPs, and their inter-relationships, highlighting the importance of organic INPs. A parametrization method is proposed for INPs in this region that reproduces the observed two-year INP concentration record.
2.1 Sampling site and sample collection
The SAIL campaign deployed the Department of Energy Atmospheric Radiation Measurement (DOE ARM) Mobile Facility 2 (AMF-2) at the East River Watershed, which is located near Crested Butte and Gothic, Colorado (Feldman et al., 2023). This mountainous region, with elevations ranging from ∼ 2440 to 4350 m above sea level, is characterized by complex terrain, a deep seasonal snowpack, and pronounced hydrometeorological gradients. The region experiences strong seasonal contrasts, with cold snowy winter and warm summers influenced by convective activity associated with the North American monsoon (Feldman et al., 2023).
For INP analyses, aerosol filter samples were collected by DOE ARM technicians through the INP Mentor Program approximately every three days from September 2021 to June 2023, with each sampling period lasting about 24 hours, as described in the instrument handbook (Creamean et al., 2024) and repeated briefly here. Aerosols were collected on two 47 mm Nuclepore polycarbonate filters (0.2 µm pore size) at flow rates in the range of 10–18 L min−1, with total sampling volumes of approximately 15 000 to 25 000 L. For computing atmospheric concentrations in this study, the sampling volume was corrected to standard temperature (273.15 K) and pressure (101.3 kPa). Prior to sampling, the filters were cleaned using 10 % H2O2 and deionized (DI) water to remove organic and biological residues, then stored in sterile Petri dishes. For the first month (September 2021) of the campaign, samples were collected at the M1 site (38°57′22.35′′ N, 106°59′16.66′′ W; 2885 m above mean sea level (MSL)). From October 2021 to June 2023, samples were collected at the S2 site (38°53′52.66′′ N, 106°56′35.21′′ W; 3137 m MSL). The distance between M1 and S2 sites is about 8 km. The possible difference in INP concentrations at M1 in the first month is not addressed here, since this study is aimed at representing the INPs in this region, and there was no significant change in INP concentrations when moving from the M1 to the S2 site. All samples were stored at −20 °C after collection, during shipment, and until the analysis in the laboratory.
2.2 Laboratory Ice Spectrometer analysis of filter-collected particles
The immersion freezing ability of particles collected on filters was quantified using the Colorado State University (CSU) Ice Nucleation Spectrometer (INS), following established procedures (McCluskey et al., 2017; Hiranuma et al., 2015; Barry et al., 2021a), which are the same methods used by the DOE ARM INP Mentor Program (Creamean et al., 2024). The INP Mentor Program analyzed many of the samples from the SAIL campaign. Our analysis was used to fill gaps in time for the Mentor Program samples, and provide additional heat and hydrogen peroxide treatments, described below. Our data on these samples is provided within the Mentor Program data product (Shi et al., 2025). Briefly, exposed filters were mixed with 10 mL of filtered deionized water in a centrifuge tube, then rotated for 20 min using an end-over-end shaker to resuspend the particles. Aliquots of the resuspension solution were pipetted into a 96-well PCR tray and cooled at a rate of 0.33 °C min−1 from room temperature to −30 °C in the CSU INS. The number of frozen wells was recorded at 0.5 °C intervals. Cumulative INP concentrations as a function of temperature (nINPs(T), INPs per liter of air) were calculated based on the method of Vali (1971) using:
where N0 is the total number of wells containing aliquots, N(T) is the cumulative number of wells frozen at temperature T, Vw is the volume of water used for particle resuspension, Vc is the aliquot volume added to each well, and Va is the total sampled air volume. Counting uncertainties were estimated using binomial confidence intervals (Agresti and Coull, 1998). Field blank filters were collected every month by briefly exposing them at the sampling site for several seconds before storage. Before calculating INP concentrations, the average number of INPs versus temperature per blank filters was subtracted from the calculated number of INPs versus temperature per sample filter, to account for potential contamination during sampling and handling, as well as any residual contamination on the filters after cleaning.
To further characterize the types of INPs, portions of the suspended aerosol solution were subjected to heat and hydrogen peroxide (H2O2) treatments, followed by freezing analysis of aliquots of these portions. For heat treatment, the solution was heated to 95 °C for 21 min before measurement. This process inactivates the biological INPs by denaturation of proteins and removes heat-labile INPs (O'Sullivan et al., 2014; Tobo et al., 2014; Hill et al., 2016). In total, 43 samples were exposed to 95 °C heat treatment, and their temperature spectra are shown in Fig. S1 in the Supplement. In the peroxide treatment, 30 % H2O2 was added to the solution to make a final concentration of 10 %, and the mixture was heated at 95 °C for 21 min under UVB light to digest organics (Suski et al., 2018), and the INPs remaining were presumed to be inorganic. A total of 34 samples underwent H2O2 treatment, with their temperature spectra shown in Fig. S2. By comparing untreated (base), heat-treated, and H2O2-treated results, INPs were categorized into biological/heat-labile, other organic, and inorganic types. Daily et al. (2022) found that some minerals also showed reduced immersion-freezing activity after heat treatment; however, SAIL samples showed some difference with the behaviors they reported. For minerals with initial active temperatures °C, IN active surface site density either decreased at all measured temperatures (Arizona Test Dust (ATD) and Fluka Quartz) or was not sensitive to wet heating (K-feldspar) (Daily et al., 2022), differing from some spectra of SAIL samples that only showed decreases at warm temperatures and almost no change at temperatures °C (Fig. S1). This suggests that mineral INPs have limited contributions to the decreases of INP concentrations after heat treatment in the SAIL samples.
There were eight ground-based sites within 55 km of the SAIL sampling locations conducted orographic cloud seeding operations by North American Weather Consultants Inc., targeting precipitation enhancement. To the best of our knowledge, these seeding stations combusted solutions in a propane flame, producing particles containing silver iodide (AgI) and other inorganic salts that served as seeding aerosols. These seeding activities occurred in specific storm situations during winter and early spring and strongly impacted our INP observations. The measured concentrations of INPs active at temperatures from −7.5 to −27.5 °C for a total of 113 24 h samples are shown in Fig. S3. Since this work focuses on investigating the natural or background INPs in the Rocky Mountain region, samples collected on days that overlapped with artificial cloud seeding activities, as recorded in their logbook (data provided by North American Weather Consultants Inc.), are highlighted in Fig. S3 and excluded from the discussion below. Cloud seeding activities last less than 24 h, typically 4–8 h, and are unlikely to affect the subsequent sample collected 3 d later. Also, eight samples collected during winter exhibited distinct INPs spectra from other samples, but highly similar to the INP spectrum of Snomax®, a commercial non-living bacterial INP product used in snowmaking (Fig. S4a). Furthermore, P. syringae, the bacterium type in Snomax®, was identified in some of these samples based on qPCR analysis (Supplement Sect. S2, Fig. S4b). These samples are highly suspected to have been affected by snowmaking activities during wintertime, associated with the location of sampling site within a ski resort at Crested Butte. Therefore, these samples, along with those affected by cloud seeding activities, were excluded from the subsequent discussion to better understand the characteristics of natural INPs in the Rocky Mountain region.
2.3 Source apportionment
To investigate aerosol sources in the SAIL region, source apportionment was performed using positive matrix factorization (PMF). PMF is a receptor model that decomposes an observation matrix into factor profiles and their corresponding contributions related to emission sources and/or atmospheric processes, providing a quantitative assessment of source influences (Paatero and Tapper, 1994). Data from the Interagency Monitoring of Protected Visual Environments (IMPROVE) site at White River, located approximately 30 km north of the SAIL campaign site, were used for PMF analysis. The IMPROVE network (Malm et al., 1994) has collected 24 h aerosol filter samples every three days over several decades at this site, providing a valuable dataset to understand aerosol sources and their long-term variability in the region. Elemental analysis was performed on the Teflon filters using X-ray fluorescence (XRF), anions were analyzed using ion chromatography (IC), elemental carbon (EC) and organic carbon (OC) were analyzed using a carbon analyzer (Hand, 2023). Chemical concentrations in the PM2.5 fraction of nineteen elements (Al, As, Br, Ca, Cl, Cr, Cu, Fe, K, Mg, Mn, Na, Ni, Pb, Se, Si, Ti, V, and Zn), along with nitrate, sulfate, elemental carbon (EC), organic carbon (OC), and calculated coarse mass concentrations (PM10–PM2.5 mass concentrations), from January 2014 to April 2024 were used as input for the PMF analysis performed using EPA PMF 5.0 (Norris et al., 2014). IMPROVE species concentrations were reported based on local conditions.
A five-factor solution was selected as the optimal solution based on the value and interpretation of the physical meanings of the factors (Brown et al., 2015). The corresponding factor profiles and time series are shown in Figs. S5 and S6. These factors were identified, based on chemical signatures and previous literature, as coarse dust, fine dust, biomass burning, sulfate-dominated, and nitrate-dominated sources. Coarse and fine dusts had high contributions from Al, Ca, Fe, Mg, and Si, which are the main components of mineral dust (Liu and Hopke, 2003). Coarse dust explained more than 90 % of the coarse mass (> PM2.5), while there was no contribution from coarse mass in the fine dust factor. The biomass burning factor was strongly associated with organic and elemental carbon, which are mainly from combustion processes, and K, a tracer of biomass burning (Hopke et al., 2020). The other two factors are dominated by nitrate and sulfate, which are related to the formation of secondary aerosols and possibly some primary emissions from regional sources that include energy production and distant urban regions. Some similar factors were also resolved in published PMF analyses using IMPROVE data (Liu and Hopke, 2003; Hwang and Hopke, 2007). Further details on the PMF analysis and results, as well as support for their applicability over the broad surrounding Rocky Mountain region (IMPROVE sites at Mount Zirkel and Rocky Mountain National Park) are provided in Sect. S1 and Fig. S7. Data for the PMF results are available through the ARM data product (Zhou et al., 2025a).
To assess the impact of different sources on INPs, the INP samples were categorized into six types based on the dominant aerosol sources during the sampling period, and the contribution of sources to each sample was shown in Fig. S8. However, IMPROVE samples were taken only one of every three days. For days without available IMPROVE data, aerosol sources were inferred from the nearest sampling days. Samples were classified as follows: (1) Coarse dust, if coarse dust contributed more than 50 % to the total PM10 mass concentration or contributed more than 40 % and represented the largest contribution among all sources; (2) Biomass burning, if biomass burning accounted for more than 50 % of the total PM10; (3) Dust, if the combined contribution of coarse and fine dust exceeded 50 % of the total PM10, with the difference between fine and coarse dust being less than 20 %; (4) Fine dust, if the combined mass contribution of coarse and fine dust exceeded 50 % of the PM10 and fine dust exceeded coarse dust by more than 20 %; (5) Mixed samples, samples for which no single source was dominant, typically characterized by a sulfate contribution greater than 20 % of the PM10. (6) Additionally, seven samples fell within periods where more than one consecutive IMPROVE sample was missing (one week or longer). For these cases, source contributions were not interpolated, and they were categorized as samples with no source data. Source influences inferred from the nearest sampling days may introduce uncertainties. However, the merged size distribution data (Sect. 2.5 and Fig. 2) for these days showed similar size distribution patterns and comparable number concentrations for most size ranges compared to the nearest days, suggesting that significant changes in aerosol sources for these inferred days were limited. Also, the discussion is based on each group containing multiple samples, which should also reduce the uncertainties associated with the inferred source from a single sample.
2.4 Back trajectory analysis
Air mass back trajectory analysis was performed using the Hybrid Single-Particle Lagrangian Integrated Trajectory model (HYSPLIT; Stein et al., 2015; Rolph et al., 2017), developed by the National Oceanic and Atmospheric Administration (NOAA) Air Resources Laboratory. For each hour during each sampling period (typically 24 h), a 96 h back trajectory was initiated at the SAIL sampling site, starting 100 m above ground level, and using the GDAS meteorological dataset with model vertical velocity. The areas traversed by the back trajectory were gridded into 1°×1° cells. For each trajectory, its occurrence in each grid cell was weighted by the residence time spent in that cell. To account for the peak in occurrence near the sampling site, the residence times were further normalized by the distance from the SAIL sampling site, following the method of Ashbaugh et al. (1985). The analysis was performed for each sample, and the resulting trajectories were aggregated to produce a composite residence-time map (Fig. 1). Separate analyses were also performed for samples categorized by different source types (Fig. S9), aggregating hourly trajectories for all sample times of a corresponding type across the campaign. Back trajectory data are available through the ARM data product (Zhou et al., 2025b).
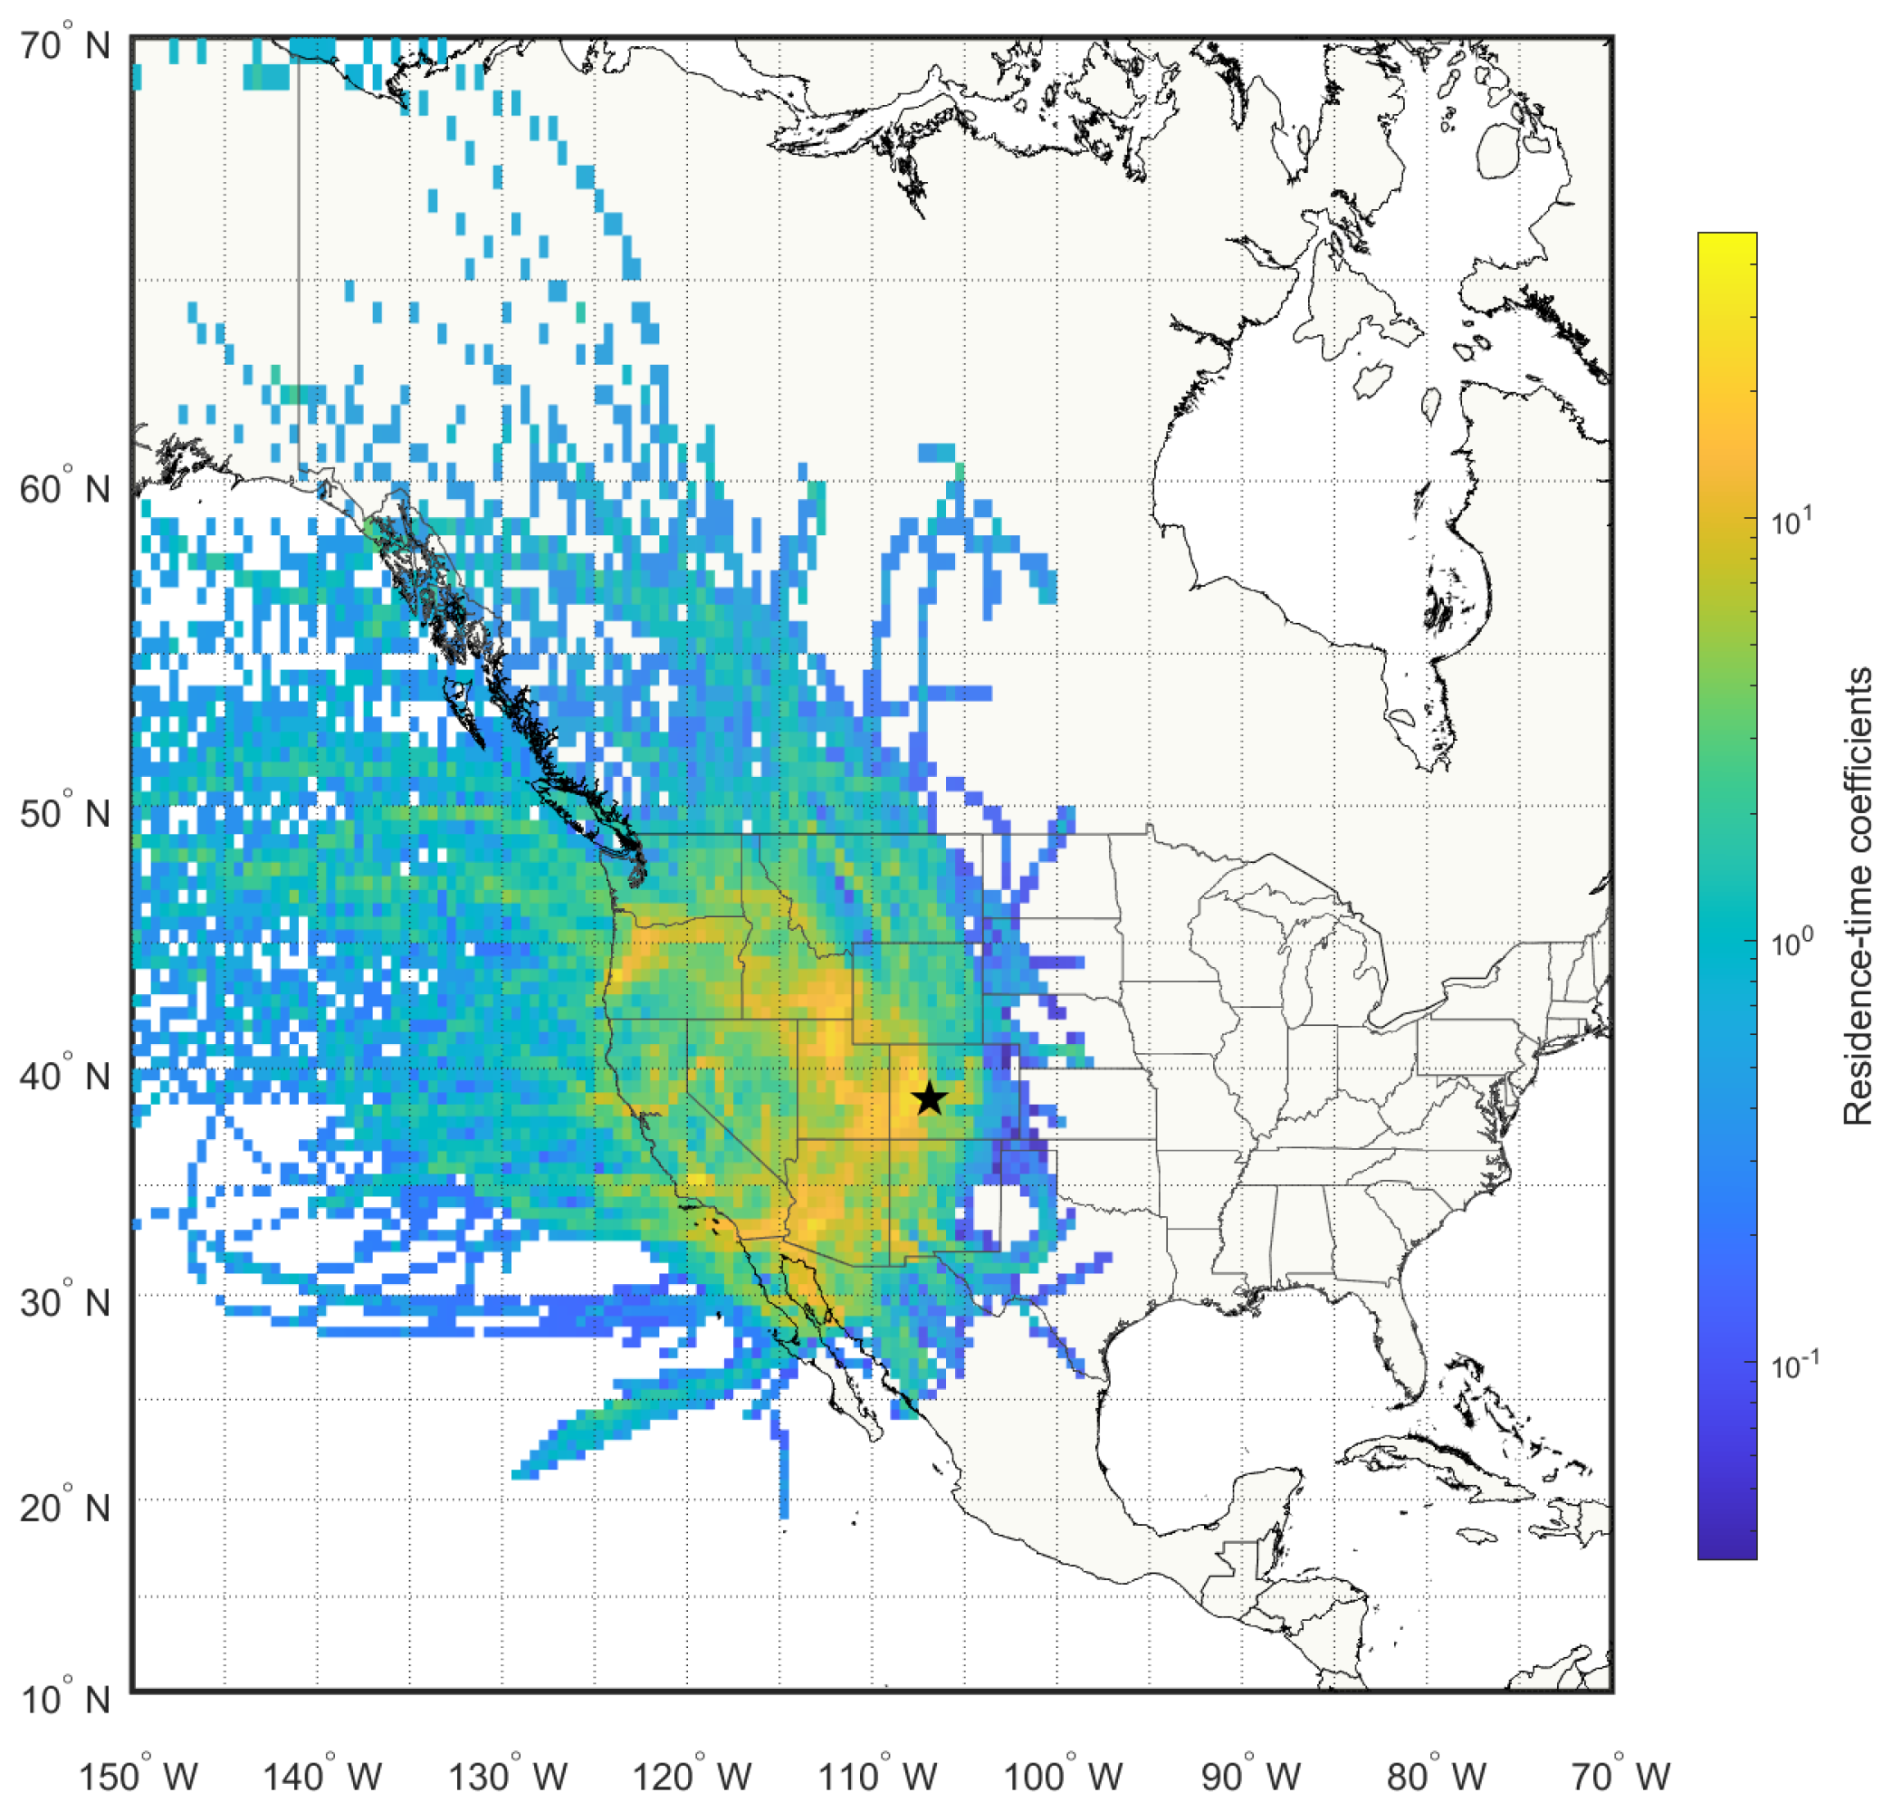
Figure 1Residence-time weighted back trajectories for all sampling periods. 96 h back trajectories were generated hourly during each sampling period and normalized by residence time and distance from the sampling site. The residence-time coefficients indicate the relative time air masses spent within each grid cell. The black star marks the SAIL sampling location.
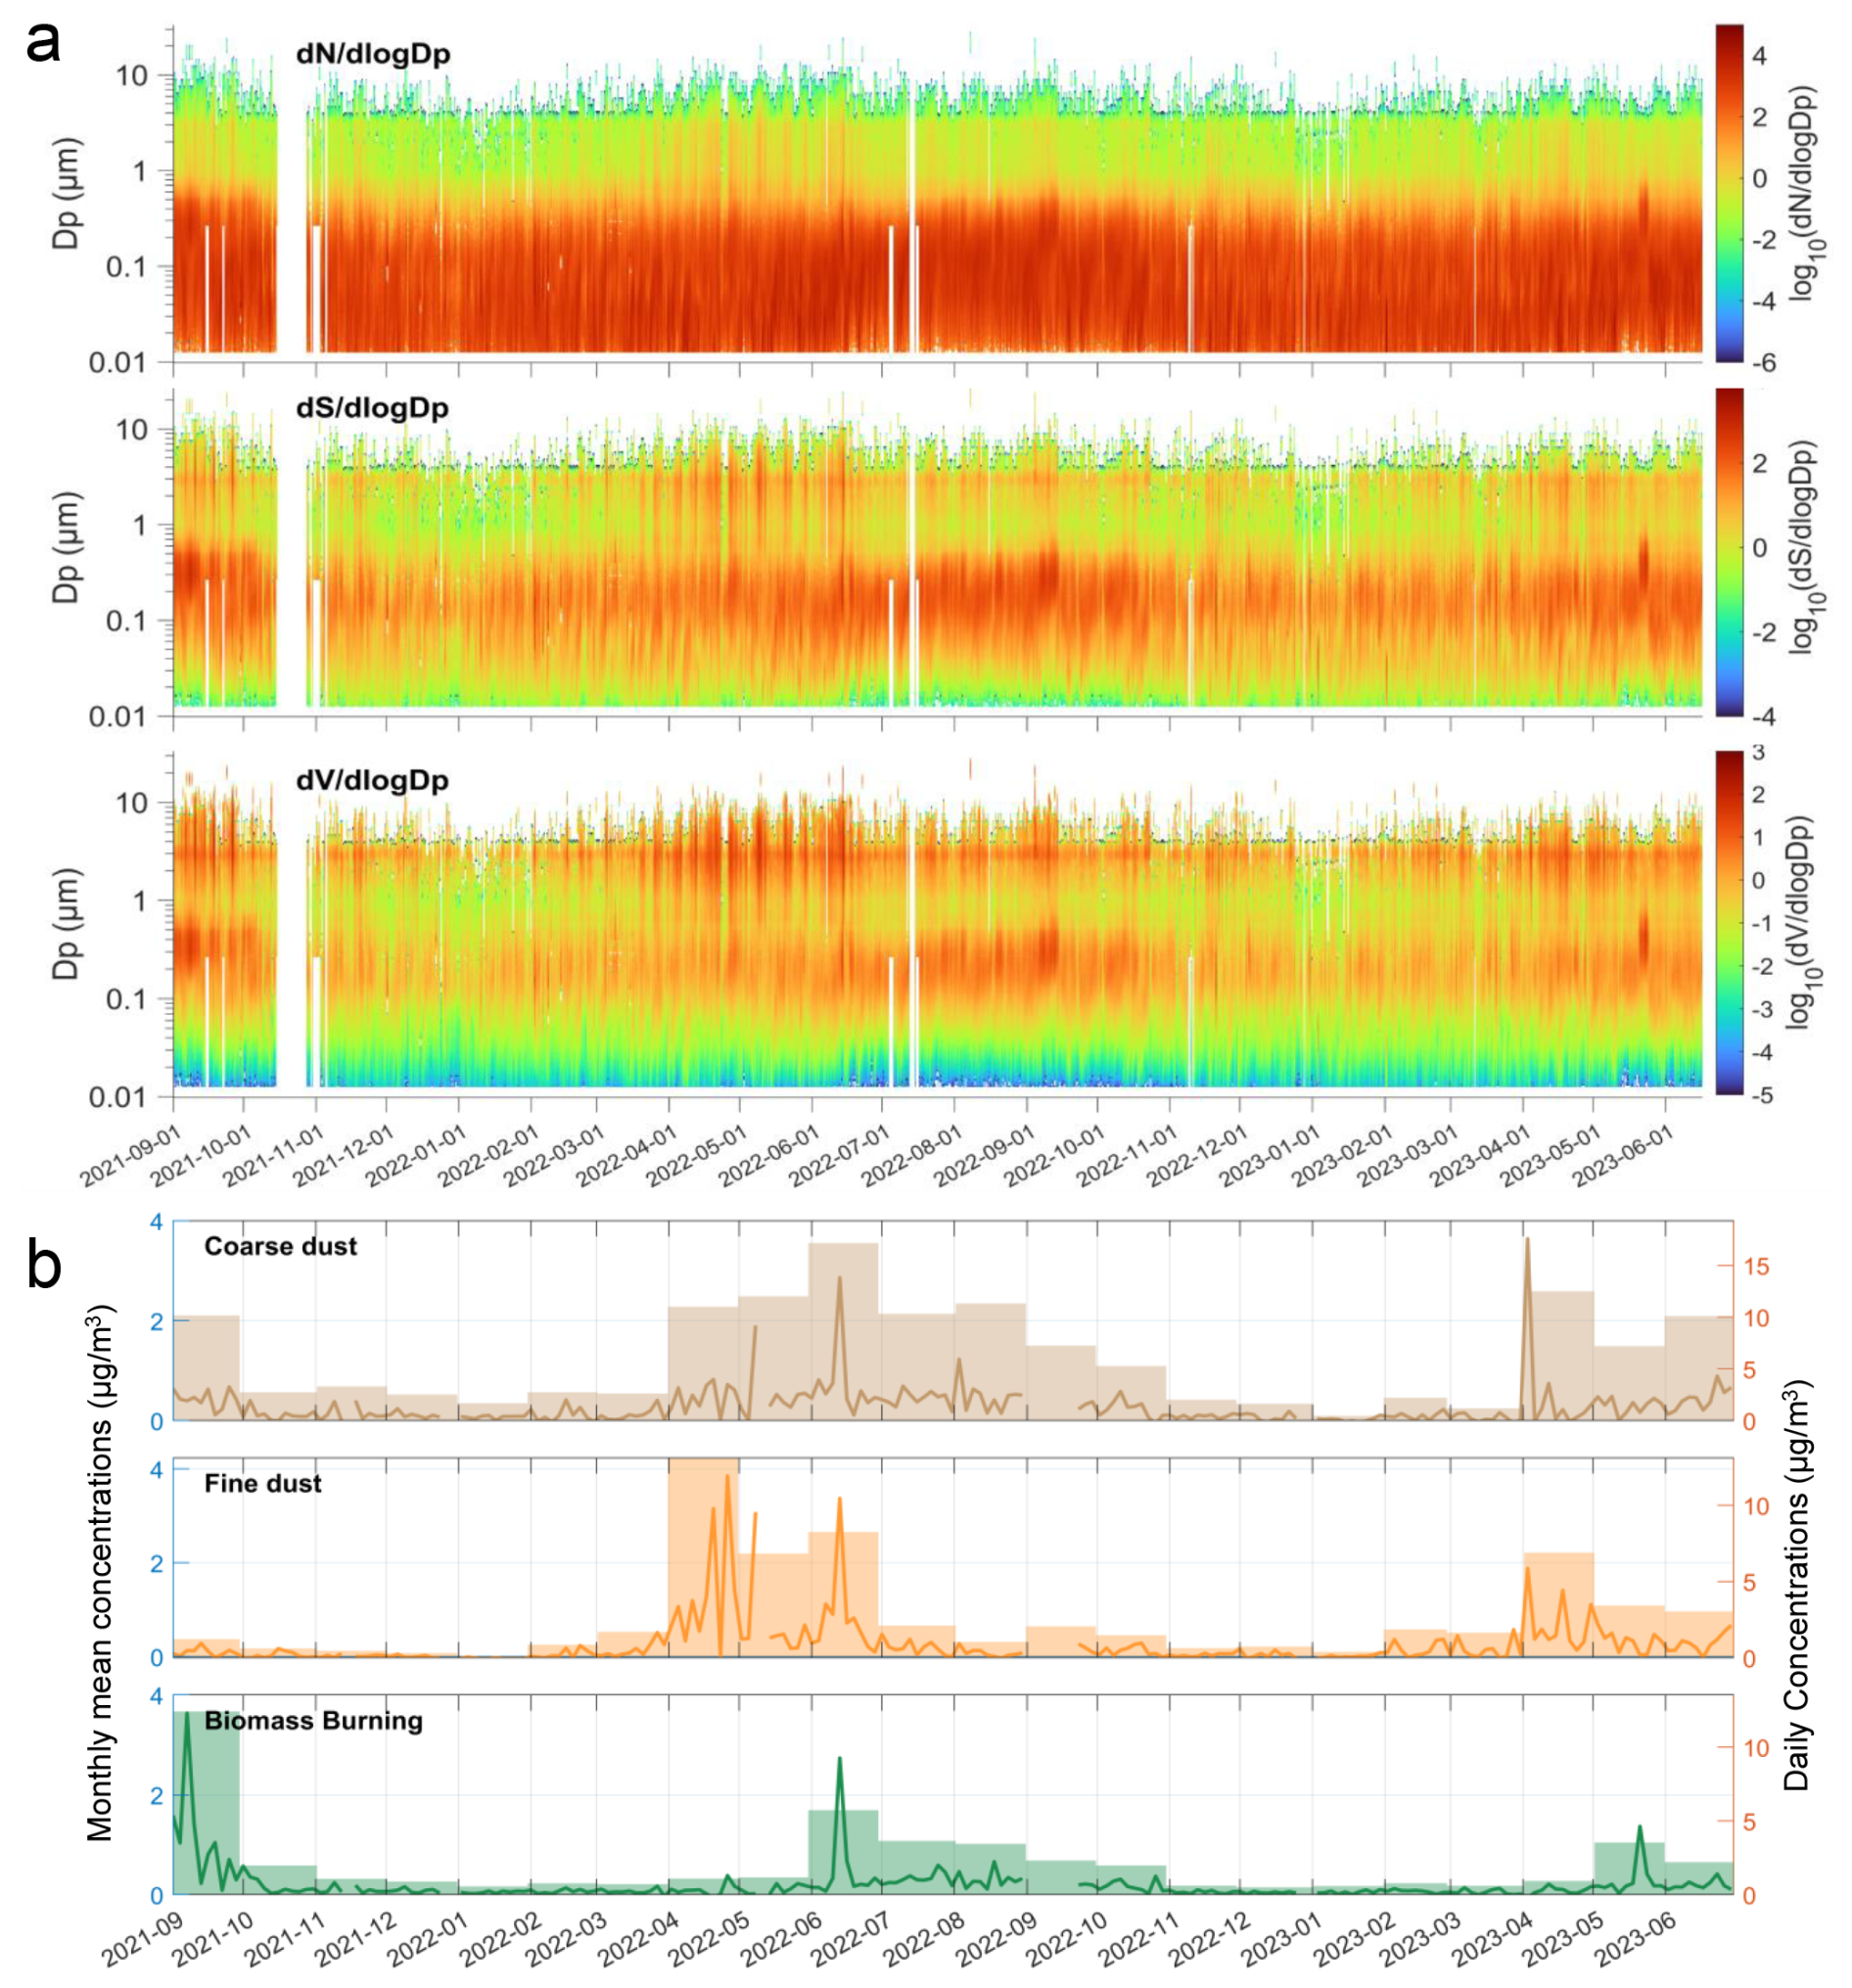
Figure 2(a) Number size distribution (, scm−3), surface area size distribution (, µm2 scm−3), and volume size distribution (, µm3 scm−3), derived from merged size distribution assuming spherical particles during the SAIL campaign. (b) Time series of aerosol mass concentrations (µg m−3) of coarse dust, fine dust, and biomass burning. Lines and bars represent daily and monthly mean concentrations, respectively.
2.5 Merged particle number-size distribution and IN active surface site density
During the SAIL campaign, a scanning-mobility particle sizer (SMPS) and an optical particle counter (OPC) were deployed simultaneously with the filter sample collection to measure aerosol number size distributions in the particle diameter ranges from 10–500 nm and 0.25–35 µm, respectively (Kuang et al., 2024; Cromwell et al., 2024). To obtain a continuous number size distribution from 10 nm to tens of micrometers, measured number size distributions from the SMPS and OPC were merged following previous methods (Hand and Kreidenweis, 2002; Marinescu et al., 2019). Briefly, the mobility diameters from the SMPS were assumed to be equal to volume equivalent diameters by assuming the particles are spherical, and number distributions were converted to volume distributions. A scaling factor was determined by comparing the overlapping size range of the two instruments, and the OPC volume size distribution was then aligned with the SMPS volume distribution measurements by shifting OPC measured diameters to estimate the SMPS mobility diameter corresponding to that optical diameter. All aerosol data from the ARM archive were corrected to standard temperature (273.15 K) and pressure (101.3 kPa). All merged size distribution data are available through the ARM data product (Zhou et al., 2025c). A timeline of the merged number-size distributions of aerosols during the SAIL campaign is shown in Fig. 2.
Assuming that the number of active ice nucleation sites is linearly proportional to the particle surface area, the IN active surface site density (m−2) at temperature T (ns(T), m−2) was calculated using the following equation:
where nINP(T) (sL−1) is the measured INP concentration at temperature T, Sm,500 (µm2 scm−3) is the surface area concentration of particles larger than 500 nm diameter calculated from the merged size distribution, assuming that particles are spherical, and the 109 conversion factor is used for ns,500 units of m−2. In this study, the surface area of particles >500 nm is used to exclude surface area associated with pollution and other aerosol types that are inefficient sources of INPs. This is supported by the correlation found between INP concentrations and the number concentrations of particles >500 nm in a previous study (DeMott et al., 2010). The ns is also calculated based on total surface area concentrations to facilitate comparison with other studies and is shown in Fig. S10. While the IN active surface site density approach is typically fully justified for single INP compositions, we will apply it here to the total surface areas, but also discuss adjustments needed when comparing to more specific INP parameterizations.
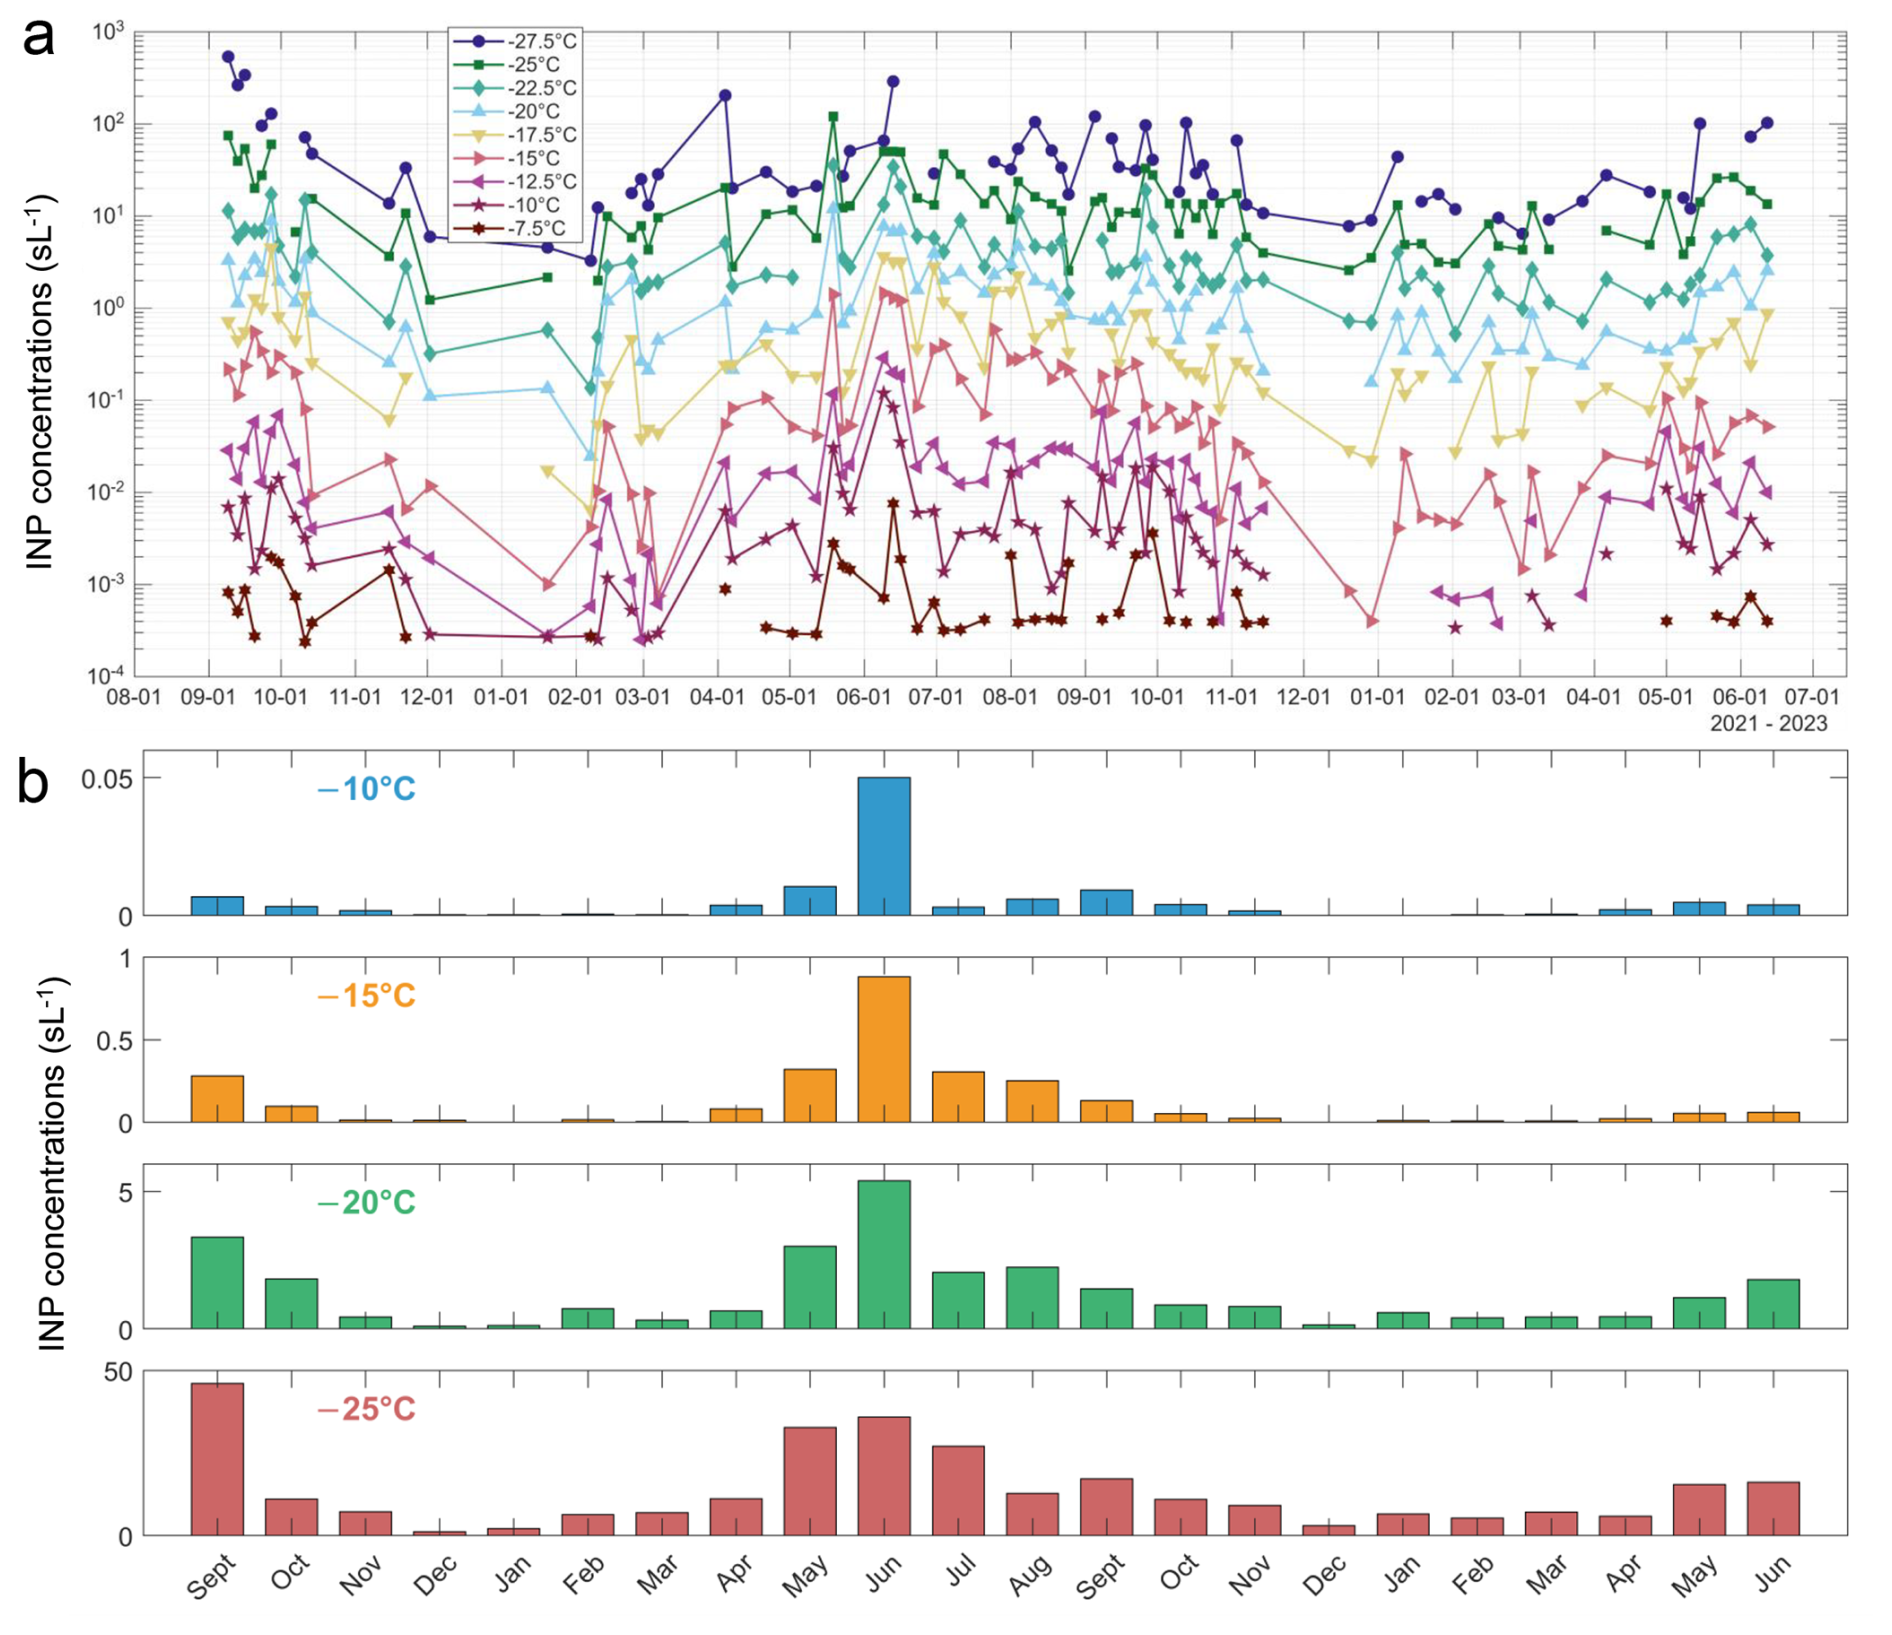
Figure 3Measured INP concentrations (sL−1) during the SAIL campaign (September 2021–June 2023), excluding samples obtained during cloud seeding and snowmaking activities. (a) INP concentrations at temperatures from −7.5 to −27.5 °C in 2.5 °C intervals. (b) Monthly mean INP concentrations at temperatures of −10, −15, −20, and −25 °C.
3.1 INPs concentrations at the SAIL study site
Samples not affected by artificial INP generation activities (cloud seeding and snowmaking activities in winter; see Sect. 2.2), representing the natural INPs in this region (84 samples in total), are shown in Fig. 3a. The discussion in this study focuses on these samples to better understand the characteristics of natural INPs in the Rocky Mountain region. INP concentrations ranged from to 1.5 L−1 (mean: 0.15 L−1, median: 0.05 L−1) at −15 °C, and from 1.2 to 90 L−1 (mean: 16 L−1, median: 12 L−1) at −25 °C. This is comparable to online INP measurements in the Rocky Mountain region (median: 8.2 L−1 at −26 °C; Lacher et al., 2025). Compared with previous INP studies summarized by Kanji et al. (2017), the INP concentrations observed during the SAIL campaign fall within the range of those in their compilation that were influenced by dust, biomass burning, and precipitation, and are higher than those from marine aerosols but lower than the maximum of those attributed to biological sources. Regarding temporal variations, INP concentrations at all measured temperatures followed a similar trend over the nearly two-year observation period: low in winter, increasing in spring, and reaching highest concentrations during summer and early fall. For activation temperatures warmer than −25 °C, the highest INP concentrations were all observed in summer. For temperatures colder than −25 °C, the samples from summer also showed high INP concentrations, while the peak concentrations occurred in September 2021. Back trajectories of those samples (9 and 16 September 2021) showed that the air masses mainly originated from the northwestern U.S. Intense wildfires occurred in that region during the summer of 2021 (Jain et al., 2024), and the transported smoke plumes increased aerosol loading at the SAIL site. These smoke intrusions may also result in enhanced INP concentrations active at low temperatures.
Monthly mean INP concentrations were calculated and are presented in Fig. 3b, to better visualize seasonal trends and reduce the impact of individual outliers. INP concentrations showed clear seasonal variations throughout the campaign. Note that our sampling did not cover the entire month, so some outliers may have been coincidently captured or missed, however, the two-year monthly dataset is still expected to broadly represent the seasonal variations of INPs in this region. In general, INP concentrations reached peaks in June 2022 across all temperatures, and reached minimum levels during winters in both years. However, differences existed among activation temperatures. At warmer temperatures (−10 and −15 °C), INP concentrations were relatively similar in warm seasons (April–October) and much higher than those in cold seasons (November–March). Bioaerosols are typically recognized as major INP sources at these activation temperatures (Kanji et al., 2017), and their emissions generally decrease in winter in most areas due to reduced biological activities and possible snow cover limiting resuspension (Fröhlich-Nowoisky et al., 2016). A distinct high INP peak was observed in June 2022, which was ten times higher than that in June 2023, and much higher than in other months, suggesting that a high INP emission event occurred during this month, which may be related to a specific biological emission event and/or dust event. For activation temperatures of −20 and −25 °C, INP concentrations also showed a seasonal pattern increasing from April, peaking in June, then decreasing and reaching a minimum in December. Recent online INP measurements for activation temperatures from −22 to −32 °C conducted from October 2021 to May 2022 and January to May 2025 at the Storm Peak Laboratory in the Rocky Mountains (Lacher et al., 2025) found a similar seasonal pattern, with the lowest INP concentrations in winter and increased in spring, suggesting that the INP sources could be similar and may dominate INPs across a broaden region of the Rocky Mountains. The elevated INPs from April to September may be attributed to enhanced dust aerosols, as dust concentrations were found to increase during this period (Hand et al., 2017), and dust is a significant source of INPs, especially at temperatures below −15 °C (Kanji et al., 2017; DeMott et al., 2015). Lower-temperature INP concentrations in June 2022 were also higher than that those in June 2023, while the magnitude of this difference (a factor of two) was less distinct from the difference at −10 °C (twelve times). This suggests that the origins of INPs activated at lower temperatures differ from those at warm temperatures.
Table 1Pearson correlation coefficients (R2) between monthly means of INP concentrations and source factor concentrations.
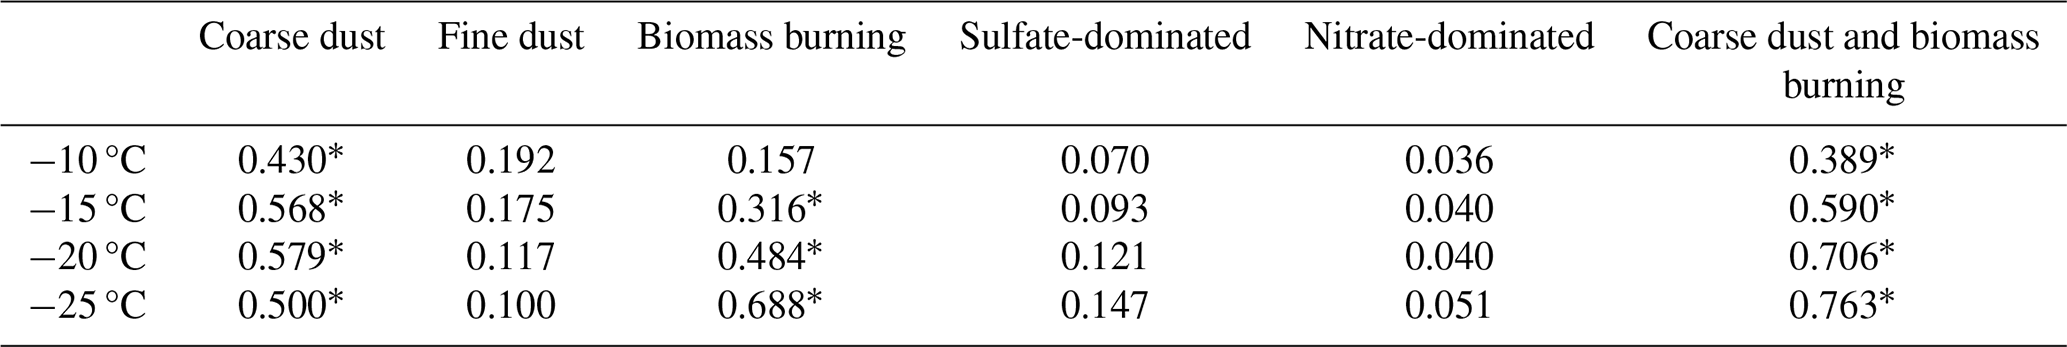
* p<0.01.
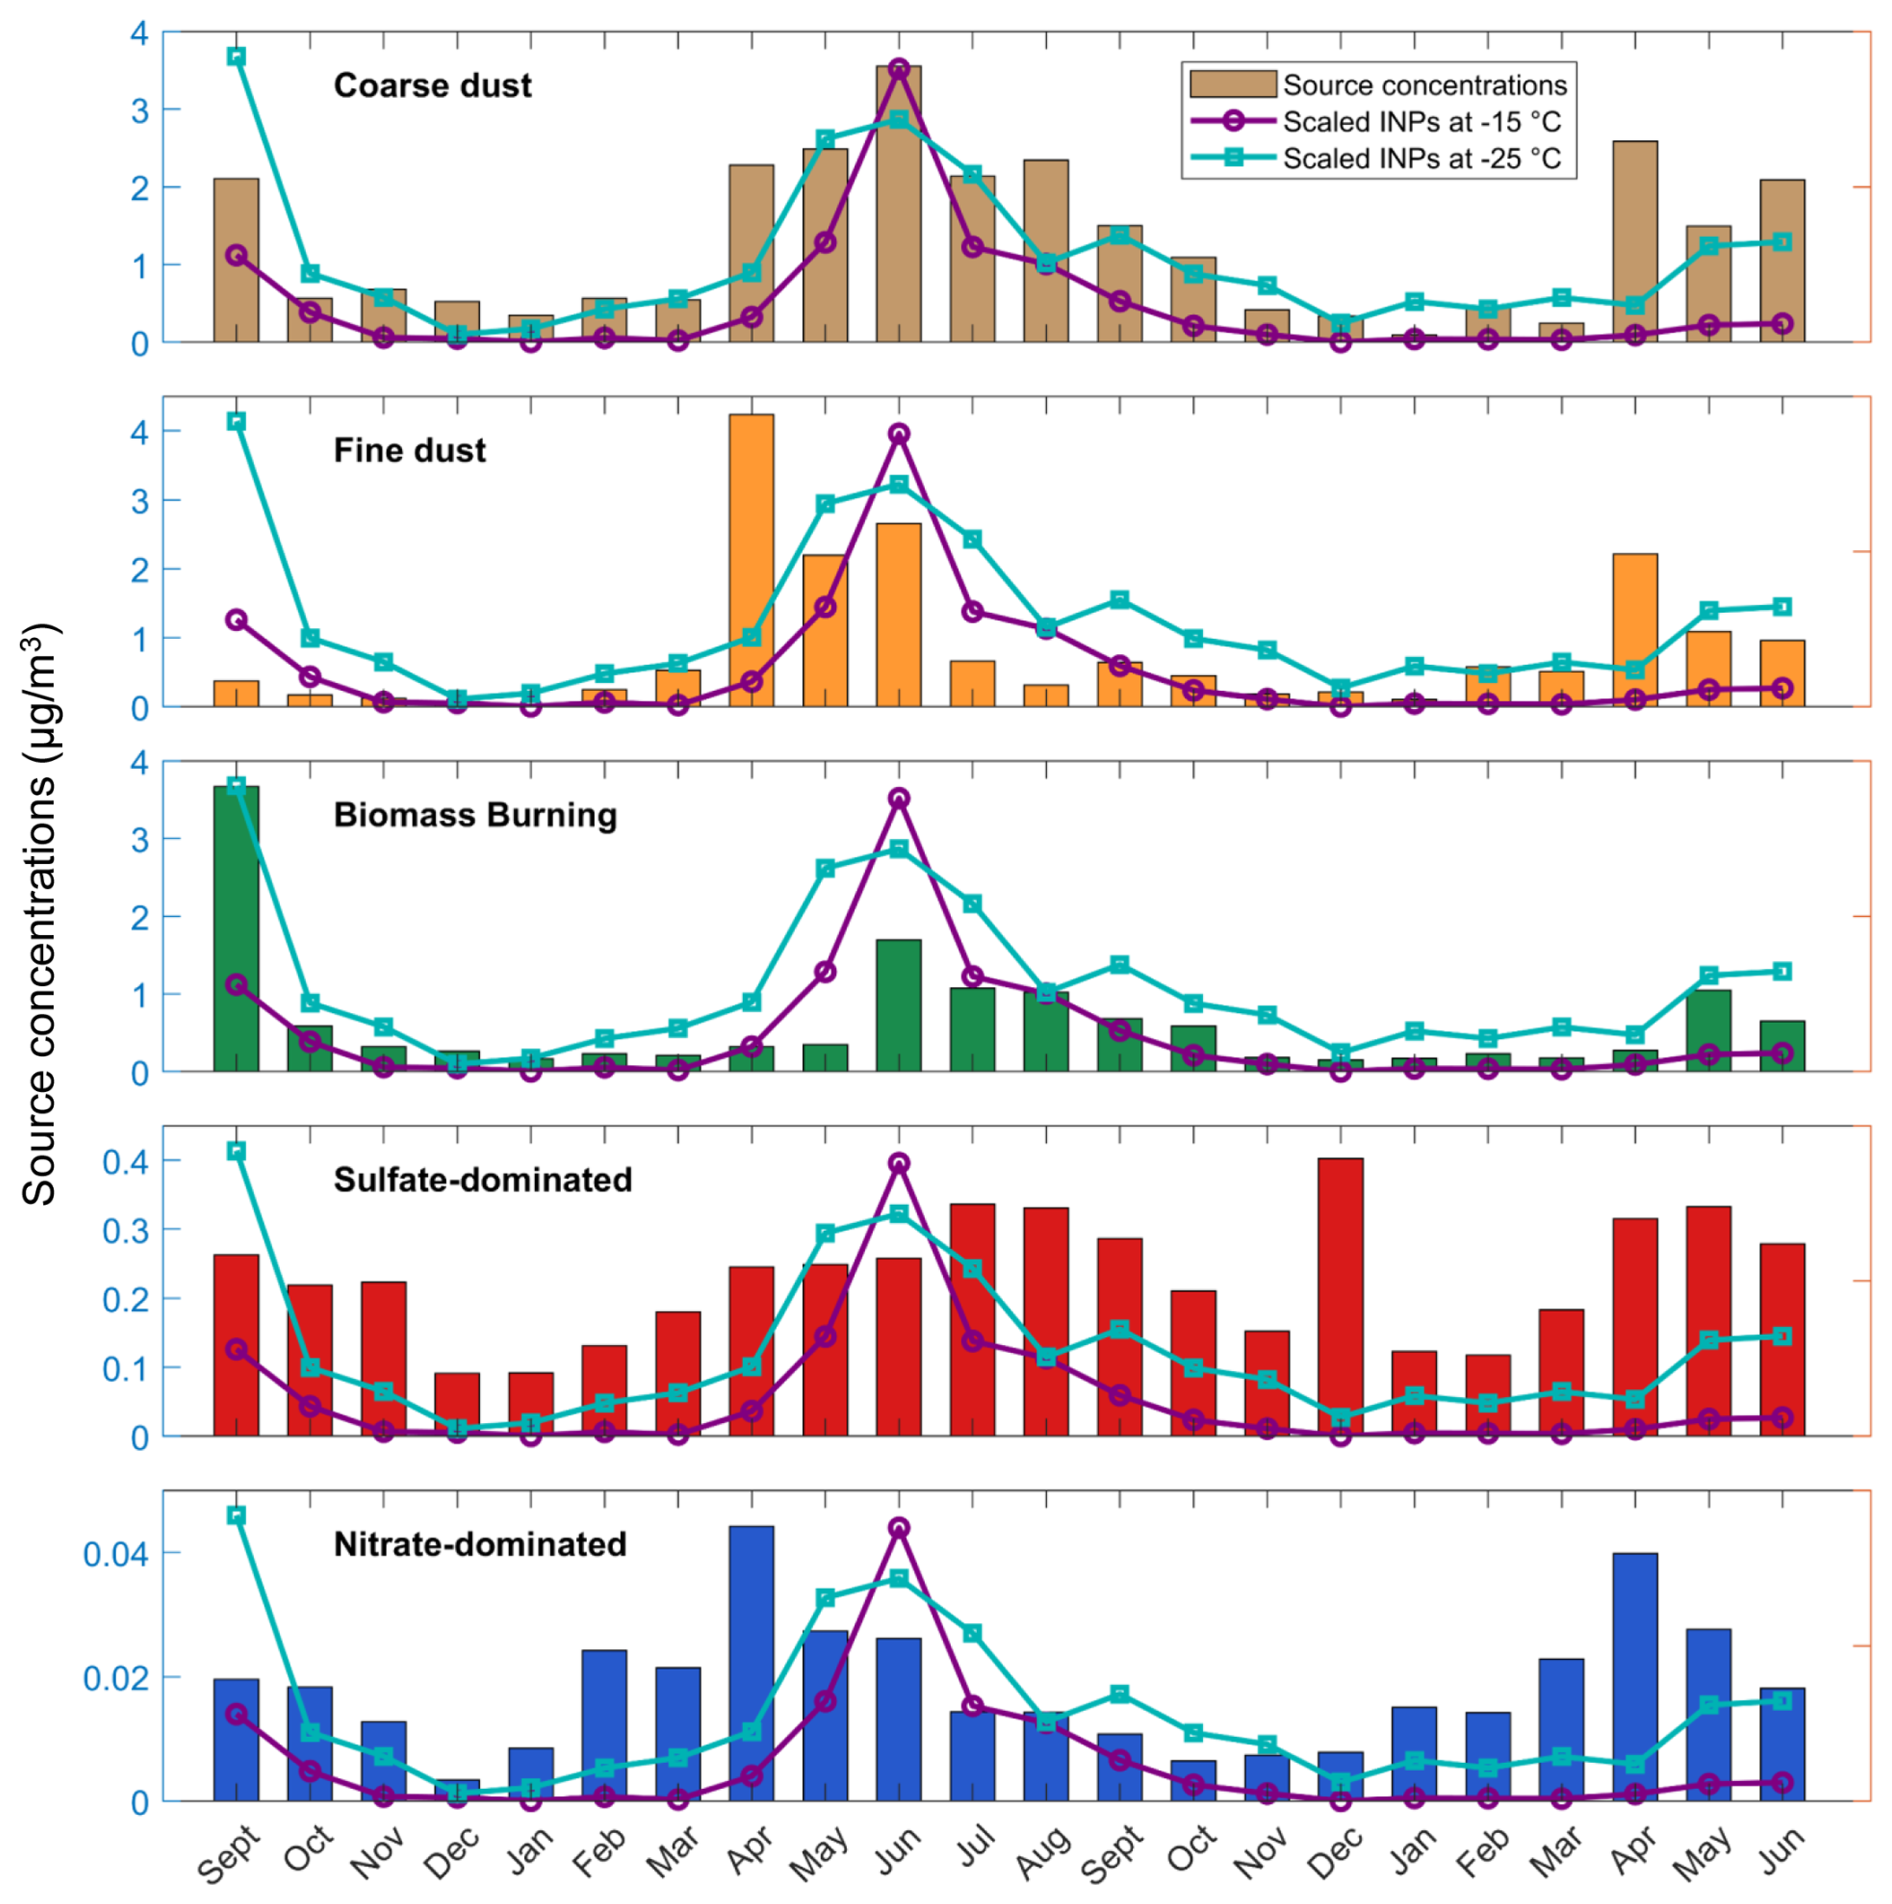
Figure 4Monthly mean INP concentrations (lines, arbitrary scaling) at −15 and −25 °C and monthly mean aerosol mass concentrations (bars) from coarse dust, fine dust, biomass burning, sulfate-dominated, and nitrate-dominated sources.
3.2 Relationships between aerosol sources and INPs
The sources of aerosols to the SAIL campaign region were identified based on the PMF analysis (Sect. S1, Figs. S5 and S6). Different sources exhibited unique seasonal trends. Coarse dust showed increased concentrations from April to September and had the highest annual mean concentration among the five resolved particle types. Fine dust increased sharply in April, May, and June, and remained low during other months. Biomass burning aerosol varied significantly by year. Strong peaks in concentrations were observed in September 2021, with SAIL collecting some samples at the end of these events, and increased contributions in June–August 2022. The biomass burning factor typically showed high concentrations in summer. The sulfate-dominated and nitrate-dominated factors had much lower concentrations overall, with peaks occurring in summer and spring, respectively. The aerosol number size distribution also reflected the variations in different sources (Fig. 2). Supermicron particle concentrations were higher when coarse dust increased. Submicron particles concentrations increased in September 2021 and the summer of 2022, which corresponded to increases in contributions from the biomass burning factor. To investigate the impact of different aerosol types on INPs, temporal variations between aerosol sources and INP concentrations at −15 and −25 °C were compared, as shown in Fig. 4. Monthly average concentrations were used to minimize the impact of unsampled dates. Although this may introduce uncertainties by smoothing episodic peaks of a source, the nearly two-year (22 months) record should adequately represent its seasonal cycle. Pearson correlation coefficients between monthly INP concentrations (−10, −15, −20, and −25 °C) and aerosol sources are shown in Table 1.
Coarse dust and biomass burning presented seasonal variations similar to those of INPs at −15 and −25 °C, while fine dust, nitrate-dominated, and sulfate-dominated factors had weaker correlations (Fig. 4). The strong correlations with coarse dust and biomass burning aerosols suggest that these sources significantly contributed to observed INPs. Coarse dust showed good correlations with INPs active at all temperatures (Table 1), with correlation coefficients increasing for colder temperatures, suggesting that coarse dust is a major source of INPs, particularly at lower temperatures. This is consistent with previous findings that dust dominates the INPs at temperatures below −20 °C (Beall et al., 2022; Testa et al., 2021; Kanji et al., 2017). Furthermore, Lacher et al. (2025) provided direct evidence that INPs active at cold temperatures were significantly contributed by supermicrometer particles, which they attributed to dust, in the Rocky Mountains. Their observation site was located near to the IMPROVE site at Mount Zirkel, where our PMF analyses identified similar sources and trends to those near the SAIL (Sect. S1), suggesting that INPs in both studies were impacted by coarse dust. Interestingly, coarse dust presented a weaker correlation with INPs at −10 °C (R2=0.43), a temperature range usually associated with biological INPs. This may be due to the large number of coarse dust particles, biological INPs carried on dust particles, and/or the inclusion of biological particles in the coarse dust factor, as biological particles are mostly supermicron in size (Després et al., 2012). Biomass burning presented a strong correlation with INP at −25 °C and weak correlations at warmer temperatures (−10 and −15 °C), suggesting that aerosols from biomass burning contribute primarily to INPs active at lower temperatures. Combining coarse dust and biomass burning contributions showed an even better correlation with INPs (Table 1), supporting that these are the major contributors of INPs in this region, especially at lower activation temperatures.
Different from coarse dust, fine dust showed weak relationships with INPs at all temperatures (R2=0.10–0.19), suggesting lower contributions to INPs. One possible reason is that larger particles have more ice nucleation active sites (Reicher et al., 2019; DeMott et al., 2010). Another reason could be differences in sources of fine and coarse dust that resulted in different ice-nucleating abilities. Fine dust presented a different seasonal pattern compared to coarse dust. Fine dust concentrations peaked in spring, especially in April, while coarse dust was higher in summer. This difference was also observed in Hand et al. (2017) for the Colorado Plateau and Central Rockies regions. They suggested that fine dust in this region is influenced by regional or long-range transported dust, such as Asian dust, while coarse aerosol mass concentrations (defined as the difference between PM10 and PM2.5, which was almost all loaded into the coarse dust factor in our PMF analysis) are mainly derived from local and regional sources. Sulfate-dominated and nitrate-dominated sources were not correlated with INP concentrations. In remote areas, sulfate and nitrate particles mainly come from secondary formation (Seinfeld and Pandis, 2016) and are generally not considered as efficient INPs (Kanji et al., 2017).
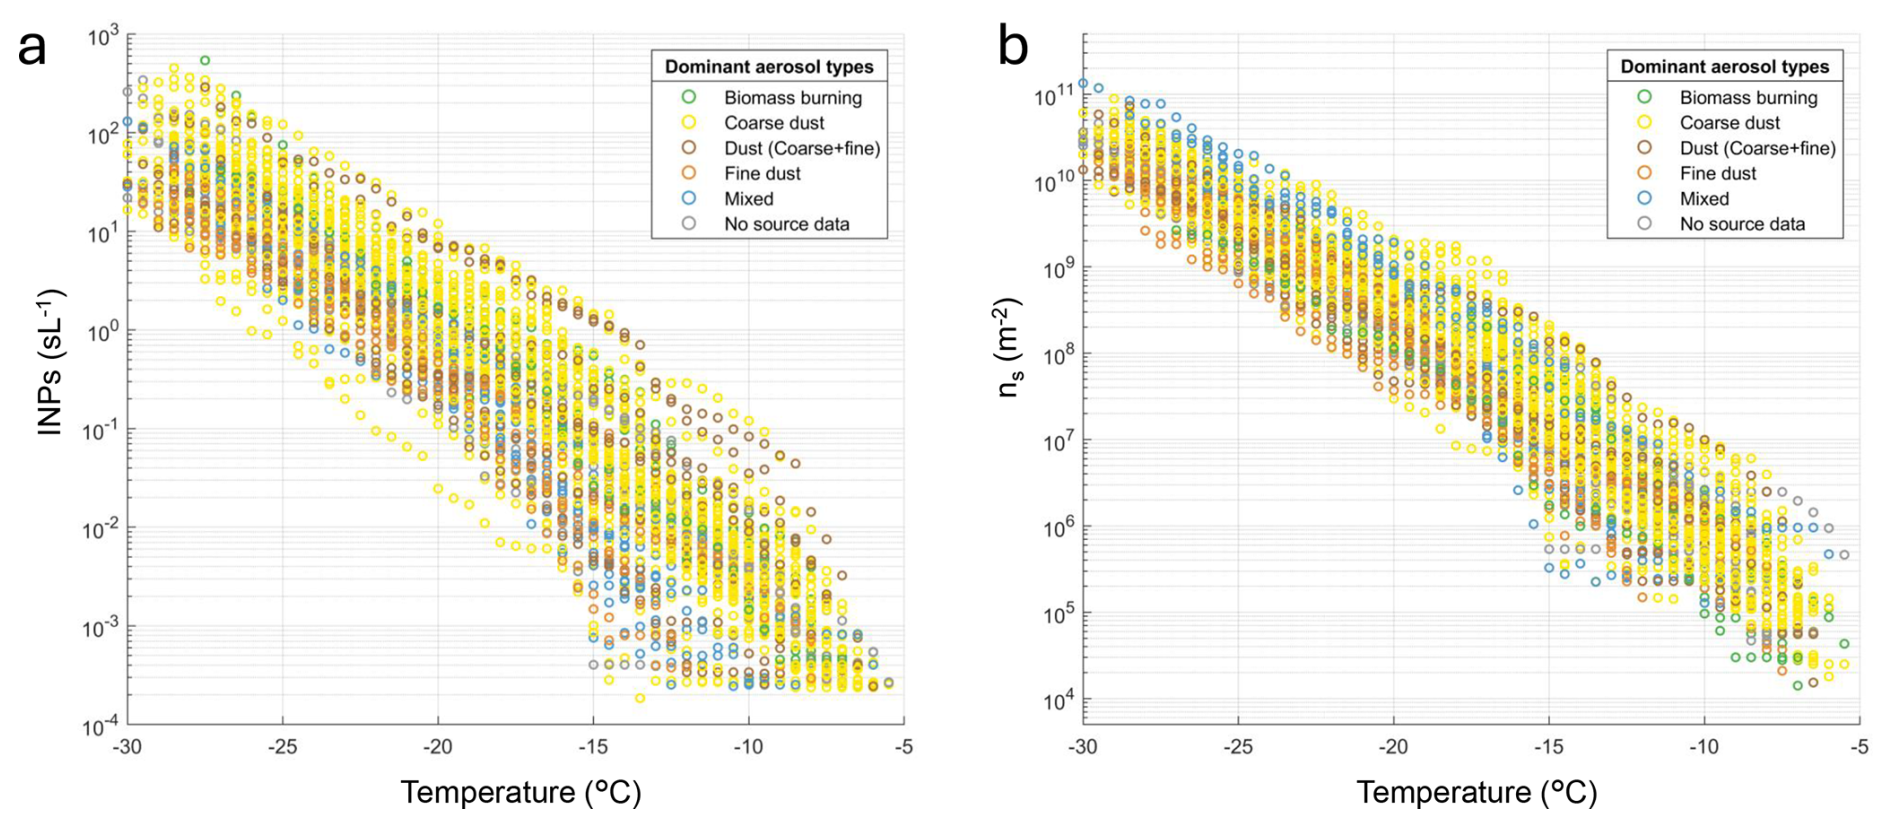
Figure 5(a) Total INP concentration (sL−1) temperature spectra, and (b) IN active surface site density (ns, m−2) calculated based on the surface area of particles larger than 500 nm. All samples were categorized by the dominant aerosol sources. Colors in the legend represent the dominant aerosol types during sampling.
3.3 INP temperature spectra categorized by sources
The total INP temperature spectra categorized by dominant aerosol types are shown in Fig. 5a, and total INP spectra sorted under dominant influence of each source type are plotted separately in Fig. S11. Significant differences in INP concentrations were observed between periods where different aerosol source types were dominant. Over 50 % of the samples were dominated by coarse dust, which was the predominant aerosol source in this region (Fig. S8). Considering that coarse dust also showed a strong correlation with INPs, this suggests INP concentrations were likely primarily influenced by coarse dust in this area. Mineral dust (DeMott et al., 2003; Niemand et al., 2012; Atkinson et al., 2013), soil dust that contains abundant organics (Tobo et al., 2014; Steinke et al., 2016; O'Sullivan et al., 2014), and playa dusts (Pratt et al., 2010; Hamzehpour et al., 2022) have been widely investigated, and are considered as important INP sources. Based on back trajectories for samples categorized as coarse dust (Fig. S9), air masses were mostly from local or regional sources (Central Rockies and Colorado Plateau, with additional inputs from the agricultural Imperial Valley in southern California). Considering their larger size and mass, coarse dust particles have relatively short atmospheric transport ranges, and local resuspension of soil is likely a dominant source (Hand et al., 2017). High air mass residence times were also indicated for the Great Salt Lake region, suggesting potential contributions from playa salts. This is consistent with the contributions of Cl and Na in the coarse dust factor profile from the PMF analysis (Fig. S5a), and playa salt dusts have also been observed, at least at lower temperatures in the mixed phase regime, to serve as INPs (Pratt et al., 2010; Koehler et al., 2007).
Compared to INPs samples that aerosols dominated by coarse dust, fine dust-dominated time periods showed lower INP concentrations (Fig. 5). Back trajectories also indicated different origin regions from those for coarse dust; samples dominated by fine dust had trajectories mainly from southern California and the Sonoran Desert in Arizona, known as an area with high dust emissions (Ginoux et al., 2012). Fine dust is likely long-range transported as Asian dust (Hand et al., 2017) or from the noted southwestern desert areas. Besides their different origins, the higher INP concentrations associated with coarse dust-dominated samples compared to those dominated by fine dust can also be attributed to differences in particle size, although confirming this would require data on size-resolved INPs that were not collected. INPs related to biomass burning-dominated samples presented comparably high concentrations, which may be related to the significantly elevated aerosol loading during biomass burning events. To assess the ice nucleating activity, with the influence of aerosol concentrations and size distributions accounted for, the IN active surface site density was further investigated.
3.4 IN active surface site density (ns) temperature spectra
The IN active surface site density (ns) temperature spectra, a measure of INPs per aerosol surface area, are shown in Fig. 5b for all samples, categorized by dominant aerosol type. Compared to INP concentrations, the ns values were less variable at a given temperature, with most samples within one order of magnitude of each other, whereas INP concentrations spanned nearly two orders of magnitude, suggesting that at least some of the variability in INP concentrations can be explained by differences in particle size distributions and concentrations.
Samples dominated by a specific aerosol source (coarse dust, dust, fine dust, or biomass burning) exhibited relatively consistent ns values with some differences among categories. The ns of samples dominated by coarse dust was similar to or slightly higher than those having both abundant coarse and fine dusts (categorized as dust), suggesting that INPs from coarse dust have higher IN active surface site density. After normalizing by surface area, the ns for the fine dust-dominated samples showed closer values with those of the coarse dust-dominated samples, while still lower. This suggests that the lower INP concentrations in fine dust-dominated samples can be partly attributed to differences in aerosol surface area concentrations, but also to lower active site density due to potentially different INP sources. The differences in ns between coarse dust- and fine dust-dominated samples were limited, likely because there were still small contributions from coarse dust (17 % on average), although fine dust dominated these samples (59 % on average).
During biomass burning events, aerosol number concentrations were significantly enhanced, especially for submicron particles (Fig. 2). A correlation was found between the biomass burning factor mass concentrations and the total surface area concentrations of aerosols (Fig. S12), suggesting that such events significantly increased aerosol surface area concentrations. However, its contributions to INPs could be affected by coarse dust. After normalization by surface area (Sm,500), the ns of INP samples for aerosols dominated by biomass burning were similar to those of coarse dust-dominated samples. Compared with previous studies (comparison based on computing ns using total surface area), these values were higher than ns reported from laboratory biomass burning studies (Umo et al., 2015; Jahn et al., 2020) and those reported in ambient biomass burning observations (McCluskey et al., 2014; Barry et al., 2021b; Zhao et al., 2024). During SAIL, this finding may have been due to the presence of coarse dust, which has a much higher ns than biomass burning, as this aerosol type still contributed moderately to the total aerosols in these samples (an average of 22 % of PM10), although biomass burning was the dominant aerosol source (62 % on average). Wildfire events could also be a source of airborne dust (Wagner et al., 2018; Meng et al., 2025). From the NOAA Hazard Mapping System (Fig. S13) and back trajectories (Fig. S9), these samples were mostly affected by long-range transported biomass burning aerosols originating primarily from wildfires in the northwest and southwest U.S. Aging could enhance the ns of biomass burning INPs (Jahl et al., 2021) and may also have contributed to higher ns of these samples.
In contrast to the convergence observed in samples dominated by a single source, samples related to mixed sources showed no reduction in variability after normalization by surface area (Figs. 5 and S11). Although it is difficult to precisely determine the INP sources for these samples based on current available analyses, this comparison strongly supports the link between INPs and the dominant bulk aerosol sources in this study.
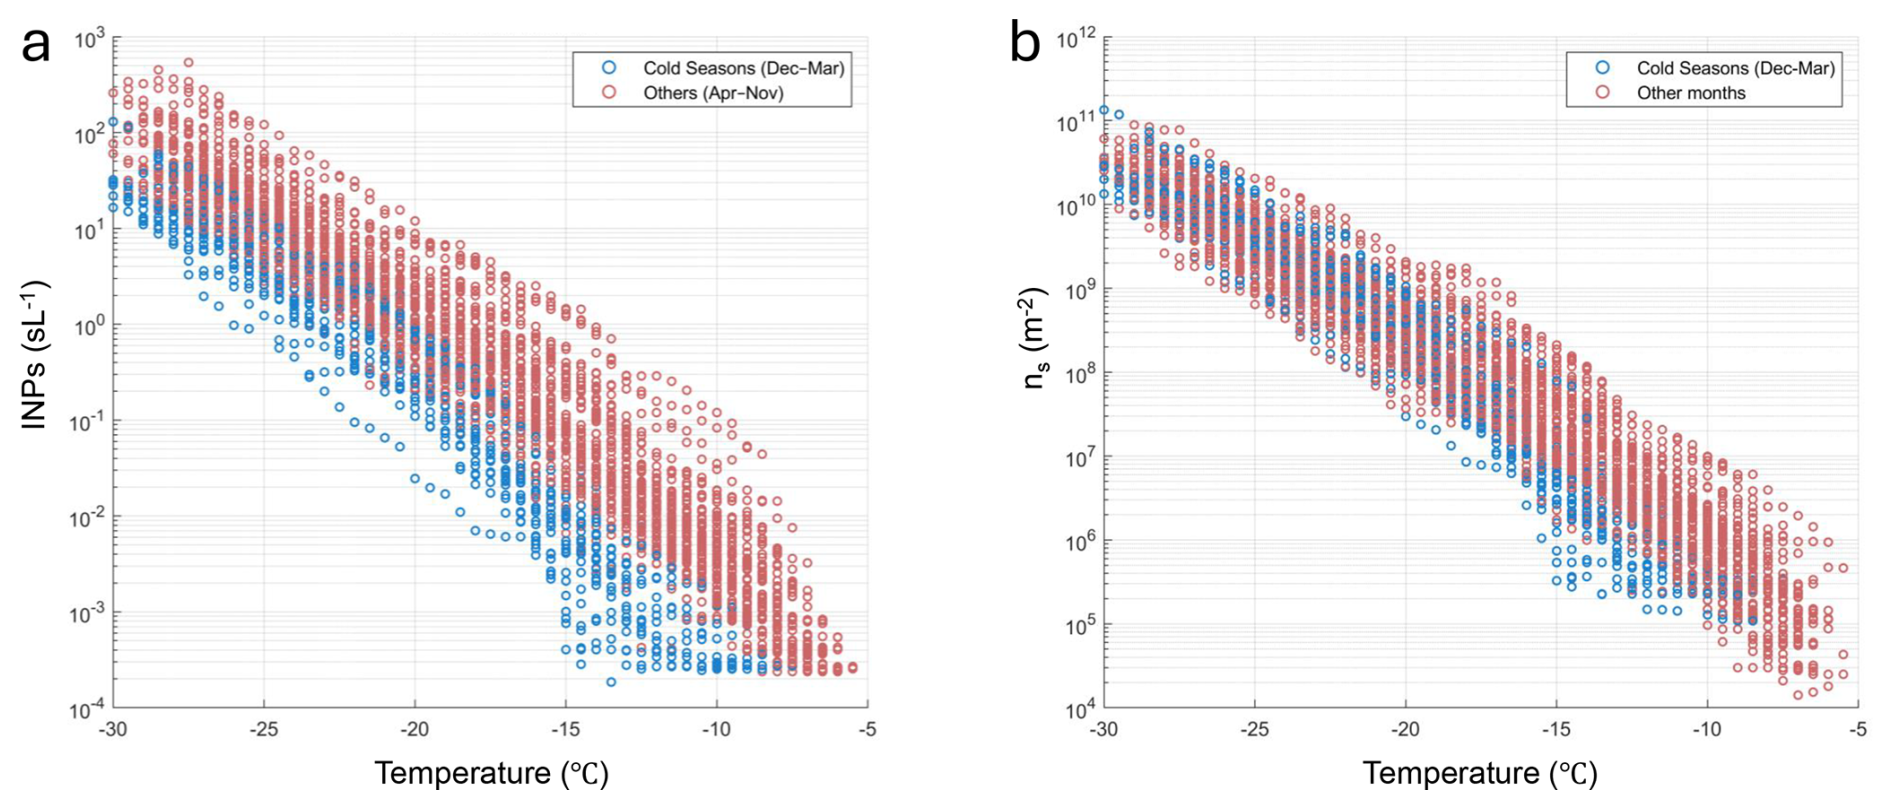
Figure 6(a) INP temperature spectra and (b) IN active surface site density (ns) categorized by sampling date as cold seasons (December–March) and other seasons (April–November). ns was calculated based on the surface area of particles larger than 500 nm.
3.5 Evidence of biological contribution to INPs
From the INP temperature spectra and ns for all samples (Fig. 5), the spectra for INPs active at temperatures higher than about −18 °C showed a segregation into two groups: one with higher INP concentrations (and ns) and measured detectable freezing onset temperatures mostly °C, and the other with lower INP concentrations (and ns) and lower measured detectable freezing onset temperatures, with most of those samples assigned to aerosol sources of mixed and fine dust. We found all samples in the latter group were collected from December to March. At freezing temperatures warmer than −15 °C, biological INPs are likely to play a more important role (Kanji et al., 2017).
Here, we separated samples collected during cold seasons (December–March) and during other seasons (April–November), as shown in Fig. 6. This separation clearly shows that on average, INP concentrations were lower in cold seasons, with the most striking difference at temperatures warmer than −15 °C (15 % of INPs in other seasons). A further comparison of ns (Fig. 6b) showed that samples from cold seasons had similar ns at temperatures colder than around −18 °C. However, at warmer temperatures, samples from cold seasons showed consistently lower ns. These results suggest that INPs that activated at temperatures colder than around −18 °C likely originated from similar sources throughout the whole year, which were primarily associated with coarse dust, as discussed above. However, in cold seasons, the contribution from biological INPs was significantly reduced, leading to the divergence in the spectra for temperatures warmer than around −18 °C. This seasonal pattern is supported by the environmental temperature dependence of biological aerosol emissions (Shawon et al., 2025).
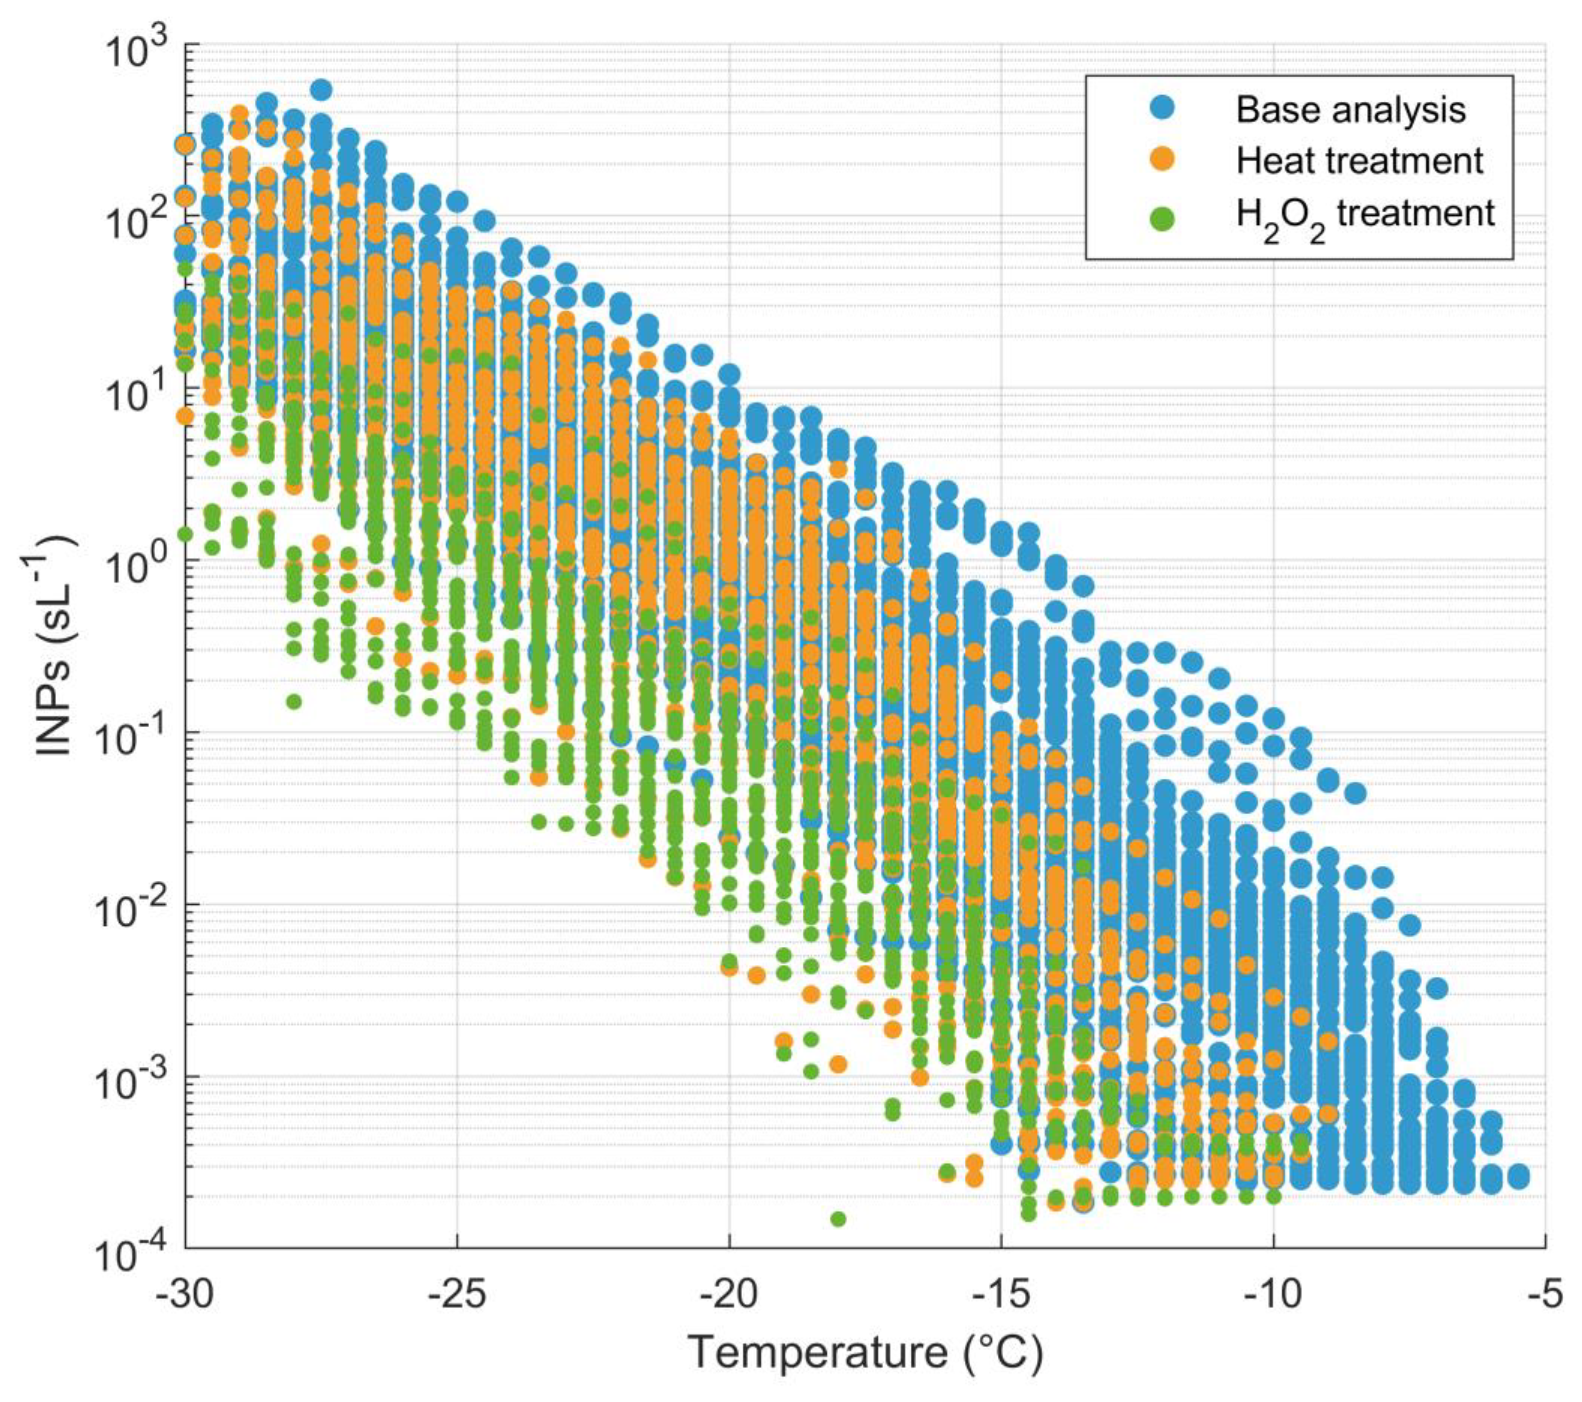
Figure 7Comparison of INP temperature spectra from base (untreated), heat-treated, and H2O2-treated analyses.
The likely biological nature of these warmer-temperature INPs was also identified from the heat treatment of samples. A compilation of spectra from all base (untreated) analyses, heat, and H2O2 treatments is shown in Fig. 7. The difference between the base and heat spectra indicated a large contribution (82 %–94 %, 90 % on average) of heat-labile INPs at warm temperatures ( °C), which are presumably biological INPs. Each individual heat spectrum is shown in Fig. S1. In September 2021, most samples showed decreased INP concentrations at temperature warmer than −15 °C after heat treatment, while almost no decrease was observed at lower temperatures. This reduction is likely due to denaturing of biological INPs, reducing or removing their IN activity (Hill et al., 2016). Samples from September 2021 were strongly affected by biomass burning (Fig. S6). Kobziar et al. (2024) found that biological aerosols can be co-emitted in biomass burning. The presence of biological INPs in smoke plumes was also suggested in aircraft measurements of biomass burning aerosols, which showed base and heat-treated spectra (Barry et al., 2021b) similar to those observed in SAIL samples from September and October 2022. During the SAIL campaign, Shawon et al. (2025) and Ashfiqur et al. (unpublished data) detected biological aerosols using a Wideband Integrated Bioaerosol Sensor (WIBS) and scanning electron microscopy during selected intensive observation periods (June–September 2022 and September 2022, respectively), further supporting the presence of biological aerosols during these periods, some of which may be active as INPs. Biological/heat-labile INPs during the cold seasons account for only 4 % of those in the other seasons. There were no significant decreases in warm-temperature INP concentrations after heat treatment for samples collected from January to early April 2022 and December 2022 to March 2023, indicating that biological INPs concentrations were very low during the cold seasons. In the other seasons (April–November), many samples showed spectra in which heat treatment significantly decreased INP concentrations at temperatures °C and almost no change at lower temperatures, suggesting abundant heat-labile INPs, presumably of biological origin.
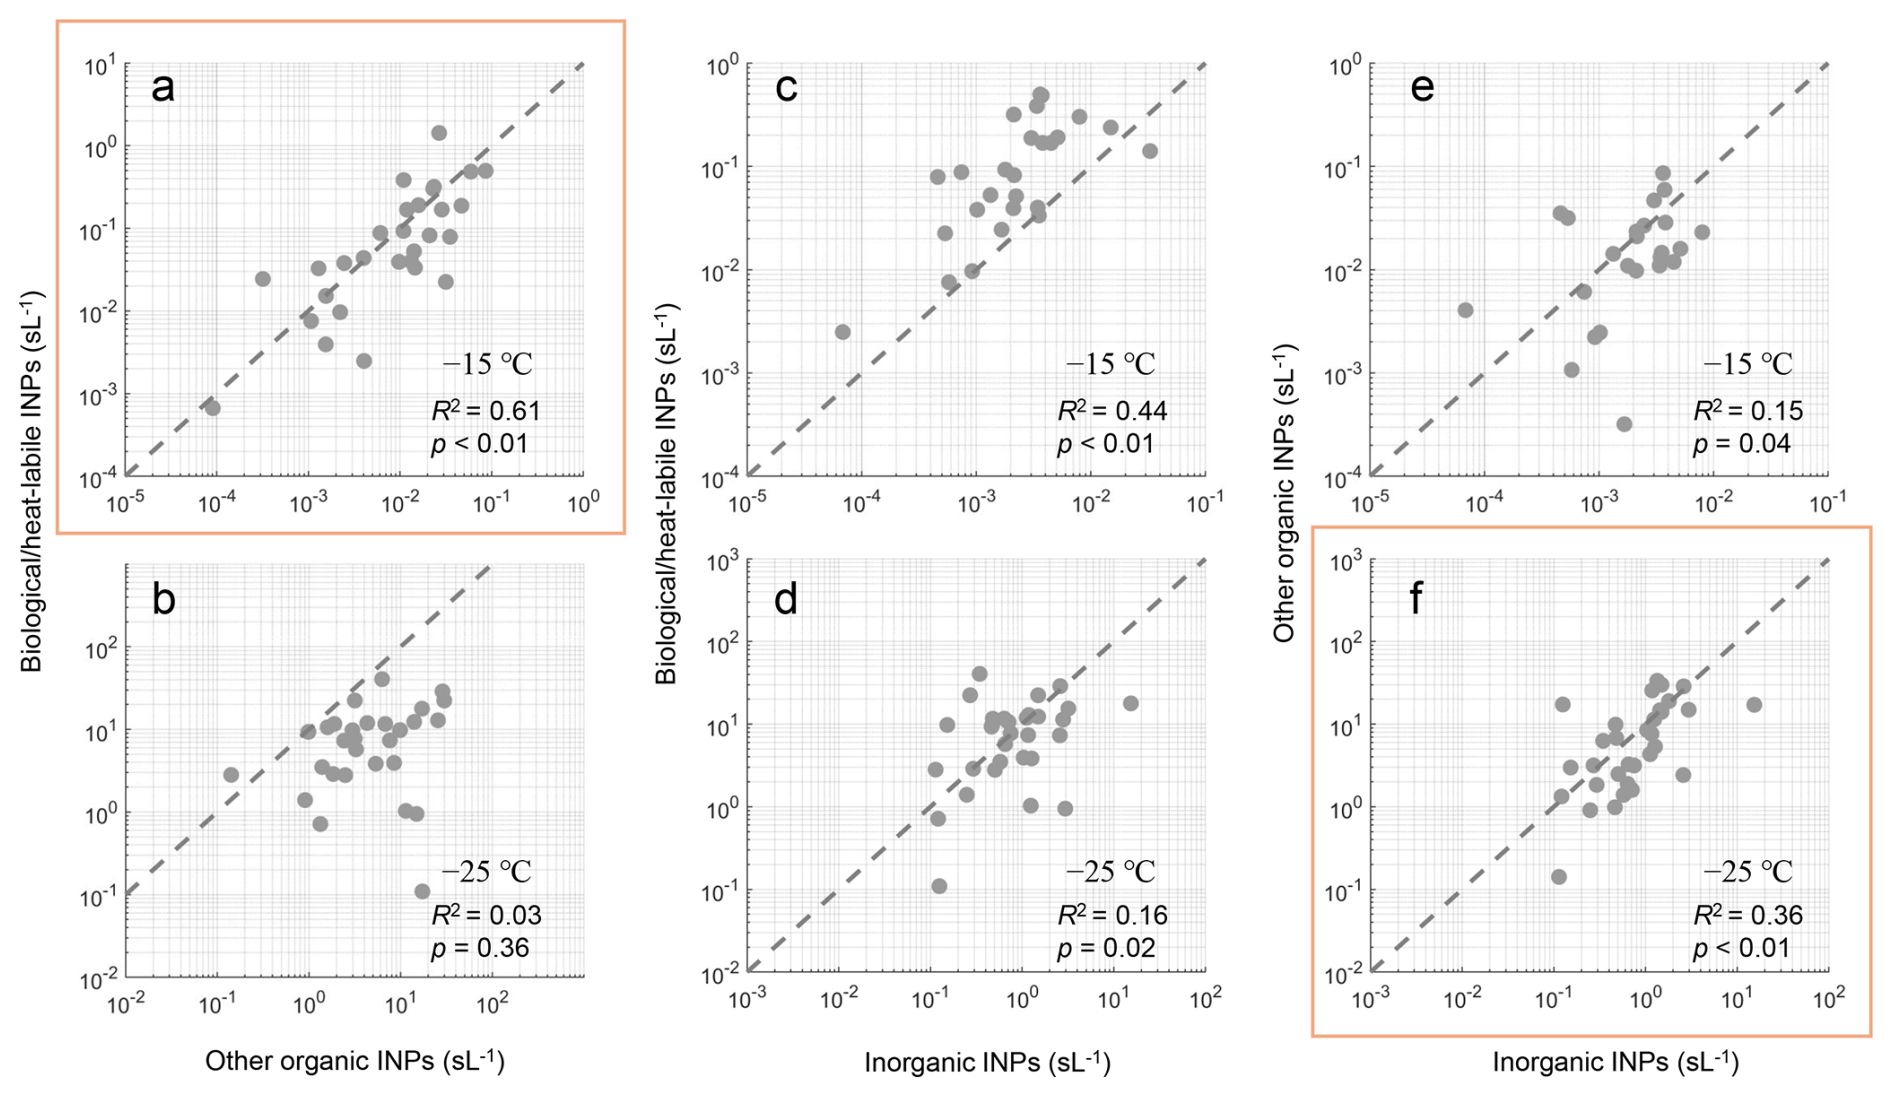
Figure 8Correlations between concentrations of (a, b) biological/heat-labile INPs and other organic INPs, (c, d) biological/heat-labile INPs and inorganic INPs, and (e, f) other organic INPs and inorganic INPs, active at either −15 °C (upper row) or −25 °C (lower row). Dashed lines indicate a 10:1 relationship for reference, and the orange rectangles highlight the strongest correlations at each temperature.
3.6 Relationships among INPs types inferred from treatments
After H2O2 treatment, almost all samples showed significant decreases (83 %–97 %, with an average reduction of 91 %) in INP concentrations across all measured activation temperatures (Figs. 7 and S2), suggesting substantial contributions from organic INPs through the entire temperature spectrum. The inorganic INPs and other organic INPs were correlated at −15 and −25 °C (Fig. 8e and f), especially at the lower temperature. The correlations clustered around the 10:1 line, with ratios of 14 and 13 at −15 and −25 °C, respectively. These results indicated a dominant contribution from organic components suggestive of a soil origin, as previous studies found that soils contain abundant organic INPs in addition to mineral INPs (Tobo et al., 2014; O'Sullivan et al., 2014; Pereira et al., 2022; Suski et al., 2018; Testa et al., 2021). A short-term observational study (DeMott et al., 2025) at the Storm Peak Laboratory in the Colorado Rockies also attributed soil INPs as the dominant INP source in late summer and early fall. These correlations provide further support that the coarse dust factor was mainly from resuspension of local or regional soil dust. Testa et al. (2021) also found a correlation at −25 °C between other organic and inorganic INPs, with a mean ratio of 5.5 in samples from north-central Argentina. Our results and those of Testa et al. (2021) suggest that other organic INPs and inorganic INPs are co-emitted from similar sources. The correlation coefficient increased at lower temperatures, possibly because other organic and inorganic INPs had limited contributions at −15 °C, a range strongly influenced by biological aerosols. Note that INPs from biomass burning could also contribute to this correlation, as they show similar organic and inorganic INP characteristics in their INP spectra (Schill et al., 2020; Barry et al., 2021b). The only exception is sample 14 October 2021, for which similar INP concentrations were observed in the base, heat, and H2O2 treatments at temperatures °C, suggesting that it was likely dominated by mineral dust.
Unexpectedly, a correlation was observed between the biological/heat-labile INPs and other organic INPs at −15 °C (R2=0.61, n=29, Fig. 8a). This correlation suggests that increases in heat-labile INPs, presumably biological INPs, were accompanied by increases in organic INPs. This is possibly because both biological and organic INPs during SAIL originated from the same source at this temperature, which was likely soil dust. However, at a warmer temperature (−12.5 °C), the correlation was weaker (R2=0.10, n=20), possibly because biological INPs from non-soil sources contributed at higher temperatures (Huang et al., 2021), as the ratios between biological/heat-labile INPs and other organic INPs changed from 13 (−15 °C) to 43 (−12.5 °C). At −25 °C, correlations between biological/heat-labile INPs and other organic INPs were much weaker, and the ratio was much lower (mean ratio of 2).
3.7 Prediction of INPs in the Rocky Mountain region
In this study, ns values were found to be close to those used in the parameterizations derived from studies of agricultural soil (Tobo et al., 2014), desert dust (Niemand et al., 2012), and fertile soil (O'Sullivan et al., 2014) (Fig. S14a). Applying the parameterization from Tobo et al. (2014) using the surface area of particles >500 nm reasonably estimated INP concentrations (Fig. S14b), but tended to underestimate them. This is possibly because the equation provided by Tobo et al. (2014) requires an estimation of the surface area of soil particles, which introduces uncertainties when using Sm,500; accurately estimating surface area of only soil particles in atmospheric samples requires additional analysis. Also, the equation from Tobo et al. (2014) is not valid for °C. The parameterization from O'Sullivan et al. (2014) includes a wider temperature range, while it tended to underestimate in temperatures warmer than −20 °C and overestimate at colder temperatures (Fig. S14b). The parameterization from Niemand et al. (2012) was derived from desert dust, consisting mainly of mineral dust. Some of their dust samples might have contained arable dust or biological INPs (Beall et al., 2022). Application of their parameterization to our data showed a bias at warm temperatures (Fig. S14b). Therefore, we developed a parameterization based on the SAIL samples, which could be useful for estimating atmospheric INPs dominated by organic-containing soil dust.
Parameterization was based on an assumed relationship between IN active surface site density (ns, m−2) calculated from surface area concentrations of particles >500 nm (Sm,500) and temperature (T, °C) over all seasons. First, a single polynomial equation fitted to data from all samples was obtained (Fig. S15), and the INP concentrations predicted from this equation and the measured Sm,500 were compared with the measured INP concentrations (Fig. S15). The predicted INPs were mostly within one order of magnitude of the measured values, suggesting this fit generally provides a reasonable estimation of INPs. However, the predicted INPs showed an overestimation trend for some samples around −15 °C. This is due to the limited contribution of biological/heat-labile INPs in cold seasons.
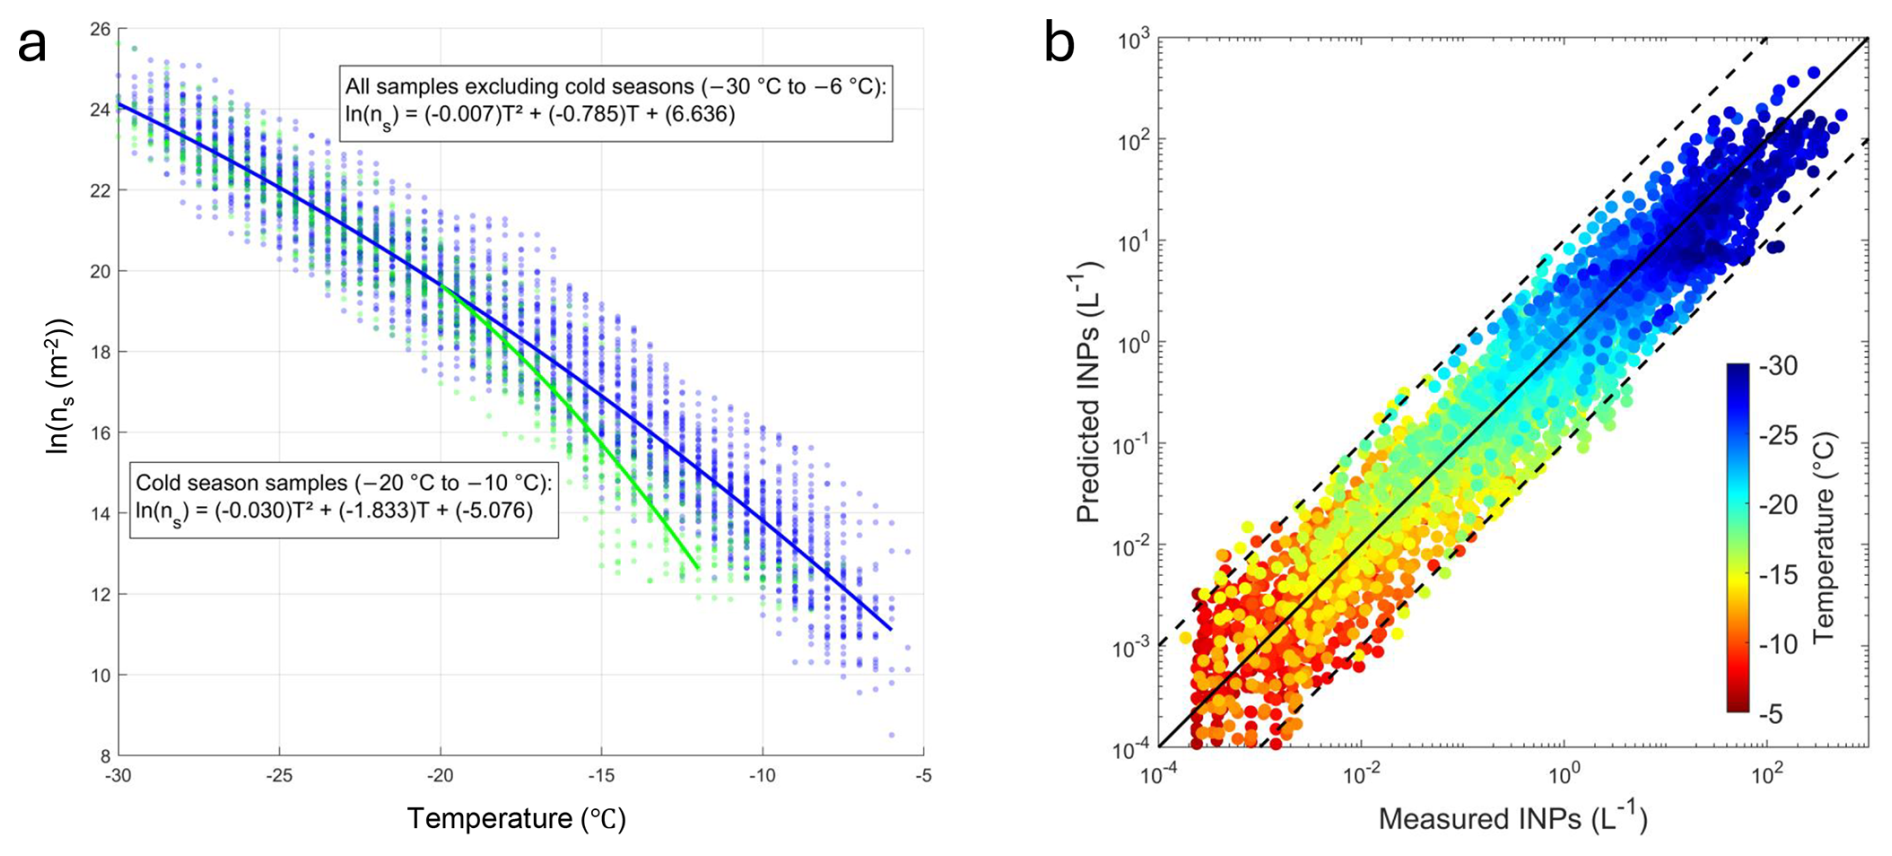
Figure 9(a) All cold season (December–March) and other seasons (April–November) INP data, expressed as IN active surface site density ns (based on the surface area of particles larger than 500 nm), with parameterization fits. All samples, excluding those from cold seasons, were used to develop the parameterization equation for temperatures from −30 to −6 °C. A separate equation was developed for samples from cold seasons at temperatures from −20 to −10 °C. (b) Comparison between predicted INP concentrations based on the parameterization equations and measured surface area concentrations, and measured INP concentrations.
To better represent the INP temperature spectra accounting for the seasonality of biological contributions, parameterization equations were fitted as polynomials for samples from other seasons (April–November, Eq. 1) and cold seasons (December–March, Eq. 2) separately (Fig. 9), as follows,
Equation (1) was derived for most samples except those from cold seasons, and Eq. (2) was obtained for samples from cold seasons (December–March). Equation (2) was constrained to intersect with Eq. (1) at −20 °C, as there were no significant differences at °C, and Eq. (1) was used in this range. The agreement between predicted and measured INPs based on these two equations showed improvement compared to using the one equation method above (Fig. S15), better representing the measured INPs across the full measured temperature range (Fig. 9). The accurate prediction of the nearly two years of observations of INPs using this single parameterization, rather than requiring multiple ns-based parameterizations for specific sources, is likely due to the dominance of coarse dust as the primary INP source in this region. Note that the lack of precise parameterization for biological INPs still introduces larger uncertainties in predictions at warm temperature ranges, while applying the two-equation parameterization based on the seasonal signature of biological INPs identified in this study improves the prediction.
This study comprehensively characterized INPs over a nearly two-year period in the mountainous Upper Colorado River Basin region. The observed average INP concentrations were 0.15 L−1 at −15 °C and 16 L−1 at −25 °C. Clear seasonal variations of INP concentrations and temperature spectra were observed, with low concentrations in winter, increasing in spring, peaking in summer, decreasing in autumn, and returning to low levels in winter. The aerosol types in this region were identified as coarse dust, fine dust, biomass burning, sulfate-dominated, and nitrate-dominated. Coarse dust concentrations were strongly correlated with INP concentrations in all seasons and over a large temperature range, suggesting that background INPs in the study region were strongly influenced by coarse dust. Further analysis of the IN active surface density site supported the dominant role of coarse dust in INPs. Abundant organic INPs were identified, suggesting that organic-containing soil dust was the primary source of INPs. Back trajectories showed that coarse dust mostly originated from local or regional sources. This study also found clear evidence of biological and heat-labile INPs, which showed strong seasonal dependence. Heat-labile, presumably biological INPs were present during warm seasons but were significantly decreased in winter. Two parameterization equations based on IN active surface site density were developed for warm and cold seasons separately. These equations well estimated the measured INP concentrations across the measured temperature and concentration ranges. The parameterization developed here could be useful for representing INPs from organic-containing soil dust in other mountain regions.
This long-term observation identified that organic-containing soil dust is the major source of INPs in the Rocky Mountain region. Biomass burning aerosols and fine dust, likely from long-range transport, play less important roles in INPs compared to coarse dust in this region. Our results indicate that soil dust from nearby regions (e.g., the Colorado Plateau and Central Rockies), rather than long-range transported fine and mineral dust, dominates contributions to the INPs in the Upper Colorado River Basin, and therefore influences aerosol-cloud interaction and precipitation. This study investigated the major INP sources by linking long-term INP measurements with aerosol source apportionment, presenting reasonable results that agree well with other studies (DeMott et al., 2025; Lacher et al., 2025). This approach may have broader applicability for INP source attribution in other regions. Future studies combining short-term online INP measurement (e.g., continuous flow diffusion chamber, CFDC) with detailed chemical analyses (e.g., mass spectrometer) would be valuable for providing more direct evidence of INP sources, such as demonstrated by the approaches used in Cornwell et al. (2023, 2024).
In this study, the origins of biological INPs are unclear due to the limitations of the analytical methods used. One possibility is that biological INPs were associated with soil dust, e.g., fungi in soil (Conen and Yakutin, 2018; O'Sullivan et al., 2016). This is supported by the correlation between biological/heat-labile INPs and other organic INPs at −15 °C. Also, raindrop impact could be an important biological INP emission pathway (Prenni et al., 2013; Mignani et al., 2025). In cold seasons, snow covers the Rocky Mountain region and inhibits the suspension of local soil dust, which is considered as the main source of INPs in this region. This assumption that coarse dust emissions are suppressed in cold seasons is also supported by the observation that more than half of the samples in cold seasons were dominated by mixed sources and fine dust, instead of coarse dust. However, the correlation between biological/heat-labile INPs and other organic INPs was weaker (R2=0.10) at a warmer temperature (−12.5 °C). This suggests that there are contributions from other biological INPs (e.g., those originating from vegetation) at warmer freezing temperatures, which are likely independent of soil dust emissions, thereby complicating the estimation of biological INPs. For example, airborne bacteria (Bowers et al., 2012) and pollen (Fall, 1992) in the Rocky Mountain region decrease in winter and increase during the warmer seasons. This seasonal pattern is consistent with the variation in biological/heat-labile INPs observed in this study, suggesting that these biological particles may represent potential sources of the biological INPs. In this case, the INP spectra in cold seasons likely represent that of soil dust, and the spectra in other seasons represent the combination of soil dust and biological INPs. While bacteria may also be partly related to soil, as summer bacteria taxa were reported to likely originate from soil and leaf surface (Bowers et al., 2012), the specific ice-active taxa among them require further investigation. In future studies, identifying the most abundant biological INPs in this region and determining whether they originate from vegetation, soil-associated sources, or from a combination of both would help improve our understanding of biological INP variability and improve their estimation. However, besides heat treatment, current approaches provide only indirect evidence of biological INPs (Cornwell et al., 2023, 2024; Sanchez-Marroquin et al., 2021). Comprehensive characterization of biological aerosol types and abundance, or developing new analytical approaches, would be highly beneficial for advancing biological INP research.
The INP concentrations in this study were similar to those observed in ambient samples influenced by agricultural soil in Argentina (Testa et al., 2021). The ns values reported for agricultural soil samples (Tobo et al., 2014) were higher than those calculated from total surface area (Fig. S10), but similar to ns when based on surface area of particles >500 nm (Fig. S14). This finding suggests that using particles >500 nm is a reasonable threshold for excluding most aerosol types that are inefficient INP sources, and approximating aerosol surface area contributions from organic-containing soils. Since SAIL was conducted at a remote site in the Rocky Mountains, these comparisons suggest that the parameterization developed in this study can potentially be applied to other remote continental areas. A recent global modeling study (Herbert et al., 2025) found that including organic INP components in dust particles, which are present in many soils, can significantly improve predictive accuracy. It is therefore essential to validate the INPs originating from organic-containing soil dust, beyond the mineral dust that has already been intensively studied, through field measurements across different continental regions.
The data from the SAIL campaign used in this study are available through the ARM Data Discovery (https://adc.arm.gov/discovery/). This includes INPs data (https://doi.org/10.5439/1770816, Shi et al., 2025), source apportionment results (https://doi.org/10.5439/2573028, Zhou et al., 2025a), back trajectory data (https://doi.org/10.5439/2574969, Zhou et al., 2025b), merged aerosol number-size distribution (https://doi.org/10.5439/2572899, Zhou et al., 2025c), and particle number size distribution data from SMPS (https://doi.org/10.5439/1476898, Kuang et al., 2024) and OPC (https://doi.org/10.5439/1824224, Cromwell et al., 2024).
The supplement related to this article is available online at https://doi.org/10.5194/acp-26-1515-2026-supplement.
RP, SK, PD, and RZ conceptualized the study. DJ, RZ, KA, and OD performed additional immersion-mode INP measurements. RZ, RP and SK conducted the source apportionment and merged the size distribution data. RZ, RP, KA and SK performed the back trajectory analysis. KB performed qPCR analysis. RZ wrote the manuscript, with revisions from RP, PD, and SK. All authors reviewed the manuscript and contributed to the final version of the manuscript.
The contact author has declared that none of the authors has any competing interests.
Publisher's note: Copernicus Publications remains neutral with regard to jurisdictional claims made in the text, published maps, institutional affiliations, or any other geographical representation in this paper. The authors bear the ultimate responsibility for providing appropriate place names. Views expressed in the text are those of the authors and do not necessarily reflect the views of the publisher.
We thank the DOE ARM INP Mentors Jessie Creamean, Tom Hill, and Carson Hume for coordinating the sample collections and for helping with the combined INP data archival. We also thank Ty Johnson for assistance with generating the NOAA Hazard Mapping System plots. The authors acknowledge the NOAA Air Resources Laboratory (ARL) for the provision of the HYSPLIT transport and dispersion model used in this publication. We also thank the Interagency Monitoring of Protected Visual Environments (IMPROVE) network for providing aerosol composition data. IMPROVE is a collaborative association of state, tribal, and federal agencies, and international partners. US Environmental Protection Agency is the primary funding source, with contracting and research support from the National Park Service. The Air Quality Group at the University of California, Davis is the central analytical laboratory, with ion analysis provided by Research Triangle Institute, and carbon analysis provided by Desert Research Institute. We thank North American Weather Consultants Inc. for providing records of their cloud seeding activities near the SAIL campaign site. Kelton Ayars and Oren Dutton would like to acknowledge support from the Scott Undergraduate Research Experiences program at Colorado State University.
This research has been supported by the U.S. Department of Energy (grant nos. DE-SC0024202 and DE-SC0021116).
This paper was edited by Bingbing Wang and reviewed by three anonymous referees.
Agresti, A. and Coull, B. A.: Approximate is better than “exact” for interval estimation of binomial proportions, Am. Stat., 52, 119–126, 1998.
Ashbaugh, L. L., Malm, W. C., and Sadeh, W. Z.: A residence time probability analysis of sulfur concentrations at Grand Canyon National Park, Atmos. Environ., 19, 1263–1270, 1985.
Atkinson, J. D., Murray, B. J., Woodhouse, M. T., Whale, T. F., Baustian, K. J., Carslaw, K. S., Dobbie, S., O'Sullivan, D., and Malkin, T. L.: The importance of feldspar for ice nucleation by mineral dust in mixed-phase clouds, Nature, 498, 355–358, https://doi.org/10.1038/nature12278, 2013.
Barry, K. R., Hill, T. C. J., Jentzsch, C., Moffett, B. F., Stratmann, F., and DeMott, P. J.: Pragmatic protocols for working cleanly when measuring ice nucleating particles, Atmos. Res., 250, 105419, https://doi.org/10.1016/j.atmosres.2020.105419, 2021a.
Barry, K. R., Hill, T. C. J., Levin, E. J. T., Twohy, C. H., Moore, K. A., Weller, Z. D., Toohey, D. W., Reeves, M., Campos, T., Geiss, R., Schill, G. P., Fischer, E. V., Kreidenweis, S. M., and DeMott, P. J.: Observations of Ice Nucleating Particles in the Free Troposphere From Western US Wildfires, J. Geophys. Res.: Atmos., 126, e2020JD033752, https://doi.org/10.1029/2020jd033752, 2021b.
Beall, C. M., Hill, T. C. J., DeMott, P. J., Köneman, T., Pikridas, M., Drewnick, F., Harder, H., Pöhlker, C., Lelieveld, J., Weber, B., Iakovides, M., Prokeš, R., Sciare, J., Andreae, M. O., Stokes, M. D., and Prather, K. A.: Ice-nucleating particles near two major dust source regions, Atmos. Chem. Phys., 22, 12607–12627, https://doi.org/10.5194/acp-22-12607-2022, 2022.
Bigg, E. K.: The supercooling of water, Proc. Phys. Soc. B, 66, 688–694, 1953.
Bowers, R. M., McCubbin, I. B., Hallar, A. G., and Fierer, N.: Seasonal variability in airborne bacterial communities at a high-elevation site, Atmos. Environ., 50, 41–49, https://doi.org/10.1016/j.atmosenv.2012.01.005, 2012.
Brown, S. G., Eberly, S., Paatero, P., and Norris, G. A.: Methods for estimating uncertainty in PMF solutions: examples with ambient air and water quality data and guidance on reporting PMF results, Sci. Total Environ., 518–519, 626–635, https://doi.org/10.1016/j.scitotenv.2015.01.022, 2015.
Burrows, S. M., McCluskey, C. S., Cornwell, G., Steinke, I., Zhang, K., Zhao, B., Zawadowicz, M., Raman, A., Kulkarni, G., and China, S.: Ice-nucleating particles that impact clouds and climate: Observational and modeling research needs, Rev. Geophys., 60, e2021RG000745, https://doi.org/10.1029/2021RG000745, 2022.
Conen, F. and Yakutin, M. V.: Soils rich in biological ice-nucleating particles abound in ice-nucleating macromolecules likely produced by fungi, Biogeosciences, 15, 4381–4385, https://doi.org/10.5194/bg-15-4381-2018, 2018.
Conen, F., Rodríguez, S., Hülin, C., Henne, S., Herrmann, E., Bukowiecki, N., and Alewell, C.: Atmospheric ice nuclei at the high-altitude observatory Jungfraujoch, Switzerland, Tellus B: Chem. Phys. Meteorol., 67, 25014, https://doi.org/10.3402/tellusb.v67.25014, 2015.
Creamean, J. M., Hill, T. C., Hume, C. C., and Devadoss, T.: Ice Nucleation Spectrometer (INS) Instrument Handbook, Oak Ridge National Laboratory (ORNL), Atmospheric Radiation Measurement (ARM) Data Center, Oak Ridge, TN, USA, https://doi.org/10.2172/1846263, 2024.
Creamean, J. M., Suski, K. J., Rosenfeld, D., Cazorla, A., DeMott, P. J., Sullivan, R. C., White, A. B., Ralph, F. M., Minnis, P., and Comstock, J. M.: Dust and biological aerosols from the Sahara and Asia influence precipitation in the western US, Science, 339, 1572–1578, https://doi.org/10.1126/science.1227279, 2013.
Cornwell, G. C., McCluskey, C. S., Hill, T. C. J., Levin, E. T., Rothfuss, N. E., Tai, S. L., Petters, M. D., DeMott, P. J., Kreidenweis, S., Prather, K. A., and Burrows, S. M.: Bioaerosols are the dominant source of warm-temperature immersion-mode INPs and drive uncertainties in INP predictability, Sci. Adv., 9, eadg3715, https://doi.org/10.1126/sciadv.adg3715, 2023.
Cornwell, G. C., Steinke, I., Lata, N. N., Zelenyuk, A., Kulkarni, G., Pekour, M., Perkins, R., Levin, E. J. T., China, S., Demott, P. J., and Burrows, S. M.: Enrichment of Phosphates, Lead, and Mixed Soil-Organic Particles in INPs at the Southern Great Plains Site, J. Geophys. Res.: Atmos., 129, e2024JD040826, https://doi.org/10.1029/2024jd040826, 2024.
Cromwell, E., Singh, A., and Kuang, C.: Optical Particle Counter (AOSOPC), 2021-10-27 to 2023-06-16, ARM Mobile Facility (GUC), Gunnison, CO, Supplemental Facility 2 (S2), Atmospheric Radiation Measurement (ARM) User Facility [data set], https://doi.org/10.5439/1824224, 2024.
Daily, M. I., Tarn, M. D., Whale, T. F., and Murray, B. J.: An evaluation of the heat test for the ice-nucleating ability of minerals and biological material, Atmos. Meas. Tech., 15, 2635–2665, https://doi.org/10.5194/amt-15-2635-2022, 2022.
de Boer, G., Morrison, H., Shupe, M. D., and Hildner, R.: Evidence of liquid dependent ice nucleation in high-latitude stratiform clouds from surface remote sensors, Geophys. Res. Lett., 38, L01803, https://doi.org/10.1029/2010GL046016, 2011.
DeMott, P. J., Sassen, K., Poellot, M. R., Baumgardner, D., Rogers, D. C., Brooks, S. D., Prenni, A. J., and Kreidenweis, S. M.: African dust aerosols as atmospheric ice nuclei, Geophys. Res. Lett., 30, 1732, https://doi.org/10.1029/2003gl017410, 2003.
DeMott, P. J., Prenni, A. J., Liu, X., Kreidenweis, S. M., Petters, M. D., Twohy, C. H., Richardson, M. S., Eidhammer, T., and Rogers, D. C.: Predicting global atmospheric ice nuclei distributions and their impacts on climate, Proc. Natl. Acad. Sci. USA, 107, 11217–11222, https://doi.org/10.1073/pnas.0910818107, 2010.
DeMott, P. J., Prenni, A. J., McMeeking, G. R., Sullivan, R. C., Petters, M. D., Tobo, Y., Niemand, M., Möhler, O., Snider, J. R., Wang, Z., and Kreidenweis, S. M.: Integrating laboratory and field data to quantify the immersion freezing ice nucleation activity of mineral dust particles, Atmos. Chem. Phys., 15, 393–409, https://doi.org/10.5194/acp-15-393-2015, 2015.
DeMott, P. J., Mirrielees, J. A., Petters, S. S., Cziczo, D. J., Petters, M. D., Bingemer, H. G., Hill, T. C. J., Froyd, K., Garimella, S., Hallar, A. G., Levin, E. J. T., McCubbin, I. B., Perring, A. E., Rapp, C. N., Schiebel, T., Schrod, J., Suski, K. J., Weber, D., Wolf, M. J., Zawadowicz, M., Zenker, J., Möhler, O., and Brooks, S. D.: Field intercomparison of ice nucleation measurements: the Fifth International Workshop on Ice Nucleation Phase 3 (FIN-03), Atmos. Meas. Tech., 18, 639–672, https://doi.org/10.5194/amt-18-639-2025, 2025.
Després, V., Huffman, J. A., Burrows, S. M., Hoose, C., Safatov, A., Buryak, G., Fröhlich-Nowoisky, J., Elbert, W., Andreae, M., Pöschl, U., and Jaenicke, R.: Primary biological aerosol particles in the atmosphere: a review, Tellus B., 64, 15598, https://doi.org/10.3402/tellusb.v64i0.15598, 2012.
Fall, P. L.: Spatial patterns of atmospheric pollen dispersal in the Colorado Rocky Mountains, USA, Rev. Palaeobot. Palynol., 74, 293–313, https://doi.org/10.1016/0034-6667(92)90013-7, 1992.
Feldman, D. R., Aiken, A. C., Boos, W. R., Carroll, R. W. H., Chandrasekar, V., Collis, S., Creamean, J. M., de Boer, G., Deems, J., DeMott, P. J., Fan, J., Flores, A. N., Gochis, D., Grover, M., Hill, T. C. J., Hodshire, A., Hulm, E., Hume, C. C., Jackson, R., Junyent, F., Kennedy, A., Kumjian, M., Levin, E. J. T., Lundquist, J. D., O'Brien, J., Raleigh, M. S., Reithel, J., Rhoades, A., Rittger, K., Rudisill, W., Sherman, Z., Siirila-Woodburn, E., Skiles, S. M., Smith, J. N., Sullivan, R. C., Theisen, A., Tuftedal, M., Varble, A. C., Wiedlea, A., Wielandt, S., Williams, K., and Xu, Z.: The Surface Atmosphere Integrated Field Laboratory (SAIL) Campaign, Bull. Am. Meteorol. Soc., 104, E2192–E2222, https://doi.org/10.1175/bams-d-22-0049.1, 2023.
Fröhlich-Nowoisky, J., Kampf, C. J., Weber, B., Huffman, J. A., Pöhlker, C., Andreae, M. O., Lang-Yona, N., Burrows, S. M., Gunthe, S. S., and Elbert, W.: Bioaerosols in the Earth system: Climate, health, and ecosystem interactions, Atmos. Res., 182, 346–376, https://doi.org/10.1016/j.atmosres.2016.07.018, 2016.
Garcia, E., Hill, T. C., Prenni, A. J., DeMott, P. J., Franc, G. D., and Kreidenweis, S. M.: Biogenic ice nuclei in boundary layer air over two US High Plains agricultural regions, J. Geophys. Res.: Atmos., 117, D18209, https://doi.org/10.1029/2012JD018343, 2012.
Ginoux, P., Prospero, J. M., Gill, T. E., Hsu, N. C., and Zhao, M.: Global-scale attribution of anthropogenic and natural dust sources and their emission rates based on MODIS Deep Blue aerosol products, Rev. Geophys., 50, RG3005, https://doi.org/10.1029/2012rg000388, 2012.
Hamzehpour, N., Marcolli, C., Klumpp, K., Thöny, D., and Peter, T.: The Urmia playa as a source of airborne dust and ice-nucleating particles – Part 2: Unraveling the relationship between soil dust composition and ice nucleation activity, Atmos. Chem. Phys., 22, 14931–14956, https://doi.org/10.5194/acp-22-14931-2022, 2022.
Hand, J. L. and Kreidenweis, S. M.: A New Method for Retrieving Particle Refractive Index and Effective Density from Aerosol Size Distribution Data, Aerosol Sci. Technol., 36, 1012–1026, https://doi.org/10.1080/02786820290092276, 2002.
Hand, J. L., Gill, T. E., and Schichtel, B. A.: Spatial and seasonal variability in fine mineral dust and coarse aerosol mass at remote sites across the United States, J. Geophys. Res.: Atmos., 122, 3080–3097, https://doi.org/10.1002/2016jd026290, 2017.
Hand, J.: IMPROVE Data User Guide 2023 (Version 2), Interagency Monitoring of Protected Visual Environments (IMPROVE) Program, https://vista.cira.colostate.edu/Improve/data-user-guide/ (last access: 21 January 2026), 2023.
Harrison, A. D., Lever, K., Sanchez-Marroquin, A., Holden, M. A., Whale, T. F., Tarn, M. D., McQuaid, J. B., and Murray, B. J.: The ice-nucleating ability of quartz immersed in water and its atmospheric importance compared to K-feldspar, Atmos. Chem. Phys., 19, 11343–11361, https://doi.org/10.5194/acp-19-11343-2019, 2019.
Herbert, R. J., Sanchez-Marroquin, A., Grosvenor, D. P., Pringle, K. J., Arnold, S. R., Murray, B. J., and Carslaw, K. S.: Gaps in our understanding of ice-nucleating particle sources exposed by global simulation of the UK Earth System Model, Atmos. Chem. Phys., 25, 291–325, https://doi.org/10.5194/acp-25-291-2025, 2025.
Hill, T. C. J., DeMott, P. J., Tobo, Y., Fröhlich-Nowoisky, J., Moffett, B. F., Franc, G. D., and Kreidenweis, S. M.: Sources of organic ice nucleating particles in soils, Atmos. Chem. Phys., 16, 7195–7211, https://doi.org/10.5194/acp-16-7195-2016, 2016.
Hiranuma, N., Augustin-Bauditz, S., Bingemer, H., Budke, C., Curtius, J., Danielczok, A., Diehl, K., Dreischmeier, K., Ebert, M., Frank, F., Hoffmann, N., Kandler, K., Kiselev, A., Koop, T., Leisner, T., Möhler, O., Nillius, B., Peckhaus, A., Rose, D., Weinbruch, S., Wex, H., Boose, Y., DeMott, P. J., Hader, J. D., Hill, T. C. J., Kanji, Z. A., Kulkarni, G., Levin, E. J. T., McCluskey, C. S., Murakami, M., Murray, B. J., Niedermeier, D., Petters, M. D., O'Sullivan, D., Saito, A., Schill, G. P., Tajiri, T., Tolbert, M. A., Welti, A., Whale, T. F., Wright, T. P., and Yamashita, K.: A comprehensive laboratory study on the immersion freezing behavior of illite NX particles: a comparison of 17 ice nucleation measurement techniques, Atmos. Chem. Phys., 15, 2489–2518, https://doi.org/10.5194/acp-15-2489-2015, 2015.
Hoose, C. and Möhler, O.: Heterogeneous ice nucleation on atmospheric aerosols: a review of results from laboratory experiments, Atmos. Chem. Phys., 12, 9817–9854, https://doi.org/10.5194/acp-12-9817-2012, 2012.
Hopke, P. K., Dai, Q., Li, L., and Feng, Y.: Global review of recent source apportionments for airborne particulate matter, Sci. Total Environ., 740, 140091, https://doi.org/10.1016/j.scitotenv.2020.140091, 2020.
Huang, S., Hu, W., Chen, J., Wu, Z. J., Zhang, D. Z., and Fu, P. Q.: Overview of biological ice nucleating particles in the atmosphere, Environ. Int., 146, 106197, https://doi.org/10.1016/j.envint.2020.106197, 2021.
Hwang, I. and Hopke, P. K.: Estimation of source apportionment and potential source locations of PM2.5 at a west coastal IMPROVE site, Atmos. Environ., 41, 506–518, https://doi.org/10.1016/j.atmosenv.2006.08.043, 2007.
IPCC: Climate Change 2022: Impacts, Adaptation, and Vulnerability, Contribution of Working Group II to the Sixth Assessment Report of the Intergovernmental Panel on Climate Change, edited by: Pörtner, H.-O., Roberts, D. C., Tignor, M., Poloczanska, E. S., Mintenbeck, K., Alegría, A., Craig, M., Langsdorf, S., Löschke, S., Möller, V., Okem, A., and Rama, B., Cambridge University Press, Cambridge, UK and New York, NY, USA, 3056 pp., https://doi.org/10.1017/9781009325844, 2022.
Jahl, L. G., Brubaker, T. A., Polen, M. J., Jahn, L. G., Cain, K. P., Bowers, B. B., Fahy, W. D., Graves, S., and Sullivan, R. C.: Atmospheric aging enhances the ice nucleation ability of biomass-burning aerosol, Sci. Adv., 7, eabd3440, https://doi.org/10.1126/sciadv.abd3440, 2021.
Jahn, L. G., Jahl, L. G., Bland, G. D., Bowers, B. B., Monroe, L. W., and Sullivan, R. C.: Metallic and crustal elements in biomass-burning aerosol and ash: Prevalence, significance, and similarity to soil particles, ACS Earth Space Chem., 5, 136–148, https://doi.org/10.1021/acsearthspacechem.9b00322, 2020.
Jain, P., Sharma, A. R., Acuna, D. C., Abatzoglou, J. T., and Flannigan, M.: Record-breaking fire weather in North America in 2021 was initiated by the Pacific Northwest heat dome, Commun. Earth Environ., 5, 202, https://doi.org/10.1038/s43247-024-01346-2, 2024.
Kanji, Z. A., Ladino, L. A., Wex, H., Boose, Y., Burkert-Kohn, M., Cziczo, D. J., and Krämer, M.: Overview of Ice Nucleating Particles, Meteor. Monogr., 58, 1.1–1.33, https://doi.org/10.1175/amsmonographs-d-16-0006.1, 2017.
Kiselev, A., Bachmann, F., Pedevilla, P., Cox, S. J., Michaelides, A., Gerthsen, D., and Leisner, T.: Active sites in heterogeneous ice nucleation-the example of K-rich feldspars, Science, 355, 367–371, https://doi.org/10.1126/science.aai8034, 2017.
Knippertz, P. and Stuut, J.-B. W.: Mineral dust, Mineral dust–A key player in the Earth system, Springer, Dordrecht, the Netherlands, 121–147, https://doi.org/10.15201/hungeobull.65.1.8, 2014.
Kobziar, L. N., Lampman, P., Tohidi, A., Kochanski, A. K., Cervantes, A., Hudak, A. T., McCarley, R., Gullett, B., Aurell, J., and Moore, R.: Bacterial emission factors: a foundation for the terrestrial-atmospheric modeling of bacteria aerosolized by wildland fires, Environ. Sci. Technol., 58, 2413–2422, https://doi.org/10.1021/acs.est.3c05142, 2024.
Koehler, K. A., Kreidenweis, S. M., DeMott, P. J., Prenni, A. J., and Petters, M. D.: Potential impact of Owens (dry) Lake dust on warm and cold cloud formation, J. Geophys. Res: Atmos., 112, D12210, https://doi.org/10.1029/2006JD008175, 2007.
Kuang, C., Singh, A., Howie, J., Salwen, C., and Hayes, C.: Scanning mobility particle sizer (AOSSMPS), 2021-10-27 to 2023-06-16, ARM Mobile Facility (GUC), Gunnison, CO; Supplemental Facility 2 (S2). Atmospheric Radiation Measurement (ARM) User Facility [data set], https://doi.org/10.5439/1476898, 2024.
Lacher, L., Steinbacher, M., Bukowiecki, N., Herrmann, E., Zipori, A., and Kanji, Z. A.: Impact of Air Mass Conditions and Aerosol Properties on Ice Nucleating Particle Concentrations at the High Altitude Research Station Jungfraujoch, Atmosphere, 9, 363, https://doi.org/10.3390/atmos9090363, 2018.
Lacher, L., Hallar, A. G., McCubbin, I. B., Bail, J., Froyd, K. D., Jacquot, J., Shen, X., Rapp, C., Möhler, O., and Cziczo, D.: Strong springtime increase of ice-nucleating particle concentration in the Rocky Mountains, EGUsphere [preprint], https://doi.org/10.5194/egusphere-2025-4492, 2025.
Liu, W. and Hopke, P. K.: Origins of fine aerosol mass in the western United States using positive matrix factorization, J. Geophys. Res: Atmos., 108, 4127, https://doi.org/10.1029/2003jd003678, 2003.
Lohmann, U. and Feichter, J.: Global indirect aerosol effects: a review, Atmos. Chem. Phys., 5, 715–737, https://doi.org/10.5194/acp-5-715-2005, 2005.
Lynn, B., Khain, A., Rosenfeld, D., and Woodley, W. L.: Effects of aerosols on precipitation from orographic clouds, J. Geophys. Res: Atmos., 112, D10225, https://doi.org/10.1029/2006JD007537, 2007.
Malm, W. C., Sisler, J. F., Huffman, D., Eldred, R. A., and Cahill, T. A.: Spatial and seasonal trends in particle concentration and optical extinction in the United States, J. Geophys. Res: Atmos., 99, 1347–1370, https://doi.org/10.1029/93JD02916, 1994.
Marinescu, P. J., Levin, E. J. T., Collins, D., Kreidenweis, S. M., and van den Heever, S. C.: Quantifying aerosol size distributions and their temporal variability in the Southern Great Plains, USA, Atmos. Chem. Phys., 19, 11985–12006, https://doi.org/10.5194/acp-19-11985-2019, 2019.
McCluskey, C. S., DeMott, P. J., Prenni, A. J., Levin, E. J. T., McMeeking, G. R., Sullivan, A. P., Hill, T. C. J., Nakao, S., Carrico, C. M., and Kreidenweis, S. M.: Characteristics of atmospheric ice nucleating particles associated with biomass burning in the US: Prescribed burns and wildfires, J. Geophys. Res.: Atmos., 119, 10458–10470, https://doi.org/10.1002/2014jd021980, 2014.
McCluskey, C. S., Ovadnevaite, J., Rinaldi, M., Atkinson, J., Belosi, F., Ceburnis, D., Marullo, S., Hill, T. C. J., Lohmann, U., Kanji, Z. A., O'Dowd, C., Kreidenweis, S. M., and DeMott, P. J.: Marine and Terrestrial Organic Ice-Nucleating Particles in Pristine Marine to Continentally Influenced Northeast Atlantic Air Masses, J. Geophys. Res.: Atmos., 123, 6196–6212, https://doi.org/10.1029/2017jd028033, 2018a.
McCluskey, C. S., Hill, T. C. J., Malfatti, F., Sultana, C. M., Lee, C., Santander, M. V., Beall, C. M., Moore, K. A., Cornwell, G. C., Collins, D. B., Prather, K. A., Jayarathne, T., Stone, E. A., Azam, F., Kreidenweis, S. M., and DeMott, P. J.: A Dynamic Link between Ice Nucleating Particles Released in Nascent Sea Spray Aerosol and Oceanic Biological Activity during Two Mesocosm Experiments, J. Atmos. Sci., 74, 151–166, https://doi.org/10.1175/Jas-D-16-0087.1, 2017.
McCluskey, C. S., Hill, T. C. J., Humphries, R. S., Rauker, A. M., Moreau, S., Strutton, P. G., Chambers, S. D., Williams, A. G., McRobert, I., Ward, J., Keywood, M. D., Harnwell, J., Ponsonby, W., Loh, Z. M., Krummel, P. B., Protat, A., Kreidenweis, S. M., and DeMott, P. J.: Observations of Ice Nucleating Particles Over Southern Ocean Waters, Geophys. Res. Lett., 45, e2018GL079981, https://doi.org/10.1029/2018gl079981, 2018b.
Meng, X., Yu, Y., and Ginoux, P.: Rise in dust emissions from burned landscapes primarily driven by small fires, Nat. Geosci., 18, 586–592, https://doi.org/10.1038/s41561-025-01730-3, 2025.
Meyers, M. P., DeMott, P. J., and Cotton, W. R.: New primary ice-nucleation parameterizations in an explicit cloud model, J. Appl. Meteor. Climatol., 31, 708–721, https://doi.org/10.1175/1520-0450(1992)031<0708:NPINPI>2.0.CO;2, 1992.
Miltenberger, A. K., Field, P. R., Hill, A. A., Rosenberg, P., Shipway, B. J., Wilkinson, J. M., Scovell, R., and Blyth, A. M.: Aerosol–cloud interactions in mixed-phase convective clouds – Part 1: Aerosol perturbations, Atmos. Chem. Phys., 18, 3119–3145, https://doi.org/10.5194/acp-18-3119-2018, 2018.
Mignani, C., Hill, T. C. J., Nieto-Caballero, M., Barry, K. R., Bryan, N. C., Marinescu, P. J., Dolan, B., Sullivan, A. P., Hernandez, M., Bosco-Lauth, A., van den Heever, S. C., Stone, E. A., Grant, L. D., Perkins, R. J., DeMott, P. J., and Kreidenweis, S. M.: Ice-Nucleating Particles Are Emitted by Raindrop Impact, J. Geophys. Res: Atmos., 130, e2024JD042584, https://doi.org/10.1029/2024jd042584, 2025.
Murray, B. J., O'Sullivan, D., Atkinson, J. D., and Webb, M. E.: Ice nucleation by particles immersed in supercooled cloud droplets, Chem. Soc. Rev., 41, 6519–6554, https://doi.org/10.1039/c2cs35200a, 2012.
Niemand, M., Möhler, O., Vogel, B., Vogel, H., Hoose, C., Connolly, P., Klein, H., Bingemer, H., DeMott, P., Skrotzki, J., and Leisner, T.: A Particle-Surface-Area-Based Parameterization of Immersion Freezing on Desert Dust Particles, J. Atmos. Sci., 69, 3077–3092, https://doi.org/10.1175/Jas-D-11-0249.1, 2012.
Norris, G., Duvall, R., Brown, S., and Bai, S.: EPA positive matrix factorization (PMF) 5.0 fundamentals and user guide, U.S. Environmental Protection Agency, Washington, DC, https://www.epa.gov/sites/default/files/2015-02/documents/pmf_5.0_user_guide.pdf (last access: 21 January 2026), 2014.
O'Sullivan, D., Murray, B. J., Ross, J. F., and Webb, M. E.: The adsorption of fungal ice-nucleating proteins on mineral dusts: a terrestrial reservoir of atmospheric ice-nucleating particles, Atmos. Chem. Phys., 16, 7879–7887, https://doi.org/10.5194/acp-16-7879-2016, 2016.
O'Sullivan, D., Murray, B. J., Malkin, T. L., Whale, T. F., Umo, N. S., Atkinson, J. D., Price, H. C., Baustian, K. J., Browse, J., and Webb, M. E.: Ice nucleation by fertile soil dusts: relative importance of mineral and biogenic components, Atmos. Chem. Phys., 14, 1853–1867, https://doi.org/10.5194/acp-14-1853-2014, 2014.
Paatero, P. and Tapper, U.: Positive matrix factorization: A non-negative factor model with optimal utilization of error estimates of data values, Environmetrics, 5, 111–126, https://doi.org/10.1002/env.3170050203, 1994.
Pereira, D. L., Gavilán, I., Letechipía, C., Raga, G. B., Puig, T. P., Mugica-Álvarez, V., Alvarez-Ospina, H., Rosas, I., Martinez, L., Salinas, E., Quintana, E. T., Rosas, D., and Ladino, L. A.: Mexican agricultural soil dust as a source of ice nucleating particles, Atmos. Chem. Phys., 22, 6435–6447, https://doi.org/10.5194/acp-22-6435-2022, 2022.
Pratt, K. A., DeMott, P. J., French, J. R., Wang, Z., Westphal, D. L., Heymsfield, A. J., Twohy, C. H., Prenni, A. J., and Prather, K. A.: In situ detection of biological particles in cloud ice-crystals, Nat. Geosci., 2, 398–401, https://doi.org/10.1038/ngeo521, 2009.
Pratt, K. A., Twohy, C. H., Murphy, S. M., Moffet, R. C., Heymsfield, A. J., Gaston, C. J., DeMott, P. J., Field, P. R., Henn, T. R., Rogers, D. C., Gilles, M. K., Seinfeld, J. H., and Prather, K. A.: Observation of playa salts as nuclei in orographic wave clouds, J. Geophys. Res.: Atmos., 115, D21304, https://doi.org/10.1029/2009jd013606, 2010.
Prenni, A. J., DeMott, P. J., Sullivan, A. P., Sullivan, R. C., Kreidenweis, S. M., and Rogers, D. C.: Biomass burning as a potential source for atmospheric ice nuclei: Western wildfires and prescribed burns, Geophys. Res. Lett., 39, L11805, https://doi.org/10.1029/2012gl051915, 2012.
Prenni, A. J., Tobo, Y., Garcia, E., DeMott, P. J., Huffman, J. A., McCluskey, C. S., Kreidenweis, S. M., Prenni, J. E., Pöhlker, C., and Pöschl, U.: The impact of rain on ice nuclei populations at a forested site in Colorado, Geophys. Res. Lett., 40, 227–231, https://doi.org/10.1029/2012gl053953, 2013.
Reicher, N., Budke, C., Eickhoff, L., Raveh-Rubin, S., Kaplan-Ashiri, I., Koop, T., and Rudich, Y.: Size-dependent ice nucleation by airborne particles during dust events in the eastern Mediterranean, Atmos. Chem. Phys., 19, 11143–11158, https://doi.org/10.5194/acp-19-11143-2019, 2019.
Rolph, G., Stein, A., and Stunder, B.: Real-time environmental applications and display system: READY, Environ. Model. Softw., 95, 210–228, https://doi.org/10.1016/j.envsoft.2017.06.025, 2017.
Sanchez-Marroquin, A., West, J. S., Burke, I. T., McQuaid, J. B., and Murray, B. J.: Mineral and biological ice-nucleating particles above the South East of the British Isles, Environ. Sci.: Atmos., 1, 176–191, https://doi.org/10.1039/d1ea00003a, 2021.
Schill, G. P., DeMott, P. J., Emerson, E. W., Rauker, A. M. C., Kodros, J. K., Suski, K. J., Hill, T. C. J., Levin, E. J. T., Pierce, J. R., Farmer, D. K., and Kreidenweis, S. M.: The contribution of black carbon to global ice nucleating particle concentrations relevant to mixed-phase clouds, Proc. Natl. Acad. Sci. USA, 117, 22705–22711, https://doi.org/10.1073/pnas.2001674117, 2020.
Schnell, R. C. and Vali, G.: Looking Back: An Account of How Ice Nucleation by Bacteria Was Discovered (1963 to about Mid-1980s). Part II: Broadening the Scope, Bull. Am. Meteorol. Soc., 105, E1004–E1014, https://doi.org/10.1175/bams-d-23-0115.1, 2024.
Seinfeld, J. H. and Pandis, S. N.: Atmospheric chemistry and physics: from air pollution to climate change, 3rd edn., Wiley, Hoboken, NJ, ISBN 978-1-118-94740-1, 2016.
Seinfeld, J. H., Bretherton, C., Carslaw, K. S., Coe, H., DeMott, P. J., Dunlea, E. J., Feingold, G., Ghan, S., Guenther, A. B., Kahn, R., Kraucunas, I., Kreidenweis, S. M., Molina, M. J., Nenes, A., Penner, J. E., Prather, K. A., Ramanathan, V., Ramaswamy, V., Rasch, P. J., Ravishankara, A. R., Rosenfeld, D., Stephens, G., and Wood, R.: Improving our fundamental understanding of the role of aerosol-cloud interactions in the climate system, Proc. Natl. Acad. Sci. USA, 113, 5781–5790, https://doi.org/10.1073/pnas.1514043113, 2016.
Shawon, A. S. M., Benedict, K. B., Gutierrez, A., and Aiken, A. C.: Diurnal Trends and Meteorological Factors Influencing the Variability of Fluorescent Bioaerosol in Mt. Crested Butte, Colorado During SAIL, J. Geophys. Res.: Atmos., 130, e2024JD041186, https://doi.org/10.1029/2024jd041186, 2025.
Shi, Y., Creamean, J., Hill, T., Hume, C., and Vazquez, M.: Ice Nucleation Spectrometer for INP measurement (INP), 2021-09-09 to 2023-06-12, ARM Mobile Facility (GUC), Gunnison, CO, Supplemental Facility 2 (S2), Atmospheric Radiation Measurement (ARM) User Facility [data set], https://doi.org/10.5439/1770816, 2025.
Shi, Y. and Liu, X.: Dust radiative effects on climate by glaciating mixed-phase clouds, Geophys. Res. Lett., 46, 6128–6137, https://doi.org/10.1029/2019GL082992, 2019.
Stein, A. F., Draxler, R. R., Rolph, G. D., Stunder, B. J., Cohen, M. D., and Ngan, F.: NOAA's HYSPLIT atmospheric transport and dispersion modeling system, Bull. Am. Meteorol. Soc., 96, 2059–2077, https://doi.org/10.1175/BAMS-D-14-00110.1, 2015.
Steinke, I., Funk, R., Busse, J., Iturri, A., Kirchen, S., Leue, M., Möhler, O., Schwartz, T., Schnaiter, M., Sierau, B., Toprak, E., Ullrich, R., Ulrich, A., Hoose, C., and Leisner, T.: Ice nucleation activity of agricultural soil dust aerosols from Mongolia, Argentina, and Germany, J. Geophys. Res.: Atmos., 121, 13559–13576, https://doi.org/10.1002/2016jd025160, 2016.
Storelvmo, T., Hoose, C., and Eriksson, P.: Global modeling of mixed-phase clouds: The albedo and lifetime effects of aerosols, J. Geophys. Res.: Atmos., 116, D05207, https://doi.org/10.1029/2010JD014724, 2011.
Sun, Y., Zhu, Y., Qi, Y., Chen, L., Mu, J., Shan, Y., Yang, Y., Nie, Y., Liu, P., Cui, C., Zhang, J., Liu, M., Zhang, L., Wang, Y., Wang, X., Tang, M., Wang, W., and Xue, L.: Measurement report: Atmospheric ice nuclei in the Changbai Mountains (2623 m a.s.l.) in northeastern Asia, Atmos. Chem. Phys., 24, 3241–3256, https://doi.org/10.5194/acp-24-3241-2024, 2024.
Suski, K. J., Hill, T. C. J., Levin, E. J. T., Miller, A., DeMott, P. J., and Kreidenweis, S. M.: Agricultural harvesting emissions of ice-nucleating particles, Atmos. Chem. Phys., 18, 13755–13771, https://doi.org/10.5194/acp-18-13755-2018, 2018.
Testa, B., Hill, T. C. J., Marsden, N. A., Barry, K. R., Hume, C. C., Bian, Q., Uetake, J., Hare, H., Perkins, R. J., Möhler, O., Kreidenweis, S. M., and DeMott, P. J.: Ice Nucleating Particle Connections to Regional Argentinian Land Surface Emissions and Weather During the Cloud, Aerosol, and Complex Terrain Interactions Experiment, J. Geophys. Res.: Atmos., 126, e2021JD035186, https://doi.org/10.1029/2021jd035186, 2021.
Tobo, Y., DeMott, P. J., Hill, T. C. J., Prenni, A. J., Swoboda-Colberg, N. G., Franc, G. D., and Kreidenweis, S. M.: Organic matter matters for ice nuclei of agricultural soil origin, Atmos. Chem. Phys., 14, 8521–8531, https://doi.org/10.5194/acp-14-8521-2014, 2014.
Tobo, Y., Prenni, A. J., DeMott, P. J., Huffman, J. A., McCluskey, C. S., Tian, G., Pöhlker, C., Pöschl, U., and Kreidenweis, S. M.: Biological aerosol particles as a key determinant of ice nuclei populations in a forest ecosystem, J. Geophys. Res.: Atmos., 118, 10100–10110, https://doi.org/10.1002/jgrd.50801, 2013.
Umo, N. S., Murray, B. J., Baeza-Romero, M. T., Jones, J. M., Lea-Langton, A. R., Malkin, T. L., O'Sullivan, D., Neve, L., Plane, J. M. C., and Williams, A.: Ice nucleation by combustion ash particles at conditions relevant to mixed-phase clouds, Atmos. Chem. Phys., 15, 5195–5210, https://doi.org/10.5194/acp-15-5195-2015, 2015.
Vali, G.: Quantitative evaluation of experimental results on the heterogeneous freezing nucleation of supercooled liquids, J. Atmos. Sci., 28, 402–409, 1971.
Vali, G. and Schnell, R. C.: Looking Back: An Account of How Ice Nucleation by Bacteria Was Discovered (1963 to about Mid-1980s). Part I: The Basics, Bull. Am. Meteorol. Soc., 105, E778–E788, https://doi.org/10.1175/bams-d-23-0114.1, 2024.
Viviroli, D., Dürr, H. H., Messerli, B., Meybeck, M., and Weingartner, R.: Mountains of the world, water towers for humanity: Typology, mapping, and global significance, Water Resour. Res., 43, W07447, https://doi.org/10.1029/2006WR005653,2007.
Wagner, R., Jähn, M., and Schepanski, K.: Wildfires as a source of airborne mineral dust – revisiting a conceptual model using large-eddy simulation (LES), Atmos. Chem. Phys., 18, 11863–11884, https://doi.org/10.5194/acp-18-11863-2018, 2018.
Wilson, T. W., Ladino, L. A., Alpert, P. A., Breckels, M. N., Brooks, I. M., Browse, J., Burrows, S. M., Carslaw, K. S., Huffman, J. A., Judd, C., Kilthau, W. P., Mason, R. H., McFiggans, G., Miller, L. A., Najera, J. J., Polishchuk, E., Rae, S., Schiller, C. L., Si, M., Temprado, J. V., Whale, T. F., Wong, J. P., Wurl, O., Yakobi-Hancock, J. D., Abbatt, J. P., Aller, J. Y., Bertram, A. K., Knopf, D. A., and Murray, B. J.: A marine biogenic source of atmospheric ice-nucleating particles, Nature, 525, 234–238, https://doi.org/10.1038/nature14986, 2015.
Zhao, X., Jiang, K., Ouyang, S., Li, Y., Wang, Y., Wang, J., Zhao, N., and Shen, G.: Global Biomass Burning Emission Contributions to Ice Nucleating Particles, Geophys. Res. Lett., 51, e2024GL111881, https://doi.org/10.1029/2024gl111881, 2024.
Zhou, R., Perkins, R., and Kreidenweis, S.: Source apportionment of aerosols at the White River IMPROVE site near the SAIL site, ARM Data Collection, Oak Ridge National Laboratory, U.S. Department of Energy, Oak Ridge, Tennessee, USA [data set], https://doi.org/10.5439/2573028, 2025a.
Zhou, R., Perkins, R., Kreidenweis, S., and Ayars, K.: Back trajectories during SAIL, ARM Data Collection, Oak Ridge National Laboratory, U.S. Department of Energy, Oak Ridge, Tennessee, USA [data set], https://doi.org/10.5439/2574969, 2025b.
Zhou, R., Perkins, R., and Kreidenweis, S.: Merged aerosol size distribution from SMPS and OPC for SAIL, ARM Data Collection, Oak Ridge National Laboratory, U.S. Department of Energy, Oak Ridge, Tennessee, USA [data set], https://doi.org/10.5439/2572899, 2025c.