
the Creative Commons Attribution 4.0 License.
the Creative Commons Attribution 4.0 License.
 | 26 Oct 2026
Relationships between deep convective clouds, cirrus clouds, and the tropical easterly jet over the Indian region observed with Aeolus spaceborne Doppler wind lidar
Zacharie Titus

Marine Bonazzola
Hélène Chepfer
Artem Feofilov
Marie-Laure Roussel
Direct wind observations used to be rare over the Arabian Sea and the Bay of Bengal. Since the launch of ESA's Aeolus Doppler Wind Lidar, profiles of horizontal wind are acquired every day and are perfectly co-located with profiles of cirrus and deep convective clouds. In this study, we first observe that while the Tropical Easterly Jet (TEJ) is primarily driven by the thermal contrast between warmer land and cooler Indian Ocean, the diverging-rotating outflow around deep convective clouds can strengthen or weaken the TEJ over the Arabian Sea with respect to the wind expected from thermal wind balance, explaining a 3 m s−1 amplitude variation during the South-Asian Summer Monsoon (SASM). We further focus on disentangling the role of this wind in the formation of cirrus clouds over the Arabian Sea during the SASM, from the roles of temperature and convective intensity variations. We show that from June to October 2020, during the SASM, high altitude clouds formed over the Bay of Bengal by deep convection in the afternoon are advected westward towards the Arabian Sea in the morning by the fast winds of the TEJ. Consequently, the cirrus cloud cover over the Arabian Sea is 14 % at 06:00 LT on days where westward winds are faster than 23.6 m s−1 between 14 and 17 km of altitude, more than twice as much than on days where westward winds are slower than 23.6 m s−1 (6 %). These results suggest that the cirrus cloud cover over the Arabian Sea may decrease in the next decades, as the TEJ and the deep convection over the eastern Indian Ocean are expected to decrease in intensity.
- Article
(8860 KB) - Full-text XML
- BibTeX
- EndNote


Tropical deep convection leads to the formation of high altitude clouds that can reach up to 17 km of altitude around India (Mehta, 2024). At its top, the cloud spreads out horizontally away from the convective core (optically opaque), to form an anvil cloud (Betts, 1973; Ackerman et al., 1988). The edge of the anvil cloud (optically thin) can be detrained further away from the core by the local dynamics. Detrained cirrus represent about half of cirrus occurrences (Massie et al., 2002; Luo and Rossow, 2004) while the other half of cirrus are formed “in-situ” (i.e. they do not directly originate from deep convection). Cirrus can be advected over distances larger than 1000 km (Luo and Rossow, 2004). They live for a few hours up to a few days until they are dissipated by solar warming (Chepfer et al., 2019), gravity waves interactions (Corcos et al., 2023), or sedimentation of ice crystals (Stubenrauch et al., 2019; Jensen et al., 2025). Within anvil clouds, the balance between the cover of the convective part of the cloud (good shortwave reflector) and the cover of the cirrus part of the cloud (longwave trap) leads to a neutral radiative effect (Ramanathan et al., 1989; Hartmann and Berry, 2017; Gasparini et al., 2021). However, observations revealed that with increasing sea surface temperatures, deep convective and anvil clouds decrease disproportionately compared to cirrus clouds (Höjgård-Olsen et al., 2022). The change in anvil cloud properties (optical thinning) could have a positive (warming) radiative effect in a warming world (Sokol et al., 2024; McKim et al., 2024).
In this study, we focus on the Indian region during the South Asian Summer Monsoon (SASM), characterized by a strong convection over the Indian continent and the Bay of Bengal, and at the same time by a fast westward wind in the upper troposphere reaching more than 30 m s−1, the Tropical Easterly Jet (TEJ). This region is the theatre of a subtle interplay between temperature, deep convection, the TEJ and the cirrus cover: the temperature contrast controls the TEJ speed via the thermal wind balance, and the TEJ speed is also controlled by, or controls, the occurrence and locations of deep convection. Deep convection acts as a source of water vapour in the upper troposphere which forms cirrus clouds that may extend over large distances depending on the speed of the TEJ and temperature conditions. In turn, the cirrus cloud cover may affect temperatures of the upper troposphere by its radiative effect (Fu et al., 2018).
Das et al. (2011) have noticed a correlation between the cirrus cloud cover and TEJ at 150 hPa during the SASM. While they observed that the TEJ spreads humidity over the Indian region, they do not explain if the cirrus clouds are simply detrained from deep convection or formed in-situ as cold temperature anomalies lead to the formation of ice crystals. The TEJ is mainly due to a large thermal contrast in the upper troposphere between the heated, elevated Tibetan plateau region and the cooler Indian Ocean region (Koteswaram, 1958). Chen (1982) suggested that in addition to this mechanism, the TEJ is energetically maintained by the release of available potential energy by the tropical divergent circulation associated with both the North-South (Hadley) and the East-West (Walker) circulations. He showed that the kinetic energy of the easterly jet is generated on the upstream side where an upward branch of the East-West Walker circulation is located (Chen, 1982). The interannual variation of the TEJ may thus be explained by changes of the tropical divergent circulations (Chen and van Loon, 1987). Pattanaik and Satyan (2000) indeed showed a strong interannual variability of the TEJ associated with the phase of El Nino Southern Oscillation and the intensity of the TEJ associated with summer monsoon rainfall over India. In a warming climate, Huang et al. (2020) also showed that the CMIP-6 projected El Niño-like warming pattern over the tropical Pacific may play a critical role in the future weakening of the TEJ, via suppressing rainfall over the tropical eastern Indian Ocean and maintaining an upper-level convergence, leading to slower easterly winds in the upper troposphere over most of the Indian Ocean. Rao et al. (2004) proved with NCEP/NCAR reanalyses and radiosonde data the existence of a strong correlation between the speed of the TEJ and the number of tropical cyclones over the Bay of Bengal for a period of more than 40 years. They interpreted this correlation by the higher growth rates of monsoon depressions due to strong easterly wind shears. More recently, Ye et al. (2023) observed that the location of the core of the TEJ exhibits a large interannual longitudinal variability around India, and particularly in June. Liu et al. (2024) further showed that this variability also has a latitudinal component, particularly in July, that changes with convective activity in the Arabian sea. They demonstrated that a strengthening of deep convection in the Arabian Sea and a suppression of convection in the Bay of Bengal drive the northwest shift in the core of the TEJ.
Although the variations of the TEJ at the synoptic and intraseasonal scales received less attention, Sathiyamoorthy et al. (2007) noted a concomitant shifting of the locations of deep convection, low level monsoon flow and TEJ during the different phases of the SASM, suggesting that they all may be related. Some authors studied the link between the TEJ and Sahel rainfall at these time scales. Nicholson (2009) suggested that there is a causal relationship between the TEJ and Sahel rainfall, with a faster TEJ enhancing rainfall by strengthening the upper-level divergence. Diongue et al. (2002) showed that the diverging-rotating outflow at the top of Deep Convective Systems (DCS) over West Africa induces a westward wind anomaly at the South-West of the DCS. The westward wind anomaly maximizes 1 or 2 d after the growth of the DCS (Lemburg et al., 2019). This time lag indicates that deep convection anomalies are more likely to drive changes in the regional TEJ than vice versa.
The aim of this study is thus to investigate the relationships between cirrus clouds, deep convective clouds, and the TEJ over the Indian region during the SASM. We test four hypotheses: (H1) The TEJ is modulated by the circulations associated with the deep convective patterns, (H2) these wind variations affect the cirrus cloud cover over the Arabian Sea; (H3) the cirrus cloud cover in this region depends on the mean temperature of the upper troposphere, (H4) the cirrus cloud cover over the Arabian Sea depends on the intensity of deep convection located over the Indian continent and the Bay of Bengal. Understanding the general framework of these interactions is important, considering the expected weakening of the TEJ in a warming climate (Rao et al., 2004; Huang et al., 2020), as well as the decrease in the convection over the Bay of Bengal (Rao et al., 2004). These changes are likely to impact the cirrus cloud cover over the Indian region in the future.
In this study, the novelty is the use of profiles of horizontal winds observed by ALADIN/Aeolus spaceborne Doppler Wind Lidar. The satellite covers the Arabian Sea, India, and the Bay of Bengal, allowing us to study wind-cloud observations beyond regions usually observed with radiosondes (Roja Raman et al., 2009; Mehta, 2024). Aeolus observations have the advantage of a lower wind bias compared to models or reanalysis in the Tropical upper troposphere, especially near regions with deep convection (Rennie et al., 2021). We make use of an Aeolus dataset (Titus et al., 2026), in which the profiles of horizontal wind are co-located with profiles of cirrus and deep convective clouds. This dataset is particularly well adapted to our study. First, Aeolus observations are available at 06:00 and 18:00 LT, and are thus suited to document convective clouds that develop in the late afternoon (Chepfer et al., 2019). Second, due to the orbit track of Aeolus, observations occurring 12 h later are shifted westward by 1150 km. This unique configuration is adequate to study processes with a time lag such as the advection of water vapour and cirrus clouds from the Bay of Bengal to the Arabian Sea, or the strengthening of the TEJ over the Arabian Sea following deep convection anomalies above India and the Bay of Bengal. Third, the TEJ is almost purely zonal (Mohan and Rao, 2016; Iqbal et al., 2017) and is thus well observed by Aeolus, as Aeolus is more favourable for measuring zonal winds instead of meridional winds due to the measurement geometry (Krisch et al., 2022).
The paper is structured as follows. We first briefly describe our Aeolus dataset, our domains of study, and the methods used to distinguish deep convective clouds from cirrus clouds and to calculate the thermal wind (Sect. 2). We characterize the annual variation and the diurnal contrast of winds and clouds over the Indian region (Sect. 3). We evaluate how different deep convection patterns above the Indian region weaken or strengthen the zonal wind through divergence and vorticity of the convective outflow on intraseasonal time scale (Sect. 4). We then quantify how the zonal wind affects the cirrus cloud cover over the Arabian Sea, and we attempt to disentangle this effect from the respective roles of temperature and convective intensity variations (Sect. 5). We finally conclude this paper in Sect. 6.
The Aeolus satellite carries the Atmospheric LAser Doppler INstrument (ALADIN), a 355 nm spaceborne Doppler Wind Lidar with High Spectral Resolution capabilities (Stoffelen et al., 2005; Reitebuch, 2012). Aeolus is primarily designed to retrieve profiles of horizontal winds but can also retrieve profiles of clouds (Feofilov et al., 2022; Donovan et al., 2024; Titus et al., 2026). In this study, we make use of a global wind and cloud profiles dataset observed with Aeolus (Titus et al., 2026) which covers the period from 1 January 2020 to 31 December 2020. For each day of the year 2020, the Bay of Bengal and the Arabian Sea are overflown by Aeolus at least once at 06:00 and once at 18:00 LT.
2.1 Clouds from Aeolus
The clouds are detected at a spatial resolution of 3 km along the orbit track horizontally and 480 m vertically after a linear interpolation of the signal along the vertical (the native vertical resolution of Aeolus is typically 1 km in the Tropical upper troposphere). Each single profile contains 40 vertical bins, and each 3 km × 480 m bin is either classified as “clear”, “cloudy” or “fully attenuated”. This last category corresponds to a bin where the laser is fully attenuated because the atmosphere above the bin has an optical thickness typically larger than 3 to 5. More details are given in Appendix A1.
We use this bin classification to discriminate between single profiles containing optically thin clouds (0.03 < τ < 3 to 5 ), such as in-situ or detrained cirrus clouds, from single profiles containing optically opaque clouds (τ > 3 to 5), such as convective clouds or the thickest part of anvil clouds, closer to the convective core (Fig. 1). To do so, in each single profile containing at least one “cloudy” bin, we evaluate if all the bins between the ground and 1 km below the lowermost cloudy bin are fully attenuated. If this is the case, then the single profile is flagged as “opaque” (see profiles #4 and #5, Fig. 1), otherwise, the single profile is flagged as “thin” (see profiles #2 and #3, Fig. 1). Single profiles which contain no cloudy layer between the ground and 18 km of altitude are simply flagged as “clear” (see profile #1, Fig. 1)
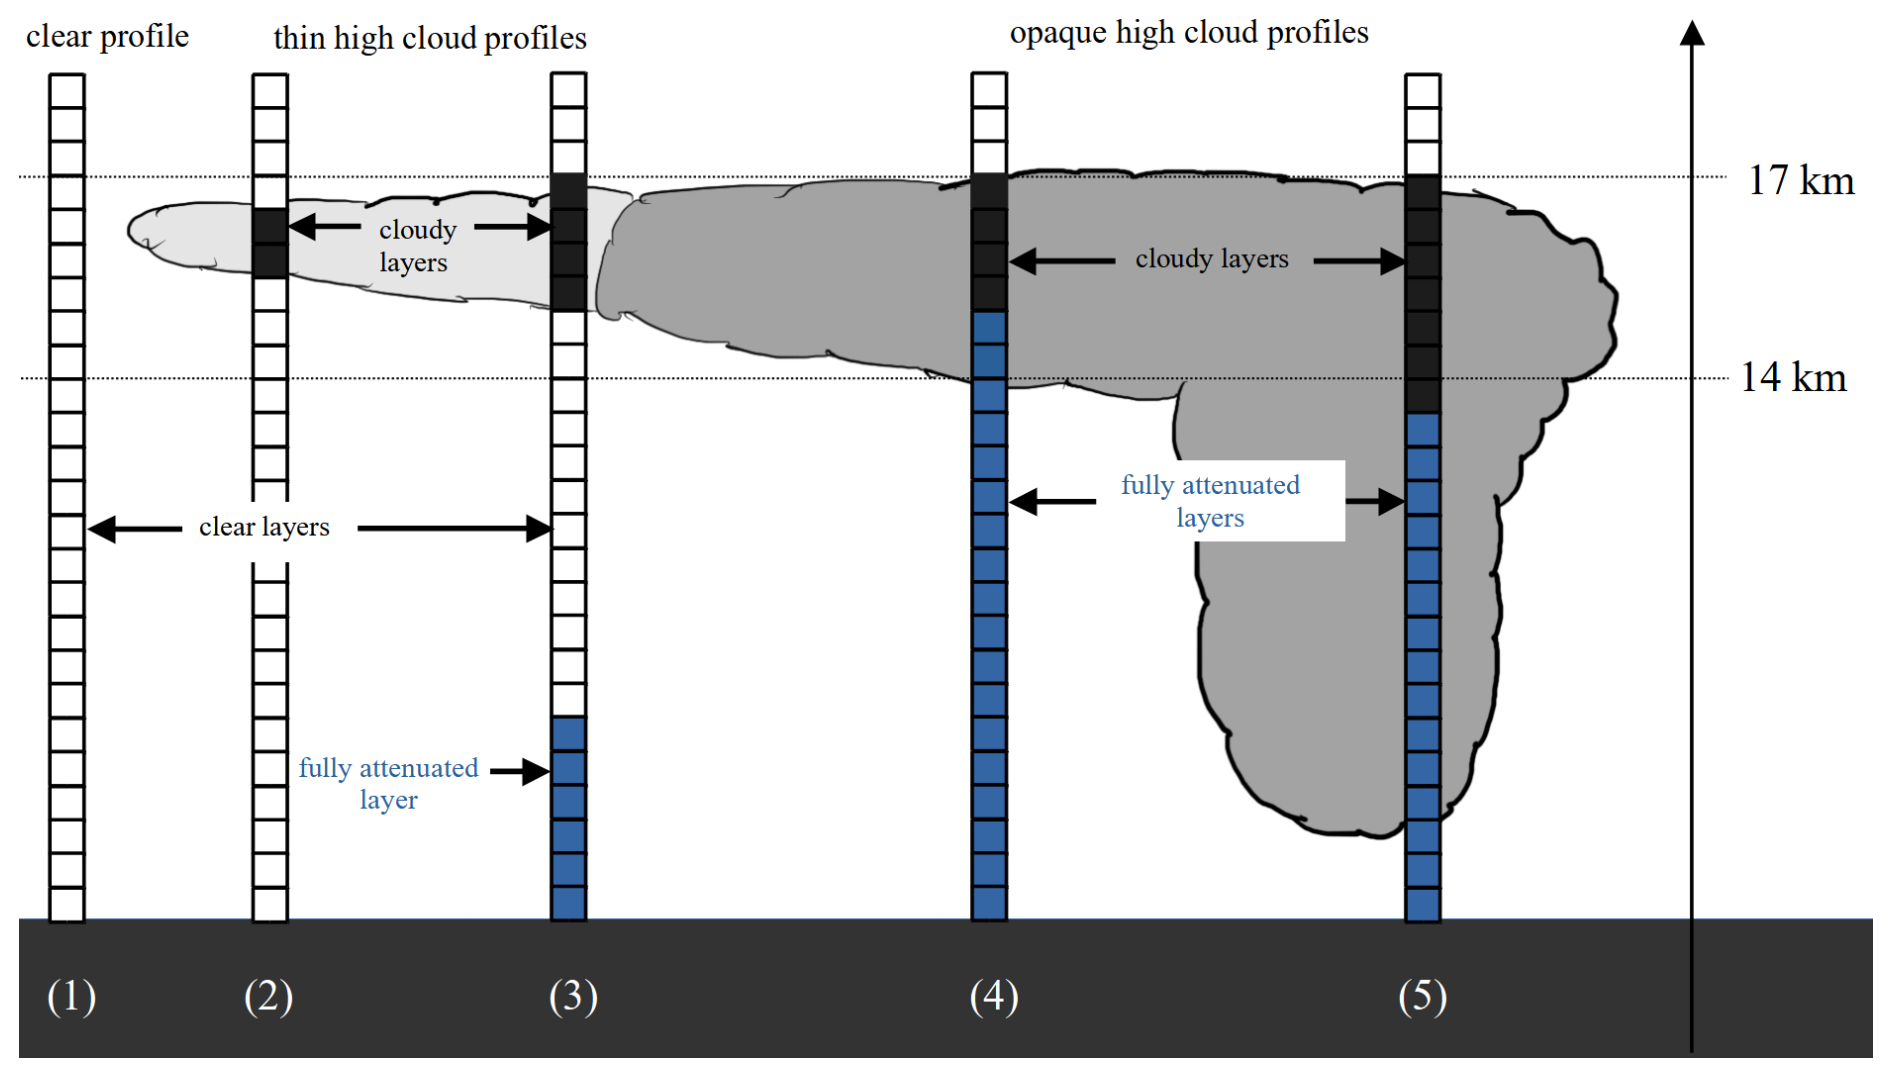
Figure 1Schematic of the different types of profiles (clear, thin and opaque profiles) observed with Aeolus.
Then, we consider all the single profiles falling within 2° latitude × 2° longitude boxes to build the gridded deep convective (cirrus) cloud fraction profiles, between 8 and 18 km of altitude. Those are three-dimensional quantities (2° longitude × 2° latitude × 480 m vertically), representing the number of 3 km × 480 m cloudy bins at a given altitude level among “opaque” (“thin”) profiles divided by the number of bins which are not “fully attenuated” at the same altitude level within the considered 2° longitude × 2° latitude grid box.
We further define diagnostics at high altitude, near the TEJ, between 14 and 17 km: the deep convective (cirrus) cloud fraction profiles at high altitude, which retain the values of deep convective (cirrus) cloud fractions but only between 14 and 17 km of altitude instead of 8–18 km.
In addition to the previous vertically resolved profiles, we define the deep convective (cirrus) cloud cover, which are two-dimensional (2° longitude × 2° latitude) quantities. They represent the number of opaque (thin) profiles containing at least one 3 km × 480 m cloudy bin between 14 and 17 km of altitude, divided by the total number of profiles within the considered 2° longitude × 2° latitude grid box.
2.2 Winds from Aeolus
Hereafter, we use Aeolus profiles of horizontal wind speed, noted uallsky in Titus et al. (2026). Within a single profile, the value of the horizontal wind speed uallsky is given for each 480 m thick bin beside the cloud/clear flags (Sect. 2.1). We use the notation uallsky for the wind (instead of the notation vHLOS commonly used in the Aeolus literature) because the wind is observed both within clear and cloudy bins (but not within fully attenuated bins). We note positive (negative) uallsky values corresponding to eastward (westward) winds.
As the laser is pointed 35° off-nadir and perpendicular to the satellite track, away from the Sun, the Aeolus measurement is not the actual horizontal wind, but the horizontal projection of the wind component retrieved along the Line-of-Sight (LOS) of Aeolus. However, at the latitudes considered in this paper, the angle between the horizontal projection of the LOS and the West-East direction is between 8 and 10°. Consequently, Aeolus essentially retrieves the zonal component of the wind (Krisch et al., 2022). The relative difference between the zonal component of the wind and the horizontal projection of the wind along the LOS is about 1 %. The restriction to the zonal component of the wind does not represent a limitation of our study, as the TEJ is also almost purely zonal (Mohan and Rao, 2016; Iqbal et al., 2017).
2.3 Domains of study
We define three domains: the Indian Region (12–24° N and 53–98° E), the Arabian Sea (12–24° N and 53–75° E) and a third domain that encompasses the Bay of Bengal and a large part of India (12–24° N and 76–98° E). This analysis benefits from Aeolus sun-synchronous orbit configuration. Figure 2 details an entire 7 d cycle of Aeolus orbits from 8 to 14 January 2020. On 8 January 2020, Aeolus crosses the middle of Arabian Sea domain at 06:00 LT, between 65° E at 24° N and 63° E at 12° N (dark blue orbit, Fig. 2). On the same day, 12 h later, Aeolus ascending orbit overflies the Bay of Bengal domain at 18:00 LT on the very East, between 98° E at 12° N and 96° E at 24° N (dark blue orbit, Fig. 2). On 9 January 2020, the orbits crossing each domain are shifted by about 300 km westward compared to the previous day orbits (lighter blue orbit, Fig. 2). After 7 d, both domains are fully paved, and Aeolus follows exactly the same orbits with a 7 d periodicity. For example, Aeolus overflies the descending and ascending dark blue orbits (Fig. 2) again on 15 January 2020 at 06:00 and 18:00 LT, respectively. On 3 d out of the 7 d cycle, the descending orbit of Aeolus over the Arabian Sea is located exactly 10.5°, or about 1150 km westward of the ascending orbit which overflew the Bay of Bengal or India 12 h before (see for example the distance between the yellow orbit over the Arabian Sea on the 14 January 2020, and the light green orbit over India on the 13 January, Fig. 2). Consequently, an air parcel that is observed by Aeolus over the Bay of Bengal at 18:00 LT, and advected westward by the TEJ at about 25 m s−1 will be located around the Aeolus orbit track 12 h later, over the Arabian Sea.
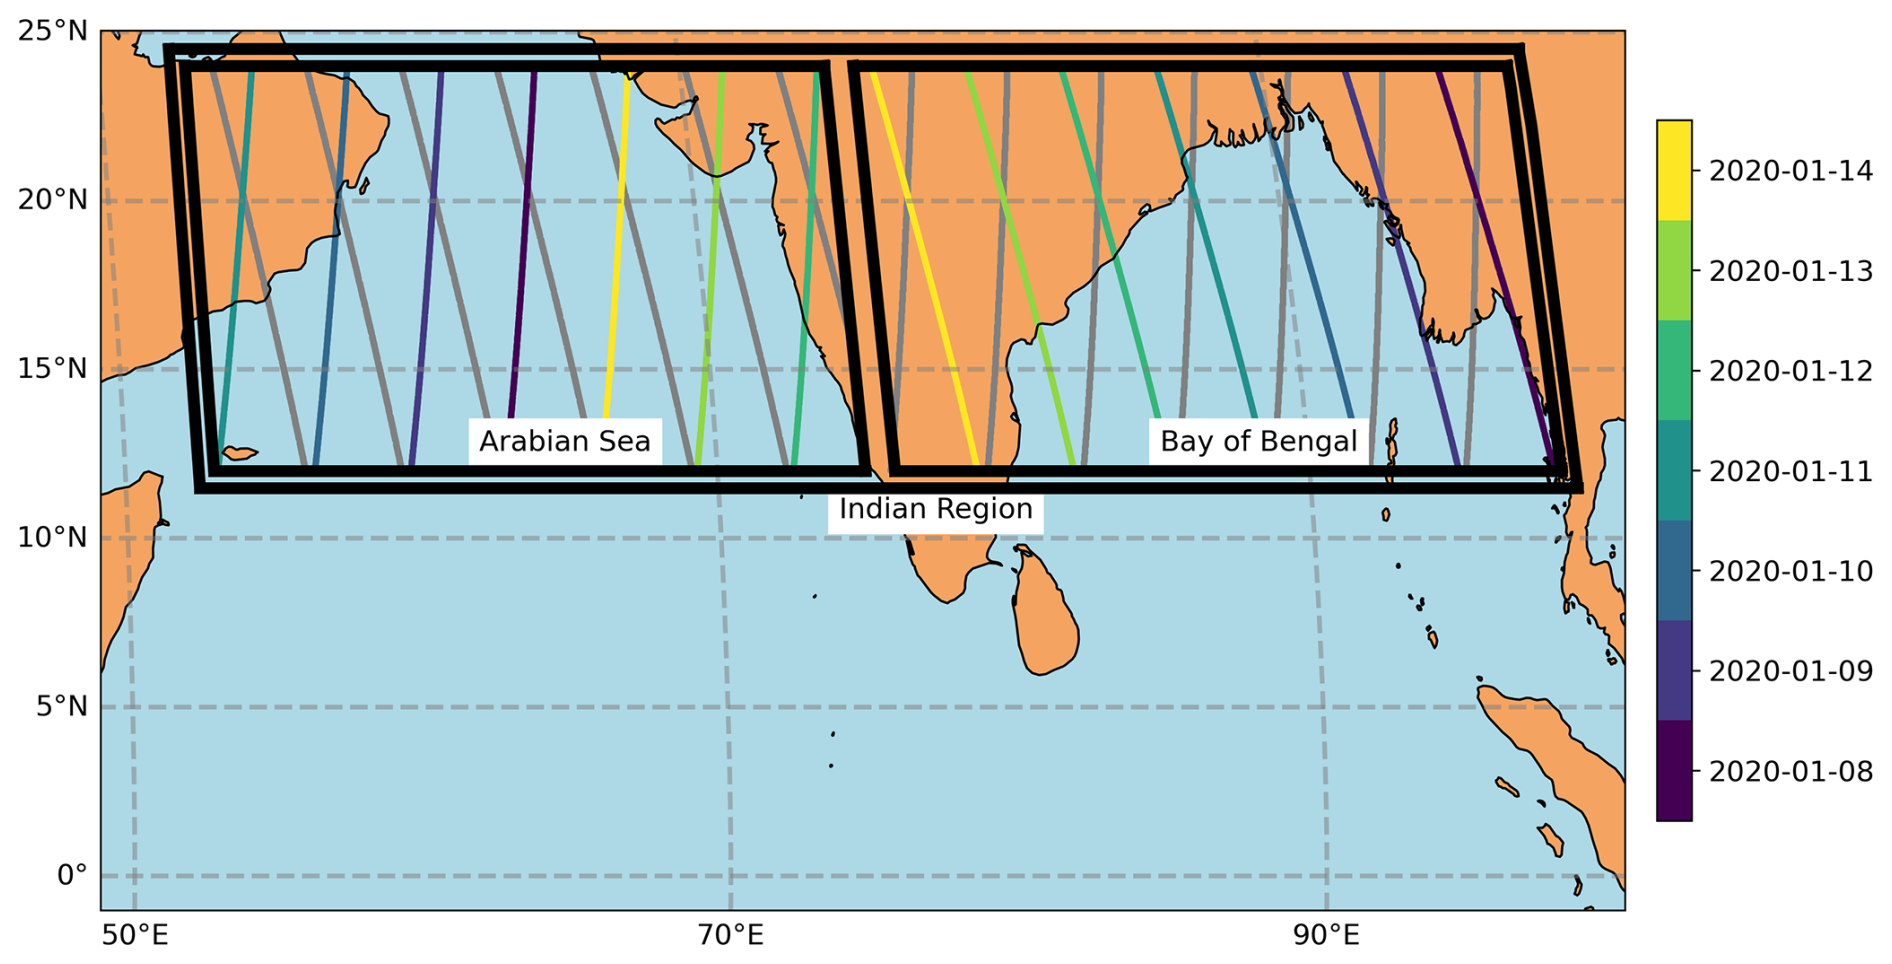
Figure 2Aeolus over the Indian Region (12–24° N and 53–98° E) during a 7 d period between 8 and 14 January 2020. The descending orbits at 06:00 LT over the Arabian Sea (12–24° N and 53–75° E) and ascending orbits at 18:00 LT over the Bay of Bengal (12–24° N and 76–98° E) are colour-coded according to the day of the orbit. These orbits are particularly used in Sects. 4 and 5 of this study. The ascending orbits at 18:00 LT over the Arabian Sea and descending orbits at 06:00 LT over the Bay of Bengal are also represented in gray.
2.4 Thermal wind over the Arabian Sea derived from ERA5
We compute the thermal wind at 06:00 LT along each Aeolus orbit in the Arabian Sea domain. To do so, we first compute the temperature differences ΔTNS(p) between the northern and southern borders of the Arabian Sea domain, at the mean longitude of the considered orbit, at each pressure levels (p) between 7 and 15 km of altitude, at 06:00 LT (more details are given in Fig. B1):
Second, we compute the zonal component of the thermal wind between 7 and 15 km at 06:00 LT, :
where ug is the geostrophic wind, R is the thermodynamic constant for dry air (287 J K−1 kg−1), f is the Coriolis parameter estimated at the latitude θ0 = 18° N (the mean latitude of the Arabian Sea domain), pz = 7 km and pz = 15 km are the average pressures at the altitudes of 7 and 15 km respectively. The length Δy is given by: Δy = REΔθ, where RE is the Earth radius and Δθ = 15° is the latitude range over which the temperature difference is estimated.
We also estimate the longitudinal temperature differences ΔTEW between the eastern and western borders of the Arabian Sea domain, at each pressure level p between 7 and 15 km of altitude, at 06:00 LT:
where TE(p) is the mean temperature at the level p within the eastern border box defined as the area within 12 to 24° N and 75 to 79° E and TW(p) is the mean temperature at the pressure level p within the western border box defined as the area within 12 to 24° N and 49 to 53° E.
We compute the meridional component of the thermal wind between 7 and 15 km at 06:00 LT, :
The length Δx is given by: Δx = REcos (θ0)Δλ, where Δλ = 26° is the longitude range over which the temperature difference is estimated.
We finally derive the projection of the thermal wind vector along the LOS of Aeolus:
where ϕ is the angle formed between the thermal wind vector and the horizontal projection of the LOS of Aeolus. We note that because Δvg≪Δug, and because of the observation geometry, Δuthermal, ERA5 and Δug only differ by 1 m s−1 at the highest.
3.1 Properties of the Tropical Easterly Jet and clouds in 2020
The Indian Region is under the influence of the Sub-Tropical Jet (STJ) from January to May, with eastward winds exceeding 30 m s−1 between 10 and 14 km of altitude (Fig. 3a). During the same period, both deep convective and cirrus cloud fractions observed by Aeolus, remain below 10 % (Fig. 3b, c). As the South-Asian Summer Monsoon (SASM) onsets in late May, a reversal of the wind (from eastward to westward) is observed: this is the TEJ. From mid-June to August, the TEJ is maintained and exceeds 30 m s−1 between 14 and 17 km of altitude, before decaying in September (Fig. 3a). The wind remains westward until late October. During the active phase of SASM (late May–October), deep convective cloud fractions larger than 30 % and cirrus cloud fractions larger than 15 % are frequently observed over the Indian region between 14 and 17 km of altitude (Fig. 3b, c). Note that over the entire Indian region, profiles of deep convective and cirrus cloud fractions, estimated from the same orbits of Aeolus are well correlated. When SASM decays in late October, the Inter Tropical Convergence Zone (ITCZ) migrates southward and winds reverse again (from westward to eastward) as the STJ becomes the dominant zonal circulation (Fig. 3a). After the break of SASM, the deep convective and cirrus cloud fractions fall below 5 % between 14 and 17 km of altitude (Fig. 3b, c).
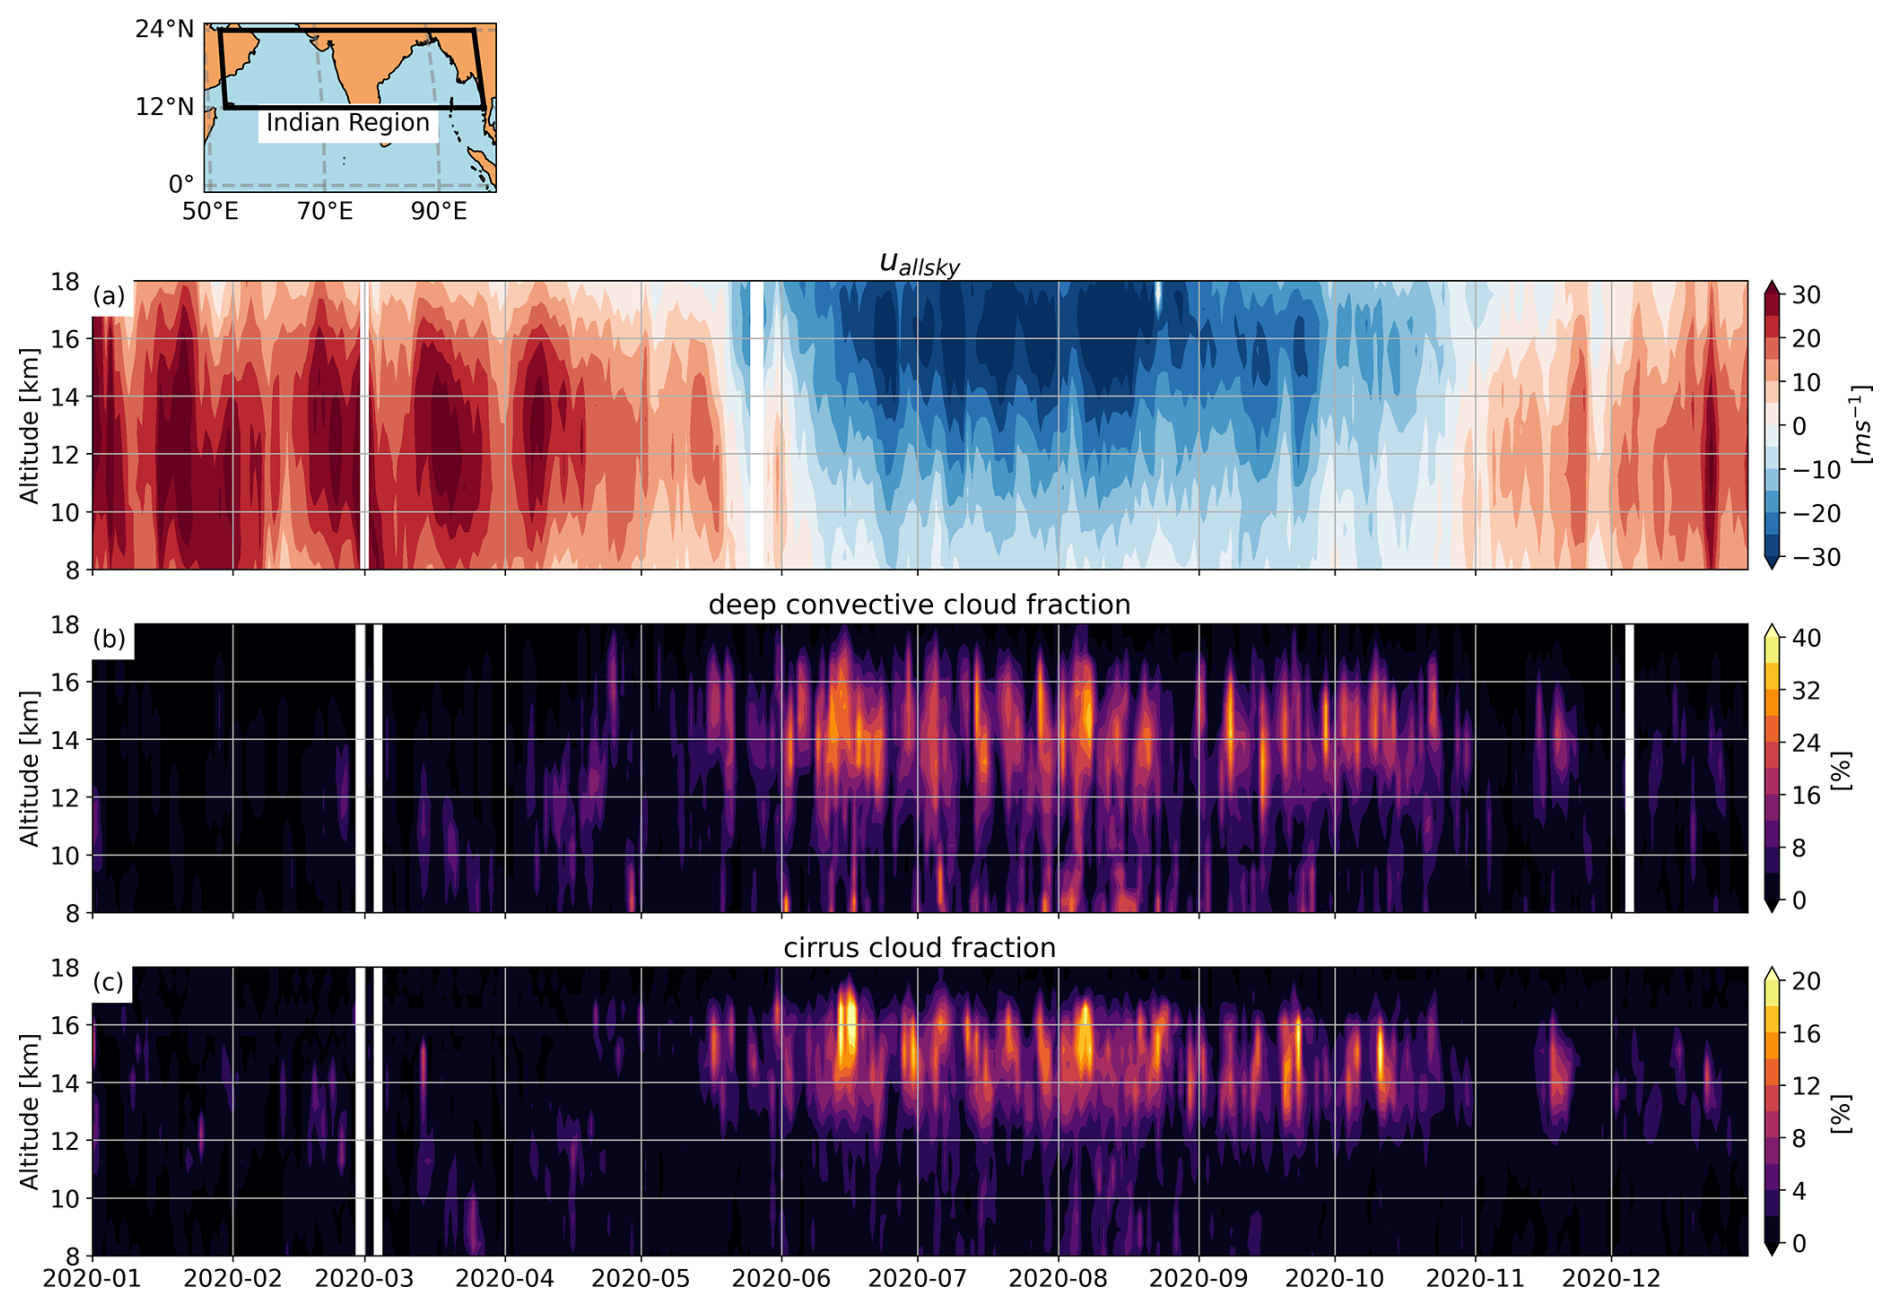
Figure 3(a) Time series of profiles of uallsky observed from Aeolus. One profile corresponds to the daily average (of 06:00 and 18:00 LT orbits) and the domain-average of uallsky over the Indian Region for each day of 2020. Note that negative uallsky values denote a westward wind while positive uallsky values denote an eastward wind. (b) Deep convective cloud fractions and (c) cirrus cloud fraction profiles observed from Aeolus. For readability purposes, colorbar ranges are different for deep convective cloud fraction profiles (0 %–40 %) and cirrus cloud fraction profiles (0 %–20 %).
3.2 Diurnal contrast
Figures 4a and b show the deep convective cloud cover observed during the active phase of SASM (June–October) at 18:00 and 06:00 LT respectively. The deep convective cloud cover is in general larger at 18:00 than at 06:00 LT. At 18:00 LT, the maxima of deep convective cloud cover between 14 and 17 km of altitude are located over the North-East of India (20° N, 80° E) and the South-West of the Bay of Bengal (12° N, 85° E), and reach 30 % (Fig. 4a). At 18:00 LT, the maximum over the North-East of India is expected as continental deep convection peaks in the late afternoon, around 18:00 LT, before decaying during the night (Mapes and Houze, 1993; Noel et al., 2018; Chepfer et al., 2019) to about 15 % at 06:00 LT (Fig. 4b). At the opposite, over the North-East of the Bay of Bengal (15° N, 90° E) that is more under maritime influence, the deep convective cloud cover is slightly below 20 %, at 18:00 LT (Fig. 4a) and increases to 25 %, at 06:00 LT (Fig. 4b). The diurnal contrast of deep convective cloud cover observed with Aeolus during the 2020 SASM over the Bay of Bengal is in good agreement with the one observed with passive imagery (Zuidema, 2003; Feofilov and Stubenrauch, 2019), in spite of the large inter-annual variations of the cloud patterns and precipitation over the Indian region (Krishnamurthy and Shukla, 2000) and the specificity of the 2020 SASM (Kripalani et al., 2022). Over the Arabian Sea, we observe a diurnal contrast of the deep convective cloud cover, which is about 5 % larger at 18:00 than at 06:00 LT (Fig. 4c), consistent with Chepfer et al. (2019). However, this diurnal contrast is weak compared to the one observed over the Indian continent.
The cirrus cloud cover also exhibits a diurnal contrast between 18:00 and 06:00 LT (Fig. 4f), although not as pronounced as that of deep convective clouds. At 18:00 LT, the cirrus cloud cover reaches values of above 20 % over continental India (Fig. 4d) and similar values above the entire Bay of Bengal. At 06:00 LT, the cirrus cloud cover remains at about 20 % over continental India (Fig. 4e), consistent with Ali et al. (2022). One of the main reasons why the cirrus cloud cover diurnal contrast is much weaker than that of deep convective clouds is the longer persistence of cirrus clouds, as a part of the deep convective clouds at 18:00 LT are converted to cirrus clouds during the night (Feofilov and Stubenrauch, 2019). Over the Arabian Sea, characterized by a weaker deep convection at 18:00 LT, the cirrus cloud cover is only 2 % to 4 % larger at 18:00 than at 06:00 LT. The ratio between cirrus and deep convective cloud covers both measured over the Arabian Sea appears larger at 06:00 than at 18:00 LT, especially westward 65° E (Fig. 4i). We also observe that the zonal gradient of the cirrus cloud cover over the Arabian Sea at 18:00 LT is less pronounced than the zonal gradient of deep convective cloud cover at 18:00 LT (the cirrus cloud cover increases from 7 % to 20 % between 50 and 80° E, while the deep convective cloud cover increases from 5 % to 30 % between the same longitudes, Fig. 4i). This result is consistent with those of Sassen et al. (2009), who showed that the cirrus cloud cover has a larger spatial extent than the convective cloud cover, likely due to the spreading of anvil outflow effect. Finally from 06:00 to 18:00 LT, we observe a westward shift in both deep convective cloud cover and cirrus clover, which might be due to the TEJ.
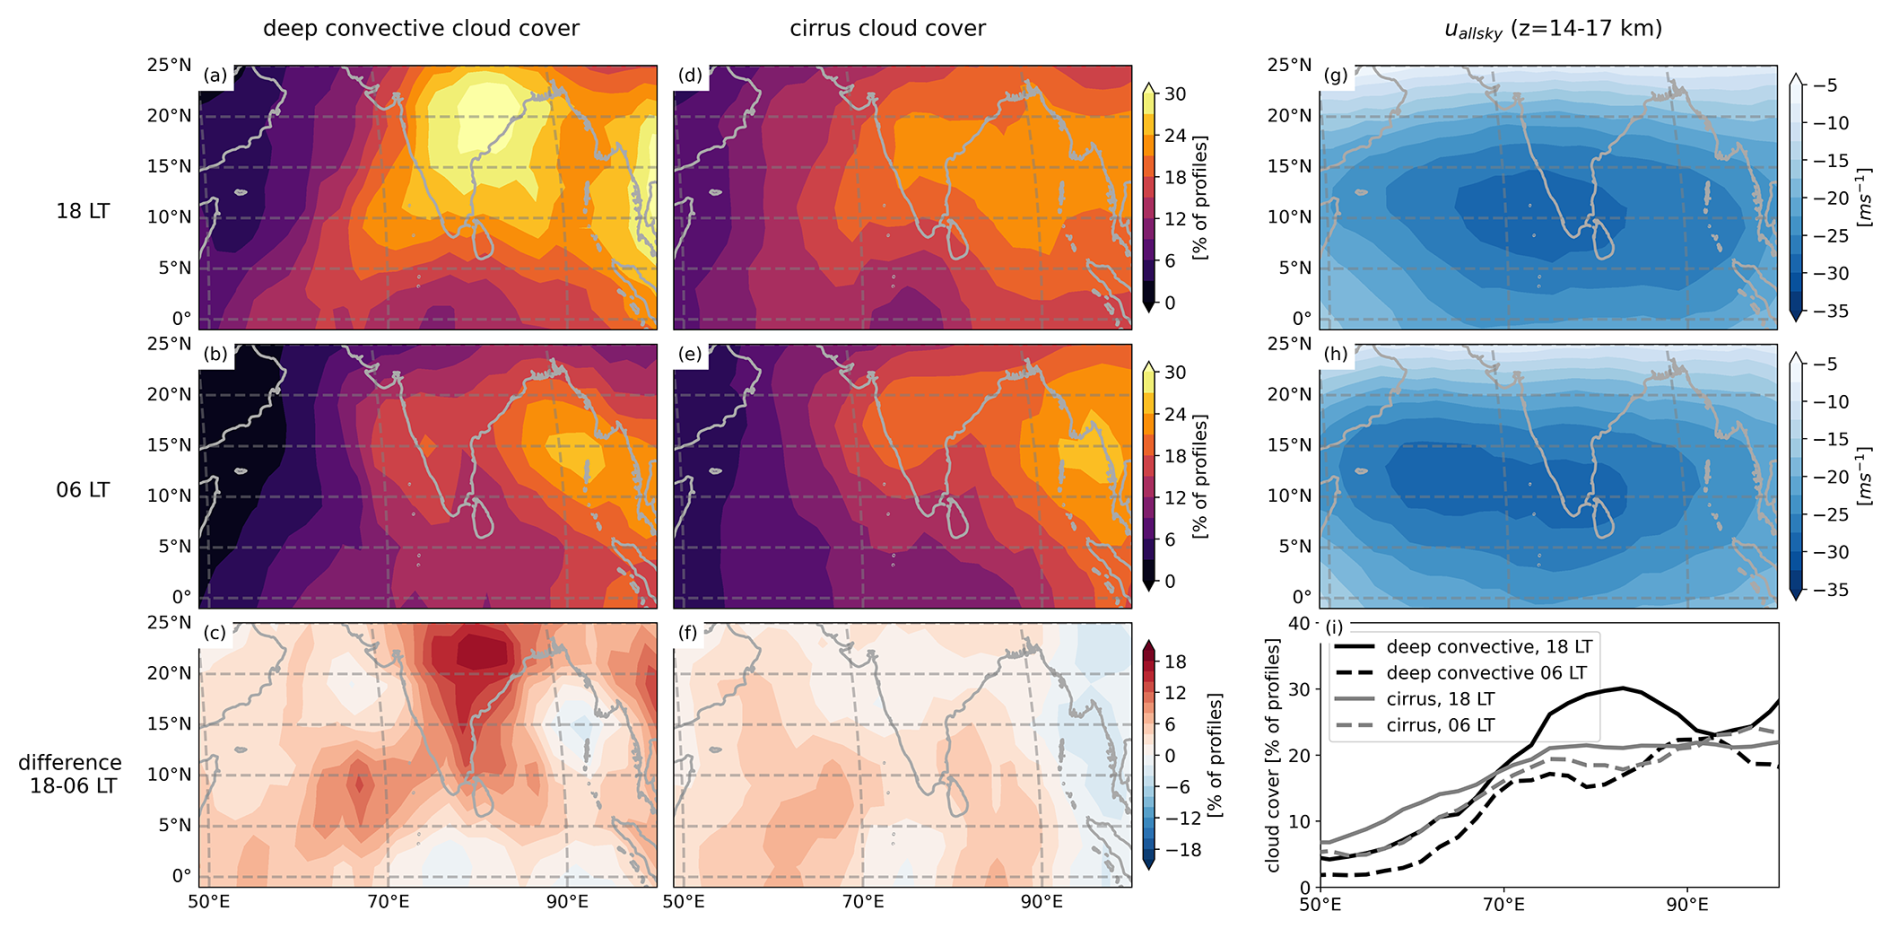
Figure 4Map of the mean deep convective cloud cover between 14–17 km, from June to October 2020 at (a) 18:00 LT and (b) 06:00 LT (c) is the difference of (a)–(b). Map of the mean cirrus cloud cover between 14–17 km, from June to October 2020 at (d) 18:00 LT and (e) 06:00 LT. (f) is the difference of (d)–(e). Map of uallsky averaged between 14–17 km, from June to October 2020 at 18:00 LT (g) and 06:00 LT (h). (i) is the average over latitudes 12–24° N (which encapsulate the Arabian Sea, India, and the Bay of Bengal) of deep convective and cirrus cloud covers as a function of longitudes at 06:00 and at 18:00 LT.
4.1 Hypothesis
The goal of this section is to examine if and how the convective patterns and locations influence the temporal variation of the mean TEJ speed (uallsky around 15 km of altitude) over the Arabian Sea during the SASM. In contrast to the studies of Ye et al. (2023) and Liu et al. (2024), our study does not focus on the specific location of the TEJ core and its interannual variability, but instead on TEJ speed variation at a much shorter time scale (typically a few days).
To do so, we proceed in three steps. We first verify that at first order, the TEJ is in thermal wind balance during the SASM of 2020 (Sect. 4.2). Then, we make the hypothesis (noted H1) that short time scale fluctuations of the TEJ speed around the wind expected from thermal wind balance can be explained by the effects of deep convection patterns that act as perturbators and we test this hypothesis against observations (Sect. 4.3). Finally, we quantify the wind speed perturbations created by deep convection patterns and propose an explanation of the mechanism in play over the Indian region (Sect. 4.4).
All along this section we make use of the two following variables estimated over the Arabian Sea at 06:00 LT: the projection of the thermal wind vector along Aeolus LOS, noted (see Sect. 2.3) and the wind difference observed by Aeolus at the same altitudes as the thermal wind, noted . We consider that the fluctuations of Δuallsky around Δuthermal, ERA5 are mostly due to uallsky(z = 15 km) rather than uallsky(z = 7 km). Indeed, we consider that , and that the wind divergence and vorticity associated with deep convection (ageostrophic wind) are strongest at the top of convective towers (Diongue et al., 2002). As a consequence, differences between Δuallsky and Δuthermal, ERA5 are due to the fluctuations of uallsky(z = 15 km) (i.e. the TEJ) around the geostrophic wind at the same altitude.
4.2 Thermal wind balance
During the SASM of 2020, the median value of the difference is equal to −2.1 m s−1. This confirms that Δuallsky can be interpreted at the first order by the thermal wind set by the North-South temperature gradient, or, in other words, that the TEJ is in thermal wind balance (). We define , the thermal wind corrected by the median of the difference :
Figure 5 shows the time series of Δuallsky and over the Arabian Sea at 06:00 LT between 1 June and 31 October 2020. As the SASM onsets in late May, both and Δuallsky decrease at the same rate to reach values of about −35 m s−1 in early August, coinciding with the date of the maximum intensity of the TEJ over the Arabian Sea, before increasing again at similar rates.

Figure 5(a) Time series of Δuallsky (dashed black line) and (solid black line) over the Arabian Sea at 06:00 LT. Red shading means that and blue shading means that . The gray shading denotes days without Aeolus observations.
4.3 Deep convection patterns
From June to October 2020, there are exactly 68 d where , 69 d where , and 16 d without Aeolus observations (Fig. 5). We define uconv as the difference:
As , uconv can be seen as the convective perturbation of uallsky(z = 15 km).
To test hypothesis H1, we consider two ensembles of days in Fig. 6. The days where at 06:00 LT over the Arabian Sea are referred as “strengthened” wind days with respect to the thermal wind, and shaded in blue in Fig. 6. Oppositely, the days where at 06:00 LT over the Arabian Sea are referred as “weakened” wind days with respect to the thermal wind, and shaded in red in Fig. 6. The fluctuations of Δuallsky around usually have a short time scale (of 1 d) but they can be as long as two weeks (in mid August 2020 for example). For each of these ensembles, we build the composite maps of deep convective cloud cover (between 14 and 17 km) observed at 18:00 LT the day before the winds are observed.
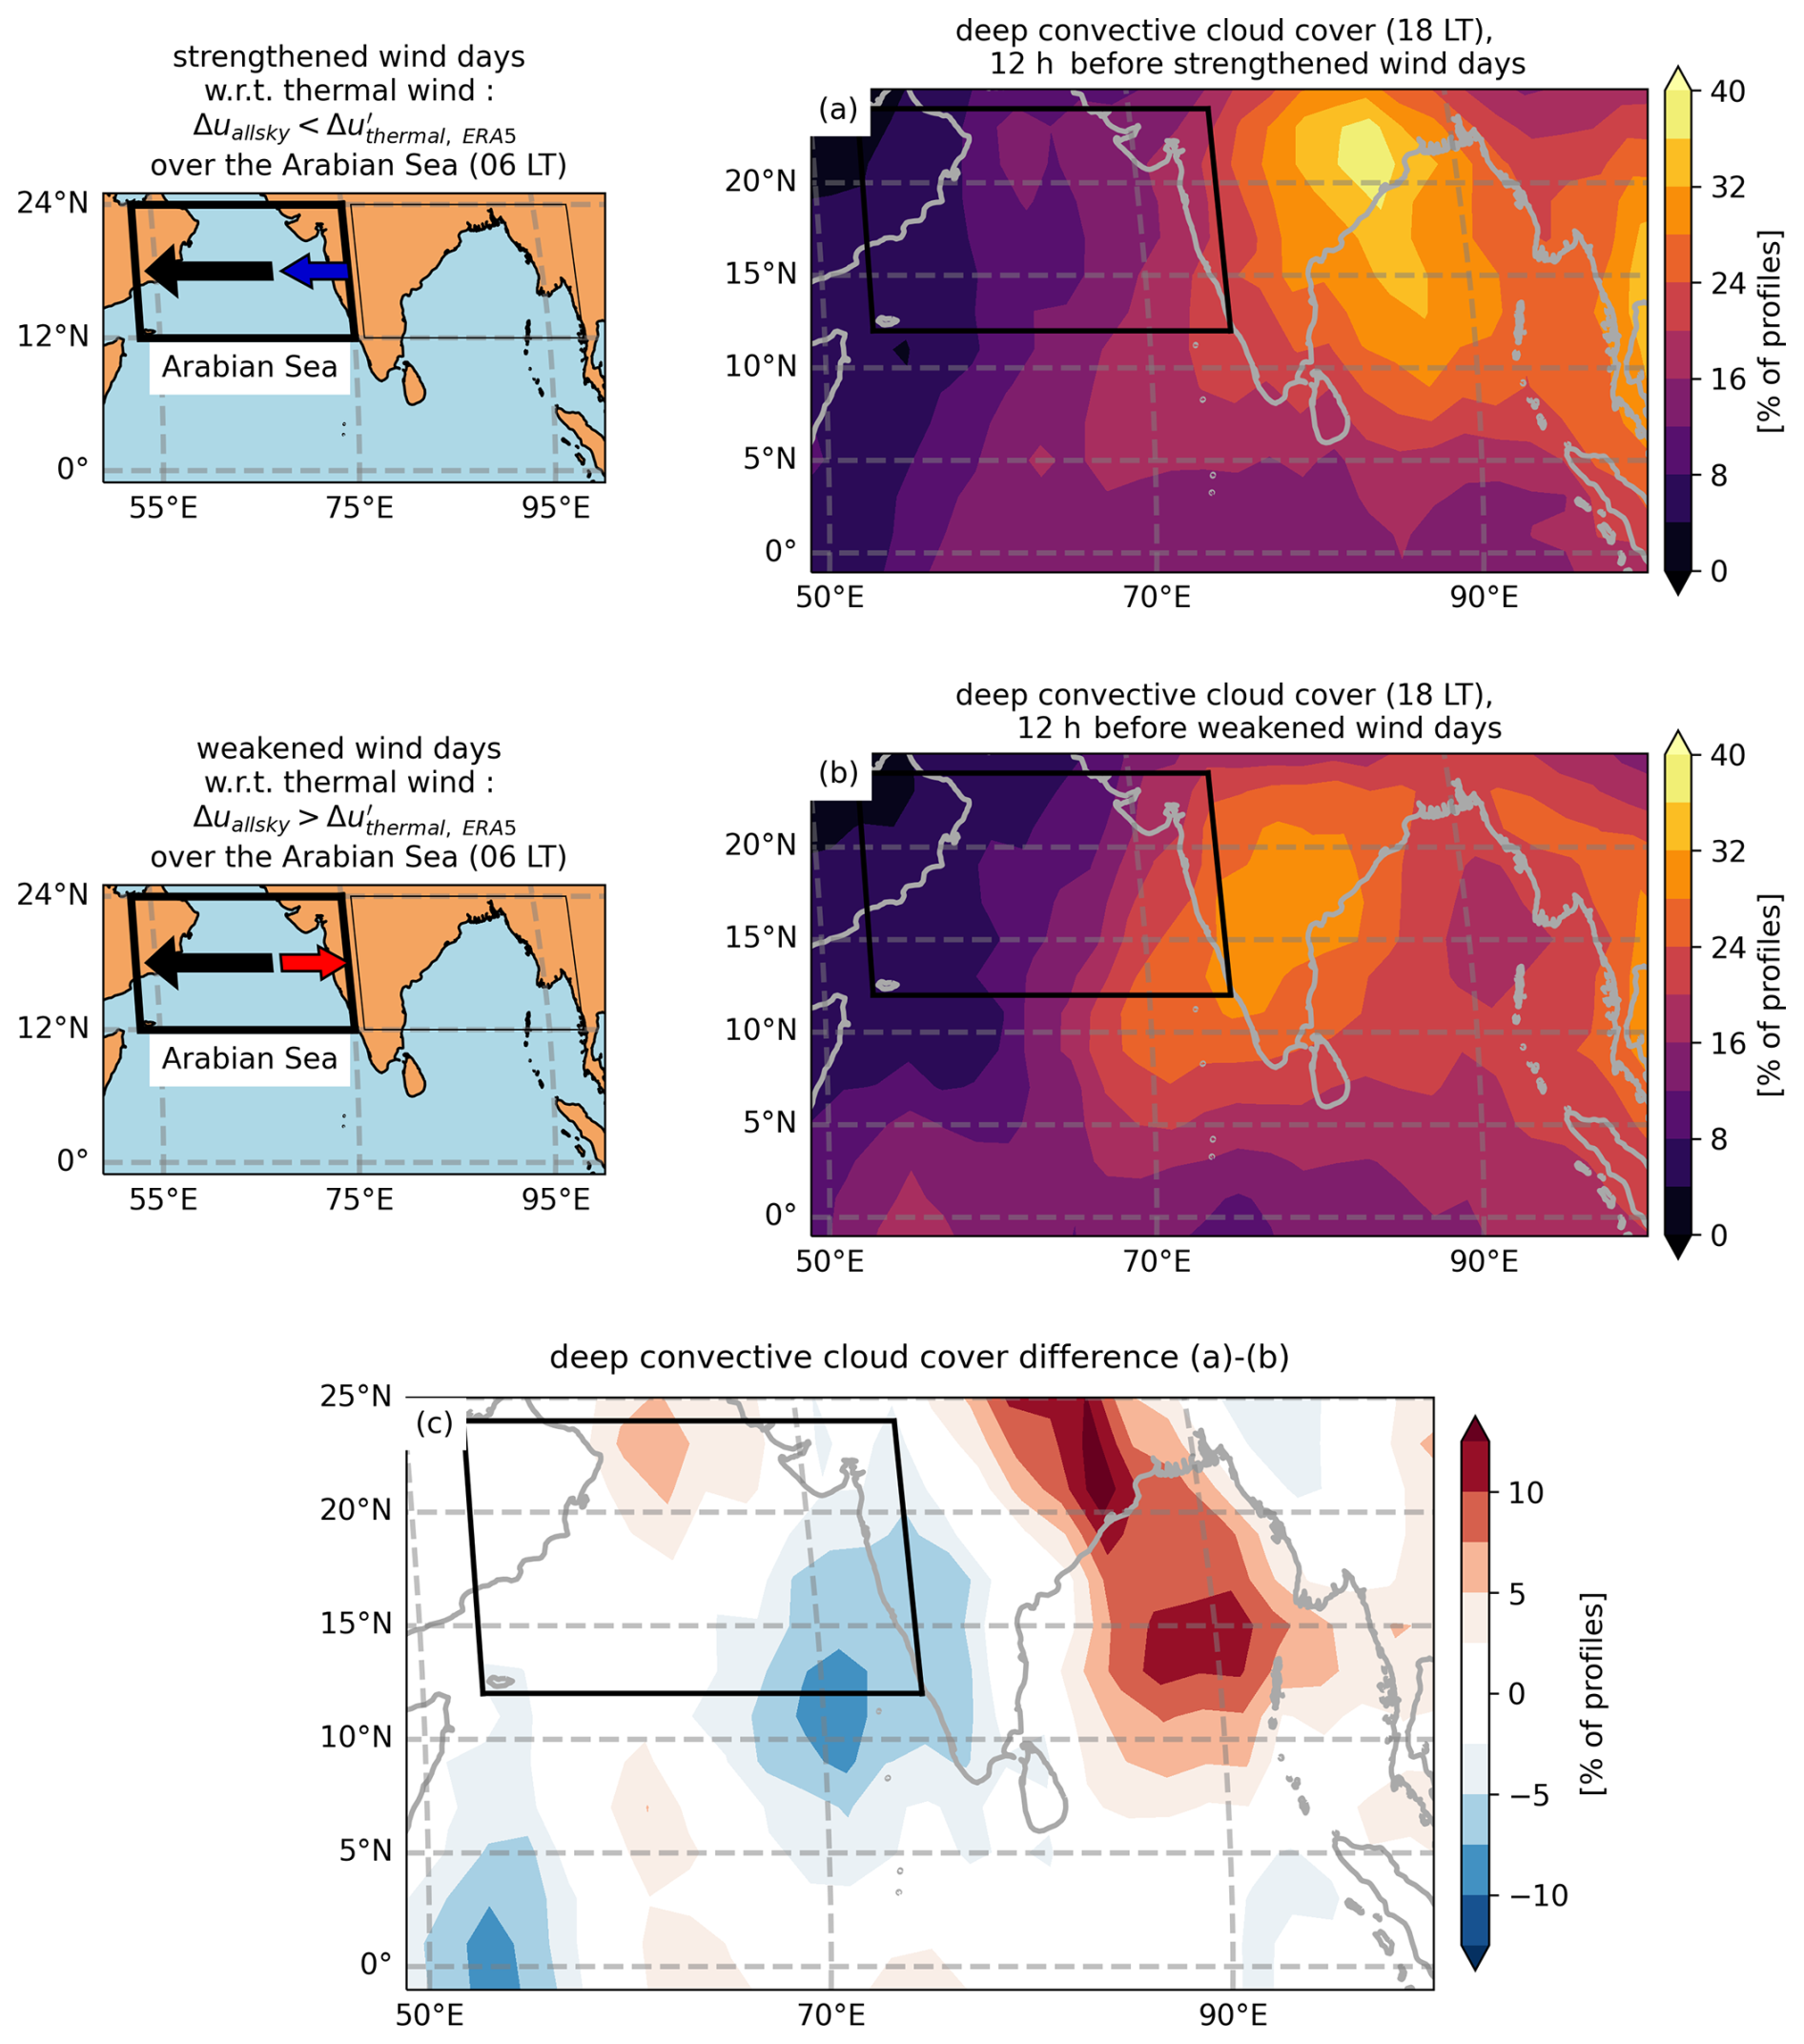
Figure 6(a) Composite maps of the deep convective cloud cover between 14 and 17 km of altitude at 18:00 LT the day before strengthened wind days ( over the Arabian Sea at 06:00 LT). (b) same but for weakened wind days ( over the Arabian Sea at 06:00 LT). The black arrow represents the thermal wind background, blue and red arrows respectively represent the westward and eastward Δuallsky perturbation over the Arabian Sea. (c) is the difference of (a)–(b). The insets on the left of the figure denote the situation where the thermal wind (black arrow) is strengthened (blue arrow) or weakened (red arrow).
12 h before the strengthened wind days, we observe a maximum of deep convective cloud cover over the North-East of India (of about 40 %) and another maximum over the Bay of Bengal (of 29 %) (Fig. 6a). Over the South-East of the Arabian Sea, the deep convective cloud cover is about 20 % and on average 11 % over the entire Arabian Sea. In contrast, 12 h before the weakened wind days, the maximum of deep convective cloud cover is found over the centre and the West of India, while the deep convective cloud cover only reaches 23 % over the Bay of Bengal, about 30 % over the South-East of the Arabian Sea and 14 % on average over the entire Arabian Sea (Fig. 6b). We thus observe that the deep convective cloud cover at 18:00 LT over the Bay of Bengal is in phase opposition with that over the South-East of the Arabian Sea. The amplitude of the changes in the deep convective cloud cover between strengthened and weakened wind days is about 3 % over the Arabian Sea and 6 % over the Bay of Bengal (Fig. 6c). Liu et al. (2024) revealed the existence of a similar deep convection dipole at the same location, which exhibits a large interannual variability in July.
The deep convection dipole depicted in Fig. 6c is thus partly responsible for fluctuations of the wind downstream, particularly over the eastern part of the Arabian Sea. This is understandable having in mind that Deep Convective Systems (DCS) are associated at their top with a divergent outflow and a negative vorticity, which induce an eastward wind perturbation in the North-East and a westward wind perturbation in the South-West (Diongue et al., 2002). Lemburg et al. (2019) described a similar phenomenon occurring over the Sahel region, which induces a westward (negative) perturbation of the TEJ of about −1.5 m s−1 at the South-West of the DCS at around 200 hPa, and an eastward (positive) perturbation of the TEJ of about 1 m s−1 at the North-East of the DCS at the same pressure level. Lemburg et al. (2019) further showed that the wind perturbation lasted up to 2 d after DCS development.
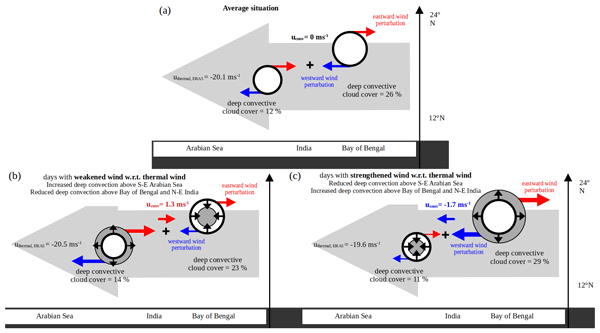
During strengthened wind days, 12 h after the deep convective cloud cover is maximum over the Bay of Bengal and North-East India, its divergent convective outflow, deflected in a clockwise motion by the Coriolis force, strengthens the westward wind at the South-West of the Bay of Bengal (Fig. 7c). This strengthening of the wind (a westward, thus negative wind perturbation uconv) is favoured by the weakening of the divergent convective outflow over the South-East Arabian Sea. Inversely, 12 h after the deep convective cloud cover is maximum over the South-East Arabian Sea, the divergent outflow at the North-East of this convection maximum induces an eastward, thus positive uconv perturbation over India, that is less counteracted by the weaker diverging outflow over the Bay of Bengal and North-East India (Fig. 7b).
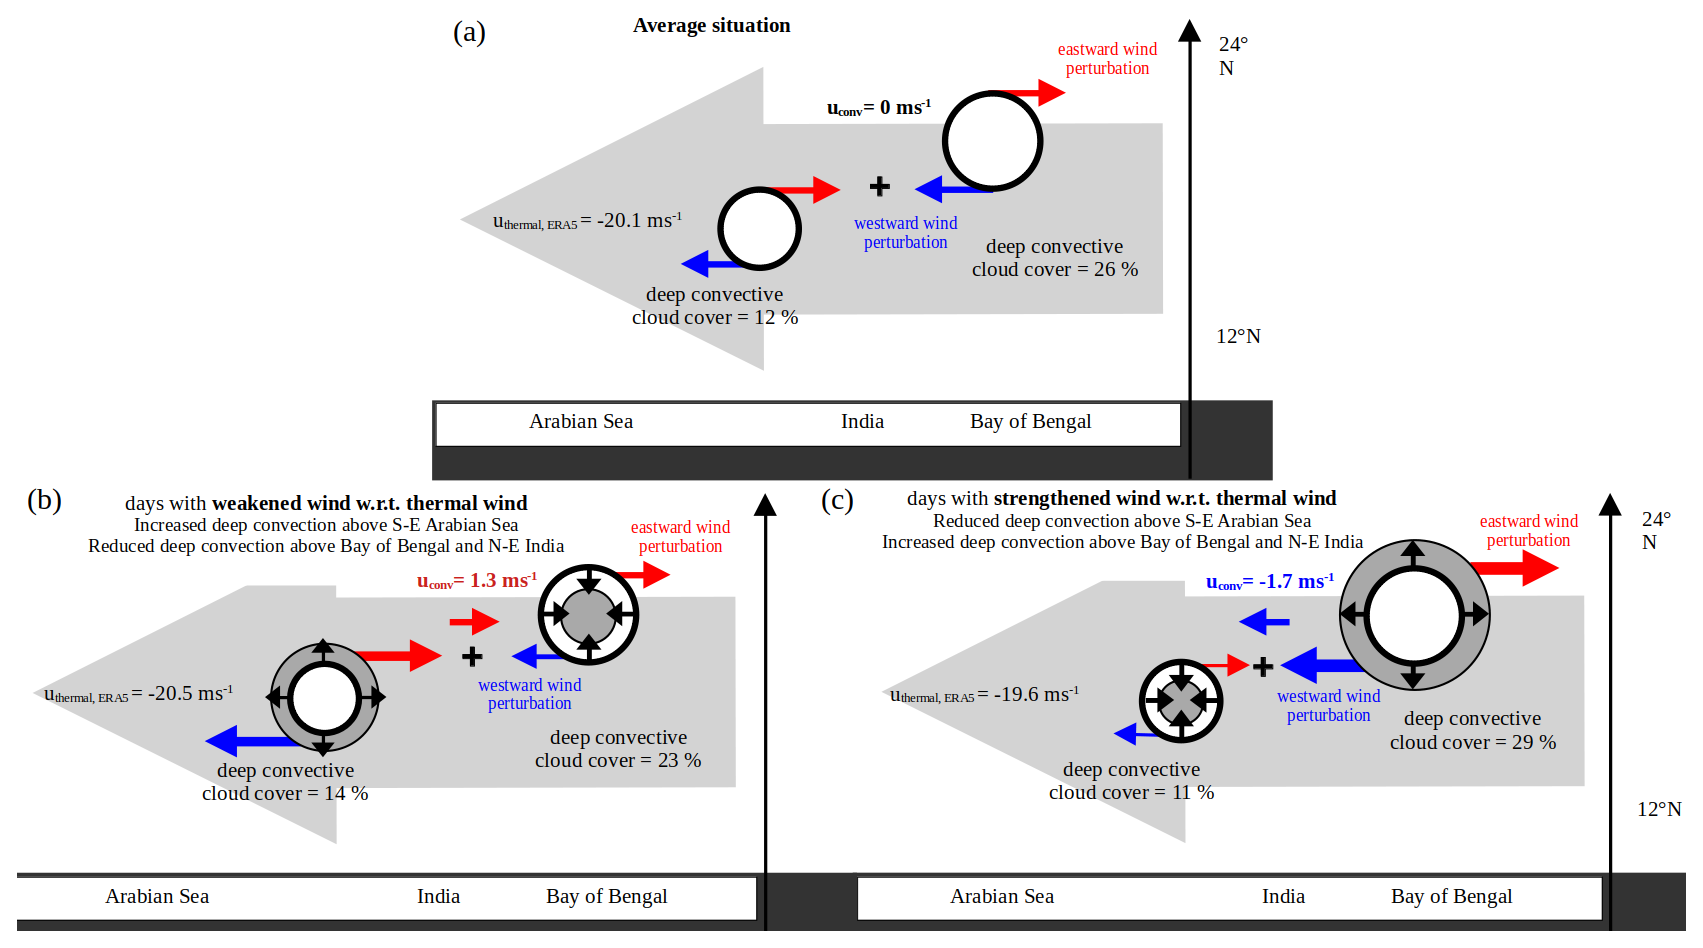
Figure 7Schematic of the proposed mechanisms inducing a wind anomaly over the Arabian Sea at 06:00 LT. (a) describes the average situation. (b) describes the high cloud cover and wind values on days where over the Arabian Sea (weakened winds), and (c), the high cloud cover and wind values on days where over the Arabian Sea (strengthened winds). Thick black circles with a white shading represent the average high cloud covers of the dipole. Thin black circles with a dark gray shading represent the actual high cloud cover, to compare with the average value. Large gray arrows represent the mean wind induced by the temperature gradient and the 0.9 m s−1 mean difference between weakened and strengthened wind days is not significant with a 90 % confidence level.
4.4 Quantification of the wind perturbations created by deep convective patterns
We consider the variable Δyu which quantifies the difference of the derivative between strengthened and weakened wind days:
We estimate Δyu between the points AN and AS, respectively located in the North and South of the deep convective cloud pattern over the Arabian Sea (Fig. 8c) following Eq. (9):
where y(AN) − y(AS) is the distance between the points AN and AS. Similarly, we estimate Δyu(BN) − y(BS) between the points BN and BS, respectively located in the North and South of the deep convective cloud pattern over the Bay of Bengal (Fig. 8c). At 06:00 LT, we find a negative Δyu around the deep convective cloud pattern over the South-East of the Arabian Sea ( s−1), and a positive Δyu around the deep convective cloud pattern over the Bay of Bengal ( s−1). Although Δyu does not measure a vorticity difference between strengthened and weakened wind days (that would be impossible to estimate from Aeolus data as they do not contain any information on the meridional wind), these values are consistent with the existence of an anticyclonic circulation around deep convective patterns.
As the wind perturbations created by deep convection propagate during the night with the mean flow (Lemburg et al., 2019), we observe that on average over the whole Arabian Sea, uconv reaches −1.7 m s−1 during strengthened wind days at 06:00 LT. On the other hand, over weakened wind days, uconv is equal to 1.3 m s−1 over the Arabian Sea at 06:00 LT, so the total amplitude variation of the wind induced by the deep convective activity is about −3 m s−1 on average over the Arabian Sea (statistically significant at a 90 % confidence level), and reaches up to −5 m s−1 in its center (Fig. 8c). Note that when the deep convective cloud cover is maximum over the Bay of Bengal and North-East India, there is also a positive wind perturbation of up to 3 m s−1, at 25° N, which is favored by the larger Coriolis parameter at this latitude (Fig. 8c).
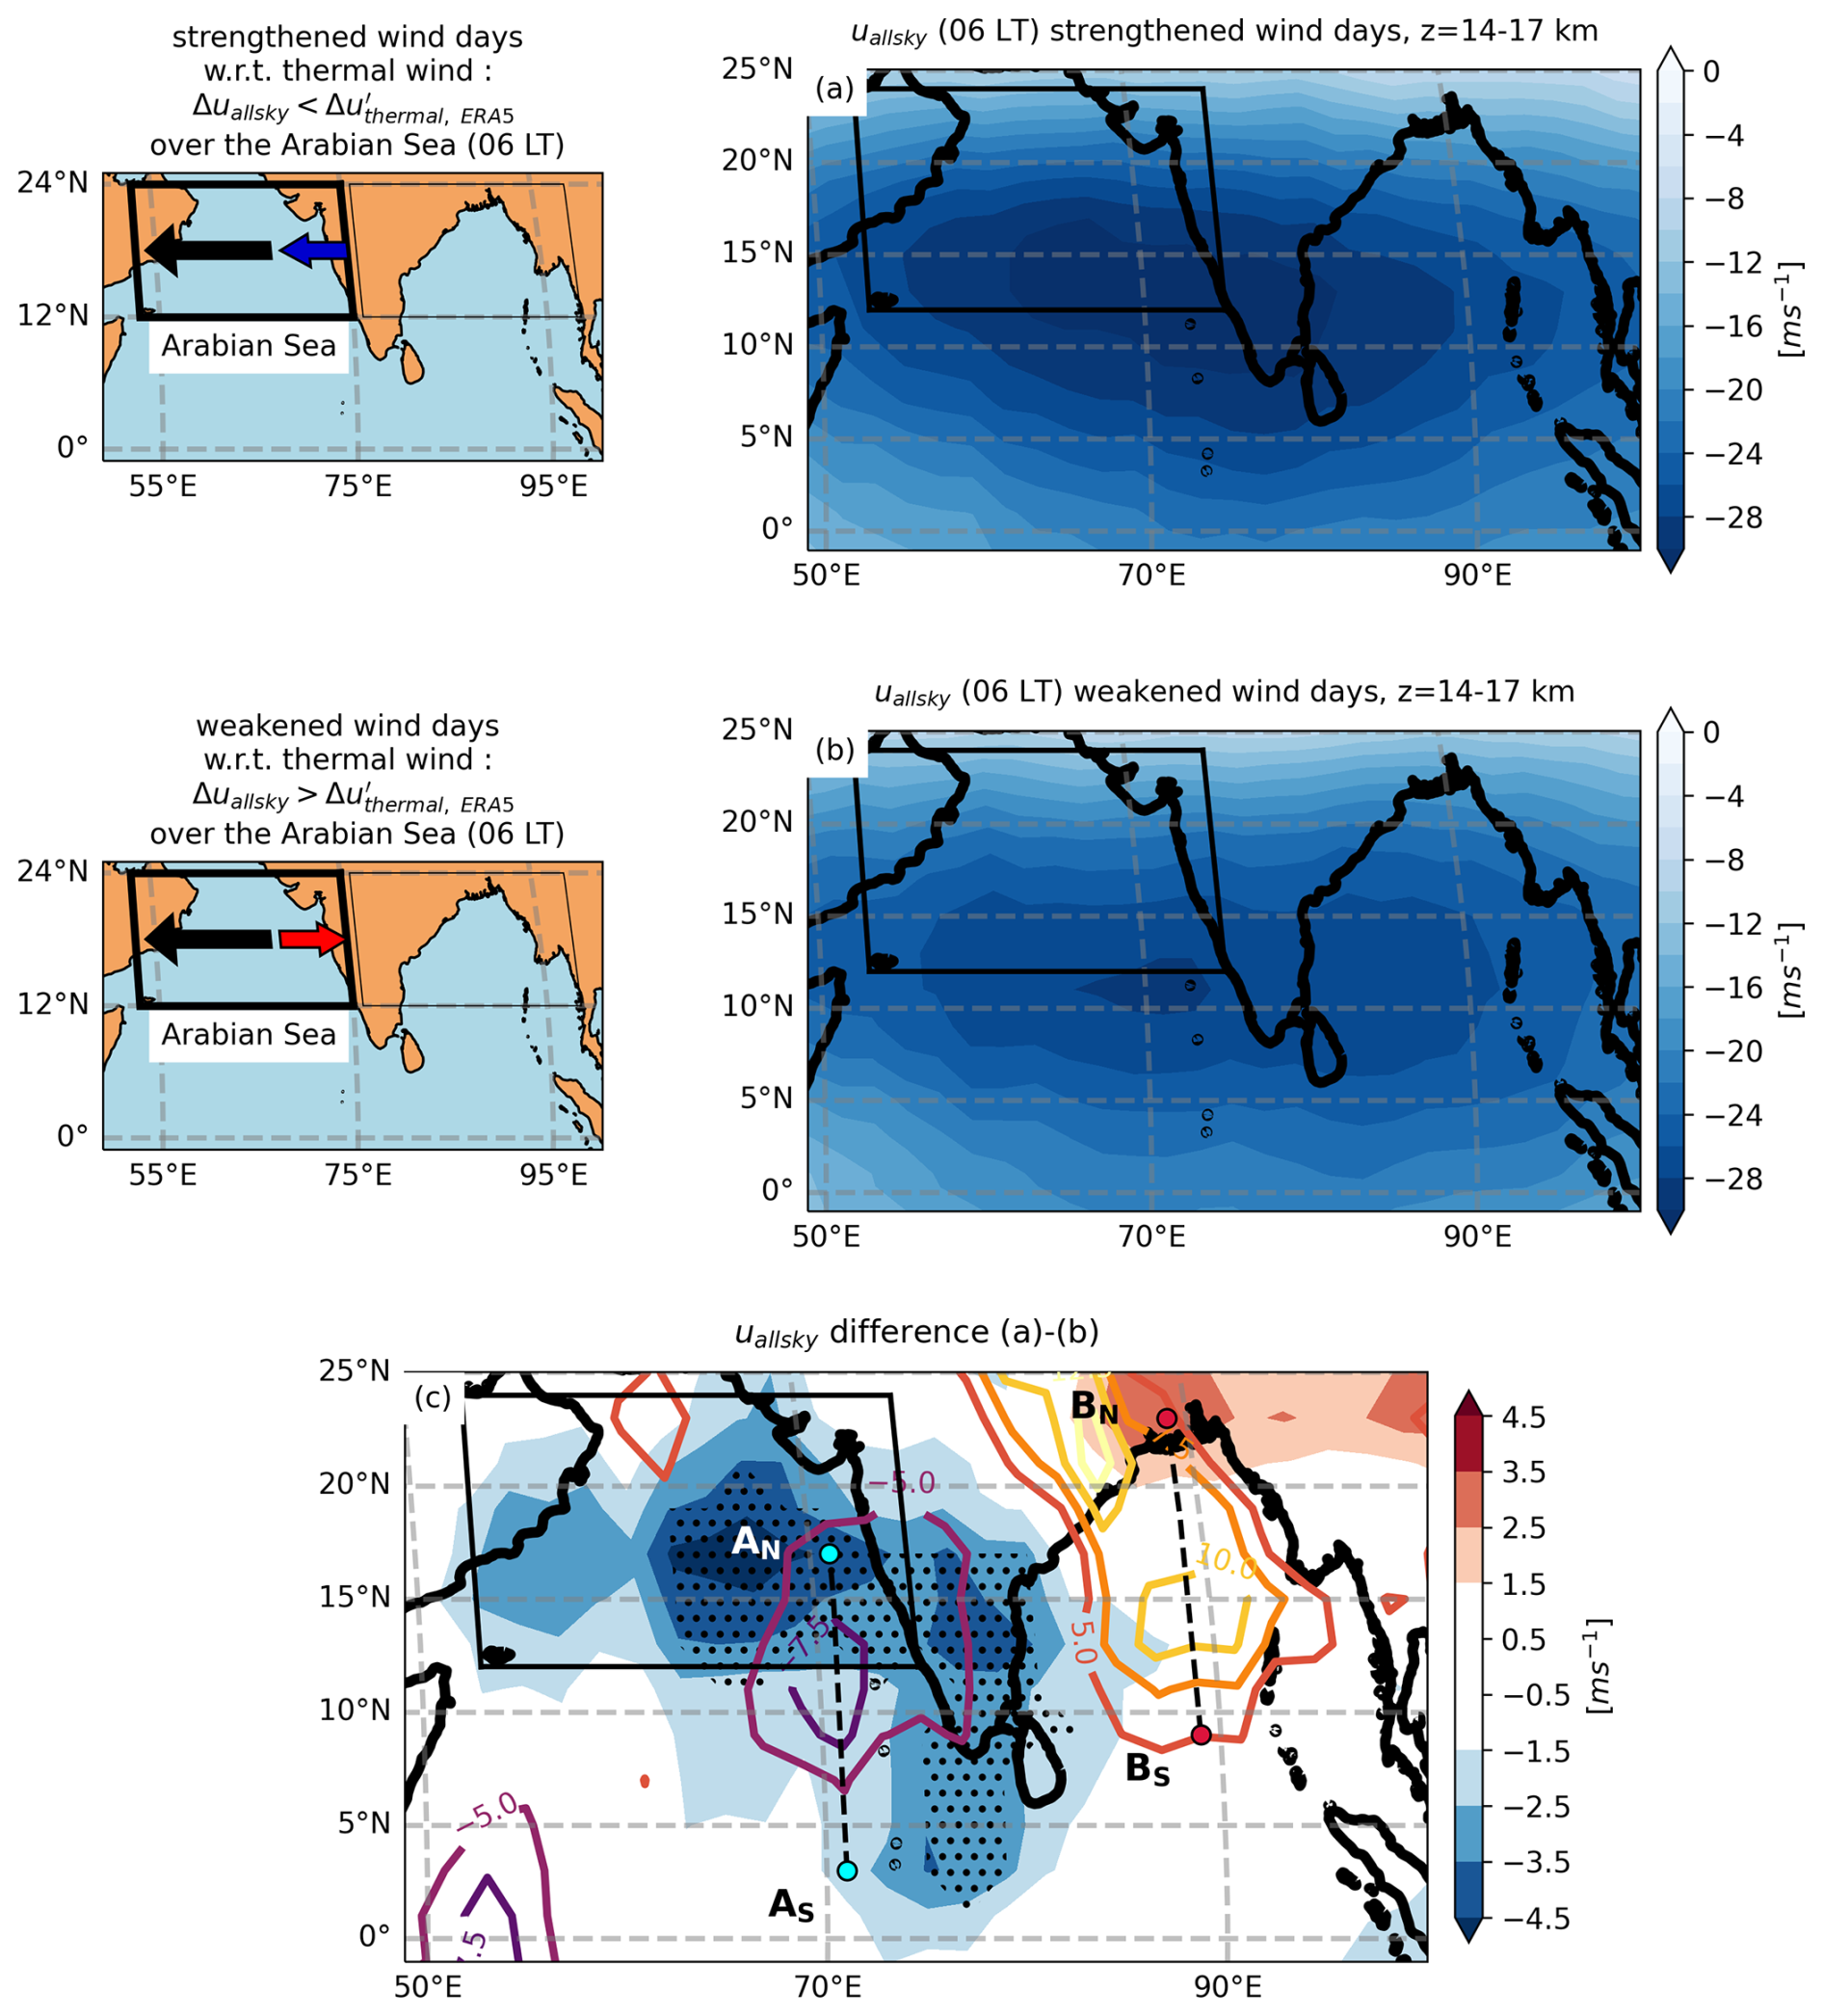
Figure 8Same as Fig. 6, but for uallsky averaged between 14 and 17 km of altitude at 06:00 LT instead of the deep convective cloud cover at 18:00 LT. (c) The black dots denote that the mean uallsky(AS, 06:00 LT) differences between strengthened and weakened wind days are significant with a 90 % confidence level. The contours represent the difference in deep convective cloud cover at 18:00 LT between strengthened and weakened wind days as depicted in Fig. 6c.
The TEJ variations described above, that we mainly attributed to variations in the meridional temperature contrast, and to a lesser extent to variations in the convective patterns, may in turn have consequences on the cloud cover. In this section we investigate the role of the wind in the cirrus cover, and we attempt to disentangle it from the roles of convective and temperature variations.
5.1 Hypotheses
Observational results of Sect. 3 suggest that deep convection is strongest over the Bay of Bengal and the Indian continent at 18:00 LT (Fig. 4a), providing a source of water in the upper troposphere. This water (vapour or ice crystals) may be advected westwards during 12 h by the TEJ, which shows the strongest winds over the Arabian Sea at 06:00 LT (Fig. 4h). As cirrus clouds found over the Arabian Sea are not always correlated with deep convective clouds found at the same place and at the same time (for example, cirrus clouds extend more towards the Western Arabian Sea than deep convective clouds observed at the same local time, see Fig. 4i), we can thus propose the following mechanism: the water injected over the Bay of Bengal and the Indian continent at 18:00 LT and advected by the TEJ during the night through cold temperatures is at the origin of the cirrus clouds found at 06:00 LT over the Arabian Sea (Fig. 4e). We attempt to establish this mechanism by testing the sensitivity of the cirrus cover over the Arabian Sea at 06:00 LT to: the wind (hypothesis H2, Sect. 5.2), the temperature (hypothesis H3, Sect. 5.3), the deep convective clouds above India and the Bay of Bengal at 18:00 LT (hypothesis H4, Sect. 5.4.). In Sect. 5.5, we draw a conclusion from our results and we study their implications in a warmer climate.
5.2 Wind
Figure 9 shows the time series of uallsky averaged between 14 and 17 km of altitude over the Arabian Sea (AS) at 06:00 LT, noted . The bar denotes an average over all altitudes between 14 and 17 km. The median value of is −23.6 m s−1 between June and October. On the days where is faster than its median value, noted “fast” wind days, the average wind speed is −29.9 ± 4.1 m s−1. In contrast, on the days where is slower than its median value, noted “slow” wind days, the average wind speed is −13.8 ± 7.7 m s−1. Fast wind days correspond to the period of the TEJ peak, as they almost all occur between mid-June and the end of August.

Figure 9Time series of (solid black line), uallsky is averaged each day at 06:00 LT over the Arabian Sea and averaged between 14 and 17 km of altitude. The dashed black line represents the median value of from June to October 2020, −23.6 m s−1. The light gray shading masks days which are not included in the SASM time interval while the dark gray shading denotes days without Aeolus observations.
We select days where is faster (or slower) than its median value, and build the composite maps of the cirrus cloud cover observed at the same time (Fig. 10). During fast wind days at 06:00 LT, the cirrus cloud cover reaches 25 % near the West coast of India (18° N, 70° E, Fig. 10a) and 14 % on average over the Arabian Sea. On the other hand, on slow wind days, the cirrus cloud cover is within the range of 2 %–15 %, and on average 6 % over the Arabian Sea at 06:00 LT (Fig. 10b). The cirrus cloud cover differences between fast and slow wind days (Fig. 10c) are the largest over the Arabian Sea in the North of 20° N, where they reach 12 %. The dependence of cirrus cloud cover on the wind speed, detailed by Das et al. (2011), is thus also observed in our study. We note that when spatially averaged over the Arabian Sea, the cirrus cloud cover increases by 8 % when the wind speed over the Arabian Sea doubles (from −13.8 to −29.9 m s−1). In comparison, Das et al. (2011) reported a relative increase in the cirrus cloud cover of about 20 % at 150 hPa close to the core of the TEJ when the wind speed doubles, and no increase at 70 hPa.
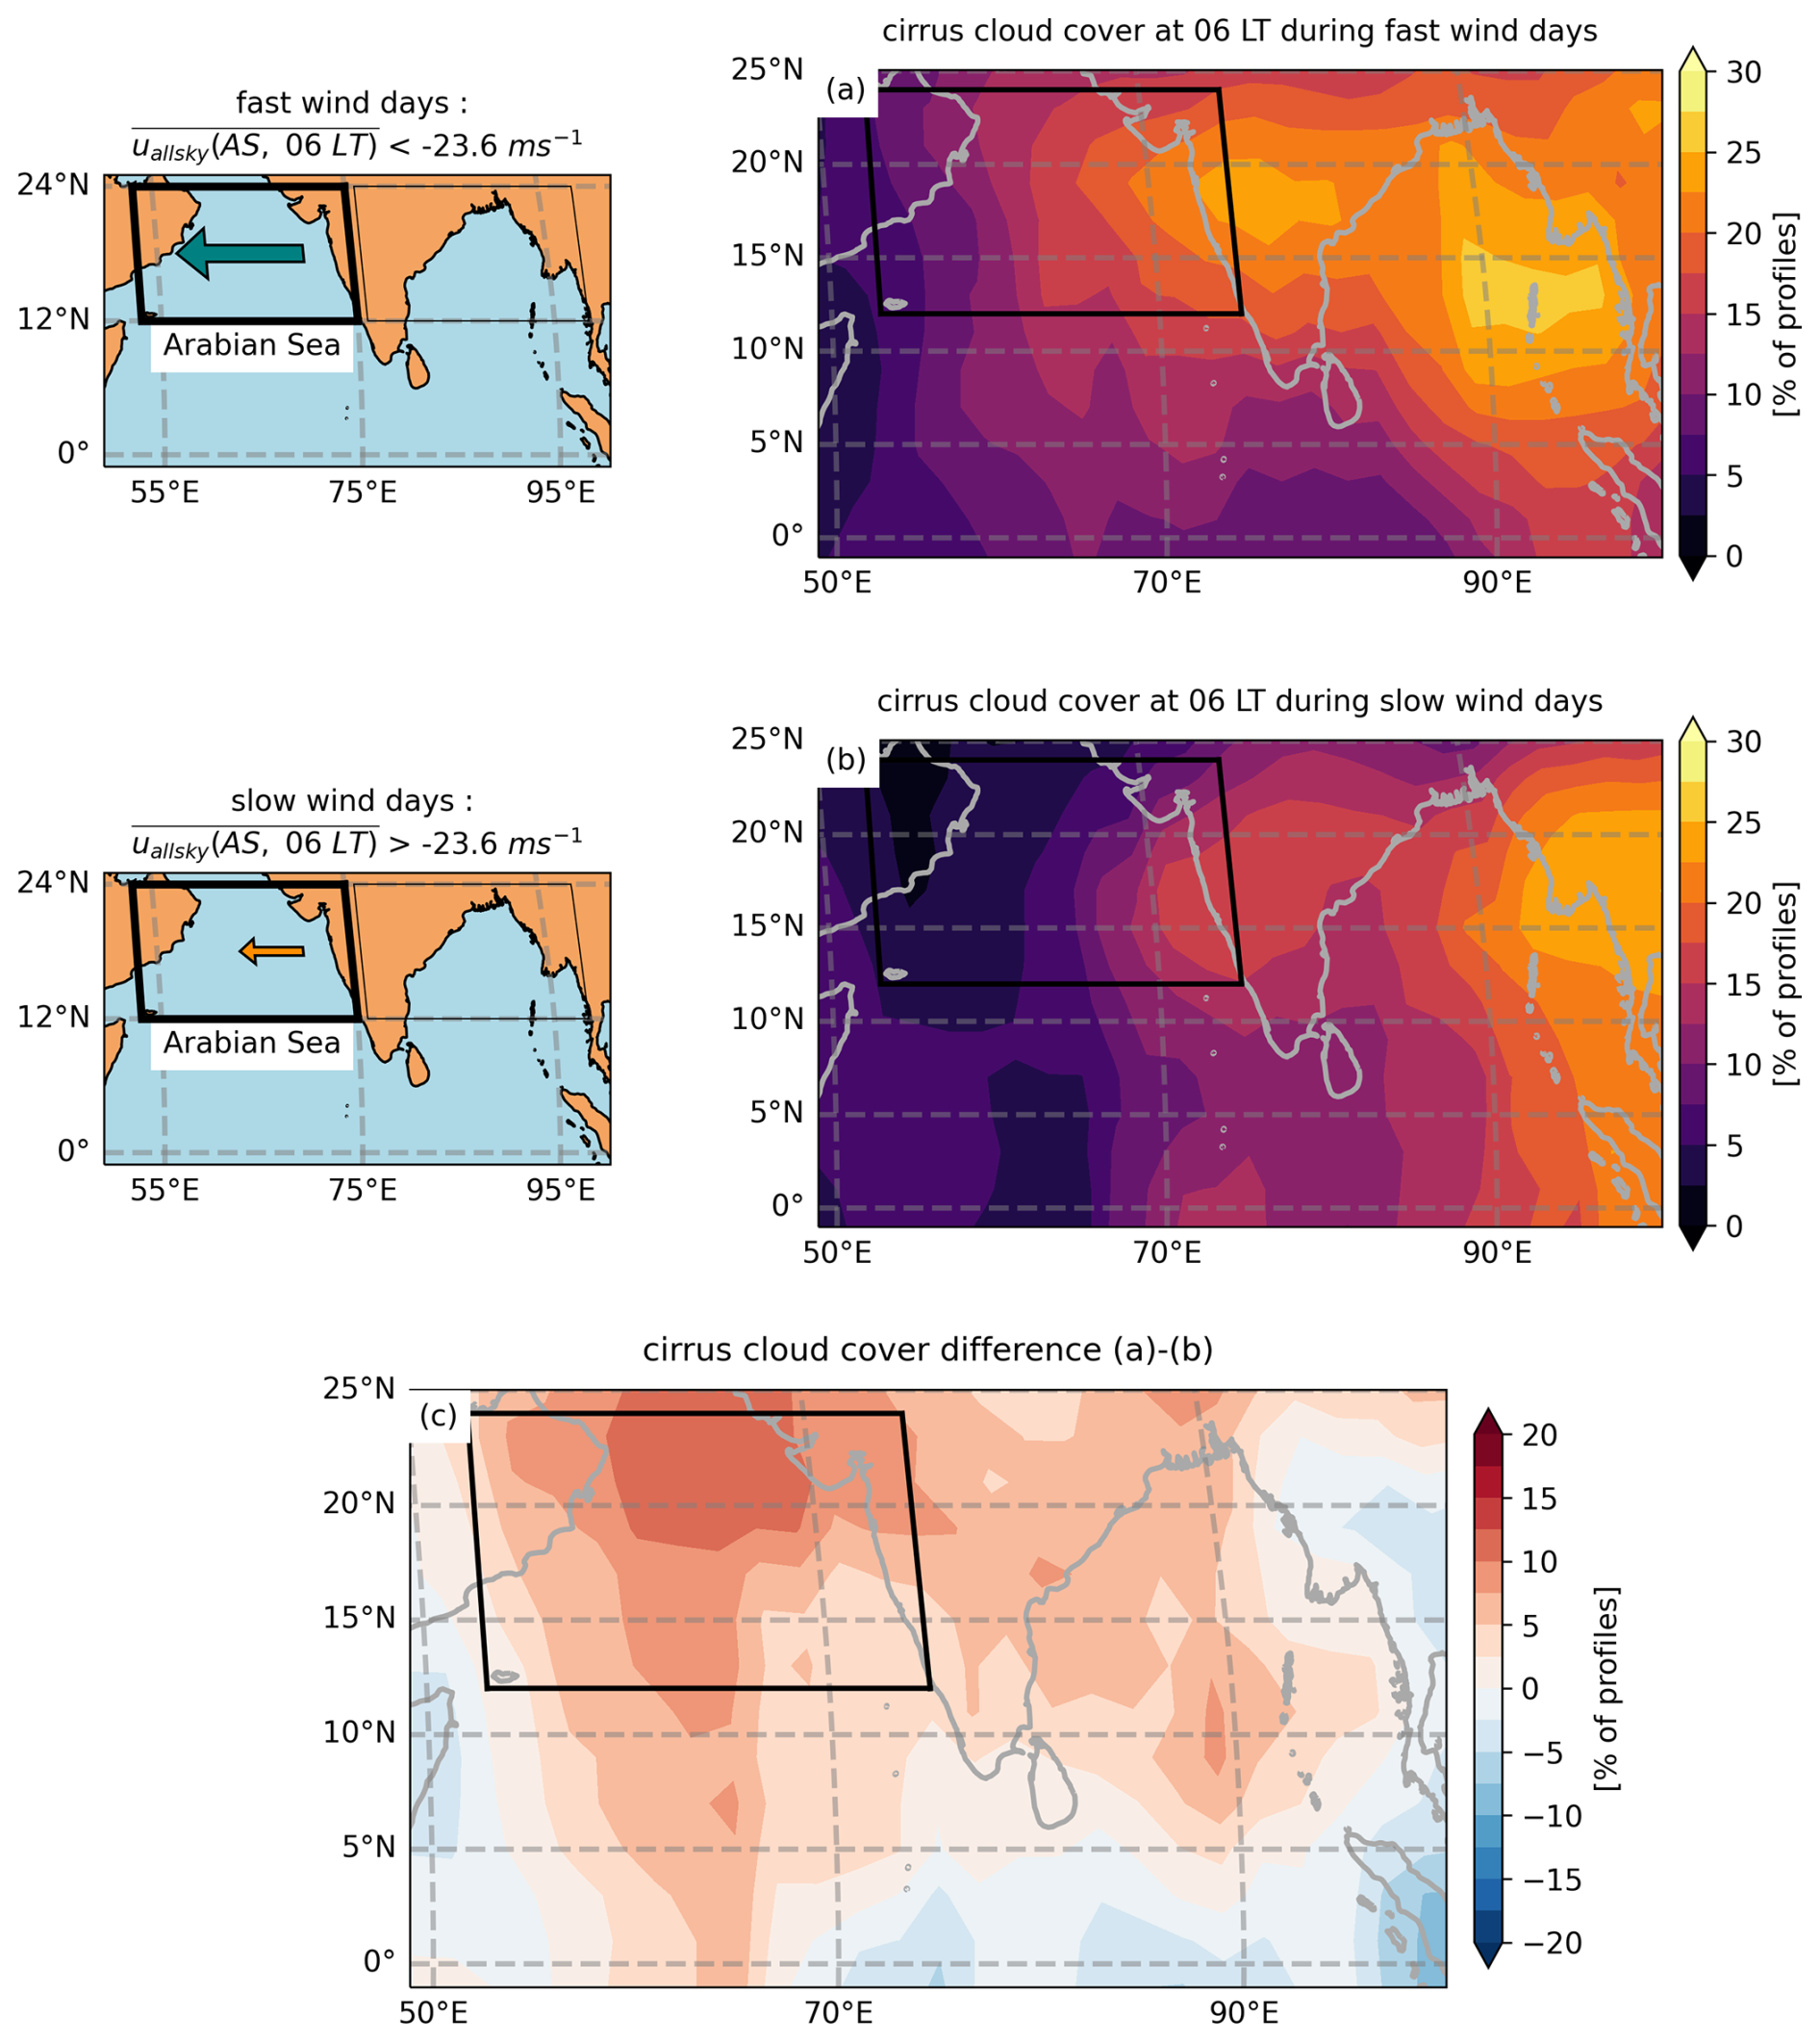
Figure 10Average cirrus cloud cover at 06:00 LT over days where is (a) faster and (b) slower than −23.6 m s−1. (c) is the difference of (a)–(b).
Figure 11a shows the PDFs of uallsky(AS,06:00 LT) observed by Aeolus for each quartile of the cirrus cloud fraction over the Arabian Sea at 06:00 LT. Here, each occurrence of uallsky and cirrus cloud fraction corresponds to an average over the Arabian Sea on a given day for each 480 m vertical level between 14 and 17 km. The first quartile, median and third quartile of cirrus cloud fraction are delimited respectively at 0.4 %, 2.6 % and 8 %. We note that all PDFs intersect between −15 and −20 m s−1. The first and second quartiles of cirrus cloud fraction (≤ 2.6 %) are dominated by winds slower than −15 m s−1, while the third and fourth quartiles of cirrus cloud fraction (> 2.6 %) are dominated by winds faster than −20 m s−1. Cirrus cloud fractions larger than 8 % are almost never observed over the Arabian Sea if uallsky(AS,06:00 LT) is slower than −10 m s−1. The occurrences of observations of cirrus cloud fractions larger than 8 % increase with wind speed and peak at −23 m s−1, while the occurrences of having no thin clouds or cirrus cloud fractions lower than 0.4 % peaks at −16 m s−1. The sensitivity of the cirrus cloud fraction over the Arabian Sea to the wind (H2) is thus well established.
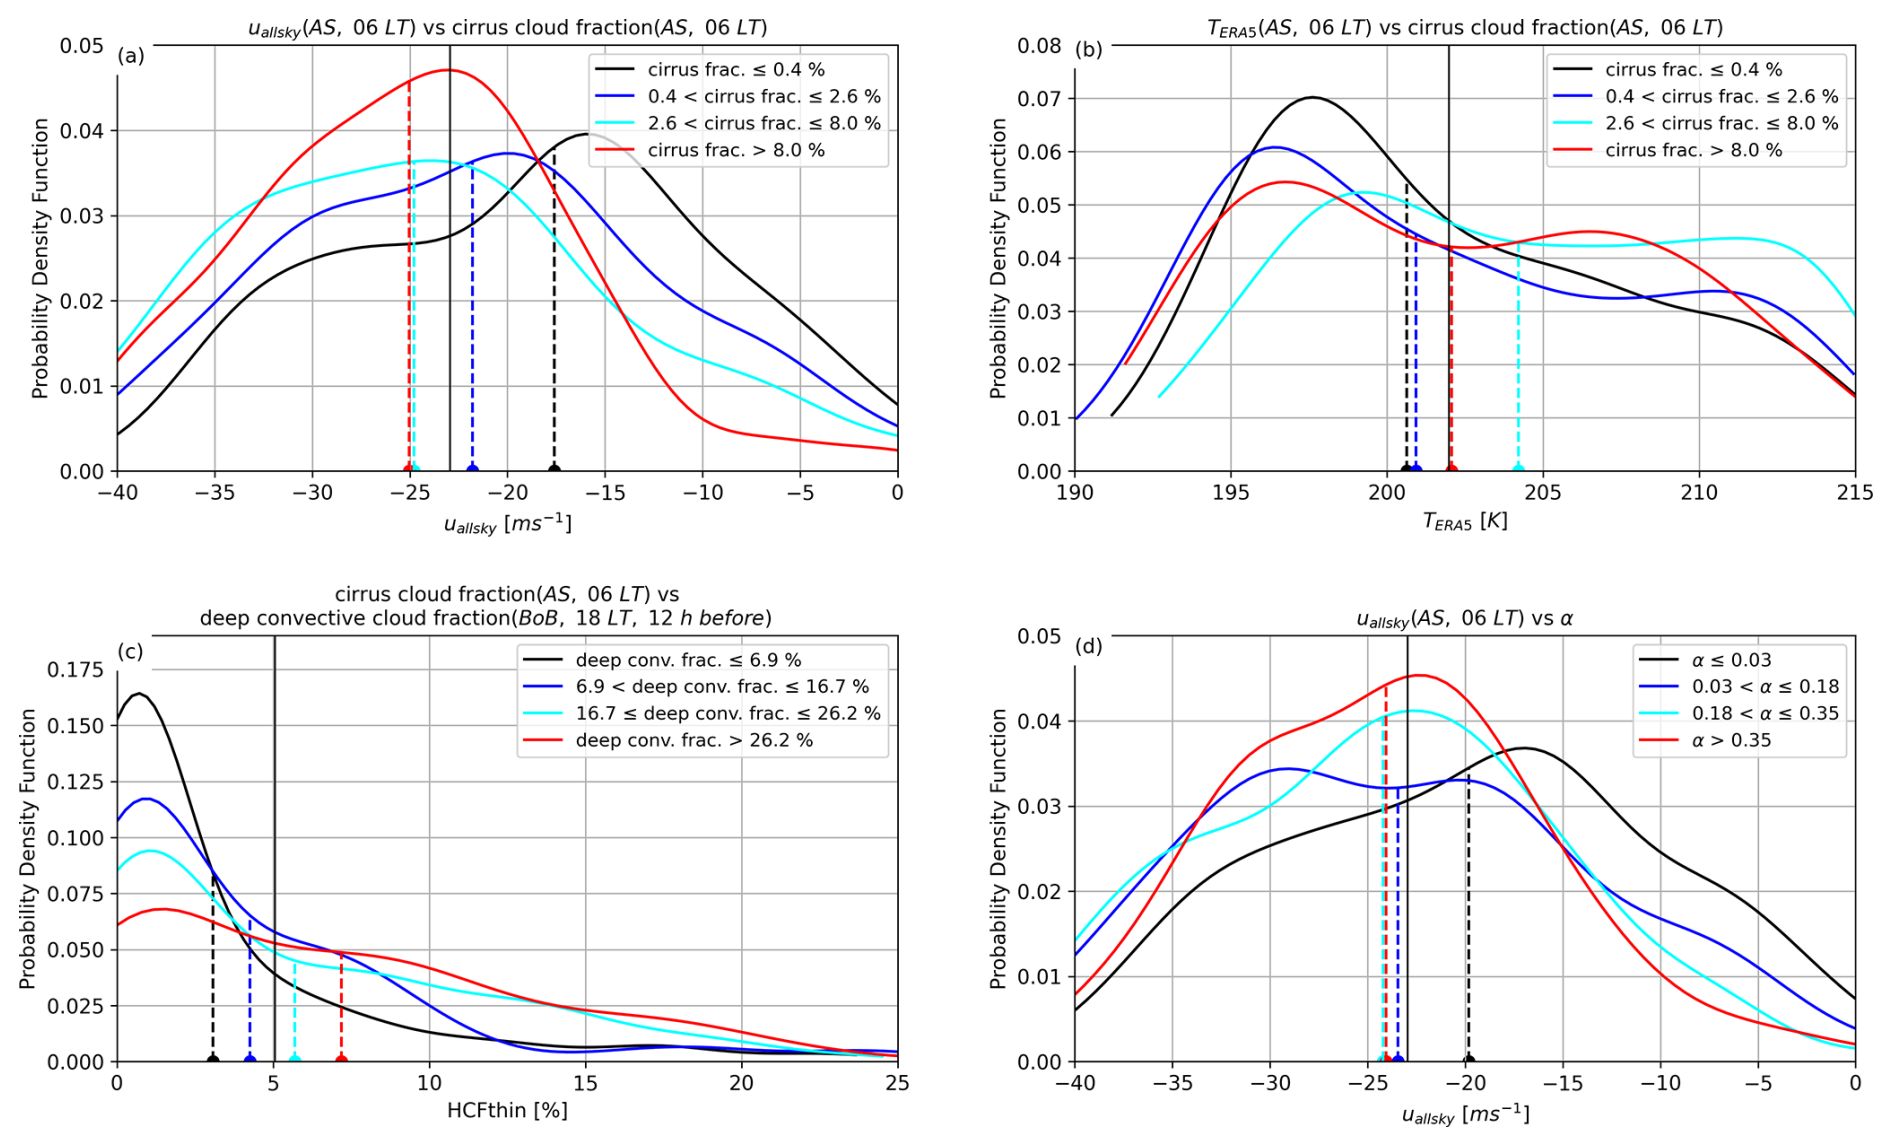
Figure 11PDF of (a) uallsky(AS, 06:00 LT) and (b) the temperature averaged over the Arabian Sea at 06:00 LT (noted TERA5(AS, 06:00 LT)) for each quartile of the cirrus cloud fraction observed over the Arabian Sea at 06:00 LT. (c) PDF of the cirrus cloud fraction observed over the Arabian Sea at 06:00 LT for each quartile of the deep convective cloud fraction observed over the Bay of Bengal (12 h before, at 18:00 LT). (d) PDF of uallsky(AS, 06:00 LT) for each quartile of the ratio α (see Eq. 10). One occurrence corresponds to the variable averaged between 12 and 24° N (about 1330 km) along the track of Aeolus, at 480 m vertical resolution between 14 and 17 km of altitude, on a given day (6 values per day corresponding to the 6 vertical 480 m layers between 14 and 17 km of altitude). The dotted lines represent the median values of each PDF and the solid black lines represent the median values across all sky conditions.
5.3 Temperature
To test hypothesis H3, we consider the ERA5 air temperatures (Hersbach et al., 2020) co-located with Aeolus observations over the Arabian Sea from June to October 2020, during the SASM. We build the PDFs of ERA5 air temperatures (noted TERA5(AS,06:00 LT)) for each quartile of the cirrus cloud fraction observed over the Arabian Sea at 06:00 LT in Fig. 11b. Each occurrence of TERA5(AS,06:00 LT) here corresponds to an average over the Arabian Sea at 06:00 LT a given day and at a given 480 m vertical level between 14 and 17 km. The temperatures corresponding to the PDFs maxima are 197.6, 196.3, 199.2 and 196.7 K for the four quartiles (sorted by increasing values) of the cirrus cloud fraction. These temperature maxima are related to the altitude of the cirrus. The two lower quartiles (black and dark blue lines), are observed at the cold point tropopause (around 16 km) and above, where temperatures are very cold (below 195 K), which explains the large peaks of their PDFs centred on low temperatures. In contrast, the highest quartile (red line), with above 8 % cirrus cloud fraction, is observed between 14 km and the cold point tropopause, which explains that it is associated with both warm and cold temperatures. The second highest quartile (light blue), is typically observed below the cold point (15.2 km or less) and is thus in general associated with warmer temperatures than the three other quartiles. This shows that large cirrus cloud fractions are not necessarily associated with low values of temperatures averaged above the Arabian Sea, and conversely low values of cirrus cloud fractions are not associated with particularly high values of temperatures. Therefore we do not observe a significant dependency of cirrus cloud fractions on the mean temperatures experienced over the Arabian Sea between 14–17 km. Note however that these mean temperatures from the reanalyses could be affected by the presence of cirrus, that would have formed after having encountered colder temperatures. Indeed cirrus clouds can warm the upper troposphere locally by up to 4 K (Fu et al., 2018). In addition, these regionally averaged temperatures may hide small-scale processes. Cold temperature anomalies induced by gravity waves can form cirrus clouds (Corcos et al., 2023) but they are not captured in the regional mean temperatures. Thus, while we cannot thoroughly disprove H3 based on these results, we can conclude that the temperature is not the main or sole driver of cirrus clouds in this region.
5.4 Deep convection
In order to test our hypothesis H4, we show on Fig. 11c that for the four quartiles of deep convective cloud fractions observed over the Bay of Bengal at 18:00 LT (delimited by 6.9 %, 16.7 %, 26.2 %), the median values of cirrus cloud fractions observed over the Arabian Sea 12 h later at 06:00 LT are 3 %, 4.5 %, 5.5 % and 7 % respectively. Thus larger cirrus cloud fractions are associated with larger deep convective cloud fractions observed 12 h before at the same altitude, and the sensitivity of the cirrus cloud fraction over the Arabian Sea to deep convection (H4) is thus well established. This shows that deep convection is important for cirrus formation and persistence; deep convection provides a direct source of ice crystals in the upper troposphere and acts as a source for water vapour which is then advected by the TEJ to over the Arabian sea. Note however that comparing the Arabian Sea at 06:00 LT and the Bay of Bengal 12 h before, at 18:00 LT makes sense if the wind speed is sufficient to advect air parcels from the Bay of Bengal to the Arabian Sea.
We explore the relationship between deep convection and wind by categorizing each day into fast or slow wind days as described in Fig. 9. We build the composites of the deep convective cloud cover at 18:00 LT, depending on uallsky(AS,06:00 LT), the wind being observed 12 h after the cloud cover is observed.
We note that 12 h prior to fast wind days, the deep convective cloud cover is 29 % on average over India and the Bay of Bengal (Fig. 12a), and maximum over North-East India at about 40 %; while 12 h prior to slow wind days, it is on average 22 % and the maximum of deep convective cloud cover of about 30 % is shifted southward (15° N, 78° E; Fig. 12b). The largest deep convective cloud cover differences between fast and slow wind days are located over the North of India and reach 20 % (Fig. 12c), while the differences are weak over the Arabian Sea, indicating that the additional sources of water are not located where the cirrus are formed.
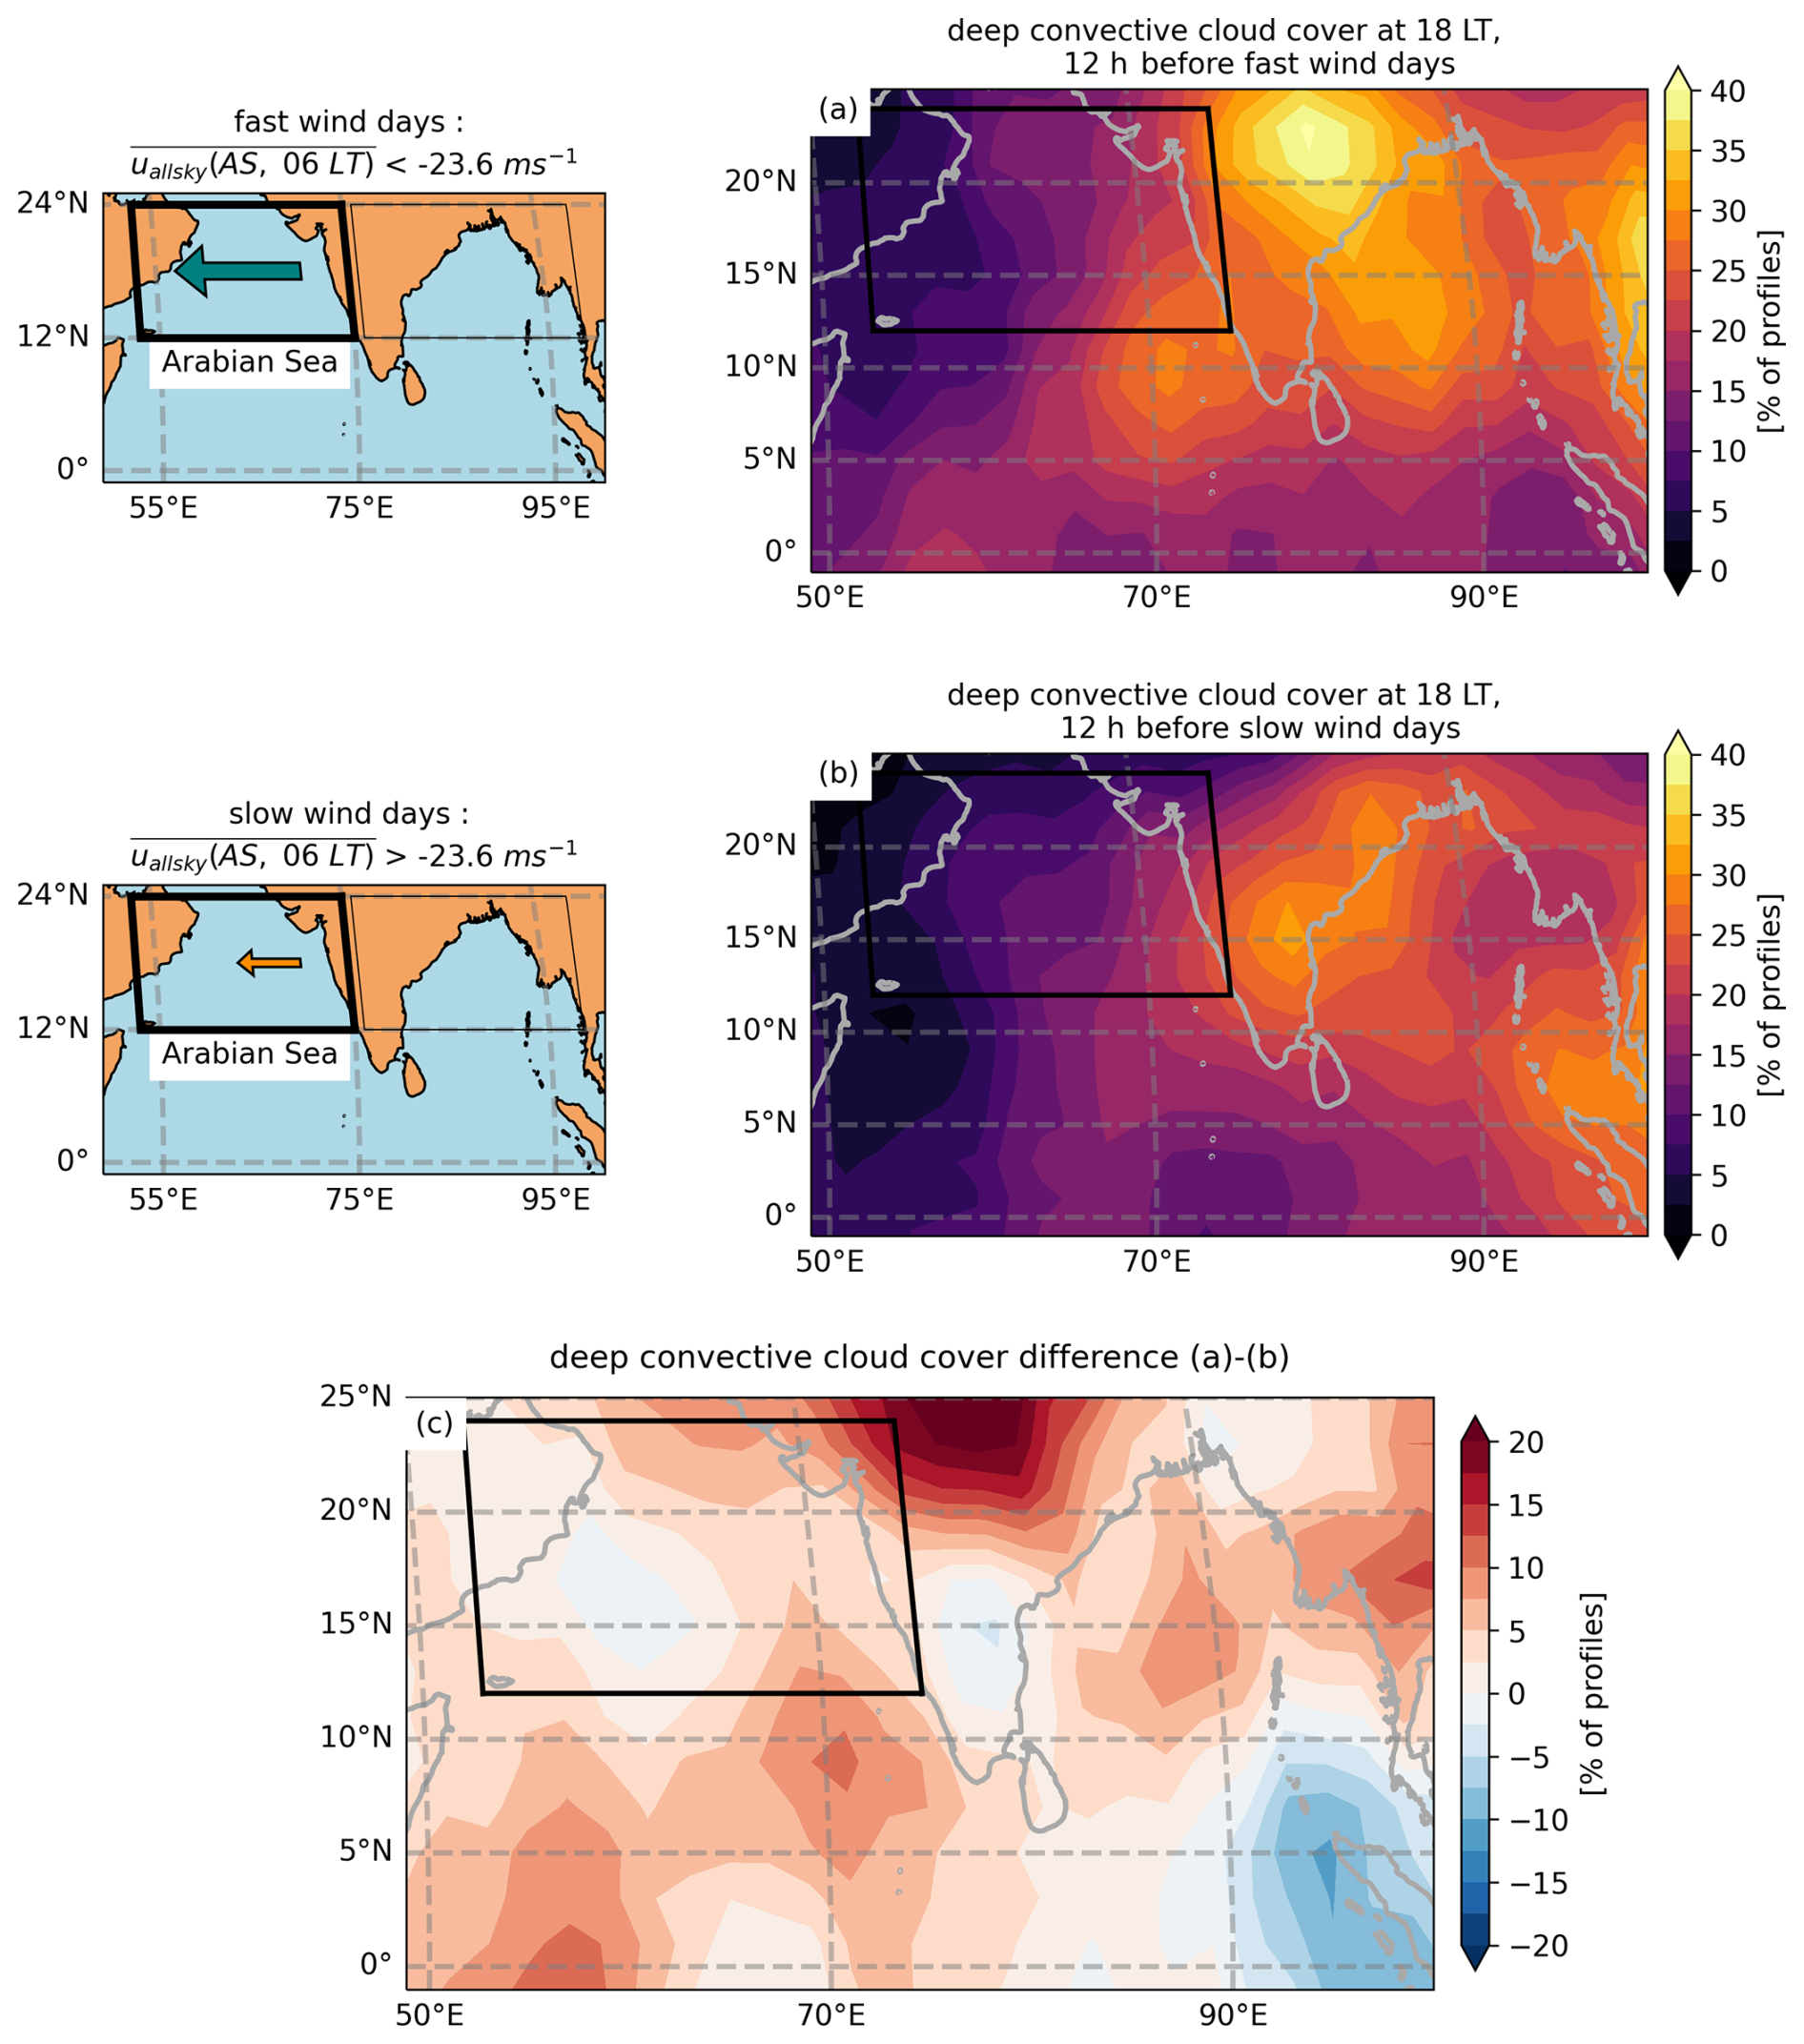
Figure 12Mean deep convective cloud cover at 18:00 LT over the days before is (a) faster and (b) slower than −23.6 m s−1. (c) is the difference of (a)–(b).
These changes in the locations of the maxima of deep convective cloud cover depending on the wind intensity can be compared with the results of Sect. 4. The patterns of differences are correlated but are not identical, as the composites are built here depending on the absolute value of the TEJ, whereas in Sect. 4, they were built depending on the TEJ deviation from the thermal wind.
These results also show that the fast wind days associated with larger cirrus cloud covers are also associated with larger deep convective cloud covers over the North of India and the Bay of Bengal, making difficult to point out which factor (the wind or deep convection) is the controlling one for the cirrus formation over the Arabian Sea.
5.5 Discussion
The sensitivity of the cirrus cloud cover to the wind, noted in Sect. 5.2, might be explained by the relationship between the cirrus cover and the deep convective cloud cover (Sect. 5.4), being itself larger when the wind is more intense (Sect. 5.4), in which case the wind would not play a direct role in the cirrus formation. Alternatively, higher occurrences of cirrus clouds over the Arabian Sea may be the result of a combination of two controlling factors: faster winds and larger sources of water injected in the upper troposphere over India and the Bay of Bengal.
To disentangle the roles of deep convection and upper tropospheric wind in the occurrence of cirrus clouds, we show in Fig. 11d four PDFs of uallsky(AS,06:00 LT) for different values of α, with:
The parameter α is between 0 and 1, and for any given value of deep convective cloud fraction observed at 18:00 LT over the Bay of Bengal, α increases when the cirrus cloud fraction over the Arabian Sea increases 12 h later at 06:00 LT. Furthermore, for any amount of cirrus cloud fraction, α increases when the deep convective cloud fraction decreases. In Fig. 11d, we only use the data coming from days where the orbit over the Arabian Sea at 06:00 LT is 1150 km westward of the orbit over the Bay of Bengal 12 h before, at 18:00 LT.
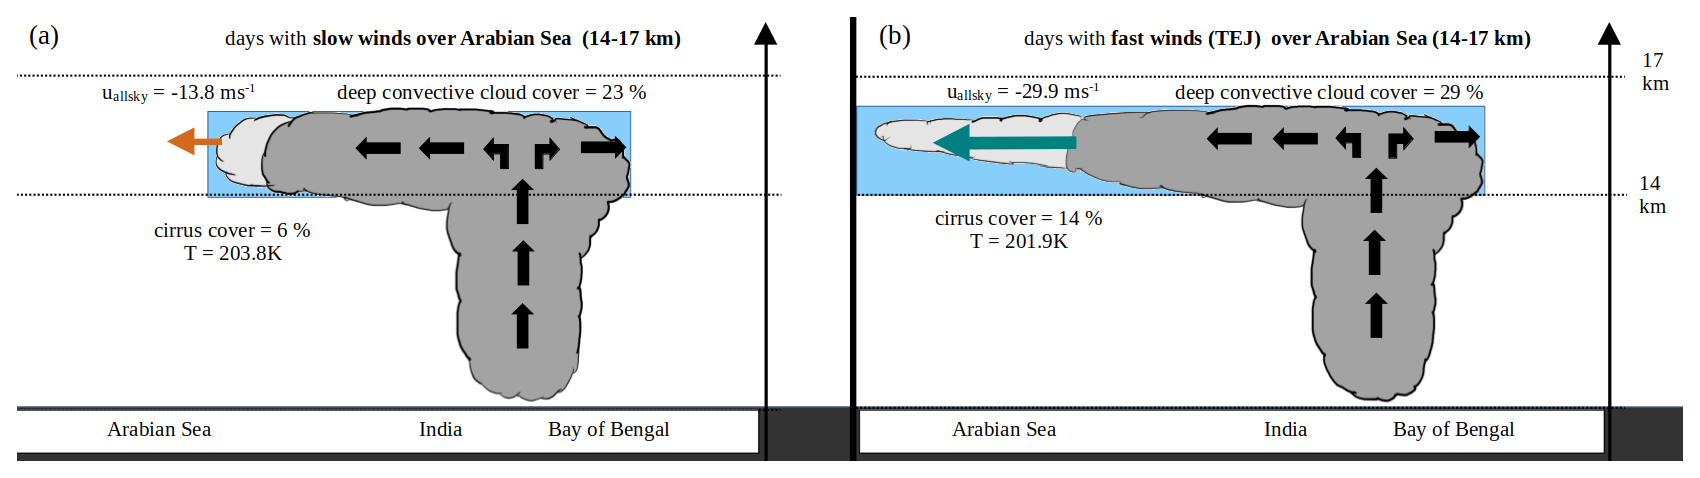
Figure 13Schematic of the partition of cirrus and deep convective clouds over the Indian region on (a) slow wind days denoted with an orange arrow and (b) fast wind days denoted with a teal arrow. The blue shading highlights the supply of water vapour in the upper-troposphere fed by deep convection while the black arrows denote the convective outflow.
Figure 11d shows that at for given deep convective cloud fraction observed over India or the Bay of Bengal at 18:00 LT, faster westward winds lead to a larger cirrus cloud fraction (larger α) over the Arabian Sea 12 h later, at 06:00 LT at the same altitude. This increase in α is particularly visible when the wind increases from −20 to −25 m s−1, and then seems to plateau at −25 m s−1, consistently with Fig. 11a, when the contribution of the deep convective cloud fraction is ignored. Indeed, if cirrus are detrained from the deep convective clouds over the Bay of Bengal at 18:00 LT, and advected at about 25 m s−1 westward, they are observed with Aeolus 12 h later over the Arabian Sea, which could explain why the mode of the PDF of uallsky(AS,06:00 LT) for the largest quartile of α (α > 0.35) is located at about −25 m s−1 (Fig. 11d). For slower westward uallsky(AS,06:00 LT), cirrus clouds detrained from deep convection over the Bay of Bengal do not make it to the Arabian Sea before the pass of Aeolus, which could explain why α < 0.03 is dominant, especially for westward uallsky(AS,06:00 LT) slower than 20 m s−1. In contrast, for westward uallsky(AS,06:00 LT) faster than 25 m s−1, the cirrus clouds may have traveled beyond the Aeolus passover at 06:00 LT; however, we still see higher ice crystal concentrations likely due to the large spatial coverage/long lifetime of cirrus clouds. This could explain why values of α > 0.03 are more often observed than values of α < 0.03 for westward uallsky(AS,06:00 LT) faster than 25 m s−1.
Overall, these diagnostics validate the general mechanism proposed in Sect. 5.1, as they show that both faster westward winds over the Arabian Sea, and larger deep convective cloud fractions over the Bay of Bengal and North-East India contribute hand in hand to an increase of the cirrus cloud fraction over the Arabian Sea in the morning. A schematic is given in Fig. 13 to summarize our results.
The TEJ shows a decreasing trend in the reanalyses during the period 1958–1998 (Rao et al., 2004) and the central TEJ intensity is expected to weaken by 18 % over the Indian Ocean by the end of the 21st century (Huang et al., 2020). In addition, Rao et al. (2004) noticed over 40 years a decrease in the number of tropical cyclones over the Bay of Bengal, and by the end of our century, the CMIP simulations project a suppressed rainfall over the tropical eastern Indian Ocean (Huang et al., 2020). This simultaneous decrease in the TEJ and deep convection over the East of India is consistent with our findings of Sect. 4, as we find a similar behaviour on an intraseasonal scale. Based on our results of Sect. 5, we predict that the decrease in convective water sources and the reduction in water advection due to a weaker TEJ will lead to a decrease in cirrus cloud cover over the Arabian Sea in the future climate.
We evaluated the relationships between the wind, deep convective clouds and cirrus clouds above the Indian region during the South-Asian summer monsoon 2020 with Aeolus observations. By computing the thermal wind between 7 and 15 km over the Arabian Sea and by comparing it to the wind speed difference observed with Aeolus between these two altitudes, we showed that the TEJ variations during SASM can be explained to a large extent by the variations in the North-South temperature gradient calculated over the Arabian Sea. However, some days showed a strengthened TEJ compared to what would be expected from the temperature gradient, and these days were associated with the presence of more deep convection in the North of the Bay of Bengal and less deep convection over the South-East Arabian Sea 12 h before. Conversely, the days that showed a weakened TEJ compared to what what would be expected from the temperature gradient, were associated with more deep convection over the South-East of the Arabian Sea and less deep convection over the North of the Bay of Bengal 12 h before. Liu et al. (2024) showed that this dipole in deep convection explained the interannual latitudinal–longitudinal variability of the TEJ core. Our results indicate that the same dipole also modulates the TEJ on much shorter time scales (on the order of days). We then concluded that deep convection anomalies, via their associated circulations, modulate the TEJ over the Arabian Sea, following a process similar to the one described by Diongue et al. (2002) and Lemburg et al. (2019) over the Sahel. The TEJ modulation lags deep convection anomalies by 12 h, suggesting that deep convection anomalies are likely to drive changes in the regional TEJ. This conclusion is not incompatible with the existence of a reversal process involving the increase of deep convection caused by the increase in the TEJ intensity or the wind shear, via baroclinic instability (Rao et al., 2004). However this process was not investigated in our study.
We found that cirrus cloud fractions over the Arabian Sea between 14 and 17 km of altitude are sensitive to the mean wind speed over the Arabian Sea at the same altitude. We noted that cirrus cloud fraction profiles larger than 8 % are almost never observed over the Arabian Sea for westward winds slower than 10 m s−1, and that the cirrus cloud cover spatially averaged over the Arabian Sea at 06:00 LT increases from 6 % to 14 % when the westward wind speed over the Arabian Sea doubles (from 13.8 to 29.9 m s−1). We do not observe a significant dependency of cirrus cloud fractions on the mean temperatures over the Arabian sea, therefore the thermodynamic conditions do not seem to be a limiting factor controlling the formation of cirrus over the Arabian Sea during SASM, although the mean temperature over the Arabian Sea may be affected by the upper tropopause warming effect of cirrus clouds. In contrast, larger cirrus cloud fractions over the Arabian Sea at 06:00 LT are associated with larger deep convective cloud fractions over India and/or the Bay of Bengal 12 h before. We conclude that the cirrus clouds found over the Arabian Sea result from their detrainment and advection over large distances, or from the large-scale advection of water vapour originating from these deep convective clouds towards the Arabian Sea as suggested in Das et al. (2011). Because Aeolus overflies the Arabian Sea at 06:00 and at 18:00 LT only, we cannot conclude on the advected water phase (ice crystals or water vapour). This would require additional observations in-between these 06:00 and 18:00 LT to properly track the evolution of deep convection.
In a warming climate, modeling studies predict a decrease in the intensity of the TEJ (Huang et al., 2020) and a decrease in deep convection over the Bay of Bengal (Rao et al., 2004) which could both reduce the cirrus cloud cover over the Arabian Sea. In the future, we plan to investigate further the relationships between the TEJ, deep convection and cirrus cloud cover over the Indian Ocean in a Global Circulation Model, in the current climate and in a warming climate.
A1 Clouds
Aeolus cloud fractions were evaluated against CALIPSO-GOCCP observations coarsened to Aeolus spatial resolution and corrected for the different flight times of the two satellites (Titus et al., 2026). Aeolus cloud fractions profiles are lower than CALIPSO-GOCCP cloud fractions by 3 % in the Tropical upper troposphere during boreal summer 2020, and this difference is non-significant at the 95th percentile with a two-sided T-test. Note however that our dataset, in spite of its 480 m vertical resolution, does not provide higher level of details compared to the native Aeolus resolution dataset, which brings some uncertainties, especially with respect to the cloud top levels.
A2 Winds
The systematic error (bias) on individual Aeolus wind observations in the most recent (2B16) baseline is reported to be below 1 m s−1 for Rayleigh-clear winds and 0.5 m s−1 for Mie-cloudy winds, while the random errors (spread of the wind values around the mean) are about 6 m s−1 for Rayleigh-clear winds and 4 m s−1 for Mie-cloudy winds (Aeolus DISC, 2024). Given the short span of the study (2020 and especially June–October 2020 for most of the paper), the limited geographic extent of the Area of interest (12–24° N, 50–90° E, 14–17 km), and the single baseline used, we assume that these properties remained constant.
The different spatial or temporal averages of the wind that we perform throughout the paper naturally mitigate the impact of the large random error on individual Aeolus wind observations. The standard error is a good metric to determine the uncertainty on our mean wind observations. The standard error on the mean wind is equal to the random error divided by , N being the number of individual wind observations, weighted by the spatial cover of each observation. While we do not show for each figure the exact uncertainty on the mean wind observations, we quantify the maximum possible standard error in perfectly clear sky (the minimum possible standard error in perfectly cloudy sky), knowing that the real standard error is between these two values.
-
Figure 11. For each occurrence of the PDF, the mean wind uallsky(AS,06:00 LT) results from a spatial average. The standard error on a daily mean wind value at a single altitude level is obtained after an average of 13 independent Rayleigh-clear (80 independent Mie-cloudy) wind observations between 12 and 24° N, which brings down the standard error to 1.6 (0.4) m s−1.
-
Figure 3. At each altitude level, the mean uallsky uses two ascending and two descending passes so the standard error is closer to 0.8 (0.2) m s−1.
-
Figure 9. An average along the vertical between 14 and 17 km of altitude brings down the maximum standard error to 0.9 (0.2) m s−1.
-
Figure 5. Because we use the difference of two mean winds coming from two different altitudes, the standard error is 2.2 (0.6) m s−1.
-
Figure 4. For maps, the mean wind results from a spatial average in each 2° × 2° grid-box followed by a temporal average), the standard error is 0.9 (0.2) m s−1.
-
Figure 6. Because the number of days used on each map is half that of Fig. 4, the standard error is 1.2 (0.3) m s−1.
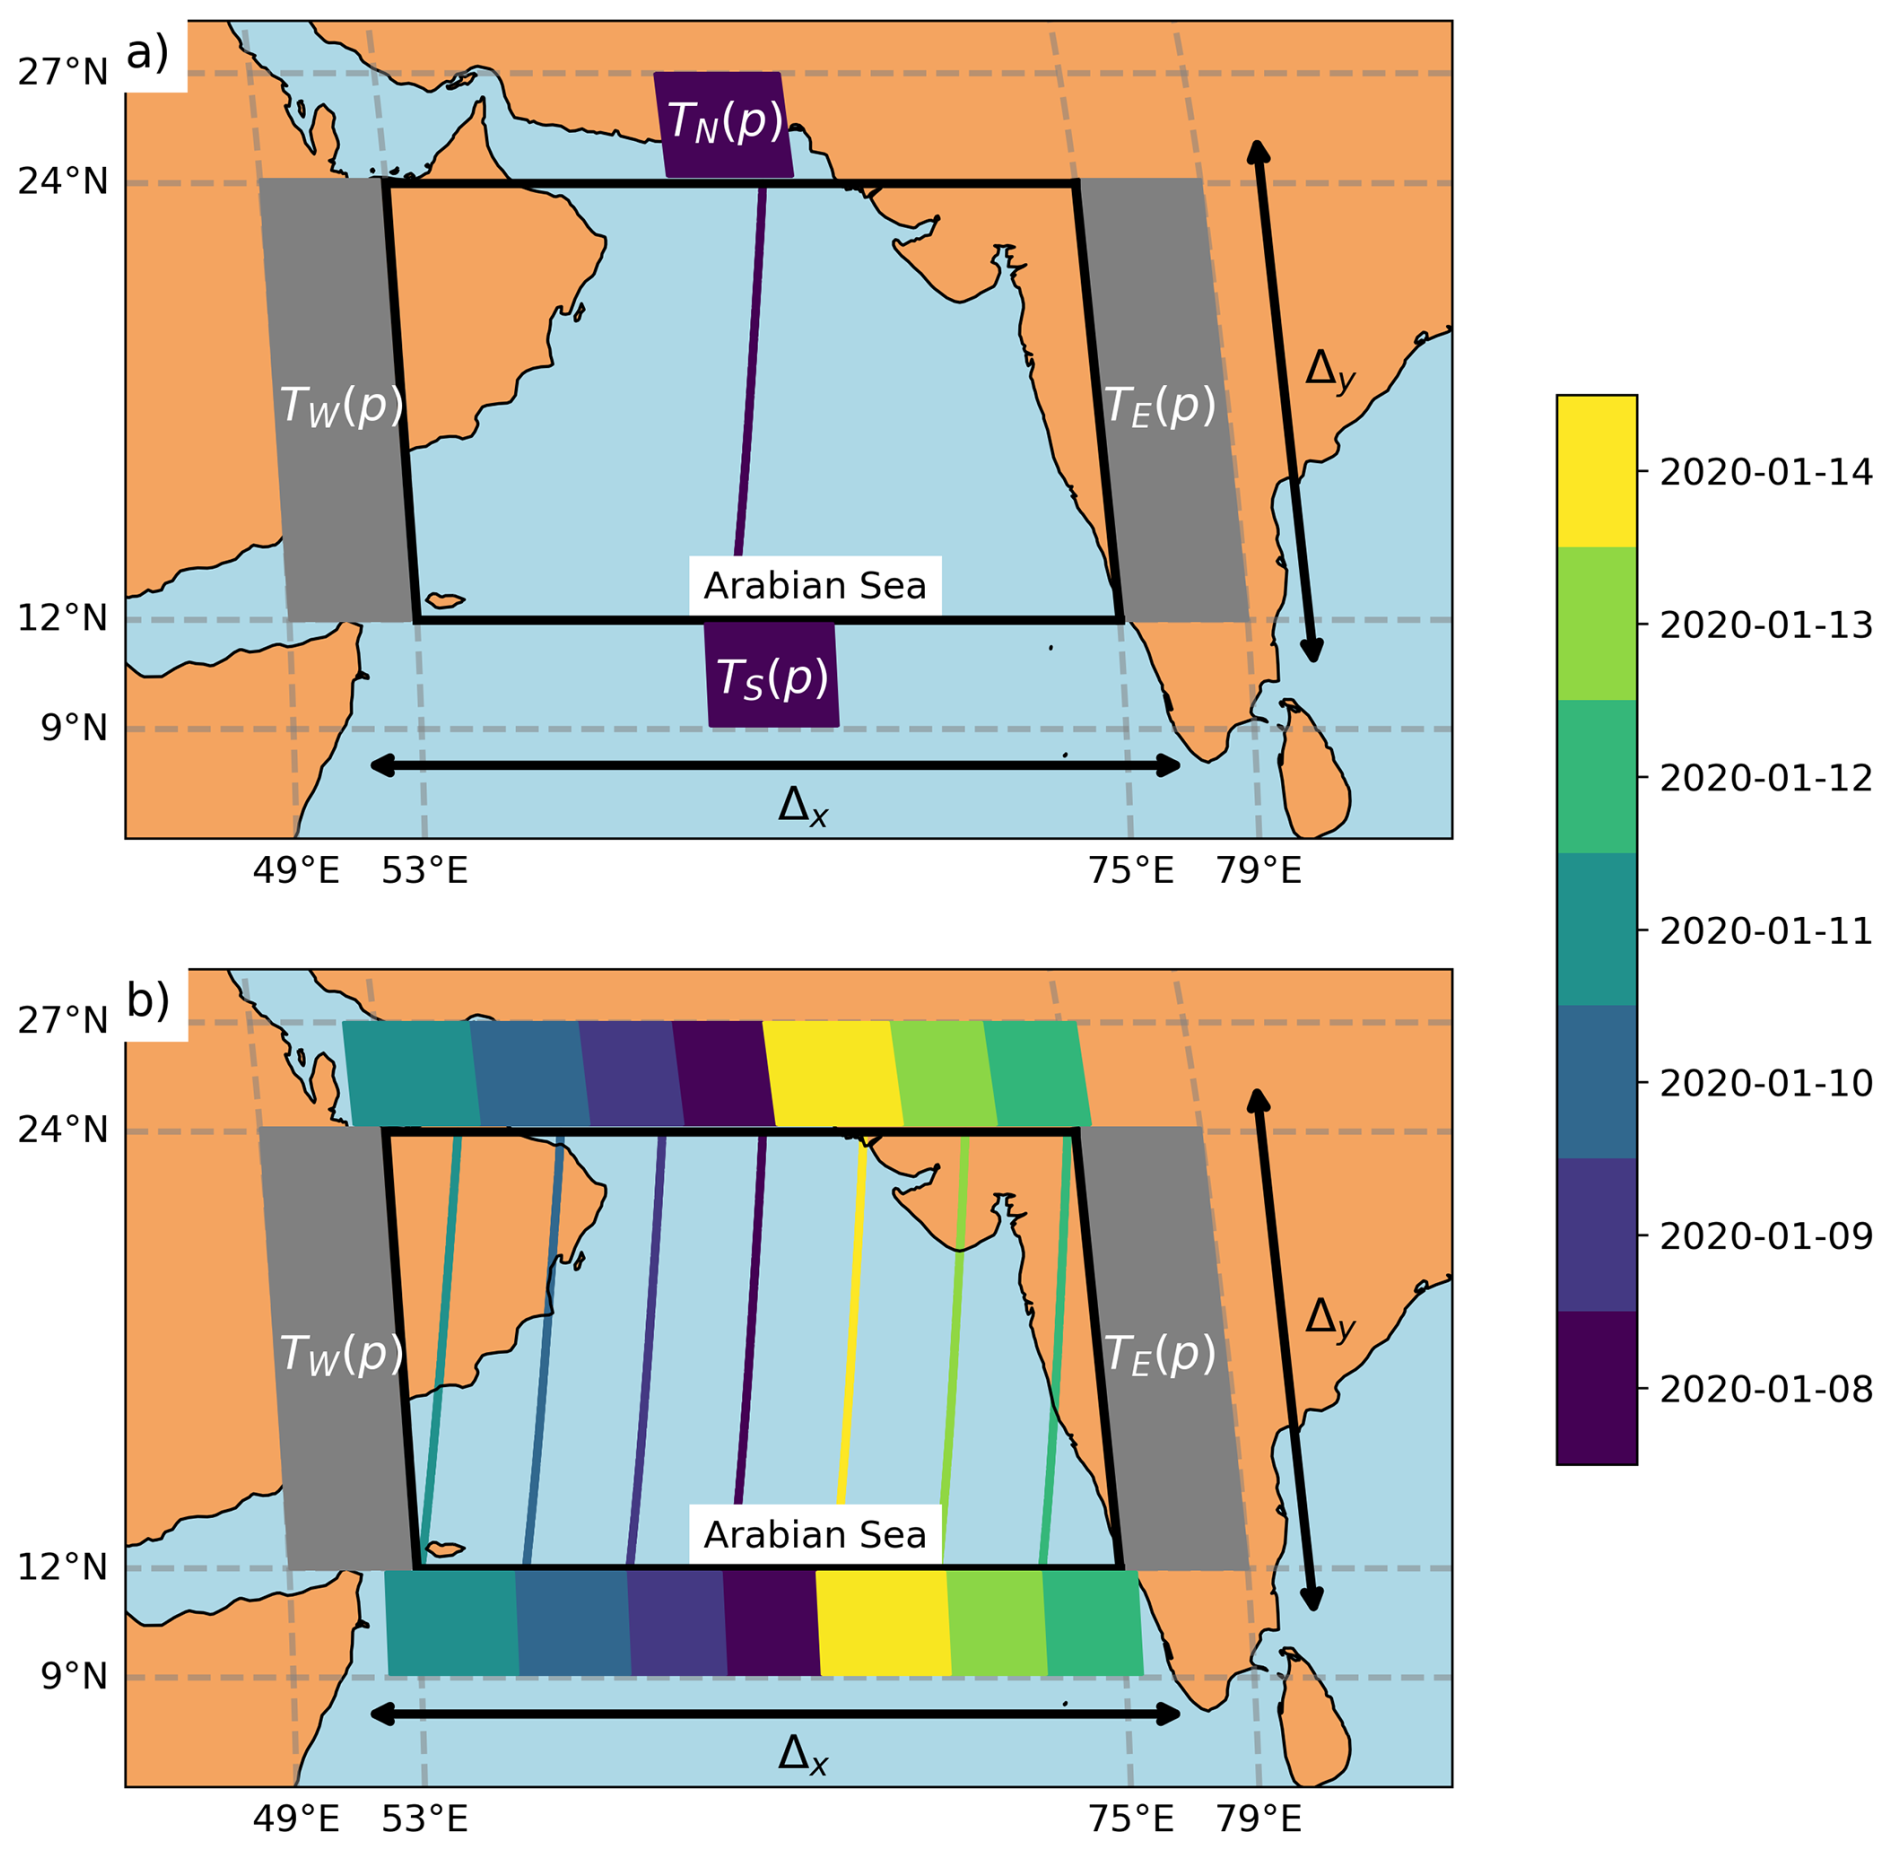
Figure B1Schematic of (a) the locations where TN, TS, TW, and TE are calculated on the 8 January 2020 at 06:00 LT. (b) is the generalization for the 7 d cycle of Aeolus. Δy and Δx are also represented.
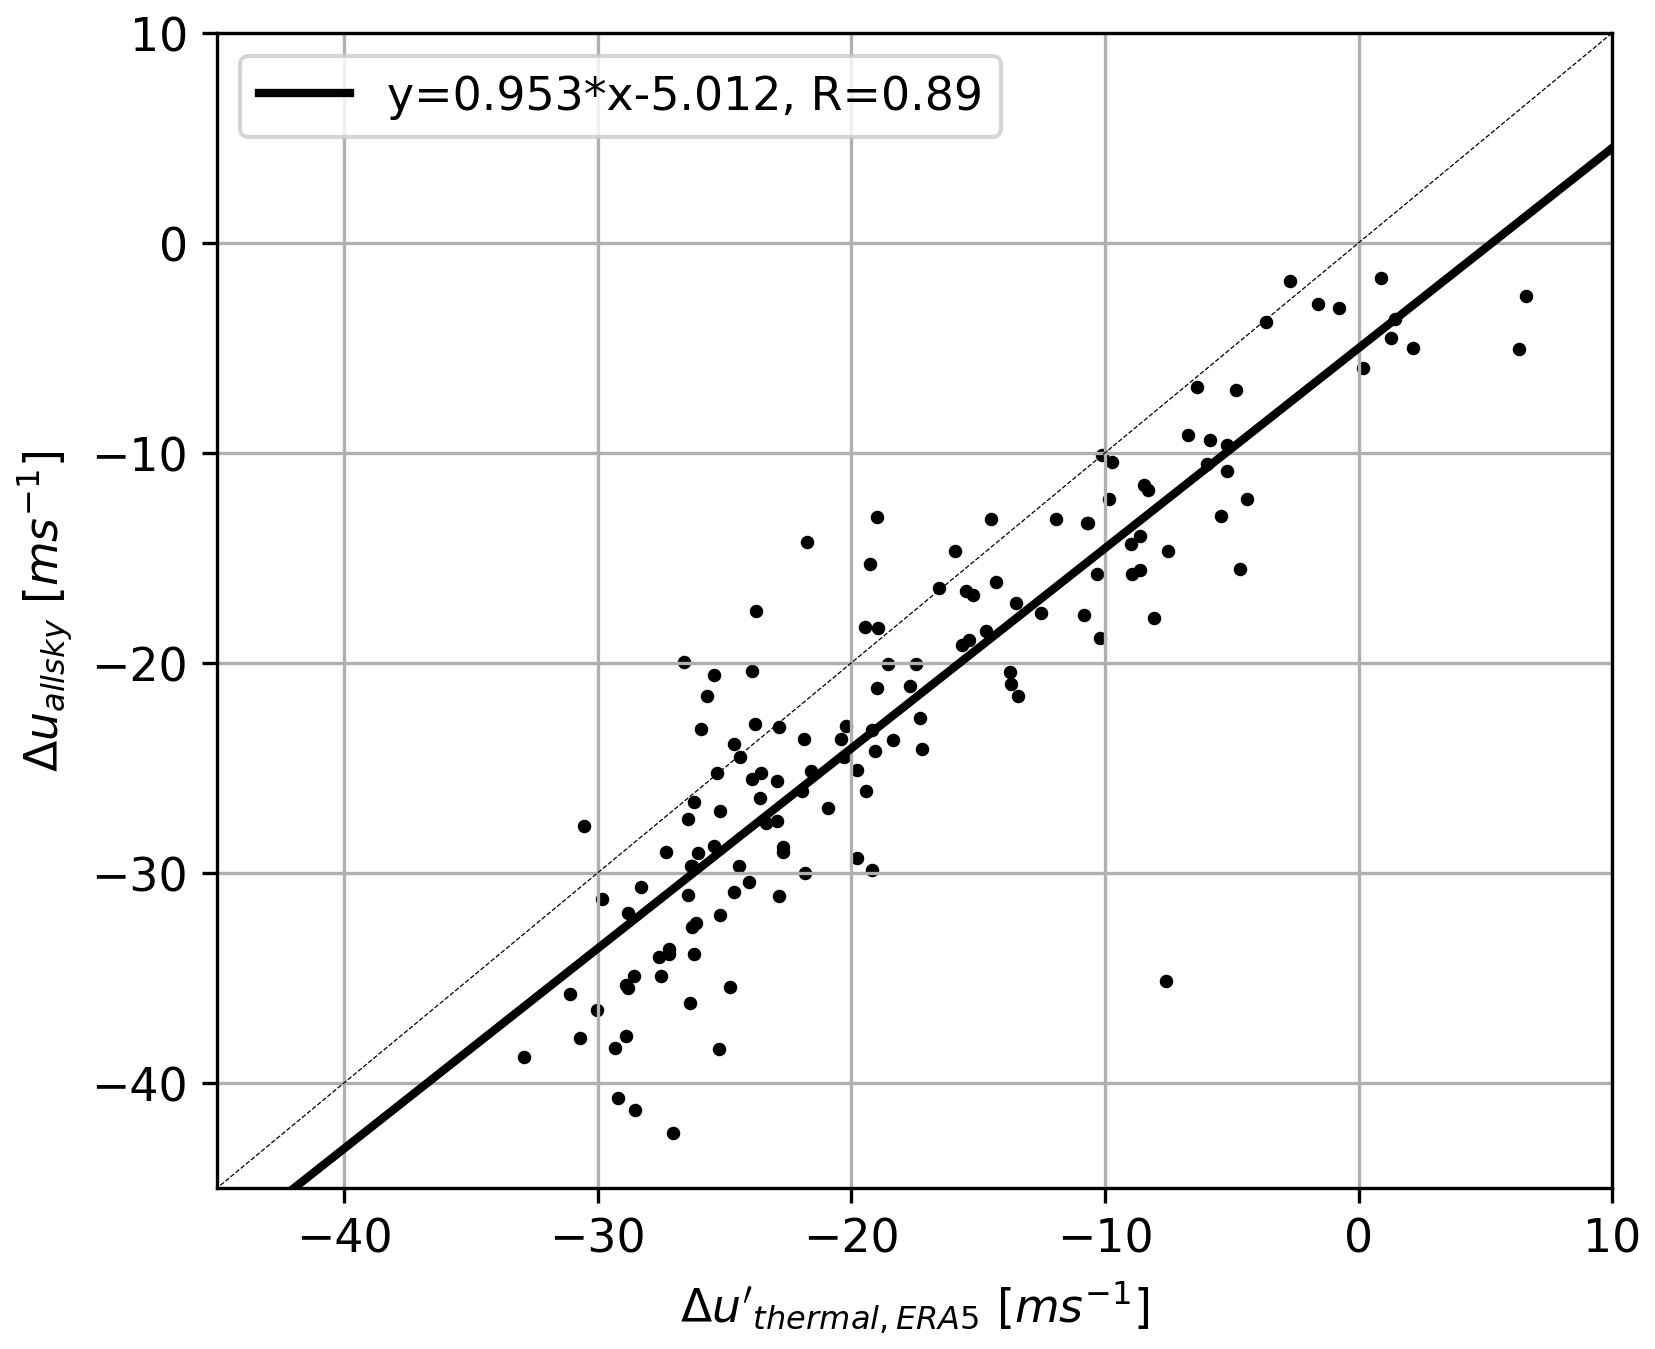
Figure B2Scatterplot of Δuallsky vs. Δutherm,ERA5 for each day of June–October 2020 at 06:00 LT over the Arabian Sea. The mean, median, and std of Δuallsky–Δutherm,ERA5 are respectively −2.1, −2.1, and −4.5 m s−1.
ALADIN/Aeolus orbit gridded data presented in this paper are available via AERIS (https://doi.org/10.25326/746; Titus, 2024). They are built from Aeolus Level 1A and Level 2B observations that can be accessed via the ESA MAAP (https://earth.esa.int/eogateway/catalog/aeolus-baseline-16-products, last access 18 September 2026). ERA5 reanalyses were accessible at https://doi.org/10.24381/cds.bd0915c6 (Hersbach et al., 2023).
ZT, MB, and HC drafted the article. The Aeolus dataset development was performed by ZT and AGF. The data analysis was performed by ZT and MB. All authors were involved in the writing and investigation.
The contact author has declared that none of the authors has any competing interests.
Publisher's note: Copernicus Publications remains neutral with regard to jurisdictional claims made in the text, published maps, institutional affiliations, or any other geographical representation in this paper. The authors bear the ultimate responsibility for providing appropriate place names. Views expressed in the text are those of the authors and do not necessarily reflect the views of the publisher.
The authors thank Mesocentre ESPRI/IPSL for the computation resources. We also thank ESA dissemination team for the access to Aeolus data and AERIS for the storage of the dataset.
This research was supported by the European Space Agency (ESA) and European Aeronautic Defence and Space company (EADS) in the framework of ZT's PhD.
This paper was edited by Matthias Tesche and reviewed by two anonymous referees.
Ackerman, T. P., Liou, K.-N., Valero, F. P., and Pfister, L.: Heating rates in tropical anvils, J. Atmos. Sci., 45, 1606–1623, https://doi.org/10.1175/1520-0469(1988)045<1606:HRITA>2.0.CO;2, 1988. a
Aeolus DISC: The Earth Explorer Mission Aeolus for atmospheric wind observations – Final Report from the Aeolus Data Innovation and Science Cluster DISC of Phase E, Aeolus DISC reports, https://doi.org/10.57676/93c3-n766, 2024. a
Ali, S., Mehta, S. K., Ananthavel, A., and Reddy, T. V. R.: Temporal and vertical distributions of the occurrence of cirrus clouds over a coastal station in the Indian monsoon region, Atmos. Chem. Phys., 22, 8321–8342, https://doi.org/10.5194/acp-22-8321-2022, 2022. a
Betts, A.: Non-precipitating cumulus convection and its parameterization, Q. J. R. Meteorol. Soc., 99, 178–196, https://doi.org/10.1002/qj.49709941915, 1973. a
Chen, T.-C.: On the kinetic energy budget of the summer-mean flow at 200 mb in the tropics, Tellus, 34, 55–62, https://doi.org/10.1111/j.2153-3490.1982.tb01792.x, 1982. a, b
Chen, T.-C. and van Loon, H.: Interannual variation of the tropical easterly jet, Mon. Weather Rev., 115, 1739–1759, https://doi.org/10.1175/1520-0493(1987)115<1739:IVOTTE>2.0.CO;2, 1987. a
Chepfer, H., Brogniez, H., and Noel, V.: Diurnal variations of cloud and relative humidity profiles across the tropics, Sci. Rep., 9, 16045, https://doi.org/10.1038/s41598-019-52437-6, 2019. a, b, c, d
Corcos, M., Hertzog, A., Plougonven, R., and Podglajen, A.: A simple model to assess the impact of gravity waves on ice-crystal populations in the tropical tropopause layer, Atmos. Chem. Phys., 23, 6923–6939, https://doi.org/10.5194/acp-23-6923-2023, 2023. a, b
Das, S. K., Chiang, C.-W., and Nee, J.-B.: Influence of tropical easterly jet on upper tropical cirrus: an observational study from CALIPSO, Aura-MLS, and NCEP/NCAR data, J. Geophys. Res.-Atmos., 116, https://doi.org/10.1029/2011JD015923, 2011. a, b, c, d
Diongue, A., Lafore, J.-P., Redelsperger, J.-L., and Roca, R.: Numerical study of a Sahelian synoptic weather system: Initiation and mature stages of convection and its interactions with the large-scale dynamics, Q. J. R. Meteorol. Soc., 128, 1899–1927, https://doi.org/10.1256/003590002320603467, 2002. a, b, c, d
Donovan, D. P., van Zadelhoff, G.-J., and Wang, P.: The EarthCARE lidar cloud and aerosol profile processor (A-PRO): the A-AER, A-EBD, A-TC, and A-ICE products, Atmos. Meas. Tech., 17, 5301–5340, https://doi.org/10.5194/amt-17-5301-2024, 2024. a
Feofilov, A. G. and Stubenrauch, C. J.: Diurnal variation of high-level clouds from the synergy of AIRS and IASI space-borne infrared sounders, Atmos. Chem. Phys., 19, 13957–13972, https://doi.org/10.5194/acp-19-13957-2019, 2019. a, b
Feofilov, A. G., Chepfer, H., Noël, V., Guzman, R., Gindre, C., Ma, P.-L., and Chiriaco, M.: Comparison of scattering ratio profiles retrieved from ALADIN/Aeolus and CALIOP/CALIPSO observations and preliminary estimates of cloud fraction profiles, Atmos. Meas. Tech., 15, 1055–1074, https://doi.org/10.5194/amt-15-1055-2022, 2022. a
Fu, Q., Smith, M., and Yang, Q.: The impact of cloud radiative effects on the tropical tropopause layer temperatures, Atmosphere, 9, 377–390, https://doi.org/10.3390/atmos9100377, 2018. a, b
Gasparini, B., Rasch, P. J., Hartmann, D. L., Wall, C. J., and Dütsch, M.: A Lagrangian perspective on tropical anvil cloud lifecycle in present and future climate, J. Geophys. Res.-Atmos., 126, https://doi.org/10.1029/2020JD033487, 2021. a
Hartmann, D. L. and Berry, S. E.: The balanced radiative effect of tropical anvil clouds, J. Geophys. Res.-Atmos., 122, 5003–5020, https://doi.org/10.1002/2017JD026460, 2017. a
Hersbach, H., Bell, B., Berrisford, P., Hirahara, S., Horányi, A., Muñoz-Sabater, J., Nicolas, J., Peubey, C., Radu, R., Schepers, D., Simmons, A., Soci, C., Abdalla, S., Abellan, X., Balsamo, G., Bechtold, P., Biavati, G., Bidlot, J., Bonavita, M., Chiara, G., Dahlgren, P., Dee, D., Diamantakis, M., Dragani, R., Flemming, J., Forbes, R., Fuentes, M., Geer, A., Haimberger, L., Healy, S., Hogan, R. J., Hólm, E., Janisková, M., Keeley, S., Laloyaux, P., Lopez, P., Lupu, C., Radnoti, G., Rosnay, P., Rozum, I., Vamborg, F., Villaume, S., and Thépaut, J. N.: The ERA5 global reanalysis, Q. J. R. Meteorol. Soc., 146, 1999–2049, https://doi.org/10.1002/qj.3803, 2020. a
Hersbach, H., Bell, B., Berrisford, P., Biavati, G., Horányi, A., Muñoz Sabater, J., Nicolas, J., Peubey, C., Radu, R., Rozum, I., Schepers, D., Simmons, A., Soci, C., Dee, D., and Thépaut, J.-N.: ERA5 hourly data on pressure levels from 1940 to present, Copernicus Climate Change Service (C3S) Climate Data Store (CDS) [data set], https://doi.org/10.24381/cds.bd0915c6, 2023. a
Höjgård-Olsen, E., Chepfer, H., and Brogniez, H.: Satellite observed sensitivity of tropical clouds and moisture to sea surface temperature on various time and space scales: 1. Focus on high level cloud situations over ocean, J. Geophys. Res.-Atmos., 127, https://doi.org/10.1029/2021JD035438, 2022. a
Huang, S., Wang, B., and Wen, Z.: Dramatic Weakening of the Tropical Easterly Jet Projected by CMIP6 Models, J. Climate, 33, 8439–8455, https://doi.org/10.1175/JCLI-D-19-1002.1, 2020. a, b, c, d, e
Iqbal, W., Syed, F., Sajjad, H., Nikulin, G., Kjellström, E., and Hannachi, A.: Mean climate and representation of jet streams in the CORDEX South Asia simulations by the regional climate model RCA4, Theor. Appl. Climatol., 129, 1–19, https://doi.org/10.1007/s00704-016-1755-4, 2017. a, b
Jensen, E., Ueyama, R., Pfister, L., and Atlas, R.: The impacts of gravity waves and wind shear on the lifecycle of cirrus clouds in the tropical tropopause layer, J. Geophys. Res.-Atmos., 130, https://doi.org/10.1029/2024JD042308, 2025. a
Koteswaram, P.: The easterly jet stream in the tropics, Tellus, 10, 43–57, https://doi.org/10.3402/tellusa.v10i1.9220, 1958. a
Kripalani, R., Ha, K.-J., Ho, C.-H., Oh, J.-H., Preethi, B., Mujumdar, M., and Prabhu, A.: Erratic Asian summer monsoon 2020: COVID-19 lockdown initiatives possible cause for these episodes?, Clim. Dynam., 59, 1339–1352, https://doi.org/10.1007/s00382-021-06042-x, 2022. a
Krisch, I., Hindley, N. P., Reitebuch, O., and Wright, C. J.: On the derivation of zonal and meridional wind components from Aeolus horizontal line-of-sight wind, Atmos. Meas. Tech., 15, 3465–3479, https://doi.org/10.5194/amt-15-3465-2022, 2022. a, b
Krishnamurthy, V. and Shukla, J.: Intraseasonal and interannual variability of rainfall over India, J. Climate, 13, 4366–4377, https://doi.org/10.1175/1520-0442(2000)013<0001:IAIVOR>2.0.CO;2, 2000. a
Lemburg, A., Bader, J., and Claussen, M.: Sahel rainfall – tropical easterly jet relationship on synoptic to intraseasonal time scales, Mon. Weather Rev., 147, 1733–1752, https://doi.org/10.1175/MWR-D-18-0254.1, 2019. a, b, c, d, e
Liu, S., Huang, S., Tan, Y., Wen, Z., Chen, X., and Guo, Y.: Characteristics and mechanisms of the interannual variability of the Northwest–Southeast shift of the tropical easterly Jet’s core in July, J. Climate, 37, 3219–3235, https://doi.org/10.1175/JCLI-D-23-0291.1, 2024. a, b, c, d
Luo, Z. and Rossow, W. B.: Characterizing tropical cirrus life cycle, evolution, and interaction with upper-tropospheric water vapor using Lagrangian trajectory analysis of satellite observations, J. Climate, 17, 4541–4563, https://doi.org/10.1175/3222.1, 2004. a, b
Mapes, B. E. and Houze Jr., R. A.: Cloud clusters and superclusters over the oceanic warm pool, Mon. Weather Rev., 121, 1398–1416, https://doi.org/10.1175/1520-0493(1993)121<1398:CCASOT>2.0.CO;2, 1993. a
Massie, S., Gettelman, A., Randel, W., and Baumgardner, D.: Distribution of tropical cirrus in relation to convection, J. Geophys. Res.-Atmos., 107, AAC-19-1–AAC-19-16, https://doi.org/10.1029/2001JD001293, 2002. a
McKim, B., Bony, S., and Dufresne, J.-L.: Weak anvil cloud area feedback suggested by physical and observational constraints, Nat. Geosci., 17, 392–397, https://doi.org/10.1038/s41561-024-01414-4, 2024. a
Mehta, S. K.: Observational evidence of the relationship between the tropical tropopause and tropical easterly jet streams over the Indian monsoon region, Atmos. Sci. Lett., 25, https://doi.org/10.1002/asl.1230, 2024. a, b
Mohan, T. and Rao, T.: Differences in the mean wind and its diurnal variation between wet and dry spells of the monsoon over southeast India, J. Geophys. Res.-Atmos., 121, 6993–7006, https://doi.org/10.1002/2015JD024704, 2016. a, b
Nicholson, S. E.: On the factors modulating the intensity of the tropical rainbelt over West Africa, Int. J. Climatol., 29, 673–689, https://doi.org/10.1002/joc.1702, 2009. a
Noel, V., Chepfer, H., Chiriaco, M., and Yorks, J.: The diurnal cycle of cloud profiles over land and ocean between 51° S and 51° N, seen by the CATS spaceborne lidar from the International Space Station, Atmos. Chem. Phys., 18, 9457–9473, https://doi.org/10.5194/acp-18-9457-2018, 2018. a
Pattanaik, D. and Satyan, V.: Fluctuations of tropical easterly jet during contrasting monsoons over India: A GCM study, Meteorol. Atmos. Phys., 75, 51–60, https://doi.org/10.1007/s007030070015, 2000. a
Ramanathan, V., Barkstrom, B. R., and Harrison, E. F.: Climate and the Earth's radiation budget, Phys. Today, 42, 22–32, 1989. a
Rao, B. S., Rao, D. B., and Rao, V. B.: Decreasing trend in the strength of Tropical Easterly Jet during the Asian summer monsoon season and the number of tropical cyclonic systems over Bay of Bengal, Geophys. Res. Lett., 31, https://doi.org/10.1029/2004GL019817, 2004. a, b, c, d, e, f, g
Reitebuch, O.: The spaceborne wind lidar mission ADM-Aeolus, in: Atmospheric physics: Background–methods–trends, 815–827, Springer, https://doi.org/10.1007/978-3-642-30183-4_49, 2012. a
Rennie, M. P., Isaksen, L., Weiler, F., de Kloe, J., Kanitz, T., and Reitebuch, O.: The impact of Aeolus wind retrievals on ECMWF global weather forecasts, Q. J. R. Meteorol. Soc., 147, 3555–3586, 2021. a
Roja Raman, M., Jagannadha Rao, V., Venkat Ratnam, M., Rajeevan, M., Rao, S., Narayana Rao, D., and Prabhakara Rao, N.: Characteristics of the Tropical Easterly Jet: Long-term trends and their features during active and break monsoon phases, J. Geophys. Res.-Atmos., 114, D19105, https://doi.org/10.1029/2009JD012065, 2009. a
Sassen, K., Wang, Z., and Liu, D.: Cirrus clouds and deep convection in the tropics: Insights from CALIPSO and CloudSat, J. Geophys. Res.-Atmos., 114, D00H06, https://doi.org/10.1029/2009JD011916, 2009. a
Sathiyamoorthy, V., Pal, P., and Joshi, P.: Intraseasonal variability of the tropical easterly jet, Meteorol. Atmos. Phys., 96, 305–316, 2007. a
Sokol, A. B., Wall, C. J., and Hartmann, D. L.: Greater climate sensitivity implied by anvil cloud thinning, Nat. Geosci., 17, 398–403, 2024. a
Stoffelen, A., Pailleux, J., Källén, E., Vaughan, J. M., Isaksen, L., Flamant, P., Wergen, W., Andersson, E., Schyberg, H., Culoma, A., Meynart, R., Endemann, M., and Ingmann, P.: The atmospheric dynamics mission for global wind field measurement, Bull. Am. Meteorol. Soc., 86, 73–88, https://doi.org/10.1175/BAMS-86-1-73, 2005. a
Stubenrauch, C. J., Bonazzola, M., Protopapadaki, S. E., and Musat, I.: New cloud system metrics to assess bulk ice cloud schemes in a GCM, J. Adv. Model. Earth Sy., 11, 3212–3234, https://doi.org/10.1029/2019MS001642, 2019. a
Titus, Z.: ALADIN/Aeolus – Wind-cloud interactions dataset, Aeris [data set], https://doi.org/10.25326/746, 2024. a
Titus, Z., Bonazzola, M., Chepfer, H., Feofilov, A. G., Roussel, M.-L., Witschas, B., and Bastin, S.: Demonstrating Aeolus capability to observe wind-cloud interactions, Atmos. Chem. Phys., 26, 443–475, https://doi.org/10.5194/acp-26-443-2026, 2026. a, b, c, d, e
Ye, J., Guo, Y., Wen, Z., Zhao, P., and Huang, S.: Longitudinal oscillation mode of the tropical easterly jet in June: role of precipitation anomalies in Asian monsoon region, Clim. Dynam., 60, 1543–1558, https://doi.org/10.1007/s00382-022-06391-1, 2023. a, b
Zuidema, P.: Convective clouds over the Bay of Bengal, Mon. Weather Rev., 131, 780–798, https://doi.org/10.1175/1520-0493(2003)131<0780:ccotbo>2.0.co;2, 2003. a
- Abstract
- Introduction
- Dataset and Method
- Evolution of wind and clouds over the Indian Region
- Drivers of the Tropical Easterly Jet variations over the Arabian Sea
- Drivers of cirrus cloud cover over the Arabian Sea
- Conclusions
- Appendix A: Complements relative to uncertainties
- Appendix B: Complements relative to ERA5 temperatures and the thermal wind
- Data availability
- Author contributions
- Competing interests
- Disclaimer
- Acknowledgements
- Financial support
- Review statement
- References