
the Creative Commons Attribution 4.0 License.
the Creative Commons Attribution 4.0 License.
 | 23 Oct 2026
Aerosol–cloud interactions influence the climate response to AMOC weakening

Ulrike Lohmann
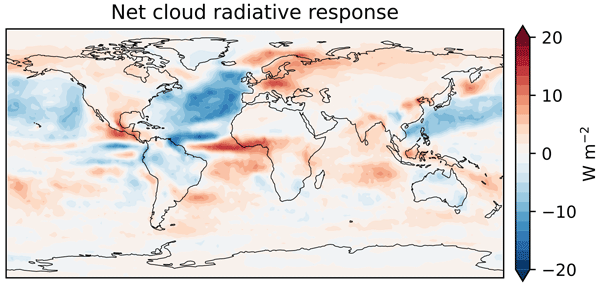
The Atlantic Meridional Overturning Circulation (AMOC) strongly influences regional climate, yet how atmospheric aerosols and aerosol–cloud interactions respond to its weakening remains largely unexplored. Using an aerosol-climate model, we examine how a 60 % AMOC weakening affects aerosols, clouds, and radiation. The weakening drives a hemispheric aerosol redistribution through purely dynamical pathways, increasing the Northern Hemisphere aerosol burden by 41 % through enhanced Saharan dust emissions and longer lifetimes under suppressed wet deposition. Averaged over 40–90° N, in-cloud droplet number increases by 10 % in warm clouds and 11 % in mixed-phase clouds, while enhanced dust ice-nucleating particles raise mixed-phase ice crystal number by 32 %, promoting the Wegener–Bergeron–Findeisen process and reducing mixed-phase total water path by 8 %. A kernel decomposition shows substantial regional cloud radiative responses, particularly over the North Atlantic, but opposing contributions largely cancel in the global mean, leaving a small net cloud radiative response of . This near cancellation reflects subpolar low-cloud brightening offset by optical thinning of mixed-phase and ice clouds, partly driven by dust-induced glaciation, together with opposing tropical cloud changes from the southward ITCZ shift. This small global mean cloud contribution contrasts with previous studies of AMOC weakening, in which cloud changes contribute a net positive radiative feedback on the surface response. Of the cloud, aerosol and surface-albedo contributions diagnosed here, the largest effect comes from the enhanced shortwave reflection by expanded sea-ice and snow cover (−0.83 W m−2), followed by the effective radiative forcing due to dust aerosol–radiation interactions (ERFari, −0.23 W m−2). Combined with the cloud contribution, these terms sum to −0.86 W m−2. This estimate excludes the longwave response to the cooling, including the Planck and lapse-rate responses, which is not decomposed here.
- Article
(10221 KB) - Full-text XML
-
Supplement
(5219 KB) - BibTeX
- EndNote


The Atlantic Meridional Overturning Circulation (AMOC) plays a central role in the global climate system by redistributing vast quantities of heat from the tropics to the North Atlantic (Siedler et al., 2001). Anthropogenic forcing weakens the AMOC by increasing the buoyancy of the upper subpolar ocean, acting through both freshwater and thermal pathways. Rapid Arctic warming and ice melt enhance the freshwater flux into the North Atlantic (Bamber et al., 2018), freshening the upper ocean and thereby suppressing deep water formation (Sévellec et al., 2017). In parallel, greenhouse gas–driven surface warming lowers upper-ocean density directly; indeed, heat flux anomalies, rather than freshwater fluxes, have been identified as the dominant driver of the projected AMOC decline in CMIP6 models (Couldrey et al., 2023). Anthropogenic aerosols act on this thermal pathway with the opposite sign, as their twentieth-century build-up cooled the North Atlantic and is estimated to have offset part of the greenhouse-gas-driven AMOC weakening (Hassan et al., 2021). Through either pathway, sustained buoyancy gain progressively suppresses the sinking branch of the AMOC, and the overturning circulation loses strength (Bakker et al., 2016).
Multiple lines of evidence indicate that the AMOC functions as a tipping element capable of exhibiting hysteresis (Rahmstorf, 1996; Hofmann and Rahmstorf, 2009; Clement and Peterson, 2008; Caesar et al., 2020). A sustained forcing perturbation, such as increased freshwater input, can push the circulation beyond a critical threshold, triggering a transition to a weakened or collapsed state that may persist even after the original forcing is removed. Although the future trajectory of the AMOC remains uncertain (Baker et al., 2025), its potential destabilisation represents one of the most consequential risks to the global climate system (Weijer et al., 2019).
The impacts of a weakening AMOC extend far beyond the Atlantic basin. A reduction in overturning strength attenuates northward heat transport, producing pronounced interhemispheric temperature contrasts and a distinctive warming hole over the subpolar North Atlantic. These thermal anomalies drive a large-scale reorganisation of atmospheric circulation, including a southward shift of the Intertropical Convergence Zone (ITCZ) (Frajka-Williams et al., 2019; Jackson et al., 2022; Ben-Yami et al., 2024). Through global teleconnections, these changes propagate across the climate system, affecting monsoonal rainfall, vegetation distributions, and atmospheric composition (Sandeep et al., 2020; Zickfeld et al., 2008; Vella et al., 2026). Within this cascade of feedbacks, cloud responses remain one of the largest sources of uncertainty (Boucher et al., 2013; Zelinka et al., 2020). Previous studies indicate that AMOC weakening can substantially alter the radiative budget through cloud feedbacks. In the tropics, the southward displacement of the ITCZ drives opposing changes in low- and high-level cloud cover, modulating top-of-atmosphere radiative fluxes (Cheng et al., 2007; Drijfhout, 2015). In the mid-latitudes, a weakened AMOC amplifies meridional sea surface temperature (SST) gradients, potentially strengthening the Northern Hemisphere storm track and enhancing low cloud formation (Trossman et al., 2016). Over the North Atlantic warming hole, cooler SSTs cool the lower troposphere from the surface upward, which increases lower tropospheric stability and strengthens the inversion at the boundary layer top (Fan et al., 2025). A stronger inversion limits the entrainment of warm and dry free tropospheric air and traps moisture within the boundary layer, and low cloud cover increases with inversion strength over subtropical and higher latitude oceans alike (Klein and Hartmann, 1993; Wood and Bretherton, 2006). Coupled models that reproduce the warming hole show this response to AMOC weakening, with a colder, drier and more stable lower troposphere and increased cloud fraction over the subpolar North Atlantic (Fan et al., 2025). The additional low cloud reduces downward shortwave radiation at the surface and thereby amplifies the surface cooling (Zhang et al., 2010; Trossman et al., 2016; Zhang et al., 2019).
Most previous studies have focused primarily on thermodynamic and macrophysical cloud responses, leaving a critical gap in our understanding of how aerosol–cloud interactions shape the climate response to AMOC weakening. Changes in atmospheric circulation and surface wind patterns associated with a weakened AMOC inevitably alter natural aerosol emissions as well as their atmospheric transport and processing. Recent analyses of large-ensemble simulations support this expectation. Allen et al. (2024) isolated the AMOC feedback in CESM1 and showed that AMOC weakening is associated with subpolar North Atlantic cooling, increased low-level cloud cover, raised sea-level pressure over Greenland and Iceland, weakened surface winds, and a reduced sea salt burden. Consistent SST, sea-level pressure, and wind responses have also been found across CMIP6 models (Hassan et al., 2021). These studies, however, diagnose the aerosol response as a feedback within coupled simulations rather than resolving the microphysical pathway from emissions to cloud condensation nuclei and ice-nucleating particles to cloud properties. Understanding the interplay between these microphysical perturbations and the macrophysical cloud response is therefore essential for accurately constraining the radiative impacts of AMOC weakening. In this study, we examine global cloud responses resulting from a 60 % weakening of the AMOC relative to present-day conditions. We employ the ICON-HAM global aerosol–climate model, which explicitly resolves aerosol microphysics, aerosol–cloud interactions, and cloud radiative processes, enabling a self-consistent assessment of how AMOC-driven changes in aerosol distributions propagate into cloud properties and radiative forcing.
2.1 ICON-HAM
ICON-A-HAM2.3 couples the ICOsahedral Non-hydrostatic (ICON) atmospheric general circulation model with the Hamburg Aerosol Module version 2.3 (HAM2.3), providing a global atmosphere–aerosol modelling framework for simulating aerosol processes and their interactions with radiation and clouds (Salzmann et al., 2022). ICON-A denotes the atmosphere component of the ICON Earth system model (Giorgetta et al., 2018; Crueger et al., 2018). The dynamical core solves the non-hydrostatic equations of motion on an icosahedral-triangular Arakawa C grid (Zängl et al., 2015). The physics package originates from the ECHAM6 general circulation model (Stevens et al., 2013) and has been adapted to the ICON framework, with dynamics and physics coupled through a sequential updating approach following a fixed process ordering (Giorgetta et al., 2018).
Aerosol processes are treated using HAM2.3, originally developed within the ECHAM-HAM modelling system (Stier et al., 2005) and subsequently updated by Zhang et al. (2012). HAM simulates the life cycle of five aerosol species: sulfate (SU), black carbon (BC), organic carbon (OC), sea salt (SS), and mineral dust (DU) (Tegen et al., 2019). The aerosol size distribution is represented by the M7 microphysical module (Vignati et al., 2004), which describes the aerosol population as seven interactive lognormal modes, four hydrophilic (nucleation, Aitken, accumulation, and coarse) and three hydrophobic (Aitken, accumulation, and coarse), with prescribed geometric standard deviations but prognostic number median radii. The prognostic variables are the particle number concentration of each mode and the mass concentration of each aerosol compound within that mode. HAM2.3 treats nucleation of sulfate aerosol, condensational growth by gas-phase sulfuric acid, coagulation, as well as emission, transport, and wet and dry deposition (Salzmann et al., 2022). Hydrophobic particles undergo ageing to the hydrophilic population through coagulation with hydrophilic particles or condensation of sulfuric acid (Stier et al., 2005). After each time step, the model redistributes particles among modes to maintain the number median radius within prescribed bounds (Vignati et al., 2004; Stier et al., 2005). Aerosol water uptake is computed within the κ-Köhler framework of Petters and Kreidenweis (2007), as implemented by O'Donnell et al. (2011), and aerosol optical properties are derived from volume-weighted refractive indices and Mie-scattering parameters assuming internal mixing (Stier et al., 2007). Secondary organic aerosol (SOA) formation follows a simplified approach in which approximately 15 % of natural terpene emissions condense immediately onto existing particles at the surface (Dentener et al., 2006; Stier et al., 2005).
The ICON-HAM configuration used here employs a two-moment stratiform cloud microphysics scheme that carries prognostic cloud droplet number concentration (CDNC) and ice crystal number concentration (ICNC) (Lohmann and Roeckner, 1996), with recent improvements documented by Lohmann and Neubauer (2018) and Neubauer et al. (2019). The scheme solves prognostic equations for the mass mixing ratios and number concentrations of cloud droplets and ice crystals, while rain and snow are treated diagnostically (Lohmann and Roeckner, 1996; Lohmann et al., 2007). Cloud droplet activation is parameterised following the Köhler-theory-based approach of Abdul-Razzak and Ghan (2000), which determines the activated fraction as a function of the aerosol size distribution and hygroscopicity provided by HAM, together with the sub-grid updraft velocity. In mixed-phase clouds, mineral dust particles can initiate contact freezing and serve as ice-nucleating particles for immersion freezing (Tegen et al., 2019; Lohmann and Diehl, 2006). Black carbon is also represented as an immersion-freezing INP, although its parameterised efficiency is approximately four orders of magnitude lower than that of dust (montmorillonite). In the cirrus regime (T<235 K), ice forms by homogeneous freezing of solution droplets only. Heterogeneous cirrus nucleation is not enabled in this configuration. Additional microphysical processes include condensation, evaporation, deposition, sublimation, autoconversion of cloud droplets to rain, accretion, aggregation, riming, and aerosol wet scavenging (Neubauer et al., 2019). Fractional cloud cover is diagnosed from relative humidity following Sundqvist et al. (1989). Convective clouds are parameterised using a mass-flux scheme with moisture convergence closure for shallow and mid-level convection and CAPE-based closure for deep convection (Giorgetta et al., 2018).
2.2 Experimental design
The experimental strategy isolates the atmospheric response to an AMOC-weakened ocean state by prescribing sea surface boundary condition perturbations derived from a fully coupled simulation, while holding anthropogenic and biomass-burning emissions fixed. Monthly climatological anomalies in sea surface temperature (ΔSST) and sea ice concentration (ΔSIC) were derived from a fully coupled ocean–atmosphere simulation performed with EC-Earth3 (Döscher et al., 2022), following the protocol of the North Atlantic Hosing Model Intercomparison Project (Jackson et al., 2023). In the EC-Earth3 simulation, the AMOC was weakened by imposing a spatially uniform freshwater flux of 0.3 Sv poleward of 50° N over the Atlantic and Arctic Oceans, applied to a pre-industrial background state. From the resulting 140 year transient integration, two quasi-equilibrated states were identified: a control state with a mean AMOC strength of approximately 17.5 Sv and a weakened state of 7.0 Sv, corresponding to a ∼60 % reduction. The monthly climatological ΔSST and ΔSIC fields were computed as the difference between these two states.
Two ICON-HAM simulations were performed at R2B4 resolution (∼160 km) with 47 vertical levels. Each simulation was initialised on 1 October 1999 and integrated through January 2010; the first three months were discarded as spin-up, yielding 10 years (2000–2009) of analysed output. Both simulations were run in free-running AMIP-style mode without meteorological nudging. The prescribed SST climatology was constructed as a multi-model ensemble mean of year-2015 monthly SSTs from four CMIP6 models run under SSP5-8.5 (CESM2, AWI-CM-1-1MR, HadGEM3-GC31-MM, and GFDL-CM4), remapped to the ICON R2B4 grid and repeated as a perpetual annual cycle. The Control simulation used this unperturbed climatology, while the Hosing simulation superimposed the EC-Earth3-derived ΔSST and ΔSIC anomalies onto the same fields (Fig. 1). All anthropogenic and biomass-burning emissions were held fixed at perpetual 2015 levels throughout the integration, so that any changes in the distributions of these species arise solely from altered transport and removal rather than from emission changes. Natural dust and sea salt emissions, in contrast, are computed interactively and respond to the simulated meteorology, and it is through this pathway that AMOC-driven dynamical changes perturb the natural aerosol burden. All other boundary conditions were identical between the two experiments.
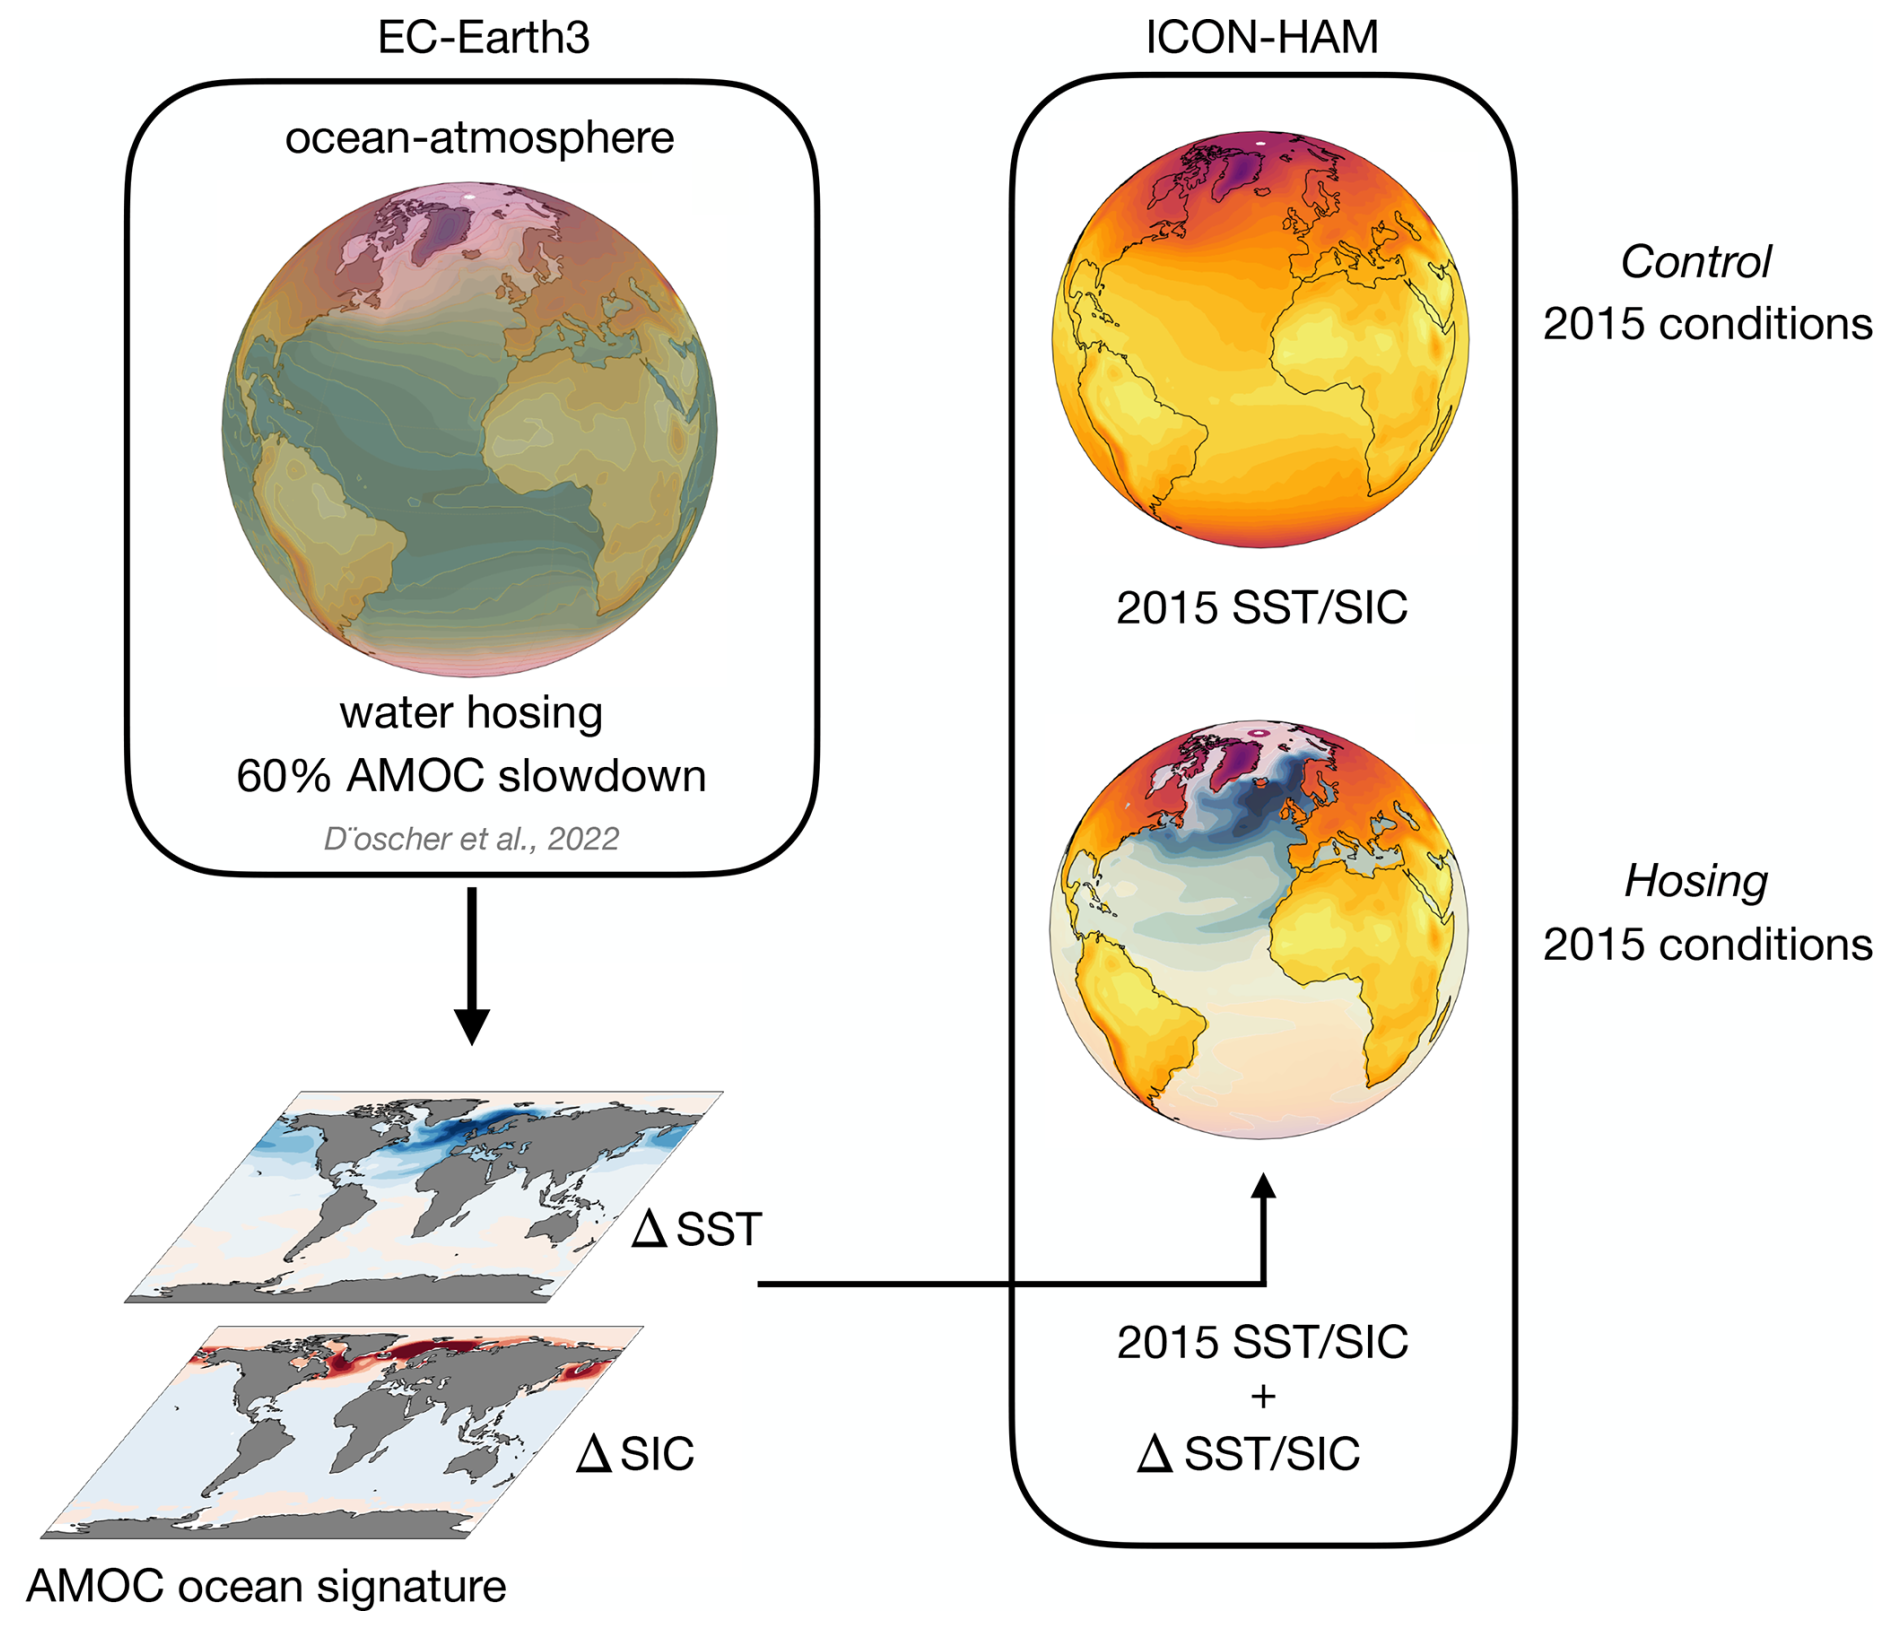
Figure 1Schematic overview of the experimental design. Anomalies in sea surface temperature (ΔSST) and sea ice concentration (ΔSIC) are derived from a fully coupled EC-Earth3 freshwater-hosing simulation that produces an approximately 60 % reduction in AMOC strength. These ocean surface anomalies are superimposed on the present-day (2015) SST and SIC climatology to force the Hosing experiment, while the Control simulation uses the unperturbed climatology. In both ICON-HAM simulations, only the ocean surface conditions are prescribed, whereas the atmosphere and the land surface temperature evolve freely in response to the imposed ocean state, together with the interactive dust and sea salt emissions. The land runs in the jsbach_lite configuration, with vegetation phenology and albedo held at climatology. Adapted from Vella et al. (2026).
Ozone concentrations were prescribed from the CMIP6 historical climatology (Hegglin et al., 2016). Greenhouse gas mixing ratios (CO2, CH4, N2O, CFCs) followed the CMIP6 historical dataset (Meinshausen et al., 2017), and solar irradiance was prescribed from the CMIP6 solar forcing dataset (Matthes et al., 2017). Stratospheric volcanic aerosol optical properties followed Stenchikov et al. (1998). Anthropogenic and biomass-burning emissions of BC, OC, SO2, and DMS were prescribed from the ACCMIP dataset (Lamarque et al., 2010), interpolated to 2015 using the RCP4.5 scenario (Thomson et al., 2011). Continuous and explosive volcanic degassing emissions followed the AEROCOM climatology (Dentener et al., 2006). Dust (Tegen et al., 2002; Cheng et al., 2008) and sea salt (Long et al., 2011) emissions are computed interactively. Land surface processes were represented by JSBACHv4 (Reick et al., 2021) in its “jsbach_lite” configuration, which employs climatological phenology and a simplified vegetation albedo with interactive carbon assimilation and terrestrial carbon cycling both disabled.
The climate response to AMOC weakening extends well beyond the direct thermodynamic imprint of North Atlantic cooling. As the large-scale atmospheric circulation reorganises in response to the altered meridional temperature gradient, surface wind patterns, precipitation regimes, and soil moisture distributions adjust accordingly. These dynamical changes influence the emission, transport, and removal of natural aerosol species, thereby reshaping the atmospheric aerosol burden, even in the absence of changes in anthropogenic emissions. In this section, we quantify the climate response, aerosol redistribution, and associated cloud impacts under a 60 % AMOC slowdown relative to present-day conditions.
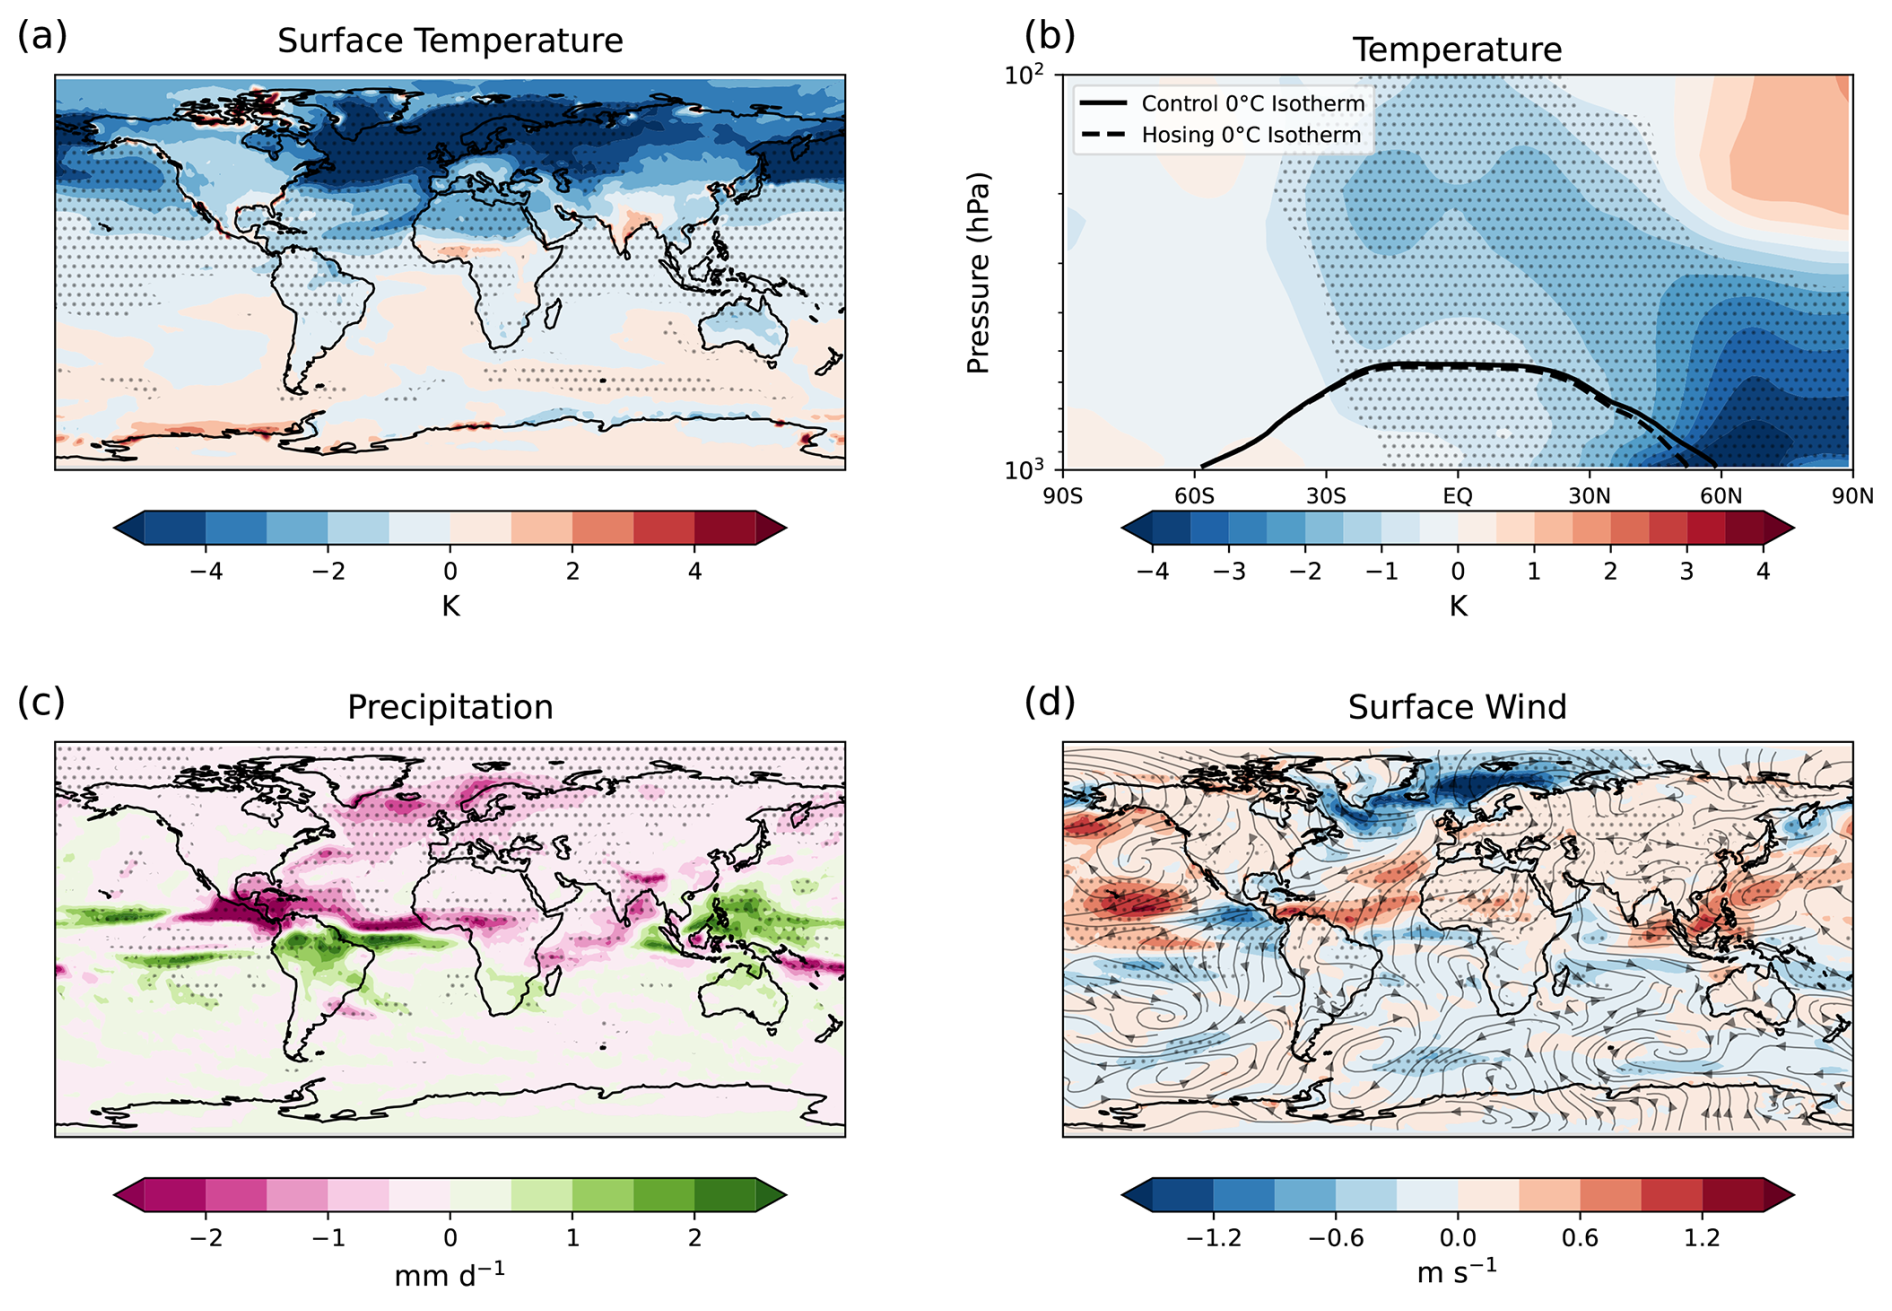
Figure 2Annual mean climate response to freshwater hosing. (a) surface temperature anomalies, (b) zonal mean vertical temperature anomalies, (c) precipitation anomalies, and (d) surface wind speed and direction anomalies. Anomalies are calculated as the Hosing experiment minus the Control. In panel (b), the solid black line indicates the 0 °C isotherm for the Control simulation, while the dashed black line indicates the 0 °C isotherm for the Hosing simulation. Stippling indicates regions where the difference is statistically significant at the 95 % confidence level (p<0.05).
3.1 Climate response
The freshwater hosing and subsequent 60 % reduction in AMOC strength produce a pronounced hemispheric temperature asymmetry (Fig. 2a). Surface temperatures are reduced by more than 4 K over the subpolar North Atlantic, with statistically significant cooling extending zonally across much of the Northern Hemisphere mid-latitudes. Averaged over the Northern Hemisphere, surface temperature decreases by ∼2.4 K, nearly twice the global-mean cooling of ∼1.2 K. The EC-Earth3 hosing simulation from which our boundary conditions are derived exhibits a strong response, with the AMOC weakening by 10.5 Sv, from 17.5 to 7.0 Sv (Sect. 2.2). This lies at the strong end of the spread across the eight CMIP6-class models of the North Atlantic Hosing Model Intercomparison Project (Jackson et al., 2023), in which the magnitude of the weakening under the same 0.3 Sv uniform hosing scales with the control-state circulation, i.e., models with weak control AMOCs (11–12 Sv) weaken by 5–6 Sv, whereas those with the strongest controls (16–18 Sv) weaken by 10–11 Sv. The strong EC-Earth3 response is thus consistent with its comparatively strong control state rather than anomalous forcing sensitivity. A comparable hemispheric asymmetry, of the same sign but smaller amplitude, is found by Bellomo and Mehling (2024) for the ∼7 Sv AMOC weakening in their abrupt 4×CO2 EC-Earth3 experiment, with the stronger cooling here reflecting both the greater weakening magnitude and the present-day rather than warmed background climate state.
The vertical structure of this thermal perturbation is illustrated by the zonal-mean temperature anomalies (Fig. 2b). Cooling originates near the surface at high northern latitudes, where reduced SSTs and expanded sea ice (Fig. S1 in the Supplement) suppress turbulent heat fluxes into the boundary layer (Fan et al., 2025). This cold anomaly propagates upward through the lower and middle troposphere and extends southward, shifting the annual-mean surface 0 °C isotherm from ∼58 ° N in the Control simulation to ∼51 ° N under hosing (roughly 761 km southward). A localised warming signal is evident above 60° N near 200 hPa, likely reflecting changes in eddy heat flux convergence or storm-track dynamics associated with the shifted meridional temperature gradient. Meanwhile, pronounced surface cooling at high northern latitudes, combined with comparatively modest cooling aloft, increases atmospheric stratification in the lower troposphere. This vertical temperature structure, in which boundary-layer cooling enhances static stability, favours the persistence of stratiform cloud layers over the subpolar North Atlantic (Zhang et al., 2010; Fan et al., 2025), with direct consequences for the cloud response discussed in Sects. 3.3 and 3.4.
The altered meridional thermal gradient drives a fundamental reorganisation of the hydrological cycle (Fig. 2c). Global-mean precipitation decreases by , but the reduction is strongly concentrated in the Northern Hemisphere (). The zonal-mean precipitation profiles (Fig. S2) reveal that the NH mid-latitude rain band weakens considerably under hosing, while the SH storm track remains largely unchanged. The strongest drying is concentrated over the North Atlantic, as well as most of western Europe (Fig. 2c). In the tropics, the anomalies exhibit a characteristic dipole with reduced rainfall north of the equator and enhanced rainfall to the south (Fig. S2b), confirming a southward displacement of the ITCZ. This meridional shift represents a dynamical adjustment of the Hadley circulation that transports energy northward across the equator, partially compensating for diminished oceanic heat transport (Frajka-Williams et al., 2019; Jackson et al., 2022; Ben-Yami et al., 2024). Over South Asia, the monsoon response is characterised by a decline in precipitation, driven by diminished cross-equatorial moisture transport and a southward displacement of the ITCZ (Sandeep et al., 2020; Vella et al., 2026). The extent of this reduction, however, differs markedly among models. For instance, Ben-Yami et al. (2024) demonstrate that Indian Summer Monsoon rainfall decreases by up to an order of magnitude across four state-of-the-art Earth System Models. In this context, the response simulated by ICON-HAM is comparatively weak.
The surface wind response (Fig. 2d) reflects the altered pressure gradients associated with the cooled North Atlantic. Over the subpolar North Atlantic, wind speeds decrease by more than 1.2 m s−1 as the surface cooling raises local sea-level pressure and weakens the prevailing westerlies. Conversely, winds strengthen over the subtropical North Atlantic and western Sahara, where the steepened meridional temperature gradient between the cooled mid-latitudes and the comparatively unchanged tropics enhances low-level flow (Orihuela-Pinto et al., 2022).
3.2 Aerosol redistribution
Although anthropogenic emissions remain constant across both simulations, the dynamical changes described in Sect. 3.1 drive a substantial spatial redistribution of the global aerosol burden. The yearly mean aerosol burden (Fig. 3a) increases by more than 300 mg m−2 over the Sahara and tropical North Atlantic, driven primarily by enhanced dust mobilisation under stronger surface winds (Fig. 2d). The zonal-mean burden (Fig. 3b) peaks at near 15–20° N and tapers off sharply south of the equator.
The species-resolved zonal-mean Aerosol Optical Thickness (AOT) (Fig. 3d) shows that dust accounts for the largest contribution. Dust emissions from the Sahara increase by 81.0 (+56.0 %), and the resulting plume extends westward over the subtropical North Atlantic via the Saharan Air Layer. Globally, the total aerosol column burden increases by 19.6 mg m−2 (+38.0 %). This change is almost entirely confined to the Northern Hemisphere, where the mean burden increases by 37.5 mg m−2 (+41.0 %), while the Southern Hemisphere exhibits a slight increase of 1.7 mg m−2 (+14.4 %). The vertical extent of the aerosol perturbation is illustrated by the zonal-mean particulate matter concentration (Fig. 3e) and extinction coefficient at 550 nm (Fig. 3f). The largest PM increases, exceeding 13 µg m−3, are concentrated in the tropical lower troposphere between 0–20° N below 800 hPa. The extinction field shows a broader pattern of enhancement, extending from the tropical boundary layer through much of the troposphere at 20–50° N.
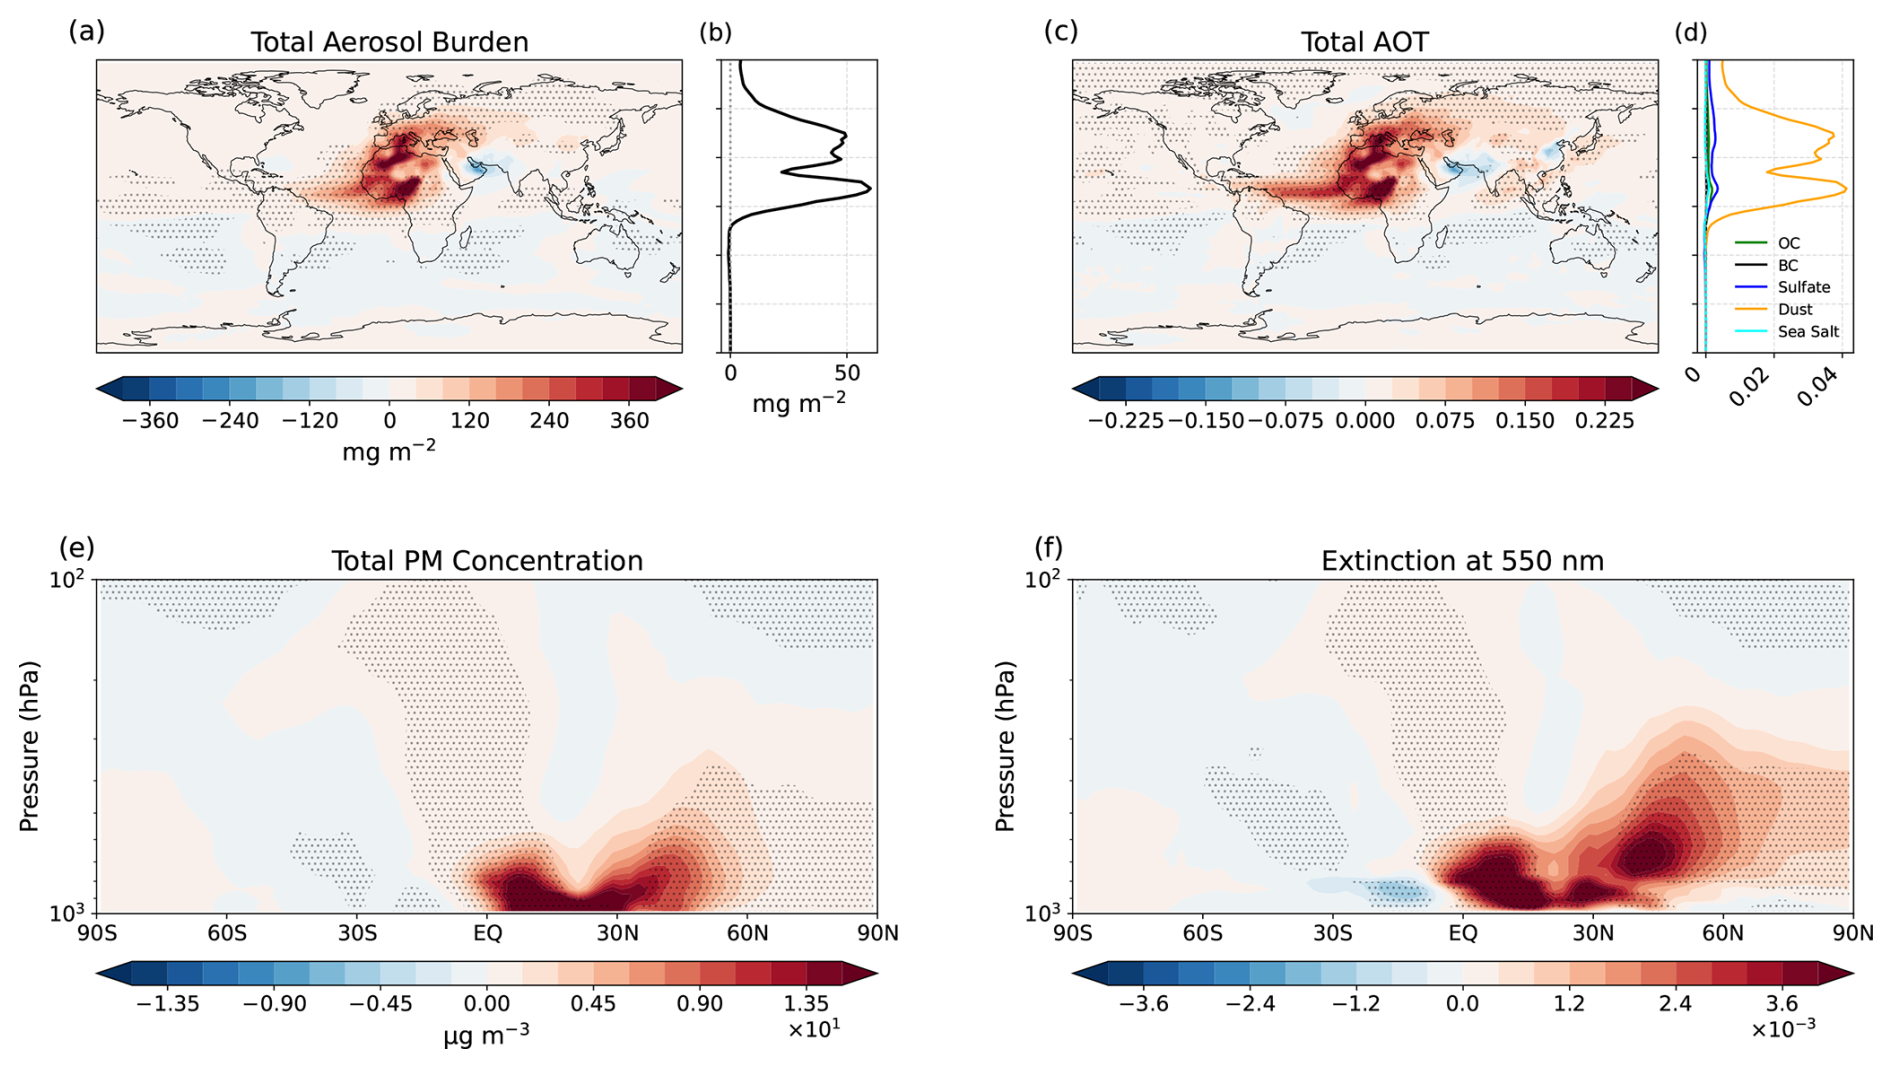
Figure 3Aerosol response to 60 % AMOC slowdown. (a) Global map of differences in Total Aerosol Burden. (b) Zonal mean of the Total Aerosol Burden differences corresponding to panel (a). (c) Global map of differences in Total Aerosol Optical Thickness (AOT) at 550 nm. (d) Zonal mean differences in AOT at 550 nm separated by individual aerosol components: Organic Carbon (OC), Black Carbon (BC), Sulfate, Dust, and Sea Salt. (e) Zonal mean latitude-pressure cross-section of differences in Total particulate matter (PM) concentration. (f) Zonal mean latitude-pressure cross-section of differences in aerosol Extinction at 550 nm. Stippling indicates regions where the difference is statistically significant at the 95 % confidence level (p<0.05).
The enhanced Saharan dust export is consistent with the palaeoclimate record, although palaeo-dust variability cannot be attributed to AMOC weakening alone, since it also reflects glacial cooling more generally. Speleothem and marine sediment reconstructions show that elevated Saharan dust fluxes coincide with periods of weakened AMOC and increased latitudinal temperature gradients (Cruz et al., 2021; Williams et al., 2016). Two features of the record point to an AMOC-specific contribution beyond the glacial background state. Dust deposition off West Africa and in the Eastern Mediterranean peaks abruptly during Heinrich stadials and the Younger Dryas, millennial-scale intervals of AMOC disruption embedded within otherwise similar background climates, with the Younger Dryas maximum occurring against deglacial warming (Ehrmann et al., 2017). Moreover, the underlying mechanism operates through the interhemispheric temperature asymmetry, southward ITCZ displacement, and weakening of the West African monsoon (Mulitza et al., 2008; Collins et al., 2013), a fingerprint specific to reduced cross-equatorial heat transport rather than to global-mean cooling, being the same chain of responses that drives the dust increase in our simulations. During Heinrich events, when the AMOC weakened to near collapsed states estimated at roughly 80 %–90 % reductions based on kinematic proxies (McManus et al., 2004), dust deposition rates increased two to fivefold above glacial background levels (Ehrmann et al., 2017). The 56 % increase in Saharan dust emissions simulated here is considerably smaller than these palaeo-reconstructed enhancements, consistent with the partial nature of the imposed weakening (60 % versus near collapse) and the present-day background climate state, which features weaker meridional temperature gradients and more vegetated North African margins than during glacial conditions (Mahowald et al., 1999; Tegen et al., 2002). In our simulations the attribution to AMOC weakening holds by construction, since only the AMOC-derived SST and sea-ice anomalies differ between the experiments. The palaeo record therefore serves as qualitative corroboration of the mechanism rather than as the attribution itself.
Sea salt shows the opposite tendency. Over the subpolar North Atlantic, sea-salt emissions decrease by ∼63 % and the column burden by ∼60 %, driven by the pronounced surface cooling (−5.2 K) and weaker 10 m winds (−4.8 %) that reduce wind- and temperature-dependent production. The source region considered here remains ice-free in both simulations, so the sea-ice expansion documented in Fig. S1 plays no role in this reduction. However, the global-mean change is small (−3 % burden), as global sea salt is dominated by the Southern Ocean and trade-wind belts (Fig. 3d).
The increase in water-soluble aerosol burden despite fixed precursor emissions reveals a second, complementary mechanism. Suppressed Northern Hemisphere rainfall reduces wet scavenging efficiency, extending the atmospheric residence time of the numerous fine sulfate and carbonaceous particles. This is evident in the aerosol number wet deposition field (Fig. S3a), which is broadly negative across the Northern Hemisphere, showing that fewer particles are removed per unit time. The aerosol mass wet deposition field (Fig. S3b) follows two controls. Where precipitation decreases most, mass wet deposition decreases too, by 27 % over the subpolar North Atlantic and by 20 % over the Arabian Sea and India, and by 36 % over the Sahara, where the reduced rainfall outweighs the larger dust burden. Downstream of the regions of increased aerosol burden, mass wet deposition increases by 65 % over eastern Europe and western Russia and by 56 % over the Atlantic and Africa just south of the equator, where the southward-shifted rain band meets the dust plume. In the Northern Hemisphere mean the burden increase dominates, and mass wet deposition increases by ∼12 %. The longer aerosol lifetime under suppressed rainfall is a precipitation-mediated mechanism that is well established in single-forcing experiments (e.g., Croft et al., 2009) and has recently been assessed in the context of AMOC weakening and air quality (Vella et al., 2026).
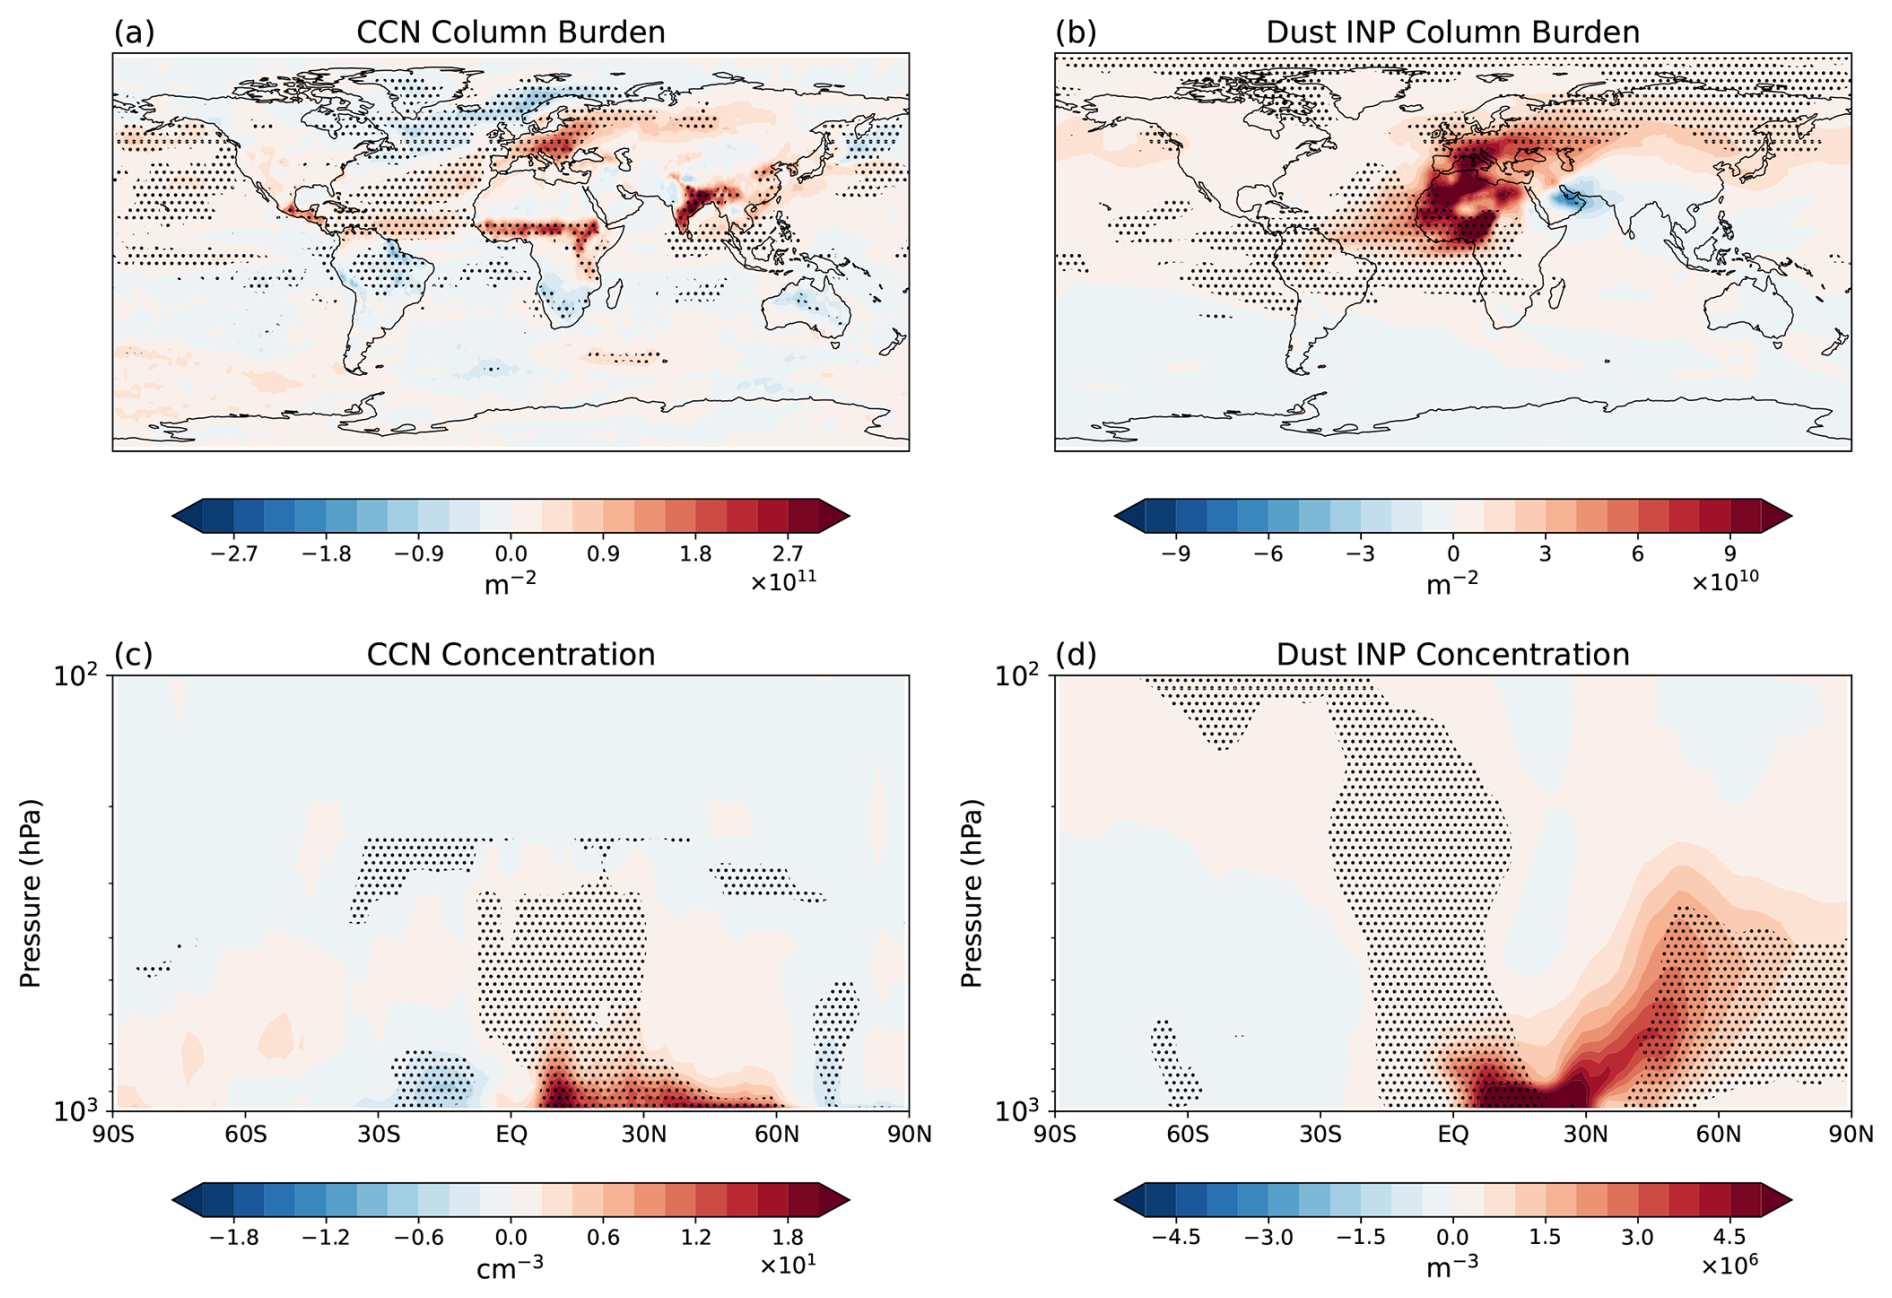
Figure 4(a) Global map of differences in CCN column burden. (b) Global map of differences in dust INP column burden. (c) Zonal mean latitude-pressure cross-section of differences in CCN Concentration. (d) Zonal mean latitude-pressure cross-section of differences in dust INP concentration. Stippling indicates regions where the difference is statistically significant at the 95 % confidence level (p<0.05).
The aerosol redistribution directly alters the availability of cloud condensation nuclei (CCN) and ice-nucleating particles (INPs). The CCN column burden (Fig. 4a) shows an increase over the mid-Atlantic Ocean, while further north in the Atlantic, CCN column burden decreases. The vertical cross-section (Fig. 4c) confirms that CCN concentrations increase throughout the lower and middle troposphere between the equator and ∼40° N, with the largest enhancements below 800 hPa in the NH tropics. The dust INP column burden (Fig. 4b) shows a more spatially confined response, with increases concentrated over North Africa, Europe, and the tropical North Atlantic. The vertical distribution (Fig. 4d) reveals that dust INP concentrations increase primarily in the lower troposphere between 10–30° N, where the Saharan dust plume is most prominent.
3.3 Cloud response
3.3.1 Cloud cover and water path
The AMOC-induced changes in temperature, circulation, and aerosol loading produce a complex pattern of cloud changes in all cloud levels (Fig. 5). The low cloud response (Fig. 5a) is dominated by a broad increase of over the North Atlantic, with locally significant anomalies exceeding +12 %. The surface cooling discussed in Sect. 3.1 enhances lower-tropospheric stability over the open ocean, suppressing vertical mixing and favouring the formation and persistence of stratiform cloud decks. Large-eddy simulations by Schneider et al. (2019) demonstrate that stratocumulus persistence depends critically on lower-tropospheric stability and cloud-top radiative cooling, and that perturbations to these controls can trigger abrupt transitions in cloud regime. In our simulations, the AMOC-induced surface cooling acts in the stabilising direction, reinforcing stratocumulus formation and stability. This pattern is in agreement with Fan et al. (2025), who find a colder, drier and more stable lower troposphere with increased cloud fraction over the subpolar North Atlantic under AMOC weakening in CMIP6 historical simulations, and with Zhang et al. (2019), who link cooler North Atlantic SSTs to increased cloud fraction and liquid water path through enhanced lower-tropospheric stability.
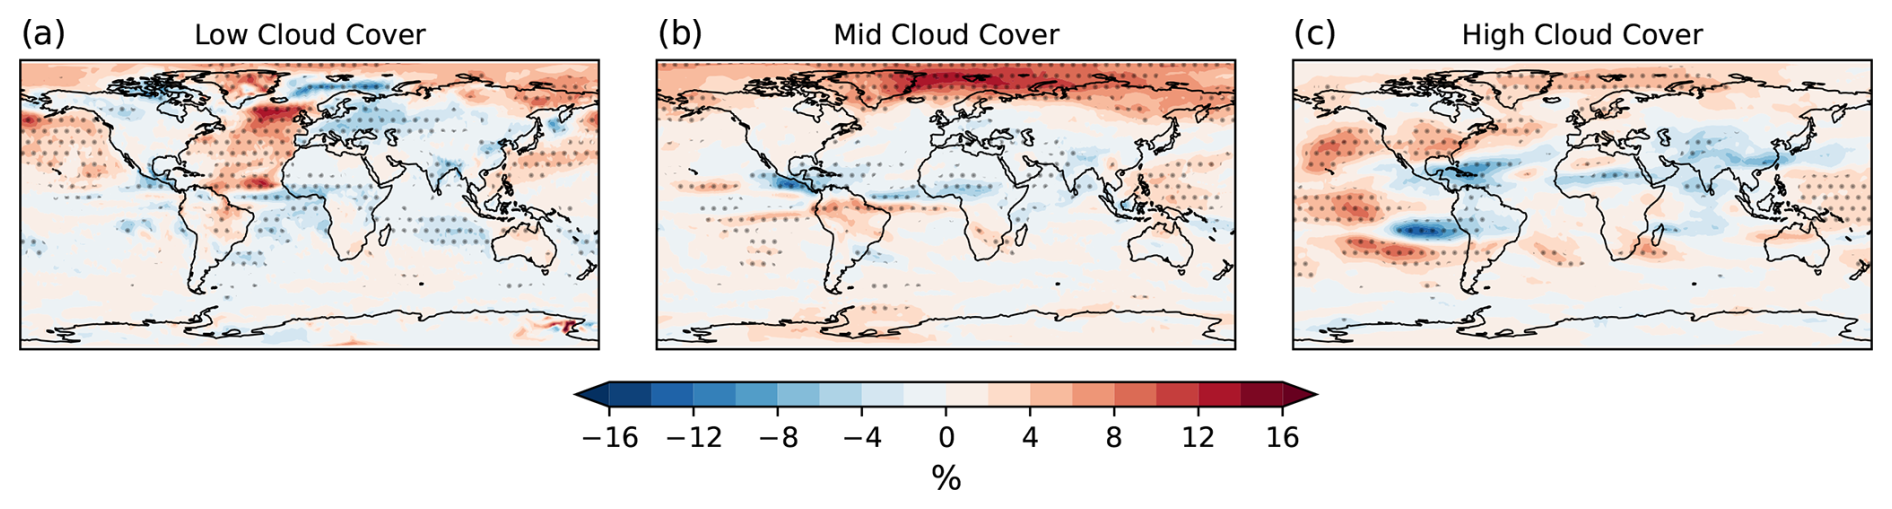
Figure 5Global maps of differences in (a) Low Cloud Cover (surface to 680 hPa), (b) Mid Cloud Cover (680–440 hPa), and (c) High Cloud Cover (above 440 hPa). Stippling indicates regions where the difference is statistically significant at the 95 % confidence level (p<0.05).
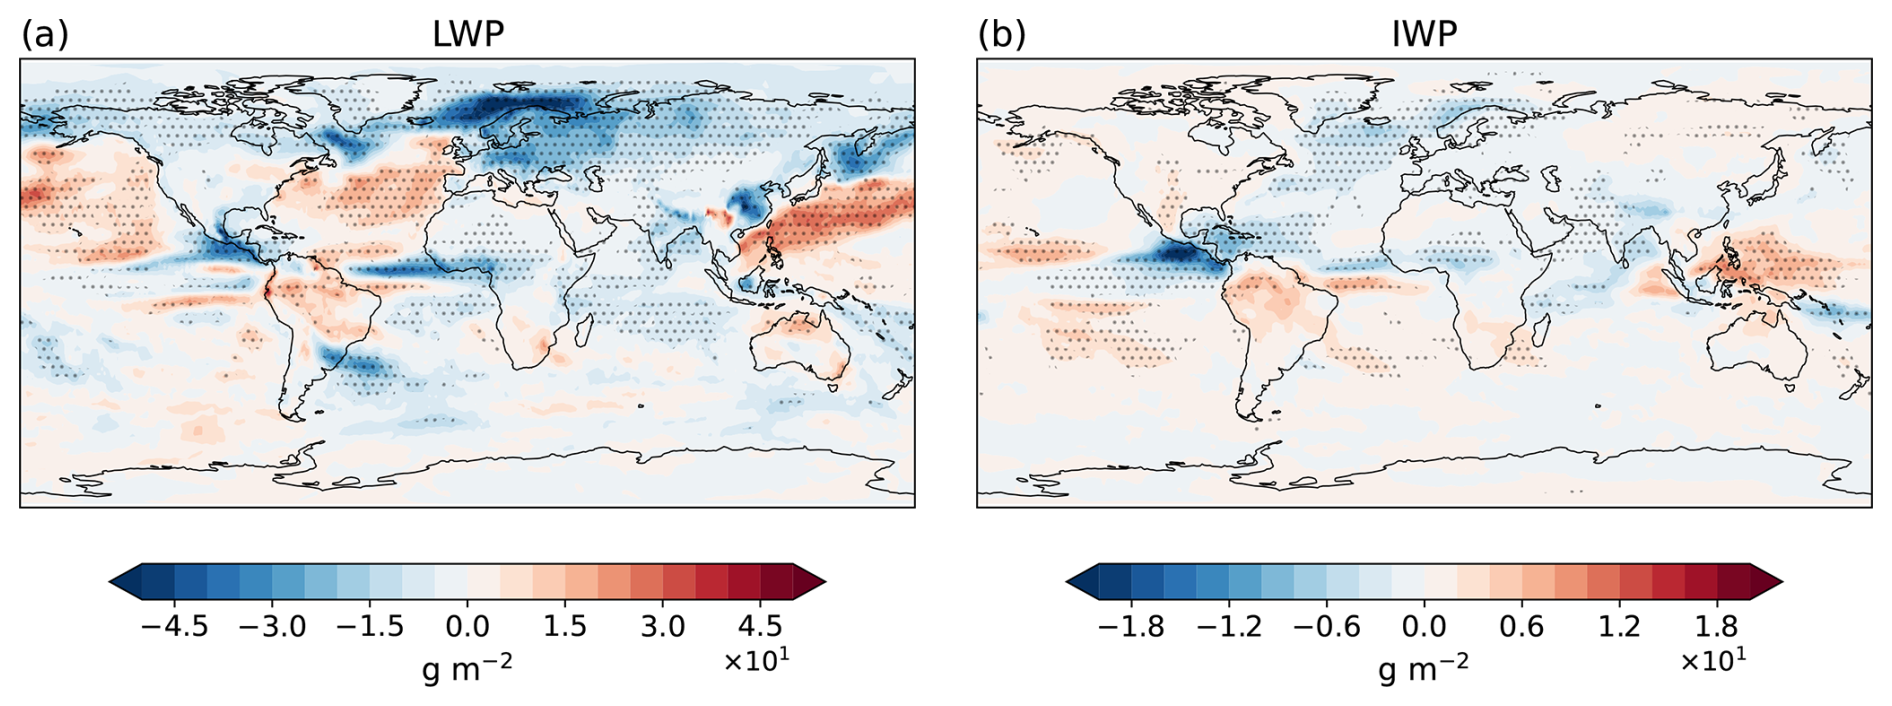
Figure 6Changes in (a) liquid water path (LWP), (b) ice water path (IWP). Stippling indicates regions where the differences are statistically significant at the 95 % confidence level (p<0.05).
Mid-level cloud cover (Fig. 5b) increases by up to 9 %–13 % over the subpolar North Atlantic and Nordic Seas, with the anomaly extending into northern Europe. In the tropics, the mid-cloud response displays a distinct meridional dipole, with decreases of north of the equator and increases of similar magnitude to the south, reflecting the southward ITCZ displacement discussed in Sect. 3.1. High cloud cover (Fig. 5c) decreases by over the Caribbean, the eastern equatorial Pacific, and a band extending from tropical North Africa across southern Asia, and increases by a comparable amount over the southern tropical Atlantic, the Maritime Continent, and the off-equatorial central Pacific. At higher latitudes, high cloud cover increases over parts of northern Europe and the subpolar North Atlantic. The increase in high cloud cover at these latitudes likely reflects enhanced frontal cloud production associated with the strengthened meridional SST gradient and baroclinicity, consistent with the dynamically generated upper-level cloud identified in the Arctic diagnostics below.
The tropical cloud dipole at multiple levels is a robust feature of AMOC weakening experiments. Zhang et al. (2010) demonstrated that AMOC-induced surface cooling increases low cloud cover over the North Atlantic through atmospheric stabilisation, while the southward ITCZ shift produces opposing cloud changes between the hemispheres that amplify the tropical precipitation response. Similar multi-level cloud changes following AMOC decline have been reported across a range of coupled models (Liu et al., 2020; Bellomo and Mehling, 2024).
Previous studies of AMOC weakening have emphasised the increase in low cloud cover and LWP over the North Atlantic (Zhang et al., 2010; Trossman et al., 2016; Zhang et al., 2019; Fan et al., 2025). Our simulations reproduce this response, but Fig. 6 shows that it is a local exception within a much broader loss of cloud water. Over the mid-latitude Atlantic and Pacific oceans, LWP increases by up to over the North Atlantic and over the North Pacific, collocated with the enhanced low cloud cover in these regions (Fig. 5a). The colder and more stable lower troposphere that Fan et al. (2025) find over the subpolar North Atlantic under AMOC weakening is consistent with this stratiform cloud increase, although they do not diagnose LWP. Poleward of these increases, however, total water path (TWP, the sum of LWP and IWP) decreases over 82 % of the area north of 40° N, by 11.6 % on average and by about a third over the Nordic and Barents Seas. The loss is almost entirely liquid and is largest over the Arctic and continental Eurasia, where surface cooling reduces the moisture available for liquid-phase cloud formation (Fig. 6a). These decreases matter radiatively, because thinner clouds reflect less sunlight. They coincide with the largest positive values of the optical depth component of the cloud radiative response (Sect. 3.4), which opposes the cooling from the increased cloud amount. In the tropics, the LWP anomalies mirror the southward shift of the ITCZ, with reductions north of the equator and increases to the south. The ice water path (Fig. 6b) decreases over the North Atlantic. Over the tropical and subtropical North Atlantic, the IWP reduction causes the loss of high cloud cover associated with the southward ITCZ shift (Fig. 5c). Over the subpolar North Atlantic, by contrast, IWP decreases even though mid- and high-level cloud cover increases (Fig. 5b and c), so that ice-containing clouds become more frequent but carry less condensate. This decoupling of cloud occurrence from cloud condensate is examined in detail for the Arctic below. Increases in IWP are evident over the southern tropical Atlantic, tropical Pacific, and Maritime Continent, tracking the southward-shifted deep convective activity. The opposing LWP and IWP responses over the North Atlantic, with increased liquid water but decreased ice water, are physically coherent with the enhanced lower-tropospheric stability documented in Sect. 3.1, which favours shallow liquid-phase stratiform clouds at the expense of deeper ice-producing convective clouds (Zhang et al., 2010).
Over the Arctic, the increase in mid- and high-level cloud cover is not accompanied by an IWP increase, because cloud occurrence and cloud condensate are governed by different controls. At mid-levels (440–680 hPa), relative humidity rises by 2.2 percentage points even though specific humidity falls (). This occurs because surface cooling lowers the saturation vapour pressure faster than it removes absolute moisture, pushing the air closer to saturation. The higher RH triggers additional cloud formation through the Sundqvist diagnostic scheme, increasing mid- and high-level cloud cover, but the reduced absolute moisture leaves less water available to condense within each cloud, so that the liquid and ice water paths (LWP and IWP) decrease rather than increase. At upper levels (above 440 hPa), cloud fraction increases despite a slight RH decrease (−0.3 percentage points), indicating that the additional cloud is generated dynamically through enhanced frontal lifting under the strengthened meridional temperature gradient, rather than thermodynamically. Underlying both regimes, Arctic-mean surface evaporation weakens by 0.23 mm d−1 as expanding sea ice reduces the open-ocean moisture source, limiting condensate supply at all levels. Conditional in-cloud diagnostics (poleward of 60° N) confirm this decoupling. Cloud fraction increases at every level, while in-cloud condensate falls by 1.0 g m−2 for mid- and high-level IWP and 51.7 g m−2 for low-level LWP. This suggests that more clouds form, but each holds less water.
3.3.2 Microphysical pathways
The TWP decreases in Fig. 6 have two possible causes. The first is the reduced moisture supply under the colder, more ice-covered surface described above. The second is an aerosol pathway through the ice phase, which previous studies of AMOC-induced cloud changes (Trossman et al., 2016; Zhang et al., 2019; Fan et al., 2025; Drijfhout, 2015) have not considered. To isolate it, we bin cloud properties over 40–90° N by in-cloud temperature and by cloud-top temperature using daily instantaneous model output over the full 10 year period (Fig. 7). Comparing clouds within the same thermal environment removes much of the spatial covariance between thermodynamic regime shifts and aerosol perturbations, so that the remaining changes in cloud microphysical properties can be attributed more directly to the aerosol perturbation.
The central result lies in the mixed-phase regime (0 to −35 °C). Dust INP concentrations there increase by 27.2 %, in-cloud ICNC rises by 32.1 %, and the additional ice crystals grow at the expense of supercooled droplets through the Wegener–Bergeron–Findeisen (WBF) process. As a result, mixed-phase clouds hold 8.1 % less water and become optically thinner, contributing to the positive optical depth term of the cloud radiative response (Sect. 3.4). The quantity that links these microphysical changes to the radiative response is the total water path (Fig. 7d), the mean condensate loading per cloud within each cloud-top temperature (CTT) regime. Clouds with the coldest tops can carry the most water because they span a deep atmospheric column, as in deep convective systems near −70 °C, whereas optically thin cirrus carry far less. The other two regimes respond differently. Warm clouds (CTT>0 °C) gain 6.4 % in TWP through suppressed autoconversion, and cold clouds (CTT ) lose 15.0 % for thermodynamic reasons unrelated to aerosol. Shading in Fig. 7 denotes ±2 standard errors of the mean, and the envelopes are narrow owing to the large gridpoint-level sample size. The following paragraphs give the evidence for each regime, starting with the mixed-phase regime.
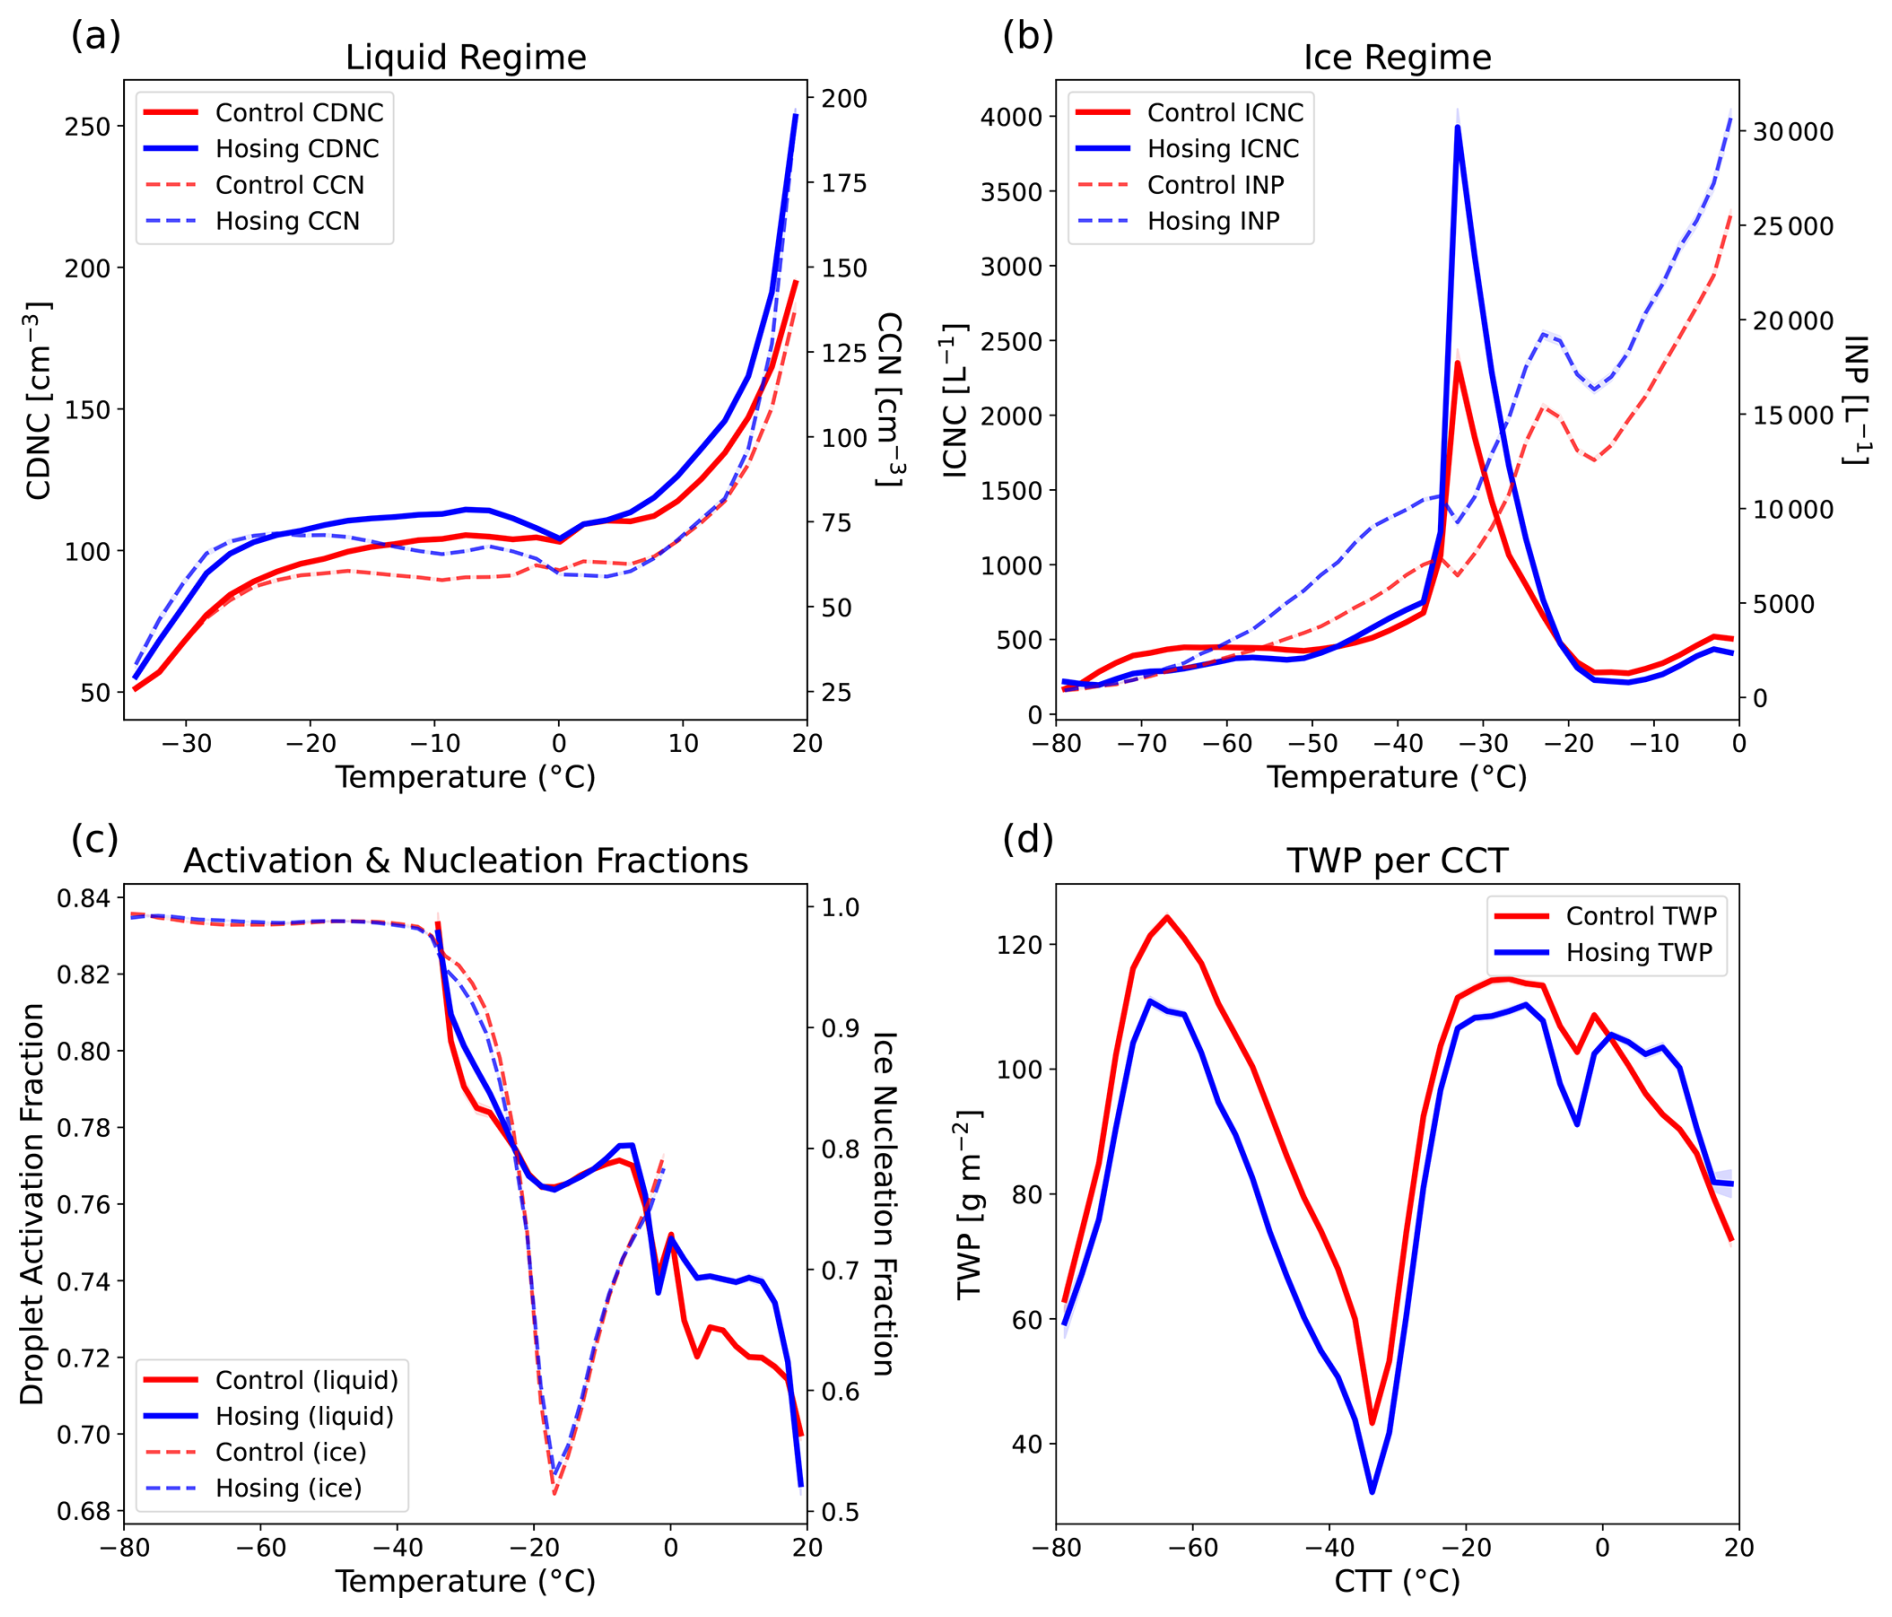
Figure 7In-cloud microphysical properties as a function of temperature over 40–90° N, derived from daily instantaneous output. (a) Cloud droplet number concentration (CDNC, solid lines, left axis, cm−3) and cloud condensation nuclei concentration (CCN, dashed lines, right axis), diagnosed as the aerosol number activated by the activation scheme at the supersaturation reached in each cloud, as a function of temperature in the liquid cloud regime. (b) Ice crystal number concentration (ICNC, solid lines, left axis) and ice nucleating particle concentration (INP, dashed lines, right axis) as a function of temperature in the ice cloud regime. (c) Droplet activation fraction (solid lines, left axis) and ice nucleation fraction (dashed lines, right axis) as a function of temperature. (d) Total water path (TWP) sorted by cloud-top temperature (CTT). In all panels, red lines denote the Control simulation and blue lines denote the Hosing simulation. Shading denotes ±2 standard errors of the mean.
In the mixed-phase regime, the aerosol perturbation reaches the clouds primarily through the ice phase. Dust INP concentrations increase by 27.2 % and in-cloud ICNC increases by 32.1 % (Fig. 7b). Besides the larger INP supply, ICNC could also increase if ice crystals were removed more slowly. In the parameterisation of Lohmann and Diehl (2006), the freezing efficiency per INP increases primarily with supercooling, and Fig. 7 compares the two simulations at the same in-cloud temperature, which removes this dependence. The ICNC increase closely following the INP increase suggests that the ice number is set primarily by the enhanced supply. The enhanced ice number intensifies the WBF process (Korolev, 2007), where more crystals compete for water vapour and deplete supercooled droplets. This depletion is evident in the droplet numbers of Fig. 7a. In the mixed-phase regime, CCN increase by 20.4 % but in-cloud CDNC rises by only 11.3 %, so a substantial part of the newly activated droplets is lost to the ice phase via the WBF process. Removal by the ice phase is fast, since ice crystals grow rapidly by deposition to precipitation sizes and fall out as snow, whereas removal by the liquid phase is slow, since the small supercooled droplets rarely reach raindrop sizes. The WBF process moves condensate from the slow liquid pathway to the fast ice pathway, so glaciated clouds lose their condensate faster and the mixed-phase TWP decreases by 8.1 %.In warm clouds, CCN concentrations increase by 7.9 % while the droplet activation fraction changes little (+1.6 %, Fig. 7a and c). The CCN accumulate because of weaker wet removal rather than stronger sources. Anthropogenic and biomass burning emissions are fixed, the subpolar sea salt source weakens, and dust is emitted into the insoluble modes (Tegen et al., 2019), entering the soluble population only through coagulation with hydrophilic or hydrophobic particles, or condensation of sulfuric acid (Sects. 2.1 and 3.2). Wet deposition of aerosol number indeed declines across the domain (Fig. S3a), which lengthens aerosol residence times. It also shifts the soluble population toward the accumulation mode, where particles activate at critical supersaturations well below those of the Aitken mode, since the critical supersaturation decreases with particle size (Petters and Kreidenweis, 2007). The properties of the accumulation mode particles themselves change little, with a slight growth in size offset by a decrease in hygroscopicity, leaving their critical supersaturation essentially unchanged. The CCN enhancement therefore arises because more particles reach and survive in the activating size range, not because particles become easier to activate. Activation is further controlled by the sub-grid updraft velocity. We find that the in-cloud sub-grid updraft increases over the mid-latitudes and is essentially unchanged over the subpolar North Atlantic, adding a secondary dynamical contribution to the activation increase. The in-cloud CDNC increases by 9.9 %, slightly more than the CCN. At fixed liquid water content, more droplets are individually smaller and collide less efficiently, which suppresses autoconversion to rain (Albrecht, 1989; Khairoutdinov and Kogan, 2000). Suppressed autoconversion removes fewer droplets, explaining the excess of the CDNC over the CCN response, and converts less cloud water to precipitation, increasing the warm-cloud TWP by 6.4 %.
In the cirrus regime, aerosols play no direct role, since heterogeneous nucleation is not enabled for cirrus in this ICON-HAM configuration and ice formation is governed by homogeneous freezing of solution droplets. Consistently, cirrus ICNC does not follow the 52.3 % increase in dust INP but instead decreases by 7.1 %. The decrease itself is dynamically driven and reflects a reorganisation of the cirrus population. Greater lower tropospheric stability under hosing suppresses the deepest convective towers, and the distribution of cold cloud tops changes accordingly (Fig. S4), with the pronounced Control peak near −70 °C flattened and the population mean shifted toward warmer values. Since homogeneous freezing decreases with increasing temperature, fewer crystals nucleate at warmer temperatures, which lowers the regime-mean ICNC. Any weakening of the ascent accompanying the suppressed towers acts in the same direction, as the number of ice crystals formed in a homogeneous freezing event increases strongly with the updraft velocity (Kärcher and Lohmann, 2002), although the vertical velocity at cirrus levels has not been diagnosed here. This causes the 15.0 % cold-cloud TWP reduction, visible in Fig. 7d where the Hosing curve falls below the Control between approximately −40 and −60 °C, as the colder upper troposphere holds less water vapour and the shallower cloud columns hold less integrated condensate.
3.4 Radiative effects
The cloud radiative effect (CRE, Fig. 8) gives a first, regional view of the radiative consequences of these cloud changes. The SW CRE (Fig. 8a) becomes more negative across the subpolar and mid-latitude North Atlantic, where low and mid-level cloud cover increases (Fig. 5a and b) and the elevated CDNC raises cloud optical thickness. SW CRE is positive over the tropical Atlantic and Caribbean, where the southward ITCZ shift reduces cloud cover. It is also positive over the Arctic, partly through clear sky masking by the expanded sea ice (Fig. S1, see below) and partly because low cloud is lost along the sea-ice margins as the ice removes the open-ocean moisture source (Fig. 5a), consistent with findings by Lee et al. (2024). The LW CRE (Fig. 8b) is weaker and negative over tropical Africa, South Asia, and the tropical North Atlantic, where the ITCZ shifts and reduced high cloud cover (Fig. 5c) decreases longwave trapping. The net anomaly (Fig. 8c) is therefore negative over the North Atlantic and positive over the tropical Atlantic and the Arctic. The global mean net CRE anomaly (Fig. 8) amounts to , but because the CRE also responds to clear-sky changes, its interpretation and the attribution to genuine cloud changes are deferred to the kernel analysis below.
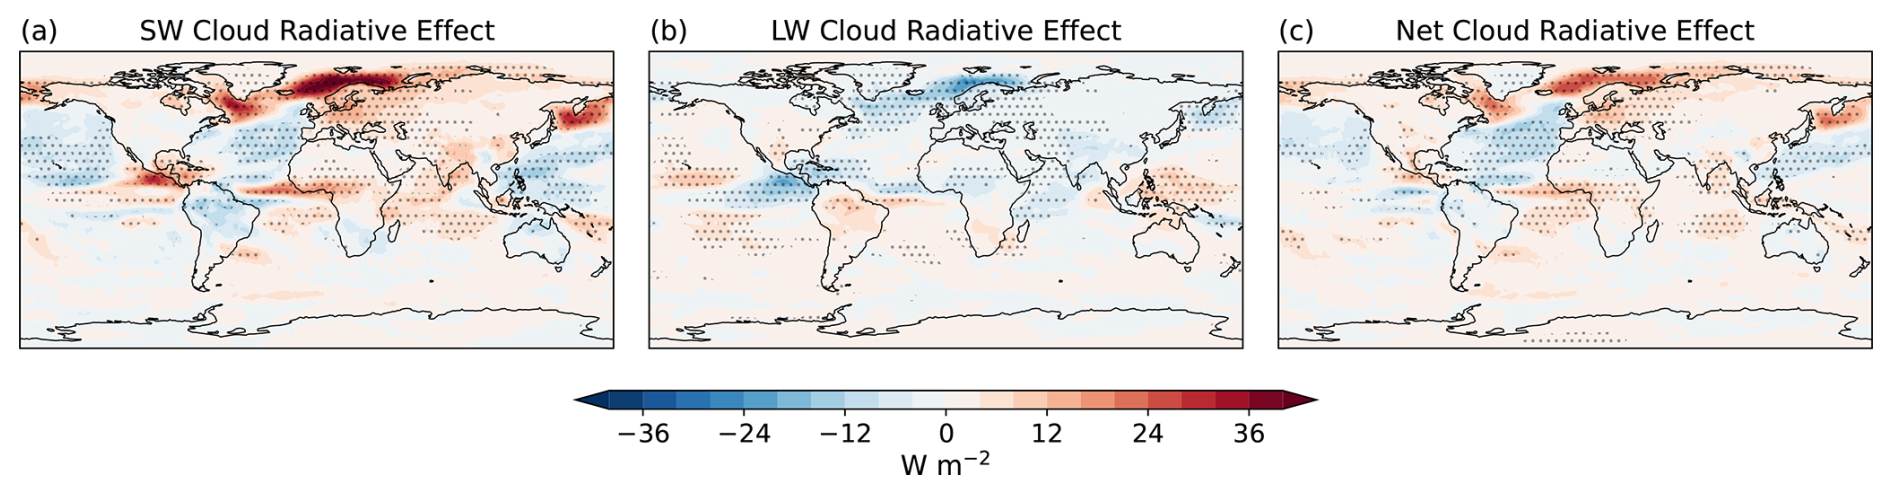
Figure 8Global maps of the difference (Hosing–Control) in (a) shortwave (SW), (b) longwave (LW), and (c) net cloud radiative effect. Stippling indicates regions where the difference is statistically significant at the 95 % confidence level (p<0.05).
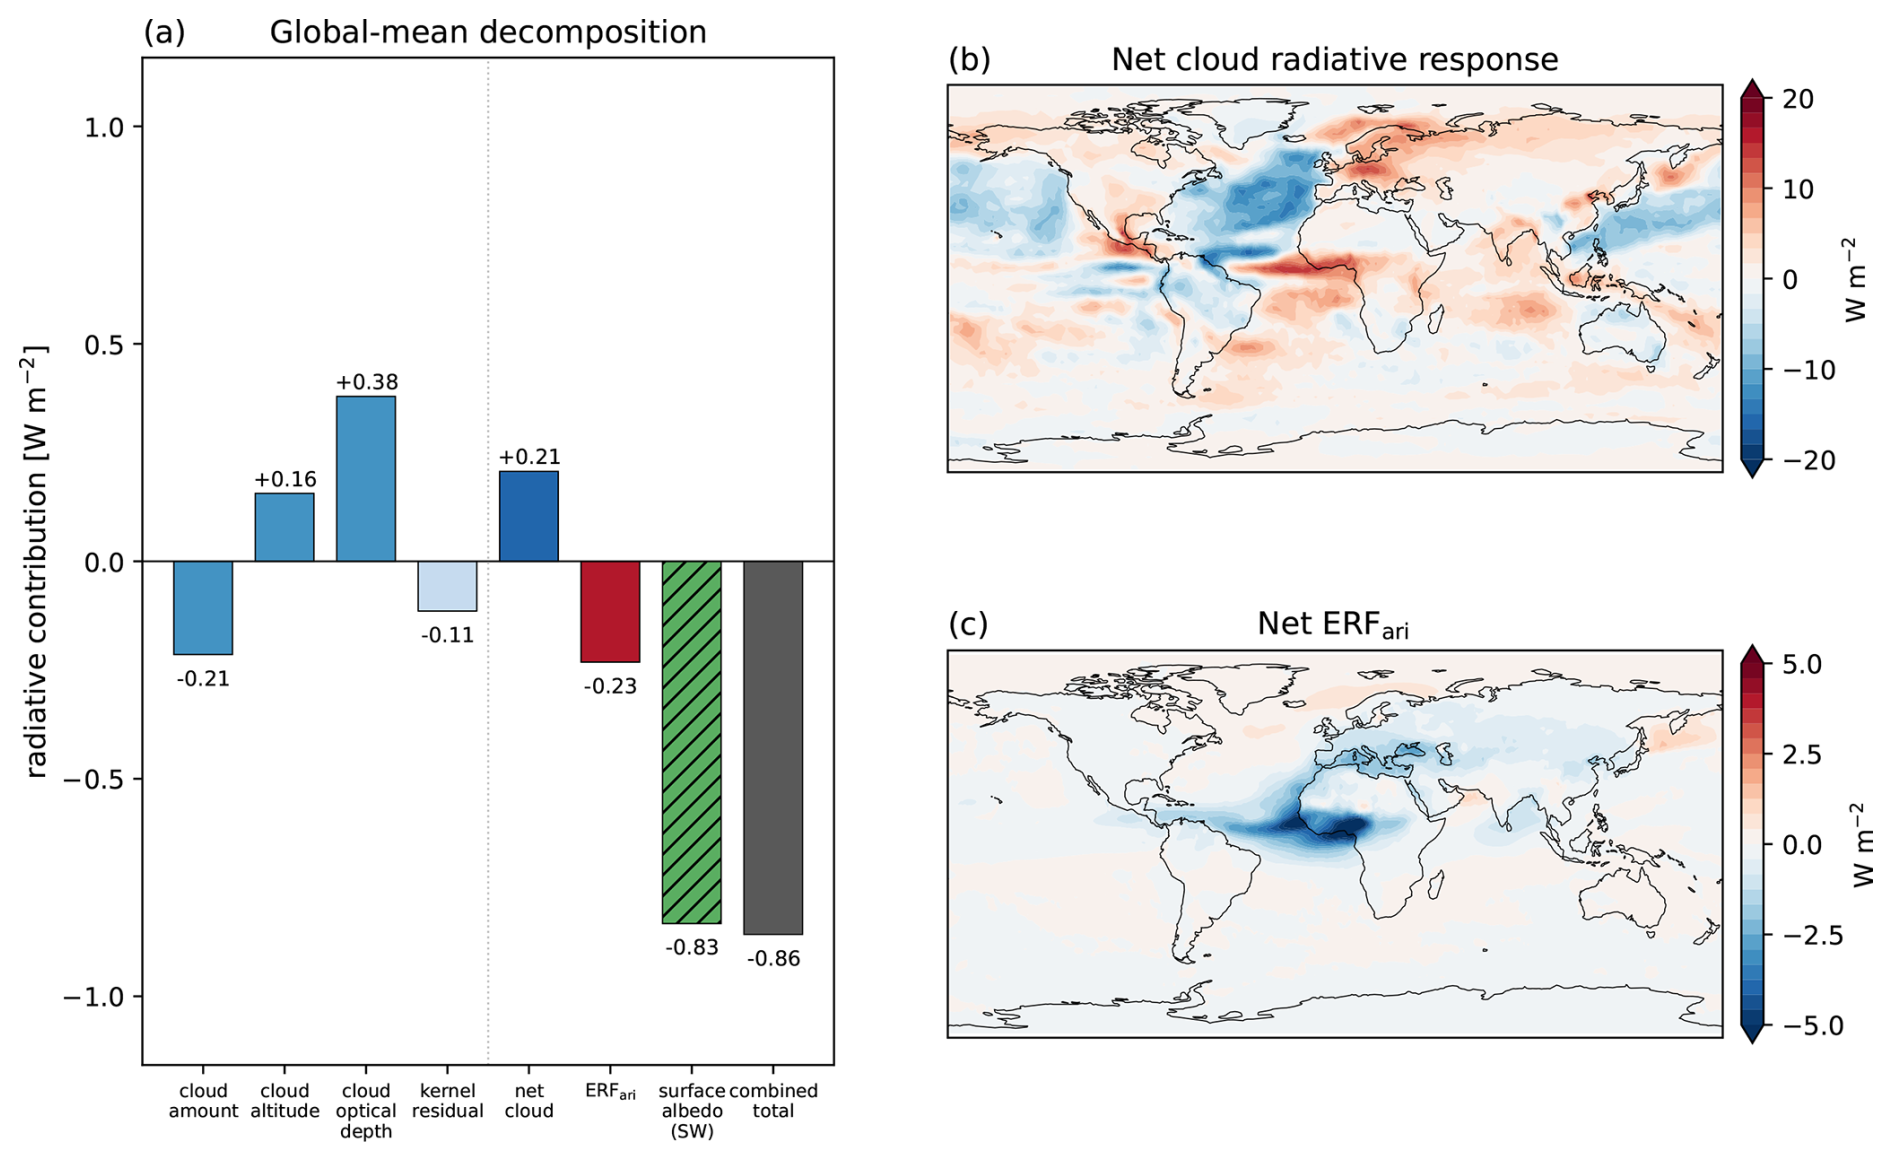
Figure 9Kernel-corrected decomposition of the top-of-atmosphere radiative response to AMOC weakening (Hosing–Control). (a) Global mean cloud radiative response decomposed into cloud amount, cloud altitude and cloud optical depth components and the kernel decomposition residual, shown alongside the net effective radiative forcing due to aerosol–radiation interactions (ERFari), the surface albedo term (shortwave only), and their combined total. (b) Map of the net cloud radiative response. (c) Map of the net ERFari.
To separate the effect of the cloud changes from this masking, we apply ISCCP simulator cloud radiative kernels (Zelinka et al., 2012a, b) to the simulated cloud top pressure and optical depth histograms (Fig. 9a). We refer to the resulting cloud term as the cloud radiative response, the change in top of atmosphere radiation due to clouds (W m−2). It includes cloud changes driven by both the meteorological and the aerosol response to the imposed sea surface temperature and sea ice anomalies. Because these surface conditions are prescribed, the cloud changes cannot amplify or damp the surface cooling that drives them, so the term describes a response rather than a feedback. Decomposed this way, the global mean net cloud radiative response is . The largest term is an optical depth reduction (), which results from the loss of condensate in the mixed phase and cold cloud regimes (Sect. 3.3) and the reduced occurrence of the deepest convective tops; together these outweigh the brightening from increased CDNC in warm clouds. The cloud altitude term () is dominated by its longwave component because (a) the amount weighted mean cloud top pressure slightly increases in the global mean, and (b) it results from the small residual of the large cross equatorial dipole tied to the southward ITCZ shift (Fig. 5c), with rising tops and enhanced longwave trapping over the southern tropics, sinking tops over the northern tropics and subtropics, and a further positive contribution from rising tops at high northern latitudes, with the zonal contributions being an order of magnitude larger than their global mean. These warming contributions are partly offset by the radiative effect of the increased cloud amount () and by a decomposition residual (), which represents joint changes in cloud-top pressure and optical depth that the separate amount, altitude and optical depth terms cannot capture.
The kernel decomposition also clarifies how the positive global mean CRE anomaly calculated in Fig. 8c () should be interpreted. Because CRE is the difference between all sky and clear sky radiation, it also responds to clear sky changes that are unrelated to clouds. Here the expanded sea ice and snow cover and the enhanced dust burden both increase clear sky reflection, part of which is hidden beneath clouds in the all sky flux, so both project onto the CRE as a positive anomaly even where clouds are unchanged. Only of the is a genuine change in cloud radiative properties. The remainder () is clear-sky masking, and it comes mainly from the surface albedo change, since the ERFari accounts for only of it.
Excluding the deep convective bins (high cloud top, high optical depth) from the kernel decomposition reduces the global-mean shortwave cloud contribution from +0.50 to while the net contribution weakens from +0.21 to but remains positive. These bins therefore contribute in the shortwave and in the longwave, with a net loss of cloud fraction from the optically thick, high-topped part of the histogram, consistent with the reduced occurrence of the coldest cloud tops (Fig. S4) and the reduced high cloud cover over the tropical North Atlantic and Caribbean (Fig. 5c). The deep convective regime thus carries strongly compensating shortwave and longwave changes and accounts for more than half of the small net cloud contribution, while the remaining cloud population contributes only .
The shortwave surface albedo contribution is isolated with the approximate partial radiative perturbation (APRP) method (Taylor et al., 2007), and the effective radiative forcing due to aerosol–radiation interactions (ERFari, Fig. 9c) is diagnosed from a double, aerosol free radiation call. Among the isolated cloud, aerosol and surface albedo contributions, two robust and dynamically forced cooling terms dominate. The larger is the surface albedo response (), of which arises from the AMOC-driven expansion of subpolar sea ice and from an increase in Northern Hemisphere continental snow cover as the land surface cools. The second is the ERFari (, Fig. 9c), driven by the enhanced Saharan dust burden. Together with the modest positive cloud radiative response (), these yield a combined radiative contribution of , a cooling that reinforces rather than offsets the surface cooling induced by AMOC weakening. This combined value quantifies only the channels driven by clouds, aerosols and surface albedo. It excludes the longwave response to the cooling of the surface and atmosphere. Outgoing longwave radiation decreases by 2.0 W m−2 in the global mean, more than the 1.12 W m−2 decrease in absorbed shortwave radiation, so that the net downward flux at the top of the atmosphere increases by 0.89 W m−2. With prescribed sea surface temperature and sea ice, this longwave response follows largely from the imposed cooling rather than feeding back on it.
To test whether these terms capture the simulated shortwave response, we compare their sum with the simulated change in top of the atmopshere (TOA) shortwave radiation (Table S1 in the Supplement). The kernel cloud term, the APRP surface albedo term and the shortwave ERFari together account for 55 % of the global mean change (). Most of the remainder is the reduced shortwave absorption in the colder, drier clear atmosphere, which we estimate with APRP from the aerosol-free fluxes of the double radiation call and attribute mainly to water vapour (). Including it leads to a closure of 85 %. The remaining is close to the difference between the kernel and APRP estimates of the shortwave cloud term (+0.50 and ), which is concentrated along the expanded sea-ice edge poleward of 40° N (Table S1), where the shortwave kernel is evaluated with the control surface albedo. Both estimates give a small positive shortwave cloud contribution, much smaller than the surface albedo term.
A small global mean should not be mistaken for a weak response. The microphysical changes of Sect. 3.3 produce large regional cloud radiative anomalies (Fig. 9b) through the competing effects of cloud brightening, mixed phase glaciation, and changes in cloud amount and cloud top height. Over the subpolar North Atlantic, the net cloud contribution is a strong cooling, with an area mean of about and local values reaching . By contrast, the cloud cover decreases over the tropical Atlantic and Caribbean that accompany the southward shift of the ITCZ (Figs. 5 and 8) produce a warming of similar magnitude but of opposite sign. Clouds therefore shape the regional radiative response while contributing little to its global mean.
This regional cloud response is consistent with previous studies of AMOC weakening. Across the subpolar and midlatitude North Atlantic, where low clouds increase and associated cloud brightening extends well beyond the subpolar warming hole (Fig. 5a) into the midlatitudes and subtropics, the resulting shortwave cooling reinforces the surface cooling, in agreement with Zhang et al. (2010); He et al. (2017); Trossman et al. (2016); Lin et al. (2019); Hahn et al. (2025); Fan et al. (2025).
The present study adds an ice phase pathway to this picture. The enhanced Saharan dust acts as ice-nucleating particles in mixed-phase clouds, promoting glaciation and the WBF process that thins these clouds. This dust driven thinning is one of the contributions to the optical depth term in Fig. 9a. Isolating its share from the thermodynamic and dynamical contributions would require an additional hosing experiment with INP concentrations held at control values, which is beyond the present design. The pathway requires interactive dust ice nucleation coupled to prognostic cloud microphysics. The cited studies examined the macrophysical and thermodynamic cloud response to AMOC weakening, in most cases with models that prescribe aerosol as a fixed climatology, and none of them assessed an aerosol contribution.
The kernel decomposition attributes the cloud contribution to an optical depth reduction but cannot say in which clouds it occurs, because its terms are defined in cloud top pressure and optical depth space rather than in temperature regimes. To locate the thinning in temperature space, we bin the CRE of cloudy columns by cloud top temperature (Figs. S5 and S6). Since the cloud top temperature is fixed within a bin and only cloudy columns enter the average, a weaker shortwave cooling in a bin means that clouds of that type have become optically thinner, independently of how often they occur. The shortwave cooling weakens for all tops between about −65 and 0 °C, i.e., in mixed-phase clouds and in all but the coldest ice clouds, and changes only marginally for warm clouds. The weakening is largest near −35 °C, where Fig. 7 shows the largest TWP loss and the largest ICNC increase over 40–90° N.
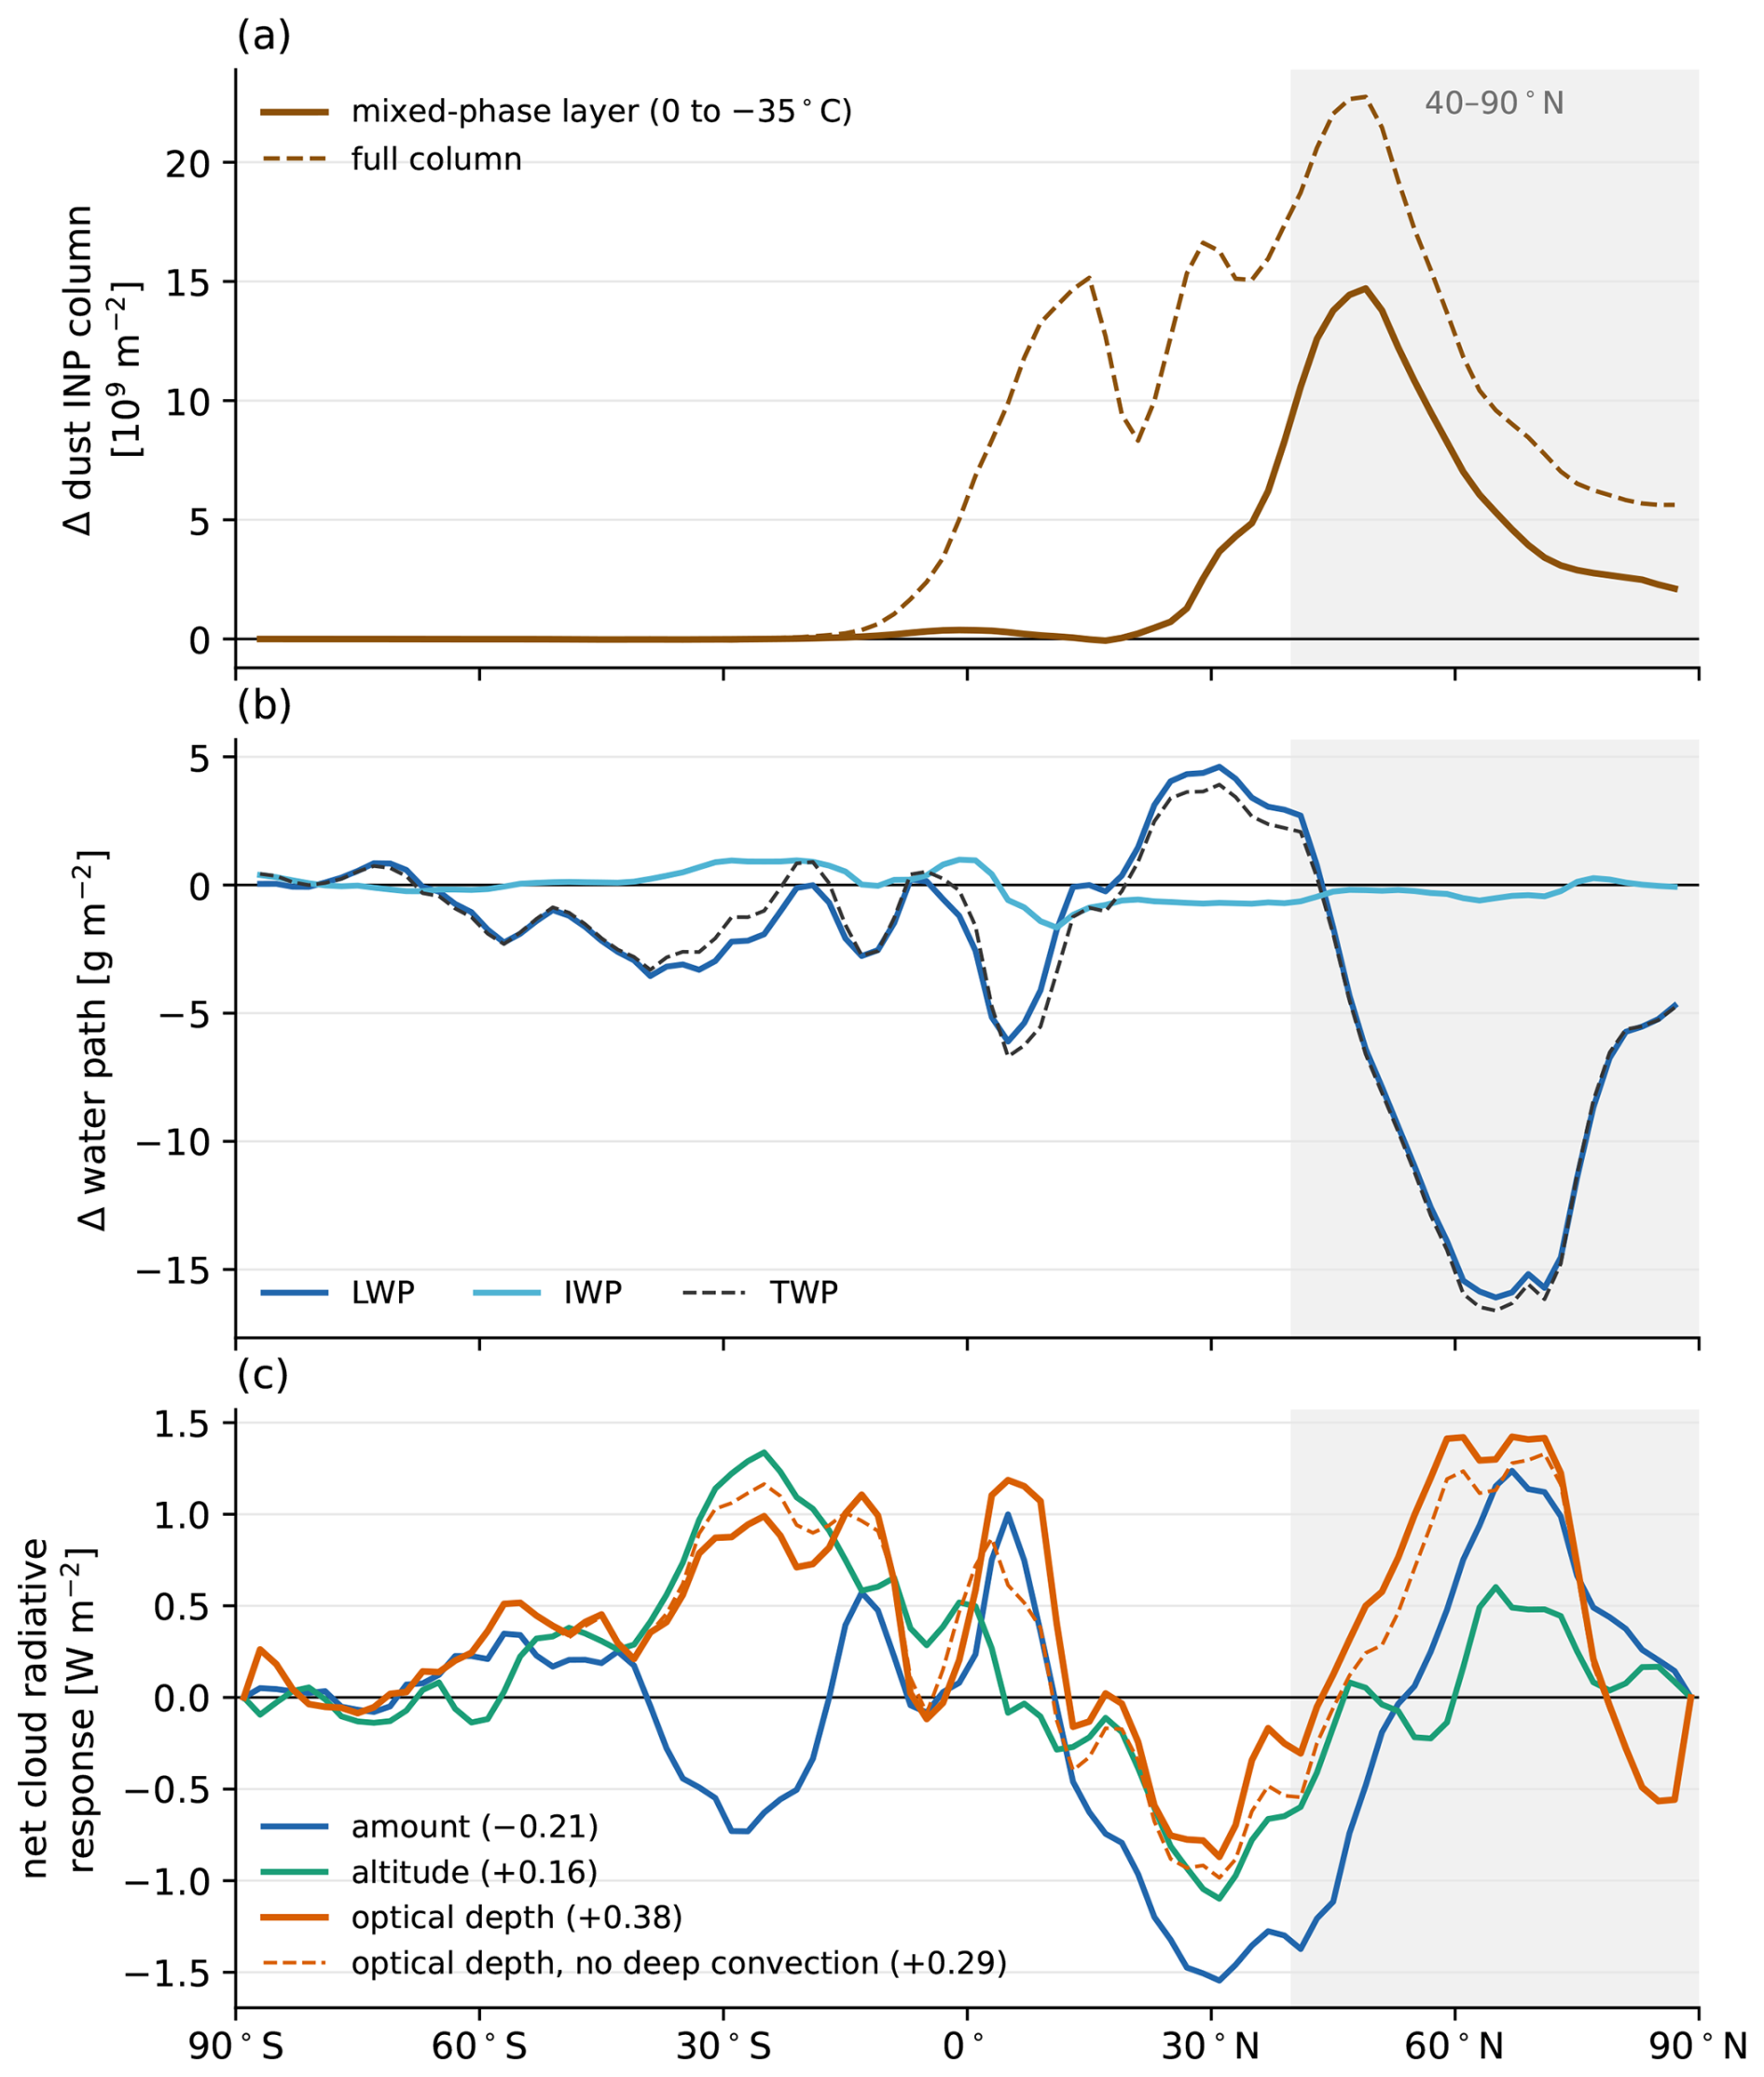
Figure 10Zonal means (Hosing–Control) of (a) the dust INP column in the mixed-phase layer, where the control annual mean temperature lies between 0 and −35 °C (solid), and over the full column (dashed), (b) liquid, ice and total water path, and (c) the net cloud amount, altitude and optical depth components of the cloud radiative response, with the optical depth component also shown without deep convective clouds (dashed). Global means in W m−2 are given in the legend of (c). Grey shading marks 40–90° N, the region of Fig. 7.
The positive cloud optical depth term in Fig. 9a () therefore combines the loss of thick, high topped cloud identified above with a per cloud thinning that arises in ice and mixed-phase clouds and peaks at the cold end of the mixed-phase regime, where the additional dust INP supplied by the AMOC slowdown deplete supercooled liquid through the WBF process. The binned CRE still contains the clear-sky offset discussed above, which can inflate the amplitude of the signal but not alter its regime structure, making the attribution robust.Maps of the three kernel components (Fig. S7) show where they arise. The cloud amount term is a cooling over the North Atlantic and the northeast Pacific, where low cloud increases, and the altitude term is mainly longwave, following lower cloud tops over the North Atlantic and the southward shift of tropical deep convection. The optical depth term follows the loss of cloud liquid water (Fig. 10). Poleward of 40° N, its shortwave component correlates with the change in total water path at , while the ice water path changes little (Fig. 10b). There, the dust INP increase in the mixed-phase layer peaks near 49° N, whereas the liquid loss peaks near 65° N over the expanded sea ice (Fig. 10a and b), and the water path change follows the surface cooling (r=0.61) more closely than the INP increase (). The optical depth term is largest over the Nordic and Barents Seas and northern Eurasia and along the tropical rain belt, and the tropics contribute about half of its global mean (+0.20 of , Fig. 10c). Over the expanded sea ice the shortwave kernel is evaluated with the control surface albedo, so the high-latitude values there are likely overestimated.
In this work, we show that a 60 % AMOC weakening drives a hemispheric redistribution of natural aerosols through purely dynamical pathways, even in the absence of changes in anthropogenic emissions. Enhanced Saharan dust emissions and extended aerosol lifetimes under suppressed wet deposition increase the Northern Hemisphere aerosol burden by 41 %. These aerosol perturbations propagate into cloud properties through both liquid and ice-phase microphysical pathways. Averaged over 40–90° N, warm-cloud CDNC increases with the CCN because of weaker wet removal, which lengthens aerosol residence times and shifts the soluble population toward the accumulation mode, and the suppressed autoconversion associated with the smaller droplets increases the warm-cloud water path. Stronger sub-grid updrafts over the mid-latitudes add a secondary dynamical contribution to the activation increase. In the mixed-phase regime, a substantial ICNC increase that closely tracks the enhanced dust INPs, set primarily by the larger INP supply, promotes the WBF process, depleting supercooled liquid water and reducing total water path. In the cirrus regime, ICNC decreases despite increased dust INP, as enhanced lower-tropospheric stability suppresses the deepest convective towers and shifts the cirrus cloud-top temperature distribution toward warmer values, where homogeneous freezing nucleation rates are lower.
A kernel decomposition shows that the genuine global-mean cloud radiative response is small (), and that the weakly positive net cloud radiative effect anomaly () largely reflects clear-sky masking, mainly of the surface albedo change. Among the isolated cloud, aerosol and surface-albedo contributions, the largest are the surface albedo response to expanded subpolar sea ice and continental snow cover () and the enhanced Saharan dust ERFari (); together with the small cloud contribution () these yield a combined contribution of , which excludes the longwave response and reinforces rather than offsets the AMOC-induced surface cooling. The temperature binned condensate changes locate the optical depth reduction behind the cloud contribution in the mixed-phase and cold cloud regimes, coinciding in the mixed-phase regime with the ICNC increase from the additional dust INPs, so that the net sign of the cloud contribution is sensitive to the relative representation of deep convective, mixed-phase, and boundary layer clouds.
These responses are broadly consistent with previous coupled-model studies of AMOC weakening, both in the magnitude of Northern Hemisphere cooling (Jackson et al., 2023; Bellomo and Mehling, 2024) and in the macrophysical cloud changes over the subpolar North Atlantic and the tropics (Zhang et al., 2010; Fan et al., 2025; Drijfhout, 2015), while the enhanced Saharan dust export is qualitatively supported by palaeoclimate reconstructions from weak-AMOC intervals (Cruz et al., 2021; McManus et al., 2004). The key advance of this study is to show that aerosol-driven microphysical pathways are an active part of the cloud response in their own right, operating alongside the established thermodynamic and macrophysical responses.
We also note some limitations of our experimental design. The atmosphere-only configuration with prescribed sea surface temperature and sea ice, derived from a separate coupled model, excludes ocean–atmosphere feedbacks, so that the cloud and aerosol radiative anomalies diagnosed here cannot, in turn, modify sea surface temperatures or the evolution of the AMOC itself. This constraint is particularly relevant given that the dominant radiative term we identify is the sea-ice surface albedo response, which in a coupled system would feed back on the very sea-ice and ocean state that is here prescribed. Holding anthropogenic and biomass-burning emissions fixed against a present-day background, with no concurrent greenhouse warming, means our results isolate the purely mechanistic link between AMOC weakening and aerosol–cloud interactions rather than a realistic future trajectory in which emissions and background climate co-evolve.
The AMOC-driven aerosol–cloud response is therefore likely state dependent. In a warmer background climate, cloud ice would decrease and the supercooled liquid water would persist, but at higher altitudes, where the additional dust, concentrated in the lower troposphere (Fig. 4d), arrives less often. Fewer dust INPs would then act in mixed-phase clouds, which would weaken the dust-driven glaciation and optical thinning and make the cloud radiative response less positive. A larger North Atlantic precipitation reduction under a future AMOC decline (Bellomo and Mehling, 2024) would instead suppress wet scavenging further and raise both INP and CCN concentrations. The additional INP would strengthen the thinning and make the contribution more positive, whereas the additional CCN would brighten warm clouds and act in the opposite direction. Our experiments cannot determine which of these effects dominates. Resolving it would require dedicated experiments, such as applying the hosing anomaly on a warm SSP background or the constant-AMOC differencing of Liu et al. (2020). Nevertheless, in this work, we provide evidence that aerosol–cloud interactions form an active component of the climate response to AMOC weakening, a pathway that models which prescribe the aerosol effect on clouds, rather than resolving the coupling between aerosol number and cloud droplet and ice-crystal formation, cannot represent, and whose absence may contribute to the spread in projected climate responses to future AMOC change. Finally, as in any single-model study, and especially for aerosol-mediated processes, the magnitude and in some regimes the sign of the aerosol–cloud response may be model dependent; our quantitative results reflect the aerosol and cloud-microphysics parameterisations of ICON-HAM, and corroboration in a multi-model framework would be valuable.
The ICOsahedral Nonhydrostatic model (ICON) is publicly available to the scientific community via the ICON model website (https://icon-model.org, last access: 21 October 2026). The simulations in this study were performed using ICON version 2.6.4 (pre open-source version), corresponding to commit 8b144b8bfdc01c8ba1d423de4ecf46e20e1b6527. The aerosol–cloud microphysics model HAM is available as part of the HAMMOZ modelling framework (https://git.iac.ethz.ch/hammoz/hammoz, last access: 21 October 2026).
The model outputs relevant to this study and scripts used to produce all figures are permanently stored in the Zenodo repository and are accessible via https://doi.org/10.5281/zenodo.22255905 (Vella, 2026).
The supplement related to this article is available online at https://doi.org/10.5194/acp-26-14939-2026-supplement.
RV conceptualised the study, prepared the model setup, conducted the simulations, and analysed the model output. UL contributed to the interpretation of the results and supervised the project. RV wrote the manuscript, with input from UL.
The contact author has declared that neither of the authors has any competing interests.
Publisher's note: Copernicus Publications remains neutral with regard to jurisdictional claims made in the text, published maps, institutional affiliations, or any other geographical representation in this paper. The authors bear the ultimate responsibility for providing appropriate place names. Views expressed in the text are those of the authors and do not necessarily reflect the views of the publisher.
The model simulations were performed on the Santis vCluster of the Alps research infrastructure at the Swiss National Supercomputing Centre (CSCS), with support from ETH Zurich. The journal processing fees were covered by ETH Zurich.
This paper was edited by Paulo Ceppi and reviewed by two anonymous referees.
Abdul-Razzak, H. and Ghan, S. J.: A Parameterization of Aerosol Activation: 2. Multiple Aerosol Types, J. Geophys. Res.-Atmos., 105, 6837–6844, https://doi.org/10.1029/1999JD901161, 2000. a
Albrecht, B. A.: Aerosols, Cloud Microphysics, and Fractional Cloudiness, Science, 245, 1227–1230, https://doi.org/10.1126/science.245.4923.1227, 1989. a
Allen, R. J., Vega, C., Yao, E., and Liu, W.: Impact of Industrial versus Biomass Burning Aerosols on the Atlantic Meridional Overturning Circulation, npj Climate and Atmospheric Science, 7, 58, https://doi.org/10.1038/s41612-024-00602-8, 2024. a
Baker, J. A., Bell, M. J., Jackson, L. C., Vallis, G. K., Watson, A. J., and Wood, R. A.: Continued Atlantic Overturning Circulation Even under Climate Extremes, Nature, 638, 987–994, https://doi.org/10.1038/s41586-024-08544-0, 2025. a
Bakker, P., Schmittner, A., Lenaerts, J. T. M., Abe-Ouchi, A., Bi, D., van den Broeke, M. R., Chan, W.-L., Hu, A., Beadling, R. L., Marsland, S. J., Mernild, S. H., Saenko, O. A., Swingedouw, D., Sullivan, A., and Yin, J.: Fate of the Atlantic Meridional Overturning Circulation: Strong Decline under Continued Warming and Greenland Melting, Geophys. Res. Lett., 43, 12,252–12,260, https://doi.org/10.1002/2016GL070457, 2016. a
Bamber, J. L., Tedstone, A. J., King, M. D., Howat, I. M., Enderlin, E. M., van den Broeke, M. R., and Noel, B.: Land Ice Freshwater Budget of the Arctic and North Atlantic Oceans: 1. Data, Methods, and Results, J. Geophys. Res.-Oceans, 123, 1827–1837, https://doi.org/10.1002/2017JC013605, 2018. a
Bellomo, K. and Mehling, O.: Impacts and State-Dependence of AMOC Weakening in a Warming Climate, Geophys. Res. Lett., 51, e2023GL107624, https://doi.org/10.1029/2023GL107624, 2024. a, b, c, d
Ben-Yami, M., Good, P., Jackson, L. C., Crucifix, M., Hu, A., Saenko, O., Swingedouw, D., and Boers, N.: Impacts of AMOC Collapse on Monsoon Rainfall: A Multi-Model Comparison, Earth's Future, 12, e2023EF003959, https://doi.org/10.1029/2023EF003959, 2024. a, b, c
Boucher, O., Randall, D., Artaxo, P., Bretherton, C., Feingold, G., Forster, P., Kerminen, V.-M., Kondo, Y., Liao, H., Lohmann, U., Rasch, P., Satheesh, S. K., Sherwood, S., Stevens, B., and Zhang, X. Y.: Clouds and Aerosols, in: Climate Change 2013: The Physical Science Basis, Cambridge University Press, 571–657, https://doi.org/10.1017/CBO9781107415324.016, 2013. a
Caesar, L., Rahmstorf, S., and Feulner, G.: On the Relationship between Atlantic Meridional Overturning Circulation Slowdown and Global Surface Warming, Environ. Res. Lett., 15, 024003, https://doi.org/10.1088/1748-9326/ab63e3, 2020. a
Cheng, T., Peng, Y., Feichter, J., and Tegen, I.: An improvement on the dust emission scheme in the global aerosol-climate model ECHAM5-HAM, Atmos. Chem. Phys., 8, 1105–1117, https://doi.org/10.5194/acp-8-1105-2008, 2008. a
Cheng, W., Bitz, C. M., and Chiang, J. C. H.: Adjustment of the Global Climate to an Abrupt Slowdown of the Atlantic Meridional Overturning Circulation, in: Ocean Circulation: Mechanisms and Impacts – Past and Future Changes of Meridional Overturning, American Geophysical Union (AGU), 295–313, https://doi.org/10.1029/173GM19, 2007. a
Clement, A. C. and Peterson, L. C.: Mechanisms of Abrupt Climate Change of the Last Glacial Period, Rev. Geophys., 46, https://doi.org/10.1029/2006RG000204, 2008. a
Collins, J. A., Govin, A., Mulitza, S., Heslop, D., Zabel, M., Hartmann, J., Röhl, U., and Wefer, G.: Abrupt shifts of the Sahara–Sahel boundary during Heinrich stadials, Clim. Past, 9, 1181–1191, https://doi.org/10.5194/cp-9-1181-2013, 2013. a
Couldrey, M. P., Gregory, J. M., Dong, X., Garuba, O., Haak, H., Hu, A., Hurlin, W. J., Jin, J., Jungclaus, J., Köhl, A., Liu, H., Ojha, S., Saenko, O. A., Savita, A., Suzuki, T., Yu, Z., and Zanna, L.: Greenhouse-Gas Forced Changes in the Atlantic Meridional Overturning Circulation and Related Worldwide Sea-Level Change, Clim. Dynam., 60, 2003–2039, https://doi.org/10.1007/s00382-022-06386-y, 2023. a
Croft, B., Lohmann, U., Martin, R. V., Stier, P., Wurzler, S., Feichter, J., Posselt, R., and Ferrachat, S.: Aerosol size-dependent below-cloud scavenging by rain and snow in the ECHAM5-HAM, Atmos. Chem. Phys., 9, 4653–4675, https://doi.org/10.5194/acp-9-4653-2009, 2009. a
Crueger, T., Giorgetta, M. A., Brokopf, R., Esch, M., Fiedler, S., Hohenegger, C., Kornblueh, L., Mauritsen, T., Nam, C., Naumann, A. K., Peters, K., Rast, S., Roeckner, E., Sakradzija, M., Schmidt, H., Vial, J., Vogel, R., and Stevens, B.: ICON-A, The Atmosphere Component of the ICON Earth System Model: II. Model Evaluation, J. Adv. Model. Earth Sy., 10, 1638–1662, https://doi.org/10.1029/2017MS001233, 2018. a
Cruz, J. A., McDermott, F., Turrero, M. J., Edwards, R. L., and Martín-Chivelet, J.: Strong Links between Saharan Dust Fluxes, Monsoon Strength, and North Atlantic Climate during the Last 5000 Years, Sci. Adv., 7, eabe6102, https://doi.org/10.1126/sciadv.abe6102, 2021. a, b
Dentener, F., Kinne, S., Bond, T., Boucher, O., Cofala, J., Generoso, S., Ginoux, P., Gong, S., Hoelzemann, J. J., Ito, A., Marelli, L., Penner, J. E., Putaud, J.-P., Textor, C., Schulz, M., van der Werf, G. R., and Wilson, J.: Emissions of primary aerosol and precursor gases in the years 2000 and 1750 prescribed data-sets for AeroCom, Atmos. Chem. Phys., 6, 4321–4344, https://doi.org/10.5194/acp-6-4321-2006, 2006. a, b
Döscher, R., Acosta, M., Alessandri, A., Anthoni, P., Arsouze, T., Bergman, T., Bernardello, R., Boussetta, S., Caron, L.-P., Carver, G., Castrillo, M., Catalano, F., Cvijanovic, I., Davini, P., Dekker, E., Doblas-Reyes, F. J., Docquier, D., Echevarria, P., Fladrich, U., Fuentes-Franco, R., Gröger, M., v. Hardenberg, J., Hieronymus, J., Karami, M. P., Keskinen, J.-P., Koenigk, T., Makkonen, R., Massonnet, F., Ménégoz, M., Miller, P. A., Moreno-Chamarro, E., Nieradzik, L., van Noije, T., Nolan, P., O'Donnell, D., Ollinaho, P., van den Oord, G., Ortega, P., Prims, O. T., Ramos, A., Reerink, T., Rousset, C., Ruprich-Robert, Y., Le Sager, P., Schmith, T., Schrödner, R., Serva, F., Sicardi, V., Sloth Madsen, M., Smith, B., Tian, T., Tourigny, E., Uotila, P., Vancoppenolle, M., Wang, S., Wårlind, D., Willén, U., Wyser, K., Yang, S., Yepes-Arbós, X., and Zhang, Q.: The EC-Earth3 Earth system model for the Coupled Model Intercomparison Project 6, Geosci. Model Dev., 15, 2973–3020, https://doi.org/10.5194/gmd-15-2973-2022, 2022. a
Drijfhout, S. S.: Global Radiative Adjustment after a Collapse of the Atlantic Meridional Overturning Circulation, Clim. Dynam., 45, 1789–1799, https://doi.org/10.1007/s00382-014-2433-9, 2015. a, b, c
Ehrmann, W., Schmiedl, G., Beuscher, S., and Krüger, S.: Intensity of African Humid Periods Estimated from Saharan Dust Fluxes, PLOS one, 12, e0170989, https://doi.org/10.1371/journal.pone.0170989, 2017. a, b
Fan, Y., Chan, D., Clothiaux, E. E., Zhang, P., and Li, L.: Subpolar North Atlantic Cooling Reinforced by Colder, Drier Atmosphere with a Weakening Atlantic Meridional Overturning Circulation, Sci. Adv., 11, eads1624, https://doi.org/10.1126/sciadv.ads1624, 2025. a, b, c, d, e, f, g, h, i, j
Frajka-Williams, E., Ansorge, I. J., Baehr, J., Bryden, H. L., Chidichimo, M. P., Cunningham, S. A., Danabasoglu, G., Dong, S., Donohue, K. A., Elipot, S., Heimbach, P., Holliday, N. P., Hummels, R., Jackson, L. C., Karstensen, J., Lankhorst, M., Le Bras, I. A., Lozier, M. S., McDonagh, E. L., Meinen, C. S., Mercier, H., Moat, B. I., Perez, R. C., Piecuch, C. G., Rhein, M., Srokosz, M. A., Trenberth, K. E., Bacon, S., Forget, G., Goni, G., Kieke, D., Koelling, J., Lamont, T., McCarthy, G. D., Mertens, C., Send, U., Smeed, D. A., Speich, S., van den Berg, M., Volkov, D., and Wilson, C.: Atlantic Meridional Overturning Circulation: Observed Transport and Variability, Frontiers in Marine Science, 6, https://doi.org/10.3389/fmars.2019.00260, 2019. a, b
Giorgetta, M. A., Brokopf, R., Crueger, T., Esch, M., Fiedler, S., Helmert, J., Hohenegger, C., Kornblueh, L., Köhler, M., Manzini, E., Mauritsen, T., Nam, C., Raddatz, T., Rast, S., Reinert, D., Sakradzija, M., Schmidt, H., Schneck, R., Schnur, R., Silvers, L., Wan, H., Zängl, G., and Stevens, B.: ICON-A, the Atmosphere Component of the ICON Earth System Model: I. Model Description, J. Adv. Model. Earth Sy., 10, 1613–1637, https://doi.org/10.1029/2017MS001242, 2018. a, b, c
Hahn, L. C., Lutsko, N. J., Eisenman, I., Luongo, M. T., and Xie, S.-P.: Contribution of AMOC Decline to Uncertainty in Global Warming via Ocean Heat Uptake and Climate Feedbacks, J. Climate, 38, 6245–6259, https://doi.org/10.1175/JCLI-D-24-0752.1, 2025. a
Hassan, T., Allen, R. J., Liu, W., and Randles, C. A.: Anthropogenic aerosol forcing of the Atlantic meridional overturning circulation and the associated mechanisms in CMIP6 models, Atmos. Chem. Phys., 21, 5821–5846, https://doi.org/10.5194/acp-21-5821-2021, 2021. a, b
He, J., Winton, M., Vecchi, G., Jia, L., and Rugenstein, M.: Transient Climate Sensitivity Depends on Base Climate Ocean Circulation, J. Climate, 30, 1493–1504, https://doi.org/10.1175/JCLI-D-16-0581.1, 2017. a
Hegglin, M., Kinnison, D., Lamarque, J.-F., and Plummer, D.: CCMI ozone in support of CMIP6 – version 1.0, https://doi.org/10.22033/ESGF/input4MIPs.1115, 2016. a
Hofmann, M. and Rahmstorf, S.: On the Stability of the Atlantic Meridional Overturning Circulation, P. Natl. Acad. Sci. USA, 106, 20584–20589, https://doi.org/10.1073/pnas.0909146106, 2009. a
Jackson, L. C., Biastoch, A., Buckley, M. W., Desbruyères, D. G., Frajka-Williams, E., Moat, B., and Robson, J.: The Evolution of the North Atlantic Meridional Overturning Circulation since 1980, Nature Reviews Earth & Environment, 3, 241–254, https://doi.org/10.1038/s43017-022-00263-2, 2022. a, b
Jackson, L. C., Alastrué de Asenjo, E., Bellomo, K., Danabasoglu, G., Haak, H., Hu, A., Jungclaus, J., Lee, W., Meccia, V. L., Saenko, O., Shao, A., and Swingedouw, D.: Understanding AMOC stability: the North Atlantic Hosing Model Intercomparison Project, Geosci. Model Dev., 16, 1975–1995, https://doi.org/10.5194/gmd-16-1975-2023, 2023. a, b, c
Kärcher, B. and Lohmann, U.: A Parameterization of Cirrus Cloud Formation: Homogeneous Freezing of Supercooled Aerosols, J. Geophys. Res.-Atmos., 107, AAC 4-1–AAC 4-10, https://doi.org/10.1029/2001JD000470, 2002. a
Khairoutdinov, M. and Kogan, Y.: A New Cloud Physics Parameterization in a Large-Eddy Simulation Model of Marine Stratocumulus, Mon. Weather Rev., 128, 229–243, https://doi.org/10.1175/1520-0493(2000)128<0229:ANCPPI>2.0.CO;2, 2000. a
Klein, S. A. and Hartmann, D. L.: The Seasonal Cycle of Low Stratiform Clouds, J. Climate, 6, 1587–1606, https://doi.org/10.1175/1520-0442(1993)006<1587:TSCOLS>2.0.CO;2, 1993. a
Korolev, A.: Limitations of the Wegener–Bergeron–Findeisen Mechanism in the Evolution of Mixed-Phase Clouds, J. Atmos. Sci., 64, 3372–3375, https://doi.org/10.1175/JAS4035.1, 2007. a
Lamarque, J.-F., Bond, T. C., Eyring, V., Granier, C., Heil, A., Klimont, Z., Lee, D., Liousse, C., Mieville, A., Owen, B., Schultz, M. G., Shindell, D., Smith, S. J., Stehfest, E., Van Aardenne, J., Cooper, O. R., Kainuma, M., Mahowald, N., McConnell, J. R., Naik, V., Riahi, K., and van Vuuren, D. P.: Historical (1850–2000) gridded anthropogenic and biomass burning emissions of reactive gases and aerosols: methodology and application, Atmos. Chem. Phys., 10, 7017–7039, https://doi.org/10.5194/acp-10-7017-2010, 2010. a
Lee, Y.-C., Liu, W., Fedorov, A. V., Feldl, N., and Taylor, P. C.: Impacts of Atlantic Meridional Overturning Circulation Weakening on Arctic Amplification, P. Natl. Acad. Sci. USA, 121, e2402322121, https://doi.org/10.1073/pnas.2402322121, 2024. a
Lin, Y.-J., Hwang, Y.-T., Ceppi, P., and Gregory, J. M.: Uncertainty in the Evolution of Climate Feedback Traced to the Strength of the Atlantic Meridional Overturning Circulation, Geophys. Res. Lett., 46, 12331–12339, https://doi.org/10.1029/2019GL083084, 2019. a
Liu, W., Fedorov, A. V., Xie, S.-P., and Hu, S.: Climate Impacts of a Weakened Atlantic Meridional Overturning Circulation in a Warming Climate, Sci. Adv., 6, eaaz4876, https://doi.org/10.1126/sciadv.aaz4876, 2020. a, b
Lohmann, U. and Diehl, K.: Sensitivity Studies of the Importance of Dust Ice Nuclei for the Indirect Aerosol Effect on Stratiform Mixed-Phase Clouds, J. Atmos. Sci., 63, 968–982, https://doi.org/10.1175/JAS3662.1, 2006. a, b
Lohmann, U. and Neubauer, D.: The importance of mixed-phase and ice clouds for climate sensitivity in the global aerosol–climate model ECHAM6-HAM2, Atmos. Chem. Phys., 18, 8807–8828, https://doi.org/10.5194/acp-18-8807-2018, 2018. a
Lohmann, U. and Roeckner, E.: Design and Performance of a New Cloud Microphysics Scheme Developed for the ECHAM General Circulation Model, Clim. Dynam., 12, 557–572, https://doi.org/10.1007/BF00207939, 1996. a, b
Lohmann, U., Stier, P., Hoose, C., Ferrachat, S., Kloster, S., Roeckner, E., and Zhang, J.: Cloud microphysics and aerosol indirect effects in the global climate model ECHAM5-HAM, Atmos. Chem. Phys., 7, 3425–3446, https://doi.org/10.5194/acp-7-3425-2007, 2007. a
Long, M. S., Keene, W. C., Kieber, D. J., Erickson, D. J., and Maring, H.: A sea-state based source function for size- and composition-resolved marine aerosol production, Atmos. Chem. Phys., 11, 1203–1216, https://doi.org/10.5194/acp-11-1203-2011, 2011. a
Mahowald, N., Kohfeld, K., Hansson, M., Balkanski, Y., Harrison, S. P., Prentice, I. C., Schulz, M., and Rodhe, H.: Dust Sources and Deposition during the Last Glacial Maximum and Current Climate: A Comparison of Model Results with Paleodata from Ice Cores and Marine Sediments, J. Geophys. Res.-Atmos., 104, 15895–15916, https://doi.org/10.1029/1999JD900084, 1999. a
Matthes, K., Funke, B., Andersson, M. E., Barnard, L., Beer, J., Charbonneau, P., Clilverd, M. A., Dudok de Wit, T., Haberreiter, M., Hendry, A., Jackman, C. H., Kretzschmar, M., Kruschke, T., Kunze, M., Langematz, U., Marsh, D. R., Maycock, A. C., Misios, S., Rodger, C. J., Scaife, A. A., Seppälä, A., Shangguan, M., Sinnhuber, M., Tourpali, K., Usoskin, I., van de Kamp, M., Verronen, P. T., and Versick, S.: Solar forcing for CMIP6 (v3.2), Geosci. Model Dev., 10, 2247–2302, https://doi.org/10.5194/gmd-10-2247-2017, 2017. a
McManus, J. F., Francois, R., Gherardi, J.-M., Keigwin, L. D., and Brown-Leger, S.: Collapse and Rapid Resumption of Atlantic Meridional Circulation Linked to Deglacial Climate Changes, Nature, 428, 834–837, https://doi.org/10.1038/nature02494, 2004. a, b
Meinshausen, M., Vogel, E., Nauels, A., Lorbacher, K., Meinshausen, N., Etheridge, D. M., Fraser, P. J., Montzka, S. A., Rayner, P. J., Trudinger, C. M., Krummel, P. B., Beyerle, U., Canadell, J. G., Daniel, J. S., Enting, I. G., Law, R. M., Lunder, C. R., O'Doherty, S., Prinn, R. G., Reimann, S., Rubino, M., Velders, G. J. M., Vollmer, M. K., Wang, R. H. J., and Weiss, R.: Historical greenhouse gas concentrations for climate modelling (CMIP6), Geosci. Model Dev., 10, 2057–2116, https://doi.org/10.5194/gmd-10-2057-2017, 2017. a
Mulitza, S., Prange, M., Stuut, J.-B., Zabel, M., von Dobeneck, T., Itambi, A. C., Nizou, J., Schulz, M., and Wefer, G.: Sahel Megadroughts Triggered by Glacial Slowdowns of Atlantic Meridional Overturning, Paleoceanography, 23, https://doi.org/10.1029/2008PA001637, 2008. a
Neubauer, D., Ferrachat, S., Siegenthaler-Le Drian, C., Stier, P., Partridge, D. G., Tegen, I., Bey, I., Stanelle, T., Kokkola, H., and Lohmann, U.: The global aerosol–climate model ECHAM6.3–HAM2.3 – Part 2: Cloud evaluation, aerosol radiative forcing, and climate sensitivity, Geosci. Model Dev., 12, 3609–3639, https://doi.org/10.5194/gmd-12-3609-2019, 2019. a, b
O'Donnell, D., Tsigaridis, K., and Feichter, J.: Estimating the direct and indirect effects of secondary organic aerosols using ECHAM5-HAM, Atmos. Chem. Phys., 11, 8635–8659, https://doi.org/10.5194/acp-11-8635-2011, 2011. a
Orihuela-Pinto, B., England, M. H., and Taschetto, A. S.: Interbasin and Interhemispheric Impacts of a Collapsed Atlantic Overturning Circulation, Nat. Clim. Change, 12, 558–565, https://doi.org/10.1038/s41558-022-01380-y, 2022. a
Petters, M. D. and Kreidenweis, S. M.: A single parameter representation of hygroscopic growth and cloud condensation nucleus activity, Atmos. Chem. Phys., 7, 1961–1971, https://doi.org/10.5194/acp-7-1961-2007, 2007. a, b
Rahmstorf, S.: On the Freshwater Forcing and Transport of the Atlantic Thermohaline Circulation, Clim. Dynam., 12, 799–811, https://doi.org/10.1007/s003820050144, 1996. a
Reick, C. H., Gayler, V., Goll, D., Hagemann, S., Heidkamp, M., Nabel, J. E. M. S., Raddatz, T., Roeckner, E., Schnur, R., and Wilkenskjeld, S.: JSBACH 3 – The Land Component of the MPI Earth System Model: Documentation of Version 3.2, https://doi.org/10.17617/2.3279802, 2021. a
Salzmann, M., Ferrachat, S., Tully, C., Münch, S., Watson-Parris, D., Neubauer, D., Siegenthaler-Le Drian, C., Rast, S., Heinold, B., Crueger, T., Brokopf, R., Mülmenstädt, J., Quaas, J., Wan, H., Zhang, K., Lohmann, U., Stier, P., and Tegen, I.: The Global Atmosphere-aerosol Model ICON-A-HAM2.3–Initial Model Evaluation and Effects of Radiation Balance Tuning on Aerosol Optical Thickness, J. Adv. Model. Earth Sy., 14, e2021MS002699, https://doi.org/10.1029/2021MS002699, 2022. a, b
Sandeep, N., Swapna, P., Krishnan, R., Farneti, R., Prajeesh, A. G., Ayantika, D. C., and Manmeet, S.: South Asian Monsoon Response to Weakening of Atlantic Meridional Overturning Circulation in a Warming Climate, Clim. Dynam., 54, 3507–3524, https://doi.org/10.1007/s00382-020-05180-y, 2020. a, b
Schneider, T., Kaul, C. M., and Pressel, K. G.: Possible Climate Transitions from Breakup of Stratocumulus Decks under Greenhouse Warming, Nat. Geosci., 12, 163–167, https://doi.org/10.1038/s41561-019-0310-1, 2019. a
Sévellec, F., Fedorov, A. V., and Liu, W.: Arctic Sea-Ice Decline Weakens the Atlantic Meridional Overturning Circulation, Nat. Clim. Change, 7, 604–610, https://doi.org/10.1038/nclimate3353, 2017. a
Siedler, G., Church, J., and Gould, J. (Eds.): Ocean Circulation and Climate: Observing and Modelling the Global Ocean, in: International Geophysics Series, vol. 77, Academic Press, ISBN 978-0-12-641351-9, 2001. a
Stenchikov, G. L., Kirchner, I., Robock, A., Graf, H.-F., Antuña, J. C., Grainger, R. G., Lambert, A., and Thomason, L.: Radiative Forcing from the 1991 Mount Pinatubo Volcanic Eruption, J. Geophys. Res.-Atmos., 103, 13837–13857, https://doi.org/10.1029/98JD00693, 1998. a
Stevens, B., Giorgetta, M., Esch, M., Mauritsen, T., Crueger, T., Rast, S., Salzmann, M., Schmidt, H., Bader, J., Block, K., Brokopf, R., Fast, I., Kinne, S., Kornblueh, L., Lohmann, U., Pincus, R., Reichler, T., and Roeckner, E.: Atmospheric Component of the MPI-M Earth System Model: ECHAM6, J. Adv. Model. Earth Sy., 5, 146–172, https://doi.org/10.1002/jame.20015, 2013. a
Stier, P., Feichter, J., Kinne, S., Kloster, S., Vignati, E., Wilson, J., Ganzeveld, L., Tegen, I., Werner, M., Balkanski, Y., Schulz, M., Boucher, O., Minikin, A., and Petzold, A.: The aerosol-climate model ECHAM5-HAM, Atmos. Chem. Phys., 5, 1125–1156, https://doi.org/10.5194/acp-5-1125-2005, 2005. a, b, c, d
Stier, P., Seinfeld, J. H., Kinne, S., and Boucher, O.: Aerosol absorption and radiative forcing, Atmos. Chem. Phys., 7, 5237–5261, https://doi.org/10.5194/acp-7-5237-2007, 2007. a
Sundqvist, H., Berge, E., and Kristjánsson, J. E.: Condensation and Cloud Parameterization Studies with a Mesoscale Numerical Weather Prediction Model, Mon. Weather Rev., 117, 1641–1657, https://doi.org/10.1175/1520-0493(1989)117<1641:CACPSW>2.0.CO;2, 1989. a
Taylor, K. E., Crucifix, M., Braconnot, P., Hewitt, C. D., Doutriaux, C., Broccoli, A. J., Mitchell, J. F. B., and Webb, M. J.: Estimating Shortwave Radiative Forcing and Response in Climate Models, J. Climate, 20, 2530–2543, https://doi.org/10.1175/JCLI4143.1, 2007. a
Tegen, I., Harrison, S. P., Kohfeld, K., Prentice, I. C., Coe, M., and Heimann, M.: Impact of Vegetation and Preferential Source Areas on Global Dust Aerosol: Results from a Model Study, J. Geophys. Res.-Atmos., 107, AAC 14-1–AAC 14-27, https://doi.org/10.1029/2001JD000963, 2002. a, b
Tegen, I., Neubauer, D., Ferrachat, S., Siegenthaler-Le Drian, C., Bey, I., Schutgens, N., Stier, P., Watson-Parris, D., Stanelle, T., Schmidt, H., Rast, S., Kokkola, H., Schultz, M., Schroeder, S., Daskalakis, N., Barthel, S., Heinold, B., and Lohmann, U.: The global aerosol–climate model ECHAM6.3–HAM2.3 – Part 1: Aerosol evaluation, Geosci. Model Dev., 12, 1643–1677, https://doi.org/10.5194/gmd-12-1643-2019, 2019. a, b, c
Thomson, A. M., Calvin, K. V., Smith, S. J., Kyle, G. P., Volke, A., Patel, P., Delgado-Arias, S., Bond-Lamberty, B., Wise, M. A., Clarke, L. E., and Edmonds, J. A.: RCP4.5: A Pathway for Stabilization of Radiative Forcing by 2100, Climatic Change, 109, 77, https://doi.org/10.1007/s10584-011-0151-4, 2011. a
Trossman, D. S., Palter, J. B., Merlis, T. M., Huang, Y., and Xia, Y.: Large-Scale Ocean Circulation-Cloud Interactions Reduce the Pace of Transient Climate Change, Geophys. Res. Lett., 43, 3935–3943, https://doi.org/10.1002/2016GL067931, 2016. a, b, c, d, e
Vella, R.: Model simulation data and analysis scripts used in “Aerosol–cloud interactions influence the climate response to AMOC weakening” (Vella & Lohmann, 2026) [Dataset], Zenodo [code and data set], https://doi.org/10.5281/zenodo.22255905, 2026. a
Vella, R., Steil, B., Meccia, V., Tost, H., Lelieveld, J., and Pozzer, A.: Air Quality Penalty in Southeast Asia Driven by AMOC Slowdown, Geophys. Res. Lett., 53, e2025GL121309, https://doi.org/10.1029/2025GL121309, 2026. a, b, c, d
Vignati, E., Wilson, J., and Stier, P.: M7: An Efficient Size-Resolved Aerosol Microphysics Module for Large-Scale Aerosol Transport Models, J. Geophys. Res.-Atmos., 109, https://doi.org/10.1029/2003JD004485, 2004. a, b
Weijer, W., Cheng, W., Drijfhout, S. S., Fedorov, A. V., Hu, A., Jackson, L. C., Liu, W., McDonagh, E. L., Mecking, J. V., and Zhang, J.: Stability of the Atlantic Meridional Overturning Circulation: A Review and Synthesis, J. Geophys. Res.-Oceans, 124, 5336–5375, https://doi.org/10.1029/2019JC015083, 2019. a
Williams, R. H., McGee, D., Kinsley, C. W., Ridley, D. A., Hu, S., Fedorov, A., Tal, I., Murray, R. W., and deMenocal, P. B.: Glacial to Holocene Changes in Trans-Atlantic Saharan Dust Transport and Dust-Climate Feedbacks, Sci. Adv., 2, e1600445, https://doi.org/10.1126/sciadv.1600445, 2016. a
Wood, R. and Bretherton, C. S.: On the Relationship between Stratiform Low Cloud Cover and Lower-Tropospheric Stability, J. Climate, 19, 6425–6432, https://doi.org/10.1175/JCLI3988.1, 2006. a
Zängl, G., Reinert, D., Rípodas, P., and Baldauf, M.: The ICON (ICOsahedral Non-hydrostatic) Modelling Framework of DWD and MPI-M: Description of the Non-Hydrostatic Dynamical Core, Q. J. Roy. Meteor. Soc., 141, 563–579, https://doi.org/10.1002/qj.2378, 2015. a
Zelinka, M. D., Klein, S. A., and Hartmann, D. L.: Computing and Partitioning Cloud Feedbacks Using Cloud Property Histograms. Part I: Cloud Radiative Kernels, J. Climate, 25, 3715–3735, https://doi.org/10.1175/JCLI-D-11-00248.1, 2012a. a
Zelinka, M. D., Klein, S. A., and Hartmann, D. L.: Computing and Partitioning Cloud Feedbacks Using Cloud Property Histograms. Part II: Attribution to Changes in Cloud Amount, Altitude, and Optical Depth, J. Climate, 25, 3736–3754, https://doi.org/10.1175/JCLI-D-11-00249.1, 2012b. a
Zelinka, M. D., Myers, T. A., McCoy, D. T., Po-Chedley, S., Caldwell, P. M., Ceppi, P., Klein, S. A., and Taylor, K. E.: Causes of Higher Climate Sensitivity in CMIP6 Models, Geophys. Res. Lett., 47, e2019GL085782, https://doi.org/10.1029/2019GL085782, 2020. a
Zhang, K., O'Donnell, D., Kazil, J., Stier, P., Kinne, S., Lohmann, U., Ferrachat, S., Croft, B., Quaas, J., Wan, H., Rast, S., and Feichter, J.: The global aerosol-climate model ECHAM-HAM, version 2: sensitivity to improvements in process representations, Atmos. Chem. Phys., 12, 8911–8949, https://doi.org/10.5194/acp-12-8911-2012, 2012. a
Zhang, R., Kang, S. M., and Held, I. M.: Sensitivity of Climate Change Induced by the Weakening of the Atlantic Meridional Overturning Circulation to Cloud Feedback, J. Climate, 23, 378–389, https://doi.org/10.1175/2009JCLI3118.1, 2010. a, b, c, d, e, f, g
Zhang, R., Sutton, R., Danabasoglu, G., Kwon, Y.-O., Marsh, R., Yeager, S. G., Amrhein, D. E., and Little, C. M.: A Review of the Role of the Atlantic Meridional Overturning Circulation in Atlantic Multidecadal Variability and Associated Climate Impacts, Rev. Geophys., 57, 316–375, https://doi.org/10.1029/2019RG000644, 2019. a, b, c, d
Zickfeld, K., Eby, M., and Weaver, A. J.: Carbon-Cycle Feedbacks of Changes in the Atlantic Meridional Overturning Circulation under Future Atmospheric CO2, Global Biogeochem. Cy., 22, https://doi.org/10.1029/2007GB003118, 2008. a