
the Creative Commons Attribution 4.0 License.
the Creative Commons Attribution 4.0 License.
 | 12 Oct 2026
Non-monotonic response of net dust deposition kinetics to low wind speeds
Ruochen Jia
Chaoqun Ba
Chao Zhang
Wennong Kuang
Yuan Liu
Zhigang Wang
Fang Liu
Zhiming Xin
Yuting Liu
Qun Ma
Lu Zong
Wei Liang

Zhimin Liu
Dry deposition is a major sink for mineral dust, yet its behavior under weak winds remains poorly constrained and is often parameterized monotonically with wind speed. Here we quantify size-resolved dust net accumulation kinetics in a closed-circuit recirculating wind tunnel using a two-stage protocol (brief high-wind loading followed by low-wind deposition at 0, 2, 4, and 6 m s−1). Cumulative retained-mass time series were measured with an array of collection trays, with the initial suspended dust loading recorded by an online concentration monitor. Particle sizes were characterized by laser diffraction and grouped into six diameter-threshold classes (PM2.5–PM63). A first-order kinetic model described the temporal accumulation dynamics and yielded a fitted asymptotic retained mass (a), effective net-accumulation rate coefficient (k), characteristic time scale (), and initial net accumulation flux (J0=ak). The observed J0 was highest at 2 m s−1 for PM2.5–PM30, and 4 m s−1 for PM40 and PM63, while J0 declined markedly at 6 m s−1 for the lower diameter thresholds. Quadratic fits across the four wind-speed levels suggest a potential maximum near 2–3 m s−1 for PM2.5–PM40. These measurements quantify the size-dependent response of effective surface retention to low wind speeds and provide benchmark behavior for coupled deposition, retention, and re-entrainment parameterizations.
- Article
(1886 KB) - Full-text XML
-
Supplement
(480 KB) - BibTeX
- EndNote


Mineral dust plays a pivotal role in the climate system, terrestrial ecosystems, and human health. It perturbs the atmospheric radiation balance and influences cloud–precipitation processes by scattering and absorbing radiation and acting as cloud condensation nuclei (Kok et al., 2023). Concurrently, it serves as a vital source of long-range nutrient fluxes to both terrestrial and marine ecosystems (Jickells et al., 2005; Mahowald et al., 2010). The atmospheric lifetime and spatial distribution of dust are predominantly governed by dry and wet deposition processes (Tegen and Fung, 1994; Wu et al., 2020a, b). Under large-scale circulation, strong wind episodes produce brief bursts of high dust emission, injecting large amounts of mineral particles into the lower atmosphere over short time scales (Shao, 2008; Kok et al., 2014). As storms subside and near-surface winds transition to a more typical low-speed background state, elevated dust concentrations can persist, making dry deposition the dominant process controlling the final transport distance and atmospheric residence time of particles (Wu et al., 2020a, b; Kok et al., 2021; Mostamandi et al., 2023). Consequently, accurately quantifying deposition efficiency during this post-storm, low-wind phase is crucial for linking source-region emissions to downwind climatic and ecological impacts (Mahowald et al., 2010; Kok et al., 2023).
Over recent decades, most models have simulated dry deposition using a framework that conceptualizes the process as “gravitational settling plus two resistances in series”, in which an aerodynamic resistance and a canopy/surface resistance describe stepwise transfer of particles from the free atmosphere to the underlying surface, allowing for the computation of size-dependent deposition velocities (Slinn, 1982; Wesely, 1989; Gallagher et al., 2002; Petroff and Zhang, 2010). Within this framework, particles in the 1–10 µm range are typically considered the least efficiently deposited, associated with the longest transport distances and identified as a critically sensitive size fraction in climate models (Petroff and Zhang, 2010; Zhang and Shao, 2014; Kok et al., 2023). However, a growing body of size-resolved flux observations and model intercomparisons reveals that predicted deposition rates for 0.1–10 µm particles can vary by more than an order of magnitude across dry deposition schemes (Zhang and He, 2014; Bergametti et al., 2018; Emerson et al., 2020). These substantial uncertainties propagate directly into estimates of global dust budgets and radiative forcing (Emerson et al., 2020; Kok et al., 2023). Recent systematic evaluations of numerical weather prediction and chemical transport models further demonstrate that differences in dry deposition parameterizations alone can induce systematic biases in simulated dust loads and surface concentrations, even when using identical wind fields and emission sources (Saylor et al., 2019; Zeng et al., 2020; Kong et al., 2025).
Model uncertainties are especially acute under low-wind, weakly turbulent conditions. Both field measurements via eddy-covariance systems and controlled wind-tunnel experiments indicate that for typical background winds (about 2–6 m s−1), dry deposition fluxes do not exhibit a straightforward, monotonic relationship with wind speed. Instead, fluxes appear more sensitive to near-surface turbulence intensity and the particle size distribution (Bergametti et al., 2018; Waza et al., 2019). Furthermore, different samplers and models frequently yield divergent deposition rates at identical wind speeds, and existing schemes often fail to accurately replicate measured deposition fluxes for coarse particles (Petroff and Zhang, 2010; Bergametti et al., 2018; Waza et al., 2019). This evidence highlights the limitations of using a single monotonic wind-speed dependence to represent net surface fluxes measured under different turbulence, surface, and sampler conditions (Zhang and He, 2014; Emerson et al., 2020).
In contrast to the extensive research on emission and saltation mechanisms during strong winds, the subsequent deposition phase following dust storms has received comparatively less attention. Conventional models often assume that surface dust fluxes decay rapidly to zero once wind speeds fall below the resuspension threshold. This assumption overlooks the potential for complex interactions among aggregation, resuspension, and gravitational settling in weakly turbulent flows (Shao, 2008; Kok et al., 2012). From an aeolian physics perspective, however, a low-wind environment does not signify dynamical quiescence. The post-dust-storm period, characterized by background winds modulated by large-scale circulation and boundary-layer friction, is a common atmospheric state. During this phase, the near-surface turbulent structure remains a key controller of momentum and scalar vertical exchange. Surface properties, such as roughness, soil moisture, and vegetation structure, collectively set the thresholds for dust emission, rebound, and resuspension (Fécan et al., 1999; Shao, 2008; Kok et al., 2012). As wind speed increases from calm conditions, turbulent fluctuations play a dual role: they help maintain particle suspension, delaying settling, while simultaneously enhancing near-surface transport and particle–surface contacts, which can promote both deposition and rebound. At higher wind speeds exceeding the resuspension threshold, saltation and splash processes begin to dominate surface fluxes, potentially inhibiting settling or even reversing net deposition (Shao et al., 1993; Shao, 2008; Kok et al., 2012; Zhang and Shao, 2014). This mechanistic reasoning suggests the potential existence of a “low-wind window”, a specific wind speed range in which effective near-surface retention reaches a local maximum, outperforming both calm and stronger wind conditions. Deposition-only parameterizations, however, do not explicitly represent such a response when stable retention and subsequent particle loss are considered together (Petroff and Zhang, 2010; Zhang and He, 2014).
Insights from two-phase flow and hydrodynamics provide further mechanistic support. In suspensions with weak to moderate shear and relatively high particle concentrations, inter-particle collisions and adhesion can induce aggregation, effectively altering the settling size spectrum (Maggi et al., 2007; Mietta et al., 2009; Zhao et al., 2023; Yu et al., 2022; Penlou et al., 2023). Experiments and numerical simulations consistently show that for fine-particle systems, moderate turbulent shear can significantly enhance bulk settling rates, whereas stronger shear suppresses settling through aggregate breakup and flow dilution (Penlou et al., 2023; Yu et al., 2022). The mean size of particle clusters often exhibits a non-monotonic dependence on shear intensity, peaking at an intermediate level. Recent detailed simulations of cohesive sediment confirm that, within certain parameter ranges, intermediate turbulence intensities can produce the largest flocs, directly illustrating the competition between shear-enhanced aggregation and turbulence-induced breakup (Maggi et al., 2007; Mietta et al., 2009; Zhao et al., 2023). These findings imply that in the post-storm atmosphere, where near-surface dust concentrations remain high and wind speeds are low to moderate, turbulence may assume a dual function: it maintains particle suspension and enhances horizontal transport, while also facilitating dust-dust collisions and aggregation. This interplay could lead to a peaked, nonlinear relationship between net deposition flux and wind speed (Penlou et al., 2023).
To address this critical knowledge gap, we formulated the hypothesis that dust accumulation under low-wind conditions exhibits a size-resolved non-monotonic dependence on wind speed. This response may reflect enhanced particle delivery and stable retention at moderate shear, followed by reduced retention at higher wind speeds. To test this hypothesis, we conducted a series of controlled experiments in a closed-circuit wind tunnel, quantified size-resolved cumulative retained mass and the temporal evolution of particle size distributions (PSDs) from an agricultural soil dust under calm air and precisely regulated low-wind speeds (0, 2, 4, and 6 m s−1). An exponential mass-accumulation model was employed to extract key kinetic parameters (e.g. characteristic time constants and effective net-accumulation rate coefficient), which were then systematically correlated with wind speed, particle size, and shifts in PSDs. Our specific objectives were: (1) to determine if an optimal low-wind speed exists for the net accumulation of fine and medium particles (e.g., PM2.5–PM30), (2) to identify whether this optimum coincides with temporal changes in the retained PSDs that may be consistent with particle aggregation, and (3) to quantify the decline in fine-particle retention at higher winds within the tested low-wind range. The findings provide experimental constraints relevant to the representation of effective surface retention in dust transport models.
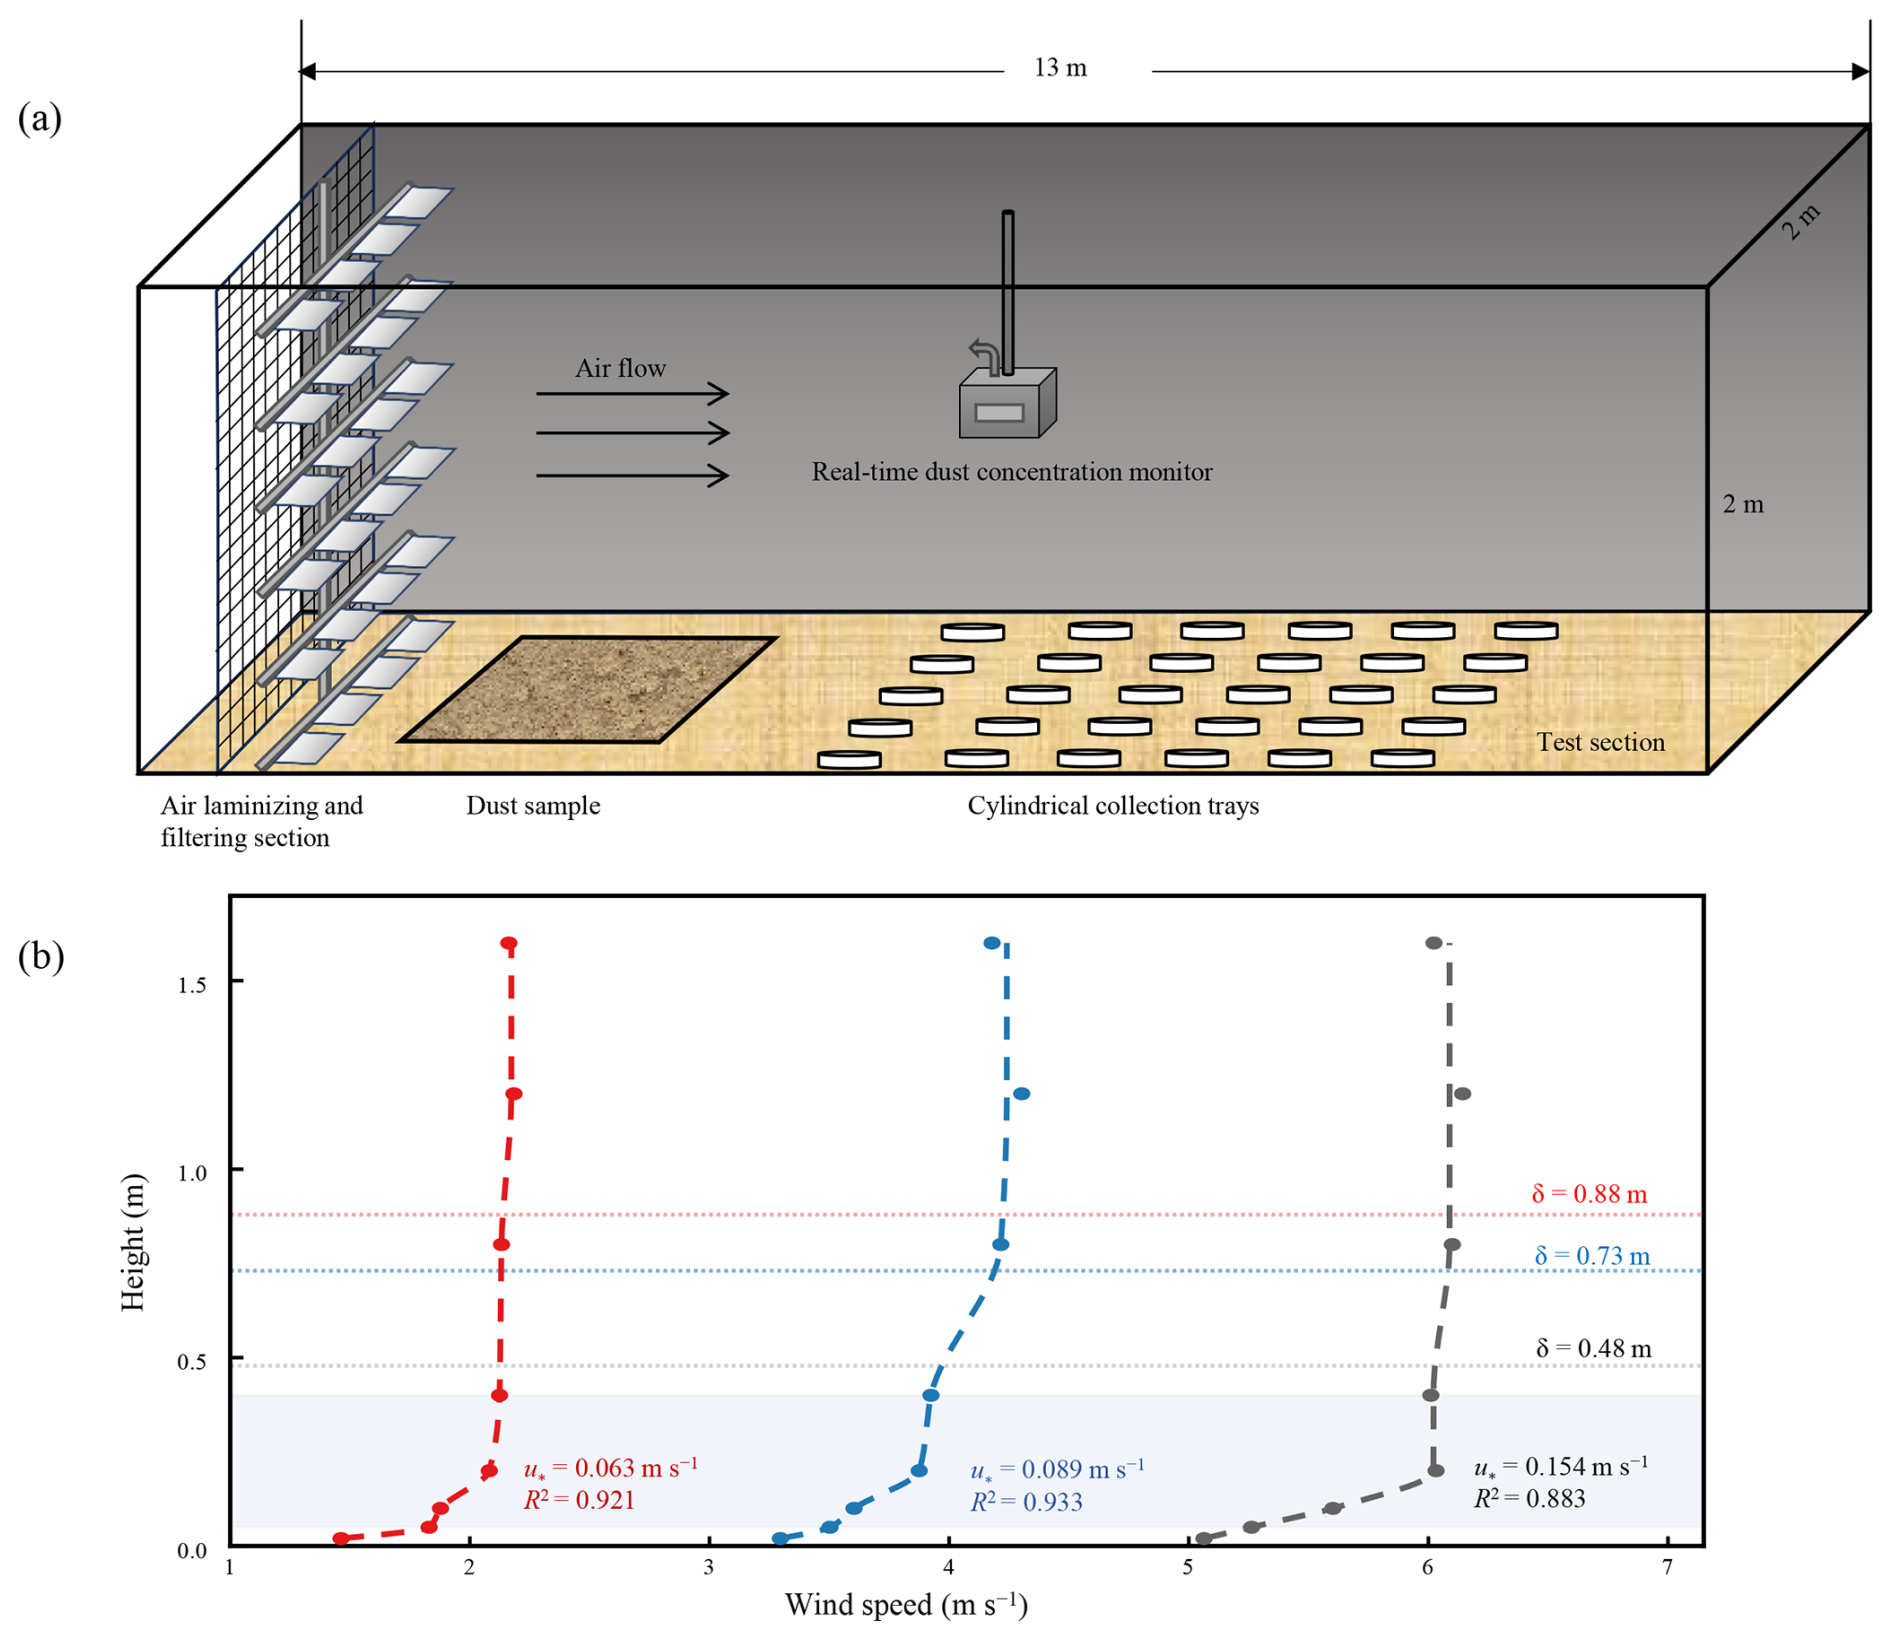
Figure 1Experimental setup and wind profiles in the closed-circuit wind tunnel. (a) Schematic layout of the vertical recirculating wind tunnel and sampling section. (b) Vertical wind-speed profiles measured along the centerline of the test section under nominal approach flows of 2, 4, and 6 m s−1. Symbols show measured values at eight heights, and dashed curves connect the measured values. The shaded band marks the height range (0.05–0.40 m) used to estimate friction velocity (u∗) from a log-linear regression. The corresponding R2 values are shown. Boundary-layer thickness (δ) was defined using the 99 % upper-profile velocity criterion.
2.1 Wind-tunnel facility and dust preparation
Experiments were conducted in a vertical recirculating wind tunnel at the Experimental Center of Desert Forestry, Chinese Academy of Forestry in Dengkou, Inner Mongolia, China (Fig. 1a). This closed-loop facility, modified from a conventional open-circuit design, enables continuous circulation of air and suspended dust, thereby facilitating long-duration observations of suspended-dust evolution and surface accumulation. The test section measures 13 m in length, with a cross section of 2 m (width) × 2 m (height). Flow is driven by four axial fans positioned downstream of the test section, allowing for continuous adjustment of the mean wind speed from 0 to 20 m s−1. Upstream of the test section, the flow is conditioned by passing through a diffuser, turning vanes, and a settling chamber equipped with honeycombs and screens, collectively ensuring a uniform approach flow with low turbulence intensity and minimal swirl (Liu et al., 2020). The dust used was sourced from the upper 0–5 cm of local cropland soil, which was air-dried and dry-sieved to obtain particles smaller than 63 µm. Before the wind-tunnel experiments, the sieved dust was further oven-dried at 105 °C for 8 h to standardize its moisture condition among experimental runs.
2.2 Experimental procedure
The experimental protocol comprised two sequential stages. (i) Strong-wind loading phase: the wind speed was initially set to 14 m s−1 for about 5 min to erode the soil source, release dust, and establish a recirculating airborne dust load within the closed-circuit tunnel. (ii) Low-wind deposition phase: immediately after the loading phase, the exposed soil source bed was completely covered with steel plates to prevent continued direct emission or re-erosion from the original source. The steel plates remained in place throughout the subsequent low-wind deposition phase. The wind speed was then reduced to a target value of 2, 4 or 6 m s−1. Additional experiments under quiescent conditions (0 m s−1) were performed in the same test section with the fans deactivated.
At the beginning of each low-wind experiment, 25 cylindrical acrylic collection trays (radius: 10 cm, rim height: 3 cm) were placed at predefined positions on the tunnel floor within the test section. Five trays were assigned to each of the five sampling times (30, 60, 90, 120 and 180 min). Each tray was exposed continuously from the beginning of the low-wind phase until its designated sampling time. Five trays were removed at their designated times to obtain the cumulative net deposition sample for a specific wind-speed-time combination, resulting in a progressive reduction in the number of trays remaining in the tunnel. The same initial tray layout, time-specific tray assignments, and retrieval sequence were used for all wind-speed treatments. Thus, the tray configuration at a given sampling time was matched among treatments, although the number of trays decreased progressively within each experimental run.
No water, glass beads, grease, adhesive, or other material was added to suppress particle rebound or re-entrainment from the tray surface. The collected mass therefore represents cumulative tray-retained net accumulation, which integrates particle arrival at the collection surface and subsequent losses through rebound, local re-entrainment, and removal from the tray.
A real-time dust concentration monitor (Fig. 1a; TD2000A-CT, Zhonggong Tiandi Technology (Beijing) Co., Ltd., Beijing, China) was operated continuously during both the loading and deposition phases to track the bulk suspended dust mass concentration in the test section. The sampling inlet was located on the longitudinal centreline of the test section, 7.5 m downstream of the test-section entrance and 1 m above the tunnel floor. The instrument had a measurement range of 0–10 000 mg m−3 (RS485 output; DC 24 V). During the loading phase, the monitor was used as a quality-control indicator to obtain comparable initial suspended dust loadings among experimental runs. The concentration recorded at the start of the low-wind phase was defined as the initial airborne dust concentration (C0). The monitor provided a single-point concentration time series at this fixed sampling location; vertical concentration profiles were not measured. For consistency throughout this study, particles of 1–10, 10–20, and 20–63 µm are referred to as fine, medium-sized, and coarse particles, respectively.
2.3 Flow characterization
Vertical wind speed profiles were measured on the longitudinal centreline of the test section, 9 m downstream of the test-section entrance and immediately downstream of the collection-tray array. The complete initial array of 25 trays was present during the profile measurements. The collection trays were arranged in the same fixed layout as in the deposition experiments, with a spacing of 20 cm between adjacent trays, and the same layout was restored before each run. Wind speed was recorded at eight heights (z = 0.02, 0.05, 0.10, 0.20, 0.40, 0.80, 1.20, and 1.60 m) under nominal wind speeds of 2, 4, and 6 m s−1 (Fig. 1b). Friction velocity u∗ was estimated from a log-linear regression of the near-surface wind profile,
where U(z) is wind speed at height z, zref = 1 m, A is the fitted slope, B is the intercept, and κ = 0.4. To ensure consistency among treatments, the regression was fitted over the common height interval of 0.05–0.40 m, which is above the tray rim height (0.03 m) and below the upper quasi-uniform portion of the profile. Therefore, the measurements at 0.80, 1.20, and 1.60 m were not included in the u∗ regression. The resulting profile-derived apparent friction velocities were 0.063, 0.089, and 0.154 m s−1 for the 2, 4, and 6 m s−1 treatments, respectively, with corresponding R2 values of 0.921, 0.933, and 0.883.
The boundary-layer thickness (δ) was defined as the first height at which the shape-preserving interpolated profile reached 0.99 U∞, where U∞ was the mean wind speed at 0.80, 1.20, and 1.60 m. Minor reversals in the measured profiles were first removed using isotonic regression before interpolation.
The upper edge of the collection trays was positioned at z = 0.03 m, corresponding to approximately 3.4 %, 4.1 %, and 6.3 % of δ, respectively. Because the profiles were measured after installation of the complete tray array, they incorporated the collective aerodynamic influence of the trays. The profiles characterize the profile-scale mean flow under the complete initial 25-tray configuration. Local flow separation and wakes around individual tray rims, as well as possible changes associated with progressive tray removal, were not resolved.
2.4 Sample analysis
The mass of dust retained in each tray was determined using an analytical balance with a resolution of 0.0001 g. Particle-size distributions (PSDs) of the deposited dust were analyzed using a laser diffraction particle-size analyzer (Eye Tech, Netherlands). To ensure accuracy and repeatability, the instrument was calibrated before each run using certified reference microspheres (20 µm and 100 nm), requiring agreement between measured and nominal diameters to be within ± 1 %. Ultrapure water blanks were analyzed to confirm background noise levels were below 0.5 %. A standard suspension was analyzed every 4 h during the measurement; if key parameters like the median diameter (D50) deviated by more than ± 2 %, the instrument was recalibrated. All measurements were performed at a circulation speed of 2000 rpm in a temperature-controlled laboratory (23 ± 1 °C). Each tray sample was measured in triplicate, and the average value was used for subsequent analysis. Particle size was reported as a volume-equivalent diameter. Particle morphology, including aspect ratio and sphericity, was not independently characterized, and no shape-dependent correction was applied in the particle-size classification.
2.5 Data processing and kinetic modeling
For each wind speed (U) and sampling-time (t) combination, the total dust mass retained in each tray was measured and the particle-size distribution (PSD) was recorded. Six cumulative diameter-threshold classes (PM2.5, PM10, PM20, PM30, PM40, and PM63) were defined from the laser-diffraction volume-equivalent diameter as Dv < 2.5, < 10, < 20, < 30, < 40, and < 63 µm, respectively. Throughout this study, the PM labels denote cumulative thresholds of laser-diffraction volume-equivalent diameter. The cumulative retained mass below each diameter threshold was then calculated as the product of the total retained mass and its corresponding cumulative volume fraction, and was then converted to an areal cumulative tray-retained mass M(t) (mg m−2) using the known tray area. For each wind-speed-time combination, five replicate trays were processed; results are summarized by the mean across replicates. The standard error of the mean (SEM, n=5) at each time point was used as the measurement uncertainty for model fitting. Before calculating D50, the differential volume fractions of each PSD were normalized to 100 %. D50 was then determined from the cumulative volume distribution by linear interpolation on the logarithmic diameter scale between the two adjacent diameter channels bracketing 50 %.
The temporal evolution of M(t) was represented by a first-order approach to an asymptote,
where a (mg m−2) is the fitted asymptotic retained mass as t→∞. k(h−1) is the effective net-accumulation rate coefficient, where larger values indicate a faster approach to the fitted asymptote. The characteristic accumulation timescale was defined as , corresponding to the time required for the fitted curve to reach approximately 63 % of a. The initial net accumulation flux is defined as the initial slope of M(t),
Because M(t), a, and J0 were not normalized by the time-varying concentration C(t), they are reported as tray-based net accumulation metrics. To assess whether small differences in initial airborne dust loading affected the wind-speed comparison, a (C0)-normalized sensitivity check was performed by scaling the retained mass with (Cref/C0), where (Cref) was the mean recorded initial concentration across the four wind-speed treatments.
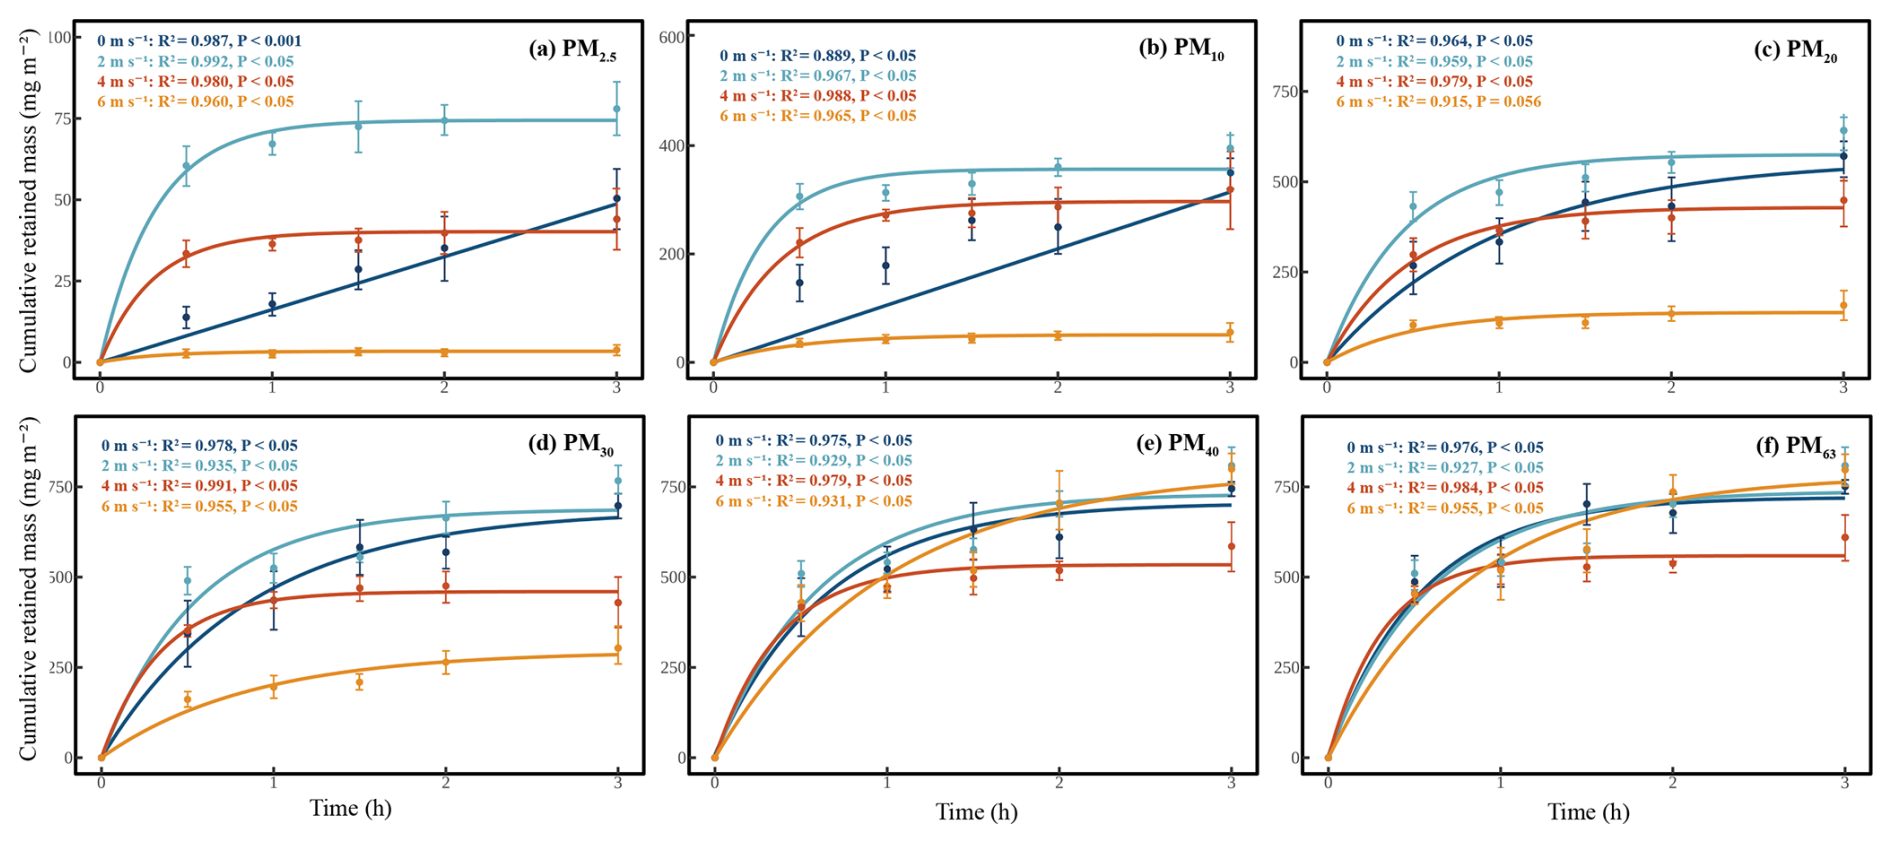
Figure 2Exponential fits of cumulative retained mass for different particle-size classes under varying wind speeds: (a) PM2.5, (b) PM10, (c) PM20, (d) PM30, (e) PM40, and (f) PM63. Symbols represent the mean cumulative retained mass M(t) (± 1 SEM, n=5 trays) at four wind speeds (0, 2, 4 and 6 m s−1). Solid curves show non-linear least-squares fits of the first-order exponential model . Legends report the coefficient of determination (R2) and P value for each fit.
Model parameters (a, k) were estimated separately for each wind-speed-size combination by weighted non-linear least squares (NLS), with weights applied to the mean at time point ti. Positive constraints (a > 0, k > 0) were enforced. Wald 95 % confidence intervals for a and k were obtained from the NLS covariance matrix. Uncertainty in the derived metric , defined by Eq. (4), was propagated by the delta method to yield 95 % CIs (used in Fig. 3b).
To quantify wind-speed dependence for each size class, J0 was related to U using linear (J0∼U) and quadratic () models; likelihood-ratio tests (LRTs) and ΔAIC were used to evaluate evidence for non-monotonicity. The wind-speed corresponding to the maximum fitted J0 response was summarized by the quadratic vertex Uopt = , with bootstrap 95 % CIs (10 000 resamples of the four (U,J0) pairs).
Many dry-deposition parameterizations describe deposition velocity for a given particle size and surface type as increasing or remaining unchanged with increasing wind speed or friction velocity, while treating resuspension separately. To quantify the departure of the present net-accumulation response from this simplified deposition-only expectation, a non-decreasing reference curve, J0,mono(U) was constructed for each size class by isotonic regression fitted to the four (U,J0) points. Deviations from the monotonic benchmark were summarized as
Here, R>1 indicates that the observed initial net accumulation flux exceeds the non-decreasing benchmark, whereas R<1 indicates that it falls below the benchmark.
All analyses were performed in R (R Core Team, 2024) (base stats for NLS, boot for resampling, ggplot2 for graphics).
3.1 Exponential kinetics of cumulative tray-retained dust accumulation
The first-order exponential model (Eq. 3) provided an excellent description of the cumulative tray-retained accumulation kinetics for all wind-speed-size combinations, with coefficients of determination (R2) ranging from 0.889 to 0.992 and 75 % of fits achieving R2>0.95 (Fig. 2). This result indicates that a single effective timescale adequately characterizes the temporal evolution of dust accumulation under experimental conditions.
Under quiescent conditions (0 m s−1), fine particles (PM2.5, PM10) accumulated slowly, as evidenced by nearly linear cumulative curves, long characteristic times (τ ≈ 4.2 h for PM2.5; 1.4 h for PM10), and small rate coefficients (k = 0.24 h−1 for PM2.5; 0.71 h−1 for PM10) (Table S2). In contrast, coarse particles (PM30–PM63) approached their fitted asymptotes within about 1 h (τ < 1 h, a ≈ 600–750 mg m−2), exhibiting behavior dominated by gravitational settling.
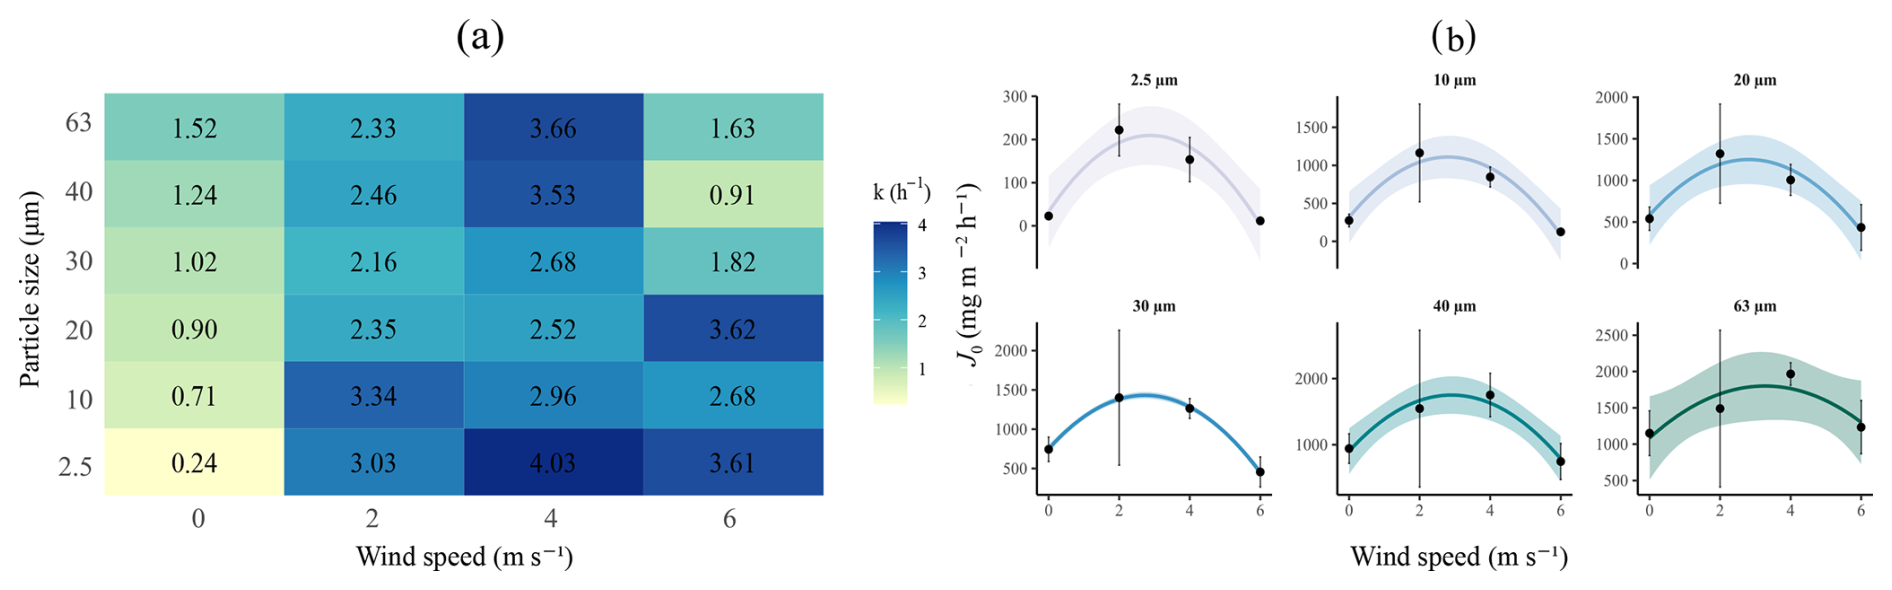
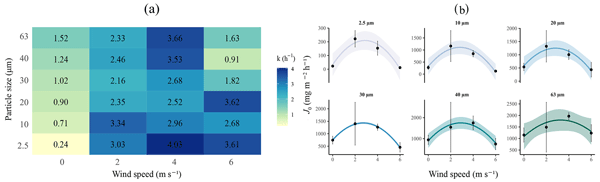
Figure 3Net accumulation kinetics and initial net accumulation flux as functions of wind speed and particle size. (a) Effective net-accumulation rate coefficient k(h−1) for each wind-speed-size combination (cell values show k). (b) Initial net accumulation flux versus wind speed U. Points are estimates and error bars are 95 % Wald confidence intervals propagated from the weighted NLS fit of with M(0)=0, n=5 trays per time point. The curve and shaded band show the quadratic fit and its 95 % confidence band.
Increasing wind speed from 0 to 2 m s−1 markedly accelerated early net accumulation across all size classes (Table S2). τ for PM2.5 shortened from 4.2 to 0.3 h (an order-of-magnitude faster approach to the fitted asymptote), while k increased from 0.24 to 3 h−1. Similarly, for PM10, τdecreased from 1.4 to 0.3 h and k increased to > 3 h−1. For medium and coarse particles, τ also decreased and k increased by factors of roughly 2–4, whereas their asymptotic loads a remained of the same order as under still air (typically within approximately 20 % of the 0 m s−1 values). In contrast, a for PM2.5 was reduced by roughly one quarter. These changes indicate that 2 m s−1 produced rapid early tray-retained accumulation, particularly for fine particles, while maintaining substantial retained mass for medium and coarse particles.
At 4 m s−1, τ remained short for all size classes (often < 0.5 h), and k stayed well above still-air values, indicating a rapid early approach to the fitted asymptote (Table S2). However, the asymptotic retained mass a for all sizes fell below their still-air values, decreasing by roughly 25 %–60 %, especially for fine-to-medium particles.
At 6 m s−1, the suppression in fine-to-medium tray-retained mass became most pronounced. For PM2.5 and PM10, a was reduced by about one order of magnitude relative to still air, indicating near-complete inhibition of effective accumulation despite still-elevated rate coefficients. Accumulation of PM20 and PM30 was also substantially suppressed. In contrast, a for the coarsest fractions (PM40, PM63) was similar to or slightly higher than under still air, but their kinetics were less favorable than at 2–4 m s−1, with longer τ and lower k compared with the low-wind optimum.
The auxiliary screening test identified an apparent critical wind-speed range of 5.87–6.01 m s−1 for marked dust mobilization from the tray surface, placing the 4 m s−1 treatment below and the 6 m s−1 treatment close to this range (Fig. S1 in the Supplement).
Analysis of characteristic times (Table S2) further shows that for most wind-speed-size combinations, τ is less than 0.5 h, indicating rapid mass accumulation during the early part of the experiments. The PSD comparison in Sect. 3.2 therefore uses the cumulative tray-retained samples collected at 0.5 and 3 h.
The concentration records were used to evaluate the comparability of initial airborne dust loading and the persistence of suspended dust during the low-wind phase. The recorded C0 ranged from 178.2 to 191.4 mg m−3, with a coefficient of variation of 3.1 % indicating comparable initial airborne dust loading among treatments. After normalizing by C0, the mean airborne concentration during the final 20 min was 5.32 %, 0.15 %, 9.27 %, and 4.24 % of C0 at 0, 2, 4, and 6 m s−1, respectively (Table S1 in the Supplement). The C0-based rescaling did not change the principal wind-speed ordering of the net-accumulation response. The 2 m s−1 treatment showed the lowest late-stage residual concentration, whereas the 4 and 6 m s−1 treatments maintained higher residual airborne concentrations, especially at 4 m s−1 (Fig. S2). This pattern indicates that the lower tray-retained mass at 4–6 m s−1 was accompanied by greater persistence of suspended dust and reduced effective transfer into stable near-surface retention.
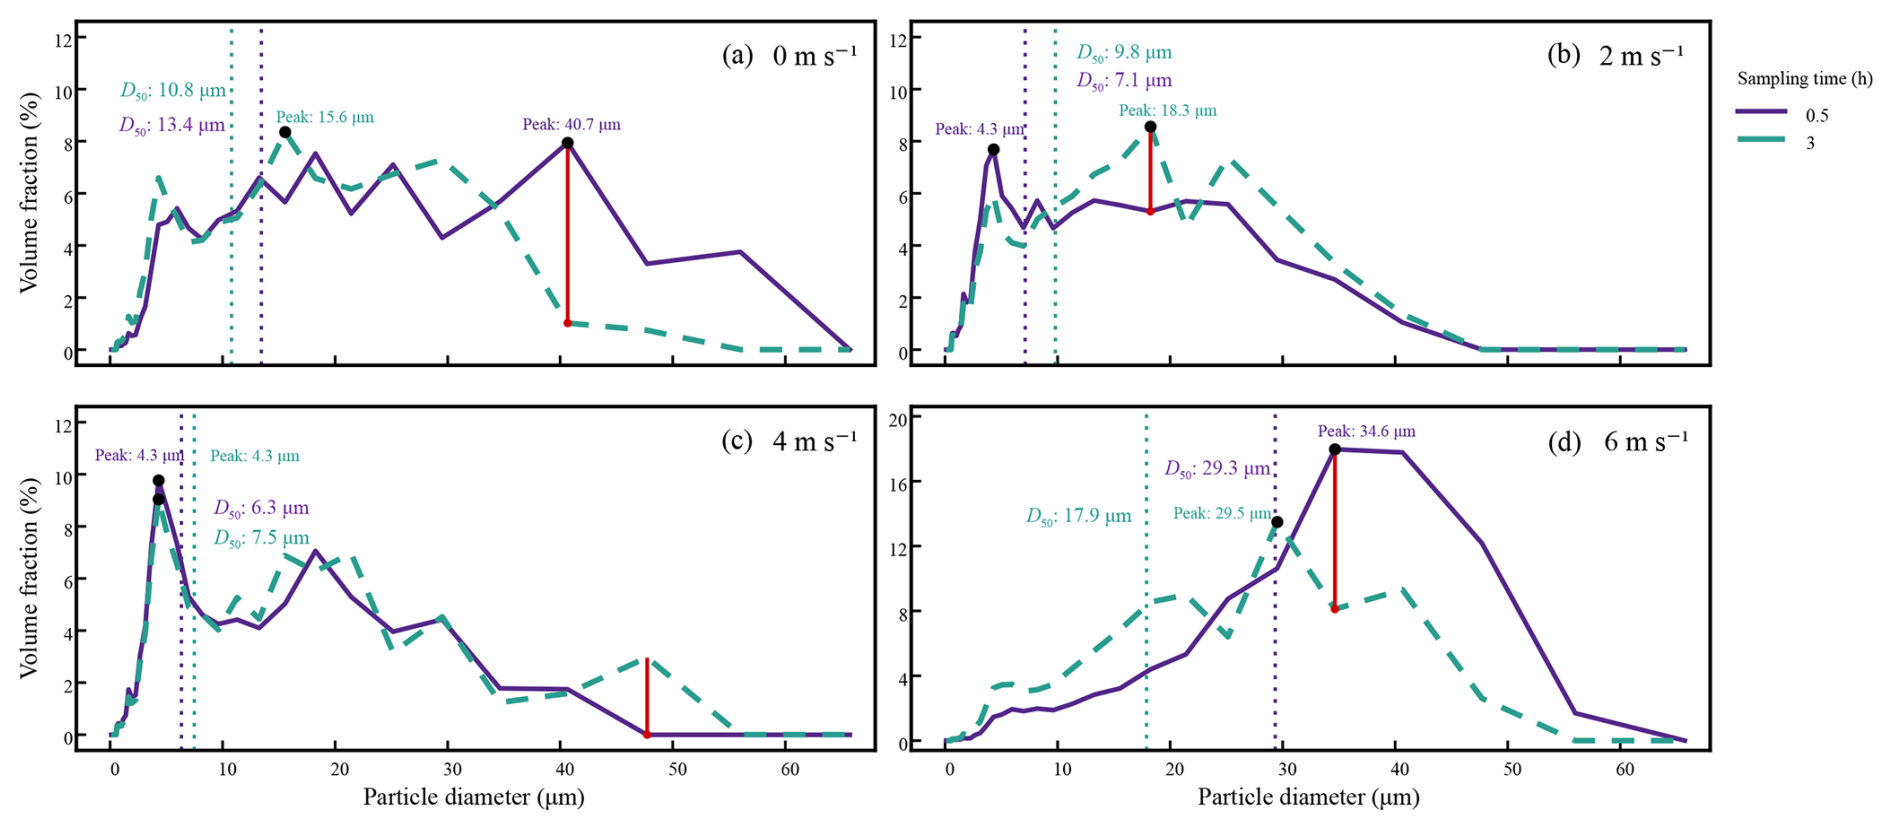
Figure 4Comparison of the volume-based particle-size distributions (PSDs) of cumulative tray-retained dust collected at 0.5 and 3 h under different wind speeds. The curves show differential volume fractions at the particle-size channels measured by laser diffraction. Solid purple and dashed teal curves represent samples collected at 0.5 and 3 h, respectively. Filled black circles indicate the modal diameters (“Peak”). Dotted vertical lines mark D50, calculated by log-linear interpolation of the normalized cumulative volume distribution. The red vertical segment marks Δmax, defined as the particle diameter at which the absolute difference in volume fraction between the two sampling times was greatest.
Figure 3 compares net accumulation dynamics across the parameter space and during the initial stage. Figure 3a illustrates the distribution of the effective net-accumulation rate coefficient k. For fine-to-medium particles (PM2.5–PM20), k increased sharply from still air to 2 m s−1 and generally remained high at 4–6 m s−1, although the wind speed corresponding to the largest k varied among size classes. The maximum k occurred at 2, 4, 6 m s−1 for PM10, PM2.5 and PM20, respectively. For PM30–PM63, the largest k occurred at 4 m s−1. Figure 3b shows that J0 was highest at 2 m s−1 among the tested wind speeds for PM2.5–PM30, and was strongly reduced at 6 m s−1 for the fine size classes. Because , the maximum initial net accumulation flux did not necessarily coincide with the maximum fitted k. Quadratic fits across the four wind-speed levels yielded a model-implied peak wind speed (Uopt) of approximately 2–3 m s−1 for PM2.5–PM40, with bootstrap 95 % confidence intervals typically spanning approximately 2.3–3.3 m s−1. The most pronounced peaked response was found in the PM30 class, whereas PM63 shows weaker evidence (Table S3).
Synthesizing Fig. 3a and b, a low-wind window centered near 2 m s−1 (model-inferred optimum around 2–3 m s−1) combines relatively high effective net-accumulation rate coefficients (Fig. 3a) with the highest observed J0 values (Fig. 3b) for PM2.5–PM30; stronger winds progressively suppress early net accumulation of these sizes and shift the relative contribution toward the coarse fraction.
3.2 Temporal evolution of cumulative tray-retained particle-size distributions
The particle-size distribution (PSD) of net accumulation dust changed between 0.5 and 3 h in a wind-speed-dependent manner (Fig. 4).
Under quiescent conditions (0 m s−1), the cumulative material collected at 0.5 h showed a prominent coarse mode, with D50 = 13.4 µm, modal diameter ≈ 40.7 µm. By 3 h, the relative contribution of particles > 30 µm had decreased markedly, while the 10–20 µm range accounted for a larger fraction of the cumulative retained material (D50 = 10.8 µm, modal diameter ≈ 15.6 µm). This temporal change is consistent with a gravity-dominated regime which coarse particles deposit first, followed by medium-sized particles.
At 2 m s−1, D50 increased from 7.1 µm at 0.5 h to 9.8 µm at 3 h, representing an increase of approximately 38 %. The modal diameter shifted from 4.3 to 18.3 µm, while volume fraction at 18.3 µm increased from 5.3 % to 8.6 %. These changes indicate progressive enrichment of medium-sized particles in the cumulative retained material under weak shear.
At 4 m s−1, the PSDs were nearly identical, both exhibiting a narrow, persistent modal diameter at 4–5 µm, with D50 increasing only slightly from 6.3 µm at 0.5 h to 7.5 µm at 3 h. The similarity between the two distributions indicates that the fine-particle-dominated size spectrum was established early and changed moderately during the remainder of the experiment.
At 6 m s−1, the cumulative material collected at 0.5 h was dominated by 30–40 µm particles, with D50 = 29.3 µm, modal diameter ≈ 34.6 µm. At 3 h, D50 decreased to 17.9 µm and the modal diameter moved to approximately 29.5 µm, accompanied by a broader contribution from particles in the 10–20 µm range. This pattern is consistent with a greater early contribution of coarse particles, followed by an increased relative contribution of finer particles in the cumulative retained material.
In summary, the cumulative PSDs reveal distinct regimes among wind-speed treatments: gravity-controlled sequential settling in still air; shear-enhanced selective enrichment of fine-medium particles at 2 m s−1; rapid establishment of a stable, fine-dominated spectrum at 4 m s−1; and a large early relative contribution of coarse particles followed by a modest shift to finer sizes at 6 m s−1.
4.1 Non-monotonic response of dust net accumulation to low wind speeds
These large-scale closed-circuit wind tunnel experiments suggest a non-monotonic tendency and size-selective response of near-surface dust deposition to low wind speeds (0–6 m s−1). The first-order exponential model captured the cumulative deposition for all size–wind combinations, indicating that net dust deposition can be approximated as a first-order kinetic process governed by a single effective time scale τ. The rate coefficient k and its reciprocal τ therefore provide robust dynamical metrics for comparing tray-retained accumulation responses across conditions.
Kinetic parameters show a consistent pattern. Deposition in still air is slow and largely controlled by gravitational settling. The introduction of weak turbulence at 2 m s−1 significantly accelerates early net accumulation of fine-to-medium particles without substantially reducing the asymptotic retained mass of medium-to-coarse particles, creating a distinct low-wind “window” for rapid and efficient dust accumulation. Quadratic fits of the initial net accumulation flux J0=ak indicate a low-wind optimum at ≈ 2–3 m s−1, with the strongest response at the experimental level of 2 m s−1.
Size-resolved PSD evolution further elucidates the size-selective nature of this response. In still air, the cumulative retained spectrum evolves sequentially from coarse to finer particles. Under weak shear (2 m s−1), D50 increased from 7.1 to 9.8 µm and the relative contribution near 18.3 µm increased, suggesting that weak turbulence not only accelerates fine-particle deposition but also facilitates their effective “coarsening” during settling, potentially involving aggregation. In contrast, at higher wind speeds (4–6 m s−1), the deposition spectrum is rapidly stabilized after an initial removal phase, entering a quasi-steady state with limited additional tray-retained accumulation and a gradual spectral shift back toward finer sizes, reflecting the strong suppression of net deposition for fine-to-medium particles.
4.2 Potential mechanisms underlying the observed accumulation patterns
4.2.1 Roles of turbulent mixing and gravitational settling
For the respirable fine particles (2–10 µm) central to this study, gravitational settling velocities (ws) estimated using the Stokes–Cunningham relationship and a representative mineral-particle density of 2650 kg m−3, are approximately 0.35–8.1 mm s−1. Their ability to penetrate the thin viscous sublayer adjacent to the surface depends critically on the efficiency of turbulent diffusion, expressed by the magnitude of the turbulent diffusive flux , rather than on gravity alone. The profile-derived apparent friction velocities (u∗) were 0.063, 0.089, and 0.154 m s−1 at nominal wind speeds of 2, 4, and 6 m s−1, respectively. The corresponding nominal near-wall viscous length scales, estimated as , where ν = 1.5 × 10⁻⁵ m2 s−1 is the kinematic viscosity of air, were approximately 1.20, 0.85, and 0.49 mm.
The relative importance of gravitational settling versus turbulent diffusion can be quantified by the Rouse number, . For particle diameters of 2–10 µm, P ranged from approximately 0.006 to 0.32 and decreased with increasing wind speed for a given particle size. These values below unity support an important role of turbulent mixing relative to gravitational settling, particularly for finer particles and at higher wind speeds.
At 2 m s−1, turbulence may have been sufficient to efficiently transport fine particles from the core flow to the top of the viscous sublayer, supporting particle transfer toward the near-surface region, yet insufficient to induce substantial resuspension. This creates favorable conditions for deposition. At higher wind speeds (4–6 m s−1), stronger turbulent mixing could prolong particle suspension and enhance horizontal redistribution near the surface.
4.2.2 Possible contribution of shear-induced aggregation
The PSD of cumulative retained material at 2 m s−1 showed the most pronounced temporal enrichment in the 10–20 µm range. This “effective coarsening” may reflect shear-induced aggregation together with size-selective transport and retention. D50 of cumulative deposited material increased from approximately 7.1 µm at 0.5 h to 9.8 µm at 3 h. Under an equivalent-sphere approximation, the characteristic volumes associated with these two diameters differ by a factor of approximately 2.6, of the same order as the combined volume of 2–3 similarly sized primary particles. This geometric comparison is consistent with limited particle clustering, although size-selective deposition and retention could also produce the observed PSD change.
This behavior is qualitatively consistent with studies of two-phase turbulent flows and cohesive particles, which often report a non-monotonic relationship between aggregate size and shear intensity, with an optimum intermediate turbulence intensity. Moderate shear can enhance collision frequencies and adhesion, forming transient clusters that increase the ensemble's settling velocity, while stronger shear leads to cluster breakup and reduced net settling (Mietta et al., 2009; Yu et al., 2022; Penlou et al., 2023; Zhao et al., 2023).
4.2.3 Possible roles of re-entrainment and horizontal redistribution
When wind speed increases to 4–6 m s−1, the fitted accumulation kinetics differed clearly from those observed at 2 m s−1. For fine-to-medium particles, k remained relatively high, whereas the asymptotic retained mass a and initial net accumulation flux J0 declined substantially. This combination represents a rapid approach to a lower retained-mass asymptote. The auxiliary screening test identified an apparent critical wind-speed range of 5.87–6.01 m s−1 for marked dust mobilization from the dust surface (Fig. S1). The 6 m s−1 treatment lay within this range, making particle rebound and local re-entrainment plausible contributors to the reduced retention. In contrast, the 4 m s−1 treatment remained well below the apparent critical range. Its lower tray-retained mass, together with the higher late-stage airborne concentration, is more consistent with continued suspension, recirculation, horizontal redistribution, and reduced stable retention.
This wind-speed dependence of net accumulation aligns with previous observations of mineral dust dry deposition and resuspension (Goossens and Rajot, 2008; Bergametti et al., 2018; Waza et al., 2019). Field intercomparisons of various passive samplers have demonstrated that dust deposition flux does not always increase monotonically with wind speed; at certain sites and for specific sampler types, apparent net deposition even decreases with increasing wind speed. This inverse relationship is typically attributed to enhanced resuspension fluxes from the surface bed, coupled with increased undercatch of coarse particles by some samplers under high wind conditions (Goossens and Rajot, 2008; Waza et al., 2019). Similarly, wind-tunnel experiments and size-resolved field measurements indicate that near the onset of active wind erosion, particle dry deposition velocities become highly sensitive to friction velocity, surface roughness, and near-surface turbulent structure (Zhang et al., 2014; Bergametti et al., 2018; Waza et al., 2019).
4.3 Implications for dust deposition parameterizations
Conventional parameterizations of particle dry deposition commonly calculate deposition velocity as a prescribed function of particle size, friction velocity, surface roughness, and land-cover type, while rebound and resuspension are represented using separate simplified treatments (Petroff and Zhang, 2010; Zhang and He, 2014; Zhang and Shao, 2014; Khan and Perlinger, 2017; Zeng et al., 2020). Classical particle-deposition frameworks account for particle-size-dependent transport and surface collection processes (Slinn, 1982), although the level of process detail differs among parameterizations. Numerical studies of particle-laden turbulent flows further show that predicted deposition rates are sensitive to turbulence closure, boundary conditions, and the treatment of near-wall velocity fluctuations (Tian and Ahmadi, 2007). However, these frameworks provide limited constraints on time-dependent net surface accumulation under low-wind conditions.
Observational studies, parameterization intercomparisons, and model-sensitivity experiments have demonstrated substantial uncertainty in particle dry deposition. Widely used parameterizations may overestimate deposition of accumulation-mode particles while underestimating coarse particle deposition over terrestrial surfaces (Petroff and Zhang, 2010; Adebiyi and Kok, 2020; Emerson et al., 2020; Farmer et al., 2021). Such size-dependent biases can affect simulated aerosol lifetime, atmospheric burden, and radiative forcing (Emerson et al., 2020). In dust simulations, differences in the representation of surface resistance, impaction collection, and particle rebound can also produce large differences in dry-deposition fluxes and atmospheric dust loading (Zeng et al., 2020).
To quantify the departure from a non-decreasing wind-speed response, the observed initial net accumulation flux J0 was compared against a non-decreasing benchmark J0,mono. For the PM2.5–PM40 cumulative classes, the observed J0 values at 2 m s−1 exceeded the benchmark by approximately 15 %–72 % (R = 1.15–1.72; Table S4). At 6 m s−1, J0 falls 45 %–91 % below the benchmark (R = 0.09–0.55), corresponding to an overestimation by factors of approximately 1.8–11 for the affected size classes. Deviations are smaller for PM63 (R ≈ 0.77 at 6 m s−1), suggesting that the non-monotonic response is most pronounced for fine-to-medium particles in the present setup.
This study yields several quantitative insights relevant to dry-deposition parameterizations in the low-wind regime: (i) a distinct peak in the initial net accumulation flux J0 occurs at approximately 2 m s−1 under the experimental conditions, whereas speeds of 4–6 m s−1 substantially reduce net deposition of fine-to-medium particles; (ii) kinetic time scales vary non-monotonically, with the characteristic time τ for fine particles reaching a minimum at 2–4 m s−1 while the fitted asymptotic retained mass a declines sharply at 4–6 m s−1, indicating that deposition rate and eventual deposited fraction do not vary synchronously with wind speed; (iii) distinct temporal evolution of the PSD emerges, with rapid progression toward the 10–20 µm range at 2 m s−1 contrasted against early spectral stabilization at 4–6 m s−1.
These findings complement multi-sampler comparison studies at the Izaña mountain station and evaluations of deposition schemes over rough surfaces (Bergametti et al., 2018; Waza et al., 2019). While previous studies highlighted flux-closure issues from an observation-parameterization discrepancy standpoint, our controlled experiments provide process-level understanding of wind-speed influences.
For numerical simulations, the size-resolved a, k, τ, and J0 values provide empirical constraints on the temporal response of effective surface retention under matched dust and surface conditions. Existing size-resolved dry-deposition schemes describe particle removal as a function of particle size, friction velocity, surface roughness, and surface collection properties, while model evaluations have demonstrated substantial sensitivity to the treatment of collection efficiency and particle rebound (Petroff and Zhang, 2010; Zhang and Shao, 2014; Khan and Perlinger, 2017; Zeng et al., 2020). In a coupled parameterization, k and τ characterize the adjustment timescale, a describes the fitted asymptotic retained mass under a specified initial dust loading, and J0 constrains the initial net surface flux. The observed response supports coupling conventional particle deposition with wind and size-dependent stable retention and a surface-specific, threshold-dependent re-entrainment term. The high J0 near 2 m s−1 and its decline toward 6 m s−1 provide benchmark behavior for evaluating such coupled parameterizations across the low-wind regime.
From a global dust cycle perspective, this non-monotonicity implies that net dry deposition in source regions under low post-dust wind conditions may be substantially higher than currently modeled, resulting in more rapid atmospheric dust load reduction and shorter effective transport distances. Conversely, under elevated background winds or complex topography, resuspension can extend fine particle residence time and enhance long-range transport fractions. These interpretations align with recent observationally constrained reassessments of dust size distributions and climatic impacts (Kok et al., 2017; Adebiyi and Kok, 2020; Emerson et al., 2020; Kok et al., 2021, 2023), which consistently identify model tendencies to underestimate coarse dust and near-source deposition while overestimating long-range transport and remote ocean dust burdens. Systematic underestimation of accumulation-mode and coarse particle deposition under weak-to-moderate turbulence would weaken near-source depositional sinks in models, likely resulting in overestimated dust load and radiative effects in remote oceanic and high-latitude regions.
4.4 Uncertainties and future work
First, the use of a single agricultural soil dust (< 63 µm) limits immediate generalization of the present results to dust from other origins, such as desert crusts, loess, or urban construction materials. Differences among dust materials may influence the observed kinetics through variations in airborne particle-size distribution, particle density and morphology, mineral composition, interparticle cohesion, and initial aggregation state. Coarser or denser particles would generally be expected to settle more rapidly, potentially producing a larger initial net accumulation flux J0, a shorter characteristic time τ, and a more gravity-dominated response. Finer, lower-density, or more porous particles may remain suspended for longer periods (Richards-Thomas and McKenna-Neuman, 2020). Mineralogy, specific surface area, and surface chemistry may further modify particle cohesion and aggregation. A stronger tendency to aggregate under weak shear could increase the effective settling size, whereas aggregate breakup under stronger shear could reduce retained mass (Mietta et al., 2009; Yu et al., 2022; Penlou et al., 2023). Consequently, both the magnitude of the observed low-wind maximum and the wind speed at which it occurs may vary among dust types.
Second, tray-retained mass characterizes effective near-surface retention under the present closed-circuit wind-tunnel and collector configuration. Particles outside the tray-retained fraction may have remained in recirculation or deposited on the side walls, ceiling, turning vanes, fan assembly, steel cover plate, and other internal surfaces, which were not quantified. The tray dimensions, 3 cm rim, smooth acrylic surface, and progressive removal of trays may also have affected local flow separation, particle rebound, and re-entrainment. The same initial layout, time-specific tray assignments, and retrieval sequence were used for all treatments, supporting comparisons among wind speeds. Absolute retained masses may vary for natural surfaces or other collector geometries.
Third, soil moisture was not investigated as an independent experimental variable. The sieved dust was oven-dried at 105 °C for 8 h before each experiment, and the reported kinetics therefore represent dry dust conditions. Residual gravimetric water content was not measured after oven drying. Soil moisture can modify interparticle cohesion, the threshold wind speed for particle mobilization, aggregation, particle-surface adhesion, and resistance to re-entrainment (Fécan et al., 1999; Shao, 2008; Kok et al., 2012). Because the same dust batch and drying procedure were used for all wind-speed treatments, moisture differences are unlikely to explain the observed differences among treatments. However, the magnitude of the low-wind maximum and the wind speed at which it occurs may differ under moist field conditions.
Finally, particle shape was not independently characterized. Mineral dust particles are commonly non-spherical, and their flatness, elongation, and orientation can alter aerodynamic drag and settling velocity (Ginoux, 2003; Bagheri and Bonadonna, 2016). Consequently, volume-equivalent diameter alone does not fully describe the aerodynamic behavior of particles within each cumulative diameter-threshold class. Particle shape may have influenced aerodynamic transport, settling velocity, and surface retention, thereby affecting the absolute retained mass and fitted kinetic descriptors. Future experiments combining laser diffraction with microscopic measurements of aspect ratio and sphericity would allow this effect to be quantified.
This study quantified size-resolved net accumulation of mineral dust in a closed-circuit recirculating wind tunnel under calm air and low winds (0–6 m s−1). Across all size-wind combinations, the temporal evolution of cumulative retained mass was well described by a first-order approach-to-asymptote model (R2=0.889–0.992), enabling extraction of an asymptotic cumulative retained mass (a), effective net-accumulation rate coefficient (k), characteristic timescale (τ), and initial net accumulation flux (J0). These kinetic descriptors provide size-resolved empirical constraints on the temporal response of effective surface retention.
Within the tested wind-speed range, fine-to-medium size classes (PM2.5–PM40) show their highest net accumulation at 2 m s−1 and lower accumulation at higher winds, with the strongest evidence for a peaked J0 response in the PM30 class. The fitted parameters indicate that increasing wind speed can accelerate the approach to the fitted asymptote (larger k; shorter τ), while the ultimate retained mass a declines at higher winds within the tested range. Quadratic fits across the four wind-speed levels suggest a potential maximum in J0 near 2–3 m s−1 for several size classes, but the inferred peak location remains tentative given the limited number of wind-speed treatments.
A conceptual interpretation consistent with these patterns is that an intermediate low-wind regime provides sufficient turbulent transport to promote particle transfer and stable retention while shear-driven particle rebound, re-entrainment, and horizontal redistribution remain comparatively limited; at higher winds, these competing processes may increasingly constrain the retained mass.
Overall, these measurements offer process-based constraints on low-wind dust accumulation and motivate refinement of dry-deposition parameterizations to represent the possibility of non-monotonic behavior and size-dependent regime shifts. Extending this framework to realistic boundary-layer turbulence and heterogeneous surfaces will require targeted observations and simulations of near-surface particle exchange.
The data and analysis code supporting this study are publicly available on Zenodo (https://doi.org/10.5281/zenodo.18264330, Jia and Liu, 2026).
The Supplement accompanying this article contains Figs. S1 and S2 and Tables S1–S4. The supplement related to this article is available online at https://doi.org/10.5194/acp-26-14245-2026-supplement.
ZL, ZW, YuaL, and ZX conceived the research idea and contributed to the experimental design. RJ led the experimental design and execution, performed the data analysis, and wrote the first draft of the manuscript. CB contributed substantially to the experiments, data processing, and manuscript preparation. CZ contributed to data analysis and interpretation. YutL, QM, WL and LZ assisted with part of the experimental work. WK and FL provided critical revisions and constructive comments that improved the manuscript. JQ and ZL supervised the study. All authors reviewed and approved the final manuscript.
The contact author has declared that none of the authors has any competing interests.
Publisher's note: Copernicus Publications remains neutral with regard to jurisdictional claims made in the text, published maps, institutional affiliations, or any other geographical representation in this paper. The authors bear the ultimate responsibility for providing appropriate place names. Views expressed in the text are those of the authors and do not necessarily reflect the views of the publisher.
We thank the Experimental Center of Desert Forestry, Chinese Academy of Forestry, for providing the experimental facilities and technical support.
This study was supported by the Open Project of Inner Mongolia Academy of Forestry Science (grant no. KF2024ZD08), the Natural Science Foundation of Inner Mongolia (grant no. 2024LHMS03039), the National Natural Science Foundation of China (grant nos. 32401668 and 42377458) and the China Postdoctoral Science Foundation (grant no. 2024M753463).
This paper was edited by Maria Kanakidou and reviewed by two anonymous referees.
Adebiyi, A. A. and Kok, J. F.: Climate models miss most of the coarse dust in the atmosphere, Sci. Adv., 6, eaaz9507, https://doi.org/10.1126/sciadv.aaz9507, 2020.
Bagheri, G. and Bonadonna, C.: On the drag of freely falling non-spherical particles, Powder Technol., 301, 526–544, https://doi.org/10.1016/j.powtec.2016.06.015, 2016.
Bergametti, G., Marticorena, B., Rajot, J.-L., Foret, G., Alfaro, S. C., and Laurent, B.: Size-resolved dry deposition velocities of dust particles: in situ measurements and parameterizations testing, J. Geophys. Res.-Atmos., 123, 11080–11099, https://doi.org/10.1029/2018JD028964, 2018.
Emerson, E. W., Hodshire, A. L., DeBolt, H. M., Bilsback, K. R., Pierce, J. R., McMeeking, G. R., and Farmer, D. K.: Revisiting particle dry deposition and its role in radiative effect estimates, P. Natl. Acad. Sci. USA, 117, 26076–26082, https://doi.org/10.1073/pnas.2014761117, 2020.
Farmer, D. K., Boedicker, E. K., and DeBolt, H. M.: Dry deposition of atmospheric aerosols: approaches, observations, and mechanisms, Annu. Rev. Phys. Chem., 72, 375–397, https://doi.org/10.1146/annurev-physchem-090519-034936, 2021.
Fécan, F., Marticorena, B., and Bergametti, G.: Parametrization of the increase of the aeolian erosion threshold wind friction velocity due to soil moisture for arid and semi-arid areas, Ann. Geophys., 17, 149–157, https://doi.org/10.1007/s00585-999-0149-7, 1999.
Gallagher, M. W., Nemitz, E., Dorsey, J. R., Fowler, D., Sutton, M. A., Flynn, M., and Duyzer, J.: Measurements and parameterizations of small aerosol deposition velocities to grassland, arable crops, and forest: influence of surface roughness length on deposition, J. Geophys. Res.-Atmos., 107, AAC 8-1–AAC 8-10, https://doi.org/10.1029/2001JD000817, 2002.
Ginoux, P.: Effects of nonsphericity on mineral dust modeling, J. Geophys. Res.-Atmos., 108, 4052, https://doi.org/10.1029/2002JD002516, 2003.
Goossens, D. and Rajot, J. L.: Techniques to measure the dry aeolian deposition of dust in arid and semi-arid landscapes: a comparative study in West Niger, Earth Surf. Proc. Land., 33, 178–195, https://doi.org/10.1002/esp.1533, 2008.
Jia, R. and Liu, Z.: Quantification of dust deposition in weak turbulent conditions, Zenodo [data set], https://doi.org/10.5281/zenodo.18264330, 2026.
Jickells, T. D., An, Z. S., Andersen, K. K., Baker, A. R., Bergametti, G., Brooks, N., Cao, J. J., Boyd, P. W., Duce, R. A., Hunter, K. A., Kawahata, H., Kubilay, N., LaRoche, J., Liss, P. S., Mahowald, N., Prospero, J. M., Ridgwell, A. J., Tegen, I., and Torres, R.: Global iron connections between desert dust, ocean biogeochemistry, and climate, Science, 308, 67–71, https://doi.org/10.1126/science.1105959, 2005.
Khan, T. R. and Perlinger, J. A.: Evaluation of five dry particle deposition parameterizations for incorporation into atmospheric transport models, Geosci. Model Dev., 10, 3861–3888, https://doi.org/10.5194/gmd-10-3861-2017, 2017.
Kok, J. F., Parteli, E. J. R., Michaels, T. I., and Karam, D. B.: The physics of wind-blown sand and dust, Rep. Prog. Phys., 75, 106901, https://doi.org/10.1088/0034-4885/75/10/106901, 2012.
Kok, J. F., Albani, S., Mahowald, N. M., and Ward, D. S.: An improved dust emission model – Part 2: Evaluation in the Community Earth System Model, with implications for the use of dust source functions, Atmos. Chem. Phys., 14, 13043–13061, https://doi.org/10.5194/acp-14-13043-2014, 2014.
Kok, J. F., Ridley, D. A., Zhou, Q., Miller, R. L., Zhao, C., Heald, C. L., Ward, D. S., Albani, S., and Haustein, K.: Smaller desert dust cooling effect estimated from analysis of dust size and abundance, Nat. Geosci., 10, 274–278, https://doi.org/10.1038/ngeo2912, 2017.
Kok, J. F., Adebiyi, A. A., Albani, S., Balkanski, Y., Checa-Garcia, R., Chin, M., Colarco, P. R., Hamilton, D. S., Huang, Y., Ito, A., Klose, M., Li, L., Mahowald, N. M., Miller, R. L., Obiso, V., Pérez García-Pando, C., Rocha-Lima, A., and Wan, J. S.: Contribution of the world's main dust source regions to the global cycle of desert dust, Atmos. Chem. Phys., 21, 8169–8193, https://doi.org/10.5194/acp-21-8169-2021, 2021.
Kok, J. F., Storelvmo, T., Karydis, V. A., Adebiyi, A. A., Mahowald, N. M., Evan, A. T., He, C., and Leung, D. M.: Mineral dust aerosol impacts on global climate and climate change, Nat. Rev. Earth Environ., 4, 71–86, https://doi.org/10.1038/s43017-022-00379-5, 2023.
Kong, S. S.-K., Fu, J. S., Lin, N.-H., Sheu, G.-R., and Huang, W.-S.: Modeling CMAQ dry deposition treatment over the western Pacific: a distinct characteristic of mineral dust and anthropogenic aerosols, Atmos. Chem. Phys., 25, 7245–7268, https://doi.org/10.5194/acp-25-7245-2025, 2025.
Liu, M., Wang, Z., and Xin, Z.: Vertical extensible comprehensive circulating wind tunnel with track platform, Chinese Utility Model Patent CN210774598U, https://patents.google.com/patent/CN210774598U/en (last access: 3 October 2026), 2020.
Maggi, F., Mietta, F., and Winterwerp, J. C.: Effect of variable fractal dimension on the floc size distribution of suspended cohesive sediment, J. Hydrol., 343, 43–55, https://doi.org/10.1016/j.jhydrol.2007.05.035, 2007.
Mahowald, N. M., Kloster, S., Engelstaedter, S., Moore, J. K., Mukhopadhyay, S., McConnell, J. R., Albani, S., Doney, S. C., Bhattacharya, A., Curran, M. A. J., Flanner, M. G., Hoffman, F. M., Lawrence, D. M., Lindsay, K., Mayewski, P. A., Neff, J., Rothenberg, D., Thomas, E., Thornton, P. E., and Zender, C. S.: Observed 20th century desert dust variability: impact on climate and biogeochemistry, Atmos. Chem. Phys., 10, 10875–10893, https://doi.org/10.5194/acp-10-10875-2010, 2010.
Mietta, F., Chassagne, C., Manning, A. J., and Winterwerp, J. C.: Influence of shear rate, organic matter content, pH and salinity on mud flocculation, Ocean Dynam., 59, 751–763, https://doi.org/10.1007/s10236-009-0231-4, 2009.
Mostamandi, S., Ukhov, A., Engelbrecht, J., Shevchenko, I., Osipov, S., and Stenchikov, G.: Fine and coarse dust effects on radiative forcing, mass deposition, and solar devices over the Middle East, J. Geophys. Res.-Atmos., 128, e2023JD039479, https://doi.org/10.1029/2023JD039479, 2023.
Penlou, B., Roche, O., Manga, M., and van den Wildenberg, S.: Experimental measurement of enhanced and hindered particle settling in turbulent gas–particle suspensions, and geophysical implications, J. Geophys. Res.-Sol. Ea., 128, e2022JB025809, https://doi.org/10.1029/2022JB025809, 2023.
Petroff, A. and Zhang, L.: Development and validation of a size-resolved particle dry deposition scheme for application in aerosol transport models, Geosci. Model Dev., 3, 753–769, https://doi.org/10.5194/gmd-3-753-2010, 2010.
R Core Team: R: A language and environment for statistical computing, version 4.4.1, R Foundation for Statistical Computing, Vienna, Austria, https://www.R-project.org/ (last access: 3 October 2026), 2024.
Richards-Thomas, T. and McKenna-Neuman, C.: Laboratory investigation of particle-scale factors affecting the settling velocity of volcaniclastic dust, J. Geophys. Res.-Atmos., 125, e2020JD032660, https://doi.org/10.1029/2020JD032660, 2020.
Saylor, R. D., Baker, B. D., Lee, P., Tong, D., Pan, L., and Hicks, B. B.: The particle dry deposition component of total deposition from air quality models: right, wrong or uncertain?, Tellus B, 71, 1550324, https://doi.org/10.1080/16000889.2018.1550324, 2019.
Shao, Y. (Ed.): Physics and Modelling of Wind Erosion, 2nd edn., Atmospheric and Oceanographic Sciences Library, vol. 37, Springer, Dordrecht, https://doi.org/10.1007/978-1-4020-8895-7, 2008.
Shao, Y., Raupach, M. R., and Findlater, P. A.: Effect of saltation bombardment on the entrainment of dust by wind, J. Geophys. Res., 98, 12719–12726, https://doi.org/10.1029/93JD00396, 1993.
Slinn, W. G. N.: Predictions for particle deposition to vegetative canopies, Atmos. Environ., 16, 1785–1794, https://doi.org/10.1016/0004-6981(82)90271-2, 1982.
Tegen, I. and Fung, I.: Modeling of mineral dust in the atmosphere: sources, transport, and optical thickness, J. Geophys. Res.-Atmos., 99, 22897–22914, https://doi.org/10.1029/94JD01928, 1994.
Tian, L. and Ahmadi, G.: Particle deposition in turbulent duct flows—comparisons of different model predictions, J. Aerosol Sci., 38, 377–397, https://doi.org/10.1016/j.jaerosci.2006.12.003, 2007.
Waza, A., Schneiders, K., May, J., Rodríguez, S., Epple, B., and Kandler, K.: Field comparison of dry deposition samplers for collection of atmospheric mineral dust: results from single-particle characterization, Atmos. Meas. Tech., 12, 6647–6665, https://doi.org/10.5194/amt-12-6647-2019, 2019.
Wesely, M. L.: Parameterization of surface resistances to gaseous dry deposition in regional-scale numerical models, Atmos. Environ., 23, 1293–1304, https://doi.org/10.1016/0004-6981(89)90153-4, 1989.
Wu, C., Lin, Z., and Liu, X.: The global dust cycle and uncertainty in CMIP5 (Coupled Model Intercomparison Project phase 5) models, Atmos. Chem. Phys., 20, 10401–10425, https://doi.org/10.5194/acp-20-10401-2020, 2020a.
Wu, M., Liu, X., Yu, H., Wang, H., Shi, Y., Yang, K., Darmenov, A., Wu, C., Wang, Z., Luo, T., Feng, Y., and Ke, Z.: Understanding processes that control dust spatial distributions with global climate models and satellite observations, Atmos. Chem. Phys., 20, 13835–13855, https://doi.org/10.5194/acp-20-13835-2020, 2020b.
Yu, M., Yu, X., Balachandar, S., and Manning, A. J.: Floc size distributions of cohesive sediment in homogeneous isotropic turbulence, Front. Earth Sci., 10, 815652, https://doi.org/10.3389/feart.2022.815652, 2022.
Zeng, Y., Wang, M., Zhao, C., Chen, S., Liu, Z., Huang, X., and Gao, Y.: WRF-Chem v3.9 simulations of the East Asian dust storm in May 2017: modeling sensitivities to dust emission and dry deposition schemes, Geosci. Model Dev., 13, 2125–2147, https://doi.org/10.5194/gmd-13-2125-2020, 2020.
Zhang, J. and Shao, Y.: A new parameterization of particle dry deposition over rough surfaces, Atmos. Chem. Phys., 14, 12429–12440, https://doi.org/10.5194/acp-14-12429-2014, 2014.
Zhang, J., Shao, Y., and Huang, N.: Measurements of dust deposition velocity in a wind-tunnel experiment, Atmos. Chem. Phys., 14, 8869–8882, https://doi.org/10.5194/acp-14-8869-2014, 2014.
Zhang, L. and He, Z.: Technical Note: An empirical algorithm estimating dry deposition velocity of fine, coarse and giant particles, Atmos. Chem. Phys., 14, 3729–3737, https://doi.org/10.5194/acp-14-3729-2014, 2014.
Zhao, K., Vowinckel, B., Hsu, T.-J., Bai, B., and Meiburg, E.: Cohesive sediment: intermediate shear produces maximum aggregate size, J. Fluid Mech., 965, A5, https://doi.org/10.1017/jfm.2023.380, 2023.