
the Creative Commons Attribution 4.0 License.
the Creative Commons Attribution 4.0 License.
 | 09 Oct 2026
Forest and bioenergy expansion amplifies climate warming by accelerating regional cloud loss
Nanjian Liu
Zhixin Hao

Siyou Xia
Peng Zhao
Land use and cover change (LUCC) can exacerbate cloud-mediated climate warming, yet long-term cloud responses to contrasting LUCC pathways remain poorly quantified. Here, we perform transient simulations based on the fully coupled Community Earth System Model (CESM) under the SSP1-2.6 scenario to quantify how long-term cloud trends respond to large-scale idealized afforestation (AF50, conversion of grassland or shrubland to forest), idealized bioenergy expansion (BE50, sugarcane expansion), and realistic afforestation (REAL). AF50 drives a pronounced vertical restructuring of cloud trends, steepening mid-level cloud decline and accelerating low-level cloud loss from −0.0153 ± 0.0030 % yr−1 in the control simulation (CTL) to −0.0175 ± 0.0036 % yr−1, corresponding to 1.14 times the CTL rate globally and 1.52 times over land. Concurrently, it amplifies the global increase in high-level clouds by a factor of 1.5 and accelerates total cloud cover loss over land. Bioenergy expansion induces a similar but weaker vertical shift, whereas realistic afforestation slows the loss rate of low- and mid-level clouds and suppresses regional warming. Interpretable machine learning identifies changes in relative-humidity trends as the highest-ranked predictor of LUCC-induced changes in low-level cloud trends, with relative importance values of 20.4 %, 20.4 %, and 15.3 % under AF50, BE50, and REAL, respectively. The simulated low-level cloud response is consistent with surface darkening reducing albedo, increasing sensible heat flux, deepening the planetary boundary layer, enhancing dry-air entrainment, and raising the lifting condensation level relative to the boundary-layer top, thereby suppressing low-level cloud formation. The cloud response is also modulated by remote atmospheric adjustment. The accelerated depletion of low-level clouds strengthens positive shortwave cloud radiative forcing, while the concurrent increase in high-level clouds enhances longwave warming, together amplifying regional warming hotspots. These results demonstrate that larger-scale forest expansion does not necessarily provide greater climate cooling benefits; the sign and magnitude of the outcome depend not only on the latitude band of land conversion but, more critically, on the type of land conversion.
- Article
(16290 KB) - Full-text XML
-
Supplement
(13543 KB) - BibTeX
- EndNote


Large-scale atmospheric circulation systems on Earth directly facilitate cloud formation through thermodynamic uplift and cooling mechanisms (Boucher et al., 2013; Klein et al., 2017; Nomokonova et al., 2020). Clouds play a crucial role in modulating the radiative energy balance at the top of the atmosphere (TOA) and the Earth's surface, with their impacts indirectly linked to temperature variations (Schneider, 1972; Karl et al., 1993; Bretherton and Hartmann, 2009; Boehm and Thompson, 2023). For instance, low-level clouds, characterized by high albedo and significant optical depth, exert a substantial net cooling effect by reducing surface solar irradiance (Chen et al., 2000). In contrast, optically thin high-altitude clouds, such as cirrus, generally exert a weaker shortwave cooling effect because of their relatively low reflectivity, while their low cloud-top temperatures strongly reduce outgoing longwave radiation, thereby producing a net warming radiative effect (Liou and Ou, 1983; L'Ecuyer et al., 2019). The modulation of radiative balance and temperature by clouds is profoundly contingent upon their physical attributes, including type, thickness, liquid water path, and the dimensions of constituent particles (Albrecht, 1989; Stephens, 2005). The characteristics of cloud cover make it possible for them to play an amplifying role in climate warming (Ceppi and Nowack, 2021; Liu et al., 2025).
Clouds have been demonstrated to exert positive cloud feedback in nearly all climate models (Kiehl, 2007; Zelinka et al., 2013, 2017, 2020). Recent studies integrating satellite observations substantiate this assertion, revealing that cloud belts in equatorial and mid-latitude regions are contracting at a rate of 1.5 %–3 % per decade (Tselioudis et al., 2025). This subtle disparity between incident and reflected radiation, arising from variations in cloud fraction, exacerbates Earth's planetary energy imbalance and amplifies climate warming (Zhou et al., 2016; Li et al., 2024; Luo et al., 2024a; Mauritsen et al., 2025; Shi et al., 2025). Further evidence indicates that the diminution of low-level cloud cover in certain regions during the initial two decades of the 21st century has directly intensified anomalous regional temperature elevations, thereby facilitating the emergence of new climate warming hotspots (Tselioudis et al., 2024, 2025). Contemporaneous investigations elucidate that the recent widening of Earth's energy imbalance gap and record-breaking temperature highs are attributable to a marked decline in low-level cloud cover (Loeb et al., 2024; Goessling et al., 2025), with the underlying driver of cloud cover decrease being the escalation of greenhouse gas emissions from anthropogenic activities (Luo et al., 2024a). Among these, land use changes since the Industrial Revolution have contributed approximately one-third of the greenhouse warming through the emission of greenhouse gases (Houghton, 1999; Goldewijk and Ramankutty, 2004; Foley et al., 2005; van der Werf et al., 2009; Hong et al., 2021). Nevertheless, it remains unknown whether shifts in surface land cover types will render clouds less climatically beneficial and contribute to the formation of new warming hotspots.
Large-scale land use and cover change (LUCC) is altering circulation patterns in local and remote regions (Portmann et al., 2022). Forests, as a common form of land cover, are widely recognized for absorbing atmospheric carbon dioxide (CO2) and mitigating climate warming (Peng et al., 2014). Changes in forests have been observed to exhibit significant interactions in heat fluxes and moisture between the surface and atmosphere from annual to seasonal scales; alterations in turbulence and water cycles will inevitably disrupt the atmospheric background for cloud formation and may reshape climate warming hotspots (Lian et al., 2022; Cheng et al., 2024). For instance, darker-colored forests absorb more solar radiation, leading to increased local radiation, whereby the absorbed additional energy is partitioned into sensible heat flux to heat the surface and the atmospheric temperature at the bottom of the boundary layer; this absorbed heat promotes the evaporation of surface and atmospheric moisture, thereby facilitating the development of shallow cumulus clouds (Ek and Holtslag, 2004). Compared to other vegetation, forests possess larger leaf area index (LAI) (Alkama and Cescatti, 2016), therefore, large-scale forest expansion enhances evapotranspiration by replacing croplands or grasslands, elevating atmospheric water vapor content and optimizing condensation environments, thereby increasing cloud cover and mitigating regional warming effects. Prior studies in Europe also indicate that forests overhead possess greater potential for cloud formation (Teuling et al., 2017). Another study on afforestation also demonstrates that the presence of forests augments low-level cloud amounts, and it is projected to yield positive climate benefits through such enhanced low-level cloud fraction; however, in regions with snow cover, this may result in diminished cloud amounts and engender converse climate effects (Duveiller et al., 2018, 2021; Breil et al., 2024). Recent studies have increasingly emphasized the critical role of cloud feedback in modulating the net climate impacts of land cover changes. For instance, Luo et al. (2024b) demonstrated that decreased cloud cover following deforestation partially offsets the cooling effect caused by increased surface albedo. Furthermore, Dror and Feingold. (2026) quantified how Amazon forest loss alters cloud properties and cloud albedo, exerting all-sky biophysical cooling feedback. These findings highlight the strong coupling between forest cover dynamics and cloud albedo responses, reinforcing the need to rigorously evaluate cloud-mediated radiative effects in land-use change scenarios.
Another distinctly divergent land use changes, namely the expansion of bioenergy crops, is less commonly implemented than forests owing to its comparatively diminished CO2 sequestration capacity, yet it can engender sufficiently substantial climate mitigation extents through bio-geochemical and bio-geophysical processes (Georgescu et al., 2011; Wang et al., 2021; Cheng et al., 2024). However, conversely, the cultivation of bioenergy crops may precipitate unintended ramifications, such as the depletion of deep soil moisture and the amplification of water resource deficits (Righelato and Spracklen, 2007; Cheng et al., 2022; Li et al., 2023), with these adverse effects typically manifesting more pronouncedly at regional scales than at global scales (Hallgren et al., 2013). In contradistinction to the elevated evapotranspiration rates of forests, low-transpiration bioenergy crops (such as switchgrass) commonly exhibit lower LAI, a physical attribute that may diminish the efficiency of moisture conveyance between the atmosphere and terrestrial surfaces, thereby impeding enhancements in atmospheric humidity and consequently precipitating reductions in local cloud cover (Bala et al., 2007). Both forest and bioenergy expansions exert varying degrees of influence on temperature, water cycles, and clouds through radiative and non-radiative processes; such influences may render the atmosphere more humid or arid across ranges extending hundreds of kilometers, thereby modulating cloud formation and subsequently reshaping the configuration of warming hotspots via cloud radiative effect (Cerasoli et al., 2021; Wang et al., 2021). Although the impacts of LUCC on atmospheric circulation play a pivotal role in projecting future climate changes and have been extensively investigated (Feddema et al., 2005; Swann et al., 2012; Li et al., 2018), comprehension of its effects on long-term trends in cloud cover remains largely unknown, particularly as the expansion of bioenergy has not received commensurate attention to that afforded to forest expansion. Therefore, it is reasonable to hypothesize positing that LUCC affects the generation and trends of local or remote cloud cover through complex or straightforward mechanisms (Hua et al., 2023).
Large-scale LUCC has the potential to reshape future cloud cover trajectories via intricate bio-geophysical feedback (Luo et al., 2024b). To quantify these effects, we employed the Community Earth System Model (CESM) to conduct transient, fully coupled simulations spanning 2015 to 2100 (Danabasoglu et al., 2020). Our results demonstrate that while realistic afforestation may offer regional climate benefits, large-scale idealized forest and bioenergy expansion could exacerbate the decline of mid-to-low-level clouds while accelerating the increase of high-level clouds. These structural shifts in cloud cover amplify positive shortwave cloud radiative forcing, thereby intensifying the formation of regional warming hotspots. These results highlight the divergent climate impacts of land-cover transitions. While poorly constrained land-management scenarios risk undermining the cooling capacity of clouds and amplifying future climate warming, realistic afforestation pathways can effectively buffer this loss, thereby preserving essential biophysical cooling.
2.1 Data
The ERA5 reanalysis data from the European Centre for Medium-Range Weather Forecasts (ECMWF), specifically the 2 m air temperature and cloud cover, were obtained from the Copernicus Climate Data Store (Muñoz-Sabater et al., 2021) to validate the CESM model simulations of near-surface temperature and cloud fraction. In addition, near-surface temperature fields from the National Centers for Environmental Prediction (NCEP) reanalysis were used to further evaluate the Community Earth System Model (CESM) model's temperature simulation performance and are available from https://psl.noaa.gov/ (last access: 1 September 2026) (Kalnay et al., 1996). The Global Precipitation Climatology Project (GPCP) dataset, used to validate the CESM model's performance in simulating recent precipitation, was obtained from https://www.psl.noaa.gov/data/gridded/data.gpcp.html (last access: 1 September 2026) (Adler et al., 2018; Huffman et al., 2023). An additional precipitation dataset is the CPC Merged Analysis of Precipitation (CMAP), which can be downloaded from https://psl.noaa.gov/data/gridded/data.cmap.html (last access: 1 September 2026) (Xie and Arkin, 1997). Finally, the core input data in this study is the land use data from Land-Use Harmonization 2 (LUH2) (Hurtt et al., 2020), downloaded from https://svn-ccsm-inputdata.cgd.ucar.edu/trunk/inputdata/ (last access: 1 September 2026).
2.2 Earth system simulation
We conducted the online simulations with the Community Earth System Model (CESM, version 2.1.3, https://www.cesm.ucar.edu/models/cesm2, last access: 1 September 2026) (Danabasoglu et al., 2020). As a state-of-the-art tool in climate prediction, this model accurately reproduces twentieth-century climate dynamics and surface sea temperatures while demonstrating high skill in projections of essential climate variables and atmospheric circulations (Danabasoglu et al., 2020; Fasullo, 2020). Similar to earlier versions (Lin and Rood, 1997), the atmospheric and land-surface component of CESM employs the Lin-Rood Finite-Volume (FV) dynamical core, though notable improvements have been introduced in atmospheric physics (Lin and Rood, 1997). Compared to its predecessor, the new generation FV mainly adjusted its cloud parameters (Zhu et al., 2022). CESM incorporates the Community Atmosphere Model Version 6 (CAM6) as its atmospheric component, offering a high-top option (with 70 pressure levels reaching about 130 km) and a standard option (with 32 pressure levels reaching about 40 km) (Danabasoglu et al., 2020). In this study, we utilize the standard low-top setup, which effectively simulates tropospheric atmospheric processes. CAM6 describes the atmospheric motion by the dynamics and sub-grid precipitation, cloud, and turbulence processes by the physics (Worley et al., 2011). Of particular relevance to our study is enhanced cloud-microphysics parameterization in CAM6: the Morrison–Gettelman 2 (MG2) scheme, which overcomes the prior constraint by explicitly predicting raindrop and snow-particle sizes (Morrison and Gettelman, 2008; Gettelman and Morrison, 2015). Accompanying enhancements feature the consolidated turbulence parameterization, incorporating a multivariate binormal probability density function (PDF) to collectively depict sub-grid fluctuations in temperature, humidity, and vertical velocity (Larson, 2017). At the same time, CESM classifies clouds across altitudes according to their cloud-top pressure, delineating low-level cloud from 700 hPa to the surface, middle-level cloud from 700–400 hPa, and high-level cloud above 400 hPa (Danabasoglu et al., 2020). Because high-level cloud is defined solely by cloud-top pressure, it is an aggregate diagnostic that may include physically distinct high-cloud types, including cirrus and the upper portions or anvils of deep convective clouds (Rossow and Schiffer, 1999; Bony et al., 2016). Accordingly, high-level cloud alone cannot identify the specific cloud type responsible for a simulated change or distinguish between surface-forced influences on deep convection and indirect large-scale dynamical or thermodynamic adjustment (Bony et al., 2016).
Before launching the simulations, we first evaluated the performance of CESM to reproduce historical climate change. The historical run employed the BHIST compset and was carried out online at 1° × 1° resolution. Monthly output in the period of 1979–2014 were used for model validation; to match the model grid, all observational datasets were conservatively interpolated to the CESM resolution. Annual and seasonal evaluations of temperature and cloud fraction show that CESM satisfactorily captures present-day climate variability (Figs. S1–S6 in the Supplement). More importantly, CESM reproduces the spatial patterns of cloud cover trends seen in the reanalysis data (Fig. S3), this is precisely the focus of this study. CESM also reproduces the observed global precipitation reasonably well, with a small global mean bias of only 0.2 mm d−1 (Fig. S6). Then, the specific land-use forcing simulation design is implemented in the Community Land Model Version 5 (CLM5) within CESM. Relative to its predecessors, CLM5 incorporates advances in soil hydrology, crop modeling, fire feedback, and biogeochemical cycling, thereby enhancing the representation of anthropogenic land-use change within the climate system (Swenson and Lawrence, 2012; Li et al., 2017; Lawrence et al., 2019). The idealized simulation experiments in this study were all conducted based on Land-Use Harmonization 2 (LUH2) (Hurtt et al., 2020). CLM5 represents land-surface heterogeneity through a nested sub-grid hierarchy, allowing multiple land-unit to coexist within each grid cell (Oleson et al., 2013). Although CLM5 is not configured with a dynamic vegetation model, the time-varying landuse.timeseries dataset provided by the model allows vegetation's physiological processes (such as photosynthesis, transpiration, etc.) to be explicitly simulated (Lawrence et al., 2019; Cheng et al., 2022).
According to the Food and Agriculture Organization of the United Nations (FAO) definition of afforestation, it refers to the establishment of new forests on land that was not previously classified as forest through planting or deliberate seeding (FAO, 2012). This implies a fundamental change in land use types, for instance, from cropland to forest or from grassland to forest (FAO, 2012). Therefore, following the FAO definition, we constructed idealized land-use datasets for forest and bioenergy expansion simulations. In CLM5, there are eight tree plant functional types (PFTs), indexed from 1 to 8, and 64 crop functional types (CFTs). In CLM5, PFTs and CFTs coexist on nested sub-grid tiles that jointly mediate energy and moisture exchanges between the land surface and the atmosphere (Lawrence et al., 2019; Lombardozzi et al., 2020). We therefore implement forest and bioenergy expansion by altering their fractional areas at the sub-grid scale, consistent with previous studies (Dickinson and Henderson-Sellers, 1988; Swann et al., 2018). Specifically, our simulation experiments comprise a control run (CTL) in which land-cover fractions are held constant at 2015 levels, an idealized 50 % linear afforestation scenario (AF50), an idealized 50 % bioenergy crop expansion scenario (BE50), and a realistic forest expansion scenario (REAL) derived from previous studies (Roe et al., 2021; King et al., 2024; Weber et al., 2024), this land-use pathway exhibits a maximum 26 % forest-expansion pattern by 2100, representing an increase of 7.5 million km2 relative to 2015 levels (Fig. S9), primarily distributed across tropical South America, Central Africa, and central North America (Figs. S7 and S8). Regarding the land area changes in the idealized afforestation scenario, approximately 29.3 million km2 of grasslands and shrublands are converted to forests by 2100 relative to 2015 levels (Fig. S9), with a widespread global distribution (Figs. S7 and S8). Previous studies suggest that the global extent of grasslands and shrublands is sufficient to support land conversion of this magnitude (Di Vittorio et al., 2018); furthermore, this approach aligns more closely with the strict definition of afforestation established by the FAO. However, the REAL scenario does not strictly qualify as afforestation; it is more consistent with the definitions of reforestation or forest enhancement. Nevertheless, for analytical convenience, it is still referred to as an afforestation simulation in this study. All future-period simulations were conducted with the scientifically validated BSSP126 compset at 1° × 1° (f09_g17_gl4) horizontal resolution, while the ocean component was run at 0.5° × 0.5° resolution, the restart files for model initialization are derived from the National Center for Atmospheric Research's 500-year equilibrated pre-industrial control simulation (Eyring et al., 2016; Danabasoglu et al., 2020). In the idealized simulations, forest expansion is restricted to shrublands and grasslands, with the newly forested area distributed evenly among the eight tree PFTs, this practice of fundamentally converting land-cover types is also analogous to previous deforestation studies (Swann et al., 2018), wherein forests are replaced by grasslands or shrublands; bare ground is excluded, although some recent studies (Bastin et al., 2019; Wang et al., 2024; Liang et al., 2025) advocate afforestation on bare soil. Bioenergy expansion is represented by rained and irrigated sugarcane and occupies only existing bioenergy land, thereby encroaching neither on forests nor on natural grasslands. Bioenergy expansion is primarily driven by rainfed sugarcane cultivation. Relative to 2015, the cultivated area is projected to increase by 6.4 million km2 by the end of the century (Fig. S9). Consistent with the Land Use Model Intercomparison Project (LUMIP) protocol (Lawrence et al., 2016), all experimental setups differ solely in their land-use forcing. Because atmospheric CO2 is prescribed rather than prognostic, the simulated climate response originates entirely from biophysical processes induced by land cover change (e.g., changes in albedo and evapotranspiration). This configuration effectively excludes the offsetting effects of bio-geochemical feedback (i.e., carbon sequestration) on short-term climate response. The climate response is quantified as the difference between each sensitivity experiment and the control run (CTL), with statistical significance evaluated via a two-tailed Student's t test.
2.3 Attribution of LUCC-induced atmospheric changes to cloud trends
In this study, to disentangle the driving factors of cloud cover trends induced by different LUCC, we employed the explainable Extreme Gradient Boosting (XGBoost) model developed by Chen and Guestrin. (2016), whose proven capacity to resolve complex nonlinear interactions and deliver high predictive skill has made it a workhorse in both atmospheric and ecological modelling (Ren et al., 2024; Flora et al., 2024). After model training, we used SHapley Additive exPlanations (SHAP), based on game theory (Lundberg and Lee, 2017; Lundberg et al., 2020), to quantify the relative importance of individual predictors in the trained model and to characterize their relationships with model-predicted cloud-cover trends (Berdugo et al., 2022). SHAP values describe the contribution of each predictor to the model prediction relative to the model baseline and therefore should not be interpreted as a causal or process-based decomposition of the simulated physical cloud-cover change. For comparisons among predictors, global feature importance was calculated from the mean absolute SHAP value of each predictor and normalized by the summed mean absolute SHAP values of all predictors. The resulting percentages therefore represent normalized SHAP feature importance within the machine-learning model rather than the percentage of the physical cloud-cover change caused by a given variable. Specifically, we constructed 12 independent models for the cloud and climate-change trends driven by LUCC and performed 100 times Bayesian hyperparameter searches (Snoek et al., 2012) and the optimized parameters name and the obtained best values are listed in Table S1 in the Supplement. These predictors were selected to comprehensively represent the key physical processes controlling cloud formation and long-term trends under land use and cover change (Seneviratne et al., 2010; Stull, 1988; Wood, 2012; Santanello et al., 2018). They can be grouped into several physically meaningful categories: (1) surface energy and moisture fluxes, which directly reflect changes in surface energy partitioning induced by alterations in albedo and vegetation; (2) boundary layer structure, which captures the vertical extent and mixing intensity of the planetary boundary layer; (3) near-surface thermodynamic conditions, which govern saturation and cloud formation; (4) large-scale moisture availability and precipitation; and (5) atmospheric instability. In particular, sensible heat flux and planetary boundary layer height were included to represent critical upstream biophysical processes.
2.4 Calculation of cloud radiative effect
Cloud radiative effect (CRE) is commonly used to evaluate the cooling or warming influence of clouds on the Earth-atmosphere system (Goldblatt et al., 2021; Luo et al., 2024a), measured at the top-of-the atmosphere (TOA), in the atmosphere, or at the surface (Zhang et al., 2022), which consists of shortwave CRE (swCRE), longwave CRE (lwCRE) and netCRE (the sum of swCRE and lwCRE). The lwCRE was calculated as the difference between downward longwave radiation at the surface under cloudy conditions and that under clear sky (Luo et al., 2024a). The swCRE is determined by the difference between downwelling solar flux at surface (FSDS, W m−2) and clear-sky downwelling solar flux at surface (FSDSC, W m−2), as well as upward shortwave radiation at the surface (FSUS, W m−2) and clear-sky (FSUSC, W m−2), as indicated in Eq. (1) (Luo et al., 2024a).
In Eq. (1), FSUS and FSUSC are indirectly calculated via FSDS and FSDSC multiply albedo, as shown in Eq. (2). FSNS (W m−2) denotes the net shortwave radiation at the surface. The clear-sky albedo is also calculated using a similar equation (Wang et al., 2024).
2.5 Quantifying the impacts of land use change
We quantify the climate response to land-use change as the difference between the sensitivity simulations and the control run (CTL), represented by the symbol Δ. Using total cloud cover (CLDTOT, %) as an example, this effect is formally defined in Eq. (3).
2.6 Grid-based linear trend analysis
In this study, we conducted ordinary least squares (OLS) linear regression at every grid point to investigate the temporal variability patterns of atmospheric variables, encompassing cloud cover. The statistical significance of linear trend for each grid cell was derived using a Student's t test, as expressed in Eq. (4).
2.7 Quantification of the inequality of cloud cover trends
Originally developed as an economic metric for wealth distribution (Atkinson, 1970), the Gini coefficient (Gini index) is adapted in this study to assess the spatial disparity of hemispheric cloud cover trends, similar to its recent applications in studies of global precipitation changes and ocean productivity variations (Zhao et al., 2025; Lesk and Mankin, 2026). Equation (5) presents the continuous form of this index.
In this formulation, the Gini index is derived by integrating the area beneath the Lorenz curve L(x), which quantifies the cumulative distribution of the target variable relative to the cumulative spatial area.
2.8 Surface energy balance decomposition of temperature
To better reveal the impacts of LUCC at different scales on surface thermodynamic temperature, this study employs the surface energy balance equation to dissect the various physical components of surface temperature changes. Through this decomposition method, the surface temperature changes caused by afforestation and bioenergy expansion can be attributed to multiple direct (local) or indirect (non-local) biophysical processes. Previous studies have shown that the linear approximation method via first-order Taylor expansion is sufficiently accurate for assessing surface temperature anomalies induced by large-scale land cover changes (Lee et al., 2011; Devaraju et al., 2018; Chen et al., 2020; Sui et al., 2025). According to the principle of energy conservation, the radiation energy absorbed by the surface must equal the heat released, as described in Eq. (6).
In Eq. (6), αs represents surface albedo (dimensionless), and SW↓ denotes downward shortwave radiation (W m−2); thus, represents net shortwave radiation at the surface (W m−2). LW↓ denotes downward longwave radiation at the surface (W m−2). ϵ is surface emissivity (dimensionless), a parameter used to describe how closely the Earth approximates a perfect blackbody, with typical values less than 1 (0.7 in this study). σ is the Stefan–Boltzmann constant (5.671 × 10⁻⁸ ). H represents sensible heat flux (W m−2), LE represents latent heat flux (W m−2), Ts is surface temperature (°C), and G is surface heat flux (W m−2, this value typically varies very little and can therefore be neglected in calculations). Rearranging and transforming the equation yields Eq. (7), where ρ is air density (1.29 kg m−3), Cp is specific heat capacity of air at constant pressure (1030 ), ra is aerodynamic resistance (s m−1), Ta is air temperature at 2 m (°C), and β represents the Bowen ratio (dimensionless).
Linearizing Eq. (7) yields the difference in surface temperature changes ΔTs between each sensitivity experiment and the CTL experiment. After linear decomposition, the equation allows the surface temperature change ΔTs to be explicitly expressed as a function of albedo (αs), turbulent processes (β), surface roughness or aerodynamic resistance (ra), cloud radiation effects (LW↓ and SW↓), and atmospheric feedback (Ta), as shown on the right-hand side (RHS) of Eq. (8). The first three physical terms on the RHS represent the local changes induced by LUCC, while the latter three terms indicate non-local responses (Devaraju et al., 2018).
In Eq. (8), λ0 and f represent the temperature sensitivity coefficient and the energy redistribution coefficient, respectively, as defined by Eqs. (9) and (10). These two parameters, respectively describe the response of black-body radiation to temperature and how turbulent fluxes regulate surface temperature (Dickinson, 1983; Lee et al., 2011).
Finaly, we calculate the annual trend of each term using Eq. (4). In this way, the long-term trends of each physical term induced by LUCC forcing can be investigated.
2.9 Attribution of non-local temperature responses via horizontal temperature advection
Temperature advection is a primary driver of non-local temperature responses to large-scale LUCC. Changes in surface energy fluxes trigger boundary-layer dynamics and mesoscale circulations that transport thermal local perturbations through wind fields to remote regions (Pielke et al., 1998; Fig. S10). Following previous studies (Kan et al., 2025), we evaluate horizontal temperature advection (Tadv) at 850 hPa, the critical interface between the boundary layer and the free troposphere. This is defined in Eq. (11), where u and v are the horizontal winds at this standard isobaric level, and , represent the zonal and meridional temperature gradients, respectively. Therefore, temperature advection can be decomposed into zonal () and meridional () components. Finally, the difference of temperature advection (ΔTadv) between the sensitivity and control experiments elucidates the atmospheric dynamic mechanisms underpinning LUCC-induced teleconnections.
2.10 Diagnosing planetary wave activity using Plumb fluxes
To capture the dominant propagation characteristics of Rossby waves in the middle-to-upper troposphere, we evaluated the wave activity at the 500 hPa isobaric level, consistent with previous studies (Harada and Nakagawa, 2017; Kan et al., 2025). This altitude serves as a canonical diagnostic layer for vigorous planetary wave activity, particularly for quasi-stationary and stationary Rossby waves. Located near the mid-to-upper tropospheric jet core, wave activity fluxes at 500 hPa clearly manifest the mid-to-upper atmospheric response to surface perturbations, while mitigating the interference of near-surface friction and turbulent dissipation. Consequently, the wave activity flux (WAF) constitutes an essential tool in atmospheric dynamics for diagnosing Rossby wave energy transport, effectively tracing the propagation pathways, directions, and intensities of planetary waves. In this study, we utilized the two-dimensional WAF formulation (Plumb, 1985). Because this flux is parallel to the Rossby wave group velocity, it intuitively delineates the two-dimensional propagation of planetary wave energy, as detailed in Eq. (12).
Here, the prime denote the deviation from zonal mean; ∅, λ, Φ denotes latitude, longitude, and geopotential height, respectively; 2Ωsin (∅) represents the Coriolis parameter, where a is the Earth's radius and Ω is the Earth's rotation rate. p0 denotes the near-surface reference pressure (1000 hPa). The u and v denote the zonal and meridional winds, respectively. This set of notations and parameter configurations is consistent with the two-dimensional wave activity flux formulation has been validated in numerous climate modeling studies (Huang and Nakamura, 2016; Kan et al., 2025).
3.1 Long-term response of cloud cover to LUCC forcings
Our simulations demonstrate that distinct land-use forcing significantly altered the global long-term trends in total cloud cover (CLDTOT) and low-level clouds (CLDLOW) (Fig. 1). While CLDTOT exhibited a moderate negative trend in both CTL (−0.0083 ± 0.0020 % yr−1, R = −0.6547) and the bioenergy expansion experiment (BE50, −0.0083 ± 0.0020 % yr−1, R = −0.6363), the idealized (AF50) and realistic afforestation (REAL) scenarios modestly attenuated this decline to −0.0072 ± 0.0025 and −0.0069 ± 0.0021 % yr−1, respectively. This suggests that the enhanced evapotranspiration and increased surface roughness associated with afforestation, coupled with a compensatory increase in cloud cover at other cloud-top heights, may provide a buffering effect against the loss of total cloud cover (Duveiller et al., 2021; Xu et al., 2022). Secondly, this global attenuation is largely driven by a weakened cloud loss over the oceans, where the CLDTOT decline rate of −0.0073 ± 0.0019 % yr−1 in the CTL simulation was mitigated to −0.0054 ± 0.0025 % yr−1 in AF50 (Fig. S11a and b). Notably, however, idealized afforestation exacerbated the loss of CLDTOT over land, accelerating the decline rate by a factor of 1.05 relative to the CTL run. CLDLOW exhibited the most pronounced and contrasting response. While idealized afforestation accelerated the decline of CLDLOW by a factor of 1.14 relative to the CTL simulation, this effect was notably amplified over land, where the loss rate increased by a factor of 1.52 (Fig. S11e and f). This suggests that the extensive conversion of grasslands or shrublands into forests may directly reduce low-level clouds by altering surface evapotranspiration and promoting deeper and well-mixed planetary boundary layer with elevated lifting condensation level (LCL), forming a negative feedback mechanism (Duveiller et al., 2021; Leung et al., 2024; King et al., 2024). This acceleration is consistent with the biophysical mechanism whereby albedo reduction from idealized afforestation increases sensible heat flux and Bowen ratio, driving stronger buoyant turbulence and the development of a deeper, well-mixed planetary boundary layer (Bright et al., 2017). The resulting enhanced entrainment of dry air and faster rise of the lifting condensation level relative to planetary boundary layer top growth suppress low-level cloud formation, particularly over water-limited mid-to-high latitude land regions (Ek and Holtslag, 2004; Bonan, 2008). In stark contrast, the REAL scenario suppressed the global CLDLOW loss rate (from −0.0153 ± 0.0030 % yr−1 in CTL to −0.0148 ± 0.0029 % yr−1) (Fig. 1e and h). Meanwhile, the BE50 scenario induced a marginal acceleration in the decline (−0.0157 ± 0.0032 % yr−1), equating to a factor of 1.03 globally and 1.23 specifically over land (reaching −0.0207 ± 0.0024 % yr−1) (Fig. S11). Furthermore, all simulations consistently suppressed the loss rate of low-level clouds over the ocean, modifying the trends to −0.0142 ± 0.0039 % yr−1 for REAL and −0.0137 ± 0.0042 % yr−1 for BE50 (Fig. S11). These findings highlight a complex spectrum of biophysical feedback, while extreme land-cover transitions, such as the idealized conversion of grassland or shrubland to forest, trigger strong feedback that accelerate low-level cloud loss, realistic afforestation act as crucial stabilizers against this cloud cover loss.
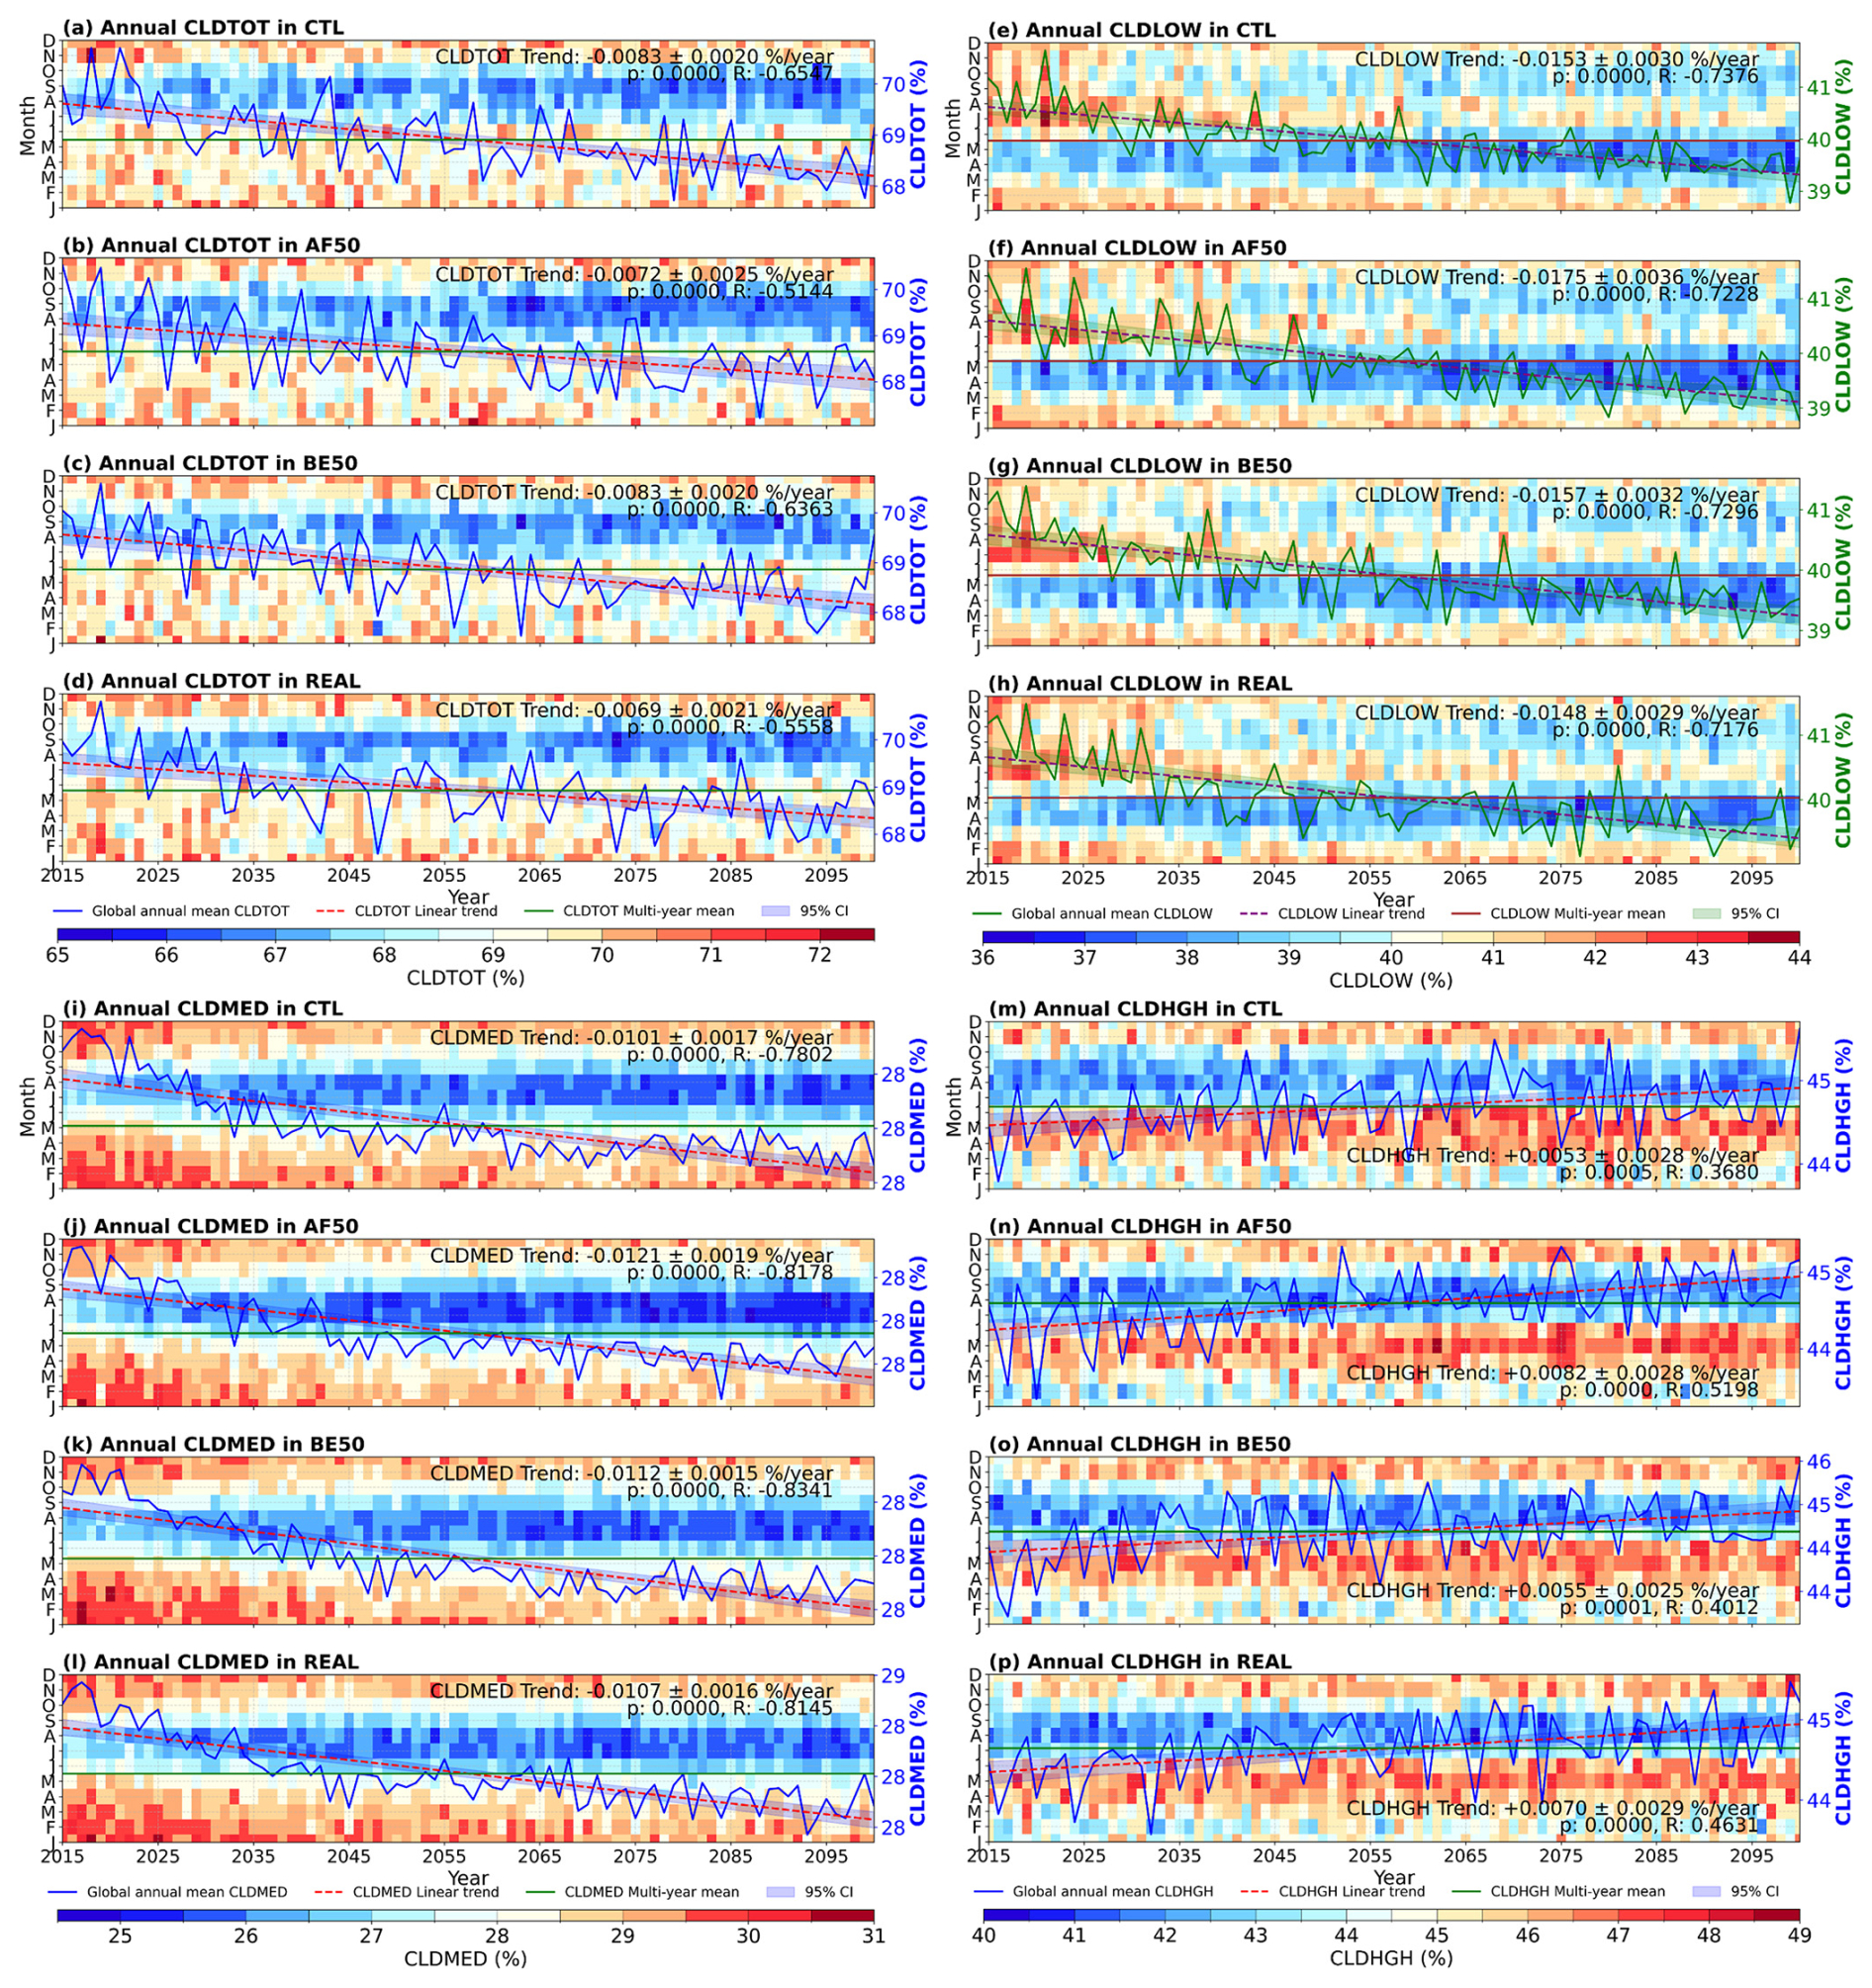
Figure 1Simulated long-term trends and seasonal variations of area-weighted global mean cloud cover. Panels display the time series (2015–2100) for total (a–d), low (e–h), medium (i–l), and high-level (m–p) cloud cover under CTL, AF50, BE50, and REAL scenarios. In each panel, heatmaps show the monthly variations, while blue and solid lines track the global annual means. Linear trend lines (dashed) and multi-year means (horizontal solid lines) are superimposed, with statistical significance (p) and regression coefficients (R) provided. The shaded areas indicate the 95 % confidence intervals (CI). Uncertainty propagation for baseline subtractions was performed via quadrature addition of standard errors (Taylor, 1997; Mastrandrea et al., 2010).
Medium-level clouds (CLDMED) exhibited a consistent downward response to land-use forcings, with trends ranging from −0.0101 ± 0.0017 % yr−1 in CTL to −0.0121 ± 0.0019 % yr−1 in AF50, idealized scenarios (AF50 and BE50) induced slightly steeper trends (Fig. 1). Conversely, high-level clouds (CLDHGH) displayed robust positive trends across all land use forcing simulations, with trends increasing from 0.0053 ± 0.0028 % yr−1 in CTL to 0.0082 ± 0.0028 % yr−1 in AF50. The CLDHGH response is associated with large-scale thermodynamic variability; however, the linear models explain only a moderate fraction of the overall variability (Fig. 1m–p). Therefore, these diagnostics do not support assigning the high-cloud response to a single dominant mechanism. Crucially, both idealized and realistic afforestation amplified this upward trend in CLDHGH. Relative to CTL run, AF50 accelerated the global upward trend by a factor of 1.5, an effect that was heavily magnified over land (by a factor of 2.28 ) compared to the ocean (1.41). Similarly, REAL enhanced it by about 1.3 times (2.17 times on land and 1.16 times on ocean). Ocean changes were generally insignificant, possibly due to the buffering effect of remote atmospheric transport (Portmann et al., 2022).
The robust amplification of the CLDHGH positive trend by afforestation, coupled with the acceleration of CLDLOW loss, highlights a critical trade-off in land-based climate mitigation (Luyssaert et al., 2018). While greenhouse gas-induced warming is known to elevate high-cloud tops and amplify climate warming (Norris et al., 2016; Zelinka et al., 2016; Luo et al., 2024a). Our findings reveal a compounding risk, we demonstrate that future large-scale afforestation, particularly under idealized scenarios, could inadvertently exacerbate this warming by reinforcing the positive high-level cloud feedback. Moreover, this effect is further compounded by the pronounced accelerated depletion of low-level clouds over land (as seen in the AF50 scenario), which triggers adverse biophysical feedback that fundamentally compromises the anticipated cooling benefits of forest expansion. Conversely, the REAL scenario exerts a minimal climate perturbation, effectively buffering the background cloud loss. This resilience is largely driven by the spatially targeted allocation of forest expansion (King et al., 2024; Weber et al., 2024; Fig. S12), which constrains cloud feedback within the bounds of natural variability. However, even realistic afforestation carries the risk of exacerbating the increasing trend of high-level clouds, thereby potentially inducing positive radiative forcing at the top of the atmosphere. This indicates that large-scale LUCC affects the lower and upper atmosphere in different ways (Dror and Feingold, 2026). The divergent responses of low- and high-level clouds indicate that their controlling processes may differ. For CLDHGH, surface-flux perturbations may influence deep convection and vertical moisture transport, whereas upper-tropospheric temperature, humidity, and circulation adjustments can also affect the high-cloud response. Because CLDHGH aggregates different high-cloud types and our diagnostics do not separate cirrus from convective anvils, we cannot determine the relative importance of surface-forced convective influences and large-scale dynamical or thermodynamic adjustment. We therefore interpret the CLDHGH increase as an integrated high-cloud response rather than evidence for a uniquely identified dominant pathway (Zhang et al., 2016; King et al., 2024).
3.2 Spatial response of cloud cover to LUCC forcings
Distinct land use forcings exerted pronounced spatially asymmetric impacts on long-term cloud cover trends, characterized by stark geographic heterogeneity between hemispheres and across land-ocean partitions (Figs. 2 and S12–S15). In the Northern Hemisphere (NH), both afforestation and bioenergy expansion triggered widespread negative CLDTOT trends. Notably, BE50 scenario induced the steepest overall decline (mean CLDTOT trend: −0.0045 % yr−1), amplifying the loss rate by a factor of 2.4 compared to the AF50 scenario (mean: −0.0019 % yr−1). However, the most striking spatial anomaly emerged in the CLDLOW regime under AF50 (mean NH trend: −0.0060 % yr−1). Negative CLDLOW trends were strongly localized over mid-to-high latitude landmasses in North America and Eurasia, with the intensity of loss in these land regions being 20 times that of the overall Southern Hemisphere (SH). This phenomenon, indicative of exacerbated seasonal losses during summer, was also evident in BE50 and REAL simulations, suggesting a general latitude dependency (Figs. 3, S12 and S13). Furthermore, CLDMED trends displayed regional divergence, with BE50 inducing CLDMED increases in Australia and Southeast Asia while AF50 amplified losses in those same regions.
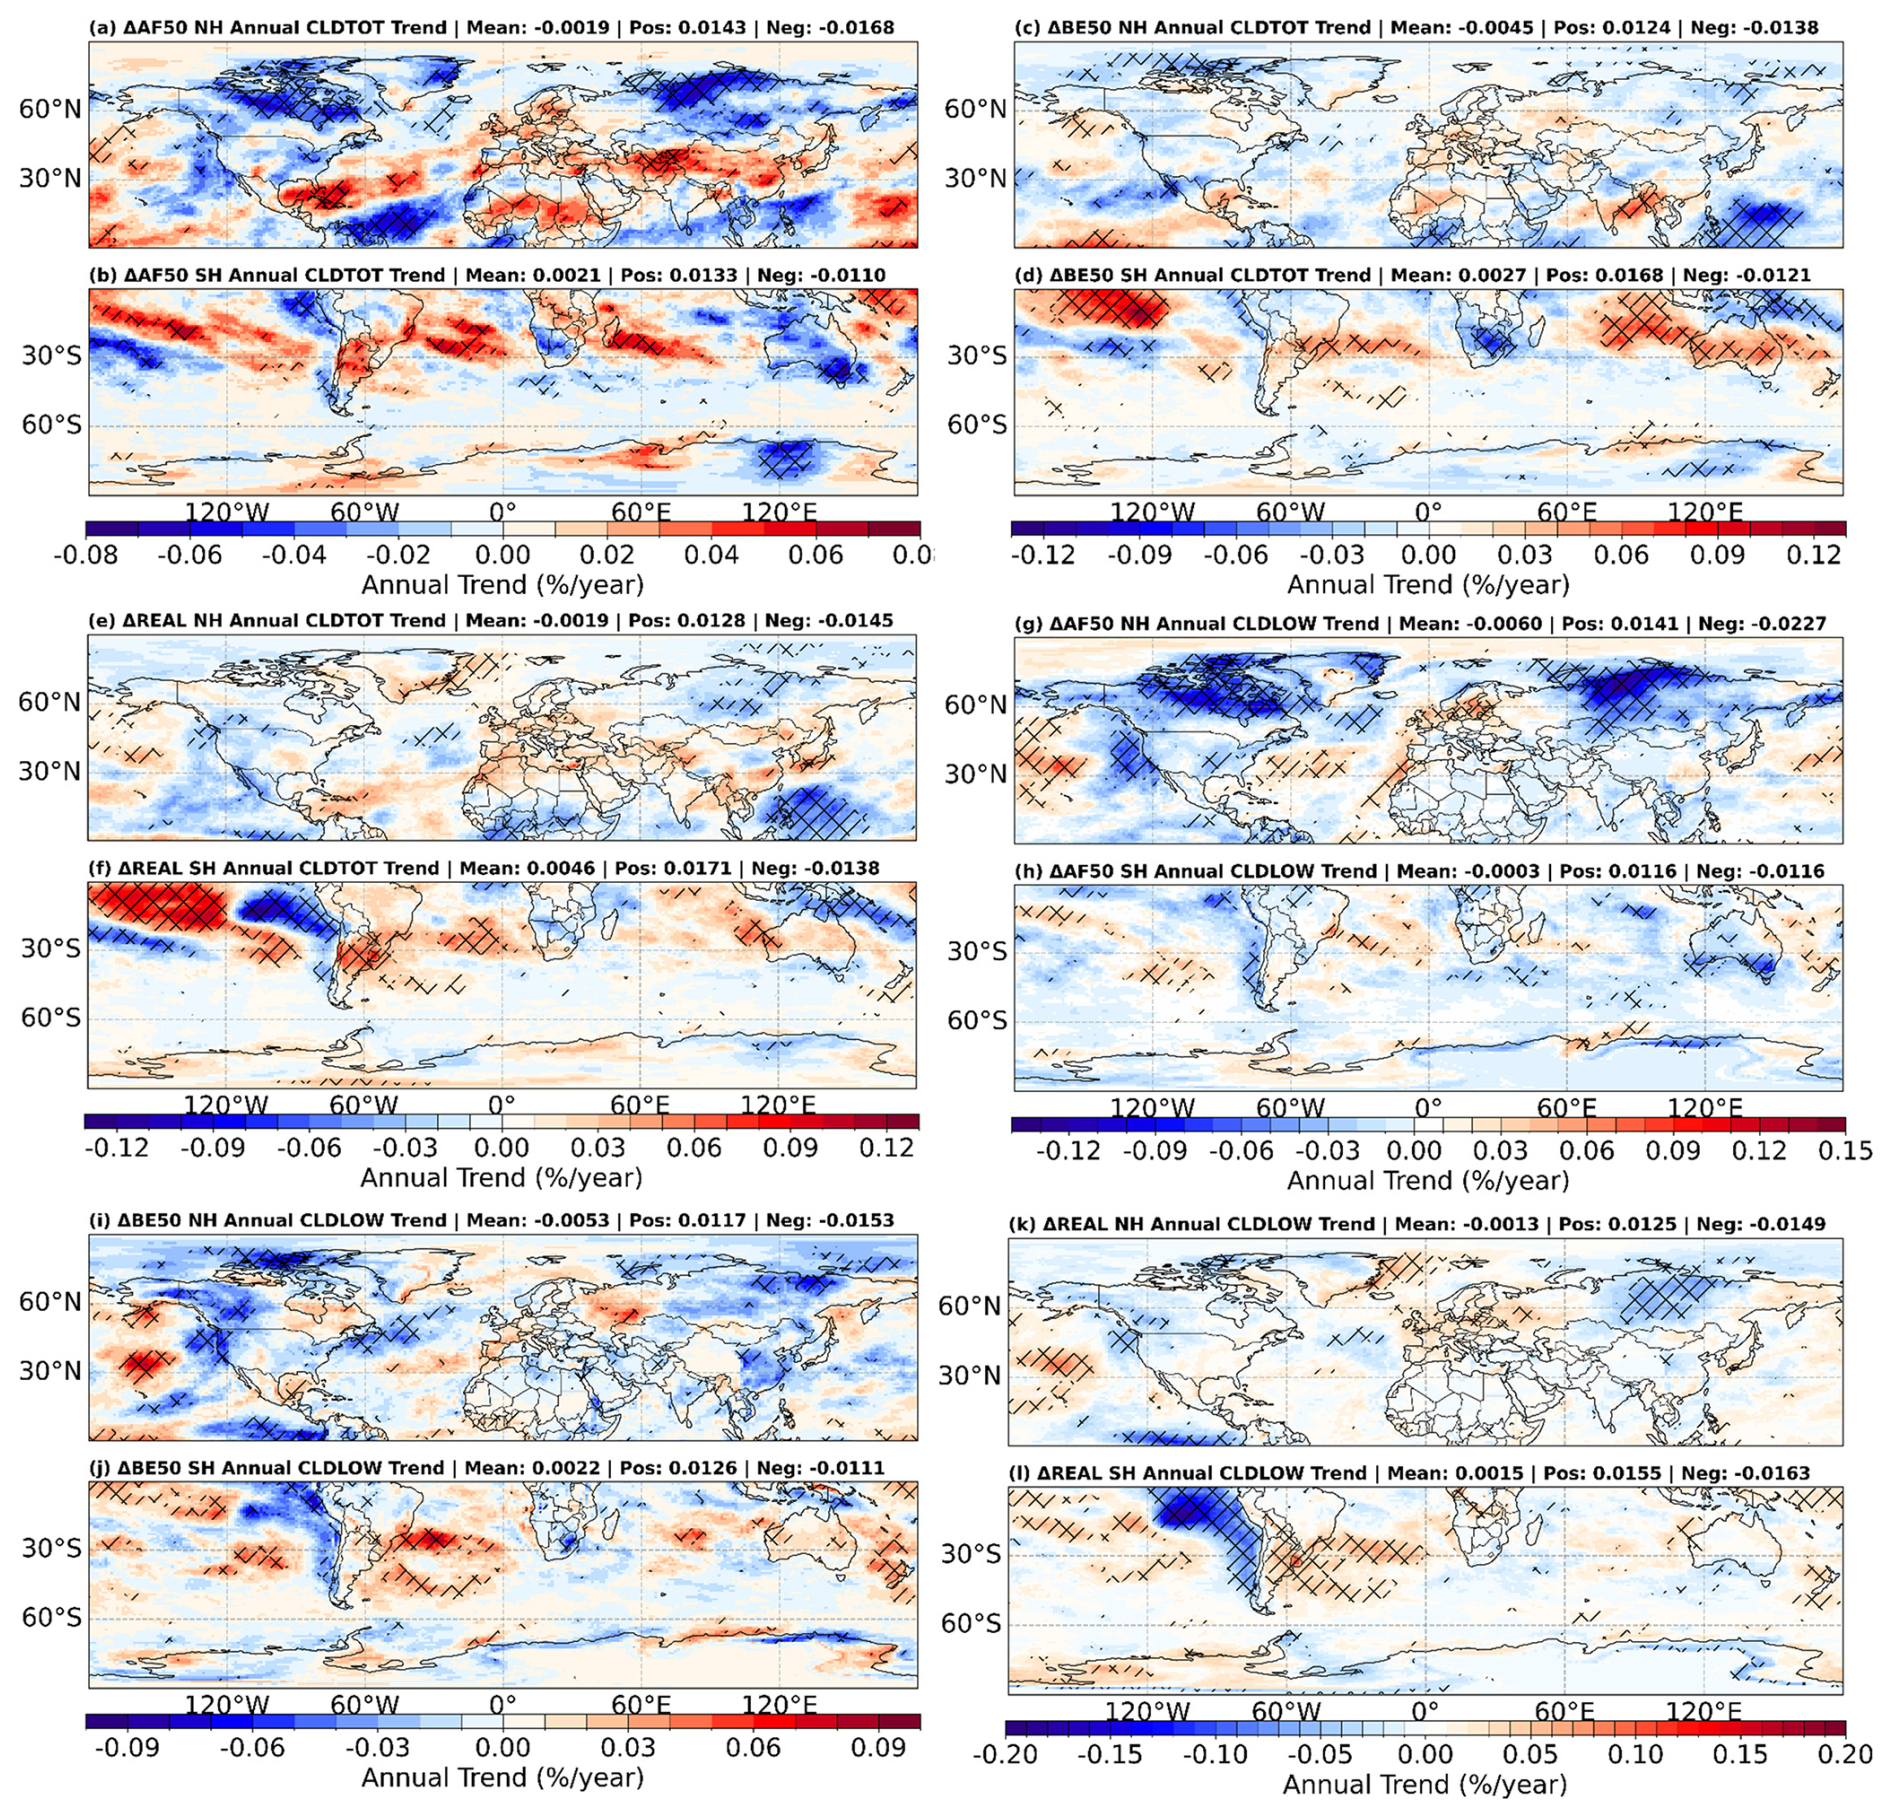
Figure 2Spatial patterns of long-term total and low-level cloud cover trends driven by diverse land-use scenarios. Maps display the anomalous annual trends (% yr−1) of total cloud cover (a–f) and low-level cloud cover (g–l) for both the Northern and Southern Hemispheres. The visualized trends represent the differences (denoted by symbol Δ) between the specific land-use forcings (idealized afforestation, bioenergy expansion, and realistic afforestation) and the control simulation. Blue shading indicates a decreasing trend in cloud cover, while red shading depicts an increasing trend. The cross-hatching highlights grid cells where the long-term trends are statistically significant (p<0.05). Panel headers provide the regional mean trend, alongside the averages of all positive (Pos) and negative (Neg) grid-level trends within the respective domains.
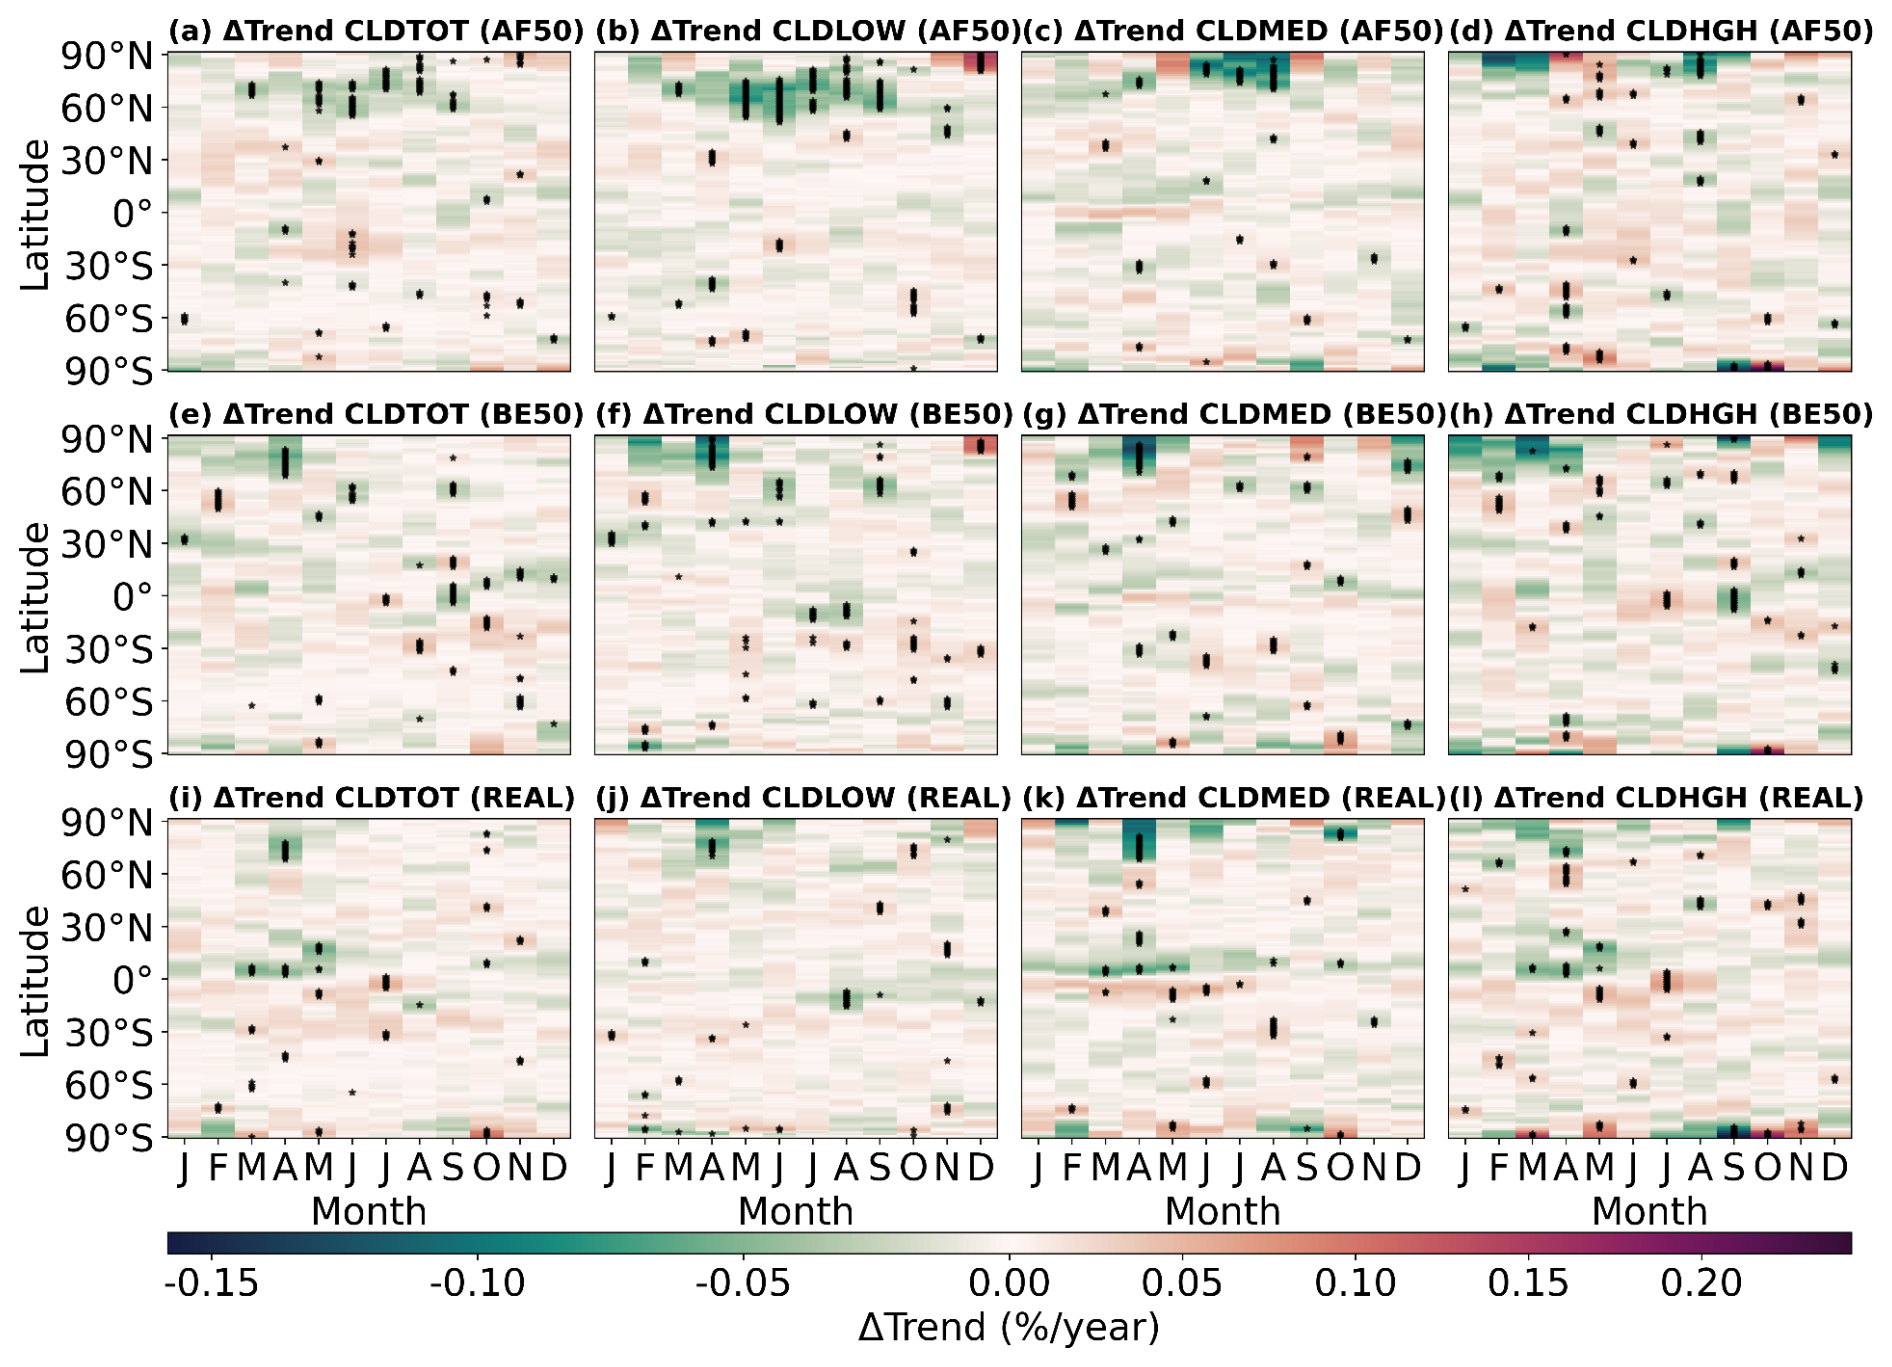
Figure 3Seasonal and latitudinal distributions of anomalous cloud cover trends under varying land-use scenarios. Heatmaps display the zonally averaged trend differences (% yr−1) across the seasonal cycle (x-axis, months) and latitudes (y-axis, 90° S to 90° N). Columns differentiate the responses for total (a, e, and i), low-level (b, f, and j), medium-level (c, g, and k), and high-level (d, h, and l) cloud fractions. Rows correspond to the idealized afforestation (a–d), bioenergy expansion (e–h), and realistic afforestation (i–l) scenarios relative to the control run. Black asterisks mark grids where the trends are statistically significant at the 95 % confidence level (p<0.05).
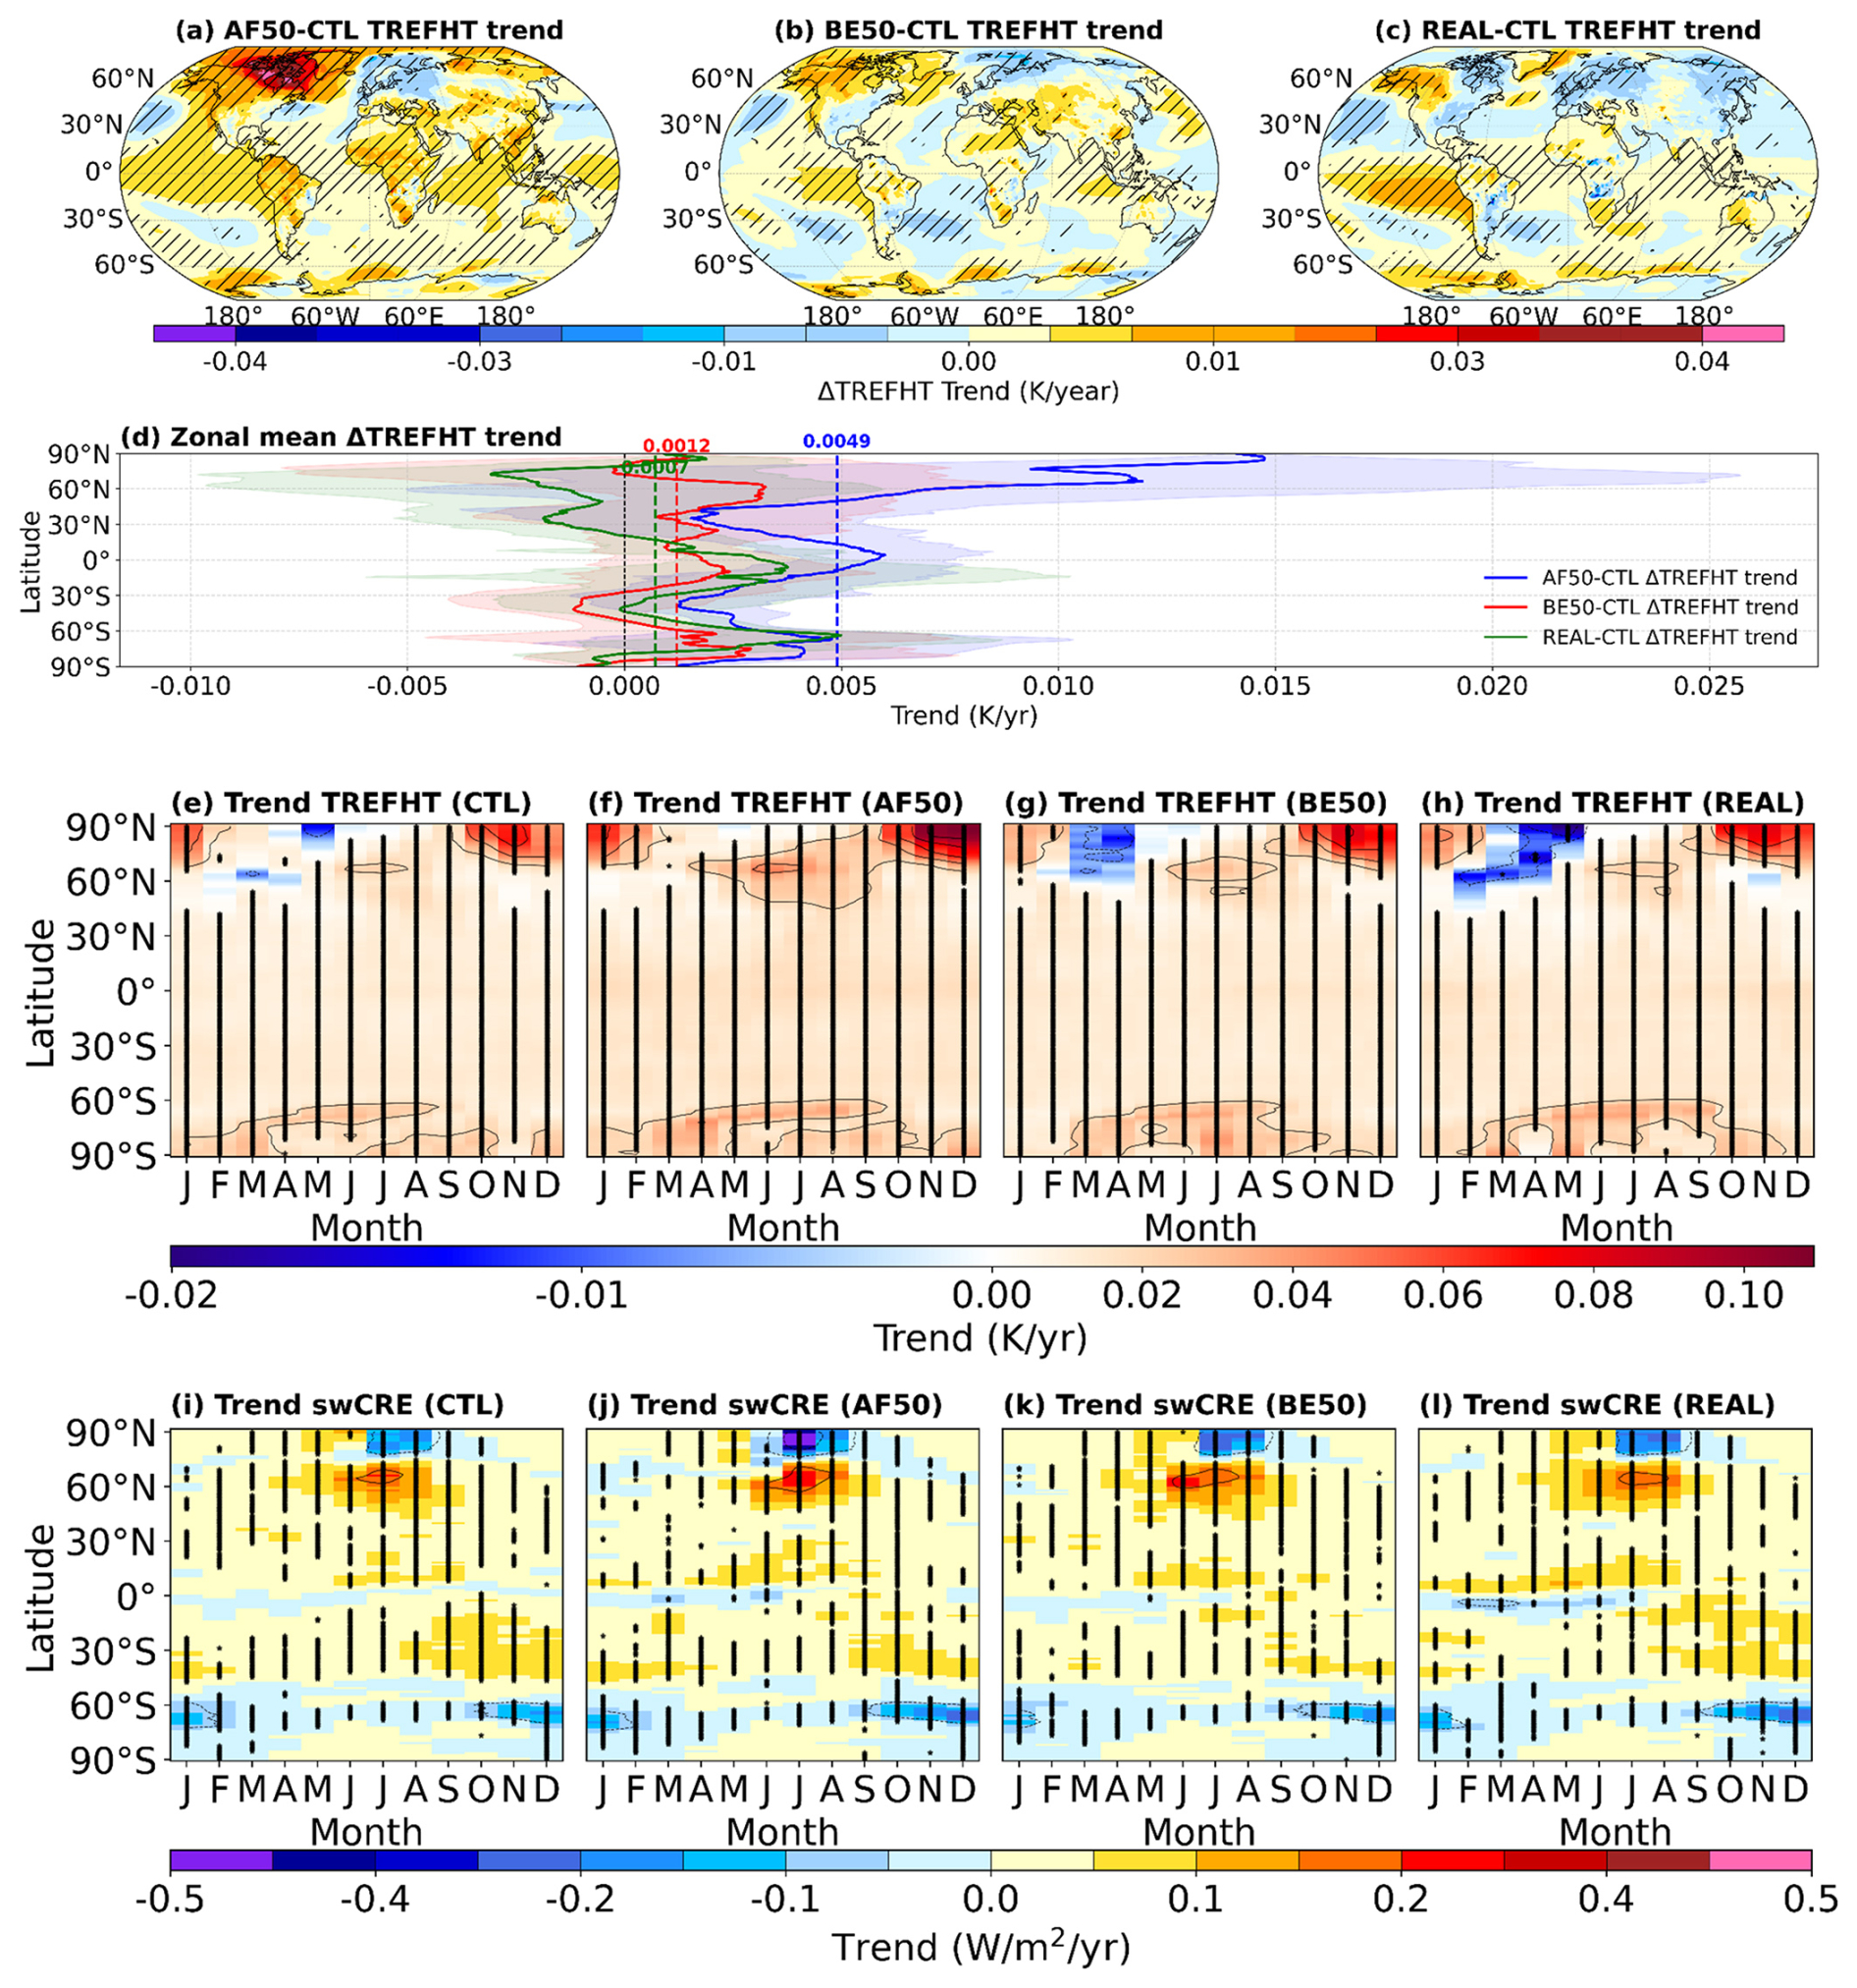
Figure 4Spatiotemporal change of temperature at reference height (TREFHT) and shortwave cloud radiative effect (swCRE). (a–d) Spatial patterns and zonal mean distribution of TREFHT induced by different land use and land cover change. (e–l) Seasonal trends in TREFHT and swCRE grouped by month in different simulation experiments. Given that the global climatological mean of swCRE is approximately −47 W m−2 (Loeb et al., 2024), an enhanced positive trend in swCRE indicates that shortwave radiative cooling of clouds is either weakening or amplifying warming. The black hatching and stippling denote the grid cells where trends are statistically (p<0.05) and the shade in (d) indicates standard deviation.
At the global scale, the investigated LUCC forcings drove a spatial contraction of the cloud loss footprint, paradoxically accompanied by an intensification of local loss magnitudes (Fig. S16). For instance, while the AF50 scenario contracted the global CLDTOT loss area by 6.01 %, the severity of cloud depletion within these confined regions escalated significantly (Fig. S16a and b). This non-linear response demonstrates that idealized afforestation does not trigger a uniform global reduction in cloudiness; instead, it funnels biophysical perturbations into highly sensitive terrestrial regions, thereby generating localized, intense warming hotspots (Fig. 4a). The formation of such regional warming hotspots is largely associated with areas where grasslands or shrublands have transitioned into forests (Fig. S8). Furthermore, both REAL and BE50 scenarios amplified CLDHGH trend increases over Australia, and REAL induced a more intense mean CLDHGH trend in the SH compared to AF50 (Fig. S12g and h). This implies that even realistic afforestation could inadvertently exacerbate regional warming by accelerating high-cloud formation over specific SH oceanic sectors. Additionally, it is noteworthy that realistic afforestation significantly exacerbates the rate of low-level cloud loss on the western side of South America, even though the forest expansion in this scenario primarily occurs on the southeastern side of the region. This pronounced spatial decoupling highlights critical remote biophysical teleconnections, suggesting that LUCC-induced, cloud-mediated drought risks could be particularly severe in these dynamically linked regions (Li et al., 2025; Kan et al., 2025).
3.3 The response of temperature and cloud radiative effect to LUCC
Beyond the direct (local) surface albedo effect, distinct land use forcings influence temperature trends and their spatial distribution through indirect (non-local) cloud radiative effects (Schneider, 1972). While increases in temperature at reference height (TREFHT) are ubiquitous across all simulations (Fig. 4e–h), idealized afforestation does not merely amplify this background warming; rather, it coalesces these thermal trends into highly concentrated regional hotspots (Figs. 4a and S17a, e). This localized warming is predominantly driven by the mid- to high latitudes of the Northern Hemisphere. To quantify this spatial aggregation, we applied the Gini coefficient to the positive temperature trends in the Northern Hemisphere. Notably, the coefficient shifts from 0.25 in the CTL simulation to 0.31 under the AF50 scenario (Fig. S17a and e). This stark exacerbation in spatial inequality demonstrates that large-scale idealized afforestation induces a highly skewed, uneven warming pattern – disproportionately penalizing specific latitudinal bands rather than distributing the thermal burden uniformly. The pronounced spatial aggregation of warming induced by the AF50 scenario is fundamentally driven by the extensive conversion of native grasslands and shrublands to forests (Fig. S8c). Because these non-forest biomes are inherently concentrated across mid-to-high latitudes (Olson et al., 2001; Dixon et al., 2014), their large-scale replacement disproportionately localizes the adverse biophysical warming effects within these specific latitudinal bands. The expansion of bioenergy crops substantially redistributes the warming hotspots induced by AF50, the intensity is alleviated in many regions (e.g., Southern Ocean, Antarctica), while opposite changes occur elsewhere, such as the Western Pacific, where BE50 reverses AF50's cooling to a warming trend. A similar redistribution of hotspots is observed when comparing AF50 with realistic afforestation; notably, REAL mitigates or offsets the significant warming trends seen in AF50 across mid-to-high latitudes of North America and Eurasia.
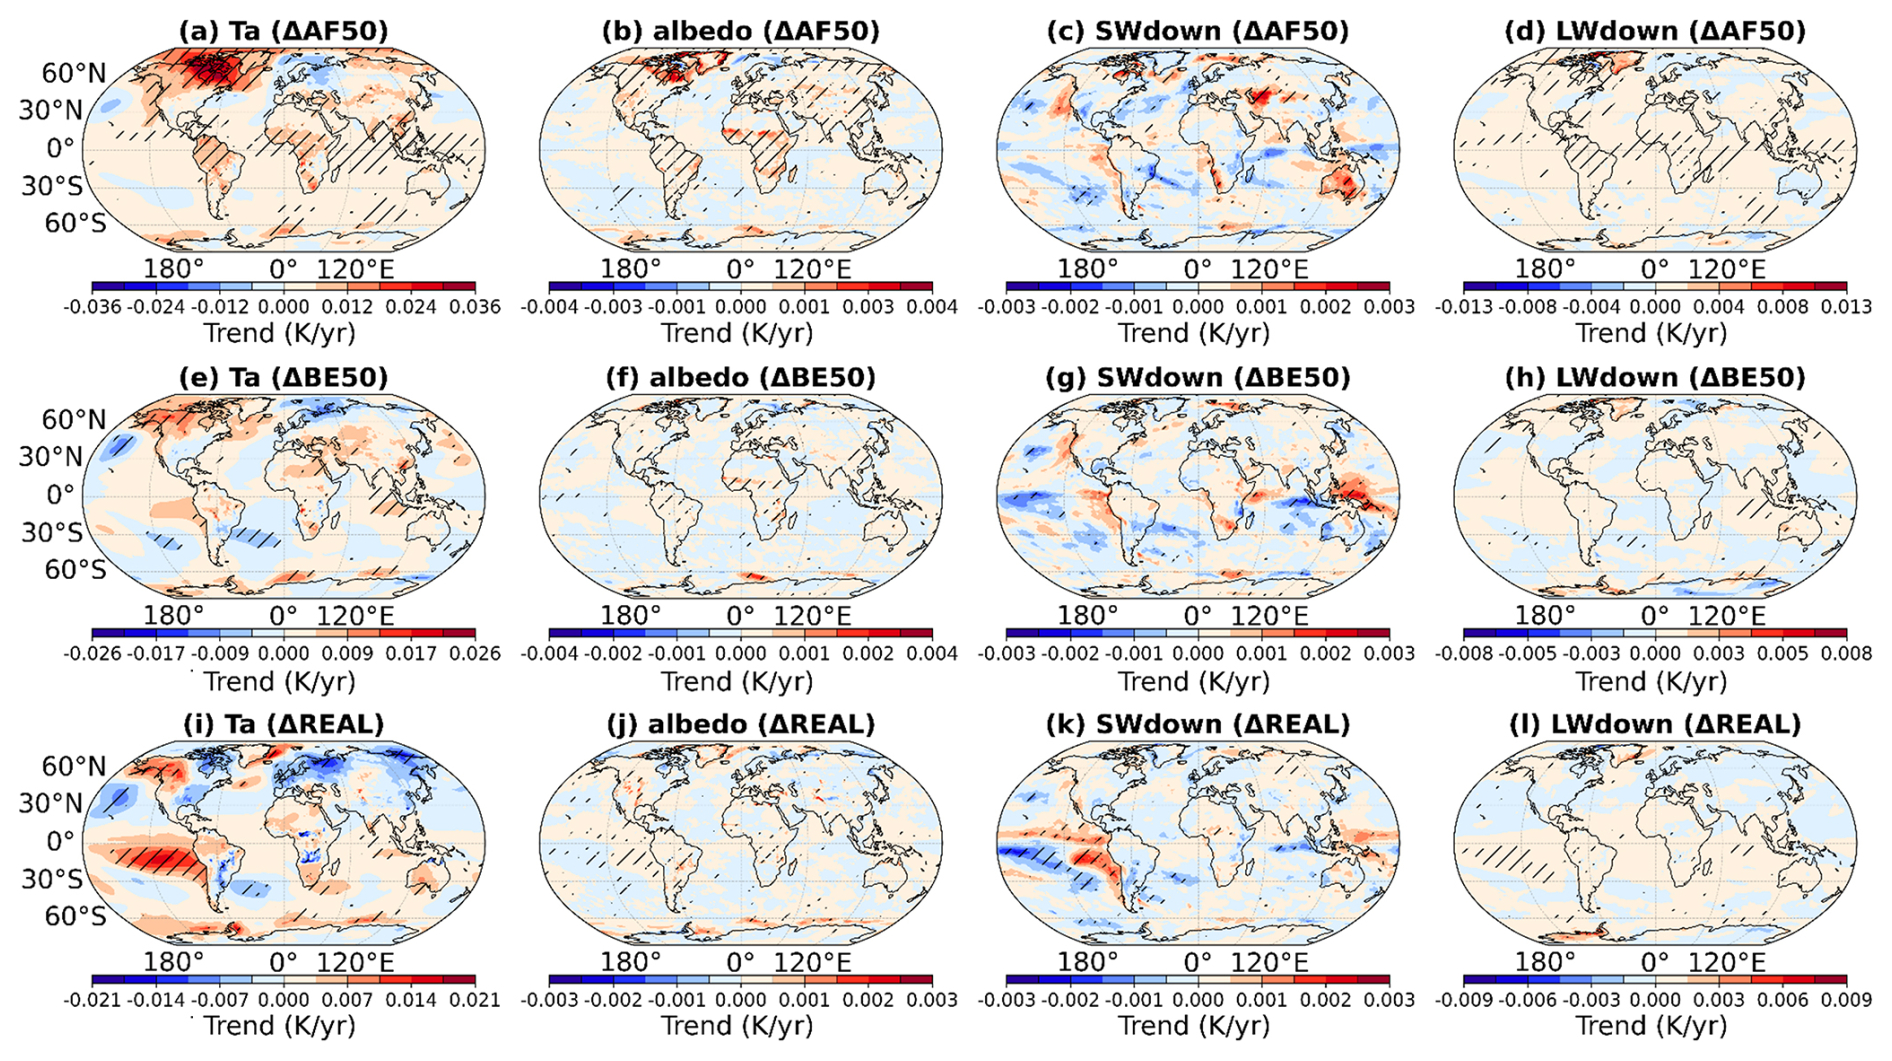
Figure 5Long-term trends of key physical terms (decomposed by the surface energy balance equation) induced by different LUCC. Ta represents the atmospheric feedback term, albedo denotes the surface albedo term, and SWdown (SW↓) and LWdown (LW↓) indicate the downward shortwave and longwave radiation terms, respectively. The black hatch indicates the grids that passed the test of significance (p<0.05).
The zonal mean responses of TREFHT exhibit stark divergences (Fig. 4d). In the mid-to-high latitudes of the NH, the idealized afforestation drives substantial warming, in sharp contrast to the pronounced cooling induced by the REAL scenario. This boreal warming is intricately coupled with severe cloud cover loss; specifically, the loss of low-level clouds triggers an anomalous positive swCRE trends that substantially amplifies surface heating (Figs. 4, 5, and S18–S21). Crucially, the top-of-atmosphere (TOA) shortwave cloud radiative effect (swCRE) serves as a robust diagnostic, vividly capturing this signature of cloud-mediated warming amplification (Figs. S20 and 21). The regions with larger cloud loss magnitudes and stronger temperature rise trends largely overlap, particularly in the boreal region (50–90° N). Relative to the global average, AF50 and BE50 significantly amplified warming here (factors of 2.15 times and 1.71 times, respectively), while REAL induced cooling (factor of −1.51 times). This pronounced warming amplification phenomenon is primarily driven by an enhanced atmospheric feedback trend, further amplified by the accelerated reduction of clouds in the middle and low-level clouds (Fig. 5). AF50 caused the low-level cloud loss rate in this region to be 8.80 times the global average, and BE50's relative amplification was even higher (13.63 times). Furthermore, the total cloud cover decline significantly contributed to the temperature rise, showing 8.88 times the global level in AF50 and by a factor of 26.12 in BE50. Therefore, under the idealized LUCC scenario, the significant warming phenomenon simulated in the boreal region is partly attributed to the enhanced positive trend of swCRE caused by mid-to-low-level cloud loss, although atmospheric feedback plays a dominant role. A significantly enhanced trend in swCRE is simulated on the western side of South America, which is associated with accelerated loss of low-level clouds. Furthermore, at the global scale, the sensitivity of swCRE to temperature is attenuated under idealized afforestation and bioenergy expansion scenarios relative to the control. Specifically, the response weakens from −0.746 in the control to −0.741 and −0.742 in the AF50 and BE50 experiments, respectively. Conversely, realistic afforestation exhibits an opposing trend (−0.749 ). In other words, the negative shortwave cloud feedback is weakened by approximately 0.67 % and 0.54 % under the two idealized scenarios, whereas realistic forest expansion strengthens this negative feedback by ∼ 0.40 % (Fig. S22).
3.4 Forest and bioenergy-induced hemispheric cloud trends asymmetry
We used the Gini index to quantitatively assess the inequality and spatial concentration of global cloud cover trends due to LUCC (Zhao et al., 2025). A Gini index closer to one signifies a highly unequal distribution, with trends strongly concentrated in specific latitude bands. For CLDTOT, relative to the CTL, idealized afforestation significantly intensified concentrated cloud losses in both hemispheres (e.g., SH downward trends Gini index rose from 0.48 to 0.52; Figs. 6 and S23d), suggesting amplified local land use impacts (Hua et al., 2023). This concentration effect was most dramatic for CLDLOW in the NH, where AF50 caused the Gini index to rise sharply from 0.41 (CTL) to 0.50 (Figs. 6f and S23f), indicating a greater concentration of cloud decline areas. Bioenergy expansion induced milder asymmetry overall, but still concentrated SH increases in specific CLDTOT and CLDHGH hotspots (Fig. S24).
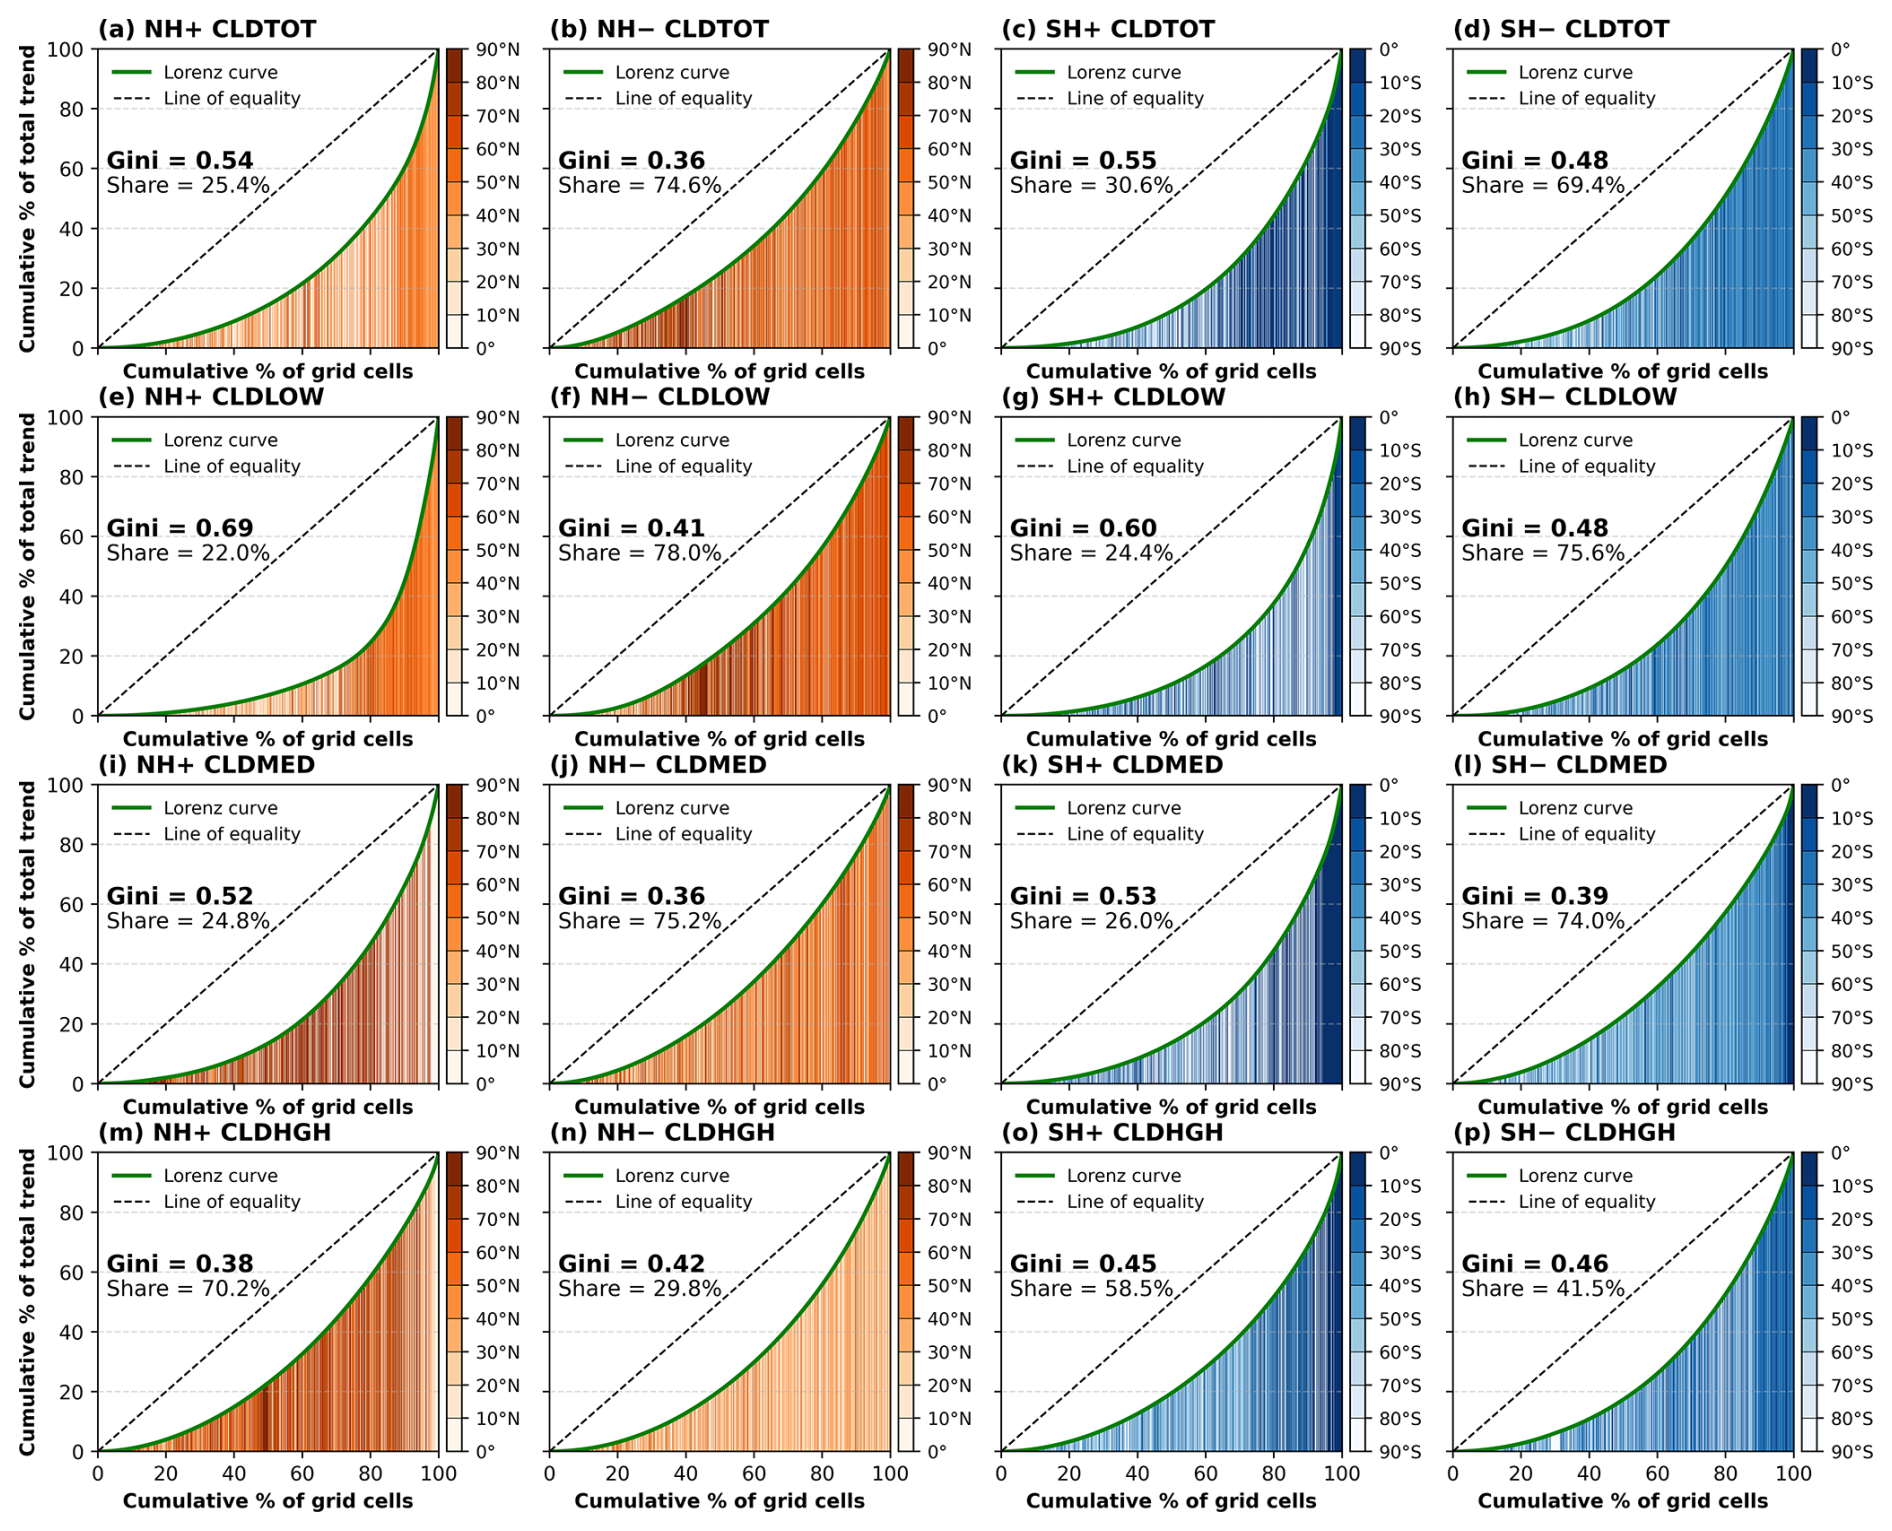
Figure 6Asymmetry of cloud trends between hemispheres. Lorenz curves of long-term CLDTOT (a–d), CLDLOW (e–h), CLDMED (i–l), CLDHGH (m–p) trend in the Northern (0 to 90° N) and Southern Hemispheres (0 to 90° S) during the 2015–2100 in CTL run. The share indicates the percentage of an increase or decrease in the trend. The results of the AF50, BE50, and REAL experiments can be found in Figs. S23–S25.
In stark contrast to idealized expansion, realistic afforestation consistently exerted the minimal influence on cloud trend heterogeneity, remaining closest to the CTL simulation (Fig. S25). For CLDTOT, REAL scenario slightly broadened NH increasing trends (Gini index from 0.54 to 0.50) with limited alteration to the overall spatial patterns. For CLDLOW, REAL scenario increased the concentration of NH downward trends, but its impact was far less pronounced than that of AF50 (Gini index from 0.41 to 0.43), this means that realistic afforestation will concentrate the loss of low-level clouds in specific areas. Collectively, these findings reveal that idealized LUCC forcings profoundly disrupt inter-hemispheric cloud homogeneity; by triggering highly concentrated low-level cloud depletion, they risk severe localized climatic perturbations, a hazard largely avoided under the more spatially diffuse impacts of realistic scenarios. Previous studies has established that large-scale land-use changes profoundly perturb atmospheric dynamics over a radius extending at least 200 km (Chambers and Artaxo, 2017; Khanna et al., 2017). Crucially, within this expansive dynamic footprint, the intense spatial aggregation of low-level cloud loss driven by the widespread conversion of native grasslands and shrublands into forests, holds the potential to precipitate severe regional droughts. Analogous to the hydrological extremes induced by highly skewed precipitation patterns (Lesk and Mankin, 2026), this geographically concentrated cloud loss disrupts the local energy and moisture balance, acting as a potent catalyst for cloud-mediated drought risks (Miralles et al., 2014; Zhou et al., 2019).
3.5 Machine learning identifies influential predictors of LUCC-induced cloud trends
Having established that distinct LUCC scenarios markedly alter the spatial distribution of global cloud-cover trends, we employed an interpretable machine-learning framework to identify the most influential predictors of these changes and characterize their relative importance and model-learned dependencies.
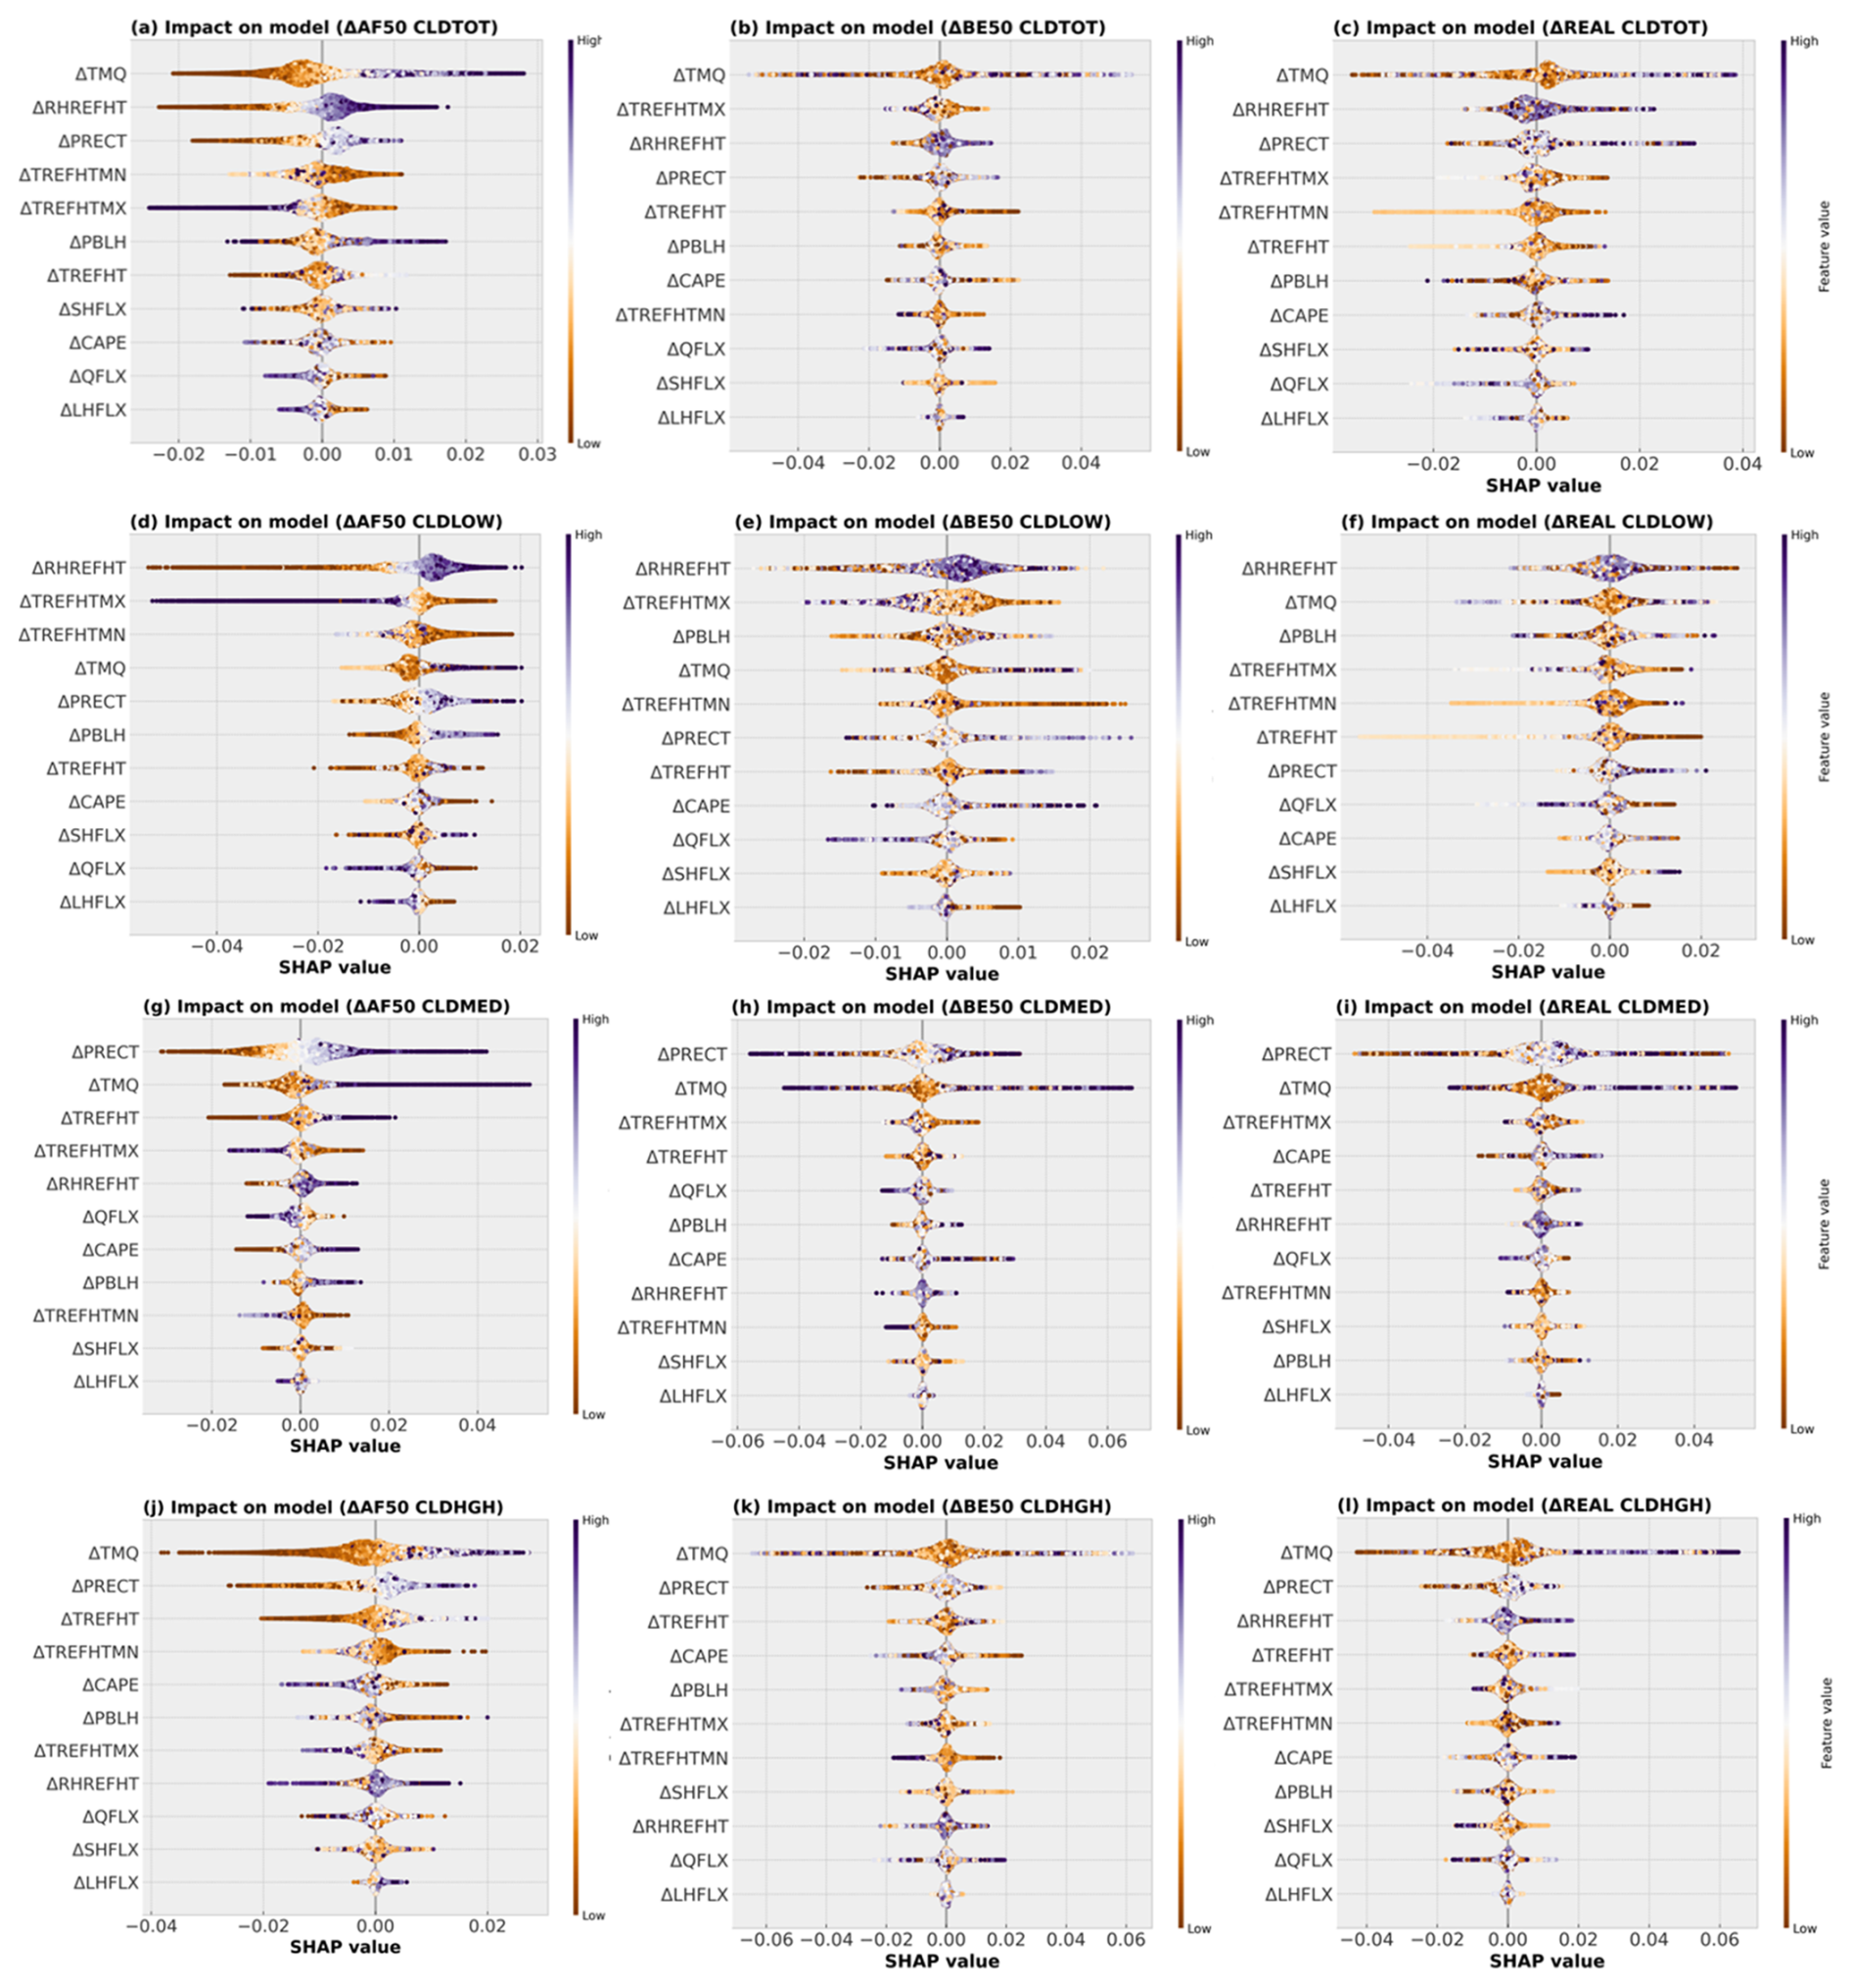
Figure 7Ranked drivers to cloud cover trends induced by different land-use change scenarios, as revealed by the machine learning model. The SHAP (SHapley Additive exPlanations) summary plots illustrating the impact of each climate features on the predicted changes in (a–c) total cloud (CLDTOT), (d–f) low-level cloud (CLDLOW), (g–i) medium-level cloud (CLDMED), and (j–l) high-level cloud (CLDHGH) under the AF50, BE50, and REAL scenarios relative to the CTL run. Δ present the difference between sensitivity experiments and CTL. In other words, this represents a machine-learning-driven mechanistic modeling of LUCC-induced cloud cover and climate trends. Each dot represents an individual sample. The x-axis (SHAP value) quantifies the directional impact of a specific feature on the model's predicted cloud trend (i.e., a positive SHAP value drives an increasing cloud cover trend, while a negative value drives a decreasing trend). The right-side color bar signifies the actual physical magnitude of the climate feature itself, transitioning from low values (orange) to high values (purple). The relationship between the color and the x-axis reveals the physical driving mechanism. For instance, if a cluster of purple dots (high feature value) is distributed on the positive side of the x-axis (SHAP > 0), it physically indicates that an increase in this specific climate feature induced by LUCC strongly drives an increasing trend in cloud cover. Conversely, orange dots on the negative side indicate that a decrease in the feature value contributes to a decreasing cloud cover trend. PRECT, total precipitation (); TMQ, total precipitable water (); TREFHT, air temperature at reference height (K yr−1); TREFHTMX, maximum temperature at reference height (K yr−1); RHREFHT, relative humidity at reference height (% yr−1); QFLX, evapotranspiration (); CAPE, convective available potential energy (); PBLH, planetary boundary layer height (m yr−1); TREFHTMN, minimum temperature at reference height (K yr−1); SHFLX, sensible heat flux (); LHFLX, latent heat flux ().
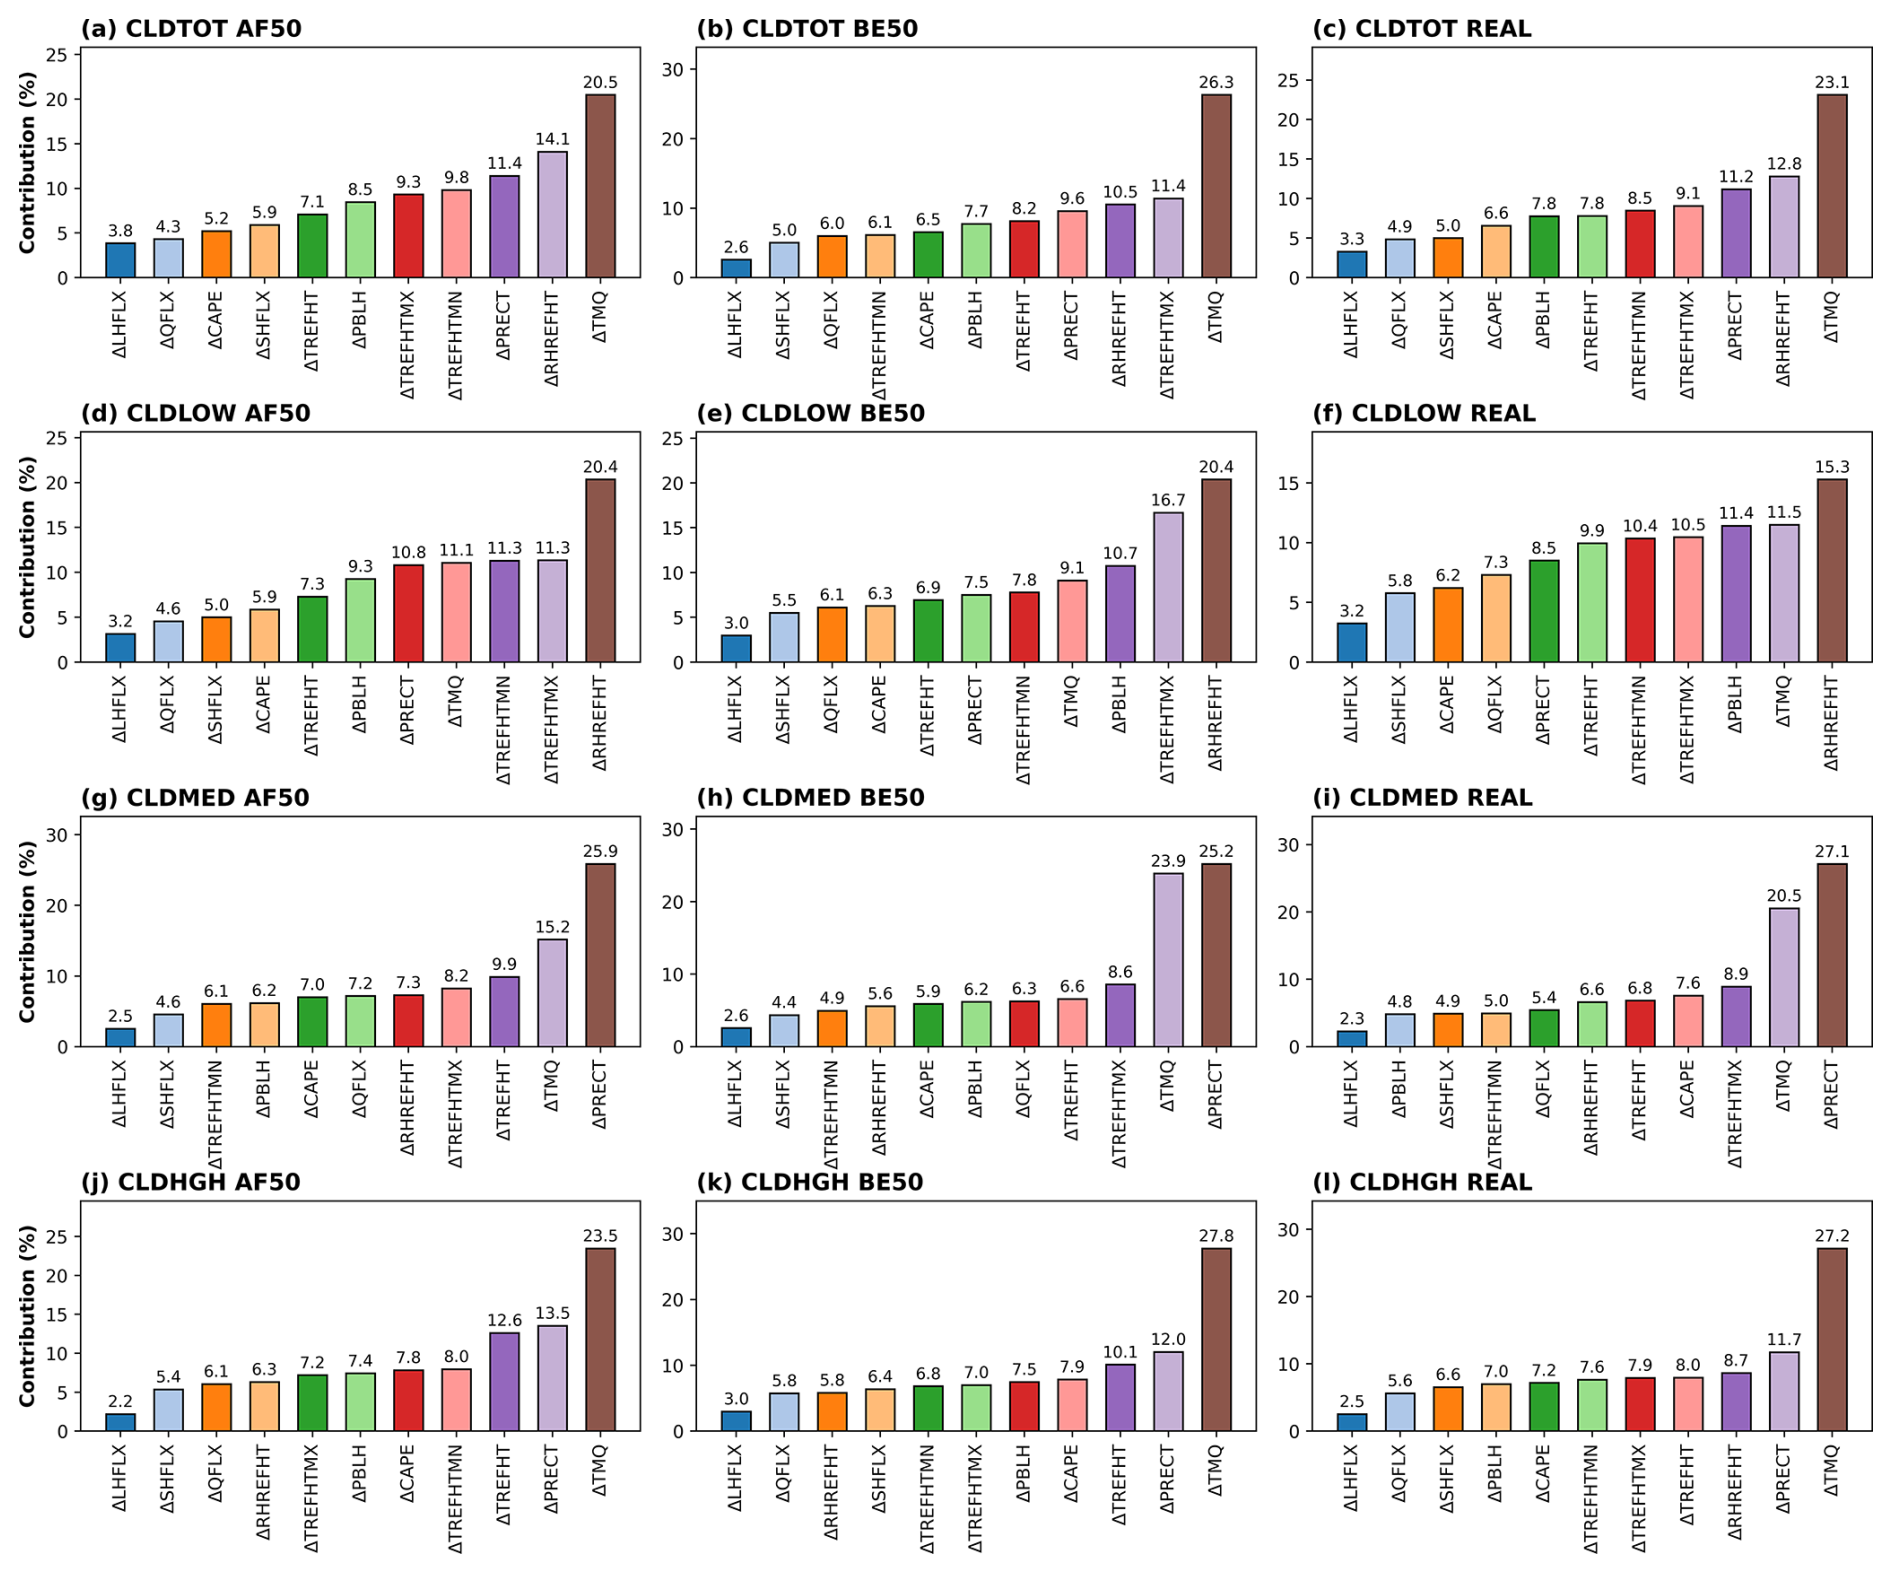
Figure 8Normalized feature importance for cloud-cover trends under different land-use change scenarios. Δ present the difference between sensitivity experiments and CTL. Feature importance is calculated from SHAP values and normalized across all predictors within each machine-learning model. The resulting percentages quantify the relative importance of predictors to model predictions (Berdugo et al., 2022).
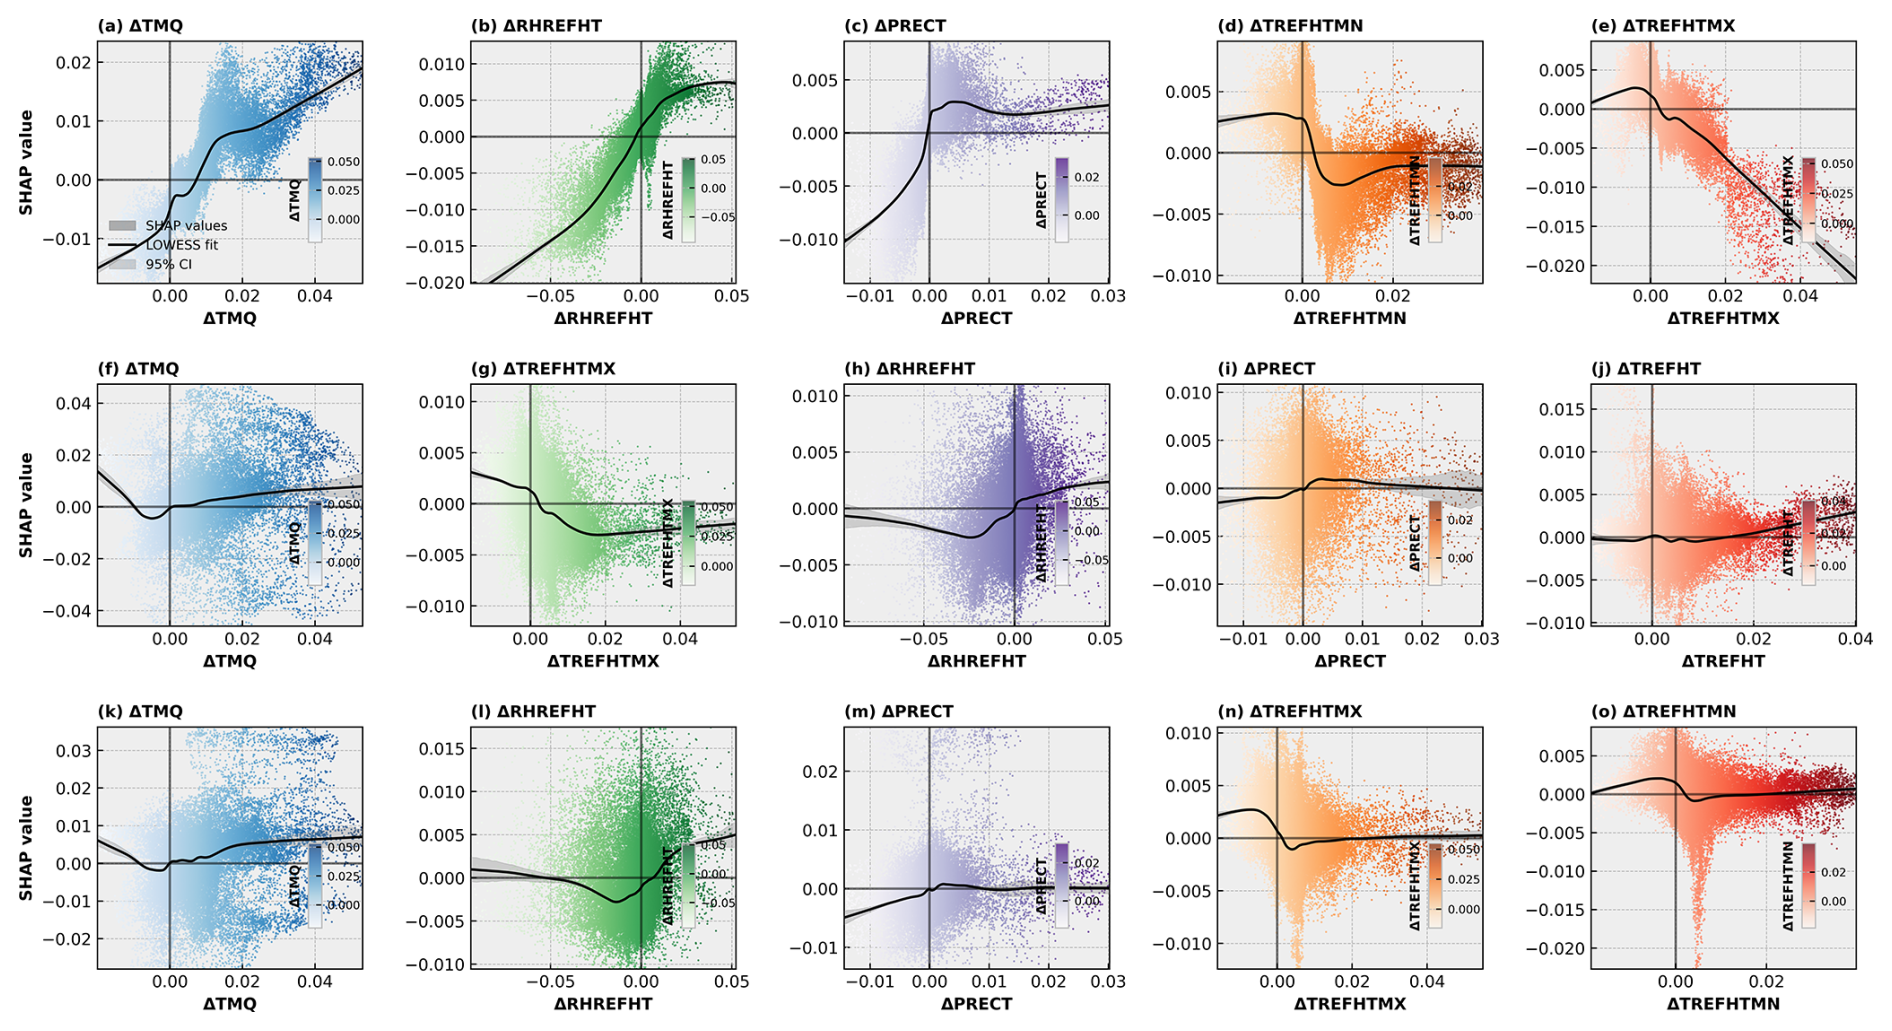
Figure 9Dependence plots of the top five important variables for total cloud cover (CLDTOT), as revealed by the machine learning model. The first to third rows represent AF50, BE50 and REAL experiments, respectively. The background scatter displays the full samples colored by feature values. The SHAP dependence trend (black solid line) was visualized using Locally Weighted Scatterplot Smoothing (LOWESS) (Cleveland, 1979) with a smoothing fraction of frac = 0.3 (using 30 % of nearest neighbors for local regression) and it = 3 robust iterations to reduce outlier influence, and gray shaded band indicates 95 % confidence interval (CI) of LOWESS regression (calculated by a random subsample of 10 000 grid cells). The corresponding results for CLDLOW, CLDMED, and CLDHGH are presented in Figs. S26, S28, and S30, respectively.
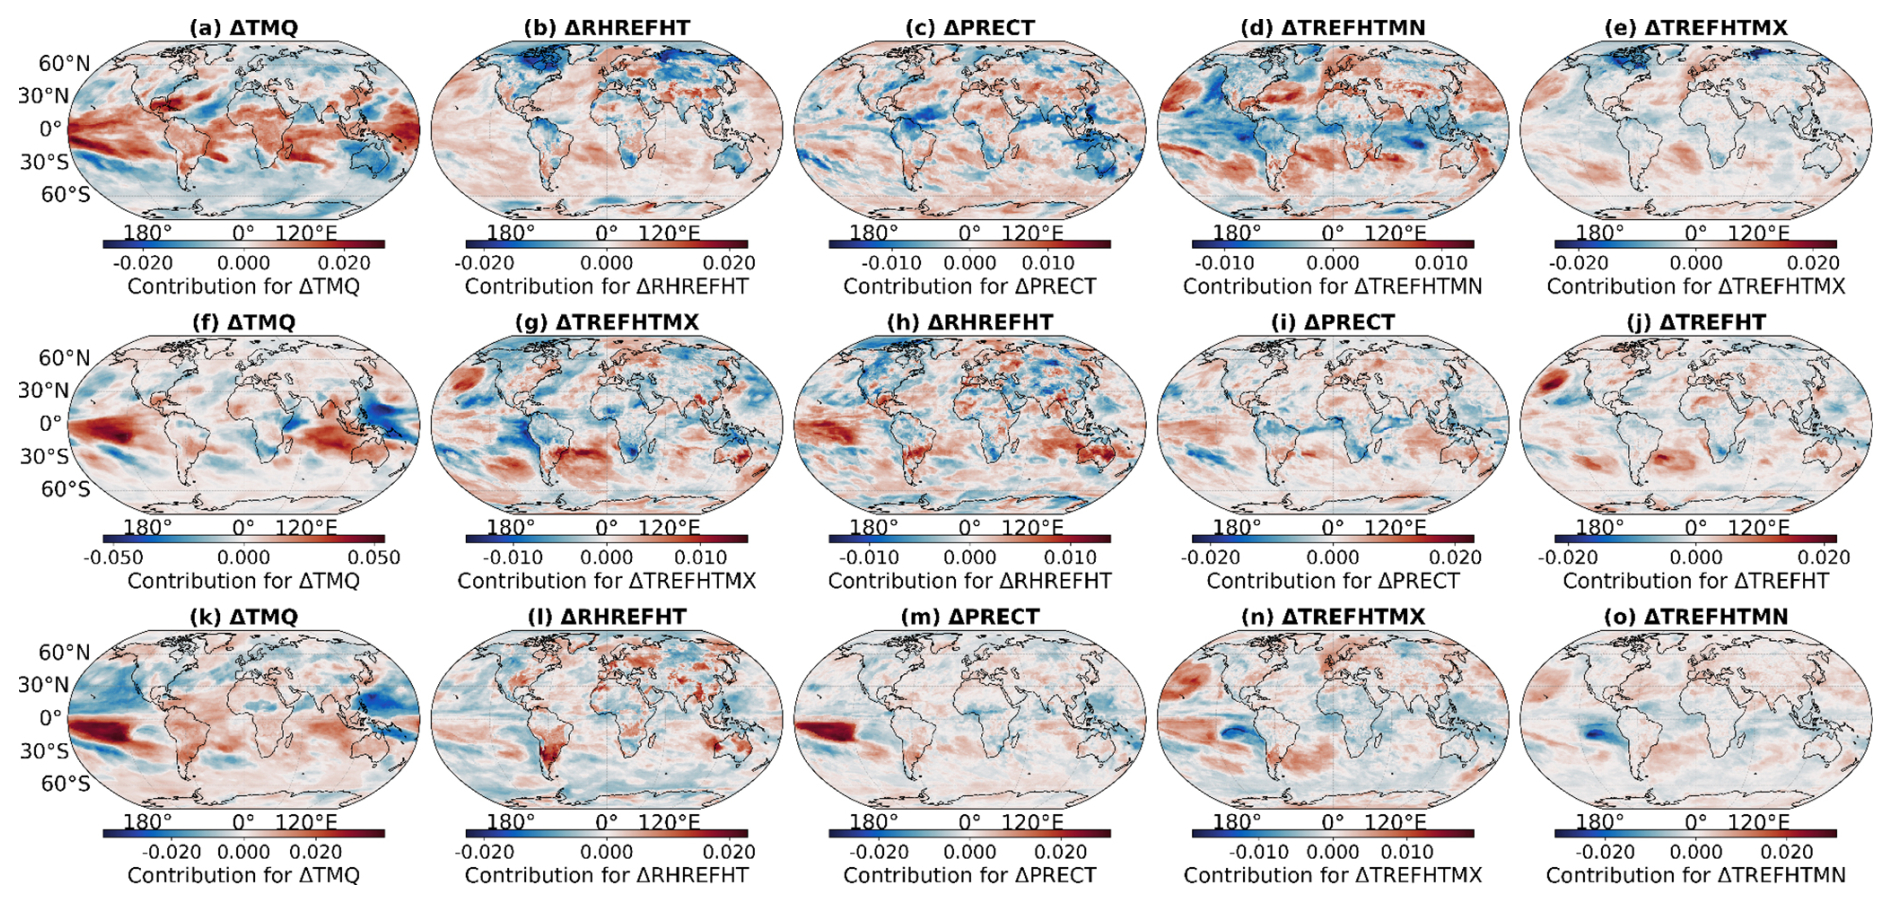
Figure 10Spatial drivers and contribution of CLDTOT revealed by machine learning response to different land use change. The first to third rows represent AF50, BE50 and REAL experiments, respectively. The contribution is expressed in SHapley Additive exPlanations (SHAP) value (Berdugo et al., 2022). The corresponding results for CLDLOW, CLDMED, and CLDHGH are presented in Figs. S27, S29, and S31, respectively.
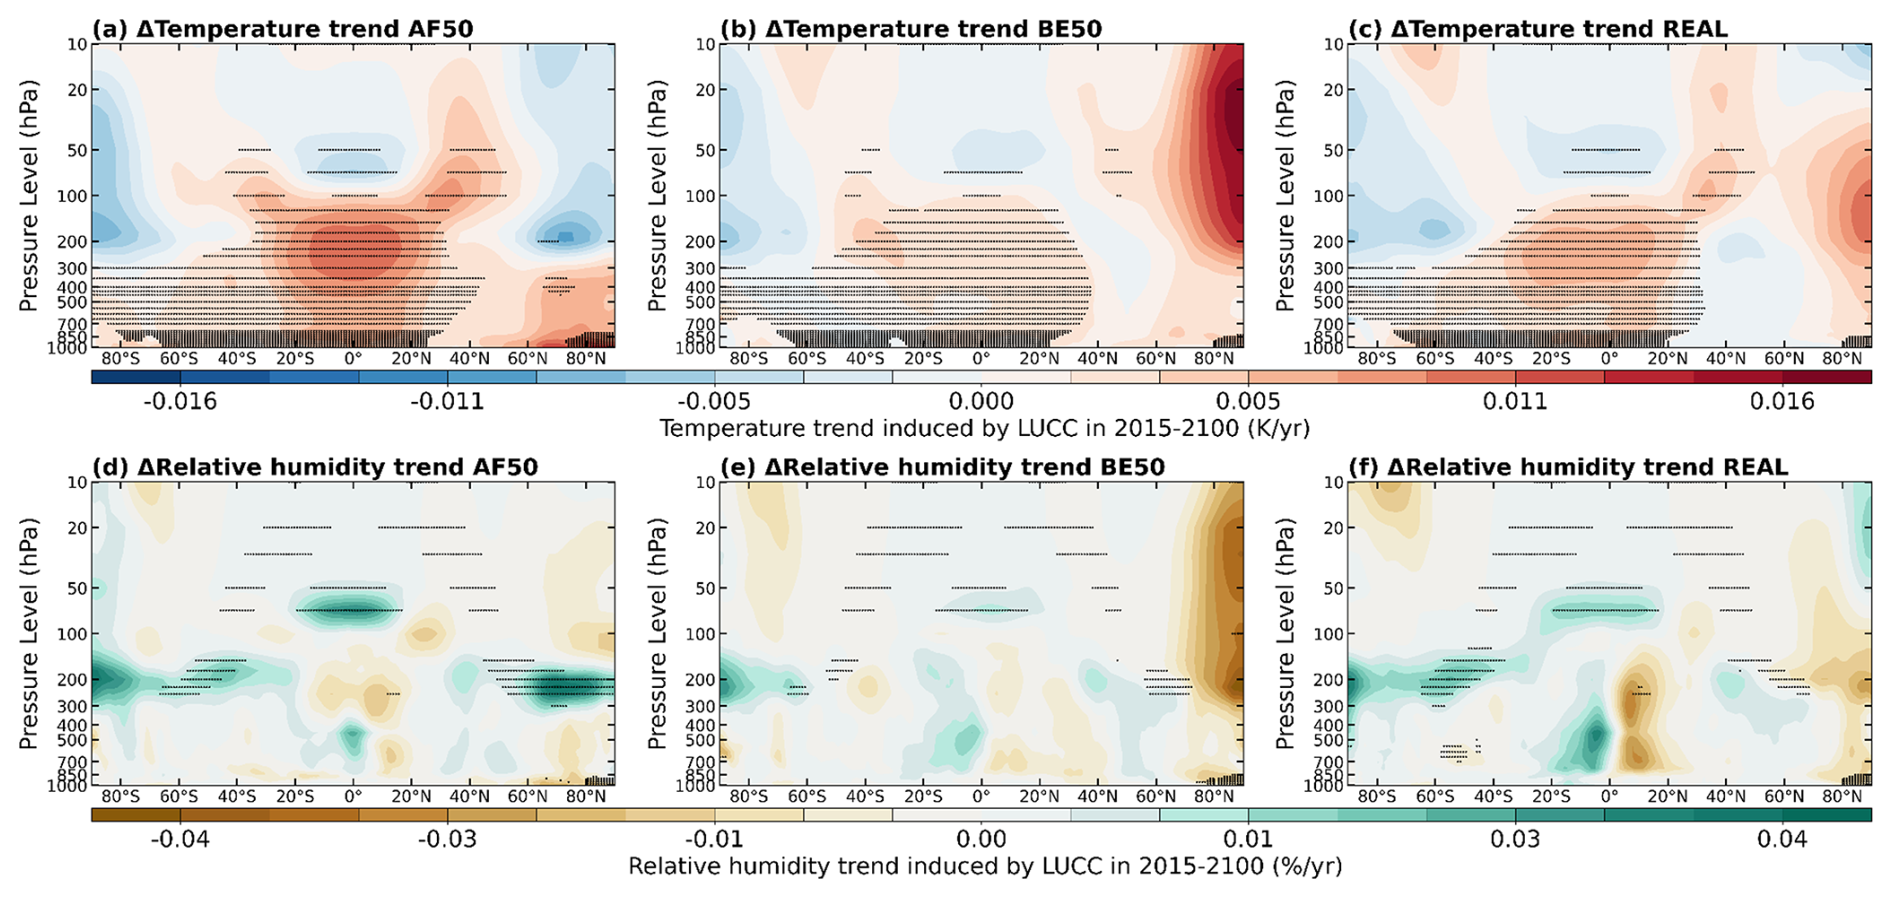
Figure 11Vertical profiles of temperature and relative humidity trends induced by different LUCC. The black asterisks denote grid cells with statistically significant trends (p<0.05).
Across all simulations, the machine-learning analysis identifies changes in total precipitable water (ΔTMQ) as the highest-ranked predictor of CLDTOT trends, with normalized SHAP importance values of 20.5 %, 26.3 %, and 23.1 % under the AF50, BE50, and REAL scenarios, respectively (Figs. 7a–c and 8a–c). The SHAP dependence relationships between TMQ and CLDTOT are consistently positive (Fig. 9a, f, and k), indicating that lower TMQ values are associated with more negative model-predicted CLDTOT trends, whereas higher TMQ values are associated with more positive predictions, which indicates that large-scale LUCC disturbances to the hydrological cycle are the primary macroscopic factor controlling long-term changes in total cloud cover (Pielke et al., 2007). Notably, the dependency of CLDTOT on TMQ under idealized afforestation is highly linear and significantly stronger than in other scenarios, the particularly strong and approximately linear SHAP dependence under AF50 indicates that TMQ is especially influential in the model predictions for this scenario (Fig. 9a, f, and k). Spatially, however, the regulatory role of TMQ varies by location; the TMQ increase trend induced by idealized forest expansion mainly contributes to the CLDTOT increase trend in tropical regions, while outside the tropics, it is primarily negative contributions (Fig. 10a). These results indicate that the rapid CLDTOT decline across Northern Hemisphere land (Fig. 2) is fundamentally governed by a chronic deficit in atmospheric moisture supply, and this manifests specifically as a trend of significant loss in relative humidity (Fig. S32b). These dynamics corroborate previous modeling evidence demonstrating that extensive midlatitude land-cover transitions (from C3 grasslands to forests) severely exacerbate lower-tropospheric moisture deficits, driving a concomitant and pronounced depletion of cloud cover (Laguë and Swann, 2016). Particularly in water-limited regions of the mid- to high-latitudes of the Northern Hemisphere, the transpiration induced by forests replacing grasslands tends to be weak, which implies that the efficiency of water vapor transport from forests to the atmosphere is lower (Breil et al., 2021). The temperature rise and relative humidity decrease caused by idealized forest expansion are not limited to the surface. Simulations show that the warming and drying trends extend vertically through the troposphere (Fig. 11). The decrease in relative humidity causes the lifting condensation level (LCL) of water vapor to rise. If the elevation of the LCL exceeds the deepening of the planetary boundary layer, boundary-layer moisture fails to reach saturation, thereby inhibiting cloud development or forcing emerging clouds to prematurely dissipate in the overlying subsaturated air (Romps, 2017; Kutta and Hubbart, 2023). This thermodynamic decoupling elucidates how idealized forest expansion drives a synchronized depletion of mid-level clouds (accelerating by a factor of 1.25 over land). Specifically, surface thermodynamic stress dampens vertical moisture transport by altering boundary-layer stability and depth, effectively suppressing mid-level cloud development. Conversely, the REAL scenario averts this desiccation by optimizing surface-atmosphere heat partitioning; it sustains robust evapotranspiration efficiency and promotes atmospheric cooling, thereby effectively neutralizing the albedo-driven warming (Figs. 11 and S34). Previous modeling studies have shown that progressive afforestation in mid-latitudes may suppress moisture supply, thereby causing tropospheric drying; the reduction in cloud fraction across vertical levels is precisely the result of this atmospheric response (Laguë and Swann, 2016). Therefore, in the idealized afforestation simulation, relative humidity is the second-ranked predictor of CLDTOT trends, with a normalized SHAP importance of 14.1 % (Fig. 8a). This total precipitable water-dominated attribution broadly extends to regional total cloud cover losses under bioenergy expansion and realistic afforestation. However, the subsequent hierarchy of contributing factors exhibits distinct scenario-dependent variations, reflecting varying interplay between relative humidity and surface temperature extremes (Fig. 8b and c).
For CLDLOW, relative humidity is the highest-ranked predictor under all three LUCC scenarios, with normalized SHAP importance values of 20.4 %, 20.4 %, and 15.3 % for AF50, BE50, and REAL, respectively (Figs. 7d–f and 8d–f). Under AF50, decreasing relative humidity is associated with increasingly negative SHAP values for CLDLOW, with the strongest spatial correspondence concentrated over the mid-to-high latitudes of the Northern Hemisphere (Fig. S27a). In these regions, idealized afforestation causes surface darkening and a substantial reduction in albedo, leading to increased absorption of surface net solar radiation (Figs. S35–S37), particularly during the late afforestation stage (2081–2100), idealized forest expansion induces a pronounced decrease in land surface albedo by 0.0142, a signal that is approximately 2.4 times larger than the global mean (−0.0058). This albedo anomaly triggers a concomitant increase in net surface radiation over land by 2.43 W m−2, exceeding the global average (0.74 W m−2) by a factor of roughly 3.3 (Fig. S37). The additional energy is preferentially partitioned into sensible heat flux (elevated Bowen ratio), suppressing the increase in latent heat flux. Over land areas, the sensible heat flux increases by 0.98 W m−2, whereas the latent heat flux increases by only 0.92 W m−2, generating strong buoyant turbulence that promotes the development of a deeper and well-mixed planetary boundary layer. Furthermore, this implies that as larger-scale grasslands or shrublands are converted into forests, while the initial latent-heat-dominated evaporative enhancement may slightly promote cloud cover, the subsequent substantial escalation in sensible heat flux significantly accelerates the loss of low- and mid-level clouds. Enhanced vertical mixing and entrainment of drier free-tropospheric air dilute boundary-layer moisture while warming the lower troposphere, jointly driving the pronounced decline in relative humidity and the rise in maximum temperature simulated under the idealized afforestation scenario (Fig. S11; Spracklen and Garcia-Carreras, 2015). At the same time, idealized afforestation induces a significant increase in temperature in response to the substantial and rapid loss of CLDLOW (Fig. S32d, e, and g), which indicates that the relative humidity decline, and temperature rise trends induced by idealized afforestation jointly amplify the loss rate of CLDLOW, and it exhibits a strong linear dependency (Fig. S26a and b). As established by prior studies, afforestation across the NH mid-to-high latitudes induces profound surface darkening, which sharply reduces albedo and amplifies solar radiation absorption, ultimately driving surface warming (Meissner et al., 2003; Swann et al., 2010). Crucially, the magnitude of this albedo decline and the subsequent positive radiative forcing per unit of afforested area are disproportionately greater in these boreal domains than in any other region (Foley et al., 1994; Weber et al., 2024). The simulation proves that the regions with rapid decline trends in CLDLOW induced by idealized afforestation simultaneously experience rapid rise trends in temperature and rapid decline in relative humidity (Figs. 2 and S32b, d, e, and g). While albedo reduction acts as the initial biophysical driver of local surface warming across NH land areas (Arora and Montenegro, 2011), it cannot directly precipitate the long-term decline of cloud cover. As revealed by our machine learning attribution, the critical missing bridge is governed by atmospheric moisture dynamics. Specifically, under idealized afforestation, the albedo-induced surface warming fundamentally alters surface energy partitioning, heavily skewing it toward sensible heat fluxes. This intense sensible heating drives the development of a deeper, vigorously mixed planetary boundary layer (Fig. S32f). Consequently, enhanced dry-air entrainment from above, coupled with a lifting condensation level that ascends faster than the planetary boundary layer top, severely depresses relative humidity (Fig. S32b). This thermodynamic cascade provides the definitive physical link between surface albedo reduction and low-level cloud cover loss. This is highly consistent with our machine learning results, which parse relative humidity, closely followed by maximum temperature, as the paramount driving factors for accelerated low-level cloud cover loss.
Machine learning identifies different LUCC-induced trends in total precipitation (ΔPRECT) and atmospheric total precipitable water (ΔTMQ) as the paramount drivers governing mid- and high-level cloud dynamics (Fig. 7g–l), in particular, these two factors contribute more than 40 % to the changing trends of mid-level clouds (Fig. 8g–i). Large-scale idealized afforestation causes insufficient water supply in the mid-to-high latitude regions of the NH, which also inhibits the development of CLDMED, but the impacts of bioenergy expansion and realistic afforestation are overall positive (Fig. S29). More critically, high-level clouds can exert a net warming effect on the climate system through their strong longwave greenhouse effect (Hartmann et al., 1992; Stephens, 2005). In the idealized afforestation experiment, the simulated increase in CLDHGH over the mid-to-high latitudes of the Northern Hemisphere coincides with upper-tropospheric cooling and increased relative humidity (Fig. 11a and d), indicating that the high-cloud response is closely associated with changes in the upper-tropospheric thermodynamic environment. However, because CLDHGH is an aggregate pressure-based diagnostic, these relationships do not establish whether the simulated increase primarily reflects cirrus, convective anvils, surface-flux influences on deep convection, or indirect large-scale dynamical adjustment. The concurrent increase in the top-of-atmosphere longwave cloud radiative effect (Fig. S20b) demonstrates the radiative consequence of the enhanced high-cloud cover, but does not distinguish among these formation pathways. Specifically, in the Northern Hemisphere, the mean positive trend of TOA swCRE rises from 0.0465 W m−2 in the CTL run to 0.0490 W m−2 in AF50, reaching 0.0511 W m−2 in BE50 and 0.0531 W m−2 in the realistic afforestation scenario. Similarly, regarding the TOA longwave cloud radiative effect in the Northern Hemisphere, the mean positive value surges from 0.0099 W m−2 in the CTL run to 0.0155 W m−2 in AF50. Therefore, idealized afforestation not only accelerates warming by accelerating the loss of mid- and low-level clouds, but also amplifies warming by promoting the increase of high-level clouds, and the warming induced by high-level clouds also exists in the bioenergy expansion and realistic afforestation simulations. However, in contrast, afforestation in real-world scenarios effectively optimizes the distribution of heat between the surface and the atmosphere, allowing atmospheric cooling and evapotranspiration efficiency (a positive manifestation of hydrothermal coupling) to dominate, partially offsetting the warming effects caused by decreased albedo. Admittedly, under realistic afforestation scenarios, the pronounced cooling simulated across the Northern Hemisphere mid-to-high latitudes may not be driven exclusively by positive cloud cover anomalies, as non-local temperature advection likely also plays a substantial modulating role (Kan et al., 2025).
Our simulation results indicate that two distinctly different future land use methods may significantly alter long-term cloud cover trends in terms of their impact on the magnitude of climate warming, particularly large-scale idealized forest expansion exacerbates cloud-mediated climate warming by substantially accelerating the loss of mid-low-level clouds and the increase of high-level clouds. Bioenergy expansion also imposes negative impacts on cloud cover, but the overall intensity is weaker than that of idealized afforestation; this relatively mild negative impact may stem from lower LAI and reduced transpiration, as in previous assessments of this scheme, where bioenergy expansion may be accompanied by depletion of soil moisture and hinder the accumulation of atmospheric humidity (Le et al., 2011; Cheng et al., 2024). We believe that the negative impacts of these two large-scale idealized LUCC forcings on cloud cover originate from their own expansion areas, because in our simulations, the land for forest expansion is taken from grasslands or shrubs, which may lead to an increase in surface radiation absorption; the increased radiation warms the bottom of the convection layer in the form of sensible heat, thereby imposing more stringent conditions for cloud formation. In contrast, in the bioenergy expansion simulation (irrigated and rained sugarcane), the land comes from the land of other bioenergy crops, which means a reduction in the area of other crops with higher albedo, for example, switchgrass has an overall higher albedo than sugarcane and thus has greater climate cooling potential (Abraha et al., 2021; Lei et al., 2023). When other possible bioenergy crops with greater climate cooling potential are replaced by sugarcane, it may suppress cloud formation due to insufficient cooling, thereby inducing mild cloud loss. Furthermore, since our idealized afforestation scenarios involve converting grasslands or shrubs to forests, although this conforms to the Food and Agriculture Organization (FAO) definition (FAO, 2012), meaning our simulations are neither forest enhancement nor reforestation, it is also essential to consider the potential ecological consequences of such land type conversions. Grasslands, as one of the important terrestrial ecosystems, support unique biodiversity but are also relatively fragile; afforestation in these areas may lead to the loss of flora and fauna, reduced water availability, and increased fires (Veldman et al., 2015a, b; Parr et al., 2024). Therefore, although the primary goal of idealized afforestation is to enhance terrestrial carbon absorption, it carries the risk of ecological degradation (Cao, 2008; Xiao et al., 2020). Here, our idealized forest expansion simulation experiment is not intended to suggest implementing such forest expansion actions; on the contrary, the signal we are sending is cautionary.
On the other hand, we found that idealized and realistic afforestation suppressed the loss trends of total and low-level cloud over the oceans, but idealized bioenergy expansion accelerated their loss trends (Fig. S11). The question we need to answer here is actually through what pathways LUCC disturbances on land propagate energy to the oceans and influence cloud trends. According to previous simulation studies on deforestation, changes in albedo are considered the fundamental source of ocean responses; deforestation increases surface albedo, thereby reducing energy absorption at the surface, so no more heat is allocated to sensible heat flux to heat the convection layer, this process leads to cooling of the convection layer over the oceans (Davin and de Noblet-Ducoudré, 2010). In contrast, in our simulations, the albedo reduction caused by forest expansion (Figs. S35–S37) induces the surface to absorb more solar radiation; the extra radiation is redistributed in the form of sensible heat flux to release into the atmosphere and heat the atmosphere, and the increased heat warms the ocean surface with ample moisture supply, making more water vapor condense into clouds. Therefore, forest expansion overall suppresses the loss rate of total cloud and low-level cloud cover in ocean areas (Liu et al., 2023).
Our hypothesis can be verified from Figs. S32 and S33, namely that forest expansion induces increasing trends in maximum temperature and total atmospheric precipitable water over the oceans. However, in bioenergy expansion, we observe overall opposite results (Fig. S32), namely that bioenergy, due to relatively high albedo, does not lead to substantial warming of the oceans, thus there is not enough heat to make moisture evaporate and condense into clouds. In contrast, realistic afforestation overall does not render clouds detrimental to the climate; this difference largely stems from the type of land conversion and the regions involved. In idealized afforestation, forests are derived from grasslands or shrubs, with large amounts of C3 grasslands distributed in mid-to-high latitude regions of the Northern Hemisphere and C4 grasslands in tropical areas, whereas forest expansion in realistic afforestation simulations is not like this (Wei et al., 2014; Fig. S8).
Although our simulations show that large-scale idealized afforestation and bioenergy expansion induce significant declining trends in mid- and low-level cloud cover, the SHAP-based spatial attribution from machine learning clearly demonstrates that these two distinct land-use changes actually trigger multiple competing land–atmosphere coupling processes. The net cloud response is essentially the outcome of the interplay among these competing drivers (Figs. S38–S40), even though the dominant factors identified by machine learning differ across scenarios (Fig. 7). The spatial competing patterns, visually represented by the stippled regions, arise from the competition between surface fluxes and boundary-layer dynamics. On one hand, forest expansion increases leaf area index and surface roughness, thereby enhancing turbulent mixing and evapotranspiration (latent heat flux). This process tends to moisten the lower atmosphere and favor cloud formation, as supported by the increasing trend in total precipitable water induced by idealized afforestation (Fig. S32a). On the other hand, the large-scale replacement of grasslands or shrublands by forests inevitably causes a substantial reduction in surface albedo. The resulting increase in absorbed solar radiation is directly manifested as enhanced sensible heat flux (Fig. S32h). This strong sensible heating deepens the planetary boundary layer and promotes the entrainment of dry air from aloft (as indicated by the rising trend in boundary layer height), generating a strong cloud-suppressing effect. Specifically, in water-limited regions of the Northern Hemisphere mid-to-high latitudes, the modest increase in transpiration resulting from the conversion of grasslands/shrublands to forests is insufficient to offset the strong drying effect driven by sensible heat flux. Compared with the substantial decline in relative humidity, the increase in total precipitable water remains relatively small. This leads to intense spatial competition between near-surface relative humidity (RHREFHT) and maximum temperature at reference height (TREFHTMX), ultimately causing a sharp reduction in low-level clouds (Fig. S38d and e). In the subtropical regions under the BE50 scenario, due to the relatively low transpiration efficiency of bioenergy crops, the dynamic drying effect associated with the rise in planetary boundary layer height (PBLH) becomes the more dominant factor (Fig. S39e). In contrast, the more realistic REAL scenario is constrained by the discontinuous spatial distribution of afforestation patches. Local advective exchange within microclimates exerts a strong physical buffering effect, resulting in a markedly fragmented pattern of large-scale competition. This fragmentation helps mitigate the widespread cloud loss observed under the idealized scenarios (Fig. S40d–f).
These findings align with recent studies highlighting the regime-dependent nature of cloud responses to land-cover change. For example, Xu et al. (2022) and Leung et al. (2024) demonstrated that the sign and magnitude of forest effects on clouds vary substantially with background climate, soil moisture availability, and aerosol conditions. Our results reinforce the view that large-scale idealized afforestation does not produce universally positive cloud feedback; instead, the net cloud response is determined by the balance between competing local processes, which is particularly unfavorable for low-cloud maintenance in water-limited mid-to-high latitude regions.
The high-level cloud response requires a different interpretation from the boundary-layer mechanism identified for low clouds. Because CLDHGH is defined by cloud-top pressure above 400 hPa, it represents an aggregate high-cloud diagnostic rather than a specific cloud type. Changes in surface albedo and turbulent heat fluxes can alter boundary-layer buoyancy and may influence deep convection and vertical moisture transport, providing a potential pathway from land-surface forcing to the upper troposphere. At the same time, the simulated upper-tropospheric cooling and moistening (Fig. 11), together with the diagnosed large-scale atmospheric adjustment, indicate that the thermodynamic and dynamical environment in which high clouds form is also modified by LUCC. These pathways are not mutually exclusive: surface forcing can act as an upstream perturbation, while convective transport and large-scale atmospheric adjustment can mediate the subsequent upper-tropospheric response. However, because the present diagnostics do not distinguish cirrus from convective anvils or quantitatively isolate the contributions of these pathways, we do not attribute the CLDHGH increase to any single dominant mechanism. Instead, we interpret it as an integrated response to changes in the upper-tropospheric thermodynamic and dynamical environment.
Recent observational studies have increasingly highlighted that cloud responses can fundamentally alter the net biophysical climate forcing of land-use changes, though the direction of this feedback is highly regime-dependent. For example, recent quantifications of forest loss present contrasting cloud radiative adjustments: Luo et al. (2024b) demonstrated that global deforestation typically reduces cloud cover, thereby introducing a warming effect that partially offsets the cooling generated by increased surface albedo. Conversely, Dror and Feingold. (2026) observed that deforestation in the Amazon basin increases low-level cloudiness, which acts synergistically to roughly double the top-of-atmosphere cooling effect of surface brightening alone. Despite these regional divergences in deforestation impacts, both studies underscore a critical biophysical framework: the interplay between surface albedo and cloud albedo adjustments. Viewed through this framework, our findings for large-scale idealized afforestation reveal a compounding climate penalty. In our AF50 scenario, forest expansion (large-scale conversion of grasslands or shrublands into forests) substantially decreases surface albedo (a direct warming effect), while the concurrent loss of low-level clouds further diminishes shortwave cloud cooling. Consequently, rather than counteracting one another, these two biophysical responses act synergistically to strongly amplify regional climate warming hotspots, particularly in the water-limited boreal regions.
Our findings underscore that large-scale afforestation, despite being widely promoted as a primary climate mitigation strategy, does not universally guarantee a net cooling effect. The exact climatic outcome is not only contingent upon the background climate, but is also heavily governed by the specific pathways of land-cover types conversion. Particularly over the past few decades, there has been a proliferation of afforestation initiatives implemented in regions naturally occupied by grasslands or shrublands (Veldman et al., 2015a; Cao et al., 2011). Furthermore, efforts aimed at enhancing canopy density within existing forests are conceptually distinct from true afforestation; conflating these practices can severely distort objective assessments of the true climate mitigation efficiency of forest expansion. It is imperative to reiterate that the idealized afforestation scenario simulated in this study strictly aligns with the standard definition established by the FAO. Consequently, our modeling results offer a critical caveat: when large-scale land-cover conversion adheres rigidly to this foundational definition, the climate mitigation potential traditionally attributed to practical afforestation may be substantially overestimated. This implies that anchoring future climate stabilization strategies heavily upon widespread forest expansion pathways introduces profound risks and uncertainties (Arora and Montenegro, 2011; Veldman et al., 2015a; Weber et al., 2024).
Importantly, the climatic impacts of large-scale LUCC are not strictly confined to the regions where land-cover conversion occurs. Localized biophysical perturbations can instead cascade into far-reaching non-local climate teleconnections (Portmann et al., 2022; Hua et al., 2023). Several methods have been developed to disentangle local and non-local biophysical responses to LUCC (Zhao et al., 2026). In particular, checkerboard experiments can be applied to both land and atmospheric variables without variable-specific physical assumptions, and Chen et al. (2022) demonstrated their application to the separation of low-, middle-, and high-level cloud-fraction responses. Because the transient AF50, BE50, and REAL experiments in the present study were not designed for checkerboard separation and we do not apply another dedicated cloud-separation framework here, we do not quantitatively partition cloud-cover changes into local and non-local components. Therefore, the following temperature-advection and wave-activity-flux diagnostics are interpreted as evidence for remote dynamical modulation and teleconnection pathways rather than as a quantitative local or non-local decomposition of the cloud response. Our diagnostic analysis of horizontal temperature advection in the lower troposphere (850 hPa) demonstrates that, under idealized afforestation and bioenergy expansion scenarios, intense local sensible heating induced by reduced surface albedo generates anomalous wind fields that redistribute thermal energy to adjacent regions (Fig. S41). Specifically, in the idealized afforestation (AF50) scenario, pronounced positive anomalies in total temperature advection develop over the Northern Hemisphere mid- and high latitudes, effectively transporting excess surface heat from afforested areas to downwind non-afforested regions. This advective transport serves as a dynamical bridge, explaining why warming hotspots frequently extend spatially beyond the precise footprint of the land-use forcing. In contrast, realistic afforestation (REAL) mitigates excessive local sensible heat accumulation; the associated weakening of westerlies reduces warm advection toward Eurasia, thereby accounting for the regional cooling and limiting the extent of non-local warming.
These non-local teleconnections are further amplified through planetary-wave dynamics in the mid- to upper troposphere. The strong surface thermal anomalies triggered by large-scale idealized LUCC perturb the overlying atmosphere, acting as a deep heat source that excites quasi-stationary Rossby waves. Evaluation of the two-dimensional Plumb wave activity flux at 500 hPa reveals that planetary-wave energy emanating from these thermal perturbations exhibits pronounced horizontal propagation (Fig. S42). In the AF50 scenario, the wave activity flux patterns illustrate clear eastward and poleward energy propagation, which conveys additional energy into non-afforested regions across the Northern Hemisphere mid- and high latitudes. The wave-activity-flux patterns are consistent with a remote dynamical pathway through which atmospheric energy propagation can modify subsidence, static stability, and humidity in regions beyond the land-cover perturbation, thereby modulating cloud cover. In the AF50 scenario, the eastward and poleward propagation of wave activity coincides spatially with remote warming, atmospheric moisture deficits, and relative-humidity reductions in the Northern Hemisphere mid- and high latitudes. These relationships support the presence of non-local atmospheric adjustment, but the present diagnostics do not determine its quantitative contribution relative to local processes. Therefore, the pronounced mid- and low-level cloud loss under idealized afforestation is interpreted as being influenced by local thermodynamic and cloud-radiative processes together with non-local dynamical adjustment, without assigning dominance to either pathway. The planetary-scale wave response to idealized bioenergy expansion is comparatively weaker but similarly promotes non-local warming and modestly amplifies mid- and low-level cloud loss. In stark contrast, realistic afforestation strengthens northerly flows while weakening westerlies over Eurasia, suppressing regional warming and producing a net remote cooling effect (Figs. S41 and S42). This process improves the thermodynamic conditions required for cloud formation, consistent with the simulated increases in mid- and low-level cloud cover over the region (Fig. 2).
Due to the intrinsic uncertainties inherent in individual climate models, particularly concerning the simulation of cloud feedbacks (Ceppi et al., 2024), the evaluation of long-term impacts arising from external forcings such as land use and land cover change can often be robustly achieved through well-validated single-model simulations, as demonstrated in numerous prior studies (Snyder et al., 2004; Arora and Montenegro, 2011; Bauer et al., 2025). However, considering that CESM may be overly sensitive to aerosol-cloud interactions or thermal disturbances, the simulated cloud cover trend changes induced by LUCC may be an upper limit. While model ensembles or multi-model intercomparison frameworks have been employed to enhance confidence in conclusions (Falloon et al., 2014), they introduce limitations such as computational expense, potential overconfidence due to model dependence – where shared code, parameterizations, and biases among models undermine the assumption of independence (Knutti et al., 2010; Abramowitz et al., 2019), and challenges in combining projections from a small or unevenly distributed set of models (von Trentini et al., 2020). Despite this, we still recommend, where computational resources permit, the integration of models with different equilibrium climate sensitivity (ECS) characteristics to adequately distinguish between signal and model structure biases (Khan et al., 2025).
Cloud parameterization uncertainties in CESM warrant particular scrutiny because they directly modulate both the local biophysical pathways and the non-local dynamical teleconnections through which LUCC influences cloud cover. CESM employs the Community Atmosphere Model version 6 (CAM6), whose stratiform cloud microphysics is governed by the MG2 two-moment scheme (Morrison et al., 2020). This scheme prognoses mass and number concentrations for cloud liquid, ice, rain, and snow and incorporates an aerosol-aware heterogeneous ice nucleation parameterization (Fan et al., 2016). However, several aspects of this framework introduce substantial uncertainty. A documented issue with the cloud ice number limiter (nimax) in the default CESM configuration inadvertently suppressed ice production in mixed-phase clouds, altering global cloud phase partitioning and contributing to the model's high ECS (Gettelman et al., 2019; Zhu et al., 2022). Subsequent analyses have shown that ice nucleation processes influence cloud feedback across a wide range of tropospheric levels and latitudes, not only in extratropical low clouds, and that correcting or perturbing these processes can substantially modify shortwave cloud feedback (McGraw et al., 2023; Zhu et al., 2022). In addition, the representation of sub-grid cloud variability in warm rain formation relies on an enhancement factor for auto-conversion that is derived from the Cloud Layers Unified by Binormals (CLUBB) turbulence scheme. This factor has been shown to be substantially overestimated over much of the ocean, leading to excessive auto conversion rates, overly strong aerosol–cloud interaction sensitivity, and biases in liquid water path and cloud optical thickness (Wang et al., 2022). Perturbed-parameter ensemble experiments further demonstrate that simulated cloud properties, precipitation, and radiative effects in CAM6 are highly sensitive to individual microphysical parameters, including those controlling auto conversion and accretion rates, ice fall speed, and the ice-to-snow conversion threshold. These sensitivities are especially relevant for LUCC experiments because afforestation and bioenergy expansion modify surface sensible and latent heat fluxes, planetary boundary layer stability, and near-surface moisture – processes that interact intimately with both the macrophysical and microphysical components of the cloud scheme. Biases in low-cloud simulation or in the phase partitioning of mixed-phase clouds can therefore either amplify or dampen the simulated cloud loss and the downstream non-local Rossby wave responses.
Collectively, these parameterization uncertainties imply that the pronounced mid- and low-level cloud reduction and the resulting remote warming hotspots reported under idealized expansion scenarios should be interpreted cautiously as potentially lying at the upper end of the model-dependent range. To reduce these uncertainties, future work should prioritize targeted sensitivity experiments that systematically perturb key microphysical parameters (e.g., auto conversion thresholds, ice nucleation rates, and sub-grid variance formulations), employ higher horizontal resolution, or test alternative microphysics schemes (such as sectional or bin approaches). Improved observational constraints on cloud phase partitioning, liquid water path, and aerosol–cloud interactions over regions undergoing land-cover change will also be essential. In parallel, realistic assessments of future afforestation or bioenergy deployment require high-resolution, accurate land-cover datasets capable of reliably distinguishing forest from other vegetation types (Hoffmann et al., 2023). Generally, higher resolution means better performance in simulating cloud cover and key atmospheric dynamic processes (Kusunoki, 2026), leading to a more accurate understanding of the impacts of large-scale land-use change on cloud cover. In addition, dedicated checkerboard experiments or other validated separation frameworks could be employed in future studies to explicitly quantify the local and non-local components of LUCC-induced cloud responses (Chen et al., 2022; Zhao et al., 2026). Such experiments would complement the temperature-advection and wave-activity-flux diagnostics used here by providing a quantitative partitioning of cloud responses rather than only diagnosing the pathways of remote atmospheric adjustment. Taken together, our findings underscore that effective land-based climate mitigation strategies must extend beyond carbon sequestration targets alone. In addition to incorporating albedo-driven effects, as previous studies have emphasized (Wang et al., 2023), decision-making frameworks should also explicitly account for the potential climate risks arising from changes in cloud cover.
We use the current state-of-the-art fully coupled Community Earth System Model (CESM) to investigate the impact of two distinctly different future land use and cover changes (forest and bioenergy expansion) on long-term cloud cover trends. Simulation results show that future large-scale idealized forest and bioenergy expansions may exacerbate cloud-mediated regional climate warming, as they accelerate the loss of mid-low-level clouds while enhancing the increase of high-level clouds, thereby diminishing the overall climate-regulating benefits of cloud cover. Specifically, idealized afforestation leads to the fastest low-level cloud loss (1.14 times on global, 1.52 times on land), followed by bioenergy expansion (1.03 times on global and 1.23 times on land), whereas realistic afforestation mitigates such losses and generates positive climate effects by preserving or enhancing cloud cover. The loss of mid-low-level clouds amplifies the formation of regional warming hotspots through enhanced shortwave cloud radiative forcing trends, particularly in mid-to-high latitude regions of the Northern Hemisphere, where accelerated reductions in mid-low level cloud amounts align with amplified temperature trends (reaching up to 2.15 times the global average under idealized afforestation). The hemispheric asymmetry in cloud trends, quantified via Gini coefficients, further highlights how idealized forest and bioenergy expansions concentrate cloud loss trends within the latitudinal bands of those expansions, thereby potentially reshaping new climate warming hotspots. An interpretable machine-learning framework further identifies total precipitable water and relative humidity as influential predictors of the simulated cloud trends. Their high SHAP importance, together with the independent thermodynamic and boundary-layer diagnostics, is consistent with an important role of atmospheric moisture availability in the accelerated loss of mid- and low-level clouds under idealized forest and bioenergy expansion, which is also modulated by non-local factors. These results underscore that not all forest expansions yield climate cooling benefits; outcomes critically depend on the type of land conversion and the specific regions of implementation. This also highlights an important realization: even within bioenergy crops, the choice of crop function type is just as crucial as the choice of afforestation site. Therefore, policymakers should prioritize realistic afforestation strategies in suitable latitudinal zones to maximize carbon sequestration while avoiding unintended cloud-mediated warming.
All CESM simulation results and associated procedures are available on request from the authors. ERA5 data are available for download through the Copernicus Climate Service (https://cds.climate.copernicus.eu/datasets, last access: 1 September 2026) (Muñoz-Sabater et al., 2021). The Global Precipitation Climatology Project (GPCP) and CPC Merged Analysis of Precipitation (CMAP) datasets can be downloaded from https://www.psl.noaa.gov/data/gridded/data.gpcp.html (last access: 1 September 2026) and https://psl.noaa.gov/data/gridded/data.cmap.html (last access: 1 September 2026) (Adler et al., 2018; Huffman et al., 2023). National Centers for Environmental Prediction (NCEP) temperature is available from https://psl.noaa.gov/ (last access: 1 September 2026) (Kalnay et al., 1996). The Land-Use Harmonization 2 (LUH2) can be downloaded from https://svn-ccsm-inputdata.cgd.ucar.edu/trunk/inputdata/ (last access: 1 September 2026) (Hurtt et al., 2020).
The supplement related to this article is available online at https://doi.org/10.5194/acp-26-14133-2026-supplement.
Nanjian Liu: Conceptualization, Methodology, Software, Formal analysis, Data curation, Visualization, Writing – original draft, Writing – review and editing. Zhixin Hao: Conceptualization, Methodology, Funding acquisition, Supervision, Project administration, Writing – review and editing. Siyou Xia: Writing – review and editing, Language polishing. Peng Zhao: Software, Visualization, Writing – review and editing.
The contact author has declared that none of the authors has any competing interests.
Publisher's note: Copernicus Publications remains neutral with regard to jurisdictional claims made in the text, published maps, institutional affiliations, or any other geographical representation in this paper. The authors bear the ultimate responsibility for providing appropriate place names. Views expressed in the text are those of the authors and do not necessarily reflect the views of the publisher.
We thank the National Natural Science Foundation of China program for providing support and resources (grant no. 42171030). We acknowledge the dendrochronology and paleoenvironmental analysis laboratory of the Institute of Geographic Sciences and Natural Resources Research, Chinese Academy of Sciences, for the computational support from its high-performance computing platform.
This research has been supported by the National Natural Science Foundation of China (grant no. 42171030).
This paper was edited by Kostas Tsigaridis and reviewed by three anonymous referees.
Abraha, M., Chen, J., Hamilton, S. K., Sciusco, P., Lei, C., Shirkey, G., Yuan, J., and Robertson, G. P.: Albedo-induced global warming impact of Conservation Reserve Program grasslands converted to annual and perennial bioenergy crops, Environ. Res. Lett., 16, 084059, https://doi.org/10.1088/1748-9326/ac1815, 2021.
Abramowitz, G., Herger, N., Gutmann, E., Hammerling, D., Knutti, R., Leduc, M., Lorenz, R., Pincus, R., and Schmidt, G. A.: ESD Reviews: Model dependence in multi-model climate ensembles: weighting, sub-selection and out-of-sample testing, Earth Syst. Dynam., 10, 91–105, https://doi.org/10.5194/esd-10-91-2019, 2019.
Adler, R. F., Sapiano, M. R. P., Huffman, G. J., Wang, J. J., Gu, G., Bolvin, D., Chiu, L., Schneider, U., Becker, A., Nelkin, E., Xie, P., Ferraro, R., and Shin, D. B.: The Global Precipitation Climatology Project (GPCP) monthly analysis (new version 2.3) and a review of 2017 global precipitation, Atmosphere, 9, 138, https://doi.org/10.3390/atmos9040138, 2018.
Albrecht, B. A.: Aerosols, Cloud Microphysics and Fractional Cloudiness, Science, 245, 1227–1230, https://doi.org/10.1126/science.245.4923.1227, 1989.
Alkama, R. and Cescatti, A.: Biophysical climate impacts of recent changes in global forest cover, Science, 351, 600–604, https://doi.org/10.1126/science.aac8083, 2016.
Arora, V. K. and Montenegro, A.: Small temperature benefits provided by realistic afforestation efforts, Nat. Geosci., 4, 514–518, https://doi.org/10.1038/ngeo1182, 2011.
Atkinson, A. B.: On the measurement of inequality, J. Econ. Theory, 2, 244–263, https://doi.org/10.1016/0022-0531(70)90039-6, 1970.
Bala, G., Caldeira, K., Wickett, M., Phillips, T. J., Lobell, D. B., Delire, C., and Mirin, A.: Combined climate and carbon-cycle effects of large-scale deforestation, P. Natl. Acad. Sci. USA, 104, 6550–6555, https://doi.org/10.1073/pnas.0608998104, 2007.
Bastin, J.-F., Finegold, Y., Garcia, C., Mollicone, D., Rezende, M., Routh, D., Zohner, C. M., and Crowther, T. W.: The global tree restoration potential, Science, 365, 76–79, https://doi.org/10.1126/science.aax0848, 2019.
Bauer, V. M., Schemm, S., Portmann, R., Zhang, J., Eirund, G. K., De Hertog, S. J., and Zibell, J.: Impacts of North American forest cover changes on the North Atlantic Ocean circulation, Earth Syst. Dynam., 16, 379–409, https://doi.org/10.5194/esd-16-379-2025, 2025.
Berdugo, M., Gaitán, J. J., Delgado-Baquerizo, M., Crowther, T. W., and Dakos, V.: Prevalence and drivers of abrupt vegetation shifts in global drylands, P. Natl. Acad. Sci. USA, 119, e2123393119, https://doi.org/10.1073/pnas.2123393119, 2022.
Boehm, C. L. and Thompson, D. W. J.: The key role of cloud–climate coupling in extratropical sea surface temperature variability, J. Climate, 36, 2753–2762, https://doi.org/10.1175/JCLI-D-22-0362.1, 2023.
Bonan, G. B.: Forests and climate change: Forcings, feedbacks, and the climate benefits of forests, Science, 320, 1444–1449, https://doi.org/10.1126/science.1155121, 2008.
Bony, S., Stevens, B., Coppin, D., Becker, T., Reed, K. A., Voigt, A., and Medeiros, B.: Thermodynamic Control of Anvil Cloud Amount, P. Natl. Acad. Sci. USA, 113, 8927–8932, https://doi.org/10.1073/pnas.1601472113, 2016.
Boucher, O., Randall, D., Artaxo, P., Bretherton, C., Feingold, G., Forster, P., Kerminen, V.-M., Kondo, Y., Liao, H., Lohmann, U., Rasch, P., Satheesh, S. K., Sherwood, S., Stevens, B., and Zhang, X. Y.: Clouds and aerosols, in: Climate Change 2013: The Physical Science Basis, edited by: Stocker, T. F., Qin, D., Plattner, G.-K., Tignor, M., Allen, S. K., Boschung, J., Nauels, A., Xia, Y., Bex, V., and Midgley, P. M., Cambridge University Press, Cambridge, UK and New York, NY, USA, 571–657, https://doi.org/10.1017/CBO9781107415324.016, 2013.
Breil, M., Davin, E. L., and Rechid, D.: What determines the sign of the evapotranspiration response to afforestation in European summer?, Biogeosciences, 18, 1499–1510, https://doi.org/10.5194/bg-18-1499-2021, 2021.
Breil, M., Schneider, V. K. M., and Pinto, J. G.: The effect of forest cover changes on the regional climate conditions in Europe during the period 1986–2015, Biogeosciences, 21, 811–824, https://doi.org/10.5194/bg-21-811-2024, 2024.
Bretherton, C. S. and Hartmann, D. L.: Large-scale controls on cloudiness, in: Clouds in the Perturbed Climate System: Their Relationship to Energy Balance, Atmospheric Dynamics, and Precipitation, edited by: Heintzenberg, J. and Charlson, R. J., MIT Press, Cambridge, MA, USA, 217–250, https://doi.org/10.7551/mitpress/9780262012874.003.0010, 2009.
Bright, R. M., Davin, E., O'Halloran, T., Pongratz, J., Zhao, K., and Cescatti, A.: Local temperature response to land cover and management change driven by non-radiative processes, Nat. Clim. Change, 7, 296–302, https://doi.org/10.1038/nclimate3250, 2017.
Cao, S.: Why large-scale afforestation efforts in China have failed to solve the desertification problem, Environ. Sci. Technol., 42, 1826–1831, https://doi.org/10.1021/es0870597, 2008.
Cao, S., Chen, L., Shankman, D., Wang, C., Wang, X., and Zhang, H.: Excessive reliance on afforestation in China's arid and semi-arid regions: Lessons in ecological restoration, Earth-Sci. Rev., 104, 240–245, https://doi.org/10.1016/j.earscirev.2010.11.002, 2011.
Ceppi, P. and Nowack, P.: Observational evidence that cloud feedback amplifies global warming, P. Natl. Acad. Sci. USA, 118, e2026290118, https://doi.org/10.1073/pnas.2026290118, 2021.
Ceppi, P., Myers, T. A., Nowack, P., Wall, C. J., and Zelinka, M. D.: Implications of a pervasive climate model bias for low-cloud feedback, Geophys. Res. Lett., 51, e2024GL110525, https://doi.org/10.1029/2024GL110525, 2024.
Cerasoli, S., Yin, J., and Porporato, A.: Cloud cooling effects of afforestation and reforestation at midlatitudes, P. Natl. Acad. Sci. USA, 118, e2026241118, https://doi.org/10.1073/pnas.2026241118, 2021.
Chambers, J. Q. and Artaxo, P.: Biosphere–atmosphere interactions: Deforestation size influences rainfall, Nat. Clim. Change, 7, 175–176, https://doi.org/10.1038/nclimate3238, 2017.
Chen, C., Wang, L., Myneni, R. B., and Li, D.: Attribution of Land-Use/Land-Cover Change Induced Surface Temperature Anomaly: How Accurate Is the First-Order Taylor Series Expansion?, J. Geophys. Res.-Biogeo., 125, e2020JG005787, https://doi.org/10.1029/2020JG005787, 2020.
Chen, C., Ge, J., Guo, W., Cao, Y., Liu, Y., Luo, X., and Yang, L.: The Biophysical Impacts of Idealized Afforestation on Surface Temperature in China: Local and Nonlocal Effects, J. Climate, 35, 7833–7852, https://doi.org/10.1175/JCLI-D-22-0144.1, 2022.
Chen, T. and Guestrin, C.: XGBoost: A scalable tree boosting system, in: Proceedings of the 22nd ACM SIGKDD International Conference on Knowledge Discovery and Data Mining, San Francisco, CA, USA, 785–794, https://doi.org/10.1145/2939672.2939785, 2016.
Chen, T., Rossow, W. B., and Zhang, Y.: Radiative Effects of Cloud-Type Variations, J. Climate, 13, 264–286, https://doi.org/10.1175/1520-0442(2000)013<0264:REOCTV>2.0.CO;2, 2000.
Cheng, Y., Huang, M., Lawrence, D. M., Calvin, K., Lombardozzi, D. L., Sinha, E., Pan, M., and He, X.: Future bioenergy expansion could alter carbon sequestration potential and exacerbate water stress in the United States, Sci. Adv., 8, eabm8237, https://doi.org/10.1126/sciadv.abm8237, 2022.
Cheng, Y., Lawrence, D. M., Pan, M., Zhang, B., Graham, N. T., Lawrence, P. J., Liu, Z., and He, X.: A bioenergy-focused versus a reforestation-focused mitigation pathway yields disparate carbon storage and climate responses, P. Natl. Acad. Sci. USA, 121, e2306775121, https://doi.org/10.1073/pnas.2306775121, 2024.
Cleveland, W. S.: Robust Locally Weighted Regression and Smoothing Scatterplots, J. Am. Stat. Assoc., 74, 829–836, https://doi.org/10.1080/01621459.1979.10481038, 1979.
Danabasoglu, G., Lamarque, J. F., Bacmeister, J., Bailey, D. A., DuVivier, A. K., Edwards, J., Emmons, L. K., Fasullo, J., Garcia, R., Gettelman, A., Hannay, C., Holland, M. M., Large, W. G., Lauritzen, P. H., Lawrence, D. M., Lenaerts, J. T. M., Lindsay, K., Lipscomb, W. H., Mills, M. J., Neale, R., Oleson, K. W., Otto-Bliesner, B., Phillips, A. S., Sacks, W., Tilmes, S., van Kampenhout, L., Vertenstein, M., Bertini, A., Dennis, J., Deser, C., Fischer, C., Fox-Kemper, B., Kay, J. E., Kinnison, D., Kushner, P. J., Larson, V. E., Long, M. C., Mickelson, S., Moore, J. K., Nienhouse, E., Polvani, L., Rasch, P. J., and Strand, W. G.: The Community Earth System Model Version 2 (CESM2), J. Adv. Model. Earth Sy., 12, e2019MS001916, https://doi.org/10.1029/2019MS001916, 2020.
Davin, E. L., de Noblet-Ducoudré, N.: Climatic impact of global-scale deforestation: radiative versus non-radiative processes, J. Climate, 23, 97–112, https://doi.org/10.1175/2009JCLI3102.1, 2010.
Devaraju, N., de Noblet-Ducoudré, N., Quesada, B., and Bala, G.: Quantifying the relative importance of direct and indirect biophysical effects of deforestation on surface temperature and teleconnections, J. Climate, 31, 3811–3829, https://doi.org/10.1175/JCLI-D-17-0563.1, 2018.
Di Vittorio, A. V., Mao, J., Shi, X., Chini, L., Hurtt, G., and Collins, W. D.: Quantifying the Effects of Historical Land Cover Conversion Uncertainty on Global Carbon and Climate Estimates, Geophys. Res. Lett., 45, 974–982, https://doi.org/10.1002/2017GL075124, 2018.
Dickinson, R. E.: Land surface processes and climate–surface albedos and energy balance, Adv. Geophys., 25, 305–353, https://doi.org/10.1016/S0065-2687(08)60176-4, 1983.
Dickinson, R. E. and Henderson-Sellers, A.: Modelling tropical deforestation: A study of GCM land-surface parametrizations, Q. J. Roy. Meteor. Soc., 114, 439–462, https://doi.org/10.1002/qj.49711448009, 1988.
Dixon, A. P., Faber-Langendoen, D., Josse, C., Morrison, J., and Loucks, C. J.: Distribution mapping of world grassland types, J. Biogeogr., 41, 2003–2019, https://doi.org/10.1111/jbi.12381, 2014.
Dror, T. and Feingold, G.: Amazon forest loss: An all-sky biophysical top-of-atmosphere cooling feedback, Science, 392, 429–432, https://doi.org/10.1126/science.adz8296, 2026.
Duveiller, G., Hooker, J., and Cescatti, A.: The mark of vegetation change on Earth's surface energy balance, Nat. Commun., 9, 679, https://doi.org/10.1038/s41467-017-02810-8, 2018.
Duveiller, G., Filipponi, F., Ceglar, A., Bojanowski, J., Alkama, R., and Cescatti, A.: Revealing the widespread potential of forests to increase low level cloud cover, Nat. Commun., 12, 4337, https://doi.org/10.1038/s41467-021-24551-5, 2021.
Ek, M. and Holtslag, A. A. M.: Influence of soil moisture on boundary layer cloud development, J. Hydrometeorol., 5, 86–99, https://doi.org/10.1175/1525-7541(2004)005<0086:IOSMOB>2.0.CO;2, 2004.
Eyring, V., Bony, S., Meehl, G. A., Senior, C. A., Stevens, B., Stouffer, R. J., and Taylor, K. E.: Overview of the Coupled Model Intercomparison Project Phase 6 (CMIP6) experimental design and organization, Geosci. Model Dev., 9, 1937–1958, https://doi.org/10.5194/gmd-9-1937-2016, 2016.
Falloon, P., Challinor, A., Dessai, S., Hoang, L., Johnson, J., and Koehler, A.-K.: Ensembles and uncertainty in climate change impacts, Front. Environ. Sci., 2, 33, https://doi.org/10.3389/fenvs.2014.00033, 2014.
Fan, J., Wang, Y., Rosenfeld, D., and Liu, X.: Review of aerosol–cloud interactions: Mechanisms, significance, and challenges, J. Atmos. Sci., 73, 4221–4252, https://doi.org/10.1175/JAS-D-16-0037.1, 2016.
FAO: Forest Resources Assessment 2015: Terms and Definitions, FAO Rep, 36, FAO, 2012.
Fasullo, J. T.: Evaluating simulated climate patterns from the CMIP archives using satellite and reanalysis datasets using the Climate Model Assessment Tool (CMATv1), Geosci. Model Dev., 13, 3627–3642, https://doi.org/10.5194/gmd-13-3627-2020, 2020.
Feddema, J. J., Oleson, K. W., Bonan, G. B., Mearns, L. O., Buja, L. E., Meehl, G. A., and Washington, W. M.: The Importance of Land-Cover Change in Simulating Future Climates, Science, 310, 1674–1678, https://doi.org/10.1126/science.1118160, 2005.
Flora, M. L., Potvin, C. K., McGovern, A., and Handler, S.: A Machine Learning Explainability Tutorial for Atmospheric Sciences, Artif. Intell. Earth Syst., 3, e230018, https://doi.org/10.1175/AIES-D-23-0018.1, 2024.
Foley, J., Defries, R., Asner, G., Barford, C., Bonan, G., Carpenter, S., Chapin, F., Coe, M., Daily, G., Gibbs, H., Helkowski, J., Holloway, T., Howard, E., Kucharik, C., Monfreda, C., Patz, A., Prentice, I., Ramankutty, N., and Snyder, P.: Global consequences of land use, Science, 309, 570–574, https://doi.org/10.1126/science.1111772, 2005.
Foley, J. A., Kutzbach, J. E., Coe, M. T., and Levis, S.: Feedbacks between climate and boreal forests during the Holocene epoch, Nature, 371, 52–54, https://doi.org/10.1038/371052a0, 1994.
Georgescu, M., Lobell, D. B., and Field, C. B.: Direct climate effects of perennial bioenergy crops in the United States, P. Natl. Acad. Sci. USA, 108, 4307–4312, https://doi.org/10.1073/pnas.1008779108, 2011.
Gettelman, A. and Morrison, H.: Advanced two-moment bulk microphysics for global models. Part I: Off-line tests and comparison with other schemes, J. Climate, 28, 1268–1287, https://doi.org/10.1175/JCLI-D-14-00102.1, 2015.
Gettelman, A., Hannay, C., Bacmeister, J. T., Neale, R. B., Pendergrass, A. G., Danabasoglu, G., Lamarque, J.-F., Fasullo, J. T., Bailey, D. A., Lawrence, D. M., and Mills, M. J.: High climate sensitivity in the Community Earth System Model Version 2 (CESM2), Geophys. Res. Lett., 46, 8329–8337, https://doi.org/10.1029/2019GL083978, 2019.
Goessling, H. F., Rackow, T., and Jung, T.: Recent global temperature surge intensified by record-low planetary albedo, Science, 387, 68–73, https://doi.org/10.1126/science.adq7280, 2025.
Goldblatt, C., McDonald, V. L., and McCusker, K. E.: Earth's long-term climate stabilized by clouds, Nat. Geosci., 14, 143–150, https://doi.org/10.1038/s41561-021-00691-7, 2021.
Goldewijk, K. K. and Ramankutty, N.: Land cover change over the last three centuries due to human activities: The availability of new global data sets, GeoJournal, 61, 335–344, https://doi.org/10.1007/s10708-004-5050-z, 2004.
Hallgren, W., Schlosser, C. A., Monier, E., Kicklighter, D., Sokolov, A., and Melillo, J.: Climate impacts of a large-scale biofuels expansion, Geophys. Res. Lett., 40, 1624–1630, https://doi.org/10.1002/grl.50352, 2013.
Harada, Y. and Nakagawa, M.: Extraordinary features of the planetary wave propagation during the boreal winter 2013/2014 and the zonal wave number two predominance, J. Geophys. Res.-Atmos., 122, 11374–11387, https://doi.org/10.1002/2017JD027053, 2017.
Hartmann, D. L., Ockert-Bell, M. E., and Michelsen, M. L.: The Effect of Cloud Type on Earth's Energy Balance: Global Analysis, J. Climate, 5, 1281–1304, https://doi.org/10.1175/1520-0442(1992)005<1281:TEOCTO>2.0.CO;2, 1992.
Hoffmann, P., Reinhart, V., Rechid, D., de Noblet-Ducoudré, N., Davin, E. L., Asmus, C., Bechtel, B., Böhner, J., Katragkou, E., and Luyssaert, S.: High-resolution land use and land cover dataset for regional climate modelling: historical and future changes in Europe, Earth Syst. Sci. Data, 15, 3819–3852, https://doi.org/10.5194/essd-15-3819-2023, 2023.
Hong, C., Burney, J. A., Pongratz, J., Nabel, J. E. M. S., Mueller, N. D., Jackson, R. B., and Davis, S. J.: Global and regional drivers of land-use emissions in 1961–2017, Nature, 589, 554–561, https://doi.org/10.1038/s41586-020-03138-y, 2021.
Houghton, R. A.: The annual net flux of carbon to the atmosphere from changes in land use 1850–1990, Tellus B. 51, 298–313, https://doi.org/10.3402/tellusb.v51i2.16288, 1999.
Hua, W., Zhou, L., Dai, A., Chen, H., and Liu, Y.: Important non-local effects of deforestation on cloud cover changes in CMIP6 models, Environ. Res. Lett., 18, 094047, https://doi.org/10.1088/1748-9326/acf232, 2023.
Huang, C. S. Y. and Nakamura, N.: Local finite-amplitude wave activity as a diagnostic of anomalous weather events, J. Atmos. Sci., 73, 211–229, https://doi.org/10.1175/JAS-D-15-0194.1, 2016.
Huffman, G. J., Adler, R. F., Behrangi, A., Bolvin, D. T., Nelkin, E. J., Gu, G., and Ehsani, M. R.: The New Version 3.2 Global Precipitation Climatology Project (GPCP) Monthly and Daily Precipitation Products, J. Climate, 36, 7635–7655, https://doi.org/10.1175/JCLI-D-23-0123.1, 2023.
Hurtt, G. C., Chini, L., Sahajpal, R., Frolking, S., Bodirsky, B. L., Calvin, K., Doelman, J. C., Fisk, J., Fujimori, S., Klein Goldewijk, K., Hasegawa, T., Havlik, P., Heinimann, A., Humpenöder, F., Jungclaus, J., Kaplan, J. O., Kennedy, J., Krisztin, T., Lawrence, D., Lawrence, P., Ma, L., Mertz, O., Pongratz, J., Popp, A., Poulter, B., Riahi, K., Shevliakova, E., Stehfest, E., Thornton, P., Tubiello, F. N., van Vuuren, D. P., and Zhang, X.: Harmonization of global land use change and management for the period 850–2100 (LUH2) for CMIP6, Geosci. Model Dev., 13, 5425–5464, https://doi.org/10.5194/gmd-13-5425-2020, 2020.
Kalnay, E., Kanamitsu, M., Kistler, R., Collins, W., Deaven, D., Gandin, L., Iredell, M., Saha, S., White, G., Woollen, J., Zhu, Y., Chelliah, M., Ebisuzaki, W., Higgins, W., Janowiak, J., Mo, K. C., Ropelewski, C., Wang, J., Leetmaa, A., Reynolds, R., Jenne, R., and Joseph, D.: The NCEP/NCAR 40-Year Reanalysis Project, B. Am. Meteorol. Soc., 77, 437–471, https://doi.org/10.1175/1520-0477(1996)077<0437:TNYRP>2.0.CO;2, 1996.
Kan, F., Xu, H., Tang, S., Peñuelas, J., Lian, X., Roebroek, C. T. J., Anniwaer, N., Wang, K., and Piao, S.: Diminished biophysical cooling benefits of global forestation under rising atmospheric CO2, Nat. Commun., 16, 4410, https://doi.org/10.1038/s41467-025-59547-y, 2025.
Karl, T. R., Jones, P. D., Knight, R. W., Kukla, G., Plummer, N., Razuvayev, V., Gallo, K. P., Lindseay, J., Charlson, R. J., and Peterson, T. C.: A new perspective on recent global warming: Asymmetric trends of daily maximum and minimum temperature, B. Am. Meteorol. Soc., 74, 1007–1024, https://doi.org/10.1175/1520-0477(1993)074<1007:ANPORG>2.0.CO;2, 1993.
Khan, N., Nasara, M. A., Sa'adi, Z., Awhari, D. P., Asiri, M. I., Shahid, S., and Yaseen, Z. M.: Global climate models performance: A comprehensive review of applied approaches, recognized issues and possible future directions, Atmos. Res., 326, 108300, https://doi.org/10.1016/j.atmosres.2025.108300, 2025.
Khanna, J., Medvigy, D., Fueglistaler, S., and Walko, R.: Regional dry-season climate changes due to three decades of Amazonian deforestation, Nat. Clim. Change, 7, 200–204, https://doi.org/10.1038/nclimate3226, 2017.
Kiehl, J. T.: Twentieth century climate model response and climate sensitivity, Geophys. Res. Lett., 34, L22710, https://doi.org/10.1029/2007GL031383, 2007.
King, J. A., Weber, J., Lawrence, P., Roe, S., Swann, A. L. S., and Val Martin, M.: Global and regional hydrological impacts of global forest expansion, Biogeosciences, 21, 3883–3902, https://doi.org/10.5194/bg-21-3883-2024, 2024.
Klein, S. A., Hall, A., Norris, J. R., and Pincus, R.: Low-Cloud Feedbacks from Cloud-Controlling Factors: A Review, Surv. Geophys., 38, 1307–1329, https://doi.org/10.1007/s10712-017-9433-3, 2017.
Knutti, R., Furrer, R., Tebaldi, C., Cermak, J., and Meehl, G. A.: Challenges in combining projections from multiple climate models, J. Climate, 23, 2739–2758, https://doi.org/10.1175/2009JCLI3361.1, 2010.
Kusunoki, S.: Do Higher Horizontal Resolution Models Perform Better?, Adv. Atmos. Sci., 43, 259–262, https://doi.org/10.1007/s00376-025-5504-4, 2026.
Kutta, E. and Hubbart, J. A.: Seasonal Lifting Condensation Level Trends: Implications of Warming and Reforestation in Appalachia's Deciduous Forest, Atmosphere, 14, 98, https://doi.org/10.3390/atmos14010098, 2023.
L'Ecuyer, T. S., Hang, Y., Matus, A. V., and Wang, Z.: Reassessing the Effect of Cloud Type on Earth's Energy Balance in the Age of Active Spaceborne Observations. Part I: Top of Atmosphere and Surface, J. Climate, 32, 6197–6217, https://doi.org/10.1175/JCLI-D-18-0753.1, 2019.
Laguë, M. M. and Swann, A. L. S.: Progressive Midlatitude Afforestation: Impacts on Clouds, Global Energy Transport, and Precipitation, J. Climate, 29, https://doi.org/10.1175/JCLI-D-15-0748.1, 5561–5573, 2016.
Larson, V. E.: CLUBB-SILHS: A parameterization of subgrid variability in the atmosphere, arXiv, https://doi.org/10.48550/arXiv.1711.03675, 2017.
Lawrence, D. M., Hurtt, G. C., Arneth, A., Brovkin, V., Calvin, K. V., Jones, A. D., Jones, C. D., Lawrence, P. J., de Noblet-Ducoudré, N., Pongratz, J., Seneviratne, S. I., and Shevliakova, E.: The Land Use Model Intercomparison Project (LUMIP) contribution to CMIP6: rationale and experimental design, Geosci. Model Dev., 9, 2973–2998, https://doi.org/10.5194/gmd-9-2973-2016, 2016.
Lawrence, D. M., Fisher, R. A., Koven, C. D., Oleson, K. W., Swenson, S. C., Bonan, G., Collier, N., Ghimire, B., van Kampenhout, L., Kennedy, D., Kluzek, E., Lawrence, P. J., Li, F., Li, H., Lombardozzi, D., Riley, W. J., Sacks, W. J., Shi, M., Vertenstein, M., Wieder, W. R., Xu, C., Ali, A. A., Badger, A. M., Bisht, G., van den Broeke, M., Brunke, M. A., Burns, S. P., Buzan, J., Clark, M., Craig, A., Dahlin, K., Drewniak, B., Fisher, J. B., Flanner, M., Fox, A. M., Gentine, P., Hoffman, F., Keppel-Aleks, G., Knox, R., Kumar, S., Lenaerts, J., Leung, L. R., Lipscomb, W. H., Lu, Y., Pandey, A., Pelletier, J. D., Perket, J., Randerson, J. T., Ricciuto, D. M., Sanderson, B. M., Slater, A., Subin, Z. M., Tang, J., Thomas, R. Q., Val Martin, M., and Zeng, X.: The Community Land Model Version 5: Description of New Features, Benchmarking, and Impact of Forcing Uncertainty, J. Adv. Model. Earth Sy., 11, 4245–4287, https://doi.org/10.1029/2018MS001583, 2019.
Le, P. V. V., Kumar, P., and Drewry, D. T.: Implications for the hydrologic cycle under climate change due to the expansion of bioenergy crops in the Midwestern United States, P. Natl. Acad. Sci. USA, 108, 15085–15090, https://doi.org/10.1073/pnas.1107177108, 2011.
Lee, X., Goulden, M. L., Hollinger, D. Y., Barr, A., Black, T. A., Bohrer, G., Bracho, R., Drake, B., Goldstein, A., Gu, L., Katul, G., Kolb, T., Law, B. E., Margolis, H., Meyers, T., Monson, R., Munger, W., Oren, R., Paw U, K. T., Richardson, A. D., Schmid, H. P., Staebler, R., Wofsy, S., and Zhao, L.: Observed increase in local cooling effect of deforestation at higher latitudes, Nature, 479, 384–387, https://doi.org/10.1038/nature10588, 2011.
Lei, C., Chen, J., and Robertson, G. P.: Climate cooling benefits of cellulosic bioenergy crops from elevated albedo, GCB Bioenergy, 15, 1373–1386, https://doi.org/10.1111/gcbb.13098, 2023.
Lesk, C. S. and Mankin, J. S.: More concentrated precipitation decreases terrestrial water storage, Nature, 653, 425–432, https://doi.org/10.1038/s41586-026-10487-7, 2026.
Leung, G. R., Grant, L. D., and van den Heever, S. C.: Deforestation-Driven Increases in Shallow Clouds Are Greatest in Drier, Low-Aerosol Regions of Southeast Asia, Geophys. Res. Lett., 51, e2023GL107678, https://doi.org/10.1029/2023GL107678, 2024.
Li, F., Lawrence, D. M., and Bond-Lamberty, B.: Impact of fire on global land surface air temperature and energy budget for the 20th century due to changes within ecosystems, Environ. Res. Lett., 12, 044014, https://doi.org/10.1088/1748-9326/aa6685, 2017.
Li, X. Q., Li, Q. X., Wild, M., and Jones, P.: An intensification of surface Earth's energy imbalance since the late 20th century, Commun. Earth Environ., 5, 644, https://doi.org/10.1038/s43247-024-01802-z, 2024.
Li, Y., Piao, S., Li, L. Z. X., Chen, A., Wang, X., Ciais, P., Huang, L., Lian, X., Peng, S., Zeng, Z., Wang, K., and Zhou, L.: Divergent hydrological response to large-scale afforestation and vegetation greening in China, Sci. Adv., 4, eaar4182, https://doi.org/10.1126/sciadv.aar4182, 2018.
Li, Y., Huang, B., Tan, C., Zhang, X., Cherubini, F., and Rust, H. W.: Investigating the global and regional response of drought to idealized deforestation using multiple global climate models, Hydrol. Earth Syst. Sci., 29, 1637–1658, https://doi.org/10.5194/hess-29-1637-2025, 2025.
Li, Z., Ciais, P., Wright, J. S., Wang, Y., Liu, S., Wang, J., Li, L. Z. X., Lu, H., Huang, X., Zhu, L., Goll, D. S., and Li, W.: Increased precipitation over land due to climate feedback of large-scale bioenergy cultivation, Nat. Commun., 14, 4096, https://doi.org/10.1038/s41467-023-39803-9, 2023.
Lian, X., Jeong, S., Park, C.-E., Xu, H., Li, L. Z. X., Wang, T., Gentine, P., Peñuelas, J., and Piao, S.: Biophysical impacts of northern vegetation changes on seasonal warming patterns, Nat. Commun., 13, 3925, https://doi.org/10.1038/s41467-022-31671-z, 2022.
Liang, S., Ziegler, A. D., Reich, P. B., Zhu, K., Wang, D., Jiang, X., Chen, D., and Ciais, P.: Climate mitigation potential for targeted forestation after considering climate change, fires, and albedo, Sci. Adv., 11, eadn7915, https://doi.org/10.1126/sciadv.adn7915, 2025.
Lin, S.-J. and Rood, R. B.: An explicit flux-form semi-Lagrangian shallow-water model on the sphere, Q. J. Roy. Meteor. Soc., 123, 2477–2498, https://doi.org/10.1002/qj.49712354416, 1997.
Liou, K. N. and Ou, S. C.: Theory of equilibrium temperatures in radiative-turbulent atmospheres, J. Atmos. Sci., 40, 214–229, https://doi.org/10.1175/1520-0469(1983)040<0214:TOETIR>2.0.CO;2, 1983.
Liu, H., Koren, I., Altaratz, O., and Chekroun, M. D.: Opposing trends of cloud coverage over land and ocean under global warming, Atmos. Chem. Phys., 23, 6559–6569, https://doi.org/10.5194/acp-23-6559-2023, 2023.
Liu, L., Huang, Y., and Gyakum, J. R.: Clouds reduce downwelling longwave radiation over land in a warming climate, Nature, 637, 868–874, https://doi.org/10.1038/s41586-024-08323-x, 2025.
Loeb, N. G., Ham, S. H., Allan, R. P., Thorsen, T. J., Meyssignac, B., Kato, S., Johnson, G. C., and Lyman, J. M.: Observational Assessment of Changes in Earth's Energy Imbalance Since 2000, Surv. Geophys., 45, 1757–1783, https://doi.org/10.1007/s10712-024-09838-8, 2024.
Lombardozzi, D. L., Lu, Y., Lawrence, P. J., Lawrence, D. M., Swenson, S., Oleson, K. W., Wieder, W. R., and Ainsworth, E. A.: Simulating Agriculture in the Community Land Model Version 5, J. Geophys. Res.-Biogeo., 125, e2019JG005529, https://doi.org/10.1029/2019JG005529, 2020.
Lundberg, S. M. and Lee, S.-I.: A unified approach to interpreting model predictions, in: Advances in Neural Information Processing Systems 30 (NIPS 2017), 4768–4777, https://doi.org/10.48550/arXiv.1705.07874, 2017.
Lundberg, S. M., Erion, G., Chen, H., DeGrave, A., Prutkin, J. M., Nair, B., Katz, R., Himmelfarb, J., Bansal, N., and -I. Lee, S.: From local explanations to global understanding with explainable AI for trees, Nat. Mach. Intell., 2, 56–67, https://doi.org/10.1038/s42256-019-0138-9, 2020.
Luo, H., Quaas, J., and Han, Y.: Diurnally asymmetric cloud cover trends amplify greenhouse warming, Sci. Adv., 10, eado5179, https://doi.org/10.1126/sciadv.ado5179, 2024a.
Luo, H., Quaas, J., and Han, Y.: Decreased cloud cover partially offsets the cooling effects of surface albedo change due to deforestation, Nat. Commun., 15, 7345, https://doi.org/10.1038/s41467-024-51783-y, 2024b.
Luyssaert, S., Marie, G., Valade, A., Chen, Y.-Y., Njakou Djomo, S., Ryder, J., Otto, J., Naudts, K., Lansø, A. S., Ghattas, J., and McGrath, M. J.: Trade-offs in using European forests to meet climate objectives, Nature, 562, 259–262, https://doi.org/10.1038/s41586-018-0577-1, 2018.
Mastrandrea, M. D., Field, C. B., Stocker, T. F., Edenhofer, O., Ebi, K. L., Frame, D. J., Held, H., Kriegler, E., Mach, K. J., Matschoss, P. R., Plattner, G.-K., Yohe, G. W., and Zwiers, F. W.: Guidance Note for Lead Authors of the IPCC Fifth Assessment Report on Consistent Treatment of Uncertainties, Intergovernmental Panel on Climate Change (IPCC), Geneva, Switzerland, 2010.
Mauritsen, T., Tsushima, Y., Meyssignac, B., Loeb, N. G., Hakuba, M., Pilewskie, P., Cole, J., Suzuki, K., Ackerman, T. P., Allan, R. P., Andrews, T., Bender, F. A.-M., Bloch-Johnson, J., Bodas-Salcedo, A., Brookshaw, A., Ceppi, P., Clerbaux, N., Dessler, A. E., Donohoe, A., Dufresne, J.-L., Eyring, V., Findell, K. L., Gettelman, A., Gristey, J. J., Hawkins, E., Heimbach, P., Hewitt, H. T., Jeevanjee, N., Jones, C., Kang, S. M., Kato, S., Kay, J. E., Klein, S. A., Knutti, R., Kramer, R., Lee, J.-Y., McCoy, D. T., Medeiros, B., Megner, L., Modak, A., Ogura, T., Palmer, M. D., Paynter, D., Quaas, J., Ramanathan, V., Ringer, M., von Schuckmann, K., Sherwood, S., Stevens, B., Tan, I., Tselioudis, G., Sutton, R., Voigt, A., Watanabe, M., Webb, M. J., Wild, M., and Zelinka, M. D.: Earth's Energy Imbalance More Than Doubled in Recent Decades, AGU Adv., 6, e2024AV001636, https://doi.org/10.1029/2024AV001636, 2025.
McGraw, Z., Storelvmo, T., Polvani, L. M., Hofer, S., Shaw, J. K., and Gettelman, A.: On the links between ice nucleation, cloud phase, and climate sensitivity in CESM2, Geophys. Res. Lett., 50, e2023GL105053, https://doi.org/10.1029/2023GL105053, 2023.
Meissner, K. J., Weaver, A. J., Matthews, H. D., and Cox, P. M.: The role of land surface dynamics in glacial inception: a study with the UVic Earth System Model, Clim. Dynam., 21, 515–537, https://doi.org/10.1007/s00382-003-0352-2, 2003.
Miralles, D. G., Teuling, A. J., van Heerwaarden, C. C., and Vilà-Guerau de Arellano, J.: Mega-heatwave temperatures due to combined soil desiccation and atmospheric heat accumulation, Nat. Geosci., 7, 345–349, https://doi.org/10.1038/ngeo2141, 2014.
Morrison, H. and Gettelman, A.: A new two-moment bulk stratiform cloud microphysics scheme in the NCAR community atmosphere model (CAM3), Part I: Description and numerical tests, J. Climate, 21, 3642–3659, https://doi.org/10.1175/2008JCLI2105.1, 2008.
Morrison, H., van Lier-Walqui, M., Fridlind, A. M., Grabowski, W. W., Harrington, J. Y., Hoose, C., Korolev, A., Kumjian, H. E., Milbrandt, J. A., Pawlowska, H., Posselt, D. P., Prabhakaran, A., Shima, K., van Diedenhoven, B. A., and Xue, L.: Confronting the Challenge of Modeling Cloud and Precipitation Microphysics, J. Adv. Model. Earth Sy., 12, e2019MS001689, https://doi.org/10.1029/2019MS001689, 2020.
Muñoz-Sabater, J., Dutra, E., Agustí-Panareda, A., Albergel, C., Arduini, G., Balsamo, G., Boussetta, S., Choulga, M., Harrigan, S., Hersbach, H., Martens, B., Miralles, D. G., Piles, M., Rodríguez-Fernández, N. J., Zsoter, E., Buontempo, C., and Thépaut, J.-N.: ERA5-Land: a state-of-the-art global reanalysis dataset for land applications, Earth Syst. Sci. Data, 13, 4349–4383, https://doi.org/10.5194/essd-13-4349-2021, 2021.
Nomokonova, T., Ebell, K., Löhnert, U., Maturilli, M., and Ritter, C.: The influence of water vapor anomalies on clouds and their radiative effect at Ny-Ålesund, Atmos. Chem. Phys., 20, 5157–5173, https://doi.org/10.5194/acp-20-5157-2020, 2020.
Norris, J. R., Allen, R. J., Evan, A. T., Zelinka, M. D., O'Dell, C. W., and Klein, S. A.: Evidence for climate change in the satellite cloud record, Nature, 536, 72–75, https://doi.org/10.1038/nature18273, 2016.
Oleson, K., Lawrence, D., and Bonan, G. B.: Technical description of version 4.5 of the Community Land Model (CLM), NCAR Tech. Note NCAR/TN-503+STR, National Center for Atmospheric Research, Boulder, CO, 2013.
Olson, D. M., Dinerstein, E., Wikramanayake, E. D., Burgess, N. D., Powell, G. V. N., Underwood, E. C., D'amico, J. A., Itoua, I., Strand, H. E., Morrison, J. C., Loucks, C. J., Allnutt, T. F., Ricketts, T. H., Kura, Y., Lamoreux, J. F., Wettengel, W. W., Hedao, P., and Kassem, K. R.: Terrestrial Ecoregions of the World: A New Map of Life on Earth: A new global map of terrestrial ecoregions provides an innovative tool for conserving biodiversity, BioScience, 51, 933–938, https://doi.org/10.1641/0006-3568(2001)051[0933:TEOTWA]2.0.CO;2, 2001.
Parr, C. L., te Beest, M., and Stevens, N.: Conflation of reforestation with restoration is widespread, Science, 383, 698–701, https://doi.org/10.1126/science.adj0899, 2024.
Peng, S., Piao, S., Zeng, Z., Ciais, P., Zhou, L., Li, L. Z. X., Myneni, R. B., Yin, Y., and Zeng, H.: Afforestation in China cools local land surface temperature, P. Natl. Acad. Sci. USA, 111, 2915–2919, https://doi.org/10.1073/pnas.1315126111, 2014.
Pielke Sr., R. A., Avissar, R., Raupach, M., Dolman, A. J., Zeng, X., and Denning, A. S.: Interactions between the atmosphere and terrestrial ecosystems: influence on weather and climate, Global Change Biol., 4, 461–475, https://doi.org/10.1046/j.1365-2486.1998.t01-1-00176.x, 1998.
Pielke Sr., R. A., Adegoke, J., Beltrán-Przekurat, A., Hiemstra, C. A., Lin, J., Nair, U. S., Niyogi, D., and Nobis, T. E.: An overview of regional land-use and land-cover impacts on rainfall, Tellus B, 59, 587–601, https://doi.org/10.1111/j.1600-0889.2007.00251.x, 2007.
Plumb, R. A.: On the three-dimensional propagation of stationary waves, J. Atmos. Sci., 42, 217–229, https://doi.org/10.1175/1520-0469(1985)042<0217:OTTDPO>2.0.CO;2, 1985.
Portmann, R., Beyerle, U., Davin, E., Fischer, E. M., De Hertog, S., and Schemm, S.: Global forestation and deforestation affect remote climate via adjusted atmosphere and ocean circulation, Nat. Commun., 13, 5569, https://doi.org/10.1038/s41467-022-33279-9, 2022.
Ren, Y., Qiu, J., Zeng, Z., Liu, X., Sitch, S., Pilegaard, K., Yang, T., Wang, S., Yuan, W., and Jain, A. K.: Earlier spring greening in Northern Hemisphere terrestrial biomes enhanced net ecosystem productivity in summer, Commun. Earth Environ., 5, 122, https://doi.org/10.1038/s43247-024-01270-5, 2024.
Righelato, R. and Spracklen, D. V.: Carbon mitigation by biofuels or by saving and restoring forests?, Science, 317, 902, https://doi.org/10.1126/science.1141361, 2007.
Roe, S., Streck, C., Beach, R., Busch, J., Chapman, M., Daioglou, V., Deppermann, A., Doelman, J., Emmet-Booth, J., Engelmann, J., Fricko, O., Frischmann, C., Funk, J., Grassi, G., Griscom, B., Havlik, P., Hanssen, S., Humpenöder, F., Landholm, D., Lomax, G., Lehmann, J., Mesnildrey, L., Nabuurs, G.-J., Popp, A., Rivard, C., Sanderman, J., Sohngen, B., Smith, P., Stehfest, E., Woolf, D., and Lawrence, D.: Land-based measures to mitigate climate change: Potential and feasibility by country, Global Change Biol., 27, 6025–6058, https://doi.org/10.1111/gcb.15873, 2021.
Romps, D. M.: Exact Expression for the Lifting Condensation Level, J. Atmos. Sci., 74, 3891–3900, https://doi.org/10.1175/JAS-D-17-0102.1, 2017.
Rossow, W. B., Schiffer, R. A.: Advances in Understanding Clouds from ISCCP, B. Am. Meteorol. Soc., 80, 2261–2288, https://doi.org/10.1175/1520-0477(1999)080<2261:AIUCFI>2.0.CO;2, 1999.
Santanello Jr., J. A., Dirmeyer, P. A., Ferguson, C. R., Findell, K. L., Tawfik, A. B., Berg, A., Ek, M., Gentine, P., Guillod, B. P., van Heerwaarden, C., Roundy, J., and Wulfmeyer, V.: Land–atmosphere interactions: The LoCo perspective, B. Am. Meteorol. Soc., 99, 1253–1272, https://doi.org/10.1175/BAMS-D-17-0001.1, 2018.
Schneider, S. H.: Cloudiness as a Global Climatic Feedback Mechanism: The Effects on the Radiation Balance and Surface Temperature of Variations in Cloudiness, J. Atmos. Sci., 29, 1413–1422, https://doi.org/10.1175/1520-0469(1972)029<1413:CAAGCF>2.0.CO;2, 1972.
Seneviratne, S. I., Corti, T., Davin, E. L., Hirschi, M., Jaeger, E. B., Lehner, I., Orlowsky, B., and Teuling, A. J.: Investigating soil moisture–climate interactions in a changing climate: A review, Earth-Sci. Rev., 99, 125–161, https://doi.org/10.1016/j.earscirev.2010.02.004, 2010.
Shi, C., Wang, T., Wang, G., and Letu, H.: The net warming effect of clouds on global surface temperature may be weakening or even disappearing, Geosci. Front., 16, 102107, https://doi.org/10.1016/j.gsf.2025.102107, 2025.
Snoek, J., Larochelle, H., and Adams, R. P.: Practical Bayesian Optimization of Machine Learning Algorithms, Adv. Neural Inf. Process. Syst., 25, 2960–2968, 2012.
Snyder, P. K., Delire, C., and Foley, J. A.: Evaluating the influence of different vegetation biomes on the global climate, Clim. Dynam., 23, 279–302, https://doi.org/10.1007/s00382-004-0430-0, 2004.
Spracklen, D. V. and Garcia-Carreras, L.: The impact of Amazonian deforestation on Amazon basin rainfall, Geophys. Res. Lett., 42, 9546–9552, https://doi.org/10.1002/2015GL066063, 2015.
Stephens, G. L.: Cloud Feedbacks in the Climate System: A Critical Review, J. Climate, 18, 237–273, https://doi.org/10.1175/JCLI-3243.1, 2005.
Stull, R. B.: An Introduction to Boundary Layer Meteorology, Springer, Dordrecht, the Netherlands, https://doi.org/10.1007/978-94-009-3027-8, 1988.
Sui, Y., Wei, M., and Liu, B.: Biophysical Impacts of Global Deforestation on Near-Surface Air Temperature in China: Results from Land Use Model Intercomparison Project Simulations, Adv. Atmos. Sci., 42, 1141–1155, https://doi.org/10.1007/s00376-024-4149-z, 2025.
Swann, A. L., Fung, I. Y., Levis, S., Bonan, G. B., and Doney, S. C.: Changes in Arctic vegetation amplify high-latitude warming through the greenhouse effect, P. Natl. Acad. Sci. USA, 107, 1295–1300, https://doi.org/10.1073/pnas.0913846107, 2010.
Swann, A. L. S., Fung, I. Y., and Chiang, J. C. H.: Mid-latitude afforestation shifts general circulation and tropical precipitation, P. Natl. Acad. Sci. USA, 109, 712–716, https://doi.org/10.1073/pnas.1116706108, 2012.
Swann, A. L. S., Laguë, M. M., Garcia, E. S., Field, J. P., Breshears, D. D., Moore, D. J. P., Saleska, S. R., Stark, S. C., Villegas, J. C., and Law, D. J.: Continental-scale consequences of tree die-offs in North America: identifying where forest loss matters most, Environ. Res. Lett., 13, 055014, https://doi.org/10.1088/1748-9326/aaba0f, 2018.
Swenson, S. C. and Lawrence, D.: A new fractional snow-covered area parameterization for the Community Land Model and its effect on the surface energy balance, J. Geophys. Res.-Atmos., 117, D21107, https://doi.org/10.1029/2012JD018178, 2012.
Taylor, J. R.: An Introduction to Error Analysis: The Study of Uncertainties in Physical Measurements [M], 2nd edn., University Science Books, Sausalito, ISBN 9780935702750, 1997.
Teuling, A. J., Taylor, C. M., Meirink, J. F., Melsen, L. A., Miralles, D. G., van Heerwaarden, C. C., Vautard, R., Stegehuis, A. I., Nabuurs, G.-J., and Vilà-Guerau de Arellano, J.: Observational evidence for cloud cover enhancement over western European forests, Nat. Commun., 8, 14065, https://doi.org/10.1038/ncomms14065, 2017.
Tselioudis, G., Rossow, W. B., Bender, F., Oreopoulos, L., Remillard, J.: Oceanic cloud trends during the satellite era and their radiative signatures, Clim. Dynam., 62, 9319–9332, https://doi.org/10.1007/s00382-024-07396-8, 2024.
Tselioudis, G., Remillard, J., Jakob, C., and Rossow, W. B.: Contraction of the World's Storm-Cloud Zones the Primary Contributor to the 21st Century Increase in the Earth's Sunlight Absorption, Geophys. Res. Lett., 52, e2025GL114882, https://doi.org/10.1029/2025GL114882, 2025.
van der Werf, G. R., Morton, D. C., DeFries, R. S., Olivier, J. G. J., Kasibhatla, P. S., Jackson, R. B., Collatz, G. J., and Randerson, J. T.: CO2 emissions from forest loss, Nat. Geosci., 2, 737–738, https://doi.org/10.1038/ngeo671, 2009.
Veldman, J. W., Overbeck, G. E., Negreiros, D., Mahy, G., Le Stradic, S., Fernandes, G. W., Durigan, G., Buisson, E., Putz, F. E., and Bond, W. J.: Tyranny of trees in grassy biomes, Science, 347, 484–485, https://doi.org/10.1126/science.347.6221.484-c, 2015a.
Veldman, J. W., Overbeck, G. E., Negreiros, D., Mahy, G., Le Stradic, S., Fernandes, G. W., Durigan, G., Buisson, E., Putz, F. E., and Bond, W. J.: Where Tree Planting and Forest Expansion are Bad for Biodiversity and Ecosystem Services, BioScience, 65, 1011–1018, https://doi.org/10.1093/biosci/biv118, 2015b.
von Trentini, F., Aalbers, E. E., Fischer, E. M., and Ludwig, R.: Comparing interannual variability in three regional single-model initial-condition large ensembles (SMILEs) over Europe, Earth Syst. Dynam., 11, 1013–1031, https://doi.org/10.5194/esd-11-1013-2020, 2020.
Wang, D., Liang, S., and Zeng, Z.: Beyond carbon-centric estimates: revisiting the interplay between hydroclimatic conditions and dryland forestation, Sustain. Horiz., 12, 100112, https://doi.org/10.1016/j.horiz.2024.100112, 2024.
Wang, H., Wang, M., Zhang, Z., Larson, V. E., Griffin, B. M., Guo, Z., Zhu, Y., Rosenfeld, D., Cao, Y., and Bai, H.: Improving the treatment of subgrid cloud variability in warm rain simulation in CESM2, J. Adv. Model. Earth Sy., 14, e2022MS003103, https://doi.org/10.1029/2022MS003103, 2022.
Wang, J., Li, W., Ciais, P., Li, L. Z. X., Chang, J., Goll, D., Gasser, T., Huang, X., Devaraju, N., and Boucher, O.: Global cooling induced by biophysical effects of bioenergy crop cultivation, Nat. Commun., 12, 7255, https://doi.org/10.1038/s41467-021-27520-0, 2021.
Wang, K., Zhao, D., Zhu, Y., Gao, X., Deng, S., Chen, Z., Wang, S., and Cui, Y.: Albedo-dominated biogeophysical warming effects induced by vegetation restoration on the Loess Plateau, China, Ecol. Indic., 154, 110690, https://doi.org/10.1016/j.ecolind.2023.110690, 2023.
Weber, J., King, J. A., Abraham, N. L., Grosvenor, D. P., Smith, C. J., Shin, Y. M., Lawrence, P., Roe, S., Beerling, D. J., and Val Martin, M.: Chemistry-albedo feedbacks offset up to a third of forestation's CO2 removal benefits, Science, 383, 860–864, https://doi.org/10.1126/science.adg6196, 2024.
Wei, Y., Liu, S., Huntzinger, D. N., Michalak, A. M., Viovy, N., Post, W. M., Schwalm, C. R., Schaefer, K., Jacobson, A. R., Lu, C., Tian, H., Ricciuto, D. M., Cook, R. B., Mao, J., and Shi, X.: The North American Carbon Program Multi-scale Synthesis and Terrestrial Model Intercomparison Project – Part 2: Environmental driver data, Geosci. Model Dev., 7, 2875–2893, https://doi.org/10.5194/gmd-7-2875-2014, 2014.
Wood, R.: Stratocumulus clouds, Mon. Weather Rev., 140, 2373–2423, https://doi.org/10.1175/mwr-d-11-00121.1, 2012.
Worley, P. H., Craig, A. P., Dennis, J. M., Mirin, A. A., Taylor, M. A., and Vertenstein, M.: Performance and Performance Engineering of the Community Earth System Model, Lawrence Livermore National Laboratory, 2011.
Xiao, Y., Xiao, Q., and Sun, X.: Ecological risks arising from the impact of large-scale afforestation on the regional water supply balance in southwest China, Sci. Rep., 10, 4150, https://doi.org/10.1038/s41598-020-61108-w, 2020.
Xie, P. and Arkin, P. A.: Global precipitation: A 17-year monthly analysis based on gauge observations, satellite estimates, and numerical model outputs, B. Am. Meteorol. Soc., 78, 2539–2558, https://doi.org/10.1175/1520-0477(1997)078<2539:GPAYMA>2.0.CO;2, 1997.
Xu, R., Li, Y., Teuling, A. J., Zhao, L., Spracklen, D. V., Garcia-Carreras, L., Meier, R., Chen, L., Zheng, Y., Lin, H., and Fu, B.: Contrasting impacts of forests on cloud cover based on satellite observations, Nat. Commun., 13, 670, https://doi.org/10.1038/s41467-022-28161-7, 2022.
Zelinka, M. D., Klein, S. A., Taylor, K. E., Andrews, T., Webb, M. J., Gregory, J. M., and Forster, P. M.: Contributions of Different Cloud Types to Feedbacks and Rapid Adjustments in CMIP5, J. Climate, 26, 5007–5027, https://doi.org/10.1175/JCLI-D-12-00555.1, 2013.
Zelinka, M. D., Zhou, C., and Klein, S. A.: Insights from a refined decomposition of cloud feedbacks, Geophys. Res. Lett., 43, 9259–9269, https://doi.org/10.1002/2016GL069917, 2016.
Zelinka, M. D., Randall, D. A., Webb, M. J., and Klein, S. A.: Clearing clouds of uncertainty, Nat. Clim. Change, 7, 674–678, https://doi.org/10.1038/nclimate3402, 2017.
Zelinka, M. D., Myers, T. A., McCoy, D. T., Po-Chedley, S., Caldwell, P. M., Ceppi, P., Klein, S. A., and Taylor, K. E.: Causes of Higher Climate Sensitivity in CMIP6 Models, Geophys. Res. Lett., 47, e2019GL085782, https://doi.org/10.1029/2019GL085782, 2020.
Zhang, H., Wang, F., Wang, F., Li, J., Chen, X., Wang, Z., Li, J., Zhou, X., Wang, Q., Wang, H., You, T., Xie, B., Chen, Q., and Duan, Y.: Advances in cloud radiative feedbacks in global climate change, Sci. Sin. Terrae, 52, 400–417, https://doi.org/10.1360/SSTe-2021-0052, 2022 (in Chinese).
Zhang, W., Xu, Z., and Guo, W.: The Impacts of Land-Use and Land-Cover Change on Tropospheric Temperatures at Global and Regional Scales, Earth Interact., 20, 1–23, https://doi.org/10.1175/EI-D-15-0029.1, 2016.
Zhao, H., Manizza, M., Lozier, M. S., and Cassar, N.: Greener green and bluer blue: Ocean poleward greening over the past two decades, Science, 388, 1337–1340, https://doi.org/10.1126/science.adr9715, 2025.
Zhao, Z., Li, Y., Xu, R., Meier, R., Liu, L., Chen, L., Zhao, L., Liu, Y., Zi, S., and Zhao, D.: Intercomparison of Methods for Disentangling Local and Nonlocal Biophysical Impacts of Land Cover Changes, Earths Future, 14, e2025EF007704, https://doi.org/10.1029/2025EF007704, 2026.
Zhou, C., Zelinka, M., and Klein, S.: Impact of decadal cloud variations on the Earth's energy budget, Nat. Geosci., 9, 871–874, https://doi.org/10.1038/ngeo2828, 2016.
Zhou, S., Williams, A. P., Berg, A. M., Cook, B. I., Zhang, Y., Hagemann, S., Lorenz, R., Seneviratne, S. I., and Gentine, P.: Land-atmosphere feedbacks exacerbate concurrent soil drought and atmospheric aridity, P. Natl. Acad. Sci. USA, 116, 18848–18853, https://doi.org/10.1073/pnas.1904955116, 2019.
Zhu, J., Otto-Bliesner, B. L., Brady, E. C., Gettelman, A., Bacmeister, J. T., Neale, R. B., Poulsen, C. J., Shaw, J. K., McGraw, Z. S., and Kay, J. E.: LGM Paleoclimate Constraints Inform Cloud Parameterizations and Equilibrium Climate Sensitivity in CESM2, J. Adv. Model. Earth Sy., 14, e2021MS002776, https://doi.org/10.1029/2021MS002776, 2022.