the Creative Commons Attribution 4.0 License.
the Creative Commons Attribution 4.0 License.
 | 27 Jan 2026
Carbon emission reduction requires attention to the contribution of natural gas use: Combustion and leakage
Haoyuan Chen
Tao Song
Xiaodong Chen
Yinghong Wang
Mengtian Cheng
Kai Wang
Fuxin Liu
Baoxian Liu
Yuesi Wang
Natural gas will continue to replace coal in the process of global energy structure reform, but its leakage potential can delay the realization of global carbon neutrality. To quantify its impact, we established a carbon dioxide (CO2) and methane (CH4) flux detection platform on the 220 m platform of the Institute of Atmospheric Physics, Chinese Academy of Sciences, located in northwestern Beijing. The observation results indicated that the daily mean CO2 and CH4 fluxes were 12.21 ± 1.75 µmol m−2 s−1 and 95.54 ± 18.92 nmol m−2 s−1, respectively. The fluxes were significantly correlated with natural gas consumption, indicating that natural gas has become a common source of CH4 and CO2, the combustion of which releases CO2, while its leakage processes emit CH4. Vehicle-based identification demonstrated that CH4 can escape at the production, storage and use stages of natural gas. Based on natural gas consumption data, the upper limit of the calculated natural gas leakage rate in Beijing reached 1.12 % ± 0.22 %, indicating that the contribution of CH4 to climate change could reach 23 % of that of CO2 on a 20-year scale. Natural gas leakage was estimated to delay the time for China to achieve carbon neutrality by at least almost four years.
- Article
(2373 KB) - Full-text XML
-
Supplement
(1451 KB) - BibTeX
- EndNote


In 2015, the 1.5 °C temperature control target was proposed in the Paris Agreement to reduce the occurrence of extreme weather events (Seneviratne et al., 2018). To achieve this goal, it is necessary to actively promote the low-carbon development transformation of the economic system, especially energy transformation. In this process, natural gas plays an important role, and typical countries have indicated a trend of coal reduction and gas increase during energy structure adjustment over the past century. It is expected that global natural gas consumption will continue to increase by 2035.
Natural gas is commonly referred to as a clean alternative to coal, but its main component is methane, with a global warming potential (GWP) that is 29.8 times greater than that of carbon dioxide at the hundred-year scale (Environmental-Protection-Agency, 2024). If 3.4 % of methane leaks into the atmosphere before natural gas combustion, the advantages of natural gas over coal will become negligible (Kemfert et al., 2022). Recent studies have suggested that the average loss rate of natural gas in cities worldwide ranges from 3.3 % to 4.7 % (Sargent et al., 2021). According to statistics from the International Energy Agency (https://www.iea.org, last access: 9 Septembr 2024) in 2020, methane leakage in the global oil and gas industry reached 72 million tons and amounted to 6 billion tons of carbon dioxide equivalent (CO2e) within 20 years. Therefore, it is unclear whether natural gas can become a bridging material for energy transformation.
One important prerequisite is to determine the contribution of natural gas leakage during coal-to-gas conversion to urban methane (CH4) emissions and its climate effects. At present, conventional CH4 monitoring methods include ground, aviation, and satellite monitoring methods. Ground monitoring aims to detect the atmospheric CH4 concentration through the installation of sensors and monitoring stations at fixed locations or on vehicles (Wunch et al., 2016). Notably, monitoring equipment is often installed near potential emission sources, with high detection accuracy but generally a limited spatial range. The aviation monitoring method can be employed to identify large-scale CH4 emissions through measurement techniques such as drones or aircraft but cannot be used to achieve long-term monitoring (Duren et al., 2019; Frankenberg et al., 2016; Sherwin et al., 2024). Satellite methods can compensate for the shortcomings of the former two methods (Chen et al., 2022; Cusworth et al., 2018; Shen et al., 2023), which exhibit interference from clouds and require significant labor and financial investments.
The eddy covariance method, which is based on tall towers, enables long-term monitoring of methane emissions, thus facilitating the identification of methane sources in specific areas. However, it should be noted that this method has certain limitations during urban flux measurements at higher altitudes, as larger air volumes in the measurement system may lead to a significant imbalance between the observed vertical turbulence exchange and surface net flux compared with those at typical measurement heights. However, this deficiency should be considered in conjunction with the advantages of urban tower measurements because cities typically correspond to deeper rough sublayers that can extend to 2–5 times the average building height (Barlow, 2014). Therefore, increasing the measurement altitude can help characterize the turbulent exchange between this layer and the inertial sublayer.
Developing countries are the main driving force behind the continuous growth in global energy demand. As Beijing is the capital of the world's largest developing country and the first city within China to complete the coal-to-gas conversion process, clarifying the natural gas leakage process in Beijing can provide guidance for energy transformation in developing countries regionally and even globally. In this study, three aspects related to natural gas were investigated as follows. First, the fluxes of CH4 and CO2 were observed simultaneously via the eddy covariance method, which was used to investigate the impact of the coal-to-gas policy on CO2 and CH4 in Beijing, including the magnitude of CO2 emission and the common effects on the sources of both. Second, with navigation experiments, the natural gas leakage process in Beijing has been confirmed, and the emission levels of natural gas at different stages have been further roughly estimated, which provides certain effective insights for the control of natural gas leakage in Beijing. Third, we discuss climate forcing caused by natural gas leakage while considering the CO2 flux as a basis, calculate the natural gas leakage rate with statistical data, and estimate the impact of natural gas leakage on China's carbon peak and carbon neutrality in conjunction with existing reports.
2.1 Instrument setup for eddy covariance measurement
The measurements were conducted at a 325 m high meteorological tower in northwestern Beijing, with a closed-path observation system installed on a platform at a height of 220 m, which included a dual laser gas analyzer (QC-TILDAS-DUAL, Aerodyne Research Inc., USA), three-dimensional ultrasonic anemometer (Gill Instruments, Ltd., Lymington, Hampshire, UK), vacuum pump (XDS35i, BOC Edwards, UK), data collector (CR6, Campbell Scientific Inc., USA), and other accessories. In the dual laser gas analyzer, tunable infrared laser direct absorption spectroscopy (TILDAS) technology is used to detect the most significant fingerprint transition frequencies of molecules within the mid-infrared wavelength range. The analyzer has an optical path of up to 76 m and can measure H2O, CO2 and CH4 simultaneously. Similar instruments have been applied to observe outdoor ecosystems (Zöll et al., 2016). Under the action of a vacuum pump, the air sample enters the instrument room at a flow rate of 2 lpm through a polytetrafluoroethylene sampling tube with a length of 3 m and an inner diameter of 3 mm (Fig. S1). Instrument calibration includes zero-point and range calibration processes. High-purity nitrogen gas (>99.999 %) was used for zero-point calibration at 1 h intervals. In this process, the corresponding solenoid valve was opened, which was automatically controlled by TDLWintel software, and range calibration was performed at the factory. In addition, before the experiment, we calibrated the gas analyzer using CO2 (401 ppm) and CH4 (2190 ppb) standard gases. We found that the measured and standard gas concentrations differed by less than 1 %, indicating satisfactory instrument performance. Therefore, we did not perform range calibration later. The instrument was placed in an insulated box equipped with air conditioning to ensure normal operation of the laser. Both instruments were operated at a sampling frequency of 10 Hz. The data collector and high-frequency instrument were timed according to the network and global positioning system (GPS), respectively, to maintain synchronization. To minimize the twisting effect of the flux tower on the incoming air, a three-dimensional ultrasonic anemometer was installed at the end of a 1.5 m long support arm facing southeast China in summer. This measurement lasted from 11 June to 7 September 2022, during which the nitrogen cylinder was replaced, and the instrument was debugged on 18 and 19 June. From 12 to 26 July, the experiment was stopped due to failure of the tower power supply.
2.2 Flux data processing
The flux data processing operation in this study is based on the eddy covariance technique via EddyPro software (version 6.2.1, Li COR, Inc.; Lincoln, Nebraska, USA). An average flux calculation period of 30 min was selected (Lee, 2004). Before calculating half-hourly fluxes, spike detection and data rejection algorithms were applied like follows as described by Vickers and Marht et al. (1997): Take a moving window with a width equal to of the averaging period (typically 5 min) and calculate the mean and standard deviation of the time series within the window. Define outliers as any data points deviating from the mean by n times the standard deviation (initial n=3.5). Replace the identified outliers with linearly interpolated values from adjacent points. Consecutive outliers ≤3 are treated as a single outlier; consecutive outliers ≥4 are considered local trends and excluded from outlier classification. Iteratively increase n by 0.1 per cycle until no outliers are detected or 20 iterations are reached. Advance the window by half its width (step size) and repeat outlier detection/removal for the next window. Continue this process until all outliers are processed within the averaging period. If outliers exceed 1 % of the total data points in any averaging period, discard that entire period.
The double rotation method proposed by Kaimal and Finnigan (1994) was employed for tilt correction. The delay time caused by the spatial separation of gas analyzers and three-dimensional ultrasonic anemometers (as well as the injection pipeline of closed-path systems) was corrected via the maximum covariance method (Fan et al., 2012). Webb, Pearman, and Leuning (WPL) correction was not applied here (Webb et al., 2007) because the instrument room was in a state of constant temperature and pressure that converted the real-time concentration into a dry volume mixing ratio, and the longer pipeline of the closed-path system avoided the influence of temperature fluctuations. The limitations of eddy covariance systems can lead to frequency loss in flux observations. Factors such as a limited average period and linear detrending can cause low-frequency loss, whereas instrument separation, path averaging, insufficient high-frequency responses, and pipeline attenuation can cause high-frequency loss. The method proposed by Moncrieff et al. (1996) was employed for frequency response correction. After the above correction of the flux data, in this paper, the 0-1-2 quality labeling scheme proposed by Mauder and Foken (Mauder and Foken, 2004) was adopted for data quality control purposes. Notably, a value of 0 represents data with the best quality, a value of 1 represents data with good quality, and a value of 2 represents data with poor quality. In this study, flux data marked as 2 were excluded from the subsequent analysis. In addition, the flux source area was evaluated via the method of Kljun et al. (2004) (Sect. S1), and the flux source area covered most of the urban area of Beijing and reflected the average emission characteristics of urban Beijing (Fig. S2).
2.3 Spectral analysis
High-frequency signal loss can occur in closed-path systems. To determine the response capability of the closed-path system to high-frequency turbulence signals, we analyzed the observed gas exchange signals through the turbulence power spectrum. The selected time ranges from 12:00 to 16:00 LT every day during the observation period, with a total of 8 and a half hours of data. The data were integrated and averaged, and the data curve was then compared with the ideal slope in the inertia subarea (Fig. S3). Co(wT) followed the theoretical (where fn denotes the normalized frequency) in the inertial subregion. In contrast, the slopes of Co(wCO2) and Co(wCH4) were slightly greater than , indicating that there was high-frequency loss in the flux observations of the closed-loop system (Kaimal et al., 1972). Through high-frequency correction, the calculation results indicated that the CO2 and CH4 fluxes were 7.73 % and 6.85 % greater, respectively, than those before correction.
2.4 Mobile CH4 and CO2 observations
Vehicle-based experiments were conducted in the urban area of Beijing in the winter of 2023 and the summer of 2024, and the specific deployment of the mobile observation station is shown in Fig. S1. Notably, the car was equipped with a spectrometer (Los Gatos Research, Inc., USA), a laptop for data viewing, and a mobile power supply (Fig. S4). Zero-point calibration of the instrument was performed once pure nitrogen was used before the mobile experiment began. Standard gases of methane and carbon dioxide were introduced to calibrate the instrument simultaneously, and we found that the concentration of the instrument matched well with the standard gas. Since we focused more on the enhancement in concentration rather than itself, we did not calibrate it again afterward. The sampling port was located approximately 20 cm from the roof, and ambient air was collected through a PTFE tube with a length of 2 m and an inner diameter of 3 mm. Before the particulate matter entered the instrument, it was removed using a filter head. The IMET sounding instrument (International Met Systems, USA) is installed on the roof, with a sampling frequency that is consistent with that of the other instruments, i.e., 1 s, real-time concentration information of different latitudes and longitudes is obtained at a resolution of seconds through the corresponding time between the GPS and the instrument; for example, if the GPS sampling time delay is 3 s, the latitude and longitude coordinates are reassigned to the CH4 reading observed three seconds prior. Our observation sites include petrochemical plants located in southwestern Beijing, natural gas storage tanks and landfills in the northeastern part, and power plants with the highest natural gas usage in the southeastern part.
3.1 Diurnal variation in the flux
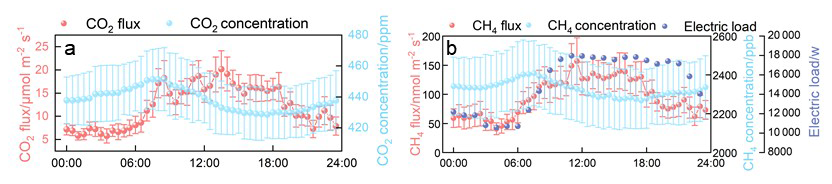
A positive or negative flux reflects the vertical exchange direction of trace gases in the urban canopy, which is positive upward and negative downward (the uncertainty analysis is described in Sect. S2 and Fig. S5, respectively). Overall, both CO2 and CH4 fluxes are positive on a daily scale, indicating that cities are the source of both gases. The diurnal CO2 flux ranged from 6.05 to 19.66 µmol m−2 s−1 with an average of 12.21 ± 1.75 µmol m−2 s−1 (Fig. 1a), which was generally lower than the summer observations by Cheng et al. (2018) and Liu et al. (2012) at 200 and 140 m at this tower, respectively (Table S1), a smaller deviation suggests that CO2 may be dominated by a more stable source than before. We also obtained observation results at 140 m in summer from 2009–2017 (Liu et al., 2020). The flux in 2022 significantly decreased compared with previous levels (Fig. S6), which reflects the transformation of Beijing's energy structure. The coal-to-gas policy implemented by Beijing these years led to a gradual decrease in the proportion of coal in primary energy consumption, with a steady increase in the proportion of natural gas in total consumption (Fig. S7), the use of natural gas results in much less coal CO2 than coal, generating the same amount of heat; moreover, Beijing has increased the amount of electricity flow from other provinces in recent years (Fig. S7), which has further driven a decrease in the annual average concentration of PM2.5, dropping to 30.5 µg m−3 by 2024. In fact, previous studies have reported a high correlation between PM2.5 and CO2 fluxes. For example, Donateo et al. (2019) found that the seasonal and daily variations in the particle number flux in southern Italian suburbs are largely determined by both transportation activities and household heating. Liu et al. (2020) confirmed that the CO2 flux can explain 64 % of the interannual variation in the PM2.5 concentration by fitting the correlation between the annual average PM2.5 and CO2 fluxes in Beijing from 2009 to 2017. Therefore, controlling CO2 emissions can also greatly control the concentration level of PM2.5, thereby achieving the dual effects of mitigating climate change and improving air quality. In terms of its diurnal variation, it did not follow a typical bimodal pattern but rather remained high after reaching the first peak at 08:00 LT, with a lower level at night, reflecting high anthropogenic carbon emissions during the day, such as those resulting from transportation and energy generation activities. The diurnal pattern of the CH4 flux was similar to the observation results of Gioli et al. (2012) and Helfter et al. (2016) (Fig. 1b), reflecting an increase in emissions during the day. The CH4 flux began to increase gradually from 04:00 to around 08:30 LT, and then remained stable until after 10:30 LT, when it began to rise rapidly again, reaching its daily peak of approximately 157.1 nmol m−2 s−1 around 11:30 LT. After 17:30 LT, it slowly declined. Its diurnal variation pattern showed some differences compared to CO2 flux, which increased beginning at 03:30 to around 08:30 LT similar to CH4 flux. However, the peak for CO2 flux occurred around 13:30 LT, then slowly decreased and decreased rapidly after 18:30 LT, Assuming that the average CH4 flux at midnight (00:00 to 06:00 LT) can be employed as the baseline for nighttime emissions, it accounted for 58 % of the daily average flux. The CH4 flux demonstrated a pronounced diurnal pattern, indicating a significant daily variation in the background source in the source area.
3.2 Homology between CO2 and CH4
The CO2 and CH4 fluxes showed a significant correlation along all directions (Fig. 2), with correlation coefficients greater than that at the center of Loz, Poland (0.50) (Pawlak and Fortuniak, 2016), but the low correlation between the CO2 and CH4 fluxes and the temperature excludes the conclusion that biological sources dominate their emissions (Fig. S8). Therefore, CO2 and CH4 share the same anthropogenic sources within the source area. This homology is also reflected in their spatial distributions, with high fluxes distributed mainly south of the tower, which is more densely populated and encompasses complex industrial structures, and much lower fluxes in the northern forest and park areas (Fig. 3a, b). The correlation between the spatial distributions of the CO2 and CH4 fluxes reached 0.98, demonstrating the common impact of similar anthropogenic sources on their emissions. The linear fitting results at 150 and 240° indicated the highest correlation coefficient (0.82) along all directions (Fig. 2), further supporting this viewpoint.
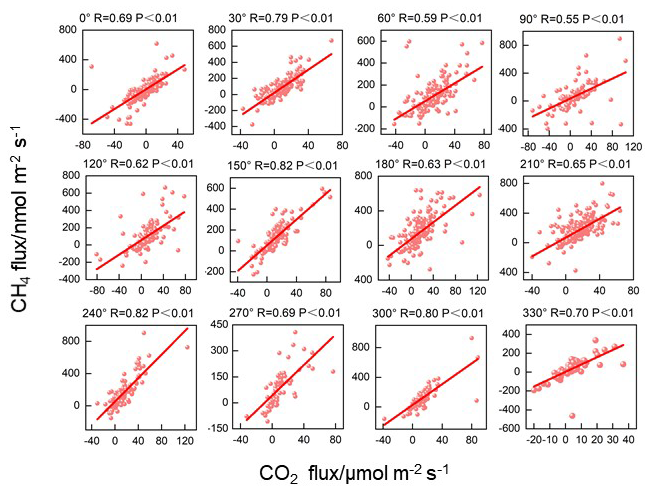
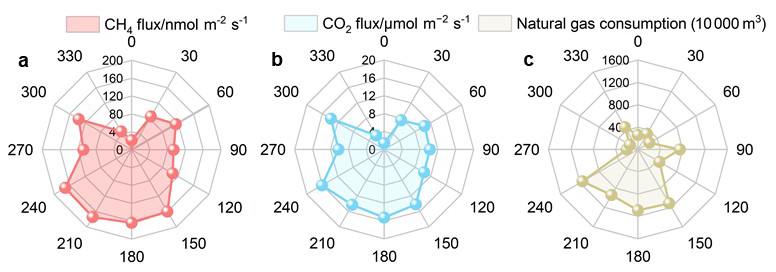
Figure 3Mean CH4 and CO2 concentrations, fluxes and natural gas consumption in the 12 directions.
4.1 Driver of the homology between CO2 and CH4
After the introduction of natural gas in 1985, the proportion of natural gas in the fossil fuel industry of Beijing increased annually, especially when coal was replaced with natural gas and electricity in 2014 and 2018, respectively, and natural gas became the most consumed fossil fuel (Fig. 6a). According to the 2022 Beijing Statistical Yearbook (in Chinese; https://nj.tjj.beijing.gov.cn/nj/main/2023-tjnj/zk/e/indexch.htm, last access: 12 November 2025), natural gas is used mainly for thermal power generation and heating (accounting for 69 %). Owing to the low proportion of heating in summer, natural gas in Beijing is mostly used for thermal power generation in summer. Owing to the difficulty in obtaining hourly electricity generation data, we obtained a daily variation curve of the electricity load in Beijing based on the statistical data (power plants usually calculate the required electricity generation based on the electricity load) (source: National Energy Administration, China; https://www.gov.cn/xinwen/2019-12/30/5465088/files/e3682ce168c8427b886a43a790d66c2c.pdf, last access: 12 December 2025) (Fig. 1b). The daily variation in the electricity load is highly consistent with that in the CH4 flux, with the maximum CH4 flux occurring at 11:00 LT during the peak electricity consumption period. After 16:00 LT, the electricity load and CH4 flux decrease synchronously. Thus, the daily variation in the CH4 flux is driven by natural gas consumption. We gridded the natural gas consumption data (Fig. S9) and calculated the mean natural gas consumption along all directions within the flux source area (Fig. 3c). Notably, a high consistency between the spatial distributions of the CO2 and CH4 fluxes and natural gas consumption was found, which reflects that after the adjustment of the energy structure in Beijing, natural gas became the main source of CO2 and CH4. Considering the high photosynthetic absorption of CO2 by plants in summer, this conclusion also applies to the other seasons, which supports the hypothesis that natural gas is the main source of winter CO2 emissions in Beijing, as determined based on the isotope tracing method (Wang et al., 2022a, b).
To verify this conclusion and identify the primary phases of natural gas leakage, we conducted mobile observations during winter and summer around large petrochemical plants, gas storage tanks, and power plants in Beijing. Given real-time variations in gas concentrations influenced by meteorological conditions and pollution transport, it was essential to determine background concentrations at each time point. The current mainstream approach for determining background values involves calculating the 5th or 10th percentile within a sliding window of 5 min (±2.5 min) or 10 min (±5 min) centered on the target timestamp (Pu et al., 2023; Weller et al., 2018, 2019). We compared and evaluated the results applying different combinations of time windows or percentile following the method of Schiferl et al. (2025). (Sect. S3). The 10 min time window with 5th percentile was used here to calculate the background value. The enhancement concentration can be defined as the difference between the observed value and the background value at the corresponding time. There was significant CH4 leakage around the gas storage tanks and power plants in both winter and summer. Notably, the observed CH4 hotspots were located in the downzone of potential leakage sources; therefore, we attribute the high CH4 concentration to the emissions of these potential natural gas leakage sources. In winter, hotspots with concentrations higher than the background value of 1759 ppb appeared around the gas storage tank (Fig. 4a), corresponding to an enhancement concentration of CH4 (E-CH4) and enhancement concentration of CO2 (E-CO2) fingerprint line with a slope of 0.11 (Fig. 5a). In addition, the enhancement concentration fingerprint slopes of the other hotspot zones were 0.06 and 0.07, respectively, indicating varying degrees of leakage around the gas storage tank (Sun et al., 2019).The enhancement concentration fingerprint in summer also revealed leakage related to gas storage equipment (Fig. 4b), with a slope of 0.04, analogous to that of 0.06 in winter. Similar to gas storage tanks, natural gas leakage hotspots have been observed in various equipment in power plants. For example, fingerprints with a slope of 0.005 (Fig. 5d) in summer reflected leakage related to combustion devices or pipeline in power plants (Lamb et al., 1995), whereas fingerprints with a slope of 0.015, 0.02 or 0.05 reflected leakage related to storage facilities (Fig. 5c, d) (Hurry et al., 2016). We also discovered natural gas leakage near the petrochemical plant (Fig. 4e), the line with a slope of 0.02 was related to the gas storage equipment, and the line with a slope of 0.005 was relevant to the natural gas combustion equipment. As important sources of methane, landfills have received widespread attention, so we also conducted mobile observations near a large landfill outside the Fifth Ring Road in Beijing, which was a hotspot exhibiting a level exceeding the minimum concentration of 1375 ppb (Fig. 4f). The concentration fingerprints were relatively disordered and significantly differed from those of CH4 emissions dominated by natural gas (Fig. 5f), indicating that waste disposal processes are relatively complex and cannot be ignored in cities (Cusworth et al., 2024).
Converting observed concentration increments into emission rates is a simple means of quantifying natural gas leakage, which is subject to atmospheric conditions and potential leak source locations. Weller et al. (2018, 2019) developed a model based on the relationship between the enhancement concentration and emission rate. The specific formula is shown in Text S4. The model assumes that CH4 enhancement is the best predictor of the leakage emission rate and that a greater leakage emission rate corresponds to greater CH4 enhancement. The method sets a minimum threshold for the observed CH4 concentration, which is 110 % of the background value, to filter out concentration changes caused by measurement. Moreover, when multiple detections are conducted for the same leakage source, it is necessary to average the CH4 enhancement values and then substitute them into the above formula. We estimated the natural gas leakage emission rates from different leakage sources with this method, and the confidence interval (CI) based on the Bootstrap method was used to estimate the uncertainty of the leakage rate. The natural gas leakage rate from the gas storage tank and power plant in winter were 7.4 ± 0.1 and 0.6 ± 0.03 g min−1, respectively, and the natural gas leakage rate from the gas storage tank and power plant in summer were 1.2 ± 0.04 and 2.1 ± 0.07 g min−1, respectively. The natural gas leakage rate near the petrochemical plant was 0.6 ± 0.04 g min−1, which was lower than the results of Ars et al. (2020) on the leakage rates of Toronto's natural gas distribution network (3.5–10.6 g min−1), but they noted that Well's method underestimated the leakage rate because it ignored smaller concentration enhancements. A significant uncertainty in this method lies in the distance between the leakage point and the vehicle; unfortunately, determining the distance between the two points in practical operation is difficult, which may confound the estimation of methane leakage. Therefore, sufficient mobile experiments should be conducted in subsequent work to accurately calculate natural gas leakage in Beijing.
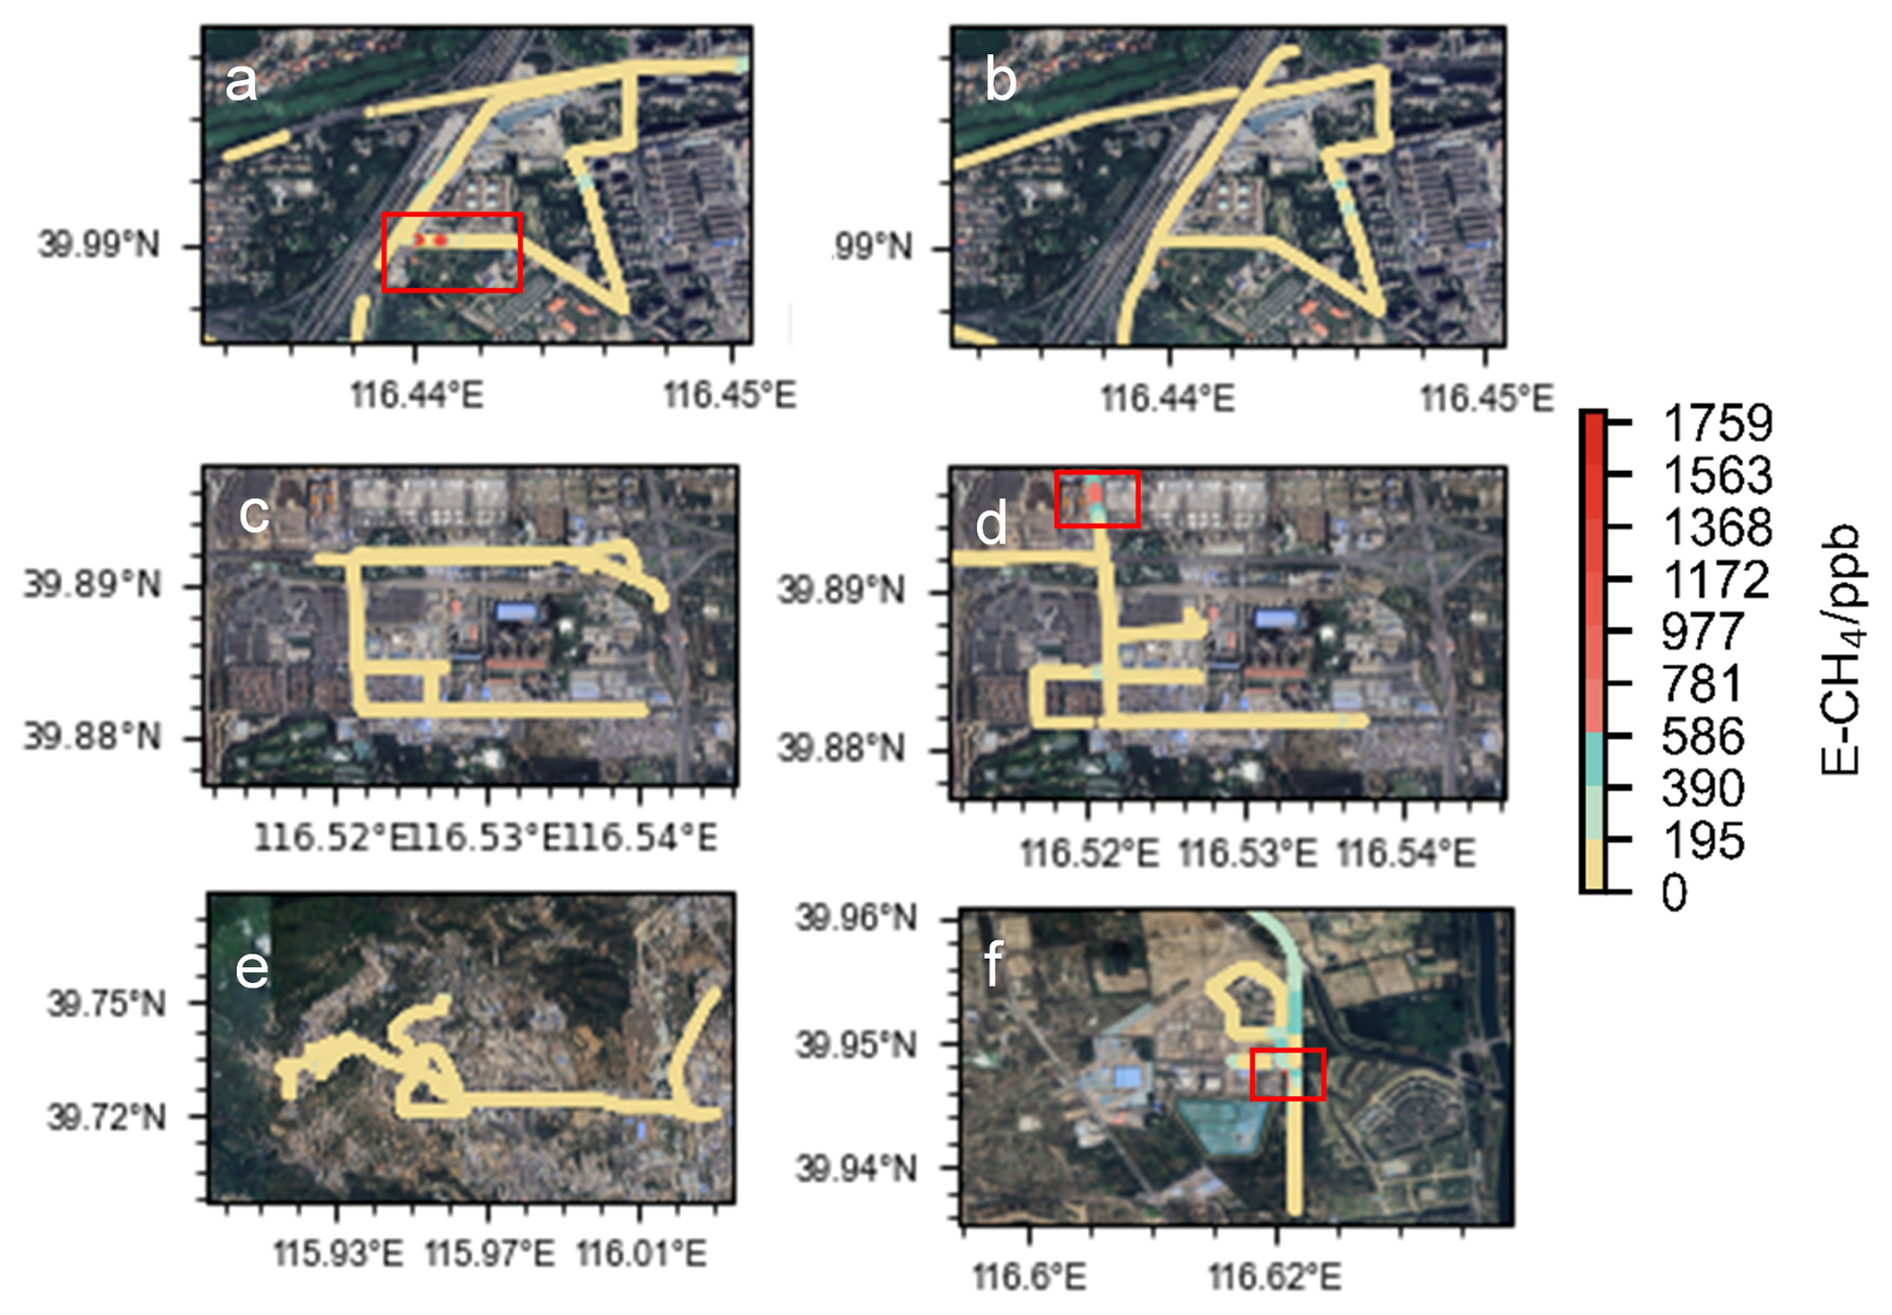
Figure 4CH4 enhancement concentration distribution map based on vehicle observations (a, c show storage tanks and thermal power plants in winter; b, d show storage tanks and thermal power plants in summer; e shows petrochemical plants; f shows waste disposal station; and the red box represents high leakage value, The background image is from Google Earth (© 2025 Google Earth)).
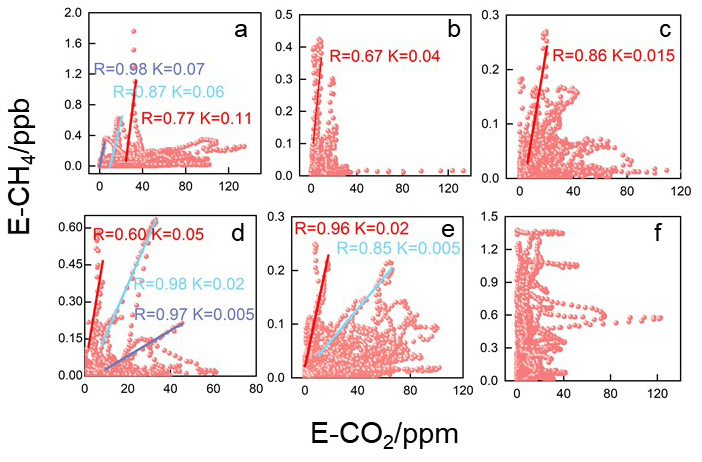
Figure 5Fitting of the CO2 and CH4 concentration enhancement values (a, c show the fitting results for the gas storage tanks and power plants in winter; b, d show the fitting results for the gas storage tanks and power plants in summer; e shows the petrochemical plants; and f shows the waste disposal stations. Different fitting lines represent various leakage sources).
4.2 Climatic effects of natural gas (NG) losses and their impact on carbon neutrality
Based on the natural gas consumption and flux data for the flux source area, the estimated upper limit of the natural gas leakage rate in Beijing reached 1.12 % ± 0.22 % (Sect. S5), and the lower limit of natural gas leakage in Beijing was estimated to be 0.82 % considering the emissions from biogenic sources (Sect. S6). If the CH4 fluxes were attributable solely to pipeline leakage processes, the CH4 fluxes should remain relatively stable throughout the day without significant diurnal variations, given the constant pressure in urban pipeline pressures. However, in our observations, the CH4 fluxes exhibited pronounced diurnal patterns and their spatial distribution positively correlated with natural gas consumption. This indicates that CH4 emissions in Beijing originate predominantly from consumption-oriented leakage processes. Consequently, as natural gas consumption surges during winter heating periods, CH4 emissions from these processes (e.g., fugitive emissions from electrical devices) also increase. As a result, the ratio of emissions to consumption (leakage rate) remains relatively stable. Thus, the CH4 leakage rate measured in summer is representative of year-round leakage rate of natural gas.
Our measured leakage rate was lower than the value of 2.07 % calculated based on the purchase and sales statistics and the statistical mean value of 1.1 %–1.65 % reported by the American Petroleum Institute (https://www.api.org/, last access: 18 October 2024). Nevertheless, the contributions of CH4 to climate warming are 8.37 % and 23.17 % of those of CO2 at the 100- and 20-year scales, respectively, according to the determined CO2 and CH4 fluxes and the GWP of CH4. With the arrival of the winter heating season, climate forcing will further increase on a yearly scale. Assuming that the natural gas consumption in Beijing during the heating season is 5 times greater than that during the other seasons (according to Beijing Gas in 2019), that oil consumption does not significantly fluctuate throughout the year and that both the CO2 and CH4 fluxes are positively correlated with fossil fuel consumption and natural gas leakage, the climate forcing effect of natural gas leakage in 2022 was 11.47 % on a 100-year scale and could reach as high as 31.56 % on a 20-year scale. However, when the same amount of heat is generated, the use of natural gas could yield CO2 emission reductions of 50 % relative to coal and of only approximately 30 % relative to oil. Therefore, the reduction in greenhouse gas emissions resulting from natural gas combustion compared with that resulting from the combustion of other fossil fuels may be offset by the climate forcing effect of CH4 leakage in the short term, making it difficult for natural gas to become a transitional energy source for energy transition.
To assess the impact of natural gas leakage on carbon peak and carbon neutrality based on our quantified leakage rate, scaling the Beijing-derived leakage rate to a national level is needed. However, due to the absence of leakage rate data from other cities, we can provide only a rough estimate based on available data as follows: according to the 14th Five-Year Plan for National Urban Infrastructure Development (in Chinese; https://www.gov.cn/zhengce/zhengceku/2022-07/31/5703690/files/d4ebd608827e41138701d06fe6133cdb.pdf, last access: 15 November 2025), cities in China are divided into three categories – major cities (natural gas penetration rate ≥85 %), medium cities (natural gas penetration rate ≥75 %), and small cities (natural gas penetration rate ≥60 %). The China Gas Development Report 2023 (Economics & Development Research Institute of SINOPEC, 2023) further supplements pipeline coverage progress, indicating that large cities and developed regions (e.g., Beijing, the Yangtze River Delta, the Pearl River Delta) accounted for approximately 30 %–40 % of the national pipeline length in 2022, here set at 35 %. Small/medium cities constituted 60 %–70 % of the total pipeline length, here set at 65 %. A study based on Bayesian network modeling revealed that leakage probabilities in small/medium cities are 1.8 times higher than those in major cities (95 % CI: 1.6–2.0) (Gao et al., 2024). Consequently, the national leakage rate was calculated as 1.7 % (95 % CI: 1.57 %–1.85 %) = 0.35 × 1.12 % + 0.65 × 1.12 % × 1.8(95 % CI: 1.6–2.0).
Then we adopted the results of the Global Climate Governance Strategy and China's Carbon Neutrality Path Outlook (Wang et al., 2021), which indicates that CO2 emissions in China under the carbon neutrality scenario reach approximately 2.1 Gt. We calculated CH4 leakage in the corresponding year based on the natural gas consumption level under the future scenario of the China Energy Outlook 2060 (Economics & Development Research Institute of SINOPEC, 2022) (Economics-and-Development-Research-Institute, 2021). All of the calculation results were converted CO2 equivalents (CO2e) according to the GWP on a 20-year scale (Fig. 6b). After taking into account the natural gas leakage process, the CO2e in China will still peak by 2030. However, the CO2e resulting from natural gas leakage will reach 0.37 Gt (95 % CI: 0.34–0.40 Gt) in 2060, compared to 0.26 Gt previously. This accounts for approximately 16.6 % (95 % CI: 15.4 %–17.9 %) of the total CO2 emissions (excluding natural gas leakage) and 35.9 % (95 % CI: 33.2 %–38.8 %) of the total CO2 emissions from natural gas combustion, which is comparable to the CO2 emissions from coal combustion (0.35 Gt). Since natural carbon sinks do not show significant short-term fluctuations, the future increase in carbon sinks will mainly rely on carbon capture and storage (CCS) technology. Given the current estimated CO2 capture rate of CCS technology (0.1 Gt yr−1, as estimated by the China Energy Outlook 2060, Economics & Development Research Institute of SINOPEC, 2022), the achievement of carbon neutrality in China will likely be delayed by nearly three to four years. Therefore, when determining future natural gas consumption levels, it is necessary to both consider the leakage effects of natural gas and utilize carbon modeling.
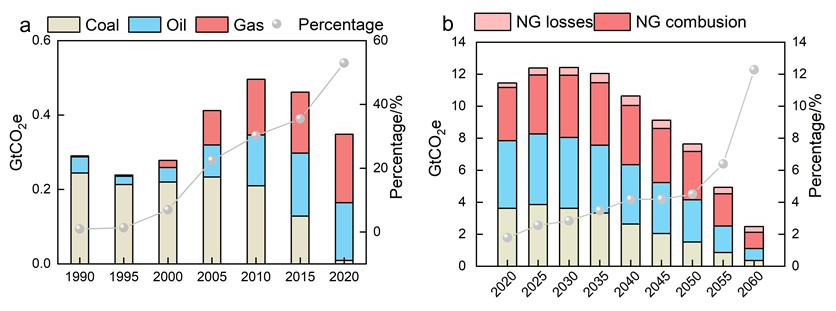
Figure 6Terminal consumption of coal, oil, and natural gas and their proportions from 1990 to 2020 (a) (since diesel-powered trucks are allowed only at night on the Fifth Ring Road and kerosene, which is used mainly in aviation and is not included in the flux source area, oil mainly comprises gasoline in this case), CO2 equivalent from coal, oil and natural gas (losses and combustion) in the future scenario (estimated by China Energy Outlook 2060 released by SINOPEC in 2021), and CO2 equivalent of natural gas leakage as a proportion of natural gas (NG) combustion emissions (b).
4.3 Policy implications
Our observations revealed a strong correlation between CH4 emissions and natural gas consumption in terms of both their daily variations and spatial distributions, that is to say, the terminal consumption process drive natural gas leakage in Beijing. Liu et al. (2023) established a bottom-up emission inventory and reported that the terminal use process in Beijing accounts for 80 % of the total methane emissions in the entire natural gas supply chain. Therefore, the Chinese government may need to expand the detection of pipeline leakage to the entire natural gas industry chain.
Notably, existing grid-based inventory products also exhibit significant uncertainty in terms of methane sources. The extracted inventory originates from the Emissions Database for Global Atmospheric Research (EDGAR) (https://edgar.jrc.ec.europa.eu/EDGARv8.0, last access: 6 August 2025). Although the mean methane flux (126.3 nmol m−2 s−1) within the source area is close to our results, the terminal use process accounts for only approximately 13 % of the annual methane emissions, suggesting that many potential urban methane sources could have been missed, which should be considered in inventory refinement in the future.
In addition, minimizing the methane leakage rate could ensure the early realization of carbon neutrality in China. Although methane emission control has been included in the agenda for the first time in the Methane Emission Control Action Plan promulgated in 2023, which clearly highlights the need to promote the application of leak detection and repair technology and to enhance the comprehensive recovery and utilization of methane, methane leakage standards have not been updated. Previous methane leakage standards focused only on controlling the amount of methane leakage from a safe perspective, thereby ignoring the climate effects of natural gas leakage. China must urgently develop a strict and detailed set of natural gas leakage standards.
4.4 Limitations
The flux discussed in this study is net flux, which means considering both positive flux and negative flux simultaneously. It should be noted that for flux values close to zero (particularly the negative values observed at night), we have retained all the data points without employing a filtering method based on the statistics of instrument white noise. Whereas a more rigorous approach would be to model these fluxes fluctuating around zero as white noise and establish a statistical significance threshold based on this. Discarding all values within this threshold (including slightly positive and slightly negative ones) could effectively reduce noise-induced bias, although at the cost of data coverage. The development and application of such objective, instrument-physics-based filtering criteria represent an important direction for future research to enhance the quality and reliability of flux data, particularly under low-turbulence conditions.
For the source analysis of CO2 and CH4, we did not consider the impact of long-distance transportation. However, this impact may not be completely ignored. For example, in the upwind area of Beijing, Shanxi Province is a high-intensity area of anthropogenic pollutant emissions, where the actual lifespan of local CO may be significantly shortened due to the influence of local OH concentration. The CO2 produced by CO there is not insignificant (Li et al., 2025), which may also be one of the sources of local CO2 in Beijing. Therefore, it is necessary to combine regional chemical transport models to more accurately quantify the impact of local chemical coupling in future flux research.
When quantifying CH4 leakage from different natural gas facilities, we adopted a quantile based deterministic method to separate background concentration from enhanced signals, and mainly explored the sensitivity brought by algorithm parameter selection. However, this framework has a fundamental limitation: it fails to incorporate the inherent observational uncertainty of background concentration and on-site observed concentration into a unified probabilistic analysis. The observation error of background value and enhanced signal are coupled (Lu et al., 2025; Zheng et al., 2025), they will propagate together, and significantly affect the final uncertainty interval of emission estimation. Our current sensitivity analysis can only be one step in such comprehensive uncertainty quantification work (i.e. identifying sensitivity to parameter selection), and future work should focus on: (1) systematically quantifying the instrument errors used in this study; (2) integrating these prior uncertainties into the inversion process of emissions using probabilistic frameworks such as Bayesian inference or error propagation models; (3) expanding the emission estimation from a single “best estimate” to a probability distribution that includes confidence intervals.
Although we estimated the impact of natural gas leaks on China's carbon neutrality process, the national-scale extrapolation of the natural gas leakage rate conducted in this study carried substantial uncertainty. Our approach, which relied on a simplified scaling method due to data availability constraints, may fail to account for strong regional heterogeneities in natural gas consumption patterns and infrastructure conditions. As highlighted by recent literatures (Qin et al., 2024; Hu et al., 2024), such scaling methods can systematically miss substantial emission sources in specific regions (e.g., industrial hubs like Shanxi Province). Therefore, our national estimate should be interpreted as a rough attempt.
This study utilized the eddy covariance method to measure CO2 and CH4 fluxes at 220 m height in urban Beijing, providing critical insights into surface-atmosphere exchanges of greenhouse gases in the region. First, urban areas unequivocally act as net sources of both CO2 and CH4. The daily mean fluxes were 12.21 ± 1.75 µmol m−2 s−1 for CO2 and 95.54 ± 18.92 nmol m−2 s−1 for CH4, with daytime emissions significantly exceeding nighttime levels, highlighting the importance of anthropogenic influences.
Although diurnal variation patterns differed slightly between CO2 and CH4 fluxes, their strong correlation indicates shared dominant sources. Spatial distribution analysis revealed high consistency between both fluxes and natural gas consumption patterns, confirming natural gas as a common source. With Beijing's energy restructuring, natural gas has become the dominated terminal energy consumption. Its combustion releases substantial CO2, while leakage processes emit CH4, as validated by mobile observations detecting CH4 fugitive emissions during production, storage and use stages. Although biogenic sources could contribute to CH4 emissions, they account for at most 27 % of total CH4 fluxes in the source area, ruling out the view that biological sources dominate both emissions. Attributing all CH4 emissions to natural gas usage, the upper leakage rate of natural gas in Beijing was calculated as 1.12 % ± 0.22 %.
The CH4 emissions from natural gas will exacerbate climate warming. Calculated flux results showed that the contribution of CH4 to climate warming on a century and 20-year scale can reach as high as 8.37 % and 23.17 % of CO2, respectively. On the basis of predicted energy report and calculated leakage rate, it is roughly predicted that natural gas leakage will delay China's realization of carbon neutrality, which necessitates urgent attention to mitigate associated climate effects. Future work should prioritize the development of more granular, bottom-up inventories based on province-level activity data and infrastructure surveys to achieve a more accurate and robust assessment of China's overall natural gas leakage.
All the data generated or analyzed in this study are included in the published article and are available from the authors upon reasonable request.
Details about the Beijing Meteorological Tower, eddy observation system and navigation observation station, daily summer variation in CO2 flux from 2009 to 2017, total consumption, electricity inflow and the proportion of natural gas in total energy consumption from 2013–2022, spatial distribution of CO2 and CH4 fluxes with wind speed and direction, grid distribution of natural gas consumption in Beijing, calculation methods of the flux source area and natural gas leakage rate, uncertainty analysis of flux calculation, estimation of non-natural gas sources The supplement related to this article is available online at https://doi.org/10.5194/acp-26-1359-2026-supplement.
Haoyuan Chen: Formal analysis, methodology, data curation, visualization, and writing – original draft; Tao Song: methodology and review; Yinghong Wang: methodology and review; Mengtian Cheng: review; Kai Wang: data curation and review; Fuxin Liu: review; Xiaodong Chen: data curation and review; Baoxian Liu: data curation and review; Guiqian Tang: supervision, project administration, funding acquisition, writing – review and editing, and conceptualization; Yuesi Wang: data curation and review.
The contact author has declared that none of the authors has any competing interests.
Publisher's note: Copernicus Publications remains neutral with regard to jurisdictional claims made in the text, published maps, institutional affiliations, or any other geographical representation in this paper. The authors bear the ultimate responsibility for providing appropriate place names. Views expressed in the text are those of the authors and do not necessarily reflect the views of the publisher.
This work was supported by the Strategic Priority Research Program of the Chinese Academy of Sciences (XDB0760200), the National Key R&D Program of China (2023YFC3706103), the Beijing Municipal Natural Science Foundation (no. 8244071) and the Beijing Municipal Sci-Tech Project on Ecology and Environment (no. BJST20250105).
This research has been supported by the Strategic Priority Research Program of the Chinese Academy of Sciences (XDB0760200), the National Key R&D Program of China (2023YFC3706103), the Beijing Municipal Natural Science Foundation (no. 8244071) and the Beijing Municipal Sci-Tech Project on Ecology and Environment (no. BJST20250105).
This paper was edited by Christoph Gerbig and reviewed by two anonymous referees.
Ars, S., Vogel, F., Arrowsmith, C., Heerah, S., Knuckey, E., Lavoie, J., Lee, C., Pak, N. M., Phillips, J. L., and Wunch, D.: Investigation of the Spatial Distribution of Methane Sources in the Greater Toronto Area Using Mobile Gas Monitoring Systems, Environ. Sci. Technol., 54, 15671–15679, https://doi.org/10.1021/acs.est.0c05386, 2020.
Barlow, J. F.: Progress in observing and modelling the urban boundary layer, Urban Climate, 10, 216–240, https://doi.org/10.1016/j.uclim.2014.03.011, 2014.
Chen, Z., Jacob, D. J., Nesser, H., Sulprizio, M. P., Lorente, A., Varon, D. J., Lu, X., Shen, L., Qu, Z., Penn, E., and Yu, X.: Methane emissions from China: a high-resolution inversion of TROPOMI satellite observations, Atmos. Chem. Phys., 22, 10809–10826, https://doi.org/10.5194/acp-22-10809-2022, 2022.
Cheng, X. L., Liu, X. M., Liu, Y. J., and Hu, F.: Characteristics of CO2 concentration and flux in the Beijing urban area, J. Geophys. Res-Atmos., 123, 1785–1801, https://doi.org/10.1002/2017JD027409, 2018.
Cusworth, D. H., Jacob, D. J., Sheng, J.-X., Benmergui, J., Turner, A. J., Brandman, J., White, L., and Randles, C. A.: Detecting high-emitting methane sources in oil/gas fields using satellite observations, Atmos. Chem. Phys., 18, 16885–16896, https://doi.org/10.5194/acp-18-16885-2018, 2018.
Cusworth, D. H., Duren, R. M., Ayasse, A. K., Jiorle, R., Howell, K., Aubrey, A., Green, R. O., Eastwood, M. L., Chapman, J. W., Thorpe, A. K., Heckler, J., Asner, G. P., Smith, M. L., Thoma, E., Krause, M. J., Heins, D., and Thorneloe, S.: Quantifying methane emissions from United States landfills, Science, 383, 1499–1504, https://doi.org/10.1126/science.adi7735, 2024.
Donateo, A., Conte, M., Grasso, F. M., and Contini, D.: Seasonal and diurnal behaviour of size segregated particles fluxes in a suburban area, Atmos. Environ, 219, 117052, https://doi.org/10.1016/j.atmosenv.2019.117052, 2019.
Duren, R. M., Thorpe, A. K., Foster, K. T., Rafiq, T., Hopkins, F. M., Yadav, V., Bue, B. D., Thompson, D. R., Conley, S., Colombi, N. K., Frankenberg, C., McCubbin, I. B., Eastwood, M. L., Falk, M., Herner, J. D., Croes, B. E., Green, R. O., and Miller, C. E.: California's methane super-emitters, Nature, 575, 180–184, https://doi.org/10.1038/s41586-019-1720-3, 2019.
Economics-and-Development-Research-Institute: World and China Energy Outlook 2060, https://www.docin.com/p-2955292161.html (last access: 6 August 2025), 2021.
Economics & Development Research Institute of SINOPEC: China Energy Outlook 2060 (Research Report, Project No.: 2021TS31), Beijing: China Petroleum & Chemical Corporation, https://max.book118.com/html/2022/0114/8053004077004055.shtm (last access: 18 August 2024), 2022.
Economics & Development Research Institute of SINOPEC: China Gas Development Report 2023, https://www.nea.gov.cn/2023-07/21/c_1310733569.htm (last access: 21 August 2024), 2024.
Environmental-Protection-Agency: Understanding global warming potentials, https://www.epa.gov/ghgemissions/understanding-global-warming-potentials, last access: 22 October 2024.
Fan, S. M., Wofsy, S. C., Bakwin, P. S., Jacob, D. J., and Fitzjarrald, D. R.: Atmosphere-biosphere exchange of CO2 and O3 in the central Amazon Forest, JGR: Atmospheres, 95, 16851–16864, https://doi.org/10.1029/JD095iD10p16851, 2012.
Frankenberg, C., Thorpe, A. K., Thompson, D. R., Hulley, G., Kort, E. A., Vance, N., Borchardt, J., Krings, T., Gerilowski, K., Sweeney, C., Conley, S., Bue, B. D., Aubrey, A. D., Hook, S., and Green, R. O.: Airborne methane remote measurements reveal heavy-tail flux distribution in Four Corners region, Proc. Natl. Acad. Sci. U. S. A., 113, 9734-9739, https://doi.org/10.1073/pnas.1605617113, 2016.
Gao, S., Tian, W., and Wang, C.: A method, system, equipment, and medium for determining methane leakage in a natural gas pipeline network (Chinese Patent No. CN118333786A). National Intellectual Property Administration, PRC, http://epub.cnipa.gov.cn/ (last access: 18 December 2025), 2024 (in Chinese).
Gioli, B., Toscano, P., Lugato, E., Matese, A., Miglietta, F., Zaldei, A., and Vaccari, F. P.: Methane and carbon dioxide fluxes and source partitioning in urban areas: the case study of Florence, Italy, Environ. Pollut., 164, 125–131, https://doi.org/10.1016/j.envpol.2012.01.019, 2012.
Helfter, C., Tremper, A. H., Halios, C. H., Kotthaus, S., Bjorkegren, A., Grimmond, C. S. B., Barlow, J. F., and Nemitz, E.: Spatial and temporal variability of urban fluxes of methane, carbon monoxide and carbon dioxide above London, UK, Atmos. Chem. Phys., 16, 10543–10557, https://doi.org/10.5194/acp-16-10543-2016, 2016.
Hu, W., Qin, K., Lu, F., Li, D., and Cohen, J. B.: Merging TROPOMI and eddy covariance observations to quantify 5-years of daily CH4 emissions over coal-mine dominated region, Int. J. Coal Sci. Technol., 11, 56, https://doi.org/10.1007/s40789-024-00700-1, 2024.
Hurry, J., Risk, D., Lavoie, M., Brooks, B.-G., Phillips, C. L., and Göckede, M.: Atmospheric monitoring and detection of fugitive emissions for Enhanced Oil Recovery, Int. J. Greenh. Gas Con., 45, 1–8, https://doi.org/10.1016/j.ijggc.2015.11.031, 2016.
Kaimal, J. C. and Finnigan, J. J.: Atmospheric boundary layer flows: their structure and measurement, New York: Oxford University Press, https://doi.org/10.1093/oso/9780195062397.001.0001, 1994.
Kaimal, J. C., Wyngaard, J. C., Izumi, Y., and Coté, O. R.: Spectral characteristics of surface-layer turbulence, Quart. J. R. Met. Soc., 98, 563–589, https://doi.org/10.1002/qj.49709841707, 1972.
Kemfert, C., Präger, F., Braunger, I., Hoffart, F. M., and Brauers, H.: The expansion of natural gas infrastructure puts energy transitions at risk, Nature Energy, 7, 582–587, https://doi.org/10.1038/s41560-022-01060-3, 2022.
Kljun, N., Calanca, P., Rotach, M. W., and Schmid, H. P.: A Simple Parameterisation for Flux Footprint Predictions, Boundary-Layer Meteorology, 112, 503–523, https://doi.org/10.1023/b:Boun.0000030653.71031.96, 2004.
Lamb, B. K., McManus, J. B., Shorter, J. H., Kolb, C. E., Mosher, B., Harriss, R. C., Allwine, E., Blaha, D., Howard, T., Guenther, A., Lott, R. A., Siverson, R., Westburg, H., and Zimmerman, P.: Development of atmospheric tracer methods to measure methane emissions from natural gas facilities and urban areas, Environ. Sci. Technol., 29, 1468–1479, https://doi.org/10.1021/es00006a007, 1995.
Lee, X.: Handbook of micrometeorology: A Guide for surface Flux Measurement and Analysis, New York: Klewer Academic Publishers, https://doi.org/10.1007/1-4020-2265-4, 2004.
Li, X., Cohen, J. B., Tiwari, P., Wu, L., Wang, S., He, Q., Yang, H., and Qin, K.: Space-based inversion reveals underestimated carbon monoxide emissions over Shanxi, Commun. Earth Environ., 6, 357, https://doi.org/10.1038/s43247-025-02301-5, 2025.
Liu, H. Z., Feng, J. W., Järvi, L., and Vesala, T.: Four-year (2006–2009) eddy covariance measurements of CO2 flux over an urban area in Beijing, Atmos. Chem. Phys., 12, 7881–7892, https://doi.org/10.5194/acp-12-7881-2012, 2012.
Liu, S., Liu, K., Wang, K., Chen, X., and Wu, K.: Fossil-Fuel and Food Systems Equally Dominate Anthropogenic Methane Emissions in China, Environ. Sci. Technol., 57, 2495–2505, https://doi.org/10.1021/acs.est.2c07933, 2023.
Liu, Z., Liu, Z., Song, T., Gao, W., Wang, Y., Wang, L., Hu, B., Xin, J., and Wang, Y.: Long-term variation in CO2 emissions with implications for the interannual trend in PM2.5 over the last decade in Beijing, China, Environ. Pollut., 266, 115014, https://doi.org/10.1016/j.envpol.2020.115014, 2020.
Lu, F., Qin, K., Cohen, J. B., He, Q., Tiwari, P., Hu, W., Ye, C., Shan, Y., Xu, Q., Wang, S., and Tu, Q.: Surface-observation-constrained high-frequency coal mine methane emissions in Shanxi, China, reveal more emissions than inventories, consistent with satellite inversion, Atmos. Chem. Phys., 25, 5837–5856, https://doi.org/10.5194/acp-25-5837-2025, 2025.
Mauder, M. and Foken, T.: Documentation and Instruction Manual of the Eddy Covariance Software Package TK2, Zenodo [software], https://doi.org/10.5281/zenodo.20349, 2004.
Moncrieff, J. B., Malhi, Y., and Leuning, R.: The propagation of errors in long-term measurements of land–fluxes of carbon and water, Global Change Biology, 2, 231–240, https://doi.org/10.1111/j.1365-2486.1996.tb00075.x, 1996.
Pawlak, W. and Fortuniak, K.: Eddy covariance measurements of the net turbulent methane flux in the city centre – results of 2-year campaign in Łódź, Poland, Atmos. Chem. Phys., 16, 8281–8294, https://doi.org/10.5194/acp-16-8281-2016, 2016.
Pu, W., Sheng, J., Tian, P., Huang, M., Liu, X., Collett Jr., J. L., Li, Z., Zhao, X., He, D., and Dong, F.: On-road mobile mapping of spatial variations and source contributions of ammonia in Beijing, China, Sci. Total Environ., 864, 160869, https://doi.org/10.1016/j.scitotenv.2022.160869, 2023.
Qin, K., Hu, W., He, Q., Lu, F., and Cohen, J. B.: Individual coal mine methane emissions constrained by eddy covariance measurements: low bias and missing sources, Atmos. Chem. Phys., 24, 3009–3028, https://doi.org/10.5194/acp-24-3009-2024, 2024.
Sargent, M. R., Floerchinger, C., McKain, K., Budney, J., Gottlieb, E. W., Hutyra, L. R., Rudek, J., and Wofsy, S. C.: Majority of US urban natural gas emissions unaccounted for in inventories, Proc. Natl. Acad. Sci. U. S. A., 118, e2105804118, https://doi.org/10.1073/pnas.2105804118, 2021.
Schiferl, L. D., Hallward-Driemeier, A., Zhao, Y., Toledo-Crow, R., and Commane, R.: Missing wintertime methane emissions from New York City related to combustion, Atmos. Chem. Phys., 25, 15683–15700, https://doi.org/10.5194/acp-25-15683-2025, 2025.
Seneviratne, S. I., Rogelj, J., Seferian, R., Wartenburger, R., Allen, M. R., Cain, M., Millar, R. J., Ebi, K. L., Ellis, N., Hoegh-Guldberg, O., Payne, A. J., Schleussner, C. F., Tschakert, P., and Warren, R. F.: The many possible climates from the Paris Agreement's aim of 1.5 °C warming, Nature, 558, 41–49, https://doi.org/10.1038/s41586-018-0181-4, 2018.
Shen, L., Jacob, D. J., Gautam, R., Omara, M., Scarpelli, T. R., Lorente, A., Zavala-Araiza, D., Lu, X., Chen, Z., and Lin, J.: National quantifications of methane emissions from fuel exploitation using high resolution inversions of satellite observations, Nat. Commun., 14, 4948, https://doi.org/10.1038/s41467-023-40671-6, 2023.
Sherwin, E. D., Rutherford, J. S., Zhang, Z., Chen, Y., Wetherley, E. B., Yakovlev, P. V., Berman, E. S. F., Jones, B. B., Cusworth, D. H., Thorpe, A. K., Ayasse, A. K., Duren, R. M., and Brandt, A. R.: US oil and gas system emissions from nearly one million aerial site measurements, Nature, 627, 328–334, https://doi.org/10.1038/s41586-024-07117-5, 2024.
Sun, W., Deng, L., Wu, G., Wu, L., Han, P., Miao, Y., and Yao, B.: Atmospheric Monitoring of Methane in Beijing Using a Mobile Observatory, Atmosphere, 10, 554, https://doi.org/10.3390/atmos10090554, 2019.
Vickers, D. and Mahrt, L.: Quality Control and Flux Sampling Problems for Tower and Aircraft Data, J. Atmos. Oceanic Technol., 14, 512–526, https://doi.org/10.1175/1520-0426(1997)014<0512:Qcafsp>2.0.Co;2, 1997.
Wang, P., Zhou, W., Xiong, X., Wu, S., Niu, Z., Cheng, P., Du, H., and Hou, Y.: Stable carbon isotopic characteristics of fossil fuels in China, Sci. Total. Environ., 805, 150240, https://doi.org/10.1016/j.scitotenv.2021.150240, 2022a.
Wang, P., Zhou, W., Xiong, X., Wu, S., Niu, Z., Yu, Y., Liu, J., Feng, T., Cheng, P., Du, H., Lu, X., Chen, N., and Hou, Y.: Source Attribution of Atmospheric CO2 Using 14C and 13C as Tracers in Two Chinese Megacities During Winter, JGR: Atmospheres, 127, e2022JD036504, https://doi.org/10.1029/2022jd036504, 2022b.
Wang, Y., Guo, C. H., Chen, X. J., Jia, L. Q., Guo, X. N., Chen, R. S., and Wang, H. D.: Global climate governance strategies and prospects for China's carbon neutrality path. Forecasting And Prospects Research Report, https://ceep.bit.edu.cn/docs/2021-01/0d8cba76b1fc4ec3943194d8fa0104eb.pdf (last access: 12 December 2024), 2021.
Webb, E. K., Pearman, G. I., and Leuning, R.: Correction of flux measurements for density effects due to heat and water vapour transfer, Q. J. R. Meteorolog. Soc., 106, 85–100, https://doi.org/10.1002/qj.49710644707, 2007.
Weller, Z. D., Roscioli, J. R., Daube, W. C., Lamb, B. K., Ferrara, T. W., Brewer, P. E., and von Fischer, J. C.: Vehicle-Based Methane Surveys for Finding Natural Gas Leaks and Estimating Their Size: Validation and Uncertainty, Environ. Sci. Technol., 52, 11922–11930, https://doi.org/10.1021/acs.est.8b03135, 2018.
Weller, Z. D., Yang, D. K., and von Fischer, J. C.: An open source algorithm to detect natural gas leaks from mobile methane survey data, PLoS One, 14, e0212287, https://doi.org/10.1371/journal.pone.0212287, 2019.
Wunch, D., Toon, G. C., Hedelius, J. K., Vizenor, N., Roehl, C. M., Saad, K. M., Blavier, J.-F. L., Blake, D. R., and Wennberg, P. O.: Quantifying the loss of processed natural gas within California's South Coast Air Basin using long-term measurements of ethane and methane, Atmos. Chem. Phys., 16, 14091–14105, https://doi.org/10.5194/acp-16-14091-2016, 2016.
Zheng, B., Cohen, J. B., Lu, L., Hu, W., Tiwari, P., Lolli, S., Garzelli, A., Su, H., and Qin, K.: How can we trust TROPOMI based Methane Emissions Estimation: Calculating Emissions over Unidentified Source Regions, EGUsphere [preprint], https://doi.org/10.5194/egusphere-2025-1446, 2025.
Zöll, U., Brümmer, C., Schrader, F., Ammann, C., Ibrom, A., Flechard, C. R., Nelson, D. D., Zahniser, M., and Kutsch, W. L.: Surface–atmosphere exchange of ammonia over peatland using QCL-based eddy-covariance measurements and inferential modeling, Atmos. Chem. Phys., 16, 11283–11299, https://doi.org/10.5194/acp-16-11283-2016, 2016.