
the Creative Commons Attribution 4.0 License.
the Creative Commons Attribution 4.0 License.
 | 25 Sep 2026
Climate impact of contrail cirrus from hydrogen combustion aircraft
Susanne M. Pettersson

Christian Azar
Daniel J. A. Johansson
One possibility for reducing the climate impact of aviation is to transition to aircraft powered by hydrogen combustion. Hydrogen combustion leads to zero CO2 exhaust emissions and represents a potential major step toward reduced climate impact, although the non-CO2 effects (primarily contrail cirrus) remain uncertain. In this study, we simulate the climate impact, in terms of energy forcing, of contrail cirrus from hydrogen combustion aviation, using a modified version of the Contrail Cirrus Prediction model (CoCiP).
With no soot in the exhaust, contrail ice particles mainly form on ambient aerosols entrained into the plume and on lubrication oil droplets in the exhaust. The formation of ice particles is modelled using an emulator developed from a theoretically based microphysical contrail formation model.
Following the Schmidt-Appleman criterion, hydrogen combustion enables contrail formation at lower altitudes and higher temperatures than fossil jet fuel. However, we find a significant reduction in contrail energy forcing. This result holds across a wide range of assumptions, with a global average reduction of about 66 % using our base case assumptions on ambient aerosols, lubrication oil properties, droplet size distribution, emission index and energy efficiency of hydrogen aircraft. We conclude that hydrogen aircraft not only eliminate CO2 emissions in the exhaust, but may also reduce the climate impact of contrail cirrus, depending on engine design for lubrication oil handling. However, we acknowledge that the modelling approach has limitations and uncertainties. Before firm conclusions can be drawn about the contrail cirrus effects of hydrogen-combustion aircraft, further studies are needed. These should include more realistic hydrogen aircraft models, alternative meteorological and microphysical models, and analyses of real-world flight patterns. In particular, measurements of lubrication-oil emissions from hydrogen aircraft under cruise conditions, as well as measurements of ice crystal number concentrations in hydrogen-aircraft contrails, would be valuable for constraining the present analysis.
- Article
(3682 KB) - Full-text XML
-
Supplement
(9094 KB) - BibTeX
- EndNote


Contrails are artificially induced ice clouds that can form behind aircraft (Schumann, 1996). They are initially line-shaped but under certain conditions, when the ambient air is humid enough, they can persist and evolve into more naturally shaped clouds. Such contrails are referred to as contrail cirrus. As clouds, contrail cirrus affect the earth's radiative balance by reflecting incoming sunlight and trapping outgoing infrared radiation (Yang et al., 2010). Depending on a range of factors, such as the time of day, prevalence of natural clouds and surface albedo, contrail cirrus can act as either net cooling or net warming. Estimates of the effective radiative forcing of global aviation show that the warming effect dominates (Lee et al., 2021). Although contrail cirrus are short-lived (hours, maybe a day), their current contribution to the overall effective radiative forcing (ERF) of aviation is estimated to be a little over half of the total aviation ERF, albeit with a large uncertainty (Lee et al., 2021). For that reason, it is important to map out possible routes for contrail mitigation. Rerouting flights around contrail-forming regions (Kölker et al., 2024; Rosenow and Fricke, 2018), improved engines and the strategic usage of low aromatic fuels (Teoh et al., 2022b; Quante et al., 2024) have been suggested as possible options.
The magnitude of the radiative forcing (RF) from contrail cirrus depends on the properties of the contrail cirrus. In addition to the factors mentioned above, a higher density of ice particles increases the contrail lifetime and optical depth (Lewellen et al., 2014; Kärcher, 2016). In turn, the density of ice particles depends on the number and properties of the particles present when the contrail is formed (Kärcher, 2016; Yu et al., 2024). Reducing the number of particles in the exhaust is suggested as a contrail cirrus mitigation strategy in itself. However, it also comes as a co-benefit of transitioning to hydrogen-fuelled aircraft. Hence, hydrogen combustion, besides having no exhaust CO2 emissions, might also be beneficial because of its decreased number of exhaust particles. One hypothesis is that the lack of soot and other fossil-jet-fuel-related particles in the exhaust of hydrogen aircraft will reduce the number of formed ice particles and consequently reduce the need for other contrail mitigation measures such as flight rerouting (which causes extra fuel use).
On the other hand, hydrogen combustion is still expected to lead to some production of ice particles and contrail formation since ambient aerosols, NOx and lubrication oil droplets can act as condensation nuclei. Furthermore, the higher water vapour emissions from hydrogen combustion, relative to kerosene on a per-unit-energy basis, increase both the likelihood of particle activation as condensation nuclei and the likelihood that the Schmidt-Appleman criterion is satisfied. The latter implies that contrails may form over a larger area for hydrogen than for kerosene. Together, these effects may increase both the occurrence and energy forcing of contrail cirrus (Schumann, 1996). No results of campaigns to measure the contrail cirrus of hydrogen-fuelled aircraft have been published yet (DLR, 2025). However, several measurement campaigns testing blends of conventional jet and sustainable aviation fuels (SAFs) at different ratios have found a reduced number of ice particles following a reduction in soot particles (due to reduced aromatics in the fuel) (Voigt et al., 2021; Moore et al., 2017; Durdina et al., 2021; Zhang et al., 2022). At soot emissions even lower than those measured in these campaigns (of the order of <1013(kg fuel)−1), ice particle number concentrations may increase at low temperatures due to the activation of other ultrafine particles in the exhaust (Kärcher and Yu, 2009; Yu et al., 2024). These may include volatile particles with approximate radii of <5 nm, consisting of condensable sulfur species and organic species formed primarily on chemi-ions, as well as homogeneously formed organic species such as lubrication oil (Yu and Turco, 1997; Yu et al., 1999; Kärcher et al., 2000; Voigt et al., 2026).
A simulation study of contrail formation for aircraft powered by hydrogen combustion showed that under most circumstances, the absence of soot and other fossil-jet-fuel-related particles significantly reduces the number of ice particles formed in a three-second-old plume compared to aircraft powered by fossil jet fuel (Bier et al., 2024). The conditions under which this does not hold are when ambient temperatures are high, near the critical threshold of contrail formation for fossil jet fuel, or even higher where only contrails from hydrogen aircraft can form. This simulation study only covers ice particle formation on ambient aerosols. However, it has been recognised that lubrication oil in the exhaust of hydrogen aircraft might contribute to ice particle formation in the absence of soot and other fossil-jet-fuel-related particles (Bier et al., 2024; Yu et al., 2024). Soot does not readily act as a condensation nucleus for water droplets. Lubrication oil droplets are even less likely to do so, but may, nevertheless, act as condensation nuclei under suitable conditions (Ponsonby et al., 2024; Lambe et al., 2011). When compared to the available water vapour in fossil jet fuel exhaust, the additional water vapour in the hydrogen exhaust will increase the chance of lubrication oil aerosols acting as condensation nuclei. The number of ice particles formed on ambient aerosols and lubrication oil in hydrogen combustion has been investigated in one previous study (Zink et al., 2025). Under certain conditions, such as a high oil emission index and small oil droplets, hydrogen combustion was found to produce more ice particles than kerosene combustion, regardless of whether lubrication oil was included in the kerosene case. This demonstrates the potential importance of lubrication oil in contrail formation.
The role of lubrication oil and ambient aerosols as ice nuclei is uncertain. All published studies reporting measurements of lubrication oil in aircraft exhaust have been conducted on conventional, fossil-jet-fuel-powered aircraft. Major uncertainties stem from the fact that lubrication oil can either be vented outside the main exhaust stream or be emitted or leaked out in the exhaust at high temperatures. This leads to large differences in aerosol oil size distributions, as oil is a volatile substance. In addition to uncertainties in size distribution, the degree of readiness of lubrication oil to act as condensation nuclei is uncertain (Lambe et al., 2011). Further, there are major uncertainties regarding the amount of lubrication oil emitted, depending on such things as oil and engine types (Yu et al., 2010; Timko et al., 2014; Decker et al., 2024).
The term “ambient aerosols” covers all types of particles suspended in the atmosphere. Consequently, there is a considerable range of particle types, sizes and properties included among ambient aerosols, leading to major variability and uncertainties in their characterisation (Raes et al., 2000; Clarke and Kapustin, 2002; Minikin et al., 2003), which has also been emphasised in the modelling of ambient aerosols in climate models (Stier et al., 2005; Kaiser et al., 2019).
The aim of this study is to simulate the contrail cirrus climate impact of hydrogen combustion for a large set of plausible assumptions. In particular, the focus is on the contribution of lubrication oil emissions to contrail energy forcing (EF). We estimate ice particle numbers generated with ambient aerosols and lubrication oil as condensation nuclei. We then use this to simulate contrail cirrus formation and evolution on relevant flight levels on a global grid under realistic meteorological conditions and estimate their energy forcing. We also estimate contrail formation and EF from conventional fossil jet fuel aviation so as to enable a comparison between the two. Thus, we may give an indication of plausible contrail cirrus climate effects for hydrogen aircraft relative to that for prevailing fossil jet fuel aircraft. In addition, we may contribute insights to guide the future development of hydrogen engines to avoid designs that may lead to major contrail cirrus climate impacts.
To investigate contrail cirrus formation, plus the evolution and energy forcing from hydrogen aircraft, we use the Contrail Cirrus Prediction model (CoCiP) (Schumann, 2012), as implemented in pycontrails (Shapiro et al., 2023). CoCiP models ice particle formation solely on soot emissions (or defaults to 1013(kg fuel)−1, as a way of accounting for background ambient aerosols if the soot emissions given are lower). We modify the functions of CoCiP covering ice particle activation to explicitly include ice particles formed on lubrication oil and ambient aerosols. Given atmospheric conditions, oil emission index and oil properties, we use activation emulators developed in the paper to estimate the number of formed ice particles. These emulators are based on the theoretical model developed by Kärcher et al. (2015) and used to determine the amount of lubrication oil and ambient aerosols activated to form ice particles. This model was originally formulated for soot and ambient aerosols but offers an approach that extends to other types of particles, provided their characteristics are given. The number of ice particles obtained from the emulators initiates the contrail cirrus simulation in CoCiP which is subsequently used to estimate energy forcing.
The Schmidt-Appleman criterion (SAC), a thermodynamic criterion for contrail formation named after its creators, dates back to the 1940s (Schumann, 1996). It depends on both ambient conditions and fuel exhaust properties. As such, the criterion requires the cooling plume to become supersaturated with respect to water at some point. This supersaturation enables the formation of water droplets, which may subsequently freeze to form the contrail. The so-called mixing line of an exhaust plume, tracing its temperature (T) and partial water vapour pressure (pw) over time, can be approximated as linear in T-pw space (excluding a brief non-linear phase directly after exit) (Schumann, 1996). The slope of this mixing line is given by:
where cp is the isobaric specific heat of air, EI is the mass emission index of water vapour, pa the ambient air pressure, η the overall propulsion efficiency, Q the specific heat of the fuel and 0.622 is the ratio between the molar masses of water and air. The ambient temperature at which the mixing line is tangential to the saturation curve with respect to water (saturation water vapour pressure curve) fulfils the SAC. Any lower ambient temperature will lead to the mixing line crossing the saturation curve and a period of supersaturation in the plume, while for higher ambient temperatures, no supersaturation with respect to water will be reached. In general, the steeper the slope G of the mixing line, the higher the supersaturation in the plume for the same ambient conditions and the more water available to form droplets. The mass emission index of water vapour and the specific heat of the fuel have a large influence on G, as can be seen from Eq. (1). For Jet-A fuel we have EI kg (kg fuel)−1 and QJ=43.2 MJ (kg fuel)−1 compared to EI kg (kg fuel)−1 and Q MJ (kg fuel)−1 for hydrogen. Everything else being equal, this gives a slope for hydrogen that is approximately 2.6 times steeper than for standard Jet-A fuel. In addition to larger supersaturations in the plume at the same ambient temperatures, the steeper slope for hydrogen as fuel enables contrail formation at higher ambient temperatures, approximately 10 K above conventional Jet-A fuel (Schumann, 1996).
The Schmidt-Appleman criterion predicts quite accurately when contrails can form, but for a formed contrail to become persistent, the ambient air needs to be supersaturated with respect to ice. If both these criteria are fulfilled, a contrail can form, persist and potentially evolve into a contrail cirrus. Also, the properties of the contrail cirrus depend on the number and type of particles present for activation into water droplets. If a larger number of particles is present, a larger number of droplets can form. The number of water droplets will also depend on the readiness of the present particles to act as condensation nuclei, that is, their hygroscopicity and size distribution. The hygroscopicity of substances can be roughly captured using a single parameter κ and for ambient particles, this lies in the range κ=0.1–0.9 (Petters and Kreidenweis, 2007). The higher the κ of a substance, the lower the supersaturation required for it to act as condensation nuclei for water droplets. The particle size can affect its ability to act as condensation nuclei for water droplets. The smaller the initial particles, the higher the supersaturation required for them to act as condensation nuclei for water droplets. Supersaturation s is the water saturation ratio S minus one, . The κ-Köhler equation gives the water saturation ratio for the equilibrium wet diameter D for a particle/solution of dry diameter Dd:
where is the surface tension of solution/air interface, ρw the density of water, Mw the molecular weight of water, R the universal gas constant and T the temperature. The exponential part of Eq. (2) instantiates the Kelvin effect, which describes how the saturation water vapour pressure increases over a curved surface. As can be seen, the exponential part approaches infinity as the wet diameter approaches zero (curvature increases). This is because the more curved a surface is, the less energy is needed for a water molecule to evaporate and therefore the equilibrium saturation water vapour pressure is increased. The maximum of the κ-Köhler curve gives the critical saturation ratio Sc, that is, the minimum saturation ratio needed for a particle with a certain dry diameter and κ to grow indefinitely as theorised (and yet limited in reality by the atmospheric water budget) or, as an equivalent, the minimum dry diameter needed at a certain saturation ratio. The minimum dry diameter/radius is referred to as the activation diameter/radius ract. Particles with r>ract in an environment with S>Sc are said to be activated. Because of the Kelvin effect, the critical saturation ratio for small particles is increased. As seen in Eq. (2), a small κ does also increase the critical saturation ratio for a given dry radius.
For our investigation into contrail formation and energy forcing consequences of hydrogen aircraft, we combine two models. We use the theoretical model suggested by Kärcher et al. (2015) to approximate the number of ice particles formed in the exhaust under various conditions (subsequently referred to as K15) but modify it to account for particles with low hygroscopicities (subsequently referred to as modified K15) using the κ-Köhler model (Petters and Kreidenweis, 2007). The number of ice particles predicted is subsequently used as input for CoCiP (Schumann, 2012), in its gridded formulation as implemented in the pycontrails repository (v0.54.1) (Engberg et al., 2025) (and henceforth referred to as simply CoCiP) to simulate contrail lifetime and its radiative impacts.
3.1 Theoretical model for ice particle formation, κ-Köhler theory and activation emulators
3.1.1 Particle activation – model overview
The K15 model is a tractable model that considers the microphysical pathway to contrail formation during the first few seconds after exhaust. Among other things, the model calculates the number of ice particles that form from exhaust and entrained particles under given ambient conditions, engine characteristics, particle properties, emission numbers and ambient concentrations. The relationship between particle size, hygroscopicity, saturation ratio and activation in K15 is given by an approximation derived from the κ-Köhler equation given in Eq. (2) (Petters and Kreidenweis, 2007). The K15 model approximates the number of water droplets formed by equating the possible number of droplets that can form at a certain supersaturation along the mixing line (Eq. 37 in Kärcher et al., 2015) with the number of these particles needed to deplete the supersaturation at the point when the production rate of supersaturation equals the loss of supersaturation due to condensation (Eq. 51 in Kärcher et al., 2015). At the time when these two calculations of droplet particle numbers are equal, the particles are said to “quench” the supersaturation of the plume and no more particles can be activated into water droplets. The plume might still be supersaturated with respect to water after quenching, although not enough to activate the remaining unactivated particles. With the remaining supersaturation, the formed droplets can continue to grow by condensation until the supersaturation is depleted or the plume reaches the freezing temperature estimated by K15 (Eq. 36 in Kärcher et al., 2015), at which point droplets freeze into ice particles. Thus if freezing occurs, the number of ice particles formed is equal to the number of water droplets at quenching.
A crucial difference between the model and actual formation of water droplets from plume aerosols is that, in reality, droplets would form continuously and successively deplete the supersaturation. This would lead to a decreasing ability to activate particles with low hygroscopicity and/or small radii. The model may therefore overestimate the activation of small and/or low-hygroscopicity particles, since all particles activate instantaneously at quench. K15 may also overestimate the activation of low hygroscopicity and/or small particles due to the lack of competition for water between plume particles in the model. Lower levels of supersaturation would otherwise suppress the activation of lower hygroscopicity and/or smaller particles in favour of large, high-hygroscopicity particles (Lewellen, 2020). Another limitation of the K15 model comes from the absence of the Kelvin effect in the formulation of the loss of supersaturation due to condensation (condensation sink Lw in Kärcher et al., 2015). This makes it possible for smaller numbers of activated particles to quench the plume, as outlined in Ponsonby et al. (2025). This, in turn, leads to short quench-times and lower maximum supersaturations being reached in the plume, compared to more resolved models. This likely results in underestimations of the number of ice particles formed from small and/or low-hygroscopicity particles. Hence, the K15 and modified K15 models have certain limitations of which the reader should be aware.
3.1.2 Homogeneous droplet nucleation and NOx assisted nucleation
Homogeneous droplet nucleation (HDN) is a potential pathway to the formation of water droplets in the absence of aerosols (condensation nuclei). This pathway requires high levels of supersaturation to become active. The relatively high degree of water supersaturation in the exhaust of hydrogen-powered aircraft is expected to increase the likelihood of this formation pathway. This was investigated in Zink et al. (2026) and based on activation rate regions in Ta–pa space where HDN could have an impact. The greatest impact occurred when ambient aerosol concentrations were low (1 cm−3) or zero. However, even in these cases, HDN was either ruled out as a relevant contributor to ice crystal formation or its contribution could not be resolved, depending on the Ta–pa conditions considered. We have omitted HDN in our analysis, as its impact is likely insignificant for medium-to-high ambient aerosol concentrations.
NOx emissions from hydrogen combustion may provide additional pathways affecting contrail particle formation. In particular, particle formation could be influenced either by the formation of nitrate-containing ion clusters or by modification of lubrication-oil-derived droplets through uptake of HNO3 (nitric acid) (Fritz et al., 2020; Zink et al., 2025). In soot-free conditions, the latter may be the more plausible pathway, since nitric acid is expected to be rapidly taken up by existing aerosol and contrail particles, whereas the former has not been shown to generate a substantial particle population on its own (Voigt et al., 2010; Wang et al., 2020). Because these effects remain highly uncertain, we do not include them explicitly.
3.1.3 Activation of lubrication oil particles – approximations
The hygroscopicity of lubrication oil is known to be low. One study shows it to be consistent with κo=0 for droplets of lognormal size distribution and a geometric mean radius of 50 nm (Ponsonby et al., 2024). Another study estimated an upper limit for lubrication oil as (Lambe et al., 2011). We have modified the approximate expression of the critical supersaturation (maximum of Eq. 2) and activation radius used in K15, to account for the low hygroscopicity of lubrication oil. The approximate expression is:
where s is the supersaturation, S the water saturation ratio and rk is the Kelvin radius. The Kelvin radius is set to 1 nm in K15 but equal to in Petters and Kreidenweis (2007) and in our study. This approximation of the correlation between the critical supersaturation and activation radius is good for κ>0.2 and large, dry radii but deteriorates for substances with smaller κ and dry radii of approximately <10 nm (Petters and Kreidenweis, 2007; Ponsonby et al., 2025). Our correction to Eq. (3) relies on a parametrisation based on a minimisation of the error between Eq. (3) and the critical saturation ratio maximum from Eq. (2) for small κ-values and all dry radii. More details can be found in Supplement S2. The updated equation for the activation radius is:
where α0≈1.2 and α1≈0.19. We have calibrated the update such that for κ=0.5. For κ>0.5, no change is needed since Eq. (3) is valid. We refer to the K15 model with this update as the “modified K15 model”.
The K15 model can incorporate any number of particle types with lognormal size distributions and varying hygroscopicities from either exhaust or the ambient atmosphere. If multiple particle types are present in the plume, the quench time is calculated using weighted averages of the activation radii, ract and slope parameters of the respective particle types (see Supplement S3). The effective averages are calculated as droplet-number-weighted averages of the different activated particle types. Thus, the model uses averages to obtain the quench time but also keeps track of the number of each particle type that are activated into water droplets. The latter is calculated using an estimated activation fraction for each particle type (ϕl in K15 Eqs. 37 and 40) multiplied by the respective number of particles or concentration of each type in the plume. For implementation in CoCiP, our new ice particle number module requires the number of droplets activated by each particle type at the moment of quenching. Thus, we created emulators (or fitted functions) for the activation fractions at quench that we use in CoCiP. This is done in our updated version of CoCiP, since the K15 model does not supply a closed expression for the number of ice particles formed but estimates it based on the equality of the two expressions of activated droplets mentioned above (Eqs. 37 and 51 in K15). The solution to the equality may be found using numerical methods. Finding the solution to this equality for every gridpoint and flight level in CoCiP would be too time-consuming for a global level analysis.
3.1.4 Emulators for lubrication oil and aerosol activation
The uncertainty and variability in the lubrication oil particle size distributions are large because different engines release lubrication oil differently. It may be either vented or leaked, within or alongside the exhaust. Lubrication oil ending up in the exhaust is heated and vaporised and needs time to form droplets. The temperature and time affects the particle size distribution characteristics. Most larger oil droplets emitted through oil venting are captured for reuse. Based on experiments on aircraft engines at idle, the remaining vented droplets were estimated to have a volumetric mean radius of 125–175 nm (Yu et al., 2010). A measuring campaign around Narita Airport in Japan reported smaller size distributions of radii <15 nm (Fushimi et al., 2019). Experiments using lubrication oil heated to two different temperatures and measured at room temperature show mean diameters of approximately 10 and 27 nm for temperatures of 300 and 20° C respectively (Ungeheuer et al., 2022). The probability function of a lognormal size distribution is given by , with total number N, geometric mean radius μo and geometric width σo. To account for variability in the size distribution, the lubrication oil activation emulator includes μo and σo as input variables. It also includes variables describing the ambient conditions, namely ambient temperature Ta, relative humidity rh, atmospheric pressure pa and the critical saturation temperature Tc derived from the SAC. Hygroscopicity, measured by κ, was not included as a variable in the emulator, to limit the functional complexity. However, the functional form of the emulator can be made to fit different κ values. More details of our method can be found in Supplement S3.1.
Likewise, ambient aerosols show considerable variability in size, concentration and hygroscopicity. Reported particle radii range from 5 nm to 2 µm and number concentrations range from 6 to 15 000 cm−3, depending on particle size and hemisphere. Concentrations are typically higher for smaller particles and are generally greater in the Northern Hemisphere (Raes et al., 2000; Clarke and Kapustin, 2002; Minikin et al., 2003; Borrmann et al., 2010). Reported hygroscopicity values range from 0.1 to 0.4 (Liu et al., 2014; Padró et al., 2010). To keep the emulator dimension manageable and given that the role of ambient aerosols in ice crystal formation in hydrogen contrails has previously been examined to some extent (Bier et al., 2024), we focus on uncertainties and variability in lubrication oil properties and emissions. Therefore, following previous studies (Kärcher et al., 2015; Bier et al., 2024), the substantial variability in ambient aerosols is represented by a single particle type with a representative size distribution, concentration and hygroscopicity. A more comprehensive treatment is left to future work.
The respective activation functions for lubrication oils and ambient aerosols emulate the fraction of activated lubrication oil droplets and the level of entrainment and activation of ambient aerosols at quench obtained by the modified K15 model when both lubrication oil and ambient aerosols are included. In the model, mixing between exhaust and ambient air is not instantaneous. As a result, the concentration of ambient aerosols within the plume does not immediately reach the ambient background value and may still be lower than that of the surrounding air at the time of quench. The emulator for activated ambient aerosols at quench therefore accounts for both the difference between plume and ambient aerosol concentrations and for the fraction of the plume ambient aerosol concentration that becomes activated. Figure 1 shows examples of outputs from the modified K15 and both our emulators. This covers different lognormal size distributions of lubrication oil at an atmospheric relative humidity of 60 % and for varying ambient temperatures. For lubrication oil (presented in the two left-hand columns), the largest deviations between the emulator and the modified K15 model are found for a geometric mean radius of 5 nm, combined with the smallest and largest geometric widths (1.28 and 2.72) respectively. The two right-hand columns show ambient aerosol entrainment and activation. Across all ambient aerosol cases, lower values are obtained at lower temperatures because supersaturation increases more rapidly in the plume, which shortens the quench time. The shorter quench time reduces the time available for entrainment of ambient aerosols, thus yielding lower ambient aerosol concentrations in the plume at quench than in the surrounding air. More details can be found in Supplement S3.2.
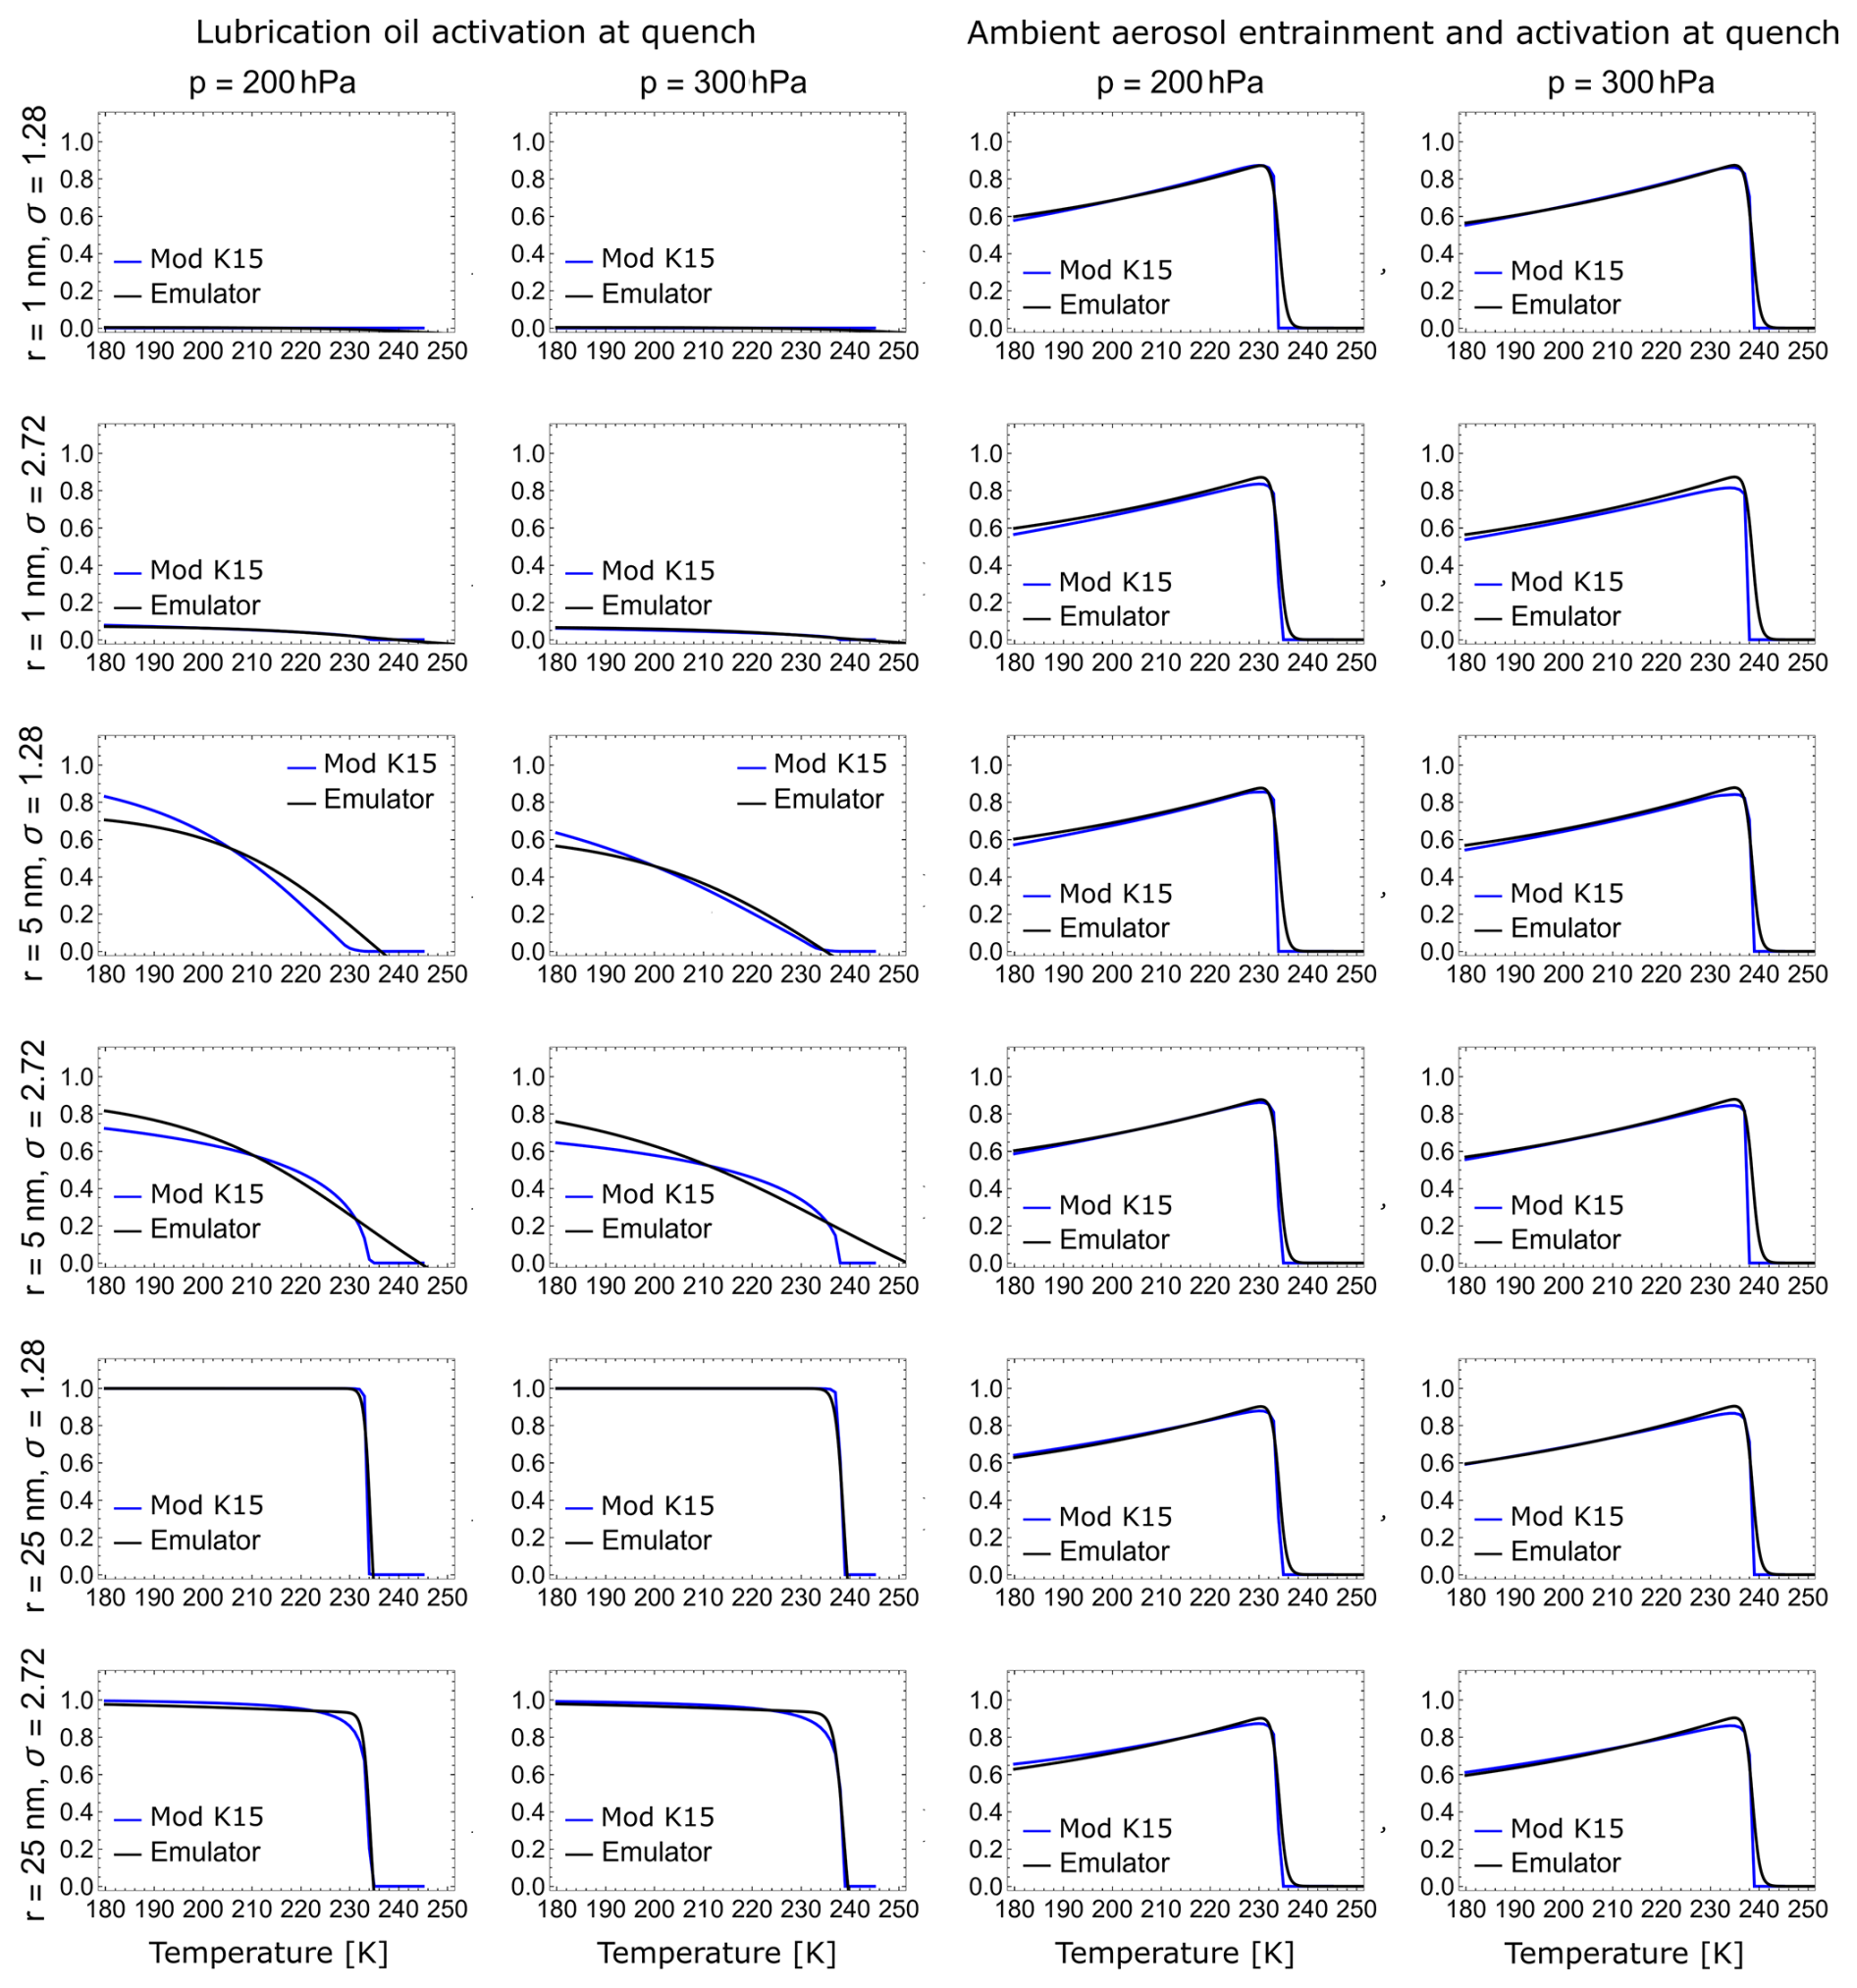
Figure 1The figure shows the share of particles activated into ice crystals using our emulators, as compared to the modified K15 model. This is done for both lubrication oil (the two left-hand columns) and ambient aerosols (the two right-hand columns). All results were obtained with an atmospheric relative humidity of 60 % and for different assumptions on lubrication oil size distributions (rows) and atmospheric pressure (columns). For lubrication oil, the lower activation due to the Kelvin effect for small particles (geometric mean radius μo=1 nm and μo=5 nm) is clearly seen in the top four rows.
In Supplement S6, we show the deviation of output from CoCiP when using the emulator to compare results as opposed to using the modified K15 model implemented directly in CoCiP. Using the emulator resulted in differences in mean energy forcing per flight meter of <11 % for all lubrication oil size distributions tested (except one outlier), with generally smaller deviations for larger radii. The outlier corresponded to a geometric mean radius of 3 nm and a geometric width of 1.28, and yielded a mean energy forcing per flight meter 22 % lower than that obtained using the modified K15 model directly.
3.1.5 Base case implementation parameter values
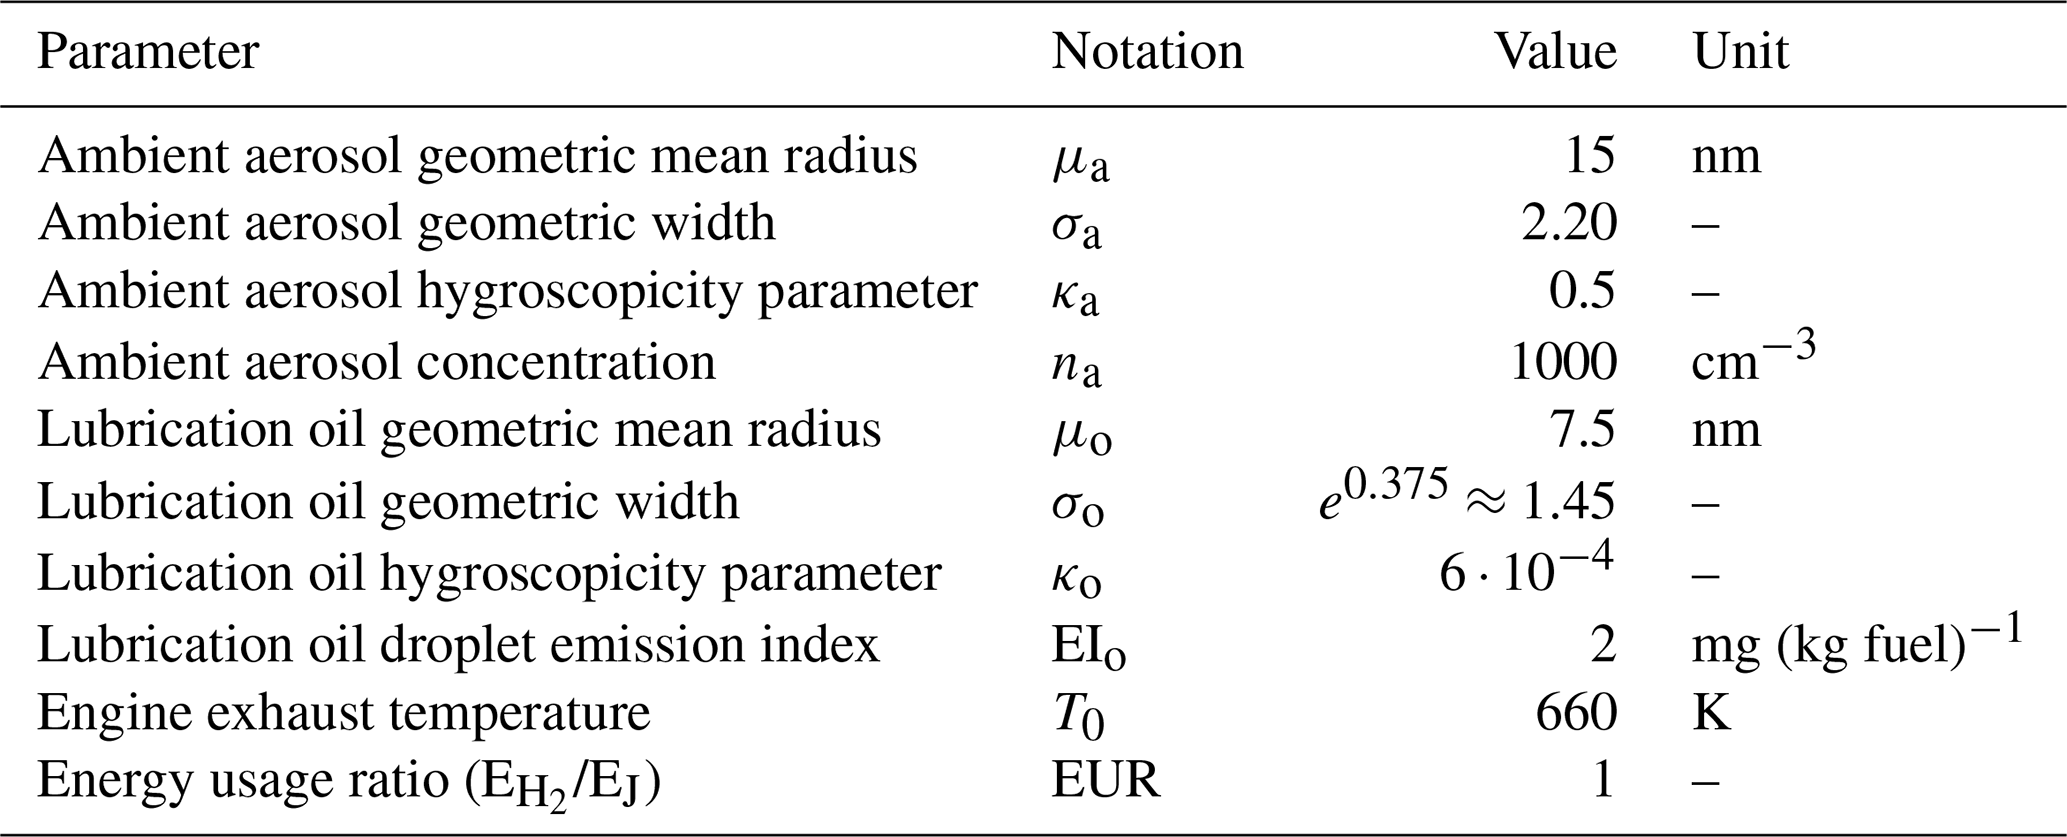
The emulators are based on the modified K15 model. In our base-case setting, lubrication oil characteristics are represented by a lognormal size distribution, with geometric mean radius μo=7.5 nm and geometric width . This is consistent with reported measurements, in which the oil was heated to 573 K and subsequently allowed to nucleate into droplets (Ungeheuer et al., 2022). This size distribution for our base case is therefore on a par with the oil being ejected into the main exhaust (we assume T0=660 K). In the base case, the lubrication oil hygroscopicity is set to , which is found as a maximum for lubrication oil (Lambe et al., 2011). The base case lubrication oil droplet mass emission index is set to EIo=2 mg (kg fuel)−1, based on two studies of kerosene engines. The first study indicates a power-related increase in the oil emission index and an emission index range of 2–12 mg (kg fuel)−1 (Yu et al., 2010). The second study found rather little dependence on power. The emission indices were in the range of 0.5–2 mg (kg fuel)−1, with one outlier engine at 40 mg (kg fuel)−1 and highly dependent on the type of engine and lubrication oil (Timko et al., 2014). Both studies measured droplets of lubrication oil, without accounting for the possibility that a fraction of the emitted oil could have remained in the vapour phase. A third study instead estimated the oil emission index based on the amount of oil used by the engine and obtained a much higher estimate of 110 mg (kg fuel)−1 (Decker et al., 2024). Our lubrication oil emission indices are based on measured droplet emission indices and we therefore assume that all the oil mass in our study is in the form of droplets which can act as condensation nuclei. Since no values for hydrogen combustion were found in the literature, we use measured kerosene combustion values as bases for our oil emission index for hydrogen combustion. We use kerosene values even though differences in, say, specific heat might actually give different values per meter. To test the model sensitivity to this assumption, we conducted a sensitivity analysis. In this analysis, we use the value EIo=20 mg (kg fuel)−1 which is large, but not larger than the outlier in one of the studies mentioned (Timko et al., 2014).
For the lognormal size distribution of the ambient aerosols, we set the geometric mean radius to μa=15 nm and geometric width to σa=2.2, to cover a broad range of particle sizes. The hygroscopicity value is set to κa=0.5 and the ambient concentration to na=1000 cm−3, in line with the literature for similar models (Kärcher et al., 2015; Bier et al., 2024; Yu et al., 2024).
It should be noted that we are using the emulator of the modified K15 model under conditions (small particle sizes and low hygroscopicity for lubrication oil) which may lead the model (and consequently our emulator) to underestimate the number of activated particles due to the condensation sink formulated without the Kelvin effect. Hence, the number of ice particles formed from lubrication oil will likely be underestimated, especially for size distributions with small geometric mean radii and small geometric width values (Ponsonby et al., 2025).
In cases when we simulate contrail formation for fossil jet fuel, we do not use an emulator of the modified K15 for the activation, we use the standard approach in CoCiP. However, for fossil jet fuel combustion, using an emulator of the modified K15 model to represent soot and ambient aerosol activation would have yielded almost identical particle activation to that predicted by CoCiP's existing soot activation function. A comparison of the modified K15 model implemented directly in CoCiP with CoCiP’s native soot activation function is shown in Supplement S6.
3.2 Contrail Cirrus Prediction model
For CoCiP in the gridded mode, the model output is based on a test flight of 1 km in the middle of each grid cell. For the simulation and contrail cirrus calculations, CoCiP incorporates meteorological data and flight performance parameters.
CoCiP uses a monodisperse particle size distribution for ice particles once formed. The ice particles obtained in the activation calculation stage share the water content of the plume equally. The properties of the plume, such as the sedimentation rate, are calculated using an effective mean ice particle volumetric radius (Schumann, 2012). The optical depth and radiative forcing are calculated using an assumption of different habits (shapes) of ice particles, in which the mixture depends on the effective volumetric radius and evolution of the plume (Schumann et al., 2011, 2012).
When running CoCiP in gridded mode, a model aircraft is chosen for which we use the aircraft with ICAO aircraft designator B737. This is the default in CoCiP grid and is one of the most common aircraft families (B73X). We use the aircraft performance model available in pycontrails, the Poll-Schumann model. This model will generate soot emissions for jet fuel propulsion, on the order of 1015(kg fuel)−1.
For meteorological input, we use the high resolution (HRES) ERA5 reanalysis data provided by the European Centre for Medium-Range Weather Forecasts (ECMWF) for 2019 (Hersbach et al., 2020). The HRES ERA5 data has a latitude/longitude resolution of 0.25°×0.25° and pressure levels between 1–1000 hPa. We have used either a range of flight levels of 100–600 hPa or the most common flight levels 200–300 hPa for different investigations. Studies have highlighted the fact that ERA5 RHi tends to underestimate high supersaturations compared to actual measurements (Gierens et al., 2020; Rädel and Shine, 2010; Reutter et al., 2020). When running CoCiP we therefore use one of the humidity scalings included in the pycontrails package (Teoh et al., 2022a).
When we run CoCiP with an aircraft powered by hydrogen combustion, we use our emulators for lubrication oil activation Ao and ambient aerosol entrainment plus activation EAa. We obtain the ice particle number per meter after downwash Nice for lubrication oil and ambient aerosols according to:
where ff (kg s−1) is the fuel flow, vtas (m s−1) the true airspeed, EIn,o ((kg fuel)−1) the lubrication oil droplet number emission index, na (m−3) the ambient aerosol concentration, Aplume (m2) the cross-sectional area of the plume at quench, nengine the number of engines of the aircraft and fsurv CoCiP's survival fraction after the vortex downwash. More details can be found in Supplement S4.
3.2.1 Hydrogen aircraft model
We do not model a hydrogen aircraft explicitly. Rather, we use the same B737 aircraft performance output such as true airspeed and aircraft weight as for fossil jet fuel but make adjustments to the energy usage for the same aircraft performance. Most conceptual models and prototypes of hydrogen aircraft use cryo-compressed liquid hydrogen which leads to fuel systems of higher complexity and larger tank volumes than for fossil jet fuel. This generally leads to a lower fuel weight to fuel-plus-fuel-system weight ratio and increased drag compared to fossil jet fuel aircraft. This, in turn, may increase both the power and energy needed for the same flight patterns as fossil jet fuel flights, despite the higher energy content per unit mass of hydrogen.
We consider two alternative assumptions for the energy use of hydrogen aircraft. One is relatively pessimistic and assumes an energy usage ratio of EUR =1.6, meaning that a hydrogen aircraft requires 1.6 times as much energy as a fossil-jet-fuel aircraft. This is consistent with hydrogen aircraft fuel-system assumptions in the literature (Adler and Martins, 2023), although reported EUR values vary even under similar technical assumptions; for example, Mukhopadhaya and Rutherford (2022) assumed approximately EUR =1.2 for a mid-range hydrogen aircraft. The other, which we adopt as our base case, assumes an energy usage ratio of EUR =1, corresponding to the default energy use for hydrogen fuel in CoCiP. We anticipate that an actual hydrogen aircraft will fall somewhere between these energy usage boundaries. We leave an accurate modelling of the energy use of a hydrogen fleet to future studies.
Key parameter choices for our base case are listed in Table 1. Equivalent parameters for fossil jet fuel, such as nvPM emission index, are generated in the aircraft performance module in CoCiP. More detailed parameter settings for the models can be found in Supplement Table S1.
Table 1Parameter settings for our base case of hydrogen combustion.
4.1 Comparing contrail cirrus climate effect from jet and hydrogen combustion aircraft.
To compare the contrail cirrus climate effects generated by fossil jet fuel and hydrogen combustion aircraft, we simulate contrail cirrus formation and properties for all of 2019 on a global grid, with one degree latitude and longitude resolution for both types of fuel. In Fig. 2 panels (a) and (b) we show the estimated relative frequency of persistent contrail cirrus formation; in (c) and (d), the estimated average contrail lifetime; and in (e) and (f), the estimated average EF per contrail-forming flight meter (EFpcm), for both hydrogen (left-hand column), plus fossil jet fuel (right-hand column) averaged over longitude and time, for different latitudes and altitudes. As can be seen, the two fuels have some general patterns in common, although there are notable differences. As expected from the SAC, the relative frequency of contrail cirrus formation is higher at lower altitudes for hydrogen than for fossil jet fuel due to the greater emission intensity of water vapour for hydrogen. Further, a shorter average lifetime for contrail cirrus formed by hydrogen aircraft is clearly seen when comparing panels (c) and (d) of Fig. 2. On average, the lifetime is 39 % shorter for contrail cirrus formed from hydrogen aircraft compared to those formed from fossil jet fuel aircraft. This shorter lifetime is a consequence of the fact that a smaller number of ice particles are activated for hydrogen combustion than for fossil jet fuel combustion. This implies that each ice particle contains a larger share of the available ice water content, since in CoCiP the ice water content is distributed equally among all particles. This, in turn, will imply that the sedimentation is faster, resulting in shorter average contrail lifetimes (Lewellen et al., 2014; Kärcher, 2016). The shorter lifetime contributes to the EFpcm being lower for contrail cirrus formed by hydrogen aircraft compared to fossil jet fuel aircraft, as shown in panels (e) and (f), respectively (note the difference in scale). However, although lower average contrail lifetime does contribute to a lower average EFpcm, the largest impact comes from the reduction in the reflective area of ice particles, as the number of ice particles for hydrogen combustion compared to fossil jet fuel combustion is lower. The ice particles still share the same ice water content (as discussed above) but the area to volume ratio drops with a smaller number of particles. With a smaller ice particle area, the optical depth (and thereby radiative forcing and energy forcing) drops (Lewellen et al., 2014; Kärcher, 2016). On average, the model output for EFpcm is about 80 % lower for hydrogen aircraft than fossil jet fuel aircraft due to the two mechanisms explained above.
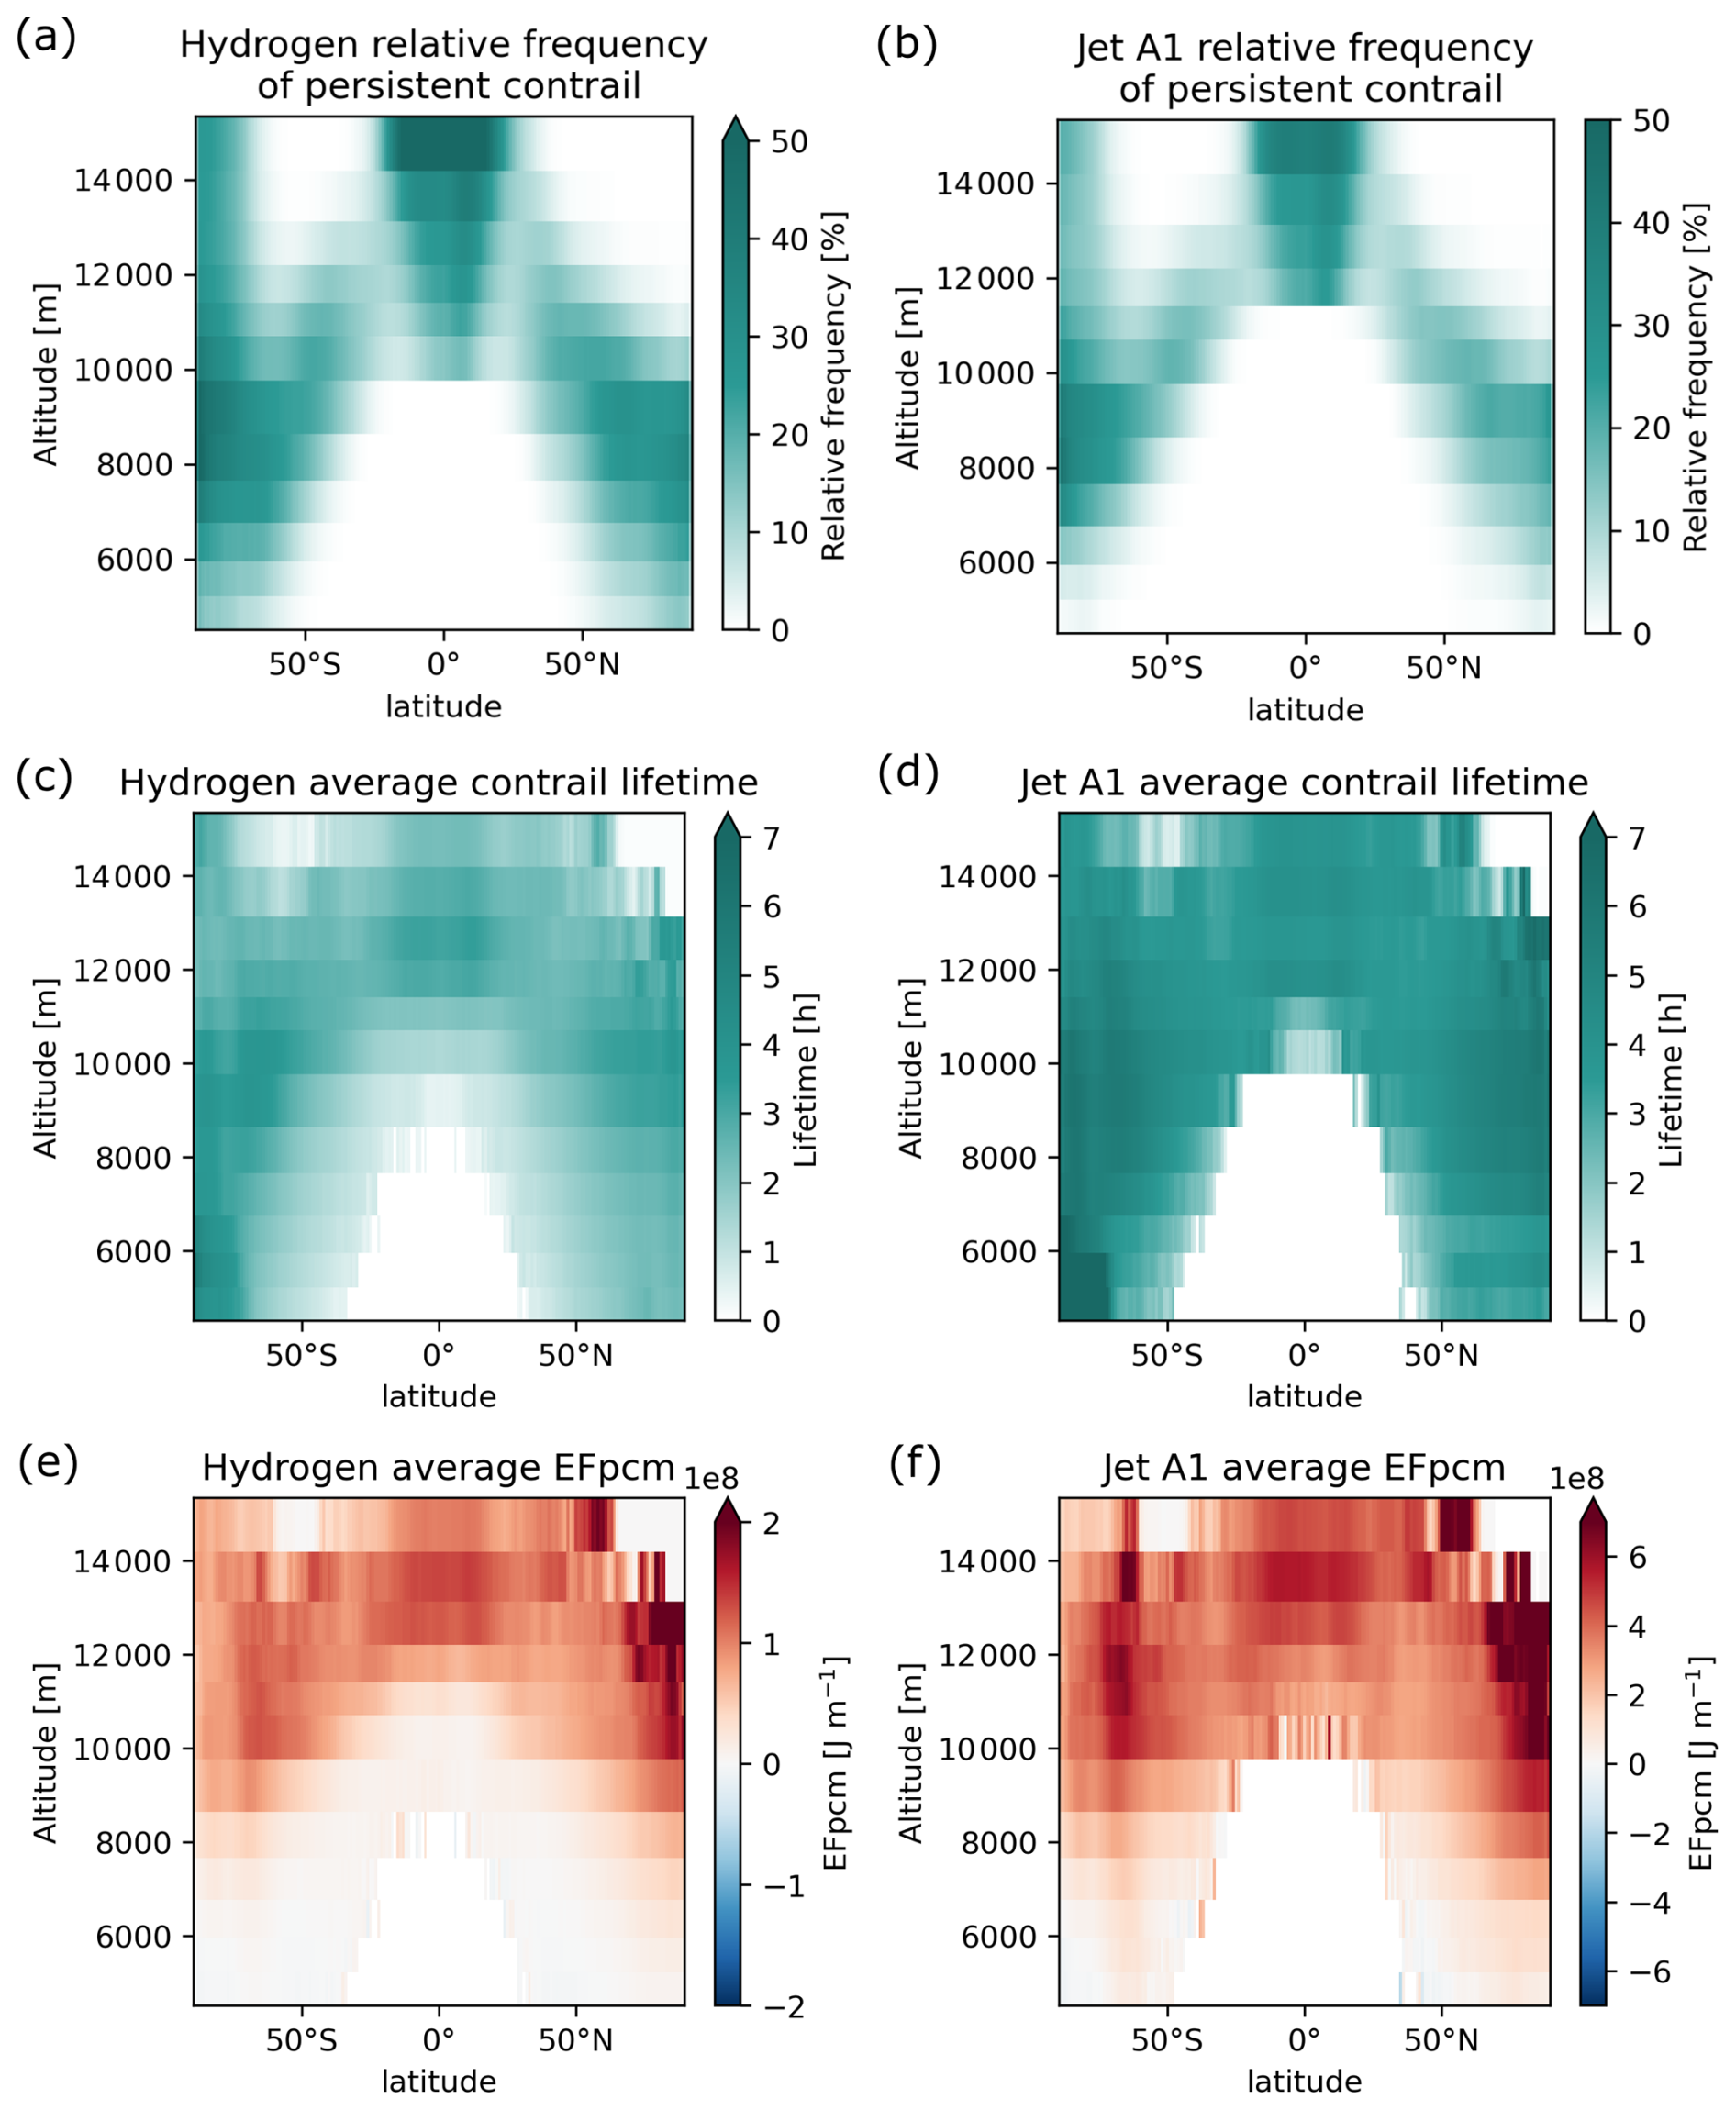
Figure 2Comparison of 2019 longitudinal averages between jet and hydrogen persistent contrail cirrus. The top panels (a, b) show the relative frequency of persistent contrail formation. The middle panels (c, d) show the average contrail lifetime and the bottom ones (e, f) show average energy forcing per contrail-forming flight meter (EFpcm). Note the difference in scale for the EFpcm between hydrogen and jet plots. Hydrogen simulations are run with base setting EUR =1, , EIo=2 mg (kg fuel)−1 and lognormal size distribution with geometric mean radius μo=7.5 nm and geometric width σo≈1.45 for lubrication oil droplets. For ambient aerosols we have hygroscopicity parameter κa=0.5 and lognormal size distribution with geometric mean radius μa=15 nm and geometric width σa=2.2.
In Fig. 3, we show the average ice particle numbers after downwash for hydrogen and fossil jet fuel aircraft per meter contrail formed and for different altitudes and latitudes. The ice particle number for fossil jet fuel aircraft is more than five times greater than for hydrogen aircraft over the whole span of latitudes and altitudes for which fossil jet fuel SAC is fulfilled. For hydrogen aircraft, the ice particle contributions from ambient aerosols and lubrication oil are shown separately in panels (a) and (b) respectively in Fig. 3. Ice particle numbers from lubrication oil are seen to be lowest at lower altitudes because of higher temperatures generally leading to lower supersaturations in the plume and therefore lower activation of the lubrication oil droplets. Indeed, ice particle numbers from ambient aerosols show an increase at lower altitudes. This is because the limiting factor for ice particle formation from ambient aerosols is the time window for particles to get entrained into the plume before quench, rather than the magnitude of the supersaturation in the plume. With a lower number of activated particles from lubrication oil and thus a smaller condensation sink, it takes longer to quench the supersaturation of the plume. Consequently, more ambient aerosols get entrained, become activated and form ice particles at higher temperatures (and lower altitudes). This entrainment and activation behaviour can be seen in Fig. 1, in which the entrainment and activation for ambient aerosols is seen to drop at lower temperatures.
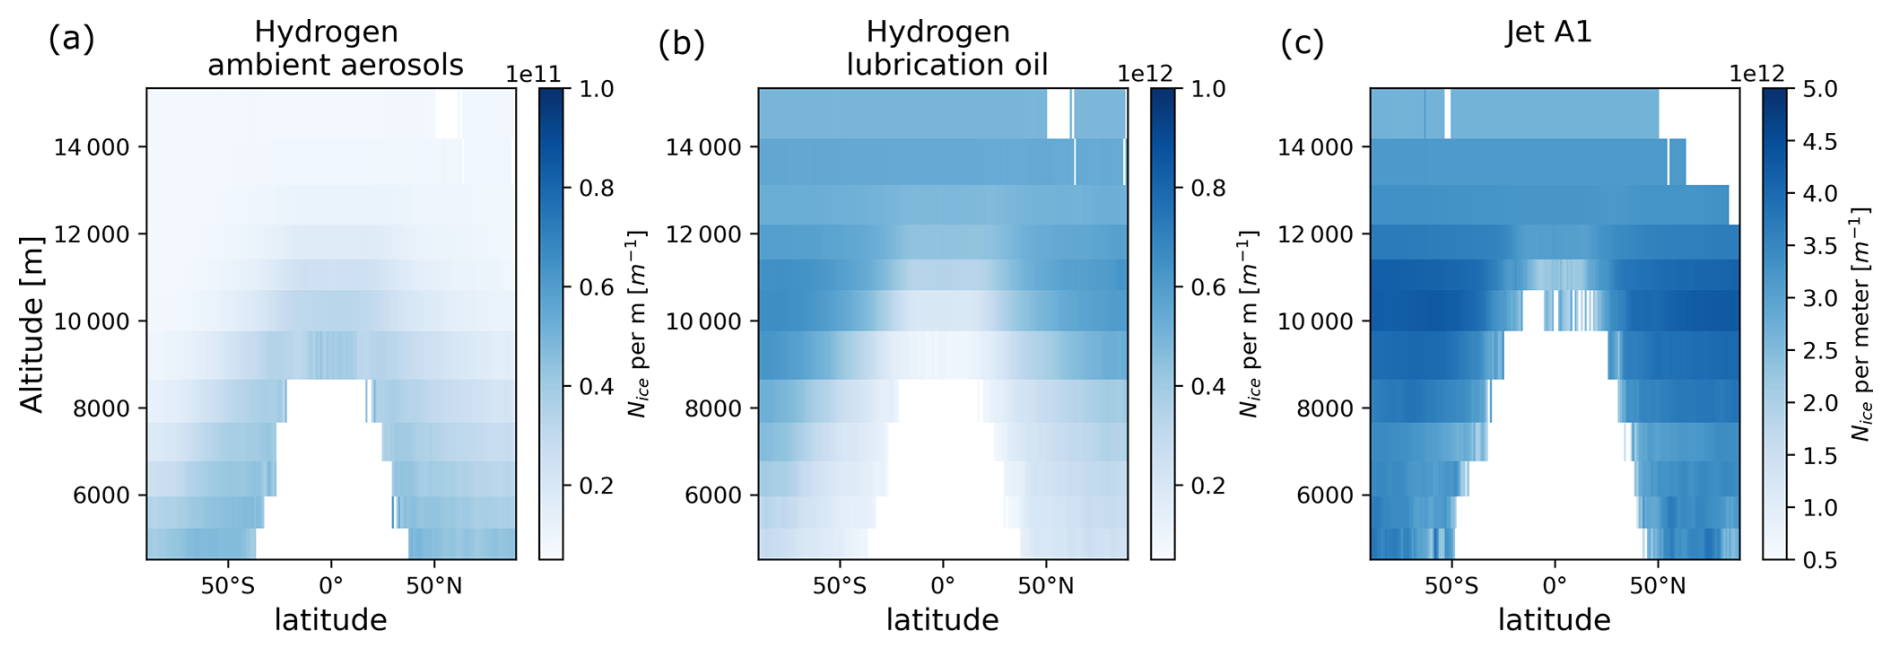
Figure 3Comparison of average number of ice particles after the vortex downwash per meter formed by hydrogen aircraft (a, b) and fossil jet fuel aircraft (c). For hydrogen aircraft, the ice particles formed are separated into those formed on ambient aerosol (a) and lubrication oil (b), respectively. Note the difference in scale between all three plots. Hydrogen simulations are run with base setting EUR =1, , EIo=2 mg (kg fuel)−1 and lognormal size distribution with geometric mean radius μo=7.5 nm and geometric width σo≈1.45 for lubrication oil droplets. For ambient aerosols we have hygroscopicity parameter κa=0.5 and lognormal size distribution with geometric mean radius μa=15 nm and geometric width σa=2.2. All simulations are run for 20 randomly chosen dates (see Supplement S5) as a representative sample for 2019.
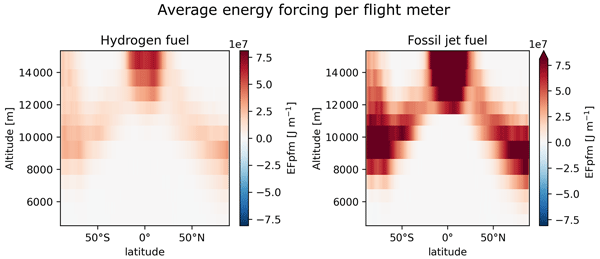
To better see the total potential impacts of hydrogen and fossil jet fuel aircraft, we combine the effect of contrail cirrus formation frequency and EFpcm to estimate the average energy forcing per flight meter (EFpfm). The result is shown in Fig. 4 for hydrogen aircraft (a) and fossil jet fuel aircraft (b). The global average EFpfm (averaged over altitude, longitude, latitude and time) is reduced by 66 % for hydrogen aircraft in our base case, compared to fossil jet fuel aircraft (note the difference in scale in Fig. 4). This is the case despite the higher relative frequencies of persistent contrail cirrus for hydrogen fuel. The higher relative frequencies for hydrogen aircraft only have a noticeable impact on EFpfm at relatively low altitudes. But even in this case, it is a modest effect and hard to discern in Fig. 4.
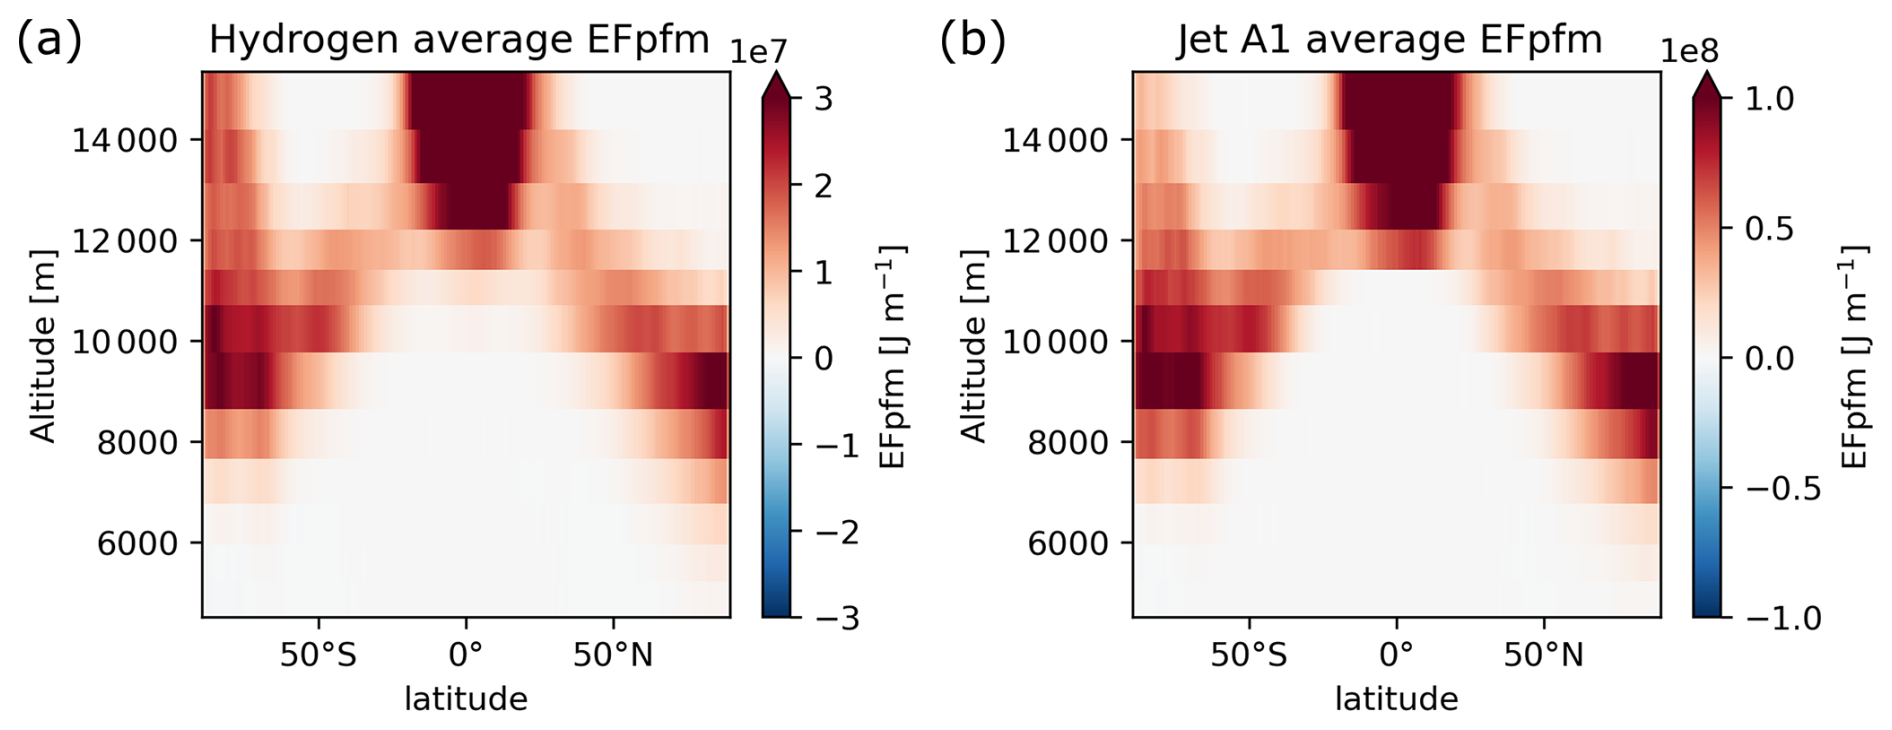
Figure 4Comparison of average EFpfm between fossil jet fuel aircraft (b) and hydrogen aircraft (a). Note the difference in scale between the plots. Hydrogen simulations are run with base setting EUR =1, , EIo=2 mg (kg fuel)−1 and lognormal size distribution with geometric mean radius μo=7.5 nm and geometric width σo≈1.45 for lubrication oil droplets. For ambient aerosols we have hygroscopicity parameter κa=0.5 and lognormal size distribution with geometric mean radius μa=15 nm and geometric width σa=2.2.
4.2 Lubrication oil sensitivity analysis
To gain an improved understanding of how the contrail EF for hydrogen aircraft depends on the parametrisation of lubrication oil size distributions and other key uncertainties, we conducted a sensitivity analysis. In these simulations, 20 dates were chosen randomly (see Supplement S5), for computational cost reasons, as a representative sample for 2019 (the same days analysed for all cases). Further, averages of contrail cirrus properties are limited to the grid covering latitudes 70° S–70° N, all longitudes and flight levels 300–200 hPa (about 9000–12 000 m). However, this region encompasses the airspace in which nearly all commercial flights operate. The ambient aerosol concentration is kept constant at the base setting for all simulations in this section, a sensitivity analysis of ambient aerosol concentration is discussed below and details of that can be found in Supplement S8. For the lubrication oil, we use a geometric mean radius μo ranging from 1 to 25 nm and a geometric width σo ranging from e0.25≈1.28 to e1.0≈2.72 in steps of e0.25. We investigate the model sensitivity with respect to the lubrication oil size distribution while keeping our other base case settings intact. For example, lubrication oil hygroscopicity parameter , oil droplet mass emission index EIo=2 mg (kg fuel)−1 and energy usage ratio EUR =1. Moreover, we analyse three additional cases (1) with the hygroscopicity parameter changed to κo=0.1, (2) oil droplet mass emission index EIo=20 mg (kg fuel)−1 and (3) the energy usage ratio EUR =1.6. A hygroscopicity parameter of 0.1 is unreasonably high for lubrication oil but is assumed so as to improve our understanding about the sensitivity of the model output in relation to our base case assumption.
In Fig. 5 we show the main results from our sensitivity analysis. For all panels, the x-axes show the average number of exhaust particles per contrail-forming flight meter N in the simulations (oil droplets for the hydrogen aircraft and soot for the fossil jet fuel aircraft). The average number of oil droplets is determined by μo, σo and the average fuel flow (which is equal for all cases except EUR =1.6). The smaller the geometric mean radius of the size distribution, the larger the number of oil droplets N for the same EIo. For each colour (case), the dots appear from left to right in order of decreasing geometric mean radius, with the largest radius on the left and the smallest on the right.
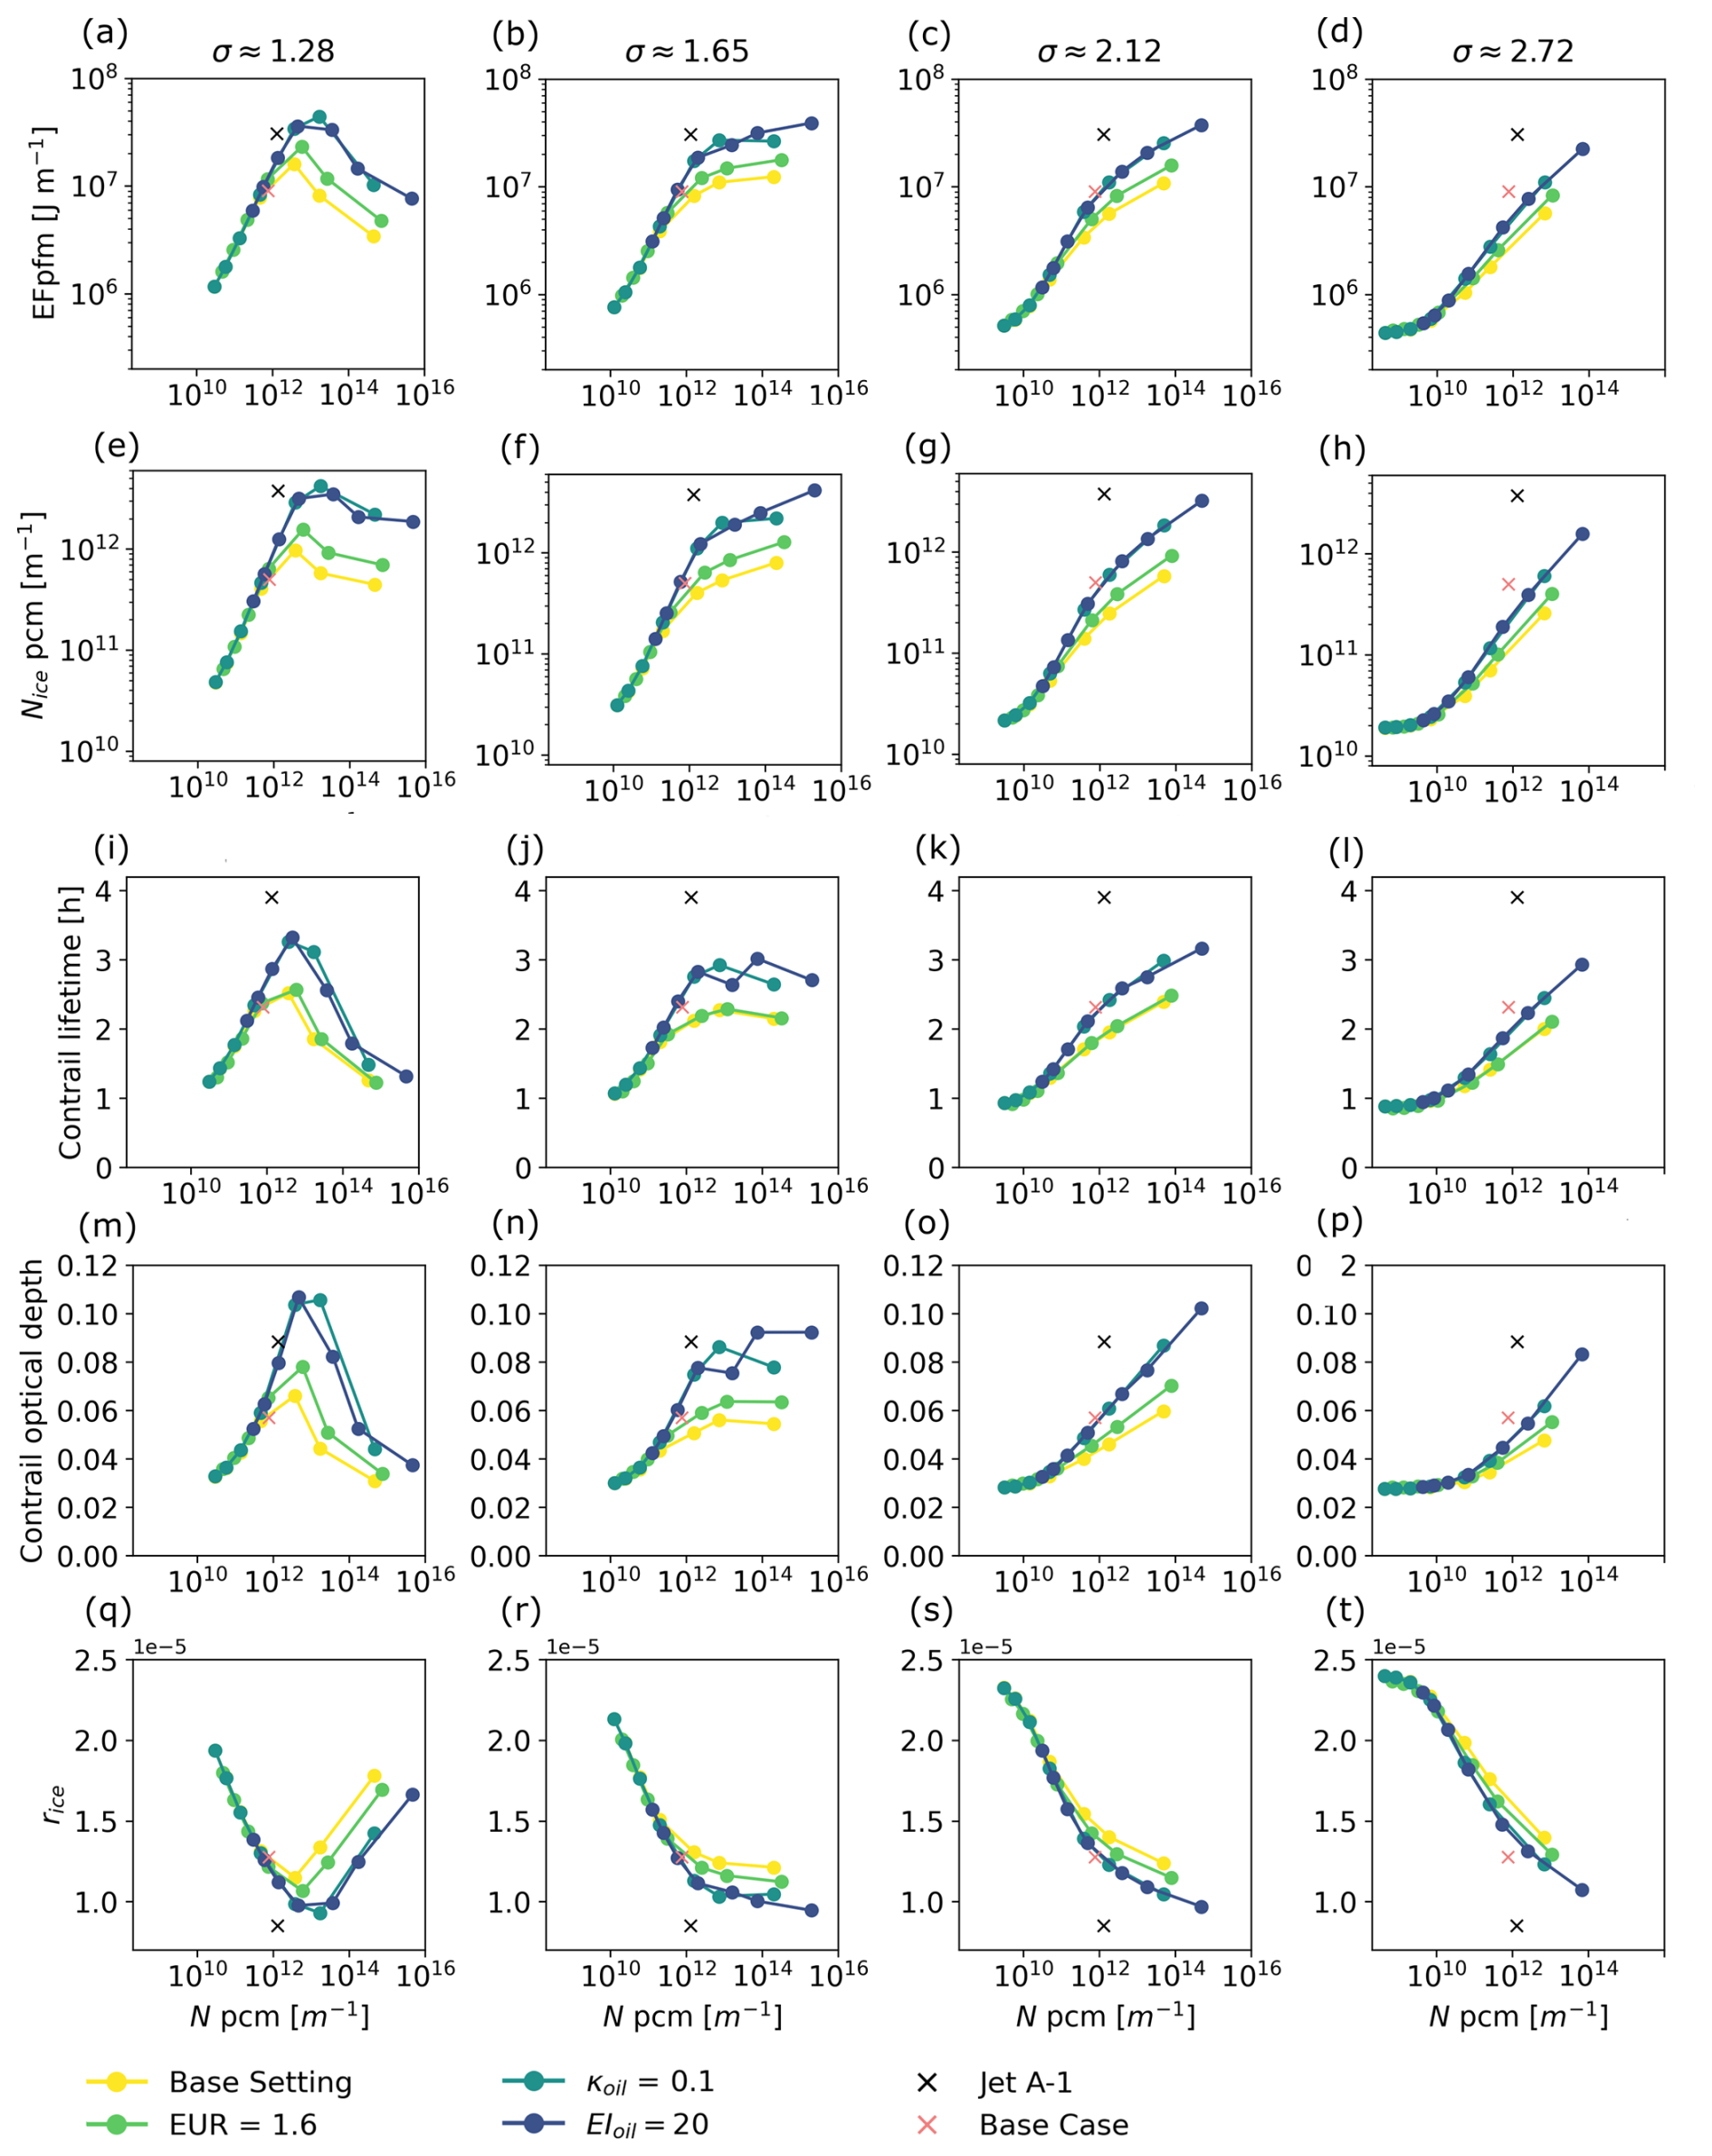
Figure 5The figure shows the average energy forcing per flight meter (row 1), the average number of ice particles per contrail-forming flight meter after downwash (row 2), the average contrail lifetime (row 3), the contrail optical depth averaged over the contrail cirrus lifetime (row 4) and the ice particle radius averaged over the contrail cirrus lifetime (row 5) for different lognormal size distributions, geometric mean radii and geometric widths (the columns) for four cases of lubrication oil parameters. These four cases are: base setting (yellow); larger fuel flow for hydrogen (light green); large lubrication oil hygroscopicity (dark green); and high oil emission index (dark blue). The x-axes show the average number of exhaust particles per contrail-forming flight meter of lubrication oil or soot, not including ambient aerosols. For comparison, the black x-marker shows the average for fossil jet A-1 fuel and the pink x-marker shows the average for the hydrogen aviation in the base case for the same 20 randomly chosen dates. Note that the base case marker is added for comparison and has the same lubrication oil size distribution, with μo=7.5 nm and σo=1.45 in all panels. All simulations are run for the same set of 20 randomly chosen dates.
We begin by analysing the first and second rows of Fig. 5, which show the average EFpfm and average Nice pcm, respectively, for all lubrication-oil size distributions and cases. A first observation is that there are cases for which contrail cirrus formed by hydrogen aircraft have a higher average EFpfm than those formed by current conventional fossil jet fuel aircraft (jet fuel values from simulations are shown as the black x-marker). This occurs when assuming a high EIo or a high κo, combined with size distribution assumptions enabling a large number of oil droplets to activate (many droplets but not too small) such as for μo=5 nm and σo=1.28 in panel (a) or μo=1 nm and σo=2.12 in panel (b). A high EIo provides a larger number of oil droplets than when using the base case setting, which opens the possibility for more ice particles to form. However, panel (e) in the second row of Fig. 5, showing the average Nice pcm, clearly demonstrates that for the cases with the largest values for N (corresponding to μo=1 nm and μo=3 nm), the Kelvin effect suppresses the fraction of droplets that activate. The high κo=0.1 enables more oil droplets to activate compared to the base setting and this causes an increase in Nice pcm and EFpfm for the same N. The highest average EFpfm was obtained for μo=3 nm, σo=1.28 and κo=0.1 with a 43 % increase compared to fossil jet fuel and a 385 % increase compared to the base case in Sect. 4.1. The second highest average EFpfm was obtained for μo=1 nm, σo=1.65 and EIo=20 mg (kg fuel)−1. For this case, we get a 27 % increase in average EFpfm compared to fossil jet fuel and a 330 % increase compared to the hydrogen base case.
Further, fossil jet fuel aircraft generate higher average EFpfm and Nice pcm compared to hydrogen aircraft in cases where the number of lubrication oil droplets and soot particles are equal (equal N). This happens despite lower levels of supersaturations in the fossil jet fuel aircraft plume, as compared to the hydrogen aircraft one. The reason is that soot has a higher hygroscopicity and larger particles (approx. κs=0.005 and μs=25 nm) than is the case for the lubrication oil cases we analyse that generate equal N.
The substantial reduction in average EFpfm and Nice for μo=1 and 3 nm compared to larger geometric mean radii, despite the much larger N shown in panels (a) and (e) respectively, is due both to the suppression of activation by the Kelvin effect and, indirectly, to the omission of the Kelvin effect from the condensation sink formulation. As noted in Sect. 3.1.1, the original and modified K15 models find the quench-time when the supersaturation forcing is equal to the condensation sink. With higher supersaturation values in the plume for hydrogen than fossil fuel aircraft, the condensation sink is increased (Lw is cubic with respect to sw) and the quenching time decreases. In some cases, this leads to quenching before plume supersaturation becomes sufficiently high to activate the many smaller oil droplets associated with certain size distributions. This behaviour of the K15 model is present regardless of fuel and can also lead to shorter quench times at colder ambient temperatures. In general, colder ambient temperatures generate higher supersaturations in the plume, increasing the condensation sink and shortening the quench time. This mechanism – i.e. high supersaturation leading to a stronger condensation sink and shorter quench times – can also be seen in Fig. 1 for ambient aerosol activation, where cold ambient temperatures give a lower percentage of entrained and activated particles because quenching occurs before full entrainment. This mechanism is also visible in panel (c) of Fig. 2 in Bier and Burkhardt (2019) for ambient aerosols (in combination with soot), where plume quenching occurs before full entrainment and activation, leading to fewer ice particles formed from ambient aerosols for colder ambient temperatures. Both examples contrast with the increase in ice particles formed from ambient aerosols at lower ambient temperatures in Bier et al. (2024), which does not include a quenching procedure.
The only study investigating this feature of the K15 model is Ponsonby et al. (2025), which found an underestimation of 10 %–30 % of formed ice particles compared to the modified pyrcel model for radii 1–4 nm and hygroscopicity 0–0.5 in the soot-poor regime (EIsoot<1013 (kg fuel)−1). We might therefore expect Nice to be underestimated, especially for oil droplet distributions with small geometric mean radii and small geometric widths.
We next turn to the third row of Fig. 5, which shows the average contrail lifetime for all lubrication-oil size distributions and cases. The ice water content in the plume is the same for all cases with the hydrogen aircraft, except for the one with a higher EUR. In CoCiP, the ice water content is assumed to be shared equally among the droplets activated. Therefore, a larger number of activated droplets leads to smaller ice particles, as noted in Sect. 4.1. Smaller average particles sediment slower and thereby generally give longer contrail cirrus average lifetimes, as can be seen in row three of Fig. 5. There are exceptions to this, as sublimation also plays a role in contrail cirrus lifetime. This can, for example, be seen for σo=1.65 in panel (j), where contrail cirrus lifetimes are shorter for μo=1 nm than for μo=3 nm, despite their larger average Nice pcm in panel (f) of row two.
In rows four and five of Fig. 5, we show the optical depth and the ice particle radius, respectively, averaged over the contrail cirrus lifetime for all cases. In general, the optical depth varies in concert with the average Nice pcm, whereas the average ice particle radius shows the opposite trend. Higher Nice pcm leads to smaller rice, which in turn results in higher optical depth. Conversely, lower Nice pcm leads to larger rice and therefore lower optical depth.
We next compare cases with the base EIo and with a tenfold increase in EIo that produce the same number of lubrication-oil droplets in the plume, N, but differ in size distribution. Under these conditions, EFpfm remains higher for the larger EIo, owing to the shift in size distribution toward larger droplets when more oil is available to form the same number of droplets. This shift leads to an increase in the share of particles in the exhaust that are activated. Furthermore, this mechanism is more important for smaller particles that are less likely to activate than larger particles. For small μo, the tenfold increase in EIo leads to an approximate 90 %–250 % increase in EFpfm, whereas for the largest comparable geometric mean radius, μo=10 nm, the increase is only about 5 %–10 %. Size distributions with μo>10 nm in the base EIo setting all produce fewer droplets than any of the size distributions in the increased-EIo cases.
In Fig. 6, we show the average EFpfm but with the geometric mean radius for lubrication oil droplets on the x-axis. Shown in this way we can see that an increase in EIo, with an associated increase in available oil droplets with the same size distribution leads to a higher average EFpfm. In general, there is a 22 %–450 % increase of average EFpfm (depending on size distribution) for our tenfold increase in EIo. The smallest increase in EFpfm is found for the case with widest distribution and geometric mean radius of 25 nm. The largest increase was obtained for a geometric mean radius of 20 nm and geometric width of 1.28.
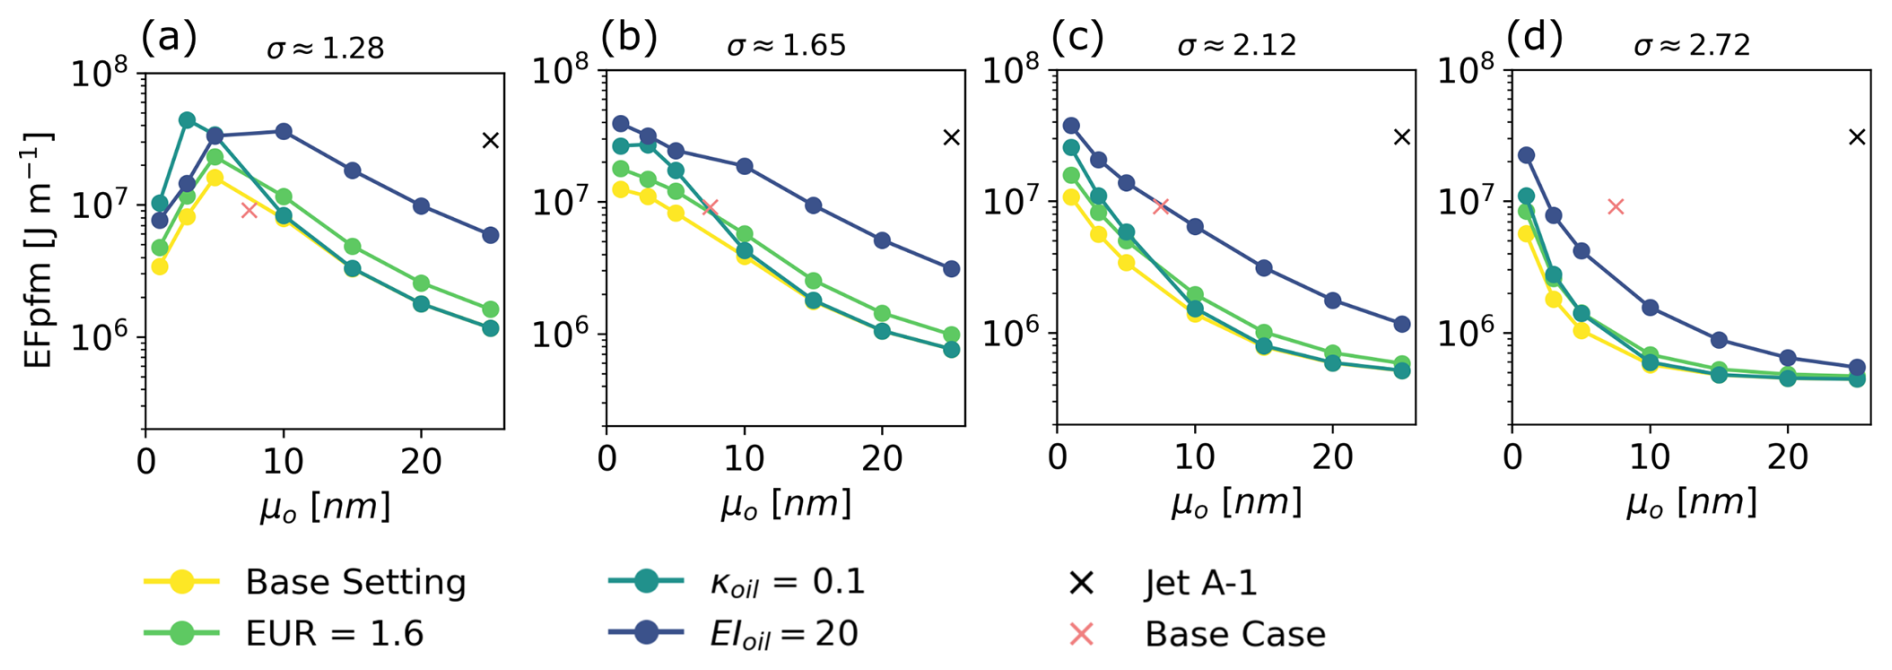
Figure 6The figure shows the average energy forcing per flight meter for different lognormal size distributions with varying geometric mean radii (x-axis) and geometric widths (columns), for four cases of lubrication oil parameters: base setting (yellow); larger fuel flow for hydrogen (light green); large lubrication oil hygroscopicity (dark green); and high oil emission index (dark blue). For comparison, the black x-marker shows the average for fossil jet A-1 fuel (with the assumption that μs=25 nm, as in the comparison between K15 and CoCiP's activation function). The pink x-marker shows the average for the base case described in Sect. 4.1. All simulations are run for the same set of 20 randomly chosen dates.
It is also interesting that the assumption about a lower fuel efficiency (EUR is 60 % higher) only has a modest effect in comparison to the oil droplet mass emission index. The increase in EFpfm is smaller than the 60 % increase in fuel flow. This is partly due to the larger ice water content for the higher EUR leading to proportionally larger ice particle losses in the wake vortex downwash of CoCiP.
4.3 Ambient aerosol contribution to ice particle formation
The contribution of ambient aerosols to ice particle formation, in absolute terms, is nearly constant across the different oil droplet size distributions and number concentrations considered here. This is because the quench time, which determines the level of entrainment, is controlled primarily by the supersaturation forcing and the condensation sink, as discussed in Sect. 4.2. However, the lubrication-oil size distribution does exert some influence on the contribution from ambient aerosols. When large numbers of oil droplets are present, they deplete the available water more rapidly and quench the plume sooner, thereby reducing the time available for ambient aerosols to be entrained into the plume and contribute to ice particle formation. For such cases, both the relative share of ice particles formed on ambient aerosols and the absolute number is smaller than for cases in which a small number of oil droplets is present, as seen in Fig. 7, in which we show the average numbers of ice particles from ambient aerosols (a) and lubrication oil (b) after downwash, as well as the ambient aerosol ice particle number as a percentage (c) for all cases and size distributions examined in the sensitivity analysis. The decrease in the case with smallest Nice,a compared to the case with the largest Nice,a is only 4 %. This implies that in cases where there are few oil droplets present at formation, the ambient aerosols are responsible for the majority of ice particles as seen in Fig. 7 panel (c). This explains the “plateauing” of Nice and EFpfm seen in panels (d) and (h) in Fig. 5, where the simulations approach an ambient-aerosol-dominated background level. This is the end point of our ranges with μo=25 nm and σo≈2.72, which gives the lowest number of oil particles. This ambient-aerosol-dominated background level can be considered a best-case scenario for the contrail cirrus climate impact of hydrogen aviation, as it approximates the average EFpfm that would remain if the contribution from lubrication oil were eliminated.
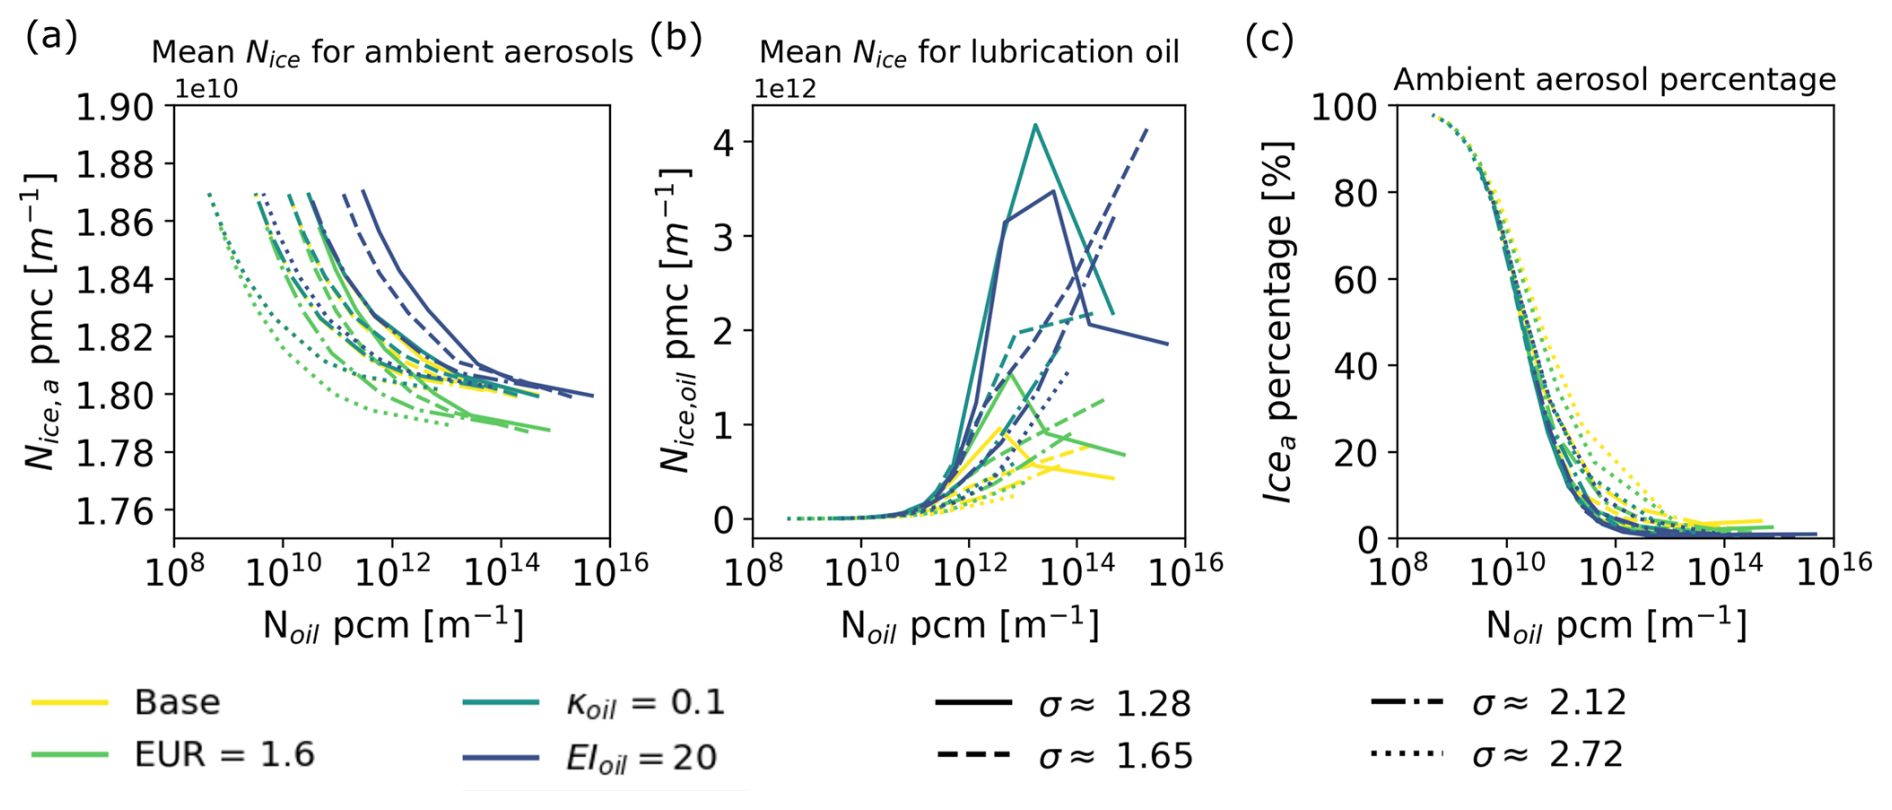
Figure 7The figure shows the average number of ice particles after downwash per contrail-forming flight meter stemming from ambient aerosols to the left (a) and lubrication oil in the middle (b), as well as the ambient aerosol ice percentage to the right (c) for all cases as a function of the lubrication oil size distributions. Note the change of scale between panel (a) and (b).
We analyse the consequences of both increasing and decreasing the ambient aerosol number concentration by a factor of ten for a subset of oil droplet size distributions spanning the range considered in Sect. 4.2; see Supplement S8. In general, the larger the fraction of ice particles formed on ambient aerosols under our base-case aerosol concentration, the larger the corresponding increase or decrease in average EFpfm following a tenfold increase or decrease in ambient aerosol concentration, respectively. The strongest sensitivity is found for cases in which nearly all ice particles form on ambient aerosols, that is, where the ambient-aerosol background level dominates. For the lubrication-oil parameters with the lowest fraction of ice particles formed on oil droplets, 2 % (μo=25 nm and σo≈2.72), we obtain a 620 % increase in average EFpfm for a tenfold increase in ambient aerosol number concentration, and a 90 % decrease for a tenfold decrease in concentration. Even in this case, however, the average EFpfm with a tenfold increase in ambient aerosol concentration remains 44 % lower than in the overall hydrogen base case. It is also 90 % lower than the average EFpfm for fossil jet fuel aircraft.
Our analysis of how hydrogen as a jet fuel impacts contrail cirrus formation and energy forcing indicates the possibility of a significant climate benefit. For almost all parameter settings considered, we find that hydrogen offers a reduction in energy forcing per flight meter compared to conventional fossil jet fuel aircraft, with a global average reduction of 66 % when using our base case assumptions. In our base case, we find an average ice particle reduction of approximately 85 % compared to a conventional fossil jet fuel aircraft. This can be compared to previous estimates of a reduction exceeding 80 %–90 %, although only ambient aerosols were considered as ice nuclei in that study (Bier et al., 2024). In our study, the ice particle number is highly dependent on the lubrication oil size distribution and less (but still significantly) dependent on lubrication oil mass emission index and lubrication oil hygroscopicity. In our most pessimistic cases, we find an increase of about 10 % in the ice particle number after downwash, relative to the case for a conventional fossil jet fuel aircraft, assuming a high oil emission index or high hygroscopicity, combined with a small lubrication oil geometric mean radius and a small geometric width. However, we found a 99 % reduction in the ice particle number after downwash when assuming relatively large lubrication oil droplets, corresponding to a situation in which lubrication oil is vented rather than emitted in the main exhaust. This indicates the possibilities and importance of future hydrogen engine designs for a low contrail cirrus climate impact.
Although the simulated reductions in ice particle number and energy forcing are robust across nearly all cases investigated here, uncertainties and caveats in the modelling approach must still be taken into account. CoCiP is a simplified model although it has been calibrated and compared (with a relatively good fit) against data (Schumann et al., 2017). However, a recent comparison between CoCiP and APCEMM (Akhtar Martínez et al., 2025) highlights the fact that a substantial part of the contrail cirrus' later lifetime might be missed in the CoCiP model. This leads to a lower estimate of the lifetime optical depth (proxy for climate impact) in CoCiP compared to APCEMM, by an approximate factor of 4 for fossil jet fuel.
The modelling approach in CoCiP does not employ size distributions of ice particles in the plume. Since the sedimentation rate depends on particle size, all ice particles in CoCiP sediment at the same rate, with the consequence that a longer-lived tail of smaller particles would be missed. In the model, the contrail cirrus with high initial ice water content and low ice particle numbers will generate large ice particles with rapid sedimentation. However, it remains unclear whether such cases would lead to a greater relative underestimation of contrail lifetime and energy forcing per flight meter because of the omitted longer-lived tail, or whether such a tail would in fact be less pronounced in cases that initially contain only a small number of large particles, potentially making CoCiP more representative in those situations.
For APCEMM, a large part of the lifetime optical depth in the model comes from the latest stages of contrail cirrus lifetime. This may explain the discrepancy between the models according to Akhtar Martínez et al. (2025). Due to a low optical depth in the later stages, this phase of contrail cirrus lifetime is difficult to measure and therefore makes it difficult to validate model results against data. Measurement difficulties notwithstanding, APCEMM sedimentation behaviour is largely in agreement with more resolved models than CoCiP (Unterstrasser and Gierens, 2010; Lewellen et al., 2014; Lewellen, 2014).
The theoretical K15 model in Kärcher et al. (2015) for ice particle formation is expected, on the one hand, to overestimate the number of ice particles due to the quench procedure, in which all water droplets form at once rather than as a successive activation of particles into water droplets. A successive activation would steadily deplete the supersaturation, thus taking it below the activation threshold for small particles and particles with low hygroscopicity. On the other hand, the formulation of the condensation sink may lead to an underestimation of the number of formed ice particles, especially for small droplets affected by the Kelvin effect. When comparing a modified version of K15 with a modified version of the pyrcel model, K15 generated approximately 10 %–30 % lower ice particle numbers for radii 1–4 nm and hygroscopicity 0–0.5 in the “soot-poor” regime for kerosene combustion (Ponsonby et al., 2025). How this translates to hydrogen combustion is not clear and needs to be studied explicitly. However, given the higher supersaturation and supersaturation forcing in the plume for hydrogen combustion, we suspect this mechanism could further enhance the underestimation because of the cubic dependence of the condensation sink to supersaturation in the K15 model, although this remains to be tested.
Due to our modelling approach, the magnitude of the uncertainties of contrail cirrus impact is difficult to estimate. There are no observations, as yet, of ice particle formation from hydrogen flights against which to compare our ice particle estimates and contrail evolution. However, the first measurement campaign of contrail formation from hydrogen aircraft was launched in December 2024 and with its upcoming publication we can better understand the modelling caveats.
Still, our modelling approach produces ice particle numbers of the same order of magnitude as those reported in another study for comparable lubrication-oil size distributions and emission indices (Zink et al., 2025). We also obtain relatively lower numbers of formed ice particles for smaller geometric mean radii, consistent with the tendency of K15 to relatively underestimate ice particle numbers when small geometric mean radii are assumed for the condensation nuclei, as noted in Ponsonby et al. (2025). A more precise comparison is hampered by modelling differences. For example, we estimate the global annual average ice particle numbers after downwash (with realistic meteorology), compared to ice particle numbers before downwash at four different temperatures (Zink et al., 2025).
In general, EFpfm increases with the number of exhaust particles (oil droplets), but this trend reverses for very high numbers of droplets (see Fig. 5 panel a). This reversal arises because, in our study, very high droplet numbers correspond to small droplets, for which activation is suppressed by the Kelvin effect. For the smallest geometric width, this generates an almost exponential decrease in EFpfm with increasing N for oil droplet numbers approximately N>1013 m−1, corresponding to geometric mean radii of <5 nm. This is the fraction of the parameter space in which we expect the largest underestimation of ice particles formed. For the largest geometric width tested, with a significant number of large droplets, EFpfm increases approximately according to a power law with N, for N>1010 m−1.
Following a tenfold increase in the emission index, the increase in EFpfm is highly dependent on oil droplet size distribution. We find the increase to be in the range 22 %–450 %, with the smallest value for geometric mean radius of 25 nm and a geometric width of 2.72 and the largest increase for a geometric mean radius of 20 nm and geometric width of 1.28. An additional finding in our study is the relatively small difference in EFpfm between our base case and the more technically pessimistic assumption for fuel systems.
The best cases in terms of lowest contrail cirrus energy forcing are obtained for particle size distributions generating approximately N<1010 m−1 and large droplets. Here, ambient aerosols dominate the ice particle formation. In the modelling, we have set the constant ambient aerosol concentration relatively high and assumed a relatively high hygroscopicity to avoid underestimation of their contribution. We also varied the ambient aerosol concentration by an order of magnitude upward and downward. The effect of this change is greatest in cases that otherwise have relatively low energy forcing. Even with a tenfold increase in ambient aerosol concentration relative to our base-case assumption, the average EFpfm remains 90 % lower than for fossil jet fuel in the case with the smallest contribution of lubrication oil to the ice particle number.
Despite the uncertainties, our study indicates the possibility of substantial climate benefits in terms of reduced contrail cirrus EFpfm for hydrogen compared to conventional jet fuel. Our parameter sweep over the lubrication oil size distributions may also provide guidance for future hydrogen engine design. From a contrail cirrus climate impact perspective, if the mass emission index of entrained lubrication oil remains unchanged, a broad size distribution with a large geometric mean radius is preferable.
In the majority of settings we analysed, contrail cirrus from hydrogen combustion aircraft generates a significantly lower energy forcing than that from fossil jet fuel combustion aircraft. The primary mechanism is a reduced number of particles available to act as condensation nuclei. While fossil jet fuel combustion emits soot and other volatile particulates that dominate ice nucleation, contrail formation from hydrogen combustion depends instead on lubrication oil droplets and ambient aerosols serving as condensation nuclei.
In our modelling approach ice particle formation on lubrication oil and ambient aerosols is captured using activation emulators based on a modified version of the microphysical framework proposed by Kärcher et al. (2015). Although lubrication oil may partially compensate for the absence of soot, its effectiveness as an ice nucleus is highly sensitive to poorly constrained factors such as its emission index and particle size distribution. Nonetheless, the conclusion that hydrogen combustion leads to lower contrail cirrus energy forcing remains intact across a wide range of assumptions regarding lubrication oil properties.
Overall, our findings suggest that hydrogen aircraft may offer not only CO2-free propulsion but also substantially reduced non-CO2 climate impacts from contrail cirrus, provided that lubrication oil emissions are effectively controlled.
Model code and generated data are available for scientific research purposes from the authors upon request and partly found at https://doi.org/10.5281/zenodo.15874256 (Pettersson, 2025).
The supplement related to this article is available online at https://doi.org/10.5194/acp-26-13485-2026-supplement.
SP and DJ designed the study. SP carried out the simulations, analysis and the preparation of the manuscript. DJ helped with the analysis. DJ and CA contributed to the preparation of the manuscript.
The contact author has declared that none of the authors has any competing interests.
Publisher's note: Copernicus Publications remains neutral with regard to jurisdictional claims made in the text, published maps, institutional affiliations, or any other geographical representation in this paper. The authors bear the ultimate responsibility for providing appropriate place names. Views expressed in the text are those of the authors and do not necessarily reflect the views of the publisher.
The authors thank VINNOVA, Chalmers Area of Advance Transport and our three anonymous referees.
This research has been supported by the Chalmers Tekniska Högskola (Area of Advance Transport) and the VINNOVA (grant no. 2023-01286).
The publication of this article was funded by the Swedish Research Council, Forte, Formas, and Vinnova.
This paper was edited by Luis A. Ladino and reviewed by two anonymous referees.
Adler, E. J. and Martins, J. R.: Hydrogen-powered aircraft: Fundamental concepts, key technologies, and environmental impacts, Prog. Aerosp. Sci., 141, 100922, https://doi.org/10.1016/j.paerosci.2023.100922, 2023. a
Akhtar Martínez, C., Eastham, S. D., and Jarrett, J. P.: Zero-dimensional contrail models could underpredict lifetime optical depth, Atmos. Chem. Phys., 25, 12875–12891, https://doi.org/10.5194/acp-25-12875-2025, 2025. a, b
Bier, A. and Burkhardt, U.: Variability in contrail ice nucleation and its dependence on soot number emissions, J. Geophys. Res.-Atmos., 124, 3384–3400, 2019. a
Bier, A., Unterstrasser, S., Zink, J., Hillenbrand, D., Jurkat-Witschas, T., and Lottermoser, A.: Contrail formation on ambient aerosol particles for aircraft with hydrogen combustion: a box model trajectory study, Atmos. Chem. Phys., 24, 2319–2344, https://doi.org/10.5194/acp-24-2319-2024, 2024. a, b, c, d, e, f, g
Borrmann, S., Kunkel, D., Weigel, R., Minikin, A., Deshler, T., Wilson, J. C., Curtius, J., Volk, C. M., Homan, C. D., Ulanovsky, A., Ravegnani, F., Viciani, S., Shur, G. N., Belyaev, G. V., Law, K. S., and Cairo, F.: Aerosols in the tropical and subtropical UT/LS: in-situ measurements of submicron particle abundance and volatility, Atmos. Chem. Phys., 10, 5573–5592, https://doi.org/10.5194/acp-10-5573-2010, 2010. a
Clarke, A. D. and Kapustin, V. N.: A Pacific aerosol survey. Part I: A decade of data on particle production, transport, evolution, and mixing in the troposphere, J. Atmos. Sci., 59, 363–382, 2002. a, b
Decker, Z. C., Alpert, P. A., Ammann, M., Anet, J. G., Bauer, M., Cui, T., Durdina, L., Edebeli, J., Gysel-Beer, M., and Prévôt, A. S.: Emission and Formation of Aircraft Engine Oil Ultrafine Particles, ACS ES&T Air, 1, 1662–1672, 2024. a, b
DLR: World-first in-flight measurements of contrails from hydrogen propulsion, https://www.dlr.de/en/latest/news/2025/world-first-in-flight-measurements-of-contrails (last access: 2 May 2026), 2025. a
Durdina, L., Brem, B. T., Elser, M., Schönenberger, D., Siegerist, F., and Anet, J. G.: Reduction of nonvolatile particulate matter emissions of a commercial turbofan engine at the ground level from the use of a sustainable aviation fuel blend, Environ. Sci. Technol., 55, 14576–14585, 2021. a
Engberg, Z., Teoh, R., Abbott, T., Dean, T., Stettler, M. E. J., and Shapiro, M. L.: Forecasting contrail climate forcing for flight planning and air traffic management applications: the CocipGrid model in pycontrails 0.51.0, Geosci. Model Dev., 18, 253–286, https://doi.org/10.5194/gmd-18-253-2025, 2025. a
Fritz, T. M., Eastham, S. D., Speth, R. L., and Barrett, S. R. H.: The role of plume-scale processes in long-term impacts of aircraft emissions, Atmos. Chem. Phys., 20, 5697–5727, https://doi.org/10.5194/acp-20-5697-2020, 2020. a
Fushimi, A., Saitoh, K., Fujitani, Y., and Takegawa, N.: Identification of jet lubrication oil as a major component of aircraft exhaust nanoparticles, Atmos. Chem. Phys., 19, 6389–6399, https://doi.org/10.5194/acp-19-6389-2019, 2019. a
Gierens, K., Matthes, S., and Rohs, S.: How well can persistent contrails be predicted?, Aerospace, 7, 169, https://doi.org/10.3390/aerospace7120169, 2020. a
Hersbach, H., Bell, B., Berrisford, P., Hirahara, S., Horányi, A., Muñoz‐Sabater, J., Nicolas, J., Peubey, C., Radu, R., and Schepers, D.: The ERA5 global reanalysis, Q. J. Roy. Meteor. Soc., 146, 1999–2049, 2020. a
Kaiser, J. C., Hendricks, J., Righi, M., Jöckel, P., Tost, H., Kandler, K., Weinzierl, B., Sauer, D., Heimerl, K., Schwarz, J. P., Perring, A. E., and Popp, T.: Global aerosol modeling with MADE3 (v3.0) in EMAC (based on v2.53): model description and evaluation, Geosci. Model Dev., 12, 541–579, https://doi.org/10.5194/gmd-12-541-2019, 2019. a
Kärcher, B.: The importance of contrail ice formation for mitigating the climate impact of aviation, J. Geophys. Res.-Atmos., 121, 3497–3505, 2016. a, b, c, d
Kärcher, B. and Yu, F.: Role of aircraft soot emissions in contrail formation, Geophys. Res. Lett., 36, https://doi.org/10.1029/2008GL036649, 2009. a
Kärcher, B., Turco, R., Yu, F., Danilin, M., Weisenstein, D., Miake‐Lye, R., and Busen, R.: A unified model for ultrafine aircraft particle emissions, J. Geophys. Res.-Atmos., 105, 29379–29386, 2000. a
Kärcher, B., Burkhardt, U., Bier, A., Bock, L., and Ford, I.: The microphysical pathway to contrail formation, J. Geophys. Res.-Atmos., 120, 7893–7927, 2015. a, b, c, d, e, f, g, h, i, j
Kölker, K., Zengerling, Z., Kühlen, M., Lütjens, K., and Linke, F.: Assessing the impact of contrail avoidance through rescheduling on airline network flows: A case study of North Atlantic flights, Transport. Res. A-Pol., 187, 104155, https://doi.org/10.1016/j.tra.2024.104155, 2024. a
Lambe, A. T., Onasch, T. B., Massoli, P., Croasdale, D. R., Wright, J. P., Ahern, A. T., Williams, L. R., Worsnop, D. R., Brune, W. H., and Davidovits, P.: Laboratory studies of the chemical composition and cloud condensation nuclei (CCN) activity of secondary organic aerosol (SOA) and oxidized primary organic aerosol (OPOA), Atmos. Chem. Phys., 11, 8913–8928, https://doi.org/10.5194/acp-11-8913-2011, 2011. a, b, c, d
Lee, D. S., Fahey, D. W., Skowron, A., Allen, M. R., Burkhardt, U., Chen, Q., Doherty, S. J., Freeman, S., Forster, P. M., and Fuglestvedt, J.: The contribution of global aviation to anthropogenic climate forcing for 2000 to 2018, Atmos. Environ., 244, 117834, https://doi.org/10.1016/j.atmosenv.2020.117834, 2021. a, b
Lewellen, D.: Persistent contrails and contrail cirrus. Part II: Full lifetime behavior, J. Atmos. Sci., 71, 4420–4438, 2014. a
Lewellen, D. C.: A large-eddy simulation study of contrail ice number formation, J. Atmos. Sci., 77, 2585–2604, 2020. a
Lewellen, D., Meza, O., and Huebsch, W.: Persistent contrails and contrail cirrus. Part I: Large-eddy simulations from inception to demise, J. Atmos. Sci., 71, 4399–4419, 2014. a, b, c, d
Liu, H. J., Zhao, C. S., Nekat, B., Ma, N., Wiedensohler, A., van Pinxteren, D., Spindler, G., Müller, K., and Herrmann, H.: Aerosol hygroscopicity derived from size-segregated chemical composition and its parameterization in the North China Plain, Atmos. Chem. Phys., 14, 2525–2539, https://doi.org/10.5194/acp-14-2525-2014, 2014. a
Minikin, A., Petzold, A., Ström, J., Krejci, R., Seifert, M., van Velthoven, P., Schlager, H., and Schumann, U.: Aircraft observations of the upper tropospheric fine particle aerosol in the Northern and Southern Hemispheres at midlatitudes, Geophys. Res. Lett., 30, https://doi.org/10.1029/2002GL016458, 2003. a, b
Moore, R. H., Thornhill, K. L., Weinzierl, B., Sauer, D., D’Ascoli, E., Kim, J., Lichtenstern, M., Scheibe, M., Beaton, B., and Beyersdorf, A. J.: Biofuel blending reduces particle emissions from aircraft engines at cruise conditions, Nature, 543, 411–415, 2017. a
Mukhopadhaya, J. and Rutherford, D.: Performance analysis of evolutionary hydrogen-powered aircraft, ICCT white paper, https://doi.org/10.13140/RG.2.2.34487.60329, 2022. a
Padró, L. T., Tkacik, D., Lathem, T., Hennigan, C. J., Sullivan, A. P., Weber, R. J., Huey, L. G., and Nenes, A.: Investigation of cloud condensation nuclei properties and droplet growth kinetics of the water‐soluble aerosol fraction in Mexico City, J. Geophys. Res.-Atmos., 115, https://doi.org/10.1029/2009JD013195, 2010. a
Petters, M. D. and Kreidenweis, S. M.: A single parameter representation of hygroscopic growth and cloud condensation nucleus activity, Atmos. Chem. Phys., 7, 1961–1971, https://doi.org/10.5194/acp-7-1961-2007, 2007. a, b, c, d, e
Pettersson, S.: Climate impact of contrail cirrus from hydrogen combustion aircraft, Zenodo [code], https://doi.org/10.5281/zenodo.15874256, 2025. a
Ponsonby, J., King, L., Murray, B. J., and Stettler, M. E. J.: Jet aircraft lubrication oil droplets as contrail ice-forming particles, Atmos. Chem. Phys., 24, 2045–2058, https://doi.org/10.5194/acp-24-2045-2024, 2024. a, b
Ponsonby, J., Teoh, R., Kärcher, B., and Stettler, M. E. J.: An updated microphysical model for particle activation in contrails: the role of volatile plume particles, Atmos. Chem. Phys., 25, 18617–18637, https://doi.org/10.5194/acp-25-18617-2025, 2025. a, b, c, d, e, f
Quante, G., Voigt, C., and Kaltschmitt, M.: Targeted use of paraffinic kerosene: Potentials and implications, Atmos. Environ.: X, 100279, https://doi.org/10.1016/j.aeaoa.2024.100279, 2024. a
Rädel, G. and Shine, K. P.: Validating ECMWF forecasts for the occurrence of ice supersaturation using visual observations of persistent contrails and radiosonde measurements over England, Q. J. Roy. Meteor. Soc., 136, 1723–1732, 2010. a
Raes, F., Van Dingenen, R., Vignati, E., Wilson, J., Putaud, J.-P., Seinfeld, J. H., and Adams, P.: Formation and cycling of aerosols in the global troposphere, Atmos. Environ., 34, 4215–4240, 2000. a, b
Reutter, P., Neis, P., Rohs, S., and Sauvage, B.: Ice supersaturated regions: properties and validation of ERA-Interim reanalysis with IAGOS in situ water vapour measurements, Atmos. Chem. Phys., 20, 787–804, https://doi.org/10.5194/acp-20-787-2020, 2020. a
Rosenow, J., Fricke, H., Luchkova, T., and Schultz, M.: Minimizing contrail formation by rerouting around dynamic ice-supersaturated regions, Aeron. Aero. Open Access J., 2, 105–111, 2018. a
Schumann, U.: On conditions for contrail formation from aircraft exhausts, Meteorol. Z., 5, 4–23, 1996. a, b, c, d, e
Schumann, U.: A contrail cirrus prediction model, Geosci. Model Dev., 5, 543–580, https://doi.org/10.5194/gmd-5-543-2012, 2012. a, b, c
Schumann, U., Mayer, B., Gierens, K., Unterstrasser, S., Jessberger, P., Petzold, A., Voigt, C., and Gayet, J.-F.: Effective radius of ice particles in cirrus and contrails, J. Atmos. Sci., 68, 300–321, 2011. a
Schumann, U., Mayer, B., Graf, K., and Mannstein, H.: A parametric radiative forcing model for contrail cirrus, J. Appl. Meteorol. Clim., 51, 1391–1406, 2012. a
Schumann, U., Baumann, R., Baumgardner, D., Bedka, S. T., Duda, D. P., Freudenthaler, V., Gayet, J.-F., Heymsfield, A. J., Minnis, P., Quante, M., Raschke, E., Schlager, H., Vázquez-Navarro, M., Voigt, C., and Wang, Z.: Properties of individual contrails: a compilation of observations and some comparisons, Atmos. Chem. Phys., 17, 403–438, https://doi.org/10.5194/acp-17-403-2017, 2017. a
Shapiro, M., Engberg, Z., Teoh, R., and Dean, T.: pycontrails: Python library for modeling aviation climate impacts, Zenodo [code], https://doi.org/10.5281/zenodo.7775435, 2023. a
Stier, P., Feichter, J., Kinne, S., Kloster, S., Vignati, E., Wilson, J., Ganzeveld, L., Tegen, I., Werner, M., Balkanski, Y., Schulz, M., Boucher, O., Minikin, A., and Petzold, A.: The aerosol-climate model ECHAM5-HAM, Atmos. Chem. Phys., 5, 1125–1156, https://doi.org/10.5194/acp-5-1125-2005, 2005. a
Teoh, R., Schumann, U., Gryspeerdt, E., Shapiro, M., Molloy, J., Koudis, G., Voigt, C., and Stettler, M. E. J.: Aviation contrail climate effects in the North Atlantic from 2016 to 2021, Atmos. Chem. Phys., 22, 10919–10935, https://doi.org/10.5194/acp-22-10919-2022, 2022a. a
Teoh, R., Schumann, U., Voigt, C., Schripp, T., Shapiro, M., Engberg, Z., Molloy, J., Koudis, G., and Stettler, M. E.: Targeted use of sustainable aviation fuel to maximize climate benefits, Environ. Sci. Technol., 56, 17246–17255, 2022b. a
Timko, M. T., Albo, S. E., Onasch, T. B., Fortner, E. C., Yu, Z., Miake-Lye, R. C., Canagaratna, M. R., Ng, N. L., and Worsnop, D. R.: Composition and sources of the organic particle emissions from aircraft engines, Aerosol Sci. Tech., 48, 61–73, 2014. a, b, c
Ungeheuer, F., Caudillo, L., Ditas, F., Simon, M., van Pinxteren, D., Kılıç, D., Rose, D., Jacobi, S., Kürten, A., and Curtius, J.: Nucleation of jet engine oil vapours is a large source of aviation-related ultrafine particles, Commun. Earth Environ., 3, 319, https://doi.org/10.1038/s43247-022-00653-w, 2022. a, b
Unterstrasser, S. and Gierens, K.: Numerical simulations of contrail-to-cirrus transition – Part 1: An extensive parametric study, Atmos. Chem. Phys., 10, 2017–2036, https://doi.org/10.5194/acp-10-2017-2010, 2010. a
Voigt, C., Schumann, U., Jurkat, T., Schäuble, D., Schlager, H., Petzold, A., Gayet, J.-F., Krämer, M., Schneider, J., Borrmann, S., Schmale, J., Jessberger, P., Hamburger, T., Lichtenstern, M., Scheibe, M., Gourbeyre, C., Meyer, J., Kübbeler, M., Frey, W., Kalesse, H., Butler, T., Lawrence, M. G., Holzäpfel, F., Arnold, F., Wendisch, M., Döpelheuer, A., Gottschaldt, K., Baumann, R., Zöger, M., Sölch, I., Rautenhaus, M., and Dörnbrack, A.: In-situ observations of young contrails – overview and selected results from the CONCERT campaign, Atmos. Chem. Phys., 10, 9039–9056, https://doi.org/10.5194/acp-10-9039-2010, 2010. a
Voigt, C., Kleine, J., Sauer, D., Moore, R. H., Bräuer, T., Le Clercq, P., Kaufmann, S., Scheibe, M., Jurkat-Witschas, T., and Aigner, M.: Cleaner burning aviation fuels can reduce contrail cloudiness, Commun. Earth Environ., 2, 114, https://doi.org/10.1038/s43247-021-00174-y, 2021. a
Voigt, C., Märkl, R., Sauer, D., Dischl, R., Renard, C., Seeliger, K., Yu, F., Kaufmann, S., Bräuer, T., and Jurkat-Witschas, T.: Substantial aircraft contrail formation at low soot emission levels, Nature, 652, 112–118, 2026. a
Wang, M., Kong, W., Marten, R., He, X.-C., Chen, D., Pfeifer, J., Heitto, A., Kontkanen, J., Dada, L., and Kürten, A.: Rapid growth of new atmospheric particles by nitric acid and ammonia condensation, Nature, 581, 184–189, 2020. a
Yang, P., Hong, G., Dessler, A. E., Ou, S. S., Liou, K.-N., Minnis, P., and Harshvardhan: Contrails and induced cirrus: Optics and radiation, B. Am. Meteorol. Soc., 91, 473–478, 2010. a
Yu, F. and Turco, R. P.: The role of ions in the formation and evolution of particles in aircraft plumes, Geophys. Res. Lett., 24, 1927–1930, 1997. a
Yu, F., Turco, R. P., and Kärcher, B.: The possible role of organics in the formation and evolution of ultrafine aircraft particles, J. Geophys. Res.-Atmos., 104, 4079–4087, 1999. a
Yu, F., Karcher, B., and Anderson, B. E.: Revisiting contrail ice formation: Impact of primary soot particle sizes and contribution of volatile particles, Environ. Sci. Technol., 2024. a, b, c, d
Yu, Z., Liscinsky, D. S., Winstead, E. L., True, B. S., Timko, M. T., Bhargava, A., Herndon, S. C., Miake-Lye, R. C., and Anderson, B. E.: Characterization of lubrication oil emissions from aircraft engines, Environ. Sci. Technol., 44, 9530–9534, 2010. a, b, c
Zhang, C., Chen, L., Ding, S., Zhou, X., Chen, R., Zhang, X., Yu, Z., and Wang, J.: Mitigation effects of alternative aviation fuels on non-volatile particulate matter emissions from aircraft gas turbine engines: A review, Sci. Total Environ., 820, 153233, https://doi.org/10.1016/j.scitotenv.2022.153233, 2022. a
Zink, J., Unterstrasser, S., and Jurkat‐Witschas, T.: On the potential role of lubrication oil particles in contrail formation for kerosene and hydrogen combustion, J. Geophys. Res.-Atmos., 130, e2025JD043487, https://doi.org/10.1029/2025JD043487, 2025. a, b, c, d
Zink, J., Unterstrasser, S., and Burkhardt, U.: Contrail formation for aircraft with hydrogen combustion – Part 1: A systematic microphysical investigation, Atmos. Chem. Phys., 26, 3125–3143, https://doi.org/10.5194/acp-26-3125-2026, 2026. a