
the Creative Commons Attribution 4.0 License.
the Creative Commons Attribution 4.0 License.
 | 22 Sep 2026
Scenario-driven ozone projections and associated impact on mortality over Africa with an integrated machine learning framework
Huimin Li

Hailong Wang
Ozone (O3), a major tropospheric air pollutant, poses significant threats to public health and ecosystems, especially across Africa, where O3 concentrations have experienced pronounced increases in recent decades. This study employs an interpretable machine learning (ML) model integrated with multi-source data to predict near-surface O3 levels over Africa from 2020 to 2050 driven by climate change under four Shared Socioeconomic Pathways (SSPs). We quantitatively investigate the respective roles of climate-driven changes in meteorological conditions and biogenic isoprene emissions in affecting future O3 variations. Results reveal that, in an annual mean sensitivity experiment that isolates climate-driven changes in biogenic isoprene, increased biogenic isoprene emissions contribute to a slight reduction in O3 levels (<0.5 ppb). Conversely, favorable meteorological conditions elevate O3 levels over Africa, with a maximum projected increase of 2.0 ppb in 2050 relative to 2020, dominating the O3 variations driven by climate change. The low-emission SSP scenarios are projected to lead to smaller increases in O3 levels than the high-emission SSPs. Moreover, elevated air temperatures associated with global warming magnify the health burden across Africa, as O3 pollution acts as an additional stressor in a warming climate. This highlights the urgency for robust air pollution control and climate mitigation strategies to alleviate future health impacts in Africa.
- Article
(11013 KB) - Full-text XML
-
Supplement
(3651 KB) - BibTeX
- EndNote


Ozone (O3) near the surface is a secondary air pollutant, primarily generated via the complex photochemical reactions involving precursors such as nitrogen oxides () and volatile organic compounds (VOCs) under solar radiation. Since O3 absorbs longwave radiation, it also acts as an important greenhouse gas that contributes to climate forcing (Myhre et al., 2017). Chronic exposure to elevated O3 levels poses substantial threats to human health (Anenberg et al., 2010; Lelieveld et al., 2015), ecosystems (Yue et al., 2017; Mills et al., 2018), and climate change (Gaudel et al., 2018; Gao et al., 2022; Wang et al., 2023). Africa suffers a high burden of O3 pollution in densely populated regions, which exhibit a rapid increase in daily maximum 8 h mean (MDA8) O3 with an annual growth rate exceeding 3 % (Sicard et al., 2023). More than 0.3 million premature deaths are attributed to O3 pollution in 2019, which has become the second largest cause of death in Africa (Fisher et al., 2021; Lyu et al., 2023). Therefore, it is urgent to characterize the long-term variations of O3 over Africa and identify their underlying driving factors.
Two thirds of countries in Africa lack ground-based observational data with sufficient temporal and geographic coverage, making it difficult to evaluate the air quality across the entire continent (Fajersztajn et al., 2014). Satellite O3 products from the Total OzoneMapping Spectrometer can provide long-time series of data. By combining these satellite measurements with the Global Modeling Initiative model, Ziemke et al. (2019) found a 4–5 DU (Dobson unit) increase in tropospheric column O3 over Central Africa during the past four decades. Nevertheless, these satellite retrievals still face spatial gaps and accuracy challenges, and cannot be directly used to estimate chemical and physical processes involved in O3 production and loss (Colombi et al., 2021). To complement the limitations of near-surface O3 measurements, chemical transport models (CTMs) have been applied to simulate O3 concentrations. Zunckel et al. (2006) found that the modelled near-surface O3 mixing ratio over Southern Africa frequently exceeded 40 ppb, which may damage the local crops. Currently, artificial intelligence algorithms such as machine learning (ML) methods are widely applied in O3 research due to their high computational efficiency and strong predictive performance, which can contribute to reducing the simulation biases inherent in traditional CTMs (Requia et al., 2020; Liu et al., 2022b; Wei et al., 2022; Li et al., 2023, 2024; Ni et al., 2024). For example, Liu et al. (2022a) developed a 0.5° global monthly near-surface O3 dataset for the period of 2003–2019 based on a cluster-enhanced ensemble ML method, and demonstrated that the average population-weighted MDA8 O3 concentration in Northern Africa reached 53 ppb during the peak season, exceeding the global average of 47 ppb. Due to the severe O3 pollution in Africa, the prediction of future O3 concentrations is essential to providing scientific guidance for effective mitigation strategies.
The variation of O3 largely depends on meteorological factors and synoptic conditions (Jacob and Winner, 2009; Doherty et al., 2013; Kavassalis and Murphy, 2017; Fu and Tian, 2019; Gong and Liao, 2019; Lu et al., 2019; Yang et al., 2022; Li et al., 2023, 2024). As documented in the Sixth Assessment Report of the Intergovernmental Panel on Climate Change (IPCC AR6), all global regions would experience intensified climate change, with the frequency, intensity, and duration of heatwaves projected to increase by 2100 (IPCC, 2021). The frequency of high-temperature days in Africa is projected to increase substantially by the mid-21st century under the Shared Socioeconomic Pathway (SSP) 2–4.5 (26 %–59 %) and SSP5-8.5 (30 %–69 %) relative to the recent climatology of 1991–2010 (Iyakaremye et al., 2021). Such future climate changes under the various scenarios will further influence near-surface O3 through altering meteorological factors (Colette et al., 2015; Wang et al., 2022). Turnock et al. (2022) applied the United Kingdom Earth System Model (UKESM1) to assess the impacts of future climate change on near-surface O3, and found a modest reduction in annual mean O3 levels by 2050 across Northern Africa (4 %) and Southern Africa (2 %) under the SSP3-7.0 scenario. Compound events involving extremely high temperatures and O3 concentrations are projected to occur more frequently, with Africa experiencing the largest increase of compound-event days by more than 150 d in the 2080s under the SSP5-8.5 scenario compared to the baseline of 1995–2014 (Ban et al., 2022). Utilizing three state-of-the-art earth system models, Brown et al. (2022) showed a multi-model average increase of O3 by up to 4 ppb over urban areas of Africa during 2090–2100 under the SSP3-7.0 scenario.
Variations in meteorological parameters under the SSP scenarios can also influence O3 levels through perturbing natural emissions of precursors, such as those from vegetation, soil and lightning. As a dominant O3 precursor, VOCs are largely emitted from terrestrial ecosystems (Kesselmeier and Staudt, 1999), with approximately 90 % originating from biogenic sources (Guenther et al., 1995). Wang et al. (2025a) evaluated annual O3 precursor emissions in 2019 over Southern Africa from different emission inventories, and demonstrated that biogenic VOCs (BVOCs) emissions exceeded those from other sources by a factor of 9 to 147. Among BVOCs, isoprene contributes the largest proportion of total emissions (Guenther et al., 2012). Notably, the African continent accounts for 20 % of global isoprene emissions, with the evergreen tropical forests of Western and Equatorial Africa serving as a major source (Marais et al., 2012; Jaars et al., 2016; Sindelarova et al., 2022). Evidence indicates that BVOCs emissions are strongly modulated by meteorological conditions, such as air temperature, solar radiation, relative humidity, and precipitation (Zhang et al., 2008; Debevec et al., 2018; Yáñez‐Serrano et al., 2020; Liu et al., 2021). Given the potentially increasing variability in future climate, isoprene emissions are becoming more uncertain in O3 prediction, as it plays a crucial role in tropospheric chemistry, particularly in the formation of tropospheric O3 (Fehsenfeld et al., 1992; Williams et al., 2009). Consequently, future changes in isoprene emissions in a warming climate are expected to further impact O3 concentrations across Africa.
Many previous studies predicted future O3 under single scenario based on limited climate model simulations, without considering the impacts of climate change on O3 variations, as well as the underlying changing meteorological conditions and natural precursor emissions. Also, the uncertainties in future meteorological parameters projected by a small number of climate models can also suffer specific model biases in O3 predictions. In this study, we aim to quantify the impacts of future climate change on near-surface O3 concentrations over Africa in the mid-21st century (average of 2045–2054) by employing a ML approach integrated with GEOS-Chem model simulations and multi‐model simulations under four SSPs scenarios (SSP1‐2.6, SSP2‐4.5, SSP3‐7.0, and SSP5‐8.5) from the Coupled Model Intercomparison Project Phase 6 (CMIP6). Individual contributions of changing meteorological conditions and changing natural emissions (isoprene) under climate change are separately evaluated. The corresponding future health risk in Africa is also assessed. Details of the data, model description and methodology are elaborated in Sect. 2. Section 3 presents future projections of near-surface O3 concentrations over Africa, relative contributions of driving factors, and assessment of the health risks. Key conclusions and potential uncertainties of this study are summarized in Sect. 4.
2.1 GEOS-Chem model simulations
The historical near‐surface O3 concentrations over Africa (36° S–30° N, 17.5° W–50° E) for the period 2000–2019 are simulated in the GEOS‐Chem model version 13.4.1, which is driven by meteorological fields from the Modern-Era Retrospective analysis for Research and Applications version 2 (MERRA-2; Gelaro et al., 2017). The model simulation has a horizontal resolution of 2° latitude × 2.5° longitude, and includes 47 vertical layers from the surface up to 0.01 hPa. It incorporates fully coupled O3–NOx-hydrocarbon-aerosol chemical mechanisms (Park et al., 2004; Pye et al., 2009; Mao et al., 2013), with about 300 species participating in over 400 kinetic and photochemical reactions (Bey et al., 2001). Vertical mixing process within the planetary boundary layer is characterized using a non-local scheme (Lin and McElroy, 2010), and stratospheric O3 chemistry utilizes the linearized O3 parameterization scheme (LINOZ; McLinden et al., 2000).
Anthropogenic emissions of O3 precursors, including non-methane VOCs (NMVOCs), NOx and CO from 2000 to 2019 are derived from the Community Emissions Data System (CEDS) version 2021_04_21 (O'Rourke et al., 2021). Biogenic emissions are calculated online based on the Model of Emissions of Gases and Aerosols from Nature (MEGAN) version 2.1 (Guenther et al. 2012). Biomass burning emissions are obtained from the Global Fire Emissions Database (GFED) version 4 (van der Werf et al., 2017). NOx emissions from soil sources are estimated online according to an updated version of the Berkeley–Dalhousie Soil NOx Parameterization scheme proposed by Hudman et al. (2012). Lightning-induced NOx emissions are calculated online following the algorithm developed by Ott et al. (2010) and Murray et al. (2012). Methane (CH4) concentrations are prescribed using spatially interpolated monthly average observations from the National Oceanic and Atmospheric Administration (NOAA) Global Monitoring Division (GMD; Murray, 2016). Previous studies have shown that GEOS-Chem model reproduces the magnitude and spatial distributions of observed O3 concentrations across Africa (Han et al., 2018; Yan et al., 2019; Wang et al., 2025a).
2.2 CMIP6 multi-model outputs
The CMIP6 repository contains multi-model climate projections for various SSPs based on alternative scenarios of future emissions and land use changes (O'Neill et al., 2016). In this study, we collect meteorological variables from CMIP6 models under four different scenarios. SSP1-2.6 represents a low-forcing scenario that considers comprehensive climate mitigation strategies to effectively reduce greenhouse gas emissions and progress toward sustainable development goals. SSP2-4.5 is an intermediate-forcing scenario that follows the business-as-usual pathway. SSP3-7.0 corresponds to a medium-to-high forcing scenario. SSP5-8.5 denotes a high-forcing scenario aiming to achieve climate adaptation alongside rapid development through intensive utilization of fossil-fueled resources.
To perform a robust prediction of future near-surface O3 concentrations in Africa, climate projections from 18 global climate models participating in CMIP6 are applied, including ACCESS_CM2, ACCESS-ESM1-5, CanESM5, CESM2-WACCM, CMCC-CM2-SR5, EC-Earth3, EC-Earth3-Veg, FGOALS-f3-L, FGOALS-g3, GFDL-ESM4, INM-CM5-0, IPSL-CM6A-LR, MIROC6, MPI-ESM1-2-HR, MPI-ESM1-2-LR, MRI-ESM2-0, NorESM2-LM, and NorESM2-MM. These models provide the major meteorological variables essential for predicting near-surface O3, such as air temperatures (at 2 m, 850 hPa, and 500 hPa), wind fields (at 850 and 500 hPa), incoming shortwave radiation at the surface, near-surface relative humidity, precipitation rate, total cloud cover, and sea level pressure under the four different scenarios. In order to minimize the inconsistencies of initial conditions between CMIP6 models and MERRA-2 reanalysis data, the future meteorological fields under different scenarios from CMIP6 models are adjusted based on the differences between CMIP6 historical meteorological variables and MERRA-2 reanalysis data during 2000–2019 following Li et al. (2022, 2023, 2024). Additionally, to discuss the role of climate change in the projected variation of O3 concentrations driven mainly by anthropogenic emissions, the monthly O3 simulation outputs under four SSPs scenarios from 8 CMIP6 models are adopted, including BCC-CSM2-MR, FGOALS-g3, IPSL-CM6A-LR, MPI-ESM1-2-HR, MPI-ESM1-2-LR, MRI-ESM2-0, NorESM2-LM, and NorESM2-MM.
2.3 Machine learning model construction
As one of the traditional ML algorithms, Random Forest (RF) model can process high-dimensional data with lower computational costs compared to the CTMs (Breiman, 2001). This ensemble approach excels at dealing with nonlinear and complex relationships between input and target variables, and it provides stable and reliable predictions of O3 in many previous studies (Wei et al., 2022; Xu et al., 2023). In this study, to predict future near-surface O3 over Africa, we integrate a set of relevant features as predictors, including O3 concentrations from GEOS-Chem model simulations, O3 precursor emissions, meteorological variables, topography (TOPO), land cover (LC), normalized difference vegetation index (NDVI), and population density (POP). Considering the autocorrelation between O3 and its covariates varies across space and time, the RF model also incorporates spatiotemporal information, including month of the year (MOY), longitude (LON) and latitude (LAT) across the Africa domain. The details of input data applied in this study are summarized in Table 1.
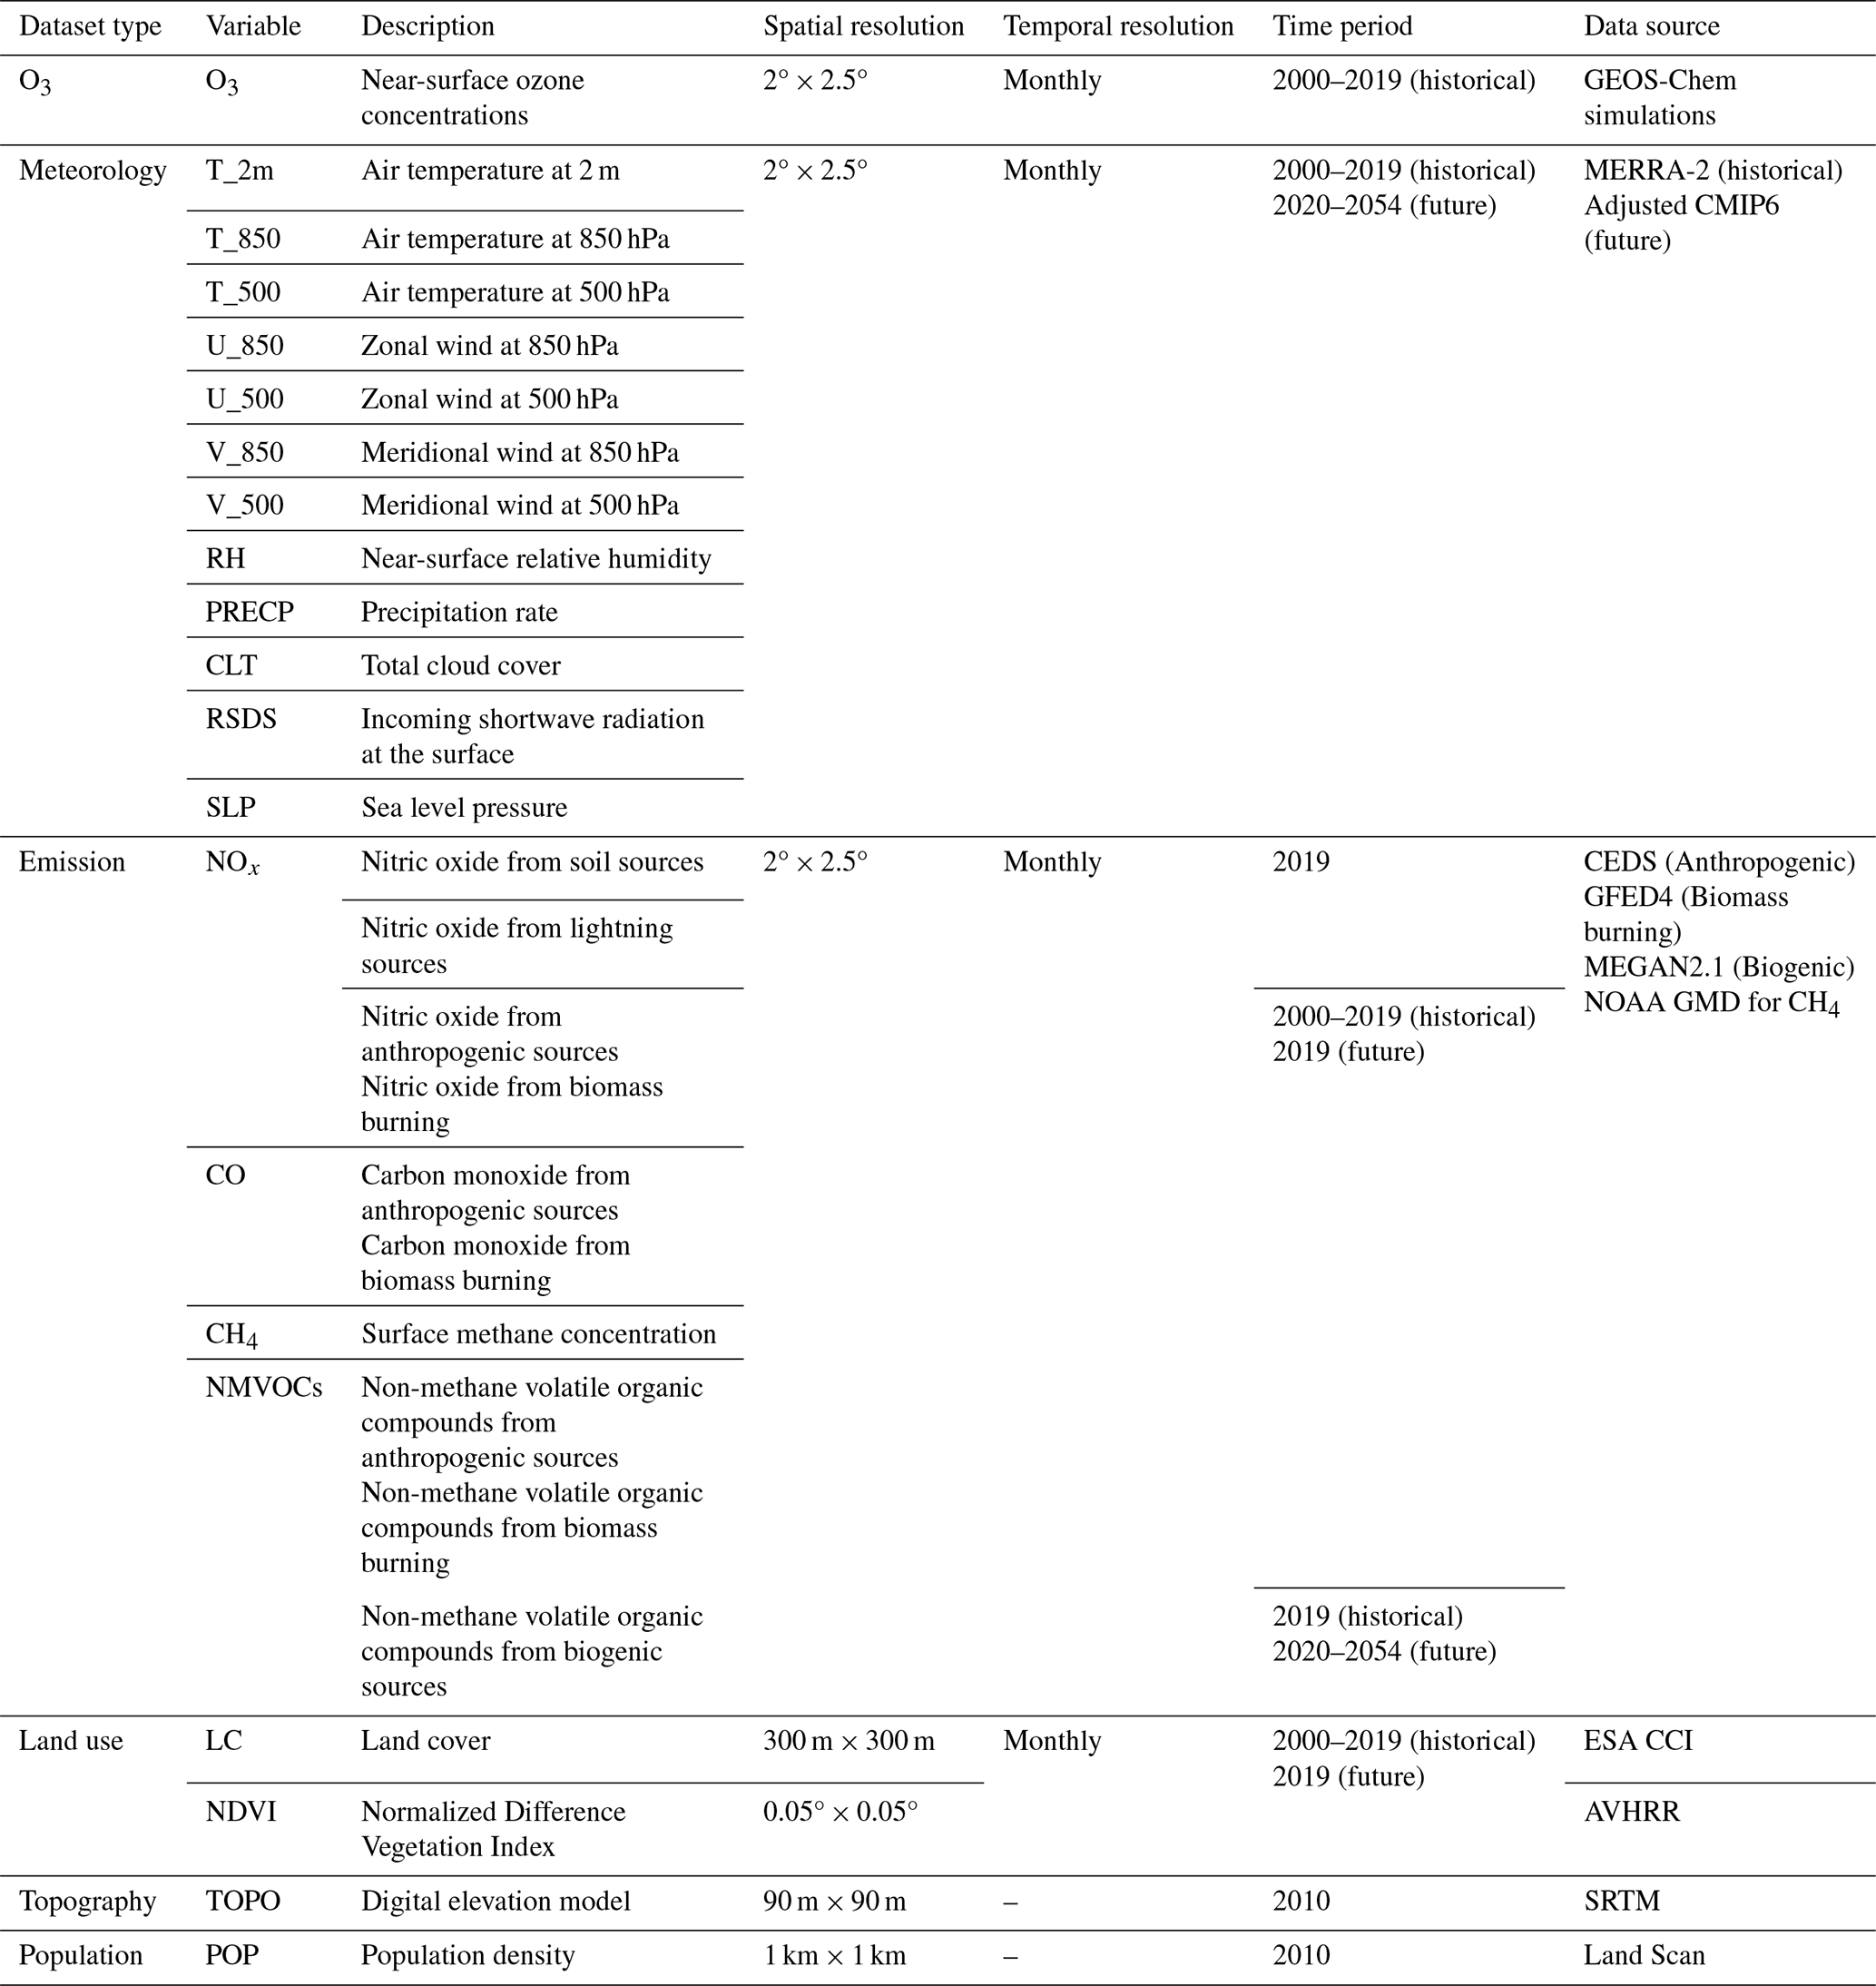
We first predict future biogenic isoprene emissions based on RF model, which are then used for predicting future near-surface O3 concentrations across Africa. The RF model for isoprene is trained using emission output from MEGAN2.1 in GEOS-Chem model, MERRA-2 meteorological variables, TOPO, LC, NDVI, POP, MOY, LAT, and LON over 2000–2009 and 2011–2019. The 2010 records are used to validate the performance of RF model, because land surface air temperature over Africa reached its peak during 2000–2019, which facilitates future projections in a warming climate. This data splitting strategy ensures the critical information related to rising temperature trends is captured in RF model projections. Based on trained RF model, the future monthly isoprene emissions from 2020 to 2054 under different climate scenarios (SSP1-2.6, SSP2-4.5, SSP3-7.0, and SSP5-8.5) in Africa are then predicted using future meteorological fields from CMIP6.
Secondly, to train the RF model for predicting future monthly near-surface O3 concentrations in Africa, we integrate O3 simulations from GEOS-Chem model, emissions and concentrations of O3 precursors, the ratio of VOCs emission to NOx emission, MERRA-2 meteorological variables, and auxiliary data. The samples over 2000–2009 and 2011–2019 are selected as training dataset and the remaining data over 2010 as testing data. We conduct two experiments to quantitatively estimate the direct (via altering meteorological conditions) and indirect (via altering biogenic isoprene emissions) effects of climate change on future O3 in Africa. By feeding the varying meteorological parameters into the trained model while fixing isoprene emissions in 2020, the climate-driven O3 variations through changing meteorological conditions are explored (O3_MET). Both the isoprene projections and CMIP6 multi-model projections from 2020 to 2054 under four scenarios are fed to the trained RF model to predict O3 (O3_ALL), and the difference of O3_ALL – O3_MET represents the impacts of changing isoprene emissions under climate change (O3_NAT).
The RF model's predictive performance was optimized through hyperparameter tuning. The best hyperparameters (n_estimators = 600, min_samples_split = 2, max_features = “sqrt”, bootstrap = “True”) of RF model for predicting isoprene emissions and O3 concentrations are tuned separately by 10-fold cross-validation (Rodriguez et al., 2010). To assess the accuracy of RF model, statistical metrics such as coefficient of determination (R2), mean absolute error (MAE), root mean square error (RMSE), and mean relative error (MRE) are calculated by comparing the outputs of RF model and GEOS-Chem model. Moreover, we employ the Shapley Additive explanation (SHAP) approach (Lundberg and Lee, 2017) to quantify the importance of individual factors determining the RF model's predictions. The SHAP provides a value that reflects the contribution of each input variable to specific predictions, and has been widely adopted in atmospheric environmental studies to enhance the interpretability of the ML model (Hou et al., 2022; Stirnberg et al., 2021).
2.4 Mortality burden assessment
Exposure to elevated temperatures and O3 pollution, exacerbated by global warming, significantly increases human health risks. We assess the future mortality ratio (MR) attributable to ambient O3 and temperature changes, respectively, under different scenarios in Africa from 2020 to 2054, using the following equations:
where MRozone (MRtemperature) stands for the MR due to O3 pollution (temperature) changes. RRozone,i and RRtemperature,i represent relative risks caused by O3 and temperature exceedance in a future (2050–2054) month i, respectively. RRozone,j and RRtemperature,j denote relative risk caused by O3 and temperature exceedance on a baseline (2020–2024) month j, respectively. m is the total number of months during future period, and n is the total number of months of baseline period. β1 indicates the O3 concentration response factor, with a value of (95 % confidence interval: , ) per ppb (Wang et al., 2025b). C0 is the theoretical minimum risk exposure level (TMREL) for O3 exposure, which ranges from 29.1 to 35.7 ppb (GBD 2019 Risk Factors Collaborators, 2020). Following Malashock et al. (2022), we use the medium value of 32.4 ppb in this study. C reflects the O3 concentrations predicted by the RF model. β2 signifies the temperature response factor, and each 1 °C increase in temperature over Africa is associated with a (95 % confidence interval: , ) rise in mortality risk (Cromar et al., 2022). T0 is the threshold value indicating minimum mortality temperature (MMT), an important indicator for characterizing the health impacts of global heating. The 50th percentile of temperature distribution corresponding to the MMT over Southern Africa was calculated to be 25 °C, which is used as the reference value for this study (Tobías et al., 2021). T reflects air temperature from the CMIP6 dataset. Similar calculation methodology has been applied in previous studies (Lee and Kim, 2016; Wang et al., 2022).
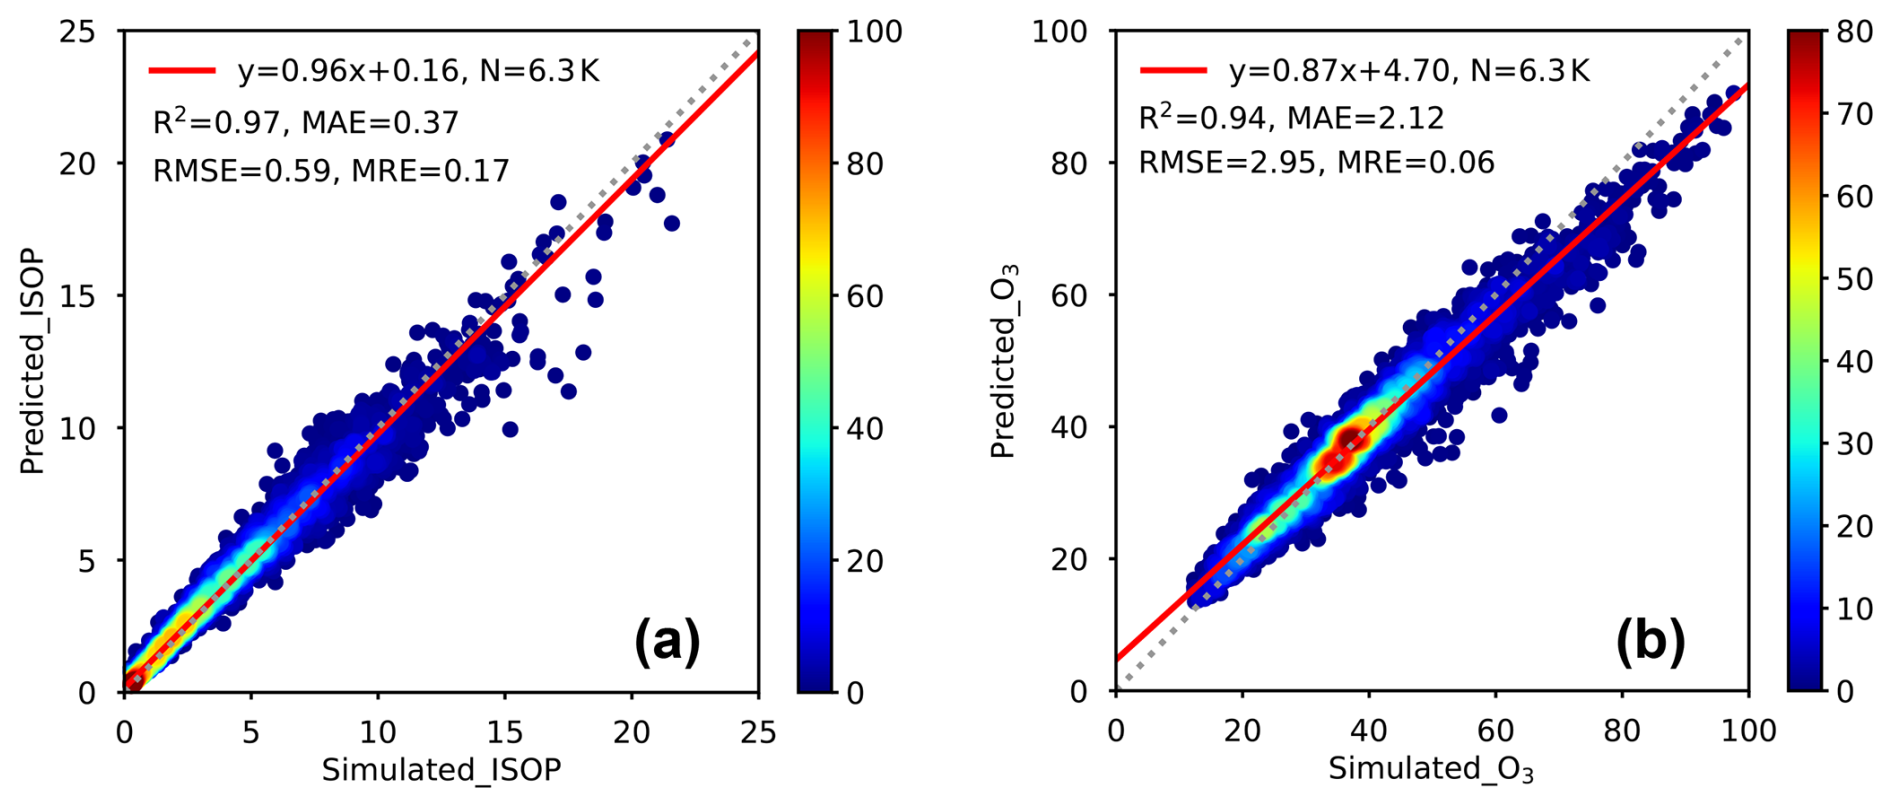
Figure 1Density plot of GEOS-Chem model simulated vs. Random Forest model predicted monthly (a) biogenic isoprene emissions () and (b) near-surface O3 concentrations (ppb) in 2010 over Africa. The gray dotted and red lines are the 1:1 lines and linear regression lines, respectively. Statistical metrics including correlation of determination (R2, unitless), root mean square error (RMSE, or ppb), mean absolute error (MAE, or ppb), and mean relative error (MRE, %) are given at the top of each panel.
3.1 Evaluation of machine learning model performance
We evaluate the ML model using a test dataset from 2010. Figure 1a and b illustrate the consistency between RF model projections and GEOS-Chem model simulations for isoprene emissions and near-surface O3 concentrations in Africa, respectively. The RF model exhibits a strong predictive capability in reproducing both isoprene emissions (R2=0.97, MRE = 17 %) and near-surface O3 concentrations (R2=0.94, MRE = 6 %). These robust statistical metrics confirm the trained RF model's suitability for predicting future O3 concentrations over Africa under a warmer climate.
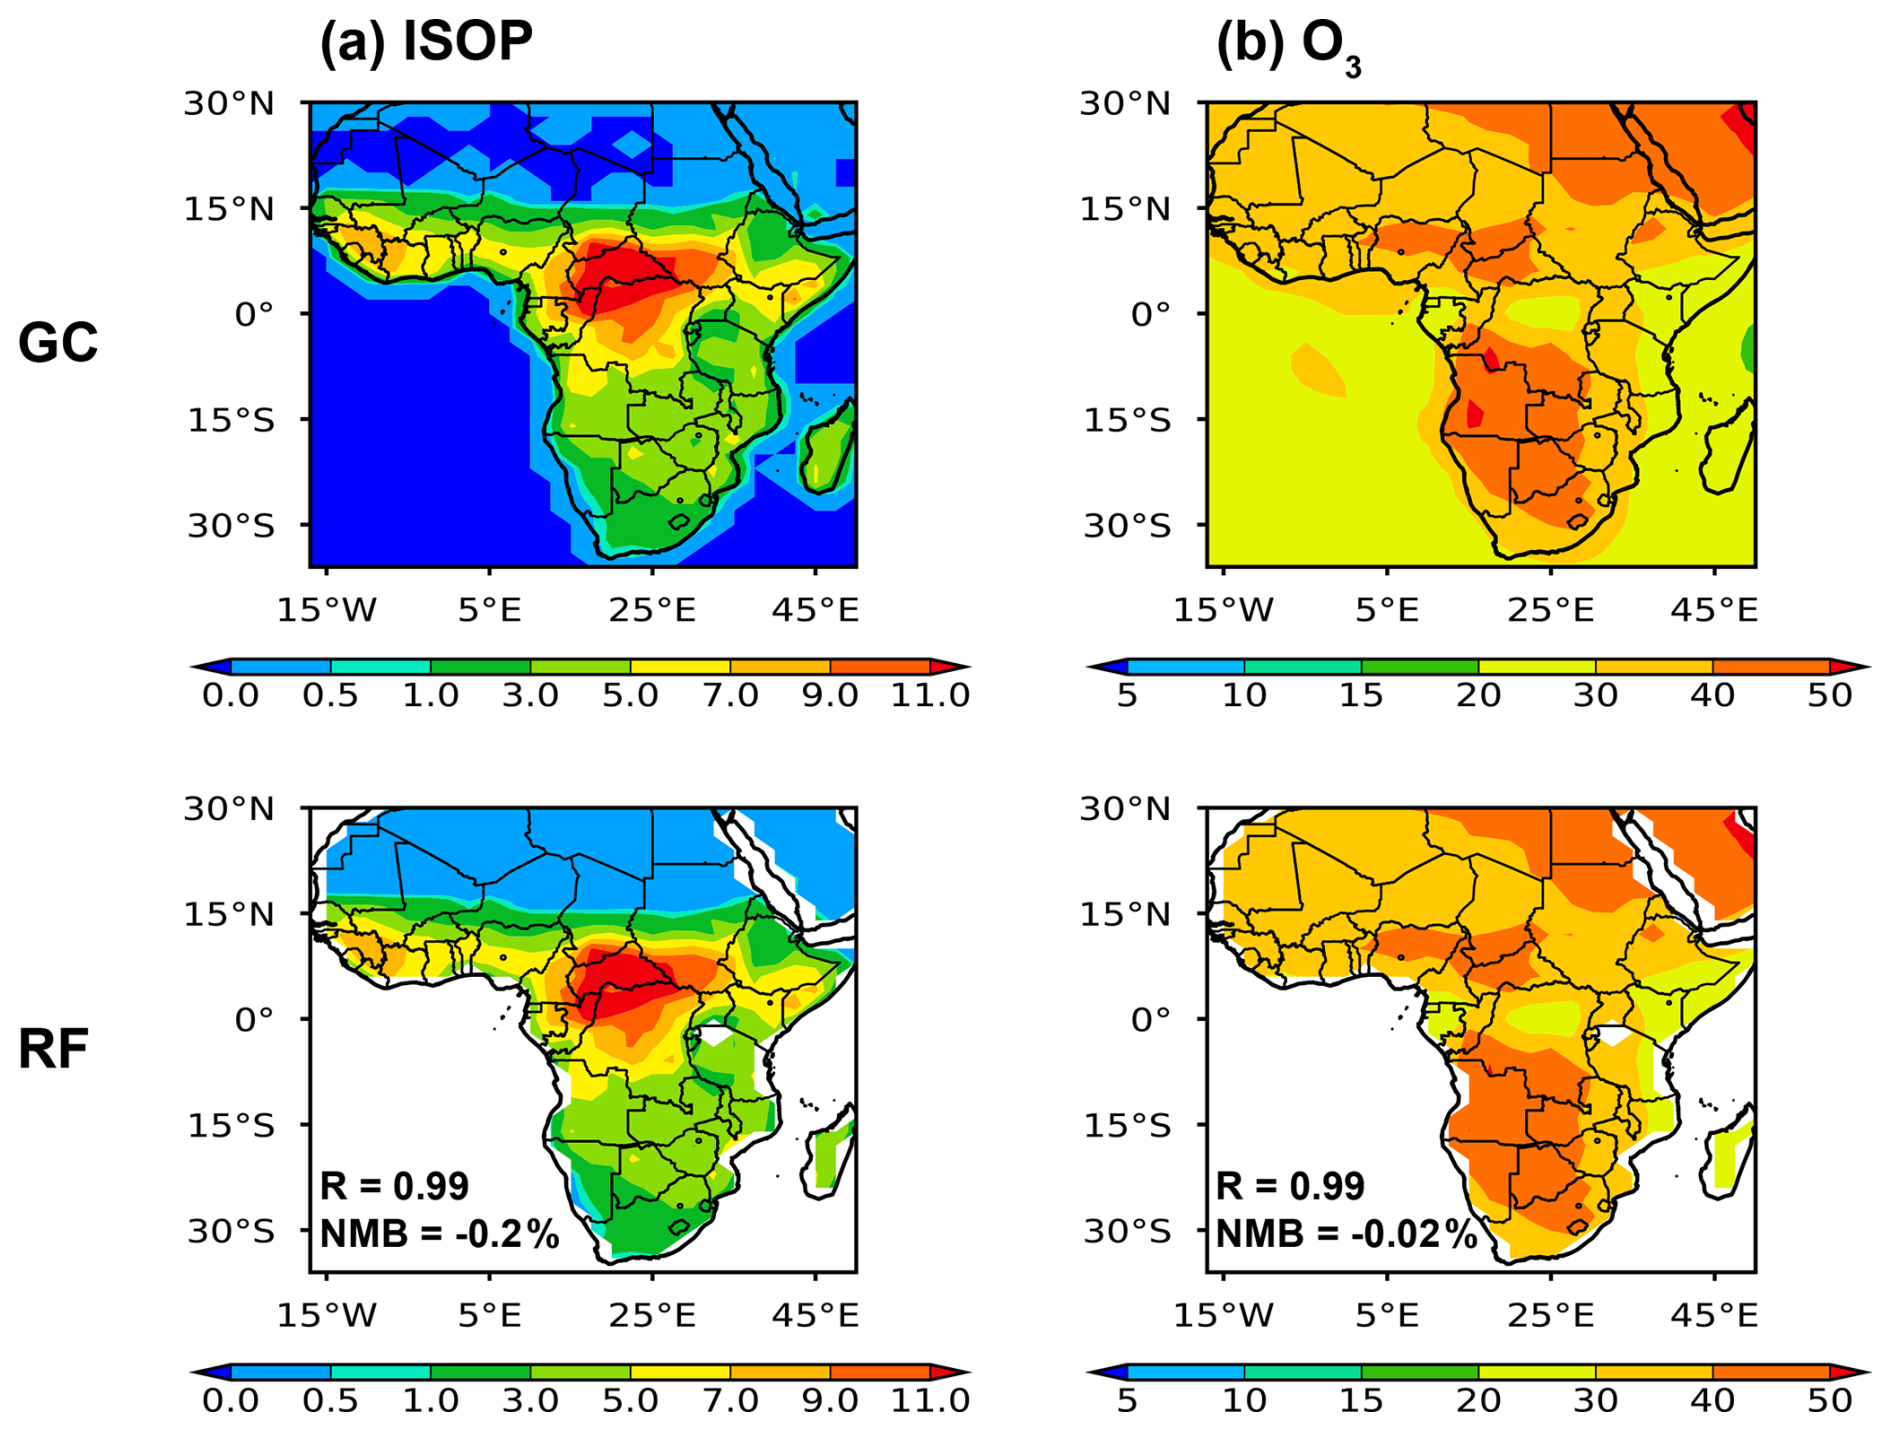
Figure 2Spatial distributions of (a) biogenic isoprene emissions (ISOP, ) and (b) near-surface O3 concentrations (ppb) derived from GEOS-Chem model (GC) and Random Forest model (RF) over Africa in 2000–2019. The correlation coefficient (R) between simulated and predicted O3 and the normalized mean bias (NMB = (Simulated − Predicted) Predicted × 100 %) are given at the bottom left of panels.
The isoprene emissions simulated by GEOS-Chem model during 2000–2019 reveal apparent regional discrepancies across Africa (Fig. 2a). The maximum isoprene emissions originate from evergreen broadleaf trees over Central Africa, which has the second largest tropical rainforest in the world. Southern Africa exhibits relatively lower isoprene emissions due to its sparse coverage of deciduous broadleaf trees. Northern Africa, dominated by deserts and semi-arid grasslands, contributes little to isoprene emissions. The isoprene projections estimated by the RF model perfectly capture the spatial distributions of isoprene emissions across Africa, with a correlation coefficient (R) between the RF projections and GEOS-Chem simulations of 0.99 and a normalized mean bias (NMB) of −0.2 %. In addition, the O3 concentrations from 2000 to 2019 simulated by GEOS-Chem model indicate that O3 pollution is predominantly concentrated in Southern Africa, as well as parts of Northern Africa and Central Africa, with concentrations over 40 ppb (Fig. 2b). The RF model accurately reproduces this spatial characteristic, which aligns well with the O3 simulation results (R=0.99, NMB = −0.02 %).
We further evaluated the RF-predicted O3 concentrations for 2020–2025 against ground-based observations from the South African Air Quality Information System (SAAQIS), which provides routine air quality measurements from monitoring stations across South Africa (Fig. S1 in the Supplement). We selected 94 monitoring sites with valid observations for at least three years during this period. To match the 2° × 2.5° model resolution, site-level mean O3 concentrations were aggregated within each model grid cell, yielding 11 grid-cell mean observations. These values were compared with RF-predicted O3 averaged over 2020–2025 and across the four SSP scenarios. The RF predictions reproduce a moderate degree of spatial variability across South Africa with a correlation coefficient of 0.54, but systematically overestimate observed O3 concentrations, with MAE of 11.92 ppb, RMSE of 12.93 ppb and NMB of 46.7 %. Although the grid-cell averaging reduces the mismatch between point observations and model grid cells, the monitoring sites are concentrated around Pretoria and coastal South Africa. Thus, unresolved urban emission gradients, local topography, and coastal meteorology, as well as the limited spatial coverage of the observations, may contribute to the disagreement.
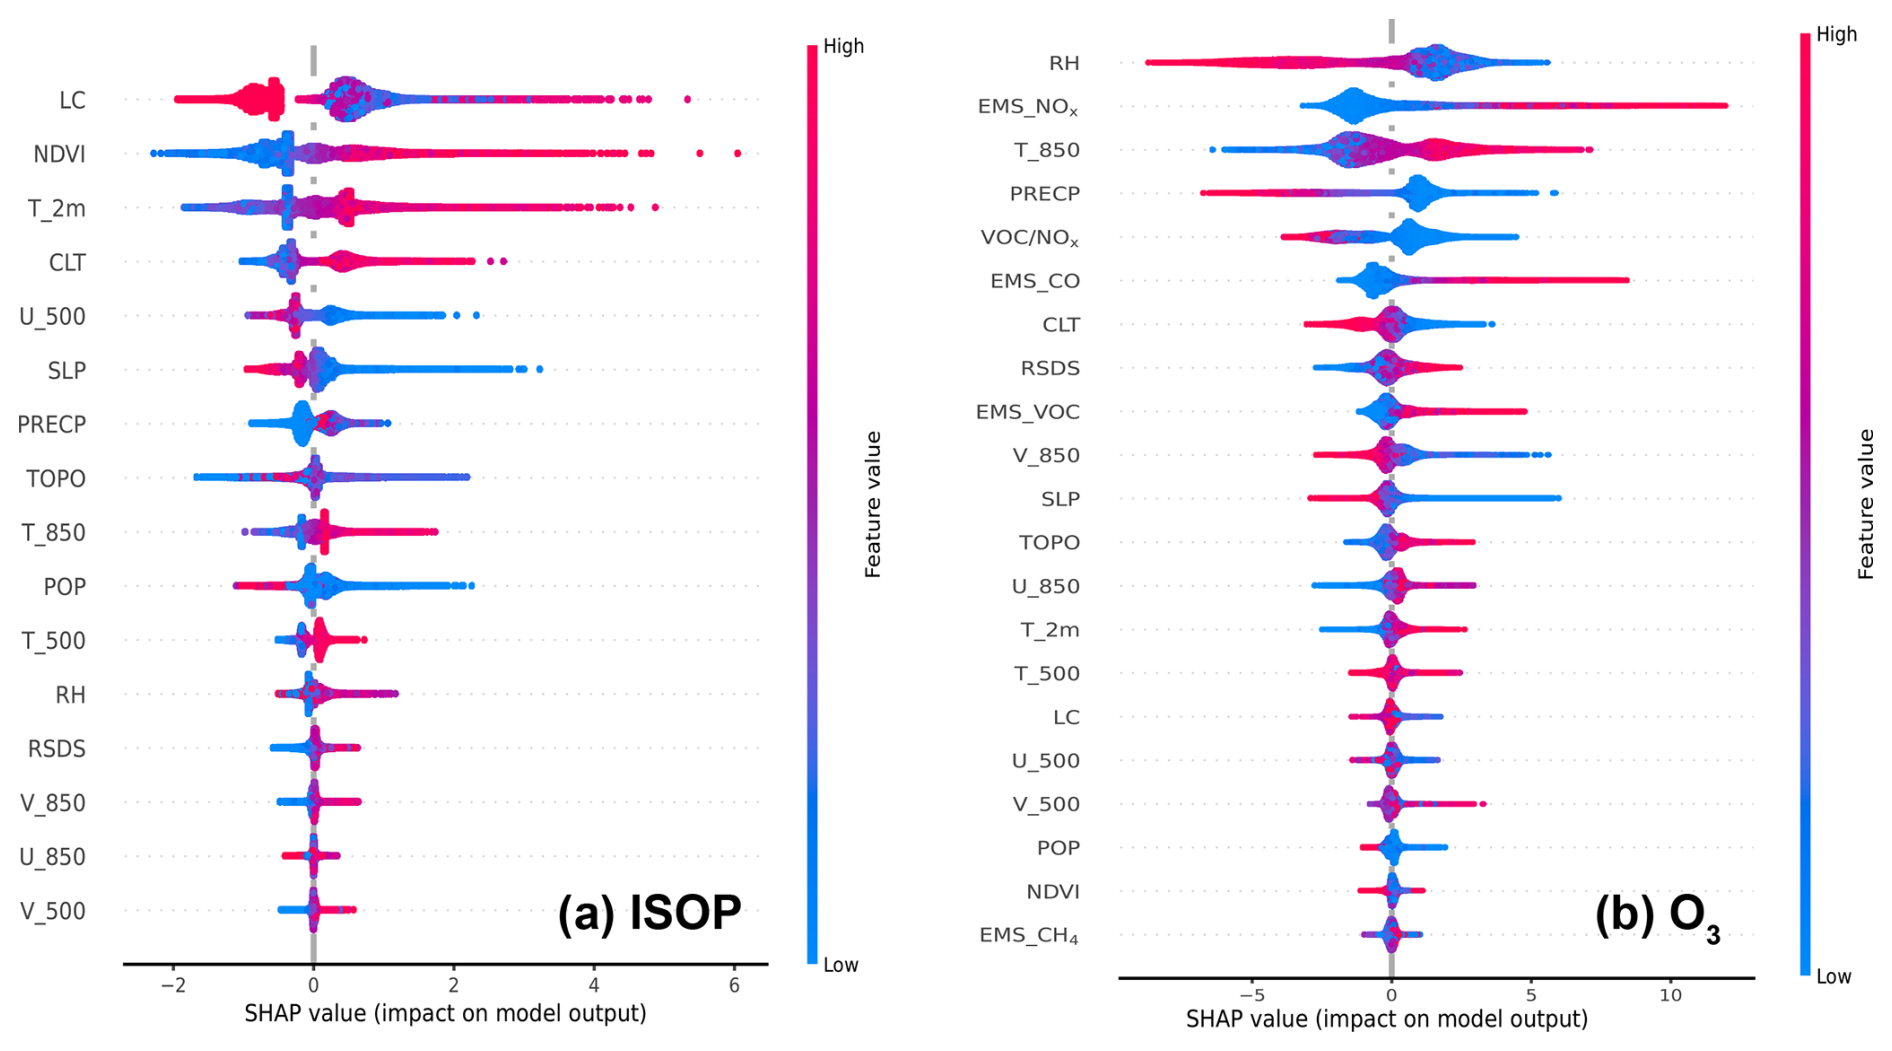
Figure 3Main and interactive effects of major input features on projections of (a) biogenic isoprene emissions (ISOP) and (b) near-surface O3 concentrations over Africa from Shapley Additive explanation (SHAP) analysis. The relative importance of selected independent features is shown in the descending order. A positive (negative) SHAP value suggests a positive (negative) contribution.
To gain deeper insights into the driving factors behind RF model outputs, we utilize SHAP, an explainable artificial intelligence technique, to quantify the contribution of each feature to the projections of biogenic isoprene emissions (Fig. 3a) and O3 concentrations (Fig. 3b) in Africa. The LC and NDVI are identified as the strongest positive drivers of isoprene emissions. This is consistent with the physics that biogenic isoprene is emitted mainly from terrestrial vegetation, and its emissions are directly influenced by LC types and the associated plant species (Guenther et al., 2006; Rosenkranz et al., 2015). Among all meteorological variables, air temperature plays a dominant role in regulating isoprene emissions, exhibiting a positive correlation, in line with prior work (e.g., Singsaas and Sharkey, 1998). The isoprene emission rates show opposite responses to wet weather conditions, as increases in the frequency and intensity of precipitation can influence plant functions (Strada et al., 2023). For O3 concentrations, meteorological factors – relative humidity, air temperature, precipitation, cloud cover, and incoming solar radiation – exert substantial influence, with temperature and solar radiation positively associated with O3 levels. Additionally, precursor emissions constitute a vital component in O3 formation. The VOCs-to-NOx emission ratio, used here as an indicator of O3 production regime in this study, is also a critical determinant of projected O3.
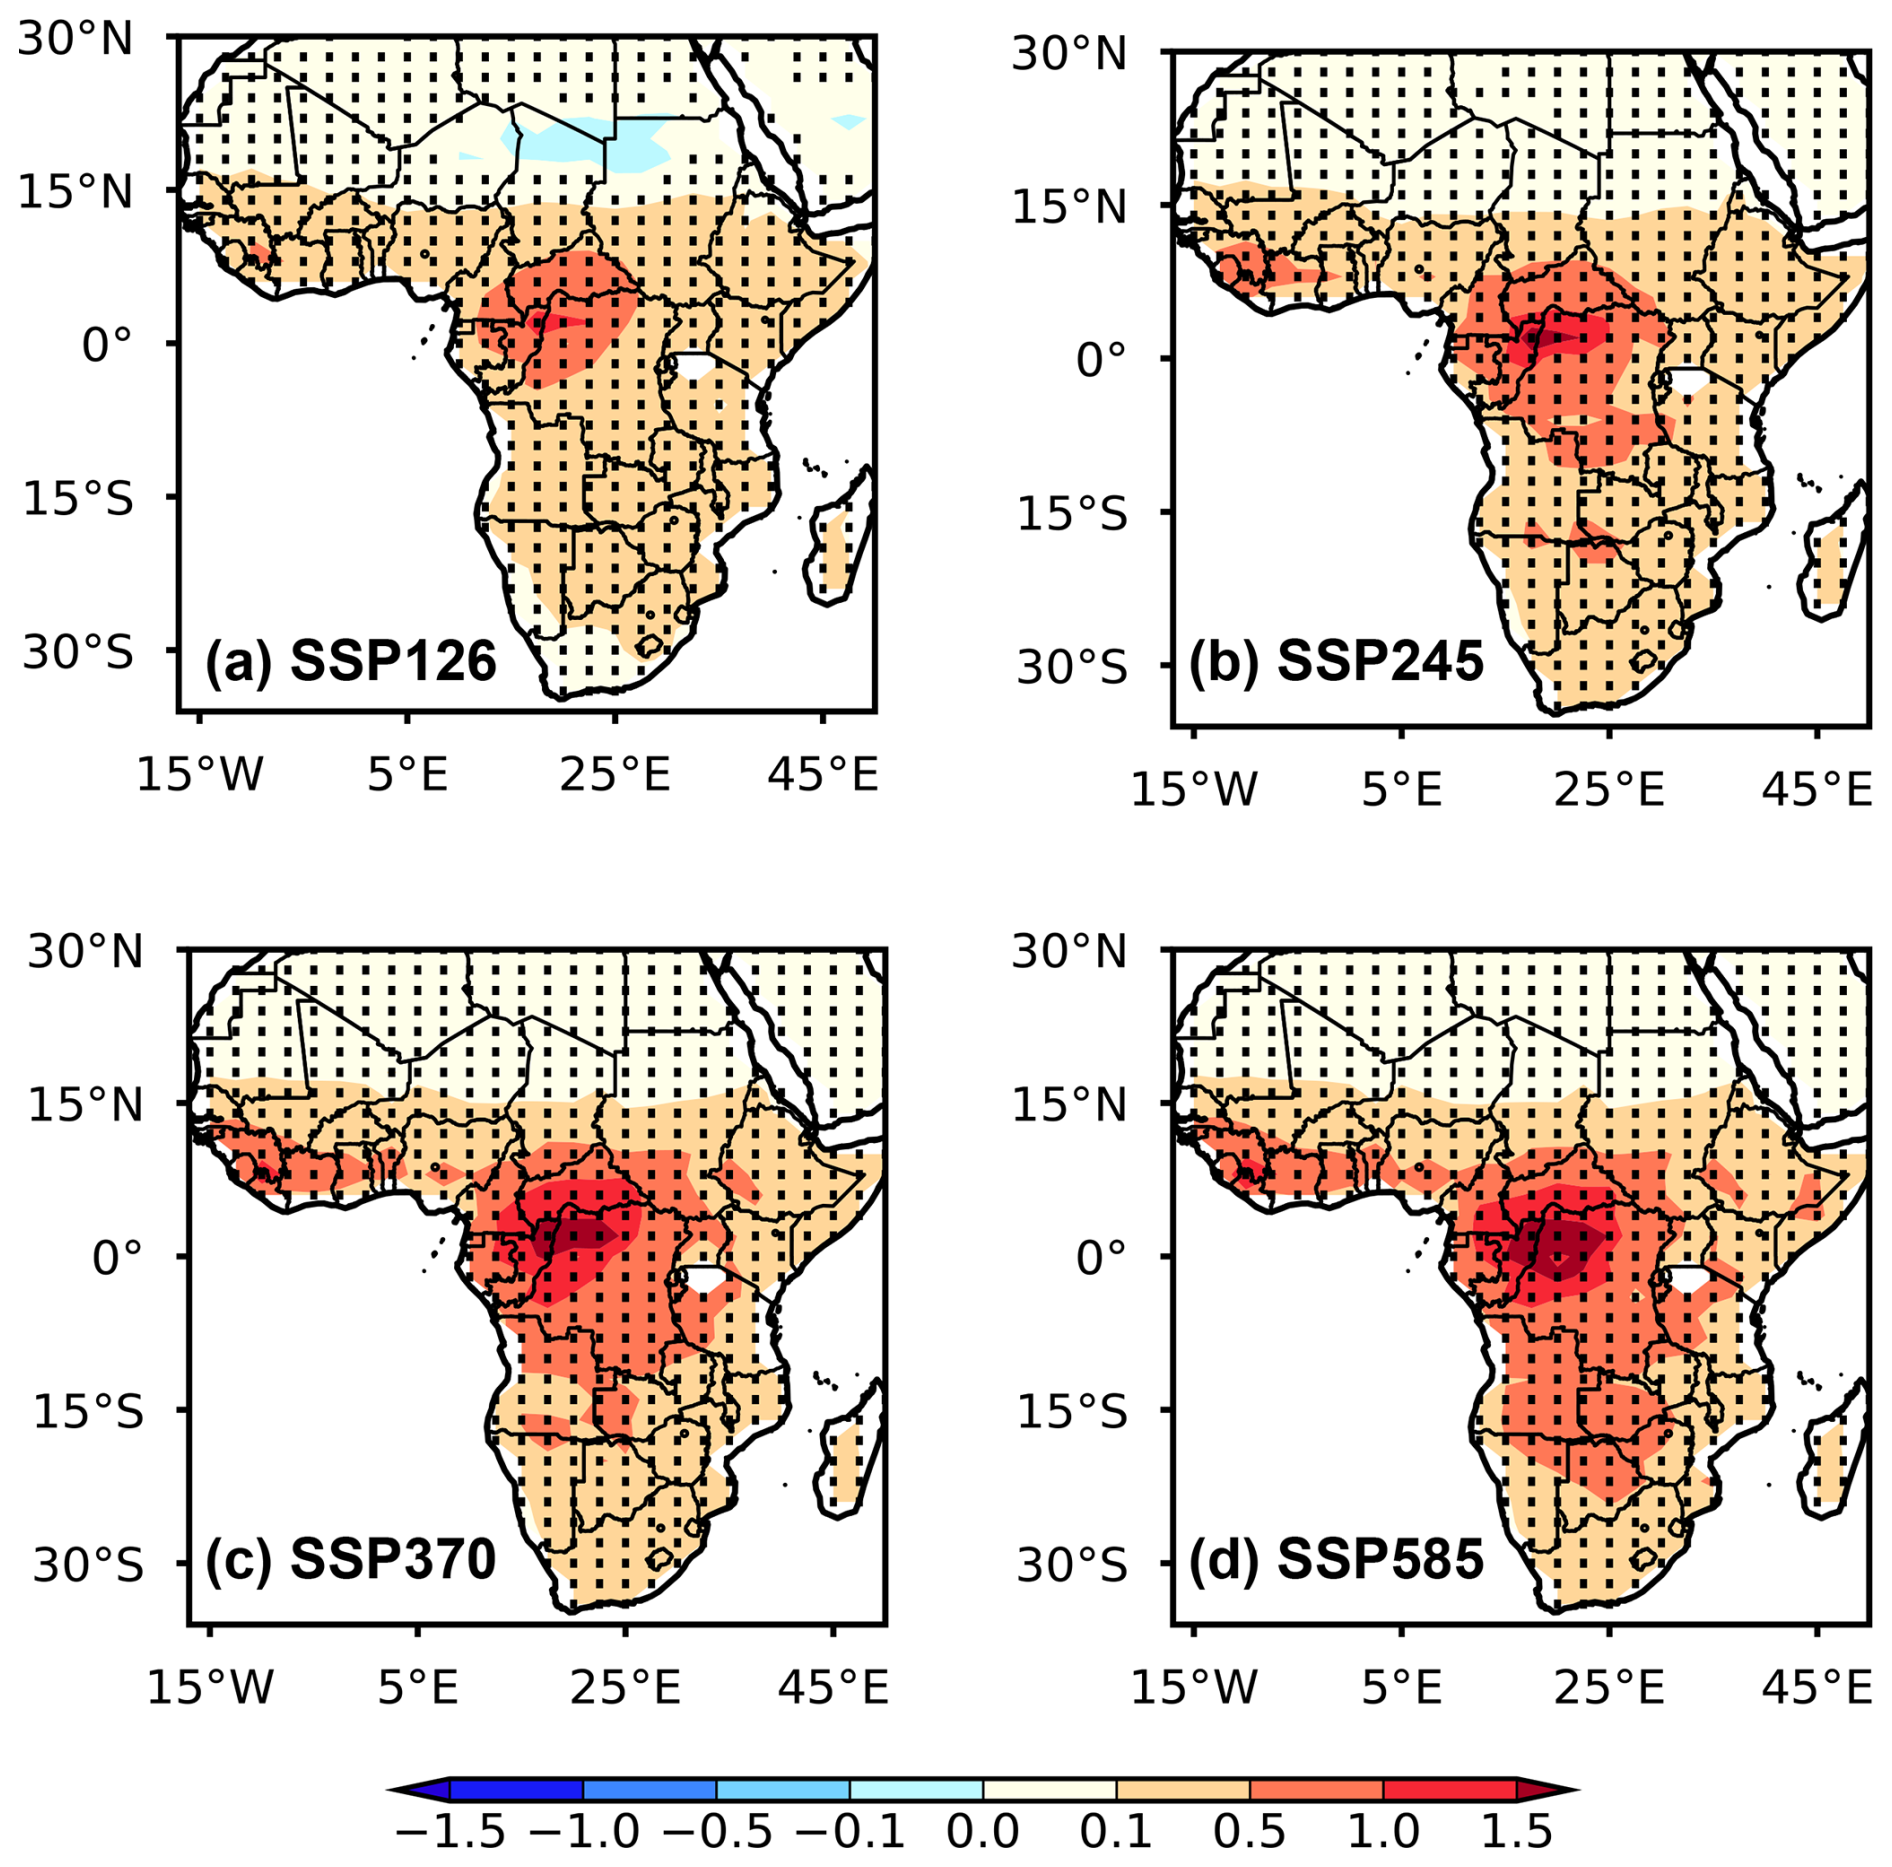
Figure 4Spatial distributions of differences in scenario-driven biogenic isoprene emissions () between 2050–2054 and 2020–2024 under (a) SSP1-2.6, (b) SSP2-4.5, (c) SSP3-7.0 and (d) SSP5-8.5 scenarios predicted by the RF model. The shaded areas indicate that the differences are statistically significant at the 90 % confidence level.
3.2 Climate-driven changes in biogenic isoprene emissions
The projected changes in RF-predicted isoprene emissions over Africa in 2050 (averaged over 2050–2054) relative to 2020 (averaged over 2020–2024) are shown in Fig. 4. The isoprene emissions show increasing trends under all four future scenarios. Shaped by the land cover characteristics in Africa, there is a distinct north-south spatial distribution pattern in the changes in isoprene emissions. Central Africa has the vast tropical forests and woodlands, serving as the major source of isoprene emissions and exhibiting the largest increases in biogenic isoprene emissions across Africa, with a maximum growth rate exceeding 1.0 under four scenarios. In contrast, the land use type in Northern Africa is dominated by barren land, resulting in consistently low isoprene emission levels. Compared to the period of 2020–2024, the projected changes of isoprene in Northern Africa for 2050–2054 are less than 0.1 , while the isoprene emissions increase by 0.1–0.5 over Southern Africa under all SSPs.
According to the feature contributions derived by SHAP analysis, biogenic isoprene emissions largely depend on meteorological fields, with air temperature (at 2 m) identified as the most critical factor (Fig. 3a). A comparison of future meteorological variables between 2050–2054 and 2020–2024 under different scenarios demonstrates that near-surface air temperatures elevate throughout the entire African continent in 2050–2054, with SSP5-8.5 presenting the strongest warming (Fig. 5). Therefore, isoprene emission rates are anticipated to rise, especially in the strong warming scenarios (i.e. SSP3-7.0 and SSP5-8.5). Besides, rising air temperature and dry conditions can further enhance isoprene release. The enhancement of projected isoprene emissions induced by drought stress is particularly pronounced over Central and Southern Africa (Fig. 6).
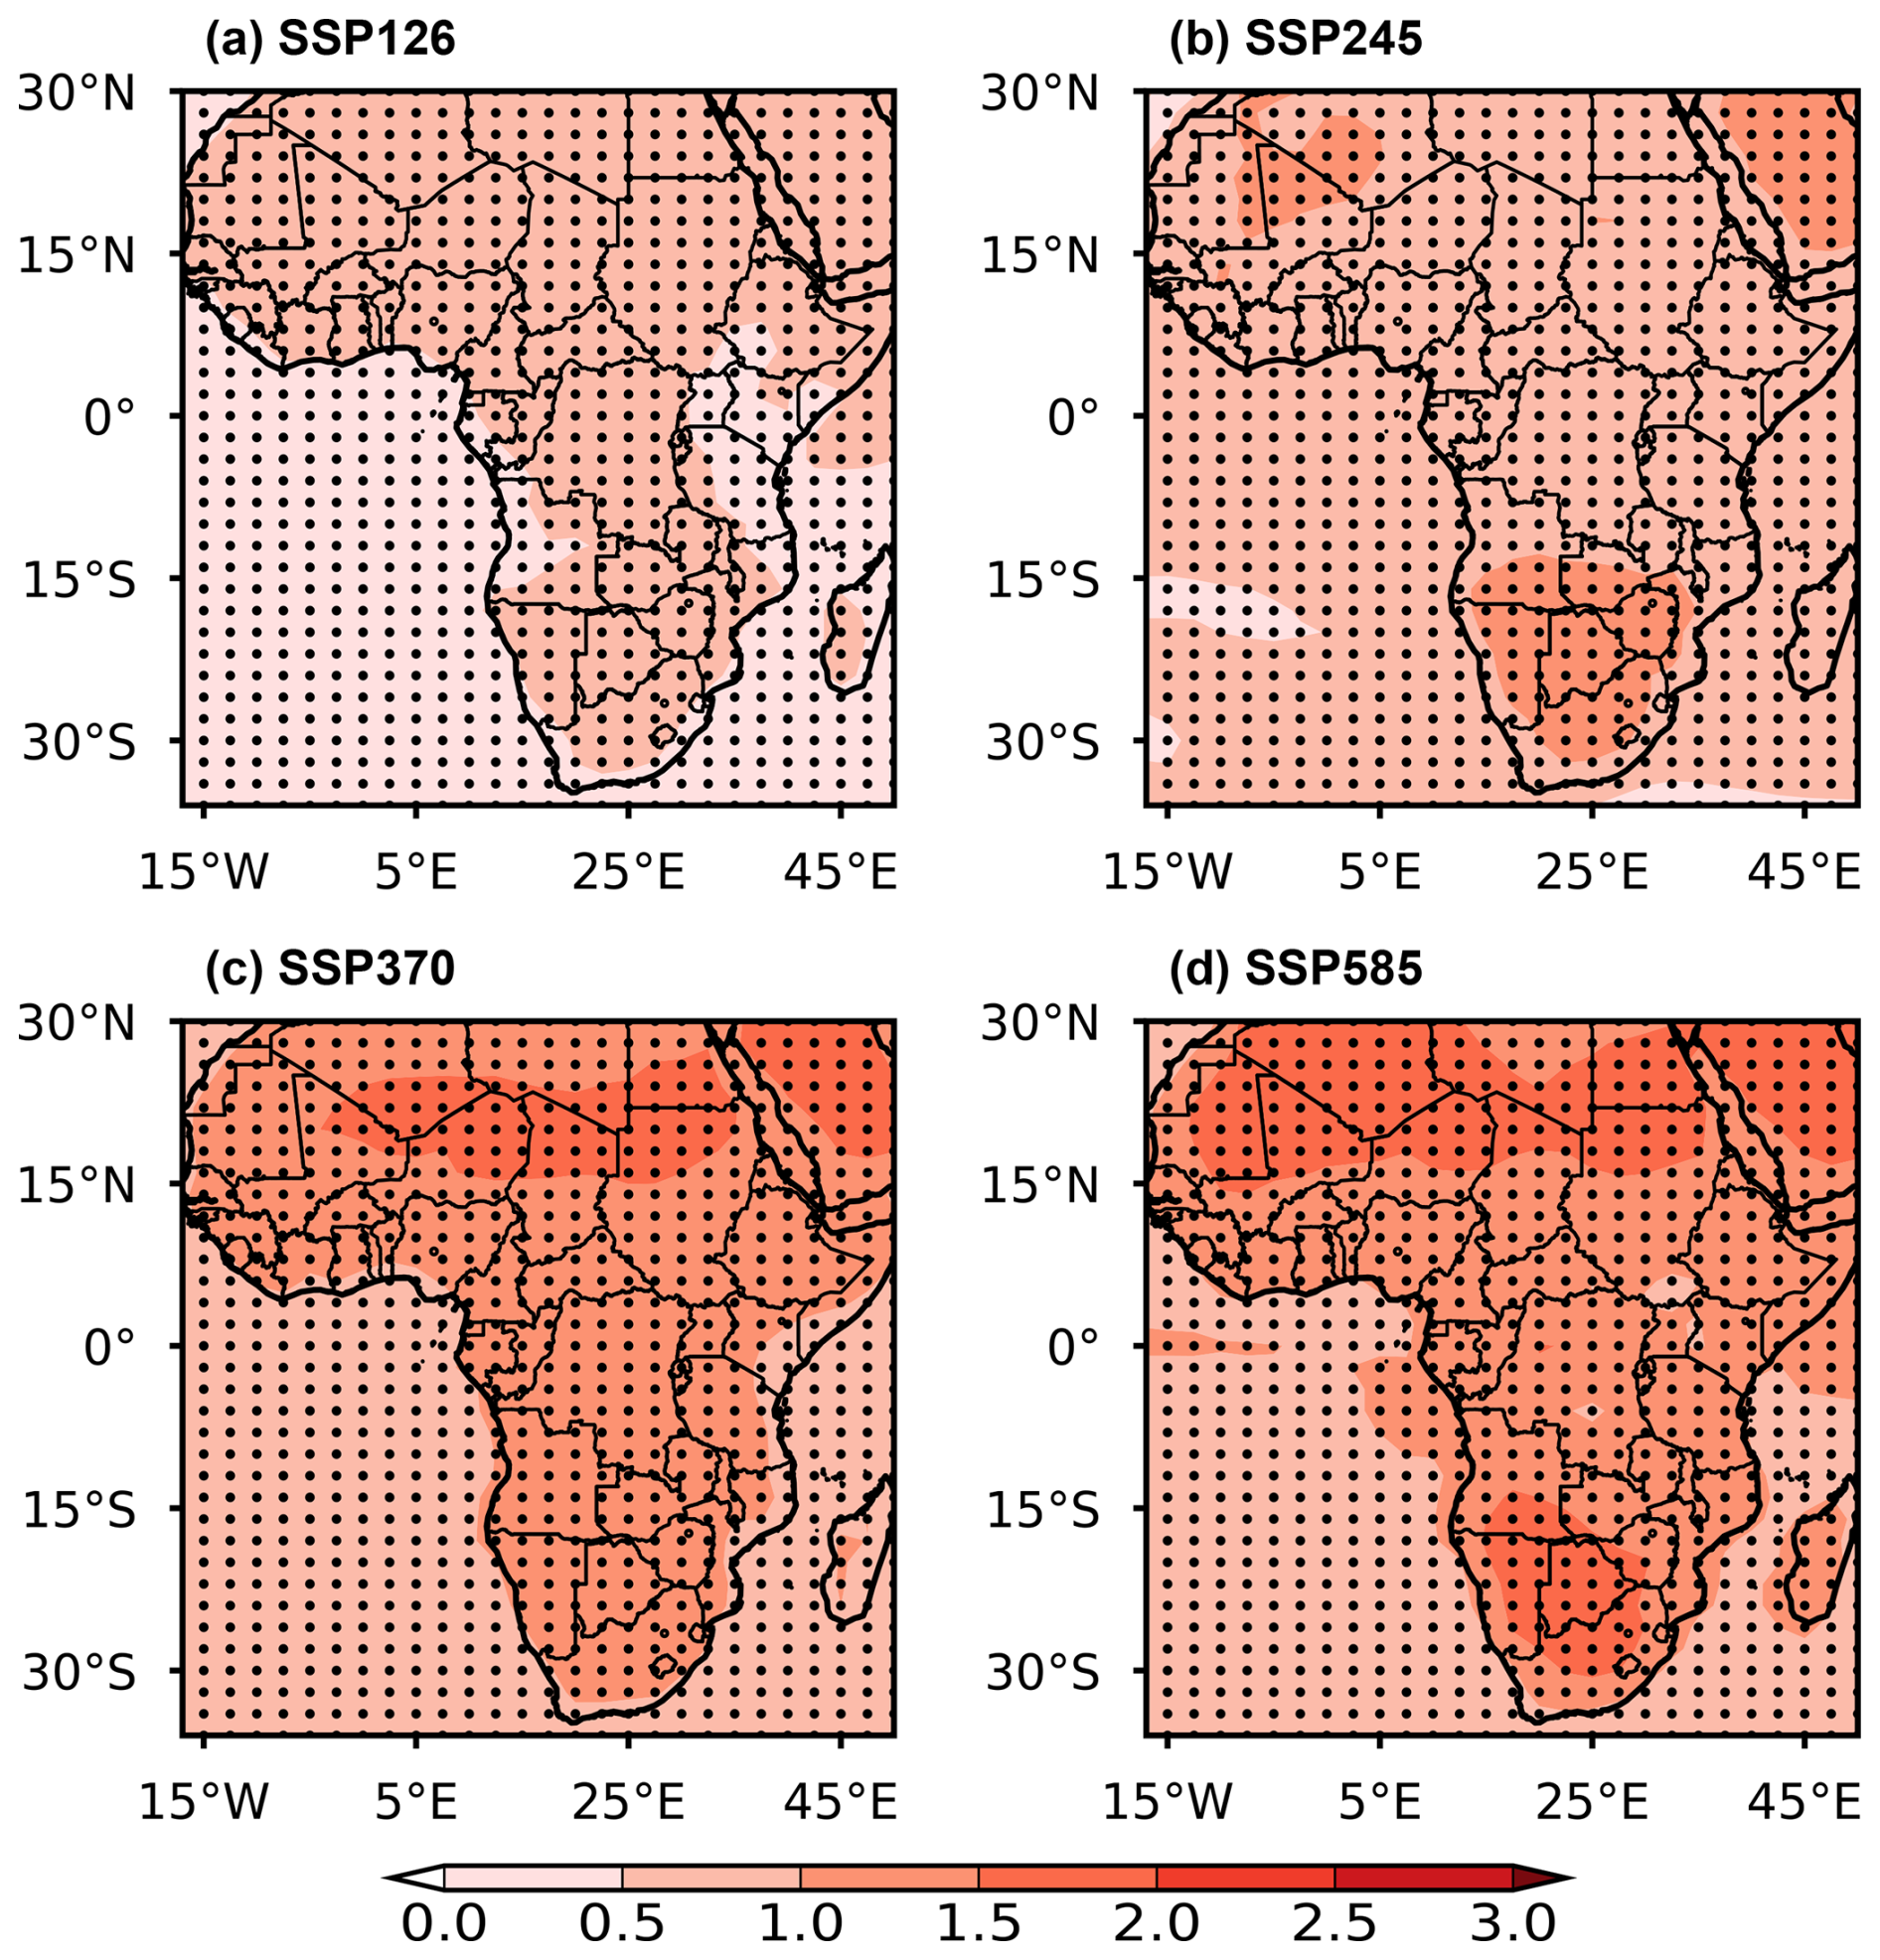
Figure 5Spatial distributions of differences in the CMIP6 multi-model mean of air temperature at 2 m (T_2m, K) between 2050–2054 and 2020–2024 over Africa under (a) SSP1-2.6, (b) SSP2-4.5, (c) SSP3-7.0 and (d) SSP5-8.5 scenarios. The shaded areas indicate that the differences are statistically significant at the 90 % confidence level.
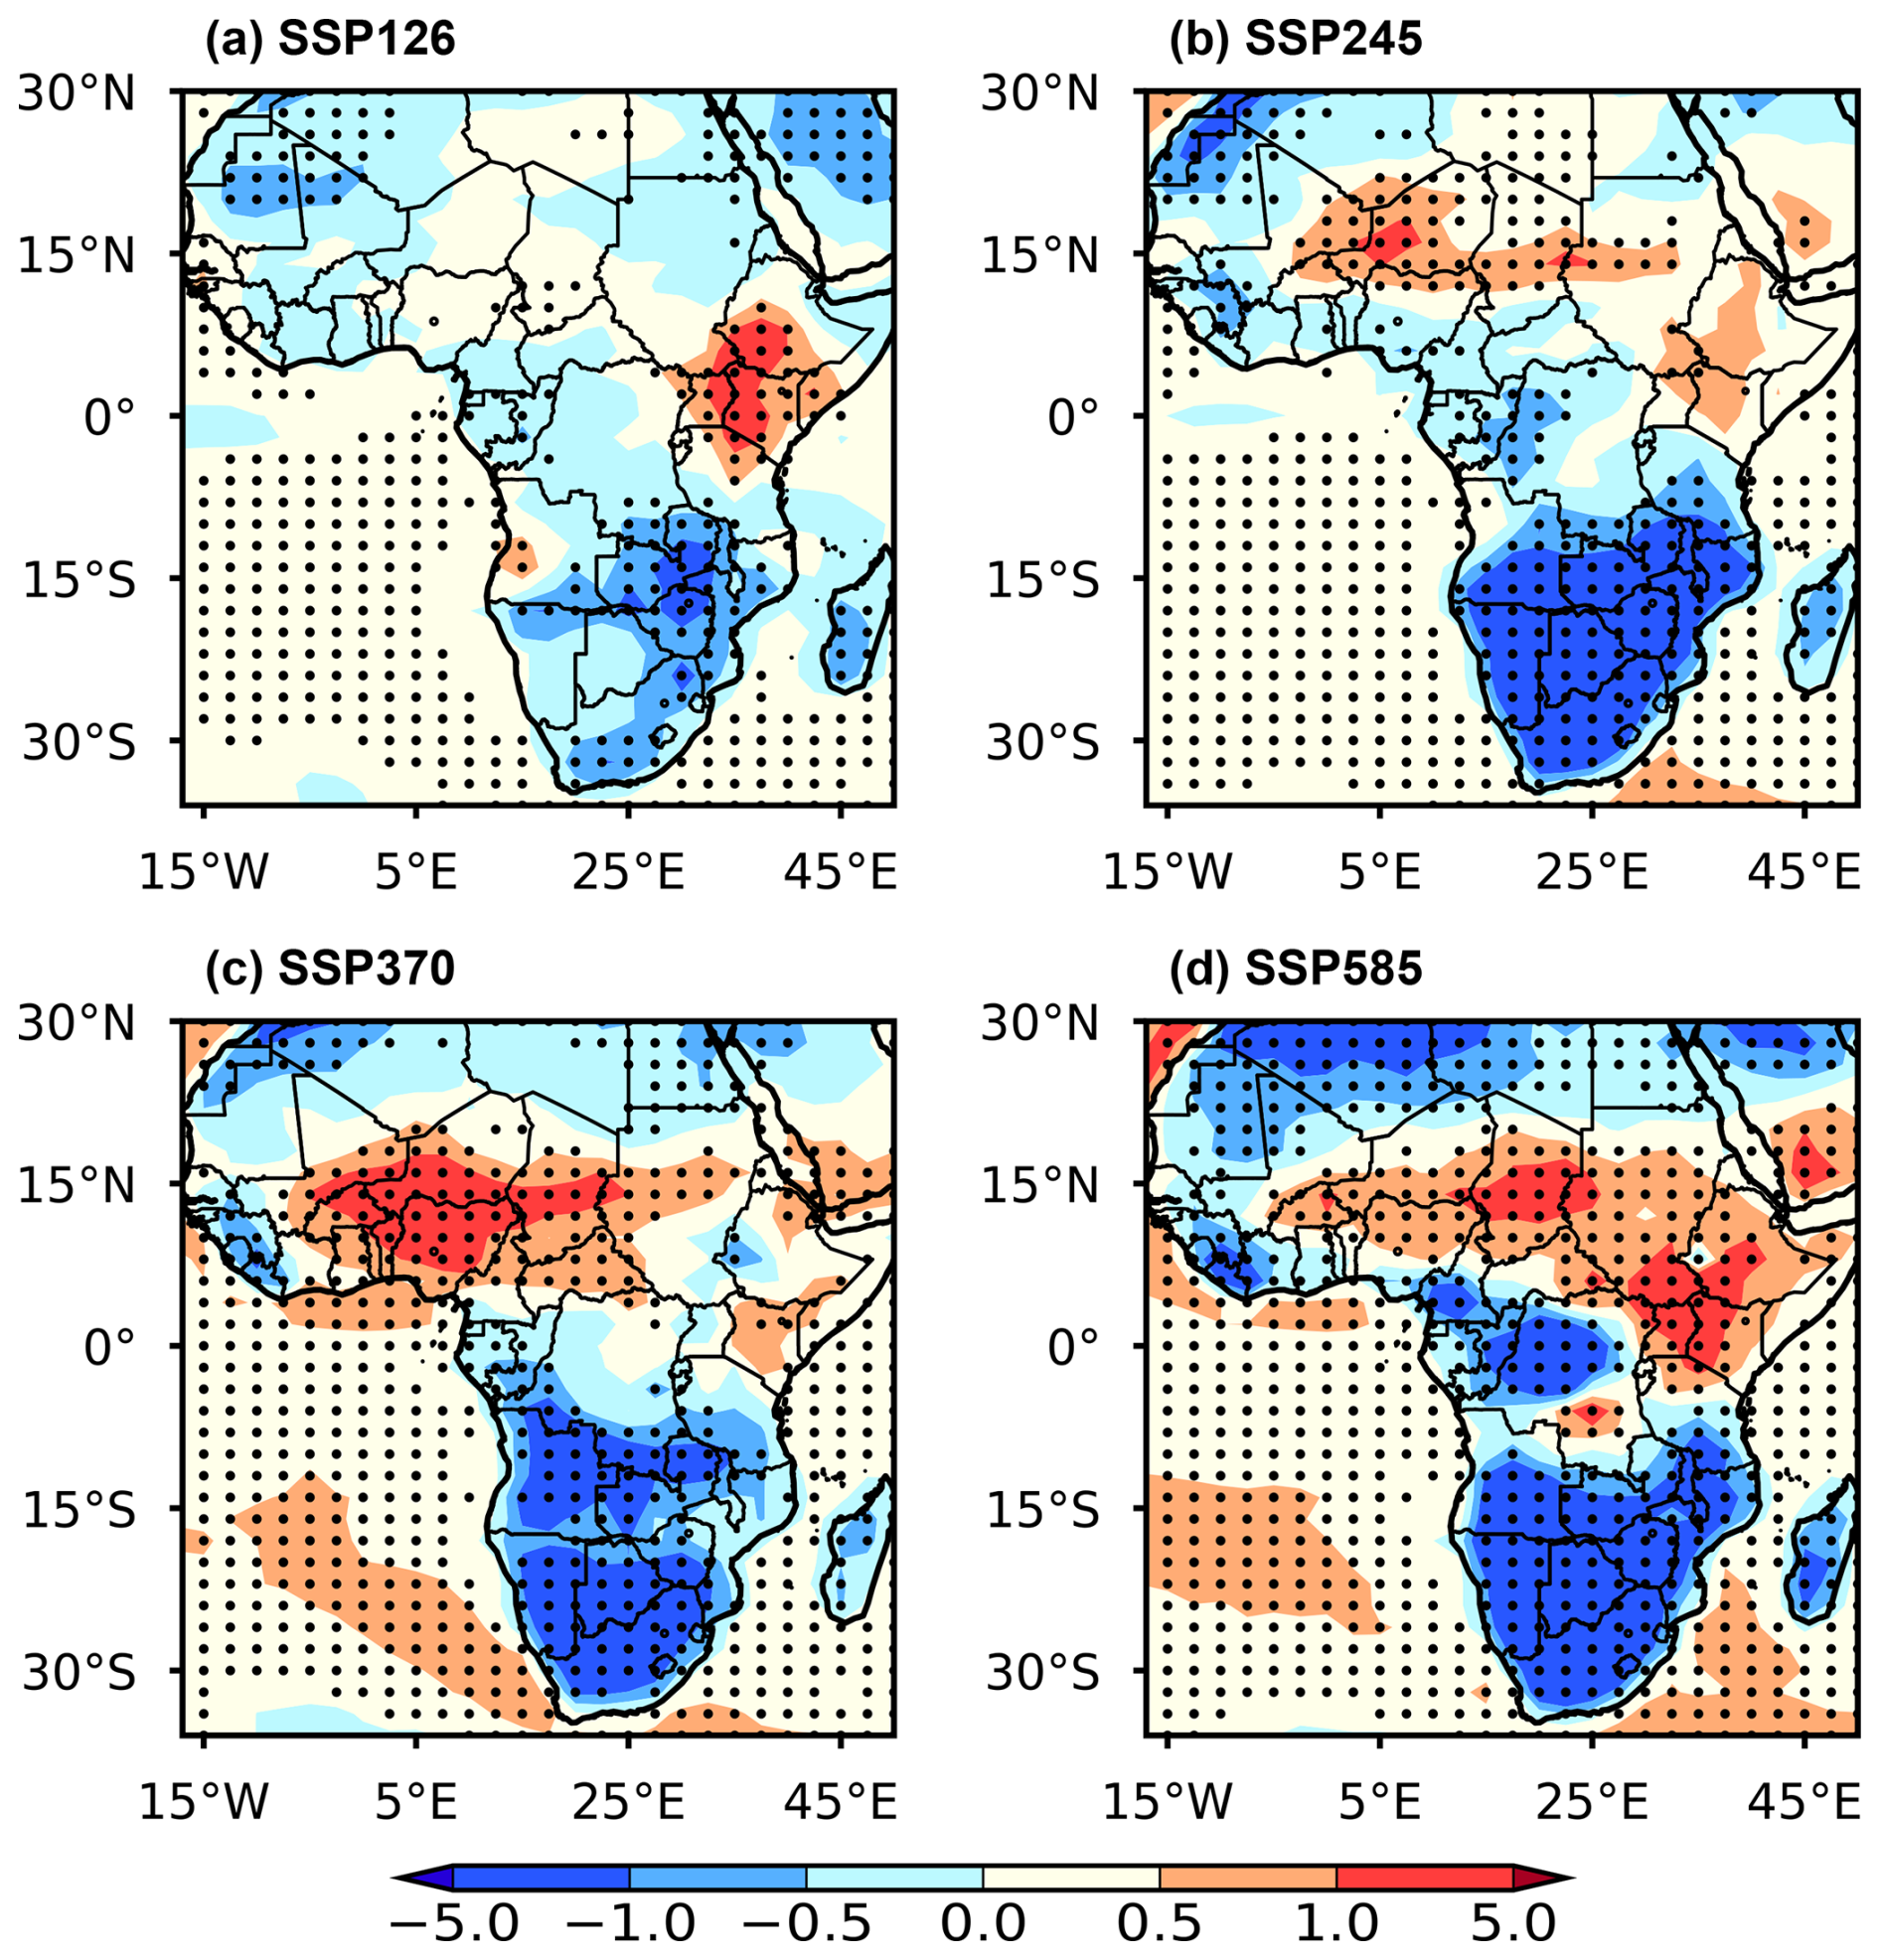
Figure 6Spatial distributions of differences in the CMIP6 multi-model mean of relative humidity (RH, %) between 2050–2054 and 2020–2024 over Africa under (a) SSP1-2.6, (b) SSP2-4.5, (c) SSP3-7.0 and (d) SSP5-8.5 scenarios. The shaded areas indicate that the differences are statistically significant at the 90 % confidence level.
Figure S2 shows the spatial distributions of biogenic isoprene emission changes during 2050–2054 compared to 2020–2024 in March–April–May (MAM), June–July–August (JJA), September–October–November (SON), and December–January–February (DJF) under the four scenarios. The changes in isoprene emissions do not show obvious seasonality, but there are relatively larger increases in MAM and DJF than other seasons.
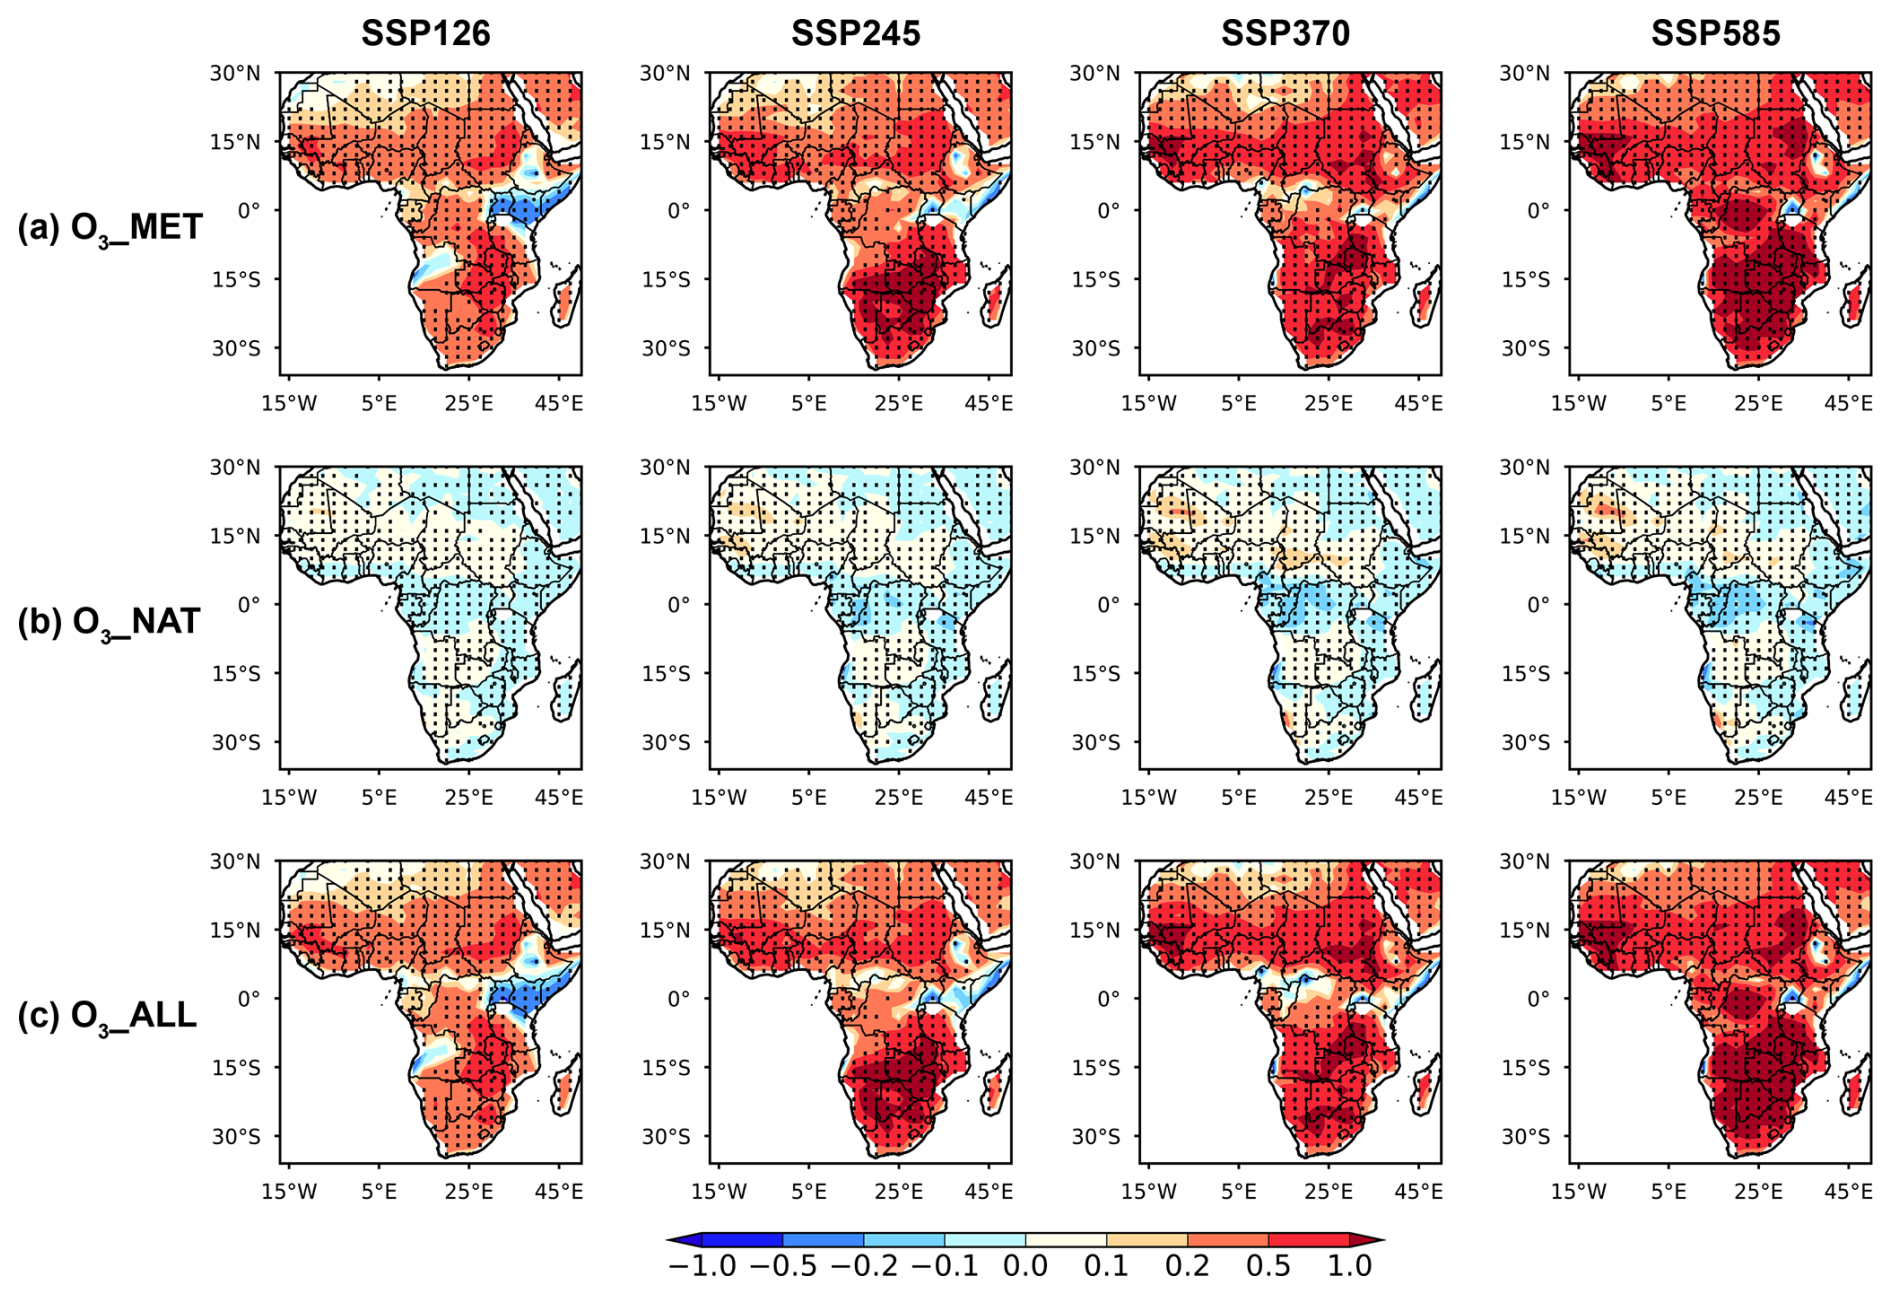
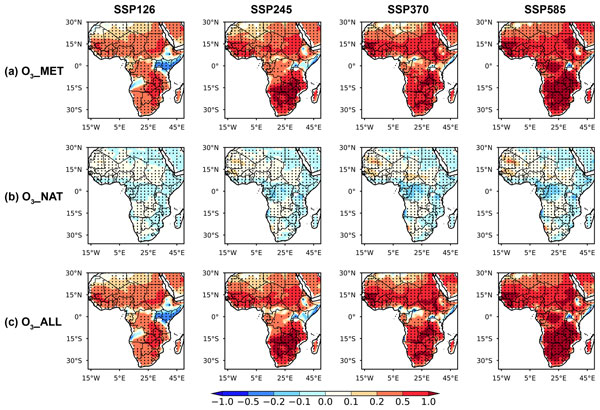
Figure 7Spatial distributions of differences in RF-predicted near-surface O3 concentrations (ppb) over Africa in response to (a) changes in meteorological fields (O3_MET), (b) changes in biogenic isoprene emissions (O3_NAT), and (c) both changes (O3_ALL) between 2050–2054 and 2020–2024 under SSP1-2.6, SSP2-4.5, SSP3-7.0 and SSP5-8.5 scenarios. The shaded areas indicate that the differences are statistically significant at the 90 % confidence level.
3.3 Climate-driven changes in future O3 concentrations over Africa
Figure 7a shows the changes in annual mean near-surface O3 concentrations in response to climate change under different scenarios, as projected by the RF model using future meteorological fields from 18 CMIP6 models (O3_MET). The projected O3 exhibits an overall increasing trend during 2050–2054 relative to 2020–2024, indicating a climate penalty on air quality over most African regions. Future increases in air temperature (Fig. 5), along with reductions in relative humidity (Fig. 6) and cloud cover (Fig. 8) will enhance photochemical O3 production, leading to substantial increases in O3 levels, with maximum increases over 1.0 ppb, even reaching 2.0 ppb, under strong warming scenarios. Under the weak warming scenario SSP1-2.6, the climate-driven O3 increases are relatively small, with increases of less than 1.0 ppb across Africa.
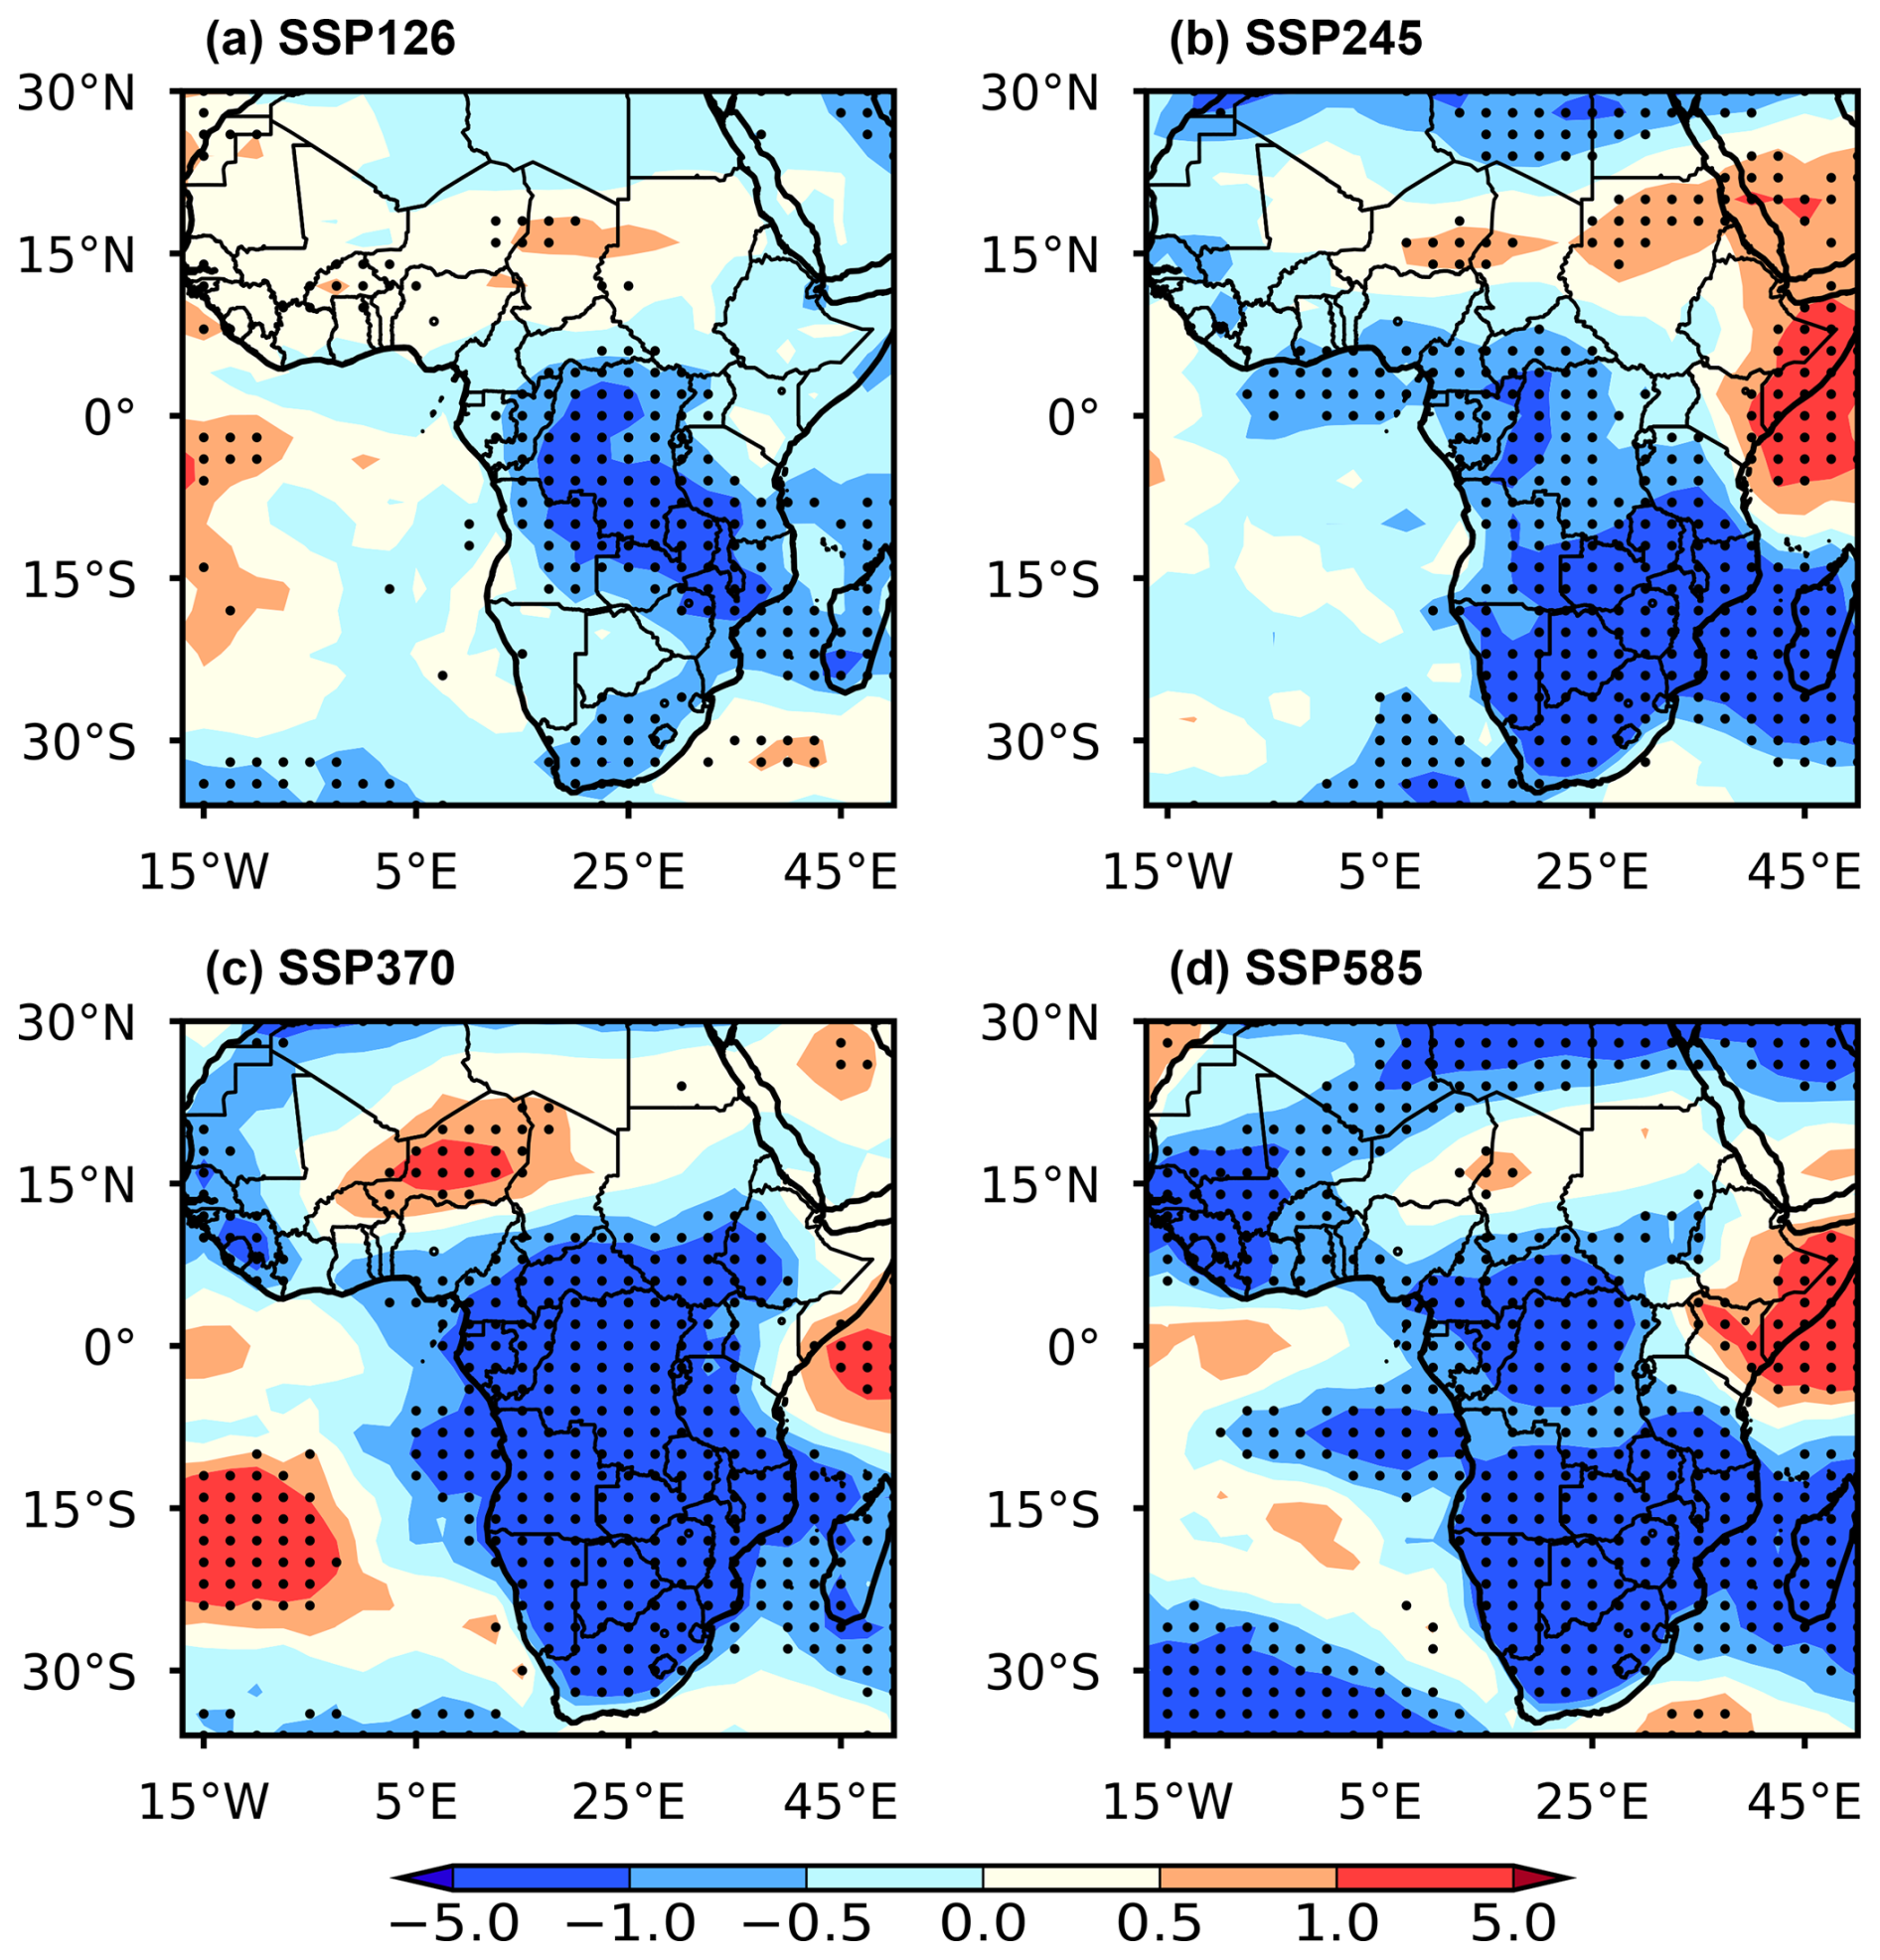
Figure 8Spatial distributions of differences in the CMIP6 multi-model mean of total cloud cover (CLT, %) between 2050–2054 and 2020–2024 over Africa under (a) SSP1-2.6, (b) SSP2-4.5, (c) SSP3-7.0 and (d) SSP5-8.5 scenarios. The shaded areas indicate that the differences are statistically significant at the 90 % confidence level.
The VOCs-to-NOx emission ratio was included as a predictor to represent, in a simplified way, the nonlinear response of O3 to precursor emissions. It is not used here as a diagnostic of a uniform O3 production regime. Precursor sensitivity can vary spatially and seasonally. NOx-rich urban environments and dry season biomass burning plumes can favor VOC-sensitive conditions and are closely linked to enhanced O3 over southern Africa (Swap et al., 2003; Wang et al., 2025a). In the O3_NAT sensitivity experiment, only biogenic isoprene emissions are allowed to vary, whereas biomass burning and other non-isoprene precursor emissions are held fixed at their baseline values. Accordingly, Fig. 7b indicates an annual mean and model-derived O3 decrease of less than 0.5 ppb over Central and Western Africa in response to the isolated isoprene perturbation. This result should not be generalized to urban or biomass burning-influenced regions or seasons. The total effects of changing meteorological factors and biogenic isoprene emissions on O3 variations are similar to those due to changes in meteorological factors alone, as depicted in Fig. 7c (O3_ALL). In summary, the climate-driven changes in meteorological parameters exert a more dominant role in regulating future O3 concentrations over Africa through changing physical and chemical processes, while the changing biogenic isoprene emissions exerts a minor role.
Climatology of meteorological fields over Africa has obvious seasonal characteristics, and the formation of near-surface O3 is tightly coupled with climate-driven processes. Figures S3–S6 show the spatial distribution changes in seasonal O3 concentrations influenced by meteorological fields and biogenic isoprene emissions under climate change. O3 concentration increases the most during MAM, with a maximum rise reaching up to 3.8 ppb over Central and Southern Africa under the SSP5-8.5 scenario (Fig. S3). In contrast, parts of Southern Africa show an O3 decrease of 0.2–1.0 ppb during SON under all scenarios (Fig. S5). Figure S5a shows that this decrease occurs in the O3_MET experiment, in which meteorological fields vary while biogenic isoprene emissions are fixed at their 2020 values. The similar spatial pattern in Fig. S5a and c indicates that, within the present sensitivity approach, the projected SON O3 decrease over Southern Africa is mainly driven by meteorological changes. In the RF model, this response is associated with higher sea level pressure (Fig. S7) and its negative relationship with O3 (Fig. 3b). Nevertheless, SON overlaps with the late dry season biomass burning period over much of southern Africa, and biomass burning is known to strongly affect regional O3 chemistry through emissions of NOx and VOCs (Archibald et al., 2010; Swap et al., 2003). Additionally, a decrease exceeding 0.5 ppb is expected across Central Africa in DJF under the strong warming scenarios (Fig. S6), largely driven by the rapid increases in precipitation frequency (Fig. S8). Moreover, increasing isoprene emissions also contribute to the decrease in O3 concentrations by 0.2–0.5 ppb over Eastern and Central Africa during JJA (Fig. S4).
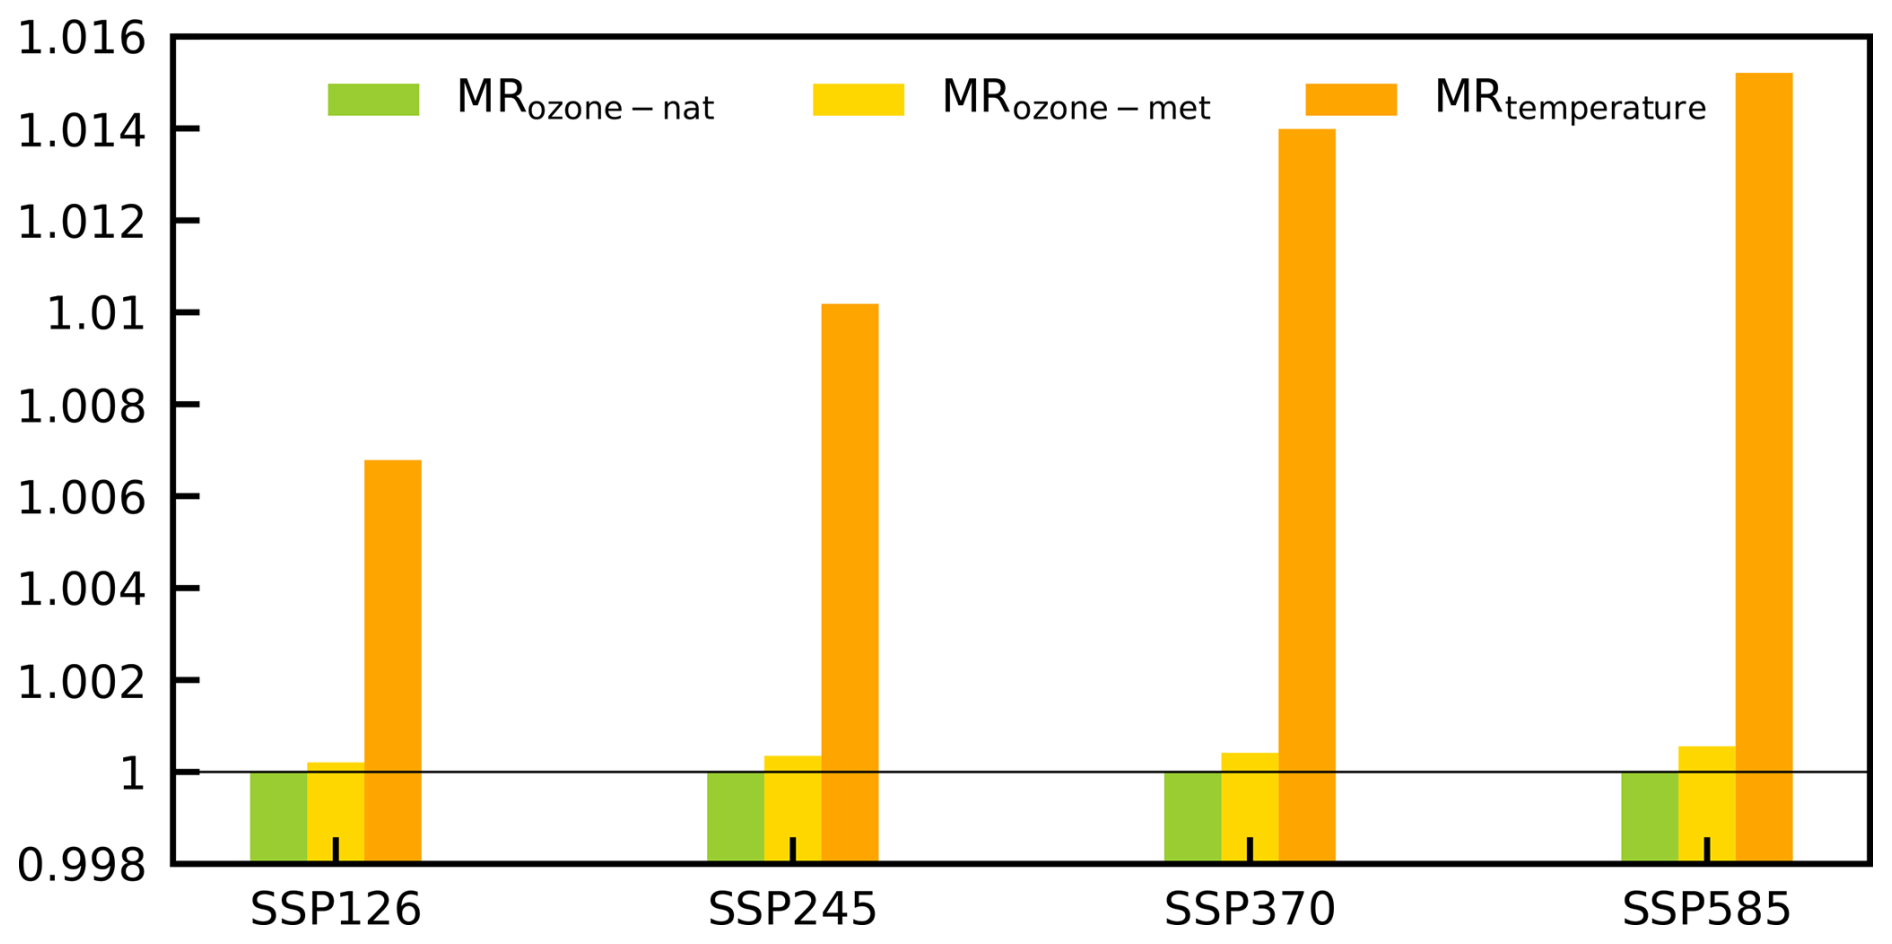
Figure 9Mortality ratio over Africa due to climate-driven changes in O3 levels related to natural emissions (MRozone−nat), O3 levels related to meteorological fields (MRozone−met), and air temperature (MRtemperature) in 2050–2054 relative to 2020–2024 under SSP1-2.6, SSP2-4.5, SSP3-7.0 and SSP5-8.5 scenarios.
3.4 Projection of mortality attributed to O3 and temperature
Figure 9 shows the relative changes in future projected mortality burden in 2050 compared to that in 2020 corresponding to changes in O3 concentrations and air temperatures across Africa under the four future scenarios. The mortality due to the changes in O3 pollution driven by changes in meteorological factors and biogenic isoprene emissions are separately investigated. It is worth noting that the potential amplification or suppression effects of interactions between O3 and temperature on mortality are not considered in this study.
Mortality ratios (MRs) over Africa are presented in 2050 relative to 2020, with temperature-related MRs (MRtemperature) increases much higher than those due to the climate-driven increases in O3 exposure levels (MRozone), particularly under the SSP3-7.0 and SSP5-8.5 scenarios. This demonstrates that increases in extreme heat in a warmer future are projected to cause substantially more deaths than the climate-driven increases in extreme O3 concentrations across Africa. The MRtemperature ranges from 1.007 to 1.015, with an average of 1.0115. The MRs due to climate-driven O3 changes related to the meteorological parameters (MRozone−met) show a slight increase from 1.0002 to 1.0006, as the climate warms. In contrast, MRs attributed to climate-driven O3 changes related to biogenic isoprene emissions (MRozone−nat) do not show any noticeable change under different scenarios, which exceed 1.0 only under the SSP3-7.0 scenario. Nevertheless, these suggest that environmental conditions for human health in Africa will deteriorate in a warming climate with more frequent extreme heat together with intensified O3 pollution.
Africa is a vast continent with a population accounting for more than one-eighth of total population in the world. In the process of rapid urbanization, industrialization, and motorization, the O3 pollution across the continent has been exacerbating, which poses a serious threat to the public health. In this study, we predict future near-surface O3 concentrations over Africa from 2020 to 2050 driven by climate change under four different scenarios (SSP1-2.6, SSP2-4.5, SSP3-7.0, and SSP5-8.5) based on an interpretable RF model integrated with multi-source data, such as GEOS-Chem model simulations, future meteorological fields from CMIP6 multi-model outputs, O3 precursor emissions, topography, land use, population density, and spatiotemporal information.
Biogenic isoprene emissions are strongly influenced by land use and climate change, which in turn modulate O3 concentrations through atmospheric photochemical reactions. With rising air temperatures, the RF model-projected biogenic isoprene emissions across Africa are expected to increase in 2050 relative to 2020 under future climate scenarios. Owing to distinctive characteristics of vegetation coverage and composition, the most substantial increase of isoprene emissions occurs over Central Africa, where the maximum increase is projected to exceed 1.0 under the SSP2-4.5, SSP3-7.0, and SSP5-8.5 scenarios. In contrast, the isoprene emissions in Northern Africa show minimal variability.
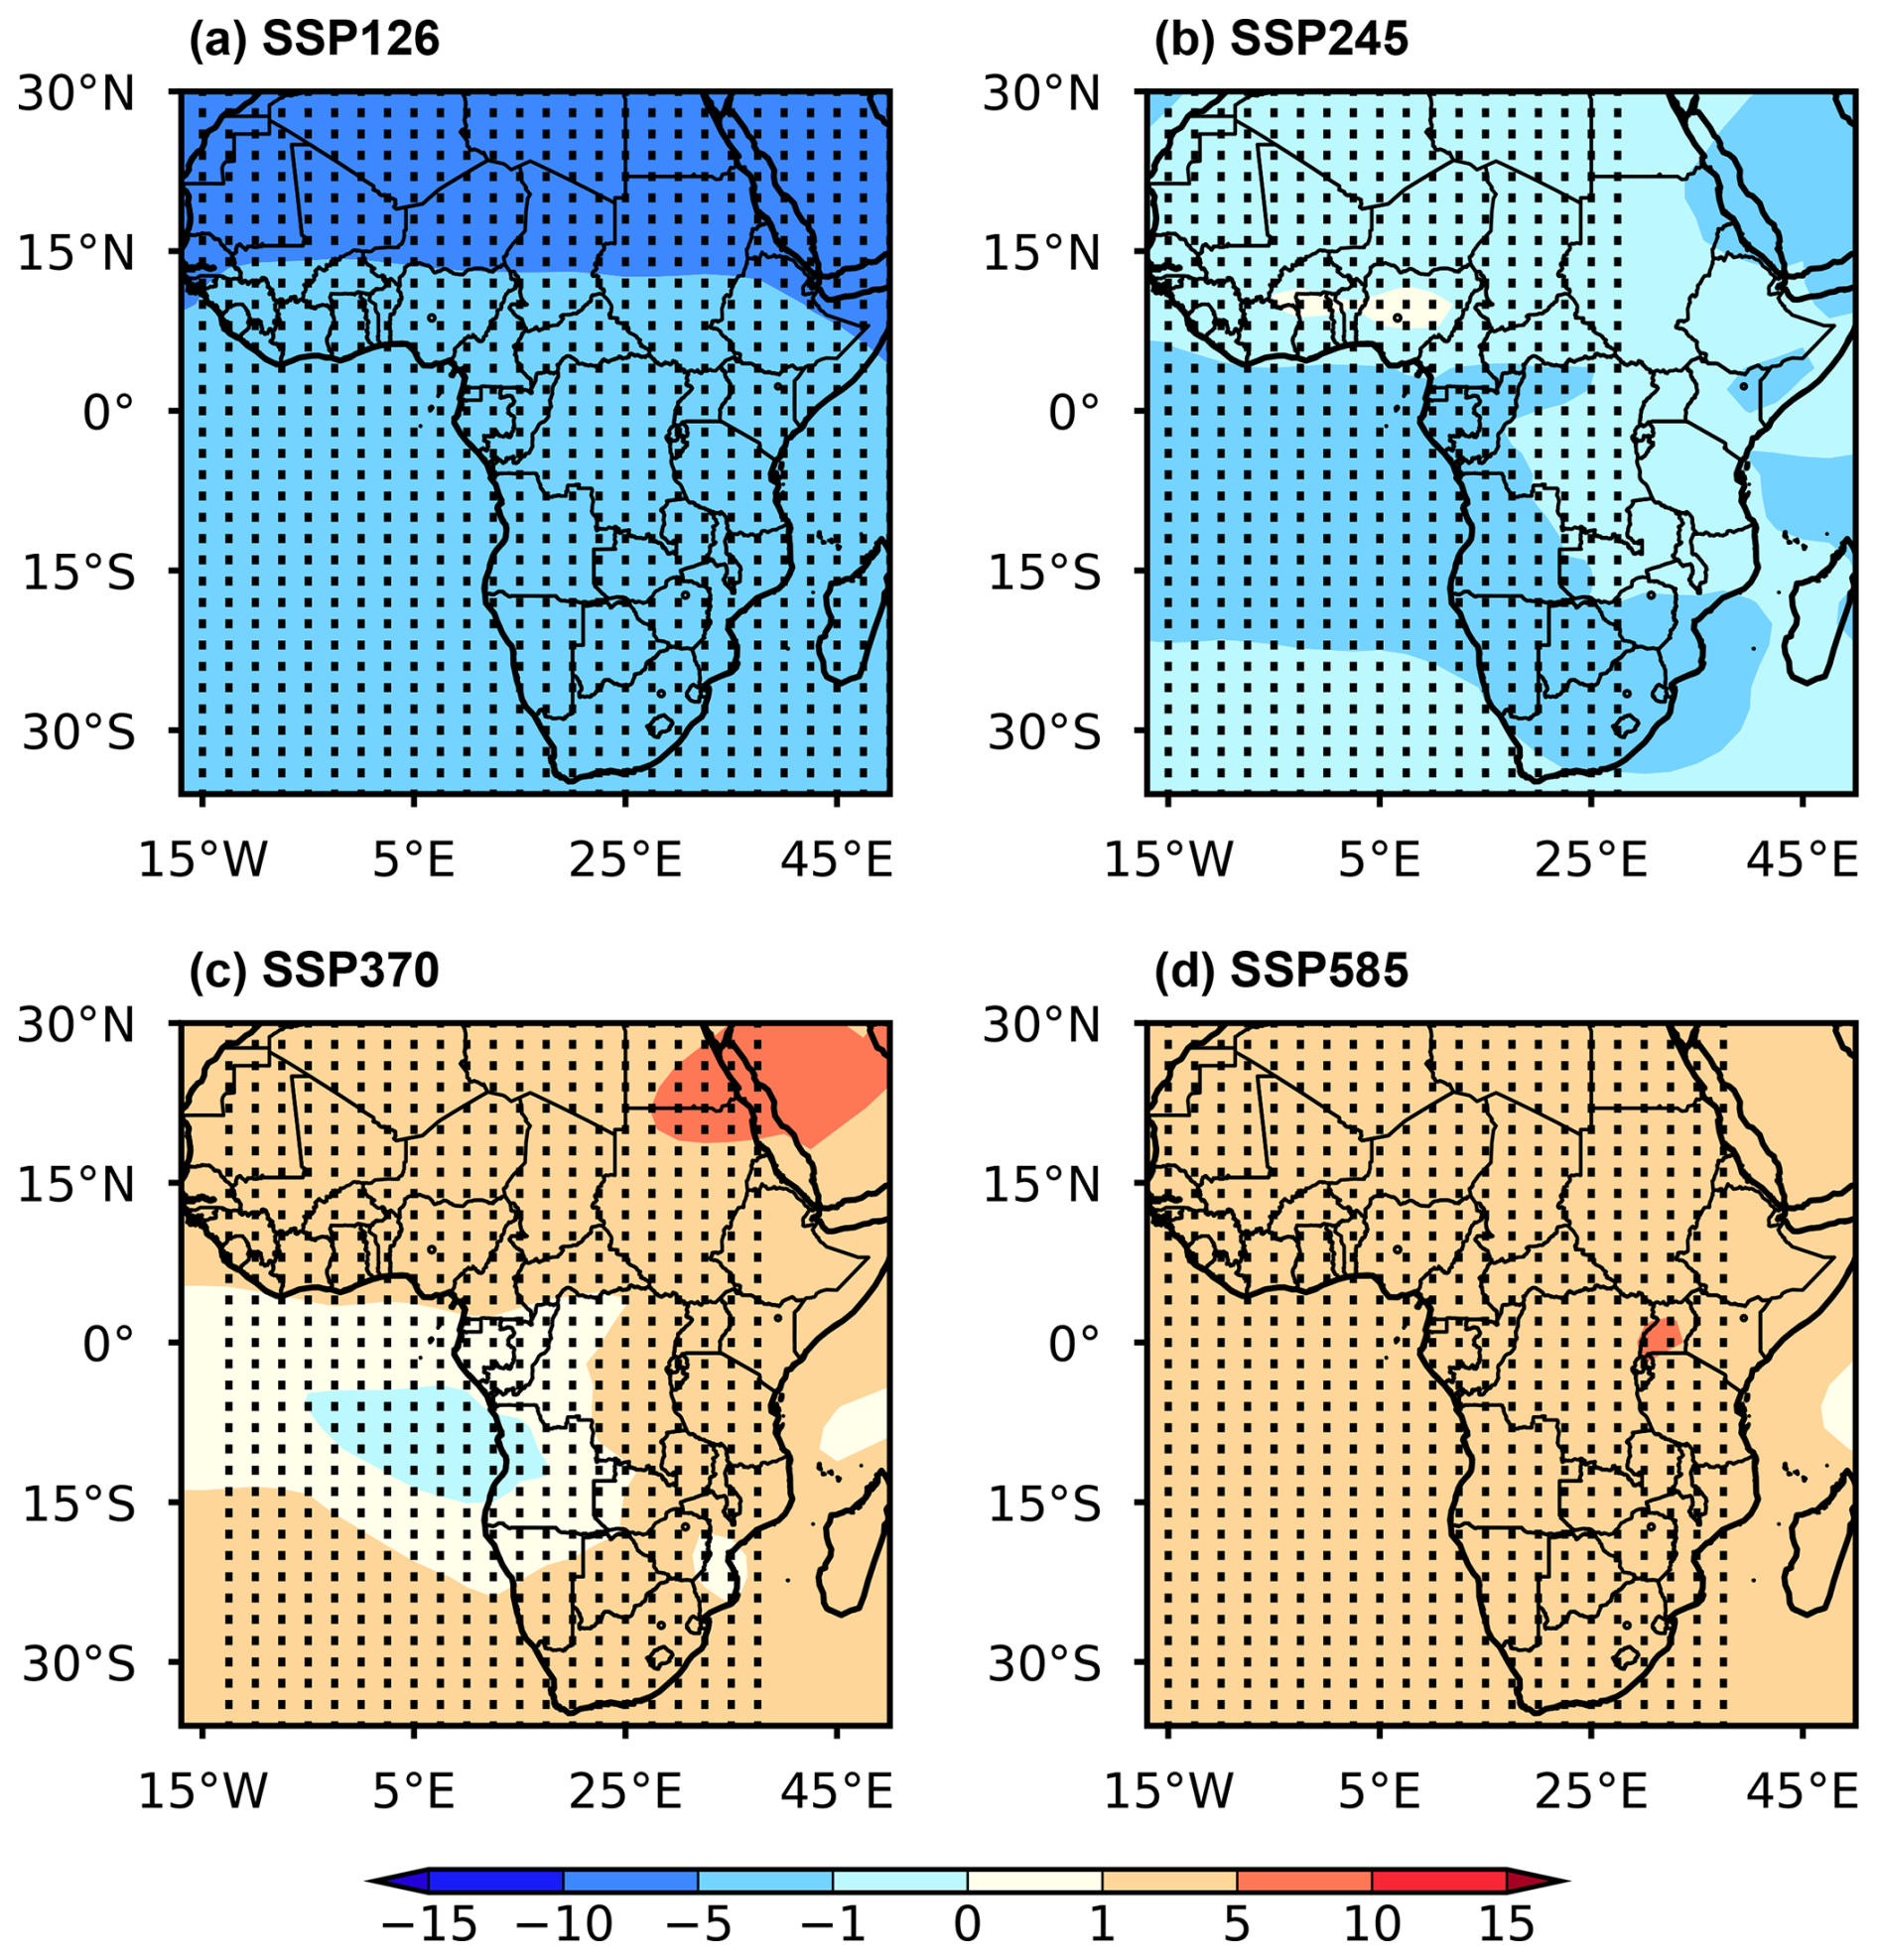
Figure 10Spatial distributions of differences in near-surface O3 concentrations (ppb) between 2050–2054 and 2020–2024 under (a) SSP1-2.6, (b) SSP2-4.5, (c) SSP3-7.0 and (d) SSP5-8.5 scenario obtained from CMIP6 multi-model simulations. The shaded areas indicate that the differences are statistically significant at the 90 % confidence level.
The impacts of biogenic isoprene emissions and meteorological fields under future climate change on O3 levels across Africa are separately quantified. In general, climate change has the potential to increase O3 concentrations, known as the “O3 climate penalty”. Favorable meteorological conditions such as higher temperature and lower relative humidity facilitate the photochemical generation of O3, with a maximum increase of 2.0 ppb in 2050 compared to 2020. Within this annual mean and isoprene-only sensitivity experiment, the simultaneously increased biogenic isoprene emissions lead to a slight O3 decline (<0.5 ppb). Meteorological fields play a greater role in shaping future O3 levels over Africa than biogenic isoprene emissions. In addition, the low-emission scenarios (SSP1-2.6 and SSP2-4.5) are projected to lead to smaller increases in O3 levels than the high-emission scenarios (SSP3-7.0 and SSP5-8.5). This study reveals that global warming will exacerbate the health risk associated with O3 pollution across Africa. It further highlights that elevated air temperatures act as the primary driver of increased mortality ratios in Africa, while enhanced O3 concentrations are an additional stressor and adverse side effect of warming climate.
To assess the role of climate change in future O3 variations, O3 concentrations from the CMIP6 multi-model future predictions are obtained, which are driven by changes in anthropogenic emissions, climate and land use following SSPs scenarios. The spatial distributions of simulated differences in O3 concentration over Africa between 2020 and 2050 are shown in Fig. 10. Under the SSP1-2.6 and SSP2-4.5 scenarios, O3 concentrations are predicted to decrease by less than 10 ppb, mainly resulting from reductions in anthropogenic emissions. However, O3 concentrations are expected to increase under the SSP3-7.0 and SSP5-8.5 scenarios, with increases of 1–5 ppb across Africa, which are largely attributable to climate change in a warming future.
Previous studies have reported a range of future O3 responses over Africa, reflecting differences in time horizons, emission pathways, model configuration, and the treatment of climate change. For example, Turnock et al. (2022) projected modest decreases in annual mean near-surface O3 by 2050 over Northern Africa (4 %) and Southern Africa (2 %) under SSP3-7.0, whereas Brown et al. (2022) reported a multi-model mean increase of up to 4 ppb over African urban areas during 2090–2100 under the same scenario. In our study, the climate-driven sensitivity simulations indicate an O3 climate penalty over most African regions, with a maximum increase of approximately 2.0 ppb by 2050 under the stronger warming scenarios. These results are within the range of previous projections, while specifically isolating the contributions of changing meteorological conditions and biogenic isoprene emissions.
Our findings also complement the Integrated Assessment of Air Pollution and Climate Change for Sustainable Development in Africa led by the United Nations Environment Programme (UNEP, 2022), the African Union Commission (AUC), and the Climate and Clean Air Coalition (CCAC). The Assessment used the GISS-E2.1-G model to evaluate African emission scenarios, while emissions outside Africa were prescribed according to SSP3-7.0. It showed that African mitigation measures under the SLCP mitigation scenario and a more ambitious Agenda 2063 scenario reduce population-weighted ozone exposure, with the largest reductions projected over Western and Eastern Africa. Under the Agenda 2063 scenario, the estimated O3-related avoided premature deaths are approximately 40 000±13 000 per year by 2030 and 320 000±100 000 per year by 2063, relative to its baseline scenario. These absolute health benefits cannot be directly compared with our mortality ratios because the Assessment includes changes in African precursor emissions, population, and vulnerability, whereas our sensitivity experiments isolate climate-driven changes while holding the non-isoprene precursor inputs fixed. Taken together, the assessment indicates that African emission controls can substantially reduce O3 exposure and health burdens, but that such benefits may be partialy offset by the climate-driven O3 increases identified here.
In this study, the O3 projections over Africa are subject to uncertainties and limitations arising from input datasets, GEOS-Chem model simulations, CMIP6 multi-model simulations of meteorology, and the RF model. First, land use, topography and population density data are held at present-day values when predicting future O3 concentrations; these factors will change with climate and may bias projections. Second, the RF model training and performance strongly relies on the accuracy of GEOS-Chem simulation results. Although the GEOS-Chem model has been proven capable of capturing the temporal and spatial variations of global O3, there remain certain uncertainties in its simulated O3 concentrations over Africa. These uncertainties mainly stem from discrepancies in emission inventories, including anthropogenic, biogenic, biomass burning, and lightning sources (Han et al., 2018). The comparison with SAAQIS observations indicates a systematic positive bias in RF-predicted O3 concentrations over the sampled South African grid cells. This bias introduces uncertainty into absolute future O3 concentrations and associated health estimates. The observational evaluation is limited to 11 grid cells, with the underlying 94 sites concentrated around Pretoria and coastal South Africa, and therefore cannot represent model performance uniformly across Africa. Furthermore, present-day bias in absolute O3 concentrations does not directly determine the bias in projected future O3 changes, because persistent biases may partially offset in the calculation of differences. Third, the CMIP6 multi-model meteorological fields used to represent future climate under different scenarios may suffer projection uncertainties and can introduce biases (Xu et al., 2021). Fourth, the contributions of selected features in this study reflect the aggregate study domain; future work should train region-specific RF models to estimate near-surface O3 concentrations and quantify variable contributions at regional scales. Finally, dependencies among the RF model input features can confound attribution, which may potentially result in spurious interpretations (Silva and Keller, 2024). In addition, biomass burning emissions and their associated NOx perturbations are not varied in the future sensitivity experiments. This limitation may be particularly important in southern Africa during the dry season, when fire activity can substantially modify precursor sensitivity and O3 production. Furthermore, when quantifying future O3 changes driven by biogenic emissions, only biogenic isoprene emissions are considered, which may have led to a low bias of the influence from biogenic emissions.
The GEOS-Chem model is available at https://doi.org/10.5281/zenodo.7254273 (Sulprizio, 2022). MERRA-2 reanalysis data can be downloaded at https://gmao.gsfc.nasa.gov/reanalysis/MERRA-2/ (last access: 17 September 2026). Multi-model projections of climate variables are from Scenario Model Intercomparison Project in Phase 6 of the Coupled Model Intercomparison Project https://esgf-node.llnl.gov/search/cmip6/ (last access: 17 September 2026). Land cover is derived from http://maps.elie.ucl.ac.be/CCI/viewer/download.php (last access: 17 September 2026). Normalized difference vegetation index is obtained from https://www.ncei.noaa.gov/data/land-normalized-difference-vegetation-index/access/ (last access: 17 September 2026). Topography is collected from https://cgiarcsi.community/data/srtm-90m-digital-elevation-database-v4-1/ (last access: 17 September 2026). Population density is acquired from https://landscan.ornl.gov/ (last access: 17 September 2026). Ground-based O3 observations used for model evaluation are obtained from https://saaqis.environment.gov.za/ (last access: 17 September 2026).
The supplement related to this article is available online at https://doi.org/10.5194/acp-26-13341-2026-supplement.
HL and YY designed the research. HL performed the model simulations, analyzed data and wrote the initial draft. YY and HW helped edit and review the manuscript. All the authors discussed the results and contributed to the final manuscript.
At least one of the (co-)authors is a member of the editorial board of Atmospheric Chemistry and Physics. The peer-review process was guided by an independent editor, and the authors also have no other competing interests to declare.
Publisher's note: Copernicus Publications remains neutral with regard to jurisdictional claims made in the text, published maps, institutional affiliations, or any other geographical representation in this paper. The authors bear the ultimate responsibility for providing appropriate place names. Views expressed in the text are those of the authors and do not necessarily reflect the views of the publisher.
The Pacific Northwest National Laboratory (PNNL) is operated for DOE by the Battelle Memorial Institute under contract DE-AC05-76RLO1830.
This study was supported by the National Natural Science Foundation of China (grant nos. 42505179 and 42475032).
This paper was edited by Rebecca Garland and reviewed by two anonymous referees.
Anenberg, S. C., Horowitz, L. W., Tong, D. Q., and West, J. J.: An estimate of the global burden of anthropogenic ozone and fine particulate matter on premature human mortality using atmospheric modeling, Environ. Health Perspect., 118, 1189–1195, https://doi.org/10.1289/ehp.0901220, 2010.
Archibald, S., Nickless, A., Govender, N., Scholes, R. J., and Lehsten, V.: Climate and the inter-annual variability of fire in southern Africa: a meta-analysis using long-term field data and satellite-derived burnt area data, Glob. Ecol. Biogeogr., 19, 794–809, https://doi.org/10.1111/j.1466-8238.2010.00568.x, 2010.
Ban, J., Lu, K., Wang, Q., and Li, T.: Climate change will amplify the inequitable exposure to compound heatwave and ozone pollution, One Earth, 5, 677–686, https://doi.org/10.1016/j.oneear.2022.05.007, 2022.
Bey, I., Jacob, D. J., Yantosca, R. M., Logan, J. A., Field, B. D., Fiore, A. M., Li, Q., Liu, H. Y., Mickley, L. J., and Schultz, M. G.: Global modeling of tropospheric chemistry with assimilated meteorology: Model description and evaluation, J. Geophys. Res.-Atmos., 106, 23073–23095, https://doi.org/10.1029/2001JD000807, 2001.
Breiman, L.: Random forests, Mach. Learn., 45, 5–32, https://doi.org/10.1023/a:1010933404324, 2001.
Brown, F., Folberth, G. A., Sitch, S., Bauer, S., Bauters, M., Boeckx, P., Cheesman, A. W., Deushi, M., Dos Santos Vieira, I., Galy-Lacaux, C., Haywood, J., Keeble, J., Mercado, L. M., O'Connor, F. M., Oshima, N., Tsigaridis, K., and Verbeeck, H.: The ozone–climate penalty over South America and Africa by 2100, Atmos. Chem. Phys., 22, 12331–12352, https://doi.org/10.5194/acp-22-12331-2022, 2022.
Colette, A., Andersson, C., Baklanov, A., Bessagnet, B., Brandt, J., Christensen, J. H., Doherty, R., Engardt, M., Geels, C., Giannakopoulos, C., Hedegaard, G. B., Katragkou, E., Langner, J., Lei, H., Manders, A., Melas, D., Meleux, F., Rouïl, L., Sofiev, M., Soares, J., Stevenson, D. S., Tombrou-Tzella, M., Varotsos, K. V., and Young, P.: Is the ozone climate penalty robust in Europe?, Environ. Res. Lett., 10, 084015, https://doi.org/10.1088/1748-9326/10/8/084015, 2015.
Colombi, N., Miyazaki, K., Bowman, K. W., Neu, J. L., and Jacob, D. J.: A new methodology for inferring surface ozone from multispectral satellite measurements, Environ. Res. Lett., 16, 105005, https://doi.org/10.1088/1748-9326/ac243d, 2021.
Cromar, K. R., Anenberg, S. C., Balmes, J. R., Fawcett, A. A., Ghazipura, M., Gohlke, J. M., Hashizume, M., Howard, P., Lavigne, E., Levy, K., Madrigano, J., Martinich, J. A., Mordecai, E. A., Rice, M. B., Saha, S., Scovronick, N. C., Sekercioglu, F., Svendsen, E. R., Zaitchik, B. F., and Ewart, G.: Global Health Impacts for Economic Models of Climate Change: A Systematic Review and Meta-Analysis, Ann. Am. Thorac. Soc., 19, 1203–1212, https://doi.org/10.1513/AnnalsATS.202110-1193OC, 2022.
Debevec, C., Sauvage, S., Gros, V., Sellegri, K., Sciare, J., Pikridas, M., Stavroulas, I., Leonardis, T., Gaudion, V., Depelchin, L., Fronval, I., Sarda-Esteve, R., Baisnée, D., Bonsang, B., Savvides, C., Vrekoussis, M., and Locoge, N.: Driving parameters of biogenic volatile organic compounds and consequences on new particle formation observed at an eastern Mediterranean background site, Atmos. Chem. Phys., 18, 14297–14325, https://doi.org/10.5194/acp-18-14297-2018, 2018.
Doherty, R. M., Wild, O., Shindell, D. T., Zeng, G., MacKenzie, I. A., Collins, W. J., Fiore, A. M., Stevenson, D. S., Dentener, F. J., Schultz, M. G., Hess, P., Derwent, R. G., and Keating, T. J.: Impacts of climate change on surface ozone and intercontinental ozone pollution: A multi‐model study, J. Geophys. Res.-Atmos., 118, 3744–3763, https://doi.org/10.1002/jgrd.50266, 2013.
Fajersztajn, L., Veras, M., Barrozo, L. V., and Saldiva, P.: Air monitoring coverage in low-income countries: an observational study, Lancet, 384, S14, https://doi.org/10.1016/s0140-6736(14)61877-8, 2014.
Fehsenfeld, F., Calvert, J., Fall, R., Goldan, P., Guenther, A. B., Hewitt, C. N., Lamb, B., Liu, S., Trainer, M., Westberg, H., and Zimmerman, P.: Emissions of volatile organic compounds from vegetation and the implications for atmospheric chemistry, Global Biogeochem. Cy., 6, 389–430, https://doi.org/10.1029/92GB02125, 1992.
Fisher, S., David, C., Bellinger, M. L., Cropper, P. K., Agnes, B., Juliette, B. K., Yongjoon, P., Gabriella, T., and Philip, J. L.: Air pollution and development in Africa: Impacts on health, the economy, and human capital, Lancet Planet. Health, 5, e681–e688, https://doi.org/10.1016/S2542-5196(21)00201-1, 2021.
Fu, T.‐M. and Tian, H.: Climate change penalty to ozone air quality: Review of current understandings and knowledge gaps, Curr. Pollut. Rep., 5, 159–171, https://doi.org/10.1007/s40726-019-00115-6, 2019.
Gao, J., Yang, Y., Wang, H., Wang, P., Li, H., Li, M., Ren, L., Yue, X., and Liao, H.: Fast climate responses to emission reductions in aerosol and ozone precursors in China during 2013–2017, Atmos. Chem. Phys., 22, 7131–7142, https://doi.org/10.5194/acp-22-7131-2022, 2022.
Gaudel, A., Cooper, O. R., Ancellet, G., Barret, B., Boynard, A., Burrows, J. P., Clerbaux, C., Coheur, P. F., Cuesta, J., Cuevas, E., Doniki, S., Dufour, G., Ebojie, F., Foret, G., Garcia, O., Granados-Muñoz, M. J., Hannigan, J. W., Hase, F., Hassler, B., Huang, G., Hurtmans, D., Jaffe, D., Jones, N., Kalabokas, P., Kerridge, B., Kulawik, S., Latter, B., Leblanc, T., Le Flochmoën, E., Lin, W., Liu, J., Liu, X., Mahieu, E., McClure-Begley, A., Neu, J. L., Osman, M., Palm, M., Petetin, H., Petropavlovskikh, I., Querel, R., Rahpoe, N., Rozanov, A., Schultz, M. G., Schwab, J., Siddans, R., Smale, D., Steinbacher, M., Tanimoto, H., Tarasick, D. W., Thouret, V., Thompson, A. M., Trickl, T., Weatherhead, E., Wespes, C., Worden, H. M., Vigouroux, C., Xu, X., Zeng, G., and Ziemke, J.: Tropospheric Ozone Assessment Report: Present-day distribution and trends of tropospheric ozone relevant to climate and global atmospheric chemistry model evaluation, Elem. Sci. Anth., 6, 39, https://doi.org/10.1525/elementa.291, 2018.
GBD 2019 Risk Factors Collaborators: Global burden of 87 risk factors in 204 countries and territories, 1990–2019: a systematic analysis for the Global Burden of Disease Study 2019, Lancet, 396, 1223–1249, https://doi.org/10.1016/S0140-6736(20)30752-2, 2020.
Gelaro, R., McCarty, W., Suárez, M. J., Todling, R., Molod, A., Takacs, L., Randles, C. A., Darmenov, A., Bosilovich, M. G., Reichle, R., Wargan, K., Coy, L., Cullather, R., Draper, C., Akella, S., Buchard, V., Conaty, A., da Silva, A. M., Gu, W., Kim, G.-K., Koster, R., Lucchesi, R., Merkova, D., Nielsen, J. E., Partyka, G., Pawson, S., Putman, W., Rienecker, M., Schubert, S. D., Sienkiewicz, M., and Zhao, B.: The Modern-Era Retrospective Analysis for Research and Applications, Version 2 (MERRA-2), J. Climate, 30, 5419–5454, https://doi.org/10.1175/JCLI-D-16-0758.1, 2017.
Gong, C. and Liao, H.: A typical weather pattern for ozone pollution events in North China, Atmos. Chem. Phys., 19, 13725–13740, https://doi.org/10.5194/acp-19-13725-2019, 2019.
Guenther, A., Hewitt, C. N., Erickson, D., Fall, R., Geron, C., Graedel, T., Harley, P., Klinger, L., Lerdau, M., Mckay, W. A., Pierce, T., Scholes, B., Steinbrecher, R., Tallamraju, R., Taylor, J., and Zimmerman, P.: A global model of natural volatile organic compound emissions, J. Geophys. Res.-Atmos., 100, 8873–8892, https://doi.org/10.1029/94jd02950, 1995.
Guenther, A., Karl, T., Harley, P., Wiedinmyer, C., Palmer, P. I., and Geron, C.: Estimates of global terrestrial isoprene emissions using MEGAN (Model of Emissions of Gases and Aerosols from Nature), Atmos. Chem. Phys., 6, 3181–3210, https://doi.org/10.5194/acp-6-3181-2006, 2006.
Guenther, A. B., Jiang, X., Heald, C. L., Sakulyanontvittaya, T., Duhl, T., Emmons, L. K., and Wang, X.: The Model of Emissions of Gases and Aerosols from Nature version 2.1 (MEGAN2.1): an extended and updated framework for modeling biogenic emissions, Geosci. Model Dev., 5, 1471–1492, https://doi.org/10.5194/gmd-5-1471-2012, 2012.
Han, H., Liu, J., Yuan, H., Zhuang, B., Zhu, Y., Wu, Y., Yan, Y., and Ding, A.: Characteristics of intercontinental transport of tropospheric ozone from Africa to Asia, Atmos. Chem. Phys., 18, 4251–4276, https://doi.org/10.5194/acp-18-4251-2018, 2018.
Hou, L., Dai, Q., Song, C., Liu, B., Guo, F., Dai, T., Li, L., Liu, B., Bi, X., Zhang, Y., and Feng, Y.: Revealing Drivers of Haze Pollution by Explainable Machine Learning, Environ. Sci. Technol. Lett., 9, 112–119, https://doi.org/10.1021/acs.estlett.1c00865, 2022.
Hudman, R. C., Moore, N. E., Mebust, A. K., Martin, R. V., Russell, A. R., Valin, L. C., and Cohen, R. C.: Steps towards a mechanistic model of global soil nitric oxide emissions: implementation and space based-constraints, Atmos. Chem. Phys., 12, 7779–7795, https://doi.org/10.5194/acp-12-7779-2012, 2012.
IPCC: Climate change 2021: The physical science basis, Contribution of working group I to the sixth assessment report of the intergovernmental panel on climate change, Cambridge, UK, Cambridge University Press, https://doi.org/10.1017/9781009157896, 2021.
Iyakaremye, V., Zeng, G., Yang, X., Zhang, G., Ullah, I., Gahigi, A., Vuguziga, F., Asfaw, T. G., and Ayugi, B.: Increased high-temperature extremes and associated population exposure in Africa by the mid-21st century, Sci. Total Environ., 790, 148162, https://doi.org/10.1016/j.scitotenv.2021.148162, 2021.
Jaars, K., van Zyl, P. G., Beukes, J. P., Hellén, H., Vakkari, V., Josipovic, M., Venter, A. D., Räsänen, M., Knoetze, L., Cilliers, D. P., Siebert, S. J., Kulmala, M., Rinne, J., Guenther, A., Laakso, L., and Hakola, H.: Measurements of biogenic volatile organic compounds at a grazed savannah grassland agricultural landscape in South Africa, Atmos. Chem. Phys., 16, 15665–15688, https://doi.org/10.5194/acp-16-15665-2016, 2016.
Jacob, D. J. and Winner, D. A.: Effect of climate change on air quality, Atmos. Environ., 43, 51–63, https://doi.org/10.1016/j.atmosenv.2008.09.051, 2009.
Kavassalis, S. C. and Murphy, J. G.: Understanding ozone‐meteorology correlations: A role for dry deposition, Geophys. Res. Lett., 44, 2922–2931, https://doi.org/10.1002/2016gl071791, 2017.
Kesselmeier, J. and Staudt, M.: Biogenic volatile organic compounds (VOC): An overview on emission, physiology and ecology, J. Atmos. Chem., 33, 23–88, https://doi.org/10.1023/A:1006127516791, 1999.
Lee, J. Y. and Kim, H.: Projection of future temperature-related mortality due to climate and demographic changes, Environ. Int., 94, 489–494, https://doi.org/10.1016/j.envint.2016.06.007, 2016.
Lelieveld, J., Evans, J. S., Fnais, M., Giannadaki, D., and Pozzer, A.: The contribution of outdoor air pollution sources to premature mortality on a global scale, Nature, 525, 367–371, https://doi.org/10.1038/nature15371, 2015.
Li, H., Yang, Y., Wang, H., Wang, P., Yue, X., and Liao, H.: Projected Aerosol Changes Driven by Emissions and Climate Change Using a Machine Learning Method, Environ. Sci. Technol., 56, 3884–3893, https://doi.org/10.1021/acs.est.1c04380, 2022.
Li, H., Yang, Y., Jin, J., Wang, H., Li, K., Wang, P., and Liao, H.: Climate-driven deterioration of future ozone pollution in Asia predicted by machine learning with multi-source data, Atmos. Chem. Phys., 23, 1131–1145, https://doi.org/10.5194/acp-23-1131-2023, 2023.
Li, H., Yang, Y., Su, H., Wang, H., Wang, P., and Liao, H.: Ozone pollution in China affected by climate change in a carbon neutral future as predicted by a process‐based interpretable machine learning method, Geophys. Res. Lett., 51, e2024GL109520, https://doi.org/10.1029/2024GL109520, 2024.
Lin, J.-T. and McElroy, M. B.: Impacts of boundary layer mixing on pollutant vertical profiles in the lower troposphere: Implications to satellite remote sensing, Atmos. Environ., 44, 1726–1739, https://doi.org/10.1016/j.atmosenv.2010.02.009, 2010.
Liu, X., Zhu, Y., Xue, L., Desai, A. R., and Wang, H.: Cluster-enhanced ensemble learning for mapping global monthly surface ozone from 2003 to 2019, Geophys. Res. Lett., 49, e2022GL097947, https://doi.org/10.1029/2022GL097947, 2022a.
Liu, Y., Schallhart, S., Taipale, D., Tykkä, T., Räsänen, M., Merbold, L., Hellén, H., and Pellikka, P.: Seasonal and diurnal variations in biogenic volatile organic compounds in highland and lowland ecosystems in southern Kenya, Atmos. Chem. Phys., 21, 14761–14787, https://doi.org/10.5194/acp-21-14761-2021, 2021.
Liu, Z., Doherty, R. M., Wild, O., O'Connor, F. M., and Turnock, S. T.: Correcting ozone biases in a global chemistry–climate model: implications for future ozone, Atmos. Chem. Phys., 22, 12543–12557, https://doi.org/10.5194/acp-22-12543-2022, 2022b.
Lu, X., Zhang, L., and Shen, L.: Meteorology and climate influences on tropospheric ozone: A Review of natural sources, chemistry, and transport patterns, Curr. Pollut. Rep., 5, 238–260, https://doi.org/10.1007/s40726-019-00118-3, 2019.
Lundberg, S. M. and Lee, S.-I.: A unified approach to interpreting model predictions, Adv. Neural Inf. Process. Syst., 30, 4768–4777, https://doi.org/10.48550/arXiv.1705.07874, 2017.
Lyu, X., Li, K., Guo, H., Morawska, L., Zhou, B., Zeren, Y., Jiang, F., Chen, C., Goldstein, A. H., Xu, X., Wang, T., Lu, X., Zhu, T., Querol, X., Chatani, S., Latif, M. T., Schuch, D., Sinha, V., Kumar, P., Mullins, B., Seguel, R., Shao, M., Xue, L., Wang, N., Chen, J., Gao, J., Chai, F., Simpson, I., Sinha, B., and Blake, D. R.: A synergistic ozone-climate control to address emerging ozone pollution challenges, One Earth, 6, 964–977, https://doi.org/10.1016/j.oneear.2023.07.004, 2023.
Malashock, D. A., Delang, M. N., Becker, J. S., Serre, M. L., West, J. J., Chang, K. L., Cooper, O. R., and Anenberg, S. C.: Global trends in ozone concentration and attributable mortality for urban, peri-urban, and rural areas between 2000 and 2019: a modelling study, Lancet Planet. Health, 6, e958–e967, https://doi.org/10.1016/S2542-5196(22)00260-1, 2022.
Mao, J., Paulot, F., Jacob, D. J., Cohen, R. C., Crounse, J. D., Wennberg, P. O., Keller, C. A., Hudman, R. C., Barkley, M. P., and Horowitz, L. W.: Ozone and organic nitrates over the eastern United States: sensitivity to isoprene chemistry, J. Geophys. Res.-Atmos., 118, 11256–11268, https://doi.org/10.1002/jgrd.50817, 2013.
Marais, E. A., Jacob, D. J., Kurosu, T. P., Chance, K., Murphy, J. G., Reeves, C., Mills, G., Casadio, S., Millet, D. B., Barkley, M. P., Paulot, F., and Mao, J.: Isoprene emissions in Africa inferred from OMI observations of formaldehyde columns, Atmos. Chem. Phys., 12, 6219–6235, https://doi.org/10.5194/acp-12-6219-2012, 2012.
McLinden, C. A., Olsen, S. C., Hannegan, B., Wild, O., Prather, M. J., and Sundet, J.: Stratospheric ozone in 3-D models: A simple chemistry and the cross-tropopause flux, J. Geophys. Res.-Atmos., 105, 14653–14665, https://doi.org/10.1029/2000jd900124, 2000.
Mills, G., Pleijel, H., Malley, C. S., Sinha, B., Cooper, O. R., Schultz, M. G., Neufeld, H. S., Simpson, D., Sharps, K., Feng, Z., Gerosa, G., Harmens, H., Kobayashi, K., Saxena, P., Paoletti, E., Sinha, V., and Xu, X.: Tropospheric ozone assessment report: Present-day tropospheric ozone distribution and trends relevant to vegetation, Elem. Sci. Anth., 6, 47, https://doi.org/10.1525/elementa.302, 2018.
Murray, L. T.: Lightning NOx and Impacts on Air Quality, Curr. Pollut. Rep., 2, 115–133, https://doi.org/10.1007/s40726-016-0031-7, 2016.
Murray, L. T., Jacob, D. J., Logan, J. A., Hudman, R. C., and Koshak, W. J.: Optimized regional and interannual variability of lightning in a global chemical transport model constrained by LIS/OTD satellite data, J. Geophys. Res.-Atmos., 117, D20307, https://doi.org/10.1029/2012jd017934, 2012.
Myhre, G., Aas, W., Cherian, R., Collins, W., Faluvegi, G., Flanner, M., Forster, P., Hodnebrog, Ø., Klimont, Z., Lund, M. T., Mülmenstädt, J., Lund Myhre, C., Olivié, D., Prather, M., Quaas, J., Samset, B. H., Schnell, J. L., Schulz, M., Shindell, D., Skeie, R. B., Takemura, T., and Tsyro, S.: Multi-model simulations of aerosol and ozone radiative forcing due to anthropogenic emission changes during the period 1990–2015, Atmos. Chem. Phys., 17, 2709–2720, https://doi.org/10.5194/acp-17-2709-2017, 2017.
Ni, Y., Yang, Y., Wang, H., Li, H., Li, M., Wang, P., Li, K., and Liao, H.: Contrasting changes in ozone during 2019–2021 between eastern and the other regions of China attributed to anthropogenic emissions and meteorological conditions, Sci. Total Environ., 908, 168272, https://doi.org/10.1016/j.scitotenv.2023.168272, 2024.
O'Neill, B. C., Tebaldi, C., van Vuuren, D. P., Eyring, V., Friedlingstein, P., Hurtt, G., Knutti, R., Kriegler, E., Lamarque, J.-F., Lowe, J., Meehl, G. A., Moss, R., Riahi, K., and Sanderson, B. M.: The Scenario Model Intercomparison Project (ScenarioMIP) for CMIP6, Geosci. Model Dev., 9, 3461–3482, https://doi.org/10.5194/gmd-9-3461-2016, 2016.
O'Rourke, P., Smith, S., Mott, A., Ahsan, H., Mcduffie, E., and Crippa, M.: CEDS v_2021_04_21 Gridded emissions data, Zenodo [data set], https://doi.org/10.25584/PNNLDATAHUB/1779095, 2021.
Ott, L. E., Pickering, K. E., Stenchikov, G. L., Allen, D. J., DeCaria, A. J., Ridley, B., Lin, R.-F., Lang, S., and Tao, W.-K.: Production of lightning NOx and its vertical distribution calculated from three-dimensional cloud-scale chemical transport model simulations, J. Geophys. Res.-Atmos., 115, D04301, https://doi.org/10.1029/2009JD011880, 2010.
Park, R. J., Jacob, D. J., Field, B. D., Yantosca, R. M., and Chin, M.: Natural and transboundary pollution influences on sulfate-nitrate-ammonium aerosols in the United States: Implications for policy, J. Geophys. Res.-Atmos., 109, 20, https://doi.org/10.1029/2003jd004473, 2004.
Pye, H. O. T., Liao, H., Wu, S., Mickley, L. J., Jacob, D. J., Henze, D. K., and Seinfeld, J. H.: Effect of changes in climate and emissions on future sulfate-nitrate-ammonium aerosol levels in the United States, J. Geophys. Res.-Atmos., 114, D01205, https://doi.org/10.1029/2008jd010701, 2009.
Requia, W. J., Di, Q., Silvern, R., Kelly, J. T., Koutrakis, P., Mickley, L. J., Sulprizio, M. P., Amini, H., Shi, L., and Schwartz, J.: An ensemble learning approach for estimating high spatiotemporal resolution of ground level ozone in the contiguous United States, Environ. Sci. Technol., 54, 11037–11047, https://doi.org/10.1021/acs.est.0c01791, 2020.
Rodriguez, J. D., Perez, A., and Lozano, J. A.: Sensitivity analysis of k-fold cross validation in prediction error estimation, IEEE T. Pattern Anal., 32, 569–575, https://doi.org/10.1109/TPAMI.2009.187, 2010.
Rosenkranz, M., Pugh, T. A. M., Schnitzler, J. P., and Arneth, A.: Effect of land‐use change and management on biogenic volatile organic compound emissions – Selecting climate‐smart cultivars, Plant Cell Environ., 38, 1896–1912, https://doi.org/10.1111/pce.12453, 2015.
Sicard, P., Agathokleous, E., Anenberg, S. C., De Marco, A., Paoletti, E., and Calatayud, V.: Trends in urban air pollution over the last two decades: A global perspective, Sci. Total Environ., 858, 160064, https://doi.org/10.1016/j.scitotenv.2022.160064, 2023.
Silva, S. J. and Keller, C. A.: Limitations of XAI methods for process‐level understanding in the atmospheric sciences, Artif. Intell. Earth Syst., 3, e230045, https://doi.org/10.1175/AIES-D-23-0045.1, 2024.
Sindelarova, K., Markova, J., Simpson, D., Huszar, P., Karlicky, J., Darras, S., and Granier, C.: High-resolution biogenic global emission inventory for the time period 2000–2019 for air quality modelling, Earth Syst. Sci. Data, 14, 251–270, https://doi.org/10.5194/essd-14-251-2022, 2022.
Singsaas, E. L. and Sharkey, T. D.: The regulation of isoprene emission responses to rapid leaf temperature fluctuations, Plant Cell Environ., 21, 1181–1188, https://doi.org/10.1046/j.1365-3040.1998.00380.x, 1998.
Stirnberg, R., Cermak, J., Kotthaus, S., Haeffelin, M., Andersen, H., Fuchs, J., Kim, M., Petit, J.-E., and Favez, O.: Meteorology-driven variability of air pollution (PM1) revealed with explainable machine learning, Atmos. Chem. Phys., 21, 3919–3948, https://doi.org/10.5194/acp-21-3919-2021, 2021.
Strada, S., Fernández-Martínez, M., Peñuelas, J., Bauwens, M., Stavrakou, T., Verger, A., and Giorgi, F.: Disentangling temperature and water stress contributions to trends in isoprene emissions using satellite observations of formaldehyde, 2005–2016, Atmos. Environ., 295, 119530, https://doi.org/10.1016/j.atmosenv.2022.119530, 2023.
Sulprizio, M.: geoschem/geos-chem: GEOS-Chem 13.4.1 (Version 13.4.1), Zenodo [software], https://doi.org/10.5281/zenodo.7254273, 2022.
Swap, R. J., Annegarn, H. J., Suttles, J. T., King, M. D., Platnick, S., Privette, J. L., and Scholes, R. J.: Africa burning: A thematic analysis of the Southern African Regional Science Initiative (SAFARI 2000), J. Geophys. Res.-Atmos., 108, 8507, https://doi.org/10.1029/2003JD003747, 2003.
Tobías, A., Hashizume, M., Honda, Y., Sera, F., Ng, C. F. S., Kim, Y., Roye, D., Chung, Y., Dang, T. N., Kim, H., Lee, W., Íñiguez, C., Vicedo-Cabrera, A., Abrutzky, R., Guo, Y., Tong, S., de Sousa Zanotti Stagliorio, M., Saldiva, P. H. N., Lavigne, E., Correa, P. M., Ortega, N. V., Kan, H., Osorio, S., Kyselý, J., Urban, A., Orru, H., Indermitte, E., Jaakkola, J. J. K., Ryti, N. R. I., Pascal, M., Huber, V., Schneider, A., Katsouyanni, K., Analitis, A., Entezari, A., Mayvaneh, F., Goodman, P., Zeka, A., Michelozzi, P., de'Donato, F., Alahmad, B., Diaz, M. H., De la Cruz Valencia, C., Overcenco, A., Houthuijs, D., Ameling, C., Rao, S., Di Ruscio, F., Carrasco, G., Seposo, X., Nunes, B., Madureira, J., Holobaca, I.-H., Scovronick, N., Acquaotta, F., Forsberg, B., Åström, C., Ragettli, M. S., Guo, Y.-L. L., Chen, B.-Y., Li, S., Colistro, V., Zanobetti, A., Schwartz, J., Dung, D. V., Armstrong, B., and Gasparrini, A.: Geographical Variations of the Minimum Mortality Temperature at a Global Scale: A Multicountry Study, Environ. Epidemiol., 5, e169, https://doi.org/10.1097/EE9.0000000000000169, 2021.
Turnock, S. T., Allen, R., Archibald, A. T., Dalvi, M., Folberth, G., Griffiths, P. T., Keeble, J., Robertson, E., and O'Connor, F. M.: The future climate and air quality response from different near-term climate forcer, climate, and land-use scenarios using UKESM1, Earth's Future, 10, e2022EF002687, https://doi.org/10.1029/2022EF002687, 2022.
United Nations Environment Programme (UNEP): Integrated Assessment of Air Pollution and Climate Change for Sustainable Development in Africa: Summary for Decision Makers, United Nations Environment Programme, 2022.
van der Werf, G. R., Randerson, J. T., Giglio, L., van Leeuwen, T. T., Chen, Y., Rogers, B. M., Mu, M., van Marle, M. J. E., Morton, D. C., Collatz, G. J., Yokelson, R. J., and Kasibhatla, P. S.: Global fire emissions estimates during 1997–2016, Earth Syst. Sci. Data, 9, 697–720, https://doi.org/10.5194/essd-9-697-2017, 2017.
Wang, P., Yang, Y., Li, H., Chen, L., Dang, R., Xue, D., Li, B., Tang, J., Leung, L. R., and Liao, H.: North China Plain as a hot spot of ozone pollution exacerbated by extreme high temperatures, Atmos. Chem. Phys., 22, 4705–4719, https://doi.org/10.5194/acp-22-4705-2022, 2022.
Wang, P., Yang, Y., Xue, D., Ren, L., Tang, J., Leung, L. R., and Liao, H.: Aerosols overtake greenhouse gases causing a warmer climate and more weather extremes toward carbon neutrality, Nat. Commun., 14, 7257, https://doi.org/10.1038/s41467-023-42891-2, 2023.
Wang, Y., Li, K., Chen, X., Yang, Z., Tang, M., Campos, P. M. D., Yang, Y., Yue, X., and Liao, H.: Revisiting the high tropospheric ozone over southern Africa: role of biomass burning and anthropogenic emissions, Atmos. Chem. Phys., 25, 4455–4475, https://doi.org/10.5194/acp-25-4455-2025, 2025a.
Wang, Y., Yang, Y., Yuan, Q., Li, T., Zhou, Y., Zong, L., Wang, M., Xie, Z., Ho, H. C., Gao, M., Tong, S., Lolli, S., and Zhang L.: Substantially underestimated global health risks of current ozone pollution, Nat. Commun., 16, 102, https://doi.org/10.1038/s41467-024-55450-0, 2025b.
Wei, J., Li, Z., Li, K., Dickerson, R., Pinker, R., Wang, J., Liu, X., Sun, L., Xue, W., and Cribb, M.: Full‐coverage mapping and spatiotemporal variations of ground‐level ozone (O3) pollution from 2013 to 2020 across China, Remote Sens. Environ., 270, 112775, https://doi.org/10.1016/j.rse.2021.112775, 2022.
Williams, J. E., Scheele, M. P., van Velthoven, P. F. J., Cammas, J.-P., Thouret, V., Galy-Lacaux, C., and Volz-Thomas, A.: The influence of biogenic emissions from Africa on tropical tropospheric ozone during 2006: a global modeling study, Atmos. Chem. Phys., 9, 5729–5749, https://doi.org/10.5194/acp-9-5729-2009, 2009.
Xu, H., Yu, H., Xu, B., Wang, Z., Wang, F., Wei, Y., Liang, W., Liu, J., Liang, D., Feng, Y., and Shi, G.: Machine learning coupled structure mining method visualizes the impact of multiple drivers on ambient ozone, Commun. Earth Environ., 4, 265, https://doi.org/10.1038/s43247-023-00932-0, 2023.
Xu, Z., Han, Y., Tam, C. Y., Yang, Z., and Fu, C.: Bias‐corrected CMIP6 global dataset for dynamical downscaling of the historical and future climate (1979–2100), Sci. Data, 8, 293, https://doi.org/10.1038/s41597-021-01079-3, 2021.
Yan, Y., Cabrera-Perez, D., Lin, J., Pozzer, A., Hu, L., Millet, D. B., Porter, W. C., and Lelieveld, J.: Global tropospheric effects of aromatic chemistry with the SAPRC-11 mechanism implemented in GEOS-Chem version 9-02, Geosci. Model Dev., 12, 111–130, https://doi.org/10.5194/gmd-12-111-2019, 2019.
Yáñez-Serrano, A. M., Bourtsoukidis, E., Alves, E. G., Bauwens, M., Stavrakou, T., Llusià, J., Filella, I., Guenther, A., Williams, J., Artaxo, P., Sindelarova, K., Doubalova, J., Kesselmeier, J., and Peñuelas, J.: Amazonian biogenic volatile organic compounds under global change, Glob. Change Biol., 26, 4722–4751, https://doi.org/10.1111/gcb.15185, 2020.
Yang, Y., Li, M., Wang, H., Li, H., Wang, P., Li, K., Gao, M., and Liao, H.: ENSO modulation of summertime tropospheric ozone over China, Environ. Res. Lett., 17, 034020, https://doi.org/10.1088/1748-9326/ac54cd, 2022.
Yue, X., Unger, N., Harper, K., Xia, X., Liao, H., Zhu, T., Xiao, J., Feng, Z., and Li, J.: Ozone and haze pollution weakens net primary productivity in China, Atmos. Chem. Phys., 17, 6073–6089, https://doi.org/10.5194/acp-17-6073-2017, 2017.
Zhang, Y., Hu, X.-M., Leung, L. R., and Gustafson Jr., W. I.: Impacts of regional climate change on biogenic emissions and air quality, J. Geophys. Res., 113, D18310, https://doi.org/10.1029/2008JD009965, 2008.
Ziemke, J. R., Oman, L. D., Strode, S. A., Douglass, A. R., Olsen, M. A., McPeters, R. D., Bhartia, P. K., Froidevaux, L., Labow, G. J., Witte, J. C., Thompson, A. M., Haffner, D. P., Kramarova, N. A., Frith, S. M., Huang, L.-K., Jaross, G. R., Seftor, C. J., Deland, M. T., and Taylor, S. L.: Trends in global tropospheric ozone inferred from a composite record of TOMS/OMI/MLS/OMPS satellite measurements and the MERRA-2 GMI simulation , Atmos. Chem. Phys., 19, 3257–3269, https://doi.org/10.5194/acp-19-3257-2019, 2019.
Zunckel, M., Koosailee, A., Yarwood, G., Maure, G., Venjonoka, K., van Tienhoven, A. M., and Otter, L.: Modelled surface ozone over southern Africa during the Cross Border Air Pollution Impact Assessment Project, Environ. Modell. Softw., 21, 911–924, https://doi.org/10.1016/j.envsoft.2005.04.004, 2006.