
the Creative Commons Attribution 4.0 License.
the Creative Commons Attribution 4.0 License.
 | 22 Sep 2026
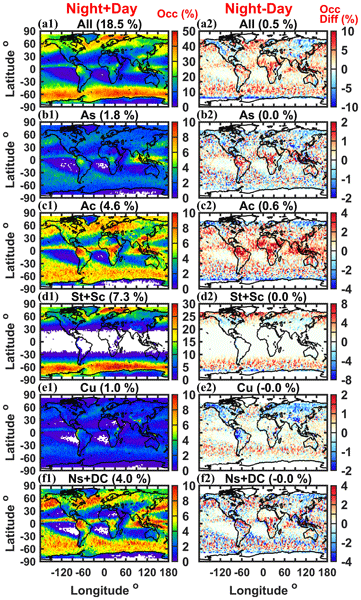
Cloud-type-dependent mixed-phase cloud climatology from CloudSat/CALIPSO measurements
Kang Yang

Mixed-phase clouds play a critical role in Earth's radiation budget but remain a major source of uncertainty in climate models. Existing satellite climatologies mostly describe mixed-phase clouds in aggregate, without separating cloud types that differ in dynamics, vertical structure, spatial distribution, and macrophysical properties. Here we use CloudSat/CALIPSO observations to develop a global, cloud-type-dependent climatology of mixed-phase cloud and examine its spatial, vertical, seasonal, and regional variations. Identified mixed-phase clouds have a global mean occurrence of 18.5 %. Stratus plus stratocumulus (St+Sc) dominates high-latitude mixed-phase occurrence, with local values exceeding 40 % over the Southern Ocean and the Greenland-Iceland-Norwegian seas, whereas altocumulus (Ac) and nimbostratus plus deep convection (Ns+DC) contribute most strongly in midlatitude storm-track regions and convectively active tropical regions. At a given cloud-top temperature, the dominant cloud phase differs substantially among cloud types and regions, indicating that cloud-top temperature alone does not uniquely determine cloud thermodynamic phase. Seasonal and surface contrasts are especially strong for St+Sc: in the NH 45–75° N band, monthly mean occurrence over open ocean increases from about 2 %–6 % in summer to 24 %–25 % in winter, whereas in the SH 45–75° S band St+Sc over open ocean reaches its annual minimum in austral summer but over sea ice reaches its minimum in austral winter. These results demonstrate the importance of cloud type for characterizing mixed-phase cloud climatology and provide observational constraints for evaluating the representation of mixed-phase clouds in climate models.
- Article
(8726 KB) - Full-text XML
- BibTeX
- EndNote


Mixed-phase clouds, in which supercooled liquid droplets and ice crystals coexist at temperatures between 0 and −40 °C, play an essential role in the Earth's climate system (Korolev et al., 2017). Through the Wegener–Bergeron–Findeisen (WBF) process, ice crystals can grow at the expense of liquid droplets, influencing the evolution of phase partitioning in mixed-phase clouds (Yang et al., 2025a). The relative abundance of supercooled liquid and ice strongly modulates cloud radiative properties and lifetime: liquid-rich clouds exhibit larger optical thickness and stronger shortwave reflectance, whereas glaciation enhances precipitation efficiency and cloud dissipation, leading to radiative impacts that differ from those of purely liquid or ice clouds (Morrison et al., 2012; Storelvmo, 2017). Matus and L'Ecuyer (2017) showed that mixed-phase clouds exert a global-mean top-of-atmosphere net cloud radiative effect of −3.4 W m−2, with compensating shortwave (−8.1 W m−2) and longwave (4.7 W m−2) contributions. Furthermore, Lohmann (2002) showed that replacing all mixed-phase clouds with purely supercooled liquid clouds in a general circulation model could alter the net top-of-atmosphere cloud radiative effect of up to 13 W m−2. Despite this substantial radiative impact, the physical processes governing phase partitioning, phase transitions, and the persistence of mixed-phase clouds remain incompletely understood and not well constrained, contributing to continuing uncertainty in their representation in climate models (Morrison et al., 2012; Komurcu et al., 2014; Hofer et al., 2024; Tan et al., 2025; Li et al., 2026).
These uncertainties in mixed-phase cloud processes are reflected in persistent biases in numerical weather prediction and climate models. Earlier generations of climate models, including many models participating in Phase 5 of the Coupled Model Intercomparison Project (CMIP5) tended to glaciate mixed-phase clouds prematurely, resulting in an underestimation of supercooled liquid water and biases in associated shortwave cloud radiative effects, particularly over the Southern Ocean and other mid-to-high latitude regions (Klein et al., 2009; Cesana et al., 2015; McCoy et al., 2016). The Phase 6 of the Coupled Model Intercomparison Project (CMIP6) multi-model mean liquid-to-ice transition temperature is closer to satellite observations than CMIP5 multi-model mean (Tan et al., 2025). However, the transition temperature still exhibits an inter-model spread of approximately 30 °C, with individual models simulating either too much or too little supercooled liquid water. For example, Tan et al. (2025) found that 18 CMIP6 models overestimated and 17 underestimated the extratropical supercooled liquid fraction relative to observations. Thus, despite continued progress in cloud microphysical parameterizations, including treatments of ice nucleation and other mixed-phase cloud processes, substantial uncertainty remains in simulated cloud phase partitioning and its associated radiative effects and feedbacks (Tan et al., 2016; Zelinka et al., 2020). A key challenge for evaluating and improving the representation of mixed-phase clouds in models is the limited availability of observational datasets that comprehensively constrain mixed-phase cloud properties across different types and spatial and temporal scales.
Observational studies have provided important insights into mixed-phase cloud properties and processes, primarily through in situ measurements and remote sensing. Long-term ground-based observations at fixed sites, such as the Atmospheric Radiation Measurement (ARM) facilities, have documented supercooled liquid layers near the tops of low-level stratiform mixed-phase clouds, revealing their vertical structure, seasonal cycles, and sensitivity to boundary-layer dynamics and large-scale synoptic conditions (Shupe et al., 2006; Verlinde et al., 2007). Airborne measurements have captured detailed microphysical variability within mixed-phase clouds and highlighted the roles of vertical motions, turbulence, aerosols, and microphysical processes, such as riming and the WBF mechanism, in influencing phase partitioning, glaciation rates, and spatial inhomogeneity (McFarquhar et al., 2011; Korolev et al., 2017). While these observations are essential for understanding process-level microphysics and improving cloud microphysical parameterizations, the limited geographic coverage restricts the ability to characterize mixed-phase cloud occurrence and variability at global scales.
Satellite remote sensing has therefore become essential for systematically documenting mixed-phase clouds globally. The A-Train satellite constellation, particularly CloudSat and the Cloud–Aerosol Lidar and Infrared Pathfinder Satellite Observations (CALIPSO), provides vertically resolved observations of cloud structure using active remote sensing (Stephens et al., 2008; Winker et al., 2010). CloudSat's 94 GHz cloud profiling radar (CPR) is highly sensitive to cloud ice particles. Still, it has limited sensitivity to small liquid cloud droplets, while CALIPSO's lidar is particularly effective at detecting optically thin clouds and supercooled liquid layers near cloud top. The complementary sensitivities of radar and lidar enable improved characterization of cloud vertical structure and thermodynamic phase. Combined CloudSat-CALIPSO products, such as 2B-CLDCLASS-LIDAR (Zhang et al., 2010; Wang, 2019) and the raDAR/liDAR (DARDAR) products (Delanoë and Hogan, 2010; Ceccaldi et al., 2013), have been widely used to characterize the global distribution and vertical structure of mixed-phase clouds, including their occurrence as functions of temperature and altitude, as well as their seasonal and regional variability (Zhang et al., 2010; Hu et al., 2010; Mülmenstädt et al., 2015; Cesana et al., 2016, 2022, 2024). These satellite-based mixed-phase cloud climatologies have provided vital observational benchmarks for evaluating and constraining the representation of mixed-phase clouds in numerical models.
However, most existing satellite-based studies have focused on aggregated mixed-phase cloud statistics across all cloud types, sometimes separating clouds by vertical level (Mioche et al., 2015; Listowski et al., 2019). Satellite observations have also been used to characterize the spatial distribution of thermodynamic phase within mixed-phase clouds. For example, Coopman and Tan (2023) used DARDAR observations to quantify the spatial homogeneity of liquid and ice within mixed-phase clouds and examined their relationships with meteorological and aerosol conditions. The degree of phase homogeneity is relevant to mixed-phase cloud microphysical processes, radiative effects, and lifetime. Nevertheless, systematic global comparisons of mixed-phase cloud occurrence and properties among cloud types remain limited. This distinction is important because mixed-phase clouds occur across a wide range of cloud types characterized by distinct dynamical forcing, vertical structure, aerosol properties, and microphysical pathways. For example, stratiform mixed-phase clouds can maintain supercooled liquid layers under relatively weak ascent and turbulent mixing, whereas mixed-phase nimbostratus and deep convective clouds tend to be more ice-dominated due to stronger vertical motions and enhanced riming and aggregation. Because cloud dynamics play an essential role in the formation and maintenance of mixed-phase conditions (Korolev and Isaac, 2003; Korolev and Field, 2008), the spatial, temporal, and microphysical characteristics of mixed-phase clouds are expected to vary systematically among cloud types (Korolev et al., 2017). Therefore, to better characterize these differences and to support improved representation of mixed-phase clouds in models, a cloud-type-dependent mixed-phase cloud climatology is needed.
In this study, we present a cloud-type-dependent climatology of mixed-phase clouds based on CloudSat and CALIPSO observations. Using the CloudSat 2B-CLDCLASS-LIDAR product in combination with temperature profiles from the CloudSat ECMWF-AUX dataset and other A-Train measurements, we categorize mixed-phase clouds into five major cloud types and examine how their occurrence varies spatially, vertically, and seasonally across different cloud types. By focusing on cloud occurrence, this study highlights the climatological prevalence of mixed-phase clouds within distinct cloud types and provides complementary observational constraints for evaluating the representation of mixed-phase clouds in numerical models. The paper is organized as follows. Section 2 describes the datasets and methodologies used in this study. Section 3.1 presents the spatial distributions and zonal-mean structures of mixed-phase cloud occurrence by cloud type, together with cloud-type-dependent occurrence of ice, mixed-phase, and supercooled-liquid clouds as a function of cloud top temperature. Section 3.2 examines the seasonal variations of mixed-phase cloud occurrence and their regional contrasts across different surface types, including land, open ocean, and sea ice. Finally, Sect. 4 summarizes the main findings and discusses their implications and limitations.
2.1 A-Train satellite observations and cloud type classification
The A-Train satellite constellation operates in a sun-synchronous orbit with equator-crossing times near 01:30 and 13:30 local solar time, providing consistent daytime and nighttime sampling. Satellites within the constellation, including CloudSat, CALIPSO, and Aqua, fly in close formation with along-track separations of seconds to a few minutes. This configuration allows for near-simultaneous observations of clouds from multiple active and passive sensors (Stephens et al., 2002; Winker et al., 2009; Xiong et al., 2023).
CloudSat carries a 94 GHz nadir-pointing CPR that measures vertical profiles of radar reflectivity. The CPR is effective at detecting ice particles in mixed-phase regions, with a vertical resolution of 240 m (oversampled) and a horizontal footprint of approximately 1.4 km cross-track by 1.7 km along-track, with an along-track sampling interval of 1.1 km. CALIPSO carries the Cloud-Aerosol Lidar with Orthogonal Polarization (CALIOP), which operates at 532 nm (parallel and perpendicular polarization) and 1064 nm. CALIOP provides high-sensitivity observations of optically thin clouds and aerosol layers and is particularly effective at detecting supercooled liquid layers near cloud top. CALIOP profiles have a vertical resolution of 30 m (60 m for the 1064 nm channel), with a horizontal resolution of 333 m below 8.2 km and 1 km between 8.2 and 20.2 km. The combined use of CloudSat radar and CALIPSO lidar measurements provides complementary information on cloud vertical structure and supports cloud type and thermodynamic phase classification (Stephens et al., 2002, 2008; Winker et al., 2010).
This study uses the CloudSat 2B-CLDCLASS-LIDAR product (all CloudSat products used in this study are from version R05), which combines information from the CloudSat CPR, the CALIOP onboard CALIPSO, and some ancillary data to classify clouds by type and thermodynamic phase (Sassen and Wang, 2008; Wang, 2019). The product identifies eight cloud types: cirrus (Ci), altostratus (As), altocumulus (Ac), stratus (St), stratocumulus (Sc), cumulus (Cu), nimbostratus (Ns), and deep convection (DC). These categories are based on traditional meteorological cloud-type nomenclature and are assigned to individual cloud layers by the 2B-CLDCLASS-LIDAR classification. This definition differs from the Moderate Resolution Imaging Spectroradiometer (MODIS) “cloud regimes” and the International Satellite Cloud Climatology Project (ISCCP) “weather states,” which characterize cloud fields at the grid-box scale by clustering joint histograms of cloud top pressure and cloud optical thickness (Cho et al., 2021; Tselioudis et al., 2021). Consequently, a cloud regime may contain multiple cloud types, and a given cloud type may occur within multiple regimes (Oreopoulos et al., 2014). Cloud thermodynamic phase for each cloud layer is categorized as ice, mixed, or liquid. Cloud types are classified based on a fuzzy-logic scheme using cloud features such as cloud cluster vertical and along-track horizontal scales, the radar reflectivity factor (Ze), precipitation scale and intensity, convective signature, cloud phase, cloud top variations, and other ancillary information. Cloud phase is inferred using a combination of CloudSat radar reflectivity, CALIOP detection of liquid cloud layers, and cloud-top and cloud-base temperatures, and thus differs from CALIOP-only phase determinations, which rely primarily on lidar backscatter and depolarization ratio (Hu et al., 2009; Cesana et al., 2016).
In this study, mixed-phase clouds are grouped into five cloud-type categories: As, Ac, St+Sc, Cu, and Ns+DC. Ci are excluded because they are predominantly ice phase. St and Sc are combined (St+Sc) because both represent low-level clouds that are typically coupled to the boundary layer and have similar thermodynamic environments. Ns and DC are grouped together (Ns+DC) to represent large-scale precipitating cloud systems with vertically extensive structures. In the tropics, DC is commonly associated with intense convective part of storms, with extensive stratiform regions classified as Ns, whereas in midlatitudes, Ns occurs more frequently in the absence of DC. This grouping is broadly consistent with the conceptual mixed-phase cloud types in terms of vertical distributions of ice and supercooled liquid water discussed in Korolev et al. (2017), although the present study uses a satellite-based cloud-type classification and does not map directly onto the types proposed in that study.
2.2 Auxiliary datasets and supporting cloud properties
Collocated atmospheric temperature profiles from the CloudSat ECMWF-AUX dataset (Partain, 2022) are used to analyze the vertical distribution of mixed-phase cloud occurrence in temperature coordinates. Ice microphysical properties are taken from the CloudSat 2C-ICE product (Deng et al., 2013, 2015), which provides retrieved vertical profiles of ice water content (IWC). Within mixed-phase cloud layers, IWC profiles are vertically integrated to derive ice water path (IWP).
MODIS onboard the Aqua satellite (King et al., 2003; Platnick et al., 2003, 2016) measures radiances in 36 spectral channels spanning the visible to the thermal infrared. MODIS cloud products provide retrievals of cloud optical and microphysical properties, including cloud thermodynamic phase and cloud water path. In this study, liquid water path (LWP) is derived from MODIS cloud water path retrievals for pixels classified as liquid phase. For the LWP analysis, only single-layer daytime mixed-phase profiles are retained to reduce ambiguity in interpreting MODIS LWP retrievals under multilayer cloud conditions. MODIS cloud water path is retained as LWP only when the MODIS optical-properties phase flag classifies the collocated pixel as liquid and the water-path retrieval is valid. The MODIS phase classification is used only to screen the LWP retrieval and does not alter the cloud phase or cloud type determined from 2B-CLDCLASS-LIDAR. Collocated MODIS retrievals are taken from the CloudSat MOD06-1KM-AUX product (Cronk and Partain, 2018). To mitigate known biases in MODIS LWP, particularly those associated with viewing geometry and subpixel cloud heterogeneity, a bias correction method based on solar zenith angle and a cloud heterogeneity index is applied following Khanal et al. (2020). Together, IWP and LWP provide complementary macrophysical information for characterizing mixed-phase clouds.
Ocean surface conditions are characterized using sea ice fraction data from the Modern-Era Retrospective analysis for Research and Applications, Version 2 (MERRA-2) reanalysis (Global Modeling and Assimilation Office, 2015), specifically the tavg1_2d_ocn_Nx product, which provides hourly sea ice fraction at 0.625°×0.5° (longitude × latitude) spatial resolution. These data are collocated with CloudSat observations using the nearest time and location to identify surface type (open ocean, sea ice, or land). Specifically, we classify CloudSat observations as over open ocean when sea ice fraction is <15 % and as over sea ice when sea ice fraction is ≥15 %. This 15 % threshold is a standard criterion used in many sea-ice extent products and previous studies (Parkinson et al., 1999; Comiso and Nishio, 2008; Frey et al., 2018). Grouping marginal and pack ice into a single sea ice category allows us to focus on the primary contrast of interest: ice-free versus ice-covered ocean surfaces. This classification enables comparison of the seasonal variations of mixed-phase cloud occurrence across different surface types, including land/open ocean/sea ice contrasts.
2.3 Statistical analysis
The analysis is based on CloudSat observations from June 2006 through December 2010. This period is selected to ensure consistent day/night sampling. Invalid or missing cloud type, cloud phase, cloud top and base height, and ancillary values required for the corresponding analyses are excluded. No additional screening based on the 2B-CLDCLASS-LIDAR confidence field is applied. For spatial distributions of mixed-phase cloud occurrence, occurrence is calculated at the profile level as the number of CloudSat profiles containing at least one mixed-phase cloud layer divided by the total number of observed profiles within a given bin. Each profile is counted at most once for the overall mixed-phase cloud occurrence and at most once for each cloud-type category, regardless of the number of mixed-phase layers of that type within the profile. Thus, a profile containing more than one mixed-phase cloud type may contribute to multiple cloud-type categories. For cloud geometry and vertically resolved mixed-phase occurrence, the analysis is performed at the layer level. Individual mixed-phase cloud layers within multilayer profiles are retained according to their cloud type and vertical extent, while non-mixed-phase layers within the same profile do not contribute to the mixed-phase cloud statistics. Spatial occurrence statistics are aggregated onto a 2.5°×2.5° horizontal grid. Vertical distributions are analyzed using altitude bins of 0.24 km and temperature bins of 1 °C, enabling characterization of mixed-phase cloud occurrence in both geometric height and temperature coordinates. All statistics are computed separately for each mixed-phase cloud type category to investigate spatial, vertical, and seasonal variations across different cloud types.
2.4 Uncertainties and limitations
Several sources of uncertainty should be considered when interpreting the results of this study. Cloud type classification is also subject to uncertainty arising from sensor limitations and differences in the observational information used to distinguish cloud categories. Passive-satellite cloud regimes are generally derived from distributions of retrieved cloud-top and optical properties but lack direct information on cloud vertical structure. Previous comparisons found general consistency between CloudSat cloud type distributions and surface-observer and ISCCP climatologies, while also identifying differences for some categories, particularly Cu and Ac, partly associated with CPR sensitivity and near-surface signal contamination (Sassen and Wang, 2008). Comparisons with MODIS cloud regimes likewise showed relatively strong correspondence for some cloud categories but less direct correspondence for middle-level and multilayer clouds, reflecting differences in observational information and classification definitions (Wang et al., 2016). Thus, cloud-type categories derived from different observing approaches are not necessarily directly equivalent, which should be considered when comparing cloud-type statistics across datasets.
Cloud phase classification in the 2B-CLDCLASS-LIDAR product depends on the combined sensitivities of the CPR and CALIOP, along with temperature information. The CALIOP signal is typically fully attenuated after approximately five optical depths from cloud top (Mace and Zhang, 2014). Thin liquid layers embedded within optically thick ice clouds may be missed, potentially leading to an underestimation of mixed-phase clouds in some cases. In addition, the limited sensitivity of the CPR and the liquid droplet contributions to Ze also reduces its ability to detect very low concentrations or small ice particles within supercooled liquid layers, which may be misclassified as liquid phase. Wang et al. (2024) compared in situ aircraft observations with CloudSat 2B-CLDCLASS-LIDAR and found that CloudSat tends to overestimate mixed-phase frequency. This overestimation likely arises from the classification approach: CloudSat may label entire deep cloud layers with cold tops and warm bases as mixed phase, whereas in situ measurements typically sample only localized portions of the cloud layers.
CloudSat's sun-synchronous orbit limits the observations to two local overpass times, around 01:30 and 13:30 local solar time. As a result, the climatology represents conditional sampling and does not capture the full diurnal cycle of clouds. In addition, MODIS LWP retrievals used in this study are available only during daytime conditions, which introduces additional uncertainty because nighttime LWP statistics are not available. Uncertainties in IWP and LWP retrievals may affect quantitative estimates, but they are unlikely to affect the qualitative interpretation of regional and seasonal variations for the five mixed-phase cloud types.
Despite these limitations, combined CloudSat/CALIPSO observations remain one of the most comprehensive datasets available for characterizing the global distribution and vertical structure of type-dependent mixed-phase clouds.
3.1 Spatial distributions of cloud-type-dependent mixed-phase clouds
Figure 1 column 1 presents the global spatial distribution of identified mixed-phase cloud occurrence, along with the partitioning among cloud types. When all cloud types are combined (Fig. 1a1), the global mean mixed-phase cloud occurrence is 18.5 %. Spatially, mixed-phase clouds are most frequent in three broad regions: the tropical Intertropical Convergence Zone (ITCZ), midlatitude storm-track regions, and high-latitude oceans. Occurrence reaches about 40 %–50 % over the Southern Ocean and 30 %–40 % in NH high latitudes, with particularly high values over the Greenland–Iceland–Norwegian (GIN) seas, where local occurrence exceeds 40 %. Other Arctic regions, such as the Beaufort and East Siberian seas, show more moderate occurrence of about 20 %–30 %.
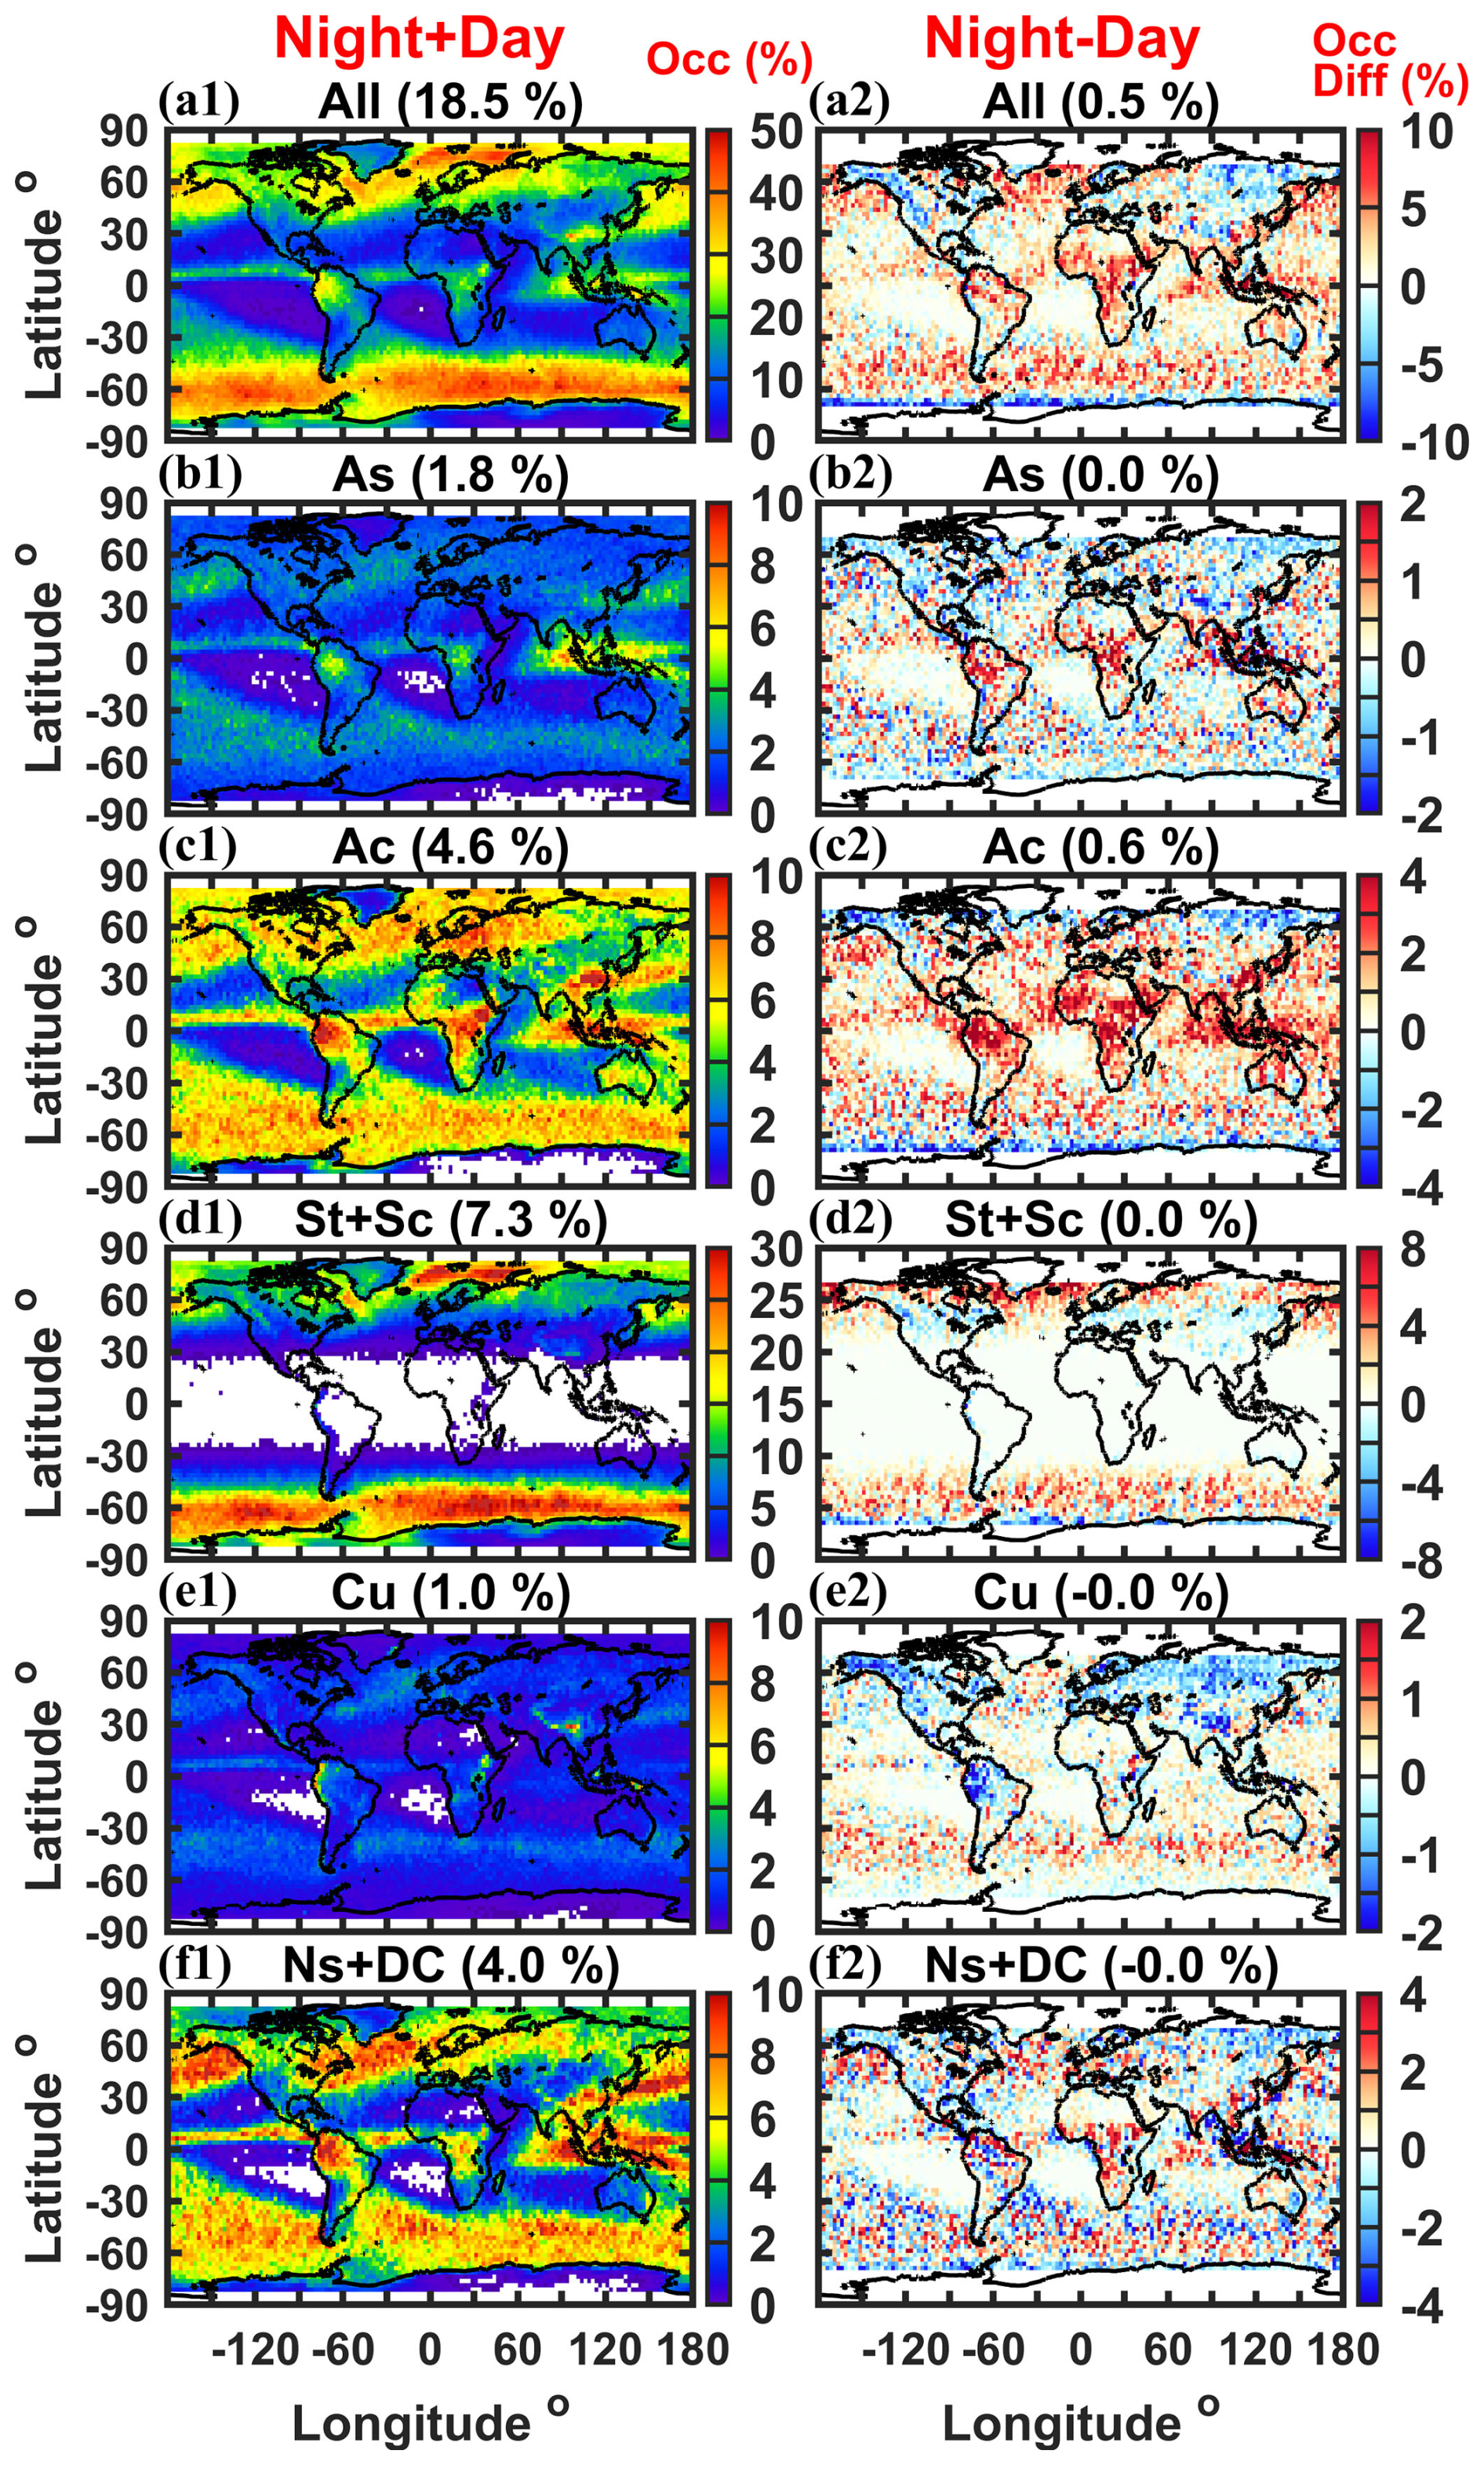
Figure 1Spatial distributions of mixed-phase cloud occurrence. Column (1) shows day/night combined occurrence, including all identified mixed-phase clouds (row a), followed by identified mixed-phase cloud occurrence for individual cloud types: As (row b), Ac (row c), St+Sc (row d), Cu (row e), and Ns+DC (row f). Column (2) shows the night–day difference in occurrence. All subplots are at 2.5°×2.5° resolution, and the numbers above each subplot indicate global mean values. Grid points with occurrences smaller than 0.01 % are masked in column (1). Night–day differences poleward of 70° in both hemispheres are masked to avoid aliasing of seasonal variability into the day/night contrast under polar day and polar night conditions.
Multilayer clouds constitute a substantial fraction of the identified mixed-phase cloud population: 43.5 % of profiles containing mixed-phase clouds contain multiple detected cloud layers. For profiles containing mixed-phase As, Ac, St+Sc, Cu, and Ns+DC, the fractions that contain multiple detected cloud layers are 57.3 %, 63.8 %, 33.5 %, 57.6 %, and 33.5 %, respectively.
In the tropics, mixed-phase cloud occurrence is strongly associated with deep convective systems, including both convective and stratiform precipitation regions (Ns+DC; Fig. 1f1), together with substantial contributions from mid-level Ac (Fig. 1c1). This pattern reflects the prevalence of deep convection, where strong vertical motions produce vertically extensive cloud systems and transport moisture into mid and upper troposphere, supporting the formation of clouds in mixed-phase temperature ranges. In contrast, As (Fig. 1b1) contributes more modestly in the tropics and is primarily associated with stratiform anvil outflow from deep convective systems (Houze, 2004).
Midlatitude storm-track regions between approximately 30 to 50° in both hemispheres show moderate mixed-phase occurrence, typically around 20 %–30 % (Fig. 1a1), with contributions mainly from Ac (Fig. 1c1) and Ns+DC (Fig. 1f1). These clouds are closely associated with synoptic-scale baroclinic systems, where large-scale ascent along warm conveyor belts and frontal zones supports clouds within the mixed-phase temperature range (Morrison et al., 2012; Field et al., 2014). In the NH, mixed-phase Ac extends farther poleward than Ns+DC, reaching latitudes north of 60° N, whereas Ns+DC occurrence decreases more rapidly with latitude. This contrast indicates a poleward reduction in the frequency and vertical extent of organized precipitating systems, while mid-tropospheric moisture and weak ascent remain sufficient to sustain Ac formation and maintenance.
At high latitudes, mixed-phase cloud occurrence is dominated by low-level stratiform clouds (St+Sc; Fig. 1d1), especially over the Southern Ocean and parts of the Arctic, where local occurrence reaches around 30 %. Over the Southern Ocean, the distinct maximum near 60° S is associated with strong air-sea interaction over open water, which enhances surface turbulent heat and moisture fluxes and supports persistent marine boundary-layer clouds. The persistence of mixed-phase structure in these clouds reflects interactions among boundary-layer circulation, cloud-top radiative cooling, ice nucleation, and the sedimentation of ice particles (McCoy et al., 2015; Bodas-Salcedo et al., 2016; Korolev et al., 2017). In the Arctic, enhanced mixed-phase St+Sc occurrence over oceanic regions, particularly in the GIN seas, is frequently associated with cold-air outbreaks and strong surface-atmosphere coupling over relatively warm open water (Shupe et al., 2006; Mioche et al., 2017).
Cu (Fig. 1e1) contributes the smallest fraction to global mixed-phase cloud occurrence, with a global mean occurrence of about 1.0 %, and is mainly associated with shallow to congestus convection in both the tropics and midlatitudes. Localized maxima in mixed-phase Cu occurrence are evident in regions of elevated terrain, including parts of the Andes, East Africa, and areas adjacent to the Tibetan Plateau. These features are consistent with the influence of orographic lifting, which can support shallow convection and allow cloud tops to reach mixed-phase temperature levels.
The night–day differences in mixed-phase cloud occurrence are shown in Fig. 1 column 2. Differences poleward of 70° in both hemispheres are masked to avoid aliasing of seasonal variability into the day/night contrast under polar day and polar night conditions. For all identified mixed-phase clouds (Fig. 1a2), positive differences (nighttime > daytime) of ∼5 %–8 % are observed over tropical land regions. In the NH midlatitudes, ocean regions exhibit generally positive differences, typically ∼2 %–4 %, with locally larger values approaching ∼5 %–6 % in parts of the North Atlantic near 50–60° N, while adjacent land regions show negative differences of smaller magnitude. Over the Southern Ocean (30–60° S), mixed-phase occurrence is higher at night by ∼4 %–6 %, whereas values become weakly negative closer to Antarctica and sea-ice covered regions.
These contrasts vary by cloud type. Mixed-phase Ac (Fig. 1c2) shows positive differences of up to ∼3 %–4 % over tropical land and nearby oceanic regions, while exhibiting weak negative values poleward of ∼60° in both hemispheres. St+Sc (Fig. 1d2) display the strongest and spatially organized signal, with widespread nighttime enhancements of ∼5 %–7 % over the Southern Ocean and ∼5 %–8 % over the North Atlantic near 60–70° N. This behavior is consistent with enhanced cloud-top longwave radiative cooling at night, which strengthens boundary-layer turbulence and helps maintain low-level stratiform mixed-phase clouds by sustaining supercooled liquid layers against depletion through the WBF process (Morrison et al., 2012; Korolev et al., 2017; Tan et al., 2023). In contrast, Cu (Fig. 1e2) exhibits negative differences over land (generally % to −2 %) in the tropics and NH midlatitudes, consistent with the diurnal cycle of shallow convection being strongly driven by daytime surface heating over land. For Ns+DC (Fig. 1f2), the day/night differences in the tropics are generally within ±2 %–3 %, and the spatial patterns are broadly consistent with the known day/night differences of tropical deep convection, with higher nighttime occurrence over Africa, the Maritime Continent, and the Indian Ocean, and alternating northwest–southeast bands of higher and lower nighttime occurrence over the Amazon (Yang et al., 2025b).
It should be noted that the night–day differences presented here are derived from observations at two fixed local times (∼ 01:30 and ∼ 13:30 LT) from the A-Train orbit and therefore do not represent the full diurnal cycle. To ensure consistent sampling of both daytime and nighttime conditions, this analysis is restricted to the 2006–2010 period when the CloudSat CPR operated continuously, rather than the post-2011 daytime-only observations. Despite this limitation, the spatial patterns indicate that robust large-scale day/night contrasts in mixed-phase cloud occurrence across different cloud types are captured in this dataset.
Overall, Fig. 1 highlights distinct regional contrasts in mixed-phase cloud occurrence and a strong dependence on cloud type. Low-level stratiform clouds (St+Sc) dominate mixed-phase occurrence at high latitudes, particularly over the Southern Ocean and the Arctic. In midlatitudes, mixed-phase clouds are primarily associated with synoptic-scale baroclinic systems, with contributions mainly from Ac and Ns+DC. In the tropics, mixed-phase occurrence is largely linked to deep convective systems (Ns+DC) and mid-level Ac. These results demonstrate that mixed-phase cloud occurrence varies systematically with cloud type and large-scale dynamical environment.
Figure 2 illustrates the zonal mean distribution of mixed-phase cloud occurrence for different cloud types. Mixed-phase Ac and Ns+DC exhibit broadly similar zonal variations, with maxima in three latitude bands: near 5° N (∼6 %–6.5 %), in the Southern Hemisphere (SH) midlatitudes (∼50° S, ∼6.5 %–7 %), and in the NH midlatitudes to subpolar region (∼55–60° N, ∼6 %–6.5 %). These peaks correspond to the ITCZ and midlatitude storm-track regions identified in Fig. 1, where large-scale ascent associated with deep convection and baroclinic systems supports cloud layers extending into the mixed-phase temperature range (Field et al., 2014; Bodas-Salcedo et al., 2016). Differences between Ac and Ns+DC are more apparent outside these regions, particularly in the subtropics (approximately 15–30° in both hemispheres) and in the NH high latitudes, whereas the two cloud types show more similar occurrence in the SH high latitudes.
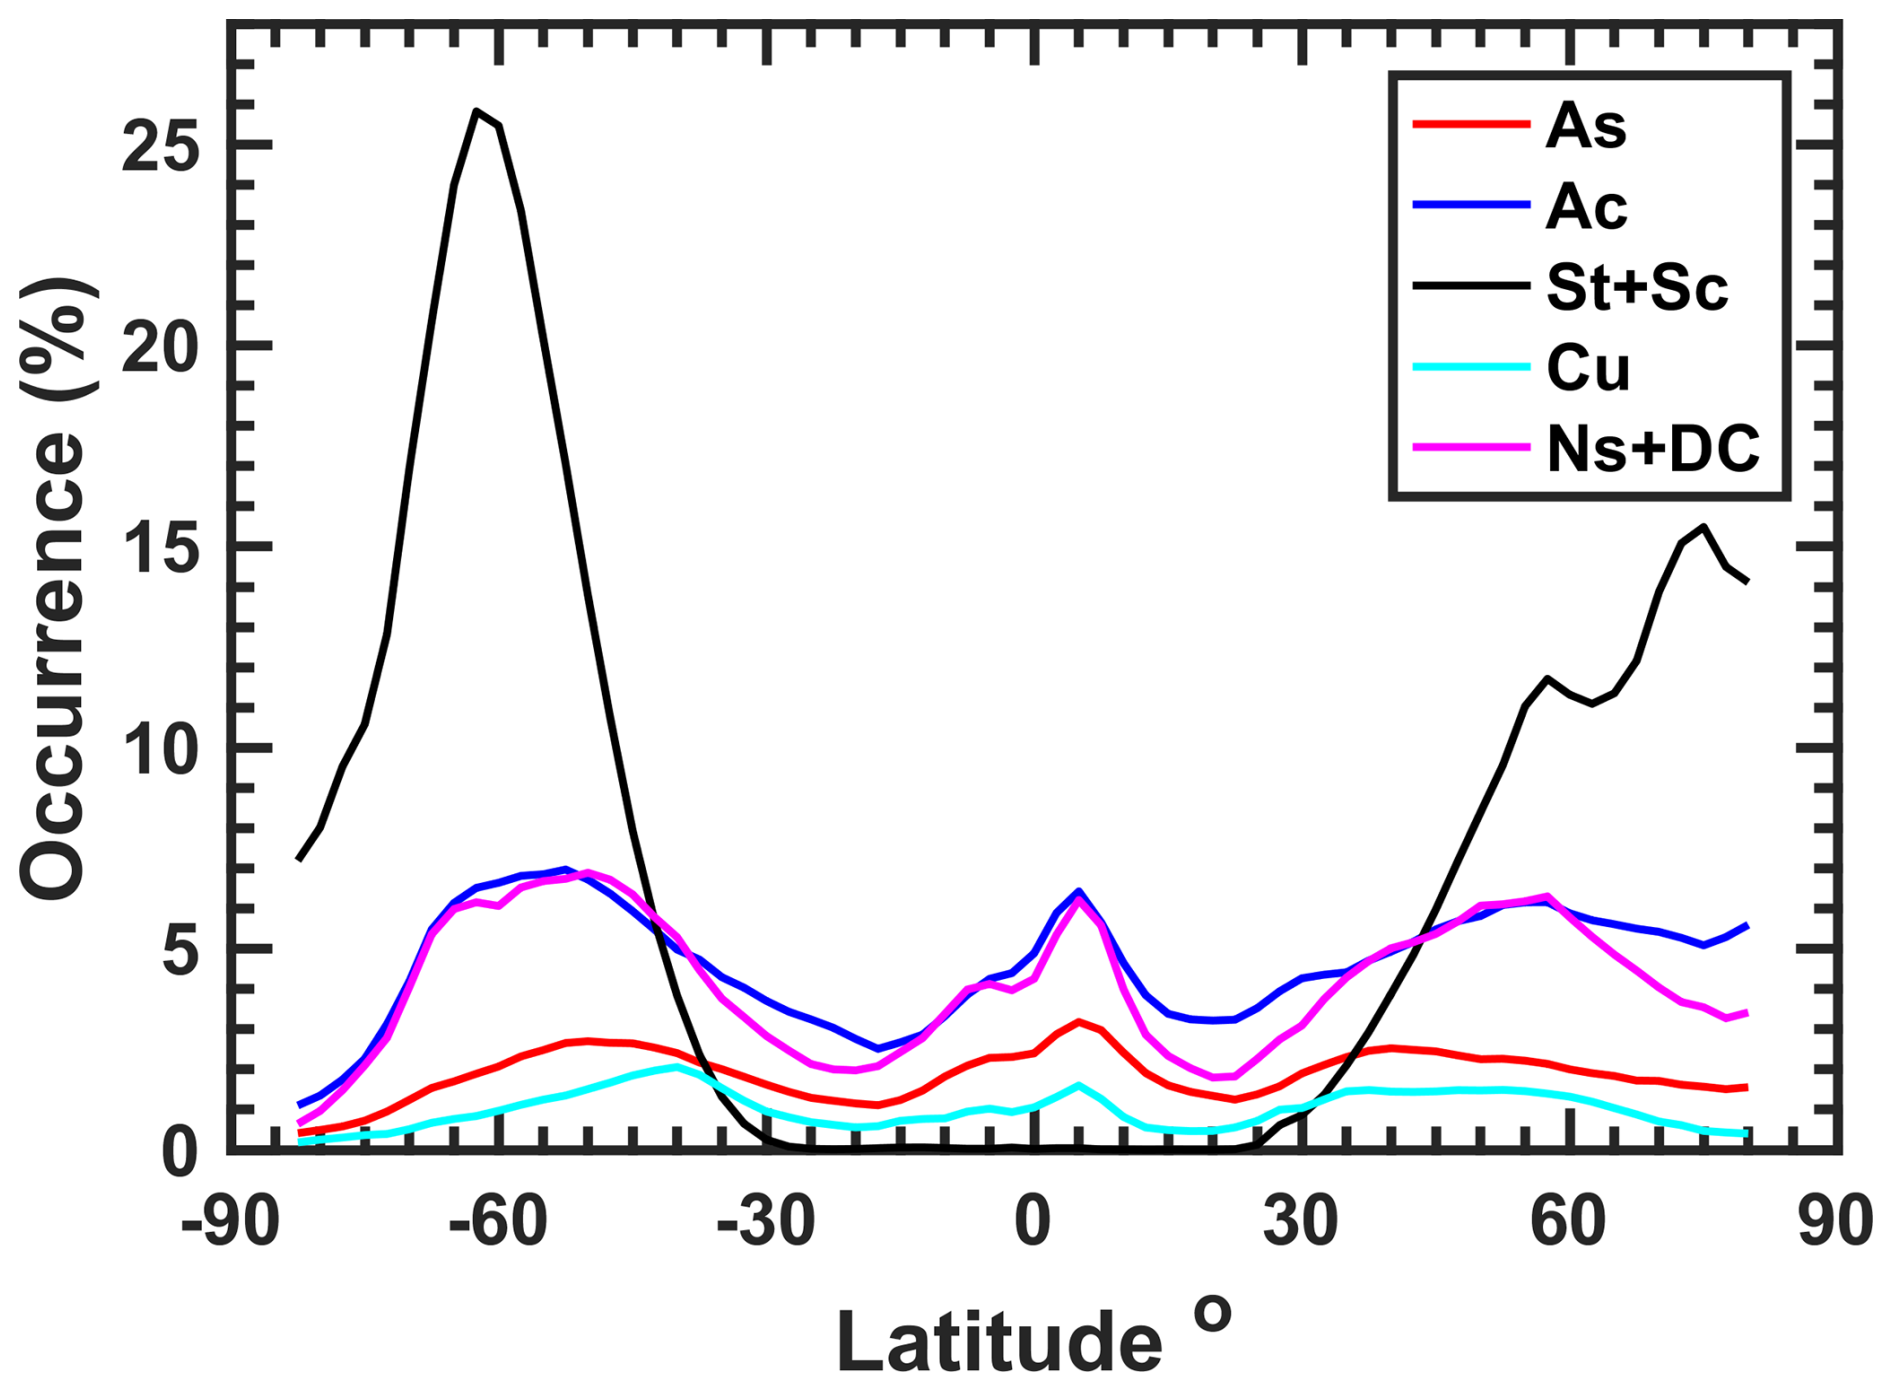
Figure 2Zonal mean mixed-phase cloud occurrence for different cloud types: As, Ac, St+Sc, Cu, and Ns+DC. Each curve represents the zonal mean occurrence for the corresponding cloud type. The y axis shows mixed-phase cloud occurrence (%), and the x axis represents latitude (°) with a 2.5° resolution.
Mixed-phase As shows a similar but weaker zonal structure, with a maximum near 5° N (∼3 %) and a local peak in the SH midlatitudes near 50° S, aligning with Ac and Ns+DC. In the NH, however, the As maximum occurs farther equatorward, near ∼40° N (∼2 %–2.5 %), rather than at ∼55–60° N.
In contrast, mixed-phase St+Sc shows a markedly different zonal distribution, with a strong maximum near 62° S (∼26 %), far exceeding all other cloud types. This peak corresponds to the Southern Ocean maximum seen in Fig. 1e1 and reflects the prevalence of persistent marine boundary-layer clouds maintained by strong air-sea coupling and cloud-top radiative cooling (Shupe et al., 2006; Morrison et al., 2012; McCoy et al., 2015). Occurrence decreases rapidly equatorward to near 0 % at ∼30° S, and poleward to ∼7 % near 80° S. In the NH, St+Sc exhibits a weaker but still strong maximum near ∼75° N (∼15 %–16 %), with a secondary peak near ∼57° N (∼11 %–12 %). The higher-latitude maximum is consistent with enhanced occurrence over Arctic oceanic regions, particularly the GIN seas, while the midlatitude peak corresponds more broadly to subpolar ocean regions, including the North Atlantic (e.g., Labrador Sea) and parts of the North Pacific, consistent with the spatial patterns in Fig. 1e1.
Mixed-phase Cu shows lower occurrence than other cloud types, peaking near ∼40° S (∼2 %). A local maximum is also evident near ∼5° N (∼1.5 %–2 %), associated with shallow to congestus convection embedded within convective regions of the ITCZ.
Figure 3 compares regional mixed-phase cloud properties for the five cloud types across three latitude bands, including cloud top height versus geometric thickness (column 1) and LWP versus IWP (column 2). A clear separation among cloud types is evident in both columns, indicating that mixed-phase cloud properties vary systematically with cloud type. In addition to the cloud-type-dependent differences in occurrence shown in Figs. 1 and 2, Fig. 3 shows that cloud types also differ substantially in their geometric structure and condensate properties.
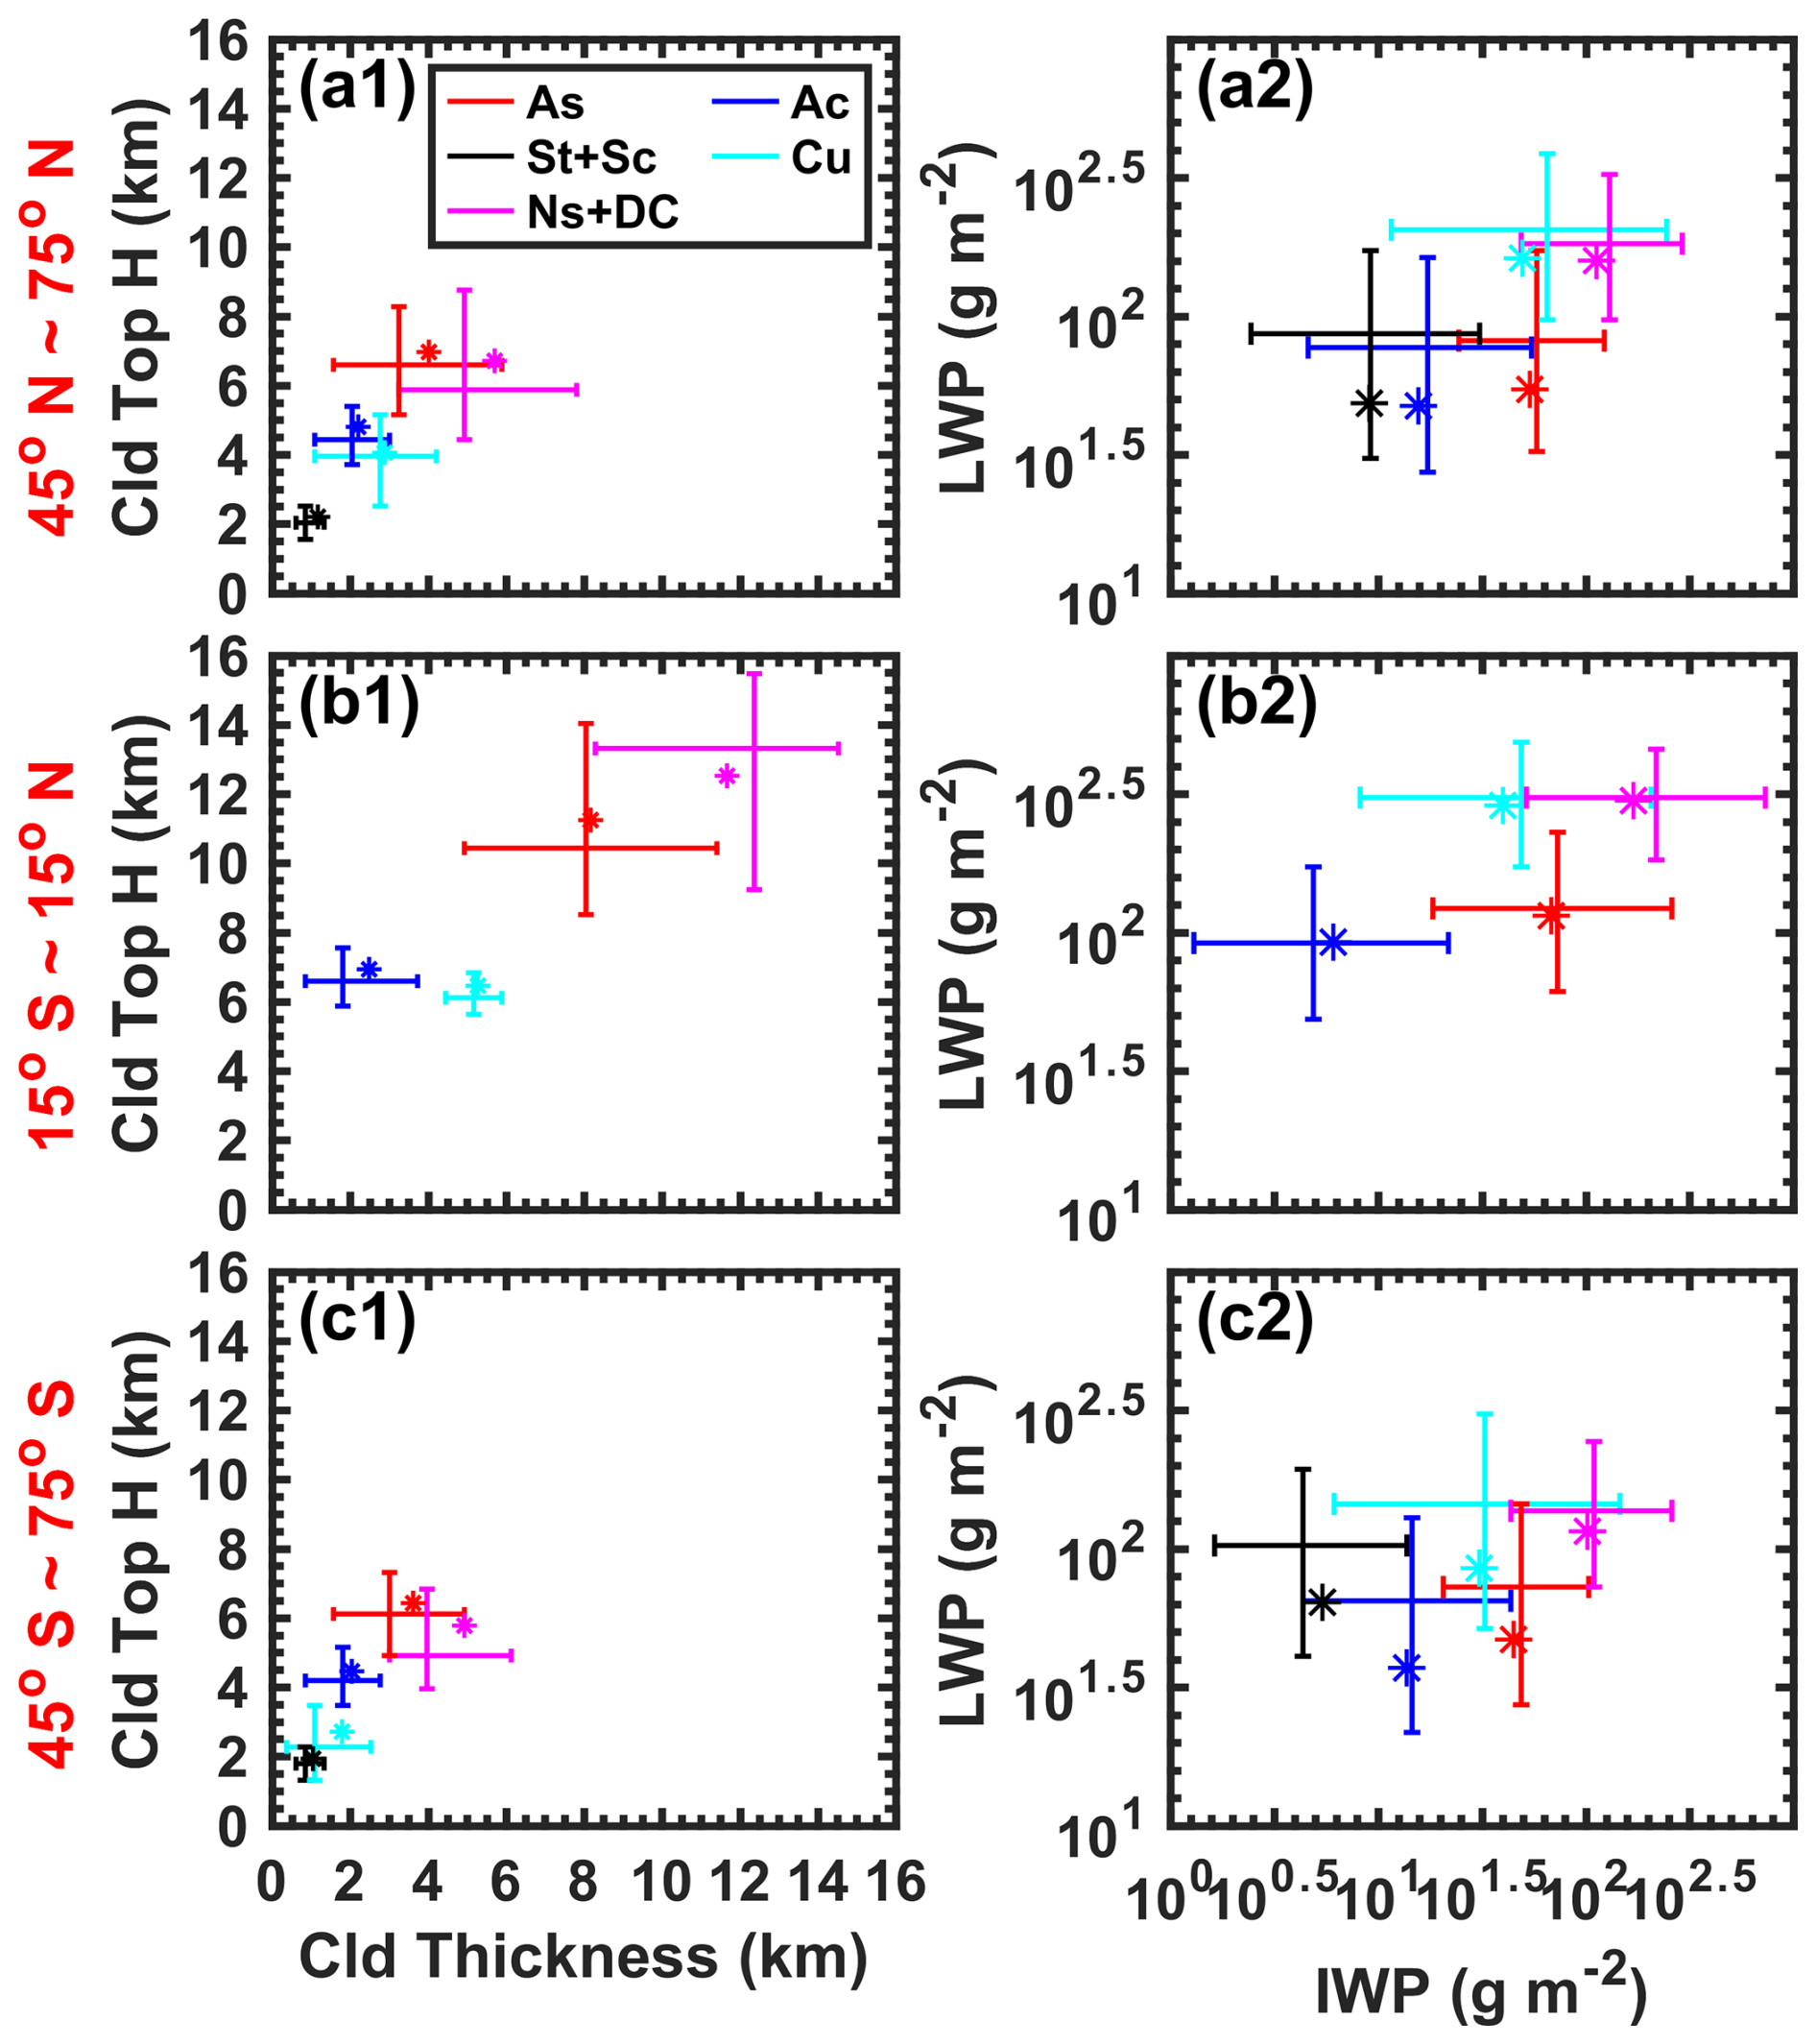
Figure 3Daytime regional mixed-phase cloud properties for As, Ac, St+Sc, Cu, and Ns+DC. Column (1) shows cloud top height versus cloud geometric thickness, and column (2) shows liquid water path (LWP) versus ice water path (IWP) for single-layer mixed-phase clouds. The cross formed by the horizontal and vertical lines represents the median values of the corresponding variables (cloud top height and thickness in column 1; LWP and IWP in column 2). Horizontal and vertical lines indicate the 25th and 75th percentiles, with short bars at the ends for illustration. Asterisks (*) denote the mean values. Rows (a)–(c) correspond to the latitude bands 45–75° N, 15° S–15° N, and 45–75° S, respectively.
Structural differences are evident among cloud types. Ns+DC exhibit the largest cloud thickness across all three latitude bands and also have the highest cloud tops in the tropics. As is the next deepest cloud type, with greater thickness and higher cloud tops than Ac, while Ac occurs at intermediate altitudes and is comparatively thinner. In contrast, St+Sc are the lowest and thinnest cloud type, with median cloud top heights around 2 km and thickness typically less than 1 km, consistent with boundary-layer clouds. Cu generally occupies an intermediate position between St+Sc and the mid-level cloud types, but remains relatively shallow overall, with cloud-top heights typically below 7 km in the tropics and below 5 km in the mid-to-high latitudes. These differences indicate that the mixed-phase cloud types shown here have systematically different geometric structures and are associated with distinct meteorological environments.
Macrophysical differences are also evident in LWP and IWP. Ns+DC consistently show the largest IWP across all latitude bands, with median values on the order of 102 g m−2, reflecting their vertically extensive structure and substantial ice mass. Their median LWP is also relatively large and is comparable to or exceeds IWP in some regions. The relatively similar MODIS LWP of Cu and Ns+DC should be interpreted cautiously because both statistics represent conditionally sampled subsets. Both are subject to the MODIS liquid-phase screening; in addition, the mixed-phase Cu sample is restricted to Cu extending into subfreezing temperatures and can include cumulus congestus, whereas the liquid-phase screening is particularly restrictive for Ns+DC with ice-dominated cloud tops. In contrast, St+Sc are characterized by very small IWP, with median values generally on the order of a few to about 10 g m−2 depending on latitude, but comparatively large LWP (with median values typically about 100 g m−2). As and Ac occupy an intermediate position in LWP-IWP space: their IWP is smaller than that of Ns+DC but larger than that of St+Sc, while their LWP is comparable to St+Sc in the NH and generally smaller in the SH. Mixed-phase As generally exhibits larger IWP than Ac, consistent with its greater cloud thickness (Fig. 3 column 1) and likely differences in ice water content. Overall, the LWP-IWP distributions indicate that different cloud types differ not only in condensate magnitude but also in the relative contribution of liquid and ice.
Latitudinal variations further modulate these cloud-type-dependent properties. Clouds in the tropics are also generally higher and thicker than those in the mid-to-high latitude bands, although Ac shows comparable thickness across the three latitude bands (Fig. 3 column 1). Tropical mixed-phase clouds also tend to exhibit larger LWP across several cloud types, consistent with greater moisture availability and, for some cloud types, greater cloud thickness. Differences between hemispheres are also evident but remain modest. As, Ac, and Ns+DC have median cloud top heights that are typically about 0.5–1 km higher in the NH than in the SH, while their thicknesses are broadly comparable, with Ns+DC in the NH being slightly thicker (by ∼1 km) than in the SH (Fig. 3a1 and c1). Hemispheric differences in LWP and IWP vary by cloud type. For example, St+Sc and Cu tend to show larger IWP in the NH than in the SH, whereas As, Ac, and Ns+DC show comparable or slightly larger LWP and IWP in the NH than in the SH (Fig. 3a2 and c2). These hemispheric contrasts may be influenced by differences in surface-type distribution (more land in the NH versus more open ocean in the SH), aerosol abundance and type, including their ability to act as cloud condensation nuclei (CCN) or ice-nucleating particles (INPs), and large-scale dynamical environments, although they are generally smaller than the variations among cloud types (McCoy et al., 2015; Bodas-Salcedo et al., 2016). In particular, the greater continental influence in the NH may provide more sources of efficient INPs, such as mineral dust, which could influence ice production and contribute to the observed IWP differences (Tan et al., 2014).
It should be noted that the LWP values are derived from MODIS daytime retrievals and are limited to pixels classified as liquid phase. As a result, the analysis does not include nighttime LWP and may be subject to sampling biases. In particular, CloudSat/CALIPSO mixed-phase clouds that are not classified as liquid by MODIS, including clouds with ice-dominated tops (Wang et al., 2023), are excluded from the LWP statistics but remain included in the CloudSat/CALIPSO occurrence and cloud-geometry analyses. Among single-layer daytime mixed-phase clouds, the fraction with valid MODIS liquid-phase LWP retrievals ranges from approximately 19.3 % to 50.3 % across the five cloud types and is approximately 19.8 % for Ns+DC. In addition, because the MODIS cloud optical-property retrieval assumes a single thermodynamic phase for each pixel, the retrieved cloud water path for vertically mixed-phase clouds classified as liquid may not accurately represent the actual liquid water path of the mixed-phase cloud, particularly for clouds with substantial ice content such as Ns+DC. Nevertheless, the distinct differences in cloud geometry and condensate amount and partitioning across cloud types indicate that mixed-phase cloud properties are fundamentally cloud-type dependent, reinforcing the need for a cloud-type resolved mixed-phase cloud climatology.
Figure 4 shows regional-mean cloud occurrence as a function of cloud-top temperature, separated by cloud phase and cloud type. For each 1 °C temperature bin, the occurrence is defined as the number of observed cloud layers of a given type and phase with cloud top temperatures within that bin, divided by the number of CloudSat observation profiles in that region. The occurrence values summed over all temperature bins in each subplot of Fig. 4 correspond to the total occurrence of that cloud type and phase in the region. This figure highlights that cloud occurrence as a function of cloud top temperature differs strongly among cloud types, and that the dominant cloud phase at a given cloud-top temperature also depends on cloud type.
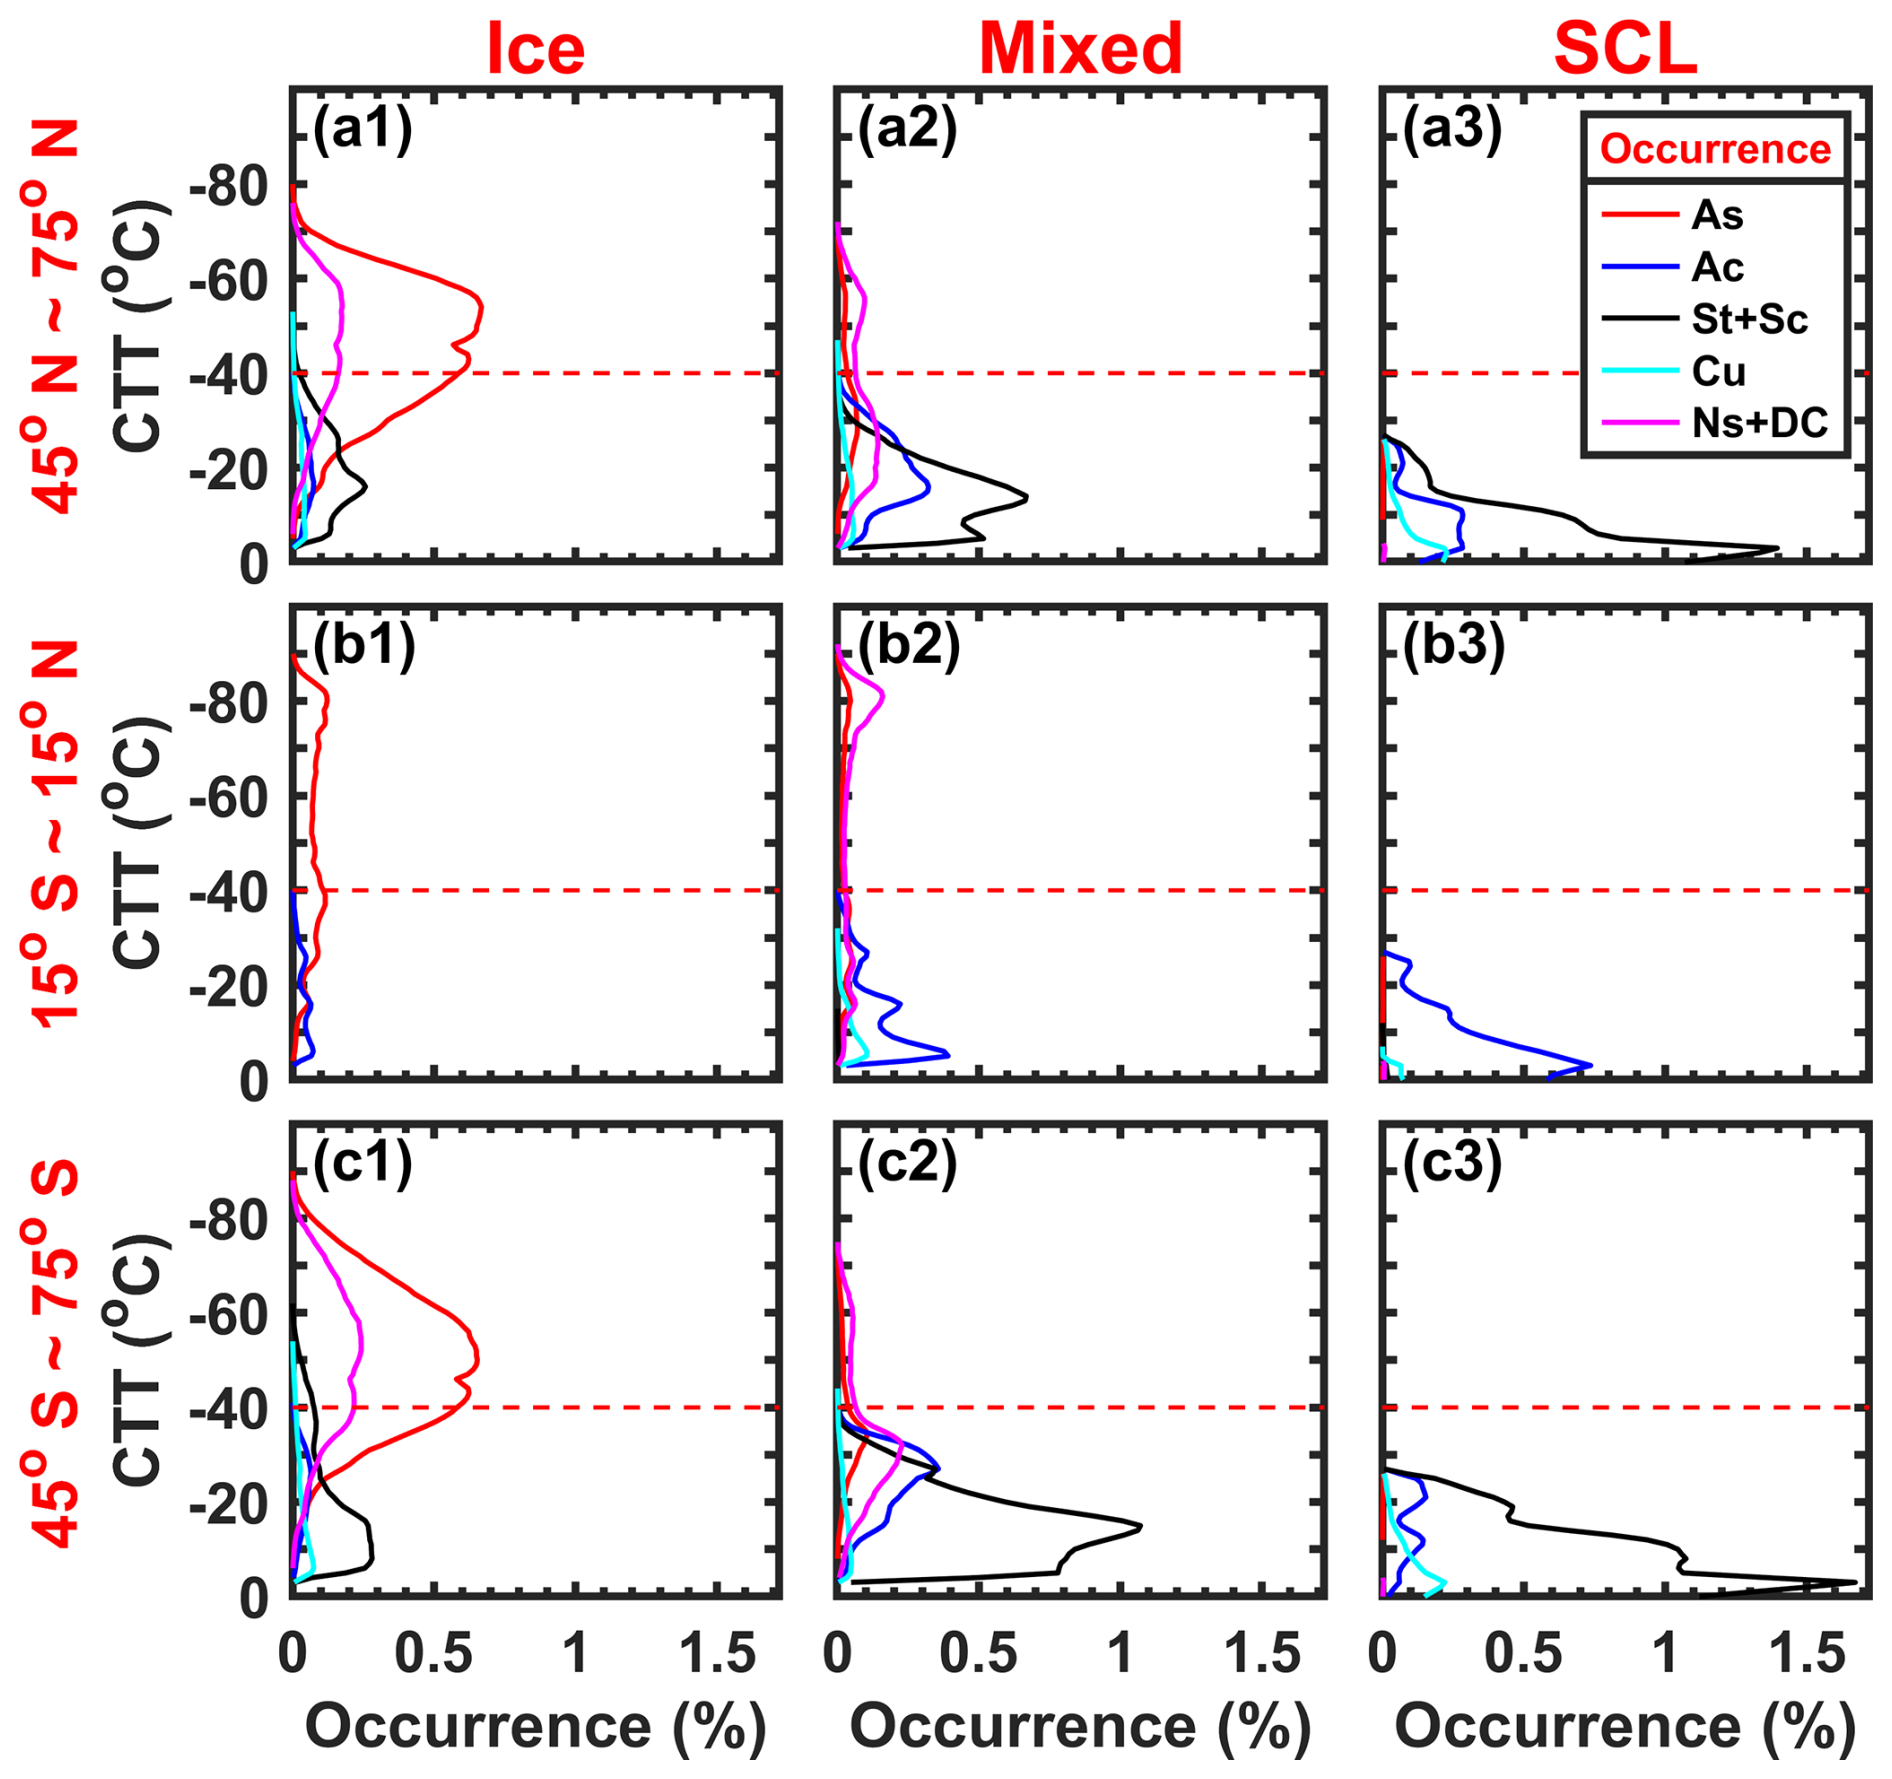
Figure 4Regional mean cloud occurrence as a function of cloud top temperature (CTT) for As, Ac, St+Sc, Cu, and Ns+DC. Colored lines in each subplot represent the occurrence of the five cloud types, referenced to the bottom x axis. The y axis represents cloud top temperature (°C) at 1 °C resolution. Columns (1), (2), and (3) correspond to ice-phase, mixed-phase, and supercooled liquid-phase (SCL) clouds, respectively. Rows (a)–(c) correspond to the latitude bands 45–75° N, 15° S–15° N, and 45–75° S, respectively. The horizontal red dashed lines mark the −40 °C level.
In the NH mid-to-high latitude band (45–75° N; Fig. 4 row a), distinct cloud-type-dependent differences are evident. St+Sc dominate the supercooled liquid occurrence over a broad temperature range from near 0 °C down to about −27 °C with the largest values of about 1.4 % near −3 °C (Fig. 4a3). Their mixed-phase occurrence is also substantial, reaching a clear maximum near −14 to −15 °C (Fig. 4a2). This contrast is consistent with the common liquid-topped structure of low-level stratiform mixed-phase clouds, for which mixed-phase occurrence becomes most prominent at cloud-top temperatures from about −10 to −20 °C, where ice is more frequently present and more readily detected (Shupe et al., 2006; Morrison et al., 2012). In contrast, As contributes most strongly to the ice-phase occurrence at colder cloud-top temperatures, especially below about −25 °C (Fig. 4a1). For As, ice-phase occurrence exceeds mixed-phase occurrence across most of the mixed-phase temperature range in this latitude band, indicating a stronger tendency toward ice-dominated conditions. Ac shows a different behavior: supercooled liquid occurrence dominates at temperatures warmer than about −10 °C, while mixed-phase occurrence becomes dominant at temperatures colder than about −15 °C, with only a relatively small ice-phase contribution. These contrasts indicate that cloud-top temperature alone does not uniquely determine cloud phase, and that cloud phase varies substantially among cloud types.
In the tropics (15° S–15° N; Fig. 4 row b), the distributions differ substantially from those in the NH mid-to-high latitudes. Ac, rather than St+Sc, contributes most strongly to the supercooled liquid occurrence, and also dominates mixed-phase occurrence over much of the temperature range warmer than −40 °C, with a main peak near −5 °C. At temperatures colder than −40 °C, however, Ns+DC becomes increasingly dominant in the mixed-phase category. This reflects the vertically extensive nature of tropical deep convective systems, whose cloud tops can be much colder than −40 °C while substantial portions of the cloud remain within warmer layers and cloud bases are warmer than 0 °C. The mixed-phase Ac distribution shows multiple peaks in temperature, indicating preferred temperature ranges for tropical mid-level clouds, consistent with previous studies of tropical cloud vertical structure (Johnson et al., 1999; Riley and Mapes, 2009). For the ice phase, As contributes most strongly at temperatures colder than about −25 °C, but its occurrence remains low (∼0.1 %), much smaller than in the NH mid-to-high latitudes.
In the SH mid-to-high latitude band (45–75° S; Fig. 4 row c), the dominant cloud types contributing to each phase are broadly similar to those in the NH: St+Sc dominate supercooled liquid and mixed-phase occurrence, while in the ice-phase category, St+Sc contribute most strongly at temperatures warmer than about −25 °C and As dominates at temperatures colder than that. However, the temperature dependence differs between hemispheres. For example, ice-phase St+Sc occurrence in the SH is spread more evenly across approximately −17 to −5 °C, whereas in the NH it shows a clearer maximum near −17 °C. Mixed-phase Ac in the SH peaks at colder temperatures (around −28 °C) than in the NH, where the maximum is closer to −15 °C, and the corresponding supercooled liquid Ac occurrence is reduced. Mixed-phase Ns+DC in the SH also shows a distinct maximum near −32 °C, differing from the NH distribution. These contrasts indicate that, even for the same cloud type, the temperature dependence of phase-resolved cloud occurrence varies systematically between the two hemispheres.
3.2 Seasonal variations and land/open ocean/sea ice contrast
Figure 5 shows the seasonal spatial distributions of mixed-phase cloud occurrence for the five cloud types, highlighting clear latitudinal contrasts and regional dependence. In the tropics, mixed-phase occurrence for all cloud types except St+Sc exhibits meridional shifts that broadly follow the seasonal migration of the ITCZ. At mid and high latitudes, seasonal variability is also evident, but its magnitude and spatial structure differ substantially among cloud types. Global-mean occurrence varies seasonally as well, with relatively modest changes for As (1.7 %–1.9 %), Cu (0.9 %–1.1 %), and Ns+DC (3.8 %–4.1 %), somewhat larger changes for Ac (3.9 %–5.1 %), and the largest seasonal range for St+Sc (5.6 %–8.5 %).
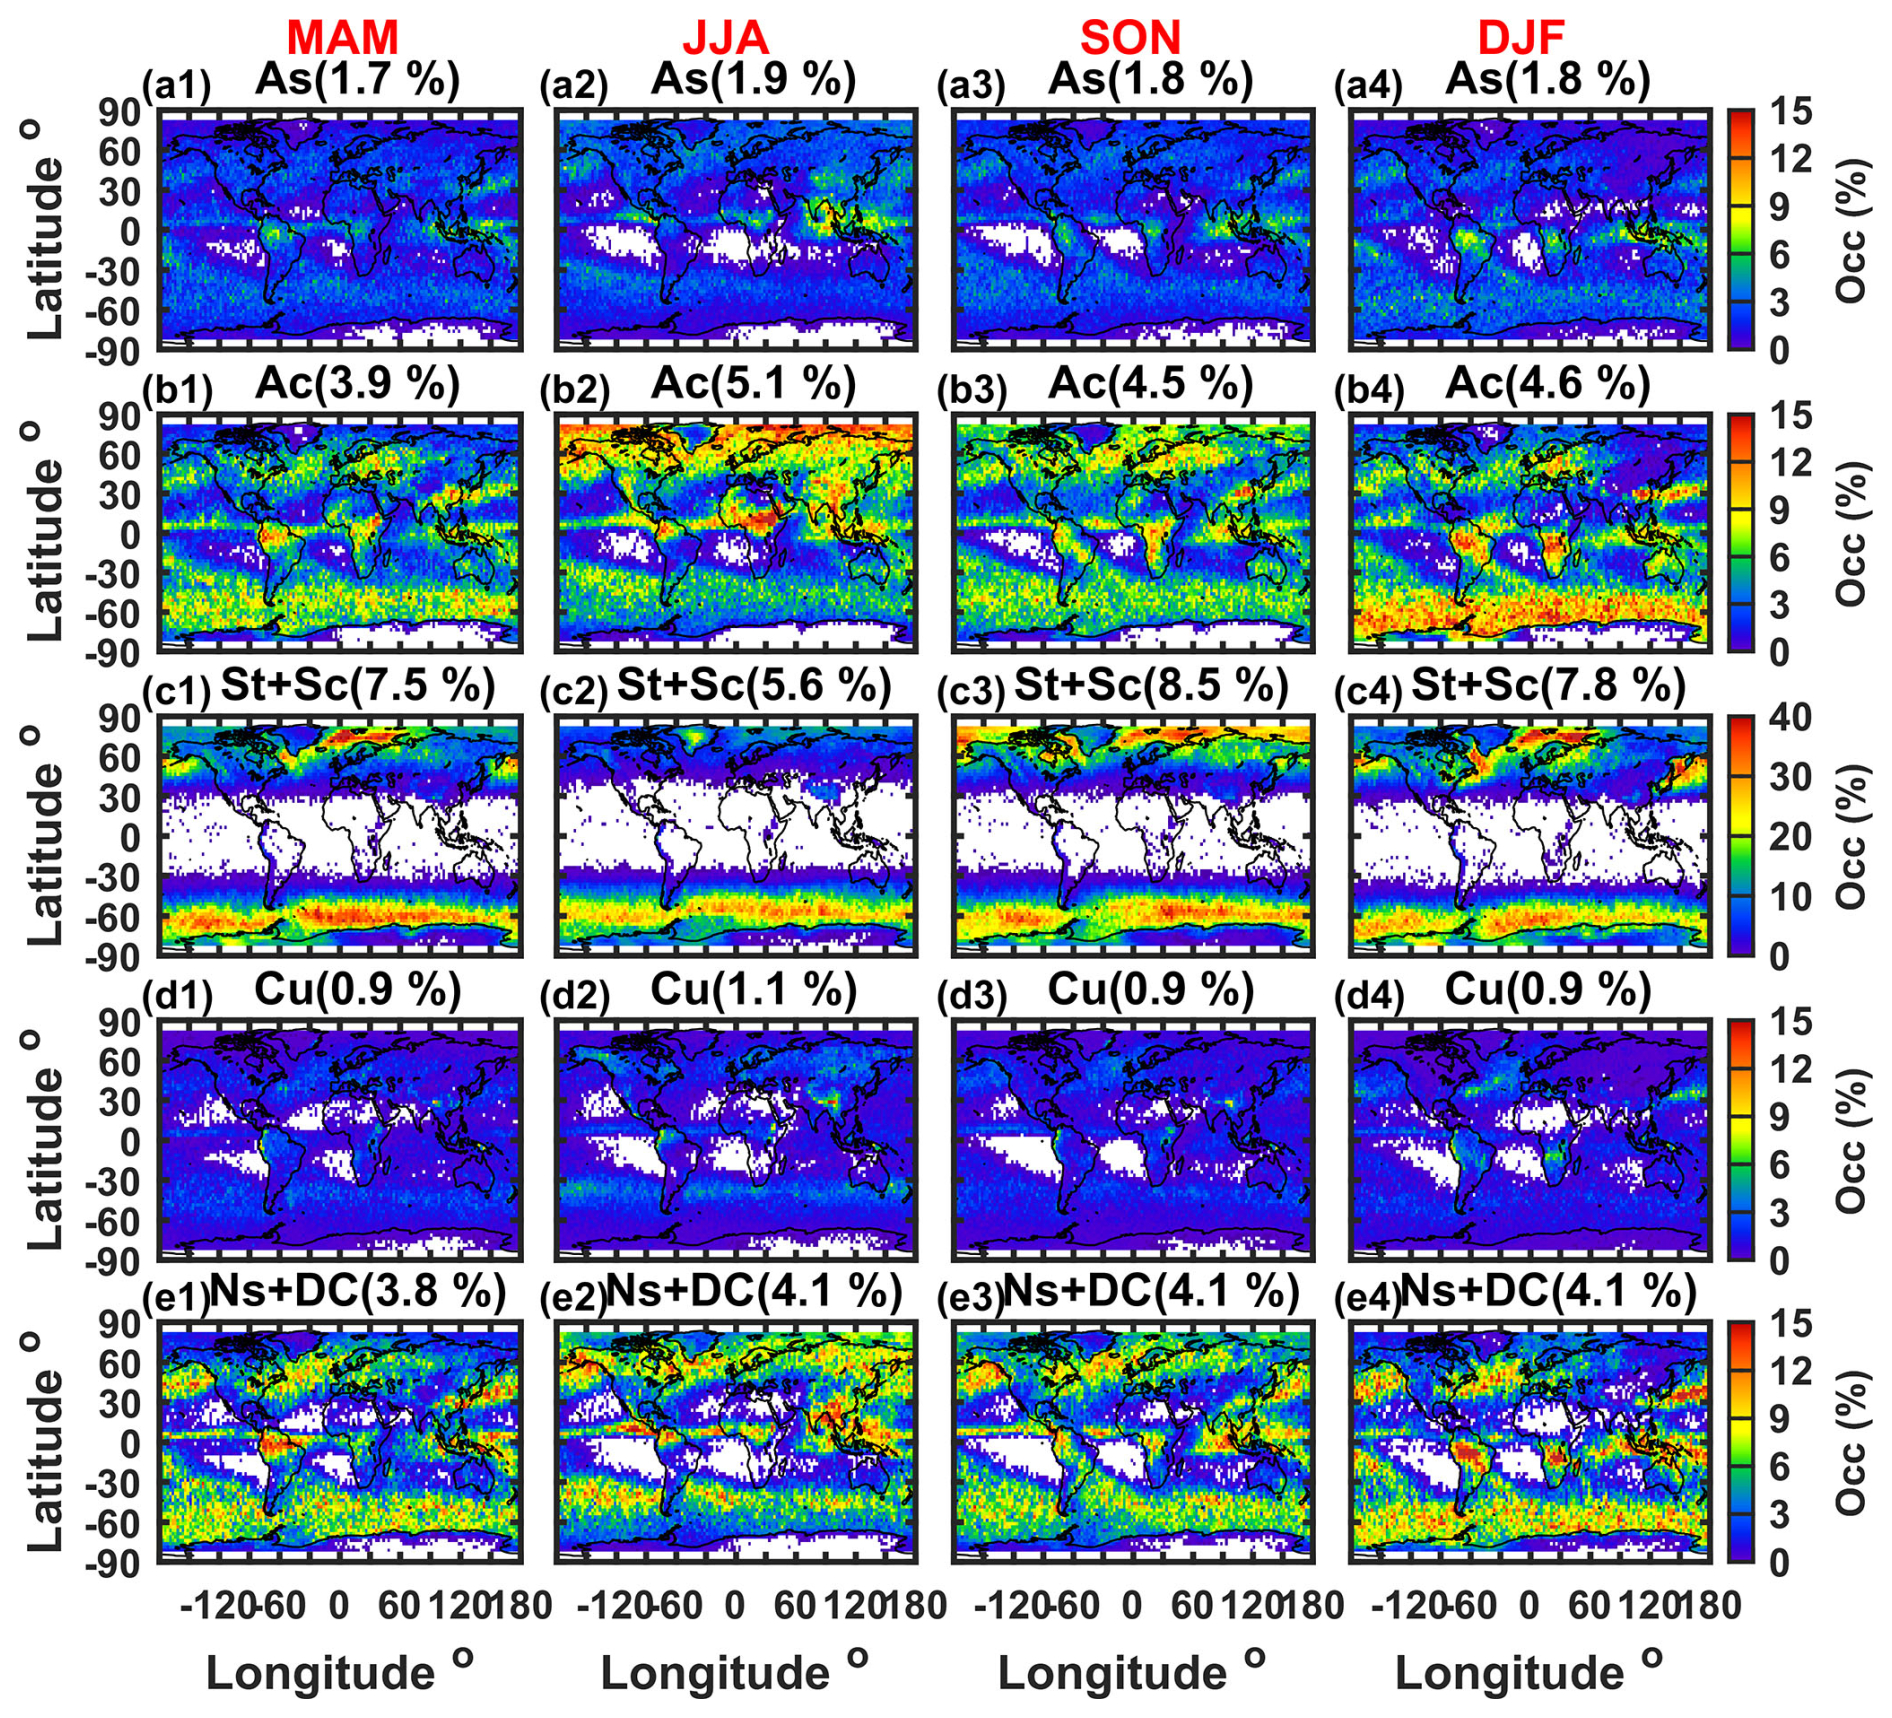
Figure 5Seasonal spatial distributions of mixed-phase cloud occurrence for the five cloud types. Rows (a)–(e) correspond to As, Ac, St+Sc, Cu, and Ns+DC, respectively. Columns (1)–(4) represent March–April–May (MAM), June–July–August (JJA), September–October–November (SON), and December–January–February (DJF), respectively. All subplots are at 2.5°×2.5° resolution. The numbers above each subplot are the global mean values. Grid points with occurrences smaller than 0.01 % are masked.
For As and Ac (Fig. 5 rows a and b), mixed-phase occurrence in the NH mid-to-high latitudes is generally enhanced during June–July–August (JJA), with widespread increases over both land and ocean, particularly for Ac. Mixed-phase Ac occurrence commonly reaches about 7 %–10 % across broad NH regions in summer, with local maxima approaching 12 % over parts of the Arctic Ocean and northern Eurasia, whereas As is generally lower, commonly around 2 %–4 %. This broad summer enhancement is consistent with greater mid-tropospheric moisture and stronger warm-season midlevel cloudiness in the NH (Tselioudis and Grise, 2020; Huang et al., 2015; Shaw et al., 2016). In the SH midlatitudes, mixed-phase Ac is enhanced primarily during December–January–February (DJF), while As shows a weaker seasonal contrast in magnitude. In the tropics, both As and Ac shift meridionally with the seasonal migration of convective activity, but Ac remains much more widespread than As.
St+Sc (Fig. 5 row c) exhibits a distinct seasonal behavior compared with other cloud types, with mixed-phase occurrence strongly concentrated over mid-to-high latitude oceans. Over the Southern Ocean, mixed-phase St+Sc are persistent throughout the year, commonly reaching about 20 %–30 % in all seasons, with local values approaching 40 % in March–April–May (MAM) and September–October–November (SON). The overall spatial pattern remains broadly similar year-round, but occurrence is generally reduced south of about 60° S in JJA as sea ice expands and solar radiation decreases. In the NH high latitudes, mixed-phase St+Sc show a stronger seasonal contrast: occurrence is weakest in JJA, but increases markedly in SON over the Arctic Ocean, adjacent coastal regions, and parts of northern Eurasia, where values commonly reach about 20 %–30 % over ocean and 10 %–20 % over land, with locally higher values over the GIN seas. DJF and MAM show similar spatial patterns, but DJF generally has stronger maxima over subpolar ocean regions, including the North Atlantic and parts of the North Pacific. This seasonality is consistent with enhanced surface–atmosphere coupling when cold air overlies relatively warm open water, increasing turbulent heat and moisture fluxes and favoring low-level stratiform mixed-phase clouds. In the Arctic and sub-Arctic, the particularly strong SON enhancement is further favored by reduced sea-ice extent following summer melt, which increases open-water influence as the lower troposphere cools rapidly during autumn (Zhao and Wang, 2010; Mioche et al., 2015; Shupe et al., 2006; Kay et al., 2016).
For mixed-phase Cu (Fig. 5 row d), occurrence in the tropics and subtropics is generally enhanced during local warm seasons, commonly reaching about 1 %–3 % over convectively active regions and locally approaching ∼6 %. In the SH, a belt of enhanced occurrence appears between about 30 and 45° S during JJA, with values generally around 4 %–6 %, likely reflecting increased shallow convection near the northern margin of the austral winter storm track (Eastman and Warren, 2014).
The seasonal variation of mixed-phase Ns+DC (Fig. 5 row e) follows tropical deep-convective regions and midlatitude storm-track precipitation systems. In the tropics, the meridional shifts are closely tied to the seasonal migration of the ITCZ. In the midlatitudes, enhanced occurrence is found poleward of about 50° N during JJA and poleward of about 50° S during DJF, consistent with the seasonal positioning of extratropical precipitation systems. In the NH, although occurrence over much of the subpolar belt weakens in DJF (Fig. 5e4), enhanced mixed-phase Ns+DC remains evident over the western North Pacific between about 30 and 45° N, where occurrence reaches about 12 %–15 %. This regional enhancement likely reflects active wintertime storm-track systems and strong oceanic moisture supply downstream of East Asia, which favor vertically extensive precipitating cloud systems (Field et al., 2014; Tselioudis and Grise, 2020; Shaw et al., 2016). In the SH, the summertime enhancement is broader and more zonally continuous, with occurrence commonly around 8 %–12 % and locally higher along the Southern Ocean storm-track belt (Fig. 5e4).
Overall, Fig. 5 shows that seasonal forcing affects mixed-phase cloud occurrence differently across cloud types: cloud systems associated with deep convection and large-scale ascent (As, Ac, and Ns+DC) shift with convective zones and storm tracks, whereas low-level stratiform clouds (St+Sc) respond more strongly to seasonal changes in surface-atmosphere coupling, open water availability, sea ice extent, and lower-tropospheric stability (Zhao and Wang, 2010; Mioche et al., 2015; Listowski et al., 2019; Cesana et al., 2024). Aerosol abundance and type may also modulate these cloud-type-dependent patterns through their roles as CCN and INPs, affecting droplet activation, ice nucleation, phase partitioning, and cloud persistence (Tan et al., 2014; Stauffer et al., 2025). Because aerosol properties are not explicitly analyzed here, their contribution to the observed seasonal patterns cannot be separated from the meteorological influences considered above.
Figure 6 shows the zonal-mean distributions of mixed-phase cloud occurrence as a function of cloud top temperature for each cloud type, together with their seasonal anomalies relative to the annual mean. The occurrence is defined as in Fig. 4, but is shown here for each 2.5° latitude bin rather than for broad latitude bands. Column 1 shows the annual-mean distribution, while columns 2–5 show seasonal anomalies. Compared with Fig. 4, this figure reveals the continuous latitudinal structure of the temperature-dependent occurrence and shows that seasonal variability occurs through both latitudinal shifts in occurrence and changes in the cloud top temperature range over which occurrence is enhanced or reduced.
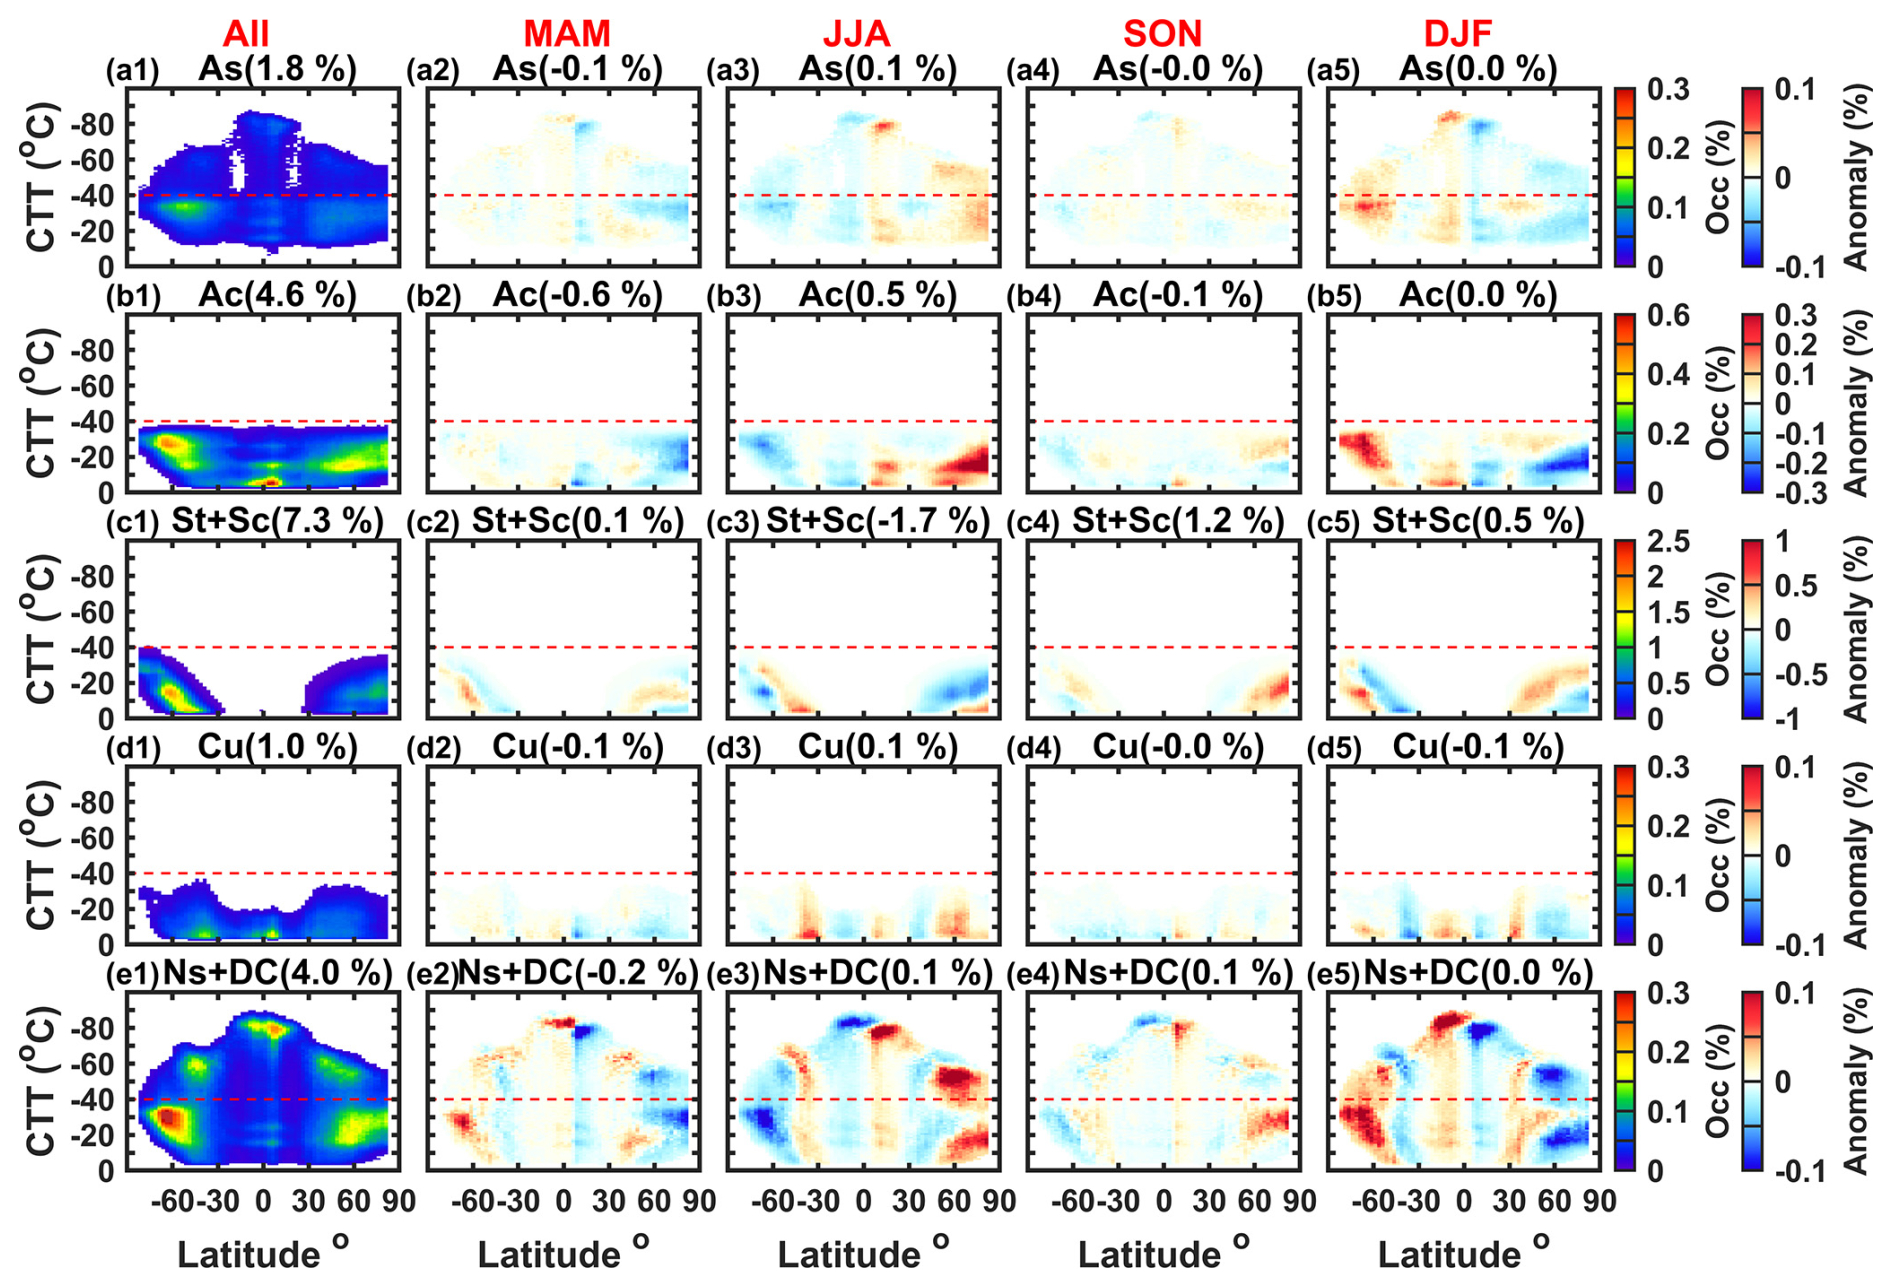
Figure 6Zonal-mean distributions of mixed-phase cloud occurrence as a function of cloud top temperature (CTT) for the five cloud types. Rows (a)–(e) correspond to As, Ac, St+Sc, Cu, and Ns+DC, respectively. Column (1) shows the annual-mean occurrence, while columns (2)–(5) show seasonal anomalies relative to the annual mean for MAM, JJA, SON, and DJF, respectively. The x axis shows latitude at 2.5° resolution, and the y axis shows cloud top temperature at 1 °C resolution. The horizontal red dashed lines mark the −40 °C level. The numbers above each subplot indicate the global-mean occurrence in column (1) and the global-mean anomaly in columns (2)–(5). Grid points with occurrences smaller than 0.01 % are masked in column (1).
For As, Ac, and Ns+DC, the annual-mean patterns (Fig. 6a1, b1, and e1) all exhibit tropical and mid-to-high latitude occurrence bands, but they differ in their preferred cloud top temperature ranges and occurrence magnitude. Ns+DC (Fig. 6e1) spans the broadest cloud-top temperature range, extending from relatively warm temperatures to very cold cloud tops near −80 °C in the tropics. There, Ns+DC exhibits a strong maximum near about −75 to −80 °C with occurrence approaching ∼0.25 %, together with weaker maxima near about −15 and −25 °C. Outside the tropics, its occurrence is concentrated mainly in two temperature ranges: colder than about −40 °C and, more strongly, between about −35 and −15 °C, with the SH mid-to-high latitude maximum near about −30 °C reaching ∼0.3 %. Ac (Fig. 6b1) is also organized into tropical and extratropical latitude bands, but its occurrence is concentrated mainly at cloud top temperatures warmer than −40 °C, with a tropical maximum near about −5 °C reaching ∼0.5 %–0.6 % and broader mid-to-high latitude occurrence largely between about −35 and −5 °C. Compared with Ac, As (Fig. 6a1) is weaker overall and shifted toward colder cloud top temperatures, with its strongest occurrence generally centered near about −30 to −35 °C, especially in the SH mid-to-high latitudes, where values reach about ∼0.1 %–0.15 %. Thus, compared with Figs. 4 and 5, the annual-mean panel in Fig. 6 shows how the preferred cloud-top temperature ranges of these cloud types vary continuously with latitude, rather than only within broad regional bands.
The seasonal-anomaly panels show that the dominant seasonal signal for As, Ac, and Ns+DC is a latitudinal displacement of enhanced occurrence toward the summer hemisphere, superimposed on the annual-mean latitude bands. For Ns+DC (Fig. 6e2–e5), this behavior is especially clear: in JJA, positive anomalies appear north of the annual-mean maxima and negative anomalies appear to their south, while the opposite pattern occurs in DJF. This seasonal displacement spans a broad cloud-top temperature range, including temperatures colder than −40 °C. Ac (Fig. 6b2–b5) shows a similar latitudinal displacement, but its strongest anomalies are concentrated mainly between about −30 and −10 °C. In the NH mid-to-high latitudes, Ac exhibits its largest positive anomalies in JJA, with local anomaly magnitudes approaching ∼0.2 %–0.3 %, while DJF anomalies are generally negative over the same latitude band. Mixed-phase As (Fig. 6a2–a5) shows a similar anomaly pattern to Ns+DC, but with smaller magnitude. In the SH, positive DJF anomalies for Ns+DC (Fig. 6e5) are strongest mainly at cloud-top temperatures warmer than about −40 °C, whereas in the NH the JJA anomalies (Fig. 6e3) extend more clearly into colder cloud top temperatures, indicating a hemispheric contrast in the temperature structure of the seasonal redistribution.
For St+Sc, the annual-mean pattern (Fig. 6c1) differs clearly from those of As, Ac, and Ns+DC. Mixed-phase occurrence is confined mainly to relatively warm cloud top temperatures, generally between about −25 and −5 °C, and is concentrated at mid-to-high latitudes. The strongest annual-mean occurrence is found over the Southern Ocean, where values locally exceed ∼1.5 % near 55–65° S at around −15 °C, while the Arctic and sub-Arctic occurrence is weaker overall. The seasonal-anomaly panels (Fig. 6c2–c5) also show larger anomaly magnitudes than for the other cloud types. In the NH, positive anomalies are strongest in SON, especially at latitudes north of 60° N and mainly between about −25 and −5 °C, with local values reaching about ∼0.8 %, whereas JJA shows widespread negative anomalies over much of the same latitude band. This NH contrast is consistent with the autumn enhancement of low-level stratiform mixed-phase clouds discussed in Fig. 5. In the SH, the anomaly pattern is better described as a latitudinal redistribution: in JJA, negative anomalies dominate poleward of about 60° S, while positive anomalies appear farther north, and DJF shows the opposite sign pattern over much of the same latitude range. This contrast is consistent with a seasonal shift in the latitude of strongest surface–atmosphere coupling over the Southern Ocean, rather than a uniform seasonal strengthening or weakening of mixed-phase St+Sc occurrence (McCoy et al., 2015; Bodas-Salcedo et al., 2016).
For Cu (Fig. 6 row d), the annual-mean occurrence is weak and confined mainly to relatively warm cloud-top temperatures, generally warmer than about −20 °C. Its seasonal anomalies are also weak, but they show a clear latitudinal displacement toward the summer hemisphere, with adjacent positive and negative anomalies broadly resembling the pattern for Ns+DC. Unlike Ns+DC, however, the Cu anomalies are smaller in magnitude and remain restricted to warmer cloud top temperatures.
Corresponding distributions in cloud-top-height coordinates are shown in Appendix A (Fig. A1). These results generally support the cloud-type-dependent vertical structures inferred from Fig. 6 and indicate that some hemispheric differences in cloud top temperature reflect differences in background thermal structure rather than corresponding differences in cloud top height.
Figure 7 shows the annual cycle of mixed-phase cloud occurrence in the 45–75° N latitude band, combining the monthly mean occurrence integrated over all cloud top temperatures (red curves) with the temperature-resolved occurrence distributions (color shading) over open ocean and land. The most pronounced surface contrast occurs for St+Sc (Fig. 7 row c). Over the open ocean, occurrence increases from about 2 %–6 % in summer to about 24 %–25 % in winter, whereas over land it is substantially lower, generally about 3 %–6 % in summer and 8 %–12 % during the other seasons. Over the ocean, the preferred cloud-top temperatures also shift from around −5 °C in summer toward a broader distribution centered between about −10 and −20 °C during the cold season. The much stronger cold-season oceanic occurrence is consistent with an important contribution from marine cold-air outbreaks (MCAOs), during which cold air moving over relatively warm ocean generates strong surface sensible and latent heat fluxes that promote marine boundary-layer cloud formation (Fletcher et al., 2016; Murray-Watson et al., 2023). Over land, the weaker but broader cold-season distribution likely reflects stronger surface stability and generally drier boundary layer conditions (Shupe et al., 2006; Zhao and Wang, 2010; Morrison et al., 2012).
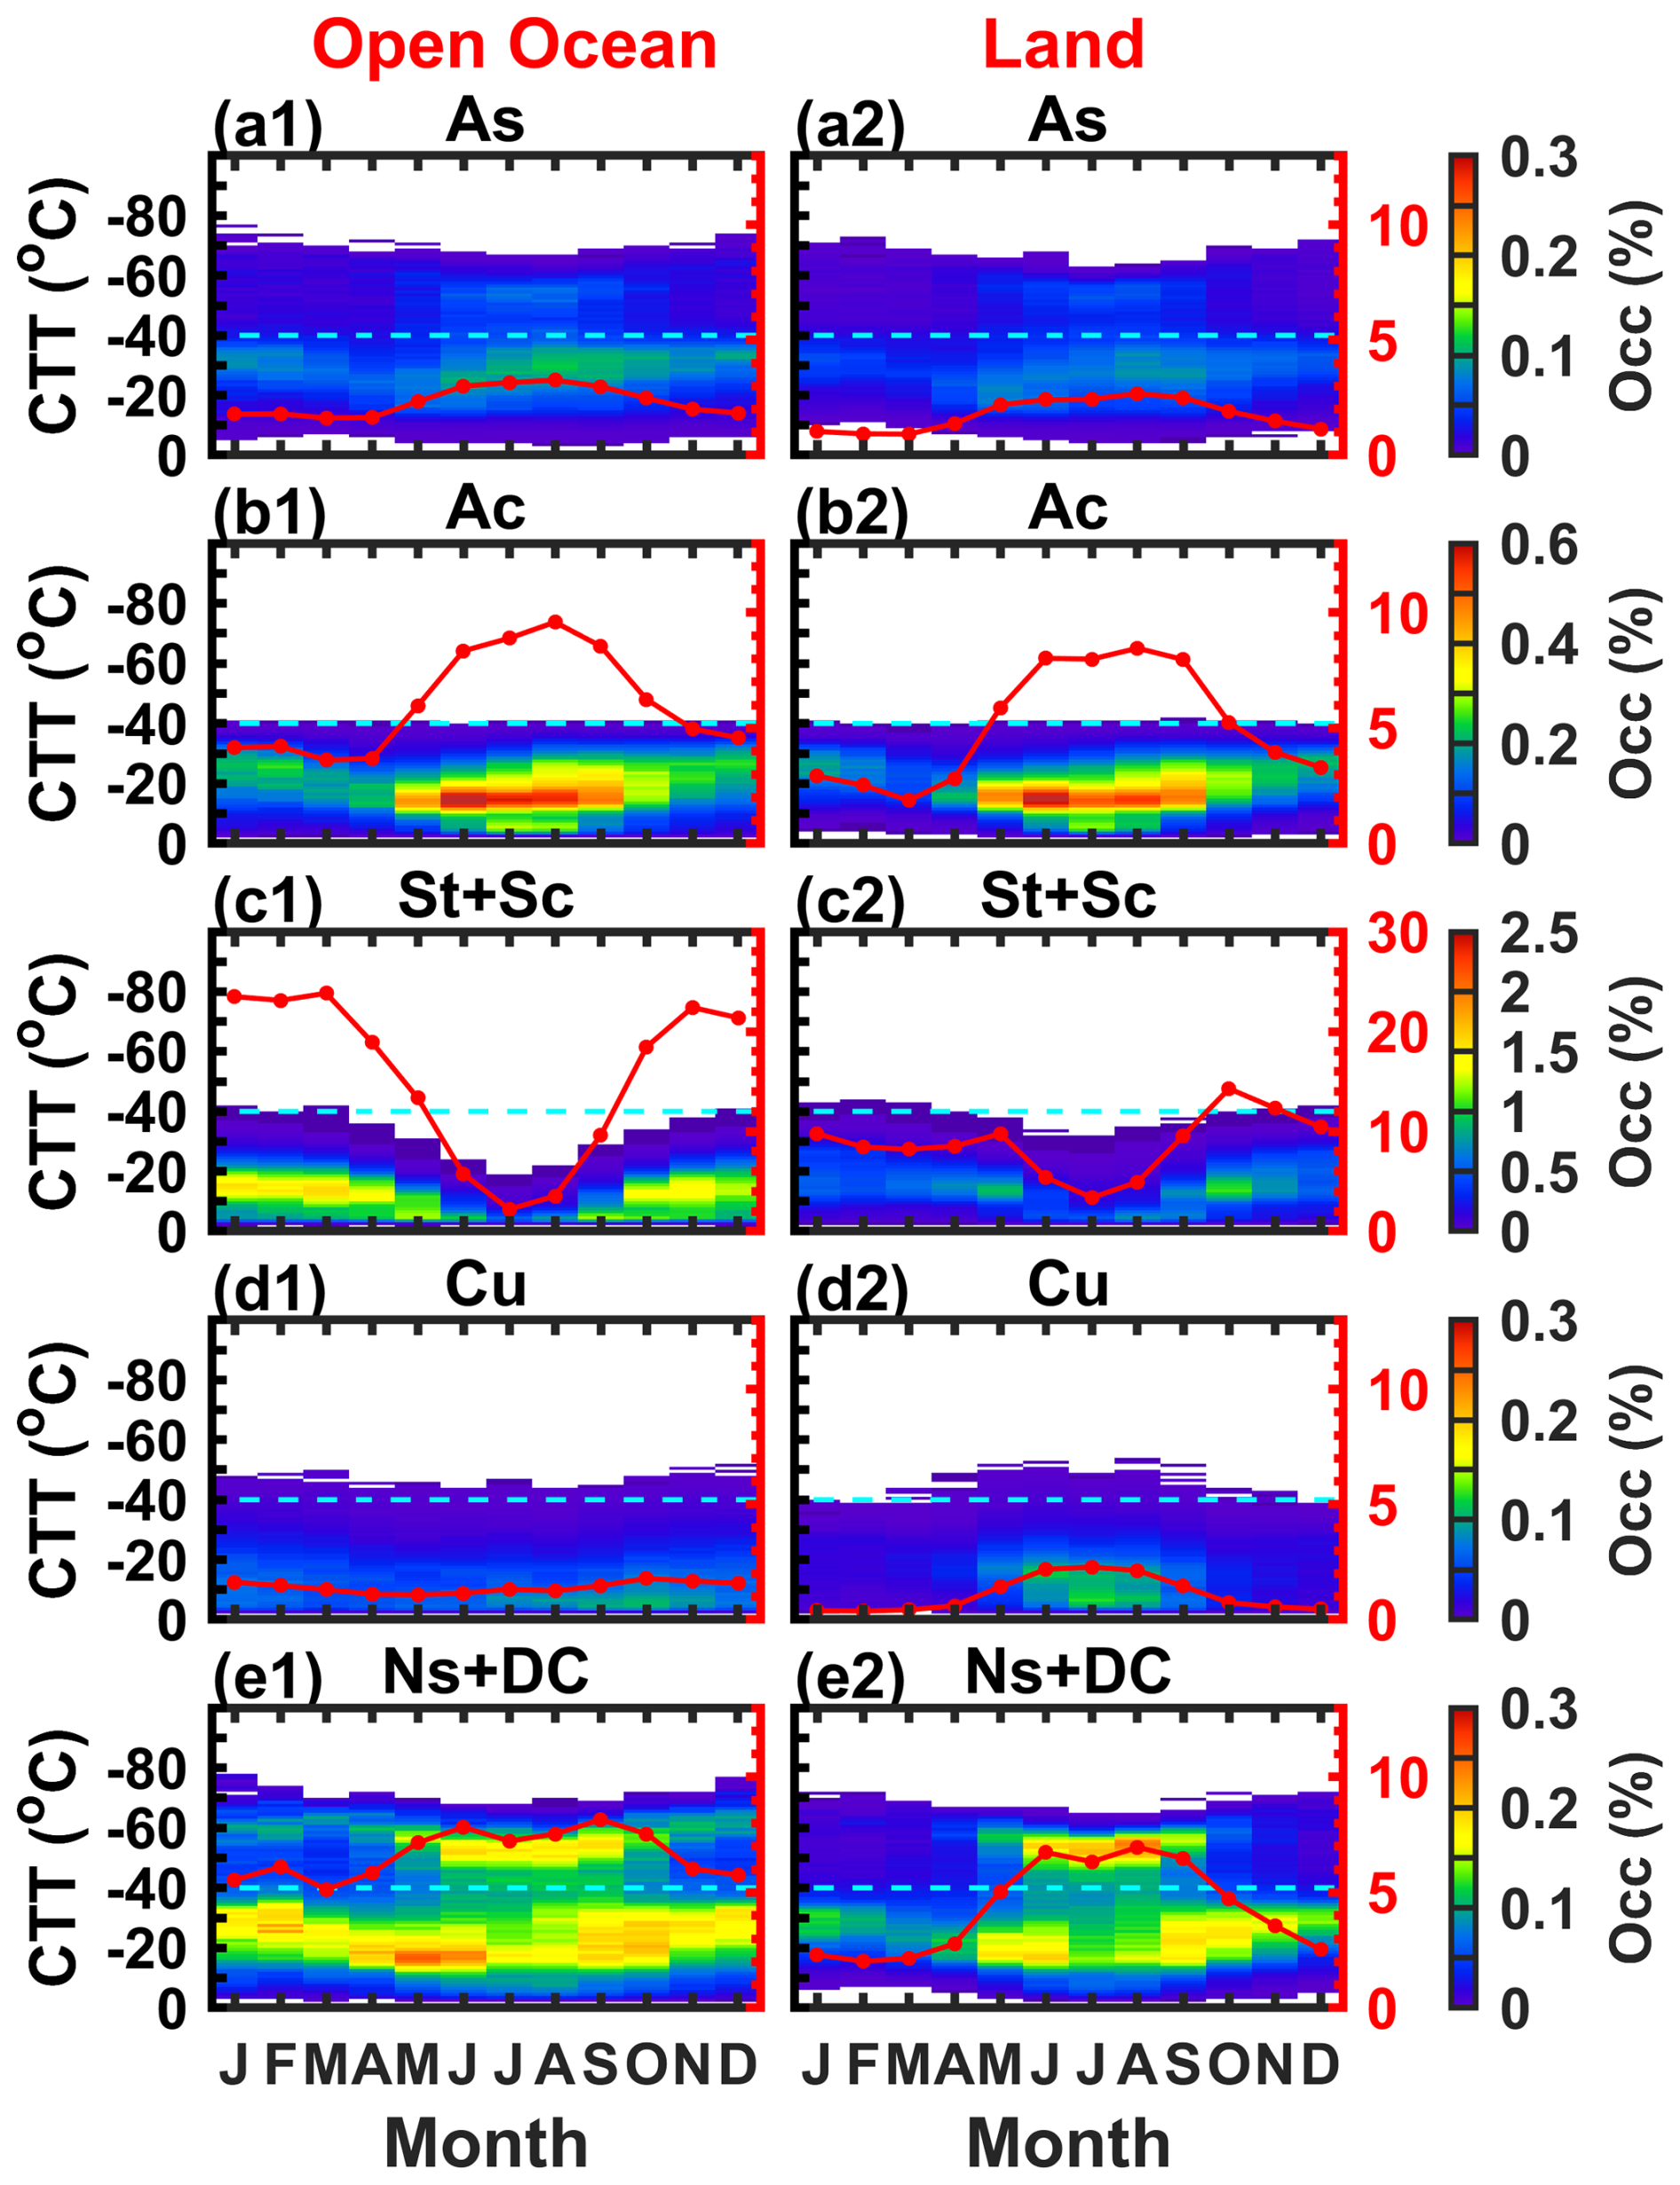
Figure 7Monthly regional mean mixed-phase cloud occurrence as a function of cloud top temperature (CTT) for the five cloud types over 45–75° N. Rows (a)–(e) correspond to As, Ac, St+Sc, Cu, and Ns+DC, respectively. Columns (1) and (2) show results over open ocean and land within this latitude band. The x axis represents the months from January to December, and the left y axis shows cloud top temperature (°C) at 1 °C resolution. Color shading indicates the monthly regional mean occurrence as a function of cloud top temperature, while the red curves referenced to the right y axis show the monthly regional mean mixed-phase cloud occurrence integrated over all cloud top temperatures. The horizontal cyan dashed lines mark the −40 °C level.
As and Ac (Fig. 7 rows a and b) both show warm-season enhancement over land and open ocean, with Ac occurrence substantially larger than As throughout the year. Ac increases from about 4 %–5 % in winter to 8 %–10 % in summer over the ocean and from about 2 %–4 % to 8 %–9 % over land, whereas As increases from about 1 %–2 % to 3 %–4 %. Their land–ocean contrasts are considerably weaker than for St+Sc, consistent with these mid-level clouds being more strongly influenced by mid-tropospheric moisture and synoptic-scale cloud systems than by local surface forcing (Field et al., 2014; Tselioudis and Grise, 2020). Cu occurrence is small overall but shows a stronger warm-season enhancement over land, increasing from less than 0.5 % in winter to about 2.5 % in summer, while remaining around 1 %–2 % over the open ocean.
Ns+DC (Fig. 7 row e) exhibits a different seasonal contrast. Over land, occurrence increases from about 2 %–3 % in winter to about 6 %–7 % in summer, whereas over the open ocean it remains higher and varies more gradually through the year, generally around 5 %–8 %. The temperature-resolved distributions show that oceanic occurrence generally dominates for cloud tops warmer than −40 °C, while land occurrence becomes larger for cloud tops colder than −40 °C during summer. Together with the latitudinal variations shown in Fig. 6, these results indicate that the seasonal cycle of Ns+DC reflects both changes in occurrence and seasonal redistribution of deep cloud systems.
Similar to Fig. 7, Fig. 8 shows the annual cycle of mixed-phase cloud occurrence, but here for the 45–75° S latitude band over open ocean and sea ice.
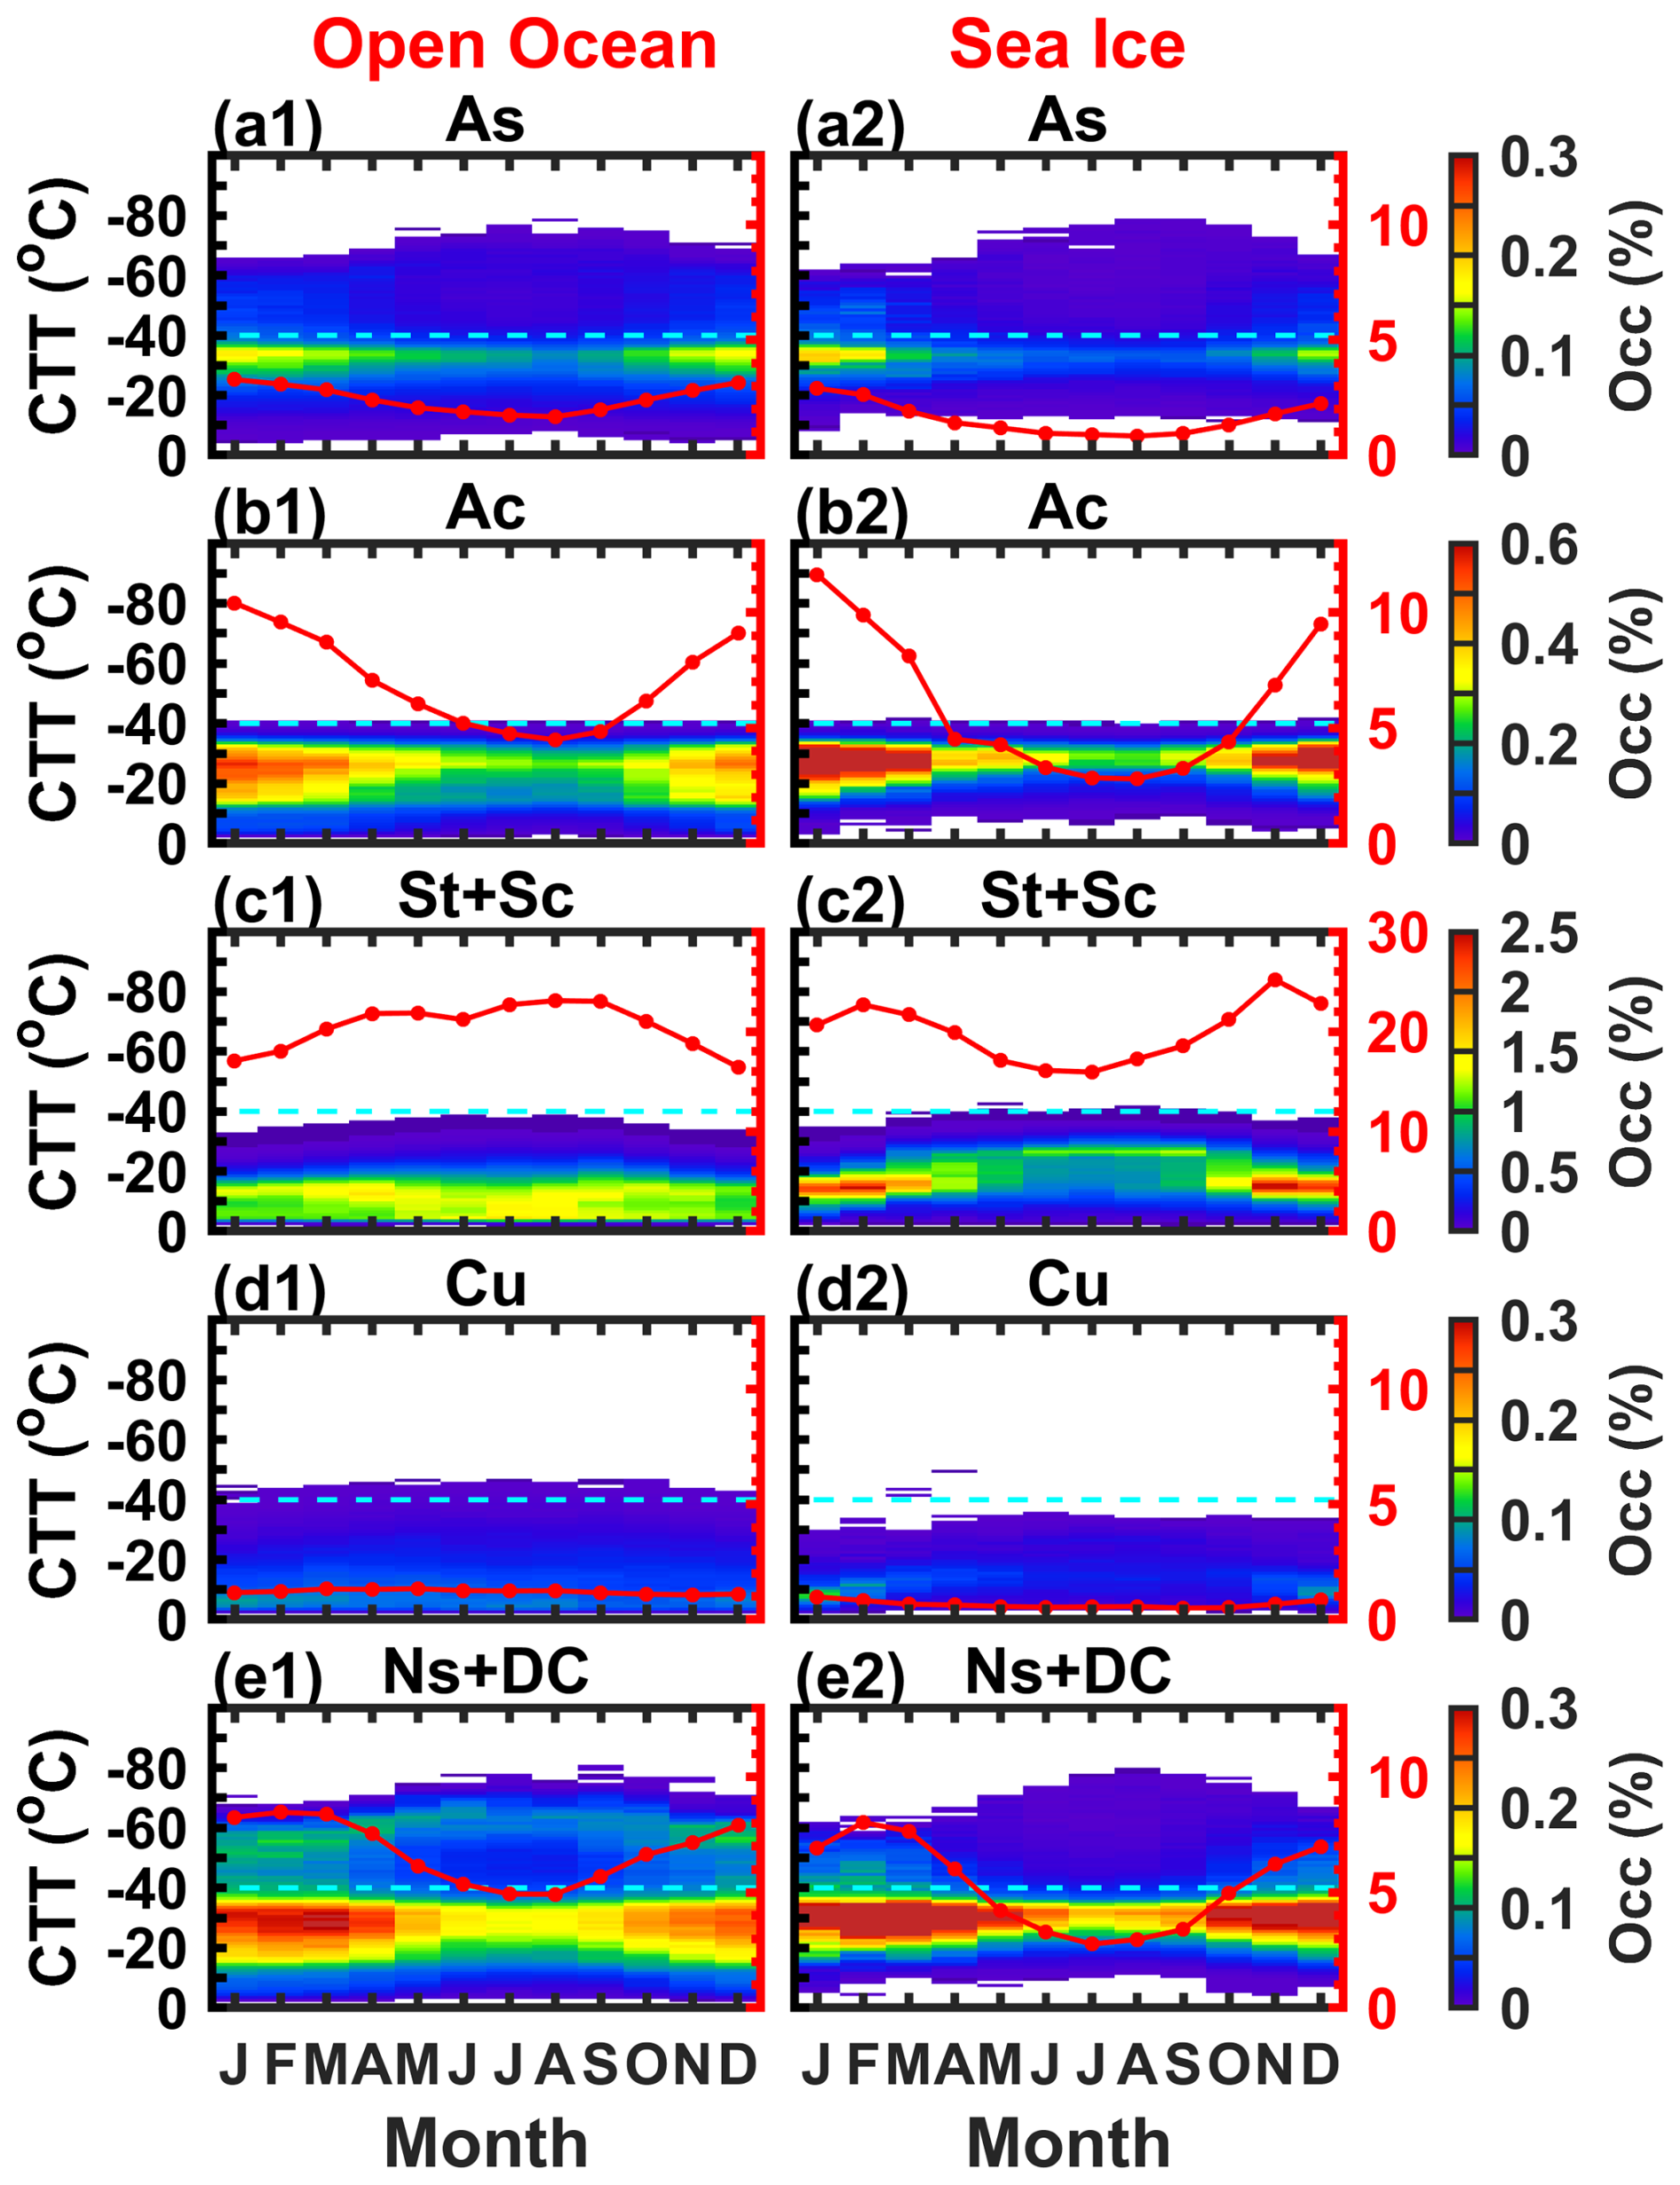
Figure 8Same as Fig. 7, but for 45–75° S latitude band; columns (1) and (2) show results over open ocean and sea ice, respectively.
St+Sc (Fig. 8 row c) accounts for the largest mixed-phase occurrence over both open ocean and sea ice, but its annual cycle differs clearly between the two surfaces. Over the open ocean (Fig. 8c1), the monthly mean mixed-phase St+Sc occurrence integrated over all cloud-top temperatures remains relatively high in all months, with values around 22 %–23 % from April to October and lower values of about 16 %–18 % during austral summer. In contrast, over sea ice (Fig. 8c2), the integrated occurrence shows a somewhat stronger annual cycle, peaking at around 26 % in November and decreasing to about 16 %–18 % during austral winter. The temperature-resolved occurrence also differs between the two surfaces. Over open ocean (Fig. 8c1), occurrence is concentrated mainly between about −20 and 0 °C throughout the year, with a JJA enhancement between about −10 and 0 °C and a modest extension toward temperatures colder than −20 °C. Over sea ice (Fig. 8c2), austral summer occurrence is more narrowly concentrated between about −20 and −10 °C, whereas from about April to October it broadens substantially and extends to colder cloud top temperatures, down to roughly −30 °C. Therefore, Fig. 8 shows that open ocean supports persistently high St+Sc occurrence year-round, while over sea ice the annual cycle is expressed through both a summer narrowing and a cold-season broadening of the cloud-top temperature distribution, together with a moderate reduction in total occurrence during the colder months. This contrast is consistent with the more continuous surface heat and moisture supply over open ocean, which helps maintain frequent liquid-topped low-level mixed-phase clouds. Over sea ice, reduced turbulent fluxes due to high albedo and insulation cause lower occurrence and colder cloud tops in winter, whereas partial summer melting enhances surface fluxes and increases occurrence (Shupe et al., 2006; Mioche et al., 2015; Cesana et al., 2024).
Ac and As (Fig. 8 rows a and b) both show a broad warm-season enhancement over open ocean and sea ice, with Ac much more frequent than As. For Ac (Fig. 8 row b), the monthly mean mixed-phase occurrence integrated over all cloud-top temperatures is generally about 5 %–10 % over open ocean and about 3 %–12 % over sea ice, with both surfaces reaching a clear maximum in January and remaining relatively high from December to March. The occurrence over open ocean is higher in most months, although the contrast becomes small in austral summer and the occurrence over sea ice is comparable to, or slightly higher than, that over open ocean in December–January. The temperature-resolved occurrence over open ocean is concentrated mainly between about −30 and −10 °C, whereas over sea ice it is more tightly confined, especially during JJA, when the strongest occurrence is centered near about −30 to −20 °C. Mixed-phase As (Fig. 8 row a) is much weaker overall, generally around about 1.5 %–3.5 % over open ocean and about 1 %–3 % over sea ice, and is centered at colder cloud top temperatures than Ac, mostly near about −40 to −25 °C, with only weak occurrence extending to temperatures colder than −40 °C. Thus, Fig. 8 shows that, for these mid-level cloud types, the open-ocean versus sea-ice contrast is expressed less through a change in the timing of the seasonal maximum and more through lower occurrence over sea ice, especially in austral winter, together with a colder and more tightly confined cloud top temperature distribution. This contrast is consistent with stronger thermodynamic constraints over sea ice, where a colder, more stable, and drier environment limits the formation and persistence of mid-level mixed-phase clouds, while the warm-season enhancement over both surfaces likely reflects the seasonal strengthening of mid-tropospheric cloudiness associated with baroclinic activity over the Southern Ocean (Listowski et al., 2019; Dietel et al., 2024).
For Ns+DC (Fig. 8 row e), the annual cycle shares some similarities with those of Ac and As (Fig. 8 rows a and b), with lower integrated occurrence in austral winter and higher occurrence in austral summer, but it differs in that cloud tops colder than −40 °C make a clearer contribution, especially over open ocean. Over open ocean (Fig. 8e1), the monthly mean mixed-phase occurrence integrated over all cloud-top temperatures is generally about 5 %–8 %, with somewhat higher values in summer and early autumn. Over sea ice (Fig. 8e2), occurrence shows a stronger annual cycle, with similarly high summer values of about 8 % but lower winter values near about 3 %. For cloud tops warmer than −40 °C, the temperature-resolved distributions over both surfaces show a narrower cold-season distribution, similar to the mid-level cloud types. The key difference is that Ns+DC also includes a colder-than −40 °C component, which is much more prominent over open ocean and notably reduced over sea ice, especially outside the warm season. This open-ocean enhancement of the coldest-top Ns+DC clouds is consistent with greater oceanic heat and moisture supply that supports deeper precipitating systems within the Southern Ocean storm-track environment (Haynes et al., 2011; Bodas-Salcedo et al., 2016). In contrast, mixed-phase Cu (Fig. 8 row d) remains infrequent over both open ocean and sea ice, with occurrence generally around 1 %–1.5 % over open ocean and about 0.5 %–1 % over sea ice. The temperature-resolved occurrence suggests a weak warm-season enhancement at cloud-top temperatures warmer than about −15 °C, but the main surface contrast in this latitude band is the lower occurrence of mixed-phase Cu over sea ice.
Overall, Fig. 8 shows that, within 45–75° S, surface type strongly modulates both the total occurrence and the cloud-top temperature distribution of mixed-phase clouds. The open-ocean versus sea-ice contrast is especially clear for low-level stratiform clouds and for the colder-top portion of Ns+DC, highlighting the strong influence of underlying surface conditions on mixed-phase cloud occurrence over the Southern Ocean. Compared with the NH ocean in Fig. 7, the open Southern Ocean shows higher and less seasonally variable mixed-phase St+Sc occurrence. This is consistent with the more persistent marine boundary-layer cloud regime over the open Southern Ocean, driven by stronger westerlies and storm tracks, lower concentrations of ice-nucleating particles that slow the rate of glaciation, and sustained air-sea heat and moisture fluxes (McCoy et al., 2015; Bodas-Salcedo et al., 2016; Haynes et al., 2011).
Using CloudSat/CALIPSO observations, this study presents a global, cloud-type-dependent climatology of mixed-phase cloud. The global mean occurrence of identified mixed-phase clouds is 18.5 %, with substantial variability across cloud types, regions, and seasons. Low-level stratiform clouds (St+Sc) dominate mixed-phase occurrence at high latitudes, with local occurrence exceeding 40 % over the Southern Ocean and the GIN seas, whereas Ac and Ns+DC contribute most strongly in midlatitude storm-track regions and convectively active tropical regions. Most mixed-phase cloud tops occur at temperatures warmer than −40 °C, but As and especially Ns+DC also show occurrence with cloud tops colder than −40 °C, reflecting vertically deep cloud systems whose tops extend into colder-than −40 °C levels while substantial portions of the cloud remain within the mixed-phase temperature range. At a given cloud-top temperature, the dominant cloud phase differs substantially among cloud types and between regions, indicating that cloud-top temperature alone does not uniquely determine mixed-phase occurrence or phase partitioning.
The seasonal and regional analyses further show that mixed-phase cloud occurrence depends strongly on cloud type and is modulated by both large-scale circulation and underlying surface conditions. In the tropics, mixed-phase occurrence in Ac and Ns+DC shifts with the seasonal migration of the ITCZ. In the midlatitudes, both cloud types are linked to storm-track activity, but Ac extends farther poleward than Ns+DC in the NH and is concentrated mainly at cloud top temperatures warmer than −40 °C, whereas Ns+DC spans a broader cloud-top temperature range that includes a distinct colder-than −40 °C component. Surface-dependent contrasts are also clear. In the NH 45–75° N band, St+Sc shows the strongest land/open ocean contrast: over open ocean, its monthly mean occurrence increases from about 2 %–6 % in summer to about 24 %–25 % in winter, whereas over land it remains much lower, generally about 3 %–6 % in summer and about 8 %–12 % in the other seasons. In the SH 45–75° S band, the open ocean versus sea ice contrast is particularly strong for St+Sc and for the colder-than −40 °C portion of Ns+DC. Over the open Southern Ocean, St+Sc remains relatively high year-round, with values around 22 %–23 % from April to October and about 16 %–18 % in austral summer, whereas over sea ice it shows a somewhat stronger annual cycle, peaking near 26 % in November and decreasing to about 16 %–18 % in austral winter. For Ns+DC, the colder-than −40 °C component is much more prominent over open ocean and is notably reduced over sea ice, especially outside the warm season.
These findings emphasize that mixed-phase cloud climatology cannot be fully characterized without accounting for cloud type. The strong cloud-type dependence likely reflects fundamental differences in dynamics, moisture supply, thermodynamic structure, and the relative roles of key microphysical processes. St+Sc is closely linked to boundary-layer coupling and liquid-topped low-level mixed-phase structure, whereas As and Ac are more closely associated with synoptic-scale ascent and mid-level stratiform cloud structure. Ns+DC represents precipitating cloud systems that are often vertically extensive and span a broad range of cloud top temperatures. In this sense, the present results provide a global observational view not only of cloud-type dependence, but also of mixed-phase clouds associated with different vertical liquid/ice structures.
The results also have implications for model evaluation. Although the representation of cloud phase partitioning has improved from CMIP5 to CMIP6, substantial intermodel spread remains in simulated phase partitioning and its associated radiative effects. The cloud-type-dependent differences identified here provide an additional dimension for model evaluation beyond bulk or temperature-dependent phase statistics. Recent regime-based approaches separate cloud feedback into contributions from changes in cloud properties within individual regimes and changes in the frequency of occurrence of different regimes (Zelinka et al., 2023; Tan et al., 2024). Such an approach could be extended to cloud-type-resolved model analyses to distinguish changes in mixed-phase properties within individual cloud types from changes in their frequency of occurrence. The climatology developed here provides observational benchmarks for the occurrence and properties of these cloud types, which can support evaluation of their representation in climate models (Tan et al., 2016; Korolev et al., 2017; Hofer et al., 2024).
Several limitations should be acknowledged. Cloud phase classification depends on the combined sensitivities of radar, lidar, and temperature information, and thin liquid layers or small ice particles may be missed under some conditions. In addition, CloudSat's sun-synchronous orbit limits sampling to two local times, so the resulting climatology represents conditional rather than full diurnal sampling. Uncertainties in auxiliary datasets may affect some quantitative estimates, but they are unlikely to alter the robust cloud-type-dependent patterns highlighted here.
New and continuing satellite observations provide complementary opportunities to extend and advance this analysis. The NASA MODIS–Visible Infrared Imaging Radiometer Suite (VIIRS) Continuity Cloud Properties products apply a common retrieval framework to Aqua MODIS and Suomi National Polar-orbiting Partnership (SNPP) VIIRS observations, providing continuity for passive cloud properties such as cloud phase, optical thickness, effective radius, and cloud water path (Platnick et al., 2021). These products can help extend the passive cloud-property record relevant to the present analysis. The Earth Cloud, Aerosol and Radiation Explorer (EarthCARE) provides a new generation of active radar-lidar observations following CloudSat/CALIPSO, with a 94 GHz Doppler CPR and a 355 nm high-spectral-resolution Atmospheric Lidar (ATLID) (Illingworth et al., 2015; Wehr et al., 2023). EarthCARE observations therefore provide an opportunity to continue and extend cloud-type-dependent analyses of mixed-phase clouds, although differences in sensor characteristics and retrieval and classification methods need to be considered. In addition, the Doppler capability of the EarthCARE CPR provides information on the vertical motion of cloud and precipitation particles (Kim et al., 2025). Together with other CPR measurements and retrievals, this capability could allow cloud-type-dependent mixed-phase cloud structure to be examined in relation to dynamical and precipitation characteristics.
Overall, the results demonstrate the value of explicitly resolving cloud-type differences in mixed-phase cloud climatology. Future work should extend this framework to cloud phase partitioning, vertical liquid/ice structure, and environmental controls, with the goal of providing improved observational constraints for the representation of mixed-phase clouds in climate models.
Figure A1 shows the zonal-mean mixed-phase cloud occurrence and seasonal anomalies as a function of cloud top height. The annual-mean distributions show clear cloud-type-dependent vertical structures, with St+Sc concentrated primarily below about 3 km, As and Ac at mid-level altitudes, and Ns+DC extending to the highest cloud tops. The height-coordinate view also helps interpret the cloud top temperature differences shown in Fig. 6. For example, although SH mid-to-high-latitude Ac occurs at colder cloud top temperatures than NH Ac, its preferred cloud top heights remain broadly similar, indicating that part of the hemispheric cloud top temperature difference reflects differences in background thermal structure. Seasonal anomalies generally reproduce the latitudinal shifts seen in Fig. 6, while the seasonal redistribution of St+Sc occurs largely within a shallow low-cloud layer.
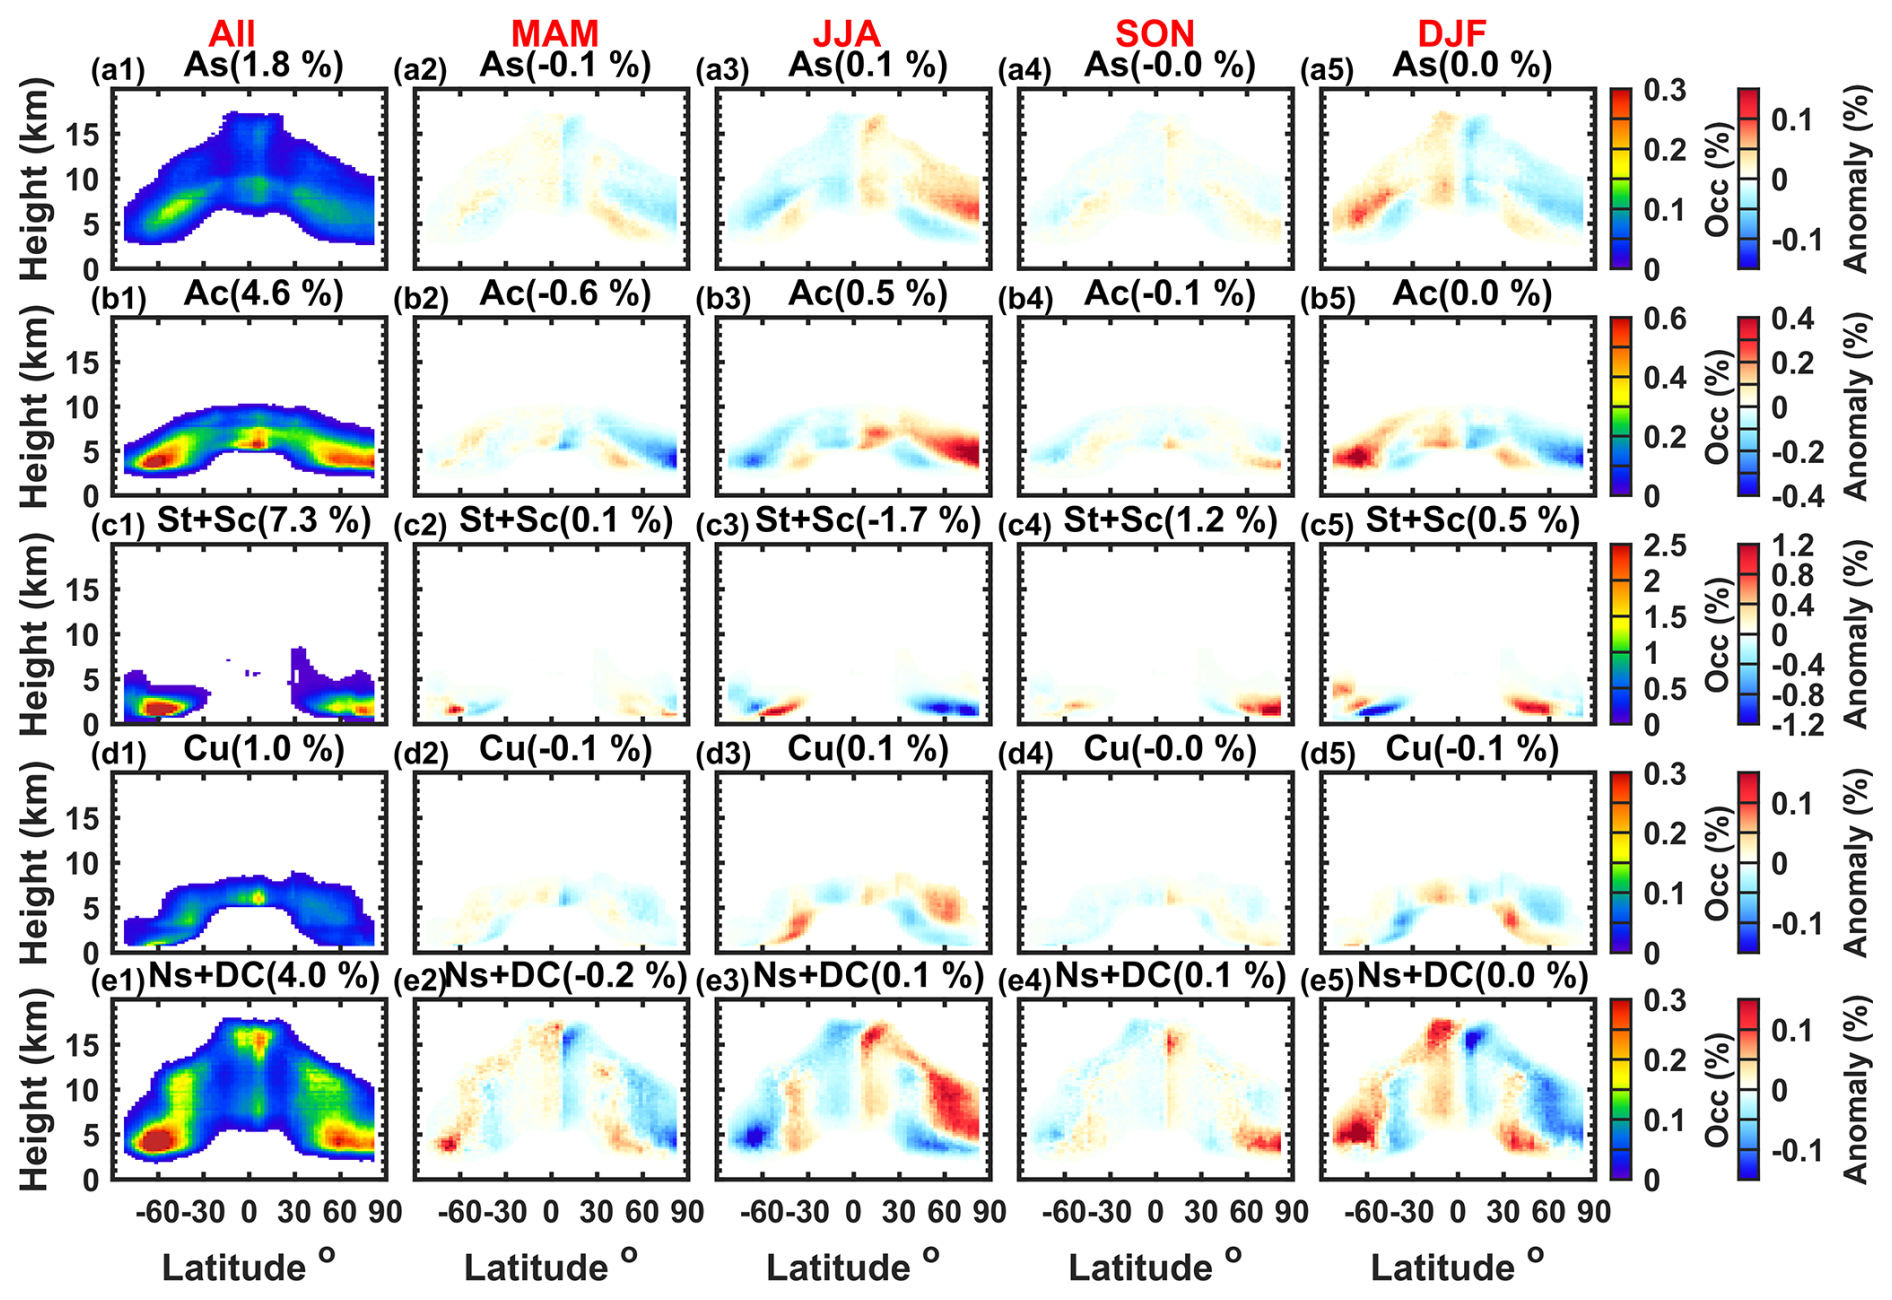
Figure A1Zonal-mean distributions of mixed-phase cloud occurrence as a function of cloud top height above mean sea level for the five cloud types. Rows (a)–(e) correspond to As, Ac, St+Sc, Cu, and Ns+DC, respectively. Column (1) shows the annual-mean occurrence, while columns (2)–(5) show seasonal anomalies relative to the annual mean for MAM, JJA, SON, and DJF, respectively. The x axis shows latitude at 2.5° resolution, and the y axis shows cloud top height at 0.24 km resolution. The numbers above each subplot indicate the global-mean occurrence in column (1) and the global-mean anomaly in columns (2)–(5). Grid points with occurrences smaller than 0.01 % are masked in column (1).
The CloudSat products are available from CloudSat Data Processing Center, https://www.cloudsat.cira.colostate.edu/data-products (last access: 17 September 2026). The MERRA-2 tavg1_2d_ocn_Nx product can be obtained from https://doi.org/10.5067/Y67YQ1L3ZZ4R (Global Modeling and Assimilation Office, 2015).
K.Y. and Z.W. developed the ideas and designed the study. K.Y. performed the analysis and prepared the draft manuscript. Z.W. and M.D. supervised and reviewed the manuscript. All authors made substantial contributions to this work and approved the final version of the manuscript.
The contact author has declared that none of the authors has any competing interests.
Publisher's note: Copernicus Publications remains neutral with regard to jurisdictional claims made in the text, published maps, institutional affiliations, or any other geographical representation in this paper. The authors bear the ultimate responsibility for providing appropriate place names. Views expressed in the text are those of the authors and do not necessarily reflect the views of the publisher.
We thank the CloudSat team, CALIPSO team, MODIS team and MERRA-2 team for providing the data.
This work is supported by NASA grant 80NSSC24K0317, CloudSat product developing contract grant 80NM0018D0004 from NASA/JPL, and NASA The Science of TERRA, AQUA, and SUOMI NPP program grant 80NSSC19K0299.
This paper was edited by Matthias Tesche and reviewed by two anonymous referees.
Bodas-Salcedo, A., Hill, P. G., Furtado, K., Williams, K. D., Field, P. R., Manners, J. C., Hyder, P., Kato, S., and Ringer, M. A.: Large contribution of supercooled liquid clouds to the solar radiation budget of the Southern Ocean, J. Climate, 29, 4213–4231, https://doi.org/10.1175/JCLI-D-15-0564.1, 2016.
Ceccaldi, M., Delanoë, J., Hogan, R. J., Poncet, N., Del Guasta, M., Noël, V., Chepfer, H., Chiriaco, M., and Pelon, J.: From CloudSat–CALIPSO to EarthCare: Evolution of the DARDAR cloud classification and its comparison to airborne radar–lidar observations, J. Geophys. Res.-Atmos., 118, 7962–7981, https://doi.org/10.1002/jgrd.50579, 2013.
Cesana, G., Waliser, D. E., Jiang, X., and Li, J.-L. F.: Multimodel evaluation of cloud phase transition using satellite and reanalysis data, J. Geophys. Res.-Atmos., 120, 7871–7892, https://doi.org/10.1002/2014JD022932, 2015.
Cesana, G., Chepfer, H., Winker, D., Getzewich, B., Cai, X., Jourdan, O., Mioche, G., Okamoto, H., Hagihara, Y., Noel, V., and Reverdy, M.: Using in situ airborne measurements to evaluate three cloud phase products derived from CALIPSO, J. Geophys. Res.-Atmos., 121, 5788–5808, https://doi.org/10.1002/2015JD024334, 2016.
Cesana, G. V., Khadir, T., Chepfer, H., and Chiriaco, M.: Southern Ocean solar reflection biases in CMIP6 models linked to cloud phase and vertical structure representations, Geophys. Res. Lett., 49, e2022GL099777, https://doi.org/10.1029/2022GL099777, 2022.
Cesana, G. V., Pierpaoli, O., Ottaviani, M., Vu, L., Jin, Z., and Silber, I.: The correlation between Arctic sea ice, cloud phase and radiation using A-Train satellites, Atmos. Chem. Phys., 24, 7899–7909, https://doi.org/10.5194/acp-24-7899-2024, 2024.
Cho, N., Tan, J., and Oreopoulos, L.: Classifying planetary cloudiness with an updated set of MODIS cloud regimes, J. Appl. Meteorol. Clim., 60, 981–997, https://doi.org/10.1175/JAMC-D-20-0247.1, 2021.
Comiso, J. C. and Nishio, F.: Trends in the sea ice cover using enhanced and compatible AMSR-E, SSM/I, and SMMR data, J. Geophys. Res., 113, C02S07, https://doi.org/10.1029/2007JC004257, 2008.
Coopman, Q. and Tan, I.: Characterization of the spatial distribution of the thermodynamic phase within mixed-phase clouds using satellite observations, Geophys. Res. Lett., 50, e2023GL104977, https://doi.org/10.1029/2023GL104977, 2023.
Cronk, H. and Partain, P.: CloudSat MOD06-AUX Auxiliary Data Process Description and Interface Control Document, https://www.cloudsat.cira.colostate.edu/cloudsat-static/info/dl/mod06-1km-aux/MOD06-AUX_PDICD.P1_R05.rev0_.pdf (last access: 13 March 2026), 2018.
Delanoë, J. and Hogan, R. J.: Combined CloudSat–CALIPSO–MODIS retrievals of the properties of ice clouds, J. Geophys. Res., 115, D00H29, https://doi.org/10.1029/2009JD012346, 2010.
Deng, M., Mace, G. G., Wang, Z., and Lawson, R. P.: Evaluation of several A-Train ice cloud retrieval products with in situ measurements collected during the SPARTICUS campaign, J. Appl. Meteorol. Clim., 52, 1014–1030, https://doi.org/10.1175/JAMC-D-12-054.1, 2013.
Deng, M., Mace, G. G., Wang, Z., and Berry, E.: CloudSat 2C-ICE product update with a new Ze parameterization in the lidar-only region, J. Geophys. Res.-Atmos., 120, 12198–12208, https://doi.org/10.1002/2015JD023600, 2015.
Dietel, B., Sourdeval, O., and Hoose, C.: Characterisation of low-base and mid-base clouds and their thermodynamic phase over the Southern Ocean and Arctic marine regions, Atmos. Chem. Phys., 24, 7359–7383, https://doi.org/10.5194/acp-24-7359-2024, 2024.
Eastman, R. and Warren, S. G.: Diurnal cycles of cumulus, cumulonimbus, stratus, stratocumulus, and fog from surface observations over land and ocean, J. Climate, 27, 2386–2404, https://doi.org/10.1175/JCLI-D-13-00352.1, 2014.
Field, P. R., Cotton, R. J., McBeath, K., Lock, A. P., Webster, S., and Allan, R. P.: Improving a convection-permitting model simulation of a cold-air outbreak, Q. J. Roy. Meteor. Soc., 140, 124–138, https://doi.org/10.1002/qj.2116, 2014.
Fletcher, J. K., Mason, S., and Jakob, C.: The climatology, meteorology, and boundary layer structure of marine cold air outbreaks in both hemispheres, J. Climate, 29, 1999–2014, https://doi.org/10.1175/JCLI-D-15-0268.1, 2016.
Frey, W. R., Morrison, A. L., Kay, J. E., Guzman, R., and Chepfer, H.: The combined influence of observed Southern Ocean clouds and sea ice on top-of-atmosphere albedo, J. Geophys. Res.-Atmos., 123, 4461–4475, https://doi.org/10.1029/2018JD028505, 2018.
Global Modeling and Assimilation Office (GMAO): MERRA-2 tavg1_2d_ocn_Nx: 2d,1-Hourly,Time-Averaged,Single-Level,Assimilation,Ocean Surface Diagnostics V5.12.4, Greenbelt, MD, USA, Goddard Earth Sciences Data and Information Services Center (GES DISC) [data set], https://doi.org/10.5067/Y67YQ1L3ZZ4R, 2015.
Haynes, J. M., Jakob, C., Rossow, W. B., Tselioudis, G., and Brown, J.: Major characteristics of Southern Ocean cloud regimes and their effects on the energy budget, J. Climate, 24, 5061–5080, https://doi.org/10.1175/2011JCLI4052.1, 2011.
Hofer, S., Hahn, L. C., Shaw, J. K., McGraw, Z. S., Bruno, O., Hellmuth, F., Pietschnig, M., Mostue, I. A., David, R. O., Carlsen, T., and Storelvmo, T.: Realistic representation of mixed-phase clouds increases projected climate warming, Commun. Earth Environ., 5, 390, https://doi.org/10.1038/s43247-024-01524-2, 2024.
Houze, R. A.: Mesoscale convective systems, Rev. Geophys., 42, RG4003, https://doi.org/10.1029/2004RG000150, 2004.
Hu, Y., Winker, D., Vaughan, M., Lin, B., Omar, A., Trepte, C., Flittner, D., Yang, P., Nasiri, S. L., Baum, B., Sun, W., Liu, Z., Wang, Z., Young, S., and Stamnes, K.: CALIPSO/CALIOP cloud phase discrimination algorithm, J. Atmos. Ocean. Tech., 26, 2293–2309, https://doi.org/10.1175/2009JTECHA1280.1, 2009.
Hu, Y., Rodier, S., Xu, K.-M., Sun, W., Huang, J., Lin, B., Zhai, P., and Josset, D.: Occurrence, liquid water content, and fraction of supercooled water clouds from combined CALIOP and CloudSat measurements, J. Geophys. Res., 115, D00H34, https://doi.org/10.1029/2009JD012384, 2010.
Huang, L., Jiang, J. H., Wang, Z., Su, H., Deng, M., and Massie, S.: Climatology of cloud water content associated with different cloud types observed by A-Train satellites, J. Geophys. Res.-Atmos., 120, 4196–4212, https://doi.org/10.1002/2014JD022779, 2015.
Illingworth, A. J., Barker, H. W., Beljaars, A., Ceccaldi, M., Chepfer, H., Clerbaux, N., Cole, J., Delanoë, J., Domenech, C., Donovan, D. P., Fukuda, S., Hirakata, M., Hogan, R. J., Huenerbein, A., Kollias, P., Kubota, T., Nakajima, T., Nakajima, T. Y., Nishizawa, T., Ohno, Y., Okamoto, H., Oki, R., Sato, K., Satoh, M., Shephard, M. W., Velázquez-Blázquez, A., Wandinger, U., Wehr, T., and van Zadelhoff, G.-J.: The EarthCARE satellite: The next step forward in global measurements of clouds, aerosols, precipitation, and radiation, B. Am. Meteorol. Soc., 96, 1311–1332, https://doi.org/10.1175/BAMS-D-12-00227.1, 2015.
Johnson, R. H., Rickenbach, T. M., Rutledge, S. A., Ciesielski, P. E., and Schubert, W. H.: Trimodal characteristics of tropical convection, J. Climate, 12, 2397–2418, https://doi.org/10.1175/1520-0442(1999)012<2397:TCOTC>2.0.CO;2, 1999.
Kay, J. E., L'Ecuyer, T., Chepfer, H., Loeb, N., Morrison, A., and Cesana, G.: Recent advances in Arctic cloud and climate research, Curr. Clim. Change Rep., 2, 159–169, https://doi.org/10.1007/s40641-016-0051-9, 2016.
Khanal, S., Wang, Z., and French, J. R.: Improving middle and high latitude cloud liquid water path measurements from MODIS, Atmos. Res., 243, 105033, https://doi.org/10.1016/j.atmosres.2020.105033, 2020.
Kim, J., Kollias, P., Puigdomènech Treserras, B., Battaglia, A., and Tan, I.: Evaluation of the EarthCARE Cloud Profiling Radar (CPR) Doppler velocity measurements using surface-based observations, Atmos. Chem. Phys., 25, 15389–15402, https://doi.org/10.5194/acp-25-15389-2025, 2025.
King, M. D., Menzel, W. P., Kaufman, Y. J., Tanré, D., Gao, B.-C., Platnick, S., Ackerman, S. A., Remer, L. A., Pincus, R., and Hubanks, P.: Cloud and aerosol properties, precipitable water, and profiles of temperature and humidity from MODIS, IEEE T. Geosci. Remote, 41, 442–458, https://doi.org/10.1109/TGRS.2002.808226, 2003.
Klein, S. A., McCoy, R. B., Morrison, H., Ackerman, A. S., Avramov, A., de Boer, G., Chen, M., Cole, J. N. S., Del Genio, A. D., Falk, M., Foster, M. J., Fridlind, A., Golaz, J.-C., Hashino, T., Harrington, J. Y., Hoose, C., Khairoutdinov, M. F., Larson, V. E., Liu, X., Luo, Y., McFarquhar, G. M., Menon, S., Neggers, R. A. J., Park, S., Poellot, M. R., Schmidt, J. M., Sednev, I., Shipway, B. J., Shupe, M. D., Spangenberg, D. A., Sud, Y. C., Turner, D. D., Veron, D. E., von Salzen, K., Walker, G. K., Wang, Z., Wolf, A. B., Xie, S., Xu, K.-M., Yang, F., and Zhang, G.: Intercomparison of model simulations of mixed-phase clouds observed during the ARM Mixed-Phase Arctic Cloud Experiment. Part I: Single-layer cloud, Q. J. Roy. Meteor. Soc., 135, 979–1002, https://doi.org/10.1002/qj.416, 2009.
Komurcu, M., Storelvmo, T., Tan, I., Lohmann, U., Yun, Y., Penner, J. E., Wang, Y., Liu, X., and Takemura, T.: Intercomparison of the cloud water phase among global climate models, J. Geophys. Res.-Atmos., 119, 3372–3400, https://doi.org/10.1002/2013JD021119, 2014.
Korolev, A. and Field, P. R.: The effect of dynamics on mixed-phase clouds: Theoretical considerations, J. Atmos. Sci., 65, 66–86, https://doi.org/10.1175/2007JAS2355.1, 2008.
Korolev, A. V. and Isaac, G. A.: Phase transformation of mixed-phase clouds, Q. J. Roy. Meteor. Soc., 129, 19–38, https://doi.org/10.1256/qj.01.203, 2003.
Korolev, A., McFarquhar, G. M., Field, P. R., Franklin, C., Lawson, P., Wang, Z., Williams, E., Abel, S. J., Axisa, D., Borrmann, S., Crosier, J., Ervens, B., Fan, J., Flynn, C., Fridlind, A., Gallagher, M., Glienke, S., Khain, A., Laskin, A., Pinsky, M., Schmitt, C., Sullivan, S., and Stratton, R.: Mixed-phase clouds: Progress and challenges, Meteor. Mon., 58, 5.1–5.50, https://doi.org/10.1175/AMSMONOGRAPHS-D-17-0001.1, 2017.
Li, J., Yang, J., Chen, M., Wang, Z., Lu, C., Jing, X., and Yang, K.: Enhanced glaciation of Arctic mixed-phase stratiform clouds by turbulence, J. Geophys. Res.-Atmos., 131, e2025JD045571, https://doi.org/10.1029/2025JD045571, 2026.
Listowski, C., Delanoë, J., Kirchgaessner, A., Lachlan-Cope, T., and King, J.: Antarctic clouds, supercooled liquid water and mixed phase, investigated with DARDAR: geographical and seasonal variations, Atmos. Chem. Phys., 19, 6771–6808, https://doi.org/10.5194/acp-19-6771-2019, 2019.
Lohmann, U.: A glaciation indirect aerosol effect caused by soot aerosols, Geophys. Res. Lett., 29, 1052, https://doi.org/10.1029/2001GL014357, 2002.
Mace, G. G. and Zhang, Q.: The CloudSat radar–lidar geometrical profile product (RL-GeoProf): Updates, improvements, and selected results, J. Geophys. Res.-Atmos., 119, 9441–9462, https://doi.org/10.1002/2013JD021374, 2014.
Matus, A. V. and L'Ecuyer, T. S.: The role of cloud phase in Earth's radiation budget, J. Geophys. Res.-Atmos., 122, 2559–2578, https://doi.org/10.1002/2016JD025951, 2017.
McCoy, D. T., Hartmann, D. L., Zelinka, M. D., Ceppi, P., and Grosvenor, D. P.: Mixed-phase cloud physics and Southern Ocean cloud feedback in climate models, J. Geophys. Res.-Atmos., 120, 11953–11971, https://doi.org/10.1002/2015JD023603, 2015.
McCoy, D. T., Tan, I., Hartmann, D. L., Zelinka, M. D., and Storelvmo, T.: On the relationships among cloud cover, mixed-phase partitioning, and planetary albedo in GCMs, J. Adv. Model. Earth Sy., 8, 650–668, https://doi.org/10.1002/2015MS000589, 2016.
McFarquhar, G. M., Ghan, S., Verlinde, J., Korolev, A., Strapp, J. W., Schmid, B., Tomlinson, J. M., Wolde, M., Brooks, S. D., Cziczo, D., Dubey, M. K., Fan, J., Flynn, C., Gultepe, I., Hubbe, J., Gilles, M. K., Laskin, A., Liu, X., Mishchenko, M. I., Norris, J. R., Ovtchinnikov, M., Shupe, M. D., and Turner, D. D.: Indirect and Semi-Direct Aerosol Campaign: The impact of Arctic aerosols on clouds, B. Am. Meteorol. Soc., 92, 183–201, https://doi.org/10.1175/2010BAMS2935.1, 2011.
Mioche, G., Jourdan, O., Ceccaldi, M., and Delanoë, J.: Variability of mixed-phase clouds in the Arctic with a focus on the Svalbard region: a study based on spaceborne active remote sensing, Atmos. Chem. Phys., 15, 2445–2461, https://doi.org/10.5194/acp-15-2445-2015, 2015.
Mioche, G., Jourdan, O., Delanoë, J., Gourbeyre, C., Febvre, G., Dupuy, R., Monier, M., Szczap, F., Schwarzenboeck, A., and Gayet, J.-F.: Vertical distribution of microphysical properties of Arctic springtime low-level mixed-phase clouds over the Greenland and Norwegian seas, Atmos. Chem. Phys., 17, 12845–12869, https://doi.org/10.5194/acp-17-12845-2017, 2017.
Morrison, H., de Boer, G., Feingold, G., Harrington, J. Y., Shupe, M. D., and Sulia, K.: Resilience of persistent Arctic mixed-phase clouds, Nat. Geosci., 5, 11–17, https://doi.org/10.1038/ngeo1332, 2012.
Mülmenstädt, J., Sourdeval, O., Delanoë, J., and Quaas, J.: Frequency of occurrence of rain from liquid-, mixed-, and ice-phase clouds derived from A-Train satellite observations, Geophys. Res. Lett., 42, 6502–6509, https://doi.org/10.1002/2015GL064604, 2015.
Murray-Watson, R. J., Gryspeerdt, E., and Goren, T.: Investigating the development of clouds within marine cold-air outbreaks, Atmos. Chem. Phys., 23, 9365–9383, https://doi.org/10.5194/acp-23-9365-2023, 2023.
Oreopoulos, L., Cho, N., Lee, D., Kato, S., and Huffman, G. J.: An examination of the nature of global MODIS cloud regimes, J. Geophys. Res.-Atmos., 119, 8362–8383, https://doi.org/10.1002/2013JD021409, 2014.
Parkinson, C. L., Cavalieri, D. J., Gloersen, P., Zwally, H. J., and Comiso, J. C.: Arctic sea ice extents, areas, and trends, 1978–1996, J. Geophys. Res., 104, 20837–20856, https://doi.org/10.1029/1999JC900082, 1999.
Partain, P.: CloudSat ECMWF-AUX auxiliary data product process description and interface control document, https://www.cloudsat.cira.colostate.edu/cloudsat-static/info/dl/ecmwf-aux/ECMWF-AUX.PDICD.P1_R05.rev0.pdf (last access: 27 April 2026), 2022.
Platnick, S., King, M. D., Ackerman, S. A., Menzel, W. P., Baum, B. A., Riédi, J. C., and Frey, R. A.: The MODIS cloud products: Algorithms and examples from Terra, IEEE T. Geosci. Remote, 41, 459–473, https://doi.org/10.1109/TGRS.2002.808301, 2003.
Platnick, S., Meyer, K., King, M. D., Wind, G., Amarasinghe, N., Marchant, B., Arnold, G. T., Zhang, Z., Hubanks, P. A., Ridgway, W. L., and Riedi, J.: The MODIS cloud optical and microphysical products: Collection 6 updates and examples from Terra and Aqua, IEEE T. Geosci. Remote, 55, 502–525, https://doi.org/10.1109/TGRS.2016.2610522, 2016.
Platnick, S., Meyer, K., Wind, G., Holz, R. E., Amarasinghe, N., Hubanks, P. A., Marchant, B., Dutcher, S., and Veglio, P.: The NASA MODIS–VIIRS continuity cloud optical properties products, Remote Sens.-Basel, 13, 2, https://doi.org/10.3390/rs13010002, 2021.
Riley, E. M. and Mapes, B. E.: Unexpected peak near −15 °C in CloudSat echo top climatology, Geophys. Res. Lett., 36, L09819, https://doi.org/10.1029/2009GL037558, 2009.
Sassen, K. and Wang, Z.: Classifying clouds around the globe with the CloudSat radar: 1-year of results, Geophys. Res. Lett., 35, L04805, https://doi.org/10.1029/2007GL032591, 2008.
Shaw, T. A., Baldwin, M., Barnes, E. A., Caballero, R., Garfinkel, C. I., Hwang, Y.-T., McGraw, M. C., Pauluis, O., Riviere, G., Simpson, I. R., and Voigt, A.: Storm track processes and the opposing influences of climate change, Nat. Geosci., 9, 656–664, https://doi.org/10.1038/ngeo2783, 2016.
Shupe, M. D., Uttal, T., Matrosov, S. Y., and Frisch, A. S.: Cloud water contents and hydrometeor sizes during the FIRE Arctic Clouds Experiment, J. Geophys. Res., 111, D22203, https://doi.org/10.1029/2005JD006916, 2006.
Stauffer, C. L., Tan, I., and Matrosov, S. Y.: Aerosol and meteorological influences on mixed-phase stratiform clouds at North Slope of Alaska, Geophys. Res. Lett., 52, e2025GL114815, https://doi.org/10.1029/2025GL114815, 2025.
Stephens, G. L., Vane, D. G., Boain, R. J., Mace, G. G., Sassen, K., Wang, Z., Illingworth, A. J., O'Connor, E. J., Rossow, W. B., Durden, S. L., Miller, S. D., Austin, R. T., Benedetti, A., and Mitrescu, C.: The CloudSat mission and the A-Train: A new dimension of space-based observations of clouds and precipitation, B. Am. Meteorol. Soc., 83, 1771–1790, https://doi.org/10.1175/BAMS-83-12-1771, 2002.
Stephens, G. L., Vane, D. G., Tanelli, S., Im, E., Durden, S., Rokey, M., Reinke, D., Partain, P., Mace, G., Austin, R., L'Ecuyer, T., Haynes, J., Lebsock, M., Suzuki, K., Waliser, D., and Wu, D.: CloudSat mission: Performance and early science after the first year of operation, J. Geophys. Res., 113, D00A18, https://doi.org/10.1029/2008JD009982, 2008.
Storelvmo, T.: Aerosol effects on climate via mixed-phase and ice clouds, Annu. Rev. Earth Pl. Sc., 45, 199–222, https://doi.org/10.1146/annurev-earth-060115-012240, 2017.
Tan, I., Storelvmo, T., and Choi, Y.-S.: Spaceborne lidar observations of the ice-nucleating potential of dust, polluted dust, and smoke aerosols in mixed-phase clouds, J. Geophys. Res.-Atmos., 119, 6653–6665, https://doi.org/10.1002/2013JD021333, 2014.
Tan, I., Storelvmo, T., and Zelinka, M. D.: Observational constraints on mixed-phase clouds imply higher climate sensitivity, Science, 352, 224–227, https://doi.org/10.1126/science.aad5300, 2016.
Tan, I., Sotiropoulou, G., Taylor, P. C., Zamora, L. M., and Wendisch, M.: A review of the factors influencing Arctic mixed-phase clouds: Progress and outlook, in: Clouds and their Climatic Impacts: Radiation, Circulation, and Precipitation, edited by: Vavrus, S. and Kay, J. E., John Wiley & Sons, 103–132, https://doi.org/10.1002/9781119700357.ch5, 2023.
Tan, I., Zelinka, M. D., Coopman, Q., Kahn, B. H., Oreopoulos, L., Tselioudis, G., McCoy, D. T., and Li, N.: Contributions from cloud morphological changes to the interannual shortwave cloud feedback based on MODIS and ISCCP satellite observations, J. Geophys. Res.-Atmos., 129, e2023JD040540, https://doi.org/10.1029/2023JD040540, 2024.
Tan, I., Zhou, C., Lamy, A., and Stauffer, C. L.: Moderate climate sensitivity due to opposing mixed-phase cloud feedbacks, npj Climate and Atmospheric Science, 8, 64, https://doi.org/10.1038/s41612-025-00948-7, 2025.
Tselioudis, G. and Grise, K.: Midlatitude cloud systems, in: Clouds and Climate: Climate Science's Greatest Challenge, edited by: Siebesma, A. P., Bony, S., Jakob, C., and Stevens, B., Cambridge University Press, Cambridge, 279–296, https://doi.org/10.1017/9781107447738.010, 2020.
Tselioudis, G., Rossow, W. B., Jakob, C., Remillard, J., Tropf, D., and Zhang, Y.: Evaluation of clouds, radiation, and precipitation in CMIP6 models using global weather states derived from ISCCP-H cloud property data, J. Climate, 34, 7311–7324, https://doi.org/10.1175/JCLI-D-21-0076.1, 2021.
Verlinde, J., Harrington, J. Y., McFarquhar, G. M., Yannuzzi, V. T., Avramov, A., Greenberg, S., Johnson, N., Zhang, G., Poellot, M. R., Mather, J. H., Turner, D. D., and Eloranta, E. W.: The Mixed-Phase Arctic Cloud Experiment (MPACE), B. Am. Meteorol. Soc., 88, 205–221, https://doi.org/10.1175/BAMS-88-2-205, 2007.
Wang, D., Yang, C. A., and Diao, M.: Validation of satellite-based cloud phase distributions using global-scale in situ airborne observations, Earth Space Sci., 11, e2023EA003355, https://doi.org/10.1029/2023EA003355, 2024.
Wang, Q., Zhou, C., Letu, H., Zhu, Y., Zhuge, X., Liu, C., Weng, F., and Wang, M.: Obtaining Cloud Base Height and Phase From Thermal Infrared Radiometry Using a Deep Learning Algorithm, IEEE T. Geosci. Remote, 61, 4105914, https://doi.org/10.1109/TGRS.2023.3317532, 2023.
Wang, T., Fetzer, E. J., Wong, S., Kahn, B. H., and Yue, Q.: Validation of MODIS cloud mask and multilayer flag using CloudSat-CALIPSO cloud profiles and a cross-reference of their cloud classifications, J. Geophys. Res.-Atmos., 121, 11620–11635, https://doi.org/10.1002/2016JD025239, 2016.
Wang, Z.: CloudSat 2B-CLDCLASS-LIDAR product process description and interface control document, https://www.cloudsat.cira.colostate.edu/cloudsat-static/info/dl/2b-cldclass-lidar/2B-CLDCLASS-LIDAR_PDICD.P1_R05.rev0_.pdf (last access: 27 April 2026), 2019.
Wehr, T., Kubota, T., Tzeremes, G., Wallace, K., Nakatsuka, H., Ohno, Y., Koopman, R., Rusli, S., Kikuchi, M., Eisinger, M., Tanaka, T., Taga, M., Deghaye, P., Tomita, E., and Bernaerts, D.: The EarthCARE mission – science and system overview, Atmos. Meas. Tech., 16, 3581–3608, https://doi.org/10.5194/amt-16-3581-2023, 2023.
Winker, D. M., Vaughan, M. A., Omar, A. H., Hu, Y., Powell, K. A., Liu, Z., Hunt, W. H., and Young, S. A.: Overview of the CALIPSO Mission and CALIOP Data Processing Algorithms, J. Atmos. Ocean. Tech., 26, 2310–2323, https://doi.org/10.1175/2009JTECHA1281.1, 2009.
Winker, D. M., Pelon, J., Coakley, J. A., Ackerman, S. A., Charlson, R. J., Colarco, P. R., Flamant, P., Fu, Q., Hoff, R. M., Kittaka, C., Kubar, T. L., Le Treut, H., McCormick, M. P., Mégie, G., Poole, L., Powell, K., Trepte, C., Vaughan, M. A., and Wielicki, B. A.: The CALIPSO mission: A global 3D view of aerosols and clouds, B. Am. Meteorol. Soc., 91, 1211–1229, https://doi.org/10.1175/2010BAMS3009.1, 2010.
Xiong, X., Angal, A., Chang, T., Aldoretta, E., Geng, X., Link, D., Sun, J., Twedt, K., and Wu, A.: Aqua MODIS: 20 years of on-orbit calibration and performance, J. Appl. Remote Sens., 17, 037501, https://doi.org/10.1117/1.JRS.17.037501, 2023.
Yang, J., Lu, J., Deng, Y., Wang, Y., Lu, C., Yin, Y., Wang, Z., Jing, X., and Yang, K.: Parameterizing the heterogeneous liquid–ice mixing in modeling ice growth through the Wegener–Bergeron–Findeisen process in CAM6, Geophys. Res. Lett., 52, e2024GL114036, https://doi.org/10.1029/2024GL114036, 2025a.
Yang, K., Wang, Z., and Deng, M.: Annual cycle of tropical convective clouds from 20-year MODIS observations with an improved convective cloud detection, J. Climate, 38, 6351–6381, https://doi.org/10.1175/JCLI-D-25-0007.1, 2025b.
Zelinka, M. D., Myers, T. A., McCoy, D. T., Po-Chedley, S., Caldwell, P. M., Ceppi, P., Klein, S. A., and Taylor, K. E.: Causes of higher climate sensitivity in CMIP6 models, Geophys. Res. Lett., 47, e2019GL085782, https://doi.org/10.1029/2019GL085782, 2020.
Zelinka, M. D., Tan, I., Oreopoulos, L., and Tselioudis, G.: Detailing cloud property feedbacks with a regime-based decomposition, Clim. Dynam., 60, 2983–3003, https://doi.org/10.1007/s00382-022-06488-7, 2023.
Zhang, D., Wang, Z., and Liu, D.: A global view of midlevel liquid-layer topped stratiform cloud distribution and phase partition from CALIPSO and CloudSat measurements, J. Geophys. Res.-Atmos., 115, D00H13, https://doi.org/10.1029/2009JD012143, 2010.
Zhao, M. and Wang, Z.: Comparison of Arctic clouds between European Center for Medium Range Weather Forecasts simulations and Atmospheric Radiation Measurement Climate Research Facility long-term observations at the North Slope of Alaska Barrow site, J. Geophys. Res., 115, D23202, https://doi.org/10.1029/2010JD014285, 2010.