
the Creative Commons Attribution 4.0 License.
the Creative Commons Attribution 4.0 License.
 | 21 Sep 2026
Improving aerosol–radiation interactions in the operational forecasting system – AIRWISE

Gaurav Govardhan
Sreyashi Debnath
Avinash N. Parde
Sandeep Wagh
Jimy Dudhia
Sachin D. Ghude
Accurate representation of aerosol optical properties remains a key uncertainty in aerosol–radiation interactions (ARIs) in numerical weather prediction models. Operational air pollution forecasting systems use globally prescribed complex refractive indices (RIs) that inadequately represent regional aerosol composition, inducing biases in ARIs and boundary layer evolution. In this study, updated and more realistic RIs of aerosols over Delhi are implemented within the Air Quality Warning and Integrated Decision Support System for Emissions (AIRWISE) to quantify their radiative and meteorological impacts during the October 2023–January 2024 season. Sensitivity experiments with RIs of different aerosol species indicate reduction in downwelling shortwave radiation at the surface (SWDOWN) by up to ∼80 W m−2 (diurnally ∼43 W m−2) during a severe post-monsoon episode. This radiative perturbation decreases surface temperature (∼0.2 °C), near-surface wind speed (∼0.4 m s−1), and boundary layer height (∼200 m), while increasing daytime humidity (3 %–4 %). Comparable sensitivity is observed during an extreme winter episode under stagnant, humid conditions favorable for haze persistence. Seasonally, monthly mean SWDOWN decreases by 25–37 W m−2 relative to the control simulation, accounting for to of the total ARIs in clear sky conditions. Evaluation against surface radiation measurements from Winter Fog Experiment (WiFEX 2023–2024) at Indira Gandhi International Airport, Delhi shows substantial bias reduction in December 2023 (62 %) and January 2024 (35 %). The revised radiative forcing systematically modifies near-surface thermodynamics and increases PM2.5 concentrations, thereby altering pollution–meteorology feedback in highly polluted urban environments.
- Article
(8157 KB) - Full-text XML
-
Supplement
(1366 KB) - BibTeX
- EndNote


Atmospheric aerosols play a crucial role in modulating the Earth's radiation budget (Haywood and Shine, 1995; Kim and Ramanathan, 2008; Armour et al., 2021), influencing the hydrological cycle (rainfall, glacier and snow melt) and shaping regional weather and climate dynamics (Seinfeld and Pandis, 2016; Bellouin et al., 2020). Beyond their impact on weather, aerosols also affect daily life by deteriorating air quality (Tomasi et al., 2016) and reducing visibility during foggy conditions, leading to socioeconomic and health-related consequences (Ghude et al., 2017, 2023). In regions with severe air pollution, such as those affected by post-monsoon stubble burning in India (Govardhan et al., 2023) or the wintertime calmer atmospheric conditions in northern India (Ghude et al., 2023), the aerosol-induced changes in radiation fluxes can substantially modify local meteorological variables and air quality (Sharma et al., 2023; Hodnebrog et al., 2025). These aerosol–radiation–meteorology feedback are also critical for operational air quality forecasting over polluted megacities (Ghude et al., 2024). The operational systems such as the Air Quality Warning and Integrated Decision Support System for Emissions (AIRWISE) demonstrate that deficiencies in aerosol representation and aerosol–radiation coupling can directly limit the prediction of extreme wintertime pollution episodes.
Aerosol–radiation interactions (ARI) are represented in numerical weather prediction (NWP) and climate models through various radiation parameterization schemes. Among the widely used schemes, the Rapid Radiative Transfer Model for Global Models (RRTMG) (Iacono et al., 2008), Community Radiative Transfer Model (CRTM) (Han, 2006), Goddard (Chou and Suarez, 1999), and the Community Atmosphere Model (CAM) (Collins et al., 2004) provide robust frameworks for simulating aerosol-induced modifications in radiation fluxes. Within these models, Mie scattering plays a fundamental role in deriving aerosol optical properties incorporating an assumed size distribution and complex refractive index (RI), which directly influence radiative transfer processes. The shortwave radiation reaching the Earth's surface serves as a primary heating agent for the atmosphere (Lettau and Lettau, 1969). This radiative heating perturbs the near-surface air mass, affecting key meteorological variables such as temperature, wind speed, relative humidity and, thereby influencing atmospheric physical processes such as convection and turbulence (Li et al., 2017; Bender, 2020). The dispersion of pollutants within the planetary boundary layer height (PBLH) is strongly modulated by wind and turbulence (Govardhan et al., 2015).
Examining aerosol–radiation feedback is crucial for improving predictions of extreme pollution events. Aerosols significantly influence radiative forcing (Ramanathan et al., 2001), boundary layer dynamics, and pollutant dispersion (Yu et al., 2002), making their accurate representation in NWP models essential for better air quality forecasts and climate assessments. The role of aerosols in cloud microphysics and radiative interactions has long been recognized (Twomey, 1977), highlighting their impact on climate forcing and regional weather patterns. For instance, a mean bias of 34 W m−2 in downwelling shortwave radiation and a warm bias of 3 °C in surface temperature in the Weather Research and Forecasting model coupled with Chemistry (WRF-Chem) were documented while simulating high-aerosol events over Delhi during the winter season of 2020–2021 by Sengupta et al. (2022). Such biases in shortwave radiation in the NWP models have also been reported over multiple regions globally (Wild, 2008; Ruiz-Arias et al., 2016). The discrepancies in the simulated shortwave radiation directly affect the ARI in the WRF-Chem, thereby introducing uncertainties in the estimation of surface energy balance. Moreover, disturbances in the surface energy budget can lead to unrealistic radiative forcing (Stier et al., 2013), with the magnitude and sign of the forcing depending on whether the bias in radiation is positive or negative. Addressing these uncertainties is essential for improving the fidelity of aerosol-cloud interactions in addition to ARIs in NWP models.
Key aerosol optical properties such as aerosol extinction coefficient, single scattering albedo (SSA), and asymmetry factor (AF), determine the extent of solar radiation absorption and scattering by aerosols, directly affecting local surface radiation fluxes, particularly during daytime when shortwave radiation dominates. These properties are formulated in the model as a function of aerosol mass, size of the particles and wavelength of the electromagnetic radiation (Ghan et al., 2001). In the WRF-Chem model, these properties are parameterized within the chemistry section, with calculations performed across four shortwave radiation bands (centered at 300, 400, 600, and 999 nm) and sixteen longwave radiation bands (Fast et al., 2006; Barnard et al., 2010). The Ångström exponent is derived from the aerosol optical depth (AOD) values at specific wavelengths, such as 400 and 600 nm, then used to calculate the AOD values over the 4 shortwave bands and then subsequently interpolated to other wavelengths within the shortwave spectrum (232 to 3462 nm) of the WRF-Chem (Zhao et al., 2013). Similarly, SSA and AF values are computed and subsequently interpolated for different spectral bands for their inclusion in radiative calculations. The RI values of aerosol particles play a fundamental role in determining their optical properties, influencing both absorption and scattering processes. The scattering and absorption cross-sections of aerosols are primarily dictated by their complex RIs and morphological characteristics, including shape and size (Bond and Bergstrom, 2006).
The RI values of the aerosol species, such as contributing to particulate matter with an aerodynamic diameter ≤2.5 µm (PM2.5), affect the surface radiation fluxes and ARIs. Among mineral dust components, hematite (Fe2O3) is a key absorber (Sokolik and Toon, 1999; Lafon et al., 2006; Koven and Fung, 2006), constituting approximately 6.85 % of the total global mineral dust mass on average (Goudie, 1978), although its abundance varies considerably across source regions. For example, hematite concentrations range from 0 %–4 % in the Thar Desert (Negi et al., 1996, 2002) while exceptionally high values of iron (Fe) mass fraction of 42.82 % have been reported near Kukas Hill, Jaipur (Agnihotri et al., 2015). Such regional variations in dust composition contribute substantially to uncertainties in dust optical properties, radiative forcing, and climate impacts. Recent multi-model assessments have demonstrated large inter-model differences in dust emissions, atmospheric burden, optical depth, and radiative forcing, highlighting mineral dust as one of the largest sources of uncertainty in aerosol-climate interactions (Wu et al., 2020; Haugvaldstad et al., 2025).
Morphological studies using Scanning Electron Microscopy identified mineral dust shapes as spheres, spheroids, chebyshev, and cylinders (Mishra and Tripathi, 2008), with sensitivity experiments showing RI values of dust decreasing with increasing wavelength. Furthermore, balloon-based observations over Delhi (Mishra et al., 2018) revealed enhanced near surface hematite concentrations (∼4 %), indicating stronger absorption characteristics than those represented by default model assumptions. These findings reinforce the need to revise dust RI values in NWP models and atmospheric chemistry models, where they are frequently treated as fixed or globally representative values despite substantial regional variability in dust composition and optical characteristics.
Furthermore, the complex RI of Black Carbon (BC) in NWP models has been a subject of ongoing debate. The wavelength-dependent RI values were derived by Chang and Charalampopoulos (1990) based on experimental measurements of propane-air flame soot particles. However, an alternative approach by Bond and Bergstrom (2006) suggested a constant RI value of 1.95+0.79i at 0.55 µm for light-absorbing carbon (LAC), a specialized term for BC across the entire shortwave spectrum. This value was obtained through an extrapolation process that intersected an imaginary upper void-fraction line for experimentally derived RI values of non-graphite LAC with a graphitization line. However, this prescribed RI was not directly supported by experimental data and was found to underpredict the measured mass absorption cross-section for uncoated BC aggregates at 0.55 µm by approximately 30 % (Liu et al., 2020). A more recent study by Moteki (2023) incorporated aggregate shape and size effects of BC and employed the complex scattering amplitude sensing technique to individually characterize water-insoluble BC particles. Using Bayesian data analysis, the study derived the distributed complex scattering amplitude of waterborne BC particles and recommended an updated RI value of 1.95 + 0.96i. This value reflects an increase of 0.17 in the imaginary component compared to those used in current aerosol-climate models, leading to improved agreement with observed BC absorption characteristics.
Regarding organic carbon (OC), it has generally been assumed to function purely as a scattering aerosol (Kanakidou et al., 2005), with a zero imaginary component of RI prescribed in NWP models. However, Kirchstetter et al. (2004) provided evidence that a subset of OC exhibits wavelength-dependent absorption, particularly in the ultraviolet and visible spectral regions, based on filter-based measurements of biomass combustion and motor vehicle emissions. Other studies (Graber and Rudich, 2006; Adler et al., 2010; Chen and Bond, 2010; Kim et al., 2012) have also mentioned that OC containing aerosol shows the light absorption near low wavelength spectral range.
Sulfate aerosols, primarily composed of ammonium sulfate, are considered scattering aerosols in the atmosphere. The imaginary part of the RI for uncoated sulfate aerosols is approximately 10−7 at 0.55 µm (Toon et al., 1976; Hess et al., 1998), and this value has been accurately implemented in NWP models irrespective of the region. In addition to sulfate, sea-salt aerosols, predominantly composed of sodium chloride, play a significant role in coastal regions, especially when mixed with organic aerosols. The imaginary component of RI for sea-salt is approximately 10−9 in the visible spectral range (Shettle and Fenn, 1979), indicating negligible absorption. Its concentration, however, is minimal over continental surfaces, where other aerosol species dominate.
Therefore, default RI values implemented in current NWP models may not be suitable for region-specific studies, potentially limiting the accuracy of ARI in regional or urban-scale pollution and associated climate assessments. In this study, we incorporate updated and more realistic aerosol optical properties, including mineral dust, black carbon, primary organic carbons, over urban regions of Delhi, using observed or literature-constrained RI values within the AIRWISE model framework. Furthermore, we assess the impact of aerosol optical properties on surface meteorology and regional pollution, quantifying associated biases from October 2023 to January 2024 using the WRF-Chem model. The data and methodology are detailed in Sect. 2, results are presented in Sect. 3, key findings are discussed in Sect. 4, and overall conclusions are provided in the final section.
2.1 Model description and configuration
WRF-Chem is a fully coupled, online chemistry transport model that integrates atmospheric chemistry and aerosol processes within the Advanced Research WRF framework (Skamarock et al., 2019), allowing for direct interactions between meteorology and atmospheric composition. Unlike offline chemical transport models, WRF-Chem simultaneously simulates the evolution of weather and chemical constituents, enabling a more accurate representation of feedback mechanisms between aerosols, radiation, and clouds (Grell et al., 2005). This capability makes it a powerful tool for studying air quality, regional and urban-scale pollution, and the climatic impacts of anthropogenic and natural emissions. The model supports multiple chemical mechanisms and includes various aerosol schemes to simulate secondary organic aerosols, BC, dust, and sea salt (Emmons et al., 2010; Zaveri et al., 2008). The model offers a wide range of dynamical and chemical parameterizations, with multiple physics options, including microphysics, radiation, and planetary boundary layer schemes, tailored to different geographical regions and atmospheric conditions (Powers et al., 2017; Zhang, 2008). Additionally, its fully coupled online feedback mechanisms allow for detailed simulations of aerosol-cloud-radiation interactions, capturing the direct and indirect effects of aerosols on weather and climate (Saide et al., 2012; Baklanov et al., 2014; Glotfelty et al., 2019). These capabilities make WRF-Chem a crucial tool for assessing the impacts of emissions on atmospheric processes.
We adopt the same core WRF-Chem (v.3.9.1) (Skamarock et al., 2008) model setup and configuration as used in the operational AIRWISE system (Ghude et al., 2020; Kumar et al., 2020; Jena et al., 2021). The study region, depicted in Fig. S1 in the Supplement, is centered over Delhi (28.7° N, 77.5° E) and consists of two nested domains (d01 and d02). The outer domain (d01) encompasses North India, extending from 62 to 93° E and 21 to 36° N, with a horizontal resolution of 10 km×10 km and a grid size of 300×170 points. The inner domain (d02) focuses on Delhi and the National Capital Region (NCR), covering an area from 75 to 78° E and 26 to 30° N, with a higher resolution of 2 km×2 km and a grid size of 161×201 points. Each domain consists of 50 vertical levels, with 8 levels within the lowest one km from the surface to better resolve boundary-layer processes, and the model top is set at 50 hPa. To focus on urbanized regions, such as Delhi, the output from both domains (d01 and d02) has been masked to represent Delhi specifically. Simulations were conducted in the period from September 2023 to January 2024 capturing the high aerosol loading during the stubble burning season (mid-October to November) and the winter period in the study region. The physics schemes used in the model simulations include several key components designed to accurately represent various atmospheric processes. The WRF Single-Moment 6-class (WSM6) scheme is employed for microphysics, which simulates cloud processes (including cloud water, rain, snow, and ice) based on a single moment approach (Hong and Lim, 2006). Longwave and shortwave radiation is handled by the RRTMG, which provides efficient and accurate computation of radiative transfer and detailed representation of the solar radiation absorbed and scattered by the atmosphere (Mlawer et al., 1997; Iacono et al., 2008). The boundary-layer physics are represented by the Mellor-Yamada Nakanishi and Niino 2.5 level (MYNN 2.5) scheme, which is designed to model turbulent mixing and the vertical structure of the boundary layer (Nakanishi and Niino, 2004). For convective parameterization, the Grell-Freitas Ensemble scheme is used, for its ability to represent deep convection and its interaction with larger-scale weather systems (Grell and Freitas, 2014). The scheme is designed to provide a seamless transition between parameterized and explicitly resolved convection across different model resolutions by progressively reducing the contribution of parameterized convection as grid spacing decreases (Kwon and Hong, 2017). The Unified Noah Land-Surface Model is utilized to simulate land-surface interactions, including the exchange of heat, moisture, and momentum between the surface and the atmosphere (Chen and Dudhia, 2001). Finally, the Eta Similarity scheme is applied in the surface layer, providing near-surface turbulent fluxes based on atmospheric stability (Businger et al., 1971). These configurations of the physics schemes have been summarized in Table S1 in the Supplement.
2.1.1 Meteorological boundary conditions
The 6-hourly meteorological datasets from the European Centre for Medium-Range Weather Forecast (ECMWF) reanalysis (ERA5) were utilized to generate the initial and boundary conditions for the domain d01. These datasets, with a horizontal resolution of 0.25°×0.25°, provide comprehensive information on various meteorological variables such as temperature, pressure, humidity, wind speed, and wind direction (Hersbach et al., 2020), which are essential for initializing the model simulations. The ERA5 data were used to define the conditions at the boundaries of the domain d01; no grid nudging or spectral nudging towards ERA5 was applied during the model integration. A one-way nesting strategy was adopted, with domain d02 dynamically downscaled from domain 01 without feedback from d02. The model output from d01 was subsequently downscaled to provide the boundary conditions for the domain d02, which covers a smaller region with a higher resolution. For geographical data, including terrestrial and land-use information, the stationary datasets are interpolated from the Moderate Resolution Imaging Spectroradiometer (MODIS) International Geosphere-Biosphere Programme (IGBP) 21-category land-cover classification datasets (Friedl et al., 2002). The interpolation ensures that the land-use data are appropriately matched to the finer resolution of the model grid, particularly for the domain d02.
2.1.2 Chemistry formulation: emissions, boundary conditions, and mechanism
The monthly anthropogenic emissions of aerosols were derived from the Emission Database for Global Atmospheric Hemispheric Transport of Air Pollutants version 2.2 (EDGAR-HTAPv2.2), which provides datasets from 2010 at a horizontal resolution of 0.1°×0.1° (Janssens-Maenhout et al., 2015). This global inventory includes sector-specific emissions, such as those from transportation, industrial activities, power and energy generation, residential sources, and agriculture. Since the coarse-resolution inventory cannot adequately represent the strong spatial variability of urban emissions over Delhi-NCR, emissions within the Delhi region were refined using the High-resolution Delhi Emission Inventory (HrDEI) developed under the System of Air Quality and Weather Forecasting and Research (SAFAR) programme (Jena et al., 2021). The HrDEI is a bottom-up inventory available at 400 m spatial resolution and incorporates detailed sector-specific emissions from transportation, residential, industrial, construction, waste-burning, and power sectors. The high-resolution emissions were aggregated to the model grid using a mass-conserving approach to preserve total emissions while improving the representation of urban emission hotspots. This refinement provides a more realistic characterization of anthropogenic emissions over Delhi-NCR and their influence on aerosol loading and ARIs. For biomass burning and prescribed fire emissions, hourly temporal data at a 1 km spatial resolution were obtained from the Fire Inventory from NCAR version 2.5 (FINNv2.5) (Wiedinmyer et al., 2011). The biogenic emissions during the study period were incorporated using the Model of Emissions of Gases and Aerosol from Nature version 2.0 (MEGANv2.0), which estimates emissions from natural sources such as vegetation (Guenther et al., 2006).
The chemical boundary conditions for the domain d01 were set using the Model for Ozone and Related Tracers version 4 (MOZART-4), which provides chemical climatological data for the study region (Emmons et al., 2010). The gas-phase chemistry was simulated using the chemical mechanisms from this global chemical transport model. Additionally, the Goddard Chemistry Aerosol Radiation and Transport (GOCART) model was employed to simulate aerosol chemistry and related processes, including transportation, deposition, nucleation, and accumulation (Chin et al., 2000). GOCART was selected because of its computational efficiency and its widespread use in both operational and research-oriented air quality forecasting applications over India (Ghude et al., 2024). This computationally economical framework allows long-duration simulations while retaining the major aerosol species required to represent ARIs. GOCART tracks aerosol species like BC, OC, and sulfate as bulk aerosol species, while dust and sea-salt are resolved in five and four size bins, respectively, for more accurate representation of their distribution and behaviour in the atmosphere.
2.2 Aerosol optical properties
In the WRF-Chem model, the PM2.5 is composed of several aerosol species (Govardhan et al., 2024), including hydrophobic and hydrophilic BC (BC1 and BC2), hydrophobic and hydrophilic OC (OC1 and OC2), Dust with two size bins (Dust1 and Dust2, with effective radii of 0.5 and 1.4 µm, respectively), Sea-Salt with two size bins (SEAS1 and SEAS2, with effective radii of 0.3 and 1.0 µm, respectively), sulfate, and an un-speciated primary PM2.5 category (as P25) representing other inorganic fine particulate matter. In the aerosol–radiation calculations, P25 is assigned the same optical properties and refractive indices as mineral dust and is therefore treated as a dust-like aerosol species for estimating its radiative effects. The optical properties of these aerosol species, including their scattering and absorption cross-sections, are separately computed in the model. These properties depend primarily on the complex RI and the morphology (shape and size) of the aerosols (Barnard et al., 2010; Tuccella et al., 2015). These RIs are basically used in the calculation of optical properties of the aerosols (such as SSA, AF etc.) using 3 methods: (a) Volume averaging mixing rule, (b) Maxwell-Garnett mixing rule and, (c) Shell-core method in the WRF-Chem model. For this study we have used the volume averaging mixing rule for the calculation of optical properties keeping in mind the mixing state of aerosols in the ambient environment of Delhi (Srivastava et al., 2018). The detailed explanation of these rules can be found in the literature (Fast et al., 2006; Barnard et al., 2010). In addition to aerosol composition, aerosol optical properties in WRF-Chem are affected by hygroscopic growth and aerosol water uptake. Aerosol water content is diagnosed as a function of aerosol composition and ambient relative humidity and is added to the dry aerosol volume to determine the wet particle size. Aerosol water is also included in the volume-averaged mixing of complex RIs, yielding an effective wet refractive index. Consequently, aerosol optical properties such as extinction, AOD, SSA, and AF are calculated using the wet particle radius and wet effective refractive index, allowing ARIs to respond dynamically to relative humidity. The optical properties are then used in the Mie subroutines to solve the radiative transfer equations in the model. The full Mie calculations are computationally expensive in the sense that they solve each equation separately and hence require more time for the model to simulate radiative transfer fluxes. An alternate subroutine that is computationally fast, but can be less accurate, uses the Chebyshev economization method (detailed explanation in Ghan et al., 2001) for the calculation of radiative fluxes. The downwelling shortwave radiation at the ground level of the model is then produced after interacting with various entities present in the atmosphere. Hence, inaccurate prescription of aerosol optical parameters can lead to erroneous simulations of their radiation interactions (Haywood and Boucher, 2000).
To improve the representation of ARIs over the study region, the RIs of Dust, BC, OC, and P25 were modified in the model. The values of complex RIs used in the study for the aerosol species were obtained from the available literature. These values were either region specific, calculated using the sampling techniques or laboratory tested values calculated under the controlled environment which may be valid for any region of interest. The details of the modified complex RIs are summarized in Table 1.
Table 1Original and modified values of the complex refractive indices of aerosol species employed in the WRF-Chem model.
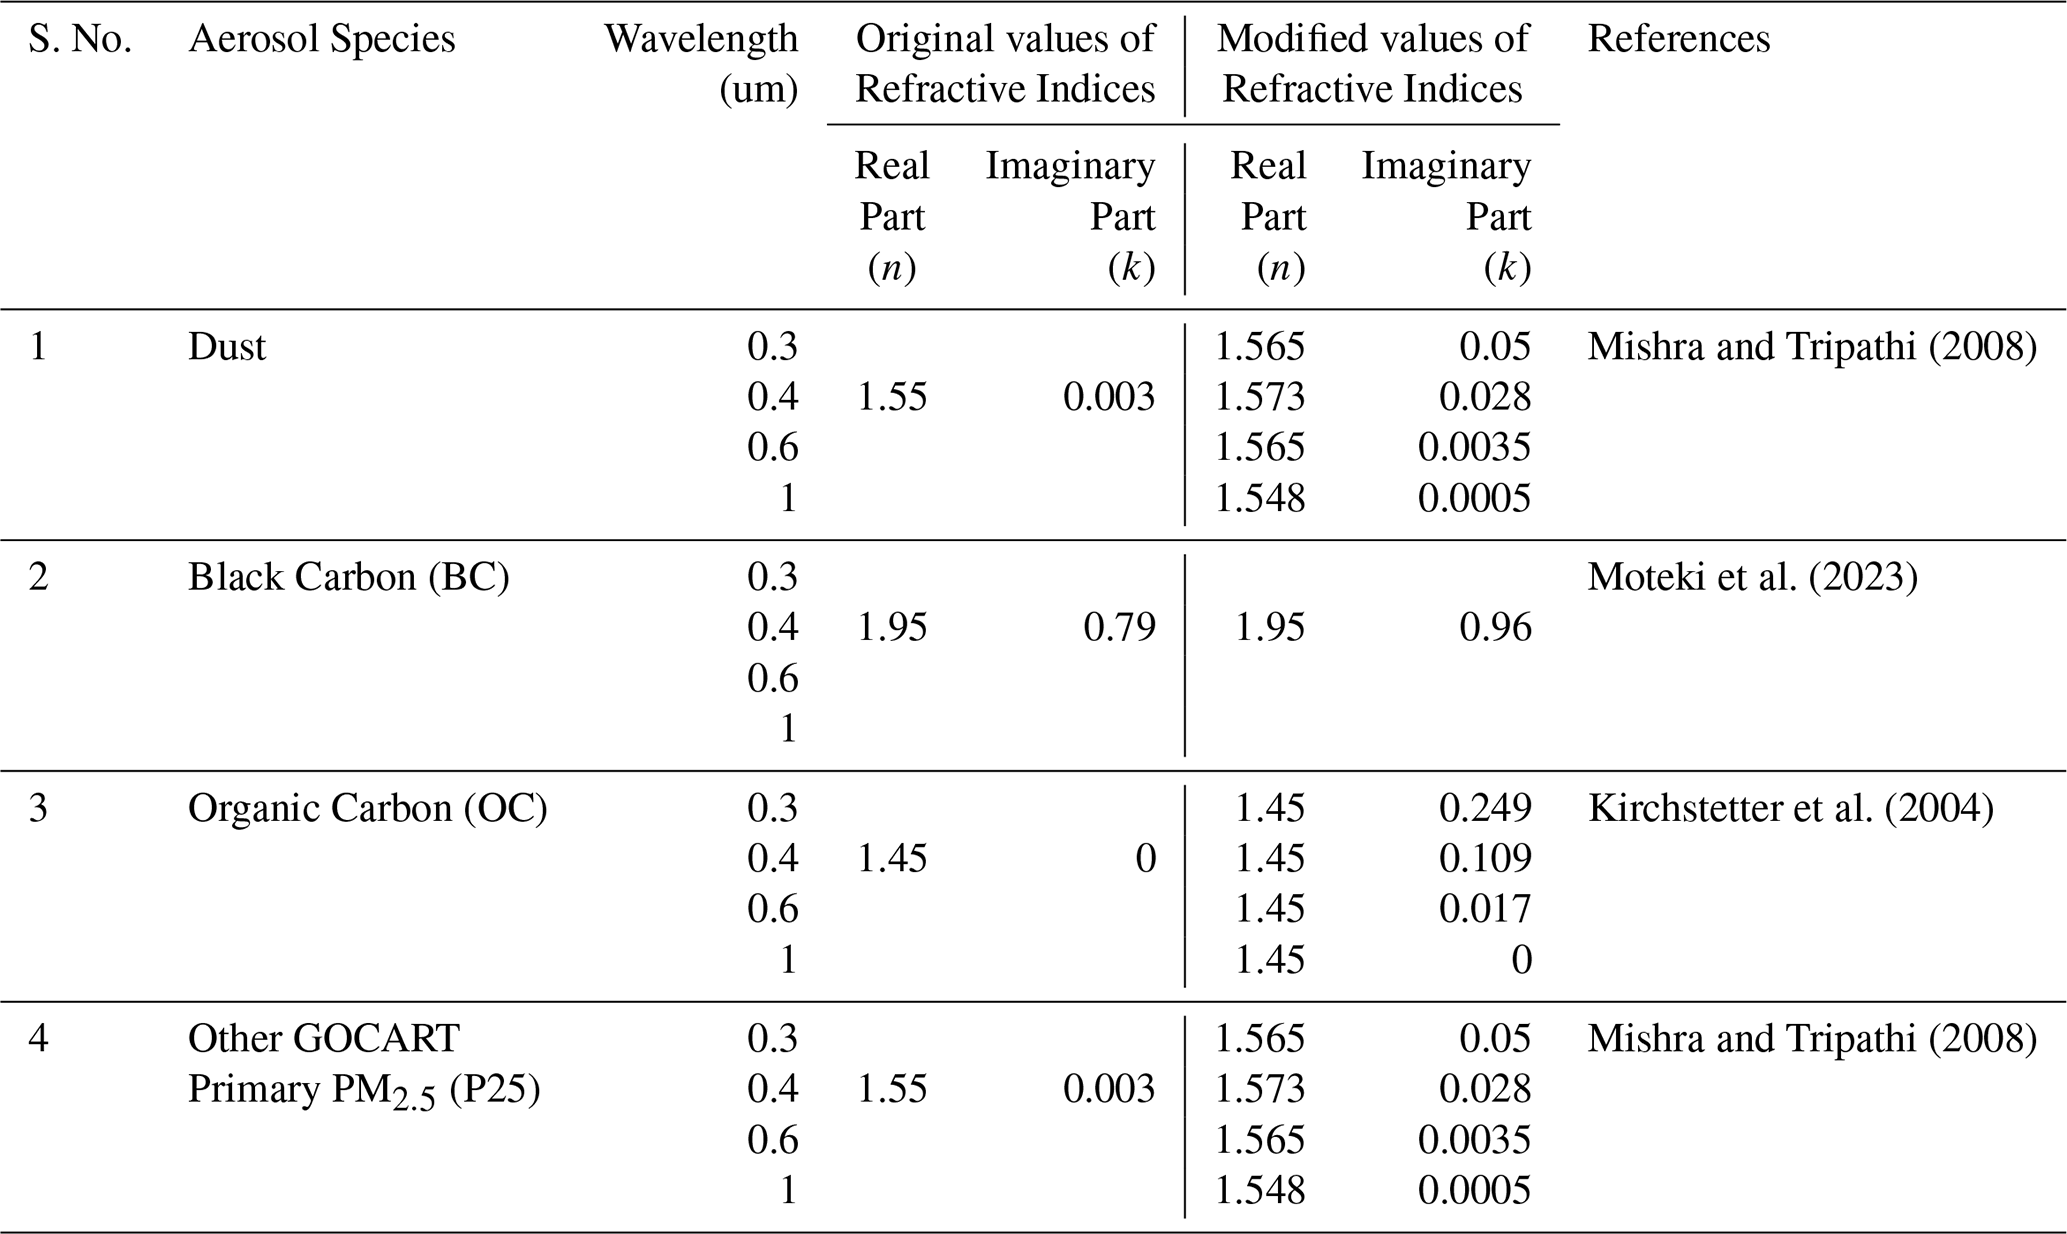
The original values of the RI were found to be independent of wavelength in WRF-Chem i.e., these species can scatter (real part of RI) and absorb (imaginary part of RI) the radiation with the same factor for all the 4 shortwave radiation bands present in the model. However, in the literature it was found that the RI values of these species depend on wavelength (except BC) and have different scattering or absorbing nature in each shortwave radiation band. Furthermore, OC was assumed to be non-absorbing in the model, but literature suggests an imaginary part of RI at few shortwave radiation bands (Table 1). The real part of RI values prescribed in the model for all the species mentioned above are approximately in agreement with the literature. However, the imaginary parts differ. Our modifications to the RI, thus make the model aerosol mixture more absorbing. Since aerosol optical properties are also calculated for hygroscopically grown particles under ambient relative humidity conditions, the revised RIs influence the optical response of hydrated aerosols. Consequently, aerosol water uptake and particle growth modify the scattering and absorption characteristics of the aerosol population, while the updated RIs alter the magnitude of these optical effects. This combined influence affects aerosol optical properties, and ARIs simulated by the model.
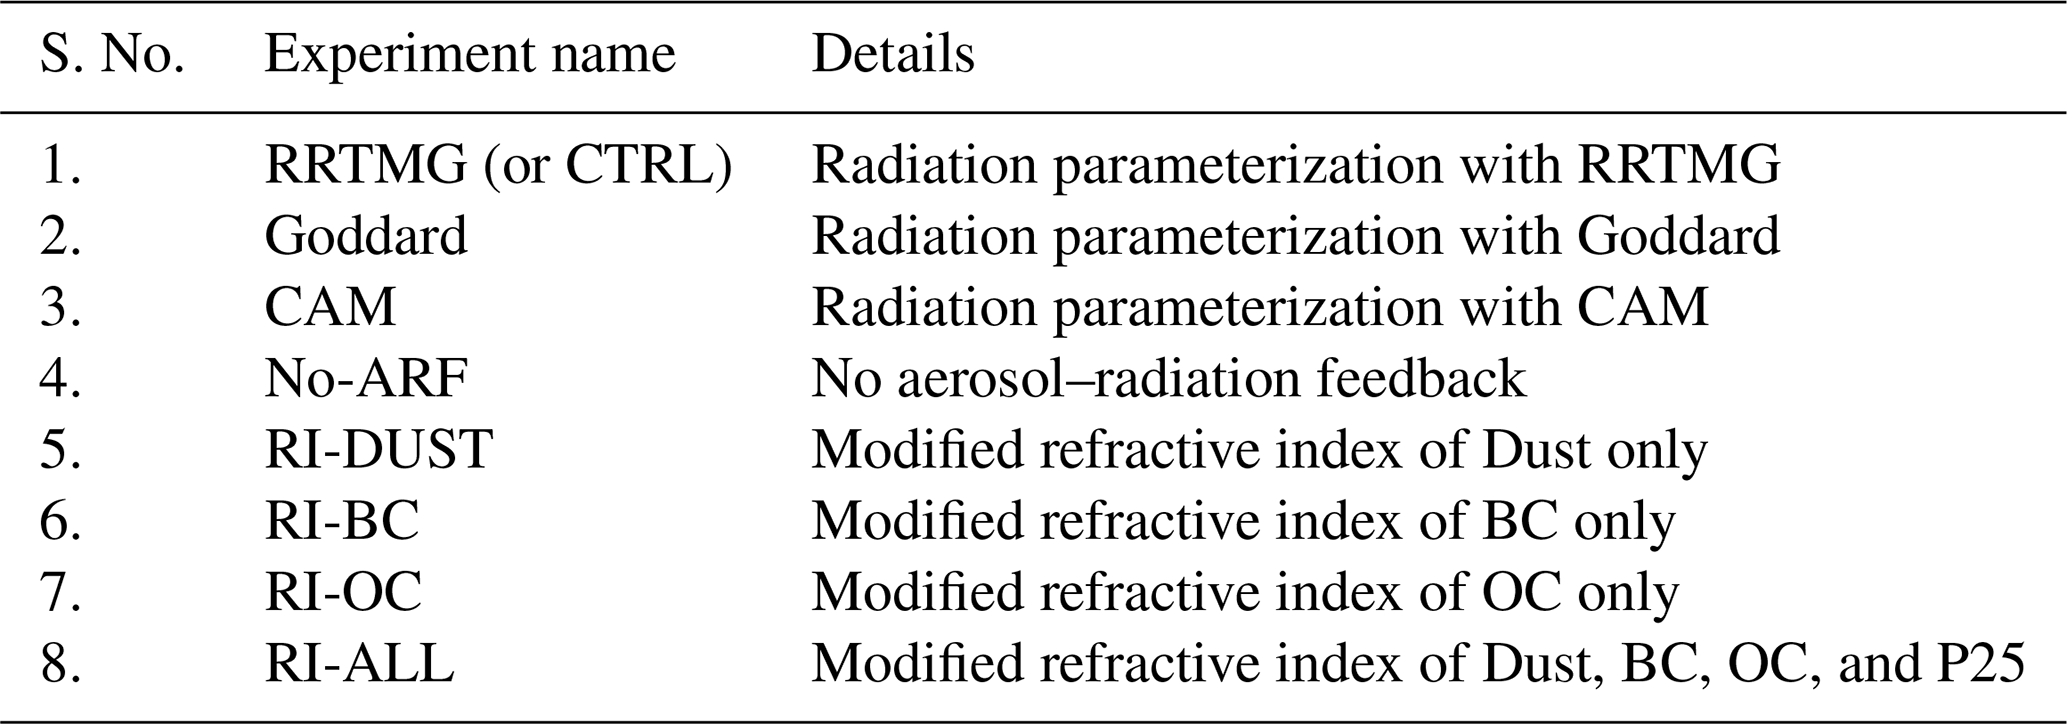
2.3 Experiment details
Eight experiments were conducted to assess the impact of ARI under various conditions. Among these, three experiments were designed to evaluate which radiation scheme, namely RRTMG, Goddard, or CAM, produces surface fluxes most consistent with observations. To isolate the role of aerosol–radiation feedback, experiment No-ARF was performed with the aerosol–radiation feedback turned off. Additionally, four experiments (RI-DUST, RI-BC, RI-OC and RI-ALL) were carried out to investigate the individual contributions of specific chemical species to the shortwave radiation reaching the surface. A summary of all experiments is provided in Table 2.
To examine the impacts of modifications in the optical properties of aerosols on the downwelling shortwave radiation in the WRF-Chem, we selected extreme pollution events that occurred over Delhi during the year 2023–2024. Figure 1 presents the mean observed PM2.5 concentrations recorded over Delhi from 20 September 2023 to 31 January 2024. During this period, concentrations peaked at ∼565 µg m−3, primarily due to local emissions from firecrackers burning on the eve of the Diwali festival. The observed PM2.5 time series also highlights two periods of persistently elevated aerosol loading, which were selected as special case studies to evaluate the impact of modified aerosol optical properties in the model: (a) a post-monsoon episode and (b) a typical winter event over Delhi.
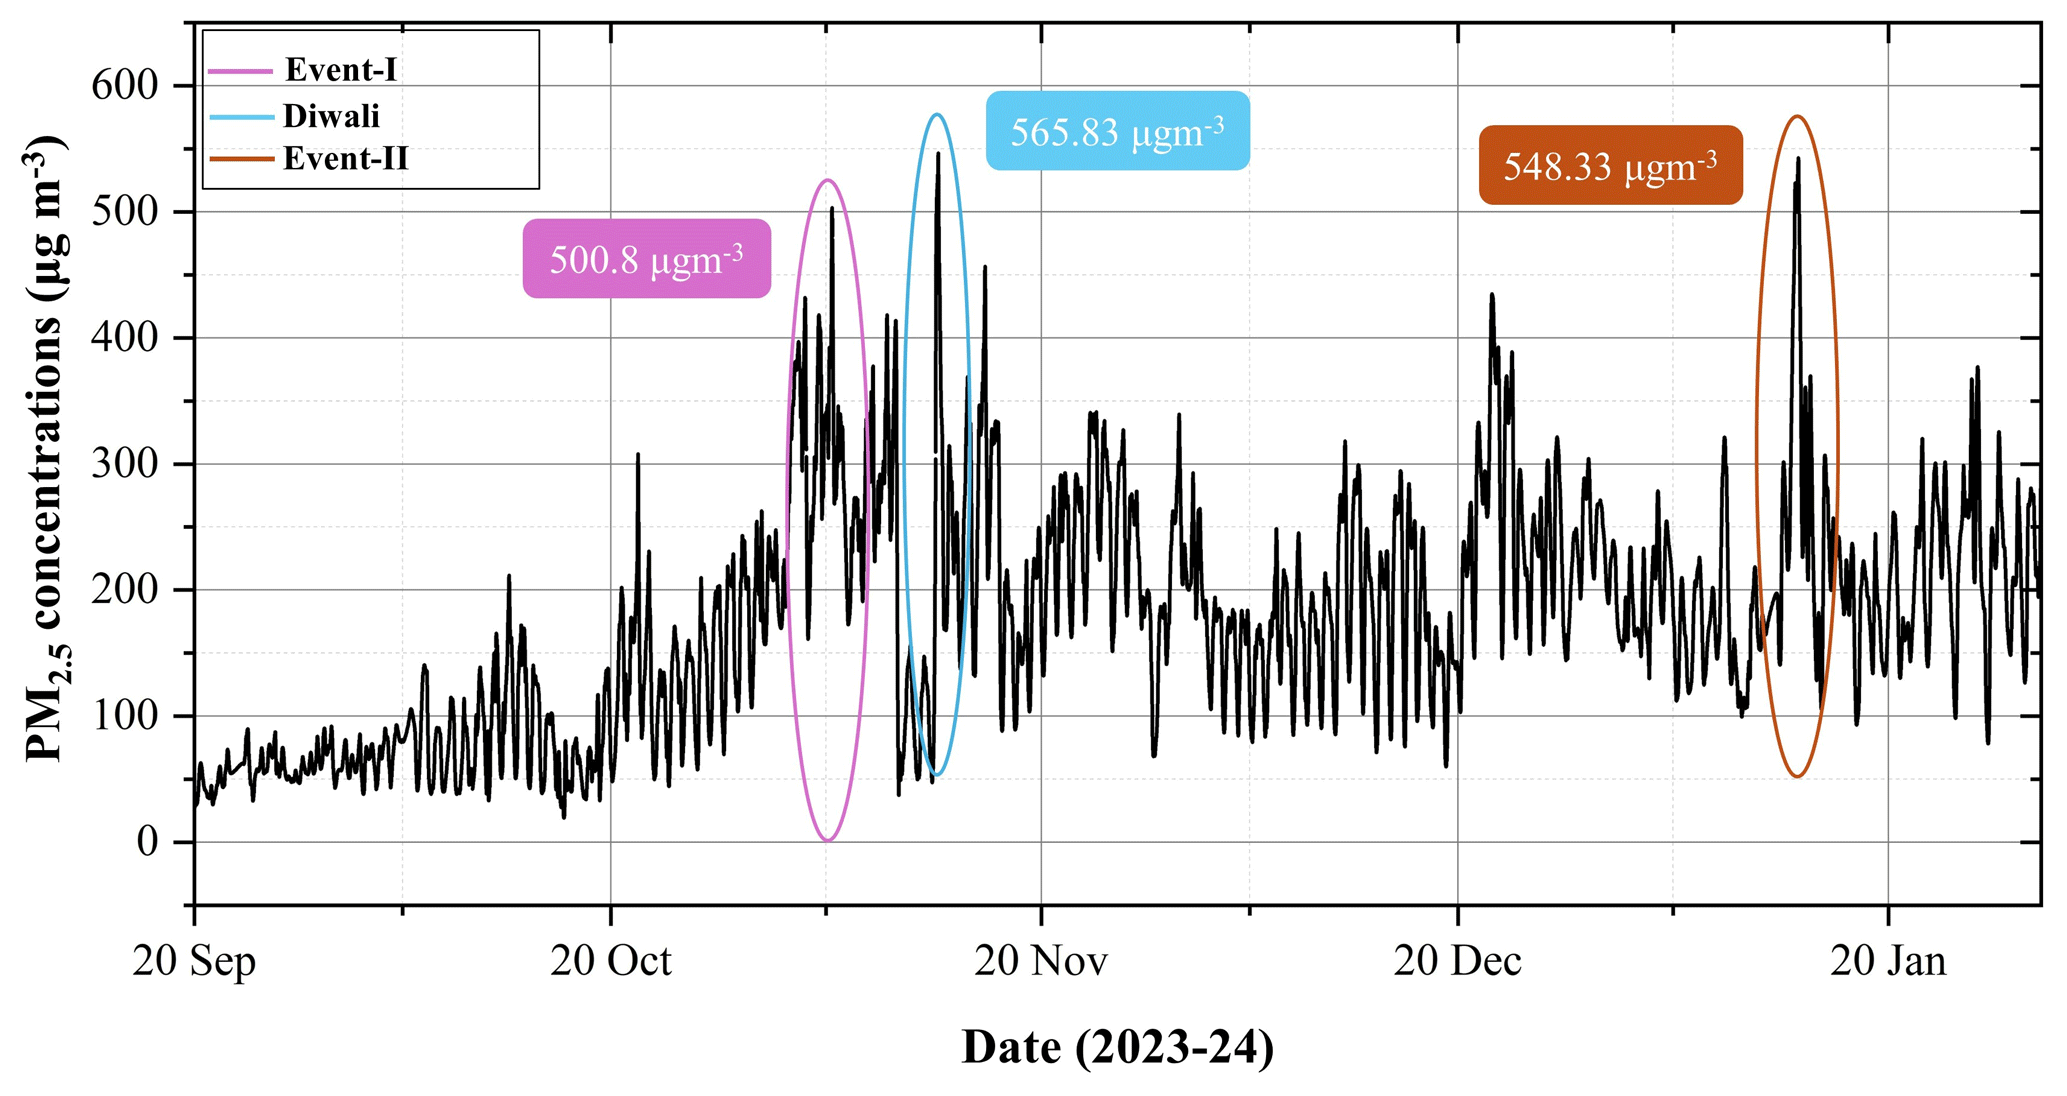
Figure 1Ground based PM2.5 measurements over Delhi for the period between 20 September 2023 to 31 January 2024.
The first case (Event-I), covers a 10 d period from 1 to 10 November 2023, chosen to represent intense aerosol loading due to enhanced anthropogenic activity and widespread crop residue burning in neighbouring states. During this event, PM2.5 concentrations reached as high as 500 µg m−3, with some days recording around 400 µg m−3 (Fig. 1). Daytime concentrations typically ranged between 200–300 µg m−3. The second case (Event-II), spanning from 8 to 18 January 2024, was selected to investigate the influence of the modified optical properties under winter meteorological conditions characterized by low temperatures, high relative humidity, and stagnant wind patterns. This event was marked by persistent fog and low-level clouds that significantly diminished incoming solar radiation. PM2.5 concentrations during this period peaked at ∼550 µg m−3, with values on most days ranging between ∼100 to 300 µg m−3.
For these high pollution events (Event-I and Event-II), a spin-up time of two days was applied for each simulation to allow meteorological and MOZART-derived chemical initial conditions to adjust to the model dynamics and emissions. Also, the comparison of these experiments was carried out for the outer domain (d01) with the observations to understand the regional impacts and variations in ARI.
The same set of experiments (No-ARF, RI-DUST, RI-BC, RI-OC and RI-ALL) was also conducted for the period from 20 September 2023 to 31 January 2024, with a 10 d spin-up, over domains d01 and d02. This long-term four-month simulation was designed to examine the impacts of modified aerosol optical properties on downwelling shortwave radiation (hereafter SWDOWN) over an extended period and during non-episodic pollution conditions. The results were analysed under both all-sky conditions (atmosphere with clouds, aerosols, trace gases etc.) and clear-sky conditions (atmosphere without clouds). For the clear-sky analysis, all data points influenced by cloud cover were excluded by retaining only those grid points and time steps with a cloud fraction less than 0.1 at all models' vertical levels.
2.4 Observational datasets
2.4.1 Radiation and meteorological data
The quality-controlled observational datasets used for the evaluation of model simulations include downwelling shortwave radiation measurements from a four-component net radiometer, along with meteorological variables such as temperature at 2 m (T2), relative humidity at 2 m (RH2), and wind speed at 10 m (WS10). These data were collected using integrated smart weather sensors mounted on a 20 m micro-meteorological tower during the Winter Fog Experiment (WiFEX) campaign, which took place from 2023 to 2024 at Indira Gandhi International (IGI) Airport, Delhi. The meteorological observations were obtained from weather stations (Gill Instruments GMX-600 Compact) installed at multiple levels (2 and 10 m above ground level (a.g.l.)). Radiation measurements were acquired using a four-component sensor (Delta Ohm LPNET14) installed at approximately 2 m a.g.l. The instrument consists of upward- and downward-facing pyranometers and pyrgeometers that separately measure incoming and outgoing shortwave and longwave radiative fluxes. The shortwave pyranometer sensors operate over a spectral range of approximately 0.3–3.0 µm, encompassing most of the solar spectrum relevant for broadband shortwave radiation measurements. In this study, only the observed downward shortwave radiation (SWDOWN) component was used for comparison with the model-simulated SWDOWN.
To distinguish between clear-sky, cloudy, and foggy conditions, attenuated backscatter observations from a ceilometer (CHM 15k NIMBUS-1064 nm) installed at approximately 8 m a.g.l., were utilized. The ceilometer provides aerosol backscatter profiles up to a height of about 15 km and was used to identify and separate cloudy and foggy periods in both the observations and model simulations.
To ensure the integrity and reliability of the observational datasets, a series of quality-control procedures were applied. Missing and physically unrealistic values were removed prior to analysis. Furthermore, days containing less than 40 % valid observations were excluded to minimize uncertainties associated with incomplete or malfunctioning sensor measurements. Since the observational instruments recorded data at a temporal resolution of 1 min (15 s for the ceilometer), whereas the WRF-Chem simulations were available at hourly intervals, all observational datasets were averaged to hourly values before comparison with the model output.
2.4.2 PM2.5 concentrations data
The ground-based hourly mass concentrations of PM2.5, collected by the Central Pollution Control Board (CPCB) and Delhi Pollution Control Committee (DPCC) at 40 monitoring stations across Delhi (Sengupta et al., 2022), were used to evaluate the model-simulated PM2.5 concentrations for the study region. The CPCB and DPCC follows stringent quality control procedures to ensure the accuracy and reliability of the air quality data. These datasets offer a comprehensive representation of PM2.5 concentrations at various locations across the city and serve as a benchmark for comparing the model outputs. Before using the data for comparison with the model, the datasets underwent thorough quality checks. Any missing, erroneous, or zero values were identified and rectified to avoid introducing biases into the analysis. This was particularly important to ensure the accuracy of the comparison, as gaps or anomalies in the observational data could lead to misleading conclusions about the model's performance. In addition, days with significant data gaps or sensor malfunctions were excluded to enhance the reliability of the evaluation. The utilization of this ground-based dataset allowed for a detailed comparison between the observed PM2.5 concentrations and the model-simulated values at the surface (∼2 m), offering insights into the model's ability to replicate observed air quality patterns. This comparison is crucial for evaluating the model's performance in capturing PM2.5 pollution, particularly in an urban setting like Delhi, where factors such as vehicular emissions, industrial activity, and seasonal variations significantly influence air quality.
2.5 Statistical evaluation
The comparison of model-simulated meteorological variables (SWDOWN, T2, RH2, WS10), and mass concentrations of PM2.5 with observational datasets was carried out using various statistical parameters to assess the model's performance. These parameters included Mean Bias (MB), Root Mean Square Error (RMSE), Normalized Mean Square Error (NMSE), and Fractional Bias (FB). These statistical metrics offer a comprehensive evaluation of how well the model simulations align with the observed datasets. The detailed formulas and descriptions for each of these statistical parameters are provided in the Supplement (Table S2).
3.1 Choice of shortwave radiation parameterization scheme
To choose the best amongst multiple shortwave radiation parameterization schemes available in WRF-Chem, we ran the model with the default optical properties of aerosols with three different schemes. We chose RRTMG, Goddard and CAM for this exercise and compared the diurnal cycles of averaged SWDOWN simulated over Delhi using these schemes with the corresponding observations. The comparisons are done for the month of December 2023 under clear-sky conditions. It should be noted that WRF-Chem does not provide a separate clear-sky SWDOWN diagnostic; therefore, clear-sky conditions were identified through cloud screening rather than by using a model-generated clear-sky radiation output. In the model simulations, cloudy or foggy periods were excluded by retaining only those hours for which the cloud fraction remained below 0.1 at all model levels over Delhi. For the observations, cloudy and fog-affected periods were identified using ceilometer backscatter measurements and associated cloud detection products and were subsequently removed. The SWDOWN evaluation was therefore restricted to periods classified as cloud-free in both the model and observational datasets (Fig. 2). It can be seen that, in comparison with RRTMG, the simulated SWDOWN in Goddard and CAM, overestimate the observations. Overall, all three radiation schemes overestimate SWDOWN during the morning hours (00:00 to 12:00 LT), whereas Goddard and CAM maintain a positive bias throughout the day. In, contrast, RRTMG shows a closer match to the observed values especially during the afternoon hours. However, the persistent morning overestimation is evident even after excluding foggy periods from the analysis, suggesting that it is not solely associated with fog or cloud contamination.
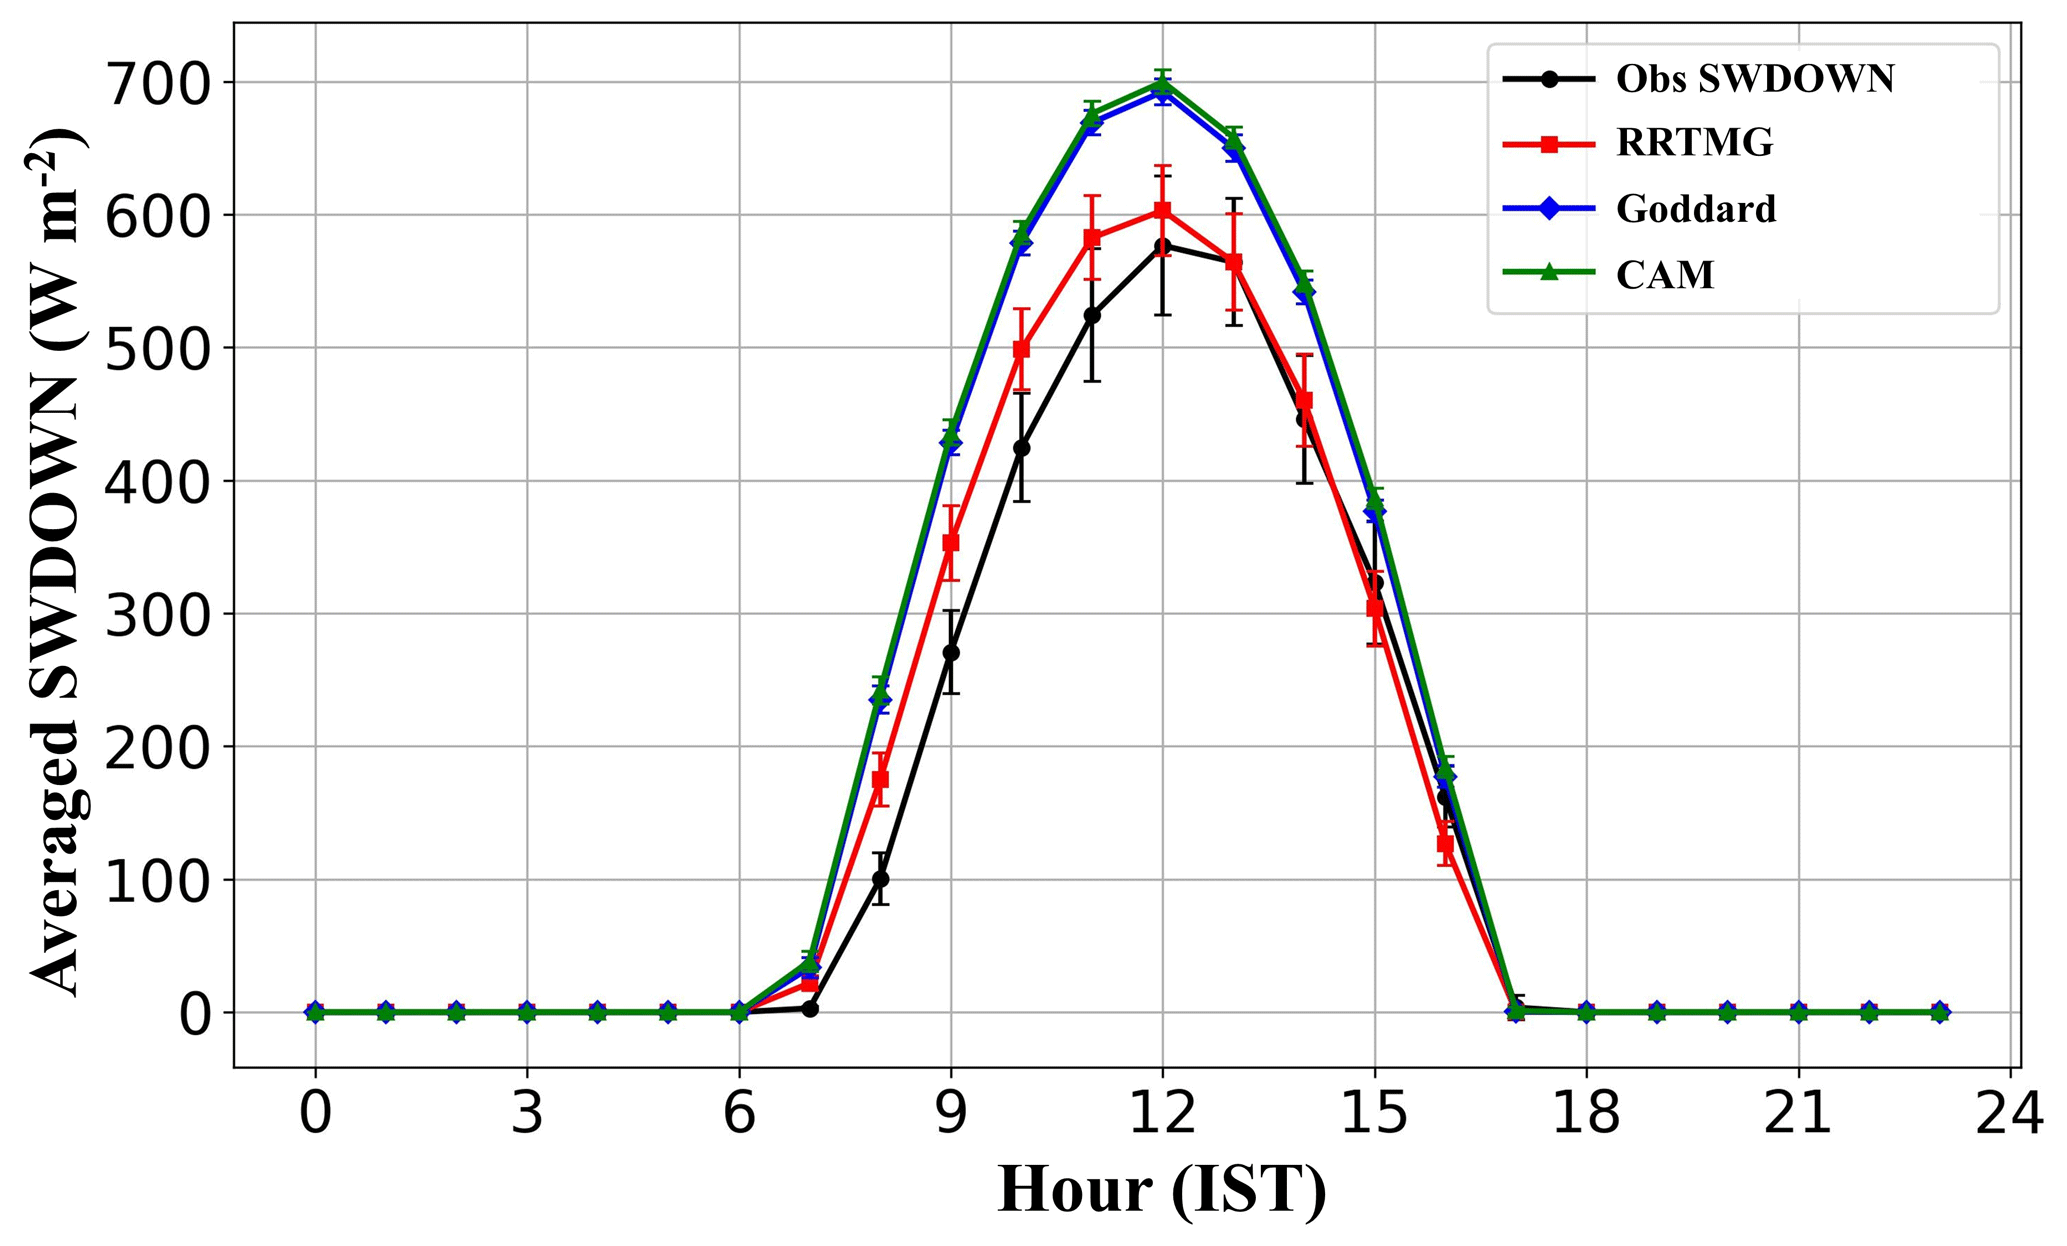
Figure 2Diurnal cycle of simulated SWDOWN by different radiation schemes: RRTMG, Goddard, CAM with observations in the month of December 2023 (monthly mean) over Delhi. IST refers to the Indian Standard Time i.e. Local Time (LT).
The biases between Goddard and CAM are roughly at least twice or even more of those for RRTMG (Table S3). In fact, RRTMG shows a very good agreement with the observations during the mid-day hours of 12:00–15:00 LT. The maximum differences in the model schemes and the observations occur around 09:00 LT, while the minima for RRTMG comes at 13:00 LT and that for Goddard and CAM is reached at 17:00 LT. Thus, RRTMG is found to be more accurate in capturing the SWDOWN vis-a-vis the other available radiation parameterization schemes. Therefore, we choose the RRTMG scheme to parameterize the shortwave radiative processes in the further experiments of this study. We refer to this configuration as CTRL in the next sections.
3.2 Impacts of modified aerosol optical properties on surface shortwave radiation
As mentioned in Sect. 2.3, we examine the impacts of modified aerosol optical properties on the SWDOWN for the two extreme pollution cases. The simulated near-surface PM2.5 dry mass concentration for both these events are shown in Fig. S2. Since, we are analysing the impacts of the modified aerosol optical properties on SWDOWN mainly in clear-sky conditions, here, we show the comparison of modelled PM2.5 with the observations in the clear-sky. For Event-I i.e., 1 to 10 November 2023 (Fig. S2a), the observations depict a peak in PM2.5 mass concentrations during the afternoon hours of 5 November, and the values go beyond 500 µg m−3. The model in the CTRL configuration rises a little up to 400 µg m−3, capturing the signature of the peak, but failing to capture the exact magnitude. On the contrary, during the afternoon hours of 4 November, the observations just manage to cross 400 µg m−3, but the CTRL simulations reach beyond 450 µg m−3. For all the other days, the CTRL configuration captures observed tendency of the PM2.5, even the values also are seen to be within ±20 % of the observations. However, on the 6 and 7 November, the model shows an overestimation in comparison with observations. This is likely related to the uncertain biomass burning emissions from fires mainly from the neighbouring states of Punjab and Haryana. To confirm this, we have done more simulation in CTRL configuration without the prescription of biomass burning emissions. The modelled PM2.5 in that configuration (Fig. S3) can be seen to reduce, especially on 6 and 7 November, thus highlighting the role played by fire emissions in causing the large disagreements between model and observations on those days. Overall, the CTRL configuration fails to capture the exact magnitude of the observed PM2.5, but the signals of the extreme pollution are well captured with PM2.5 magnitudes not too low vis-a-vis observations.
For Event-II of extreme pollution i.e. from 8 to 18 January 2024 (Fig. S2b), most of the days were mainly affected by dense fog spells (Kant et al., 2025), especially up to 14 January. During this period, the model underestimated PM2.5 concentrations relative to the observations. The underestimation is likely associated with the model's difficulty in reproducing the observed fog and near-saturated conditions because of a negative RH bias (Sengupta et al., 2022). Lower simulated RH can limit aerosol hygroscopic growth and suppress aqueous-phase processing, secondary aerosol formation, and gas-particle partitioning, thereby contributing to lower PM2.5 concentrations during foggy periods. Nevertheless, the model fairly captures the signals of the observed PM2.5 under clear-sky conditions, though the exact values are missed. Thus, for both the events, the model in CTRL configuration captures the observed signatures of peak signals, however the peak magnitudes are missed. Nevertheless, the model's atmosphere has enough ambient aerosols under clear-sky conditions, to interact with the incoming shortwave radiation and show impacts of the modified optical properties on it.
We now evaluate the simulated SWDOWN in the CTRL and RI-ALL configuration which is the combined modified RIs of all chemical species and compare it with the corresponding observational data at the WiFEX site. Due to unavailability of data during the Event-I of high Air Quality Index (AQI) (i.e. during November 2023), we have done the model-observation comparisons only for Event-II i.e. during 8 to 18 January 2024 (Fig. 3a). It may be noted that the comparisons are done only for the daytime SWDOWN values for cloud- and fog-free scenarios. This results in screening-out of most of the early morning and nighttime data. The simulated SWDOWN shows a satisfactory comparison with the observations by capturing the day-to-day variation in high and lows, however the magnitudes differ substantially. The RI-ALL configuration tends to reduce the SWDOWN in comparison with CTRL. The bias in the SWDOWN reduces by around 10–15 W m−2 especially from 10–12 January (Fig. 3b). Towards latter half of the study period (14–18 January), the bias vis-a-vis observations in fact increases by as high as 25 W m−2. In general, the RI-ALL configuration reduces the downwelling shortwave radiation at the surface by 10–25 W m−2. The MB, RMSE, NMSE, and the FB are 4.58 (0.86) W m−2, 22.45 (21.61) W m−2, 0.043 (0.042), and 0.042 (0.008) for the CTRL (RI-ALL) experiment (Table S5). Thus, modifying the aerosol optical properties improves the agreement between simulated and observed SWDOWN, primarily through a reduction in mean bias, while the improvement in RMSE is relatively modest.
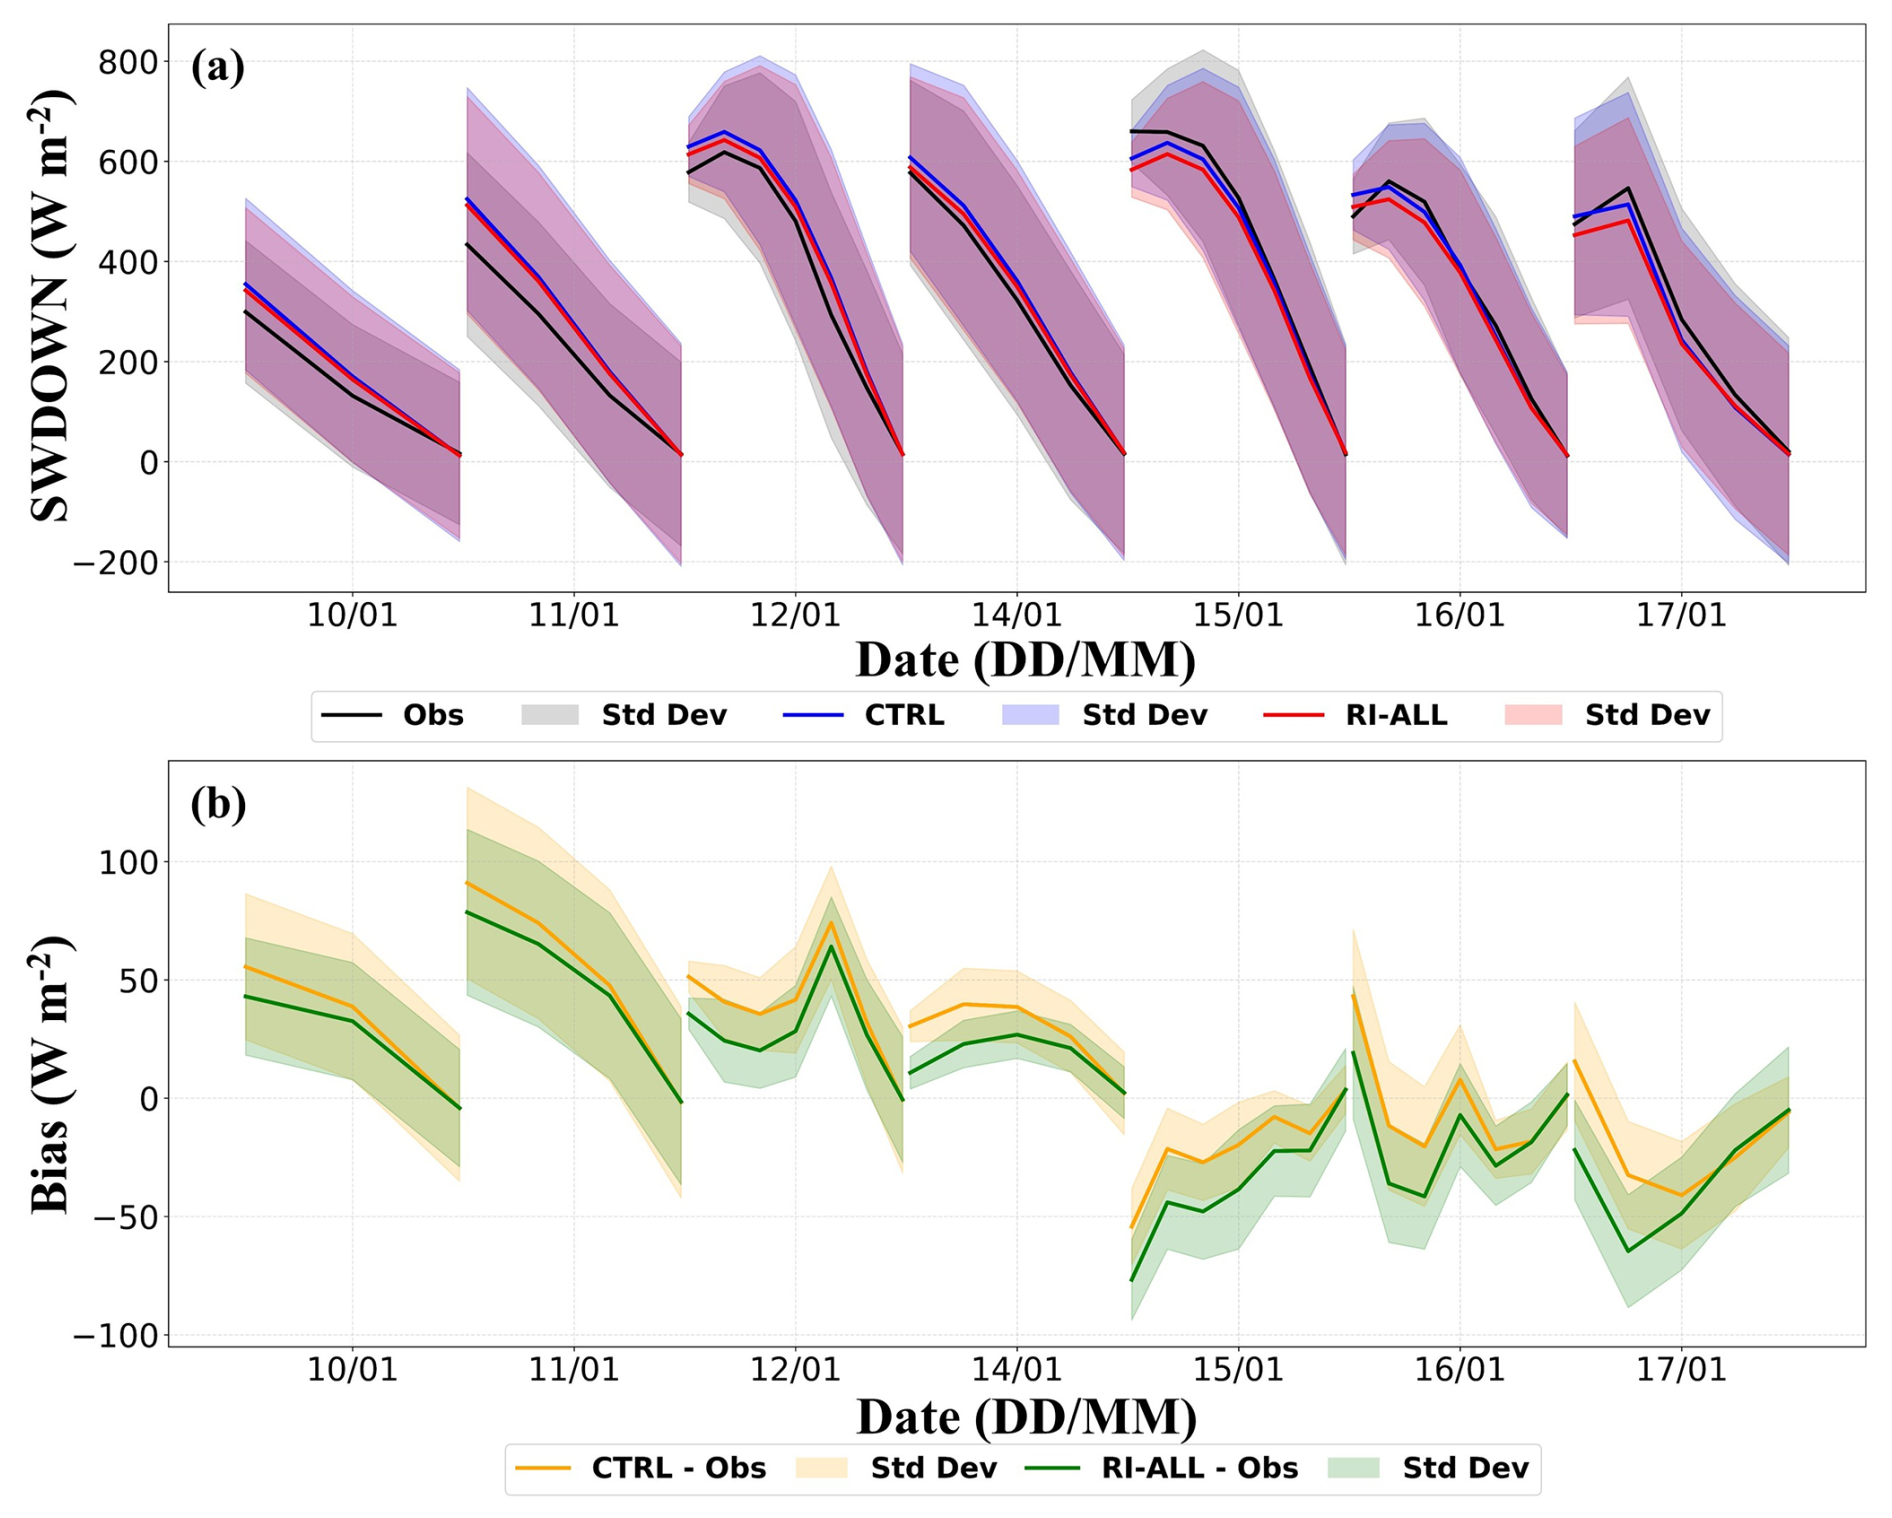
Figure 3(a) Time series of simulated SWDOWN in CTRL and RI-ALL configuration along with observations over Delhi, and (b) bias in CTRL and RI-ALL configurations, excluding nighttime and cloudy/foggy hours, during Event-II.
To isolate the impacts of the modifications in the individual aerosol species' optical properties in causing such changes in SWDOWN, we plot the hourly difference in clear-sky SWDOWN in each of the sensitivity experiments vis-a-vis the CTRL configuration in Fig. 4a (for Event-I) and 4c (for Event-II), the event-mean hourly differences in the SWDOWN are plotted in Fig. 4b and d for Event-I and the Event-II, respectively. Additionally, the total impacts of ARI on the SWDOWN have also been computed as the difference between the No-ARF and CTRL configuration. Those values have also been plotted in hourly as well as event-mean hourly basis in Fig. 4a–d. It may be seen that the hourly changes in SWDOWN due to the modified optical properties of all aerosol species could go as high as 80 W m−2 on the polluted days of 7 and 8 November (Fig. 4a). These changes are roughly of the total clear-sky aerosol radiation impact on the given day. On the contrary, during the winter month of January 2024, the corresponding changes on the extreme pollution days are around 30–40 W m−2. This difference mainly arises due to the lesser availability of the solar radiation in the month of January compared to November. It can also be noticed that the SWDOWN is more sensitive to the changes in the optical properties of the carbonaceous aerosols compared to the mineral dust species. The mean changes in SWDOWN due to the modification in the optical properties of mineral dust (RI-DUST) is +1.4 and −0.73 W m−2 during Event-I and Event-II respectively (Table S6). On the other hand, those due to the changes in the optical properties of BC (RI-BC) are −22.46 and −9.34 W m−2 during Event-I and Event-II, respectively. The corresponding changes due to modified OC optical properties (RI-OC) are −11.35 and −5.69 W m−2, respectively. Figure S4 further shows that the mean PM2.5 composition remains broadly similar between CTRL and RI-DUST configurations during both events, indicating that the differences in simulated SWDOWN are not primarily associated with changes in aerosol mass concentrations. In particular, dust contributes only about 6 %–10 % of PM2.5, whereas carbonaceous aerosols (BC + OC) account for nearly 37 %–40 % of the total aerosol mass during both events. Therefore, the stronger SWDOWN response to RI-BC and RI-OC configurations mainly reflects the larger radiative influence of carbonaceous aerosols rather than changes in aerosol abundance. It may be noted that the real parts (scattering ability) of the RIs of aerosol have not been substantially modified in this study (Table 1). The major modifications have occurred in the imaginary parts (absorption ability). Moreover, the changes in the imaginary parts of BC and OC are much higher in magnitude than that in the imaginary parts of the RI of dust. Therefore, RI-BC and RI-OC experiments produce more changes in SWDOWN compared to the RI-DUST. The mean changes in SWDOWN during clear-sky due to RI-ALL experiment are −27.52 and −13.39 W m−2 for the Event-I and Event-II respectively. With the noon-time values going as high as 50 and 25 W m−2 respectively, which are roughly to of the total impacts of direct radiative effects of aerosols.
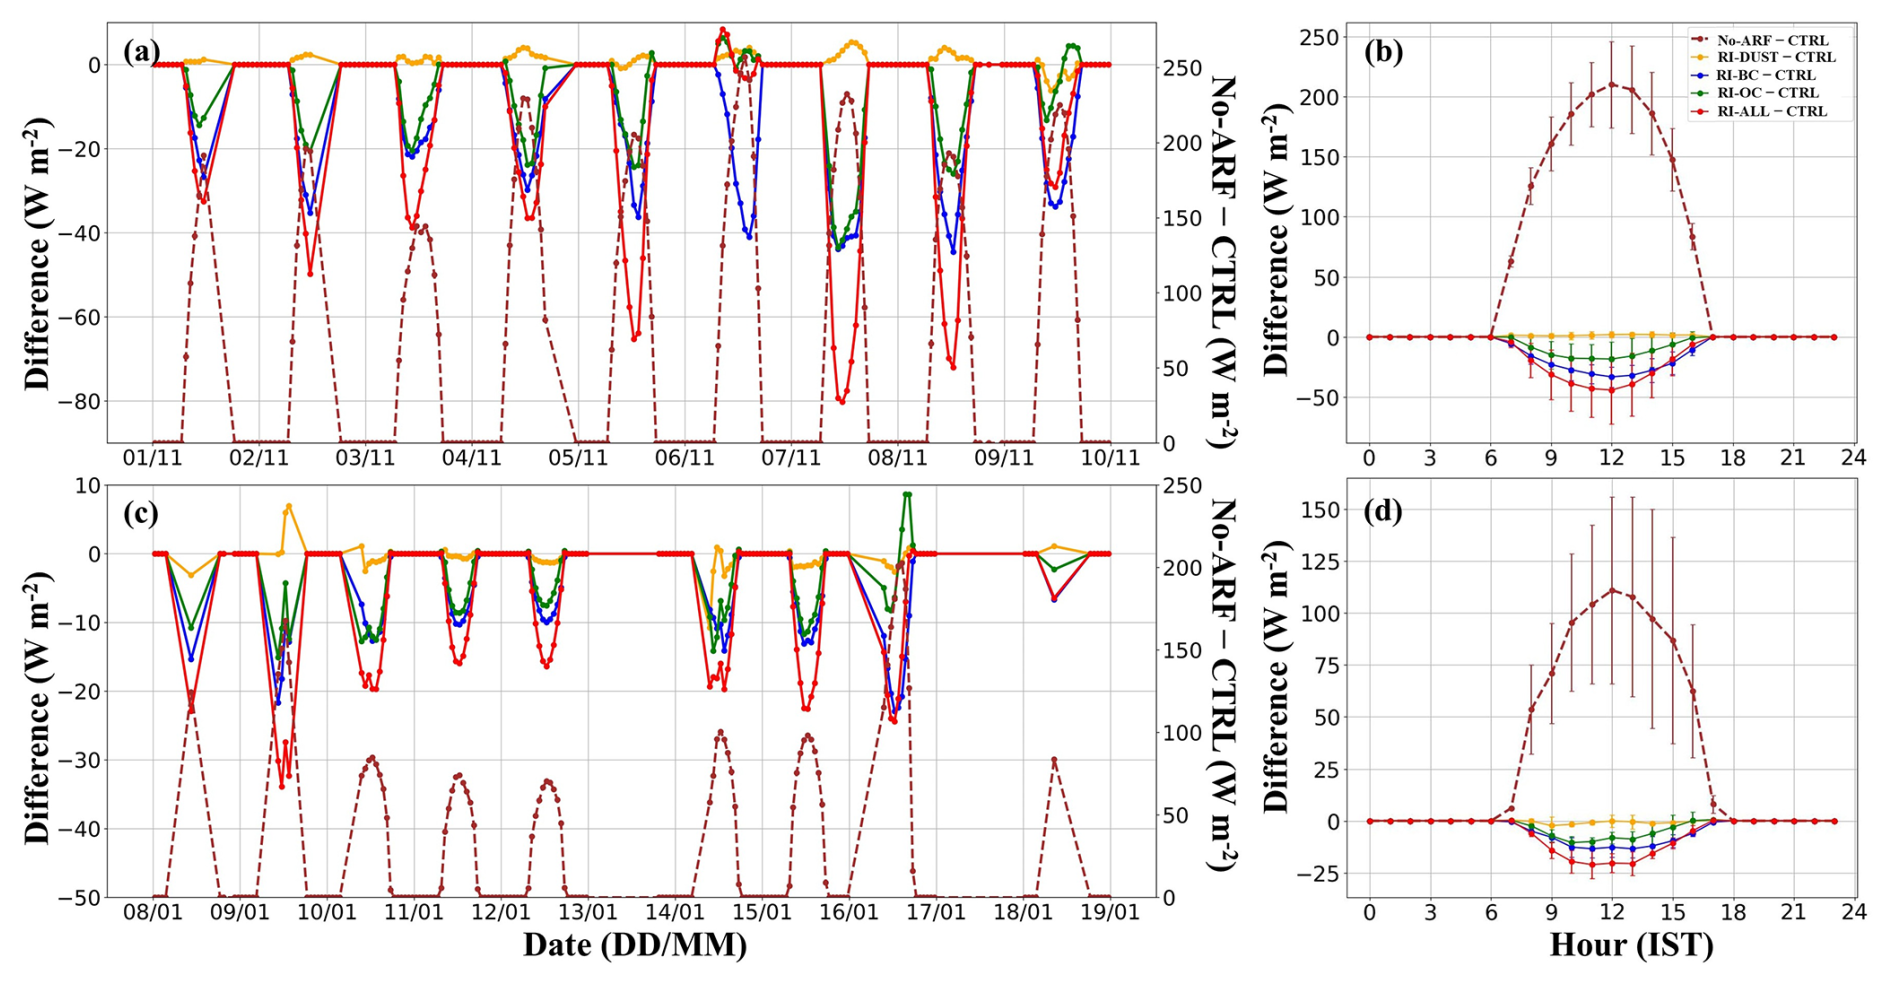
Figure 4Reduction in simulated SWDOWN in RI-DUST, RI-BC, RI-OC, and RI-ALL configurations with respect to CTRL along with difference of No-ARF configuration and CTRL during (a) Event-I, and (c) Event-II in clear-sky over Delhi. Diurnal changes in simulated averaged SWDOWN during (b) Event-I, and (d) Event-II in clear-sky over Delhi.
The changes in SWDOWN due to changes in the optical properties of all aerosol species are around 20 % (in magnitude) less than the sum of the changes in SWDOWN due to the modification of individual species' optical properties, suggesting that the changes in SWDOWN are not strictly linear and additive.
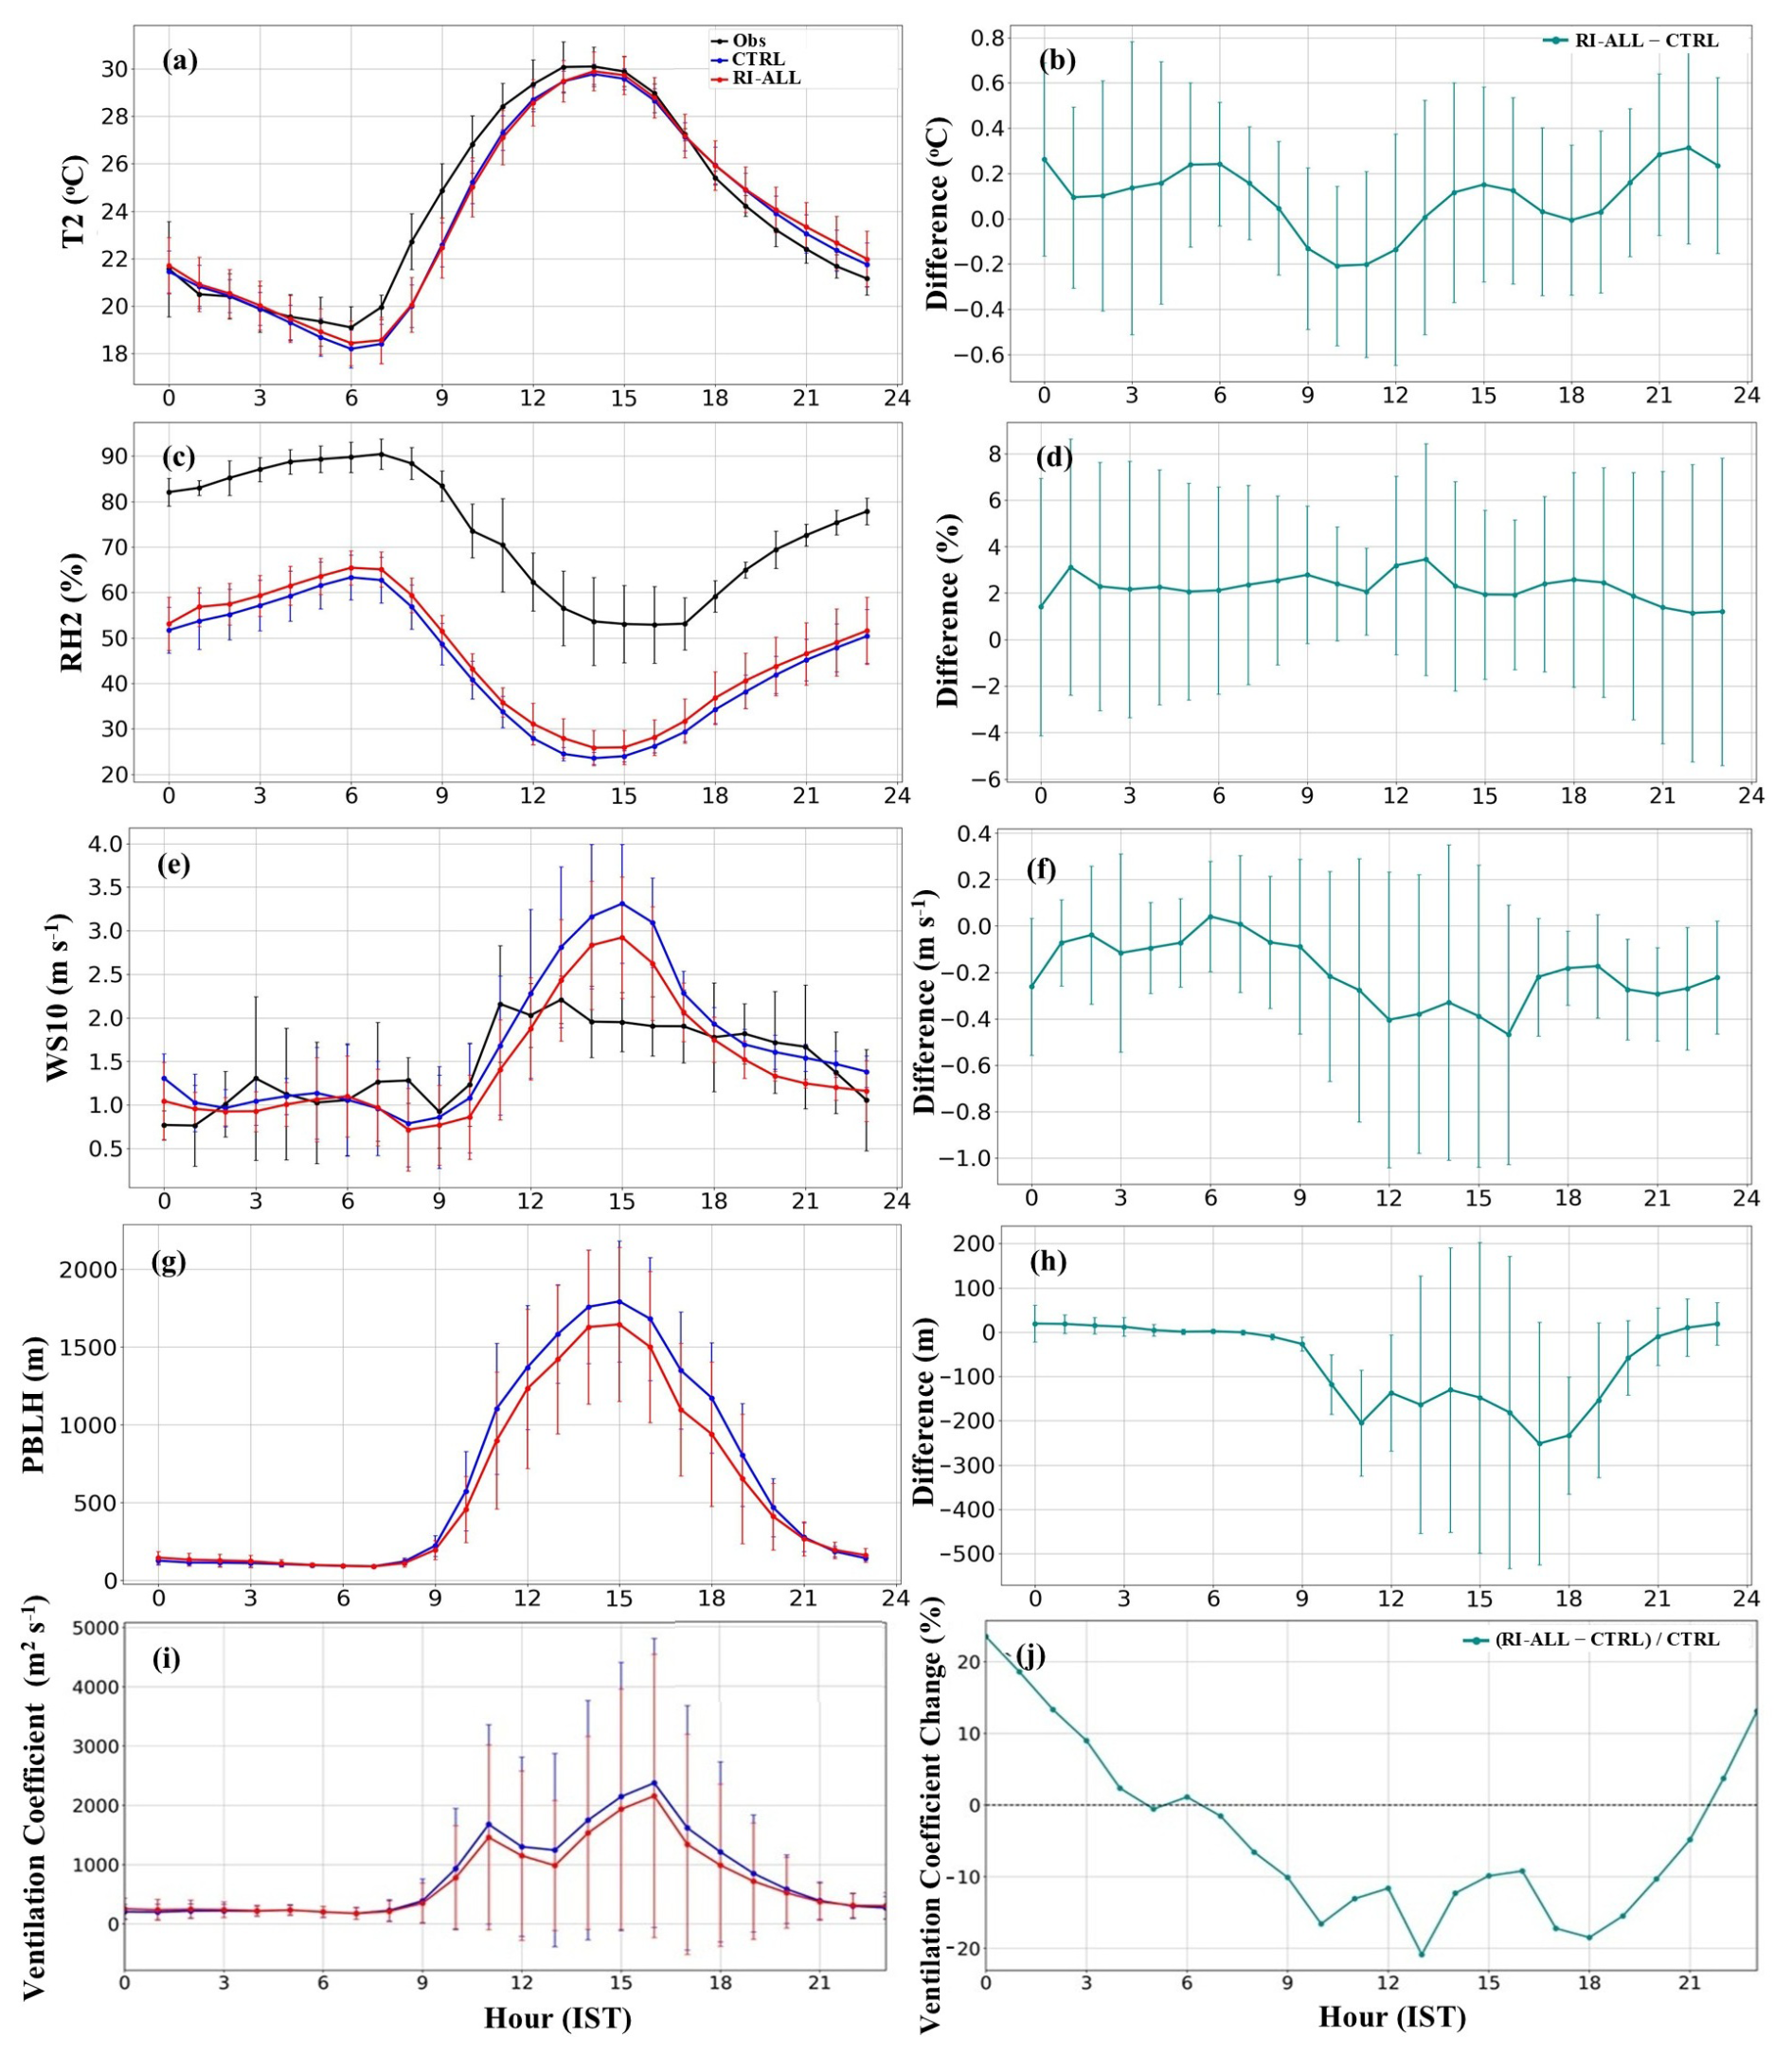
Figure 5Diurnal cycle of simulated meteorological parameters in CTRL and RI-ALL along with observations, and changes in RI-ALL with respect to CTRL averaged over Delhi for Event-I under clear-sky: (a, b) for T2, (c, d) for RH2, (e, f) for WS10, (g, h) for PBLH, and (i,j) for ventilation coefficient.
3.3 Effects of the modified aerosol optical properties on meteorological parameters
We now examine the impacts of modified optical properties of aerosols on the meteorological parameters mainly through the direct radiative interaction and the fast-atmospheric response to those. We compare the impacts on the near-surface temperatures (T2), relative humidity (RH2) levels, wind speeds (WS10), and the simulated planetary boundary layer height (PBLH). We compare the simulated values with the corresponding measurements carried out at the WiFEX measurement site at the IGI Airport, New Delhi in Fig. 5. Figure 5a, c, e, and g, depict the comparisons between the meteorological parameters simulated by CTRL and RI-ALL configurations, and the measurements, for the Event-I. Figure 5b, d, f, and h, show the impacts of modified optical properties of aerosols on the simulated meteorological parameters in the model. For T2, it may be seen that both the model configurations underestimate the temperatures during the pre-noon hours and overestimate those in the afternoon through early midnight hours. The modification in the optical properties results in the reduction of surface temperatures by 0.2 °C in the morning hours, while the post-noon enhancements in temperatures also reach up to 0.3 °C. The late morning reduction in the temperatures is expected, as the more optically thick aerosol mixture in the RI-ALL configuration scatters and absorbs more incoming shortwave radiation than that in the CTRL configuration, thus resulting in surface-cooling. However, the temperature response remains small and changes sign during different times of the day. While the reduction in SWDOWN tends to cool the surface, the simultaneous decrease in PBLH (Fig. 5h) may reduce turbulent mixing and modifies the redistribution of heat within the near-surface layer, partially offsetting the radiative cooling. Consequently, the net impact on T2 remains modest, with differences generally within ±0.3 °C throughout the day. The corresponding RMSE values are 1.43 and 1.59 °C for CTRL and RI-ALL, respectively (Table S4). As a consequence of reducing the surface temperature during the daytime, the RH2 values are seen to be higher in the RI-ALL configuration vis-a-vis CTRL case. On an average the changes in RH2 are ∼2 %–4 %. Nevertheless, the simulated RH2 values are much lesser compared to the measurements. One of the reasons behind this underestimation in RH could be related to the drier soil moisture levels in the model, as shown by Parde et al. (2022). The changes in WS10 due to the modified optical properties of aerosols are however relatively higher and sustained morning through evening. On an average, the winds are found to be calmer in the RI-ALL configuration vis-a-vis CTRL. The maximum reductions of around 0.4 m s−1 are seen to be during the 12:00–16:00 LT with the mean winds in the CTRL configuration around 2.5–3.25 m s−1. Thus, the near-surface winds are seen to be slowing down by ∼12 %–16 %, throughout the day, with maximum changes during the afternoon hours. This in turn also results in better agreements with the observations in comparison with the CTRL run. For WS10, the MB, RMSE, NMSE, and the FB are 0.20 (0.01) m s−1, 0.83 (0.75) m s−1, 0.283 (0.262), and 0.115 (−0.01) for the CTRL (RI-ALL) experiment (Table S4).
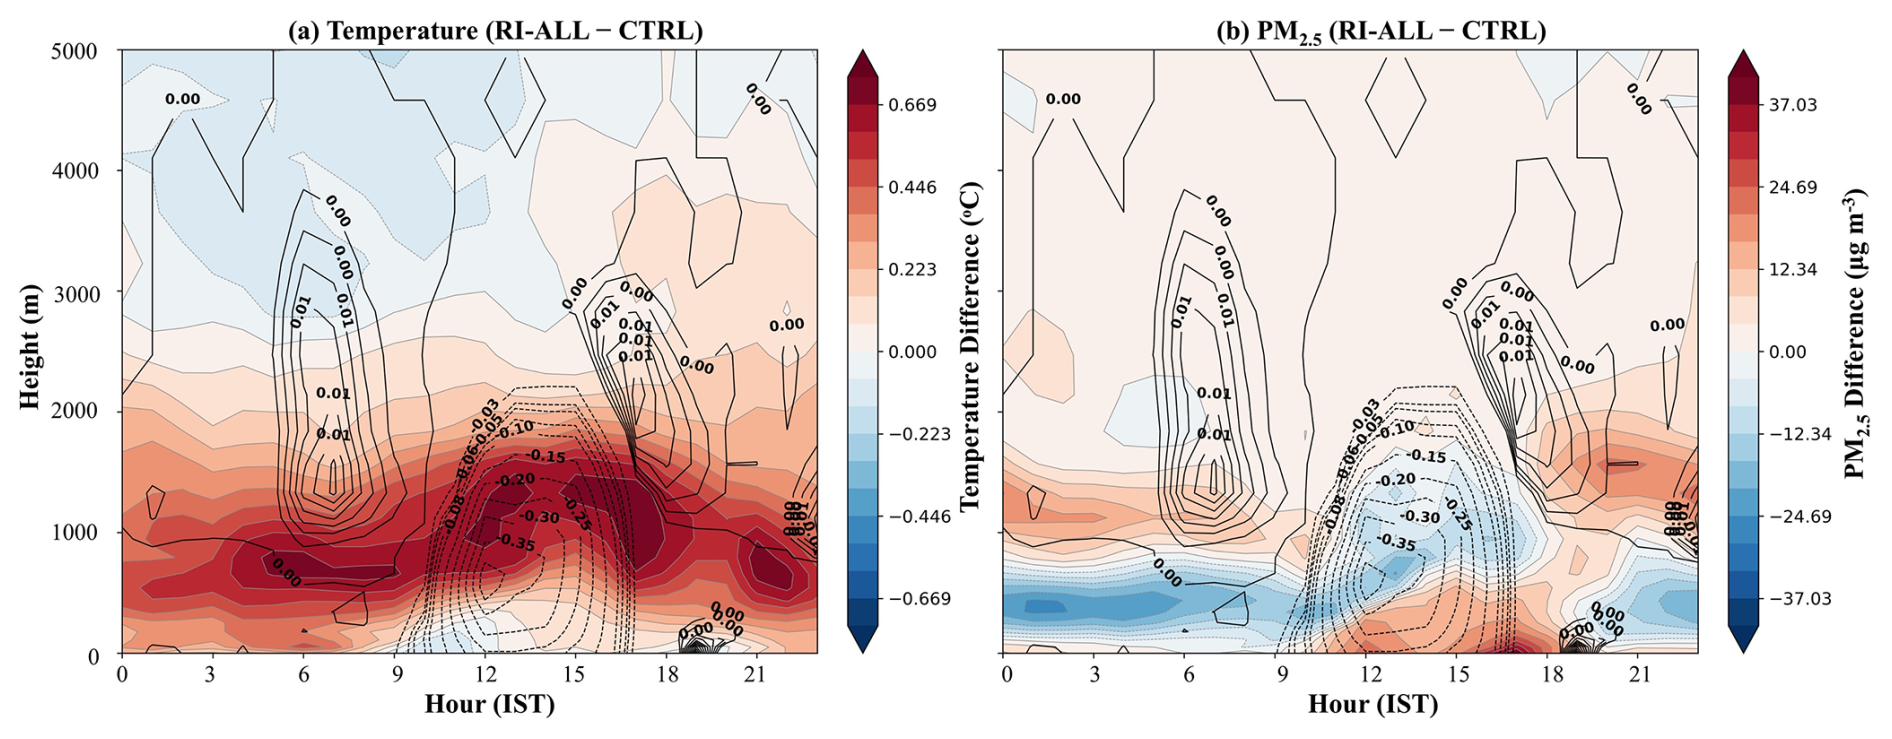
Figure 6Mean diurnal time–height cross-sections over Delhi showing the differences in (a) temperature (°C) and (b) PM2.5 concentration (µg m−3) between the RI-ALL and CTRL simulations during Event-I. Filled contours represent the differences (RI-ALL−CTRL) in temperature and PM2.5 concentration. Black contours denote differences in turbulent kinetic energy (TKE; m2 s−2), with solid contours indicating positive differences and dashed contours indicating negative differences.
As a result of the reduction in surface radiative heating due to enhanced aerosol extinction, together with weaker near-surface wind speeds, the boundary layer turbulence is also expected to be reduced in RI-ALL configuration. The PBLH which represents the height of the turbulence in the planetary boundary layer is seen to be reduced in the RI-ALL configuration vis-a-vis CTRL. Observational estimates of PBLH were not available for the study period for validation. The mean reductions in the simulated PBLH are seen to be around 100–200 m during the afternoon hours, with as high as 200–300 m during the late afternoon hours (∼17:00–18:00 IST), which are ∼15 %–20 % of PBLH in CTRL configuration. Thus, the modified optical properties suppress the boundary-layer turbulence by increasing stability, thereby weakening vertical mixing and reducing the transport of near-surface aerosols into the overlying atmosphere.
To further investigate the dynamical response of the boundary layer, Fig. 6 presents the mean diurnal time–height differences in temperature, PM2.5, and turbulent kinetic energy (TKE) between the RI-ALL and CTRL simulations for the Event-I. The modified aerosol optical properties produce a pronounced daytime reduction in TKE indicated by contours during the boundary-layer growth period (approximately 10:00–17:00 IST), with the largest negative differences (−0.20 to −0.35 m2 s−2) confined below ∼1.5 km a.g.l. These reductions coincide with warming between approximately 700 and 1500 m along with surface cooling (up to ∼500 m height) and enhanced the PM2.5 concentrations within the lower boundary layer. Together with the reduced surface heating caused by enhanced aerosol extinction, the elevated warming strengthens atmospheric stability and suppresses buoyancy-driven turbulence. Consequently, the daytime mixed layer becomes shallower, vertical transport is weakened, and pollutants are more efficiently confined within the lower atmosphere, favouring the accumulation of PM2.5 near the surface. However, a positive TKE (max. ∼0.02 m2 s−2) during the early morning and nighttime hours above 1 km may have locally destabilised the atmosphere which resulted in deprived PM2.5 concentrations between approximately 100 and 700 m height and the formation of a residual PM2.5 layer between 1 to 2 km.
The changes in the gradient Richardson number (Fig. S5) further supports the mechanism of the stability of the atmosphere. During the daytime, the CTRL simulation exhibits a layer of relatively low R (R<0.25) within the growing boundary layer, indicating dynamically unstable conditions favourable for turbulent mixing due to solar heating. In contrast, the RI-ALL simulation exhibits substantially larger R over the same period, particularly below about 1 km a.g.l. due to reduction in SWDOWN, indicating a more stable boundary layer. The positive R differences are consistent with enhanced atmospheric stability and suppressed turbulent mixing (Fig. S5c). The concurrent increase in R and decrease in TKE therefore provide independent dynamical evidence that the modified aerosol optical properties inhibit daytime boundary-layer development, leading to a shallower PBLH, weaker ventilation, and reduced vertical dispersion of aerosols. These results demonstrate that the impact of the modified aerosol optical properties extends beyond radiative cooling at the surface by altering the dynamical structure of the boundary layer, thereby reinforcing the positive aerosol–boundary layer feedback responsible for enhanced PM2.5 accumulation over Delhi.
A similar analysis of the impacts of the modified optical properties of aerosols on the meteorological parameters has been performed for the Event-II of extreme pollution. The results are shown in Fig. S6. Similar to the findings in Event-I during the late morning hours, the modification of aerosol optical properties results in colder near-surface temperatures (change of −0.2 °C in T2) for the Event-II too. The consequent enhancements (of 1 %–2 %) in RH are also noticed. Similarly, the wind speeds also seem to reduce by around 0.2 m s−1 in the modified configuration. The PBLH also shows a decline by 40–50 m in RI-ALL configuration vis-a-vis CTRL. It may be noticed that the changes in all the analysed meteorological parameters in the month of January are lesser compared to that in the month of November. As mentioned previously, this behaviour is primarily due to the lesser availability of solar radiation in the month of January, which reduces the magnitude of the impact that modified aerosols have on the radiation and thus limits the atmospheric response to the perturbations. Nevertheless, the nature and the sign of the impacts on meteorological parameters remains broadly similar to that in November.
The reduced winds speeds and boundary layer heights would result in reduced ventilation coefficient (VC) in the RI-ALL configuration vis-a-vis CTRL. The same has been verified in Fig. 5. The VC which is the product of PBLH and winds in the boundary layer, has been plotted for both the events, for CTRL as well as RI-ALL configuration (Figs. 5i and S6i). The changes in VC have also been plotted in Figs. 5j and S6j. Furthermore, the VC maximizes during the afternoon hours mainly due to higher boundary layer heights owing to the well-mixed boundary layer. Conversely, the lowest values of VC are noticed during the evening to early morning hours (Figs. 5i and S6i) due to shallow boundary layer and calmer winds. It may be noted that the VC in the “RI-ALL” is consistently lower compared to that in the CTRL configuration, especially during the sunlit hours and even after sunset. The mean reductions are up to 20 % in the month of November (Event-I), and up to 10 %–12 % in the month of January (Event-II). The maximum changes are expectedly seen during the sunlit hours, while they are less in magnitude and/or in relative terms during the night hours.
3.4 Effects of the modified aerosol optical properties on the near-surface PM2.5 mass concentrations
As discussed above, the enhanced aerosol extinction increases the daytime atmospheric stability, suppresses TKE, and reduces the boundary layer depth. These dynamical changes weaken the VC, which governs the near-surface concentration of aerosols (Govardhan et al., 2015). Therefore, one would expect enhanced accumulation of PM2.5 in the RI-ALL simulation. The higher (lower) values VC signifies greater (reduced) horizontal advection and vertical mixing of aerosols in the atmosphere. As shown in Fig. 5, VC in the RI-ALL configuration is reduced throughout the sunlit hours of the day, one would expect a consequent increase in the near-surface mass concentrations of PM2.5 in the model. To confirm that, we have examined the near-surface mass concentrations of PM2.5 in both the configurations and for both the events in Fig. 7.
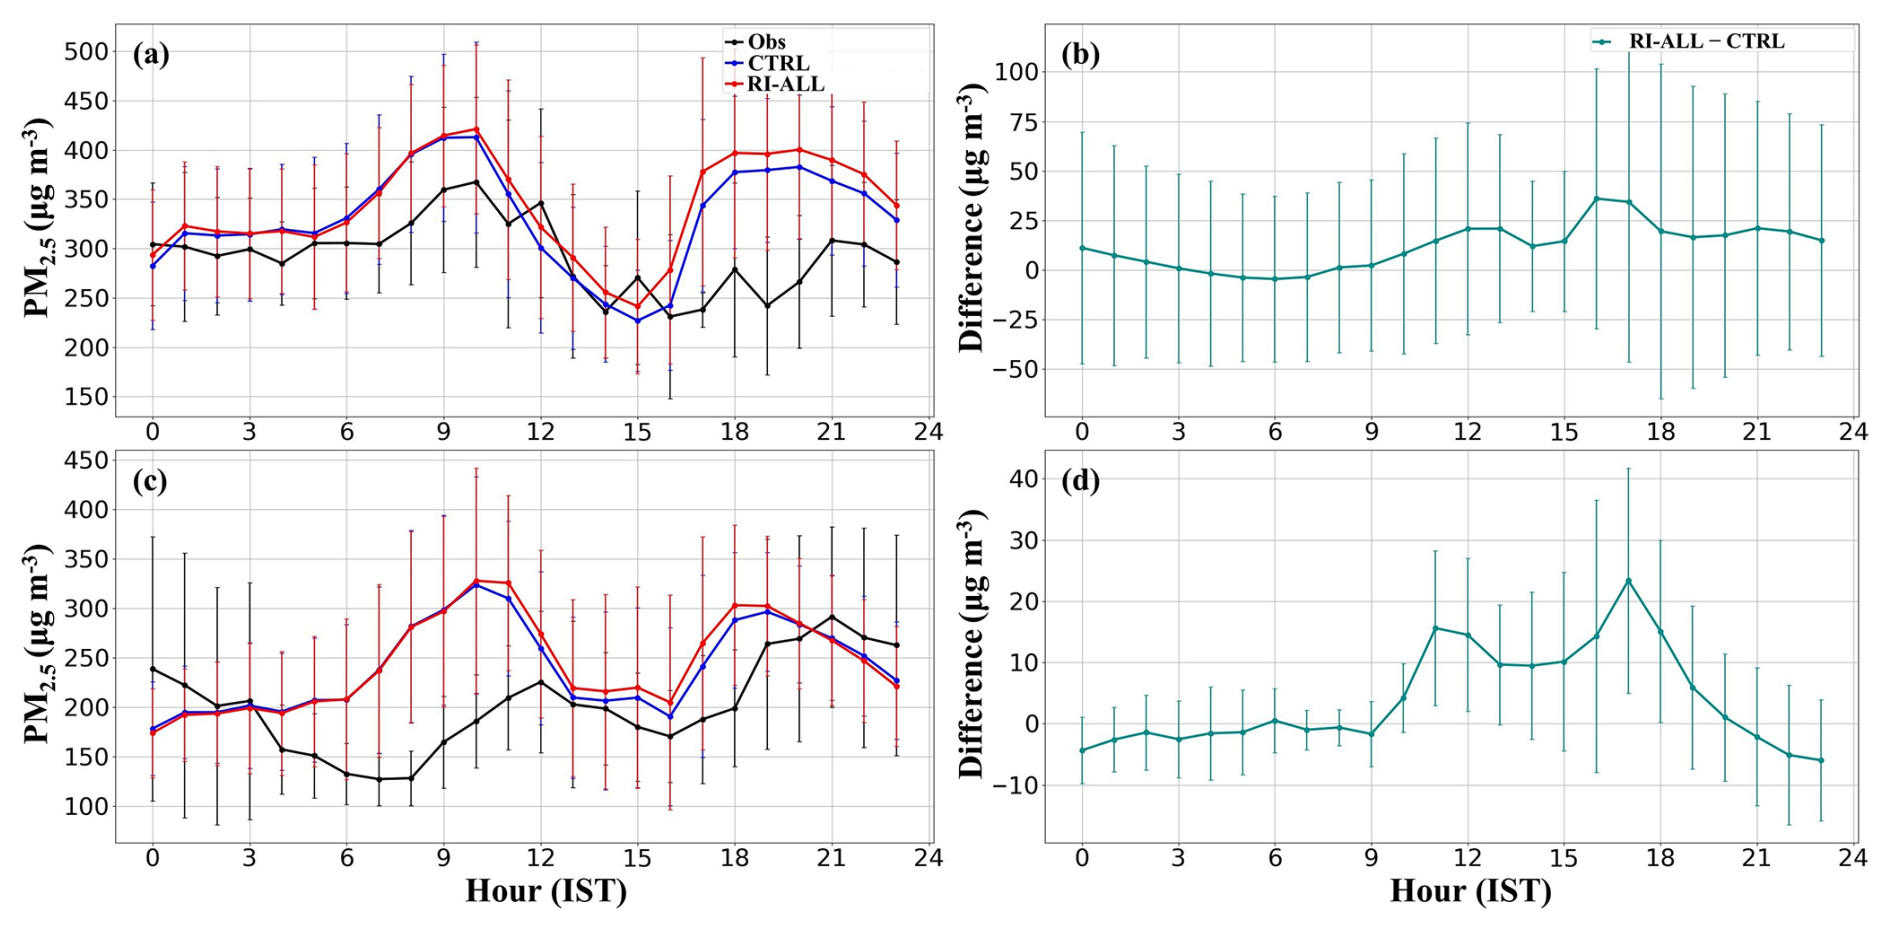
Figure 7Diurnal cycle of averaged simulated PM2.5 mass concentrations in CTRL and RI-ALL along with observations and changes in RI-ALL with respect to CTRL: (a, b) for Event-I, and (c, d) for Event-II under clear-sky over Delhi.
It may be seen that the PM2.5 indeed increases in RI-ALL configuration vis-a-vis CTRL. The mean changes are seen to be the highest during the afternoon hours. On average, the maximum changes during the polluted events are ∼37–40 µg m−3 for the November-event and ∼25 µg m−3 during the January-event. For the Event-I, the mass concentrations show enhancements throughout the day barring minor reductions during some late-night to early morning hours. On the other hand, for the Event-II, the increments in PM2.5 are seen only during the period of 10:00 to 20:00 LT. Nevertheless, during the sunlit hours the mass concentrations of PM2.5 show expected enhancements.
3.5 Effects of modified optical properties of aerosol: monthly-mean picture
To examine the effects of the modifications in the optical properties of aerosols on meteorological as well as aerosol related parameters on a longer timescale, we carried out four month-long simulations (for domain d01 and d02) of WRF-Chem for the months of October, November, December of 2023 and January 2024, in CTRL, and all other sensitivity configurations. The clear-sky impacts of modifications in optical properties of individual aerosol species and that of the all species put together on the surface reaching SWDOWN from domain d01 and d02 are shown in Figs. S7 and S8. Similar to that for the extreme pollution events, the impacts of modified optical properties of dust aerosols alone have minimal effect on SWDOWN. This is partly due to the fact that the period under consideration in this study is mainly post-monsoon and winter, which has relatively slower winds and humid conditions, thus lesser long-range transport of mineral dust from the deserts of Thar and Arabia to Delhi. This limits the concentrations of mineral dust over this region vis-a-vis the pre-monsoonal months of March to May. Moreover, as shown in Table 1, even after modification, the imaginary part of the RIs of dust is still much lesser than that for BC or OC, hence the consequent impacts of the modification in mineral dust RI as minimal.
The SWDOWN reduces by as high as ∼12 W m−2 at the noon time, across all the months barring November, due to the changes in the RI of OC and BC individually. For November, the corresponding changes are approximately twice (∼25 W m−2) of that for the other months. This is mainly due to the enhanced concentrations of these aerosol species in November mainly owing to the agricultural burning activities that occur predominantly in the neighbouring states of Punjab and Haryana in north-western India. The maximum impacts of the modifications in RIs of all aerosols crosses 25 (37) W m−2 for October, December, and January (November). As shown previously also, the noontime impacts of ARI on the SWDOWN at surface go as high as 80–100 W m−2 for October, December, and January, while that for November goes beyond 120 W m−2. Therefore, as shown for the pollution episodes, the impacts of modifications in the RIs of aerosols are around to of the total impacts of aerosols on radiation in clear-sky conditions in WRF-Chem, even on monthly-mean timescales. Thus, the modifications induce substantial changes in the total ARI in WRF-Chem over this region. It is noteworthy that results from the coarser domain (d01; 10 km resolution) do not differ significantly from those of the finer domain (d02; 2 km resolution). A detailed comparison of simulated SWDOWN for sensitivity experiments of modified RIs of chemical species as mentioned in Table 2 across all months under clear-sky conditions is provided in the Supplement (Tables S7 and S8) for the domains d01 and d02.
Comparison with WiFEX observed shortwave fluxes for December 2023 and January 2024 further demonstrates improvement in model performance. Under clear-sky (non-foggy/cloudy) conditions, the mean SWDOWN bias is substantially reduced in the RI-ALL configuration relative to CTRL (Table S9). In December, the mean bias decreased from 10.53 to 3.96 W m−2, corresponding to a reduction of approximately 62 %, while the RMSE decreased by ∼9 %. In January, it decreased from 23.63 to 15.26 W m−2 (∼35 % reduction), accompanied by a reduction in RMSE of ∼12 %. These reductions demonstrate that improved representation of ARI through revised aerosol optical properties enhances model skill.
The associated impacts of the modified RIs of aerosols on the meteorological parameters as well as PM2.5 concentrations on the monthly-mean time scales are tabulated in Table S10. The monthly-mean SWDOWN in RI-ALL configuration is lesser than the CTRL configuration for all the months by around 8–20 W m−2. The numbers are expectedly smaller than the noon-time maximums shown in Fig. S7. The resultant changes in T2 are also evident especially for the months of December and January, albeit with subdued values. The mean RH2 in the model shows greater changes (5 %–10 %) in the months of December and January, while showing changes of ∼2 %–3 % in October and November. The near-surface wind speeds (WS10) show a reduction on a monthly-mean basis. Similarly, the monthly-mean PBLH depicts a reduction across all the months upon modification in the RIs. The consequent changes in the monthly-mean near-surface PM2.5 mass concentrations are also evident, though smaller in magnitudes.
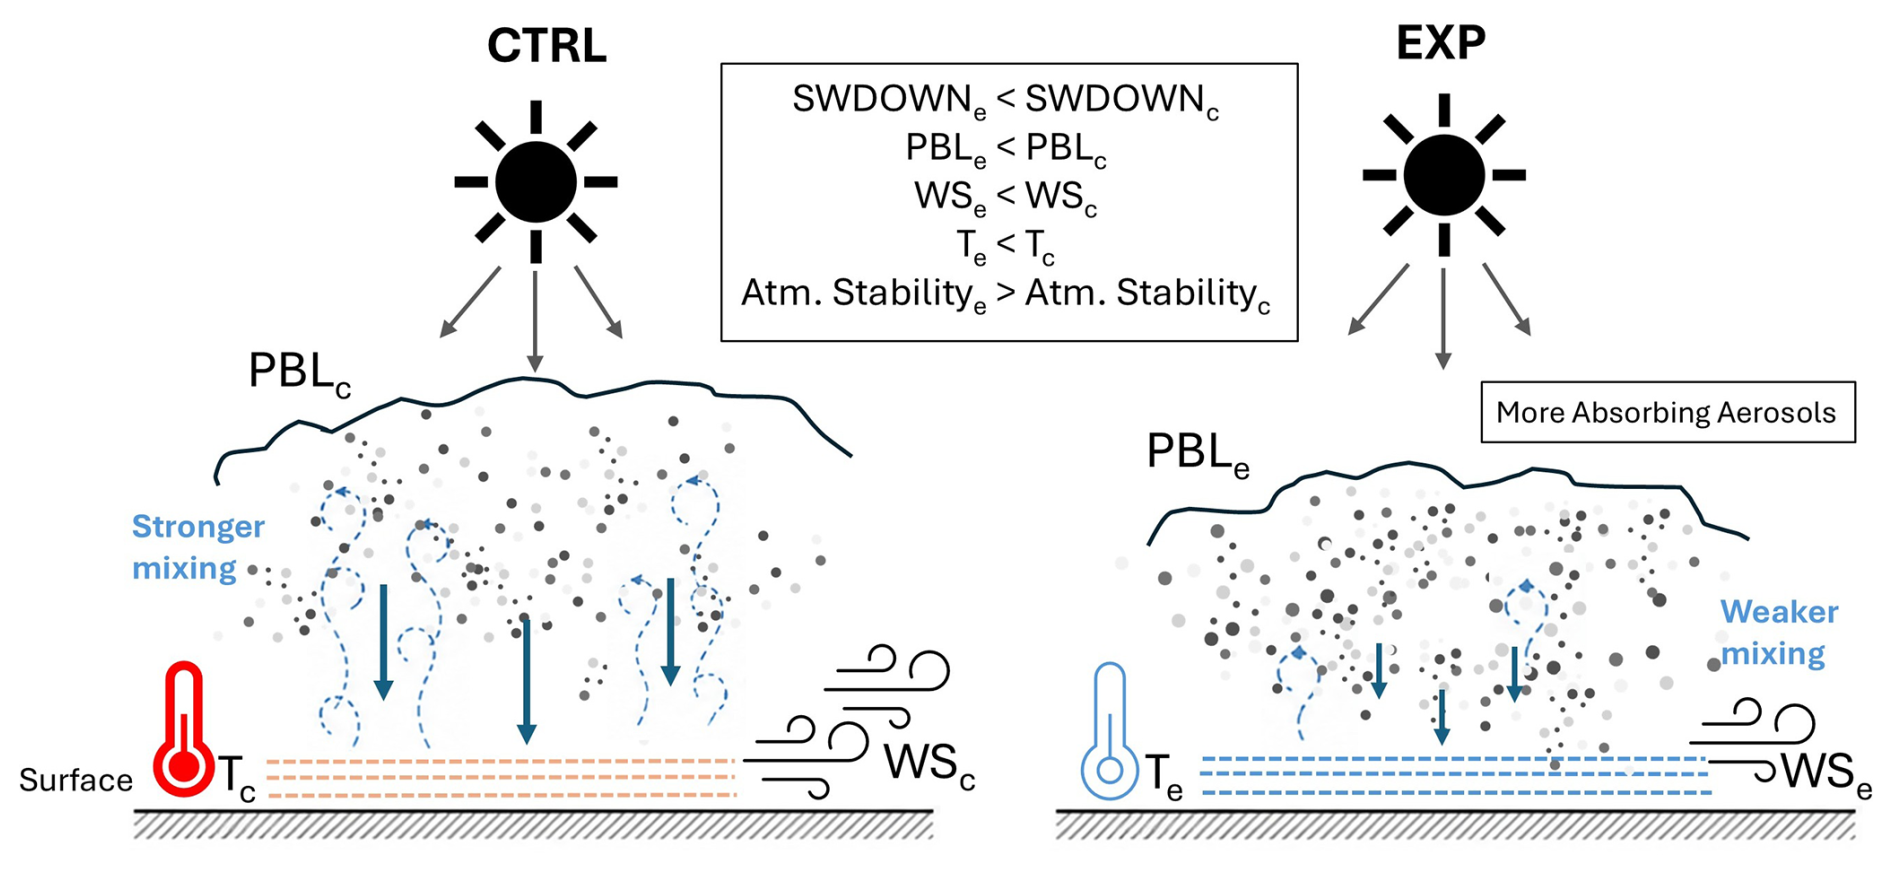
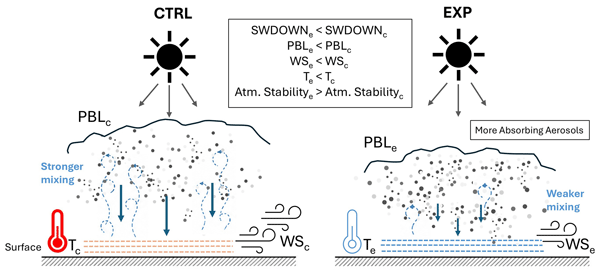
Figure 8Schematic of physical mechanism explaining the impacts of realistic optical properties on meteorological parameters. Here, c denotes CTRL and e denotes EXP e.g., RI-ALL.
The overall impacts of the modified aerosol optical properties in this study are summarized schematically in Fig. 8. The implementation of more realistic and optically stronger aerosol species enhances the extinction of incoming solar radiation, thereby reducing the downwelling shortwave radiation reaching the surface. The resulting increase in atmospheric heating and decrease in surface heating weakens buoyancy production within the planetary boundary layer, leading to increased atmospheric stability. The enhanced stability suppresses turbulent kinetic energy and weakens vertical turbulent mixing, resulting in a shallower planetary boundary layer together with reduced near-surface wind speeds. Consequently, the ventilation of pollutants is diminished, promoting the accumulation of PM2.5 within the lower atmosphere. The increased aerosol loading further enhances the extinction of incoming solar radiation, thereby reinforcing the suppression of boundary-layer mixing and establishing a positive aerosol–boundary layer feedback. This feedback mechanism is consistent with previous studies that have demonstrated the role of absorbing aerosols in stabilizing the lower atmosphere, suppressing boundary-layer development, and aggravating severe air pollution episodes (Ding et al., 2016; Sharma et al., 2023; Stjern et al., 2023). In the present study, this feedback is initiated through the implementation of updated and more realistic aerosol optical properties, highlighting the importance of accurately representing aerosol refractive indices in aerosol–radiation interaction calculations.
The revised optical properties of aerosols in WRF-Chem result in optically thicker and more absorbing aerosols. They in-turn reduce the downwelling shortwave radiation reaching the surface, thus showing better agreements with the corresponding observations. The reduced surface heating enhances atmospheric stability, suppresses turbulent kinetic energy, and weakens boundary-layer development. Consequently, the planetary boundary layer becomes shallower, near-surface winds weaken, and the ventilation of pollutants is reduced, leading to enhanced daytime surface PM2.5 concentrations. These enhancements are particularly important for the AIRWISE system, as the system-simulated PM2.5 shows a rapid decline during the sunlit hours, and misses the morning-time concentrations (Ghude et al., 2024; Sengupta et al., 2022). The model seems to over-ventilate the pollutants. In fact, AIRWISE better captures the night-time peaks in PM2.5 concentrations, however mainly due to its inability in capturing the morning time concentrations, the simulated AQI, which is calculated on the basis of 24 h-running-mean values of PM2.5, shows mis-match vis-a-vis observed AQIs. Therefore, the modifications in the optical properties are expected to improve the performance of the AIRWISE system in capturing the AQI and provide improved warnings to the policymakers about forthcoming air pollution episodes.
As noticed in Fig. 3, the bias in the simulated SWDOWN vis-a-vis the observations still exist. One of the major parameters that can reduce the bias would be the urban morphology. The WRF-Chem model employed in this study and that used in the AIRWISE system does not include urban morphology in its formulation. The urban structures reflect and absorb the direct as well as diffused sunlight and thus reduce SWDOWN reaching the surface. Therefore, lack of urban structures in the model may have resulted in the overestimation of SWDOWN at the surface. The simulated surface temperatures still are biased vis-a-vis the observations. In addition to the urban morphology, this behaviour of the model may also be linked with the soil moisture levels. It has been shown previously that WRF tends to have biases in the simulated soil moisture in northern-India especially in post-monsoon to winter months (Parde et al., 2022). The latest land-use land category data along with the correct information about the extent of irrigation in the fields may improve the simulated soil-moisture and thus the near-surface temperatures in the model. One of the other limitations of this study is related to the lack of observational data for the solar radiation measurements. Currently, the data available over the WiFEX observational site has been used; however, more such data locations are needed to validate our findings. Unfortunately, due to lack of systematic in dataset for radiative fluxes especially over the NCR, the study had to be limited to only one observational location. In future, it is recommended that a network of sites with radiation measurements needs to be established to further strengthen the model.
It has been shown that even after modifying the optical properties of aerosols, the model still shows biases for the simulated near-surface PM2.5 mass concentrations. It may be noted that the emission inventory used in this study as well as in the AIRWISE system is old and it needs update keeping in mind the technological as well as administrative changes that have occurred over the study domain in the last few years. Moreover, instead of having a static emissions inventory, it will be useful to employ the dynamic emissions inventory in the model which dynamically estimates the emissions based on real-time capture of vehicular traffic, construction and demolition activities, waste burning and other related activities. As noticed in our analysis, one of the major uncertainties in the aspect of emissions of particulate pollutants exists in the agricultural burning related emissions. The exact timing of the farm fires, the locations, the amount of the crop residue being burnt, and subsequent emissions of pollutants generated from the farm fires contribute to the overall uncertainty in the estimates as discussed by Ambulkar et al. (2025). It has also been shown by Ghude et al. (2024) that the system mainly shows less skill in the month of November when the farm fires are at their peak, thus underscoring their impact on the simulations. The use of burnt area indices from a very high-resolution satellite-data base like Sentinel-2, instead of fire count information may assist in better capture of the fire locations. Further, the chemical mechanism used in the WRF-Chem model for AIRWISE purposes, is rather simple and lacks comprehensive treatment to secondary organic aerosols or some of the secondary inorganic aerosols (like nitrates) too. In addition, the GOCART aerosol module employed in the present study uses a bulk aerosol representation and does not explicitly resolve aerosol size distributions and mixing states. More advanced sectional aerosol schemes, such as Model for Simulating Aerosol Interactions and Chemistry (MOSAIC), provide a more detailed treatment of aerosol microphysics, gas-particle partitioning, and secondary aerosol formation, and have been successfully coupled with the MOZART chemistry mechanism in WRF-Chem. The use of such schemes may improve the representation of aerosol composition, size distributions, and optical properties, particularly during severe pollution episodes over northern India. However, it should be noted that uncertainties associated with aerosol refractive indices are not unique to the GOCART aerosol module. In WRF-Chem, aerosol optical properties are calculated using aerosol refractive indices irrespective of the aerosol representation employed. Therefore, although the quantitative response may vary depending on the aerosol scheme, the need for realistic refractive indices and the resulting sensitivity of aerosol–radiation interactions are expected to be relevant across different WRF-Chem aerosol modules. In future, fast chemical parameterization for the inclusion of these species may be exercised. Additionally, to improve the performance of the model in simulating the composition of PM2.5, more measurements of the chemical composition may be carried out in areas of heavy pollution.
Air pollution remains one of the most critical environmental challenges over northern India, particularly during the post-monsoon and winter seasons when stagnant meteorological conditions, biomass burning, and enhanced aerosol loading frequently lead to severe pollution episodes. Accurate forecasting of such extreme air quality events is essential for policymakers and public health authorities to mitigate population exposure and implement timely emission-control strategies.
The Air Quality Warning and Integrated Decision Support System for Emissions (AIRWISE), developed through a collaborative effort between the Indian Institute of Tropical Meteorology (IITM), the India Meteorological Department (IMD), and the National Center for Atmospheric Research (NCAR), has been operational since 2018 and provides real-time air quality forecasts across India. Despite its operational success, the system exhibits limitations in reproducing extreme pollution loading events over northern India, particularly over Delhi during the crop-residue (stubble) burning season in the surrounding states. These high-impact episodes are often underestimated partly due to inaccuracies in representing aerosol–radiation–meteorology interactions. Improving the representation of meteorological feedback processes is therefore crucial for enhancing forecast skill. Among these processes, shortwave radiation plays a pivotal role in governing boundary layer evolution, surface energy balance, atmospheric stability, and pollutant dispersion. In many numerical weather and chemistry models, aerosol optical properties are prescribed using globally averaged values, which may not adequately represent the complex and highly absorbing aerosol mixtures characteristic of northern India. Such simplifications introduce biases in surface radiation fluxes, subsequently affecting boundary layer dynamics and pollutant accumulation.
This study demonstrates that incorporating updated and more realistic aerosol optical properties, such as observed refractive indices of dominant chemical species, significantly improves the simulation of surface shortwave radiation, reducing flux biases by 25–37 W m−2 on monthly scales and by up to ∼80 W m−2 during severe polluted episodes. The revised aerosol–radiation interaction modifies the surface energy budget, decreasing surface temperature (∼0.2 °C), near-surface wind speed (∼0.4 m s−1), and planetary boundary layer height (∼200 m), while increasing daytime relative humidity by 3 %–4 % under polluted conditions (PM2.5>400–550 µg m−3), thereby enhancing the model's ability to reproduce high surface pollutant concentrations (20–40 µg m−3) during extreme events. This surface cooling, together with atmospheric heating induced by more absorbing aerosols, suppresses buoyancy within the boundary layer and enhances atmospheric stability. These improvements highlight the importance of using locally constrained aerosol optical parameters rather than relying on global averages in regions with complex aerosol compositions.
However, to extend and generalize these findings across the broader Indian region, additional surface radiation measurements are required. Expanded observational coverage would enable more robust model validation, reduce uncertainties in aerosol optical parameterization, and further enhance the predictive capability of operational air quality forecasting systems such as AIRWISE.
| Acronym | Description |
| AF | Asymmetric Factor |
| a.g.l. | Above Ground Level |
| AIRWISE | Air Quality Warning and Integrated Decision Support System for Emissions |
| AOD | Aerosol Optical Depth |
| ARI | Aerosol-Radiation Interaction |
| AQI | Air Quality Index |
| AWS | Automated Weather Stations |
| BC | Black Carbon |
| BC1 | Hydrophobic BC |
| BC2 | Hydrophilic BC |
| CAM | Community Atmosphere Model |
| CRTM | Community Radiative Transfer Model |
| CPCB | Central Pollution Control Board |
| CTRL | Control Run |
| d01 | Outer Domain |
| d02 | Inner Domain |
| DPCC | Delhi Pollution Control Committee |
| Dust1 | Dust with effective radii of 0.5 µm |
| Dust2 | Dust with effective radii of 1.4 µm |
| ECMWF | European Centre for Medium-Range Weather Forecast |
| EDGAR-HTAP | Emission Database for Global Atmospheric Hemispheric Transport of Air Pollution |
| ERA5 | ECMWF Fifth Generation Reanalysis |
| FB | Fractional Bias |
| FINN | Fire Inventory from NCAR |
| GOCART | Goddard Chemistry Aerosol Radiation and Transport |
| HrDEI | High-resolution Delhi Emission Inventory |
| IGBP | International Geosphere-Biosphere Programme |
| IGI | Indira Gandhi International |
| IGP | Indo Gangetic Plains |
| IITM | Indian Institute of Tropical Meteorology |
| IMD | India Meteorological Department |
| IST | Indian Standard Time |
| LAC | Light Absorbing Carbon |
| LT | Local Time |
| MB | Mean Bias |
| MEGAN | Model for Emissions of Gases and Aerosol from Nature |
| MODIS | Moderate Resolution Imaging Spectroradiometer |
| MOSAIC | Model for Simulating Aerosol Interactions and Chemistry |
| MOZART | Model for Ozone and Related Tracers |
| MYNN | Mellor-Yamada Nakanishi and Niino |
| NCAR | National Center for Atmospheric Research |
| NCR | National Capital Region |
| NMSE | Normalized Mean Square Error |
| No-ARF | Experiment with No Aerosol-Radiation Feedback |
| NWP | Numerical Weather Prediction |
| OC | Organic Carbon |
| OC1 | Hydrophobic OC |
| OC2 | Hydrophilic OC |
| P25 | Other GOCART Primary PM2.5 |
| PBLH | Planetary Boundary Layer Height |
| PM2.5 | Particulate Matter of Diameter 2.5 µm or less |
| R | Richardson Number |
| RH2 | Relative Humidity at 2 m |
| RI | Refractive Index |
| RI-ALL | Experiment with Modified Refractive Index of Dust, BC, OC, and P25 |
| RI-BC | Experiment with Modified Refractive Index of BC only |
| RI-DUST | Experiment with Modified Refractive Index of Dust only |
| RI-OC | Experiment with Modified Refractive Index of OC only |
| RMSE | Root Mean Square Error |
| RRTMG | Rapid Radiative Transfer Model for Global |
| SAFAR | System of Air Quality and Weather Forecasting and Research |
| SEAS1 | Sea-Salt with effective radii of 0.3 µm |
| SEAS2 | Sea-Salt with effective radii of 1.0 µm |
| SSA | Single Scattering Albedo |
| SWDOWN | Downward Shortwave Radiation |
| T2 | Temperature at 2 m |
| TKE | Turbulent Kinetic Energy |
| VC | Ventilation Coefficient |
| WiFEX | Winter Fog Experiment |
| WRF | Weather Research and Forecasting |
| WRF-Chem | WRF coupled with Chemistry |
| WS10 | Wind Speed at 10 m |
| WSM6 | WRF Single-Moment 6-class |
The WRF-Chem model source code is publicly available from the National Center for Atmospheric Research (NCAR) at https://www2.mmm.ucar.edu/wrf/users/download/get_source.html (last access: 10 September 2026). WiFEX 2023–2024 observational datasets are available at https://ews.tropmet.res.in/wifex/observations.php (last access: June 2026). Surface PM2.5 observations were obtained from the Central Pollution Control Board (CPCB) Central Control Room portal (https://airquality.cpcb.gov.in/ccr/#/repository/data, last access: 10 September 2026). The WRF-Chem model configuration files, modified module codes, simulations output and analysis scripts generated in this study are available from the corresponding author upon reasonable request. Data processing and visualization were performed using Python 3.13.5 (https://www.python.org/, last access: 10 September 2026) with standard scientific libraries and OriginPro 2024 software (OriginLab Corporation, https://www.originlab.com/, last access: 10 September 2026).
The supplement related to this article is available online at https://doi.org/10.5194/acp-26-13189-2026-supplement.
SK: Conceptualization, Methodology, Simulations, Model development, Software, Formal analysis, Investigation, Data curation, Visualization, Writing – original draft, Writing – review and editing. GG: Conceptualization, Methodology, Model development, Supervision, Visualization, Writing – review and editing. SD: Simulations, Methodology, Formal analysis, Validation. ANP: Methodology, Simulations, Writing – review and editing. SW: Data curation, Technical support. JD: Model development, Software, Writing – review. SDG: Conceptualization, Supervision, Funding acquisition, Project administration, Writing – review and editing.
The contact author has declared that none of the authors has any competing interests.
Publisher's note: Copernicus Publications remains neutral with regard to jurisdictional claims made in the text, published maps, institutional affiliations, or any other geographical representation in this paper. The authors bear the ultimate responsibility for providing appropriate place names. Views expressed in the text are those of the authors and do not necessarily reflect the views of the publisher.
The authors sincerely acknowledge the Central Pollution Control Board (CPCB) and the Delhi Pollution Control Committee (DPCC) for providing the PM2.5 measurement data used for model evaluation. The numerical simulations were performed on the Pratyush supercomputing facility at the Indian Institute of Tropical Meteorology (IITM), Pune. We gratefully acknowledge the Director, IITM; the Director-General, India Meteorological Department (IMD), New Delhi; and the Head, National Centre for Medium-Range Weather Forecasting (NCMRWF), Noida, for their continued encouragement and institutional support, particularly during the Winter Fog Experiment (WiFEX) campaign. The Ministry of Earth Sciences (MoES), Government of India, is also acknowledged for sustained support of the campaign activities. We thank the Grandhi Mallikarjuna Rao (GMR) Group and the Airports Authority of India (AAI) for logistical support at Indira Gandhi International (IGI) Airport, New Delhi. Finally, we appreciate the handling editor and the anonymous reviewers for their constructive comments, which significantly improved the manuscript. This research work forms part of the PhD thesis of the first author.
This paper was edited by Gunnar Myhre and reviewed by two anonymous referees.
Adler, G., Riziq, A. A., Erlick, C., and Rudich, Y.: Effect of intrinsic organic carbon on the optical properties of fresh diesel soot, P. Natl. Acad. Sci. USA, 107, 6699–6704, https://doi.org/10.1073/pnas.0903311106, 2010.
Agnihotri, R., Mishra, S. K., Yadav, P., Singh, S., Rashmi, R., Prasad, M. V. S. N., Sharma, C., and Arya, B. C.: Bulk Level to Individual Particle Level Chemical Composition of Atmospheric Dust Aerosols (PM5) over a Semi-Arid Urban Zone of Western India (Rajasthan), Aerosol Air Qual. Res., 15, 58–71, https://doi.org/10.4209/aaqr.2013.08.0270, 2015.
Ambulkar, R., Govardhan, G., Gavhale, S., Kalita, G., Pande, C., Jat, R., Kulkarni, S., Khare, M., Attri, S. D., and Ghude, S. D.: Crop Residue Burning in North-Western India: Emission Estimation and Uncertainty Quantification, J. Geophys. Res.-Atmos., 130, e2024JD042198, https://doi.org/10.1029/2024JD042198, 2025.
Armour, K., Forster, P., Storelvmo, T., Collins, W., Dufresne, J.-L., Frame, D., Lunt, D., Mauritsen, T., Palmer, M., Watanabe, M., Wild, M., Zhang, H., Alterskjaer, K., and Smith, C.: The Earths energy budget, climate feedbacks, and climate sensitivity, in: AGU Fall Meeting Abstracts, U13B-07, 2021.
Baklanov, A., Schlünzen, K., Suppan, P., Baldasano, J., Brunner, D., Aksoyoglu, S., Carmichael, G., Douros, J., Flemming, J., Forkel, R., Galmarini, S., Gauss, M., Grell, G., Hirtl, M., Joffre, S., Jorba, O., Kaas, E., Kaasik, M., Kallos, G., Kong, X., Korsholm, U., Kurganskiy, A., Kushta, J., Lohmann, U., Mahura, A., Manders-Groot, A., Maurizi, A., Moussiopoulos, N., Rao, S. T., Savage, N., Seigneur, C., Sokhi, R. S., Solazzo, E., Solomos, S., Sørensen, B., Tsegas, G., Vignati, E., Vogel, B., and Zhang, Y.: Online coupled regional meteorology chemistry models in Europe: current status and prospects, Atmos. Chem. Phys., 14, 317–398, https://doi.org/10.5194/acp-14-317-2014, 2014.
Barnard, J. C., Fast, J. D., Paredes-Miranda, G., Arnott, W. P., and Laskin, A.: Technical Note: Evaluation of the WRF-Chem “Aerosol Chemical to Aerosol Optical Properties” Module using data from the MILAGRO campaign, Atmos. Chem. Phys., 10, 7325–7340, https://doi.org/10.5194/acp-10-7325-2010, 2010.
Bellouin, N., Quaas, J., Gryspeerdt, E., Kinne, S., Stier, P., Watson-Parris, D., Boucher, O., Carslaw, K. S., Christensen, M., Daniau, A.-L., Dufresne, J.-L., Feingold, G., Fiedler, S., Forster, P., Gettelman, A., Haywood, J. M., Lohmann, U., Malavelle, F., Mauritsen, T., McCoy, D. T., Myhre, G., Mülmenstädt, J., Neubauer, D., Possner, A., Rugenstein, M., Sato, Y., Schulz, M., Schwartz, S. E., Sourdeval, O., Storelvmo, T., Toll, V., Winker, D., and Stevens, B.: Bounding Global Aerosol Radiative Forcing of Climate Change, Rev. Geophys., 58, e2019RG000660, https://doi.org/10.1029/2019RG000660, 2020.
Bender, F. A.-M.: Aerosol Forcing: Still Uncertain, Still Relevant, AGU Adv., 1, e2019AV000128, https://doi.org/10.1029/2019AV000128, 2020.
Bond, T. C. and Bergstrom, R. W.: Light Absorption by Carbonaceous Particles: An Investigative Review, Aerosol Sci. Tech., 40, 27–67, https://doi.org/10.1080/02786820500421521, 2006.
Businger, J. A., Wyngaard, J. C., Izumi, Y., and Bradley, E. F.: Flux-Profile Relationships in the Atmospheric Surface Layer, J. Atmos. Sci., 28, 181–189, https://doi.org/10.1175/1520-0469(1971)028<0181:FPRITA>2.0.CO;2, 1971.
Chang, H. and Charalampopoulos, T. T.: Determination of the wavelength dependence of refractive indices of flame soot, P. Roy. Soc. Lond. A Mat., 430, 577–591, https://doi.org/10.1098/rspa.1990.0107, 1990.
Chen, F. and Dudhia, J.: Coupling an Advanced Land Surface–Hydrology Model with the Penn State–NCAR MM5 Modeling System. Part I: Model Implementation and Sensitivity, Mon. Weather Rev., 129, 569–585, https://doi.org/10.1175/1520-0493(2001)129<0569:CAALSH>2.0.CO;2, 2001.
Chen, Y. and Bond, T. C.: Light absorption by organic carbon from wood combustion, Atmos. Chem. Phys., 10, 1773–1787, https://doi.org/10.5194/acp-10-1773-2010, 2010.
Chin, M., Rood, R. B., Lin, S., Müller, J., and Thompson, A. M.: Atmospheric sulfur cycle simulated in the global model GOCART: Model description and global properties, J. Geophys. Res.-Atmos., 105, 24671–24687, https://doi.org/10.1029/2000JD900384, 2000.
Chou, M.-D. and Suarez, M. J.: A solar radiation parameterization for atmospheric studies, NASA/TM-1999-104606/VOL15, NASA Goddard Space Flight Center, Greenbelt, MD, USA, https://ntrs.nasa.gov/api/citations/19990060930/downloads/19990060930.pdf (last access: 10 September 2026), 1999.
Collins, W. D., Rasch, P. J., Boville, B. A., Hack, J. J., McCaa, J. R., Williamson, D. L., Kiehl, J. T., and Briegleb, B.: Description of the NCAR Community Atmosphere Model (CAM 3.0), NCAR Tech. Note NCAR/TN-464+STR, National Center for Atmospheric Research, Boulder, CO, USA, https://www2.mmm.ucar.edu/wrf/users/physics/phys_refs/SW_LW/CAM.pdf (last access: 10 September 2026), 2004.
Ding, A. J., Huang, X., Nie, W., Sun, J. N., Kerminen, V.-M., Petäjä, T., Su, H., Cheng, Y. F., Yang, X.-Q., Wang, M. H., Chi, X. G., Wang, J. P., Virkkula, A., Guo, W. D., Yuan, J., Wang, S. Y., Zhang, R. J., Wu, Y. F., Song, Y., Zhu, T., Zilitinkevich, S., Kulmala, M., and Fu, C. B.: Enhanced haze pollution by black carbon in megacities in China, Geophys. Res. Lett., 43, 2873–2879, https://doi.org/10.1002/2016GL067745, 2016.
Emmons, L. K., Walters, S., Hess, P. G., Lamarque, J.-F., Pfister, G. G., Fillmore, D., Granier, C., Guenther, A., Kinnison, D., Laepple, T., Orlando, J., Tie, X., Tyndall, G., Wiedinmyer, C., Baughcum, S. L., and Kloster, S.: Description and evaluation of the Model for Ozone and Related chemical Tracers, version 4 (MOZART-4), Geosci. Model Dev., 3, 43–67, https://doi.org/10.5194/gmd-3-43-2010, 2010.
Fast, J. D., Gustafson, W. I., Easter, R. C., Zaveri, R. A., Barnard, J. C., Chapman, E. G., Grell, G. A., and Peckham, S. E.: Evolution of ozone, particulates, and aerosol direct radiative forcing in the vicinity of Houston using a fully coupled meteorology-chemistry-aerosol model, J. Geophys. Res.-Atmos., 111, 2005JD006721, https://doi.org/10.1029/2005JD006721, 2006.
Friedl, M. A., McIver, D. K., Hodges, J. C. F., Zhang, X. Y., Muchoney, D., Strahler, A. H., Woodcock, C. E., Gopal, S., Schneider, A., Cooper, A., Baccini, A., Gao, F., and Schaaf, C.: Global land cover mapping from MODIS: algorithms and early results, Remote Sens. Environ., 83, 287–302, https://doi.org/10.1016/S0034-4257(02)00078-0, 2002.
Ghan, S., Laulainen, N., Easter, R., Wagener, R., Nemesure, S., Chapman, E., Zhang, Y., and Leung, R.: Evaluation of aerosol direct radiative forcing in MIRAGE, J. Geophys. Res.-Atmos., 106, 5295–5316, https://doi.org/10.1029/2000JD900502, 2001.
Ghude, S. D., Bhat, G. S., Prabhakaran, T., Jenamani, R. K., Chate, D. M., Safai, P. D., Karipot, A. K., Konwar, M., Pithani, P., Sinha, V., Rao, P. S. P., Dixit, S. A., Tiwari, S., Todekar, K., Varpe, S., Srivastava, A. K., Bisht, D. S., Murugavel, P., Ali, K., Mina, U., Dharua, M., Jaya Rao, Y., Padmakumari, B., Hazra, A., Nigam, N., Shende, U., Lal, D. M., Chandra, B. P., Mishra, A. K., Kumar, A., Hakkim, H., Pawar, H., Acharja, P., Kulkarni, R., Subharthi, C., Balaji, B., Varghese, M., Bera, S., and Rajeevan, M.: Winter fog experiment over the Indo-Gangetic plains of India, Curr. Sci.-India, 112, 767–784, https://doi.org/10.18520/cs/v112/i04/767-784, 2017.
Ghude, S. D., Kumar, R., Jena, C., Debnath, S., Kulkarni, R. G., Alessandrini, S., Biswas, M., Kulkrani, S., Pithani, P., Kelkar, S., Sajjan, V., Chate, D. M., Soni, V. K., Singh, S., Nanjundiah, R. S., and Rajeevan, M.: Evaluation of PM2.5 forecast using chemical data assimilation in the WRF-Chem model, Curr. Sci.-India, 118, 1803–1815, 2020.
Ghude, S. D., Jenamani, R. K., Kulkarni, R., Wagh, S., Dhangar, N. G., Parde, A. N., Acharja, P., Lonkar, P., Govardhan, G., Yadav, P., Vispute, A., Debnath, S., Lal, D. M., Bisht, D. S., Jena, C., Pawar, P. V., Dhankhar, S. S., Sinha, V., Chate, D. M., Safai, P. D., Nigam, N., Konwar, M., Hazra, A., Dharmaraj, T., Gopalkrishnan, V., Padmakumari, B., Gultepe, I., Biswas, M., Karipot, A. K., Prabhakaran, T., Nanjundiah, R. S., and Rajeevan, M.: WiFEX: Walk into the Warm Fog over Indo-Gangetic Plain Region, B. Am. Meteorol. Soc., 104, E980–E1005, https://doi.org/10.1175/BAMS-D-21-0197.1, 2023.
Ghude, S. D., Govardhan, G., Kumar, R., Yadav, P. P., Jat, R., Debnath, S., Kalita, G., Jena, C., Ingle, S., Gunwani, P., Pawar, P. V., Ambulkar, R., Kumar, S., Kulkarni, S., Kulkarni, A., Khare, M., Kaginalkar, A., Soni, V. K., Nigam, N., Ray, K., Atri, S. D., Nanjundiah, R., and Rajeevan, M.: Air Quality Warning and Integrated Decision Support System for Emissions (AIRWISE): Enhancing Air Quality Management in Megacities, B. Am. Meteorol. Soc., 105, E2525–E2550, https://doi.org/10.1175/BAMS-D-23-0181.1, 2024.
Glotfelty, T., Alapaty, K., He, J., Hawbecker, P., Song, X., and Zhang, G.: The Weather Research and Forecasting Model with Aerosol–Cloud Interactions (WRF-ACI): Development, Evaluation, and Initial Application, Mon. Weather Rev., 147, 1491–1511, https://doi.org/10.1175/MWR-D-18-0267.1, 2019.
Goudie, A. S.: Dust storms and their geomorphological implications, J. Arid Environ., 1, 291–311, https://doi.org/10.1016/S0140-1963(18)31712-9, 1978.
Govardhan, G., Nanjundiah, R. S., Satheesh, S. K., Krishnamoorthy, K., and Kotamarthi, V. R.: Performance of WRF-Chem over Indian region: Comparison with measurements, J. Earth Syst. Sci., 124, 875–896, https://doi.org/10.1007/s12040-015-0576-7, 2015.
Govardhan, G., Ambulkar, R., Kulkarni, S., Vishnoi, A., Yadav, P., Choudhury, B. A., Khare, M., and Ghude, S. D.: Stubble-burning activities in north-western India in 2021: Contribution to air pollution in Delhi, Heliyon, 9, e16939, https://doi.org/10.1016/j.heliyon.2023.e16939, 2023.
Govardhan, G., Ghude, S. D., Kumar, R., Sharma, S., Gunwani, P., Jena, C., Yadav, P., Ingle, S., Debnath, S., Pawar, P., Acharja, P., Jat, R., Kalita, G., Ambulkar, R., Kulkarni, S., Kaginalkar, A., Soni, V. K., Nanjundiah, R. S., and Rajeevan, M.: Decision Support System version 1.0 (DSS v1.0) for air quality management in Delhi, India, Geosci. Model Dev., 17, 2617–2640, https://doi.org/10.5194/gmd-17-2617-2024, 2024.
Graber, E. R. and Rudich, Y.: Atmospheric HULIS: How humic-like are they? A comprehensive and critical review, Atmos. Chem. Phys., 6, 729–753, https://doi.org/10.5194/acp-6-729-2006, 2006.
Grell, G. A. and Freitas, S. R.: A scale and aerosol aware stochastic convective parameterization for weather and air quality modeling, Atmos. Chem. Phys., 14, 5233–5250, https://doi.org/10.5194/acp-14-5233-2014, 2014.
Grell, G. A., Peckham, S. E., Schmitz, R., McKeen, S. A., Frost, G., Skamarock, W. C., and Eder, B.: Fully coupled “online” chemistry within the WRF model, Atmos. Environ., 39, 6957–6975, https://doi.org/10.1016/j.atmosenv.2005.04.027, 2005.
Guenther, A., Karl, T., Harley, P., Wiedinmyer, C., Palmer, P. I., and Geron, C.: Estimates of global terrestrial isoprene emissions using MEGAN (Model of Emissions of Gases and Aerosols from Nature), Atmos. Chem. Phys., 6, 3181–3210, https://doi.org/10.5194/acp-6-3181-2006, 2006.
Han, Y.: JCSDA community radiative transfer model (CRTM): Version 1, NOAA Technical Report NESDIS 122, National Oceanic and Atmospheric Administration (NOAA), https://repository.library.noaa.gov/view/noaa/1157 (last access: 10 September 2026), 2006.
Haugvaldstad, O. W., Olivié, D., Storelvmo, T., and Schulz, M.: Dust radiative forcing in CMIP6 Earth System models: insights from the AerChemMIP piClim-2xdust experiment, Atmos. Chem. Phys., 25, 13199–13219, https://doi.org/10.5194/acp-25-13199-2025, 2025.
Haywood, J. and Boucher, O.: Estimates of the direct and indirect radiative forcing due to tropospheric aerosols: A review, Rev. Geophys., 38, 513–543, https://doi.org/10.1029/1999RG000078, 2000.
Haywood, J. M. and Shine, K. P.: The effect of anthropogenic sulfate and soot aerosol on the clear sky planetary radiation budget, Geophys. Res. Lett., 22, 603–606, https://doi.org/10.1029/95GL00075, 1995.
Hersbach, H., Bell, B., Berrisford, P., Hirahara, S., Horányi, A., Muñoz-Sabater, J., Nicolas, J., Peubey, C., Radu, R., Schepers, D., Simmons, A., Soci, C., Abdalla, S., Abellan, X., Balsamo, G., Bechtold, P., Biavati, G., Bidlot, J., Bonavita, M., De Chiara, G., Dahlgren, P., Dee, D., Diamantakis, M., Dragani, R., Flemming, J., Forbes, R., Fuentes, M., Geer, A., Haimberger, L., Healy, S., Hogan, R. J., Hólm, E., Janisková, M., Keeley, S., Laloyaux, P., Lopez, P., Lupu, C., Radnoti, G., De Rosnay, P., Rozum, I., Vamborg, F., Villaume, S., and Thépaut, J.: The ERA5 global reanalysis, Q. J. Roy. Meteor. Soc., 146, 1999–2049, https://doi.org/10.1002/qj.3803, 2020.
Hess, M., Koepke, P., and Schult, I.: Optical Properties of Aerosols and Clouds: The Software Package OPAC, B. Am. Meteorol. Soc., 79, 831–844, https://doi.org/10.1175/1520-0477(1998)079<0831:OPOAAC>2.0.CO;2, 1998.
Hodnebrog, Ø., Aunan, K., Chowdhury, S., Marelle, L., Myhre, G., Stjern, C. W., and Wang, S.: Strong reduction in near-surface turbulence due to aerosols in South and East Asia, Npj Clean Air, 1, 9, https://doi.org/10.1038/s44407-025-00009-6, 2025.
Hong, S.-Y. and Lim, J.-O. J.: The WRF single-moment 6-class microphysics scheme (WSM6), Asia-Pac. J. Atmos. Sci., 42, 129–151, 2006.
Iacono, M. J., Delamere, J. S., Mlawer, E. J., Shephard, M. W., Clough, S. A., and Collins, W. D.: Radiative forcing by long-lived greenhouse gases: Calculations with the AER radiative transfer models, J. Geophys. Res.-Atmos., 113, 2008JD009944, https://doi.org/10.1029/2008JD009944, 2008.
Janssens-Maenhout, G., Crippa, M., Guizzardi, D., Dentener, F., Muntean, M., Pouliot, G., Keating, T., Zhang, Q., Kurokawa, J., Wankmüller, R., Denier van der Gon, H., Kuenen, J. J. P., Klimont, Z., Frost, G., Darras, S., Koffi, B., and Li, M.: HTAP_v2.2: a mosaic of regional and global emission grid maps for 2008 and 2010 to study hemispheric transport of air pollution, Atmos. Chem. Phys., 15, 11411–11432, https://doi.org/10.5194/acp-15-11411-2015, 2015.
Jena, C., Ghude, S. D., Kumar, R., Debnath, S., Govardhan, G., Soni, V. K., Kulkarni, S. H., Beig, G., Nanjundiah, R. S., and Rajeevan, M.: Performance of high resolution (400 m) PM2.5 forecast over Delhi, Sci. Rep.-UK, 11, 4104, https://doi.org/10.1038/s41598-021-83467-8, 2021.
Kanakidou, M., Seinfeld, J. H., Pandis, S. N., Barnes, I., Dentener, F. J., Facchini, M. C., Van Dingenen, R., Ervens, B., Nenes, A., Nielsen, C. J., Swietlicki, E., Putaud, J. P., Balkanski, Y., Fuzzi, S., Horth, J., Moortgat, G. K., Winterhalter, R., Myhre, C. E. L., Tsigaridis, K., Vignati, E., Stephanou, E. G., and Wilson, J.: Organic aerosol and global climate modelling: a review, Atmos. Chem. Phys., 5, 1053–1123, https://doi.org/10.5194/acp-5-1053-2005, 2005.
Kant, S., Kumar, N., and Jenamani, R. K.: Assessment of fog conditions over capital city Delhi (India) during December 2023–January 2024, Nat. Hazards, 121, 12077–12093, https://doi.org/10.1007/s11069-025-07273-5, 2025.
Kim, D. and Ramanathan, V.: Solar radiation budget and radiative forcing due to aerosols and clouds, J. Geophys. Res.-Atmos., 113, 2007JD008434, https://doi.org/10.1029/2007JD008434, 2008.
Kim, J., Petzold, A., Lottin, D., Hitzenberger, R., Ferry, D., Bauer, H., and Dobovicnik, T.: Constraining optical properties and refractive index of soot through combined experimental and modelling studies, European Aerosol Conference 2012, Contribution No. 335, A-WG01S1P04, Granada, Spain, https://juser.fz-juelich.de/record/23021 (last access: 10 September 2026), 2 September 2012.
Kirchstetter, T. W., Novakov, T., and Hobbs, P. V.: Evidence that the spectral dependence of light absorption by aerosols is affected by organic carbon, J. Geophys. Res.-Atmos., 109, 2004JD004999, https://doi.org/10.1029/2004JD004999, 2004.
Koven, C. D. and Fung, I.: Inferring dust composition from wavelength-dependent absorption in Aerosol Robotic Network (AERONET) data, J. Geophys. Res.-Atmos., 111, 2005JD006678, https://doi.org/10.1029/2005JD006678, 2006.
Kumar, R., Ghude, S. D., Biswas, M., Jena, C., Alessandrini, S., Debnath, S., Kulkarni, S., Sperati, S., Soni, V. K., Nanjundiah, R. S., and Rajeevan, M.: Enhancing Accuracy of Air Quality and Temperature Forecasts During Paddy Crop Residue Burning Season in Delhi Via Chemical Data Assimilation, J. Geophys. Res.-Atmos., 125, e2020JD033019, https://doi.org/10.1029/2020JD033019, 2020.
Kwon, Y. C. and Hong, S.-Y.: A Mass-Flux Cumulus Parameterization Scheme across Gray-Zone Resolutions, Mon. Weather Rev., 145, 583–598, https://doi.org/10.1175/MWR-D-16-0034.1, 2017.
Lafon, S., Sokolik, I. N., Rajot, J. L., Caquineau, S., and Gaudichet, A.: Characterization of iron oxides in mineral dust aerosols: Implications for light absorption, J. Geophys. Res.-Atmos., 111, 2005JD007016, https://doi.org/10.1029/2005JD007016, 2006.
Lettau, H. and Lettau, K.: Shortwave radiation climatonomy, Tellus A, 21, 208, https://doi.org/10.3402/tellusa.v21i2.10075, 1969.
Li, Z., Guo, J., Ding, A., Liao, H., Liu, J., Sun, Y., Wang, T., Xue, H., Zhang, H., and Zhu, B.: Aerosol and boundary-layer interactions and impact on air quality, Natl. Sci. Rev., 4, 810–833, https://doi.org/10.1093/nsr/nwx117, 2017.
Liu, F., Yon, J., Fuentes, A., Lobo, P., Smallwood, G. J., and Corbin, J. C.: Review of recent literature on the light absorption properties of black carbon: Refractive index, mass absorption cross section, and absorption function, Aerosol Sci. Tech., 54, 33–51, https://doi.org/10.1080/02786826.2019.1676878, 2020.
Mishra, S. K. and Tripathi, S. N.: Modeling optical properties of mineral dust over the Indian Desert, J. Geophys. Res.-Atmos., 113, 2008JD010048, https://doi.org/10.1029/2008JD010048, 2008.
Mishra, S. K., Ahlawat, A., Khosla, D., Sharma, C., Prasad, M. V. S. N., Singh, S., Gupta, B., Tulsi, Sethi, D., Sinha, P. R., Ojha, D. K., Wiedensohler, A., and Kotnala, R. K.: Experimental investigation of variations in morphology, composition and mixing-state of boundary layer aerosol: A balloon based study over urban environment (New Delhi), Atmos. Environ., 185, 243–252, https://doi.org/10.1016/j.atmosenv.2018.04.053, 2018.
Mlawer, E. J., Taubman, S. J., Brown, P. D., Iacono, M. J., and Clough, S. A.: Radiative transfer for inhomogeneous atmospheres: RRTM, a validated correlated-k model for the longwave, J. Geophys. Res.-Atmos., 102, 16663–16682, https://doi.org/10.1029/97JD00237, 1997.
Moteki, N.: Climate-relevant properties of black carbon aerosols revealed by in situ measurements: a review, Prog. Earth Planet. Sci., 10, 12, https://doi.org/10.1186/s40645-023-00544-4, 2023.
Nakanishi, M. and Niino, H.: An Improved Mellor–Yamada Level-3 Model with Condensation Physics: Its Design and Verification, Bound.-Lay. Meteorol., 112, 1–31, https://doi.org/10.1023/B:BOUN.0000020164.04146.98, 2004.
Negi, B. S., Sadasivan, S., Nambi, K. S. V., and Pande, B. M.: Characterization of atmospheric dust at Gurushikar, Mt. Abu, Rajasthan, Environ. Monit. Assess., 40, 253–259, https://doi.org/10.1007/BF00398870, 1996.
Negi, B. S., Jha, S. K., Chavan, S. B., Sadasivan, S., Goyal, A., Sapru, M. L., and Bhat, C. L.: Atmospheric Dust Loads and Their Elemental Composition at a Background Site in India, Environ. Monit. Assess., 73, 1–6, https://doi.org/10.1023/A:1012619711336, 2002.
Parde, A. N., Ghude, S. D., Sharma, A., Dhangar, N. G., Govardhan, G., Wagh, S., Jenamani, R. K., Pithani, P., Chen, F., Rajeevan, M., and Niyogi, D.: Improving simulation of the fog life cycle with high-resolution land data assimilation: A case study from WiFEX, Atmos. Res., 278, 106331, https://doi.org/10.1016/j.atmosres.2022.106331, 2022.
Powers, J. G., Klemp, J. B., Skamarock, W. C., Davis, C. A., Dudhia, J., Gill, D. O., Coen, J. L., Gochis, D. J., Ahmadov, R., Peckham, S. E., Grell, G. A., Michalakes, J., Trahan, S., Benjamin, S. G., Alexander, C. R., Dimego, G. J., Wang, W., Schwartz, C. S., Romine, G. S., Liu, Z., Snyder, C., Chen, F., Barlage, M. J., Yu, W., and Duda, M. G.: The Weather Research and Forecasting Model: Overview, System Efforts, and Future Directions, B. Am. Meteorol. Soc., 98, 1717–1737, https://doi.org/10.1175/BAMS-D-15-00308.1, 2017.
Ramanathan, V., Crutzen, P. J., Kiehl, J. T., and Rosenfeld, D.: Aerosols, Climate, and the Hydrological Cycle, Science, 294, 2119–2124, https://doi.org/10.1126/science.1064034, 2001.
Ruiz-Arias, J. A., Arbizu-Barrena, C., Santos-Alamillos, F. J., Tovar-Pescador, J., and Pozo-Vázquez, D.: Assessing the Surface Solar Radiation Budget in the WRF Model: A Spatiotemporal Analysis of the Bias and Its Causes, Mon. Weather Rev., 144, 703–711, https://doi.org/10.1175/MWR-D-15-0262.1, 2016.
Saide, P. E., Spak, S. N., Carmichael, G. R., Mena-Carrasco, M. A., Yang, Q., Howell, S., Leon, D. C., Snider, J. R., Bandy, A. R., Collett, J. L., Benedict, K. B., de Szoeke, S. P., Hawkins, L. N., Allen, G., Crawford, I., Crosier, J., and Springston, S. R.: Evaluating WRF-Chem aerosol indirect effects in Southeast Pacific marine stratocumulus during VOCALS-REx, Atmos. Chem. Phys., 12, 3045–3064, https://doi.org/10.5194/acp-12-3045-2012, 2012.
Seinfeld, J. H. and Pandis, S. N.: Atmospheric Chemistry and Physics: From Air Pollution to Climate Change, 3rd Edn., John Wiley & Sons, Inc., Hoboken, New Jersey, USA, ISBN 978-1-118-94740-1, 1152 pp., 2016.
Sengupta, A., Govardhan, G., Debnath, S., Yadav, P., Kulkarni, S. H., Parde, A. N., Lonkar, P., Dhangar, N., Gunwani, P., Wagh, S., Nivdange, S., Jena, C., Kumar, R., and Ghude, S. D.: Probing into the wintertime meteorology and particulate matter (PM2.5 and PM10) forecast over Delhi, Atmos. Pollut. Res., 13, 101426, https://doi.org/10.1016/j.apr.2022.101426, 2022.
Sharma, A., Venkataraman, C., Muduchuru, K., Singh, V., Kesarkar, A., Ghosh, S., and Dey, S.: Aerosol radiative feedback enhances particulate pollution over India: A process understanding, Atmos. Environ., 298, 119609, https://doi.org/10.1016/j.atmosenv.2023.119609, 2023.
Shettle, E. P. and Fenn, R. W.: Models for the aerosols of the lower atmosphere and the effects of humidity variations on their optical properties, Optical Physics Division, Air Force Geophysics Laboratory, Hanscom AFB, Massachusetts, USA, https://www.researchgate.net/publication/235074087_Models_for_the_Aerosols_of_the_Lower_Atmosphere_and_the_Effects_of_Humidity_Variations_on_their_Optical_Properties (last access: 10 September 2026), 1979.
Skamarock, W. C., Klemp, J. B., Dudhia, J., Gill, D. O., Barker, D. M., Duda, M. G., Huang, X.-Y., Wang, W., and Powers, J. G.: A description of the Advanced Research WRF version 3, NCAR Tech. Note NCAR/TN-475+STR, National Center for Atmospheric Research, Boulder, CO, USA, https://www2.mmm.ucar.edu/wrf/users/docs/technote/v3_technote.pdf (last access: 10 September 2026), 2008.
Skamarock, W. C., Klemp, J. B., Dudhia, J., Gill, D. O., Liu, Z., Berner, J., Wang, W., Powers, J. G., Duda, M. G., Barker, D. M., and others: A description of the Advanced Research WRF version 4, NCAR Tech. Note NCAR/TN-556+STR, National Center for Atmospheric Research, Boulder, CO, USA, 145 pp., https://www2.mmm.ucar.edu/wrf/users/docs/technote/v2_technote.pdf (last access: 10 September 2026), 2019.
Sokolik, I. N. and Toon, O. B.: Incorporation of mineralogical composition into models of the radiative properties of mineral aerosol from UV to IR wavelengths, J. Geophys. Res.-Atmos., 104, 9423–9444, https://doi.org/10.1029/1998JD200048, 1999.
Srivastava, P., Dey, S., Srivastava, A. K., Singh, S., and Tiwari, S.: Most probable mixing state of aerosols in Delhi NCR, northern India, Atmos. Res., 200, 88–96, https://doi.org/10.1016/j.atmosres.2017.09.018, 2018.
Stier, P., Schutgens, N. A. J., Bellouin, N., Bian, H., Boucher, O., Chin, M., Ghan, S., Huneeus, N., Kinne, S., Lin, G., Ma, X., Myhre, G., Penner, J. E., Randles, C. A., Samset, B., Schulz, M., Takemura, T., Yu, F., Yu, H., and Zhou, C.: Host model uncertainties in aerosol radiative forcing estimates: results from the AeroCom Prescribed intercomparison study, Atmos. Chem. Phys., 13, 3245–3270, https://doi.org/10.5194/acp-13-3245-2013, 2013.
Stjern, C. W., Hodnebrog, Ø., Myhre, G., and Pisso, I.: The turbulent future brings a breath of fresh air, Nat. Commun., 14, 3735, https://doi.org/10.1038/s41467-023-39298-4, 2023.
Tomasi, C., Fuzzi, S., and Kokhanovsky, A.: Atmospheric Aerosols: Life Cycles and Effects on Air Quality and Climate, John Wiley & Sons, 704 pp., ISBN 978-3-527-33645-6, 2017.
Toon, O. B., Pollack, J. B., and Khare, B. N.: The optical constants of several atmospheric aerosol species: Ammonium sulfate, aluminum oxide, and sodium chloride, J. Geophys. Res., 81, 5733–5748, https://doi.org/10.1029/JC081i033p05733, 1976.
Tuccella, P., Curci, G., Grell, G. A., Visconti, G., Crumeyrolle, S., Schwarzenboeck, A., and Mensah, A. A.: A new chemistry option in WRF-Chem v. 3.4 for the simulation of direct and indirect aerosol effects using VBS: evaluation against IMPACT-EUCAARI data, Geosci. Model Dev., 8, 2749–2776, https://doi.org/10.5194/gmd-8-2749-2015, 2015.
Twomey, S.: The Influence of Pollution on the Shortwave Albedo of Clouds, J. Atmos. Sci., 34, 1149–1152, https://doi.org/10.1175/1520-0469(1977)034<1149:TIOPOT>2.0.CO;2, 1977.
Wiedinmyer, C., Akagi, S. K., Yokelson, R. J., Emmons, L. K., Al-Saadi, J. A., Orlando, J. J., and Soja, A. J.: The Fire INventory from NCAR (FINN): a high resolution global model to estimate the emissions from open burning, Geosci. Model Dev., 4, 625–641, https://doi.org/10.5194/gmd-4-625-2011, 2011.
Wild, M.: Short-wave and long-wave surface radiation budgets in GCMs: a review based on the IPCC-AR4/CMIP3 models, Tellus A, 60, 932, https://doi.org/10.1111/j.1600-0870.2008.00342.x, 2008.
Wu, C., Lin, Z., and Liu, X.: The global dust cycle and uncertainty in CMIP5 (Coupled Model Intercomparison Project phase 5) models, Atmos. Chem. Phys., 20, 10401–10425, https://doi.org/10.5194/acp-20-10401-2020, 2020.
Yu, H., Liu, S. C., and Dickinson, R. E.: Radiative effects of aerosols on the evolution of the atmospheric boundary layer, J. Geophys. Res.-Atmos., 107, https://doi.org/10.1029/2001JD000754, 2002.
Zaveri, R. A., Easter, R. C., Fast, J. D., and Peters, L. K.: Model for Simulating Aerosol Interactions and Chemistry (MOSAIC), J. Geophys. Res.-Atmos., 113, 2007JD008782, https://doi.org/10.1029/2007JD008782, 2008.
Zhang, Y.: Online-coupled meteorology and chemistry models: history, current status, and outlook, Atmos. Chem. Phys., 8, 2895–2932, https://doi.org/10.5194/acp-8-2895-2008, 2008.
Zhao, C., Ruby Leung, L., Easter, R., Hand, J., and Avise, J.: Characterization of speciated aerosol direct radiative forcing over California, J. Geophys. Res.-Atmos., 118, 2372–2388, https://doi.org/10.1029/2012JD018364, 2013.