the Creative Commons Attribution 4.0 License.
the Creative Commons Attribution 4.0 License.
 | 26 Jan 2026
Decadal evolution of aerosol-mediated ozone responses in Eastern China under clean air actions and carbon neutrality policies
Yasong Li
Chen Li
Yaoyu Li
Tijian Wang
Mengmeng Li
Hao Wu
Yanjin Wang
Despite substantial reductions in PM2.5 and other pollutants, ozone (O3) in eastern China has increased over the past decade, yet the influence of aerosol processes – including aerosol–radiation interactions (ARI) and heterogeneous chemistry (HET) – on these trends remains insufficiently explored, particularly during Clean Air Action Plan (CAAP, Phase I: 2013–2017; Phase II: 2018–2020) and under carbon neutrality pathways. We applied a phase- and season-resolved WRF-Chem framework with explicit ARI and HET to quantify historical and projected O3 changes in the Yangtze River Delta (YRD), linking aerosol effects with CAAP and carbon-neutrality pathways. We separate O3 changes into those driven directly by anthropogenic emissions and meteorological variability, and those mediated by aerosol processes through ARI and HET. The results revealed that anthropogenic emissions and meteorological variability respectively dominated winter and summer O3 increases. Winter O3 increases were dominated by ARI: large aerosol reductions enhanced solar radiation, temperature, and photolysis, resulting in a photochemical O3 rise (+1.14 (+0.74) ppb in Phase I (II)). Summer O3 was more sensitive to HET. In Phase I, aerosol decreases weakened heterogeneous radical uptake, enhancing O3 formation (+1.62 ppb). In Phase II, however, the net HET effect reversed sign (−2.86 ppb), driven by shifts in multiple heterogeneous pathways – including changes in radical uptake, HONO and N2O5 chemistry, and aerosol liquid water – rather than radical scavenging alone. Accounting for aerosol effects (AEs = ARI + HET), reductions in PM2.5 and NOx increased O3, while VOCs reductions consistently lowered O3 in both seasons. Under carbon peaking and neutrality scenarios with AEs, winter O3 increased by 6.7 % and 10.7 %, whereas summer O3 decreased by 2.9 % and 6.7 %, highlighting seasonally contrasting responses. These results underscore the necessity of explicitly accounting for multi-path aerosol–O3 interactions in both near-term air quality management and long-term climate mitigation to prevent unintended trade-offs and maximize co-benefits.
- Article
(11236 KB) - Full-text XML
-
Supplement
(2252 KB) - BibTeX
- EndNote


Over the last decade, a series of landmark policy initiatives – such as the Air Pollution Prevention and Control Action Plan (Phase I: 2013–2017), the Three-Year Blue Sky Protection Campaign (Phase II: 2018–2020), and the subsequent dual-carbon strategy – have driven substantial and persistent declines in PM2.5 concentrations across China's major urban clusters (Geng et al., 2024; Zhai et al., 2019). However, in sharp contrast to these successes, ground-level O3 have continued to rise, particularly in economically developed regions such as Beijing-Tianjin-Hebei (BTH, Zhao et al., 2023; Dai et al., 2023), the Yangtze River Delta (YRD, Li et al., 2023; Hu et al., 2025), and the Pearl River Delta (PRD, Chen et al., 2020). For example, Yan et al. (2024) reported that the annual mean maximum daily 8 h average (MDA8) O3 in major Chinese cities increased from 106.0 µg m−3 in 2013 to 131.1 µg m−3 in 2022, with the most pronounced growth observed in the BTH and YRD regions. The emerging decoupling between PM2.5 and O3 trends underscores the growing complexity of air pollution control in China, suggesting that conventional precursor-oriented mitigation strategies may be insufficient to address secondary pollutants formed through nonlinear atmospheric processes. The increasing frequency and intensity of O3 pollution episodes not only pose serious risks to human health and ecosystems (Liu et al., 2018; Li et al., 2020b) but also diminish the co-benefits of PM2.5 mitigation. As China advances toward its goal of carbon neutrality, elucidating the mechanisms behind this counterintuitive O3 rise has become both a scientific imperative and a policy priority.
Extensive research has identified anthropogenic emissions and meteorological variability as the two dominant drivers of observed O3 increases (Ma et al., 2023a; Sun et al., 2019; Shao et al., 2024; Ni et al., 2024), particularly during the early stages of the CAAP. For instance, Dang et al. (2021) used the GEOS-Chem model to show that during the summer of 2012–2017, meteorological changes accounted for 49 % of the O3 increase in the BTH region and 84 % in the YRD, while emission changes explained 39 % and 13 %, respectively. Recent efforts combining numerical modeling with machine learning have further highlighted the critical roles of solar radiation and temperature, especially during the COVID-19 lockdown. Zhang et al. (2025) attributed approximately 94 % of the summer O3 increase in the Hangzhou Bay area from 2019 to 2022 to meteorological influences, noting a growing dominance of meteorological drivers over emission-related factors. In addition, innovative metrics such as the O3-specific emission–meteorology index (EMI/O3) have been proposed to quantify these contributions, revealing that summer O3 increases in cities like Beijing and Shanghai were largely governed by volatile organic compound (VOCs) emissions and meteorological shifts (Lu et al., 2025).
Beyond emissions and meteorology, aerosol effects (AEs) have emerged as important, though often overlooked, regulators of surface O3. Aerosols influence O3 formation through two principal mechanisms: aerosol–radiation interaction (ARI), which alter photolysis rates and boundary layer dynamics, and heterogeneous chemistry (HET), which removes hydroperoxyl (HO2) radical and suppresses O3 formation (Li et al., 2025, 2024b, 2019a; Gao et al., 2018). As aerosol loading has substantially declined under clean air policies, the magnitudes and directions of these mechanisms may have shifted. For instance, Yu et al. (2019) found that reductions in PM2.5 contributed to approximately 22 % of the observed O3 increase in the YRD during 2013–2017. Yang et al. (2024) quantified a 0.81 ppb increase in summer O3 linked to the weakening of ARI under lower aerosol conditions. Previous analyses indicated that diminished aerosol modulation of photochemistry through ARI, photolysis rate suppression, and heterogeneous reactions jointly contributed to a 22.2 %–57.3 % enhancement in O3 growth between 2014 and 2020 (Li et al., 2024a). Similarly, Liu et al. (2023a) identified weakened HET as the dominant mechanism behind O3 increases across both phases of the CAAP. Moreover, precursor–O3 relationships are strongly modulated by background aerosol levels, further emphasizing the need to assess O3 responses under evolving aerosol conditions to ensure the effectiveness of co-control strategies. Anthropogenic emissions and meteorological variability act as external drivers that directly regulate precursor concentrations, atmospheric chemical regimes, and transport processes. In contrast, ARI and HET represent aerosol-mediated mechanisms that reshape the photochemical environment by altering photolysis rates and radical budgets. These aerosol-driven mechanisms determine the extent to which surface O3 responds to precursor (particularly NOx) reductions or meteorological perturbations. This conceptual framework underpins our separation of O3 changes into externally driven components and aerosol-modulated components in this study.
Despite increasing recognition of the role of aerosols in modulating surface O3, several critical knowledge gaps remain. Most existing studies tend to isolate either ARI or HET rather than evaluate their combined and potentially synergistic effects. Additionally, few investigations adopt a phase- and season-resolved framework aligned with policy implementation timelines, and even fewer consider long-term projections under carbon neutrality pathways. Furthermore, the spatial heterogeneity and nonlinear chemical responses of O3 under dynamic aerosol environments remain poorly characterized, particularly in densely populated and industrialized regions like the YRD. To address these gaps, this study employs an improved WRF-Chem modeling framework to conduct a comprehensive, phase-, season-, and mechanism-resolved assessment of AEs in the YRD from 2013 to 2024. By explicitly disentangling the effects of ARI and HET and integrating them with historical emission changes, meteorological variability, and future carbon neutrality–driven mitigation scenarios, we aim to systematically quantify the drivers of past O3 trends and predict their future trajectories. Furthermore, we assessed the responses of O3 to reductions in individual precursors (PM2.5, NOx, VOCs, NH3, and SO2), thereby elucidating the conditions under which synergistic air quality and climate co-benefits can be most effectively realized. These results provide a scientific basis for the development of region-specific and seasonally adaptive O3 mitigation strategies that are consistent with China's dual objectives of air pollution control and carbon neutrality.
2.1 Model and dataset
To diagnose the mechanisms governing surface O3 variability over eastern China under the Clean Air Action Plan (CAAP), we applied an improved configuration of the Weather Research and Forecasting model coupled with Chemistry (WRF-Chem, version 3.7.1, Grell et al., 2005). The analysis focused on two major implementation stages of the CAAP (Phase I and Phase II), with the objective of disentangling the relative contributions of emission controls, meteorological variability, and aerosol-mediated processes to long-term O3 changes. Particular attention was devoted to two key aerosol effects (ARI and HET) and their roles in modulating O3 trends. In addition, sensitivity experiments were conducted to quantify O3 responses to precursor emission reductions, and to evaluate future surface O3 behavior under carbon neutrality–oriented emission pathways while explicitly accounting for combined aerosol effects (ARI + HET). Building upon our previous modeling framework, the WRF-Chem setup largely followed configurations documented in earlier studies (Li et al., 2024a, b), with targeted enhancements to address the objectives of this work. A three-tier nested domain system was implemented, encompassing East Asia as the outermost domain, eastern China as the intermediate domain, and the YRD as the innermost domain (Fig. S1 in the Supplement). Biogenic emissions were calculated online using the Model of Emissions of Gases and Aerosols from Nature (Guenther et al., 2006). Numerical simulations were performed for January and July to characterize representative winter and summer conditions, respectively. Each seasonal simulation covered a five-week period (29 December to 1 February for winter, and 28 June to 1 August for summer), with the initial three days excluded to allow for model spin-up and chemical equilibration. Beyond the seasonal analyses, the decadal evolution of maximum daily 8 h average (MDA8) O3 over the YRD during 2013–2024 was systematically examined for both seasons. Detailed information about the spatial distribution and technical characteristics of the monitoring stations and model configuration have been reported in our previous studies (Li et al., 2024a).
2.2 Aerosol effects enhancement
This work provided a comprehensive evaluation of aerosol-mediated influences on surface O3 variability within the dual context of China's CAAP and prospective carbon neutrality pathways. Two representative aerosol-related processes (ARI and HET) were explicitly represented in the WRF-Chem modeling system to account for the coupled physical and chemical pathways through which aerosols regulate O3 formation. The formulation, implementation, and performance evaluation of these processes followed the methodologies established in our earlier studies and are only briefly outlined here for completeness (Li et al., 2024b). Within this framework, ARI modulated O3 concentrations through two primary mechanisms. First, aerosols attenuated incoming solar radiation, thereby influencing photolysis frequencies through light extinction. Second, aerosols perturbed meteorological conditions by altering radiative fluxes, giving rise to aerosol–radiation feedbacks (ARF). While ARF was natively supported in the standard WRF-Chem configuration, the default Fast-J photolysis scheme did not dynamically account for aerosol optical properties, which led to the omission of aerosol extinction effects on photolysis rates. To overcome this deficiency, a customized coupling interface was implemented to link prognostic aerosol optical parameters – such as scattering and absorption coefficients – to the Fast-J module. This modification allowed aerosol optical depth to be calculated online and enabled photolysis rates to respond consistently to the evolving spatial and temporal distributions of aerosols.
Heterogeneous chemistry exerts complex influences on O3 formation by altering radical budgets, modifying reactive nitrogen cycling, and changing aerosol-phase reaction rates. In the enhanced WRF-Chem, HET is represented through multiple pathways on dust and black carbon surfaces, including (1) heterogeneous uptake of HO2, OH, NO2, and NO3; (2) nighttime N2O5 hydrolysis to 2HNO3; (3) heterogeneous formation of HONO from NO2 uptake on carbonaceous aerosols; (4) SO2 and H2SO4 heterogeneous oxidation; and (5) direct O3 uptake on dust and black carbon surfaces. These processes collectively modify photolysis-driven radical initiation and NOx partitioning. Therefore, the net HET effect reflects the balance among several aerosol-mediated pathways rather than a single mechanism. The heterogeneous reactions considered in this study, together with their corresponding uptake coefficients (γ), were summarized in Table S1 in the Supplement. Key parameters, including uptake coefficients, aerosol surface area densities, and photolysis scaling factors, followed values that had been validated in our previous modeling studies (Li et al., 2024b). The enhanced WRF-Chem system had been systematically assessed in earlier work and was demonstrated to realistically reproduce meteorological fields, aerosol characteristics, and trace gas concentrations in China, with particularly robust performance in YRD (Qu et al., 2023; Li et al., 2018).
2.3 Numerical experimental designs
To disentangle the respective and combined influences of anthropogenic emission changes, meteorological variability, and aerosol-related processes on surface O3, three groups of numerical experiments were designed within the enhanced WRF-Chem modeling framework (Table 1).
Table 1Overview of WRF-Chem numerical experiments.
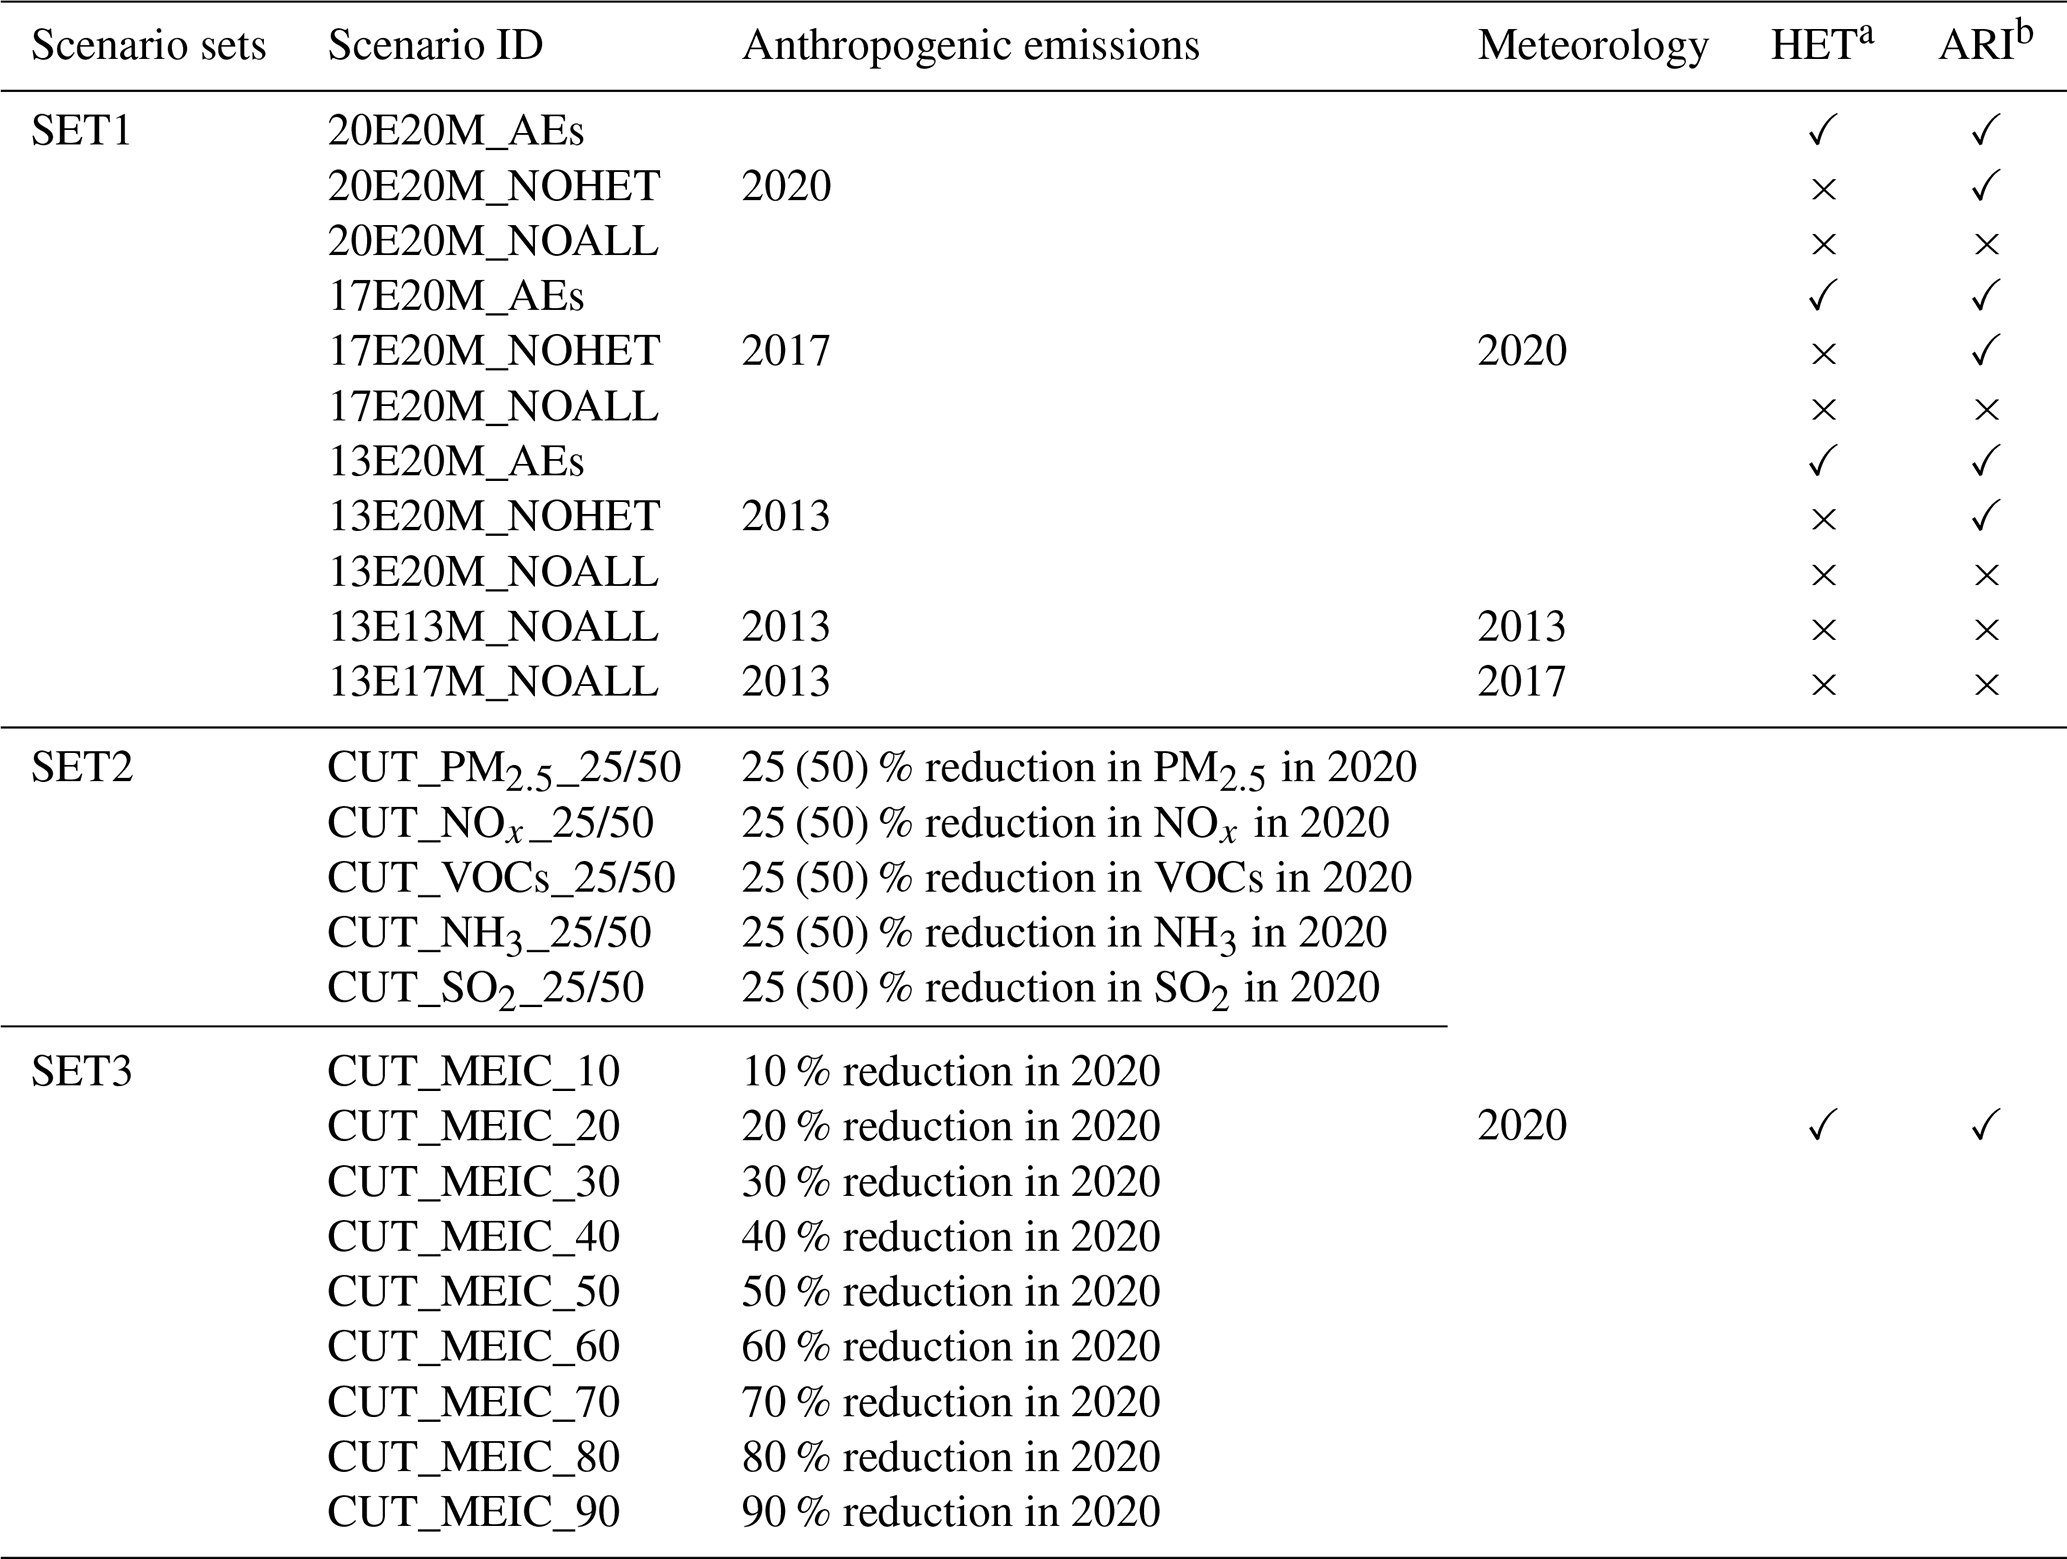
HETa: Heterogeneous chemistry (HET) was activated by setting the heterogeneous reaction switch to 1.
ARIb: Aerosol–radiation interaction (ARI) was activated by turning on the aerosol–radiation feedback (aer_ra_feedback=1) and by linking aerosol optical properties to the photolysis calculation.
2.3.1 (1) SET1: Historical Attribution Simulations (2013–2020)
The first set of simulations was conducted to identify the dominant drivers of O3 variability during two major stages of CAAP, referred to as Phase I and Phase II. In total, 11 simulations were performed to isolate the effects of emission changes, meteorological variability, and aerosol-related mechanisms. To quantify the impact of anthropogenic emission changes alone, three simulations were conducted using fixed meteorological conditions from 2020, with all aerosol-related effects disabled (13E20M_NOALL, 17E20M_NOALL, and 20E20M_NOALL). Differences among these simulations represented the net O3 response to emission evolution in the absence of aerosol feedbacks and meteorological variability. The contribution of meteorological variability was assessed through an additional set of simulations using fixed anthropogenic emissions from 2013 while varying meteorological conditions (2013, 2017, and 2020). Aerosol-related processes were excluded in these runs (13E13M_NOALL, 13E17M_NOALL, and 13E20M_NOALL), and the resulting differences quantified the meteorology-driven component of O3 changes. To evaluate aerosol effects (AEs), three parallel simulations were conducted for each emission year (2013, 2017, and 2020): (i) with all aerosol-related processes enabled (AEs), (ii) with heterogeneous chemistry disabled (NOHET), and (iii) with all aerosol effects turned off (NOALL). Pairwise comparisons among these simulations (e.g., AEs-NOHET, NOHET-NOALL, and AEs-NOALL) allowed the individual contributions of heterogeneous chemistry (HET), aerosol–radiation interactions (ARI), and their combined effects to be quantified. For example, the difference between 20E20M_AEs and 20E20M_NOHET isolated the HET contribution under 2020 emission conditions, whereas the comparison between 20E20M_NOHET and 20E20M_NOALL represented the ARI effect. This analytical framework was applied consistently across all emission years to characterize phase-resolved aerosol influences on O3 trends. A schematic illustration of the experimental design and the associated O3 responses was provided in Fig. 1.
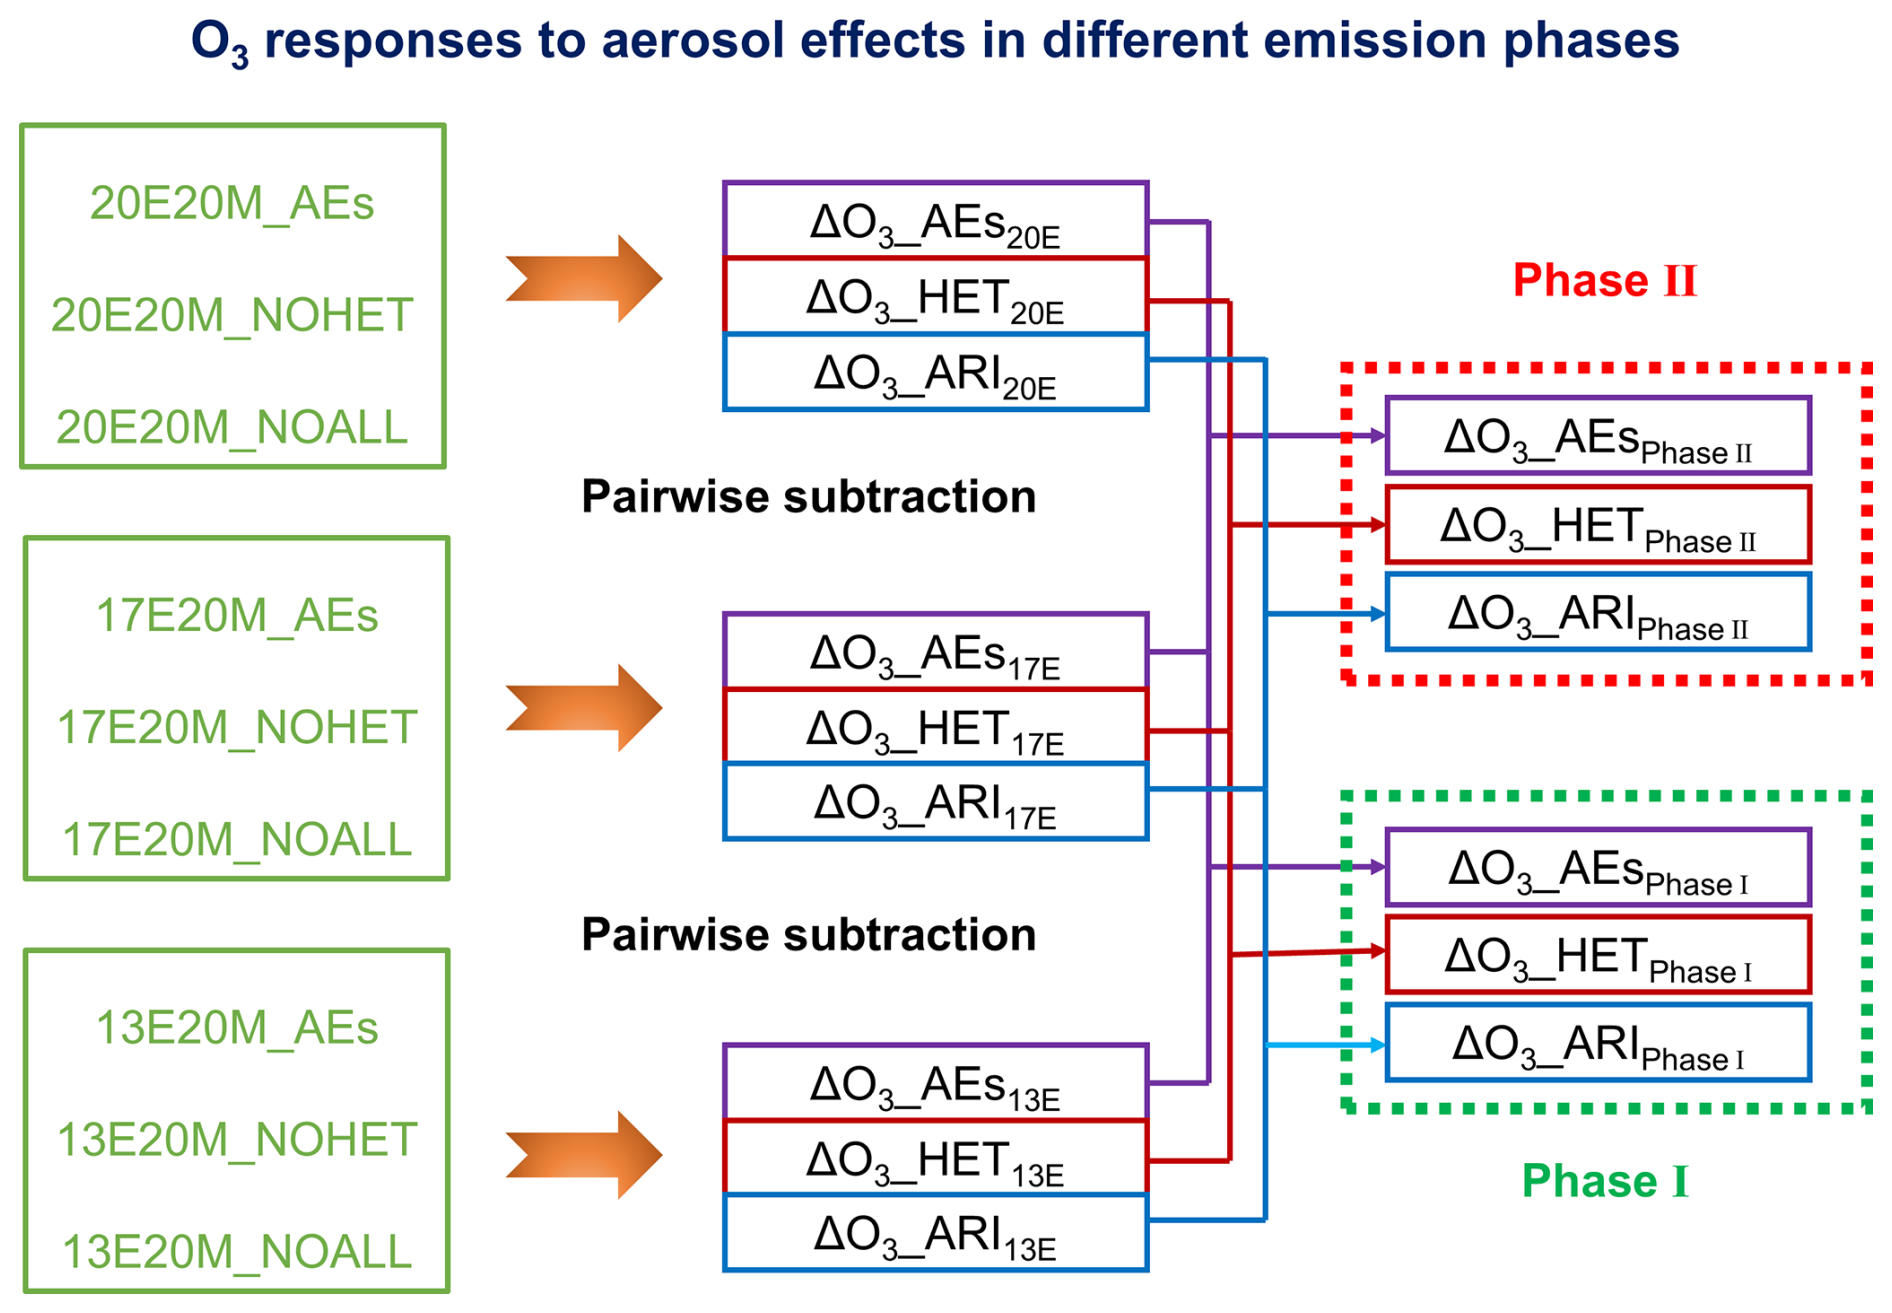
Figure 1Conceptual diagram illustrating the scenario design and the associated ozone responses to aerosol-mediated processes during the CAAP phases. Note: HET = heterogeneous chemistry, ARI = aerosol-radiation interaction, AEs = aerosol effects (HET + ARI). Scenario IDs such as “13E20M” refer to emission year 2013 with 2020 meteorology.
2.3.2 (2) SET2: Single-Precursor Sensitivity Experiments (2020 baseline)
The second group of simulations was designed to examine the nonlinear responses of O3 to individual precursor emission controls under active aerosol effects. All experiments were based on the 2020 anthropogenic emissions inventory. For each simulation, emissions of one precursor (primary PM2.5, NOx, volatile organic compounds (VOCs), SO2, or NH3) were reduced by 25 % and 50 %, while emissions of the remaining species were held constant. Reductions in primary PM2.5 included both black carbon (BC) and organic carbon (OC).
2.3.3 (3) SET3: Multi-Pollutant Co-Reduction Experiments (Future Scenarios)
The third set of experiments explored potential O3 responses under future emission mitigation pathways aligned with China's carbon peaking and carbon neutrality objectives. Coordinated reductions in all major anthropogenic emissions were applied, guided by the mid- and long-term projections reported by Cheng et al. (2021), who assessed China's air quality evolution under dual-carbon strategies. Their analysis suggested that anthropogenic emissions will decrease by approximately 26 %–32 % by 2030 relative to 2020 levels, followed by a slower reduction pace thereafter, reaching a maximum decline of about 31 % by 2060 compared to 2030. Based on these projections, two representative reduction levels – 30 % and 50 % – were selected to approximate emission conditions corresponding to the carbon peaking (2030) and carbon neutrality (2060) targets, respectively. To further characterize the nonlinear O3 response under increasingly stringent mitigation, a series of additional co-control scenarios spanning 10 %, 20 %, 40 %, 60 %, 70 %, 80 %, and 90 % reductions was implemented. Across all future experiments, emissions of primary PM2.5, NOx, VOCs, SO2, and NH3 were scaled down proportionally, reflecting a coordinated multi-pollutant mitigation framework. Aerosol-related processes were consistently enabled in all simulations to preserve realistic aerosol–O3 feedbacks.
2.4 Historical changes in emissions and observed O3
Interannual changes in six key species – SO2, primary PM2.5, BC, OC, NOx, and VOCs – at the provincial scale in the YRD during 2013–2020 was presented in Fig. S2. Over this period, emissions of most pollutants declined substantially, with the exception of VOCs. Cumulatively, SO2, primary PM2.5, BC, OC, and NOx emissions were reduced by 69.7 %, 46.9 %, 40.4 %, 38.0 %, and 27.9 %, respectively. During the first phase of the CAAP (Phase I), control strategies were predominantly oriented toward particulate matter abatement. As a result, primary PM2.5, BC, and OC emissions decreased markedly by 37.0 %, 30.0 %, and 27.3 %, respectively. Concurrently, notable reductions were achieved for major gaseous precursors, with SO2 and NOx declining by 56.4 % and 19.8 %. In contrast, the absence of explicit VOCs-targeted measures during this stage led to a 7.1 % increase in VOCs emissions (Li et al., 2019b). The second phase of the CAAP (Phase II) was characterized by a transition toward more coordinated regulation of NOx and VOCs. Although emissions of SO2, NOx, and PM2.5 continued to decrease, the overall pace of reduction was slower than that observed in Phase I. Specifically, NOx and VOCs emissions declined by 7.4 % and 4.6 %, respectively. Nevertheless, when considering the entire 2013–2020 period, VOCs emissions in the YRD still exhibited a net increase of 2.2 %. From a spatial perspective, emission reductions were most pronounced in the northwestern and central subregions of the YRD (Fig. S3), a pattern that aligns with national emission reduction trends and is consistent with previous regional assessments (Liu et al., 2023a; Yan et al., 2024).
In addition to modifying emissions, the CAAP brought about substantial changes in observed O3. Figure 2 illustrated the annual variation of the MDA8 O3 in winter and summer across the YRD based on ground-based observations from 2013 to 2024. In winter, O3 increased by approximately 7 µg m−3 during 2013–2017, at an average annual growth rate of 3 %. This trend reversed during 2017–2020, with a decrease of 4 µg m−3 (2 % yr−1), followed by a modest increase of 2.2 µg m−3 (0.91 % yr−1) between 2020 and 2024. In summer, O3 rose by 13.2 µg m−3 during 2013–2017, continued to increase by 4.9 µg m−3 from 2017 to 2020, and then declined sharply by 11.4 µg m−3 during 2020–2024. These results suggested that in the early phase of clean air efforts, the insufficient control of O3 precursors contributed to significant increases in both winter and summer O3. However, stronger VOCs and NOx control measures in recent years appeared to mitigate this upward trend. A particularly sharp drop in O3 between 2020 and 2021 was likely caused by a combination of intensified emission reductions and unusual meteorological conditions (Yin et al., 2021). Overall, observed MDA8 O3 in the YRD increased by 12.1 % in winter and 11.8 % in summer during 2013–2017. In the subsequent periods (2017–2020 and 2020–2024), winter O3 levels first declined and then rebounded, while summer O3 initially rose and then decreased. The underlying causes of these contrasting patterns were explored in detail in the Results section. Note that this study did not focus on the spatial distribution of O3 changes, as this topic has already been extensively examined in previous literature (Hu et al., 2025; Zhao et al., 2023).
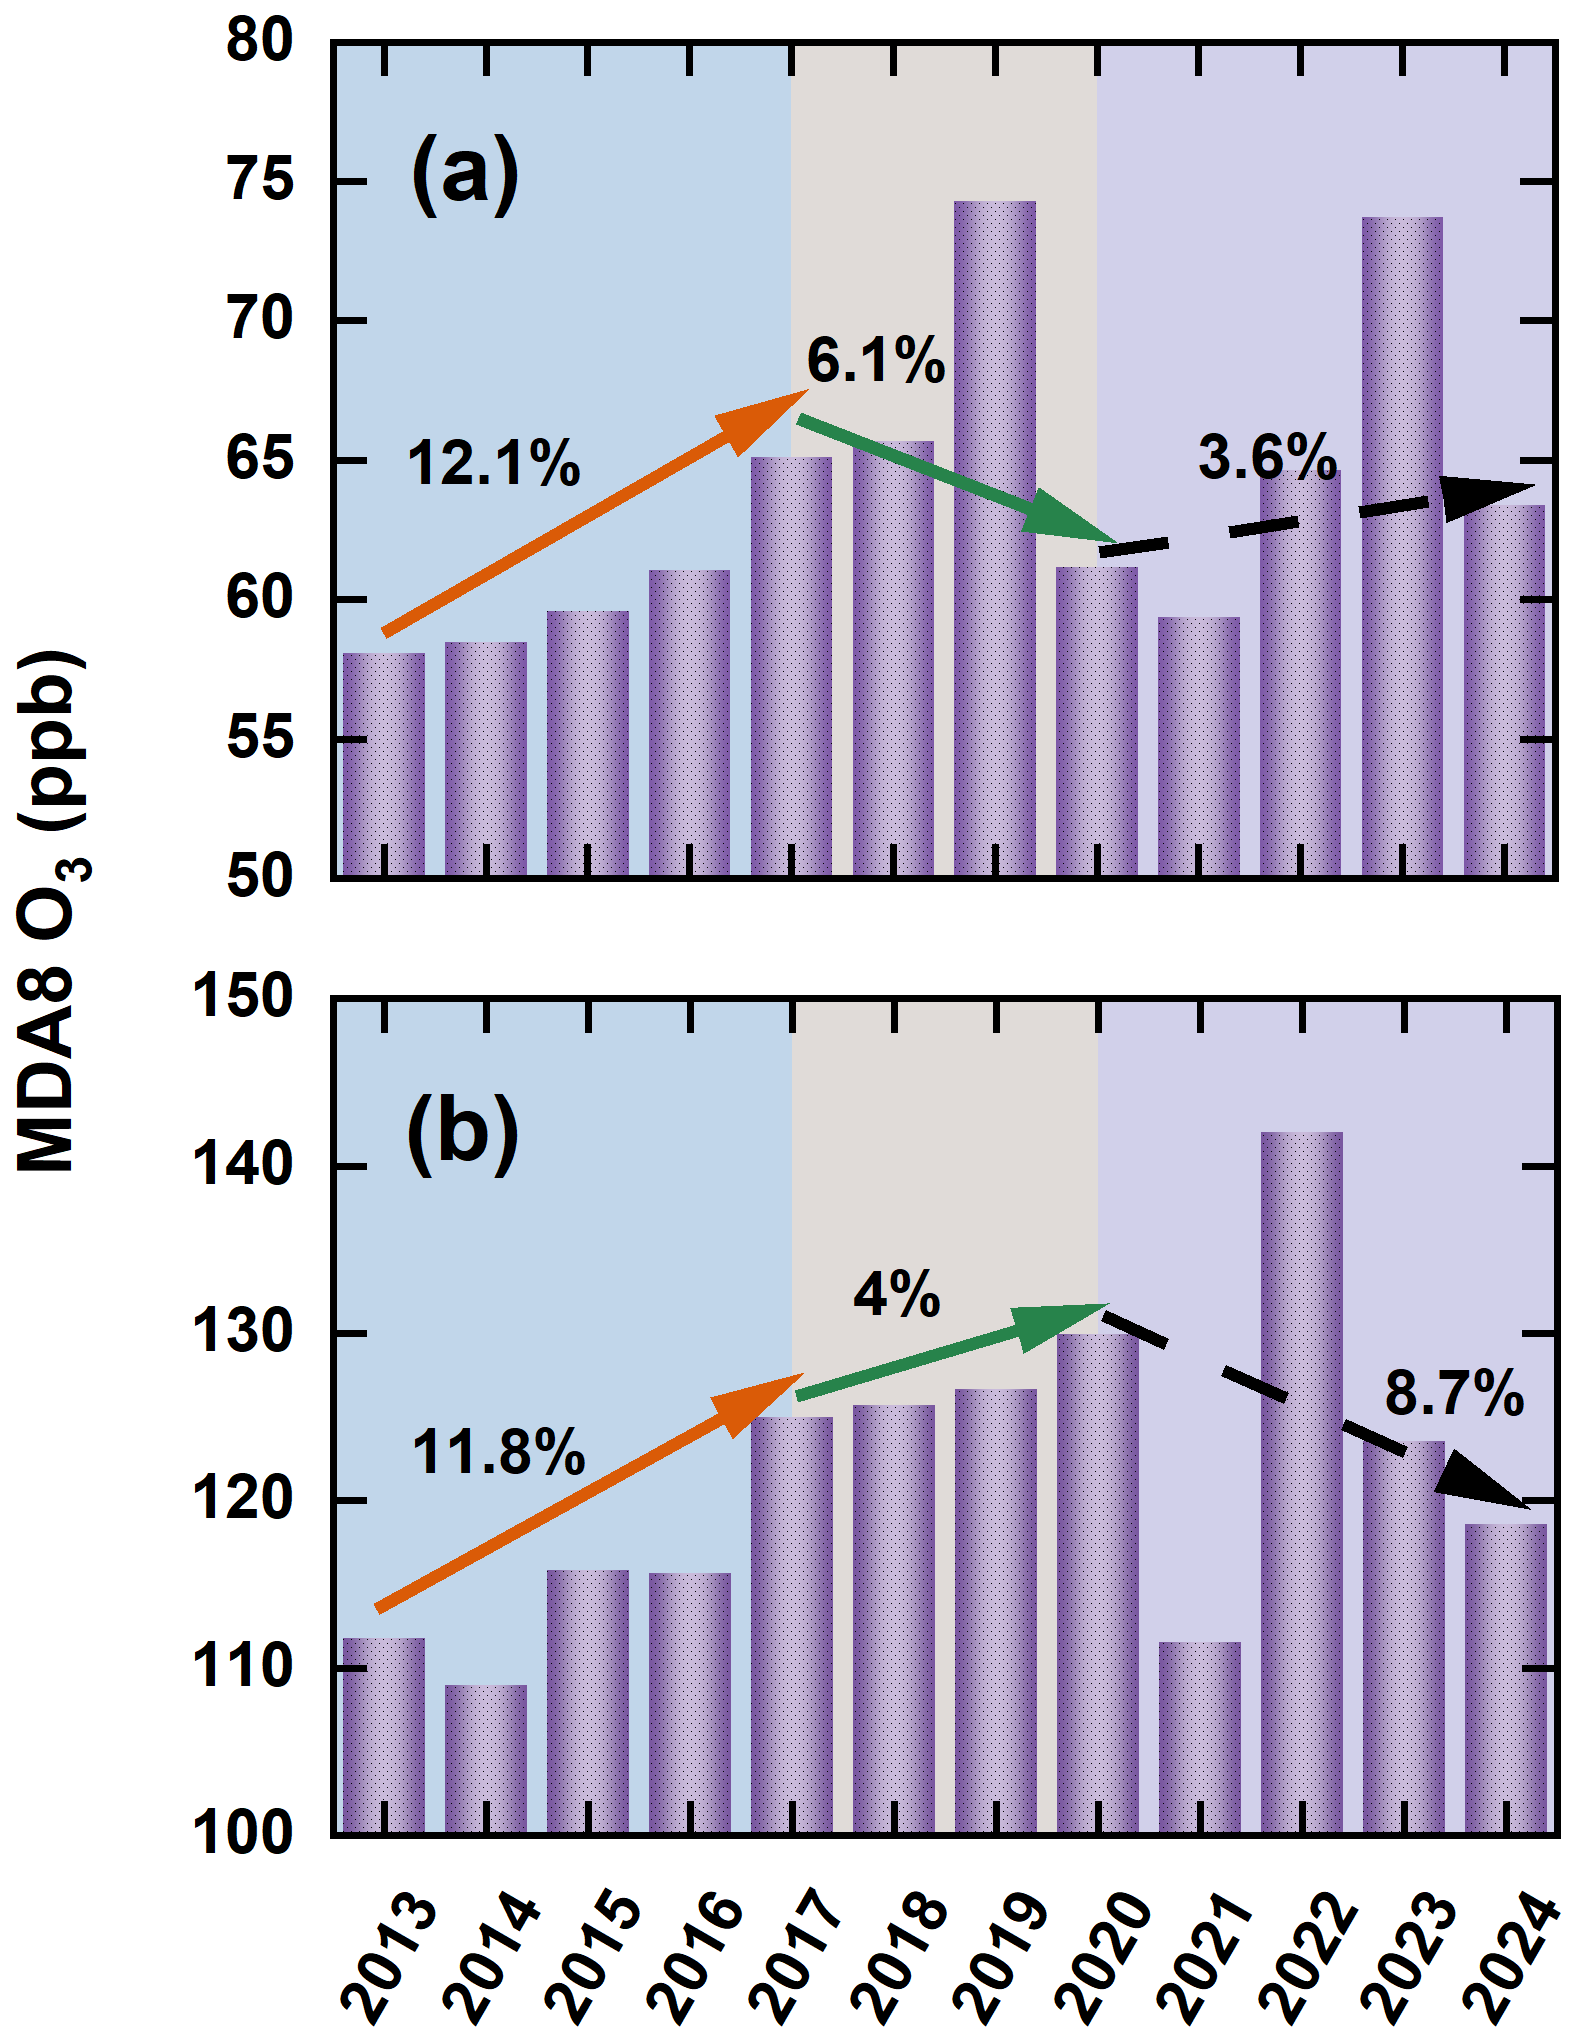
Figure 2Interannual variations in winter (a) and summer (b) MDA8 O3 concentrations (ppb) across the YRD during 2013–2024, derived from continuous ground-based measurements.
The accuracy of simulated meteorological parameters and pollutant concentrations under scenario (20E20M_AEs) has been thoroughly validated against ground-based observations in earlier work (Li et al., 2024a). As summarized in Table S2, the model reasonably captures the magnitude, seasonal variability of PM2.5, O3, as well as the major features of temperature, relative humidity, and wind speed. These results provide confidence in the model's ability to represent the atmospheric conditions relevant to the subsequent analysis.
3.1 Attribution of historical seasonal O3 changes to emissions and meteorology
A set of attribution simulations (SET1) with aerosol processes disabled (NOALL) and fixed 2020 meteorology was conducted to isolate emission-driven O3 variability in the YRD over the past decade, with the resulting responses shown in Fig. 3. During Phase I, emission reductions unexpectedly led to O3 increases of 6.3 ppb in winter and 1.3 ppb in summer. In contrast, Phase II witnessed coordinated NOx and VOCs controls, leading to O3 reductions of 0.9 ppb (winter) and 1.5 ppb (summer). These contrasting outcomes reflect the nonlinear chemistry of O3 formation. While Phase I focused primarily on reducing PM2.5 and SO2, VOCs emissions remained poorly regulated and even increased, enhancing photochemical activity. In contrast, Phase II adopted a more balanced control strategy targeting both NOx and VOCs, which proved more effective in mitigating O3 pollution. Spatially, the strongest O3 responses occurred in the northwestern and central parts of the YRD, aligning with regions that experienced the largest emission reductions.
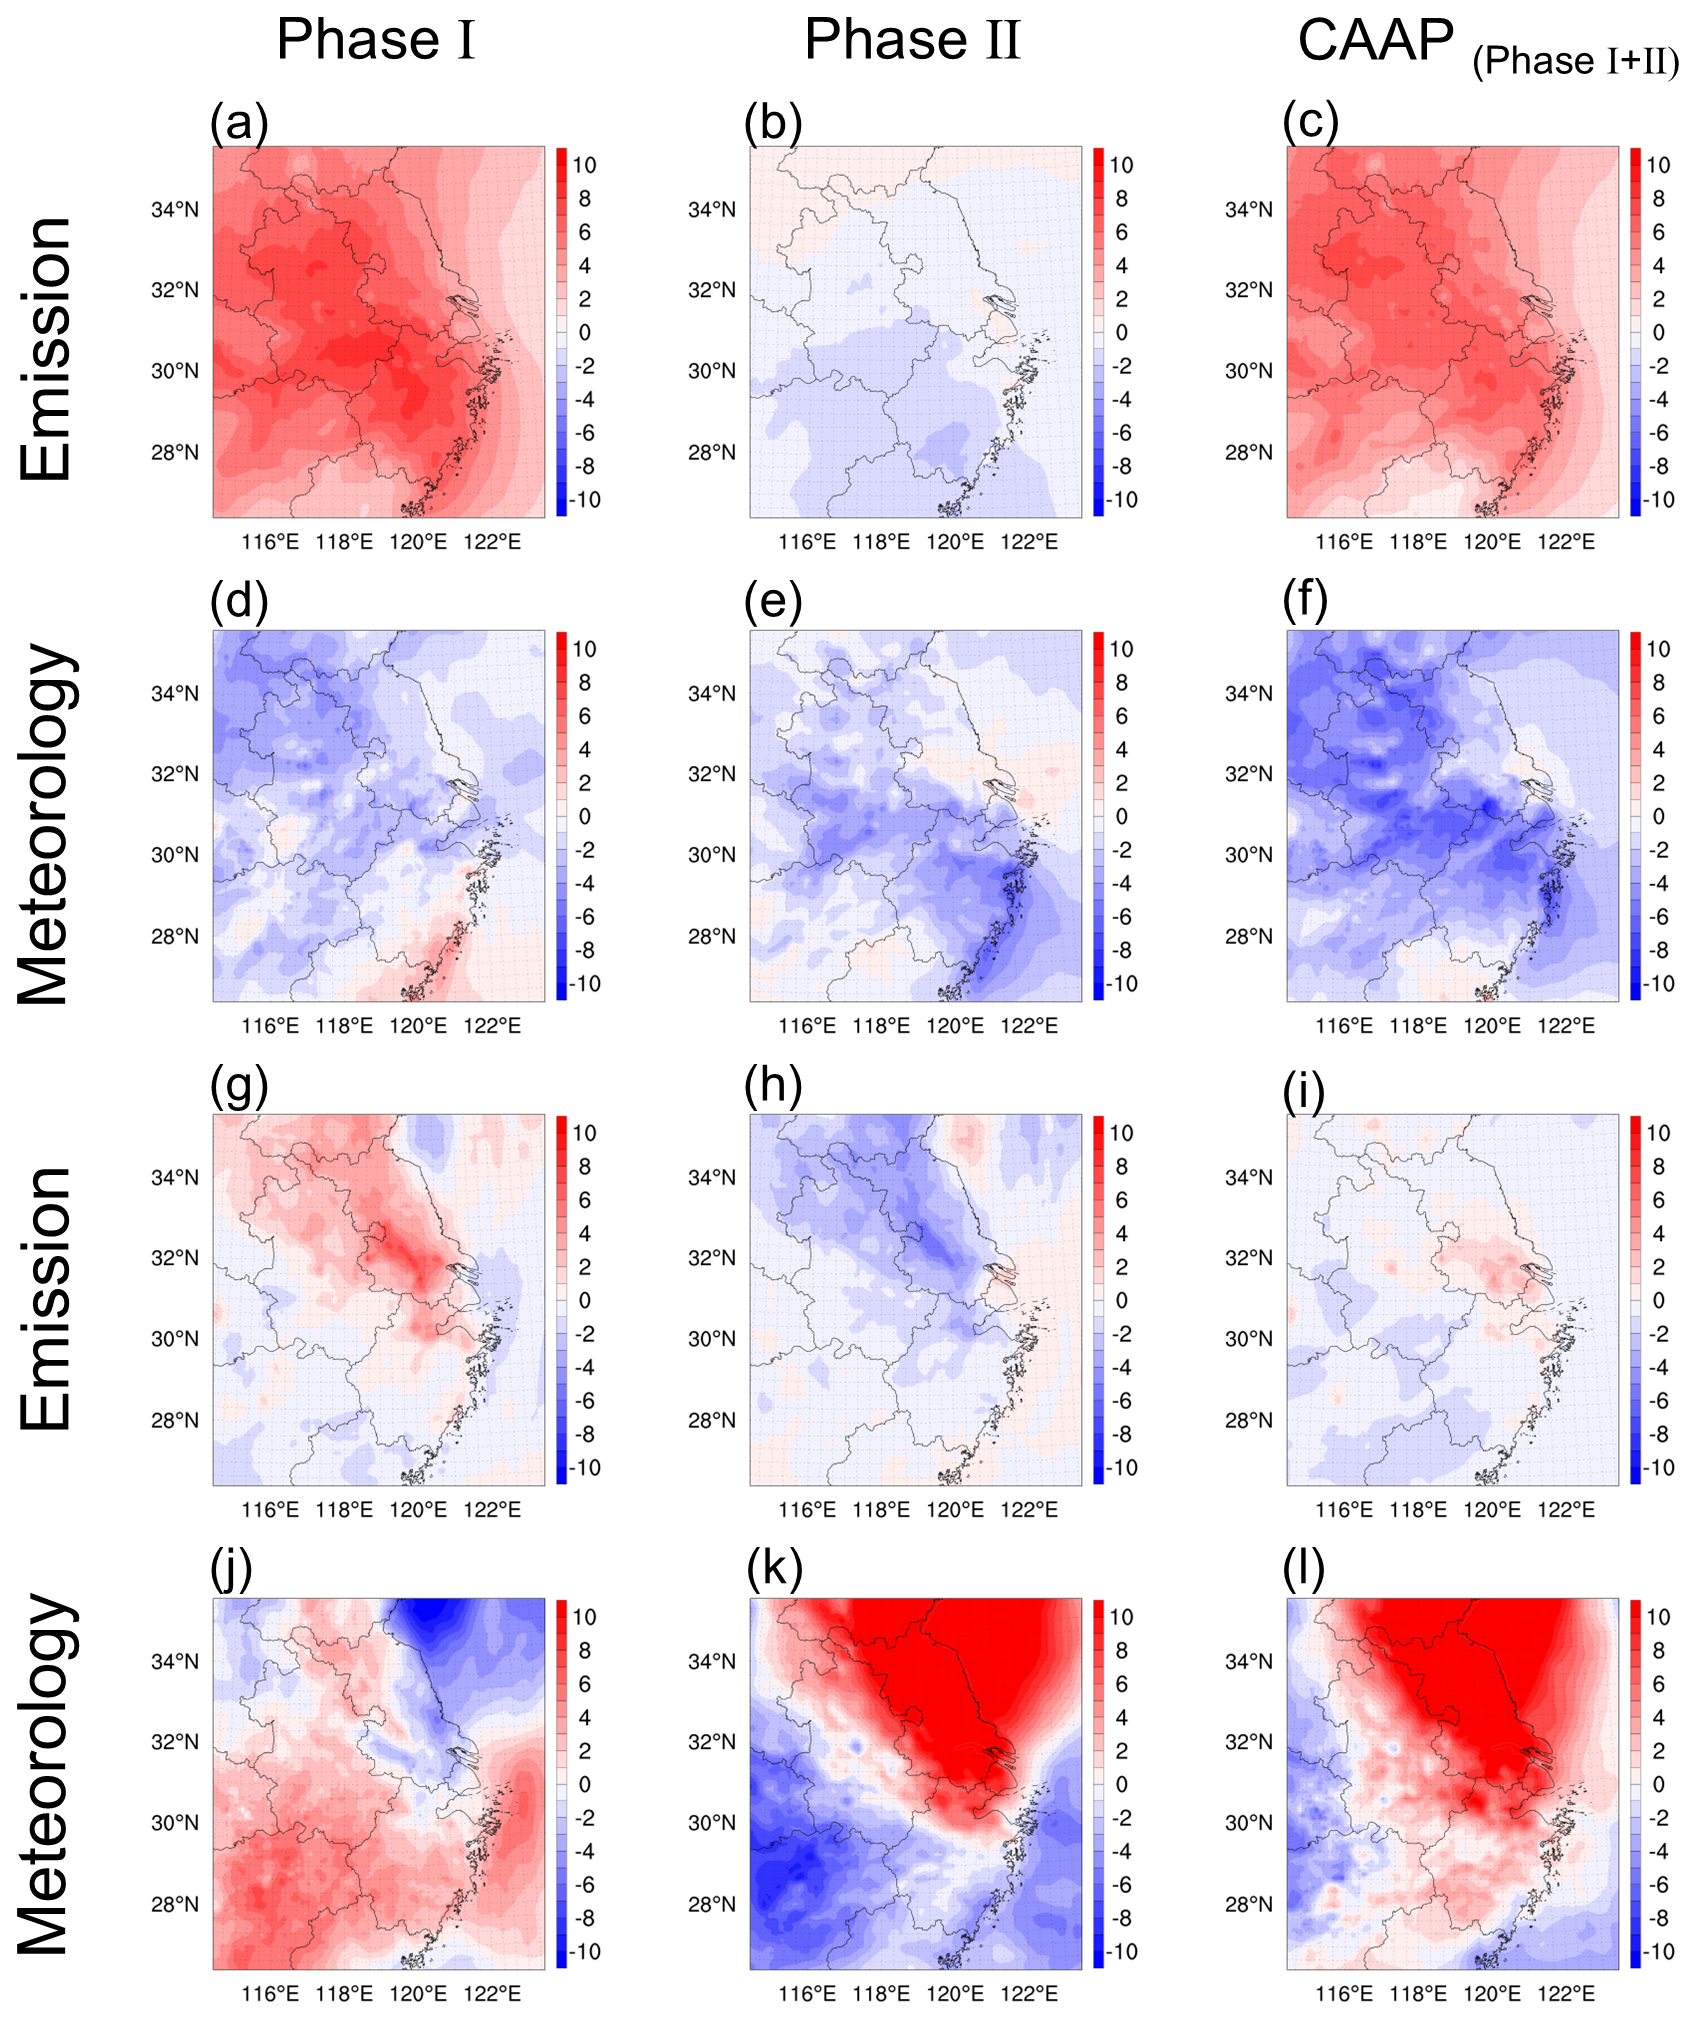
Figure 3Attribution of seasonal O3 variations (ppb) in the Yangtze River Delta to emission reductions (a–c, g–i) and meteorological influences (d–f, j–l) during Phase I and Phase II of the CAAP, with winter and summer results displayed in the upper and lower rows, respectively.
To assess the influence of meteorological conditions, we fixed anthropogenic emissions at 2013 levels and varied the meteorological fields across years. Results revealed seasonally asymmetric impacts: meteorology contributed to wintertime O3 declines (1.7 and 2.1 ppb during Phases I and II, respectively), but promoted summertime O3 increases (1.4 and 4.6 ppb). This highlighted a distinct seasonal asymmetry in meteorological influences on O3. As summarized in Table S3, changes in five key meteorological parameters (shortwave radiation (SW), temperature (T2), relative humidity (RH2), planetary boundary layer height (PBLH), and wind speed (WS10)) collectively explain these trends. In winter, lower radiation and T2, higher RH2, and stronger WS10 suppressed O3 formation and accumulation. Conversely, summer conditions characterized by higher radiation and T2, coupled with lower RH2 and weaker WS10, favored O3 build-up. Although this study does not explicitly quantify the relative contributions of individual meteorological factors, prior studies (Liu et al., 2023a; Yan et al., 2024; Dai et al., 2024) using multiple linear regression consistently identify SW and T2 as dominant drivers. Figure S4 presented the spatial distributions of meteorological changes during 2013–2020, revealing that the most pronounced shifts – especially in radiation and temperature-occurred in the central YRD and were more significant in summer, consistent with stronger O3 responses.
In summary, anthropogenic emission changes were the dominant drivers of winter O3 increases during Phase I. These findings are consistent with earlier research (Cao et al., 2022; Wu et al., 2022), which similarly highlighted that early-phase air quality interventions-though effective in reducing PM2.5-often overlooked the complex chemistry of O3, particularly the roles of VOCs and NOx, thereby unintentionally intensifying O3 pollution. The transition to coordinated multi-pollutant control strategies in Phase II enabled more effective O3 mitigation. In addition, the role of meteorology was non-negligible. Our findings, in line with those of Liu and Wang (2020), emphasize a pronounced seasonal asymmetry-meteorology suppressed winter O3 but enhanced summer levels. Notably, wintertime O3 variability was primarily emission-driven during Phase I, but increasingly influenced by meteorology in Phase II. In contrast, summer O3 changes were consistently dominated by meteorological variability across both phases. These insights underscore the need for future O3 control strategies to account for both emissions and meteorological variability, particularly in the context of climate change and evolving pollution regimes. These externally driven O3 changes provide the foundation for evaluating how aerosol-mediated processes further modulate the emission-driven portion of the O3 response.
3.2 Aerosol multi-effects contributions to past seasonal O3 variations
Building on the external drivers identified in Sect. 3.1, we next examined how ARI and HET modified the emission-reduction-driven O3 response. Figure 4 illustrated the wintertime spatial patterns of O3 changes driven by ARI and HET across the YRD during both phases of the CAAP. In Phase I, ARI induced a significant O3 increase of up to 1.14 ppb across the region, while the contribution from HET was notably smaller at 0.32 ppb. This indicated that early aerosol reductions primarily enhanced O3 via increased solar radiation and associated meteorological feedbacks, rather than through the suppression of radical uptake on particle surfaces. This finding contrasted with those of Li et al. (2019a), who – using GEOS-Chem simulations – attributed O3 increases over the BTH to reduced HO2 uptake under declining PM2.5. The discrepancy may stem from differences in model representation; our framework explicitly incorporates both ARI-driven meteorological feedbacks and the direct photolysis attenuation by aerosols, enabling a more comprehensive simulation of aerosol–radiation interaction. During Phase II, the ARI-induced O3 increase weakened to +0.74 ppb, and the contribution from HET became negligible or slightly negative (−0.01 ppb). This suggested that ARI remained the dominant aerosol-related driver of winter O3 variability, while the influence of HET diminished. The reduced overall aerosol impact during this phase was consistent with smaller primary PM2.5 emission reductions (−8 % in Phase II compared to −37 % in Phase I). Summing the contributions from both mechanisms, the total aerosol-driven O3 enhancement reached +1.46 ppb in Phase I and +0.73 ppb in Phase II, culminating in a net wintertime increase of +2.2 ppb over the CAAP period.
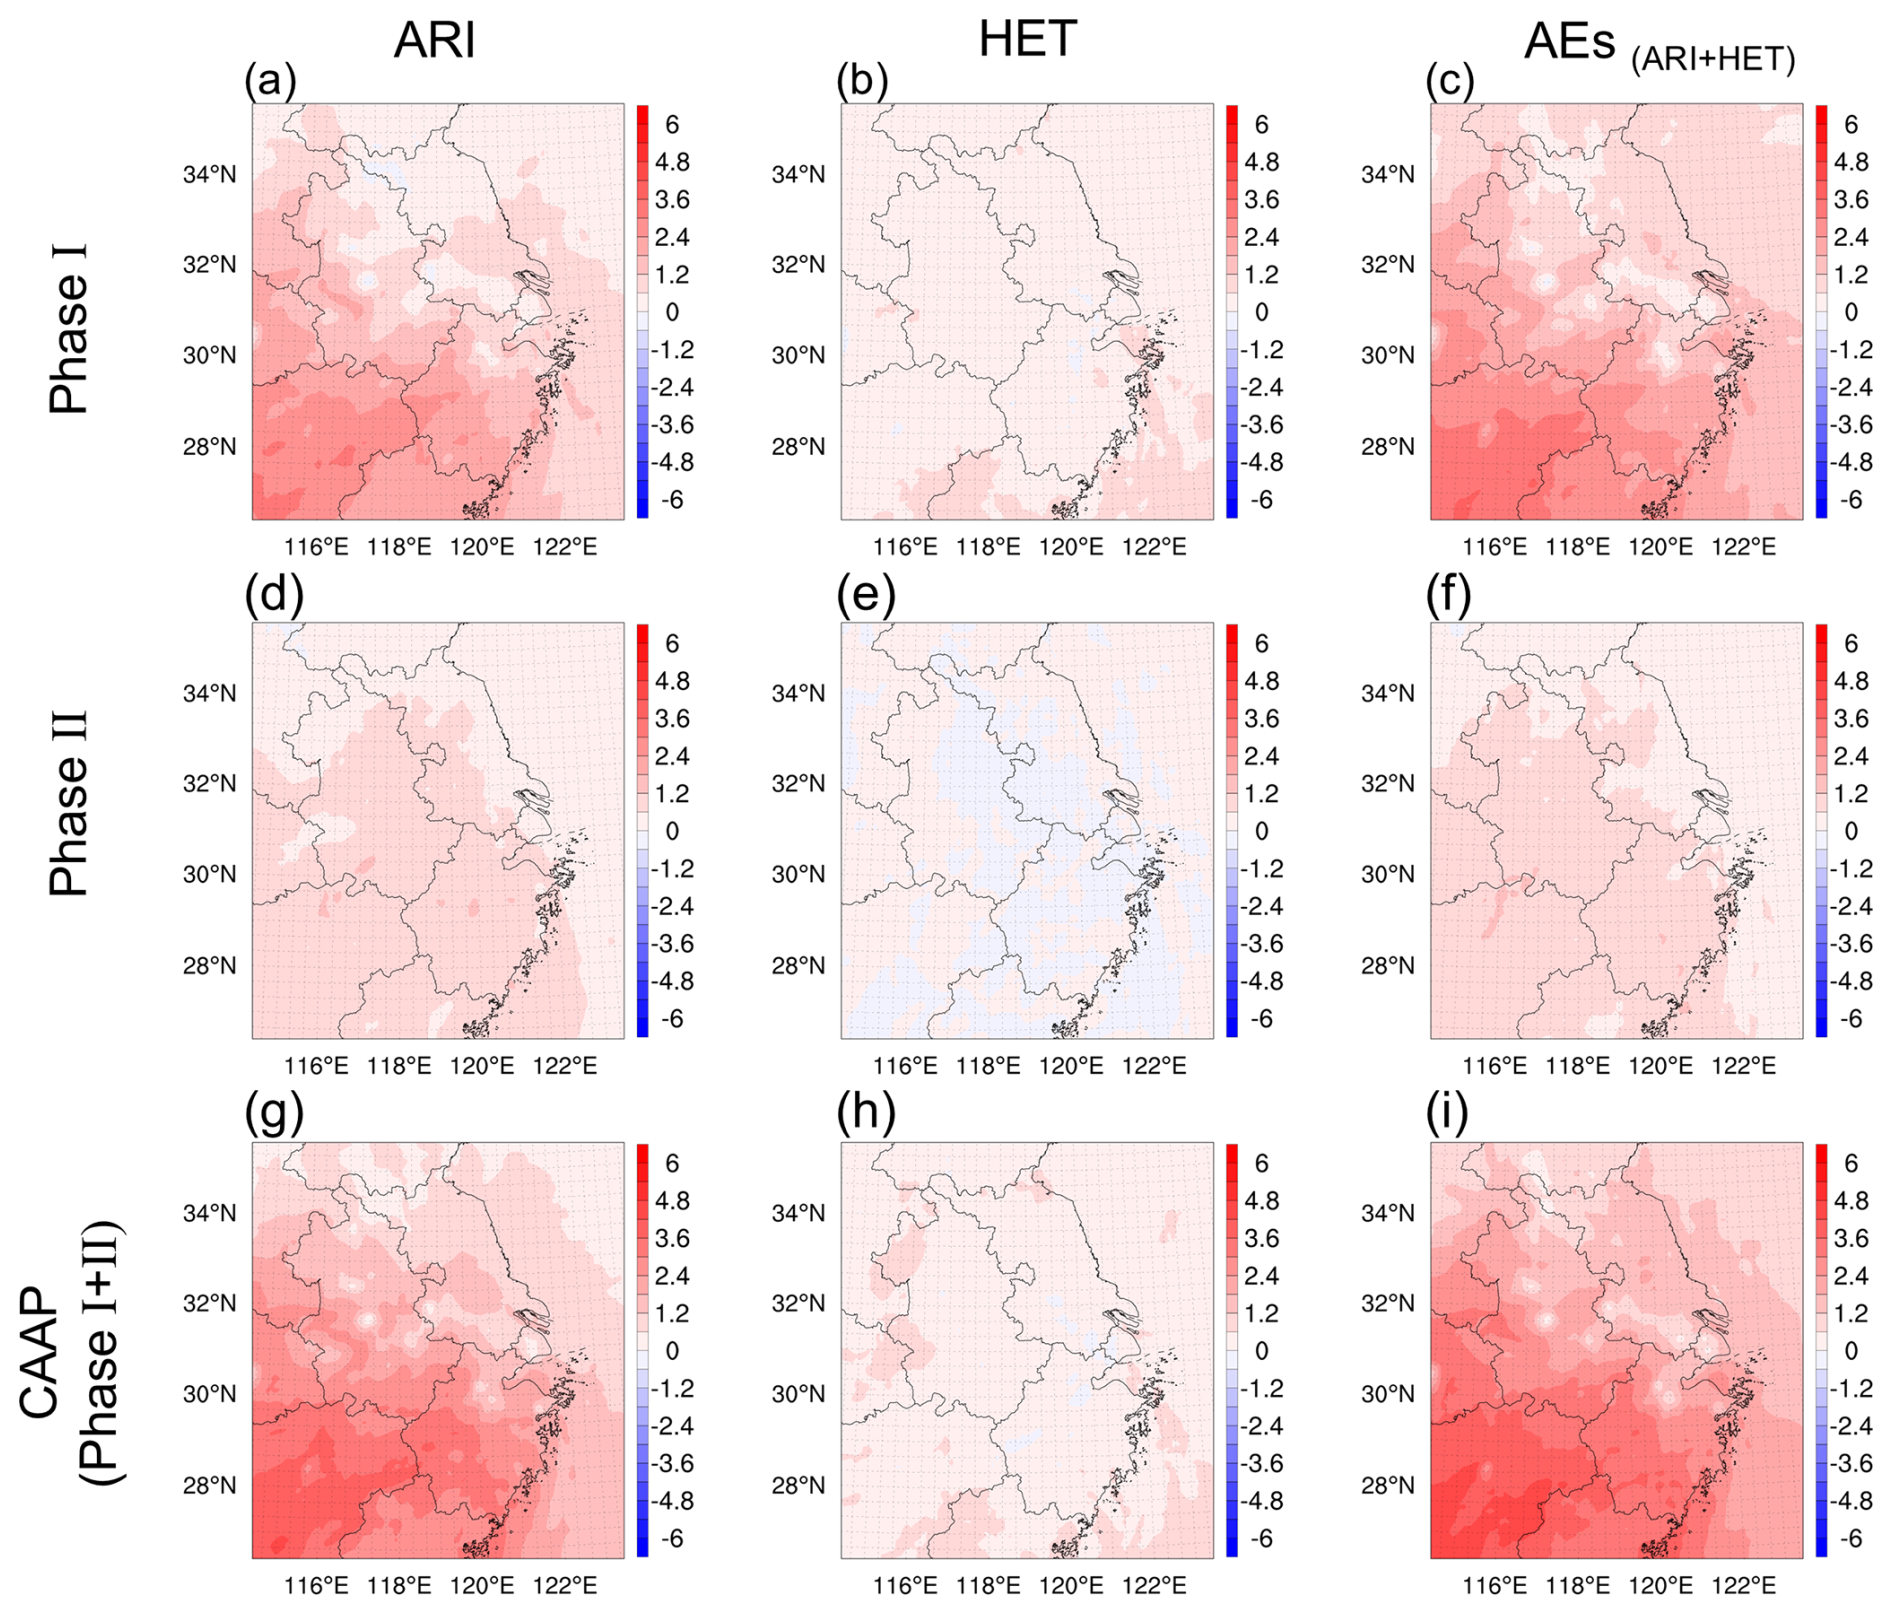
Figure 4Spatial distribution of winter O3 changes (ppb) over YRD driven by ARI (a, d, g), HET (b, e, h) and their combined effects (AEs, c, f, i) during two stages of the CAAP.
In contrast to winter, summertime O3 responses to AEs revealed different dominant mechanisms and magnitudes, as shown in Fig. 5. In Phase I, HET played a more substantial role, contributing a 1.62 ppb increase, whereas ARI slightly suppressed O3 by 0.51 ppb. This pattern indicated that under high photochemical activity, reduced particulate matter significantly weakened radical scavenging, thereby elevating HO2 levels and promoting O3 formation. During Phase II, however, HET unexpectedly contributed a 2.86 ppb decreases in O3, while ARI induced a 1.56 ppb enhancement. The HET-driven decrease may be linked to complex nonlinear chemical responses under further reduced aerosol backgrounds, which diminished the amplification effect of radical availability. Across both phases, HET consistently emerged as the primary driver of summertime aerosol-related O3 variability. When aggregated, aerosols contributed a 1.11 ppb increase in Phase I and a 1.30 ppb decrease in Phase II, yielding a modest net summer reduction of 0.19 ppb over the CAAP period.
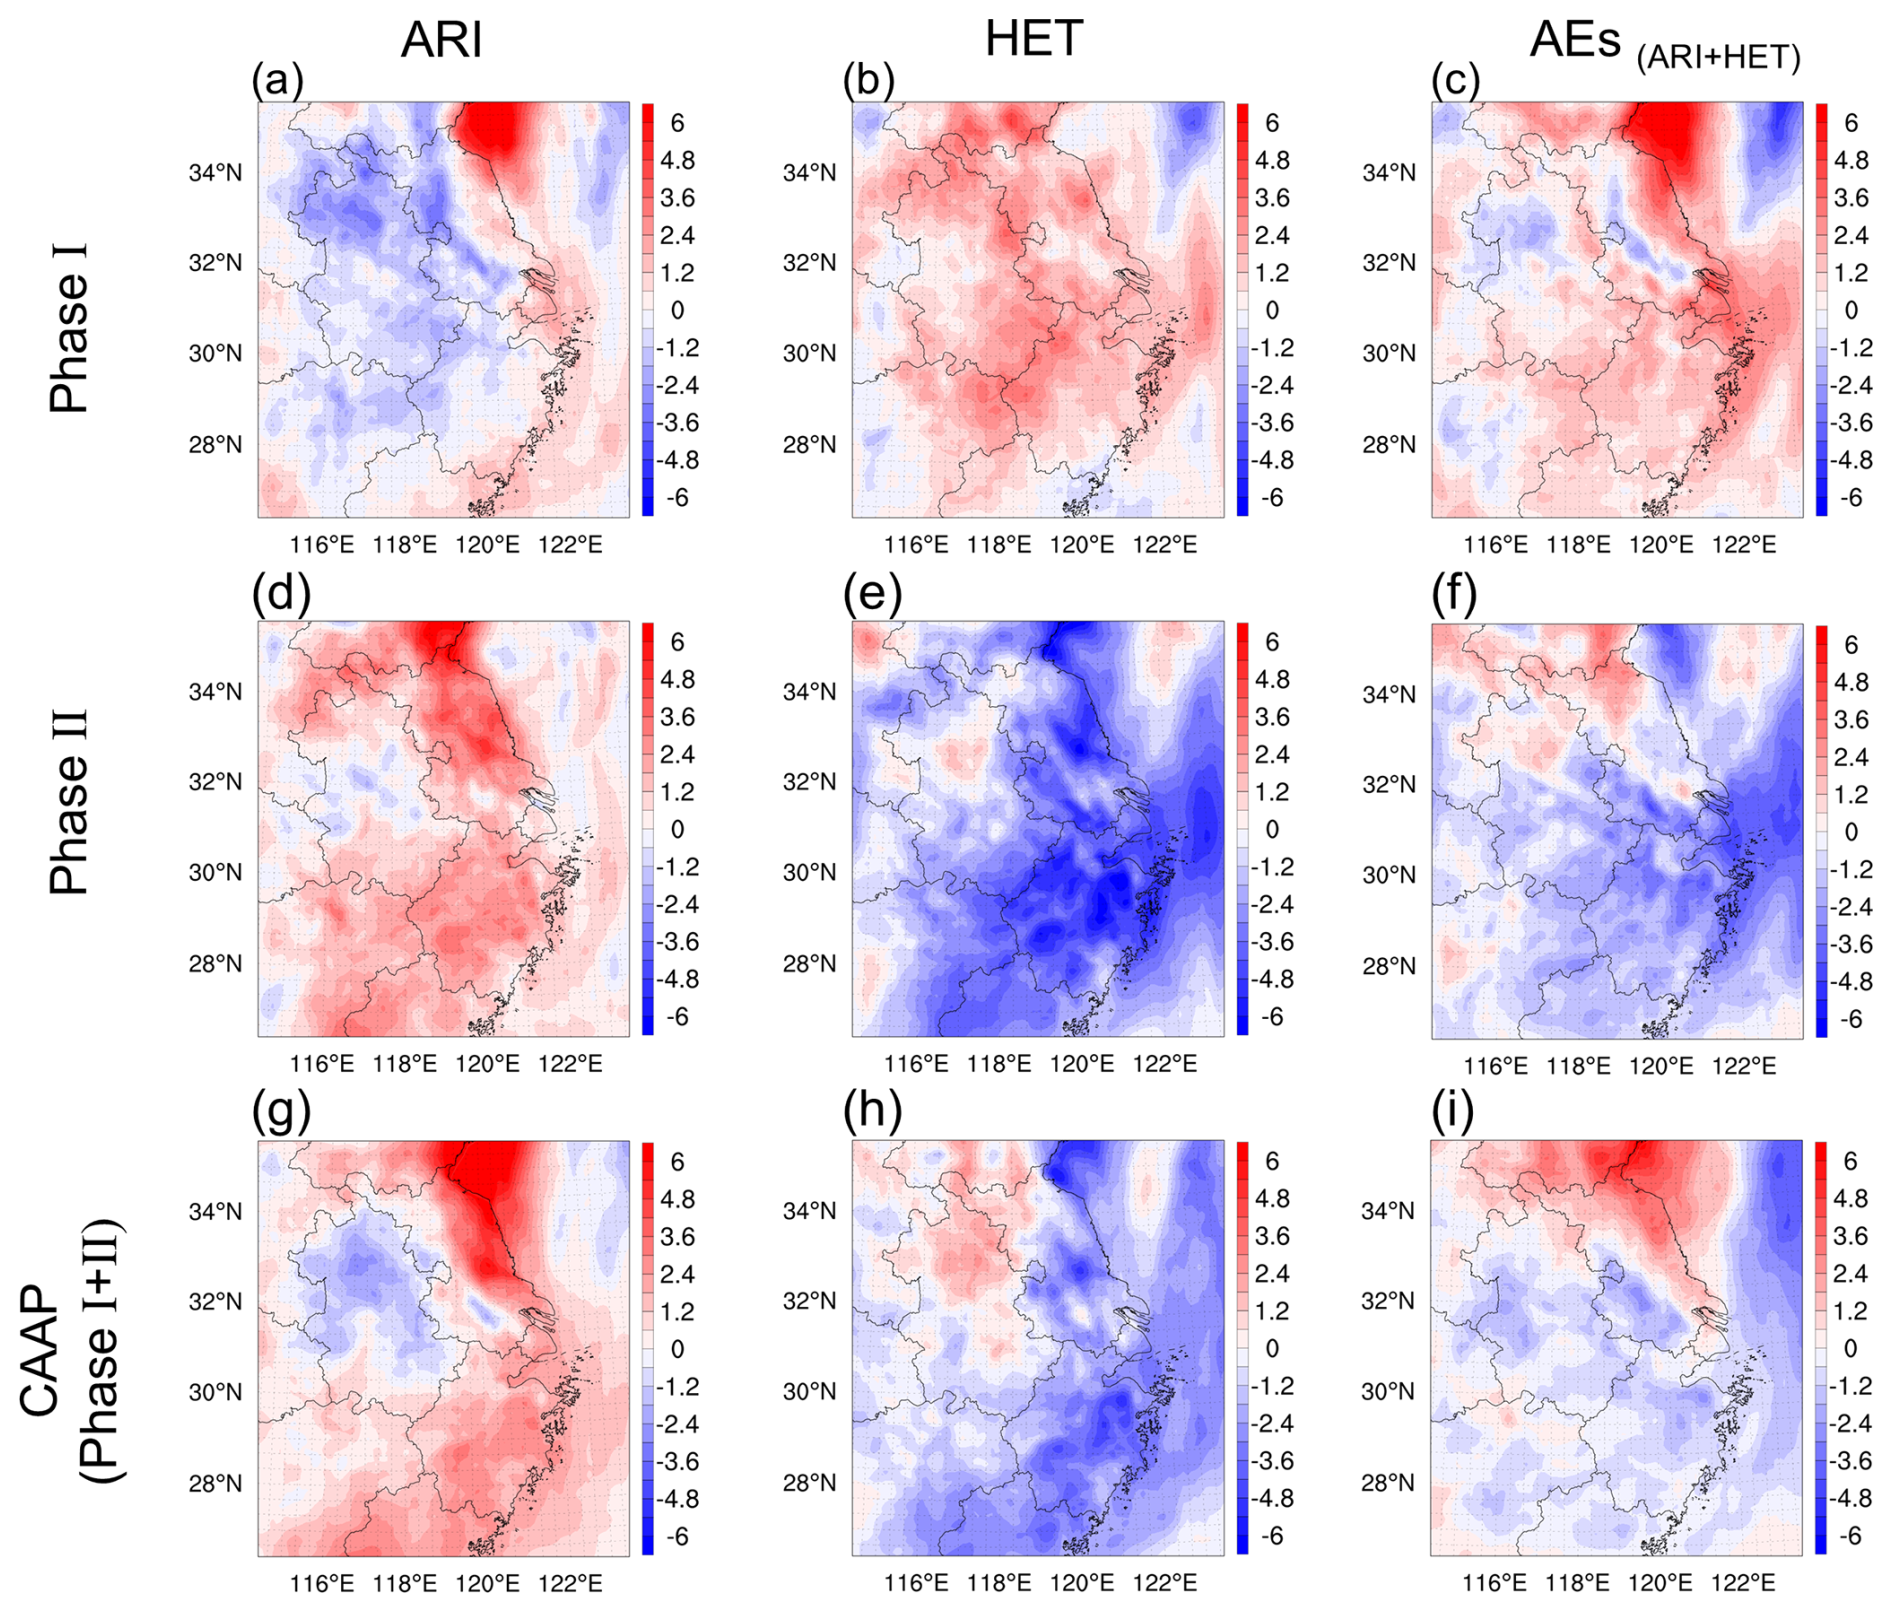
Figure 5Spatial distribution of summer O3 changes (ppb) over YRD driven by ARI (a, d, g), HET (b, e, h) and their combined effects (AEs, c, f, i) during two stages of the CAAP.
To elucidate the underlying mechanisms of aerosol impacts on O3, we examined the changes in key meteorological variables, photolysis rates, and HO2 radical concentrations induced by ARI and HET during the two implementation phases of the CAAP. Figure 6 presented the variations in five key meteorological parameters and the NO2 photolysis rate () in winter and summer as influenced by ARI. The results indicated that ARI consistently enhanced , SW, T2, WS10, and PBLH, while reducing RH2 during winter across both phases. These modifications – especially increased SW and T2 – significantly facilitated photochemical O3 production, thereby elevating O3. Notably, the magnitude of these changes was substantially greater in Phase I than in Phase II, which can be attributed to the more pronounced reductions in aerosol emissions during the earlier phase. In summer, ARI and HET exerted contrasting influences on ground-level O3, with their effects reversing between the two phases. ARI led to a slight decrease in O3 (−0.51 ppb), likely due to enhanced vertical mixing from reduced aerosol extinction, which increased solar radiation and photolysis rates. However, the concurrent rise in temperature and PBLH may have diluted surface O3 in certain regions (Fig. 6b), resulting in a net negative O3 response to ARI during this phase. In Phase II, the ARI-induced increases in T2 and photolysis rates more effectively enhanced photochemical O3 production. Simultaneously, reductions in PBLH and WS10 during this period suppressed vertical and horizontal O3 dispersion (Fig. 6b), collectively leading to a net positive O3 response (+1.56 ppb).
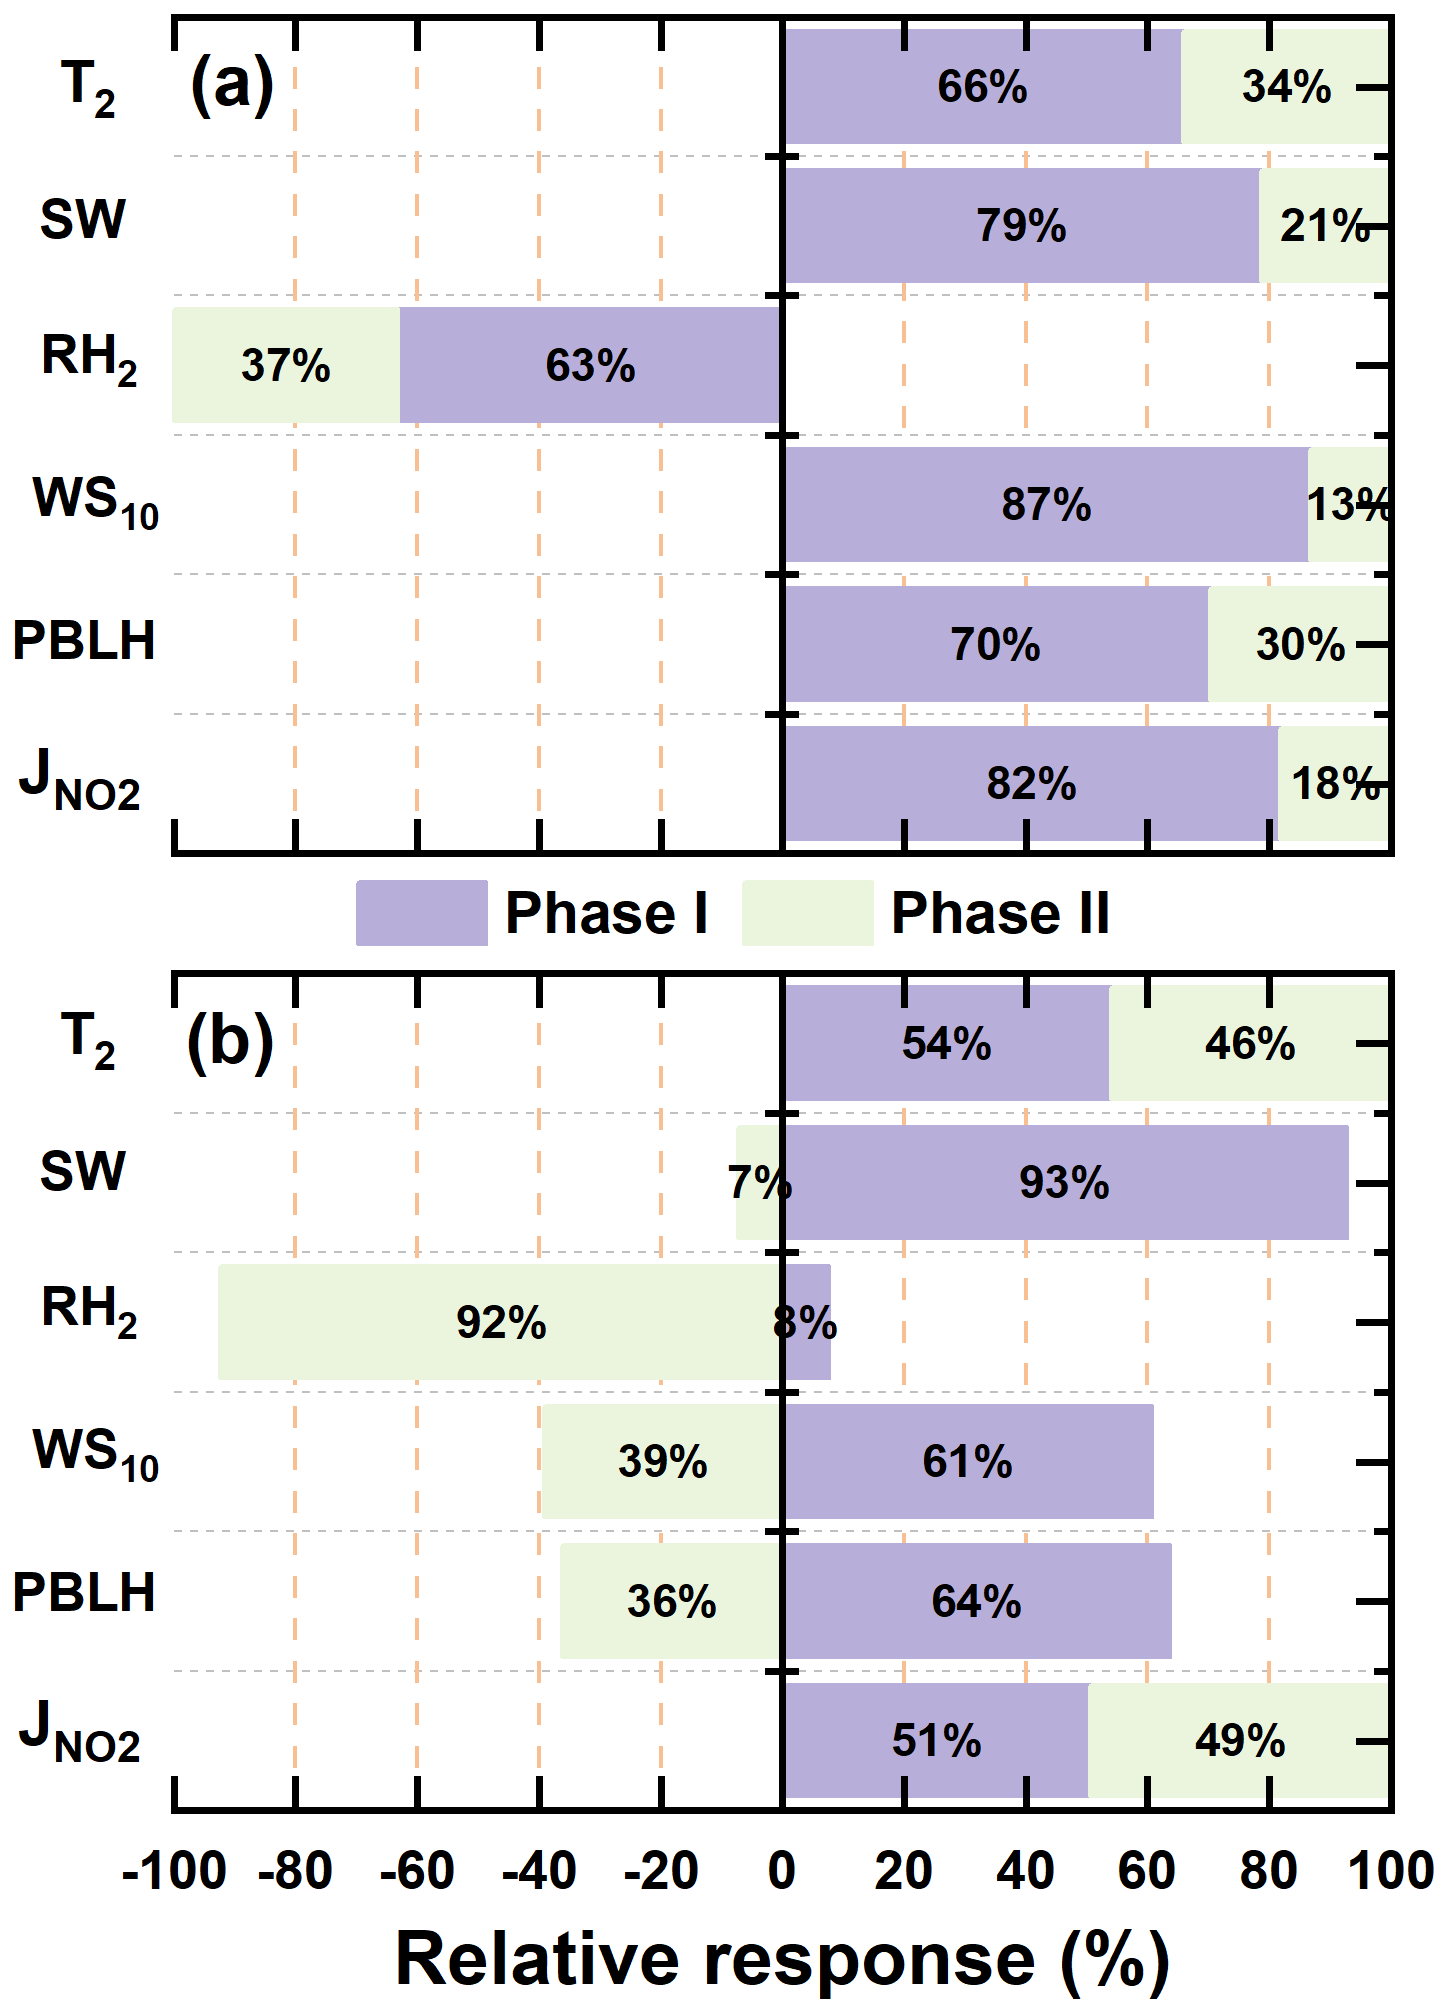
Figure 6ARI-driven relative responses of meteorological fields and photolysis rates in YRD during winter (a) and summer (b) for the two CAAP stages.
During Phase I, the substantial reductions in aerosol mass and surface area primarily weakened HO2 heterogeneous uptake, as indicated by elevated HO2 (Fig. 7d). This reduction in radical loss increased the availability of HO2 and OH, leading to an enhancement in the photochemical ozone production term P(O3) (Dyson et al., 2023). In parallel, N2O5 also increased during Phase I (Fig. S5a), consistent with suppressed heterogeneous hydrolysis under reduced aerosol liquid water (ALW) and diminished aerosol surface area (Brown and Stutz, 2012). The weakened N2O5 hydrolysis further limited nighttime conversion of reactive nitrogen to HNO3, maintaining NOx in more photochemically active forms (Ma et al., 2023b). Meanwhile, heterogeneous NO2 uptake – an important HONO source – was significantly reduced, consistent with the simulated decrease in HONO (Fig. S5d). The reduction in HONO slightly weakened early-morning radical initiation (Yu et al., 2022), but this influence was outweighed by the strong enhancement in HO2 and the limited conversion of NOx into HNO3. As a result, HET exerted a net positive contribution to O3 (+1.62 ppb) in Phase I. In contrast, Phase II exhibited a fundamentally different chemical response. Although aerosol loadings continued to decrease, the relative importance of heterogeneous pathways shifted substantially. HO2 declined during Phase II (Fig. 7e), indicating a reduced radical pool and weaker propagation of daytime photochemical production. At the same time, N2O5 decreased markedly (Fig. S5b), suggesting that nighttime N chemistry became less effective at sustaining reactive nitrogen cycling under even lower aerosol surface area and ALW. Rather than promoting efficient nighttime NOx recycling, this suppression favored a net loss of reactive nitrogen through terminal sinks (e.g., HNO3), shifting NOx partitioning toward less photochemically active forms and weakening daytime P(O3). Conversely, HONO concentrations rebounded during Phase II (Fig. S5e). This increase reflects the altered balance between NO2 uptake and nighttime NOx partitioning under reduced N2O5 hydrolysis. However, despite this HONO increase, its positive effect on radical initiation could not compensate for the combined decline in HO2, weakened N2O5 hydrolysis, and enhanced HNO3 formation (George et al., 2015). The joint effect was a net reduction in the morning radical pool and diminished photochemical O3 production (−2.86 ppb). This multi-pathway adjustment explains the observed sign reversal of HET's effect on O3 between the two phases and underscores the importance of considering the full suite of heterogeneous processes – rather than radical uptake alone – when interpreting aerosol-mediated O3 responses. In future work, we plan to apply integrated process rate (IPR) diagnostics to more directly evaluate how individual heterogeneous pathways – such as HO2 uptake, HONO formation, and N2O5 hydrolysis – shape the resulting O3 responses. Coupled with continued improvements in heterogeneous chemistry parameterizations and more comprehensive constraints on radical, reactive nitrogen, and aerosol liquid water fields, this will enable a more detailed and process-resolved understanding of phase-dependent O3 changes.
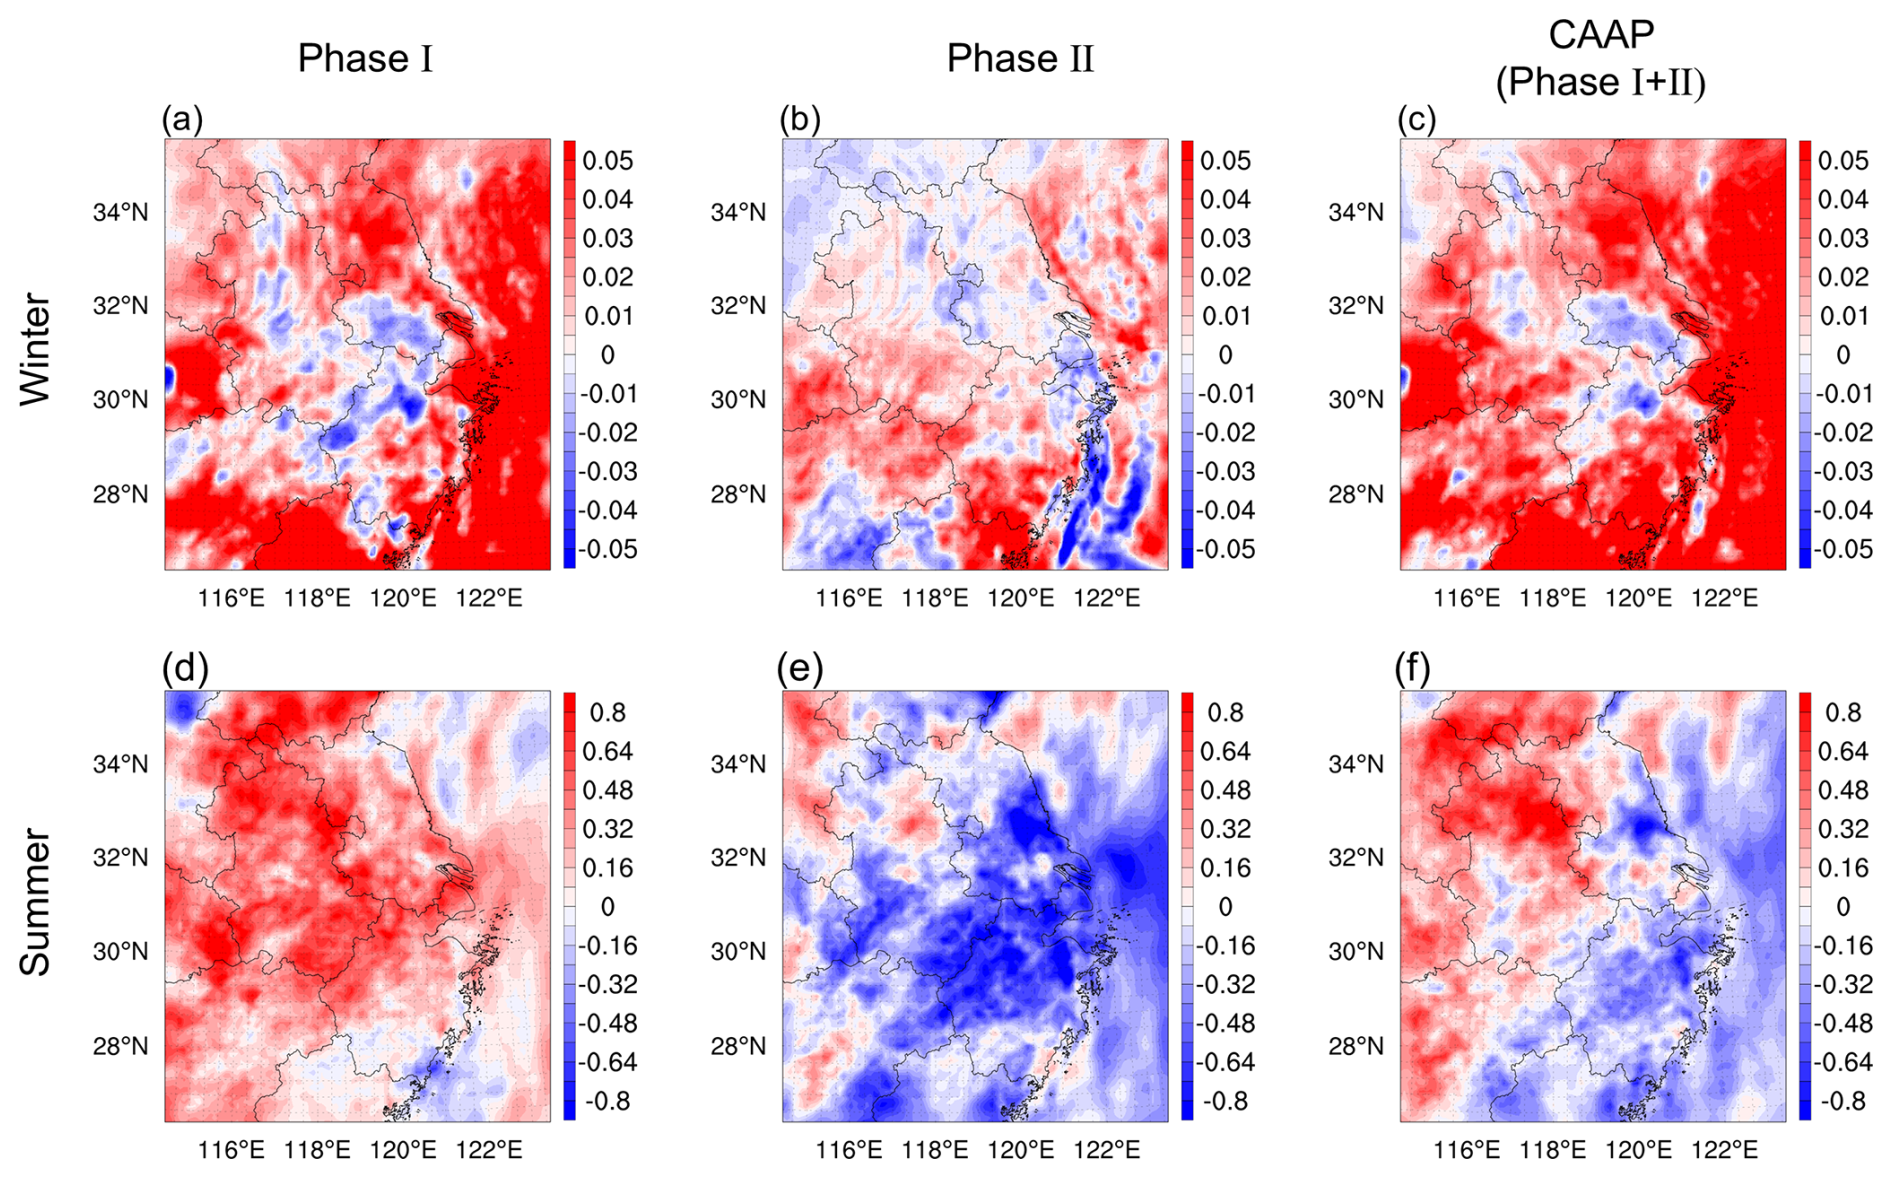
Figure 7Spatial distributions of HO2 concentration (ppt) changes induced by HET in winter (a–c) and summer (d–f) during two phases of the CAAP in YRD.
To further evaluate whether daytime and nighttime O3 responses compensate within the daily mean metric, we examined the diurnal cycles of baseline O3 concentration and the aerosol-mediated impacts (HET, ARI, and AEs) during Phase I, Phase II, and the overall CAAP period for both winter (Fig. S6) and summer (Fig. S7). Across all phases and both seasons, the dominant O3 perturbations occur during daytime hours, coinciding with the photochemical peak at 14:00–16:00 LT. In winter, Phase I exhibits a pronounced daytime enhancement driven by ARI (up to ∼2.41 ppb), whereas HET induces a consistently positive but comparatively weaker increase (up to ∼0.49 ppb). In Phase II, the ARI-induced enhancement weakens notably (peaking at ∼1.24 ppb), and HET-induced changes remain minor. In summer, the diurnal behavior more clearly reflects a daytime-dominated response. During Phase I, HET produces a marked midday O3 enhancement (up to ∼2.01 ppb), while ARI imposes a weaker yet persistent negative contribution. In contrast, Phase II is characterized by a strong HET-driven daytime O3 decrease (maximum ∼3.43 ppb), overwhelming the comparatively modest positive ARI effect. For all cases, nighttime O3 changes share the same direction as daytime responses but remain substantially smaller in magnitude, insufficient to offset the daytime signals dominated by photochemistry. These diurnal patterns confirm that the phase-dependent O3 responses to aerosol effects are not artifacts of day–night compensation in daily mean metrics, but instead arise from robust, daytime-dominant photochemical adjustments.
Previous studies showed that ARI and HET were not fully independent and could interact through aerosol–meteorology–chemistry feedbacks (Chen et al., 2019; Liu et al., 2023b; Kong et al., 2018; Li et al., 2020a). ARI-induced increases in near-surface relative humidity typically enhanced aerosol hygroscopic growth and expanded aerosol surface area. The resulting increase in aerosol liquid water promoted gas-to-particle partitioning and facilitated aqueous- and surface-phase reactions, thereby accelerating heterogeneous oxidation pathways involving SO2 and NOx. The strengthened heterogeneous formation of secondary inorganic aerosols further modified solar radiation and potentially intensified the ARI effect. In the present study, our primary focus was to quantify the separate and combined contributions of ARI and HET to O3 changes across different stages of the CAAP. Accordingly, we isolated their individual impacts rather than examining their nonlinear coupling. We acknowledged that ARI–HET interactions might also affect O3 under certain chemical and meteorological conditions, and we indicated that future work would incorporate dedicated coupled-sensitivity experiments to more explicitly quantify these nonlinearities and their implications for O3 formation.
Figure S8 illustrated the hierarchical relationships among the four factors analyzed in this section. Emission reductions and meteorological variability constituted the external drivers of O3 changes, whereas ARI and HET acted as aerosol-mediated modulators that adjust the emission-reduction-driven O3 responses. This framework motivated our presentation sequence, where external drivers were examined first, followed by the modulation effects of ARI and HET. Figure 8 presented the relative contributions of major driving factors to surface O3 changes during the two phases of the CAAP. In winter, anthropogenic emissions emerged as the dominant driver of O3 increases during Phase I, contributing 6.3 ppb, primarily due to enhanced photochemical production under VOCs-limited conditions. In contrast, Phase II saw a modest O3 decline (0.9 ppb) resulting from co-reductions in NOx and VOCs, suggesting improved control effectiveness through coordinated precursor mitigation. Meteorological changes consistently exerted a suppressive effect on wintertime O3, contributing −1.7 and −2.1 ppb in Phases I and II, respectively. AEs – mediated by ARI and HET – also contributed to O3 accumulation, particularly in Phase I (+1.46 ppb), though their influence weakened in Phase II (+0.73 ppb) due to the smaller reductions in aerosol loading. Overall, the wintertime O3 increase in Phase I was jointly driven by emissions and aerosol-related processes, while the slight decline in Phase II reflected the synergistic benefits of emission reductions and favorable meteorological conditions. In contrast, the attribution profile for summer revealed a dominant role of meteorology. Meteorological variability accounted for a substantial O3 increase in Phase II (+4.6 ppb), outweighing the contributions of emission changes. The effect of emission reductions on summer O3 was limited and nonlinear: a slight increase (+1.3 ppb) was observed in Phase I, followed by a minor decline (−1.5 ppb) in Phase II, indicative of a photochemical regime with weak emission sensitivity. Aerosol-related effects exhibited strong seasonal contrasts. HET was the dominant mechanism influencing O3 in both summer phases, albeit with opposite signs – enhancing O3 by 1.62 ppb in Phase I but reducing it by 2.86 ppb in Phase II. These contrasting effects likely reflect differences in HO2 uptake efficiency under evolving humidity and temperature conditions. ARI effects were comparatively modest, leading to a slight O3 decrease in Phase I (0.51 ppb) and an increase in Phase II (1.56 ppb), likely driven by enhanced photolysis and reduced vertical mixing.
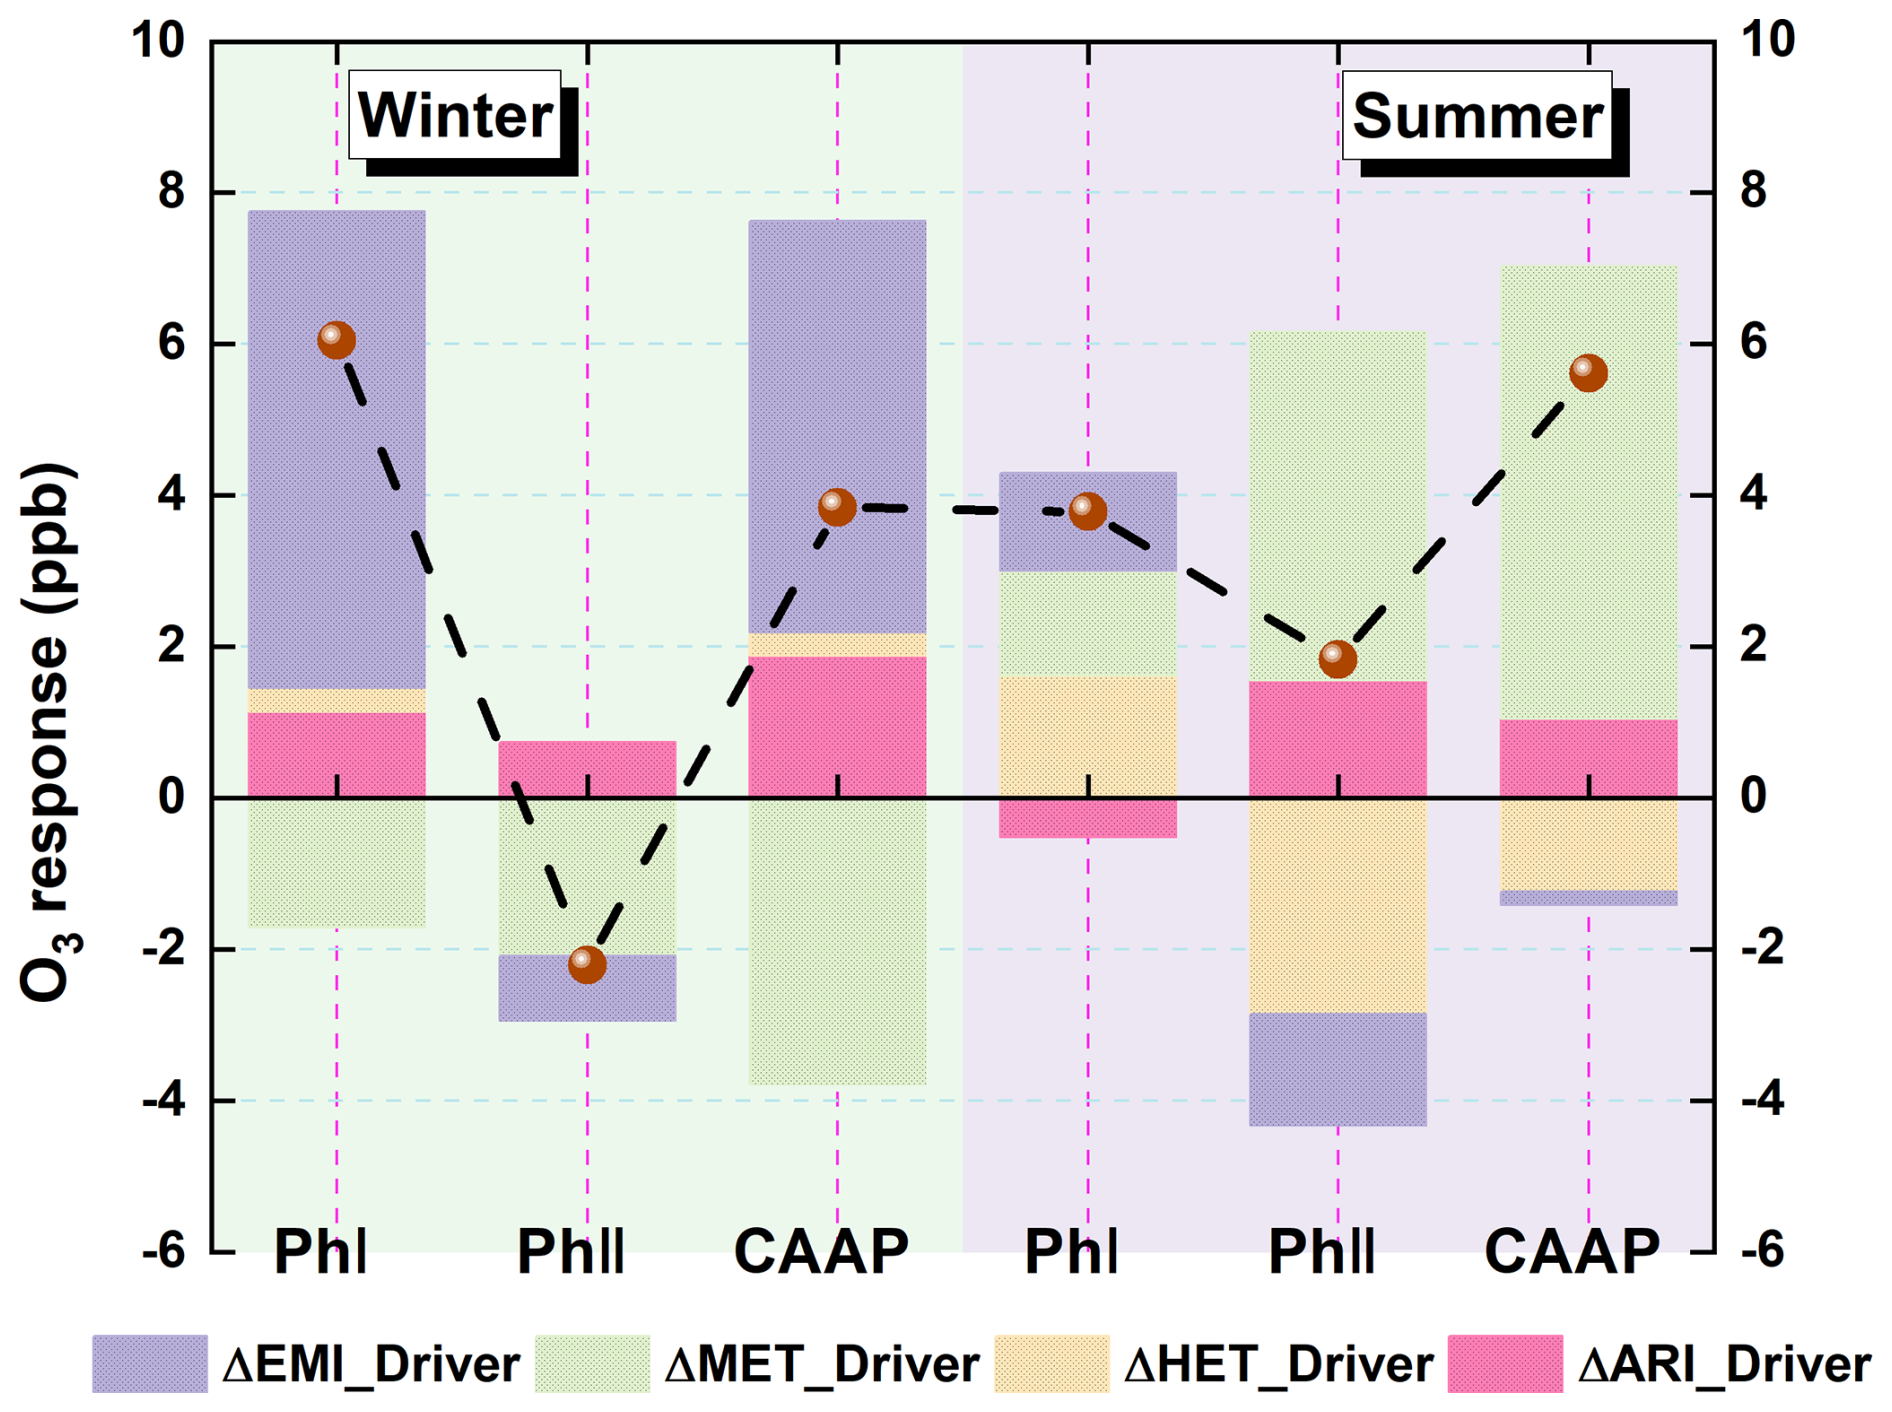
Figure 8Quantitative attribution of surface O3 changes over the Yangtze River Delta (YRD) during the two CAAP phases. Contributions from emission reductions (EMI), meteorological variability (MET), aerosol–radiation interactions (ARI), and heterogeneous chemistry (HET) are shown for winter (left) and summer (right).
Collectively, these results highlight the evolving interplay among emission control efforts, meteorological conditions, and aerosol effects in shaping surface O3 trends. While anthropogenic emissions primarily drove winter O3 increases during the early phase of the CAAP, the roles of meteorology and aerosol processes became increasingly prominent in summer and in the later policy phase. This multi-factor attribution framework aligns well with prior modeling and observational studies in eastern China (Zhu et al., 2021; Zhou et al., 2019). For example, Liu et al. (2023a) demonstrated that declining PM2.5 levels enhanced O3 formation by weakening HO2 radical scavenging, particularly under VOCs-limited regimes – a conclusion consistent with our wintertime results. Similarly, Yang et al. (2019) highlighted the growing influence of meteorological variability in recent years as the sensitivity of O3 to emission changes has diminished. Our study extends this knowledge base by providing phase-resolved attribution and explicitly separating the effects of ARI and HET. Notably, the reversal of HET-driven O3 responses in summer – from enhancement to suppression – has rarely been quantified and underscores the importance of dynamically characterizing aerosol–ozone interactions under evolving atmospheric and policy contexts.
3.3 O3 responses to precursor emission reductions under aerosol effects
Before presenting the simulation results, we first assessed the O3 chemical regimes over YRD using the widely adopted ratio (Jeon et al., 2018; Peng et al., 2011; Hammer et al., 2002; Zhang et al., 2000). This metric serves as a diagnostic indicator of O3 production sensitivity, with ratios <0.6 indicating VOCs-limited conditions, >0.8 denoting NOx-limited regimes, and intermediate values representing transitional states. Figure S9 showed the spatial distribution of this ratio under the baseline scenario (20E20M_AEs). The analysis reveals that wintertime O3 formation is predominantly VOCs-limited across the YRD, while in summer, most areas exhibit transitional or NOx-limited regimes, except parts of Anhui Province. Figure 9 displayed the simulated O3 responses to precursor reductions in both seasons. The results highlight strong seasonal differences and nonlinear sensitivities depending on chemical regime. In winter, reductions in primary PM2.5 and NOx led to substantial O3 increases. Specifically, 25 % and 50 % reductions in PM2.5 increased O3 by 0.7 and 1.5 ppb, respectively, while NOx reductions caused even larger enhancements of 4.8 and 10.2 ppb. These increases primarily stem from weakened aerosol suppression mechanisms – namely reduced heterogeneous uptake and increased photolysis rates – which enhance radical availability and photochemical activity. Additionally, under VOCs-limited conditions, NOx reductions diminish O3 titration by NO, further contributing to O3 accumulation. Among all precursors, NOx reductions produced the most pronounced O3 increase. In contrast, NH3 and SO2 reductions exerted negligible impacts on O3, underscoring their limited roles in direct O3 photochemistry. VOCs controls, on the other hand, effectively suppressed O3 formation, with 25 % and 50 % reductions yielding decreases of 2.7 and 5.6 ppb, respectively. In summer, O3 responses followed broadly similar trends but with different magnitudes. Reducing PM2.5 and NOx increased O3 by 2 and 4.3 ppb (PM2.5) and 0.8 and 1.6 ppb (NOx), respectively. Notably, the O3 increase associated with PM2.5 reductions exceeded that from NOx cuts, underscoring the critical role of particulate matter in regulating radical chemistry via aerosol-mediated pathways. VOCs reductions remained the only control strategy that consistently decreased O3, lowering concentrations by 1.6 and 3.4 ppb for 25 % and 50 % reductions, respectively. Again, NH3 and SO2 reductions had negligible effects. Collectively, these findings suggest that continued PM2.5-targeted controls may inadvertently worsen O3 pollution under active AEs, particularly in summer. In contrast, VOCs mitigation remains the most robust and seasonally effective strategy for O3 reduction.
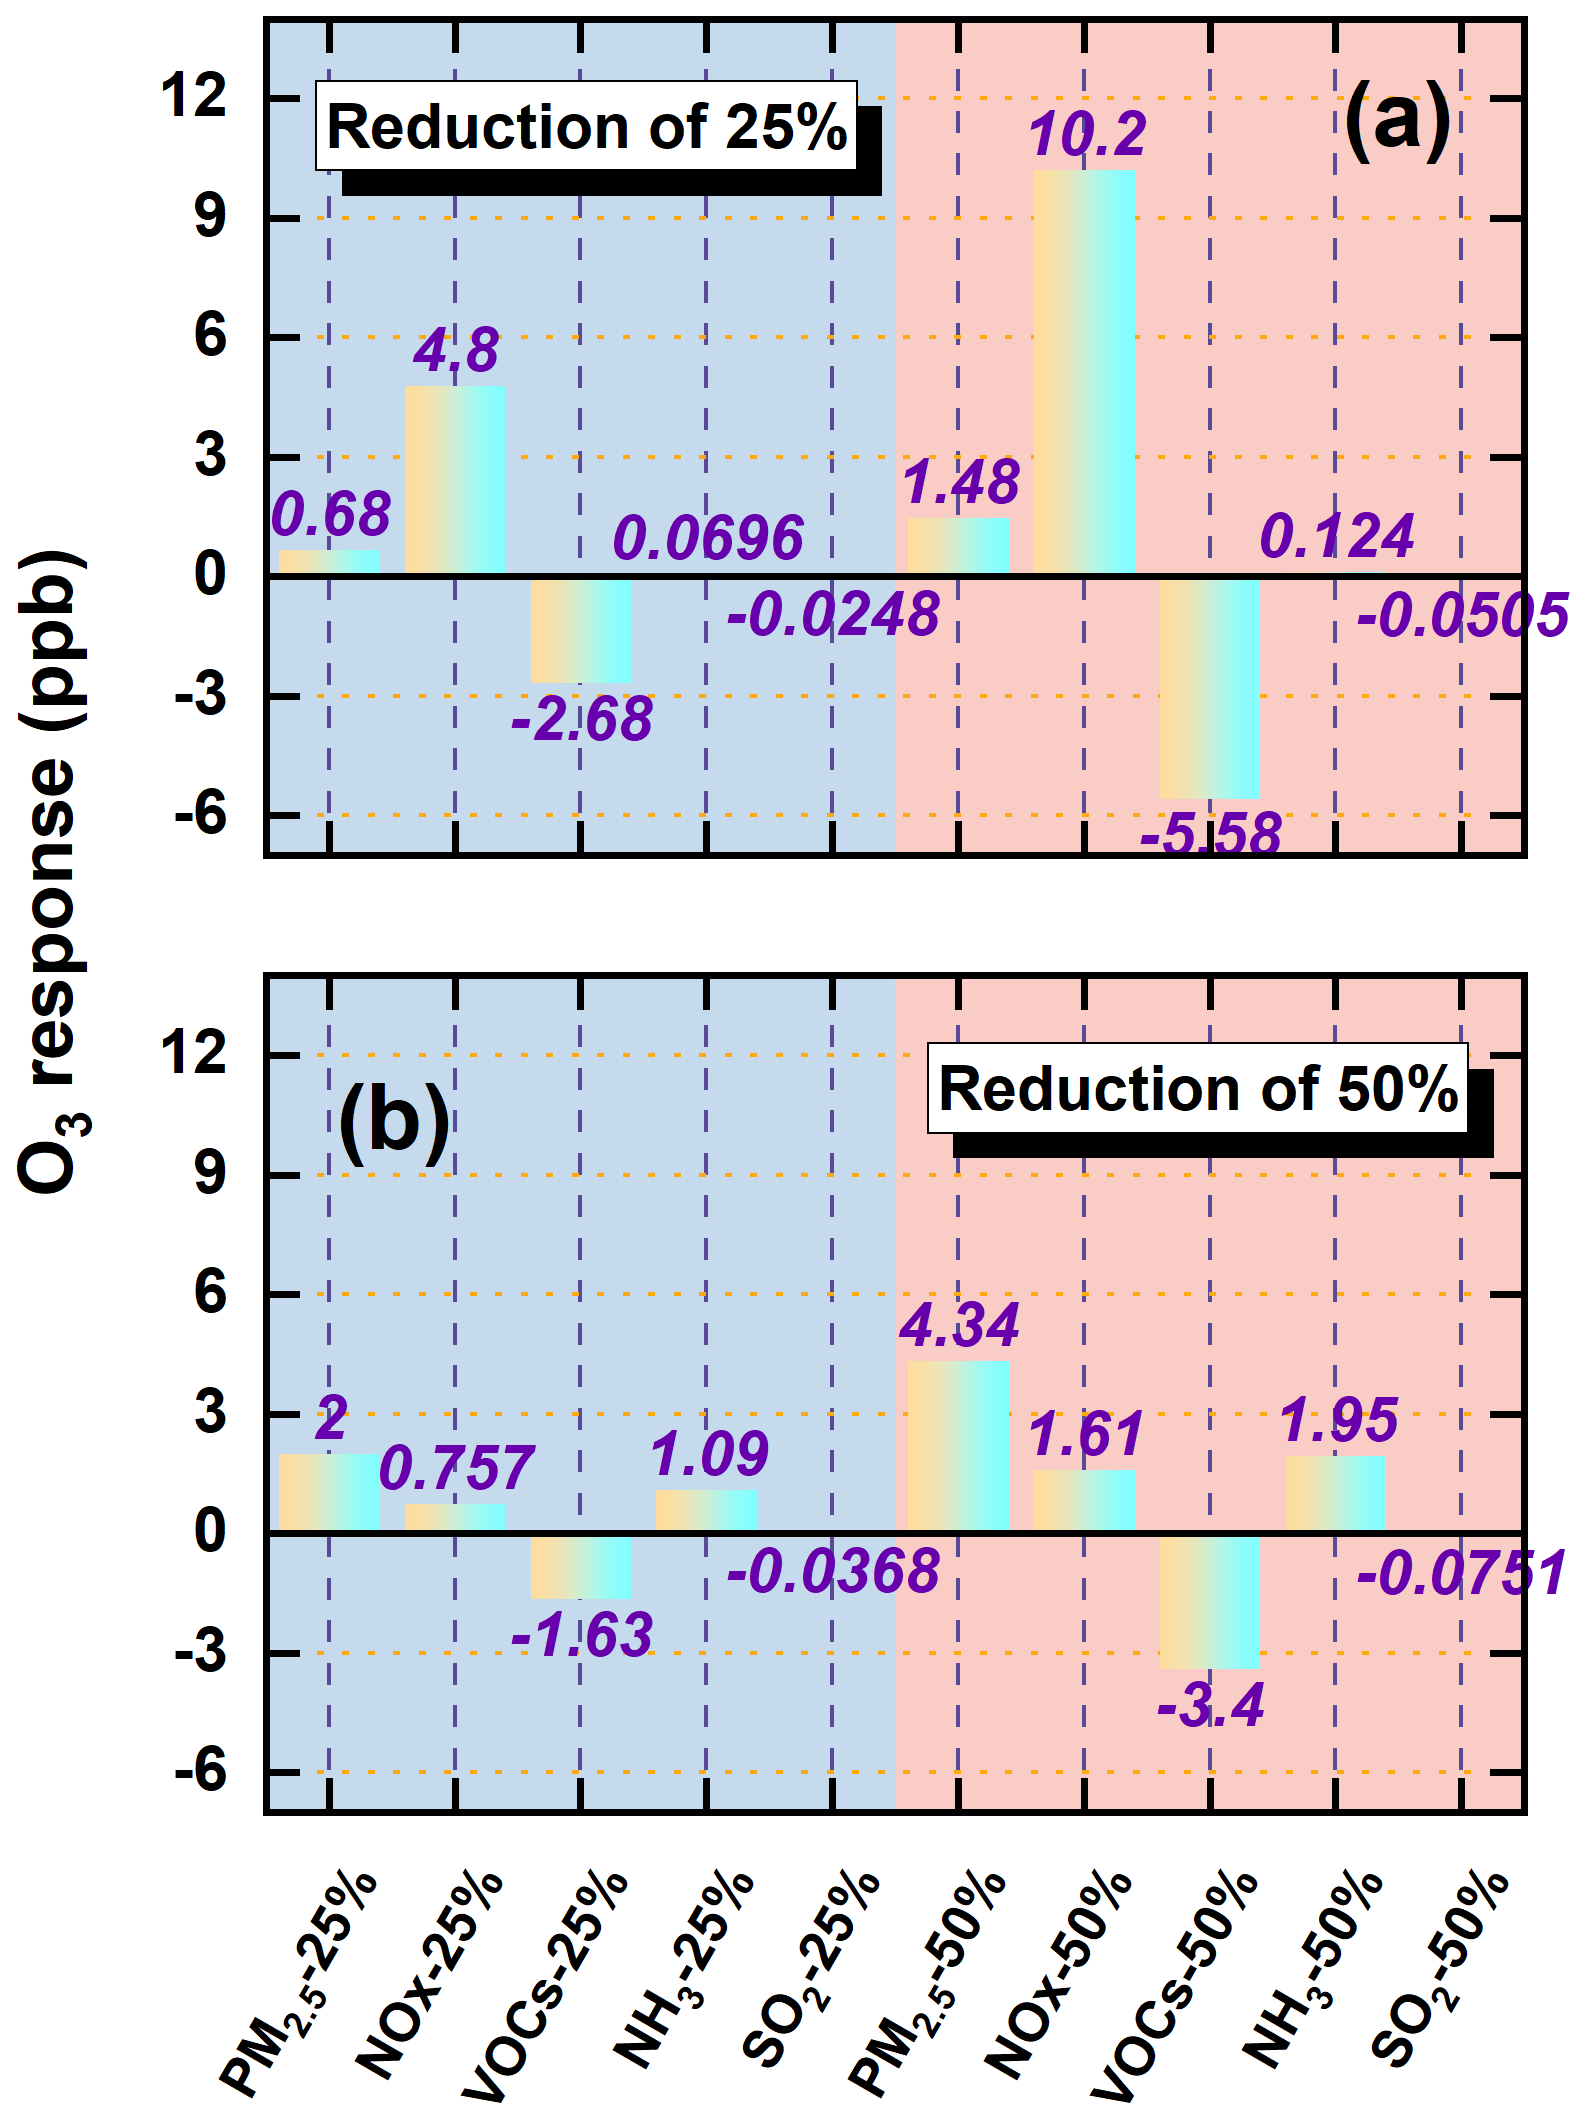
Figure 9O3 concentration changes (ppb) in response to 25 % and 50 % reductions in precursor emissions over YRD during winter (a) and summer (b).
Figure S10 presented the distribution of O3 changes under 25 % and 50 % precursor reductions for both seasons. Strong seasonal contrasts and regional gradients in O3 responses are evident. Reductions in PM2.5 consistently caused widespread O3 increases across the YRD, with the most pronounced enhancements in northwestern inland regions – particularly southern Jiangsu and central-to-northern Anhui – where historically high aerosol burdens make O3 formation especially sensitive to weakened aerosol suppression (via ARI and HET). Conversely, coastal cities such as Shanghai and eastern Zhejiang exhibited smaller O3 increases, reflecting their lower baseline aerosol concentrations and weaker aerosol feedbacks. VOCs reductions led to the largest O3 decreases in urban corridors, particularly along the Shanghai–Nanjing–Hangzhou (SNH) axis, where VOCs emissions are elevated and O3 formation is strongly VOCs-sensitive. NOx reductions yielded seasonally opposite effects: in winter, O3 increased broadly across the YRD, while in summer, decreases were observed in most regions except Anhui Province. These patterns align with seasonal chemical regimes inferred from ratios – VOCs-limited in winter and NOx-limited or transitional in summer. NH3 and SO2 reductions produced negligible spatial effects in both seasons, reinforcing their limited involvement in direct O3 photochemistry. These spatially heterogeneous responses highlight the need for geographically differentiated control strategies. Regions with historically high aerosol pollution are more likely to experience unintended O3 increases following PM2.5 or NOx reductions. Conversely, VOCs control provides consistent and widespread O3 benefits across both seasons, making it a key lever for achieving co-benefits in both PM2.5 and O3 mitigation.
To better understand the temporal dynamics of O3 responses, we analyzed diurnal variations in four representative cities – Shanghai, Nanjing, Hangzhou, and Hefei – under 50 % reductions of individual precursors (Fig. S11). In winter, NOx reductions led to substantial O3 increases during afternoon hours (14:00–17:00 LT (all times are local time)), particularly in urban centers like Shanghai and Hangzhou, where enhancements exceeded 15 ppb. These increases reflect the dual effect of diminished NO titration and enhanced photochemical activity. PM2.5 reductions also caused moderate O3 increases from late morning to early afternoon, underscoring the influence of both ARI and HET. VOCs reductions induced midday O3 declines (12:00–15:00) exceeding 5 ppb, consistent with VOCs-limited wintertime chemistry. In summer (Fig. S12), VOCs reductions suppressed O3 throughout the daytime, with maximum declines reaching up to 25 ppb in early afternoon, reaffirming the effectiveness of VOCs control. In contrast, PM2.5 reductions led to notable O3 increases during photochemically active hours (11:00–16:00), highlighting the critical role of aerosols in modulating radical cycles and O3 production. Overall, these diurnal profiles underscore the time-sensitive nature of O3 responses to precursor emission reductions. They emphasize the necessity for temporally and spatially refined control strategies that account for local photochemical regimes, emission structures, and AEs.
3.4 Future O3 responses to Carbon neutrality–driven emission reductions considering aerosol effects
We performed a suite of sensitivity experiments using the 2020 anthropogenic emissions as the baseline to examine prospective O3 responses to emission mitigation under China's carbon peaking and carbon neutrality pathways. As shown in Fig. 10, O3 exhibited pronounced seasonal variability in response to progressive emission reductions. In winter, regional mean O3 increased monotonically with the magnitude of emission cuts, rising from +2.1 % under the 10 % reduction scenario to +14.6 % under the 90 % scenario. This counterintuitive increase is primarily attributed to two synergistic mechanisms: (1) reduced O3 titration resulting from NOx emission reductions, and (2) weakened aerosol-mediated O3 suppression due to lower aerosol loads, which diminish both ARI and HET processes. The reduced availability of aerosol surfaces and optical attenuation enhances photolysis rates and radical propagation, thereby promoting O3 accumulation. In contrast, summer O3 declined steadily with increasing emission reductions, from −1.5 % to −16.5 % across the same range. This decline reflects the dominance of VOCs-limited or transitional photochemical regimes in the region during summer, where coordinated reductions in NOx and VOCs effectively suppress O3 formation. These results underscore the seasonal asymmetry of O3 responses under the carbon-neutrality-aligned emission trajectories used in this study – namely the proportional precursor-reduction pathways designed to reflect long-term, economy-wide emission declines. While such stringent reductions may inadvertently aggravate wintertime O3 pollution, they yield substantial co-benefits for summer O3 mitigation. The spatial distribution of O3 changes under these scenarios, presented in Fig. S13, further corroborates the contrasting seasonal patterns. In winter, O3 increases were most pronounced in inland areas of northern Anhui and central Jiangsu – regions characterized by historically high aerosol burdens and stronger aerosol-mediated O3 suppression. As emissions decline, the weakening of both aerosol effects and NOx titration leads to a disproportionate O3 rebound in these locations. The largest summer O3 reductions observed in densely populated urban corridors such as Shanghai, Nanjing, and Hangzhou. These metropolitan areas, with high precursor emissions and transitional or NOx-limited chemical regimes, are particularly responsive to coordinated VOCs and NOx controls. The spatial heterogeneity in O3 responses highlights the necessity of designing region-specific and seasonally adaptive emission control strategies. Differentiated approaches are essential given the diverse pollution histories, chemical sensitivities, and aerosol–ozone coupling characteristics across the YRD.
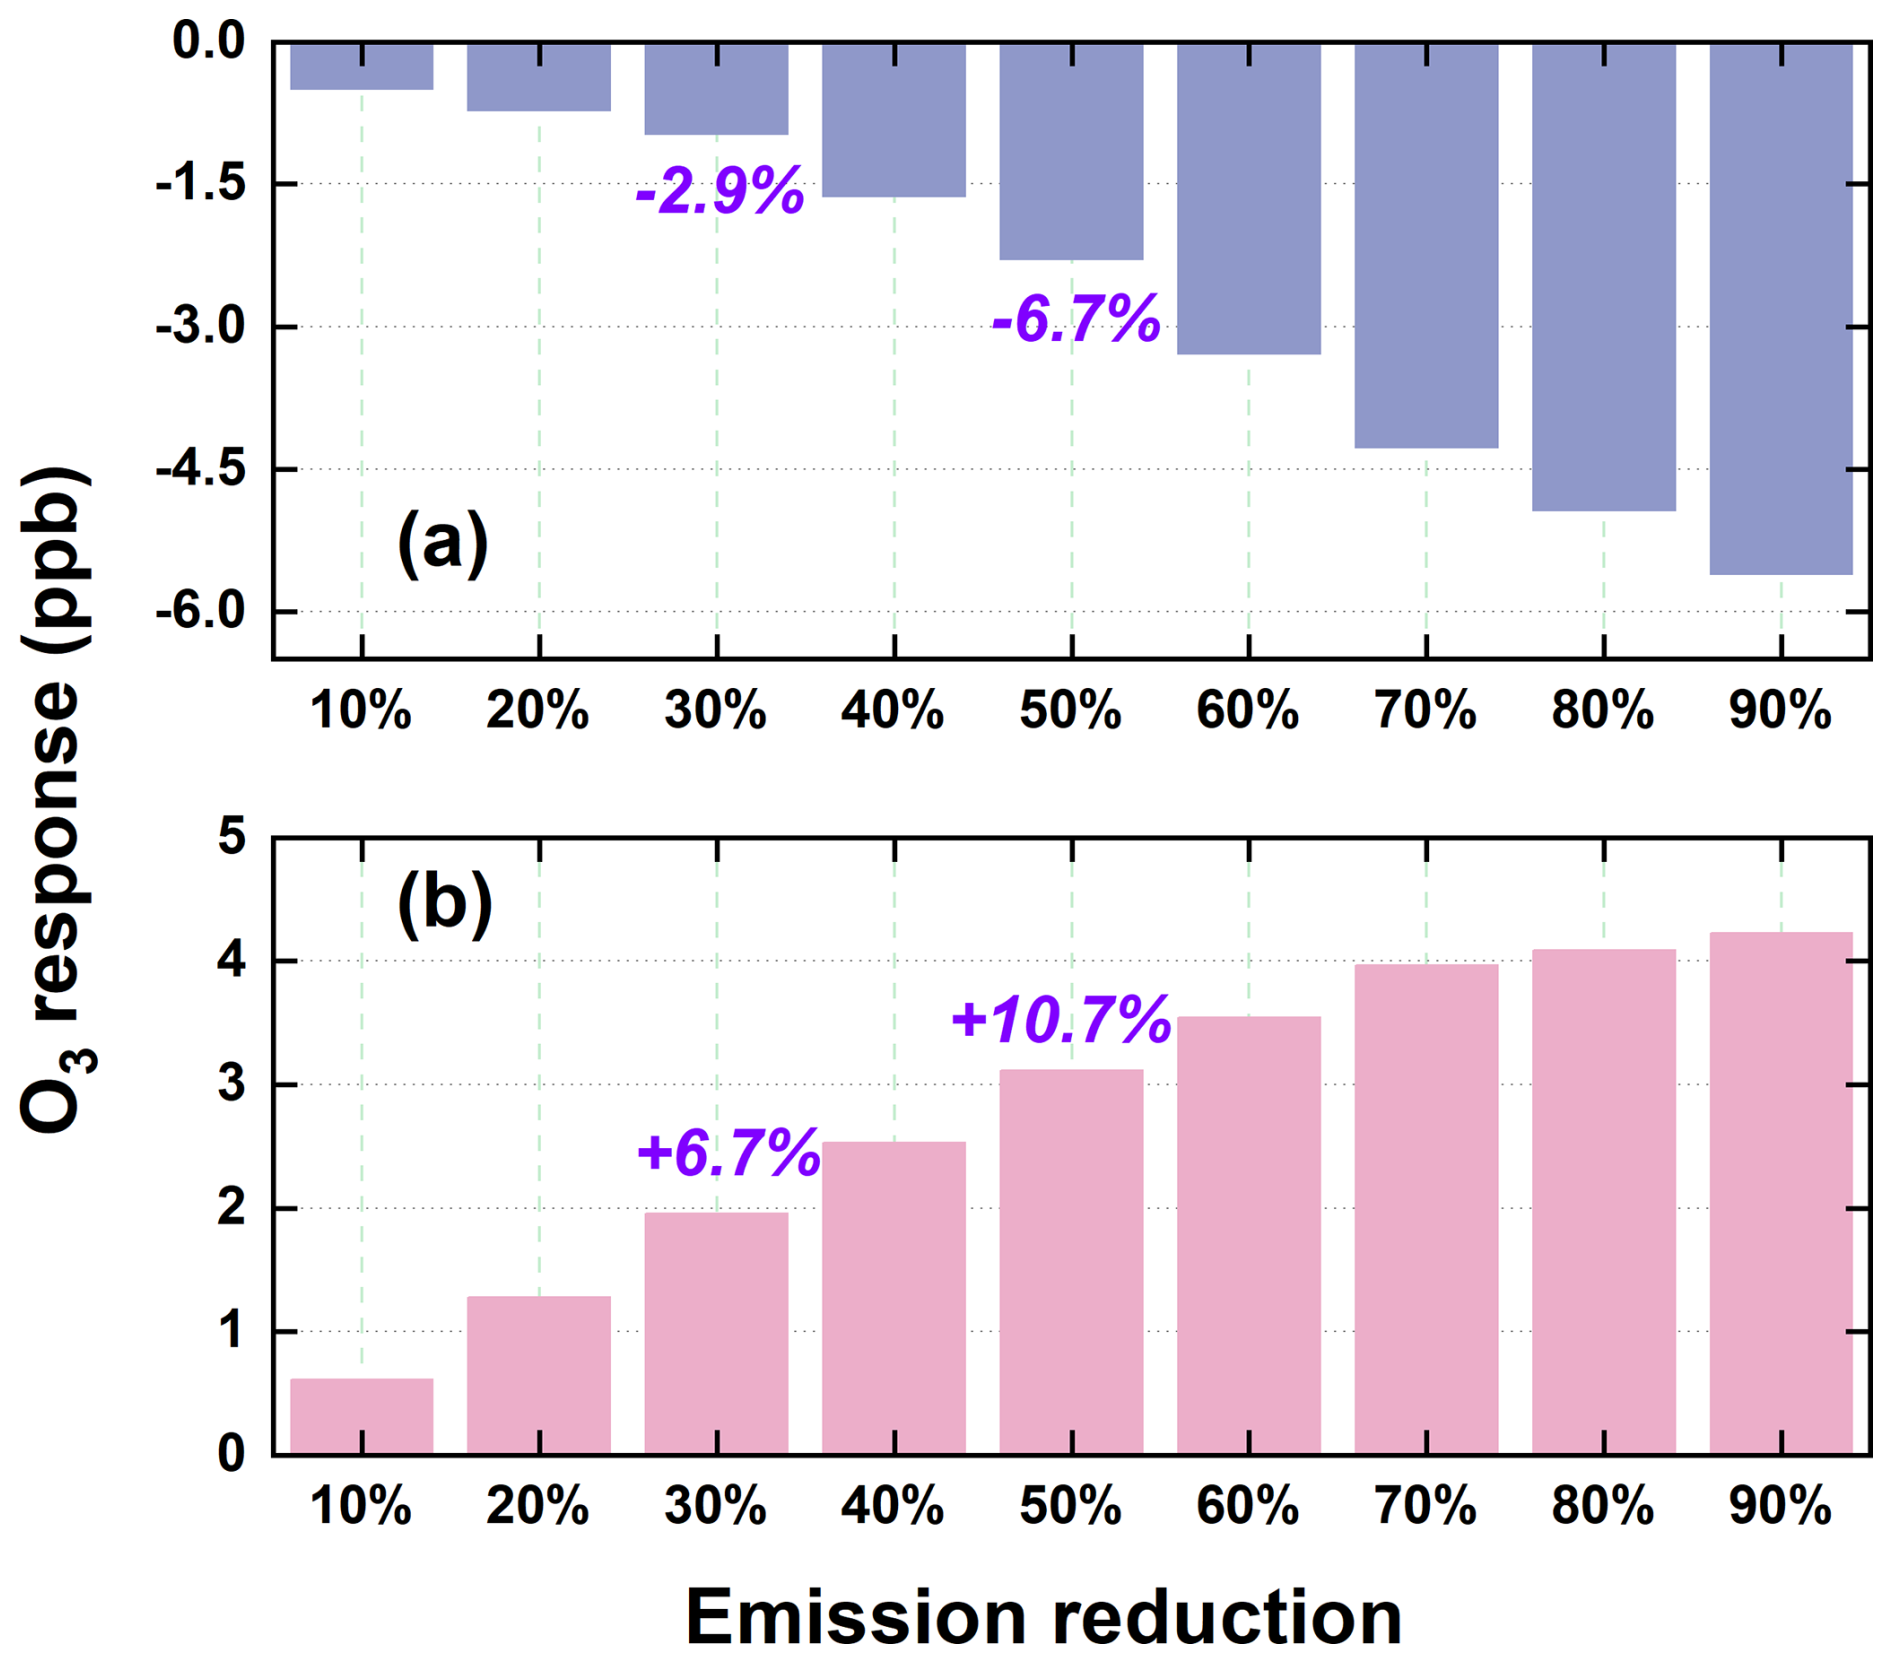
Figure 10Seasonal variations in O3 concentrations (ppb) projected under a range of emission reduction intensities (10 %–90 %), including representative scenarios for carbon peaking (30 %) and carbon neutrality (50 %), referenced to 2020 conditions with aerosol-related processes accounted for. Results for summer and winter are displayed in the upper and lower panels, respectively.
Overall, these findings suggest that carbon neutrality–driven emission pathways, if carefully managed, can yield significant summertime O3 mitigation benefits, but must be complemented with targeted wintertime strategies to avoid adverse trade-offs. The proportional 10 %–90 % reductions applied uniformly across all pollutant species were designed as an idealized framework to systematically examine nonlinear O3 responses under consistent boundary conditions. In practice, however, future emission pathways are expected to exhibit pronounced sectoral and spatial heterogeneity – for example, SO2 and primary PM2.5 typically decline faster than VOCs and NH3, and the pace of reductions varies across industrial, transportation, and residential sectors. Such differences may influence the magnitude of O3 responses and the balance among precursor contributions. Recognizing this limitation, future work will incorporate sector-resolved and scenario-specific emission pathways to provide a more realistic assessment of O3 sensitivity under evolving emission structures.
3.5 Discussion and policy implications
This study presented a comprehensive assessment of O3 responses to emission reductions under both the CAAP and future carbon neutrality pathways, explicitly considering aerosol effects. Our findings underscore that while emission control measures have been effective in substantially lowering PM2.5, they may yield unintended consequences for O3 pollution – particularly under VOCs-limited regimes during winter. Specifically, aerosol-induced enhancements in O3 – via weakened heterogeneous chemistry (HET) and increased photolysis (ARI) – highlight the necessity of accounting for multiphase feedback mechanisms in the design of future air quality strategies. Our phase-resolved, seasonally differentiated attribution analysis suggests that coordinated reductions in VOCs and NOx are critical for effective O3 mitigation, especially in summer when photochemical activity is most intense. Furthermore, the spatial heterogeneity of O3 responses calls for region-specific strategies. For instance, in inland areas with historically high aerosol burdens, the potential for O3 rebound due to weakened aerosol suppression is more pronounced, necessitating tailored mitigation approaches. In contrast, urban corridors such as the Shanghai–Nanjing–Hangzhou (SNH) axis – characterized by high VOCs emissions and transitional or NOx-limited regimes – stand to benefit most from targeted VOCs controls, particularly under future carbon-neutrality-driven reductions.
Uncertainties in HET parameterizations also introduce potential variability into the estimated O3 responses. The uptake coefficients (γ) for HO2, NO2, and N2O5 depend on aerosol liquid water content, acidity, ionic strength, and particle composition (Jacob, 2000), yet these dependencies remain imperfectly constrained in current atmospheric models. As a result, uncertainties in these parameters may alter the magnitude of individual heterogeneous pathways simulated in this study. For example, higher assumed HO2 uptake would strengthen radical loss and could reduce the positive HET contribution during Phase I, whereas larger N2O5 hydrolysis rates would enhance nighttime conversion of NOx to HNO3 and potentially intensify the negative HET influence in Phase II. Likewise, uncertainties in NO2 uptake and HONO yields could modulate early-morning radical initiation and shift the balance between radical propagation and reactive nitrogen recycling. Importantly, while such uncertainties may influence the absolute magnitude of HET-induced O3 perturbations, they are unlikely to overturn the direction of the response. Prior modeling studies provide support for this robustness. For instance, Shao et al. (2021) showed that varying between 0.2 and 0.08 altered the magnitude of the O3 increase driven by reduced HO2 heterogeneous uptake – from approximately 6 % (consistent with the ∼7 % reported by Li et al., 2019a), to about 2.5 % during 2013–2016 – yet the effect remained positive in all cases. These findings indicate that although heterogeneous uptake assumptions can change the amplitude of the response, the sign of the O3 change is preserved because the underlying chemical mechanism (reduced radical loss leading to enhanced photochemical production) remains the same. By analogy, the phase-dependent sign reversal identified in our study reflects a structural shift in the competition among HO2 uptake, N2O5 hydrolysis, and HONO formation pathways, and is therefore unlikely to be reversed by plausible uncertainties in individual uptake coefficients. Our future studies will incorporate dedicated sensitivity simulations and integrated process rate (IPR) diagnostics to more systematically quantify how uncertainties in heterogeneous chemistry parameterizations propagate into O3 simulations. Improvements in observational constraints on aerosol acidity, liquid water content, and heterogeneous reaction rates will further strengthen mechanistic understanding and reduce uncertainty in model-based assessments of aerosol–O3 interactions under evolving emission pathways.
It is worth emphasizing that all simulations were performed under a fixed-meteorology configuration, which was designed to isolate the influences of aerosol processes and emission changes on O3 by suppressing interannual meteorological variability. This strategy improves the interpretability of attribution results by reducing confounding weather effects, but it inevitably constrains the model's ability to capture O3 variability associated with meteorological extremes, such as heat waves or anomalous circulation patterns. As a result, caution is warranted when extending these findings to long-term evolutions or climate-change contexts, where interactions between emissions and meteorology may substantially alter O3 responses. Future work will explicitly address this limitation by conducting additional sensitivity experiments with time-varying meteorological conditions.
These findings carry timely relevance for China's national climate and environmental goals. As outlined in the 14th Five-Year Plan for Ecological and Environmental Protection and the 2060 Carbon Neutrality Roadmap, deep multi-sector emission cuts are pivotal for achieving synergistic benefits between air quality improvement and climate change mitigation. Our results demonstrate that under prevailing atmospheric chemical regimes – especially during winter – aggressive reductions in primary PM2.5 and NOx may inadvertently exacerbate O3 pollution unless accompanied by VOCs-focused controls and regionally tailored strategies. In light of these findings, we advocate for an integrated policy framework that (i) coordinates VOCs and NOx reductions according to regional O3 sensitivity, (ii) strengthens VOCs monitoring and inventory resolution at the city level, and (iii) explicitly incorporates aerosol effects in both short-term air pollution forecasting and long-term carbon-neutrality scenarios. Such targeted and mechanism-informed strategies will help bridge the current policy gap between PM2.5 control and O3 pollution mitigation, while ensuring co-benefits under evolving climate objectives.
We employed a phase- and season-specific WRF-Chem framework that explicitly accounted for aerosol–radiation interactions and heterogeneous chemistry to characterize aerosol-driven modulation of O3 over the YRD from 2013 to 2024. Through combined analyses of emission transitions, meteorological variability, and carbon-neutrality–oriented scenarios, this study provides an integrated assessment of the mechanisms governing historical O3 changes and future responses to precursor emission controls.
O3 exhibited a distinct rise–fall trajectory over the past decade, shaped by complex interactions among emission reductions, meteorological changes, and aerosol effects. During Phase I, substantial reductions in PM2.5 and SO2, coupled with inadequate VOCs controls, led to significant wintertime O3 increases (6.29 ppb) and modest summer increases (1.28 ppb). In Phase II, more balanced reductions in NOx and VOCs effectively suppressed O3 formation. Meteorological variability also exhibited seasonally asymmetric impacts – suppressing O3 in winter but enhancing accumulation in summer. While wintertime O3 changes were primarily driven by emissions, summertime variations were dominated by meteorological factors. Aerosol effects further modulated O3 concentrations through seasonally distinct mechanisms. In winter, ARI played the dominant role: the substantial aerosol reductions in Phase I enhanced solar radiation and boundary layer development, promoting O3 formation (1.14 ppb); these effects weakened in Phase II (0.73 ppb). Summer O3 was more sensitive to HET. In Phase I, aerosol decreases weakened heterogeneous radical uptake, enhancing O3 formation (+1.62 ppb). In Phase II, however, the net HET effect reversed sign (−2.86 ppb), driven by shifts in multiple heterogeneous pathways – including changes in radical uptake, HONO and N2O5 chemistry, and aerosol liquid water – rather than radical scavenging alone.
Accounting for aerosol effects, precursor emission reductions elicited marked seasonal and spatial O3 responses. In winter, a 50 % reduction in VOCs effectively suppressed O3 by 5.58 ppb, whereas equivalent reductions in NOx and PM2.5 increased O3 by 10.2 and 1.48 ppb, respectively – primarily due to weakened O3 titration and radical loss processes. In summer, reductions in PM2.5 led to greater increases in O3 than NOx (4.34 vs. 1.61 ppb under the 50 % reduction scenario), highlighting the crucial role of aerosol effects in shaping photochemical O3 production. Under carbon neutrality–driven emission reduction scenarios, O3 exhibited pronounced seasonally contrasting responses. In winter, O3 increased monotonically with the magnitude of emission cuts, primarily due to the weakened titration by NO and the diminished aerosol-mediated suppression via heterogeneous chemistry and radiation attenuation. In contrast, summer O3 consistently declined, with the most substantial improvements observed in high-emission urban corridors. These reductions were mainly driven by the synergistic control of NOx and VOCs under NOx-limited and transitional photochemical regimes. When aerosol effects were considered, wintertime O3 increased by 6.7 % and 10.7 % under carbon peaking and neutrality scenarios, respectively, whereas summertime O3 decreased by 2.9 % and 6.7 %, highlighting the critical role of multiphase aerosol effects in shaping future air quality outcomes and making climate mitigation strategies.
While this study provides innovative and policy-informative findings, several uncertainties remain that warrant further investigation. Uncertainties primarily arise from limitations in the parameterization of heterogeneous chemistry, assumptions in future emission projections, and the current resolution of VOCs emission inventories. Future efforts should prioritize the enhancement of real-time VOCs monitoring, vertical profiling of O3 and its precursors, and the refinement of multiphase chemical processes in regional models. In conclusion, a holistic and mechanism-informed approach – one that jointly accounts for emissions, aerosol effects, atmospheric chemistry, and meteorology – is essential for the effective co-control of PM2.5 and O3 in the carbon neutrality era. Seasonally adaptive, region-specific, and chemically targeted policies are critical to maximizing air quality and climate co-benefits under evolving environmental and policy contexts.
The WRF-Chem model (version 3.7.1) used in this study is based on the standard release from NCAR (https://doi.org/10.5065/D6MK6B4K, Grell et al., 2005), with modifications to the aerosol and chemical mechanisms. Details of these modifications are documented in Sect. 2.2 of the paper. The updated code about model and NCL scripts used for data processing and visualization can be provided upon request.
The FNL (Final Analysis) meteorological data are available from the Research Data Archive of NCAR: https://doi.org/10.5065/D6M043C6 (National Centers for Environmental Prediction (NCEP), National Weather Service, U.S. Department of Commerce, 2000). The MEIC v1.4 emission inventory can be accessed at: http://meicmodel.org/?page_id=560 (last access: 20 February 2025). Hourly surface O3 observations are provided by the China National Environmental Monitoring Centre (CNEMC) and are available at: http://www.cnemc.cn/ (last access: 26 February 2025).
The supplement related to this article is available online at https://doi.org/10.5194/acp-26-1301-2026-supplement.
YasL, and TW formulated the research, and YasL: carried it out. ML, YQ, HW, and MX: technical support on the WRF-Chem model. CL, YaoL, and YW: reviewed the manuscript.
The contact author has declared that none of the authors has any competing interests.
Publisher's note: Copernicus Publications remains neutral with regard to jurisdictional claims made in the text, published maps, institutional affiliations, or any other geographical representation in this paper. The authors bear the ultimate responsibility for providing appropriate place names. Views expressed in the text are those of the authors and do not necessarily reflect the views of the publisher.
We sincerely thank Tsinghua University for providing the anthropogenic emission inventory, and the China National Environmental Monitoring Center for providing the observational datasets. We also extend our heartfelt appreciation to our numerous other institutional collaborators.
This investigation was supported by the National Key Basic Research & Development Program of China (grant no. 2024YFC3711905), the Doctoral Scientific Research Fund of Henan Finance University (grant no. 2024BS055), and the National Natural Science Foundation of China (grant no. 42477103), the Creative talent exchange program for foreign experts in the Belt and Road countries, the Henan Provincial Science and Technology Research and Development Program (grant no. 252102320085).
This paper was edited by Carl Percival and reviewed by two anonymous referees.
Brown, S. S. and Stutz, J.: Nighttime radical observations and chemistry, Chem. Soc. Rev., 41, 6405–6447, https://doi.org/10.1039/C2CS35181A, 2012.
Cao, J., Qiu, X., Liu, Y., Yan, X., Gao, J., and Peng, L.: Identifying the dominant driver of elevated surface ozone concentration in North China plain during summertime 2012–2017, Environ. Pollut., 300, 118912, https://doi.org/10.1016/j.envpol.2022.118912, 2022.
Chen, J., Li, Z., Lv, M., Wang, Y., Wang, W., Zhang, Y., Wang, H., Yan, X., Sun, Y., and Cribb, M.: Aerosol hygroscopic growth, contributing factors, and impact on haze events in a severely polluted region in northern China, Atmos. Chem. Phys., 19, 1327–1342, https://doi.org/10.5194/acp-19-1327-2019, 2019.
Chen, X., Zhong, B., Huang, F., Wang, X., Sarkar, S., Jia, S., Deng, X., Chen, D., and Shao, M.: The role of natural factors in constraining long-term tropospheric ozone trends over Southern China, Atmos. Environ., 220, 117060, https://doi.org/10.1016/j.atmosenv.2019.117060, 2020.
Cheng, J., Tong, D., Zhang, Q., Liu, Y., Lei, Y., Yan, G., Yan, L., Yu, S., Cui, R. Y., Clarke, L., Geng, G., Zheng, B., Zhang, X., Davis, S. J., and He, K.: Pathways of China's PM2.5 air quality 2015–2060 in the context of carbon neutrality, Natl. Sci. Rev., 8, https://doi.org/10.1093/nsr/nwab078, 2021.
Dai, H., Liao, H., Li, K., Yue, X., Yang, Y., Zhu, J., Jin, J., Li, B., and Jiang, X.: Composited analyses of the chemical and physical characteristics of co-polluted days by ozone and PM2.5 over 2013–2020 in the Beijing–Tianjin–Hebei region, Atmos. Chem. Phys., 23, 23–39, https://doi.org/10.5194/acp-23-23-2023, 2023.
Dai, H., Liao, H., Wang, Y., and Qian, J.: Co-occurrence of ozone and PM2.5 pollution in urban/non-urban areas in eastern China from 2013 to 2020: Roles of meteorology and anthropogenic emissions, Sci. Total Environ., 924, 171687, https://doi.org/10.1016/j.scitotenv.2024.171687, 2024.
Dang, R., Liao, H., and Fu, Y.: Quantifying the anthropogenic and meteorological influences on summertime surface ozone in China over 2012–2017, Sci. Total Environ., 754, 142394, https://doi.org/10.1016/j.scitotenv.2020.142394, 2021.
Dyson, J. E., Whalley, L. K., Slater, E. J., Woodward-Massey, R., Ye, C., Lee, J. D., Squires, F., Hopkins, J. R., Dunmore, R. E., Shaw, M., Hamilton, J. F., Lewis, A. C., Worrall, S. D., Bacak, A., Mehra, A., Bannan, T. J., Coe, H., Percival, C. J., Ouyang, B., Hewitt, C. N., Jones, R. L., Crilley, L. R., Kramer, L. J., Acton, W. J. F., Bloss, W. J., Saksakulkrai, S., Xu, J., Shi, Z., Harrison, R. M., Kotthaus, S., Grimmond, S., Sun, Y., Xu, W., Yue, S., Wei, L., Fu, P., Wang, X., Arnold, S. R., and Heard, D. E.: Impact of HO2 aerosol uptake on radical levels and O3 production during summertime in Beijing, Atmos. Chem. Phys., 23, 5679–5697, https://doi.org/10.5194/acp-23-5679-2023, 2023.
Gao, J., Zhu, B., Xiao, H., Kang, H., Pan, C., Wang, D., and Wang, H.: Effects of black carbon and boundary layer interaction on surface ozone in Nanjing, China, Atmos. Chem. Phys., 18, 7081–7094, https://doi.org/10.5194/acp-18-7081-2018, 2018.
Geng, G., Liu, Y., Liu, Y., Liu, S., Cheng, J., Yan, L., Wu, N., Hu, H., Tong, D., and Zheng, B.: Efficacy of China's clean air actions to tackle PM2.5 pollution between 2013 and 2020, Nat. Geosci., 17, 987–994, https://doi.org/10.1038/s41561-024-01540-z, 2024.
George, C., Ammann, M., D'Anna, B., Donaldson, D. J., and Nizkorodov, S. A.: Heterogeneous Photochemistry in the Atmosphere, Chem. Rev., 115, 4218–4258, https://doi.org/10.1021/cr500648z, 2015.
Grell, G. A., Peckham, S. E., Schmitz, R., McKeen, S. A., Frost, G., Skamarock, W. C., and Eder, B.: Fully coupled “online” chemistry within the WRF model, Atmos. Environ., 39, 6957–6975, https://doi.org/10.1016/j.atmosenv.2005.04.027, 2005.
Guenther, A., Karl, T., Harley, P., Wiedinmyer, C., Palmer, P. I., and Geron, C.: Estimates of global terrestrial isoprene emissions using MEGAN (Model of Emissions of Gases and Aerosols from Nature), Atmos. Chem. Phys., 6, 3181–3210, https://doi.org/10.5194/acp-6-3181-2006, 2006.
Hammer, M. U., Vogel, B., and Vogel, H.: Findings on as an indicator of ozone sensitivity in Baden-Württemberg, Berlin-Brandenburg, and the Po valley based on numerical simulations, J. Geophys. Res.: Atmos., 107, LOP 3-1–LOP 3-18, https://doi.org/10.1029/2000JD000211, 2002.
Hu, F., Xie, P., Xu, J., Lv, Y., Zhang, Z., Zheng, J., and Tian, X.: Long-term trends of ozone in the Yangtze River Delta, China: spatiotemporal impacts of meteorological factors, local, and non-local emissions, J. Environ. Sci., 156, 408–420, https://doi.org/10.1016/j.jes.2024.07.017, 2025.
Jacob, D. J.: Heterogeneous chemistry and tropospheric ozone, Atmos. Environ., 34, 2131–2159, https://doi.org/10.1016/S1352-2310(99)00462-8, 2000.
Jeon, W., Choi, Y., Souri, A. H., Roy, A., Diao, L., Pan, S., Lee, H. W., and Lee, S.-H.: Identification of chemical fingerprints in long-range transport of burning induced upper tropospheric ozone from Colorado to the North Atlantic Ocean, Sci. Total Environ., 613–614, 820–828, https://doi.org/10.1016/j.scitotenv.2017.09.177, 2018.
Kong, L., Du, C., Zhanzakova, A., Cheng, T., Yang, X., Wang, L., Fu, H., Chen, J., and Zhang, S.: Trends in heterogeneous aqueous reaction in continuous haze episodes in suburban Shanghai: An in-depth case study, Sci. Total Environ., 634, 1192–1204, https://doi.org/10.1016/j.scitotenv.2018.04.086, 2018.
Li, J., Han, Z., Li, J., Liu, R., Wu, Y., Liang, L., and Zhang, R.: The formation and evolution of secondary organic aerosol during haze events in Beijing in wintertime, Sci. Total Environ., 703, 134937, https://doi.org/10.1016/j.scitotenv.2019.134937, 2020a.
Li, K., Jacob, D. J., Liao, H., Shen, L., Zhang, Q., and Bates, K. H.: Anthropogenic drivers of 2013–2017 trends in summer surface ozone in China, Proceedings of the National Academy of Sciences, 116, 422–427, https://doi.org/10.1073/pnas.1812168116, 2019a.
Li, K., Jacob, D. J., Shen, L., Lu, X., De Smedt, I., and Liao, H.: Increases in surface ozone pollution in China from 2013 to 2019: anthropogenic and meteorological influences, Atmos. Chem. Phys., 20, 11423–11433, https://doi.org/10.5194/acp-20-11423-2020, 2020b.
Li, M., Wang, T., Xie, M., Li, S., Zhuang, B., Chen, P., Huang, X., and Han, Y.: Agricultural Fire Impacts on Ozone Photochemistry Over the Yangtze River Delta Region, East China, J. Geophys. Res.: Atmos., 123, 6605–6623, https://doi.org/10.1029/2018JD028582, 2018.
Li, M., Zhang, Q., Zheng, B., Tong, D., Lei, Y., Liu, F., Hong, C., Kang, S., Yan, L., Zhang, Y., Bo, Y., Su, H., Cheng, Y., and He, K.: Persistent growth of anthropogenic non-methane volatile organic compound (NMVOC) emissions in China during 1990–2017: drivers, speciation and ozone formation potential, Atmos. Chem. Phys., 19, 8897–8913, https://doi.org/10.5194/acp-19-8897-2019, 2019b.
Li, Y., Wang, T., Wang, Q. G., Qu, Y., Wu, H., Xie, M., Li, M., Li, S., and Zhuang, B.: Spatiotemporal Variations of PM2.5 and O3 Relationship during 2014–2021 in Eastern China, Aerosol and Air Quality Research, 23, 230060, https://doi.org/10.4209/aaqr.230060, 2023.
Li, Y., Wang, T., Wang, Q. G., Li, M., Qu, Y., Wu, H., and Xie, M.: Exploring the role of aerosol-ozone interactions on O3 surge and PM2.5 decline during the clean air action period in Eastern China 2014–2020, Atmos. Res., 302, 107294, https://doi.org/10.1016/j.atmosres.2024.107294, 2024a.
Li, Y., Wang, T., Wang, Q. G., Li, M., Qu, Y., Wu, H., Fan, J., Shao, M., and Xie, M.: Deciphering the seasonal dynamics of multifaceted aerosol-ozone interplay: Implications for air quality management in Eastern China, Sci. Total Environ., 946, 174327, https://doi.org/10.1016/j.scitotenv.2024.174327, 2024b.
Li, Y., Wang, T., Wang, Q. G., Li, M., Qu, Y., Wu, H., and Xie, M.: Impact of aerosol-radiation interaction and heterogeneous chemistry on the winter decreasing PM2.5 and increasing O3 in Eastern China 2014–2020, J. Environ. Sci., 151, 469–483, https://doi.org/10.1016/j.jes.2024.04.010, 2025.
Liu, H., Liu, S., Xue, B., Lv, Z., Meng, Z., Yang, X., Xue, T., Yu, Q., and He, K.: Ground-level ozone pollution and its health impacts in China, Atmos. Environ., 173, 223–230, https://doi.org/10.1016/j.atmosenv.2017.11.014, 2018.
Liu, Y. and Wang, T.: Worsening urban ozone pollution in China from 2013 to 2017 – Part 1: The complex and varying roles of meteorology, Atmos. Chem. Phys., 20, 6305–6321, https://doi.org/10.5194/acp-20-6305-2020, 2020.
Liu, Y., Geng, G., Cheng, J., Liu, Y., Xiao, Q., Liu, L., Shi, Q., Tong, D., He, K., and Zhang, Q.: Drivers of Increasing Ozone during the Two Phases of Clean Air Actions in China 2013–2020, Environ. Sci. Technol., 57, 8954–8964, https://doi.org/10.1021/acs.est.3c00054, 2023a.
Liu, Z., Wang, H., Peng, Y., Zhang, W., Che, H., Zhang, Y., Liu, H., Wang, Y., Zhao, M., and Zhang, X.: The combined effects of heterogeneous chemistry and aerosol-radiation interaction on severe haze simulation by atmospheric chemistry model in Middle-Eastern China, Atmos. Environ., 302, 119729, https://doi.org/10.1016/j.atmosenv.2023.119729, 2023b.
Lu, S., Gong, S., Chen, J., Zhang, L., Ke, H., Pan, W., Lu, J., and You, Y.: Contribution assessment of meteorology vs. emissions in the summer ozone trend from 2014 to 2023 in China by an environmental meteorology index, Atmos. Environ., 343, 120992, https://doi.org/10.1016/j.atmosenv.2024.120992, 2025.
Ma, D., Wang, T., Wu, H., Qu, Y., Liu, J., Liu, J., Li, S., Zhuang, B., Li, M., and Xie, M.: The effect of anthropogenic emission, meteorological factors, and carbon dioxide on the surface ozone increase in China from 2008 to 2018 during the East Asia summer monsoon season, Atmos. Chem. Phys., 23, 6525–6544, https://doi.org/10.5194/acp-23-6525-2023, 2023a.
Ma, P., Quan, J., Dou, Y., Pan, Y., Liao, Z., Cheng, Z., Jia, X., Wang, Q., Zhan, J., Ma, W., Zheng, F., Wang, Y., Zhang, Y., Hua, C., Yan, C., Kulmala, M., Liu, Y., Huang, X., Yuan, B., Brown, S. S., and Liu, Y.: Regime-Dependence of Nocturnal Nitrate Formation via N2O5 Hydrolysis and Its Implication for Mitigating Nitrate Pollution, Geophys. Res. Lett., 50, e2023GL106183, https://doi.org/10.1029/2023GL106183, 2023b.
National Centers for Environmental Prediction (NCEP), National Weather Service, U.S. Department of Commerce: NCEP FNL Operational Model Global Tropospheric Analyses, continuing from July 1999, NSF National Center for Atmospheric Research [data set], https://doi.org/10.5065/D6M043C6, 2000.
Ni, Y., Yang, Y., Wang, H., Li, H., Li, M., Wang, P., Li, K., and Liao, H.: Contrasting changes in ozone during 2019–2021 between eastern and the other regions of China attributed to anthropogenic emissions and meteorological conditions, Sci. Total Environ., 908, 168272, https://doi.org/10.1016/j.scitotenv.2023.168272, 2024.
Peng, Y.-P., Chen, K.-S., Wang, H.-K., Lai, C.-H., Lin, M.-H., and Lee, C.-H.: Applying model simulation and photochemical indicators to evaluate ozone sensitivity in southern Taiwan, J. Environ. Sci., 23, 790–797, https://doi.org/10.1016/S1001-0742(10)60479-2, 2011.
Qu, Y., Wang, T., Yuan, C., Wu, H., Gao, L., Huang, C., Li, Y., Li, M., and Xie, M.: The underlying mechanisms of PM2.5 and O3 synergistic pollution in East China: Photochemical and heterogeneous interactions, Sci. Total Environ., 873, 162434, https://doi.org/10.1016/j.scitotenv.2023.162434, 2023.
Shao, M., Wang, W., Yuan, B., Parrish, D. D., Li, X., Lu, K., Wu, L., Wang, X., Mo, Z., Yang, S., Peng, Y., Kuang, Y., Chen, W., Hu, M., Zeng, L., Su, H., Cheng, Y., Zheng, J., and Zhang, Y.: Quantifying the role of PM2.5 dropping in variations of ground-level ozone: Inter-comparison between Beijing and Los Angeles, Sci. Total Environ., 788, 147712, https://doi.org/10.1016/j.scitotenv.2021.147712, 2021.
Shao, M., Lv, S., Song, Y., Liu, R., and Dai, Q.: Disentangling the effects of meteorology and emissions from anthropogenic and biogenic sources on the increased surface ozone in Eastern China, Atmos. Res., 311, 107699, https://doi.org/10.1016/j.atmosres.2024.107699, 2024.
Sun, L., Xue, L., Wang, Y., Li, L., Lin, J., Ni, R., Yan, Y., Chen, L., Li, J., Zhang, Q., and Wang, W.: Impacts of meteorology and emissions on summertime surface ozone increases over central eastern China between 2003 and 2015, Atmos. Chem. Phys., 19, 1455–1469, https://doi.org/10.5194/acp-19-1455-2019, 2019.
Wu, K., Wang, Y., Qiao, Y., Liu, Y., Wang, S., Yang, X., Wang, H., Lu, Y., Zhang, X., and Lei, Y.: Drivers of 2013–2020 ozone trends in the Sichuan Basin, China: Impacts of meteorology and precursor emission changes, Environ. Pollut., 300, 118914, https://doi.org/10.1016/j.envpol.2022.118914, 2022.
Yan, D., Jin, Z., Zhou, Y., Li, M., Zhang, Z., Wang, T., Zhuang, B., Li, S., and Xie, M.: Anthropogenically and meteorologically modulated summertime ozone trends and their health implications since China's clean air actions, Environ. Pollut., 343, 123234, https://doi.org/10.1016/j.envpol.2023.123234, 2024.
Yang, H., Chen, L., Liao, H., Zhu, J., Wang, W., and Li, X.: Weakened aerosol–radiation interaction exacerbating ozone pollution in eastern China since China's clean air actions, Atmos. Chem. Phys., 24, 4001–4015, https://doi.org/10.5194/acp-24-4001-2024, 2024.
Yang, L., Luo, H., Yuan, Z., Zheng, J., Huang, Z., Li, C., Lin, X., Louie, P. K. K., Chen, D., and Bian, Y.: Quantitative impacts of meteorology and precursor emission changes on the long-term trend of ambient ozone over the Pearl River Delta, China, and implications for ozone control strategy, Atmos. Chem. Phys., 19, 12901–12916, https://doi.org/10.5194/acp-19-12901-2019, 2019.
Yin, H., Lu, X., Sun, Y., Li, K., Gao, M., Zheng, B., and Liu, C.: Unprecedented decline in summertime surface ozone over eastern China in 2020 comparably attributable to anthropogenic emission reductions and meteorology, Environ. Res. Lett., 16, 124069, https://doi.org/10.1088/1748-9326/ac3e22, 2021.
Yu, C., Huang, L., Xue, L., Shen, H., Li, Z., Zhao, M., Yang, J., Zhang, Y., Li, H., Mu, J., and Wang, W.: Photoenhanced Heterogeneous Uptake of NO2 and HONO Formation on Authentic Winter Time Urban Grime, ACS Earth Space Chem., 6, 1960–1968, https://doi.org/10.1021/acsearthspacechem.2c00054, 2022.
Yu, Y., Wang, Z., He, T., Meng, X., Xie, S., and Yu, H.: Driving factors of the significant increase in surface ozone in the Yangtze River Delta, China, during 2013–2017, Atmos. Pollut. Res., 10, 1357–1364, https://doi.org/10.1016/j.apr.2019.03.010, 2019.
Zhai, S., Jacob, D. J., Wang, X., Shen, L., Li, K., Zhang, Y., Gui, K., Zhao, T., and Liao, H.: Fine particulate matter (PM2.5) trends in China, 2013–2018: separating contributions from anthropogenic emissions and meteorology, Atmos. Chem. Phys., 19, 11031–11041, https://doi.org/10.5194/acp-19-11031-2019, 2019.
Zhang, H., Roehl, C. M., Sander, S. P., and Wennberg, P. O.: Intensity of the second and third OH overtones of H2O2, HNO3, and HO2NO2, J. Geophys. Res.: Atmos., 105, 14593–14598, https://doi.org/10.1029/2000JD900118, 2000.
Zhang, X., Zhang, W.-C., Wu, W., and Liu, H.-B.: Understanding ozone variability in spatial responses to emissions and meteorology in China using interpretable machine learning, iScience, 28, 113036, https://doi.org/10.1016/j.isci.2025.113036, 2025.
Zhao, X., Zhang, Z., Xu, J., Gao, J., Cheng, S., Zhao, X., Xia, X., and Hu, B.: Impacts of aerosol direct effects on PM2.5 and O3 respond to the reductions of different primary emissions in Beijing-Tianjin-Hebei and surrounding area, Atmos. Environ., 309, 119948, https://doi.org/10.1016/j.atmosenv.2023.119948, 2023.
Zhou, M., Zhang, L., Chen, D., Gu, Y., Fu, T.-M., Gao, M., Zhao, Y., Lu, X., and Zhao, B.: The impact of aerosol–radiation interactions on the effectiveness of emission control measures, Environ. Res. Lett., 14, 024002, https://doi.org/10.1088/1748-9326/aaf27d, 2019.
Zhu, J., Chen, L., Liao, H., Yang, H., Yang, Y., and Yue, X.: Enhanced PM2.5 Decreases and O3 Increases in China During COVID-19 Lockdown by Aerosol-Radiation Feedback, Geophys. Res. Lett., 48, e2020GL090260, https://doi.org/10.1029/2020GL090260, 2021.