
the Creative Commons Attribution 4.0 License.
the Creative Commons Attribution 4.0 License.
 | 14 Sep 2026
Characterization of aerosol properties during a huge transatlantic smoke transport event using Aeolus observations in synergy with multi-platform data
Kangwen Sun
Guangyao Dai
Dimitri Trapon
Holger Baars
Albert Ansmann
Ulla Wandinger
Songhua Wu

During the wildfire season on the West Coast of the US in September 2020, biomass burning smoke aerosols were continually generated, resulting in several transatlantic transport events. As a high spectral resolution lidar (HSRL), ALADIN could directly retrieve the aerosol extinction and backscatter coefficient. Targeting a large-scale tropospheric smoke transport event originating from the western US on 14 September and arriving over Europe on 21 September, a method for constructing an Aeolus smoke dataset was developed based on ALADIN observations, in synergy with multi-source data. Utilizing selected cross-sections from this dataset, the vertical structure of the smoke layers at different transport stages are presented. HYSPLIT simulations illustrate the general transport pathway connecting these layers. Statistical analyses of the complete Aeolus smoke dataset from 14 to 21 September reveal the evolution of the smoke plume throughout its transatlantic pathway. The dense smoke plume throughout the transport was characterized by mean extinction coefficients of approximately 200 Mm−1 across all selected cross-sections and a decline in AOD from 0.54 to 0.33 along the transport pathway. The smoke layers ascended from approximately 4.4 km above the US to over 6 km above the Europe and were observed above clouds upon reaching Europe. The initially decreasing and then increasing lidar ratios are likely associated with the aging process and the hygroscopic growth of smoke particles, individually. Plume separation was observed over the mid-Atlantic, and the two resulting branches were investigated individually. To our knowledge, this paper presents the first use of ALADIN for observations and analyses of a large-scale transatlantic tropospheric smoke transport. The comprehensive characterization presented herein provides valuable information for advancing global aerosol research.
- Article
(8644 KB) - Full-text XML
- BibTeX
- EndNote


Smoke aerosols, primarily produced by biomass burning events such as wildfires, exert significant impacts on the Earth system by perturbing the radiation balance, influencing cloud formation, and degrading air quality (Sokolik et al., 2019; Ditas et al., 2018; Hirsch and Koren, 2021). In recent years, climate change has driven hotter and drier conditions and more frequent wildfires, leading to the formation of increasingly intense smoke layers in the atmosphere (Kirchmeier-Young et al., 2019; Cunningham et al., 2024; Trickl et al., 2024). Smoke aerosols from wildfires can be lofted to altitudes of up to about 35 km, thereby inducing substantial perturbations to tropospheric cloud processes and stratospheric aerosol composition (Khaykin et al., 2020; Twohy et al., 2021; Peterson et al., 2021). Once injected, smoke plumes can undergo long-range transport via large-scale atmospheric circulation, affecting regions far from their sources. Accurately representing such long-range transport is therefore essential for the parameterization of cloud–aerosol interactions in regional and global models, ultimately improving the fidelity of weather and climate predictions (Lohmann and Neubauer, 2018; Beer et al., 2022, 2024).
Lidar remote sensing is an effective approach for atmospheric measurements, providing vertically resolved parameters and information. Based on ground-based lidar observations, extensive research has been conducted to investigate the characteristics of smoke aerosols and their environmental impacts. Using lidar measurements at Leipzig, Haarig et al. (2018) characterized the properties of aged tropospheric and stratospheric smoke originating from Canadian wildfires. The impacts of wildfire smoke aerosols on cirrus formation over the eastern Mediterranean and the Arctic were explored by Mamouri et al. (2023) and Ansmann et al. (2025), based on lidar observations. Wildfire smoke was found contributing to the processes driving record-breaking stratospheric ozone depletion over the Arctic and Antarctica in 2020 (Ohneiser et al., 2022). Therefore, with the observation records of single ground-based lidar station, (1) smoke plumes at specific phase of the whole development or transport event can be characterized in detail, meanwhile (2) interactions between smoke layers and other atmospheric constituents, such as clouds or ozone, can be investigated. Furthermore, lidar networks, comprising multiple stations, have increasingly been employed in wildfire smoke research. Floutsi et al. (2023) derived universal lidar-based intensive optical properties of smoke aerosols – including the particle linear depolarization ratio, the extinction-to-backscatter ratio (lidar ratio), and the Ångström exponent – by analysing long-term observations from the European Aerosol Research Lidar Network (EARLINET) and several dedicated campaigns (Pappalardo et al., 2014). Vaughan et al. (2018) and Baars et al. (2019) utilized the observations of the UK lidar network and the EARLINET individually, characterizing the smoke aerosols transported from North America. Although lidar sites can provide information on smoke over different regions, they primarily capture the decay phase of transport rather than the entire transport event. In summary, ground-based lidar stations and networks are valuable for investigating smoke processes over specific regions and for establishing comprehensive smoke databases, but they are limited in their ability to track long-range smoke transport.
For tracking long-distance smoke transport, particularly across oceans, satellite-based lidars provide valuable global measurements, as most operate in polar orbits and circle the Earth more than ten times per day. The Cloud-Aerosol Lidar with Orthogonal Polarization (CALIOP) aboard the Cloud-Aerosol Lidar and Infrared Pathfinder Satellite Observation (CALIPSO) mission measured global vertical profiles of atmospheric aerosol and cloud optical properties from 2006 to 2023 (Winker et al., 2009; Omar et al., 2009). Numerous transport studies exist based on CALIOP. For example, by using three CALIOP measurement cross-sections, Vaughan et al. (2018) tracked a wildfire smoke plume originating in western Canada in May 2016 then crossing the Atlantic to the UK, finding that the plumes were primarily transported in the middle troposphere (3 to 11 km) with a slight ascending tendency, and that the smoke aerosol depolarization ratios at 532 nm remained below 0.1. Similarly, a wildfire smoke transport event from Canada to Europe in May–June 2019 was characterized by analysing CALIOP profiles divided by west-to-east locations (Shang et al., 2024), revealing that (1) transport occurred mainly in the middle troposphere (3 to 8 km), (2) aerosol optical depth (AOD) at 532 nm decreased from 0.25 to near zero, and (3) depolarization ratio at 532 nm increased from 0.03 to 0.06. Focusing on smoke self-lofting, Ohneiser et al. (2023) examined CALIOP cross-sections of Canadian wildfire smoke in 2017 and Australian smoke in 2020, showing plumes lofted from 12 to 13 to around 20 km partly contributed by absorbing solar radiation, indicating the transports took place in the upper troposphere and lower stratosphere. Collectively, these studies demonstrate that CALIOP measurements enable detailed tracking and characterization of long-range wildfire smoke transport. Nevertheless, as an elastic-backscatter lidar, CALIOP-derived extinction coefficients and AOD rely on assumptions of the extinction-to-backscatter ratio (lidar ratio) (Kim et al., 2018).
As the first wind spaceborne lidar and also the first operational spaceborne high spectral resolution lidar, the Atmospheric Laser Doppler Instrument (ALADIN) onboard Aeolus satellite measured global wind and aerosol profiles simultaneously for more than 4 years (August 2018 to April 2023) (Stoffelen et al., 2005; Reitebuch, 2012). The aerosol and cloud optical properties product (Level 2A) of Aeolus includes directly derived profiles of extinction coefficient and co-polarized backscatter coefficient at 355 nm, because ALADIN transmits circularly polarized light but measures only the co-polarized component of the backscattered light (Flament et al., 2021). The Aeolus Level 2A product has been involved in the research of the characterization of dust aerosols and the evaluation of the wind impact on marine aerosol (Song et al., 2024; Sun et al., 2024). It also provides opportunities to track and describe large-scale long-range aerosol transport with the underlying possible dynamic reasons described by the wind information. Based on Aeolus data, Dai et al. (2022) characterized and analysed a huge dust transport event from the Sahara dust crossing the Atlantic to the Caribbean Sea occurred in June 2020. The dust plumes were found below 6 km during transport and the wind vector product (Level 2C) from Aeolus was also used to evaluate the transport intensity. This study focuses on a huge smoke transport stage in September 2020, of which the smoke aerosols were generated from the extreme forest fires in California (Hu et al., 2022; Ceamanos et al., 2023; Eck et al., 2023). Hu et al. (2022) reported that smoke plumes were transported across the Atlantic to Europe, with two distinct transport events identified, each lasting approximately 5–7 d. Aeolus Level 2A product has demonstrated the capability to measure smoke profiles (Baars et al., 2021). However, during long-range transport, smoke plumes may become mixed with other aerosols and clouds. Moreover, Aeolus's ability to classify aerosols and clouds was limited due to the absence of depolarization measurements. Based on Aeolus product, together with CALIOP, spaceborne passive instruments (Visible Infrared Imaging Radiometer Suite, VIIRS (Liu et al., 2014); Moderate-resolution Imaging Spectroradiometer, MODIS (Savtchenko et al., 2004)), models (Modern-Era Retrospective analysis for Research and Applications, Version 2, MERRA-2 (Gelaro et al., 2017; Buchard et al., 2017), Hybrid Single Particle Lagrangian Integrated Trajectory Model, HYSPLIT (Stein et al., 2015)), this study (1) determined the general region and period of the smoke transport, (2) derived the Aeolus smoke profiles and conducted validation, (3) selected the Aeolus cross-sections to characterize the smoke layers at different transport stages, and (4) investigated the features of the entire smoke event using all Aeolus smoke profiles in the transport region. The derived Aeolus smoke profiles dataset mainly include backscatter coefficient, extinction coefficient and lidar ratio.
The paper is organized as follows. Section 1 provides an introduction to the present study. Section 2 describes the data and models used. Section 3 localizes the targeted smoke transport event. Section 4 presents the methodology for developing and validating the Aeolus-based smoke dataset, along with the caveats and uncertainties encountered during the dataset development. Section 5 analyses and discusses the characterization of smoke aerosols across the transport, by examining cross-sections of the smoke aerosol layers at different transport stages, as well as the entire smoke plume throughout the transport process.
2.1 ALADIN
During its operational lifetime from August 2018 to April 2023, the ALADIN instrument onboard the Aeolus satellite provided global atmospheric wind measurements along with aerosol and cloud observations simultaneously for more than 4 years, covering the atmospheric column from the surface to the lower stratosphere. As a high spectral resolution lidar operating at a wavelength of 354.8 nm, ALADIN had the capability to separate atmospheric particulate (aerosol and cloud) backscattered signal from molecular backscattered signal (Reitebuch , 2012). Thus, extinction coefficients can be retrieved directly without the need to assume a lidar ratio. However, ALADIN was not equipped with a cross-polar polarization detection channel, resulting in the absence of polarization information in its backscatter measurements (Flament et al., 2021). ALADIN operated on a dawn-dusk orbit with an inclination of 97.01°, and mean times of ascending/descending node at 18:00/06:00 LT (ESA, 2008). Further details on the instrument design and the measurement concept have been reported in Ansmann et al. (2007), Dabas et al. (2008), Flamant et al. (2008), Reitebuch (2012), Lux et al. (2020), and Flament et al. (2021).
Aeolus data products include several different levels: Level 0 (instrument housekeeping data), Level 1B (engineering-corrected Horizontal Light-Of Sight, i.e., HLOS winds), Level 2A (aerosol and cloud layer optical properties, including particulate extinction coefficient α, backscatter coefficient β, and lidar ratio, all at 355 nm), Level 2B (meteorologically representative HLOS winds) and Level 2C (Aeolus-assisted wind vectors) (Flamant et al., 2008; Tan et al., 2008; Rennie et al., 2020). “Baselines” of the products were defined to represent the products retrieved with different processor versions. Up to the time of this study, the products of Level 2A Baseline 16 with the time period of Aeolus' whole lifetime have been published (https://aeolus-ds.eo.esa.int/oads/access/, last access: 1 February 2026). The Level 2A Baseline 16 product includes aerosol and cloud retrievals derived from various algorithms. Among them, the Standard Correct Algorithm (SCA) is a retrieval algorithm for particulate extinction and backscatter coefficients using a direct algebraic inversion scheme, and the SCAmid is a version using better vertical averaging strategy, of which the products were more recommended for usage than the initial one (Flament et al., 2021; Gkikas et al., 2023). The Mie Channel Algorithm MCA relies on Mie signal only and provides particle extinction coefficient assuming a fixed lidar ratio. The Maximum Likelihood Estimation (MLE) and the MLEsub algorithms, based on physically constrained optimal estimation, achieved more accurate aerosol retrievals when compared to SCA and SCAmid, especially for the particle extinction coefficient (Ehlers et al., 2022; Trapon et al., 2025). The data with the MLEsub has higher horizontal resolution (18 km) than the one with the MLE (90 km). The AEL-PRO algorithm was developed targeting the Earth Cloud Aerosol and Radiation Explorer (EarthCARE) HSRL ATmospheric LIDar (ATLID), based on the feature mask identification as the previous step (Wang et al., 2024). More details of the Level 2A retrieval algorithm are introduced in the “ADM-Aeolus L2A Algorithm Theoretical Baseline Document” (Flamant et al., 2022). In this study, α and β in the Level 2A product with the MLE algorithm and aligned with 90 km horizontal from Baseline 16 were adopted. The MLE product was chosen because it integrates five times as many profiles as the MLEsub product, resulting in a higher signal-to-noise ratio and thus better data quality (Flamant et al., 2022). The vertical resolution varies from 0.25 km close to the surface to 2 km for top height, with most range bin thickness aligned with 0.5, 0.75 and 1 km in upper troposphere. Relative humidity (RH) and molecular backscatter coefficient (βm) from European Centre for Medium-Range Weather Forecasts Reanalysis 5 (ERA5) with the same grid of ALADIN measurement data provided in the Aeolus Level 2A products are also used as the ancillary data.
2.2 CALIOP
CALIOP on board CALIPSO measured global aerosol and cloud vertical profiles for around 17 years from June 2006 to June 2023. CALIOP Level 2 Aerosol Profile products provide directly retrieved backscatter coefficient at 532 nm and particulate depolarization ratio at 532 nm. In this study, the Aerosol Profile products of data version 4.21 were used to evaluate the stability of the depolarization ratio during the smoke transport. The vertical resolution of the Aerosol Profile products is variable in the altitude region of 0.5 to 30.1 km: 60 m for −0.5 to 20.2 km, 180 m for 20.2 to 30.1 km (Hunt et al., 2009). The horizonal resolution is 5 km. CALIOP Level 2 Vertical Feature Mask (VFM) products provide aerosol and cloud classification along the vertical profiles, consisting of the identification of aerosols and clouds, and further the subtypes of aerosols and clouds. The layer-integrated volume depolarization ratio at 532 nm, the layer-integrated total attenuated backscatter color ratio, the layer-averaged attenuated backscatter at 532 nm, the latitude and the altitude were taken account as the inputs to the cloud-aerosol discrimination (CAD) algorithm to distinguish aerosols from clouds (Liu et al., 2019). Aerosol bins were marked as “marine”, “dusty marine”, “dust”, “polluted dust”, “continental”, “polluted continental/smoke”, “elevated smoke”, and “others” according to the comprehensive analysis of the particulate depolarization ratio at 532 nm, the integrated attenuated backscatter coefficient at 532 nm, the layer top altitude, the layer base altitude, and the surface type (Kim et al., 2018). In this study, the VFM products from data version 4.21 were used. The spatial resolutions of VFM products are variable: 30 m vertically and 333 m horizontally for the altitude range of −0.5 to 8.2 km, 60 m vertically and 1000 m horizontally for 8.2 to 20.2 km, 180 m vertically and 1667 m horizontally for 20.2 to 30.1 km (Hunt et al., 2009).
2.3 MODIS
MODIS instrument is a Moderate Resolution Imaging Spectroradiometer, designed for the measurement of atmosphere, ocean, and land, monitoring global data with 36 high spectral resolution bands between 0.415 and 14.235 µm having spatial resolutions of 250 (2 bands), 500 (5 bands), and 1000 m (29 bands) (Savtchenko et al., 2004). Two MODIS instruments on board Terra satellite (10:30 ECT, descending) and Aqua satellite (13:30 ECT, ascending) provide near-global daily observations. In this study, we used the merged “Deep Blue/Dark Target” AOD at 550 nm by averaging the daily MODIS AOD from both Terra and Aqua to get the best spatial coverage, for the purpose of smoke plume localization and Aeolus products' validation (Levy et al., 2013). The temporal resolution is daily and the spatial resolution is 1°.
2.4 VIIRS
Visible Infrared Imaging Radiometer Suite (VIIRS) onboard Suomi National Polar-Orbiting Partnership (S-NPP) satellite is a cross-track scanning radiometer with 22 spectral bands covering the visible/infrared spectrum (0.412–12.05 µm) (Liu et al,̇ 2014). The satellite flies in a sun-synchronous polar orbit with the ascending equator crossing time of 13:30. The photo-like true-color images with the temporal resolution of daily and the spatial resolution of 250 m visualized by the Worldview (https://worldview.earthdata.nasa.gov, last access: 23 July 2026) were applied to localize the smoke plume.
2.5 MERRA-2
The Modern-Era Retrospective Analysis for Research and Applications, version 2 (MERRA-2), is the atmospheric reanalysis of the modern satellite era produced by NASA's Global Modelling and Assimilation Office (GMAO), assimilated with more than 30 types of observations including both satellite and ground-based remote sensing (Gelaro et al., 2017). The hourly column mass concentration (CMC) of organic carbon, black carbon and dust with the spatial resolution of 0.5° × 0.625° from MERRA-2 were utilized to extract smoke data of ALADIN observations.
2.6 HYSPLIT
The Hybrid Single-Particle Lagrangian Integrated Trajectory model (HYSPLIT) is a modelling system developed by the National Oceanic and Atmospheric Administration (NOAA) Air Resources Laboratory (ARL), which is capable to simulate the transport trajectories, dispersion and diffusion of air masses (Stein et al., 2015). In this study, both backward and forward trajectory simulations are applied to verify the pathway of smoke plume transport. The simulations were calculated with the model vertical velocity from the global data assimilation system developed by NOAA (https://www.ncei.noaa.gov/products/weather-climate-models/global-data-assimilation, last access: 23 July 2026).
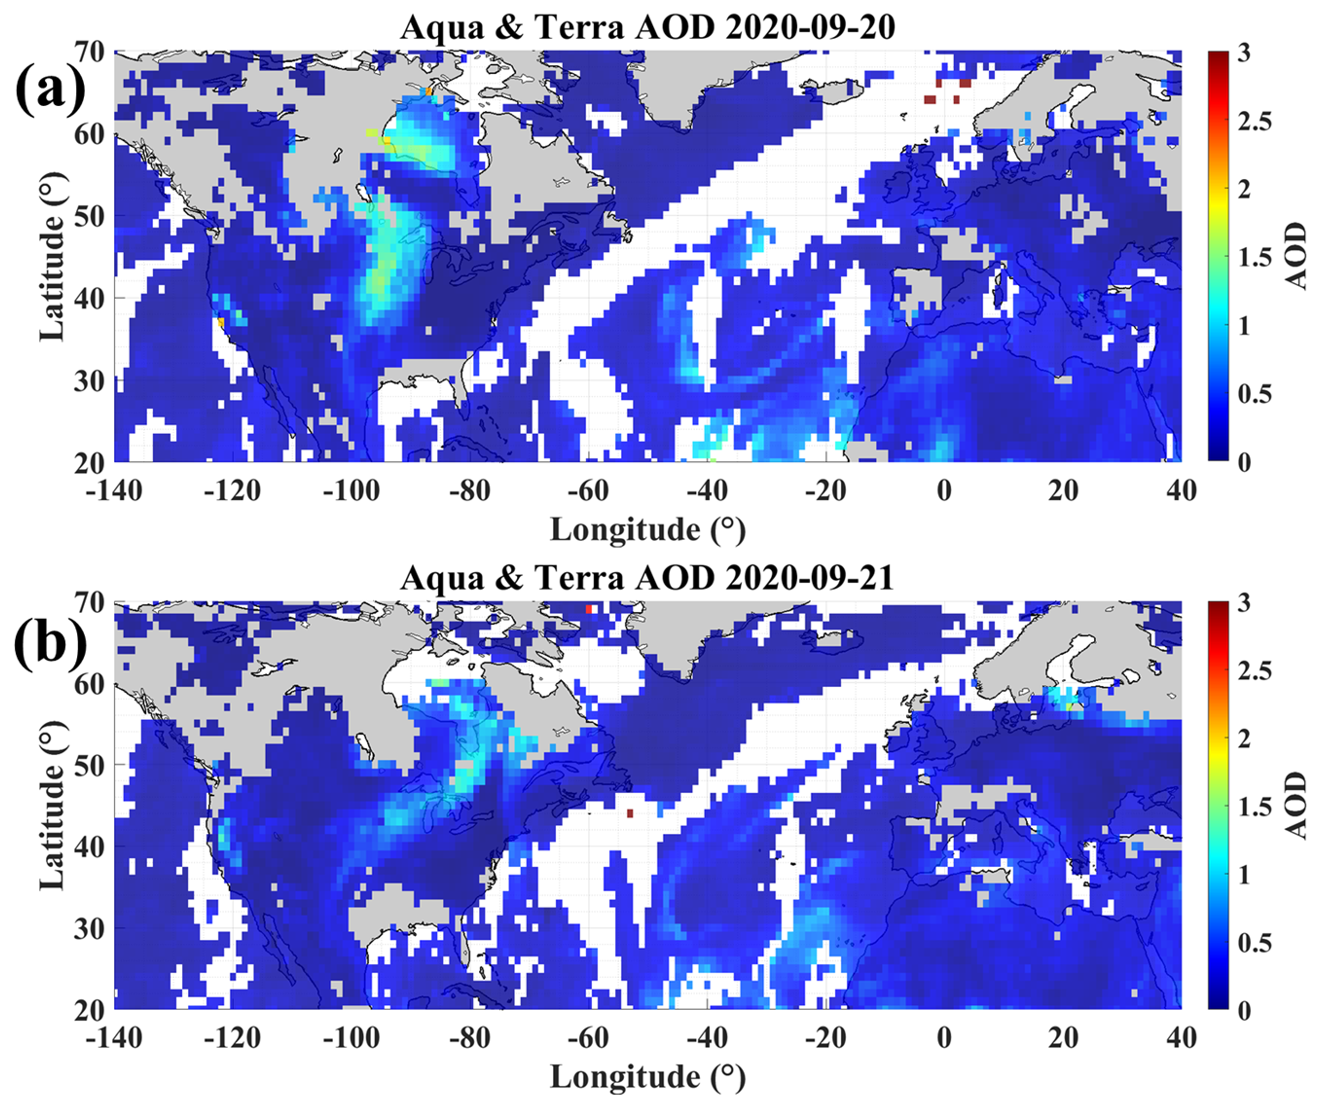
In 2020, more than 8000 wildfires in the west coast of the US generated large amounts of smoke aerosol into the atmosphere continuously (https://www.fire.ca.gov/incidents/2020/, last access: 23 July 2026). A pronounced smoke transport event from the western US across the Atlantic to Europe in September is presented and illustrated in Fig. 1. The daily true-color images from VIIRS and the daily mean AOD derived from Aqua and Terra are shown in this figure.
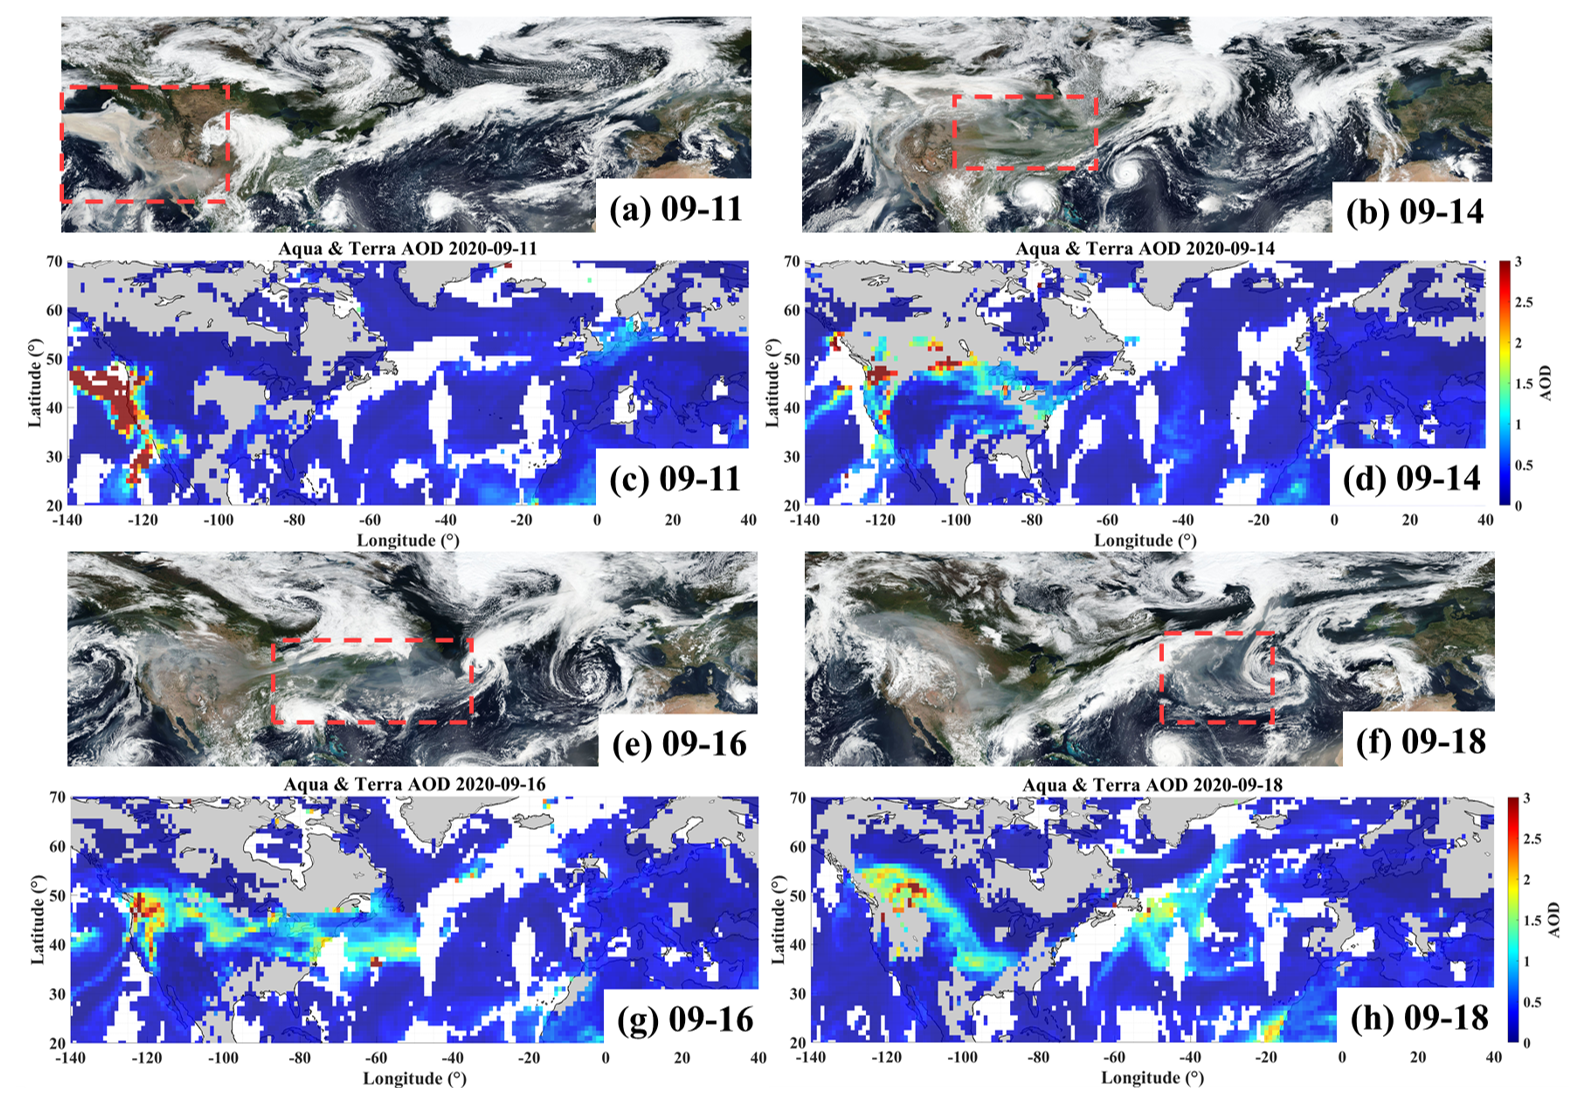
Figure 1Observations of spaceborne passive instruments in the spatial range of 140° W to 40° E and 20 to 70° N. True-color images from VIIRS on (a) 11, (b) 14, (e) 16, (f) 18 September 2020, acquired on the Worldview (https://worldview.earthdata.nasa.gov, last access: 23 July 2026). Averaged AOD from both Aqua and Terra on (c) 11, (d) 14, (g) 16, (h) 18 September 2020. In the AOD maps, the grey and white parts indicate the land and the invalid data, respectively. Satellite imagery © NASA Earthdata/Worldview.
In panel (a) of Fig. 1, the red dashed region highlights a clearly visible, dense aerosol plume over the west coast, which is likely smoke originating from wildfires in the western US. Consistent with this observation, panel (c) indicates that many of the associated smoke layers reached AOD values greater than 3. In panels (b), (e), and (f), the visible plumes within the red dashed boxes indicate smoke aerosols generated off the west coast of the US and moving above the Atlantic from 14 to 18 September. The maximum AOD values could exceed 1.5 during transport, as shown in panels (d), (g), and (h). Hu et al. (2022) observed smoke layers at the lidar station ATOLL (ATmospheric Observatory of LiLle) in northern France, from 17 to 22 September, which were transported from Oregon (located on the west coast of the US) starting on 13 September. This corresponds well with the smoke plume transport indicated in Fig. 1, suggesting that the smoke plume was transported to Europe afterwards. In conclusion, the snapshots taken by spaceborne passive instruments captured the daily locations of smoke plumes during their transport from the west coast of the US across the Atlantic to Europe. However, passive instruments cannot provide vertical plume information, and AOD retrieval cannot be accomplished in the presence of clouds.
In order to further investigate the pathway of the entire smoke transport event, the averaged AOD and the smoke CMC with the same spatial coverage and the temporal range from 11 to 21 September 2020 are presented individually in panels (a) and (b) of Fig. 2. The smoke CMC was calculated as the sum of the organic carbon and black carbon from the MERRA-2 reanalysis dataset. In general, these two figures align well for regions with high values, except for the Sahara Desert and the surrounding ocean, which have high load of atmospheric dust. From these figures, the transport pathway is visible. The smoke plume moved eastward from the west coast of the US, crossing the continental US and reaching the central Atlantic. Then, it separated into two branches. The larger branch moved northeastward over a longer distance, while the smaller one moved southeastward. The southern smoke plume was transported toward the Sahara Desert, where it may have mixed with dust aerosols. Overall, the gradual decrease in AOD and smoke CMC from west to east suggests that the concentration of the smoke aerosol diminished due to diffusion during its transport. However, it can be speculated that the accumulation of smoke plumes occurred over the Atlantic between longitude 70 and 40° W after being transported away from land, as the AOD and the smoke CMC show higher values than the surrounding region. As previously mentioned, the Aeolus's ALADIN lidar cannot classify aerosol subtypes due to the lack of depolarization ratio detection (Flament et al., 2021). Whether ALADIN can characterize the smoke plumes during transport depends on interference from other types of aerosols along the transport pathway. Therefore, an examination of the types of aerosols in the smoke pathway region was conducted. Data from the CALIOP VFM product was used. The aerosol subtype data within the altitude of 2 to 15 km and the period of 11 to 21 September, located in the red dashed box of Fig. 2a, was counted for the statistical analysis. The result shown in Fig. 2b indicates that the smoke-related aerosols (flagged as “elevated smoke”, “polluted continental/smoke”, “polluted dust” in the VFM product) dominate the region, accounting for around 78 % of the total. Dust aerosol accounts for around 15 %, while the sum of the others (marine-related and continental) accounts for less than 7 %.
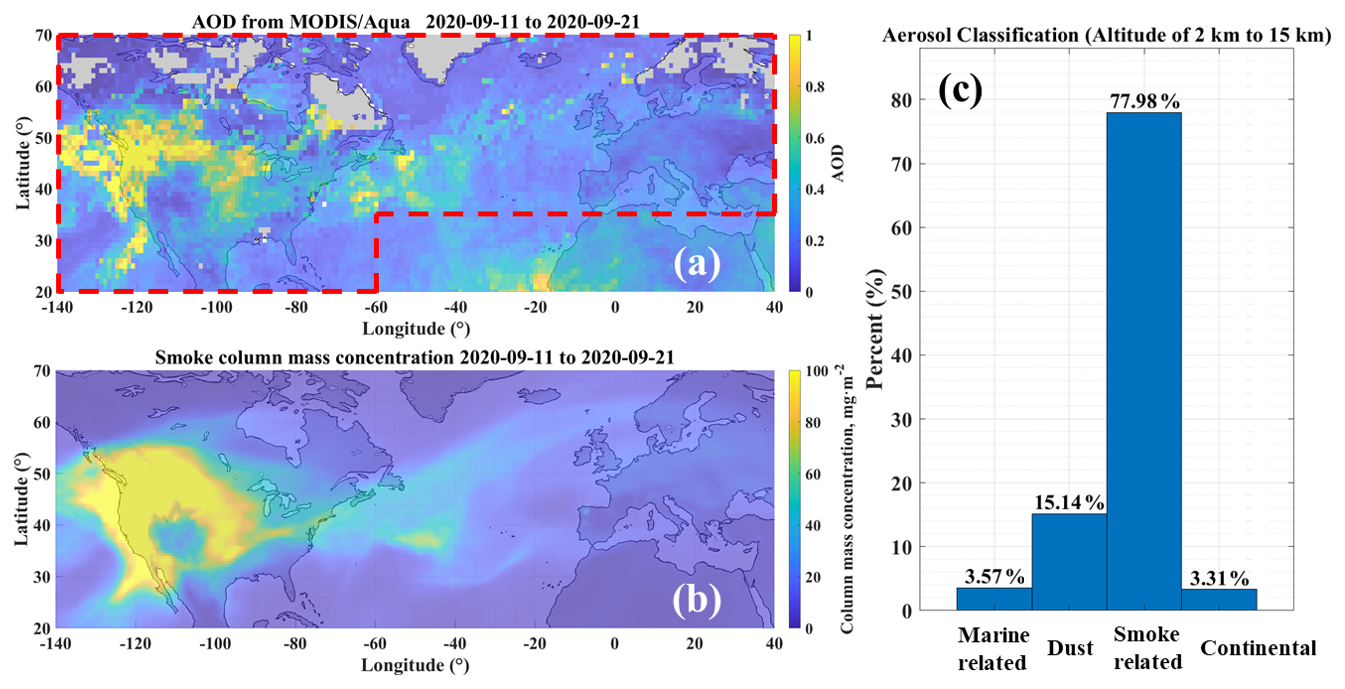
Figure 2(a) Average AOD by MODIS onboard Aqua; (b) Average smoke column mass concentration (CMC) by MERRA-2; (c) Statistical result of aerosol classification from CALIOP VFM products, taking the data in the region indicated by the red dashed box of panel (a). The temporal range is 11 to 21 September 2020. In panel (c), “Marine related” indicates “marine” and “dusty marine” from CALIOP VFM products, and “Smoke related” includes “elevated smoke”, “polluted continental/smoke”, “polluted dust”.
To summarize this section, the specific period and pathway of the smoke transport were identified and the transport region was found dominated by the smoke-related aerosols. The results indicate the potential for deriving smoke properties from Aeolus L2A products for this smoke event, as the transport exhibited a large spatial and temporal scale with limited influence from other aerosol types.
In this section, focusing on the smoke transport event described in Sect. 3, the procedures for developing an Aeolus-based smoke dataset are presented in Sect. 4.1 and 4.2. Aeolus L2A products within the spatial domain of 140° W–40° E and 20–70° N during the period from 11 to 21 September 2020 were utilized, covering the entire transport event. The caveats and uncertainties are analysed in Sect. 4.3. The validation of this dataset is presented in Sect. 4.4. The brief flowchart of the methodology introduced in this section is summarized in Fig. 3.
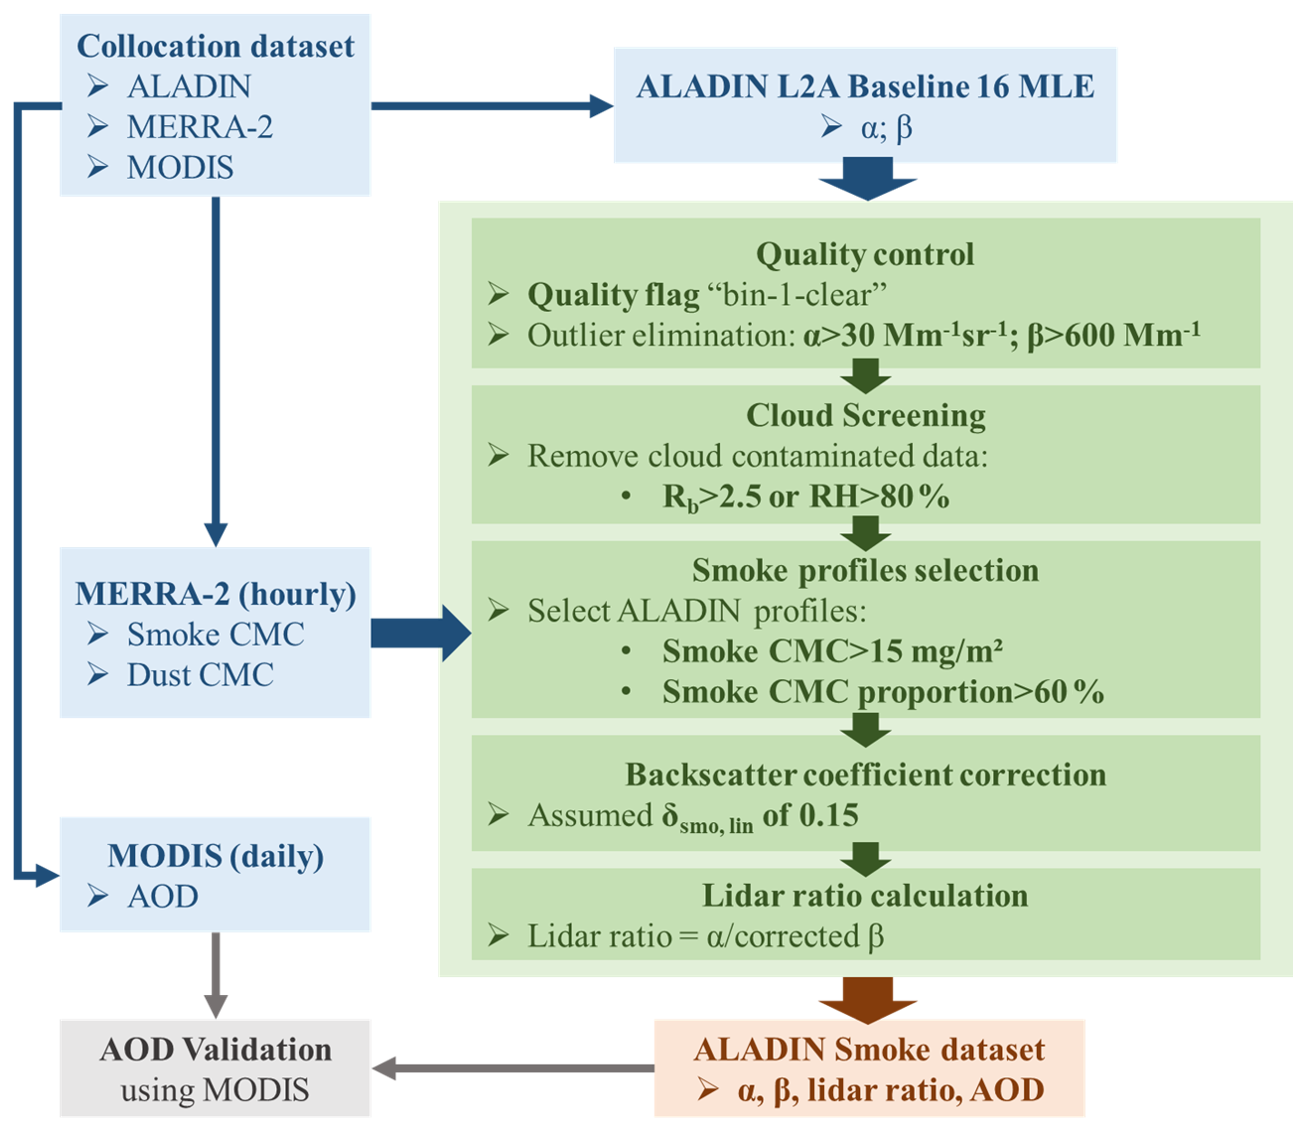
Figure 3Methodology flowchart for development and validation of the Aeolus-based smoke dataset. α and β represent ALADIN observed extinction and backscatter coefficients. Rb and RH represent backscattering ratio and relative humidity. CMC is column mass concentration and δsmo, lin is smoke linear depolarization ratio.
4.1 Collocation of multi-platform data
The smoke CMC data from MERRA-2 and the AOD data from MODIS are used for deriving and validating the Aeolus-based smoke dataset, respectively. Daily AOD averages are based on data from MODIS onboard Terra and Aqua. Due to the different spatial resolutions, these data were collocated to the Aeolus data grid, which follows the Aeolus orbit. The AOD data from MODIS used in this study is with a spatial resolution of 1° and a temporal resolution of one day. The smoke CMC data from MERRA-2 has a spatial resolution of 0.5° × 0.625° and a temporal resolution of 1 h. For the collocation, the temporal closest and spatial nearest data bins of AOD and smoke CMC to the Aeolus data grid, which has a horizontal resolution of 90 km along its orbits were selected. However, the time difference between Aeolus and Terra or Aqua can be several hours, while the difference between Aeolus and MERRA-2 can be tens of minutes, due to their distinct temporal resolutions.
4.2 Derivation of the smoke dataset from ALADIN observations
The extinction and backscatter coefficients measured by Aeolus contain information on both clouds and aerosols. In order to characterize the features and the evolution of the smoke plumes during transport, a smoke dataset including extinction coefficient, backscatter coefficient and lidar ratio from Aeolus products should be acquired. Therefore, several steps were adopted to derive smoke data from the Aeolus L2A products:
-
Quality control. The flag “bin-1-clear” (set to 1), indicating normally detected profiles, inside the Aeolus L2A product was used for the preliminary quality control. Thresholds were set for the outlier elimination of backscatter and extinction coefficients. Backscatter coefficients larger than 30 Mm−1 sr−1 and extinction coefficients larger than 600 Mm−1 were eliminated.
-
Cloud screening. We applied a similar method to that used in the marine aerosol research of Sun et al. (2024). Data bins with a backscatter ratio (Rb, calculated by dividing the total backscatter coefficient by the molecular backscatter) higher than 2.5 are identified as cloud contamination. The threshold of relative humidity (RH) was set more strictly than in Sun et al. (2024), such that clouds are considered to exist with a high possibility when RH is above 80 % (Forbes et al., 2009). Consequently, Aeolus L2A data bins with Rb and RH no more than 2.5 and 80 % are considered as aerosol data bins.
-
Smoke profile selection. The Aeolus aerosol dataset from Aeolus L2A has been acquired by step 1 and 2. As introduced in Sect. 3, CALIOP classified about 15 % of the aerosols in the smoke transport region as dust. CMC data from MERRA-2 was utilized to select the L2A profiles with smoke aerosols. A Level 2A profile can be considered a “smoke profile” if it meets the following two criteria: a smoke CMC greater than 15 mg m−2 and a smoke CMC proportion (calculated by the smoke CMC dividing the sum of the smoke CMC and the dust CMC) exceeding 60 %.
-
Backscatter coefficient correction. Since ALADIN missed the cross-polar component of the particle backscattered signals, the original backscatter coefficients from Aeolus L2A products were underestimated. Thus, the correction is needed in order to obtain the total backscatter coefficient. Additionally, as ALADIN was a circular polarization lidar system, the smoke circular depolarization ratio (δsmo, cir) converted from δsmo, lin should be used for the correction. The backscatter correction was accomplished applying the formulas below (Roy and Roy, 2008; Paschou et al., 2022):
In terms of this smoke transport event, it has been determined that the δsmo, lin at 532 nm over the continental US is about 0.1 and the δsmo, lin at 355 nm over the Europe is around 0.15 (Hu et al., 2022). We also investigated the stability of δsmo, lin during long transport, as well as the impact of their variation on total backscatter coefficient and lidar ratio in the following. Using the L2 APro product and L2 VFM product of CALIOP from 11 to 21 September, we examined the variation of δsmo, lin in the smoke transport pathway. The particulate linear depolarization ratio data bins in the L2 APro product identified as the smoke-related aerosols (flagged as “elevated smoke”, “polluted continental/smoke”, “polluted dust” in the VFM product) were utilized for analysis. Since the transport was generally eastward, the red box region in panel (a) of Fig. 2 was divided into 9 sub-regions, each 20° wide zonally from 140° W to 40° E. The average δsmo, lin values were calculated for these sub-regions and presented in Table 1. The highest value, 0.119, appeared in the subregion between 100 and 80° W, while the lowest value, 0.110, appeared in the subregion between 20° W and 20° E. Basically, the average δsmo, lin at 532 nm exhibits a slight decline trend from west to east during smoke transport. Additionally, the δsmo, lin at 355 nm of 0.16 and the δsmo, lin at 532 nm of 0.12 were observed by Hu et al. (2022) for the same smoke transport event, from which we can derive that δsmo, lin at 355 nm is approximately 1.33 times that at 532 nm. Using a mean value of 0.115 from Table 1, this crude approximation yields that δsmo, lin at 355 nm is approximately 0.15. Therefore, we set the assumed δsmo, lin at 355 nm to 0.15 for the entire transport, considering no anticipated significant zonal variability indicated by the CALIOP observations at 532 nm.
-
Lidar ratio calculation. Smoke lidar ratios were calculated for each data bin of smoke profiles by dividing extinction coefficients by the corrected backscatter coefficients.
Table 1Depolarization ratio (mean ± standard deviation) at 532 nm of the smoke plume and the corresponding data bin counts during transport from 140° W to 40° E, derived from CALIOP observations.

One cross-section example that was processed using the five steps above and the corresponding orbit is shown in Fig. 4. Panel (a) shows aerosol extinction coefficients of Aeolus crossing the smoke plume on 15 September 2020. The cross-section started at 11:51:59 UTC on 70.0° N, 75.8° W and ended at 12:04:47 UTC on 20.5° N, 91.1° W, crossing the eastern US on a descending orbit. The black bins indicate the invalid values while the gray ones indicate the cloud contaminated bins. They were all removed for subsequent characterization. Within the red dashed lines, the “smoke profiles” captured a thick smoke layer alongside a cloud layer. The maximum altitude was around 10 km, and the latitude range was 33 to 48° N (with a meridional width of more than 1500 km).
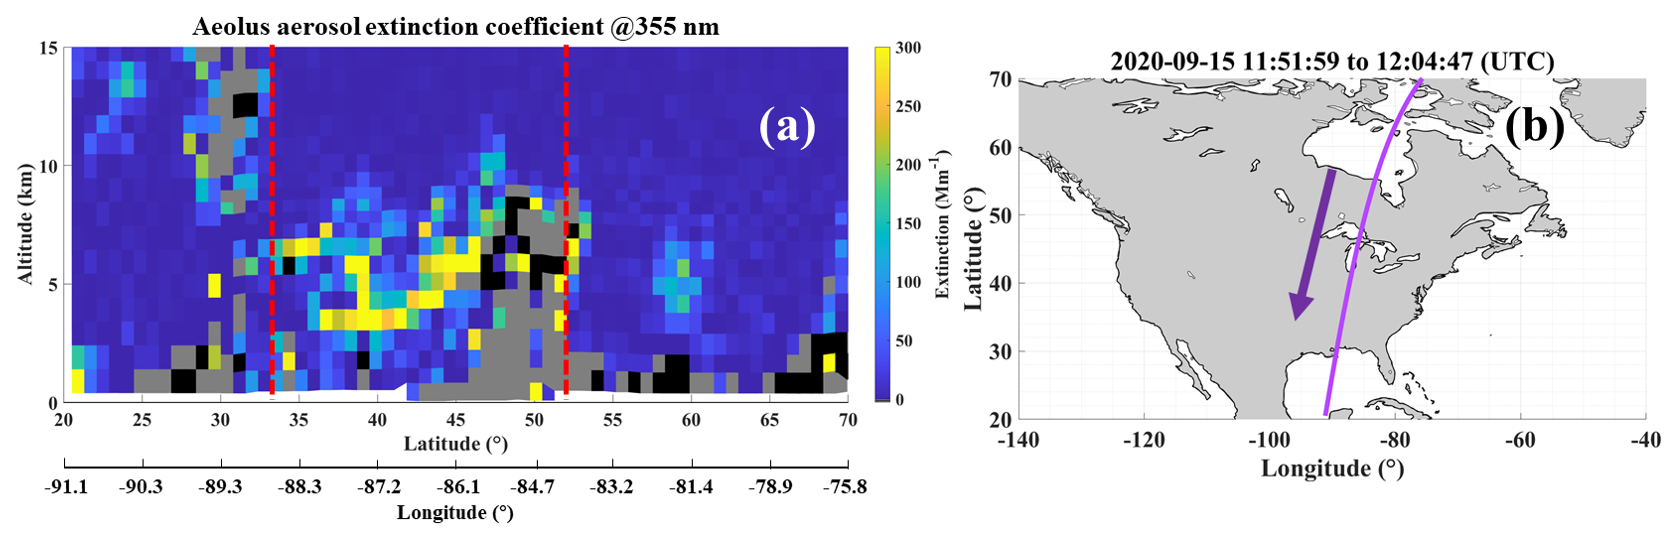
Figure 4(a) One cross-section example of Aeolus aerosol extinction coefficient crossing the smoke plume, on 15 September 2020, starting at 11:51:59 UTC on 70.0° N, 75.8° W and ending at 12:04:47 UTC on 20.5° N, 91.1° W. (b) The corresponding descending orbit indicated by the purple curve (Aeolus orbit) and the purple arrow (Aeolus flight direction). The data in panel (a) has been processed to derive smoke data from Aeolus by the steps introduced in the section “Derivation of the smoke dataset from ALADIN observations”. The black bins indicate the invalid values, while the grey ones indicate the cloud contaminated bins. The profiles inside two red dashed lines are the “smoke profiles”.
4.3 Caveats and uncertainties
This section outlines the caveats and potential uncertainties associated with the five steps used to derive the smoke dataset, as introduced in Sect. 4.2. Steps (1) through (3) are limited to data bin selection and thus do not introduce uncertainties beyond those inherent in the Aeolus observational data. Nevertheless, the bin selection itself is subject to the methodological uncertainty because it relies on the threshold values of Rb, RH and smoke CMC, all of which are associated with their own uncertainties. Consequently, these uncertainties may influence the retrieved mean optical properties. Step (4), “backscatter correction,” adopts an assumed depolarization ratio for both backscatter coefficient and lidar ratio correction. This step could introduce additional uncertainties, which will be discussed in detail below.
In step (1), “quality control,” preliminary quality control was conducted using the Aeolus flag and outlier elimination based on thresholds. The principle for threshold setting is that values exceeding the thresholds are unlikely to fall within the typical range of aerosol optical properties; they could represent outliers or be contaminated by clouds. After processing the selected Aeolus data (spatial domain: 140° W–40° E, 20–70° N; period: 11–21 September 2020) by step (1), 95 % of extinction coefficients (174 819 out of 183 997 data bins) and 95 % of backscatter coefficients (175 002 out of 183 997 data bins) were retained as valid data bins. Step (2), “cloud screening,” applies thresholds of Rb and RH, as cloud layers are characterized by stronger backscattering and higher RH. After step (2), 87 % of extinction coefficients (151 922 out of 174 819 data bins) and 86 % of backscatter coefficients (150 210 out of 175 002 data bins) were retained as aerosol data bins. The risk here is that even a few weak clouds with particularly low Rb and RH could contaminate the smoke dataset. In step (3), “smoke profiles selection,” hourly data from the MERRA-2 reanalysis dataset are used. The time gaps between colocated Aeolus and MERRA-2 data are less than one hour, during which the smoke layers are considered stable. Thus, the “smoke profiles” can be selected with the assistance of MERRA-2 dataset. After applying the smoke proportion threshold of 60 %, a mean smoke proportion of 79 % was computed from the selected smoke profiles. This indicates that the smoke dataset may contain a small amount of dust aerosol contamination.
With respect to step (4), the assumption of a constant linear depolarization ratio for backscatter coefficient and lidar ratio correction was based on the observations reported by Hu et al. (2022) and corresponding CALIOP measurements. It should be noted that this constant may vary depending on the characteristics of distinct smoke events. The assumption could introduce additional uncertainties. Regarding the uncertainties in the total backscatter coefficient and lidar ratio introduced by the depolarization ratio correction, the calculations of the first-order propagated standard deviations can be derived using Eqs. (1) and (2), as shown below:
Among them, and are the first-order propagated standard deviations of the total backscatter coefficient and the lidar ratio, individually, representing the uncertainties. αAeolus and βAeolus are the extinction and backscatter coefficients observed by Aeolus, while δsmo, lin and represent the smoke linear depolarization ratio and its corresponding uncertainty, respectively.
Utilizing these formulas, the uncertainties within a single smoke layer captured by one Aeolus cross-section as well as those across different transport stages, will be discussed as follows. First, to investigate the uncertainties introduced by depolarization ratio, assuming αAeolus of 200 Mm−1 and βAeolus of 3 Mm−1 sr−1 as constants, under both circumstances. δsmo, lin is set to the assuming constant of 0.15. For the uncertainty within a single cross-section, of 0.085 is adopted, derived from the standard deviations of sub-regions presented in Table 1. Applying formulas (3) and (4), and are computed as 0.6 Mm−1 sr−1 and 8.6 sr, respectively. Although this estimation is contingent upon specific assumptions and the use of CALIOP-derived , this approximate uncertainty quantification demonstrates that and per data bins attributable to may exceed the uncertainties within a single cross-section (as indicated by the standard errors of the mean listed in Table 1). It should be illustrated that the standard errors of the mean in Table 2 do not incorporate the uncertainty estimation described above, as no accurate depolarization information was available for the Aeolus observations. As for the uncertainties introduced by depolarization ratio across different transport stages, the is set to 0.009, which is the maximum difference of the mean depolarization ratio values presented in Table 1. This procedure tests whether the longitudinal changes in the backscatter coefficient and lidar ratio discussed in Sect. 5 remain robust when the variation in the linear depolarization ratio is considered. Under this assumption, and can be calculated as 0.06 Mm−1 sr−1 and 0.9 sr, respectively, using formulas (3) and (4). Considering the mean lidar ratio values of the different cross-sections shown in Table 2, the maximum variation is around 20 sr. Therefore, under the assumption that δsmo, lin is 0.15, and are negligible and will not affect the trends of the mean values across different longitudinal transport stages. In conclusion, while correcting the smoke backscatter coefficient and lidar ratio using δsmo, lin of 0.15 may introduce additional uncertainties for each data bin (0.6 Mm−1 sr−1 for backscatter coefficient and 8.6 sr for lidar ratio), the corrected results are used for only the mean value analyses of a single measurement cross-section or a specific sub-region in the following discussion.
4.4 Validation of the Aeolus smoke dataset
The performance of ALADIN aerosol profiles has been examined and demonstrated in several validation studies, including Baars et al. (2021), Abril-Gago et al. (2022), Gkikas et al. (2023), and Trapon et al. (2025). Among these, Baars et al. (2021) conducted co-temporal profile comparisons between ALADIN and a ground-based lidar and confirmed ALADIN's capability for profiling backscatter coefficient, extinction coefficient, and lidar ratio within a smoke layer. This smoke layer observed over Europe was found to have been advected from the US, and its transport closely matches and slightly precedes the transport event examined in the present study. Nevertheless, for the purpose of verifying the reliability of the derived Aeolus smoke dataset across the entire transport, spaceborne measurements provide data with much larger spatial coverage compared to ground-based lidars, which are limited to specific stations. For a transatlantic dust transport event in June 2020, ALADIN aerosol observations were compared with CALIOP, despite a temporal gap of several hours and a limited number of well-matched orbits (Song et al., 2024). Considering the scarcity of well-matched orbits, the lack of a cross-polar component in ALADIN backscatter coefficient measurements, and the reliance of CALIOP extinction coefficient retrieval on assumed lidar ratios, we decided to use MODIS for AOD validation. Despite the temporal gap of several hours between ALADIN and MODIS, the averaging of Terra and Aqua MODIS data, together with the statistical results based on a large number of data points (N= 1247, as shown in Fig. 5), can provide evidence for ALADIN validation to some extent.
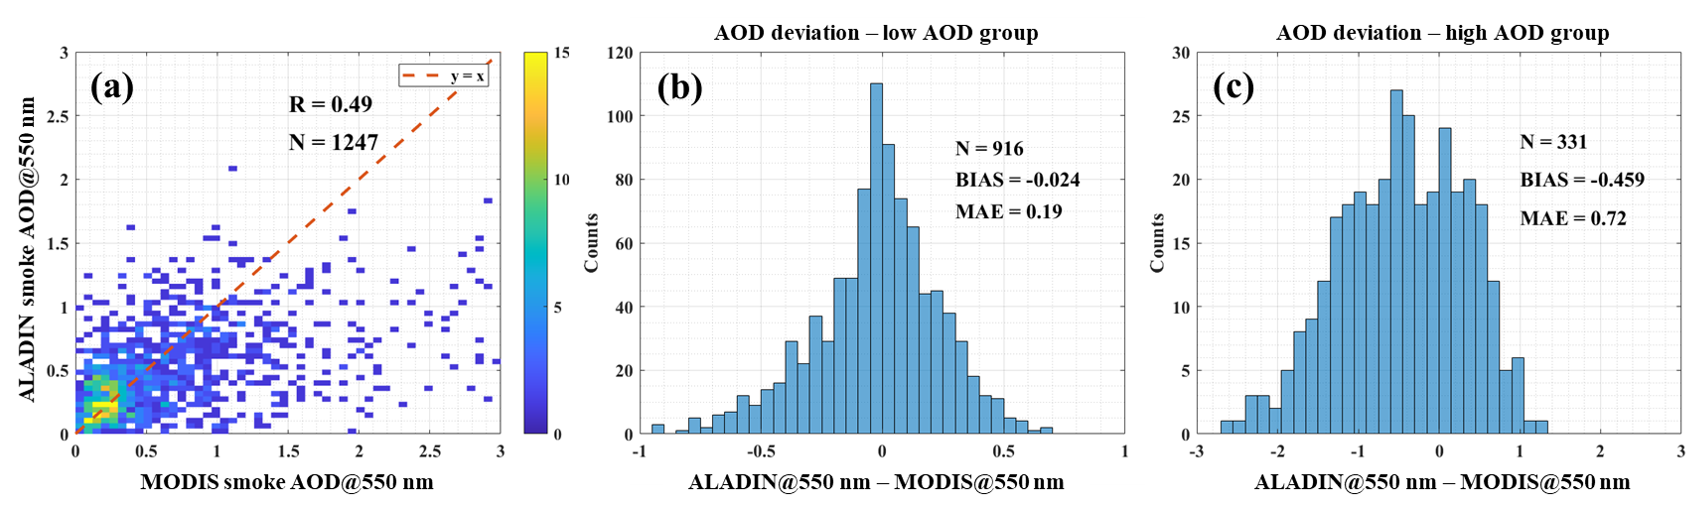
Figure 5Comparison results between converted ALADIN AOD and MODIS AOD, both at 550 nm. (a) Scatter of MODIS and ALADIN AOD. AOD deviation histograms of ALADIN AOD minus MODIS AOD for (b) high AOD group and (c) low AOD group.
The dataset covers the period from 11 to 21 September 2020, and the spatial range is from 140° W to 40° E and 20 to 70° N. Considering that ALADIN (355 nm) and MODIS (550 nm) AOD are in different wavelength and only smoke AOD is compared, the wavelength conversion was conducted. The Ångström exponent of 0.5 was applied to the conversion from 355 to 532 nm (ÅE355–532), as reported by Hu et al. (2022) for the same smoke event. The low ÅE355–532 suggests that the smoke plumes could be dominated by the coarse mode aerosols. We also consider it acceptable to use ÅE355–532 for a similar wavelength range (355 to 550 nm), assuming the Ångström exponent is constant within the range of 355 to 550 nm. The conversion was accomplished using the following formula (Ångström, 1964):
Basically, the scatter between the MODIS and ALADIN AOD both at 550 nm is presented in Fig. 5a, indicating a reasonable degree of agreement, given their distinct measurement techniques, different spatial grids and overpass times. It is evident that the ALADIN AODs are generally less than 1.5 when MODIS AODs range from 1.5 to 3, illustrating that MODIS AODs exceed ALADIN AODS under relatively high AOD conditions. To investigate more specifically, based on these features, we separated the AODs into two groups according to their values. The low AOD group consists of AOD values below 1, while the high AOD group comprises either ALADIN or MODIS AOD values above 1. The AOD deviations between the ALADIN and MODIS measurements for the low and high AOD groups are presented in the histograms in Fig. 5b and c. With respect to the low AOD group, the number of matched pairs (N) is 916 while mean bias (BIAS) is −0.024 and mean absolute error (MAE) is 0.19. These results indicate good agreement and suggest that, compared with MODIS, the Aeolus smoke dataset can provide reliable AOD and extinction coefficient when AOD is below 1. For the high AOD group, N is 331, with a BIAS of −0.459 and a MAE of 0.72. It has been reported that during severe smoke events, MODIS AOD (derived using either the Deep Blue or Dark Target algorithm) may overestimate the AOD under high AOD conditions (Gumber et al., 2023). This finding could explain the overestimation of MODIS AOD observed in this study.
5.1 Cross-sections of the smoke aerosol layers at different transport stages
Seven ALADIN observations with descending orbits from west to east, from 14 to 21 September were selected, intended for analysing the smoke layers at different transport stages. The locations of these cross-sections are shown as the white curves in Fig. 6, with the background smoke CMC maps temporally closest to every Aeolus orbit. From the smoke CMC maps, it can be clearly seen that a smoke plume generated from the west coast of the US, crossing the continental US and reached the Atlantic. There, it apparently separated into two plumes. One of them, the larger one, arrived in Europe, while the other propagated to the Mediterranean. The seven Aeolus orbits, all of which cross the smoke plumes indicated by the smoke CMC maps, have the potential to capture cross-sections of the smoke plumes at different transport stages.
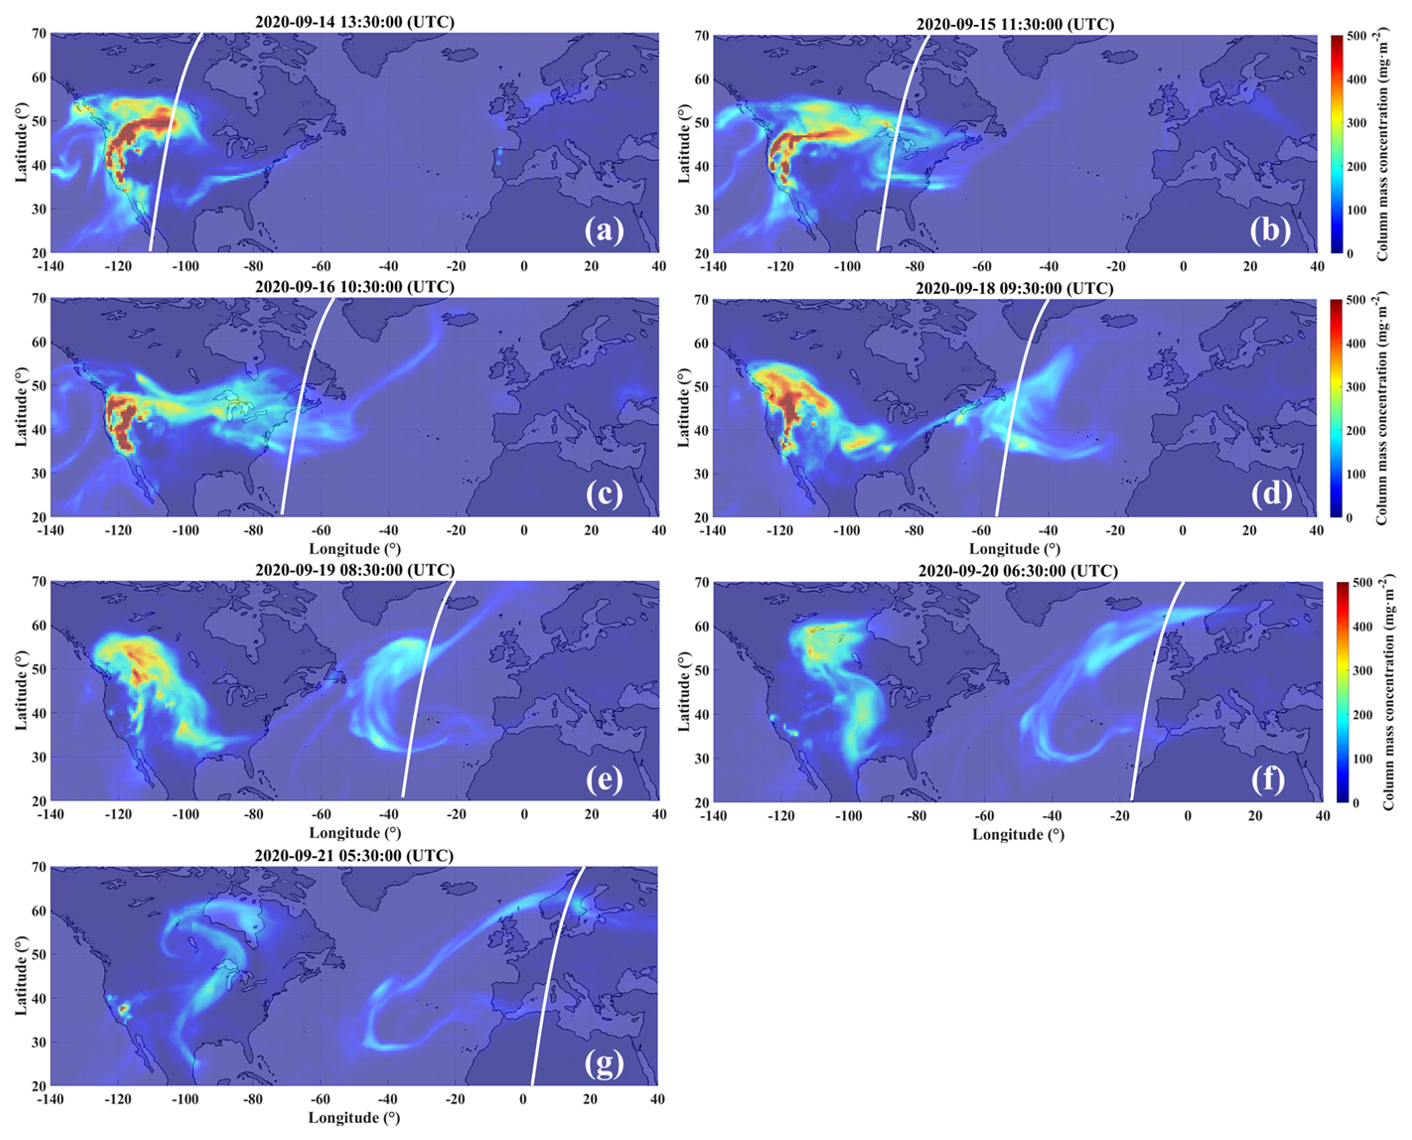
Figure 6Smoke column mass concentration map in the spatial range of 140° W to 40° E, 20 to 70° N, on (a) 14, (b) 15, (c) 16, (d) 18, (e) 19, (f) 20, (g) 21 September 2020, respectively. The white curves indicate the selected Aeolus orbits on the same days.
5.1.1 General transport pathway analysis by the cross-sections
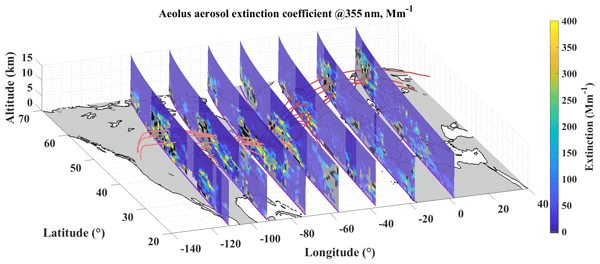
Figure 7a shows the seven selected cross-sections of the Aeolus aerosol extinction coefficient at 355 nm from 14 to 21 September. The black bins indicate invalid data, and the white bins indicate cloud-contaminated data. The dark regions are considered to consist of “smoke profiles”, but the bright regions did not meet the criteria introduced in Sect. 4.2 and were therefore not considered for further analysis. The backward and forward trajectories are also plotted in Fig. 7a, indicated by pink and red curves, respectively. The details of the trajectories are shown in Fig. 6b and c. The starting time is 10:00 UTC on 18 September 2020 and the starting locations were determined by the smoke layers in the Aeolus cross-section on that day. The locations are 49.49° W, 48.55° N; 50.52° W, 44.62° N; and 51.44° W, 40.69° N. They are all in the smoke layers at altitudes of 3000, 5000, and 7000 m. The duration of the backward trajectories is 96 h ending at 10:00 UTC on 14 September, while the duration of the forward trajectories is 72 h ending at 10:00 UTC on 21 September. All seven cross-sections captured the smoke layers, and these layers show good agreement with the HYSPLIT trajectories. Considering that the seven Aeolus orbits crossed the smoke plumes indicated by the CMC maps (as presented in Fig. 6), it can be inferred from the above facts that the smoke layers observed in the seven cross-sections originated from the same smoke plume but at different transport stages. Regarding the smoke layers, it can be observed that, during the initial transport stages over the continental US on 14 and 15 September, the smoke plumes were accompanied by clouds on their northern sides. The main part of the smoke plume was transported northeast along the HYSPLIT trajectories after 18 September. However, in the cross-sections on 19 and 20 September, a few smoke layers were also identified and observed in the south region with latitudes between 30 and 40° N, corresponding to the “plume separation” phenomenon found in the analyses of Figs. 2 and 6. Only few smoke profiles were determined in this southern pathway, which might result from the smoke plume being weak, also suggested by the southern branch presented in Fig. 6e and f. In Fig. 7c, the two green curves turning to the south could also illustrate the same phenomenon. On 20 and 21 September, the ALADIN observations indicated that the smoke layers were located above the cloud layers. Across the complete dataset, five of the six smoke layers identified in the ALADIN cross-sections over Europe during these two days were found above clouds. This suggests that the smoke plume was predominantly above clouds upon reaching Europe. The limited forward trajectory simulations may not adequately represent the ascending motion of the smoke layer compared to what was observed by ALADIN.
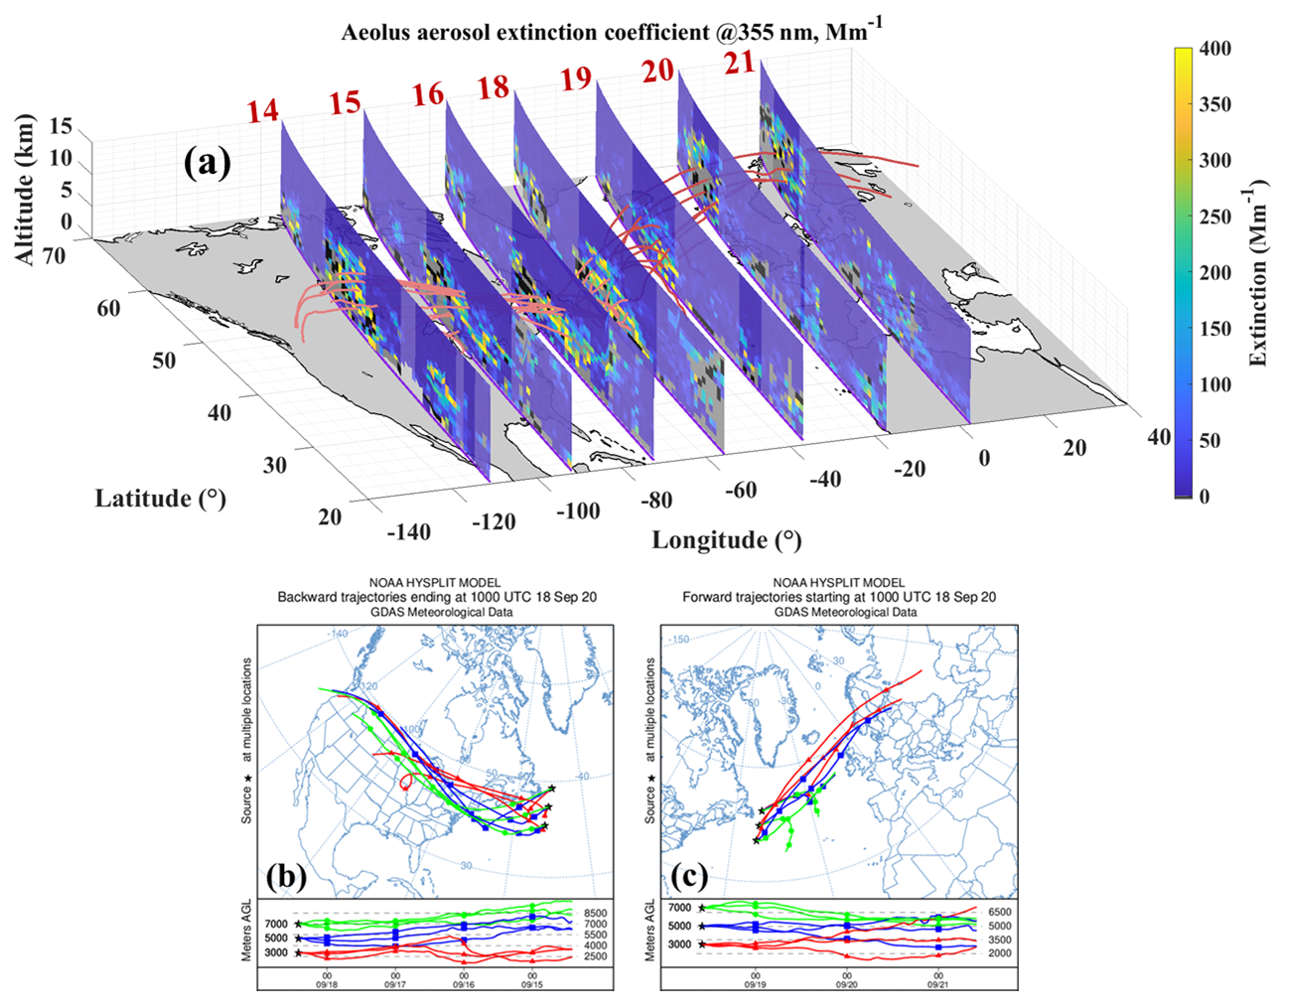
Figure 7(a) The selected cross-sections of Aeolus aerosol extinction coefficient at 355 nm on 14, 15, 16, 18, 19, 20, 21 September 2020, with the HYSPLIT trajectories starting from 18 September. In the cross-sections, the black and grey bins indicate invalid data and cloud contaminated data separately, while the pink curves present the backward trajectories and the red curves are the forward trajectories. The dark parts of the curtains indicate smoke profiles identified by the step (3) in Sect. 4.2. Details of the (b) backward and (c) forward trajectories originating from the middle of the transport pathway (acquired by https://www.ready.noaa.gov/HYSPLIT_traj.php, last access: 23 July 2026).
5.1.2 Characteristics of the smoke layers at different transport stages
To better characterize the smoke layers at the different transport stages, Fig. 8 presents boxplots of the extinction coefficient, total backscatter coefficient, lidar ratio, aerosol optical depth (AOD), height, and relative humidity of the smoke layers in the cross-sections shown in Fig. 7a. Only the northern smoke layers (if multiple smoke regions exist, e.g., in the cross-sections of 14, 19 and 20 September) seen in the main smoke plume pathway were selected for the calculation. More statistical results including the mean values and the corresponding standard errors the mean (SEM) of these parameters are summarized in Table 2. It should be noted that only Aeolus smoke data bins with an extinction greater than 30 Mm−1 and a backscatter greater than 1 Mm−1 sr−1 were considered representative of smoke layers and used in the statistical calculation. These thresholds are set to filter out low noisy values, which can be observed in the clear sky region of the cross-section presented in Fig. 4a, so that the remaining values above the threshold are considered representative for the smoke layers. The additional uncertainties of the corrected total backscatter coefficient introduced by the assumed depolarization ratio are discussed in Sect. 4.3, but are not included in Fig. 7 and Table 2.
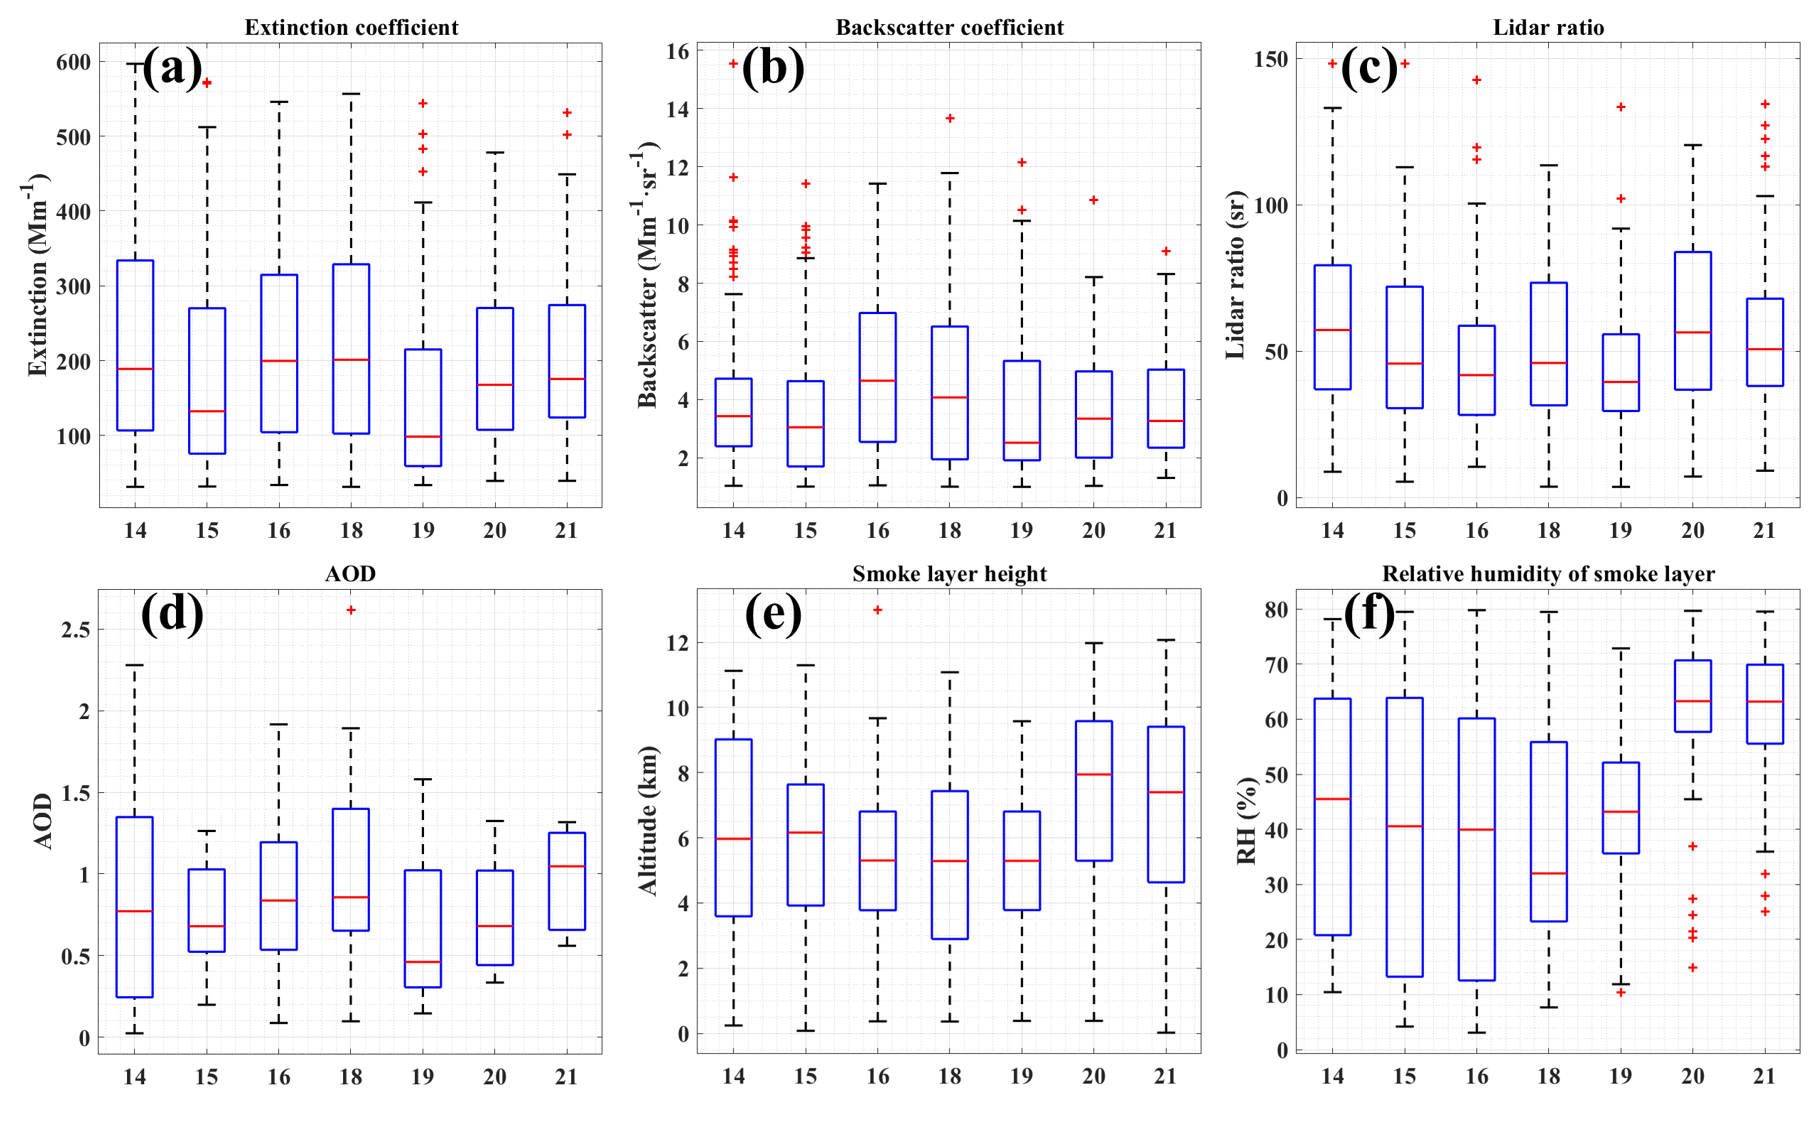
Figure 8The boxplots of (a) extinction coefficient, (b) backscatter coefficient, (c) lidar ratio, (d) AOD, (e) data bins' altitude and (f) relative humidity of the smoke layers in the cross-sections of Fig. 7a. Only the north smoke layers (if multiple smoke layers exist, e.g., in the cross-section of 14, 19 and 20) seen in the main smoke plume pathway were selected for the calculation.
Table 2Mean values and standard error of the mean (SEM) of extinction coefficient, backscatter coefficient, lidar ratio, AOD, height and relative humidity, of the smoke layers in the cross-sections shown in Fig. 7a.
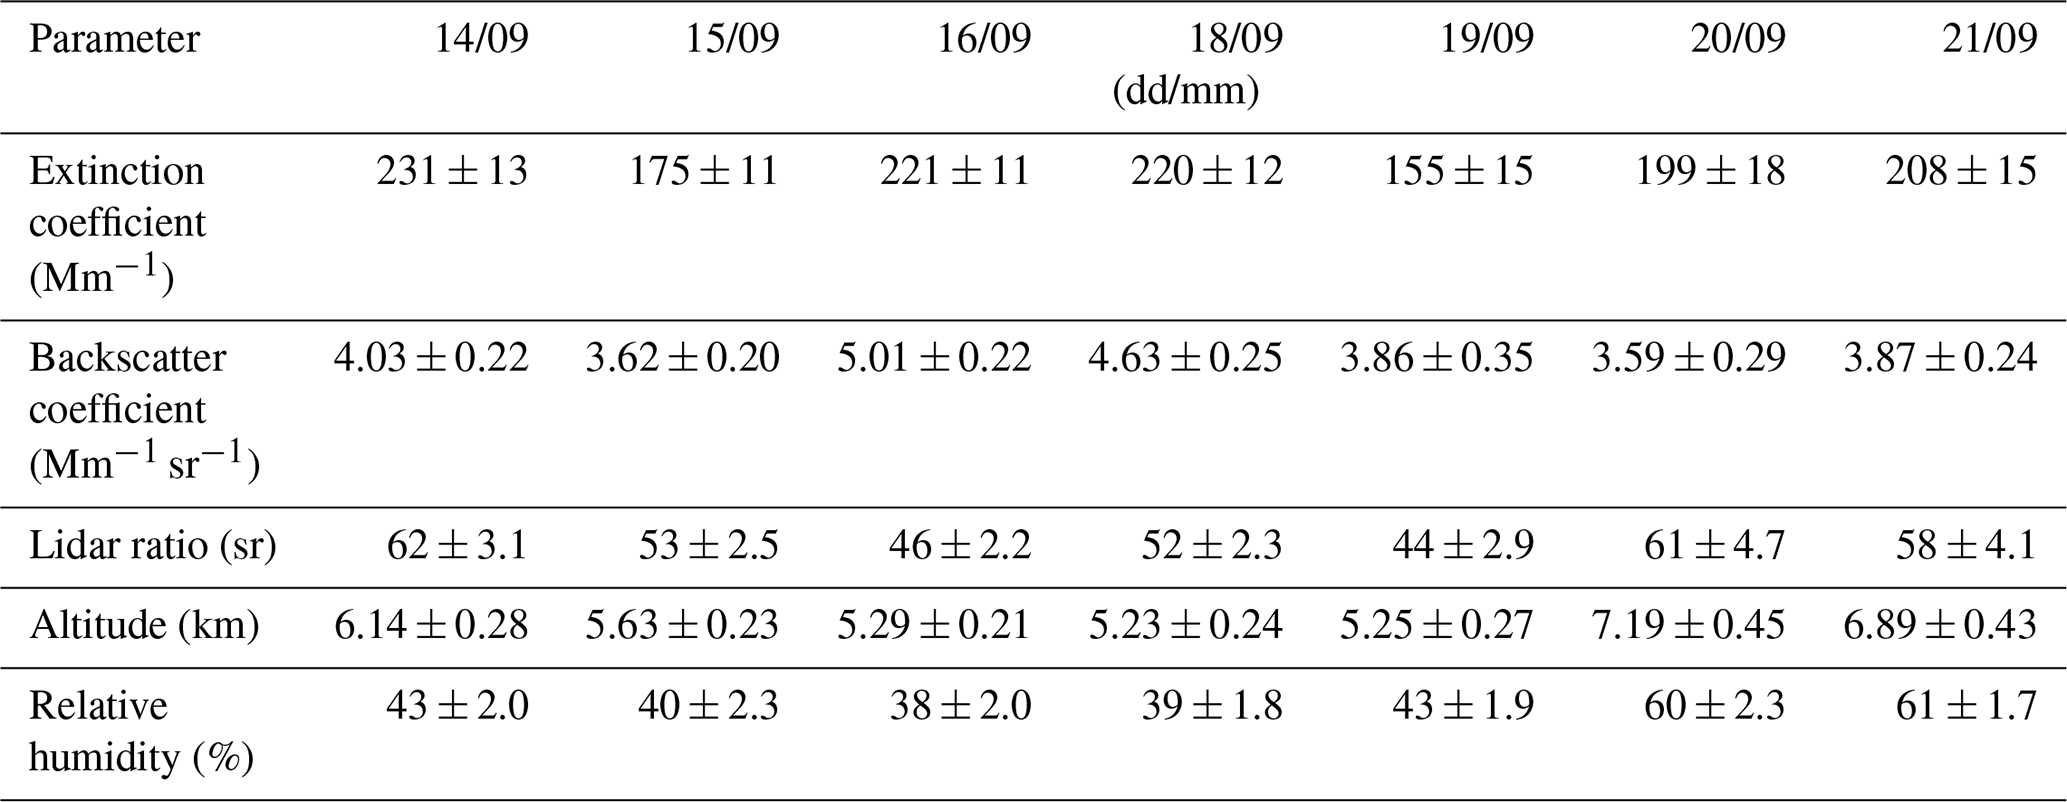
As the extensive properties of aerosols retrieved from the lidar measurements, the extinction coefficient and the backscatter coefficient can represent smoke concentrations. Comprehensively considering the variations in the means and the medians of these two properties during the transport, it can be found that the extensive properties of the smoke layers on 16 and 18 September were obviously higher than those of cross-sections on 15 and 19 September, indicating higher smoke concentrations. This can also be observed in the cross-sections of 16 and 18 September in Fig. 7a, which include more bins with high extinction values ranging from 300 to 400 Mm−1 (indicated by yellow). The high smoke concentrations could result from the potential accumulation of smoke aerosols when they were transported to above the Atlantic. This phenomenon agrees well with the findings from the analysis of the MODIS AOD and MERRA-2 smoke CMC across the entire transport region, as illustrated in Fig. 2a and b and the accompanying descriptions. On 20 and 21 September, the mean extinction coefficients are 199 and 208 Mm−1, and the mean backscatter coefficients are 3.59 and 3.87 Mm−1 sr−1, which are considered quite high over Europe. In a study targeting a very similar smoke transport event, Hu et al. (2022) reported that a smoke layer transported from the western US was observed by a ground-based lidar over Lille, France, between 22:00 UTC on 11 September and 03:00 UTC on 12 September 2020, with extinction and backscatter coefficients at 355 nm of approximately 180 Mm−1 and 5 Mm−1 sr−1, respectively. Similarly, Baars et al. (2021) used a ground-based lidar to detect a smoke layer transported from the western US over Leipzig, Germany, on 11 September 2020, reporting extinction and backscatter coefficients at 355 nm of around 160 Mm−1 and 3.3 Mm−1 sr−1. In both cases, the smoke layers were found in the troposphere (5–7 km), which is comparable to the layer heights observed on 20 and 21 September in this study (7.19 and 6.89 km, respectively). Although these two cases do not describe transport events identical to the one in the present study, they exhibit extinction and backscatter coefficients similar to those observed here, thereby providing some validation for the ALADIN measurements over Europe. Taken together, these findings suggest that dense smoke plumes originating from the western United States covered Europe on 11, 12, 20, and 21 September 2020.
As for the variations in the lidar ratio, one of the intensive properties that is independent of aerosol concentrations, it presents the properties of smoke particles at different transport stages. The mean lidar ratios ranged from 44 to 62 sr, consistent with the broad range of tropospheric smoke lidar ratios (30–110 sr), summarized in Ansmann et al. (2021). A general declining trend from 62 sr on 14 September to 44 sr on 19 September was observed as the smoke transported from the west US to the mid-Atlantic. This decline is considered attributed to the aging process of smoke aerosols, aligning with the findings and the statements in Nicolae et al. (2013), Haarig et al. (2018), Nicolae et al. (2026) and Haarig et al. (2026). Taking 44 ± 2.9 sr on 19 September 2020 as the lidar ratio for aged smoke, this value agrees well with the 40–50 sr reported in Baars et al. (2021) and the 40 ± 6 sr reported in Hu et al. (2022) for aged smoke layers from the similar transport event mentioned above. Subsequently, after being transported to Europe and appearing above cloud layers, the mean lidar ratios increased to around 60 sr on 20 and 21 September, a change that may be explained by hygroscopic growth. During the initial stages of the transport event (14–18 September), the smoke layers gradually became drier, with mean relative humidity from 43 % to 39 %. However, on 20 and 21 September, after the smoke had been transported over Europe and appeared above clouds, the relative humidity of the smoke layers increased to approximately 60 %. The lidar ratio and relative humidity exhibited consistent increasing trends on 20 and 21 September. Regarding the extinction coefficient, it increased from 155 to around 200 Mm−1, while the backscatter coefficient remained relatively stable. This suggests that the increase in relative humidity enhanced the smoke lidar ratio, given that the lidar ratio is calculated as the extinction coefficient divided by the backscatter coefficient. A similar phenomenon has been observed and discussed for continental aerosols in Haarig et al. (2025).
The smoke layer heights provide evidence that the layers were primarily in the troposphere during the transport. Regarding the mean values, the decline from 6.14 km on 14 September to 5.25 km on 19 September may illustrate that the layers settled slightly during the transport of the high-concentration smoke aerosol. However, altitudes of 7.19 km on 20 September and 6.89 km on 21 September illustrate that these layers were at higher altitudes after being transported to above the Europe.
In this section, seven descending ALADIN measurements were selected to characterize the cross-sections of the smoke plume during the transport. These measurements are considered representative of different transport stages of the same plume, as they are connected by the general transport pathway illustrated by the HYSPLIT simulations. However, they only provide a limited depiction of the entire smoke plume, which can extend over several thousand kilometers. The accompanying HYSPLIT trajectories should likewise be regarded as illustrative, since they are based on a limited number of releases from one time and from a small number of locations and altitudes.
5.2 Characteristics of the smoke aerosol plume across its entire transport
In this section, all smoke layers identified in the ALADIN measurement cross-sections from 14 to 21 September 2020, within the region from 140° W to 40° E and 20 to 70° N, are presented together with their statistical results. These analyses aim to investigate the evolution of the entire smoke event throughout its transport pathway. It should be noted that, according to the orbit configuration, all data used in this section were located close to the terminator but in illuminated regions (ESA, 2008). Accordingly, no differences are expected between data from ascending and descending orbits.
Figure 9 shows the smoke layers captured by ALADIN. The colors in the panel (a) indicate the observational time from 14 to 21 September 2020, while the colors in the panel (b) show the smoke AOD. Firstly, panel (a) is divided by a red dotted line. In the left side of the dotted line, it can be seen that blue and green tracks dominate the region of 140 to 40° W. This illustrates that smoke plumes were observed in this region from 14 to 18 September, and suggests that these smoke plumes were transported there during this period. There are also several yellow tracks in the continental US region, indicating that smoke aerosols were still being generated by wildfires from 19 to 21 September. To the right of the red dotted line, more yellow orbits appear from the mid-Atlantic region to northern Europe, implying the smoke plume moved along this pathway from 19 to 21 September. Several deep blue dots also appear there, suggesting that before 14 September, the smoke layers may have been transported from North America. It can be also clearly found that the smoke plume separated above the mid-Atlantic around 18 to 19 September. The movement of the smoke plume observed by Aeolus aligns well with the smoke CMC maps shown in Fig. 6. Although daily MODIS AOD can provide photo-like observations of smoke plumes over large horizontal regions, they are quite cloud-sensitive, and thus the smoke plume above northern Europe on 20 and 21 September cannot be recorded due to the cloud cover (shown in Fig. A1). We believe that Aeolus smoke dataset acquired in this paper is capable of observing a smoke layer even if clouds are present below the smoke layers in a given profile. As shown in panel (b) of Fig. 9, several high AOD values were observed above Northern Europe. In general, the bright yellow colors in the panel (b) indicate the main pathway of the smoke plume. The separated southern smoke plume, with the maximum AOD typically below 0.6, is inferred to be weaker than the northern one. The reason that Aeolus smoke dataset does not report the transport of the southern plume near the Sahara Desert could be that the plume is mixed with dust aerosols, leading to its exclusion from the dataset, as described in Sect. 4.2.
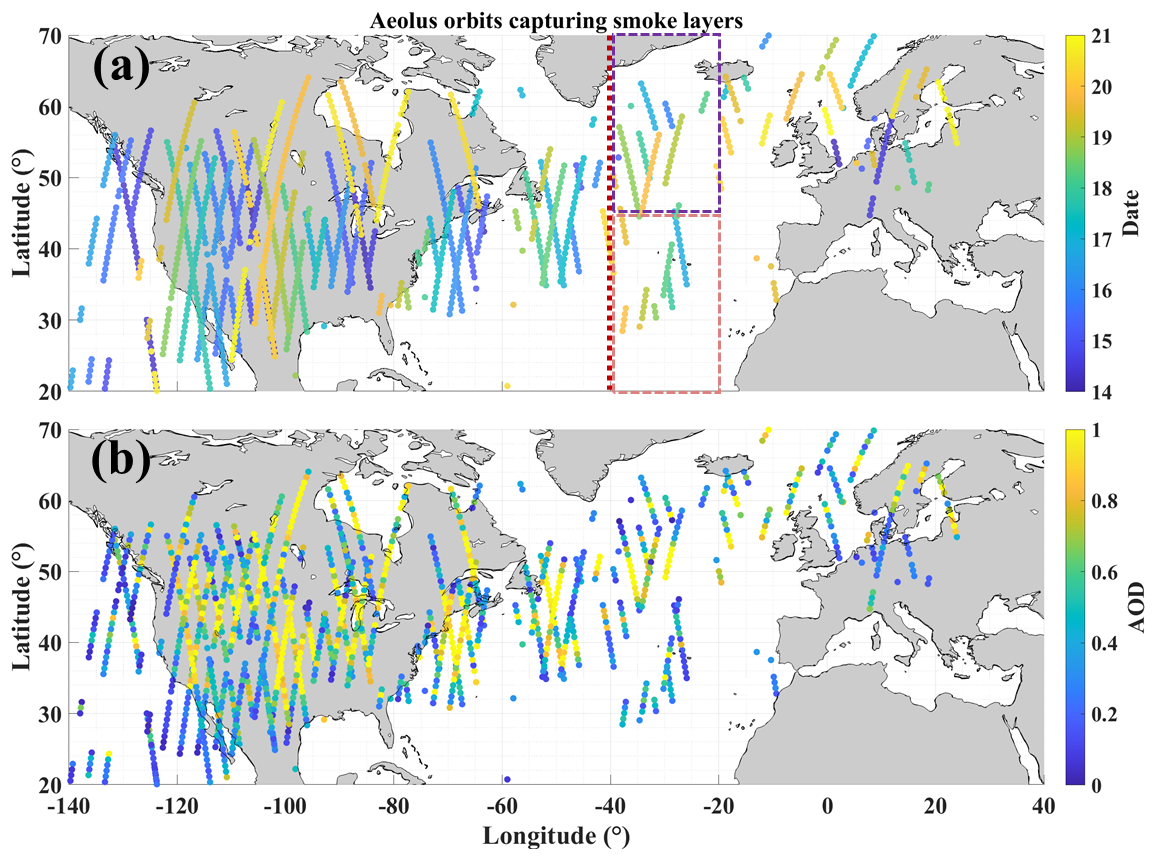
Figure 9Smoke layers captured by ALADIN along the Aeolus orbits, with the color of the tracks representing (a) observational time and (b) AOD. In panel (a), the red dotted line divides the layers at earlier and later transport stage, while the purple and pink dotted boxes highlight the layers of the northern and southern branches following the plume separation.
To characterize the features of the smoke event during transport more quantitively, the statistical results (AOD, altitudes and lidar ratio) will be analysed along the longitude in the following. Regarding AOD and lidar ratio, Aeolus smoke data bins within the altitude range of 2 to 12 km were selected for the statistics. The chosen altitude range was selected because (1) this smoke transport event occurred mainly below 12 km (see Fig. 8e), which approximately corresponds to the typical tropopause height in mid-latitudes, and (2) it minimizes the influence of other aerosol types present in the planetary boundary layer (e.g., continental pollution and marine aerosols). In addition, only the data bins with extinction greater than 30 Mm−1 and backscatter greater than 1 Mm−1 sr−1 were considered representative of smoke layers and used in the statistical calculation. These thresholds are set to filter out low noisy values, which can be observed in the clear sky region of the cross-section presented in Fig. 4a, so that the remaining values above the threshold are considered representative for the smoke layers. Since the entire smoke plume moved eastward, the statistical values along longitudinal lines are likely to reflect the characteristics of the smoke event along its transport pathway.
5.2.1 Variation of smoke aerosol optical depth and altitude along the longitude
In Fig. 10, using the Aeolus smoke dataset in the period of 14 to 21 September 2020, in the smoke plume transport region of 140° W to 40° E and 20 to 70° N, the means and the standard deviations of AOD (panel a) and altitude (panel b) were calculated with the longitude grid of 20°. The corresponding data counts are shown in panels (c) and (d).
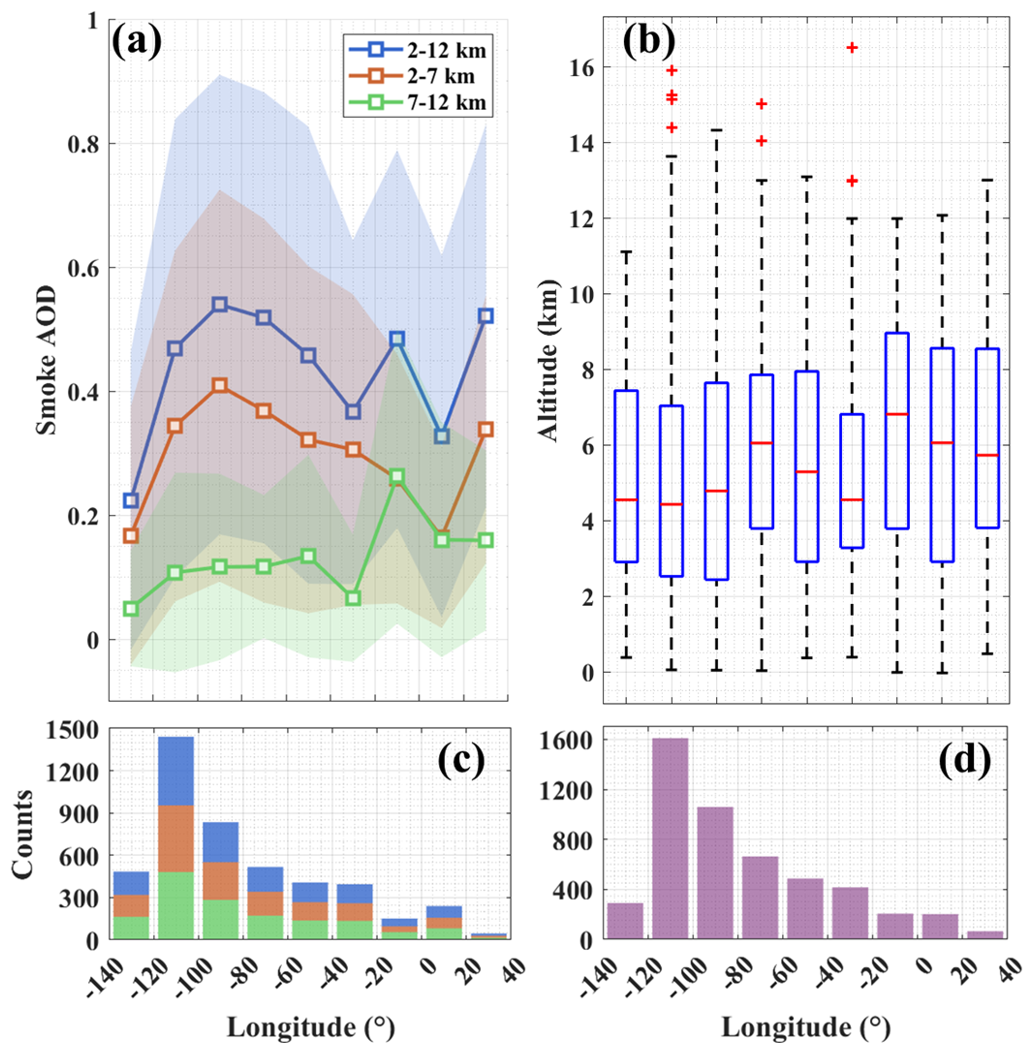
Figure 10Statistical results (a) smoke AOD (means and standard deviations), (b) smoke bins altitude (boxplot) along longitude. (c, d) The corresponding data counts of the statistics. The statistics were calculated using the Aeolus smoke dataset in the period of 14 to 21 September 2020, in the smoke plume transport region of 140° W to 40° E and 20 to 70° N, and with the longitude grid of 20°. Smoke AOD includes total AOD (2 to 12 km), AOD within 2 to 7 km (AODM), and AOD within 7 to 12 km (AODU), indicated by the blue, red and green curves, respectively. In panel (c), the corresponding data counts are also presented by the stacked bars in the same color with the AOD curves.
In panel (a), we present the variations of total AOD (2 to 12 km), AOD within 2 to 7 km (AODM, corresponding to the mid-troposphere) and AOD within 7 to 12 km (AODU, corresponding to the upper-troposphere), indicated by the blue, red and green curves individually. In general, the total AOD exhibits a declining tendency, dropping from around 0.54 to below 0.33 in the main transport region between 100° W and 20° E. Considering the declining trend in AOD from the Copernicus Atmosphere Monitoring Service model-from 0.5 over the western United States to 0.2 over Europe-during a similar smoke transport event in September 2020 reported by Ceamanos et al. (2023), and comparing both this event and the current study with a tropospheric transatlantic smoke transport event in 2019 from Canada to Europe, where AOD declined from 0.25 to 0.013 as reported by Shang et al. (2024), it can be inferred that the September 2020 smoke transport event was fairly severe. The AODM shows a similar trend, suggesting that the smoke layers in the mid-troposphere weaken during transport. Additionally, the sharp increases in AOD and AODM may be attributed to the low data count (15), which are considered insufficient to be representative of the observed trend. However, for the AODU, the slight increasing trend within 120 to 40° W indicates that a few smoke aerosols were lofted into the upper-troposphere from the mid-troposphere while the smoke plume was being transported into this region. The relatively large decline in AODU, from around 0.13 to below 0.07, occurred after plume separation in the region of 40 to 20° W. After being transported above Europe, the AODU increased rapidly to around 0.26 in the region of 20° W to 0°. Regarding to medians of the altitudes, basically, they show an ascending trend from around 4.4 to exceeding 5.3 km in the region of 140 to 40° W, which corresponds to the increasing AODU in this region. A descent to around 4.5 km appeared in the plume separation region between 40 and 20° W. Subsequently, the altitude medians tended to increase to over 6 km upon reaching Europe. Comprehensively considering the variations in both average AOD and altitude along the transport pathway, it can be inferred that the smoke plume was generally located below 12 km (the typical tropopause height at mid-latitudes), with its intensity weakening and its altitude rising.
Nevertheless, distinct weakened tendencies of AODU and layer altitude occurred in the region of 40 to 20° W, which may be related to the process of the plume separation, indicated by two branches of the smoke layers captured by ALADIN within the purple and pink dotted boxes in Fig. 9a, individually. For further investigation, the statistical analyses are conducted targeting these two boxes in the following.
5.2.2 Investigation of the two branches following plume separation
Integrating the ALADIN smoke observations within the purple and pink dotted boxes in Fig. 9a, representing the two branches following the plume separation, the smoke AOD and layer altitudes of both branches are investigated by statistical analyses.
Figure 11 presents the statistical results (boxplots, mean values, and corresponding standard deviations) of the two branches following the plume separation calculated from ALADIN smoke observations within the purple dotted box (latitude 45–70° N, longitude 40–20° W) and the pink dotted box (latitude 20–45° N, longitude 40–20° W) in Fig. 9a, labelled “Northern” and “Southern,” respectively. AODU, AODM, and layer altitudes are presented in panel (a), (b) and (c), respectively. Overall, the smoke aerosol load in the northern branch was higher than that in the southern branch. The notably low AODM of the southern branch, with a mean value of 0.038 and a median of 0.015, is consistent with the distinctly low AOD values observed in the region between 40 to 20° W, as shown in Fig. 9a. Regarding layer altitudes, the northern branch was situated higher than the southern one. The southern branch, with a mean altitude of 4.8 km and a median of 4.4 km, is considered be responsible for the low altitude in the same longitude band (40 to 20° W) depicted in Fig. 9a. The information from Fig. 11 provides insights into the behaviour of the two branches following the plume separation: the stronger and higher northern branch was subsequently transported toward Europe, while the southern branch was weaker and became lower in altitude.
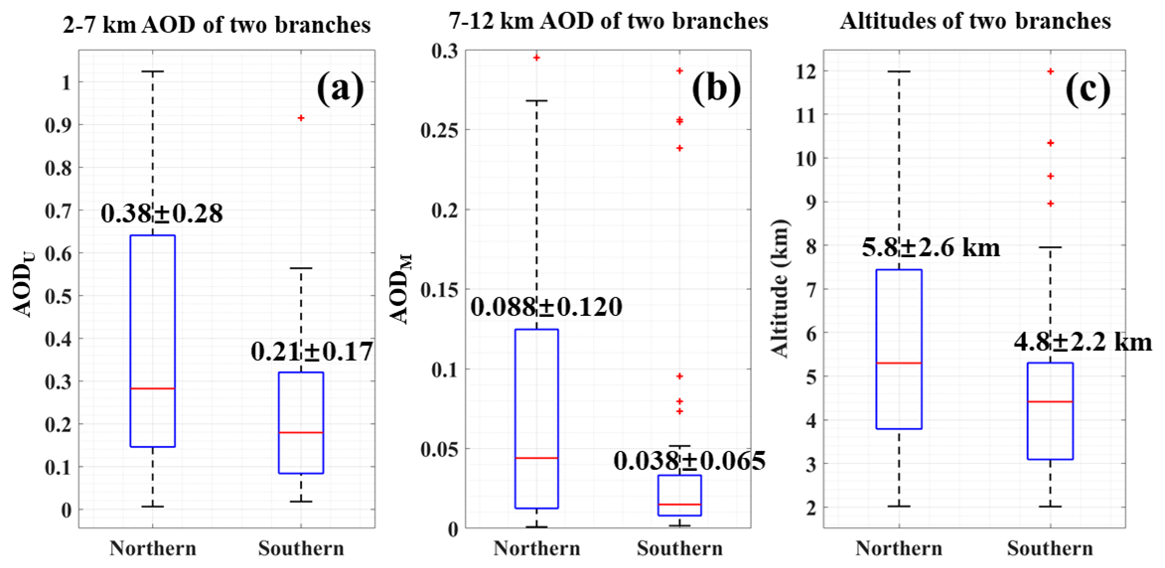
Figure 11Statistical results of the two branches following the plume separation calculated from ALADIN smoke observations within the purple dotted box (latitude 45–70° N, longitude 40–20° W) and the pink dotted box (latitude 20–45° N, longitude 40–20° W) in Fig. 9a, labelled “Northern” and “Southern”. (a) 2–7 km AOD (AODU) of two branches; (b) 7–12 km AOD (AODM) of two branches; (c) Layer altitudes of two branches.
5.2.3 Variation of lidar ratio along the longitude
Figure 12 shows the variation in the smoke lidar ratio with respect to longitude. Overall, the mean lidar ratio, ranging from 44 to 51 sr, fall within the typical range for smoke aerosols (Ansmann et al., 2021), though it exhibits less variability compared to the selected cross-sections (44 to 62 sr) discussed in Sect. 5.2.1. Initially, the mean values decrease from over 50 sr over the continental US (120 to 80° W) to around 45 sr over the mid-Atlantic (60 to 20° W). Subsequently, they turned to rise to nearly 50 sr upon reaching Europe. The decreasing-increasing trend is consistent with the findings in Sect. 5.2.1, and could also be explained by the aging process of smoke particles followed by hygroscopic growth (Haarig et al., 2025; Haarig et al., 2026). The impact of the backscatter correction, based on an assumed constant depolarization ratio, on the smoke lidar ratio has been discussed in Sect. 4.3. A variation in the mean depolarization ratio of approximately 0.01 at different transport stages could result in a lidar ratio variation of about 0.9 sr, which has a negligible effect on the overall lidar ratio variation. Therefore, the mean lidar ratio shown in Fig. 12 is considered representative of the entire smoke transport event along the pathway.
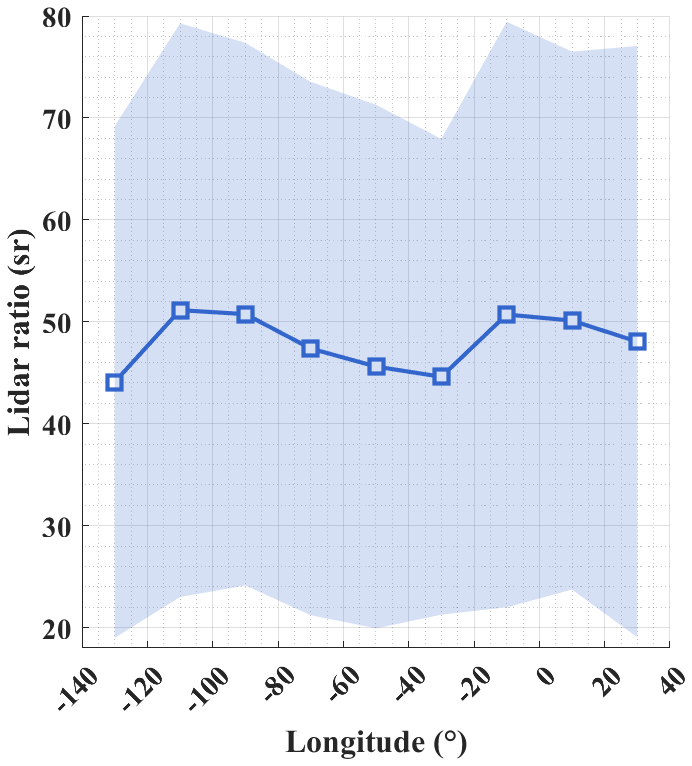
Figure 12Statistical results (means and standard deviations) of smoke lidar ratio along longitude. The statistics were calculated by using the Aeolus smoke dataset (within the altitude range of 2 to 12 km) in the period of 14 to 21 September 2020, in the smoke plume transport region of 140° W to 40° E and 20 to 70° N, and with the longitude grid of 20°.
Spaceborne lidar observations are well suited for studying the large-scale aerosol transport, because they have the potential to acquire cross-sections of aerosol plumes during different transport stages. Although the Atmospheric Laser Doppler Instrument (ALADIN) onboard the Aeolus satellite was designed as a wind measurement lidar, it is capable of providing aerosol profiles as a high spectral resolution lidar. These profiles can be used to investigate aerosol transport.
In this study, targeting the wildfire season of the West Coast of the US in September 2020, a comprehensive investigation of transatlantic transport of smoke generated by intense fires was conducted, based on the ALADIN observation, in synergy with another spaceborne lidar CALIOP (Cloud-Aerosol Lidar with Orthogonal Polarization), spaceborne passive instruments (Visible Infrared Imaging Radiometer Suite, VIIRS; Moderate-resolution Imaging Spectroradiometer, MODIS) and models (Modern-Era Retrospective analysis for Research and Applications, Version 2, MERRA-2; Hybrid Single Particle Lagrangian Integrated Trajectory Model, HYSPLIT). The smoke plume transport event was determined starting from the west coast of the US on 14 September, crossing the Atlantic, finally arriving above Europe on 21 September. In order to derive a smoke dataset of extinction coefficient, backscatter coefficient and lidar ratio from Aeolus, a collocation dataset comprising Aeolus products, MODIS AOD, and MERRA-2 smoke column mass concentration (CMC) was established. Subsequently, the method for deriving smoke data from ALADIN observations was highlighted, including (1) quality control, (2) cloud screening, (3) smoke profile selection, (4) backscatter coefficient correction and (5) lidar ratio calculation. The backscatter coefficient correction was achieved with the aid of CALIOP depolarization ratios. The reliability of the Aeolus smoke dataset was validated by the comparison of AOD with MODIS measurement.
In terms of the characterization of the smoke transport, seven cross-sections on 14, 15, 16, 18, 19, 20 and 21 September, located from the west of the US eastwards to the Europe, were selected as the first case. HYSPLIT trajectory simulations have been used to illustrate the general transport pathway of the smoke transport event. The characterization of the smoke layers across the transport pathway was described in detail by the vertical structure within these cross-sections. The potential smoke aerosol accumulation during the transport was observed in the cross-sections on 16 and 18 September, corresponding well to the AOD and CMC maps. That smoke layers appeared above cloud layers over Europe was implied by the cross-sections on 20 and 21 September. Statistics of each set of cross-sections were also presented and analysed. Moreover, the features of the entire smoke plume during transport were investigated using the Aeolus smoke dataset from 14 to 21 September 2020, in the transport region. This dataset included all smoke layers captured by Aeolus along its orbits. We highlight the capability of the Aeolus smoke dataset (derived from ALADIN with the assistance of multi-source data) to observe aerosol layers above clouds, thereby providing more information than passive instruments such as MODIS, which are susceptible to cloud contamination. Based on the Aeolus smoke dataset, we further characterized the smoke plumes along the transport pathway using statistics of AOD, altitude, and lidar ratio. Additionally, the plume separation that occurred between 40 and 20° W was investigated. Based on a comprehensive consideration of all results, the key features of the smoke transport event are summarized as follows:
-
The smoke plume remained fairly intense throughout the transport. The mean extinction coefficients on the seven selected cross-sections at different stages were all approximately 200 Mm−1. The AOD (integrated between 2 and 12 km altitude) decreased from 0.54 above the US to 0.33 above Europe.
-
The plume was transported primarily below 12 km. The median layer altitudes ascended from approximately 4.4 to over 6 km. Additionally, the smoke layers were observed above clouds when transported to Europe.
-
As revealed by the cross-sections, the declining trend of the lidar ratio from 62 sr on 14 September to 44 sr on 19 September may be attributed to the aging process of smoke aerosols. Subsequently, the increase to approximately 60 sr on 20 and 21 September is likely associated with the hygroscopic growth of smoke particles.
-
Plume separation was observed during transport between 40 and 20° W. Following the separation, the stronger and higher northern branch was subsequently transported toward Europe, while the southern branch was weaker and remained at a lower altitude.
In conclusion, we demonstrated that Aeolus can provide useful and broadly consistent observations of smoke transport event with the synergy of multi-platform data. We believe that the characteristic aerosol properties during a long-range smoke transport event by a spaceborne high spectral resolution lidar (HSRL) provides valuable information for global aerosol research, particularly highlighting the capabilities of the HSRL to provide lidar ratio retrieval. In the future, the synergy of multi-spaceborne HSRL missions (the Aerosol and Carbon Detection Lidar (ACDL) at 532 nm, the ATmospheric LIDar (ATLID) at 355 nm, and the wind and aerosol lidar onboard the future Aeolus follow-on mission) has great potential for the large-scale aerosol transport research with muti-wavelength observations and dynamic field measurements (Dai et al., 2024; Donovan et al., 2024).
The Aeolus data were downloaded via the website https://aeolus-ds.eo.esa.int/oads/access (last access: 1 February 2026). The CALIOP data were downloaded from https://www.earthdata.nasa.gov (last access: 1 February 2026). The VIIRS products were acquired from https://worldview.earthdata.nasa.gov (last access: 1 February 2026). Data from MODIS and MERRA-2 were downloaded via https://giovanni.gsfc.nasa.gov/giovanni (last access: 1 February 2026). The HYSPLIT models were conducted in the website https://www.ready.noaa.gov/hypub-bin/trajtype.pl?runtype=archive (last access: 23 July 2026).
SW, KS and GD conceived the study; KS conducted the experiments and wrote the manuscript; DT and HB contributed to the data analysis; all co-authors discussed the results and revised the manuscript.
The contact author has declared that none of the authors has any competing interests.
Publisher's note: Copernicus Publications remains neutral with regard to jurisdictional claims made in the text, published maps, institutional affiliations, or any other geographical representation in this paper. The authors bear the ultimate responsibility for providing appropriate place names. Views expressed in the text are those of the authors and do not necessarily reflect the views of the publisher.
We appreciate the enormous effort of Aeolus team under the frame of Aeolus DISC (Data, Innovation, and Science Cluster), who are still working on the validation and refinement of ALADIN data. This study was also supported by the Dragon 6 program, which is conducted by the European Space Agency and the China Science and Technology Exchange Center (grant no. 95376). Kangwen Sun appreciates the support from the China Scholarship Council (CSC) to conduct this research under the CSC no. 202306330054.
This research was jointly funded by the National Key Research and Development Program of China, grant number 2024YFF0726403, the National Natural Science Foundation of China, grant numbers 42475145 and U2106210, and the Hainan Province Science and Technology Special Fund, grant number ZDYF2024GXJS012.
This paper was edited by Peter Haynes and reviewed by three anonymous referees.
Abril-Gago, J., Guerrero-Rascado, J. L., Costa, M. J., Bravo-Aranda, J. A., Sicard, M., Bermejo-Pantaleón, D., Bortoli, D., Granados-Muñoz, M. J., Rodríguez-Gómez, A., Muñoz-Porcar, C., Comerón, A., Ortiz-Amezcua, P., Salgueiro, V., Jiménez-Martín, M. M., and Alados-Arboledas, L.: Statistical validation of Aeolus L2A particle backscatter coefficient retrievals over ACTRIS/EARLINET stations on the Iberian Peninsula, Atmos. Chem. Phys., 22, 1425–1451, https://doi.org/10.5194/acp-22-1425-2022, 2022.
Ångström, A.: The parameters of atmospheric turbidity, Tellus, 16, 64–75, https://doi.org/10.1111/j.2153-3490.1964.tb00144.x, 1964.
Ansmann, A., Wandinger, U., Le Rille, O., Lajas, D., and Straume, A. G.: Particle backscatter and extinction profiling with the spaceborne high-spectral-resolution Doppler lidar ALADIN: methodology and simulations, Appl. Optics, 46, 6606, https://doi.org/10.1364/AO.46.006606, 2007.
Ansmann, A., Ohneiser, K., Mamouri, R.-E., Knopf, D. A., Veselovskii, I., Baars, H., Engelmann, R., Foth, A., Jimenez, C., Seifert, P., and Barja, B.: Tropospheric and stratospheric wildfire smoke profiling with lidar: mass, surface area, CCN, and INP retrieval, Atmos. Chem. Phys., 21, 9779–9807, https://doi.org/10.5194/acp-21-9779-2021, 2021.
Ansmann, A., Jimenez, C., Roschke, J., Bühl, J., Ohneiser, K., Engelmann, R., Radenz, M., Griesche, H., Hofer, J., Althausen, D., Knopf, D. A., Dahlke, S., Gaudek, T., Seifert, P., and Wandinger, U.: Impact of wildfire smoke on Arctic cirrus formation – Part 1: Analysis of MOSAiC 2019–2020 observations, Atmos. Chem. Phys., 25, 4847–4866, https://doi.org/10.5194/acp-25-4847-2025, 2025.
Baars, H., Ansmann, A., Ohneiser, K., Haarig, M., Engelmann, R., Althausen, D., Hanssen, I., Gausa, M., Pietruczuk, A., Szkop, A., Stachlewska, I. S., Wang, D., Reichardt, J., Skupin, A., Mattis, I., Trickl, T., Vogelmann, H., Navas-Guzmán, F., Haefele, A., Acheson, K., Ruth, A. A., Tatarov, B., Müller, D., Hu, Q., Podvin, T., Goloub, P., Veselovskii, I., Pietras, C., Haeffelin, M., Fréville, P., Sicard, M., Comerón, A., Fernández García, A. J., Molero Menéndez, F., Córdoba-Jabonero, C., Guerrero-Rascado, J. L., Alados-Arboledas, L., Bortoli, D., Costa, M. J., Dionisi, D., Liberti, G. L., Wang, X., Sannino, A., Papagiannopoulos, N., Boselli, A., Mona, L., D'Amico, G., Romano, S., Perrone, M. R., Belegante, L., Nicolae, D., Grigorov, I., Gialitaki, A., Amiridis, V., Soupiona, O., Papayannis, A., Mamouri, R.-E., Nisantzi, A., Heese, B., Hofer, J., Schechner, Y. Y., Wandinger, U., and Pappalardo, G.: The unprecedented 2017–2018 stratospheric smoke event: decay phase and aerosol properties observed with the EARLINET, Atmos. Chem. Phys., 19, 15183–15198, https://doi.org/10.5194/acp-19-15183-2019, 2019.
Baars, H., Radenz, M., Floutsi, A. A., Engelmann, R., Althausen, D., Heese, B., Ansmann, A., Flament, T., Dabas, A., Trapon, D., Reitebuch, O., Bley, S., and Wandinger, U.: Californian wildfire smoke over Europe: A first example of the aerosol observing capabilities of Aeolus compared to ground-based lidar, Geophys. Res. Lett., 48, https://doi.org/10.1029/2020GL092194, 2021.
Beer, C. G., Hendricks, J., and Righi, M.: A global climatology of ice-nucleating particles under cirrus conditions derived from model simulations with MADE3 in EMAC, Atmos. Chem. Phys., 22, 15887–15907, https://doi.org/10.5194/acp-22-15887-2022, 2022.
Beer, C. G., Hendricks, J., and Righi, M.: Impacts of ice-nucleating particles on cirrus clouds and radiation derived from global model simulations with MADE3 in EMAC, Atmos. Chem. Phys., 24, 3217–3240, https://doi.org/10.5194/acp-24-3217-2024, 2024.
Buchard, V., Randles, C. A., da Silva, A. M., Darmenov, A., Colarco, P. R., Govindaraju, R., Ferrare, R., Hair, J., Beyersdorf, A. J., Ziemba, L. D., and Yu, H.: The MERRA-2 Aerosol Reanalysis, 1980 Onward – Part II: Evaluation and Case Studies, J. Climate, 30, 6851–6872, https://doi.org/10.1175/JCLI-D-16-0613.1, 2017.
Ceamanos, X., Coopman, Q., George, M., Riedi, J., Parrington, M., and Clerbaux, C.: Remote sensing and model analysis of biomass burning smoke transported across the Atlantic during the 2020 Western US wildfire season, Sci. Rep., 13, 16014, https://doi.org/10.1038/s41598-023-39312-1, 2023.
Cunningham, C., Williamson, G., and Bowman, D.: Increasing frequency and intensity of the most extreme wildfires on Earth, Nat. Ecol. Evol., 12, 1420–1425, https://doi.org/10.1038/s41559-024-02452-2, 2024.
Dabas, A., Denneulin, M. L., Flamant, P., Loth, C., Garnier, A., and Dolfi-Bouteyre, A.: Correcting winds measured with a Rayleigh Doppler lidar from pressure and temperature effects, Tellus A, 60, 206–215, https://doi.org/10.1111/j.1600-0870.2007.00284.x, 2008.
Dai, G., Sun, K., Wang, X., Wu, S., E, X., Liu, Q., and Liu, B.: Dust transport and advection measurement with spaceborne lidars ALADIN and CALIOP and model reanalysis data, Atmos. Chem. Phys., 22, 7975–7993, https://doi.org/10.5194/acp-22-7975-2022, 2022.
Dai, G., Wu, S., Long, W., Liu, J., Xie, Y., Sun, K., Meng, F., Song, X., Huang, Z., and Chen, W.: Aerosol and cloud data processing and optical property retrieval algorithms for the spaceborne ACDL/DQ-1, Atmos. Meas. Tech., 17, 1879–1890, https://doi.org/10.5194/amt-17-1879-2024, 2024.
Ditas, J., Ma, N., Zhang, Y., Assmann, D., Neumaier, M., Riede, H., Karu, E., Williams, J., Scharffe, D., Wang, Q., Saturno, J., Schwarz, J. P., Katich, J. M., McMeeking, G. R., Zahn, A., Hermann, M., Brenninkmeijer, C. A. M., Andreae, M. O., Pöschl, U., Su, H., and Cheng, Y.: Strong impact of wildfires on the abundance and aging of black carbon in the lowermost stratosphere, P. Natl. Acad. Sci. USA, 115, E11595–E11603, https://doi.org/10.1073/pnas.1806868115, 2018.
Donovan, D. P., van Zadelhoff, G.-J., and Wang, P.: The EarthCARE lidar cloud and aerosol profile processor (A-PRO): the A-AER, A-EBD, A-TC, and A-ICE products, Atmos. Meas. Tech., 17, 5301–5340, https://doi.org/10.5194/amt-17-5301-2024, 2024.
Eck, T. F., Holben, B. N., Reid, J. S., Sinyuk, A., Giles, D. M., Arola, A., Slutsker, I., Schafer, J. S., Sorokin, M. G., Smirnov, A., LaRosa, A. D., Kraft, J., Reid, E. A., O'Neill, N. T., Welton, E. J., and Menendez, A. R.: The extreme forest fires in California/Oregon in 2020: Aerosol optical and physical properties and comparisons of aged versus fresh smoke, Atmos. Environ., 305, 119798, https://doi.org/10.1016/j.atmosenv.2023.119798, 2023.
Ehlers, F., Flament, T., Dabas, A., Trapon, D., Lacour, A., Baars, H., and Straume-Lindner, A. G.: Optimization of Aeolus' aerosol optical properties by maximum-likelihood estimation, Atmos. Meas. Tech., 15, 185–203, https://doi.org/10.5194/amt-15-185-2022, 2022.
ESA: ADM-Aeolus Science Report, ESA SP-1311, 121 pp., European Space Agency, https://esamultimedia.esa.int/multimedia/publications/SP-1311/SP-1311.pdf (last access: 22 May 2026), 2008.
Flamant, P., Dabas, A., Martinet, P., Lever, V., Flament, T., Trapon, D., Olivier, M., Cuesta, J., and Huber, D.: Aeolus L2A Algorithm Theoretical Baseline Document, Particle optical properties product, Tech. rep., ESA, version 6.0, https://earth.esa.int/eogateway/documents/20142/37627/Aeolus-L2A-Algorithm-Theoretical-Baseline-Document.pdf (last access: 28 May 2026), 2022.
Flamant, P. H., Cuesta, J., Denneulin, M.-L., Dabas, A., and Huber, D.: ADM-Aeolus retrieval algorithms for aerosol and cloud products, Tellus A, 60, 273–286, https://doi.org/10.1111/j.1600-0870.2007.00287.x, 2008.
Flament, T., Trapon, D., Lacour, A., Dabas, A., Ehlers, F., and Huber, D.: Aeolus L2A aerosol optical properties product: standard correct algorithm and Mie correct algorithm, Atmos. Meas. Tech., 14, 7851–7871, https://doi.org/10.5194/amt-14-7851-2021, 2021.
Floutsi, A. A., Baars, H., Engelmann, R., Althausen, D., Ansmann, A., Bohlmann, S., Heese, B., Hofer, J., Kanitz, T., Haarig, M., Ohneiser, K., Radenz, M., Seifert, P., Skupin, A., Yin, Z., Abdullaev, S. F., Komppula, M., Filioglou, M., Giannakaki, E., Stachlewska, I. S., Janicka, L., Bortoli, D., Marinou, E., Amiridis, V., Gialitaki, A., Mamouri, R.-E., Barja, B., and Wandinger, U.: DeLiAn – a growing collection of depolarization ratio, lidar ratio and Ångström exponent for different aerosol types and mixtures from ground-based lidar observations, Atmos. Meas. Tech., 16, 2353–2379, https://doi.org/10.5194/amt-16-2353-2023, 2023.
Forbes, R., Ahlgrimm, M., Stiller, O., Di Michele, S., and Delanoë, J.: Validation of cloud parametrization. WP-2100 report for the ESA project QuARL – 21613/08/NL/CB (available from ECMWF, Reading, UK), 49 pp., https://www.ecmwf.int/sites/default/files/elibrary/2009/9438-validation-cloud-parametrization.pdf, last access: 4 September 2025, 2009.
Gelaro, R., McCarty, W., Suárez, M. J., Todling, R., Molod, A., Takacs, L., Randles, C. A., Darmenov, A., Bosilovich, M. G., Reichle, R., Wargan, K., Coy, L., Cullather, R., Draper, C., Akella, S., Buchard, V., Conaty, A., da Silva, A. M., Gu, W., Kim, G.-K., Koster, R., Lucchesi, R., Merkova, D., Nielsen, J. E., Partyka, G., Pawson, S., Putman, W., Rienecker, M., Schubert, S. D., Sienkiewicz, M., and Zhao, B.: The Modern-Era Retrospective Analysis for Research and Applications, Version 2 (MERRA-2), J. Climate, 30, 5419–5454, https://doi.org/10.1175/JCLI-D-16-0758.1, 2017.
Gkikas, A., Gialitaki, A., Binietoglou, I., Marinou, E., Tsichla, M., Siomos, N., Paschou, P., Kampouri, A., Voudouri, K. A., Proestakis, E., Mylonaki, M., Papanikolaou, C.-A., Michailidis, K., Baars, H., Straume, A. G., Balis, D., Papayannis, A., Parrinello, T., and Amiridis, V.: First assessment of Aeolus Standard Correct Algorithm particle backscatter coefficient retrievals in the eastern Mediterranean, Atmos. Meas. Tech., 16, 1017–1042, https://doi.org/10.5194/amt-16-1017-2023, 2023.
Gumber, A., Reid, J. S., Holz, R. E., Eck, T. F., Hsu, N. C., Levy, R. C., Zhang, J., and Veglio, P.: Assessment of severe aerosol events from NASA MODIS and VIIRS aerosol products for data assimilation and climate continuity, Atmos. Meas. Tech., 16, 2547–2573, https://doi.org/10.5194/amt-16-2547-2023, 2023.
Haarig, M., Ansmann, A., Baars, H., Jimenez, C., Veselovskii, I., Engelmann, R., and Althausen, D.: Depolarization and lidar ratios at 355, 532, and 1064 nm and microphysical properties of aged tropospheric and stratospheric Canadian wildfire smoke, Atmos. Chem. Phys., 18, 11847–11861, https://doi.org/10.5194/acp-18-11847-2018, 2018.
Haarig, M., Engelmann, R., Baars, H., Gast, B., Althausen, D., and Ansmann, A.: Discussion of the spectral slope of the lidar ratio between 355 and 1064 nm from multiwavelength Raman lidar observations, Atmos. Chem. Phys., 25, 7741–7763, https://doi.org/10.5194/acp-25-7741-2025, 2025.
Haarig, M., Baars, H., König, L., Donovan, D. P., Ansmann, A., Khaykin, S., Ceolato, R., Gast, B., Jimenez, C., Floutsi, A. A., Hogan, R. J., Chantry, A., Marnas, F., Roschke, J., van Zadelhoff, G.-J., and Wandinger, U.: The life cycle of a stratospheric smoke plume as seen from EarthCARE – tracking a plume from Canada to Europe, Geophys. Res. Lett., 53, https://doi.org/10.1029/2025GL119977, 2026.
Hirsch, E. and Koren, I.: Record-breaking aerosol levels explained by smoke injection into the stratosphere, Science, 371, 1269–1274, https://doi.org/10.1126/science.abe1415, 2021.
Hu, Q., Goloub, P., Veselovskii, I., and Podvin, T.: The characterization of long-range transported North American biomass burning plumes: what can a multi-wavelength Mie–Raman-polarization-fluorescence lidar provide?, Atmos. Chem. Phys., 22, 5399–5414, https://doi.org/10.5194/acp-22-5399-2022, 2022.
Hunt, W. H., Winker, D. M., Vaughan, M. A., Powell, K. A., Lucker, P. L., and Weimer, C.: CALIPSO Lidar Description and Performance Assessment, J. Atmos. Ocean. Tech., 26, 1214–1228, https://doi.org/10.1175/2009JTECHA1223.1, 2009.
Khaykin, S., Legras, B., Bucci, S., Sellitto, P., Isaksen, L., Tencé, L., Bekki, S., Bourassa, A., Rieger, L., Zawada, D., Jumelet, J., and Godin-Beekmann, S.: The 2019/20 Australian wildfires generated a persistent smoke-charged vortex rising up to 35 km altitude, Nat. Commun. Earth Environ., 1, 22, https://doi.org/10.1038/s43247-020-00022-5, 2020.
Kim, M.-H., Omar, A. H., Tackett, J. L., Vaughan, M. A., Winker, D. M., Trepte, C. R., Hu, Y., Liu, Z., Poole, L. R., Pitts, M. C., Kar, J., and Magill, B. E.: The CALIPSO version 4 automated aerosol classification and lidar ratio selection algorithm, Atmos. Meas. Tech., 11, 6107–6135, https://doi.org/10.5194/amt-11-6107-2018, 2018.
Kirchmeier-Young, M. C., Gillett, N. P., Zwiers, F. W., Cannon, A. J., and Anslow, F. S.: Attribution of the influence of human-induced climate change on an extreme fire season, Earth's Future, 7, 2–10, https://doi.org/10.1029/2018EF001050, 2019.
Levy, R. C., Mattoo, S., Munchak, L. A., Remer, L. A., Sayer, A. M., Patadia, F., and Hsu, N. C.: The Collection 6 MODIS aerosol products over land and ocean, Atmos. Meas. Tech., 6, 2989–3034, https://doi.org/10.5194/amt-6-2989-2013, 2013.
Liu, H., Remer, L. A., Huang, J., Huang, H.-C., Kondragunta, S., Laszlo, I., Oo, M., and Jackson, J. M: Preliminary evaluation of S‐NPP VIIRS aerosol optical thickness, J. Geophys. Res.-Atmos., 2014, 119, 3942–3962, 2014.
Liu, Z., Kar, J., Zeng, S., Tackett, J., Vaughan, M., Avery, M., Pelon, J., Getzewich, B., Lee, K.-P., Magill, B., Omar, A., Lucker, P., Trepte, C., and Winker, D.: Discriminating between clouds and aerosols in the CALIOP version 4.1 data products, Atmos. Meas. Tech., 12, 703–734, https://doi.org/10.5194/amt-12-703-2019, 2019.
Lohmann, U. and Neubauer, D.: The importance of mixed-phase and ice clouds for climate sensitivity in the global aerosol–climate model ECHAM6-HAM2, Atmos. Chem. Phys., 18, 8807–8828, https://doi.org/10.5194/acp-18-8807-2018, 2018.
Lux, O., Lemmerz, C., Weiler, F., Marksteiner, U., Witschas, B., Rahm, S., Geiß, A., and Reitebuch, O.: Intercomparison of wind observations from the European Space Agency's Aeolus satellite mission and the ALADIN Airborne Demonstrator, Atmos. Meas. Tech., 13, 2075–2097, https://doi.org/10.5194/amt-13-2075-2020, 2020.
Mamouri, R.-E., Ansmann, A., Ohneiser, K., Knopf, D. A., Nisantzi, A., Bühl, J., Engelmann, R., Skupin, A., Seifert, P., Baars, H., Ene, D., Wandinger, U., and Hadjimitsis, D.: Wildfire smoke triggers cirrus formation: lidar observations over the eastern Mediterranean, Atmos. Chem. Phys., 23, 14097–14114, https://doi.org/10.5194/acp-23-14097-2023, 2023.
Nicolae, D., Nemuc, A., Müller, D., Talianu, C., Vasilescu, J., Belegante, L., and Kolgotin, A.: Characterization of fresh and aged biomass burning events using multiwavelength Raman lidar and mass spectrometry, J. Geophys. Res.-Atmos., 118, 2956–2965, https://doi.org/10.1002/jgrd.50324, 2013.
Nicolae, D., Ciocan, G.-A., Nemuc, A., Nicolae, V., Talianu, C., Vasilescu, J., Dandocsi, A., Radu, C., Cazacu, M.-M., Vulturescu, V., and Belegante, L.: Examining the characteristics of aerosols: a statistical analysis based on a decade of lidar and photometer observations at the Eastern border of ACTRIS, Atmos. Meas. Tech., 19, 1179–1199, https://doi.org/10.5194/amt-19-1179-2026, 2026.
Ohneiser, K., Ansmann, A., Kaifler, B., Chudnovsky, A., Barja, B., Knopf, D. A., Kaifler, N., Baars, H., Seifert, P., Villanueva, D., Jimenez, C., Radenz, M., Engelmann, R., Veselovskii, I., and Zamorano, F.: Australian wildfire smoke in the stratosphere: the decay phase in 2020/2021 and impact on ozone depletion, Atmos. Chem. Phys., 22, 7417–7442, https://doi.org/10.5194/acp-22-7417-2022, 2022.
Ohneiser, K., Ansmann, A., Witthuhn, J., Deneke, H., Chudnovsky, A., Walter, G., and Senf, F.: Self-lofting of wildfire smoke in the troposphere and stratosphere: simulations and space lidar observations, Atmos. Chem. Phys., 23, 2901–2925, https://doi.org/10.5194/acp-23-2901-2023, 2023.
Omar, A. H., Winker, D. M., Kittaka, C., Vaughan, M. A., Liu, Z., Hu, Y., Trepte, C. R., Rogers, R. R., Ferrare, R. A., Lee, K.-P., Kuehn, R. E., and Hostetler, C. A.: The CALIPSO Automated Aerosol Classification and Lidar Ratio Selection Algorithm, J. Atmos. Ocean. Tech., 26, 1994–2014, https://doi.org/10.1175/2009JTECHA1231.1, 2009.
Pappalardo, G., Amodeo, A., Apituley, A., Comeron, A., Freudenthaler, V., Linné, H., Ansmann, A., Bösenberg, J., D'Amico, G., Mattis, I., Mona, L., Wandinger, U., Amiridis, V., Alados-Arboledas, L., Nicolae, D., and Wiegner, M.: EARLINET: towards an advanced sustainable European aerosol lidar network, Atmos. Meas. Tech., 7, 2389–2409, https://doi.org/10.5194/amt-7-2389-2014, 2014.
Paschou, P., Siomos, N., Tsekeri, A., Louridas, A., Georgoussis, G., Freudenthaler, V., Binietoglou, I., Tsaknakis, G., Tavernarakis, A., Evangelatos, C., von Bismarck, J., Kanitz, T., Meleti, C., Marinou, E., and Amiridis, V.: The eVe reference polarisation lidar system for the calibration and validation of the Aeolus L2A product, Atmos. Meas. Tech., 15, 2299–2323, https://doi.org/10.5194/amt-15-2299-2022, 2022.
Peterson, D. A., Fromm, M. D., McRae, R. H. D., Campbell, J. R., Hyer, E. J., Taha, G., Camacho, C. P., Kablick, G. P., Schmidt, C. C., and DeLand, M. T.: Australia's Black Summer pyrocumulonimbus super outbreak reveals potential for increasingly extreme stratospheric smoke events, npj Clim. Atmos. Sci., 4, 38, https://doi.org/10.1038/s41612-021-00192-9, 2021.
Reitebuch, O.: The Spaceborne Wind Lidar Mission ADM-Aeolus, in: Atmospheric Physics, Research Topics in Aerospace, edited by: Schumann, U., Springer Berlin Heidelberg, 815–827, https://doi.org/10.1007/978-3-642-30183-4_49, 2012.
Rennie, M., Tan, D., Andersson, E., Poli, P., Dabas, A., de Kloe, J., Marseille, G., and Stoffelen, A.: Aeolus Level-2B Algorithm Theoretical Basis Document, version 3.40, https://earth.esa.int/documents/d/earth-online/aeolus_l2b_algorithm_tbd-pdf (last access: 28 August 2025), 2020.
Roy, G. and Roy, N.: Standoff determination of the particle size and concentration of small optical depth clouds based on double scattering measurements: concept and experimental validation with bioaerosols, Appl. Optics, 47, 1336–1349, https://doi.org/10.1364/AO.47.001336, 2008.
Savtchenko, A., Ouzounov, D., Ahmad, S., Acker, J., Leptoukh, G., Koziana, J., and Nickless, D.: Terra and Aqua MODIS products available from NASA GES DAAC, Adv. Space Res., 2004, 34, 710–714, 2014.
Shang, X., Lipponen, A., Filioglou, M., Sundström, A.-M., Parrington, M., Buchard, V., Darmenov, A. S., Welton, E. J., Marinou, E., Amiridis, V., Sicard, M., Rodríguez-Gómez, A., Komppula, M., and Mielonen, T.: Monitoring biomass burning aerosol transport using CALIOP observations and reanalysis models: a Canadian wildfire event in 2019, Atmos. Chem. Phys., 24, 1329–1344, https://doi.org/10.5194/acp-24-1329-2024, 2024.
Sokolik, I. N., Soja, A. J., DeMott, P. J., and Winker, D.: Progress and challenges in quantifying wildfire smoke emissions, their properties, transport, and atmospheric impacts, J. Geophys. Res.-Atmos., 124, 13005–13025. https://doi.org/10.1029/2018JD029878, 2019.
Song, R., Povey, A., and Grainger, R. G.: Characterization of dust aerosols from ALADIN and CALIOP measurements, Atmos. Meas. Tech., 17, 2521–2538, https://doi.org/10.5194/amt-17-2521-2024, 2024.
Stein, A. F., Draxler, R. R., Rolph, G. D., Stunder, B. J. B., Cohen, M. D., and Ngan, F.: NOAA's HYSPLIT atmospheric transport and dispersion modeling system, B. Am. Meteorol. Soc., 96, 2059–2077, https://doi.org/10.1175/BAMS-D-14-00110.1, 2015.
Stoffelen, A., Pailleux, J., Källén, E., Vaughan, J. M., Isaksen, L., Flamant, P., Wergen, W., Andersson, E., Schyberg, H., Culoma, A., Meynart, R., Endemann, M., and Ingmann, P.: The Atmospheric Dynamics Mission For Global Wind Field Measurement, B. Am. Meteorol. Soc., 86, 73–88, https://doi.org/10.1175/BAMS-86-1-73, 2005.
Sun, K., Dai, G., Wu, S., Reitebuch, O., Baars, H., Liu, J., and Zhang, S.: Effect of wind speed on marine aerosol optical properties over remote oceans with use of spaceborne lidar observations, Atmos. Chem. Phys., 24, 4389–4409, https://doi.org/10.5194/acp-24-4389-2024, 2024.
Tan, D. G., Andersson, E., Kloe, J. D., Marseille, G.-J., Stoffelen, A., Poli, P., Denneulin, M.-L., Dabas, A., Huber, D., and Reitebuch, O.: The ADM-Aeolus wind retrieval algorithms, Tellus A, 60, 191–205, https://doi.org/10.1111/j.1600-0870.2007.00285.x, 2008.
Trapon, D., Baars, H., Floutsi, A. A., Bley, S., Haarig, M., Lacour, A., Flament, T., Dabas, A., Nehrir, A. R., Ehlers, F., and Huber, D.: Cross-validations of the Aeolus aerosol products and new developments with airborne high-spectral-resolution lidar measurements above the tropical Atlantic during JATAC, Atmos. Meas. Tech., 18, 3873–3896, https://doi.org/10.5194/amt-18-3873-2025, 2025.
Trickl, T., Vogelmann, H., Fromm, M. D., Jäger, H., Perfahl, M., and Steinbrecht, W.: Measurement report: Violent biomass burning and volcanic eruptions – a new period of elevated stratospheric aerosol over central Europe (2017 to 2023) in a long series of observations, Atmos. Chem. Phys., 24, 1997–2021, https://doi.org/10.5194/acp-24-1997-2024, 2024.
Twohy, C. H., Toohey, D. W., Levin, E. J. T., DeMott, P. J., Rainwater, B., Garofalo, L. A., Pothier, M. A., Farmer, D. K., Kreidenweis, S. M., Pokhrel, R. P., Murphy, S. M., Reeves, J. M., Moore, K. A., and Fischer, E. V.: Biomass burning smoke and its influence on clouds over the western U. S., Geophys. Res. Lett., 48, https://doi.org/10.1029/2021GL094224, 2021.
Vaughan, G., Draude, A. P., Ricketts, H. M. A., Schultz, D. M., Adam, M., Sugier, J., and Wareing, D. P.: Transport of Canadian forest fire smoke over the UK as observed by lidar, Atmos. Chem. Phys., 18, 11375–11388, https://doi.org/10.5194/acp-18-11375-2018, 2018.
Wang, P., Donovan, D. P., van Zadelhoff, G.-J., de Kloe, J., Huber, D., and Reissig, K.: Evaluation of Aeolus feature mask and particle extinction coefficient profile products using CALIPSO data, Atmos. Meas. Tech., 17, 5935–5955, https://doi.org/10.5194/amt-17-5935-2024, 2024.
Winker, D. M., Vaughan, M. A., Omar, A. H., Hu, Y., Powell, K. A., Liu, Z., Hunt, W. H., and Young, S. A.: Overview of the CALIPSO Mission and CALIOP Data Processing Algorithms, J. Atmos. Ocean. Technol., 26, 2310–2323, 2009.
- Abstract
- Introduction
- Data and model
- Localization of the smoke transport event
- Development and validation of the Aeolus-based smoke dataset
- Characterization of the smoke aerosols across the transport
- Summary and outlook
- Appendix A
- Data availability
- Author contributions
- Competing interests
- Disclaimer
- Acknowledgements
- Financial support
- Review statement
- References
- Abstract
- Introduction
- Data and model
- Localization of the smoke transport event
- Development and validation of the Aeolus-based smoke dataset
- Characterization of the smoke aerosols across the transport
- Summary and outlook
- Appendix A
- Data availability
- Author contributions
- Competing interests
- Disclaimer
- Acknowledgements
- Financial support
- Review statement
- References