
the Creative Commons Attribution 4.0 License.
the Creative Commons Attribution 4.0 License.
 | 14 Sep 2026
An advanced modelling study on the role of dimethyl sulfide in new particle formation in the pristine marine boundary layer
Robin Wollesen de Jonge

Zihao Fu
Pontus Roldin
Michael Boy
New particle formation (NPF) enhances the concentration of cloud condensation nuclei (CCN) over the oceans, thereby affecting the radiative balance and, consequently, Earth's climate. The literature suggest that marine NPF predominantly occurs in the free troposphere, as the extensive surface area of sea spray aerosols and limited precursor gases suppress NPF in the marine boundary layer (MBL). However, such interpretations do not fully account for the observations on nucleation and Aitken-mode particles within the MBL. Here, we demonstrate how natural emissions of dimethyl sulfide (DMS) and NH3 can drive H2SO4–NH3-derived NPF in the MBL during cloud-free conditions following precipitation events. The newly formed particles manage to grow into the upper Aitken and accumulation mode size range within 3–4 d, with the potential to act as CCN. Through extensive sensitivity runs, we show that DMS-derived NPF and growth exhibits a non-linear response to variations in air temperature and wind speed, whereas their response to changes in sea surface temperature, precipitation rate, and DMS surface ocean concentration remains approximately linear. Sporadic cloud cover is shown to suppress NPF. Finally, we employ quantum chemical calculations to provide temperature dependant rate coefficients for the OH-initiated oxidation of methane sulphinic acid (MSIA). We also assess other key uncertainties in the DMS oxidation mechanism to illustrate their impact on the formation and growth of DMS-derived aerosol particles in the MBL.
- Article
(1465 KB) - Full-text XML
-
Supplement
(22765 KB) - BibTeX
- EndNote


Cloud condensation nuclei (CCN) over the oceans impact the formation, albedo and lifetime of marine clouds and thereby the global climate system (Charlson et al., 1987; Rosenfeld et al., 2019). The formation of aerosol particles through vapour nucleation, namely new particle formation (NPF) (Kulmala et al., 2013), is believed to give rise to more than half of the CCN in the marine boundary layer (MBL) (Merikanto et al., 2009). Observations on NPF in the MBL nevertheless remains scarce, and while certain studies report NPF events during cruise (Collins et al., 2017; Burkart et al., 2017a; Baccarini et al., 2020; Brean et al., 2021; Baccarini et al., 2021) and flight campaigns (Willis et al., 2016; Burkart et al., 2017b; Zheng et al., 2021), it is commonly believed that such events are rare (Pirjola et al., 2000; Quinn and Bates, 2011). Instead, aerosol particles are thought to enter the MBL from the free troposphere, in which low temperatures and low particle concentrations provides more favourable conditions for NPF (Williamson et al., 2019). While the question of open ocean NPF remains ambiguous, measurements made at coastal sites frequently show NPF (Jokinen et al., 2018; Dall'Osto et al., 2018; Beck et al., 2021; Brean et al., 2021).
Throughout the atmosphere, vapours with strong intermolecular interactions can undergo nucleation to form clusters that may grow into aerosol particles (Elm et al., 2020). One such vapour is sulfuric acid (SA: H2SO4), which is known to nucleate in the presence of a stabilizing base such as NH3 (Korhonen et al., 1999; Kirkby et al., 2011). Over the oceans, dimethyl sulfide (DMS: (CH3)2S), formed through the breakdown of dimethylsulfoniopropionate (DMSP: (CH3)2S+CH2CH2COO−) released from macro- and microalgea (including phytoplankton) during physiological stress (Carpenter et al., 2012; Hulswar et al., 2022), comprises the largest source of natural sulfur and thus SA to the atmosphere (Lovelock et al., 1972; Bates et al., 1992). DMS therefore has the potential to influence NPF and CCN concentrations in the marine environment (Charlson et al., 1987; Rosati et al., 2021) and over land (Wollesen de Jonge et al., 2024), although its role in said processes remains to be fully understood. One of the main shortcomings in our current understanding concerns the oxidation mechanism of DMS, which has undergone extensive revision in recent years (Jacob et al., 2024). DMS oxidation is driven by O3, HOx, NOx and halogen radicals in both the gas-phase and the aqueous-phase of deliquesced aerosol particles and cloud droplets, where it forms the stable species dimethyl sulfoxide (DMSO: CH3SOCH3), methane sulphinic acid (MSIA: CH3SO2H), methanesulfonic acid (MSA: CH3SO3H) and sulfur dioxide (SO2) in addition to SA (Barnes et al., 2006; Hoffmann et al., 2016; Wollesen de Jonge et al., 2021). DMS has also been found to undergo autoxidation to form hydroperoxymethyl thioformate (HPMTF: HOOCH2SCHO) (Wu et al., 2014; Berndt et al., 2019; Veres et al., 2020; Ye et al., 2022). Although heavily researched, many of the reactions pathways forming said compounds remain uncertain, with large variations in the reaction rates presented in the literature. These uncertainties influence the distribution of products from DMS oxidation, making it difficult to asses the impact of DMS on the formation and growth of aerosol particles in the atmosphere – including the impact of DMS on NPF within the MBL.
Here, we use advanced process-based modelling to demonstrate the role of DMS in NPF and secondary aerosol growth within the pristine MBL. For this purpose, we construct an open ocean scenario in the aerosol dynamics, gas- and particle-phase chemistry box model ADCHAM and examine DMS-driven NPF under different meteorological and hydrological conditions, including cloud and non-cloud periods, precipitation events and varying wind-speeds, air temperatures, sea surface temperatures and sea surface concentrations of dissolved DMS and NHx. In addition to ADCHAM, we also include the use of detailed quantum chemical calculations to address uncertainties and alternative reaction pathways in the DMS oxidation mechanism. This is done as a means to reduce the uncertainty related to the role of DMS in NPF over the oceans.
2.1 Model Description
Simulations were performed in the gas and particle phase chemistry box model ADCHAM (Roldin et al., 2014). ADCHAM considers state-of-the-art aerosol dynamics, treating the formation, growth, ageing and deposition of aerosol particles in the atmosphere. New particles are formed in the model by use of the Atmosphere Cluster Dynamics Code (ACDC) (McGrath et al., 2012; Olenius et al., 2013). ACDC takes into account both neutral and ion-induced pathways when calculating nucleation rates for various clustering systems, simulating the formation of clusters consisting of maximum five acid molecules and five base molecules. Clusters that manage to grow into the upper size range in ACDC are introduced as particles in ADCHAM in the smallest size bin at 1.08 nm. The setup used in this study models NPF from SA and NH3, taking into account the loss of clusters to collisions, evaporation, coagulation, and scavenging. The SA-NH3 system was calculated using the domain based local pair natural orbital (DLPNO) method at the DLPNO-CCSD(T)/aug-cc-pVTZ//ωB97X-D/6-31++G(d,p) quantum chemical level of theory (Besel et al., 2020). The DLPNO method was used in the default model setup as opposed to the resolution-of-the-identity second-order coupled cluster (RI-CC2) method as RI-CC2 has been shown to over-predict cluster binding energies (Schmitz and Elm, 2020). Nucleation rates obtained with the RI-CC2 method should therefore be interpreted as the upper limit for SA-NH3 driven NPF, whereas nucleation rates obtained with the DLPNO method comprises the lower (and more realistic) limit.
Newly formed or pre-existing aerosol particles grow in the model, either through vapour condensation or through the partitioning and processing of water soluble species in the deliquesced aerosol particles and cloud droplets. The condensation and evaporation of species is solved with the analytical predictor of condensation (APC) scheme (Jacobson, 2005), taking into account the dissociation of condensing compounds in the aerosol particle aqueous-phase. Other water soluble compounds, including oxidation agents, are allowed to partition to and (for certain compounds) dissociate in the aqueous-phase in accordance with their Henry's law solubility and pKa values, respectively. In this study, ADCHAM considers the partitioning of 52 gaseous species to the aerosol particle aqueous-phase. Some of these species contribute to the growth of the aerosol particles by undergoing aqueous-phase oxidation to form low-volatile compounds that remain in the particle-phase, even upon a decrease in the water-content of deliquesced aerosol particles or through the evaporation of cloud droplets. Henry's law solubilities and pKa values for the key DMS-derived water-soluble compounds HPMTF, DMSO, MSIA and MSA are based on COSMOtherm (Dassault Systèmes, 2021) calculations obtained from Wollesen de Jonge et al. (2024).
Once formed, aerosol particles in ADCHAM leave the atmosphere through either wet or dry-deposition. Wet-deposition, including below-cloud scavenging of particles, is calculated for different particle sizes in accordance with the parameterization by Laakso et al. (2003). The parameterization considers the intensity of precipitation in mm h−1. Dry-deposition of aerosol particles in an ocean environment relevant for this study is calculated with the parameterization by Slinn and Slinn (1980).
To investigate the influence of DMS on NPF in the pristine MBL, a model scenario reproducing conditions over the remote open ocean was constructed. The simulation was made to imitate the conditions during the flight-campaign described in Zheng et al. (2021), where frequent NPF within the MBL was observed following the passage of cold fronts. In the BaseCase scenario, the movement of an air-parcel within the MBL is simulated for 144 h, starting and ending at midnight. During the first 48 h, the air-parcel passes through cloud cover four times – twice during midnight and twice during mid-day. To form clouds, the air-parcel is lifted, causing the air to become supersaturated with respect to water vapour through adiabatic cooling. The clouds are allowed to persist for 2 h, until the air-parcel descends and they evaporate. During the fourth cloud event, heavy precipitation at 10 mm h−1 is introduced in the model. The cloud is allowed to precipitate for the first hour of its lifetime. During the remaining 4 d of the simulation, no cloud or precipitation events take place. In this time (and in between cloud periods during the first 2 d), the relative humidity is kept at 90 % and the aerosol particles are assumed to be deliquesced.
The prescribed scenario is designed to spur NPF after the precipitation event on day 3 of the simulation. Before this event, the model is initiated with a size distribution consisting of NaCl in the accumulation and coarse mode in addition to (Na)2SO4 in the Aitken mode. The initial aerosol concentration is kept high to ensure that new particles are less likely to form during the first 2 d of the simulation. The precipitation event on day 2 effectively lowers the aerosol particle concentration, allowing DMS-derived oxidation products to form and grow new particles. The initial size distribution and sea spray emissions are calculated using the parameterization by Salter et al. (2015). This parameterization takes into account the surface layer wind-speed, which is kept fixed at 6 m s−1 in the BaseCase simulation but varied in additional sensitivity runs.
DMS emissions in ADCHAM are treated by considering an oceanic DMS dataset and a DMS transfer velocity parameterization. The oceanic DMS dataset by Lana et al. (2011) was used to construct four scenarios with five different surface ocean concentrations of DMS, including low (5 nmol L−1), moderate (10 nmol L−1), high (15 nmol L−1) and very high (20 nmol L−1) concentrations. High to very high concentrations of DMS are representative for phytoplankton blooms in the North Atlantic Ocean during May–July, and in the Southern Ocean from December–February (Lana et al., 2011; Hulswar et al., 2022). It should be noted that even higher concentrations can be found in the ocean surrounding Antarctica during sea-ice breakout and melting. A super-linear transfer velocity specifically made for DMS was used to obtain the flux of DMS to the model (Blomquist et al., 2017). We acknowledge that alternative linear and quadratic transfer velocities are also commonly used to calculate the DMS sea-air flux (Liss and Merlivat, 1986; Wanninkhof, 2014; Nightingale et al., 2000). All parameterizations consider the sea surface temperature (SST) and wind-speed when calculating the transfer velocity. Emissions of NH3 were treated similar to DMS by considering an oceanic dataset and a transfer velocity. The sea surface concentration of total ammonia NHx was set to 0.3 mmol m−3. This values represents a middle ground between NHx concentrations observed in the North Atlantic Ocean (May–July: ∼ 0.2 mmol m−3) and the Southern ocean around Antarctica (December–February: ∼ 0.4 mmol m−3) when the phytoplankton blooms are at their peak in each respective region (Paulot et al., 2020). Additional sensitivity runs are performed using both higher and lower concentration of sea surface NHx. The transfer velocity of NH3 was calculated in accordance with the method by Wentworth et al. (2016). This approach employs a bidirectional exchange of NH3, meaning that the air-sea flux of NH3 in the model is regulated by the gas-phase concentration of NH3. In the case that the concentration of NH3 in the gas-phase exceeds the so-called “compensation-point”, the sea-air flux of NH3 can also become negative. It should be noted that the sea surface concentration of both NHx and DMS can reach considerably higher concentrations near the coast, especially in regions with strong upwelling or nutrient run-off (Lana et al., 2011; Paulot et al., 2020; Hulswar et al., 2022). Emissions of biogenic volatile organic compounds (BVOCs) over the oceans (including isoprene and α-pinene) is treated in accordance with the rates reported in Hoffmann et al. (2016).
2.2 DMS Oxidation Mechanism
The DMS oxidation reaction scheme used in this study has its basis in the mechanism presented in Wollesen de Jonge et al. (2021). Here, this mechanism is updated to account for the recent advances in the representation of DMS chemistry. In addition to these updates, we also use quantum chemical calculations to present new reaction pathways and temperature dependencies, as a means to address reactions in the DMS oxidation mechanism that still remain uncertain. The full gas-phase and aqueous-phase mechanism is found in Tables S1 and S2 in the Supplement, respectively. Alternative reaction rate coefficients from the literature for key reactions in the mechanism can be found in Table S3. A simplified scheme for the gas-phase reactions that impact the direct formation of SA and thus DMS-drived NPF in the MBL is shown in Fig. 1.
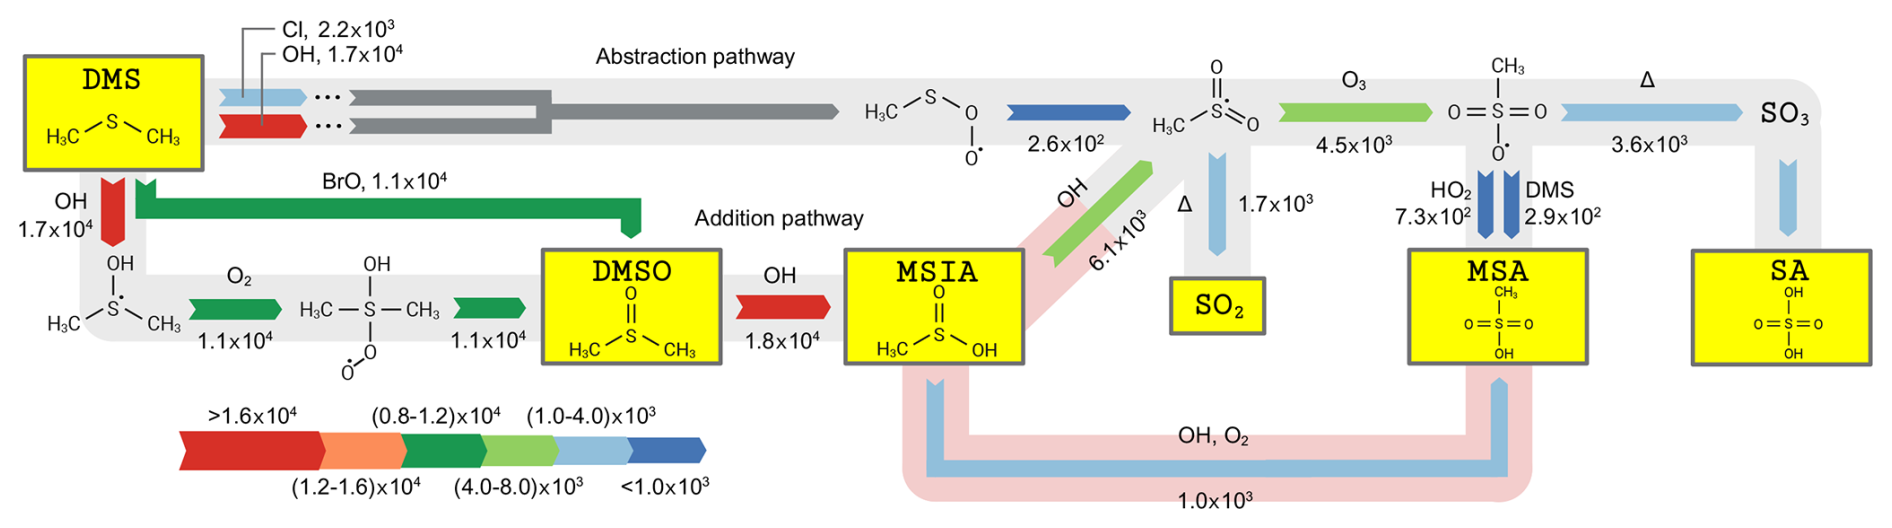
Figure 1Simplified DMS oxidation mechanism for the gas-phase reactions responsible for the direct production of SA in the MBL. Source/sink fluxes for the respective compounds are reported in molec. cm−3 s−1 and calculated at the conditions given in the BaseCase simulation. The fluxes are shown next to the arrow for each reaction together with the reactant for said reaction. Key compounds, all of which are able to partition to the aqueous-phase, are highlighted in yellow. New and modified pathways are marked in red. The initial addition of OH and BrO to DMS marks the addition pathway in the DMS oxidation mechanism, whereas the H-abstraction from DMS by OH and Cl marks the abstraction pathway.
The main part of the DMS-derived gas-phase chemistry is taken from the Master Chemical Mechanism version 3.3.1 (MCMv3.3.1) (Jenkin et al., 1997, 2003). This includes the gas-phase oxidation of DMS by OH and NO3 in addition to the fundamental processing of oxidation intermediates and products in the so-called addition and abstraction pathway. Here, the addition pathway refers to the addition of OH to DMS while the abstraction pathway refers to the H-abstraction from DMS by OH. The oxidation of DMS by halogen radicals Cl and BrO (through H-abstraction and addition, respectively) is treated in accordance with the study by Hoffmann et al. (2016). The processing of halogen radicals, including the activation of chlorine and bromine species in the sea spray particles, is obtained from Braeuer et al. (2013). This chemistry is essential for the representation of halogen radicals in the MBL and thus the oxidation of DMS. In addition to the halogen driven oxidation of DMS, Hoffmann et al. (2016) also provides the reactions that govern the aqueous-phase processing of DMS and its water soluble oxidation products in both deliquesced aerosol particles and cloud droplets. Amongst others, these reactions include the uptake of DMS, DMSO and MSIA to the aqeoues-phase and their reaction with OH and O3 to form MSA. The uptake of MSIA has been found to be particularly impactful for the production of MSA particle mass (PM), as MSIA is able to partition to deliquesced aerosol particles in between cloud periods (Hoffmann et al., 2016; Wollesen de Jonge et al., 2021). The aqueous-phase processing of SO2 is treated in accordance with Jacobson (2005).
The formation of HPMTF through autoxidation, proposed in theory by Wu et al. (2014), shown first in experiments by Berndt et al. (2019) and observed in the atmosphere by Veres et al. (2020), has undergone numerous revisions in the last couple years. The compound is formed from the CH3SCH2OO peroxy radical (produced initially in the DMS abstraction pathway), which undergoes two hydrogen shifts (H-shifts) to form HPMTF. The first of the two H-shift is considerably slower than the second and thus constitutes the rate-limiting step in the formation of HPMTF. Veres et al. (2020) used multiconformer transition state theory to calculate temperature dependant rate coefficients for both H-shifts. Using this approach, the first and rate-limiting H-shift was determined to be 0.047 s−1 at 295 K. This estimate remains considerably slower than the some of the reaction coefficients determined in experiments, e.g. by Berndt et al. (2019) (0.23 ± 0.12 s−1 at 295 K) and Ye et al. (2022) (0.13 ± 0.03 s−1 at 295 K). In this study, we use the temperature dependant rate coefficient by Veres et al. (2020) and scale it to match the rate coefficient obtained by Ye et al. (2022). The rate by Ye et al. (2022) is used as opposed to the rate by Berndt et al. (2019), as the uncertainty associated with the rate is lower. To stay consistent with the use of reaction coefficients from Ye et al. (2022), the subsequent reaction of HPMTF with OH is also implemented from this study. Said rate is considerably higher than the original one presented in the study by Wu et al. (2014) (2.1 × 10⁻¹¹ and 1.4 × 10⁻¹² cm3 s−1, respectively), ensuring that a higher fraction of HPMTF is converted to SO2. HPMTF has also been found to oxidise in the aqueous phase to form SO (Novak et al., 2021; Jernigan et al., 2024; Kilgour et al., 2025). However, as the mechanism for these reactions remains unknown, this pathway has been omitted from the mechanism used in this study. Still, we acknowledge that this pathway is likely to reduce the production of SO2 from HPMTF in the gas phase.
Another aspect of the DMS oxidation mechanism that has undergone revision in recent years is the fate of the products formed in the addition-pathway. In MCMv3.3.1, DMS undergoes OH addition to form DMSO, MSIA and finaly SO2. Recent studies, combining smog chamber experiments on DMS oxidation with box modelling, are nevertheless unable to account for the production of MSA in the gas-phase and particle-phase without considering the H-abstraction from MSIA by OH to form the intermediate radical CH3SO2 (Wollesen de Jonge et al., 2021; Shen et al., 2022). CH3SO2 subsequently undergoes thermal decomposition to form SO2 (similar to the fate of MSIA in MCMv3.3.1), but may also react with O3 or O2 and NO to form CH3SO3 and thus SA and MSA. Here it is essential to distinguish between the formation of SA from CH3SO3 and from SO2, the latter pathway being considerably slower than the first (2.8 × 10⁻² and 8.8 × 10⁻⁷ s−1 at 283 K and an OH concentration of 106 cm−3). With a direct impact on the production of SA and MSA, the H-abstraction from MSIA by OH therefore has the potential to impact the formation and growth of aerosol particles in the MBL. The reaction coefficient for said reaction was set to match the experimentally determined rate by Kukui et al. (2003). As this rate was determined at 298 K, quantum chemical calculations are used in this study to provide temperature dependency for the reaction (Sect. 2.4). These calculations demonstrate that the H-abstraction is more likely to occur at lower temperatures. While the H-abstraction from MSIA by OH has been shown to improve the model representation of MSA in previous publications, others continue to report a missing source of MSA in their model simulations (Ye et al., 2022). Consequently, this study also includes the addition of OH to MSIA, ultimately forming MSA through O2 hydrogen abstraction. This pathway has been proposed theoretically in previous publications (Lucas and Prinn, 2002; Shen et al., 2022; Ye et al., 2022; Chen et al., 2023), but the rate of the reaction has so far only been based on estimates or taken from similar reactions. Here, we implement quantum chemical calculations to determine the temperature dependant rate coefficient for the production of MSA through OH addition to MSIA. The reaction pathway is incorporated together with the work by Lv et al. (2019), which suggest that H2SO3 also forms from the addition of OH to MSIA. In this mechanism, H2SO3 is assumed to decompose directly to SO2. An alternative source of MSA through the reaction of CH3SO3 with DMS is also considered (Yin et al., 1990; Jacob et al., 2024).
The isomerization of CH3SOO to CH3SO2 was included in the mechanism in accordance with the study by Hoffmann et al. (2016), which ensures that SA and MSA forms in the abstraction pathway, even during low NOx conditions (Turnipseed et al., 1995; Lucas and Prinn, 2002). In MCMv3.3.1, CH3SO2 is only able to form via the abstraction pathway through the reaction of CH3SO with NO2 or via O2 addition followed by oxygen abstraction by NO. As NOx concentrations are known to be low in the pristine MBL, the isomerization of CH3SOO therefore plays a role in the production of CH3SO2, SA and thus NPF. The fate of CH3SO2 nevertheless remains uncertain. CH3SO2 either undergoes thermal decomposition to form SO2 or reacts with O3, NO2 or O2 followed by NO, HO2, or RO2 to form CH3SO3. While the reaction coefficients for the reactions forming CH3SO3 are consistent in the literature, the coefficient for the thermal decomposition of CH3SO2 are not. MCMv3.3.1 reports a temperature dependant reaction coefficient of 0.29 s−1 at 295 K, which is considerably lower than the estimates used in the box modelling studies by Jacob et al. (2024) (6 s−1 at 295 K) and Berndt et al. (2023) (20 s−1 at 295 K). As the two latter reaction coefficients are in fact estimates obtained by fitting box model results to measurements, the rate presented in MCMv3.3.1 is used in this study. Due to the impact of the reaction on the distribution of SO2, SA and MSA (and thereby NPF), the different rates are tested in ADCHAM through sensitivity runs. Similar to CH3SO2, the thermal decomposition of CH3SO3 also remains uncertain. Again, MCMv3.3.1 reports a relatively low rate for the reaction (0.11 s−1 at 295 K) while another study suggests that the reaction coefficient might be considerably higher (9.71 s−1 at 295 K) (Cao et al., 2013). The rate from MCMv3.3.1 is implemented as the default rate in this study while sensitivity runs are performed with the rate by Cao et al. (2013).
2.3 Sensitivity Runs
In addition to the default simulation (named BaseCase), different sensitivity runs were performed to test the impact of meteorological and hydrological conditions along with alternative rate coefficients and reaction pathways in the DMS oxidation mechanism on the role of DMS in NPF in the MBL. Table 1 gives an overview of the different simulations. The TEMP273, TEMP278, TEMP288 and TEMP293 sensitivity runs are performed at air temperatures both lower and higher than in the BaseCase simulation, respectively. This is done to demonstrate the impact of temperature on the DMS chemistry in addition to its effect on particle formation and particle growth. WS2, WS4, WS8 and WS10 showcase the impact of wind-speed on the emissions of compounds to the model, especially emissions of DMS, NH3 and sea-spray. These simulations represent conditions of low, moderate and high wind-speed. PRCP2.5, PRCP5 and PRCP15 show the impact of varying the amount of precipitation on day 2 of the simulation. Here, precipitation at 2.5–5.0 mm h−1 is classified as moderate rain, while precipitation from 10–15 mm h−1 is classified as heavy rain. The sea surface concentration of DMS is varied from the concentration used in the BaseCase simulation (10 nmol L−1) to 5 nmol L−1 in [DMS]5, 15 nmol L−1 in [DMS]15 and 20 nmol L−1 in [DMS]20. This represent conditions ranging from weak to moderate and strong phytoplankton blooms. [NHx]0.1, [NHx]0.2 and [NHx]0.4 demonstrate the effect of the sea surface concentration of total dissolved ammonia, which in turn impacts the emissions of NH3 to the marine atmosphere. NHx concentrations of 0.2 mmol m−3 are representative of conditions in the North Atlantic Ocean between May and July, where phytoplankton blooms are at their peak in the region (Paulot et al., 2020). The same is true in the Southern Ocean during December to February, where NHx concentration of 0.4 mmol m−3 are common. Both higher and lower concentrations of NHx can be found in different regions of the Worlds oceans, or in different periods of the year. The range of NHx concentrations presented here are nevertheless representative of pristine ocean regions during periods with active phytoplankton blooms. In the BaseCase simulation, no clouds are introduced in the model after the precipitation event at the end of day 2. In the CLOUD sensitivity run, mid-day and mid-night clouds continue to be present after the precipitation event to test the impact of clouds on NPF in the simulation.
Jacob et al. (2024)Cao et al. (2013)Table 1An overview of the ADCHAM model setup in the BaseCase simulation and sensitivity runs.
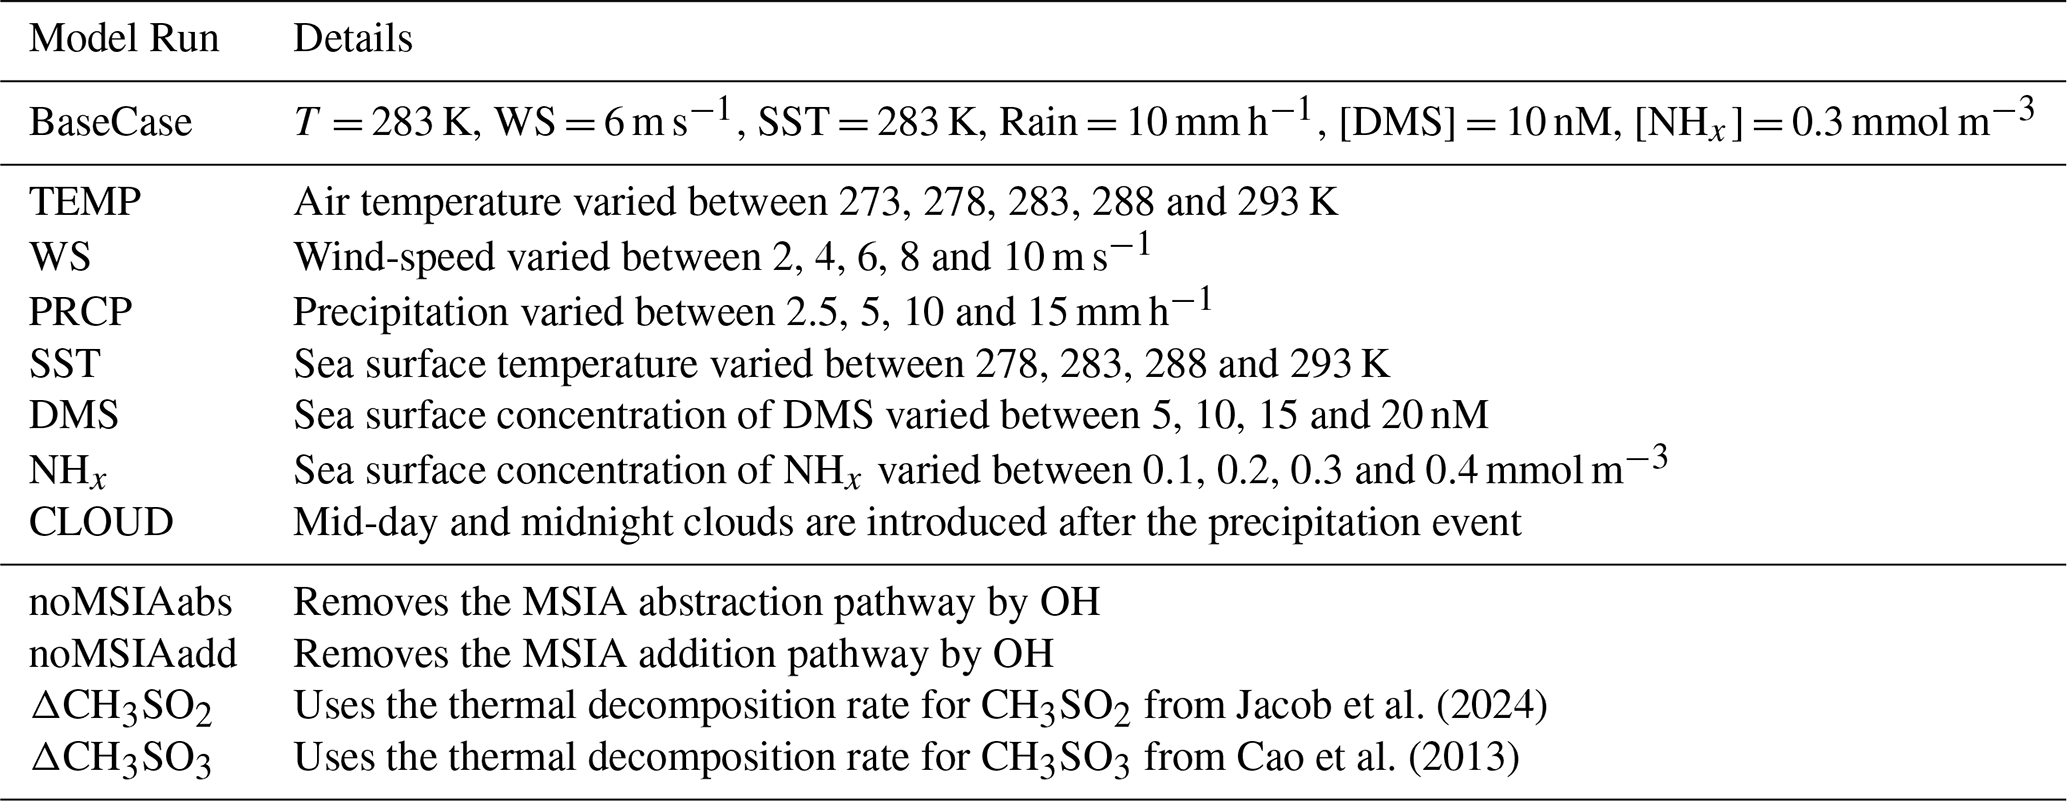
In addition to the sensitivity runs focusing on emissions and different meteorological and hydrological conditions, certain aspects of the DMS oxidation chemistry and its impact on DMS-derived NPF are also examined. In ΔCH3SO2, the rate for the thermal decomposition of CH3SO2 from Jacob et al. (2024) is used as opposed to the rate from MCMv3.3.1, to test how an increase in SO2 at the expense of SA and MSA impacts NPF. In ΔCH3SO3, the rate from Cao et al. (2013) for the thermal decomposition of CH3SO3 is used as opposed to the one from MCMv3.3.1 to demonstrate the impact from an increase in SA from CH3SO3. In noMSIAabs and noMSIAadd, the reactions for the H-abstraction from MSIA by OH and OH addition to MSIA are removed from the simulation. This is done to showcase the role of the MSIA compound in the formation and growth of aerosol particles from DMS. In addition to the results depicted in Figs. 1–4 from the main text, further figures can be found in the Supplement, Sects. S4–S12. The mean source flux of H2SO4, MSA, SO2, MSIA, DMSO, and HPMTF depicted in these figures are summarized in Table S4.
2.4 Rate coefficients calculations
In this study, two key reactions on the oxidation of MSIA by OH were modified based on quantum chemical calculations. This was done due to their impact on SA and MSA production in the gas-phase (Wollesen de Jonge et al., 2021; Shen et al., 2022) and thus DMS-derived NPF in the MBL. The two reactions concern the H-abstraction from MSIA by OH and the addition of OH to MSIA. Quantum chemical calculations were used on the following principles: (1) If the reaction coefficient had previously been based on estimates, then the quantum chemical calculations were used to obtain both the reaction rate and the temperature dependency for the reaction. (2) If the reaction coefficient has been determined experimentally but at a fixed temperature, then the quantum chemical calculations were used to obtain the temperature dependency for the reaction. In the context of this work, quantum chemical calculations were therefore used to obtain the temperature dependency for the H-abstraction from MSIA by OH, since the rate of reaction had already been determined at a fixed temperate (298 K) by Kukui et al. (2003). As no experimental rates exists for the addition of OH to MSIA, both the reaction rate and temperature dependency were calculated using quantum chemical calculations.
For the quantum chemical calculations, all geometry optimizations and harmonic vibrational frequency calculations of the reactants, transition states (TS), intermediates (IM), and products were performed at the M06-2X/6-311+G(3df,2p) level of theory (Zhao and Truhlar, 2008). Intrinsic Reaction Coordinate (IRC) calculations at the same level were carried out to confirm that each TS connects the intended reactants and products. Single-point energy (SPE) calculations were performed at the ROHF-ROCCSD(T)-F12a/cc-pVDZ-F12 (hereafter denoted as F12a) level (Adler et al., 2008), including zero-point energy corrections obtained at the M06-2X/6-311+G(3df,2p) level. This combination of methods has been widely applied to study the transformations of peroxy and alkoxy radicals, and its accuracy is well established as a “gold-standard” approach (Wang et al., 2020; D'Ambro et al., 2022; Møller et al., 2019). All quantum chemical calculations were performed using the Gaussian 16 and Molpro 2024.3 software packages (Frisch et al., 2016; Werner et al., 2020).
To account for the effects of multiple conformers of the reactants and transition states on the reaction mechanism, both single and multi-conformer approaches were employed to balance computational cost and accuracy. Based on the single-conformer results, multi-conformer effects were explicitly considered for key reaction channels, including H-abstraction and OH-addition reactions of MSIA with OH, as well as the subsequent reactions of the addition intermediates (IMadd). Following previous work (Fu et al., 2022, 2024a, b), a conformational sampling scheme using Molclus and Gaussian 16 was adopted to explore the low-energy conformers of the relevant reactants and transition states. For kinetic analysis, the electronic energies were taken from the F12a calculations, while the partition functions were derived from the M06-2X/6-311+G(3df,2p) results. Rate constants were obtained using multiconformer transition state theory (MC-TST). One-dimensional unsymmetrical Eckart barriers were applied to account for quantum tunnelling in reactions involving H-shift or H-abstraction (Eckart, 1930). All rate constants were calculated with the KiSThelP program (Canneaux et al., 2014). The calculations are discussed in more detail in the Supplement, Sect. S4.
3.1 DMS-derived NPF and growth
At the conditions given in the BaseCase model setup, a distinct NPF event takes place on the third day of the simulation following the precipitation event (Fig. 2a). The formation and growth of particles is driven by emissions of DMS, which enters the model at 8.3 × 10⁹ molec. cm−2 s−1 (6 m s−1 wind-speed) and gradually builds up to reach a concentration of 0.92 ppb at the end of the simulation (Fig. 2b). Atmospheric DMS concentrations in the MBL have been shown to range from tens of ppt in regions with low surface-ocean DMS concentrations to a couple of ppb over waters with high surface-ocean DMS concentrations (Marandino et al., 2008; Lawson et al., 2020; Novak et al., 2022). The scenario prescribed in the BaseCase simulation is representative of a marine environment with moderate to high surface-ocean DMS concentrations, and the simulated gas-phase concentrations of DMS are therefore in line with observations from the MBL. The flux parametrization for the sea-air exchange of NH3 results in a mean NH3 gas-phase concentration of 17 ppt throughout the simulation with a maximum concentration of 50 ppt. These concentrations fall within the range observed in the Arctic MBL (Wentworth et al., 2016), and constitute a realistic representation of NH3 in the MBL without impact from anthropogenic emissions. As the simulation is initiated with high concentrations of sea spray aerosol particles (18.6 µg m−3) and partial cloud cover, NPF is suppressed on day 1 and day 2. The suppression of NPF is driven by the high SA condensation sink (1.4 × 10⁻³ s−1 before the precipitation event) and the uptake of SA and SA precursors to the cloud droplets. These precursors include MSIA and SO2 which partition to the cloud droplets during cloud cover (Fig. 2c) to form MSA and , respectively. This means that MSIA and SO2 are almost completely removed from the gas-phase during cloud cover. Consequently, the mean SA gas-phase concentration is lower on day 2 of the simulation (1.2 × 106 cm−3) compared to day 3 (1.6 × 107 cm−3). The uptake and processing of water soluble species in the activated cloud droplets causes a small but distinct Hoppel minima to form in the size distribution during days 1–2 (Fig. 2a), driven predominantly by the uptake and aqueous-phase processing of DMSO, MSIA and SO2. The minima persists after the precipitation event and highlights the impact that aqueous-phase chemistry in cloud droplets has on the aerosol particle population over the ocean. MSA is also removed during cloud cover, but since it possesses semi-volatile characteristics (Henry's law solubility of 6.7 × 10⁸ mol kg−1 atm−1 at 283 K) a fraction of it will evaporate back to the gas-phase after each cloud period (Fig. 2d). During the cloud free conditions representative of days 3–6, MSA follows a similar diurnal trend as SA with peak production and concentration during midday and lower concentrations at night. HPMTF builds up in the gas-phase in the same way as DMS, reaching a concentration of 166 ppt at the end of the simulation (Fig. 2b).
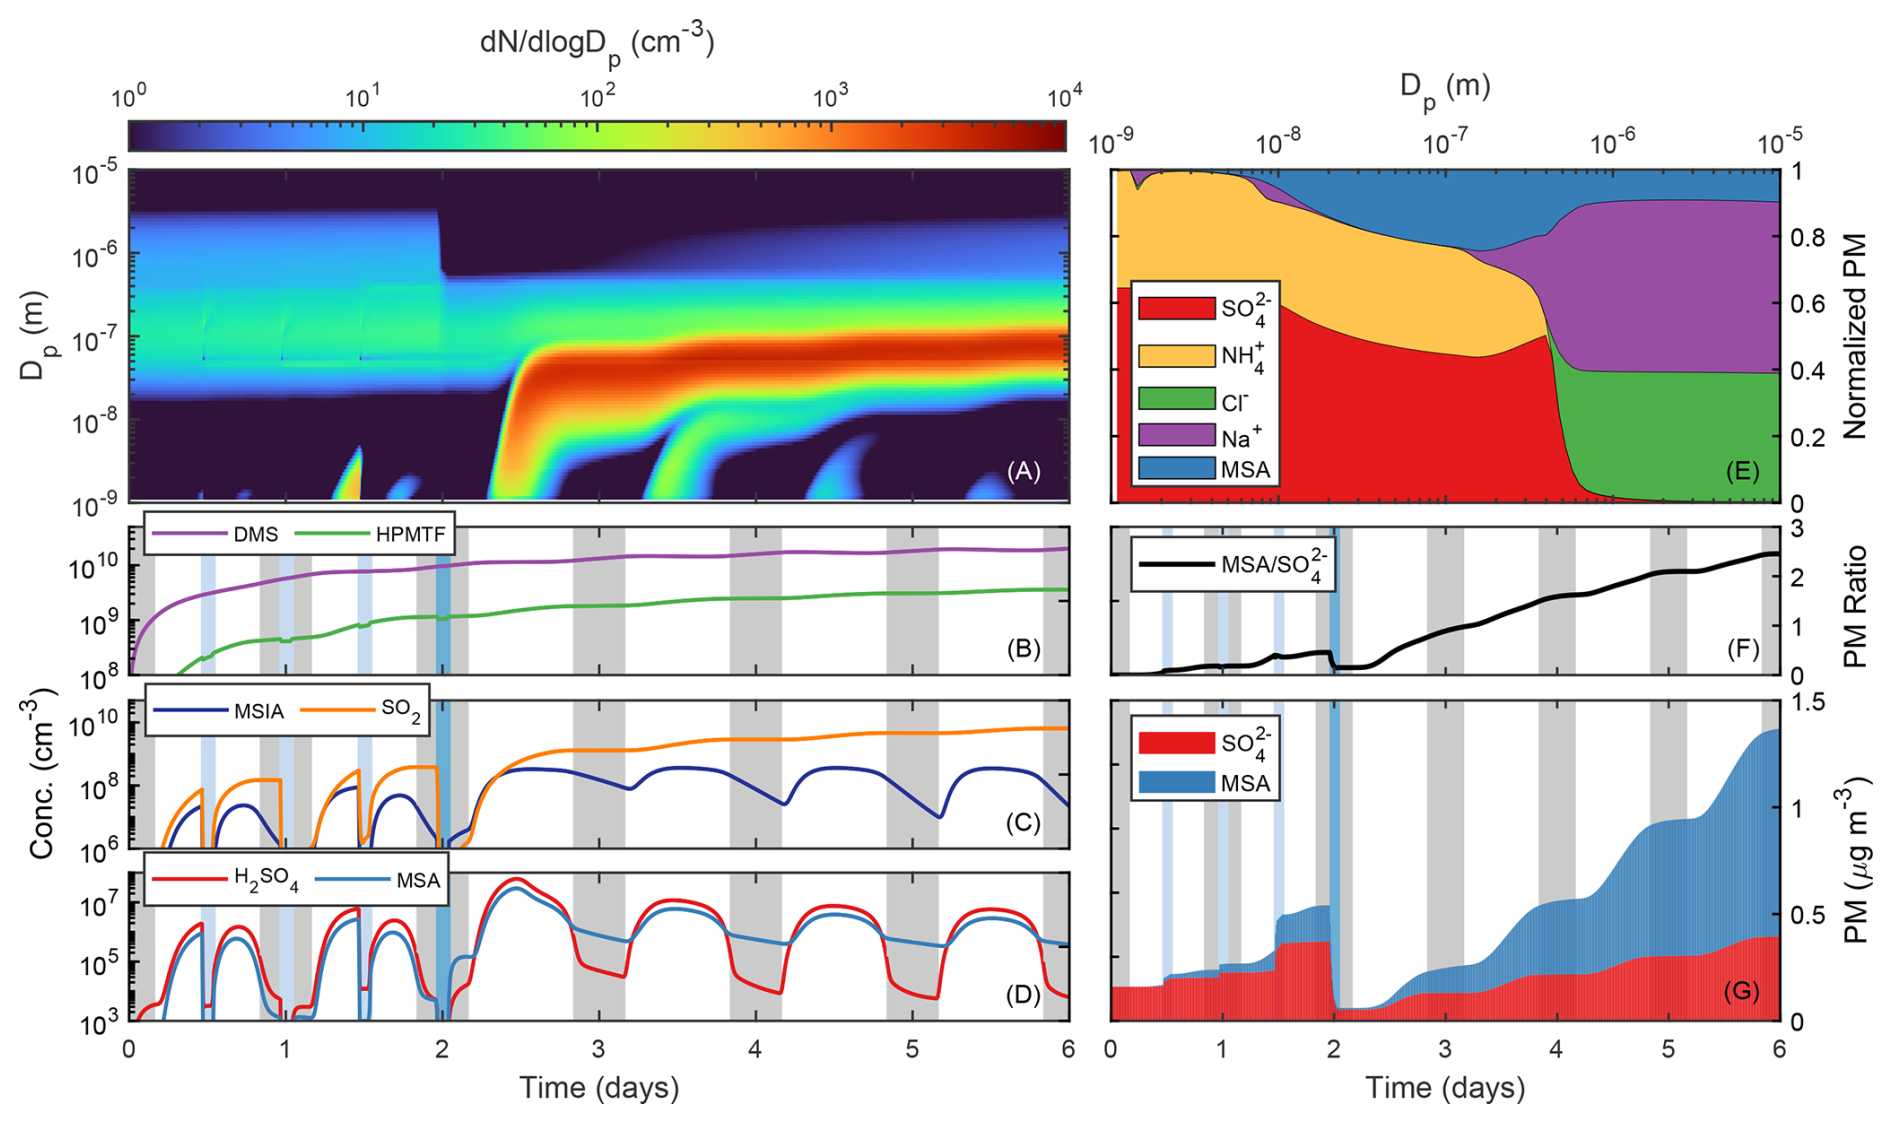
Figure 2DMS driven NPF and growth in the pristine MBL. Panel (a) shows the particle number size distribution for the full simulation period, while panels (b), (c) and (d) show the gas-phase concentrations of DMS and HPMTF, MSIA and SO2 along with SA and MSA, respectively. Panel (d) shows the normalized chemical composition for the full size distribution, panel (e) the MSA PM ratio and panel (f) the and MSA PM. The grey bars represent night-time conditions while the light and dark blue bars depict cloud and precipitation events, respectively. The results are obtained from the BaseCase simulation.
On day 3 of the simulation, the precipitation event removes a considerable fraction of the aerosol PM, thereby decreasing the condensation sink to 1.1 × 10⁻⁴ s−1. This spurs an increase in the SA gas-phase concentration which causes SA and NH3 to cluster and form new particles. The continuous condensation of SA and NH3 ensures that the newly formed clusters grow, first into a distinct nucleation mode and thereafter into the Aitken mode which reaches a mode particle diameter of 73 nm (25th–75th prct.: 60–88 nm) at the end of the simulation. Additional NPF on days 4–6 is suppressed due to the increase in the condensation sink from the additional sea-spray PM and the particles formed in the NPF event on day 3. The gas-phase concentration of MSIA, MSA and SA decreases correspondingly as they are lost to the increasing concentration of said particles (Fig. 2c and d). SO2, on the other hand, accumulates in the gas-phase during days 3–6 as the lack of clouds prevents it from partitioning efficiently to the particle-phase. This also means that the SA source flux from SO2 increases towards the end of the simulation whereas the SA source flux from CH3SO3 decreases in correspondence with the decrease in MSIA (Fig. S6). Consequently, SO2 comprises 21 % of the SA source flux during day 6 compared to 3 % during day 3. As a result, SO2 becomes less important for the initial NPF as the conversion of SO2 to SA is considerably slower than the conversion of CH3SO3 to SA. When SO2 finally reaches a concentration where it contributes significantly to the production of SA, the sea-spray and DMS-derived PM concentration has become too high for new particles to form efficiently. Nucleation rates for the SA-NH3 system obtained with the RI-CC2 method are significantly higher than those obtained with the DLPNO method (maximum nucleation rate of 2.0 cm−3 s−1 on day 3 of the simulation using RI-CC2 as opposed to 0.13 cm−3 s−1 when using DLPNO)(Fig. S12). This rate leads to a 2.2 times increase in the total PN concentration at the end of the simulation. The increase in the PN concentration stunts the growth of the particles as more SA is needed to grow said particles into the nucleation and Aitken mode. As a result, the growth mode only reaches a mode particle diameter of 56 nm (25th–75th prct.: 46–68 nm) at the end of the simulation. Consequently, using the RI-CC2 method as opposed to the DLPNO method to obtain nucleation rate for the SA-NH3 system will increase the total number of particles but decrease the number of particles that may reach the CCN size range.
and PM dominates the chemical composition of the aerosol particles formed during the NPF event and in the subsequent growth mode (Fig. 2e). This is caused by the ability of SA to condense irreversibly to the particle-phase, with NH3 aiding the growth by neutralizing the otherwise acidic aerosol particles. According to ADCHAM, DMS-derived SA and natural emissions of NH3 from the surface ocean are capable of sustaining the growth of newly formed aerosol particles into the nucleation and Aitken mode. MSA does not contribute significantly to the growth of the smaller particles, as its semi-volatile characteristics mainly allows it to condense on the larger sea-spray particles. MSA PM nevertheless aids the growth of the particles in the Aitken and upper end of the nucleation mode, with particularly high PM concentrations in the accumulation and coarse mode particles (Fig 2e). This happens as 85 % of MSA is formed in the aqueous-phase of the deliquesced aerosol particles and cloud droplets from the oxidation of dissolved and dissociated MSIA by O3 (Fig. S7). The remaining MSA production happens in the gas-phase through the addition of OH to MSIA (8 %) and from the reaction of CH3SO3 with HO2 (6 %) and DMS (2 %). While MSA formed in the gas-phase is able to condense on particles in the nucleation and Aitken mode size range, MSIA mainly partitions to the coarse mode deliquesced sea-spray particles where it is converted to MSA. This tendency is evident from the decrease in the MSA PM during the precipitation event. Here, the MSA PM decreases by 95 % as opposed to 86 % for the PM as the coarse mode particles containing most of the MSA PM are removed more efficiently through wet-deposition than particles in the lower size ranges (Fig. 2g). After the precipitation event, the MSA PM increases disproportionally to the PM as the lack of clouds prevents SO2 from being converted to . As MSA continues to be produced in the deliquesced sea spray particles, the MSA PM ratio increases throughout the simulation from an average ratio of 0.3 on day 3 to 2.3 on day 6 (Fig. 2f).
3.2 Impact of meteorological and hydrological conditions
3.2.1 Air temperature
The air temperature within the MBL dictates different aspects that influences the formation and growth of aerosol particles. This includes the gas-phase and aqueous-phase chemistry, the rate of molecular clustering and evaporation, the condensation of low volatile species to the particles and the uptake of water-soluble species to deliquesced particles and cloud droplets. The air temperature therefore constitutes an important factor in NPF and particle growth.
A fundamental role of the air temperature is its ability to control the amount of water that the air can hold. Warmer air holds more water than cold air and as a consequence produces higher concentrations of OH, with a mean concentration throughout the simulation of 5.2 × 105 cm−3 in TEMP293 compared to 1.8 × 105 cm−3 in TEMP273. Higher concentrations of OH also leads to higher concentrations of HO2, which promotes the production of HOX (X = Cl, Br, I) which catalytically activates the halogen species ICl, BrCl and Cl2 from the sea spray particles and thus promotes the concentration of halogen oxidants in the gas-phase (Braeuer et al., 2013). The oxidative capacity of the MBL therefore increases with temperature, which is seen in the mean DMS sink flux throughout the simulation which increases from 4.1 × 104 cm−3 s−1 in TEMP273 to 4.9 × 104 cm−3 s−1 in TEMP293 (Fig. S16). At the same time, temperature also dictates the ratio of the DMS abstraction pathway to the DMS addition pathway, as OH addition to DMS is favoured at lower temperatures ( = 0.5 at 273 K and 1 atm compared to 1.6 at 293 K). The temperature driven branching of the OH-initiated oxidation of DMS propagates through the mechanism and dictates the production of species in both the abstraction and addition pathway. As a result, the mean source flux of DMSO and MSIA in the addition pathway is higher in TEMP273 (2.4 × 10⁴ and 1.9 × 104 cm−3 s−1, respectively) compared to TEMP293 (1.6 × 10⁴ and 1.4 × 104 cm−3 s−1, respectively) in spite of higher OH concentrations in TEMP293 (Fig. S20). The temperature dependency on the initial oxidation of DMS is amplified by the addition of BrO to DMS forming DMSO, which is favoured at lower temperatures. Although cold conditions promotes the production of DMSO and MSIA, the fraction that oxidizes to form CH3SO2, CH3SO3 and ultimately SA and MSA in the gas-phase is limited by the uptake of MSIA to the deliquesced aerosol particles. The mean sink flux of MSIA to the deliquesced particles is 4.0 times higher at 273 K compared to 293 K, whereas the sink flux of MSIA through H-abstraction by OH is 3.0 times higher at 293 K compared to 273 K. Consequently, colder temperatures promote the uptake of MSIA to the aqueous-phase, whereas warmer temperatures promote the continued oxidation of MSIA in the gas-phase. The effect is evident from the MSA PM ratio (7.0 in TEMP273 and 0.9 in TEMP293) as the uptake of MSIA to the deliquesced aerosol particles promotes the production of MSA through aqueous-phase oxidation by O3.
The continuous production of CH3SO2 originates both from the oxidation of MSIA by OH in the addition pathway and through the propagation of species in the abstraction pathway. However, due to the low NOx conditions in the simulation (mean concentration of ∼ 6 ppt in BaseCase, representative of the pristine MBL), the NOx driven oxidation of CH3SO and CH3SOO2 in the abstraction pathway make up < 1 % of the CH3SO2 source flux throughout all temperature sensitivity runs. The isomerization of CH3SOO comprises the only significant source of CH3SO2 from the abstraction pathway, making up 4 % of the CH3SO2 source flux in the BaseCase simulation (Fig. S10). The oxidation of MSIA by OH, on the other hand, makes up 96 % of the CH3SO2 source flux. It is evident therefore that the oxidation of species in the addition pathway dictates the production of CH3SO2, CH3SO3 and thus direct SA and MSA production in the gas-phase.
While the production of CH3SO2 continues to increase with temperature, its oxidation by O3 to form CH3SO3 is impacted by the thermal decomposition of CH3SO2 into CH3OO and SO2 (Fig. 1). Said decomposition increases with temperature, causing the sink flux ratio to increase from 0.1 in TEMP273 to 1.3 in TEMP293. As a consequence, the CH3SO3 production stagnates as the temperature increases from 273 to 283 K and starts to drop as the temperature exceeds 283 K (Fig. S22). This directly impacts the production of SA which follows the trend of CH3SO3 through the thermal decomposition of CH3SO3 into CH3OO, SO3 and thus SA. As the simulation progresses and additional sea-spray enters the MBL, the temperature effect on the uptake of MSIA to the sea-spray becomes increasingly important for the production of SA. Following the precipitation event on day 3, sea-spray concentrations remain relatively low. This in combination with higher concentrations of DMSO ensures that the concentration of MSIA on day 3 is higher in TEMP273 compared to TEMP293. On day 4–6, however, MSIA concentrations in TEMP273 falls below that in TEMP293 as the colder temperatures ensures that MSIA partitions efficiently to the aqueous-phase. As a result, the CH3SO2, CH3SO3 and SA source flux decreases from day 3 to day 6 in TEMP273 but increases during the same time in TEMP293, both following the continued increase in the DMS concentration (Figs. S17, S21 and S22).
In addition to the effect of temperature on the uptake of MSIA to the deliquesced particles, SA production from SO2 also becomes increasingly important with the increase in temperature. The SO2 source flux increases by a factor of 3.8 between 273 and 293 K, mainly driven by the increase in HPMTF production but also from the thermal decomposition of CH3SO2 which makes up 17 % of the SO2 source flux in TEMP293 as opposed to 4 % in TEMP273 (Fig. S19). The formation of HPMTF is favoured at higher temperatures as the OH addition to DMS becomes less favourable, thereby promoting the abstraction pathway and thus the autoxidation of CH3SCH2O2 into HPMTF and ultimately SO2. Furthermore, the autoxidation itself becomes faster as the temperature increases as the internal H-abstractions by the peroxy radicals in CH3SCH2O2 and OOCH2SCH2OOH are favoured at higher temperatures. SO2 therefore reaches a concentration of 519 ppt in TEMP293 as opposed to 130 ppt in TEMP273, thereby comprising 27 % and 7 % of the total SA source flux throughout the simulations, respectively. The combination of the decrease in the uptake of MSIA to the sea-spray particles and the increase in the production of SO2 means that the total SA source flux increases from 273 to 288 K (Fig. S17). Beyond 288 K, however, the thermal decomposition of CH3SO2 limits the oxidation of CH3SO2 by O3 to a degree where the production of CH3SO3 and thus SA starts to decrease. Consequently, the total SA source flux throughout the simulation decreases as the temperature exceeds 288 K.
MSA production in the gas-phase remains relatively stable across the temperature interval, although its source varies. At 273 K, H-abstraction from DMS by CH3SO3 and the reaction of HO2 with CH3SO3 makes up 27 % and 46 % of the MSA gas-phase source flux, respectively. At 293 K, OH addition to MSIA dominates the production of MSA comprising 80 % of the MSA gas-phase source flux. The difference comes down to the decrease in MSIA partitioning to the deliquesced particles and higher OH concentrations in warm conditions, which promotes the addition of OH to MSIA despite the inverse relationship between temperature and the addition reaction rate itself. In cold conditions, DMS concentrations are higher due to the limited oxidation capacity of the atmosphere and CH3SO3 is less likely to undergo thermal decomposition thereby promoting the production of MSA via H-abstraction from DMS by CH3SO3.
In addition to the impact of temperature on the chemistry and uptake of water soluble species to the aqueous-phase, temperature also impacts the rate by which the initial clusters form and grow. Here, the maximum SA-NH3 derived nucleation rate on day 3 of the simulation following the precipitation event increases as the temperature decreases from 0.3 × 10⁻² cm−3 s−1 at 293 K to 0.9 cm−3 s−1 at 273 K (Fig. S15). The difference is driven predominantly by the temperature effect on the cluster stability as the NH3 and SA concentrations increases with increasing temperatures. The higher nucleation rate at 273 K promotes the total PN concentration, which was found to be 15 times higher at the end of the simulation in TEMP273 compared to TEMP293 (Fig. 3a).
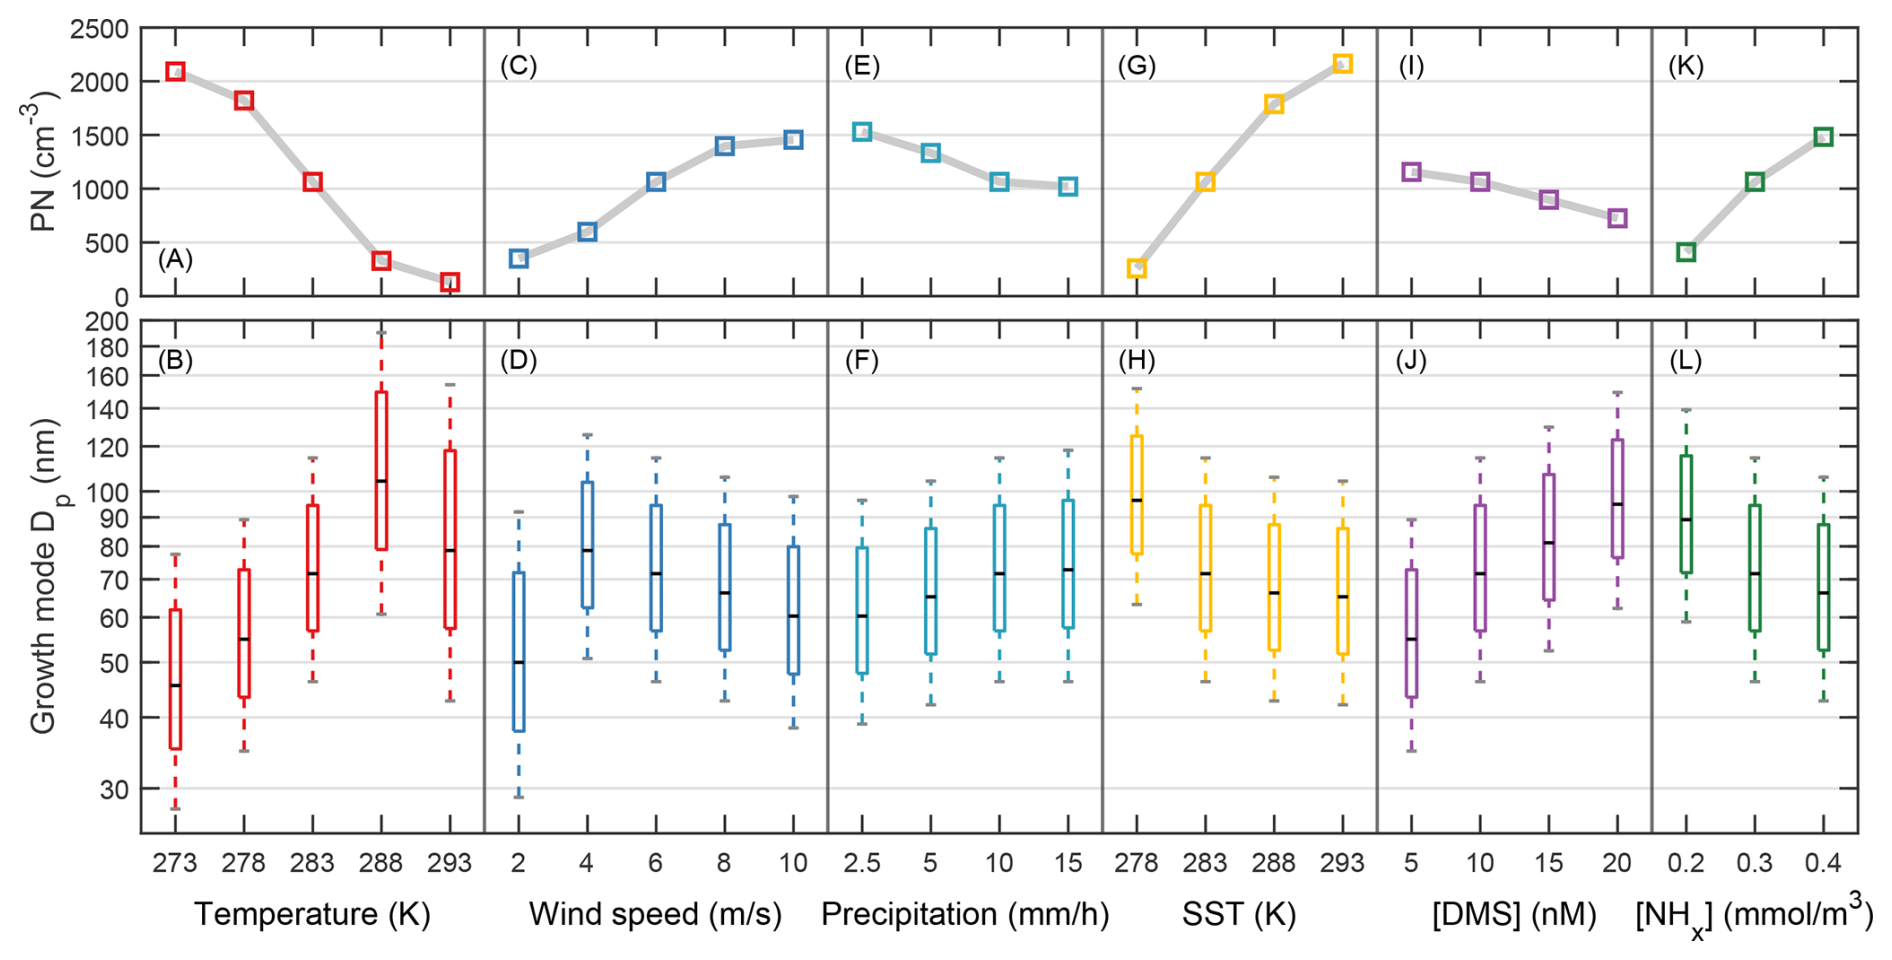
Figure 3DMS-derived growth mode in the pristine MBL. Depicts the aerosol growth mode particle size distribution and total PN concentration at the end of the simulation for (a–b) varying temperatures, (c–d) varying wind-speeds, (e–f) varying rates of precipitation, (g–h) varying sea surface temperatures, (i–j) varying surface ocean concentrations of DMS and (k–l) varying surface ocean concentrations of total dissolved NHx. The box plots represents the 5th, 25th, 75th and 95th percentile of the growth mode and the black line represents the mode particle diameter. Simulations were no NPF event took place are not included in the figure.
The continued growth of the particles changes throughout the simulation. During day 1–2, the particle growth is dictated by the uptake and complete removal of water soluble gas-phase species to the cloud droplets. In terms of the MSA PM, the impact of clouds is less pronounced as MSIA already partitions efficiently to the deliquesced particles during cloud-free periods. Clouds nevertheless promotes the production of PM through the uptake and aqueous-phase processing of SO2. Consequently, the PM increases linearly with the temperature during days one-two. During the remainder of the simulation, however, the total SA source flux and thus the production of PM increases from 273 to 288 K but decreases from 288 to 293 K. This happens as the production of CH3SO3 and in turn SA stagnates and starts to decrease beyond 288 K as the fraction of CH3SO2 that decomposes into SO2 becomes higher. If left to run for an extended period, the total SA source flux in TEMP293 would eventually surpass that of those in the remaining simulations due to the increase in the production of SA from SO2. However, as the production of SA from CH3SO3 dictates the production of the new particles following the precipitation event, the particles formed at 293 K would not reach the size of those produced at 288 K. As a result, the DMS-derived particles reach their maximum mode diameter of 106 nm (25th–75th prct.: 85–136 nm) at 288 K, with the particles reaching only 46 nm (25th–75th prct.: 38–57 nm) at 273 K and 81 nm (25th–75th prct.: 62–106 nm) at 293 K (Fig. 3b). The DMS-derived NPF and growth therefore does not change linearly with temperature, but peaks around moderate temperature conditions. At higher temperatures, the SA production is limited by the thermal decomposition of CH3SO2 which limits the production of CH3SO3 and thus SA. At lower temperatures, the SA production is limited by the uptake of MSIA to the deliquesced particles, which decreases the production of CH3SO2, CH3SO3 and thus SA. It should be noted that the high nucleation rate at the lower temperatures also lowers the growth of the particles, as more SA is needed to grow the high concentration of newly formed particles into the nucleation and Aitken mode.
3.2.2 Wind-speed
The wind-speed adjacent to the sea surface makes up the most important meteorological factor in the emission of gases and sea spray particles from the ocean to the MBL. The correlation between the gas-flux and the wind-speed 10 m above the sea surface (U10) may be linear (Liss and Merlivat, 1986), super-linear (Blomquist et al., 2017) or quadratic (Wanninkhof, 2014; Nightingale et al., 2000) depending on the study that is used to calculate the transfer velocity kw. Well established emission databases such as the Copernicus Atmosphere Monitoring Service (CAMS) relies on the quadratic transfer velocity from Nightingale et al. (2000) to calculate the sea-air flux of DMS, despite the fact that the relationship between the transfer velocity and wind-speed from said study has not been determined specifically for DMS. In this work we utilize the super-linear transfer velocity from Blomquist et al. (2017), as it was calculated specifically for DMS. As a consequence, the DMS flux and atmospheric DMS-derived concentrations reported here are smaller than those in model studies that rely on emissions from CAMS or utilize a quadratic transfer velocity to calculate the flux of DMS in their model, especially during conditions with high wind-speed. Emissions decrease further if using the linear transfer velocity from Liss and Merlivat (1986). For sea spray, the current parameterizations generally agree on using an empirical power law fit for the sea spray flux as a function of wind-speed (Sofiev et al., 2011; Salter et al., 2015). Concentrations of sea spray in the MBL consequently depends heavily on wind-speed, with much higher emissions during strong winds compared to calm conditions.
In the sensitivity runs WS2, WS4, WS8 and WS10, the wind-speed in the simulation is varied from 2 to 10 m s−1 in addition to the 6 m s−1 used in the BaseCase simulation. DMS emissions vary by close to an order of magnitude across this wind-speed interval, ranging from 1.9 × 10⁹ molec. cm−2 s−1 at 2 m s−1 to 1.6 × 10¹⁰ molec. cm−2 s−1 at 10 m s−1. The DMS concentrations consequently reaches 229 ppt in WS2 and 808 ppt in WS10 (Fig. S23). Higher concentrations of DMS are seen in BaseCase (922 ppt) and WS8 (1089 ppt), as the substantial sea spray particle concentrations in WS10 (65 µg m−3 at the end of the simulation as opposed to 0.3 µg m−3 in WS2) ensures higher concentrations of halogen oxidants BrO and Cl and thus a higher DMS sink flux than in the remaining simulations (Fig. S26). The increase in DMS emissions and the oxidative capacity of the MBL also ensures that the secondary aerosol PM increases in accordance with the wind-speed (0.2 µg m−3 in WS2 and 6.0 µg m−3 in WS10). Strong winds favour the production of MSA as opposed to , as the increase in sea spray increases the uptake of MSIA to the deliquesced aerosol particles and thus promotes the aqueous-phase production of MSA. As a result, the MSA PM ratio is 0.5 in WS2 and 8.3 in WS10.
The formation and growth of DMS derived particles in the MBL at different wind-speeds is dictated by the emissions of DMS, NH3 and sea spray. In WS2, sea spray emissions and thus the condensation sink remains low (0.6 × 10⁻³ s−1 at the end of the simulation as opposed to 4.6 × 10⁻³ s−1 in WS10). The low condensation sink allows DMS-derived SA and NH3 to form and grow particles during days 3–6 in the simulation (Fig. S24), although the maximum nucleation rate during these days remains moderately low at 1.5 × 10⁻² cm−3 s−1. New particles are able to form on day 6 in WS2 as the sea spray concentration builds up slowly, thus keeping the condensation sink low. Nucleation and growth rates in WS2 remain low compared to the other simulations, as the low wind-speed also limits the emissions of DMS and NH3. The opposite is true in WS10, where emissions of DMS and NH3 are high but the growth is limited by the high concentration of sea spray. As a result, new particles are able to form relatively efficiently on day 3 (following the precipitation event) when sea spray concentrations have not yet reached a level where they efficiently suppress NPF. On day 4 to 6, however, the increasing condensation sink (both from the sea spray and from the DMS-derived growth event) prevents any new particles from forming. As the high condensation sink in WS10 also limits the growth of the newly formed particles, said particles only reach a mode particle diameter of 61 nm (25th–75th prct.: 51–74 nm) at the end of the simulation (Fig. 3d). In WS2, the particles reach a mode diameter of 52 nm (25th–75th prct.: 41–65 nm). These two scenarios illustrate that an optimal wind-speed exists where the condensation sink is sufficiently low and the concentration of precursor gases sufficiently high for particles to grow. Here, we demonstrate that the overall growth of the particles peaks in WS4 at a mode diameter of 80 nm (25th–75th prct.: 66–96 nm). The total PN concentration, however, increases in according with the wind-speed from 4.1 × 102 cm−3 in WS2 to 1.5 × 103 cm−3 in WS10 (Fig. 3c). In conclusion, moderate wind-speeds (4–6 m s−1) comprises the optimal conditions for DMS-derived particles to grow within the MBL. During conditions of light winds, the growth of the new particles is limited by the lack DMS and NH3. During strong winds, the growth is limited by the high condensation sink caused by the sea spray emissions. As the concentration of sea spray particles remains low on day 3 of the simulation following the precipitation event in WS2–10, the rate of nucleation and thus the total PN concentration increases in accordance with the wind-speed due to higher emissions of DMS and NH3.
3.2.3 Precipitation
Over the open ocean, precipitation is essential for the formation of new particles as it efficiently lowers the concentration of accumulation and coarse mode particles. The decrease in particle surface area lowers the condensation sink and allows SA to reach higher concentrations in the gas-phase. In the BaseCase simulation, a heavy rainfall of 10 mm h−1 is introduced to the model for 1 h during the night-time cloud event between day 2 and day 3. This rainfall efficiently lowers the sea spray PM concentration by 99 % which causes the mean SA gas-phase concentration to increase by an order of magnitude (factor 12.3) on day 3 compared to day 2. The increase in the gas-phase concentrations of SA subsequently sparks a distinct NPF event on day 3. In the PRCP2.5 and PRCP5 sensitivity runs, representing conditions of moderate precipitation, the growth mode on day 3 remains present in the simulation despite lower concentrations of SA (Fig. S34). This happens as these precipitation rates still remove 89 % and 96 %, respectively, of the available sea-spray PM. At 2.5 mm h−1 precipitation, the growth rate of the NPF event on day 3 was found to be 2.8 nm h−1 compared to 3.3 nm h−1 at 5 mm h−1 precipitation and 4.0 nm h−1 at 10 mm h−1 precipitation. The newly formed particles continue to grow and reach a mode diameter of 61 nm (25th–75th prct.: 51–74 nm), 66 nm (25th–75th prct.: 55–80 nm) and 73 nm (25th–75th prct.: 60–88 nm) towards the end of the simulation in PRCP2.5, PRCP5 and BaseCase, respectively (Fig. 3f). Our results, therefore, indicate that new particles formed over the ocean can reach the Aitken mode size range within a couple of days, even at moderate rates of precipitation. Precipitation beyond 10 mm h−1 has less impact on the NPF and growth since the far majority of the coarse mode sea spray particles has already been removed at this precipitation rate. As a consequence, the growth rate on day 3 of the simulation in PRCP15 increases to just 4.3 nm h−1 with the newly formed particles reaching a mode diameter of 74 nm (25th–75th prct.: 61–89 nm) at the end of the simulation. The total PN concentration at the end of the simulation is higher in PRCP2.5 compared to PRCP10 (Fig. 3e), as less of the PM has been removed from the atmosphere. As a result, more NH3 evaporates back into the gas-phase following the precipitation event which helps to drive the initial NPF. The continued growth of these particles are nevertheless stunted by the decreased production of SA in the gas-phase.
3.2.4 Sea surface temperature
All marine emissions, be it sea spray particles or gases, depend on the sea surface temperature. For gases, the sea to air flux is generally calculated as the product between the gas exchange coefficient k and the concentration gradient between the air-sea interface (Eq. 1) (Ziska et al., 2013).
Here, Cw is the concentration of the gas in water, Ca is the concentration of the gas in air and H is the dimensionless Henry's law solubility. The gas exchange coefficient depends both on the wind-speed and the sea surface temperature through the Schmidt number for each gas. The Schmidt number, which prescribes the ratio of the kinematic viscosity of water to the diffusivity of a specific gas in water, decreases for increasing sea surface temperatures as water becomes less viscous and gases diffuse easier in warmer waters. From the inverse relationship between the gas exchange coefficient and the Schmidt number it follows that higher sea surface temperatures increases the rate by which the gas leaves the surface ocean. In addition, the Henrys law solubility dictates that gases are less soluble in warm as opposed to cold water, thereby increasing the sea-air flux in warmer waters.
For the emission flux of sea spray particles, the sea surface temperature impacts both the size of the particles emitted as well as total emitted PM. While uncertain, it is currently believed that the emission rate of smaller particles is favoured at low temperature as opposed to the emission rate of larger particles which is favoured at higher temperatures (Barthel et al., 2019). While the emitted particles are smaller in cold waters the number of emitted particles tend to be higher than in warm waters. Overall, this leads to less PM but higher PN when the sea surface temperature is low as opposed to higher PM but lower PN when the sea surface temperature is high.
The SST278, SST288 and SST293 sensitivity runs demonstrate how the emissions of gases and sea spray PM increases with increasing sea surface temperature. Comparing results from the SST278 and SST293 sensitivity runs, the emission of NH3 increases by a factor of 4.9 while the emissions of DMS increases by 50 %. Sea spray emissions increase as well, reaching a concentration of 9.3 and 15.9 µg m−3 at the end of the simulation in SST278 and SST293, respectively (Fig. S45). The effects of the emission increase across all the mentioned species are twofold. First, the overall production of secondary aerosol PM increases from 1.1 µg m−3 in SST278 to 2.1 µg m−3 in SST293, following the higher emissions of DMS which promotes the production of and MSA PM. Second, the MSA PM ratio increases correspondingly from 2.0 to 3.4 as the production of MSA PM is favoured to the production of PM due to the higher uptake of MSIA to the higher concentration of deliquesced sea spray particles. The uptake of MSIA to said particles constitutes 56 % of the MSIA sink flux in SST278 and 69 % in SST293. The increase in DMS emissions with the increase in SST nevertheless outweighs the increase in the uptake of MSIA to the sea spray particles, ensuring that the SA production in the gas-phase becomes 33 % higher in SST293 compared to SST278 (Fig. S47). The increase in the SA production along with the increase in NH3 emissions also ensures that the maximum nucleation rate on day 3 of the simulation increases with the increase in SST, from 2.0 × 10⁻² cm−3 s−1 in SST278 to 0.8 cm−3 s−1 in SST293 resulting in the total PN concentration being 8.3 times higher in SST293 compared to SST278 (Fig. 3g). In conclusion, higher SST promotes DMS-derived NPF through an increase in the emissions of NH3 and DMS and thus the production of SA. At the same time, said processes are suppressed by the increase in the sea spray PM concentration which promotes the uptake of MSIA and SA to the particle-phase. At the same time, the high concentration of new particles formed in SST293 stagnates the growth of said particles as more SA is needed to grow the particles into the nucleation and Aitken mode. In SST278, where significantly less particles are able to form, the particles are able to grow into larger sizes. As a result, the newly formed particles in SST293 reach a particle mode diameter of 66 nm (25th–75th prct.: 54–80 nm) at the end of the simulation as opposed to 98 nm (25th–75th prct.: 82–116 nm) in SST278 (Fig. 3h). It should be noted that elevated concentrations of DMS and NHx in the surface ocean are generally found at high latitudes in colder waters, whereas middle and low latitudes with warmer waters on average experience lower concentrations (Lana et al., 2011; Hulswar et al., 2022; Paulot et al., 2015).
3.2.5 DMS surface ocean concentration
The concentration of DMS in the surface ocean varies globally in accordance with various physical and chemical ecosystem parameters. These parameters include the availability of nutrients and sunlight that helps to form and sustain the growth of phytoplankton blooms, in addition to variations in temperature, salinity, UV-light intensity, and certain algal and bacterial enzymes that either drive the stress-induced released of DMSP or contribute to the conversion DMSP to DMS (Stefels et al., 2007; Carpenter et al., 2012). In [DMS]5, BaseCase, [DMS]15 and [DMS]20, we demonstrate the impact that low, moderate, and high concentrations of DMS may have on the DMS-derived NPF and growth within the MBL. It should be noted that DMS may reach even higher concentrations in certain regions of the worlds oceans (Lana et al., 2011; Hulswar et al., 2022). The concentrations applied here are nevertheless representative of surface ocean concentrations of DMS in the pristine marine environment during spring and summer in both the northern and southern hemisphere.
Unsurprisingly, higher surface ocean concentrations of DMS leads to higher gas-phase concentrations of DMS and thereby DMS-derived secondary aerosol PM in the MBL. The impact on the chemistry, NPF and particle growth, however, is found to be sub-linear. At a surface ocean concentration of 5 nM, DMS enters the MBL at 0.4 × 10¹⁰ molec. cm−2 s−1 and reaches a gas-phase concentration of 427 ppt at the end of the simulation. At 20 nM, the sea-air flux increases to 1.7 × 10¹⁰ molec. cm−2 s−1 and the concentration reaches 2.1 ppb. The ensuing processing of DMS and its reaction intermediates and products changes in accordance with the availability of oxidant species. The source flux of halogen radicals remains relatively unchanged following the increase in DMS concentrations from [DMS]5 to [DMS]20. The concentrations of OH and O3, however, are found to decrease as the DMS concentration increases (Fig. S53). On the final day of the simulation, the mean OH and O3 concentrations are 24 % and 3 % lower, respectively, in [DMS]20 compared to [DMS]5. As a result, the DMS concentration in the gas-phase stagnates and becomes relatively stable as the simulation progresses in [DMS]5 and BaseCase as opposed to [DMS]15 and [DMS]20 where it accumulates. While the concentration of DMS-derived oxidation products increases in accordance with the increase in DMS emissions, said increase stagnates as the DMS loading becomes higher. For instance, a power law fit for the source flux of SO2, MSA and SA to the sea surface DMS concentration shows a sublinear response for all species, with scaling exponents of 0.81, 0.92, and 0.66, respectively. The incremental increase in the MSA source flux drops disproportionally to the other species as the production of MSA through the H-abstraction from DMS by CH3SO3 increases with the concentration of DMS. Said reaction therefore makes up 7 % of the MSA gas-phase source flux in [DMS]5 as opposed to 25 % in [DMS]20. The increase in MSA happens at the expense of SA production, as CH3SO3 is less likely to undergo thermal decomposition into SO3 and thus SA.
The rate of particle formation on day 3 of the simulation is governed by the production of SA and the uptake of NH3 to the particle phase. As the simulation progresses, the higher DMS loading acidifies the particles (2.1 and 1.2 mean bulk particle-phase pH during days 3–6 in [DMS]5 and [DMS]20, respectively) thereby driving NH3 into the aqueous-phase (Fig. S55). This effect is most pronounced towards the end of the simulation, but even on day 3 the concentration of NH3 is 67 % lower in DMS20 compared to DMS5. The source flux of SA and thus the SA gas-phase concentration, however, continues to increase with higher sea surface concentrations of DMS (Fig. S57). Still, the nucleation rate on day of three of the simulation peaks at 0.15 cm−3 s−1 in [DMS]5 and decreases to 0.10 cm−3 s−1 in [DMS]20. The nucleation rate also impacts the total PN concentration in the Aitken mode, which decreases from [DMS]5 to [DMS]20 (Fig. 3i). As the continued growth of the particles relies mainly on the availability of SA in the gas-phase, the growth rate on day 3 of the simulation peaks in [DMS]20 at 6.2 nm h−1, compared to 2.8 nm h−1 in [DMS]5. The same is true for the particle growth during the remainder of the simulation, where the particles reach a mode diameter of 96 nm (25th–75th prct.: 81–114 nm) in [DMS]20 compared to 56 nm (25th–75th prct.: 46–89 nm) in [DMS]5 (Fig. 3j). In conclusion, natural emissions of DMS during moderate to high sea surface concentrations of DMS are able to form and grow aerosol particles that reach into the upper Aitken and accumulation mode particle size range with the potential to act as CCN in the pristine MBL.
3.2.6 NHx surface ocean concentration
It is well documented that the ocean can constitute a source of NH3 to the atmosphere from dissolved NHx in the surface ocean (Johnson et al., 2008; Paulot et al., 2020). This is particularly true at high latitudes in highly productive regions of the oceans with intense biological recycling of nitrogen. These same regions also experience the highest occurrence of phytoplankton blooms. Once in the atmosphere, NH3 aids the SA-NH3 clustering and therefore constitutes one of the most important precursors that drives NPF in the MBL. In addition, NH3 helps to neutralize the otherwise acidic marine aerosol particles, ensuring that less acidic and more volatile species such as MSIA and MSA are able to partition to and dissociate in the aqueous-phase.
In [NHx]0.1, [NHx]0.2, BaseCase and [NHx]0.4 we perform simulations with low (0.1 mmol m−3), moderate (0.2–0.3 mmol m−3) and high (0.4 mmol m−3) concentrations of dissolved NHx in the surface ocean. Higher concentrations of NHx naturally leads to a higher emissions of NH3, with the NH3 sea-air flux being 3.7 times higher in [NHx]0.4 compared to [NHx]0.1. The increase is sub-linear as the flux is regulated based on the concentration of NH3 in the atmosphere. Once in the air, NH3 helps to increase the pH of the predominantly acidic marine particles from 1.4 in [NHx]0.1 to 1.7 in [NHx]0.4 (Fig. S65). The increase in pH incentivize the uptake and dissociation of semi-volatile and moderately acidic species such as MSIA, which aids the production of MSA in the aqueous-phase. The MSA PM ratio consequently increases from 2.1 in [NHx]0.1 to 2.5 in [NHx]0.4.
The biggest impact from changes in the NHx concentration nevertheless concerns the rate of SA-NH3 driven nucleation. On the third day of the simulation, the gas-phase NH3 concentration in [NHx]0.4 is 7.3 times higher than in [NHx]0.1, which in turn increases the SA–NH3 nucleation rate by a factor of 22.9. As a result, the nucleation rate in [NHx]0.1 is insufficient to initiate a distinct growth event and, consequently, to form and sustain an Aitken mode throughout the simulation (Fig. S64). At a concentration of 0.2 mmol m−3, however, the NH3 gas-phase concentration becomes sufficiently high to allow the particles to form and grow into the Aitken mode. Increasing the NHx concentration further mainly impacts the nucleation rate and thus the PN concentration in the DMS-derived growth mode. Consequently, the total PN concentration increases from 4.1 × 102 cm−3 in [NHx]0.2 to 1.1 × 103 cm−3 in [NHx]0.3 and 1.5 × 103 cm−3 in [NHx]0.4 (Fig. 3k). The mode diameter at the end of the simulation is impacted by the rate of nucleation. As a result, more SA is needed to grow the particles in [NHx]0.4 which stunts their growth compared to the particles in [NHx]0.2. The newly formed particles therefore reach a mode diameter at the end of the simulation of 90 nm (25th–75th prct.: 76–107 nm) in [NHx]0.2 and 67 nm (25th–75th prct.: 56–81 nm) in [NHx]0.4 (Fig. 3l).
3.2.7 Clouds
In the BaseCase model setup, the first 2 d of the simulation includes partial cloud cover during midday and midnight. The following 4 d contain no clouds. In the CLOUD sensitivity run, clouds are introduced at midday and midnight throughout the simulation. As a consequence, the total source flux of CH3SO2, CH3SO3 and SA decreases as the water soluble compounds DMSO, MSIA and SO2 are lost to the aqueous-phase during cloud cover (Figs. S81 and S82). The gas-phase concentration of SO2 is affected in particular by the presence of clouds, as it does not partition readily to the deliquesced particles. Therefore, SO2 becomes insignificant in the production of SA during cloudy conditions compared to the decomposition of CH3SO3 which makes up 97 % of the SA source flux throughout the CLOUD sensitivity run as opposed to 89 % in BaseCase. The combination of the uptake of MSIA and SO2 during the additional cloud-periods lowers the total SA source flux from 4.1 × 103 cm−3s−1 in BaseCase to 1.9 × 103 cm−3s−1 in CLOUD.
The total DMS-derived production of secondary aerosol PM nevertheless increases by 71 % as the SO2 taken up during the cloud periods is transformed efficiently to PM. The impact is evident from the MSA PM ratio which drops from 2.5 to 0.7, almost exclusively driven by the increase in PM as MSA is produced efficiently in the absence of clouds through the uptake and aqueous-phase processing of MSIA in the deliquesced aerosol particles. On day 3 of the simulation, the NPF event initiates in similar fashion to the event in the BaseCase simulation, but looses momentum after the first midday cloud period (Fig. S74). This happens as the uptake of DMSO, MSIA, SO2 and SA to the aqueous-phase in addition to the aqueous-phase processing of DMSO, MSIA and SO2 ensures that the gas-phase concentration of these species must rebuild after each midday cloud period (Fig. S73). The same goes for NH3, which is not able to reach sufficient concentrations in the gas-phase in order to drive additional NPF or neutralize the newly formed particles. As a consequence, additional NPF after the cloud-event on day 3 of the simulation becomes negligible as the SA-concentration in the gas-phase is not sufficient to sustain the growth into the nucleation mode. Therefore, no distinct growth mode forms after the precipitation event in the CLOUD sensitivity run. The overall effect of clouds are therefore to terminate both the formation of DMS-derived particles and their growth into the nucleation and Aitken mode size range.
3.3 Impact of chemistry
Although this study has demonstrated that DMS is able to drive the formation and growth of aerosol particles within the pristine MBL under various meteorological and hydrological conditions, some uncertainty still remains due to the present representation of the DMS oxidation mechanism. Most of this uncertainty lies in the fate of MSIA and its successors CH3SO2 and CH3SO3, due to their role in the production of SA and MSA. CH3SO2 and CH3SO3 are also formed in the DMS abstraction pathway, but since HPMTF and SO2 make up the major products from said pathway the production of CH3SO2 and CH3SO3 remains small. At 283 K, MSIA oxidation by OH makes up 96 % of the CH3SO2 source flux while the isomerization of CH3SOO makes up 4 %. At the low NOx conditions representative of the pristine MBL, CH3SO2 formation through the reaction of CH3SO with NO2 or CH3SOO2 with NO becomes insignificant. The role of MSIA in the production of SA through CH3SO2 and CH3SO3 is evident from the “noMSIAabs” sensitivity run. Here, the source flux of SA decreases by 87 % throughout the simulation, thus decreasing the strength of the NPF event following the precipitation event on day 3 (Figs. 4a and S84). This is caused by SA being formed predominantly through SO2 which is slower than the production of SA through the thermal decomposition of CH3SO3. Consequently, SA is not formed fast enough to initiate a strong NPF and growth event before the concentration of sea spray becomes to high. Some new particles are able to form on days 4–6 of the simulation when the SO2 concentration has had time to accumulate, but the nucleation and growth rate remains limited. The rate of the H-abstraction from MSIA by OH was originally determined experimentally at 298 K by Kukui et al. (2003). In this work, we extend the rate determined by Kukui et al. (2003) with a theoretical temperature dependency based on quantum chemical calculations. Said temperature dependency predicts a slight increase in the rate of H-abstraction at lower temperatures, e.g. 9.0 × 10⁻¹¹ cm3 s−1 at 298 K and 1.2 × 10⁻¹⁰ cm3 s−1 at 273 K. It should be noted that in the simulation the increase in the H-abstraction rate is counterbalanced by the decrease in the OH concentration at lower temperatures.
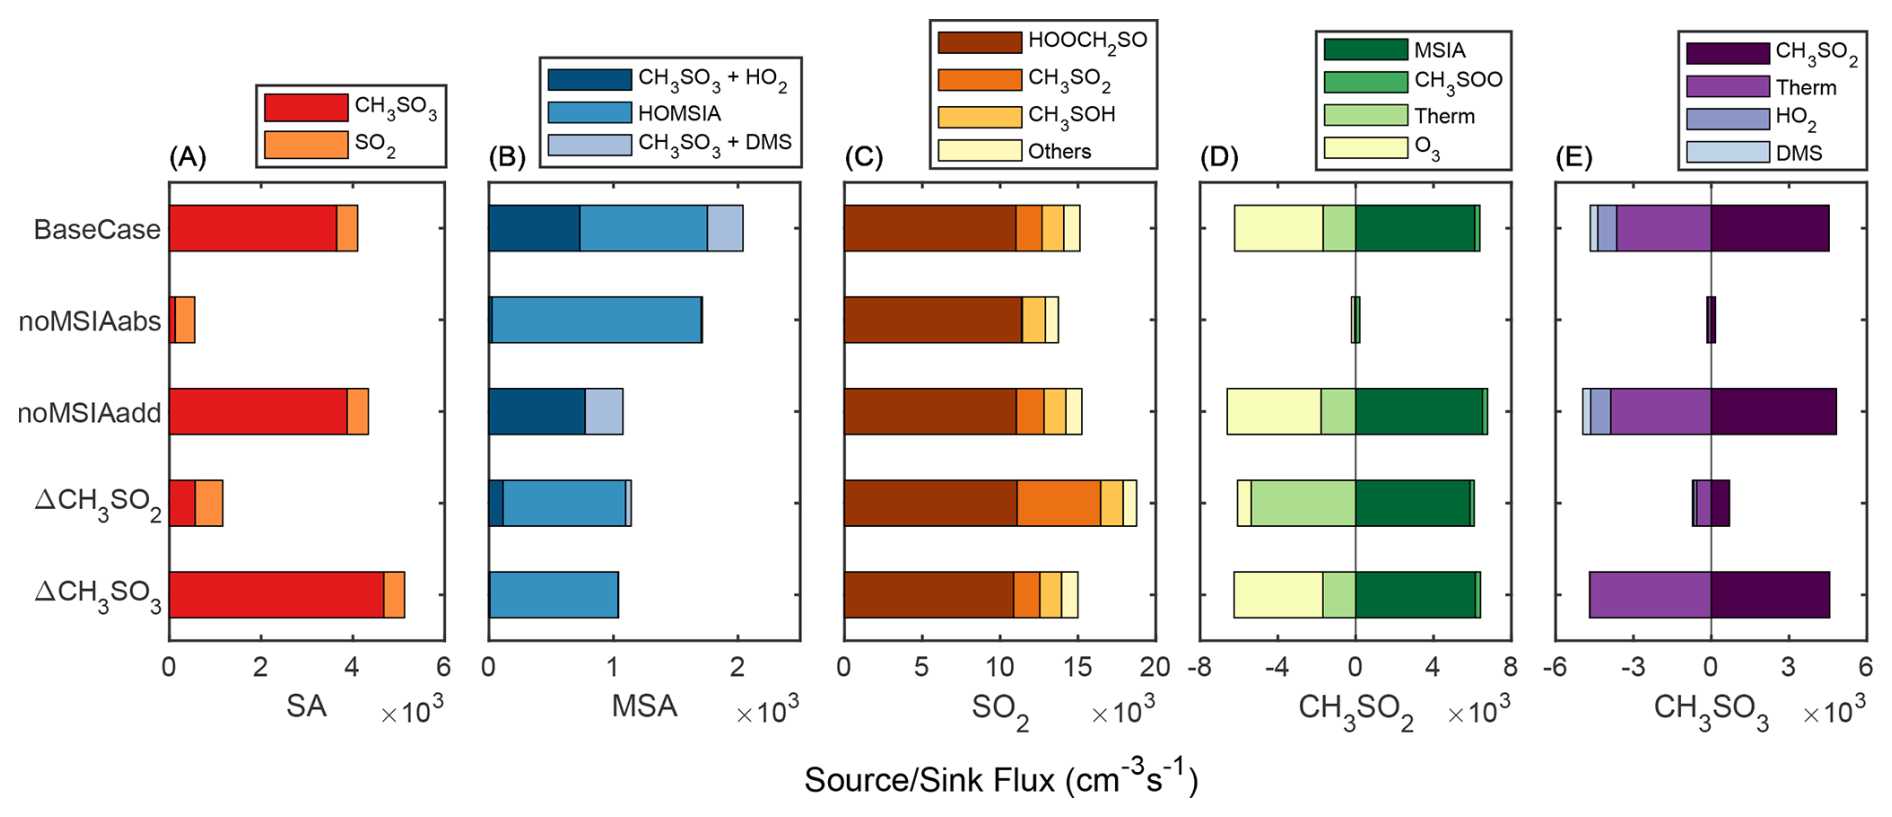
Figure 4Gas-phase sink and/or source fluxes for SA, MSA, SO2, CH3SO2, and CH3SO3. The legend for the source flux refers to the precursor of the compound in question, while for the sink flux it refers to the oxidant or process that reacts with or transforms the compound. “Therm” denotes the thermal decomposition of either CH3SO2 or CH3SO3.
In addition to adding temperature dependency to the rate for H-abstraction from MSIA by OH, this study also presents the temperature dependant reaction rate for the addition of OH to MSIA and subsequent production of MSA through H-abstraction by O2. This pathway has been discussed in previous publications (Lucas and Prinn, 2002; Shen et al., 2022; Ye et al., 2022), but so far no experimental nor theoretical reaction rates have been determined. Here, quantum chemical calculations are used to provide the reaction rate. The noMSIAadd sensitivity run demonstrates the impact of the reaction, which has little influence on the formation and initial growth of the aerosol particles as it does not significantly influence the production of SA. It does however impact the gas-phase production of MSA which decreases by 47 % throughout the simulation (Fig. 4b). As a result, including this reaction pathway might help to improve model representations of MSA in the gas-phase. The HO-MSIA intermediate that forms after the OH-addition to MSIA has also been shown to form H2SO3 (and thus eventually SO2) in other studies by the loss of a methyl group (Lv et al., 2019; Berndt et al., 2024). In accordance with the calculations performed in this study, however, the H-abstraction by O2 forming MSA is considerably faster than the decomposition to H2SO3 (2.4 × 10¹³ and 6.4 × 10¹⁰ s−1 at 283 K and 1 atm, respectively).
Another aspect of the DMS oxidation mechanism that adds uncertainty to the role of DMS in NPF in the MBL is the rate for the thermal decomposition of CH3SO2 and CH3SO3 into SO2 and SO3, respectively. Unfortunately, it is challenging to calculate the transition state for the decomposition of both these species and therefore a theoretical rate has not been determined in this study. Instead we demonstrate the impact that these rates have on DMS-derived NPF in the MBL through sensitivity runs performed with the experimentally determined or estimated rates that are currently available in the literature. In this study we use the rates prescribed by MCMv3.3.1 in the BaseCase setup as they are in line with the experimental rate for the CH3SO2 decomposition obtained by Borissenko et al. (2003) (e.g. < 1 s−1 at 298 K). Higher rates for the decomposition of CH3SO2 have been estimated in the studies by Jacob et al. (2024) (8.3 s−1 at 298 K) and Berndt et al. (2023) (20 s−1). As for the decomposition of CH3SO3, Cao et al. (2013) calculated an upper limit of 12.7 s−1 at 298 K while an estimate based on experimental results by Berndt et al. (2023) falls in line with the rate presented in MCMv3.3.1 (0.1 s−1 at 298 K).
In the ΔCH3SO2 sensitivity run, the rate for the thermal decomposition of CH3SO2 was increased in accordance with the rate estimated by Jacob et al. (2024). This increase favours the production of SO2, the source flux of which increases by 24 % throughout the simulation at the expense of CH3SO3 and thus SA, the source flux of which decreases by 72 % (Fig. 4c and a). The decrease in SA lowers the nucleation rate on day 3 from 0.13 to 8.7 × 10⁻² cm−3 s−1 and causes the particles to reach a mode diameter of 52 nm (25th–75th prct.: 41–65 nm) at the end of the simulation compared to 73 nm (25th–75th prct.: 60–88 nm) in BaseCase. Due to the decrease in the CH3SO3 concentration, SO2 becomes more important for the production of SA making up 52 % of the SA source flux as opposed to 11 % in the BaseCase simulation. The conversion of SO2 to SO3 and thus SA nevertheless remains slow, meaning that new particles are not able to form efficiently before the concentration of sea spray particles and thus the SA condensation sink becomes to high (Fig. S84). Using the rate by Jacob et al. (2024) also impacts the source flux of MSA in the gas-phase which decreases by 44 % as a result of the decrease in the CH3SO3 concentration. As a consequence, MSA production through OH addition to MSIA becomes the dominating source of MSA in the gas-phase comprising 86 % of the MSA gas-phase source flux compared to 50 % in the BaseCase simulation. In summary, a higher rate for the thermal decomposition of CH3SO2 would make DMS-driven NPF in the MBL less favourable as the direct production of SA is suppressed.
A higher rate for the thermal decomposition of CH3SO3, however, is seen to have the opposite effect. Increasing said rate favours the production of SO3 and SA as opposed to MSA. This is evident from the ΔCH3SO3 sensitivity run where the rate for the thermal decomposition of ΔCH3SO3 was increased in accordance with the study by Cao et al. (2013). As a consequence, the total SA source flux showed a 25 % increase compared to the BaseCase run at the expense of the MSA source flux in the gas-phase which decreases by 49 %. Said decrease originates from the reaction of CH3SO3 with HO2 and DMS, respectively, which make up ∼ 1 % of the MSA source in the ΔCH3SO3 sensitivity run. Consequently, MSA production through OH addition to MSIA as proposed in this study becomes the almost exclusive source of MSA in the gas phase. The impact of the increase in the SA source flux from the increase in the thermal decomposition of CH3SO3 is evident from the SA-NH3 derived nucleation rate. On day 3 of the simulation, the nucleation rate increases by 19 %, ultimately increasing the total PN concentration at the end of the simulation from 1.1 × 103 cm−3 in BaseCase to 1.2 × 103 cm−3 in ΔCH3SO3. The increase in the PN concentration counterbalances the increase in the growth for the individual aerosol particles as more SA is needed to grow the newly formed particles into the nucleation and Aitken mode size range. As a result, the mode diameter of the growth mode at the end of simulation is lower at 68 nm (25th–75th prct.: 57–82 nm) in ΔCH3SO3 compared to 73 nm (25th–75th prct.: 60–88 nm) in BaseCase, despite the increase in the SA source flux.
The rate calculated by Cao et al. (2013) nevertheless remains uncertain. In the review article by Barnes et al. (2006), it is mentioned that the rate for the thermal decomposition of CH3SO3 should be similar or much lower than the one by CH3SO2. This is supported by a recent experimental study by Berndt et al. (2023), where they estimate said rate to be similar to the one presented in the MCMv3.3.1. It remains evident however that the rate for the thermal decomposition of both CH3SO2 and CH3SO3 has an impact on the formation and growth of DMS-derived aerosol particles in the MBL. At the moment, any claim that these rates should be higher than those presented in the MCMv3.3.1 are based on estimates and theoretical calculations. It remains essential therefore that the thermal decomposition of both CH3SO2 and CH3SO3 are examined further in laboratory studies so as to decrease the uncertainty linked to their role in the formation and growth of aerosol particles from DMS.
Advanced simulations of atmospheric chemistry and aerosol dynamics in a pristine ocean scenario shows that natural emissions of DMS and NH3 are able to drive SA-NH3-derived NPF within the MBL, the particles of which are able to grow into the upper Aitken and accumulation mode size range with the potential to act as CCN. The formation and growth of said particles is favoured during cloud-free conditions following an event of moderate to heavy precipitation. Precipitation effectively lowers the concentrations of sea spray aerosol PM in the MBL, allowing SA to reach concentrations where they are able to cluster with NH3 and grow into the nucleation and Aitken mode size range.
The formation and growth of the particles are impacted by various meteorological and hydrological conditions. Low temperatures favour SA-NH3 NPF by preventing cluster evaporation, but at the same impair NPF and growth as they promote the uptake of MSIA to the sea spray particles which lowers the production of SA. High temperatures, on the other hand, prevent NPF and growth by favouring the DMS abstraction pathway over the addition pathway. Moreover, the thermal decomposition of CH3SO2 into CH3OO and SO2 reduces the production of CH3SO3, thereby lowering the formation of SA. This leads to optimal DMS-derived particle growth at moderate temperatures (283–288 K). Varying wind-speed conditions produce similar results: low wind speeds limit NPF and growth due to reduced emissions of DMS and NH3, whereas high wind speeds constrain particle growth by increasing the sea spray PM, which enhances the uptake of MSIA and SA to the particle phase. Consequently, DMS-derived particles in the MBL grow most efficiently at moderate wind-speeds around 4–6 m s−1. Sensitivity runs utilizing different rates of precipitation demonstrates that DMS and NH3 are able to drive NPF and growth in the MBL, even during conditions with a moderate rainfall (2.5–5.0 mm h−1). At 10 mm h−1 and beyond, the far majority (> 98 %) of sea spray aerosol PM has been removed, providing optimal conditions for NPF and growth. Increasing the SST promotes the ocean-air flux of DMS and NH3, which in turn favours the formation and growth of DMS-derived aerosol particles despite the increase in sea-spray PM. For the surface ocean concentrations of DMS, the SA production and subsequent aerosol particle growth shows a sub-linear response to an increase in concentration due to the impact of DMS on the concentration of O3 and OH. The acidification of the particles with higher emissions of DMS also limits the NH3 concentrations in the gas-phase, ultimately lowering the rate of nucleation. For the sea surface concentration of NHx, 0.2 mmol m−3 was sufficient to initiate and sustain a DMS-derived growth event, with higher concentrations promoting the rate of SA-NH3 nucleation and neutralization of the aerosol particles. If sporadic cloud cover is introduced in the model following the precipitation event, NPF is terminated and the particles are not able to form a distinct growth event.
The degree to which DMS is able to form and sustain the growth of new particles within the MBL also depends heavily on the representation of the DMS oxidation mechanism. MSIA is found to be one of the key components in this process, as it governs the direct production of SA through the formation of CH3SO2 and CH3SO3. Omitting the H-abstraction from MSIA by OH from the model decreases the SA production to a point where NPF is heavily limited and the particles that do form are unlikely to reach the Aitken mode. Omitting the addition of OH to MSIA (as presented in this study) does not impact NPF significantly. It does, however, decrease the production of MSA in the gas-phase substantially. The spread in the rate for the thermal decomposition of CH3SO2 and CH3SO3 as presented in the literature proves to be a big source of uncertainty in the direct production of SA and thus DMS-derived NPF and growth. High estimates for promotes SO2 production at the expense of CH3SO3, slowing down the formation of SA and thus limiting NPF and growth. High estimates for , on the other hand, promotes direct SA production and thus NPF. Future work, therefore, should focus on improving the rate coefficients for these reactions.
Based on the results presented in this work, we also encourage the atmospheric modelling community (especially those working with global climate models) to consider more detailed DMS chemistry when attempting to reproduce the formation and growth of aerosol particles in the marine atmosphere. In particular, this concerns the gas-phase production of the reaction intermediates DMSO, MSIA, and HPMTF, their uptake to the aqueous phase, and the direct production of H2SO4 from the CH3SO3 intermediate. All these processes are essential to the production of DMS-derived SA in the marine atmosphere and therefore have a significant impact on both NPF and particle growth over the ocean. As observations of NPF over the oceans remain scarce, we also encourage the scientific community to expand measurement efforts in the marine environment. As demonstrated in this study, DMS-driven NPF in the MBL takes place under specific conditions, and while NPF has been observed in flight and ship campaigns (Baccarini et al., 2021; Zheng et al., 2021), long-term measurements over the pristine ocean would increase the likelihood of meeting these conditions and thereby capturing such events. Locations such as the Faroe Islands may comply with these requirements, as the islands are surrounded by high concentrations of surface ocean DMS during spring and summer and are subject to significant variations in cloud cover, precipitation, and wind speeds. At the same time, research groups conducting measurements in open-ocean or coastal environments should seek to collaborate with modellers capable of reproducing the emissions, chemistry, and aerosol processes in the air masses that affect the measurements made at research stations and during campaigns. Such efforts may help to determine the source of NPF in the marine environment and quantify the extent to which natural emissions of DMS and NH3 impact NPF and ultimately CCN concentrations in the MBL.
All source codes, including plotting programs and the ADCHAM model version used to perform the simulations presented in this study, can be obtained by contacting the corresponding author Robin Wollesen de Jonge. The full multiphase DMS oxidation mechanism presented in Tables S1 and S2 can be downloaded from an open archive provided by the data publisher Zenodo (https://doi.org/10.5281/zenodo.21913874, Roldin and Wollesen de Jonge, 2026) in a format compatible with the Kinetic PreProcessor (KPP) (Damian et al., 2002). This archive also contains all the data presented in the paper.
The supplement related to this article is available online at https://doi.org/10.5194/acp-26-12865-2026-supplement.
R.W.d.J. designed and planned the study, performed the ADCHAM simulations, interpreted and visualized the results, and wrote the paper. P.R. and R.W.d.J. developed the ADCHAM model. Z.F. performed the quantum chemical calculations. M.B. supervised the project.
The contact author has declared that none of the authors has any competing interests.
Publisher's note: Copernicus Publications remains neutral with regard to jurisdictional claims made in the text, published maps, institutional affiliations, or any other geographical representation in this paper. The authors bear the ultimate responsibility for providing appropriate place names. Views expressed in the text are those of the authors and do not necessarily reflect the views of the publisher.
R.W.d.J. would like to thank the Carlsberg Foundation (project no. CF24-1915) for funding this research. Partially, funding was also provided by the AoF project ACCC, “The Atmosphere and Climate Competence Center”, under grant agreement no. 337549. The model work was supported by the Swedish strategic research area: ModElling the Regional and Global Earth system (MERGE) and the Lund University Faculty of Engineering Profile Area: AEROSOLS. Z.F. thanks the National Natural Science Foundation of China (project no. 22306002).
This research has been supported by the Carlsberg Foundation (grant no. CF24-1915), the AoF project ACCC (“The Atmosphere and Climate Competence Center”, grant no. 337549), and the Data Center of Management Science, National Natural Science Foundation of China – Peking University (grant no. 22306002).
Open-access funding was provided by the Helsinki University Library.
This paper was edited by Anoop Mahajan and reviewed by three anonymous referees.
Adler, T., Knizia, G., and Werner, H.-J.: A simple and efficient CCSD(T)-F12 approximation, J. Chem. Phys., 127, 221106, https://doi.org/10.1063/1.2817618, 2008. a
Baccarini, A., Karlsson, L., Dommen, J., Duplessis, P., Vüllers, J., Brooks, I., Alfonso, S.-L., Salter, M., Tjernström, M., Baltensperger, U., Zieger, P., and Schmale, J.: Frequent new particle formation over the high Arctic pack ice by enhanced iodine emissions, Nat. Commun., 11, https://doi.org/10.1038/s41467-020-18551-0, 2020. a
Baccarini, A., Dommen, J., Lehtipalo, K., Henning, S., Modini, R., Gysel, M., Baltensperger, U., and Schmale, J.: Low‐Volatility Vapors and New Particle Formation Over the Southern Ocean During the Antarctic Circumnavigation Expedition, J. Geophys. Res.-Atmos., 126, https://doi.org/10.1029/2021JD035126, 2021. a, b
Barnes, I., Hjorth, J., and Mihalopoulos, N.: Dimethyl Sulfide and Dimethyl Sulfoxide and Their Oxidation in the Atmosphere, Chem. Rev., 106, 940–975, https://doi.org/10.1021/cr020529+, 2006. a, b
Barthel, S., Tegen, I., and Wolke, R.: Do new sea spray aerosol source functions improve the results of a regional aerosol model?, Atmos. Environ., 198, 265–278, https://doi.org/10.1016/j.atmosenv.2018.10.016, 2019. a
Bates, T., Lamb, B., Guenther, A., Dignon, J., and Stoiber, R.: Sulfur Emissions to the Atmosphere from Natural Sources, J. Atmos. Chem., 14, 315–337, https://doi.org/10.1007/BF00115242, 1992. a
Beck, L., Sarnela, N., Junninen, H., Hoppe, C., Garmash, O., Bianchi, F., Riva, M., Rose, C., Peräkylä, O., Wimmer, D., Kausiala, O., Jokinen, T., Ahonen, L., Mikkilä, J., Hakala, J., He, X.-C., Kontkanen, J., Wolf, K., Cappelletti, D., and Sipilä, M.: Differing Mechanisms of New Particle Formation at Two Arctic Sites, Geophys. Res. Lett., 48, https://doi.org/10.1029/2020GL091334, 2021. a
Berndt, T., Scholz, W., Mentler, B., Fischer, L., Hoffmann, E., Tilgner, A., Hyttinen, N., Prisle, N. L., Hansel, A., and Herrmann, H.: Fast Peroxy Radical Isomerization and OH Recycling in the Reaction of OH Radicals with Dimethyl Sulfide, J. Phys. Chem. Lett., 2019, https://doi.org/10.1021/acs.jpclett.9b02567, 2019. a, b, c, d
Berndt, T., Hoffmann, E., Tilgner, A., Stratmann, F., and Herrmann, H.: Direct sulfuric acid formation from the gas-phase oxidation of reduced-sulfur compounds, Nat. Commun., 14, https://doi.org/10.1038/s41467-023-40586-2, 2023. a, b, c, d
Berndt, T., Hoffmann, E. H., Tilgner, A., and Herrmann, H.: Gas-Phase Formation of Sulfurous Acid (H2SO3) in the Atmosphere, Angew. Chem. Int. Edit., 63, e202405572, https://doi.org/10.1002/anie.202405572, 2024. a
Besel, V., Kubecka, J., Kurtén, T., and Vehkamäki, H.: Impact of Quantum Chemistry Parameter Choices and Cluster Distribution Model Settings on Modeled Atmospheric Particle Formation Rates, J. Phys. Chem. A, https://doi.org/10.1021/acs.jpca.0c03984, 2020. a
Blomquist, B. W., Brumer, S. E., Fairall, C. W., Huebert, B. J., Zappa, C. J., Brooks, I. M., Yang, M., Bariteau, L., Prytherch, J., Hare, J. E., Czerski, H., Matei, A., and Pascal, R. W.: Wind Speed and Sea State Dependencies of Air-Sea Gas Transfer: Results From the High Wind Speed Gas Exchange Study (HiWinGS), J. Geophys. Res.-Oceans, 122, 8034–8062, https://doi.org/10.1002/2017JC013181, 2017. a, b, c
Borissenko, D., Kukui, A., Laverdet, G., and Le Bras, G.: Experimental Study of SO2 Formation in the Reactions of CH3SO Radical with NO2 and O3 in Relation with the Atmospheric Oxidation Mechanism of Dimethyl Sulfide, J. Phys. Chem. A, 107, 1155–1161, https://doi.org/10.1021/jp021701g, 2003. a
Braeuer, P., Tilgner, A., Wolke, R., and Herrmann, H.: Mechanism development and modelling of tropospheric multiphase halogen chemistry: The CAPRAM Halogen Module 2.0 (HM2), J. Atmos. Chem., 70, 19–52, https://doi.org/10.1007/s10874-013-9249-6, 2013. a, b
Brean, J., Dall´osto, M., Simó, R., Shi, Z., Beddows, D., and Harrison, R.: Open ocean and coastal new particle formation from sulfuric acid and amines around the Antarctic Peninsula, Nat. Geosci., 14, https://doi.org/10.1038/s41561-021-00751-y, 2021. a, b
Burkart, J., Hodshire, A. L., Mungall, E. L., Pierce, J. R., Collins, D. B., Ladino, L. A., Lee, A. K. Y., Irish, V., Wentzell, J. J. B., Liggio, J., Papakyriakou, T., Murphy, J., and Abbatt, J.: Organic Condensation and Particle Growth to CCN Sizes in the Summertime Marine Arctic Is Driven by Materials More Semivolatile Than at Continental Sites, Geophys. Res. Lett., 44, 10725–10734, https://doi.org/10.1002/2017GL075671, 2017a. a
Burkart, J., Willis, M. D., Bozem, H., Thomas, J. L., Law, K., Hoor, P., Aliabadi, A. A., Köllner, F., Schneider, J., Herber, A., Abbatt, J. P. D., and Leaitch, W. R.: Summertime observations of elevated levels of ultrafine particles in the high Arctic marine boundary layer, Atmos. Chem. Phys., 17, 5515–5535, https://doi.org/10.5194/acp-17-5515-2017, 2017b. a
Canneaux, S., Bohr, F., and Henon, E.: KiSThelP: a program to predict thermodynamic properties and rate constants from quantum chemistry results, J. Comput. Chem., 35, 82–93, 2014. a
Cao, J., Wang, W.-L., Gao, L.-J., and Fu, F.: Mechanism and Thermodynamic Properties of CH3SO3 Decomposition, Acta Phys.-Chim. Sin., 29, https://doi.org/10.3866/PKU.WHXB201304021, 2013. a, b, c, d, e, f, g
Carpenter, L., Archer, S., and Beale, R.: Ocean-atmosphere trace gas exchange, Chem. Soc. Rev., 41, 6473–506, https://doi.org/10.1039/c2cs35121h, 2012. a, b
Charlson, R. J., Lovelock, J. E., Andreae, M. O., and Warren, S. G.: Oceanic phytoplankton, atmospheric sulphur, cloud albedo and climate, Nature, 326, 655–661, https://doi.org/10.1038/326655a0, 1987. a, b
Chen, J., Lane, J., Bates, K., and Kjaergaard, H.: Atmospheric Gas-Phase Formation of Methanesulfonic Acid, Environ. Sci. Technol., 57, https://doi.org/10.1021/acs.est.3c07120, 2023. a
Collins, D. B., Burkart, J., Chang, R. Y.-W., Lizotte, M., Boivin-Rioux, A., Blais, M., Mungall, E. L., Boyer, M., Irish, V. E., Massé, G., Kunkel, D., Tremblay, J.-É., Papakyriakou, T., Bertram, A. K., Bozem, H., Gosselin, M., Levasseur, M., and Abbatt, J. P. D.: Frequent ultrafine particle formation and growth in Canadian Arctic marine and coastal environments, Atmos. Chem. Phys., 17, 13119–13138, https://doi.org/10.5194/acp-17-13119-2017, 2017. a
Dall'Osto, M., Geels, C., Beddows, D. C. S., Boertmann, D., Lange, R., Nøjgaard, J. K., Harrison, R. M., Simo, R., Skov, H., and Massling, A.: Regions of open water and melting sea ice drive new particle formation in North East Greenland, Sci. Rep., 8, 6109, https://doi.org/10.1038/s41598-018-24426-8, 2018. a
D'Ambro, E., Hyttinen, N., Møller, K., Iyer, S., Otkjær, R., Bell, D., Liu, J., Lopez-Hilfiker, F., Schobesberger, S., Shilling, J., Zelenyuk, A., Kjaergaard, H., Thornton, J., and Kurtén, T.: Pathways to Highly Oxidized Products in the Δ3-Carene + OH System, Environ. Sci. Technol., 56, https://doi.org/10.1021/acs.est.1c06949, 2022. a
Damian, V., Sandu, A., Damian, M., Potra, F., and Carmichael, G. R.: The kinetic preprocessor KPP-a software environment for solving chemical kinetics, Comput. Chem. Eng., 26, 1567–1579, https://doi.org/10.1016/S0098-1354(02)00128-X, 2002. a
Dassault Systèmes: BIOVIA COSMOtherm, Release 2021, Dassault Systèmes, http://www.3ds.com (last access: 26 February 2024), 2021. a
Eckart, C.: The penetration of a potential barrier by electrons, Phys. Rev., 35, 1303–1309, 1930. a
Elm, J., Kubečka, J., Besel, V., Jääskeläinen, M. J., Halonen, R., Kurtén, T., and Vehkamäki, H.: Modeling the formation and growth of atmospheric molecular clusters: A review, J. Aerosol Sci., 149, 105621, https://doi.org/10.1016/j.jaerosci.2020.105621, 2020. a
Frisch, M. J., Trucks, G. W., Schlegel, H. B., Scuseria, G. E., Robb, M. A., Cheeseman, J. R., Scalmani, G., Barone, V., Petersson, G. A., Nakatsuji, H., Li, X., Caricato, M., Marenich, A. V., Bloino, J., Janesko, B. G., Gomperts, R., Mennucci, B., Hratchian, H. P., Ortiz, J. V., Izmaylov, A. F., Sonnenberg, J. L., Williams-Young, D., Ding, F., Lipparini, F., Egidi, F., Goings, J., Peng, B., Petrone, A., Henderson, T., Ranasinghe, D., Zakrzewski, V. G., Gao, J., Rega, N., Zheng, G., Liang, W., Hada, M., Ehara, M., Toyota, K., Fukuda, R., Hasegawa, J., Ishida, M., Nakajima, T., Honda, Y., Kitao, O., Nakai, H., Vreven, T., Throssell, K., Montgomery, J. A. J., Peralta, J. E., Ogliaro, F., Bearpark, M. J., Heyd, J. J., Brothers, E. N., Kudin, K. N., Staroverov, V. N., Keith, T. A., Kobayashi, R., Normand, J., Raghavachari, K., Rendell, A. P., Burant, J. C., Iyengar, S. S., Tomasi, J., Cossi, M., Millam, J. M., Klene, M., Adamo, C., Cammi, R., Ochterski, J. W., Martin, R. L., Morokuma, K., Farkas, O., Foresman, J. B., and Fox, D. J.: Gaussian 16, Revision B.01, Gaussian, Inc., Wallingford CT, https://gaussian.com/gaussian16/ (last access: 2 February 2026), 2016. a
Fu, Z., Xie, H. B., Elm, J., Liu, Y., Fu, Z., and Chen, J.: Atmospheric autoxidation of organophosphate esters, Environ. Sci. Technol., 56, 6944–6955, 2022. a
Fu, Z., Guo, S., Xie, H.-B., Zhou, P., Boy, M., Yao, M., and Hu, M.: A Near-Explicit Reaction Mechanism of Chlorine-Initiated Limonene: Implications for Health Risks Associated with the Concurrent Use of Cleaning Agents and Disinfectants, Environ. Sci. Technol., 58, 19762–19773, 2024a. a
Fu, Z., Guo, S., Yu, Y., Xie, H.-B., Li, S., Lv, D., Zhou, P., Song, K., Chen, Z., Tan, R., Hu, K., Shen, R., Yao, M., and Hu, M.: Oxidation Mechanism and Toxicity Evolution of Linalool, a Typical Indoor Volatile Chemical Product, Environ. Health, 2, 486–498, 2024b. a
Hoffmann, E. H., Tilgner, A., Schrödner, R., Bräuer, P., Wolke, R., and Herrmann, H.: An advanced modeling study on the impacts and atmospheric implications of multiphase dimethyl sulfide chemistry, P. Natl. Acad. Sci. USA, 113, 11776–11781, https://doi.org/10.1073/pnas.1606320113, 2016. a, b, c, d, e, f
Hulswar, S., Simó, R., Galí, M., Bell, T. G., Lana, A., Inamdar, S., Halloran, P. R., Manville, G., and Mahajan, A. S.: Third revision of the global surface seawater dimethyl sulfide climatology (DMS-Rev3), Earth Syst. Sci. Data, 14, 2963–2987, https://doi.org/10.5194/essd-14-2963-2022, 2022. a, b, c, d, e
Jacob, L. S. D., Giorio, C., and Archibald, A. T.: Extension, development, and evaluation of the representation of the OH-initiated dimethyl sulfide (DMS) oxidation mechanism in the Master Chemical Mechanism (MCM) v3.3.1 framework, Atmos. Chem. Phys., 24, 3329–3347, https://doi.org/10.5194/acp-24-3329-2024, 2024. a, b, c, d, e, f, g, h
Jacobson, M. Z.: Fundamentals of Atmospheric Modeling, Cambridge University Press, 2nd edn., https://doi.org/10.1017/CBO9781139165389, 2005. a, b
Jenkin, M. E., Saunders, S. M., and Pilling, M. J.: The tropospheric degradation of volatile organic compounds: a protocol for mechanism development, Atmos. Environ., 31, 81–104, https://doi.org/10.1016/S1352-2310(96)00105-7, 1997. a
Jenkin, M. E., Saunders, S. M., Wagner, V., and Pilling, M. J.: Protocol for the development of the Master Chemical Mechanism, MCM v3 (Part B): tropospheric degradation of aromatic volatile organic compounds, Atmos. Chem. Phys., 3, 181–193, https://doi.org/10.5194/acp-3-181-2003, 2003. a
Jernigan, C. M., Rivard, M. J., Berkelhammer, M. B., and Bertram, T. H.: Sulfate and Carbonyl Sulfide Production in Aqueous Reactions of Hydroperoxymethyl Thioformate, ACS ES&T Air, 1, 397–404, https://doi.org/10.1021/acsestair.3c00098, 2024. a
Johnson, M. T., Liss, P. S., Bell, T. G., Lesworth, T. J., Baker, A. R., Hind, A. J., Jickells, T. D., Biswas, K. F., Woodward, E. M. S., and Gibb, S. W.: Field observations of the ocean-atmosphere exchange of ammonia: Fundamental importance of temperature as revealed by a comparison of high and low latitudes, Global Biogeochem. Cy., 22, https://doi.org/10.1029/2007GB003039, 2008. a
Jokinen, T., Sipilä, M., Kontkanen, J., Vakkari, V., Tisler, P., Duplissy (née Kyrö), E.-M., Junninen, H., Kangasluoma, J., Manninen, H., Petäjä, T., Kulmala, M., Worsnop, D., Kirkby, J., Virkkula, A., and Kerminen, V.-M.: Ion-induced sulfuric acid–ammonia nucleation drives particle formation in coastal Antarctica, Sci. Adv., 4, eaat9744, https://doi.org/10.1126/sciadv.aat9744, 2018. a
Kilgour, D. B., Jernigan, C. M., Garmash, O., Aggarwal, S., Zhou, S., Mohr, C., Salter, M. E., Thornton, J. A., Wang, J., Zieger, P., and Bertram, T. H.: Cloud processing of dimethyl sulfide (DMS) oxidation products limits sulfur dioxide (SO2) and carbonyl sulfide (OCS) production in the eastern North Atlantic marine boundary layer, Atmos. Chem. Phys., 25, 1931–1947, https://doi.org/10.5194/acp-25-1931-2025, 2025. a
Kirkby, J., Curtius, J., Almeida, J., Dunne, E., Duplissy, J., Ehrhart, S., Franchin, A., Gagné, S., Ickes, L., Kürten, A., Kupc, A., Metzger, A., Riccobono, F., Rondo, L., Schobesberger, S., Tsagkogeorgas, G., Wimmer, D., Amorim, A., Bianchi, F., and Kulmala, M.: Role of sulphuric acid, ammonia and galactic cosmic rays in atmospheric aerosol nucleation, Nature, 476, 429–33, https://doi.org/10.1038/nature10343, 2011. a
Korhonen, P., Kulmala, M., Laaksonen, A., Viisanen, Y., McGraw, R., and Seinfeld, J. H.: Ternary nucleation of H2SO4, NH3, and H2O in the atmosphere, J. Geophys. Res.-Atmos., 104, 26349–26353, https://doi.org/10.1029/1999JD900784, 1999. a
Kukui, A., Borissenko, D., Laverdet, G., and Bras, G.: Gas-Phase Reactions of OH Radicals with Dimethyl Sulfoxide and Methane Sulfinic Acid Using Turbulent Flow Reactor and Chemical Ionization Mass Spectrometry, J. Phys. Chem. A, 107, https://doi.org/10.1021/jp0276911, 2003. a, b, c, d
Kulmala, M., Kontkanen, J., Junninen, H., Lehtipalo, K., Manninen, H. E., Nieminen, T., Petäjä, T., Sipilä, M., Schobesberger, S., Rantala, P., Franchin, A., Jokinen, T., Järvinen, E., Äijälä, M., Kangasluoma, J., Hakala, J., Aalto, P. P., Paasonen, P., Mikkilä, J., Vanhanen, J., Aalto, J., Hakola, H., Makkonen, U., Ruuskanen, T., Mauldin, R. L., Duplissy, J., Vehkamäki, H., Bäck, J., Kortelainen, A., Riipinen, I., Kurtén, T., Johnston, M. V., Smith, J. N., Ehn, M., Mentel, T. F., Lehtinen, K. E. J., Laaksonen, A., Kerminen, V.-M., and Worsnop, D. R.: Direct Observations of Atmospheric Aerosol Nucleation, Science, 339, 943–946, https://doi.org/10.1126/science.1227385, 2013. a
Laakso, L., Grönholm, T., Üllar Rannik, Kosmale, M., Fiedler, V., Vehkamäki, H., and Kulmala, M.: Ultrafine particle scavenging coefficients calculated from 6 years field measurements, Atmos. Environ., 37, 3605–3613, https://doi.org/10.1016/S1352-2310(03)00326-1, 2003. a
Lana, A., Bell, T. G., Simó, R., Vallina, S. M., Ballabrera-Poy, J., Kettle, A. J., Dachs, J., Bopp, L., Saltzman, E. S., Stefels, J., Johnson, J. E., and Liss, P. S.: An updated climatology of surface dimethlysulfide concentrations and emission fluxes in the global ocean, Global Biogeochem. Cy., 25, https://doi.org/10.1029/2010GB003850, 2011. a, b, c, d, e
Lawson, S. J., Law, C. S., Harvey, M. J., Bell, T. G., Walker, C. F., de Bruyn, W. J., and Saltzman, E. S.: Methanethiol, dimethyl sulfide and acetone over biologically productive waters in the southwest Pacific Ocean, Atmos. Chem. Phys., 20, 3061–3078, https://doi.org/10.5194/acp-20-3061-2020, 2020. a
Liss, P. S. and Merlivat, L.: Air-Sea Gas Exchange Rates: Introduction and Synthesis, Springer Netherlands, Dordrecht, 113–127, ISBN 978-94-009-4738-2, https://doi.org/10.1007/978-94-009-4738-2_5, 1986. a, b, c
Lovelock, J. E., Maggs, R. J., and Rasmussen, R. A.: Atmospheric Dimethyl Sulfide and the Natural Sulfur Cycle, Nature, 237, 452–453, 1972. a
Lucas, D. D. and Prinn, R. G.: Mechanistic studies of dimethylsulfide oxidation products using an observationally constrained model, J. Geophys. Res.-Atmos., 107, ACH 12-1–ACH 12-26, https://doi.org/10.1029/2001JD000843, 2002. a, b, c
Lv, G., Zhang, C., and Sun, X.: Understanding the oxidation mechanism of methanesulfinic acid by ozone in the atmosphere, Sci. Rep., 9, 322, https://doi.org/10.1038/s41598-018-36405-0, 2019. a, b
Marandino, C., Bruyn, W., Miller, S., and Saltzman, E.: Dms Air/Sea Flux and Gas Transfer Coefficients From the North Atlantic Summertime Coccolithophore Bloom, Geophys. Res. Lett., 35, https://doi.org/10.1029/2008GL036370, 2008. a
McGrath, M. J., Olenius, T., Ortega, I. K., Loukonen, V., Paasonen, P., Kurtén, T., Kulmala, M., and Vehkamäki, H.: Atmospheric Cluster Dynamics Code: a flexible method for solution of the birth-death equations, Atmos. Chem. Phys., 12, 2345–2355, https://doi.org/10.5194/acp-12-2345-2012, 2012. a
Merikanto, J., Spracklen, D. V., Mann, G. W., Pickering, S. J., and Carslaw, K. S.: Impact of nucleation on global CCN, Atmos. Chem. Phys., 9, 8601–8616, https://doi.org/10.5194/acp-9-8601-2009, 2009. a
Møller, K. H., Bates, K. H., and Kjaergaard, H. G.: The Importance of Peroxy Radical Hydrogen-Shift Reactions in Atmospheric Isoprene Oxidation, J. Phys. Chem. A, 123, 920–932, https://doi.org/10.1021/acs.jpca.8b10432, 2019. a
Nightingale, P. D., Malin, G., Law, C. S., Watson, A. J., Liss, P. S., Liddicoat, M. I., Boutin, J., and Upstill-Goddard, R. C.: In situ evaluation of air-sea gas exchange parameterizations using novel conservative and volatile tracers, Global Biogeochem. Cy., 14, 373–387, https://doi.org/10.1029/1999GB900091, 2000. a, b, c
Novak, G., Fite, C. H., Holmes, C., Veres, P., Neuman, J., Faloona, I., Thornton, J., Wolfe, G., Vermeuel, M., Jernigan, C., Peischl, J., Ryerson, T., Thompson, C., Bourgeois, I., warneke, C., Gkatzelis, G., Coggon, M., Sekimoto, K., Bui, T., and Bertram, T.: Rapid cloud removal of dimethyl sulfide oxidation products limits SO 2 and cloud condensation nuclei production in the marine atmosphere, P. Natl. Acad. Sci. USA, 118, e2110472118, https://doi.org/10.1073/pnas.2110472118, 2021. a
Novak, G. A., Kilgour, D. B., Jernigan, C. M., Vermeuel, M. P., and Bertram, T. H.: Oceanic emissions of dimethyl sulfide and methanethiol and their contribution to sulfur dioxide production in the marine atmosphere, Atmos. Chem. Phys., 22, 6309–6325, https://doi.org/10.5194/acp-22-6309-2022, 2022. a
Olenius, T., Kupiainen-Määttä, O., Ortega, I., Kurtén, T., and Vehkamäki, H.: Free energy barrier in the growth of sulfuric acid-ammonia and sulfuric acid-dimethylamine clusters, J. Chem. Phys., 139, 084312, https://doi.org/10.1063/1.4819024, 2013. a
Paulot, F., Jacob, D. J., Johnson, M. T., Bell, T. G., Baker, A. R., Keene, W. C., Lima, I. D., Doney, S. C., and Stock, C. A.: Global oceanic emission of ammonia: Constraints from seawater and atmospheric observations, Global Biogeochem. Cy., 29, 1165–1178, https://doi.org/10.1002/2015GB005106, 2015. a
Paulot, F., Stock, C., John, J. G., Zadeh, N., and Horowitz, L. W.: Ocean Ammonia Outgassing: Modulation by CO and Anthropogenic Nitrogen Deposition, J. Adv. Model. Earth Sy., 12, e2019MS002026, https://doi.org/10.1029/2019MS002026, 2020. a, b, c, d
Pirjola, L., O'Dowd, C. D., Brooks, I. M., and Kulmala, M.: Can new particle formation occur in the clean marine boundary layer?, J. Geophys. Res.-Atmos., 105, 26531–26546, https://doi.org/10.1029/2000JD900310, 2000. a
Quinn, P. K. and Bates, T. S.: The case against climate regulation via oceanic phytoplankton sulphur emissions, Nature, 480, 51–56, https://doi.org/10.1038/nature10580, 2011. a
Roldin, P. and Wollesen de Jonge, R.: DMS mechanism and model results, Zenodo [data set], https://doi.org/10.5281/zenodo.21913874, 2026. a
Roldin, P., Eriksson, A. C., Nordin, E. Z., Hermansson, E., Mogensen, D., Rusanen, A., Boy, M., Swietlicki, E., Svenningsson, B., Zelenyuk, A., and Pagels, J.: Modelling non-equilibrium secondary organic aerosol formation and evaporation with the aerosol dynamics, gas- and particle-phase chemistry kinetic multilayer model ADCHAM, Atmos. Chem. Phys., 14, 7953–7993, https://doi.org/10.5194/acp-14-7953-2014, 2014. a
Rosati, B., Christiansen, S., Wollesen de Jonge, R., Roldin, P., Jensen, M. M., Wang, K., Moosakutty, S. P., Thomsen, D., Salomonsen, C., Hyttinen, N., Elm, J., Feilberg, A., Glasius, M., and Bilde, M.: New Particle Formation and Growth from Dimethyl Sulfide Oxidation by Hydroxyl Radicals, ACS Earth Space Chem., 5, 801–811, https://doi.org/10.1021/acsearthspacechem.0c00333, 2021. a
Rosenfeld, D., Zhu, Y., Wang, M., Zheng, Y., Goren, T., and Yu, S.: Aerosol-driven droplet concentrations dominate coverage and water of oceanic low-level clouds, Science, 363, eaav0566, https://doi.org/10.1126/science.aav0566, 2019. a
Salter, M. E., Zieger, P., Acosta Navarro, J. C., Grythe, H., Kirkevåg, A., Rosati, B., Riipinen, I., and Nilsson, E. D.: An empirically derived inorganic sea spray source function incorporating sea surface temperature, Atmos. Chem. Phys., 15, 11047–11066, https://doi.org/10.5194/acp-15-11047-2015, 2015. a, b
Schmitz, G. and Elm, J.: Assessment of the DLPNO Binding Energies of Strongly Noncovalent Bonded Atmospheric Molecular Clusters, ACS Omega, 5, 7601–7612, https://doi.org/10.1021/acsomega.0c00436, 2020. a
Shen, J., Scholz, W., He, X.-C., Zhou, P., Marie, G., Wang, M., Marten, R., Surdu, M., Rörup, B., Baalbaki, R., Amorim, A., Ataei, F., Bell, D. M., Bertozzi, B., Brasseur, Z., Caudillo, L., Chen, D., Chu, B., Dada, L., Duplissy, J., Finkenzeller, H., Granzin, M., Guida, R., Heinritzi, M., Hofbauer, V., Iyer, S., Kemppainen, D., Kong, W., Krechmer, J. E., Kürten, A., Lamkaddam, H., Lee, C. P., Lopez, B., Mahfouz, N. G. A., Manninen, H. E., Massabò, D., Mauldin, R. L., Mentler, B., Müller, T., Pfeifer, J., Philippov, M., Piedehierro, A. A., Roldin, P., Schobesberger, S., Simon, M., Stolzenburg, D., Tham, Y. J., Tomé, A., Umo, N. S., Wang, D., Wang, Y., Weber, S. K., Welti, A., Wollesen de Jonge, R., Wu, Y., Zauner-Wieczorek, M., Zust, F., Baltensperger, U., Curtius, J., Flagan, R. C., Hansel, A., Möhler, O., Petäjä, T., Volkamer, R., Kulmala, M., Lehtipalo, K., Rissanen, M., Kirkby, J., El-Haddad, I., Bianchi, F., Sipilä, M., Donahue, N. M., and Worsnop, D. R.: High Gas-Phase Methanesulfonic Acid Production in the OH-Initiated Oxidation of Dimethyl Sulfide at Low Temperatures, Environ. Sci. Technol., 56, 13931–13944, https://doi.org/10.1021/acs.est.2c05154, 2022. a, b, c, d
Slinn, S. and Slinn, W.: Predictions for particle deposition on natural waters, Atmos. Environ.), 14, 1013–1016, https://doi.org/10.1016/0004-6981(80)90032-3, 1980. a
Sofiev, M., Soares, J., Prank, M., de Leeuw, G., and Kukkonen, J.: A regional-to-global model of emission and transport of sea salt particles in the atmosphere, J. Geophys. Res.-Atmos., 116, 21302, https://doi.org/10.1029/2010JD014713, 2011. a
Stefels, J., Steinke, M., Turner, S., Malin, G., and Belviso, S.: Environmental constraints on the production and removal of the climatically active gas dimethylsulphide (DMS) and implications for ecosystem modelling, Phaeocystis, Major Link in the Biogeochemical Cycling of Climate-Relevant Elements, 245–275, https://doi.org/10.1007/978-1-4020-6214-8_18, 2007. a
Turnipseed, A. A., Barone, S. B., Jensen, N. R., Hanson, D. R., Howard, C. J., and Ravishankara, A. R.: Kinetics of the Reactions of CF3O Radicals with CO and H2O, J. Phys. Chem., 99, 6000–6009, https://doi.org/10.1021/j100016a041, 1995. a
Veres, P. R., Neuman, J. A., Bertram, T. H., Assaf, E., Wolfe, G. M., Williamson, C. J., Weinzierl, B., Tilmes, S., Thompson, C. R., Thames, A. B., Schroder, J. C., Saiz-Lopez, A., Rollins, A. W., Roberts, J. M., Price, D., Peischl, J., Nault, B. A., Møller, K. H., Miller, D. O., Meinardi, S., Li, Q., Lamarque, J.-F., Kupc, A., Kjaergaard, H. G., Kinnison, D., Jimenez, J. L., Jernigan, C. M., Hornbrook, R. S., Hills, A., Dollner, M., Day, D. A., Cuevas, C. A., Campuzano-Jost, P., Burkholder, J., Bui, T. P., Brune, W. H., Brown, S. S., Brock, C. A., Bourgeois, I., Blake, D. R., Apel, E. C., and Ryerson, T. B.: Global airborne sampling reveals a previously unobserved dimethyl sulfide oxidation mechanism in the marine atmosphere, P. Natl. Acad. Sci. USA, 117, 4505–4510, https://doi.org/10.1073/pnas.1919344117, 2020. a, b, c, d
Wang, S., Newland, M., Deng, W., Rickard, A., Hamilton, J., Muñoz, A., Ródenas, M., Vázquez, M., Wang, L., and Wang, X.: Aromatic Photooxidation, A New Source of Atmospheric Acidity, Environ. Sci. Technol., https://doi.org/10.1021/acs.est.0c00526, 2020. a
Wanninkhof, R.: Relationship between wind speed and gas exchange over the ocean revisited, Limnol. Oceanogr.-Meth., 12, 351–362, https://doi.org/10.4319/lom.2014.12.351, 2014. a, b
Wentworth, G. R., Murphy, J. G., Croft, B., Martin, R. V., Pierce, J. R., Côté, J.-S., Courchesne, I., Tremblay, J.-É., Gagnon, J., Thomas, J. L., Sharma, S., Toom-Sauntry, D., Chivulescu, A., Levasseur, M., and Abbatt, J. P. D.: Ammonia in the summertime Arctic marine boundary layer: sources, sinks, and implications, Atmos. Chem. Phys., 16, 1937–1953, https://doi.org/10.5194/acp-16-1937-2016, 2016. a, b
Werner, H.-J., Knowles, P. J., Manby, F. R., Black, J. A., Doll, K., Hesselmann, A., Kats, D., Kohn, A., Korona, T., Kreplin, D. A., Ma, Q., Miller, T. F. I., Mitrushchenkov, A., Peterson, K. A., Polyak, I., Rauhut, G., and Sibaev, M.: The Molpro quantum chemistry package, J. Chem. Phys., 152, 144107, https://doi.org/10.1063/5.0005081, 2020. a
Williamson, C. J., Kupc, A., Axisa, D., Bilsback, K. R., Bui, T., Campuzano-Jost, P., Dollner, M., Froyd, K. D., Hodshire, A. L., Jimenez, J. L., Kodros, J. K., Luo, G., Murphy, D. M., Nault, B. A., Ray, E. A., Weinzierl, B., Wilson, J. C., Yu, F., Yu, P., Pierce, J. R., and Brock, C. A.: A large source of cloud condensation nuclei from new particle formation in the tropics, Nature, 574, 399–403, https://doi.org/10.1038/s41586-019-1638-9, 2019. a
Willis, M. D., Burkart, J., Thomas, J. L., Köllner, F., Schneider, J., Bozem, H., Hoor, P. M., Aliabadi, A. A., Schulz, H., Herber, A. B., Leaitch, W. R., and Abbatt, J. P. D.: Growth of nucleation mode particles in the summertime Arctic: a case study, Atmos. Chem. Phys., 16, 7663–7679, https://doi.org/10.5194/acp-16-7663-2016, 2016. a
Wollesen de Jonge, R., Elm, J., Rosati, B., Christiansen, S., Hyttinen, N., Lüdemann, D., Bilde, M., and Roldin, P.: Secondary aerosol formation from dimethyl sulfide – improved mechanistic understanding based on smog chamber experiments and modelling, Atmos. Chem. Phys., 21, 9955–9976, https://doi.org/10.5194/acp-21-9955-2021, 2021. a, b, c, d, e
Wollesen de Jonge, R., Xavier, C., Olenius, T., Elm, J., Svenhag, C., Hyttinen, N., Nieradzik, L., Sarnela, N., Kristensson, A., Petäjä, T., Ehn, M., and Roldin, P.: Natural Marine Precursors Boost Continental New Particle Formation and Production of Cloud Condensation Nuclei, Environ. Sci. Technol., 58, 10956–10968, https://doi.org/10.1021/acs.est.4c01891, 2024. a, b
Wu, R., Wang, S., and Wang, L.: A New Mechanism for The Atmospheric Oxidation of Dimethyl Sulfide. The Importance of Intramolecular Hydrogen Shift in CH3SCH2OO Radical, J. Phys. Chem. A, 119, https://doi.org/10.1021/jp511616j, 2014. a, b, c
Ye, Q., Goss, M. B., Krechmer, J. E., Majluf, F., Zaytsev, A., Li, Y., Roscioli, J. R., Canagaratna, M., Keutsch, F. N., Heald, C. L., and Kroll, J. H.: Product distribution, kinetics, and aerosol formation from the OH oxidation of dimethyl sulfide under different RO2 regimes, Atmos. Chem. Phys., 22, 16003–16015, https://doi.org/10.5194/acp-22-16003-2022, 2022. a, b, c, d, e, f, g, h
Yin, F., Grosjean, D., Flagan, R. C., and Seinfeld, J. H.: Photooxidation of dimethyl sulfide and dimethyl disulfide. II: Mechanism evaluation, J. Atmos. Chem., 11, 365–399, https://doi.org/10.1007/BF00053781, 1990. a
Zhao, Y. and Truhlar, D.: The M06 suite of density functionals for main group thermochemistry, thermochemical kinetics, noncovalent interactions, excited states, and transition elements: two new functionals and systematic testing of four M06 functionals and 12 other functionals, Theor. Chem. Acc., 120, 215–241, https://doi.org/10.1007/s00214-007-0310-x, 2008. a
Zheng, G., Wang, Y., Wood, R., Jensen, M. P., Kuang, C., McCoy, I. L., Matthews, A., Mei, F., Tomlinson, J. M., Shilling, J. E., Zawadowicz, M. A., Crosbie, E., Moore, R., Ziemba, L., Andreae, M. O., and Wang, J.: New particle formation in the remote marine boundary layer, Nat. Commun., 12, 527, https://doi.org/10.1038/s41467-020-20773-1, 2021. a, b, c
Ziska, F., Quack, B., Abrahamsson, K., Archer, S. D., Atlas, E., Bell, T., Butler, J. H., Carpenter, L. J., Jones, C. E., Harris, N. R. P., Hepach, H., Heumann, K. G., Hughes, C., Kuss, J., Krüger, K., Liss, P., Moore, R. M., Orlikowska, A., Raimund, S., Reeves, C. E., Reifenhäuser, W., Robinson, A. D., Schall, C., Tanhua, T., Tegtmeier, S., Turner, S., Wang, L., Wallace, D., Williams, J., Yamamoto, H., Yvon-Lewis, S., and Yokouchi, Y.: Global sea-to-air flux climatology for bromoform, dibromomethane and methyl iodide, Atmos. Chem. Phys., 13, 8915–8934, https://doi.org/10.5194/acp-13-8915-2013, 2013. a