
the Creative Commons Attribution 4.0 License.
the Creative Commons Attribution 4.0 License.
 | 09 Sep 2026
Numerical study of a Saharan dust plume impact on radiation, urban climate and thermal comfort in the Paris region during an heatwave event

Tim Nagel
Valéry Masson
Aude Lemonsu
Jean Wurtz
Pierre Tulet
Quentin Rodier
In Europe, heatwave conditions associated with southern synoptic flows can sometimes be combined with episodes of dust plumes coming from the Saharan desert. Change in the atmospheric composition of aerosols alters the radiation observed near the ground, resulting in impacts on other variables such as air temperature. This study focuses on the heatwave experienced by the Paris region from 15 to 19 June 2022, combined with the passage of a Saharan dust plume. To investigate the aerosols impact on local weather conditions and thermal comfort, three Meso-NH atmospheric numerical simulations are used: one without dust aerosol (C0), one with dust aerosols defined from CAMS reanalysis (C1), and one with twice the concentration of CAMS dust aerosols (C2). Simulation C1 is validated against observations from the PANAME-Urban experimental campaign. The time evolution of Aerosol Optical Depth and incoming solar radiation at the surface is well reproduced, with improvement in the resulting air temperature and boundary layer height when taking aerosols into consideration. The radiative effect of dust aerosols results in a decrease in incoming solar radiation and air temperature of up to 75 W m−2 and 1 °C, respectively. At 16:00 UTC, it results in a thermal comfort improvement of up to 1 °C in sunny urban and suburban areas. However, in shaded suburban areas, the increase in diffuse solar radiation and humidity and the decrease in wind speed induced by the dust aerosols counterbalance the air temperature decrease, resulting in no thermal comfort improvement. This result highlights the need to integrate these insights into operational heat-health warning systems – by coupling aerosol forecasts with bioclimatic indices.
- Article
(9153 KB) - Full-text XML
- BibTeX
- EndNote


The frequency, intensity and duration of heatwave events are increasing over time and is expected to continue to increase due to climate change (IPCC, 2021). Urban citizens, representing most of the world population, are facing even warmer events due to the urban local climate (Oke et al., 2017). The so-called Urban Heat Island (UHI), defined as the difference in air temperature between the city and its surroundings, can reach values up to 10 °C for large cities like Paris (Haeffelin et al., 2024) and is expected to rise with rising air temperature (Fujibe, 2011). UHI is generally more pronounced at night but other variables are locally altered by urban settings. The mean radiant temperature, aggregating the radiant exchange with a human and its environment, is generally lower when the built areas is getting denser due to shadow generated by buildings (Lau et al., 2022). However, densely built areas are subject to lower wind speed due to the additional surface roughness created by the buildings (Macdonald, 2000). In addition to these locally urban factors, urban climate, as well as thermal comfort within cities, can be modulated by atmospheric aerosols. For example, Han et al. (2020) have shown that summer UHI in China is reduced due to higher aerosol concentrations in urban compared to rural areas.
One of the mechanisms by which aerosols affect the atmosphere is through their interaction with radiation. Depending on their optical and microphysical properties, aerosols can scatter and absorb solar and long-wave radiation, thereby altering the surface and atmospheric energy budget. The type and the location of the aerosols are crucial. While the effect of some aerosols (such as sulfate or nitrate) is mainly limited to solar radiation diffusion, some others (black carbon, for example) can also absorb the solar radiation and convert it into heat (Liu et al., 2019). Mineral dusts have a dual behavior by scattering solar radiation, but also absorbing both solar and long-wave radiation depending on their size, shape, and mineralogical composition (Schepanski, 2018). The distribution of absorbing aerosols is particularly important: heating near the surface can enhance entrainment in the planetary boundary layer (PBL), whereas heating aloft tends to stabilize the atmosphere by strengthening the inversion layer (Wang et al., 2022). Thus, through their effect on radiation and near-surface air temperature, aerosols also exert strong control on turbulence, PBL dynamics, and wind fields. Reduced surface heating weakens turbulent mixing, leading to a shallower boundary layer and lower wind speeds. For example, Péré et al. (2011) reported reductions in PBL height of 200 m (10 %) and wind speed decreases of 1.2 m s−2 (6 %) in response to aerosol–radiation interactions. Observations by Park et al. (2010) further support this, showing wind speed reductions up to 20 % when surface solar flux was suppressed by 200 W m−2 due to Asian dust layers.
Anthropogenic aerosols are among the largest sources of uncertainty in radiative forcing (Stocker et al., 2013). Mitigation policies have already demonstrated a reduction of the aerosols concentration (Hodnebrog et al., 2024)and as more stringent measures are implemented to improve air quality, aerosol emissions are likely to continue decreasing worldwide during the 21st century. Zhao et al. (2019) investigated the effect of projected aerosol decrease on the worldwide increase of intensity, frequency, and duration of heatwaves. Their results show that future greenhouse gases increase will result in heatwaves by 2081–2100 that are, when globally averaged over land, significantly more intense (+2.4 °C on average air temperature), longer (+17 d) and more frequent (+12 heatwave days per year), compared to present‐day conditions. These changes will also be further aggravated by aerosol reductions, leading to an increase of the mean intensity, length and frequency of heatwaves by 0.6 °C, 7 d, and 2 more days per year, respectively. This highlights the need to better understand the role of aerosols in modulating heatwave conditions, particularly in urban environments.
Natural aerosols – and dust in particular – originate from surface processes and can be transported over intercontinental distances, influencing atmospheric chemistry, radiation, and cloud microphysics (Schepanski, 2018). Their impacts are particularly relevant during large-scale dust outbreaks, which strongly modify surface and boundary layer conditions. The use of an aerosol climatology for global models based on the tropospheric aerosol scheme shows an effect of up to 30 W m−2 over desert, partly compensated by the increase of long-wave radiations (about 10 W m−2, Wang et al., 2022). Observational studies of a Saharan dust outbreak over Barcelona (Spain) confirm this level of magnitude: in June, Córdoba-Jabonero et al. (2021) documented a decrease in net solar radiation of 54 W m−2 and an increase in net long-wave radiation of 11 W m−2 when the aerosol optical depth (AOD) reached 0.45 at 532 nm. Similarly, Bangert et al. (2012) reported that accounting for dust–radiation interactions in a simulation of a late-May Saharan dust event over southwest Germany reduced net solar radiation by up to 80 W m−2 (AOD of 0.36), with corresponding near-surface air temperature decreases of up to 1 °C across several regions of their domain. They further concluded that the positive bias commonly found in numerical weather forecasts during this dust event could be largely attributed to the absence of aerosol–radiation interactions in the forecast simulations. Although values may slightly differ, other studies report similar conclusions: during the 2003 European heatwave, characterized by AOD values between 0.4 and 0.6, numerical experiments with the Weather Research and Forecasting Model (WRF, Skamarock et al., 2005) indicated that aerosols reduced net solar radiation by 30–50 W m−2, corresponding to a 15 % reduction in solar flux (Péré et al., 2011). This decrease in surface energy led to air temperature reductions of up to 0.3 °C, consistent with the work from (Zhang et al., 2010) over the continental U.S. Closer to the dust emission source, impacts can be considerably larger: during a dust storm in West Africa, where the dust was distributed over the boundary layer, the reduction in the near-surface air temperature reached 4 °C (Tulet et al., 2008).
Despite a quite dense scientific literature showing the impact of aerosols on near-surface atmospheric variables, significant gaps remain regarding their effects on urban climate and human thermal comfort. Most of the simulations are performed at coarse resolution (12 to 36 km – Bernstein et al., 2013 and Péré et al., 2011, respectively) and very few are dedicated to explore the effect on urban climate, more specifically on human thermal comfort. Slater et al. (2020) have simulated the effect of urban haze on solar radiation and boundary layer meteorology but did not analyse their results in the context of thermal comfort. Han et al. (2020) and Cao et al. (2016) explored the aerosol effect on the UHI intensity but focused mainly on night-time conditions and did not consider key thermal comfort variables such as mean radiant temperature. Conversely, Wai et al. (2017) investigated the role of aerosols on the mean radiant temperature for a person located in the middle of a building block street but did not account for the effect of the aerosols on air temperature, wind speed or relative humidity, and restricted their analysis to a sun-exposed pedestrian at noon. Yet during heat events, pedestrians are more willing to stay in shaded areas. – spaces that, while generally cooler (Masson et al., 2020), may themselves be affected by aerosol–radiation interactions.
To fill these gaps, this study investigates how aerosol concentration can impact thermal comfort in urban areas during an extreme event: the July 2022 heatwave in the Paris region, which coincided with an inter-continental Saharan dust outbreak. We use an atmospheric model coupled with an urban surface model at a resolution of 1.2 km, allowing us to explicitly resolve urban heterogeneities and assess the combined effects of aerosols on air temperature, wind speed, radiation, and mean radiant temperature across different urban morphologies.
2.1 Meteorological overview
The present study focuses on the heatwave that struck the Paris region from 15 to 19 June 2022. The associated synoptic conditions, based on the ERA5 reanalysis (Hersbach et al., 2023), are presented in Fig. 1. The air temperature at 850 hPa in the Paris region gradually warmed to 20 °C from 15 to 18 June under the influence of a 500 hPa cut-off located west of Portugal and advecting hot air from Northern Africa and the Iberian Peninsula toward France. In addition, a high geopotential at 500 hPa developed over France, causing air subsidence, which further increased the near-surface air temperature. The 850 hPa air temperature rose until 18 June, which was classified as a notable heat peak day by Météo-France and the national Public Health Agency (Lemonsu et al., 2026). This heatwave ended on the night from 18 to 19 June, as the low-pressure system moved northeastward, bringing cooler oceanic air over France and leading to heavy rainfall and air temperature drop over the Paris region.
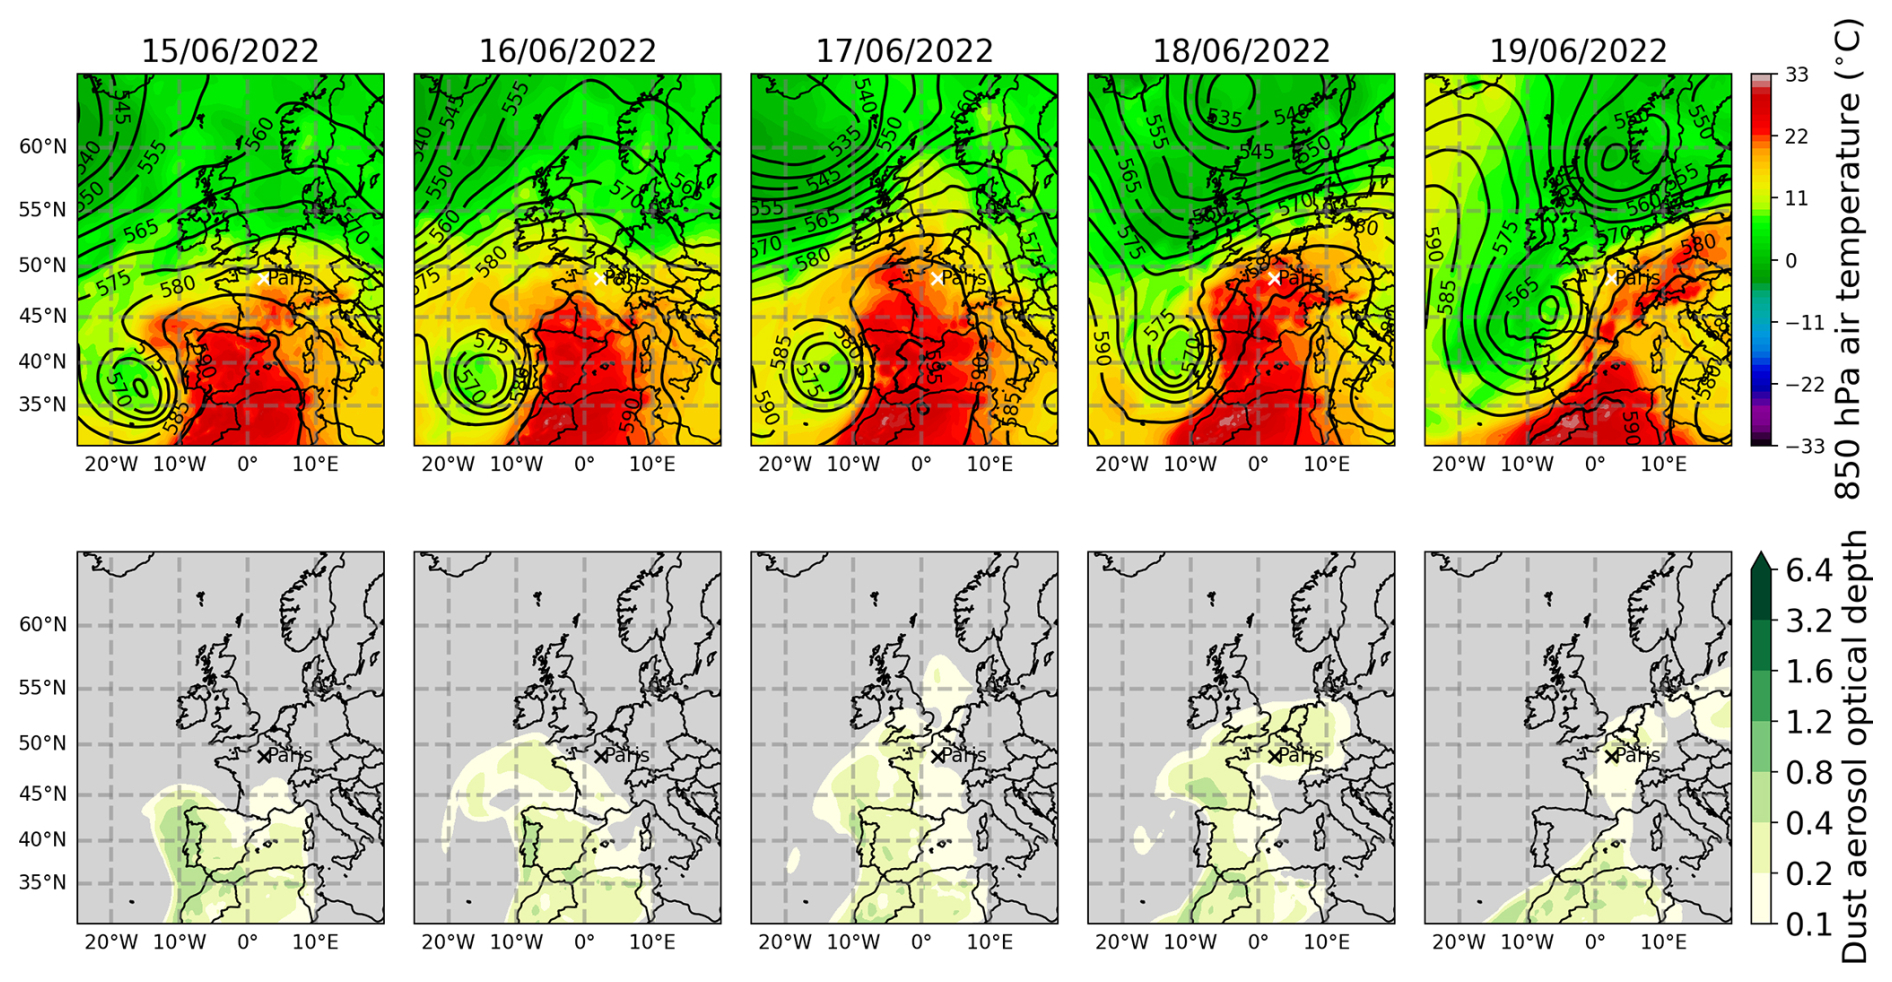
Figure 1Top panel: synoptic overview at 12:00 UTC (14:00 LT in Paris) from 15 to 19 June 2022 based on ERA5 reanalysis (Hersbach et al., 2023). The colors and the contours represent the air temperature at 850 hPa and the 500 hPa geopotential height, respectively. Bottom panel: Dust aerosol optical depth (550 nm) every day at noon from 15 to 19 June 2022 based on CAMS-IFS (Rémy et al., 2022).
During this heatwave, the strong southerly flow caused a significant transport of Saharan dust that affected a large part of France, including the Paris region. The time series of dust AOD maps at 550 nm, based on the Copernicus Atmosphere Monitoring Service Integrated Forecasting System (CAMS-IFS, Rémy et al., 2022) (Fig. 1), shows that the dust plume reached the Paris region in the afternoon of 16 June and left from 19 June, as the low-pressure system moved northeastward. Note that the vertical profiles of aerosol backscatter coefficients from ground-based remote sensing measurements obtained during the PAris region urbaN Atmospheric observations and models for Multidisciplinary rEsearch (PANAME-Urban Lemonsu et al., 2026) experimental campaign show that before 17 June, the dust aerosols were in the troposphere (not shown), so interactions with aerosols in the boundary layer was not possible before this date.
The dust AOD from CAMS-IFS, whose reanalysis (Inness et al., 2019) serves as input for this study, is compared with the total AOD measured by ground-based sun photometer located in Palaiseau at the SIRTA (Site Instrumental de Recherche par Télédetection Atmosphérique Haeffelin et al., 2005) observatory (∼20 km southwest of Paris) and with the dust AOD multimodel forecasts (minimum, maximum and median (called MULTI-MODEL, Basart et al., 2019), based on 16-model ensemble) provided by the Barcelona dust regional center platform (Fig. 2). For the period considered, CAMS-IFS is quite close to the median value simulated by the models. The observations of total AOD show a shift toward higher AOD values by about 0.1 compared to models, which is particularly visible on the first two days. This offset is due to the model AOD limited to dust particles. Nevertheless, and despite a large spread of the ensemble, the temporal evolution of the AOD from 16 to 18 June is well represented by the models, with an increase in AOD during the night from 16 to 17 June, a slight decrease on 17 June, and peak values reached during the next night and day. However, there is a large variability in terms of AOD intensity, the simulated dust AOD on 18 June ranging between 0.1 and up to 0.5. The variability of the AOD values between the data source can be partly attributed to their quite large spatial resolution difference, from 0.2° for min and max models, to 0.75° for CAMS-IFS.
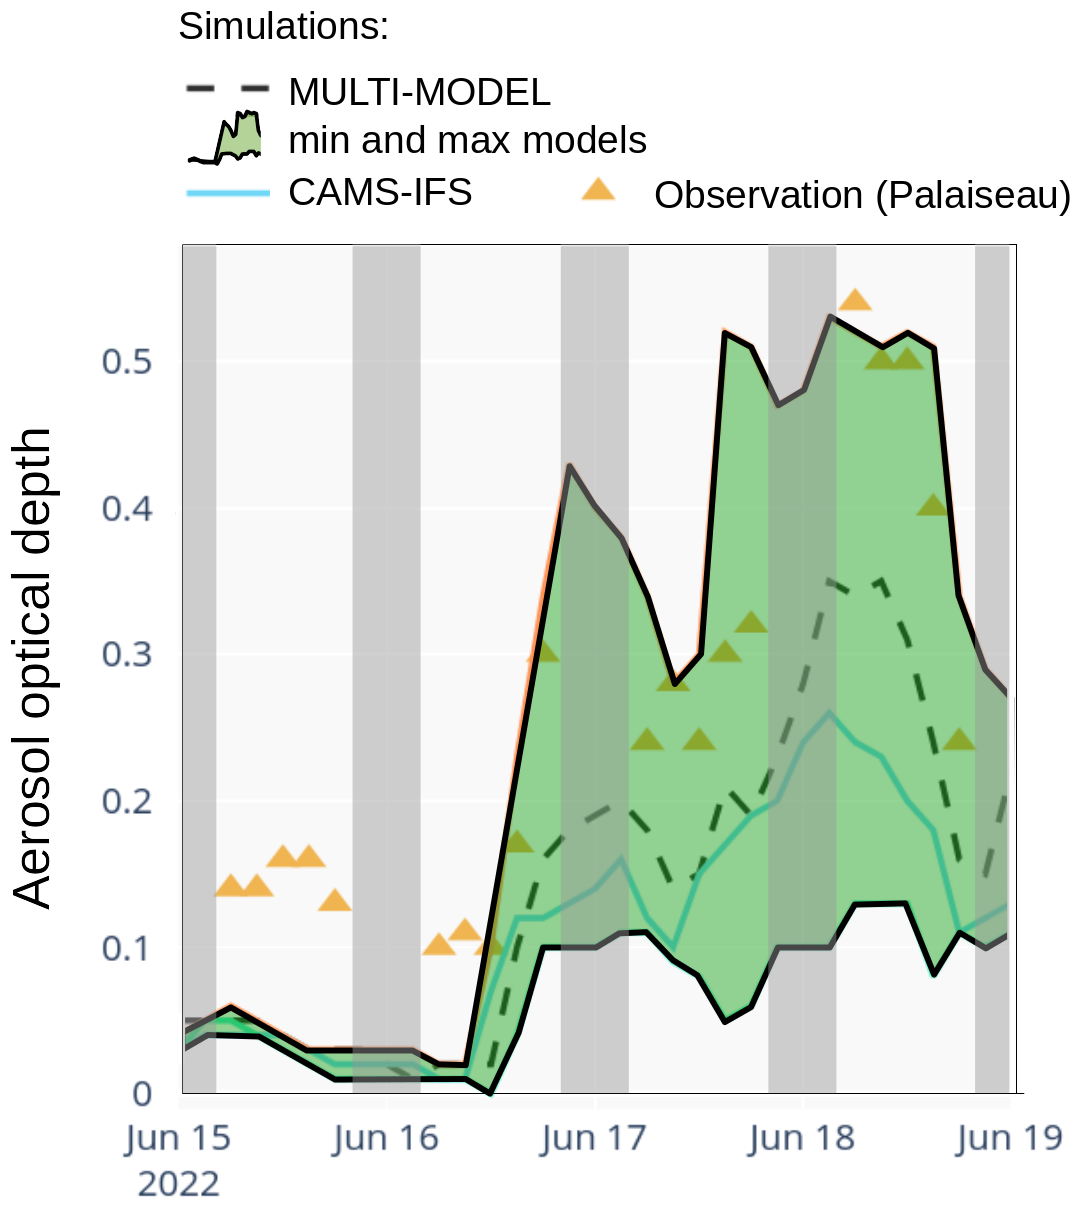
Figure 2Aerosol optical depth at 550 nm from 15 to 19 June 2022. The observation is the total aerosol optical depth at the Palaiseau station while the model data only represents the effect of the dust aerosols. The min, max and MULTI-MODEL models illustrate the variability and the median dust AOD values of the 16 models proposed on the Barcelona Dust Regional Center platform. The figure is adapted from data and images provided by the WMO Barcelona Dust Regional Center and the partners of the Sand and Dust Storm Warning Advisory and Assessment System (SDS-WAS) for Northern Africa, the Middle East and Europe. Here and for the other figures in the manuscript, the shaded gray time period correspond to nighttime.
2.2 Model description
2.2.1 Atmospheric model
In this study, the non-hydrostatic research atmospheric model Meso-NH (Lac et al., 2018) is coupled with the SURFace Externalised land surface modeling system (SURFEX, Masson et al., 2013). For the wind advection, a third-order weight essentially non-oscillatory scheme (WENO3) is used and combined with a five-stage third-order Runge-Kutta time-splitting scheme (Lunet et al., 2017). The atmospheric turbulence scheme, based on a prognostic equation for the turbulent kinetic energy (Cuxart et al., 2000), only accounts for vertical turbulent fluxes and is closed with the mixing length of Honnert et al. (2021). Deep convection is explicitly resolved while shallow convection is parameterized with an Eddy-Diffusivity-Kain-Fritsch scheme (Pergaud et al., 2009). The historical radiative solver of Meso-NH is used: the Rapid Radiation Transfer Model (Mlawer et al., 1997) for long-wave radiation is coupled with a short-wave scheme based on the Fouquart (1980) method. Finally, microphysics is solved using the ICE3 one-moment scheme (Pinty and Jabouille, 1998; Riette, 2020; Wurtz et al., 2023).
2.2.2 Dust scheme
The transport of desert aerosols and the evolution of their size distribution are described by three log-normal modes according to the Organic Inorganic Lognormal Aerosol Model (ORILAM, Tulet et al., 2006). These modes are initialized using CAMS reanalysis (Inness et al., 2019) of size distribution with median diameters of 78 nm, 0.64 µm, and 5 µm, and respective standard deviations of 1.75, 1.76, and 1.70 (Crumeyrolle et al., 2011). Radiative properties (extinction, single scattering albedo and asymmetry factor) are computed on-line using the method described by Grini et al. (2006) and are coupled to the six wavelength bands of the Morcrette and Fouquart (1986) radiation scheme.
2.2.3 Surface model
Surface physics is handled by SURFEX V9.0.0, according to four main cover types with dedicated surface schemes (sea and ocean, inland water, natural soil and vegetation, and urban). The component fraction of the cover types per grid cell is derived from the ECOCLIMAP-Second Generation land cover database (ECOCLIMAP-SG, Wiki – CNRM, 2018). Each cover type uses a dedicated scheme to calculate the fluxes over the surface. For urban areas, the multilayer version of the Town Energy Balance (TEB) urban canopy model (Masson, 2000; Schoetter et al., 2020) is used, allowing the buildings to interact directly with the first atmospheric layers using a drag approach and releasing fluxes at the corresponding atmospheric model levels. In-canyon urban vegetation and street trees are also taken into account (Redon et al., 2017, 2020). For rural and natural tiles, the Interaction Soil–Biosphere–Atmosphere (ISBA) land surface model (Noilhan and Planton, 1989) is used, with an explicit multi-layer soil approach to model water and heat vertical transfers (Decharme et al., 2011). The Multi-Energy Budget parameterization is activated in ISBA (ISBA-MEB, Boone et al., 2017) to deal with a low and high vegetation canopy that is separated from the ground.
2.2.4 Thermal comfort
The TEB model, described in Sect. 2.2.3, computes inline the Universal Thermal Climate Index (UTCI, Fiala et al., 2012). The UTCI is a bioclimatic index that describes the physiological comfort of humans under specific meteorological conditions. It is expressed as a temperature (in °C). Following Bröde et al. (2012), its operational procedure calculation is based on an equation involving four meteorological variables: air temperature (Ta, °C), mean radiant temperature (Tmrt, ∘C), relative humidity (RH, %) and wind speed (Uwind, m s−1). Equation (1) shows that UTCI can be calculated as the air temperature plus an offset that depends on all the aforementioned variables (Bröde et al., 2012):
TEB computes the UTCI for a person located in the middle of the urban canyon and exposed to the incoming short-wave (direct and diffuse components) and long-wave radiation, to the short- and long-wave reflected radiation inside the canyon, and to the infrared radiation emitted by the surrounding walls and ground surfaces (de Munck et al., 2018). In TEB, Ta, RH, Tmrt, and Uwind are calculated at 1, 1, 1.1 and 10 m above ground level (a.g.l.), respectively. To provide a sub-grid information on UTCI variability related to sun-shade contrasts, TEB computes two UTCI diagnostics, one for a person standing in the sun (by considering all radiation contributions) and one for a person in the shade (by excluding direct radiation contribution).
2.3 Numerical experiment
The model is run with a 1.2-km horizontal resolution over a 480 km by 480 km domain, covering the northern part of France and centered on Paris (Fig. 3). The vertical grid is divided into 68 levels with a first half-level at 2 m a.g.l. for physical variables such as air temperature. The grid size increases along the vertical, with a constant stretching of 1.17 up to 1000 m and 1.04 above. The domain extends vertically up to approximately 17500 m. The maximum vertical grid size allowed is 500 m. A simulation consists of a single 4-d Meso-NH run with a 5 s time step.
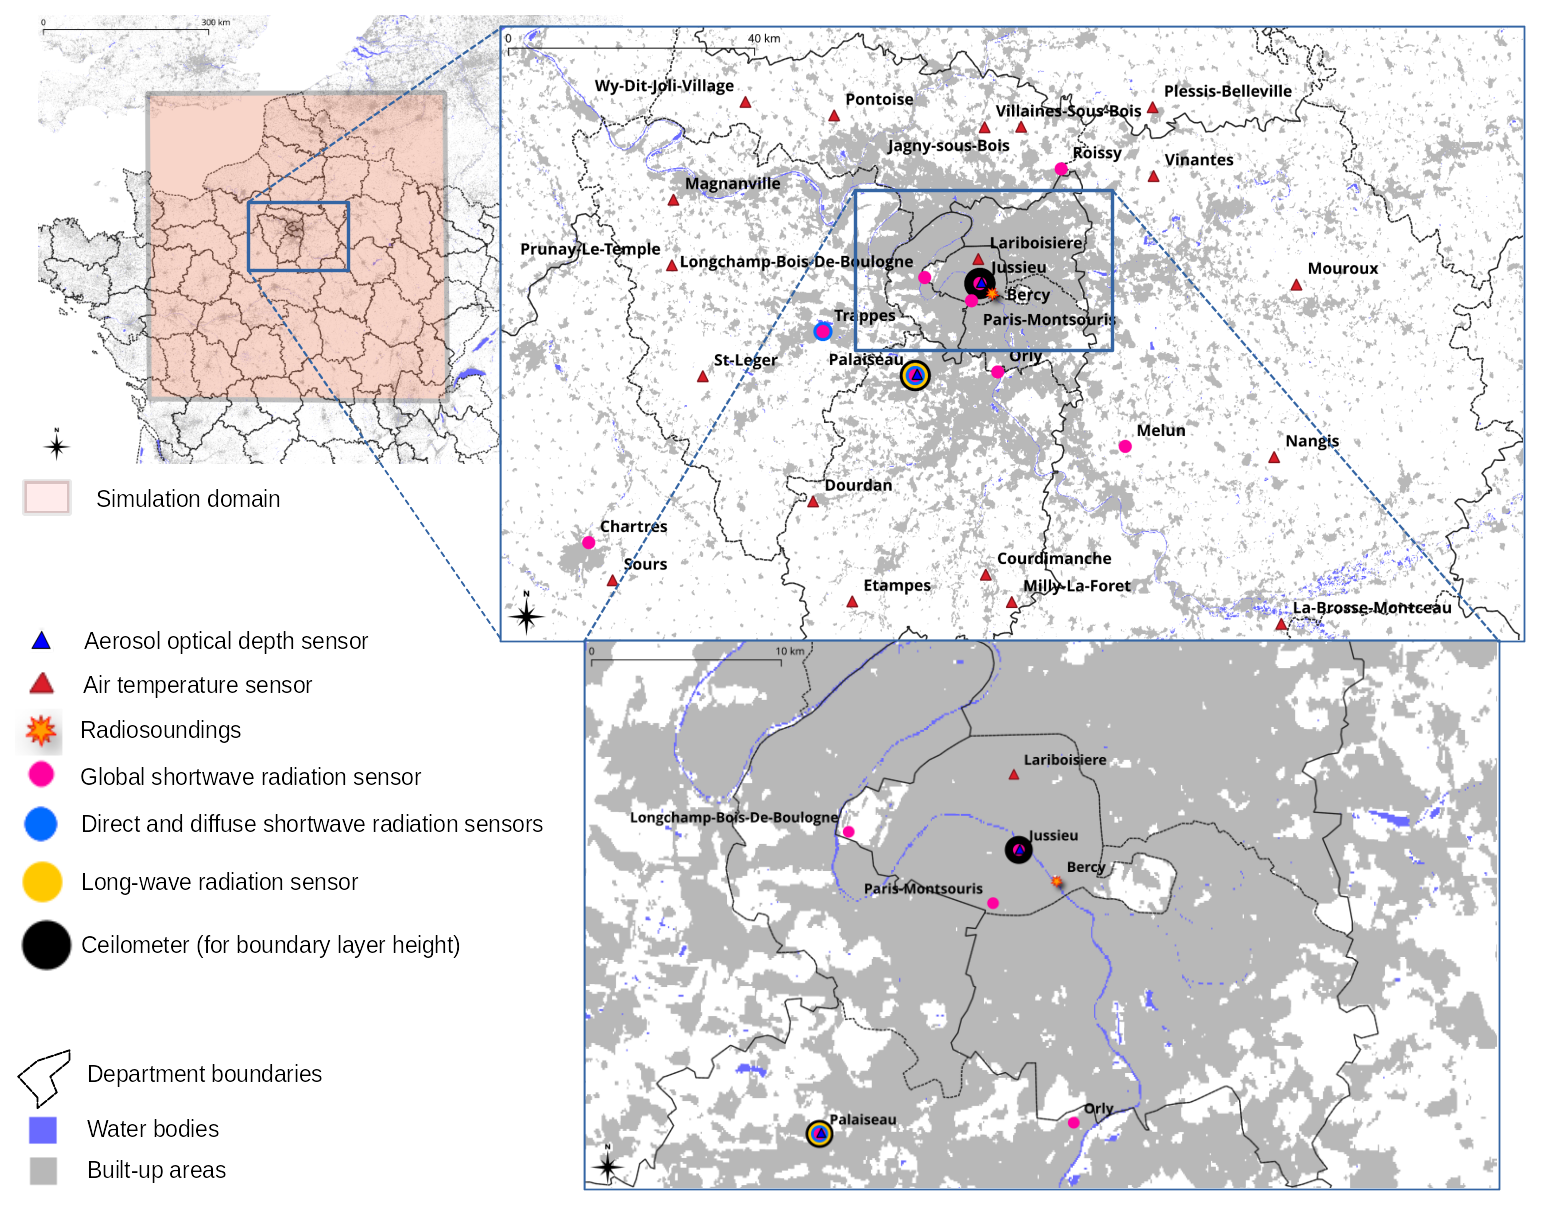
Figure 3Representation of the model configuration and observation network. Built-up areas and water bodies are derived from the map produced by Demuzere et al. (2022).
The objective of the study is to investigate the effect of desert dust aerosols on urban thermal comfort. Thus, only dusts are explicitly coupled with Meso-NH, the level for the other aerosol types (black carbon, organic and sulfate-type, and sea-salt aerosols) being taken from the Tegen et al. (1997) climatology. To account for the “actual” changes in dust aerosol concentrations in the atmosphere during the simulation (in response to the passage of the Saharan plume), the dust aerosol data from the CAMS reanalysis (Inness et al., 2019) are provided to Meso-NH with a 3-h timestep. Three simulations are performed: (i) C0 sets the dust concentration to 0, (ii) C1 uses the concentrations from CAMS data as input, and (iii) C2 doubles the concentrations from CAMS data. Given the substantial AOD variability across dust source models (see Fig. 2), both C1 and C2 remain scenarios considered as potentially realistic. Since aerosol quantity and composition are inherently uncertain, the most plausible scenario is the one closest to the observations and the urban thermal comfort analysis will therefore be conducted exclusively for that scenario. In contrast, C0 is not intended to be realistic but is used as a reference scenario to evaluate the effect of the dust in the two other simulations.
The CAMS reanalysis provides a concentration in dust aerosols in µg m−3 for each cell of 0.75° by 0.75° (73 km by 111 km at this latitude) with 35 vertical layers within the model domain extension. The inclusion of CAMS aerosols into the Meso-NH model is prone to uncertainties. The total mass content given by CAMS is distributed according to log-normal modes that can be described by the 0th, 3rd, and 6th moment of the distribution (Grini et al., 2006; Hoarau et al., 2018). Assumptions are made on the shape of the distributions of aerosols, which influence the radiative properties. Note that for simplification, only dust transport and dry dust deposition are included in the simulations: due to the short period of simulation and the fact that the aerosols are outside of the boundary layer, the modification of the dust aerosols content by wet deposition, aggregation or chemical reaction is not simulated.
For all simulations, the initial conditions for the atmospheric and surface fields, as well as the atmospheric boundary conditions, come from the analysis output of the french numerical weather prediction model AROME-France (Application of Research to Operations at Mesoscale, Seity et al., 2011), which uses a three-dimensional variational (3DVar, Brousseau et al., 2016) data assimilation scheme and is also coupled with SURFEX. Data assimilation is not performed directly in Meso-NH.
2.4 Observation network
The simulations described above can be compared with numerous meteorological observations, distributed over the Ile-de-France administrative region (which includes Paris). The measurement types and their locations are shown in Fig. 3 and described hereafter.
The AOD for wavelengths between 340 and 1640 nm is observed by two AErosol RObotic NETwork (AERONET) stations (Holben et al., 1998). One is located in Jussieu (center of Paris) and the second is in Palaiseau (blue triangles in Fig. 3).
The Météo-France permanent surface network (Radome, Tardieu and Leroy, 2003) has nine automatic weather stations (AWS) located nearby Paris that record global solar radiation (purple dots in Fig. 3). Two of them also record direct and diffuse components of solar radiation (Trappes and Palaiseau), and one record the long-wave radiation (Palaiseau).
Comparing atmospheric model simulations with observations of 2 m a.g.l. air temperature in cities is not straightforward, due to the lack of representativeness of AWS stations (Oke, 2004). Indeed, to follow the WMO recommendations, AWS operated by national meteorological services should be installed in large and homogeneous areas of flat terrain and low-rise vegetation. Locations that match these constraints are complex to find in or near urban areas, as these areas are characterized by quite high land cover heterogeneity. Thus, in suburban areas, AWS are generally located in small patches of low-rise vegetation in airports, and, in cities, they are often located in urban parks. In the present study, the grid mesh of the model is 1.2 km. Therefore, a single cell often includes both urban and rural land cover types, this is particularly true in Paris or in its suburbs. As a consequence, although the observation station is located in a low-rise vegetation area of 200–500 m wide, the model will calculate fluxes released by the low-rise vegetation area but also by a large amount of urbanized surfaces, making the comparison between simulations and observations non-relevant. To prevent this inconsistency, only in-situ stations where the corresponding model grid cell surface cover matches their immediate surroundings are used for the air temperature evaluation. This results in 18 rural stations and a unique urban station (Lariboisière, see Fig. 3). The rural stations are located away from Paris, whereas the urban site is located in a non-vegetated part of Paris city center (i.e. the surface fluxes in the corresponding model cell are calculated only with TEB). In the model, because of the 1.2 km resolution, suburbs have often a mix in surface cover between rural and urban features. Therefore, in-situ suburban stations of the Radome network are excluded from the comparison.
The air temperature of the upper atmosphere is observed using radiosondes measurements released from Bercy (Garrouste and Lemonsu, 2023, inner part of Paris, near the Seine River – Fig. 3). The atmospheric boundary layer height is also estimated from attenuated backscatter profiles measured by two ceilometers, located in Jussieu (near the city center) and Palaiseau, and using the algorithm described by Kotthaus et al. (2020). Note that more details on each instrument can be found in the description of the PANAME-Urban experimental campaign (Lemonsu et al., 2026).
The simulations without dust (C0) and with CAMS dust aerosols (C1 and C2) are first compared to observations in the Paris region to assess the quality of the simulations, as well as the impact of aerosols on radiation and air temperature. Then, the effect of aerosols on thermal comfort is investigated in Sect. 3.4. In the following, if not specified, the simulation results refer to C1.
3.1 Aerosol optical depth
According to Fig. 4, the AOD simulated by C1 and observed in the Paris region agree relatively well (Pearson correlation coefficients is on average 0.58, 0.86 and 0.86 for C0, C1 and C2 respectively, with p-values much lower than 0.01). A comparison of the AOD times series observed at Palaiseau and Jussieu stations and simulated at the corresponding grid cells shows that the dust aerosols cause a sharp increase in AOD on the afternoon of 16 June, that peaks on 18 June. On 15 June, prior to the arrival of the Saharan plume, background AOD values were much lower. Figure 4a–c show that the higher the wavelength, the lower the AOD but also that for all wavelengths, the increase in AOD between 15 and 18 June is nearly the same (about 0.3). Lastly, the small differences in AOD noted between Jussieu (urban) and Palaiseau (suburban) stations, located about 20 km apart (Fig. 3), with variations of less than 0.07 for observations and 0.05 for simulations (not shown here), indicate that the effect of dust aerosols prevails over that of local urban aerosol sources.
However, differences are also observed. First, there is a small negative bias (about −0.1) of the simulated AOD on 15 June, when the dust plume have not yet reached our study area. This bias may be due to the use of a climatological value for aerosols other than dust. Indeed, in the Tegen et al. (1997) climatology, aerosol values are expected to be representative of a monthly mean and may underestimate their concentration. Except on 17 June, the level of magnitude of this daily mean bias remains constant over time for the C1 simulation. The level of aerosols being maximum on 18 June, this day is considered as the more interesting to observe the effect of aerosols on the meteorological variables near the surface. The sharp variations in observed AOD related to the passage of the dust plume are smoothed in the simulation, which is probably explained by the low horizontal resolution of the initial field provided by the CAMS data (73 km by 111 km at the Paris latitude).
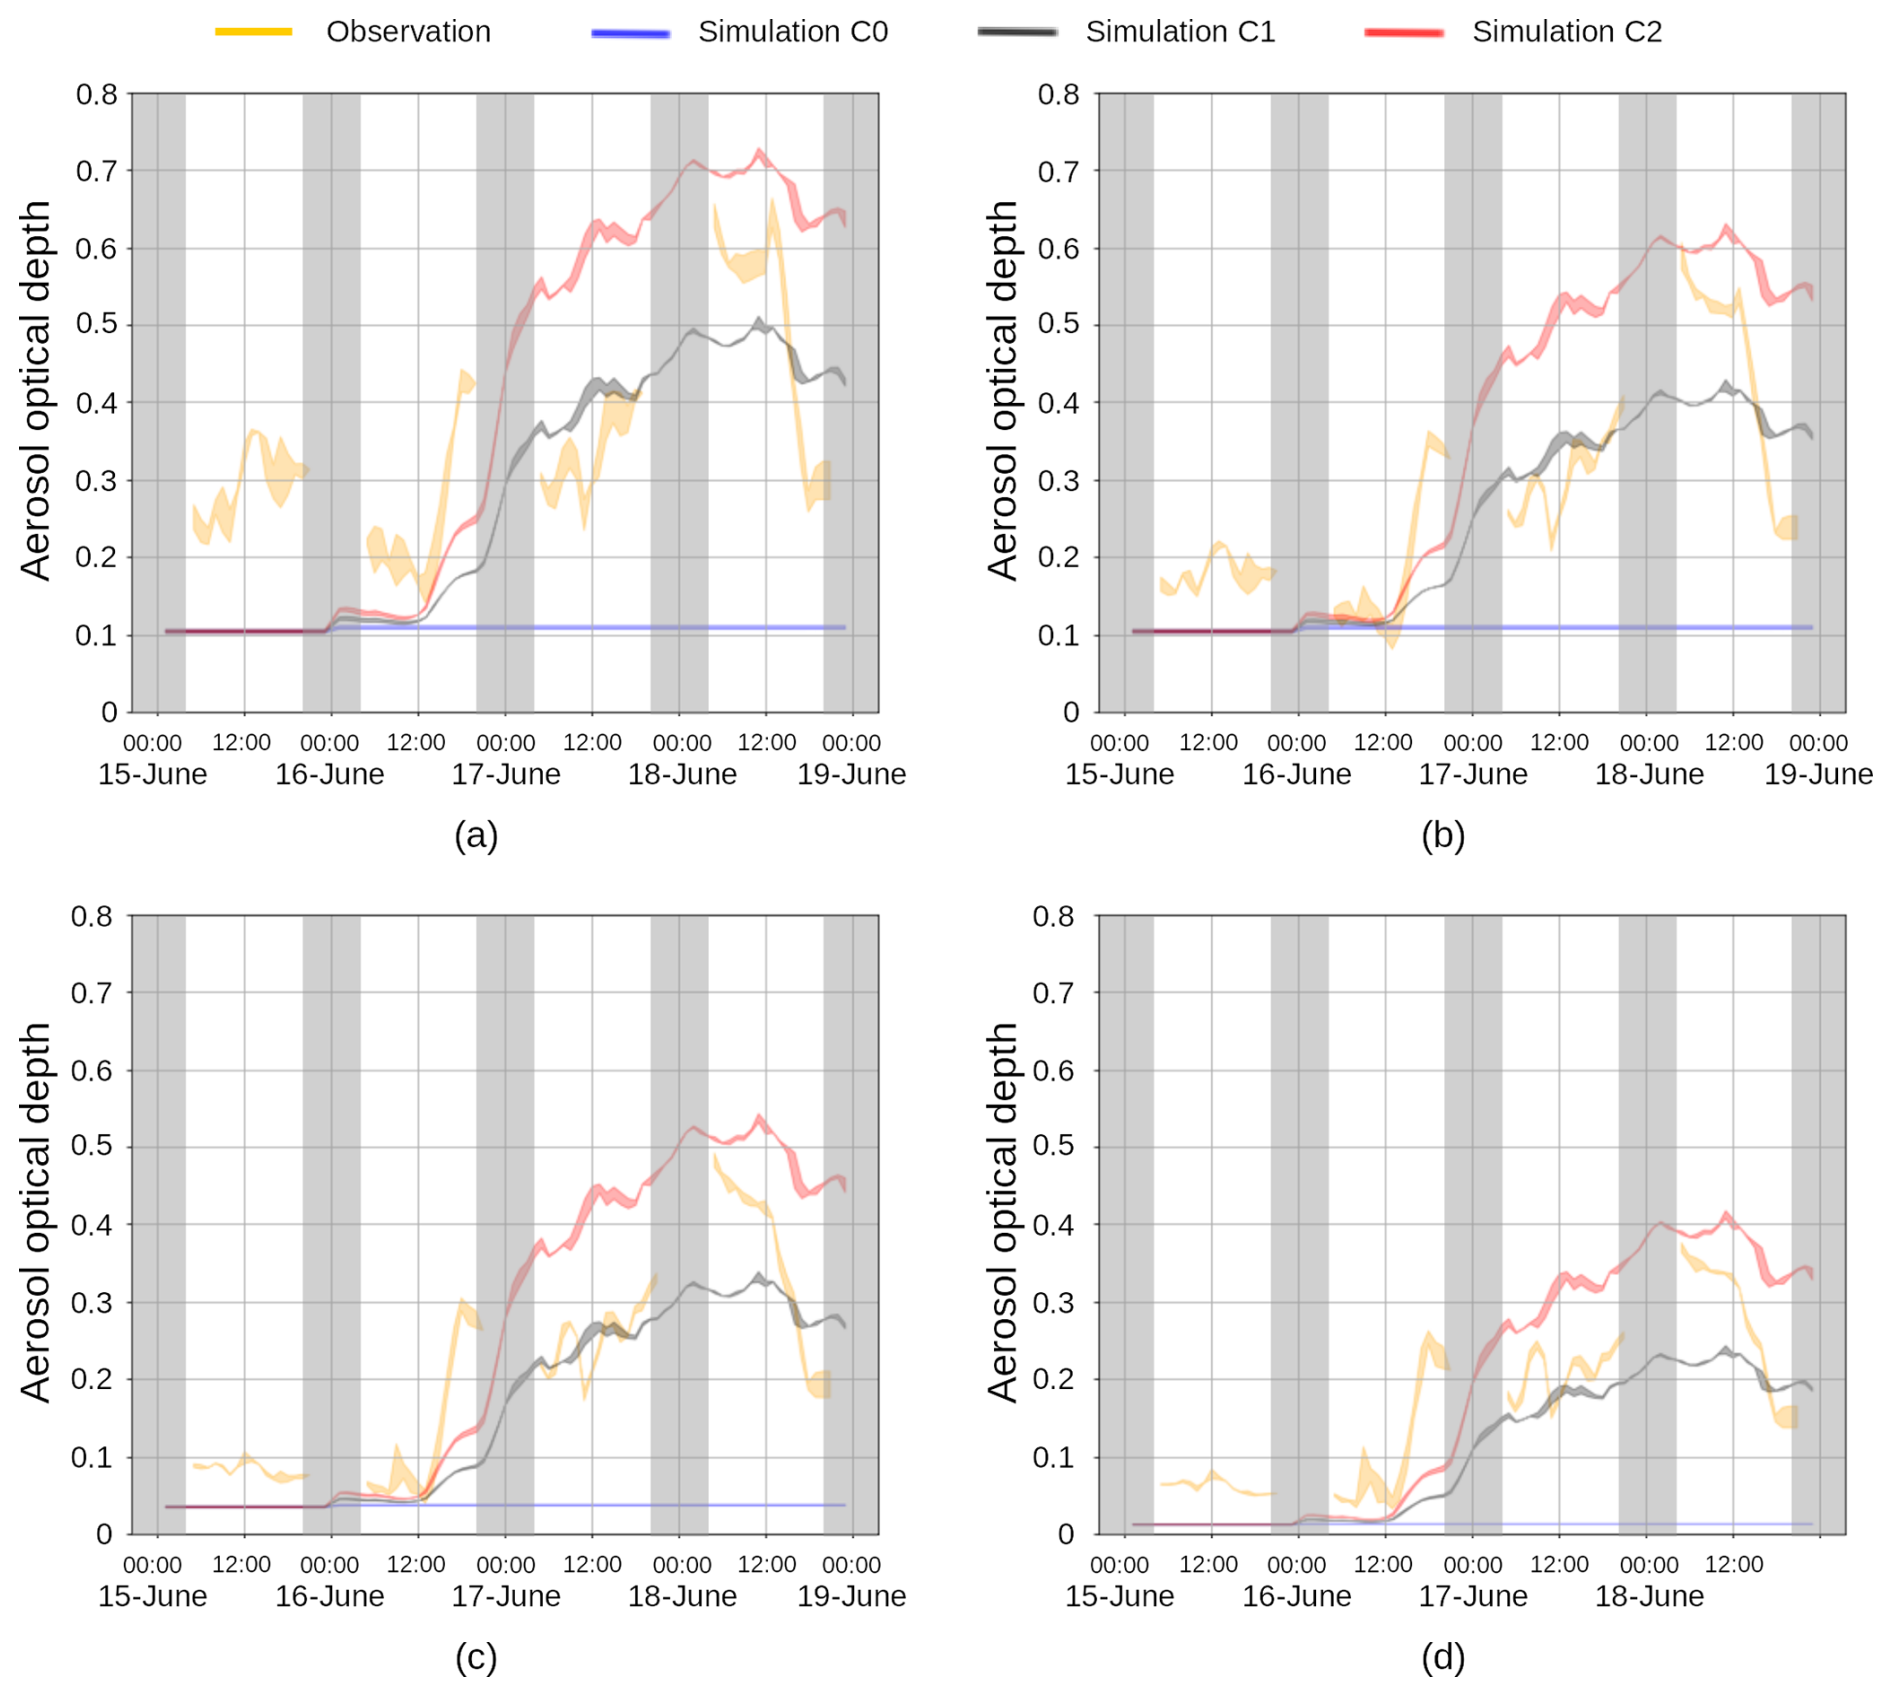
Figure 4Time-series of aerosol optical depth observed (and simulated) at the Jussieu and Palaiseau stations (a) at 340 nm (250–440 nm), (b) at 500 nm (440–690 nm), at 1020 nm (690–1190 nm) and (d) at 1640 nm (1190, 2380 nm). The color patches represent the AOD value difference between the two locations: a larger patch thus denotes higher spatial variability. Note that this is not possible to observe AOD during night-time (20:00 to 04:00 UTC).
3.2 Radiation
The heatwave event investigated begins on 15 June, one day and a half before the dust plume, with a partially cloudy sky, followed by three days with increasing dust aerosols above the Paris region. This evolution of atmospheric conditions affect the global solar radiation. On 15 June, the observed and simulated data show a signal shape and maximum intensity altered by the clouds, both in Chartres (Fig. 5a) and in Roissy (Fig. 5b). On the afternoon of 16 June, the dust plume reaches the Paris region from the south-west, affecting the western part of the region (Fig. 5a) more than the eastern one (Fig. 5b).
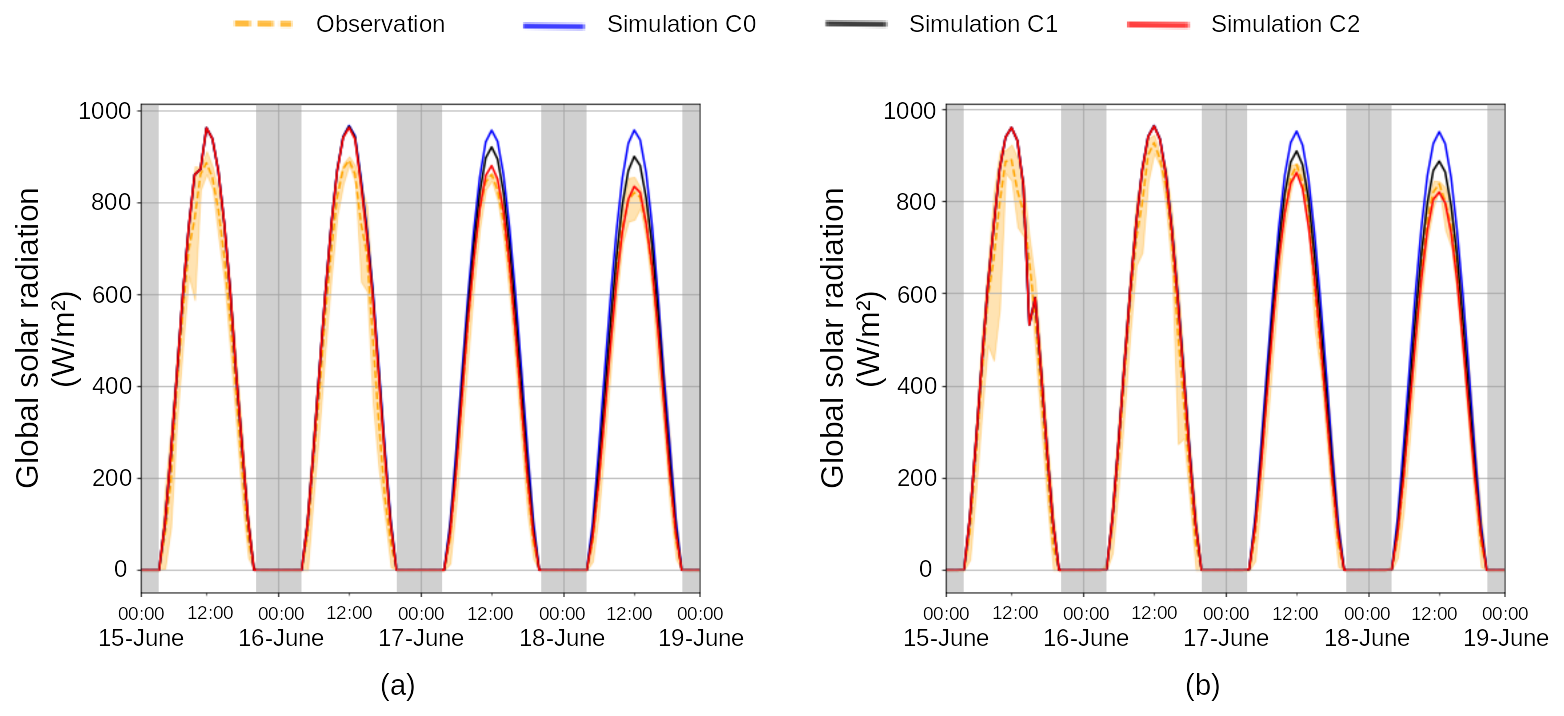
Figure 5The global solar radiation (a) in Chartres, the most western radiation station, and (b) in Roissy, the most eastern radiation station. Note that the patch associated to the observation curve is delineated at the bottom and at the top by the hourly minimum and maximum, respectively.
For the first two days, there is a limited amount of aerosols in the atmosphere and no significant differences between C0, C1 and C2. However, all simulations overestimate the observed incoming solar radiation with a larger bias on 15 June. This could be caused by contrails in the morning and sparse cumulus humilis in the afternoon that are not present in the simulations (not shown). The underestimation of AOD for aerosol other than dust (see Sect. 3.1) could also contribute to this bias. Therefore, in order to quantify the mitigation of incoming solar radiation by dust and evaluate the ability of the model to simulate this effect (while eliminating the model's inherent biases), Fig. 6a shows the diurnal cycle of solar radiation on 15 June, subtracted from those on 17 and 18 June in both observations and simulations, for the nine measurement locations (purple dots in Fig. 3). On 17 June, C1 overestimates the effect of aerosols, which is consistent with the AOD overestimation shown in Sect. 3.1. On 18 June, C1 performs well in the morning, mitigating the global solar radiation up to 75 W m−2 in the simulation compared to 65 W m−2 in the observations. During the afternoon, the mitigation effect is again highly overestimated by about 30 W m−2 that is explained by the different dynamics of AOD (Fig. 4): the observed AOD drops very quickly from noon while it decreases very slowly in the simulations, leading to an increasing offset. Note that the spike in the simulations occurring in the afternoon is due to the presence of clouds in the eastern part of the region during the reference day (15 June – Fig. 5b). Despite the identified shortcomings, the daily mean mitigation of global radiation on 18 June is of the same order of magnitude between C1 (−32 W m−2) and observations (−25 W m−2, as shown in Table 1).
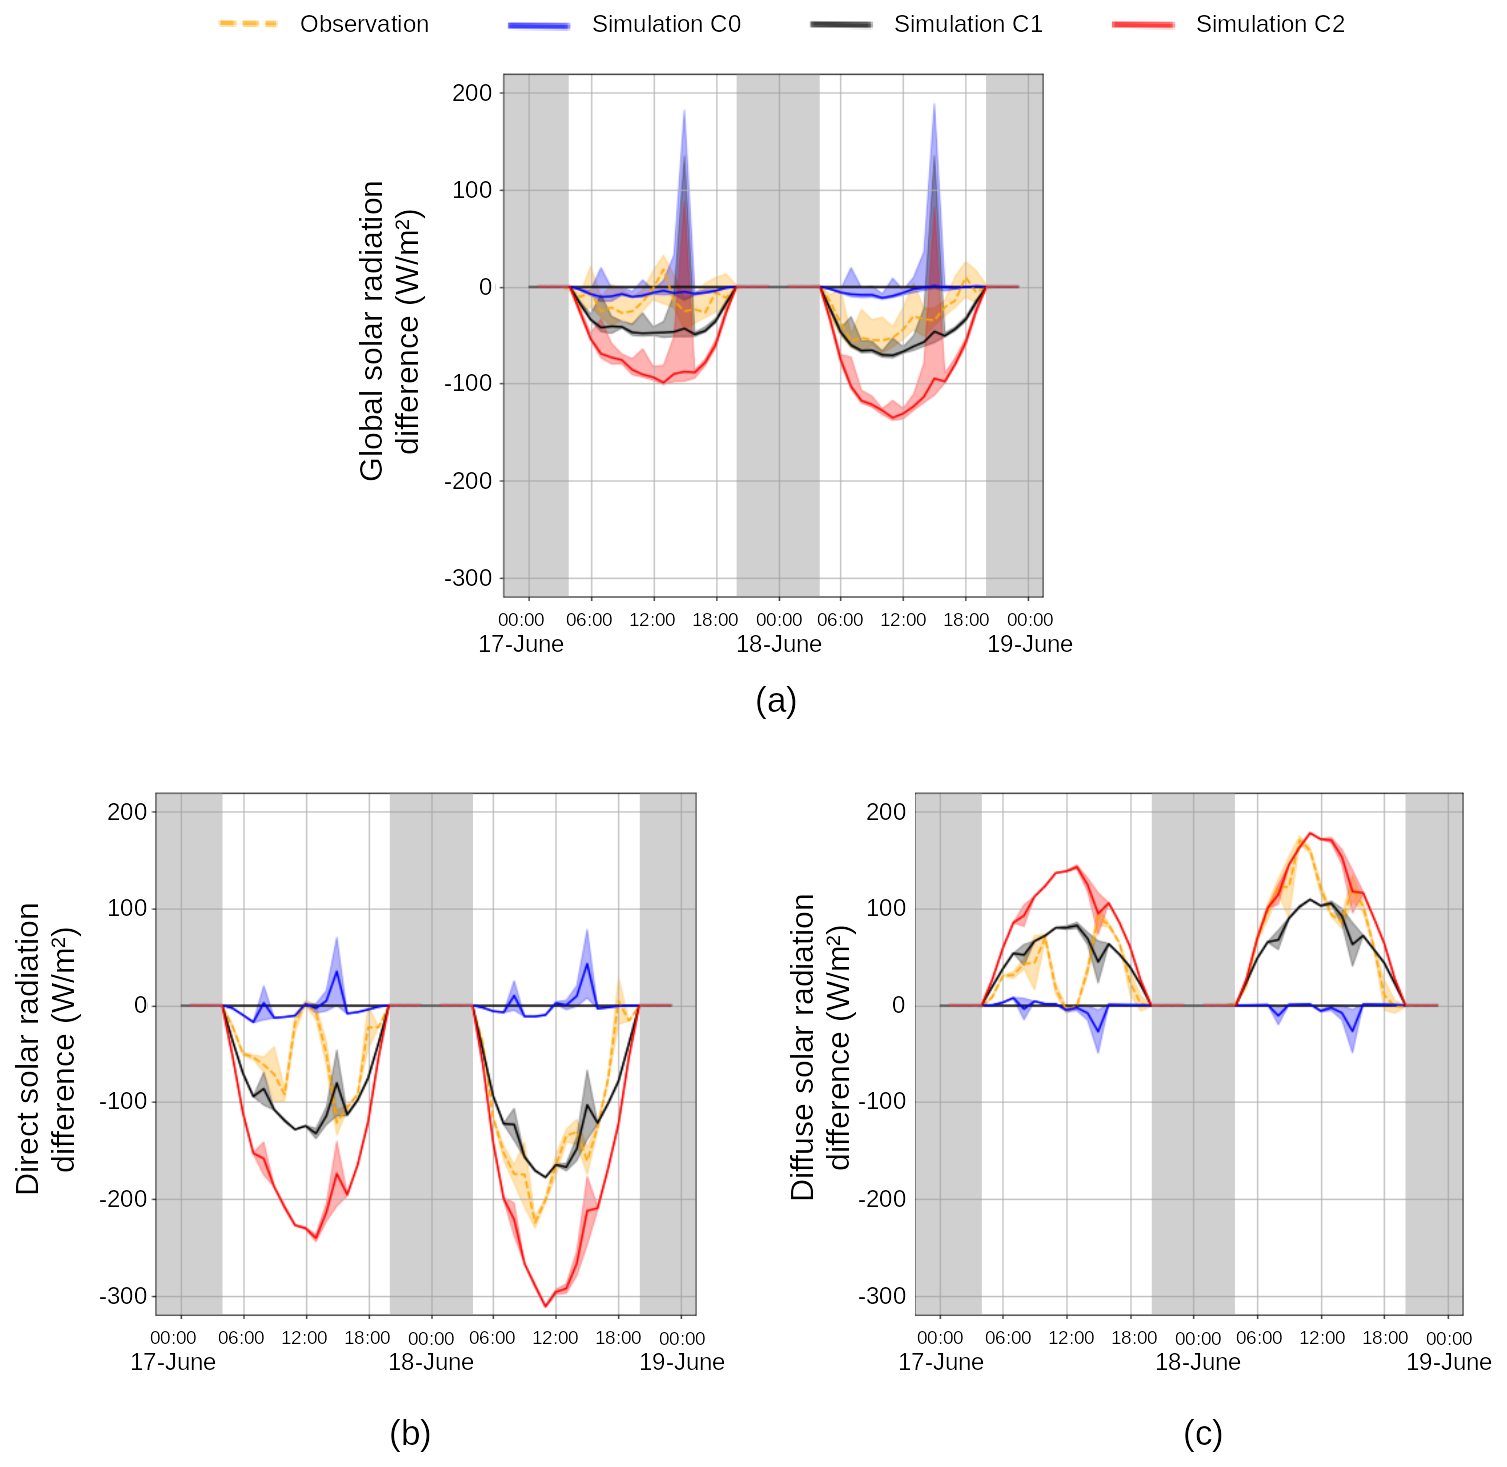
Figure 6(a) Global, (b) direct and (c) diffuse solar radiation difference for 17 and 18 June compared with 15 June. The mean value of the nine (two) global (direct and diffuse) solar radiation stations is represented by the curve and is surrounded by a patch delineated at the bottom and at the top by the 0.1 and 0.9 quantiles, respectively. Note that when the desired quantile lies between two data points i and j, the quantile is then equal to , where fraction is the fractional part of the index surrounded by i and j.
The attenuation of global incoming solar radiation is accompanied by a change in the direct and diffuse components due to the optical properties of dust particles. This effect is illustrated in Fig. 6b, c using radiation data from Jussieu and Palaiseau. On 18 June, the partitioning of global radiation in C1 underestimates the diffuse component in the late morning period when temporary clouds are observed on 15 June (reference day). Otherwise, the diffusive effect of dust is quite well simulated by C1. The observed effect is more important than the one simulated by C1 and less important than the one simulated by C2.
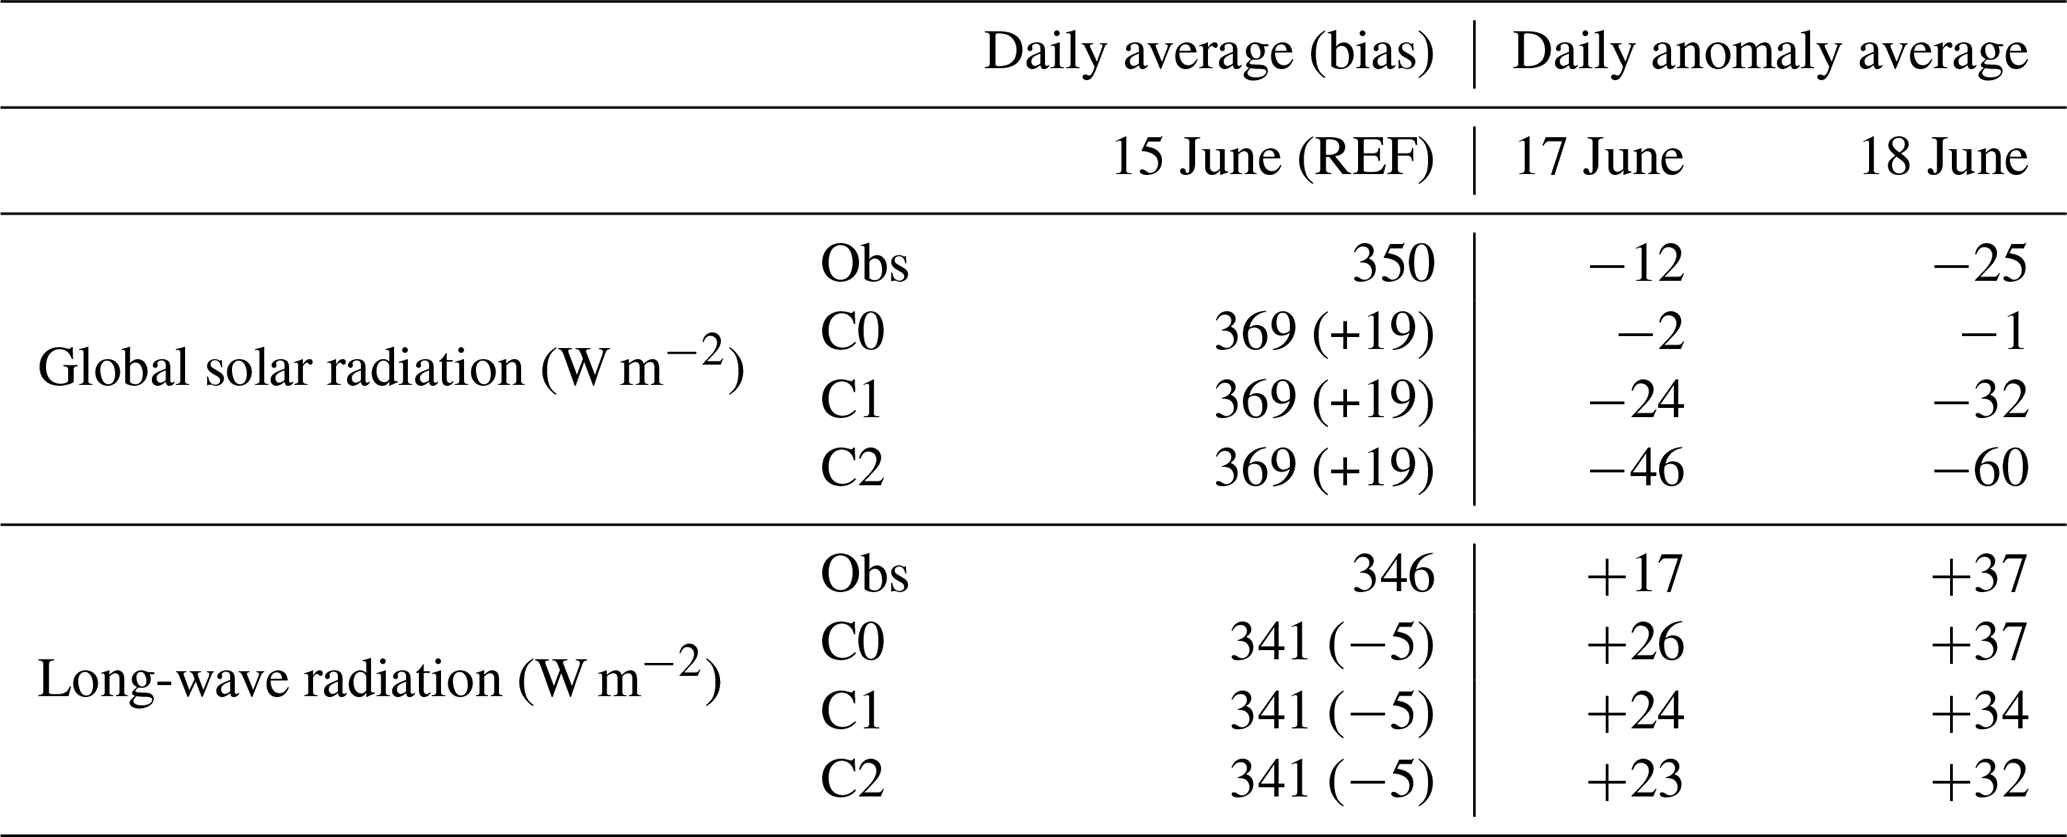
The daily averages of global solar radiation and long-wave radiation are compiled in Table 1. For the reference day (15 June), they have the same order of magnitude (350 and 346 W m−2 for observations) but the mean bias for C1 is higher for the solar radiation (+19 W m−2 against −5 W m−2 for long-wave). However, the effect of dust aerosols on the daily mean long-wave radiation is minor (−3 W m−2 between C1 and C0 on the 18th), which makes these impacts of long-wave negligible compared with solar radiation reduction (−31 W m−2).
Table 1The daily average global solar radiation (W m−2) and long-wave radiation (W m−2) observed and simulated at the Palaiseau station for the reference day and the daily anomaly average, corresponding to the difference between a given day and the reference day. The numbers in brackets are the difference of radiation between a simulation and the observations for the reference day (15 June).
3.3 Air temperature
3.3.1 Near-ground air temperature
Comparison of near-surface air temperature is performed for the 18 rural sites and for the single urban site. When there are no dust aerosols in the atmosphere (15 June), the air temperature simulated by the model for urban and rural stations is underestimated from 06:00 to 12:00 UTC (00:00–06:00 UTC being the spin-up time it is not considered) and overestimated the rest of the day (about 1.75 °C for the rural median value – Fig. 7a). For the night between 15 and 16 June (20:00–04:00 UTC) the bias is close to zero. The daytime (from 04:00 to 20:00 UTC) warm bias increases in rural areas on 17 and 18 June, as temperatures rise, but differently depending on the simulations: it is maximum for C0 (without dust aerosols) and minimum for C2 (by doubling CAMS dust aerosols). Although trends are quite similar at the urban site for the three simulations (Fig. 7b, d), biases are lower. A warm nighttime bias with similar distinction between the simulations appears on 17 and 18 June for urban and rural stations.
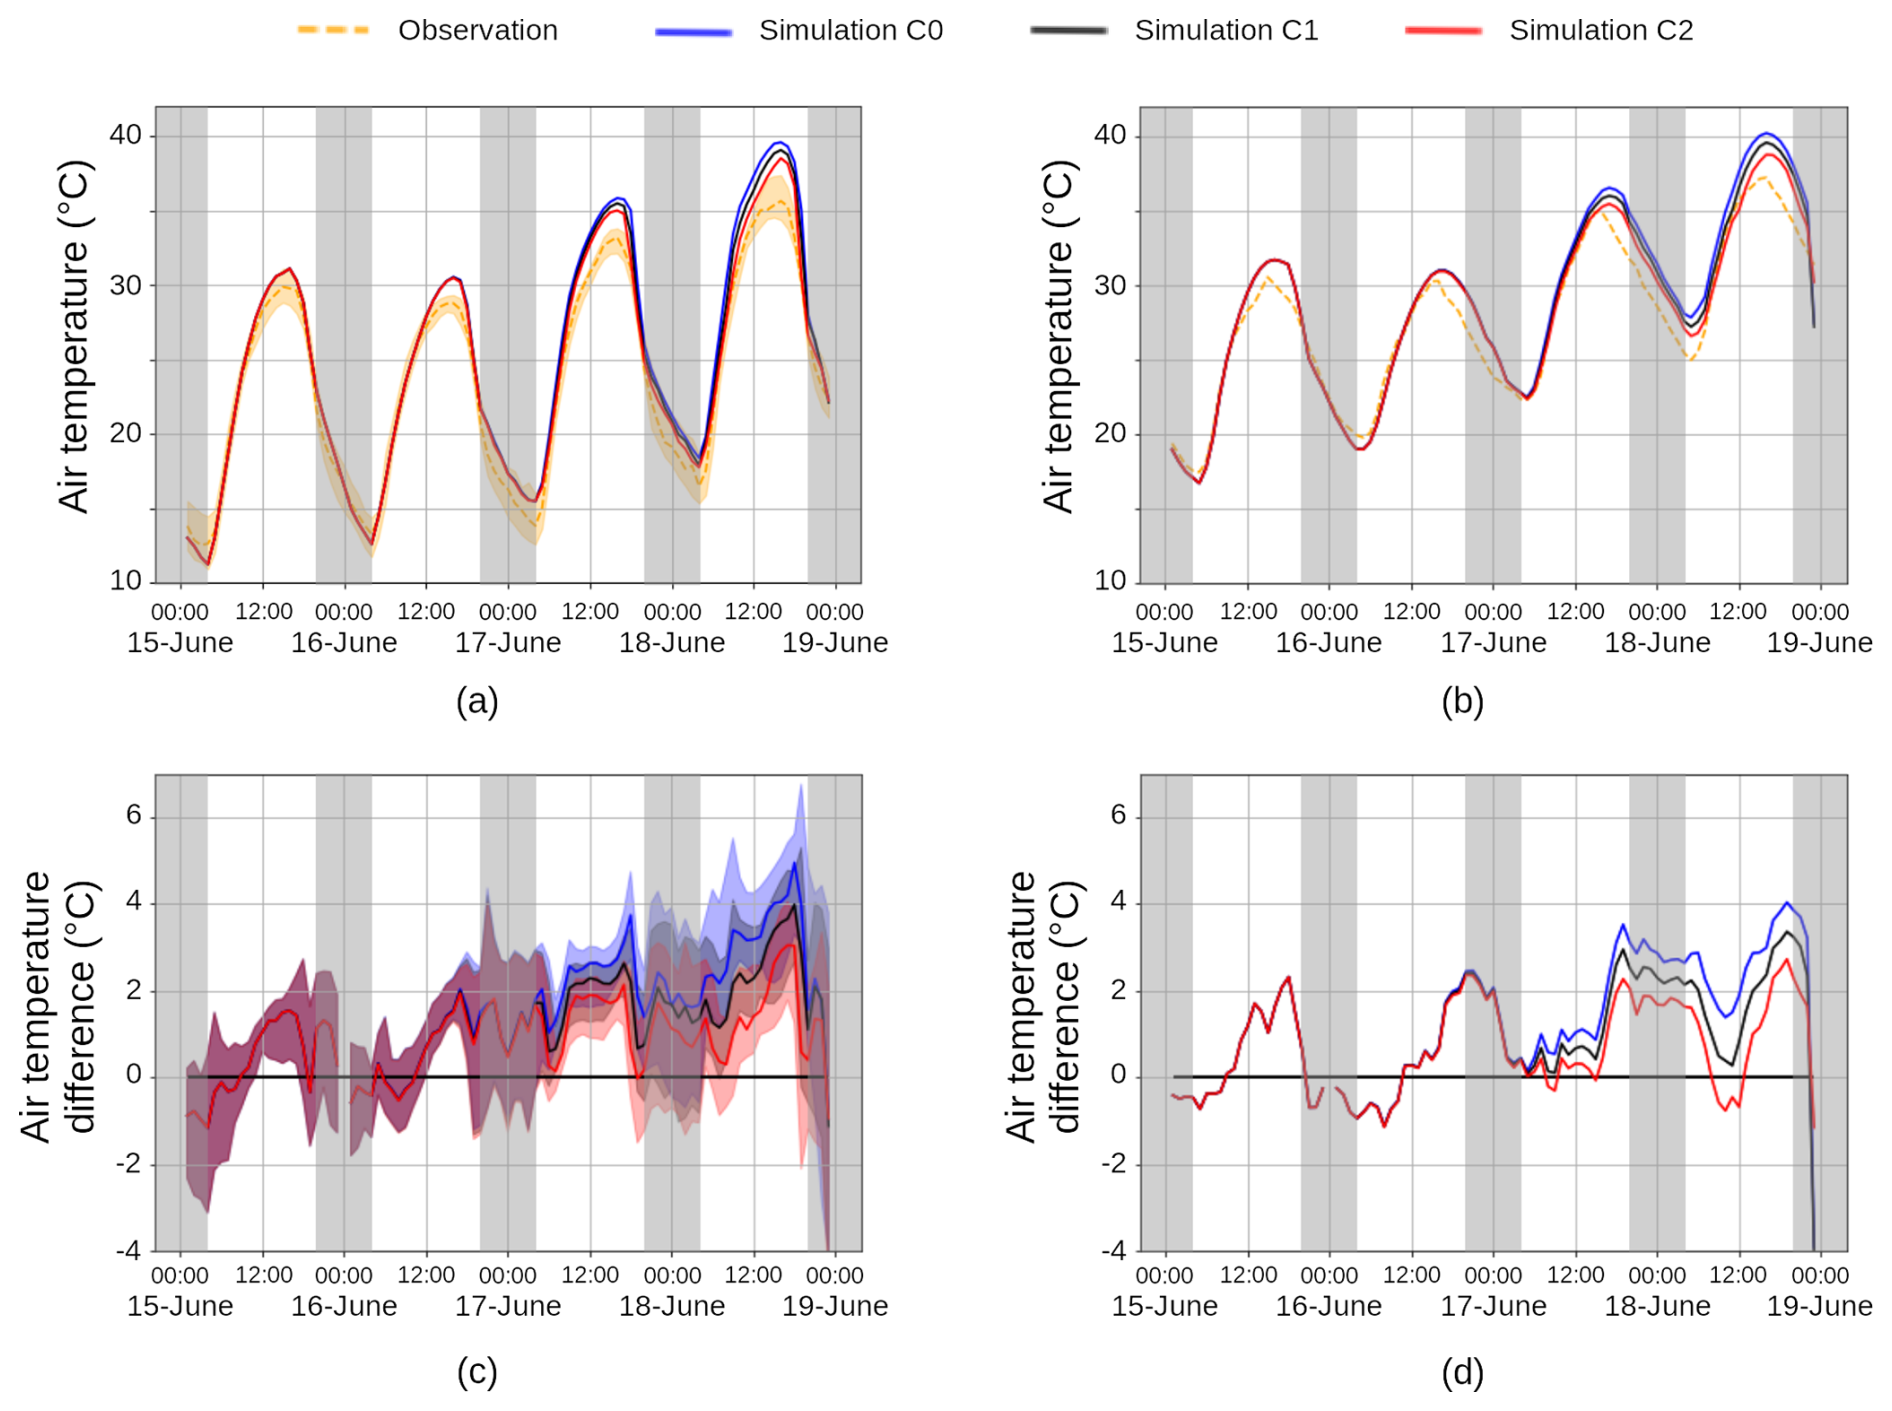
Figure 7(a) Observed and simulated air temperature and (c) difference between simulation and observation for the 18 rural stations. (b) Observed and simulated air temperature and (d) difference between simulation and observation for the urban station. For rural stations air temperature differences (c), the median value of the 18 stations is represented by the curve and is surrounded by a patch delineated at the bottom and at the top by the 0.1 and 0.9 quantiles, respectively.
As with solar radiation, the air temperatures in the simulations with and without aerosols start to diverge on 17 June, and this difference increases on 18 June. Overall, taking aerosols into account clearly improves the simulation of the near-surface air temperature. In Sect. 3.3.2, the vertical structure of the atmospheric boundary layer is investigated to understand the reason for the air temperature bias near the surface, more specifically the afternoon overestimation.
3.3.2 Upper atmosphere air temperature
The impact of dust aerosols on the vertical stability of the first 6000 m of the atmosphere can be assessed by comparing the simulations with each other and with radiosonde and ceilometer measurements. Figure 8 shows the vertical profiles of potential air temperature1 recorded by radiosondes released from Bercy on 18 June at 00:00, 12:00, 16:00, and 20:00 UTC (see location in Fig. 3).
At 00:00 UTC (Fig. 8a), the urban boundary layer (UBL) is well mixed. Its height is well captured by all the simulations, but its air temperature is slightly too warm. This is also the case for the residual layer above it up to 1000 m, probably resulting from a warm bias on the previous day (17 June, not shown). Above 1000 m, in the free atmosphere, the simulated profiles of potential air temperature are very similar and in good agreement with observations.
At 12:00 UTC (Fig. 8b), the differences in incoming solar radiation at the surface lead to different boundary layer heights between simulations. The best boundary layer simulation here is C2. The C0 boundary layer grows twice faster, while C1 gives intermediate results. This shows that the dust aerosols have a significant effect at this stage of the boundary layer development. At 16:00 UTC (Fig. 8c), all three simulations largely overestimate the vertical development of the boundary layer and underestimate its inversion strength. The turbulence and thermal scheme used by the Meso-NH model probably simulate a too strong entrainment rate at the top of the boundary layer, which could reduce the stability barrier in the free atmosphere. This could also be related to a slight time lag in the simulation of the large-scale structure change of the air mass that occurs in the evening. This strong entrainment causes additional warming of the boundary layer and surface during the afternoon (Fig. 7), due to excessive vertical extension of the boundary layer, resulting in mixing with warmer air from the upper layers. However, the comparison of the three simulations highlights the important role of the surface solar radiation reduction (due to the dust plume) in the dampening of the boundary layer development. At midnight (Fig. 8d), the nocturnal boundary layer develops again, and air temperature differences between simulations are driven by the afternoon ones.
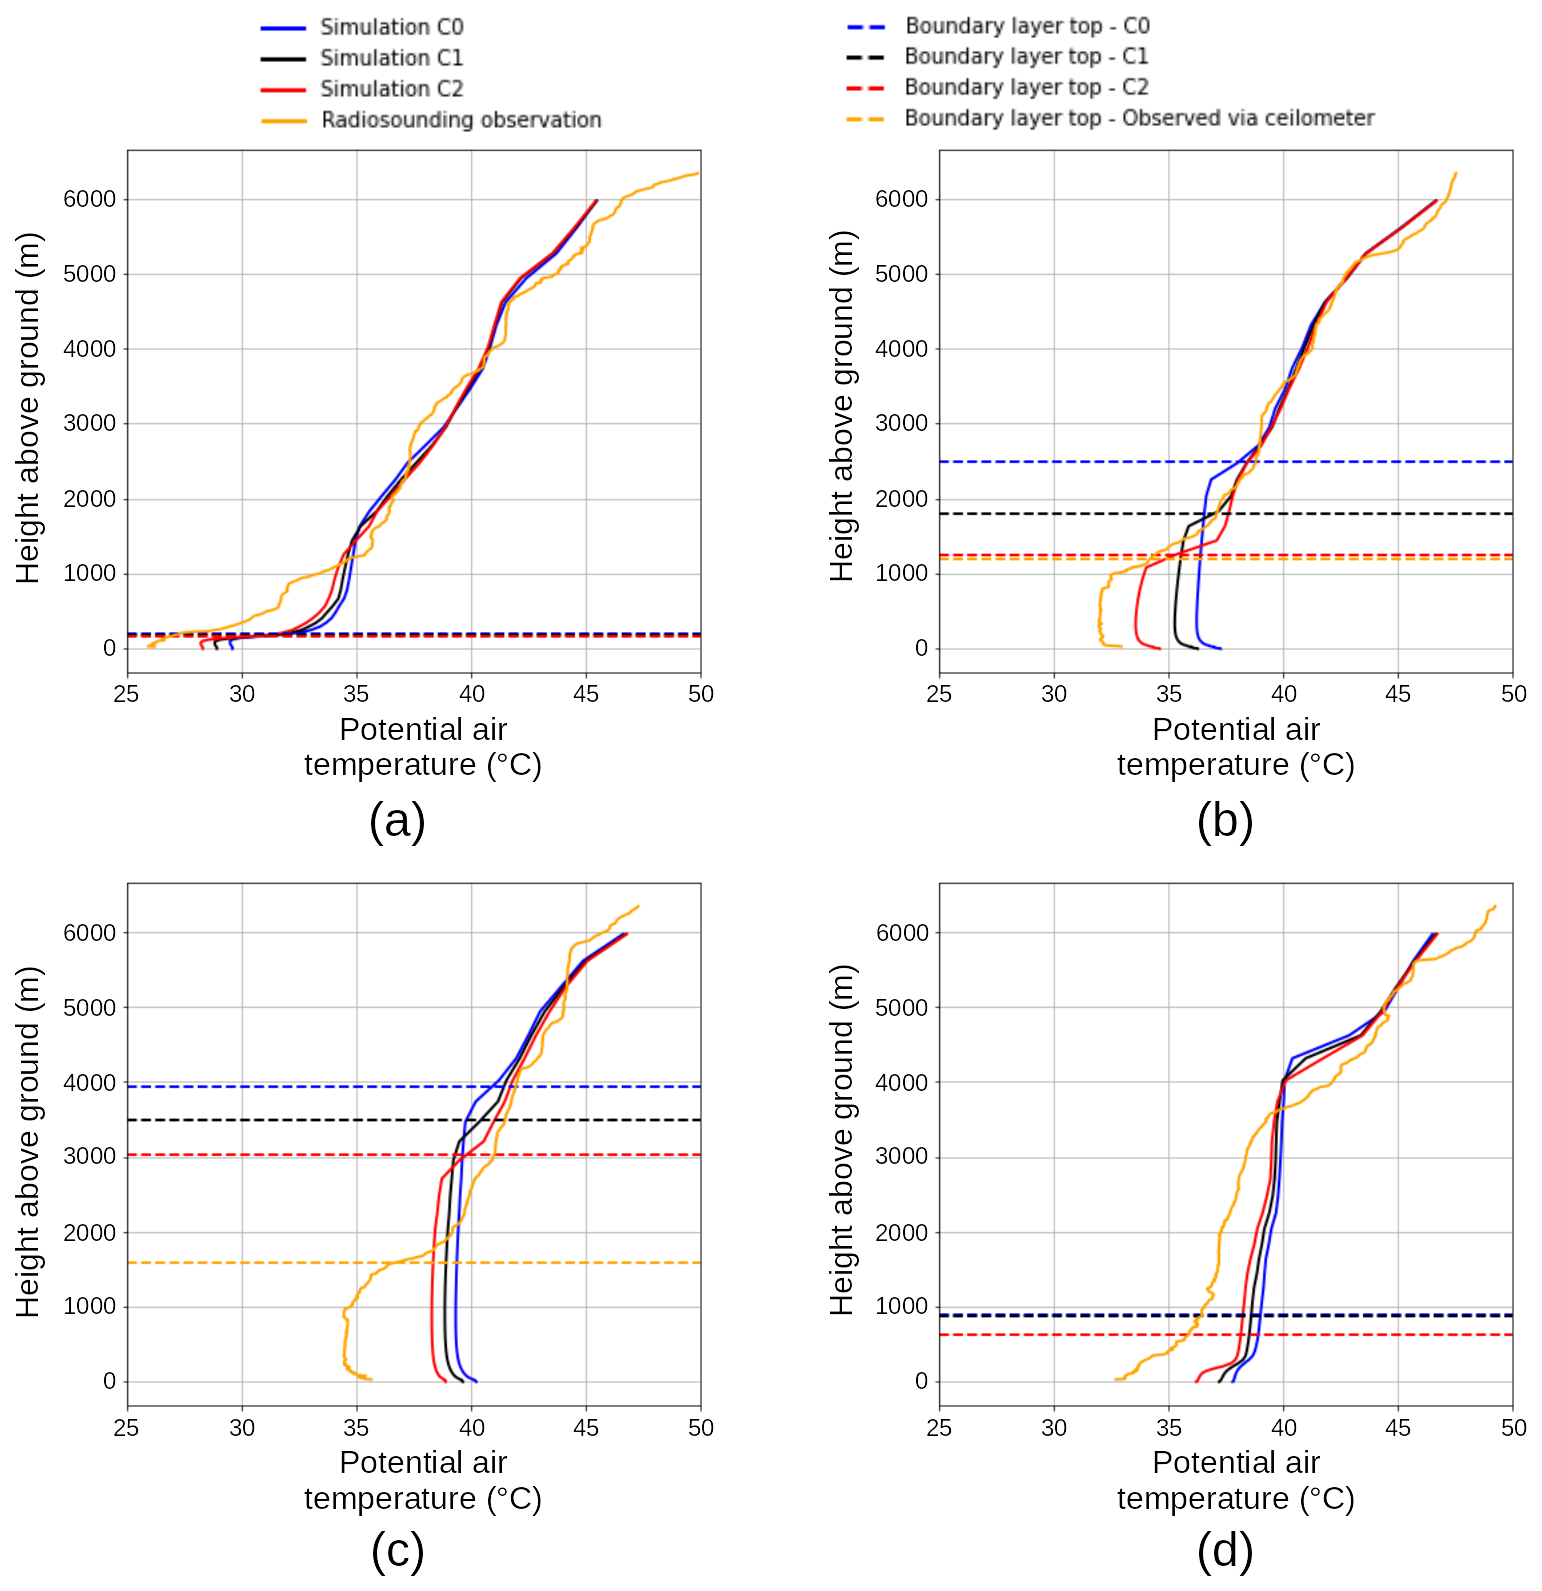
Figure 8Vertical profile of the potential air temperature simulated by the Meso-NH model and observed by a radiosonde at the Jussieu station location on 18 June at (a) 00:00, (b) 12:00, (c) 16:00 and (d) 20:00 UTC terms.
In addition, the temporal evolution of the vertical structure of the first 4500 m of the atmosphere during the three days of the dust event is shown in Fig. 9. The model overestimates the boundary layer height retrieved from the ceilometer at the Jussieu station, but this is improved in C1 compared to C0. The evolution of the difference in potential air temperature between C1 and C0, vertically and as a function of time confirms previous findings: taking dust aerosols into account in C1 results in a cooling of typically 0.5 °C throughout the boundary layer compared to C0 on 17 and 18 June.
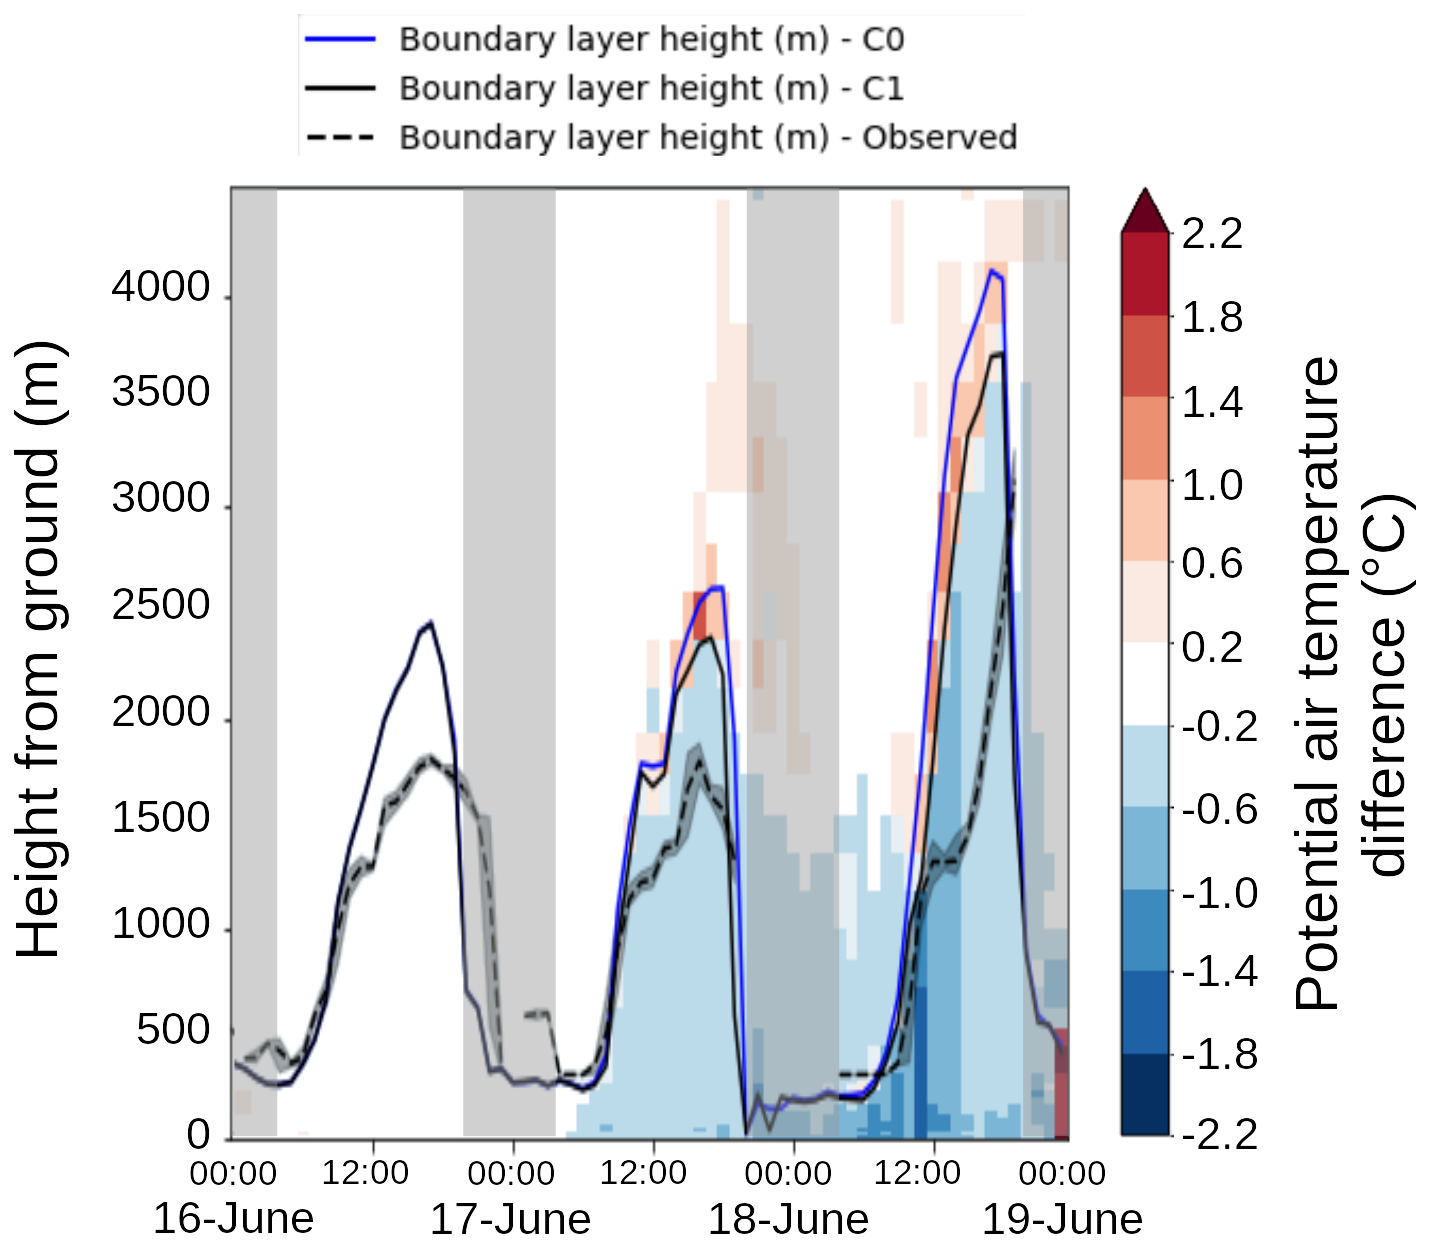
Figure 9Comparaison of time-series of boundary layer height simulated (C0 and C1) and observed at the Jussieu station, and vertical variation of the potential air temperature difference between C1 and C0 at the same location. The hourly median value of the observations is represented by the dashed line and is surrounded by a patch delineated at the bottom and at the top by the hourly minimum and maximum, respectively
3.4 Thermal comfort
In previous sections, the effect of dust aerosols on individual meteorological variables has been investigated. In the present section, we analyze the spatial and temporal variations of the UTCI bioclimatic index (see Sect. 2.2.4), which aggregates the effect of several meteorological variables on human thermal comfort. Previous results suggest that the C1 simulation is the one that catches the best the effect of aerosols on global, direct, and diffuse solar radiation (Fig. 6). However, the near-surface air temperature is closer to the observation with C2 (Fig. 7). This is probably due to the fact that Meso-NH overestimates the entrainment at the top of the boundary layer, causing extra heating near the surface (Fig. 8). Increasing the aerosol quantity in the atmosphere, as done in C2, reduces the radiations reaching the surface, and therefore partially compensates for this bias, but this remains unrealistic. Moreover, the mean radiant temperature is known to be the main variable responsible for the spatial and temporal variability of human thermal comfort (Lindberg et al., 2025). Thus, only C0 (without dust) and C1 (considered as the most realistic one regarding radiation) are used for this section.
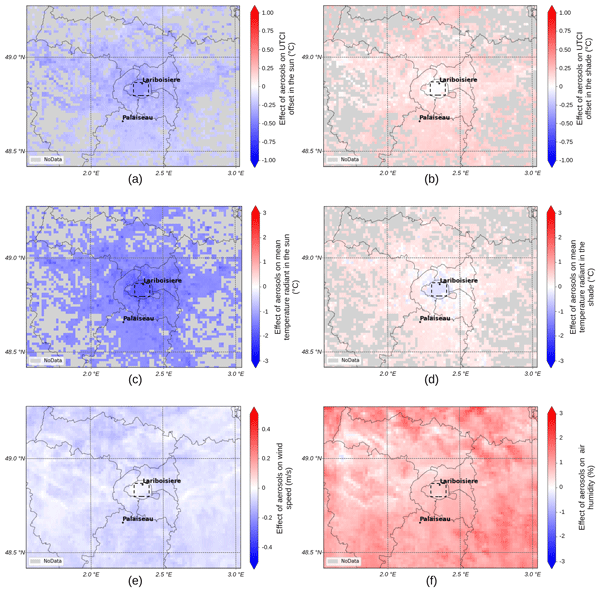
Figure 10a, b show the UTCI calculated with TEB on 18 June for C1, for a person standing within the urban canyon in the sun and in the shade, respectively (see Sect. 2.2.4). The distinction between sun and shade is made because the mean radiant temperature, a very important driver for daytime outdoor thermal stress (Thorsson et al., 2014), is substantially reduced by shadow patterns created by obstructing objects such as buildings (Lindberg and Grimmond, 2011; Lindberg et al., 2025). The results are averaged for the time period from 15:00 to 17:00 UTC (17:00 to 19:00 LT). This choice is justified by two reasons: it is the hottest time of day, and it is also the preferred time for commuting from work to home. The effect of dust aerosols on thermal comfort is investigated by calculating the UTCI difference between C1 and C0 both in the sun and in the shade (Fig. 10c and d, respectively). The increase in dust aerosol concentration in the atmosphere results in a slight decrease in UTCI values for the entire study area, although some contrasts are found: the decrease is more pronounced in the sun and in the Paris city (−0.65 ± 0.03 °C2) than in the shade outside of Paris (−0.16 ± 0.04 °C).
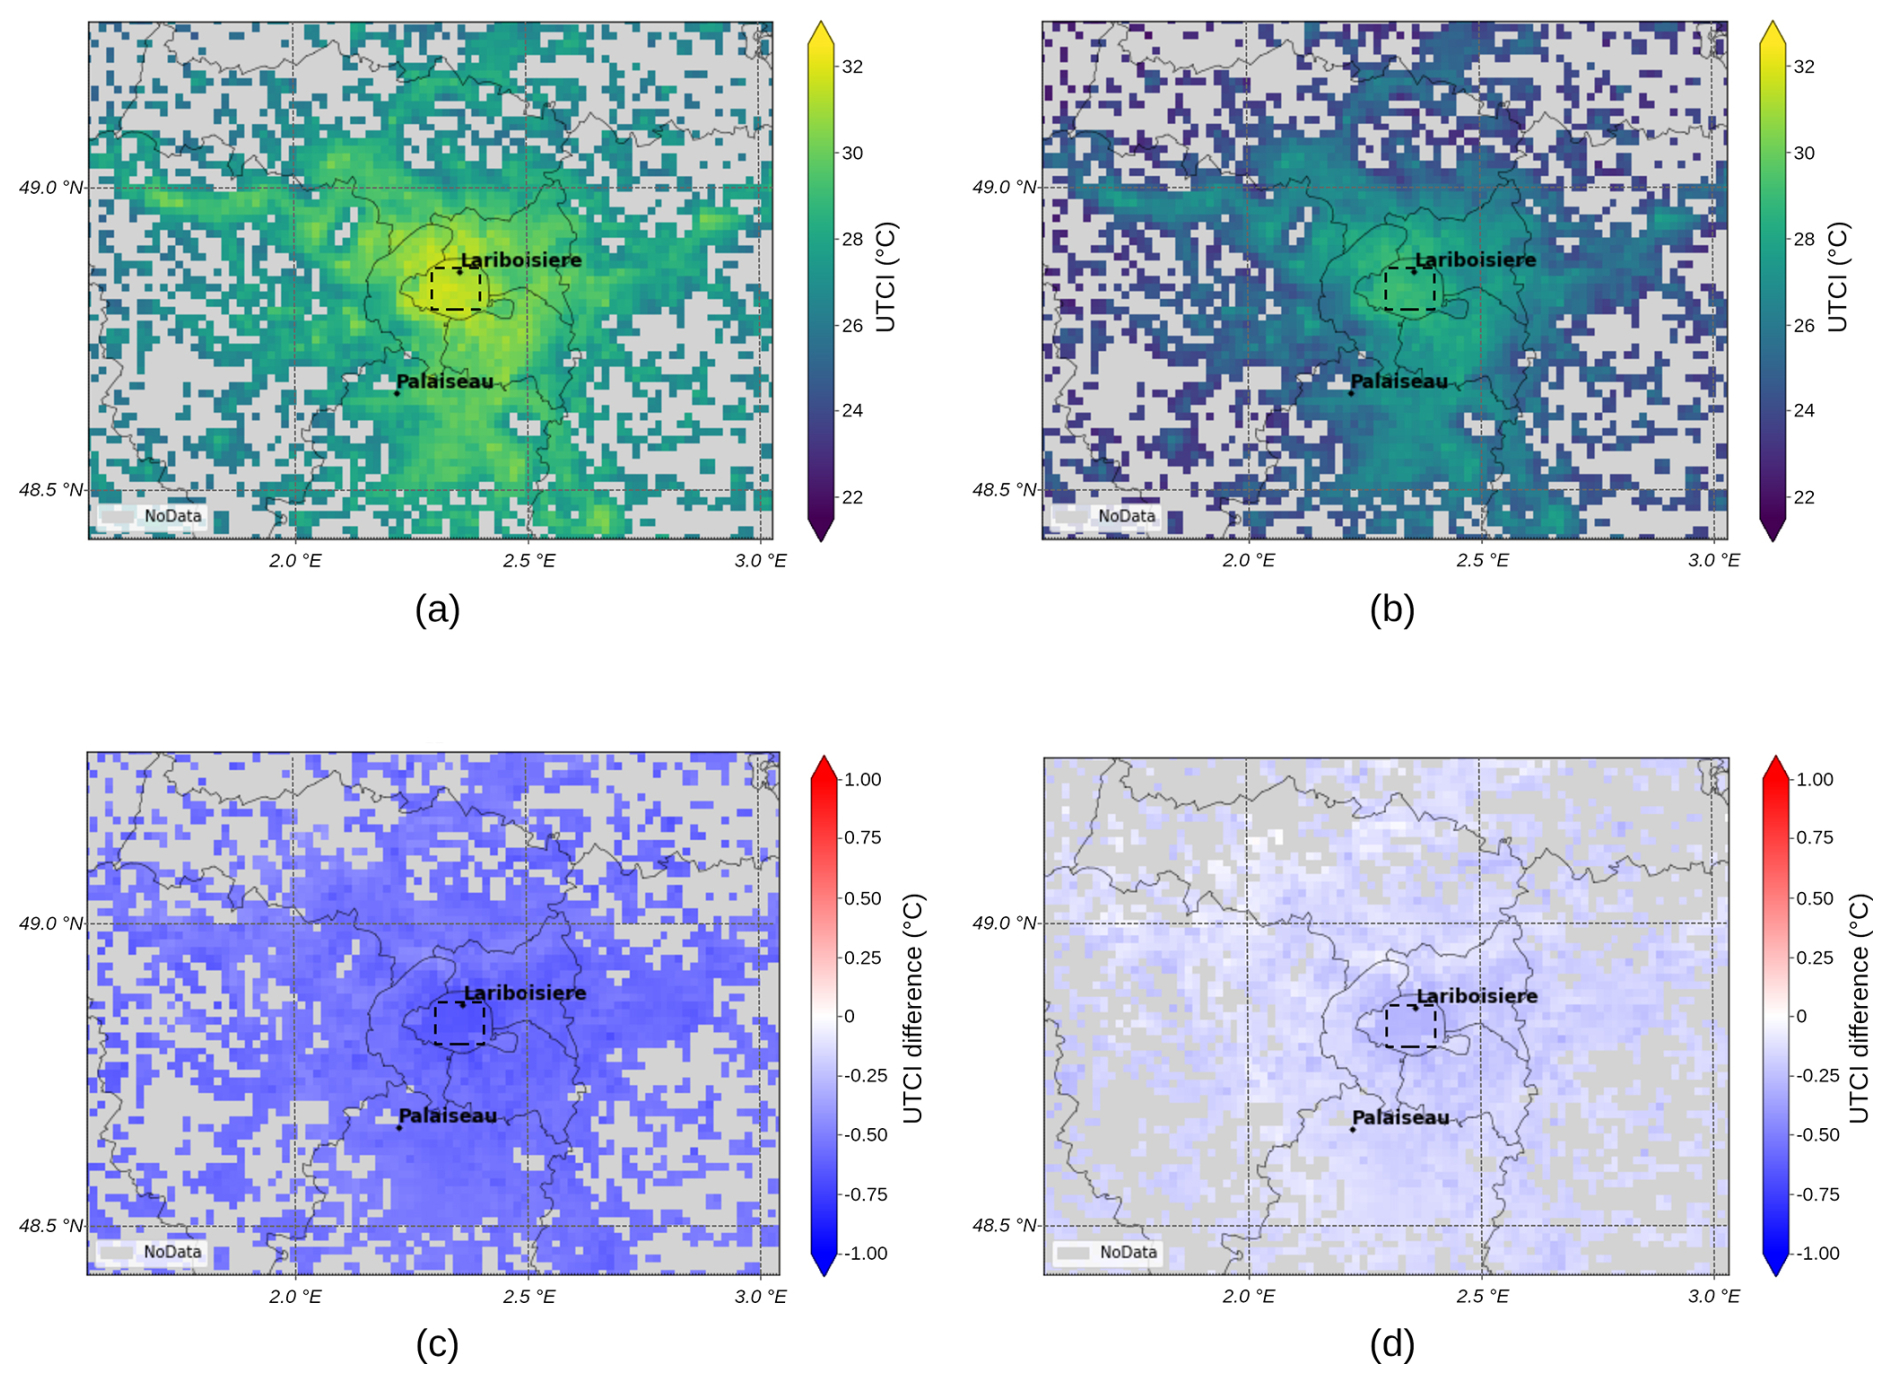
Figure 10UTCI bioclimatic index calculated by TEB on 18 June for the C1 simulation, for a person standing within the urban canyon: (a) in the sun and (b) in the shade. Difference between simulations C1 and C0 in the sun (c) and in the shade (d). The results are averaged for the time period from 15:00 to 17:00 UTC (17:00 to 19:00 LT). Missing data correspond to rural grid cells where the surfaces fluxes are calculated with ISBA only and therefore where no UTCI can calculated by the model.
The contribution of the near-surface air temperature to UTCI can be removed in order to focus only on the UTCI offset term (Eq. 1). The differences in UTCI offset in the sun and in the shade between C1 and C0 show more contrasted results than looking at differences in total UTCI (Fig. 11a, b). In the sun, the dust aerosols reduce the UTCI offset everywhere (Paris city and outside of Paris) (Fig. 11a). This is consistent with the reduction in the mean radiant temperature in the sun between C1 and C0, ranging from 1.05 to 1.87 °C over the domain (Fig. 11c). This is likely due to the increase in AOD that reduces the direct solar radiation at the surface, as described in Wai et al. (2017) for several eastern Asia cities.
However, in the shade, dust aerosols increase the UTCI offset outside Paris ( °C), but have a negligible effect in the Paris city ( °C – Fig. 11b). In the mean time, Tmrt under shade is reduced in the dense Paris city ( °C), see Fig. 11d) but slightly increase outside Paris ( °C). This increase is likely due to the increase in diffuse solar radiation (Fig. 5). However, the contrasting trends in Tmrt and UTCI offset in the Paris city (Fig. 11b, d) suggest that the other variables play a role. In the Paris city, the slight decrease in wind speed ( m s−1 – Fig. 11e) and the increase in relative humidity (0.006±0.0007 %) Fig. 11f) are likely compensating for the decrease in mean radiant temperature. The decrease in wind speed has been previously documented in aerosol impact studies (Péré et al., 2011) and is attributable to the decrease of turbulence in the shallower boundary layer. The increase in relative humidity is explained by the decrease in air temperature, but also by an increase of the specific humidity. The difference in humidity between C1 and C0 reaches its maximum at 16:00 UTC i.e. +0.4 g kg−1 of increase compared to the reference conditions of C0 (8 g kg−1 on average). These more humid conditions near the surface in C1 results from the lower boundary layer height with less entrainment of dry air from upper layers.
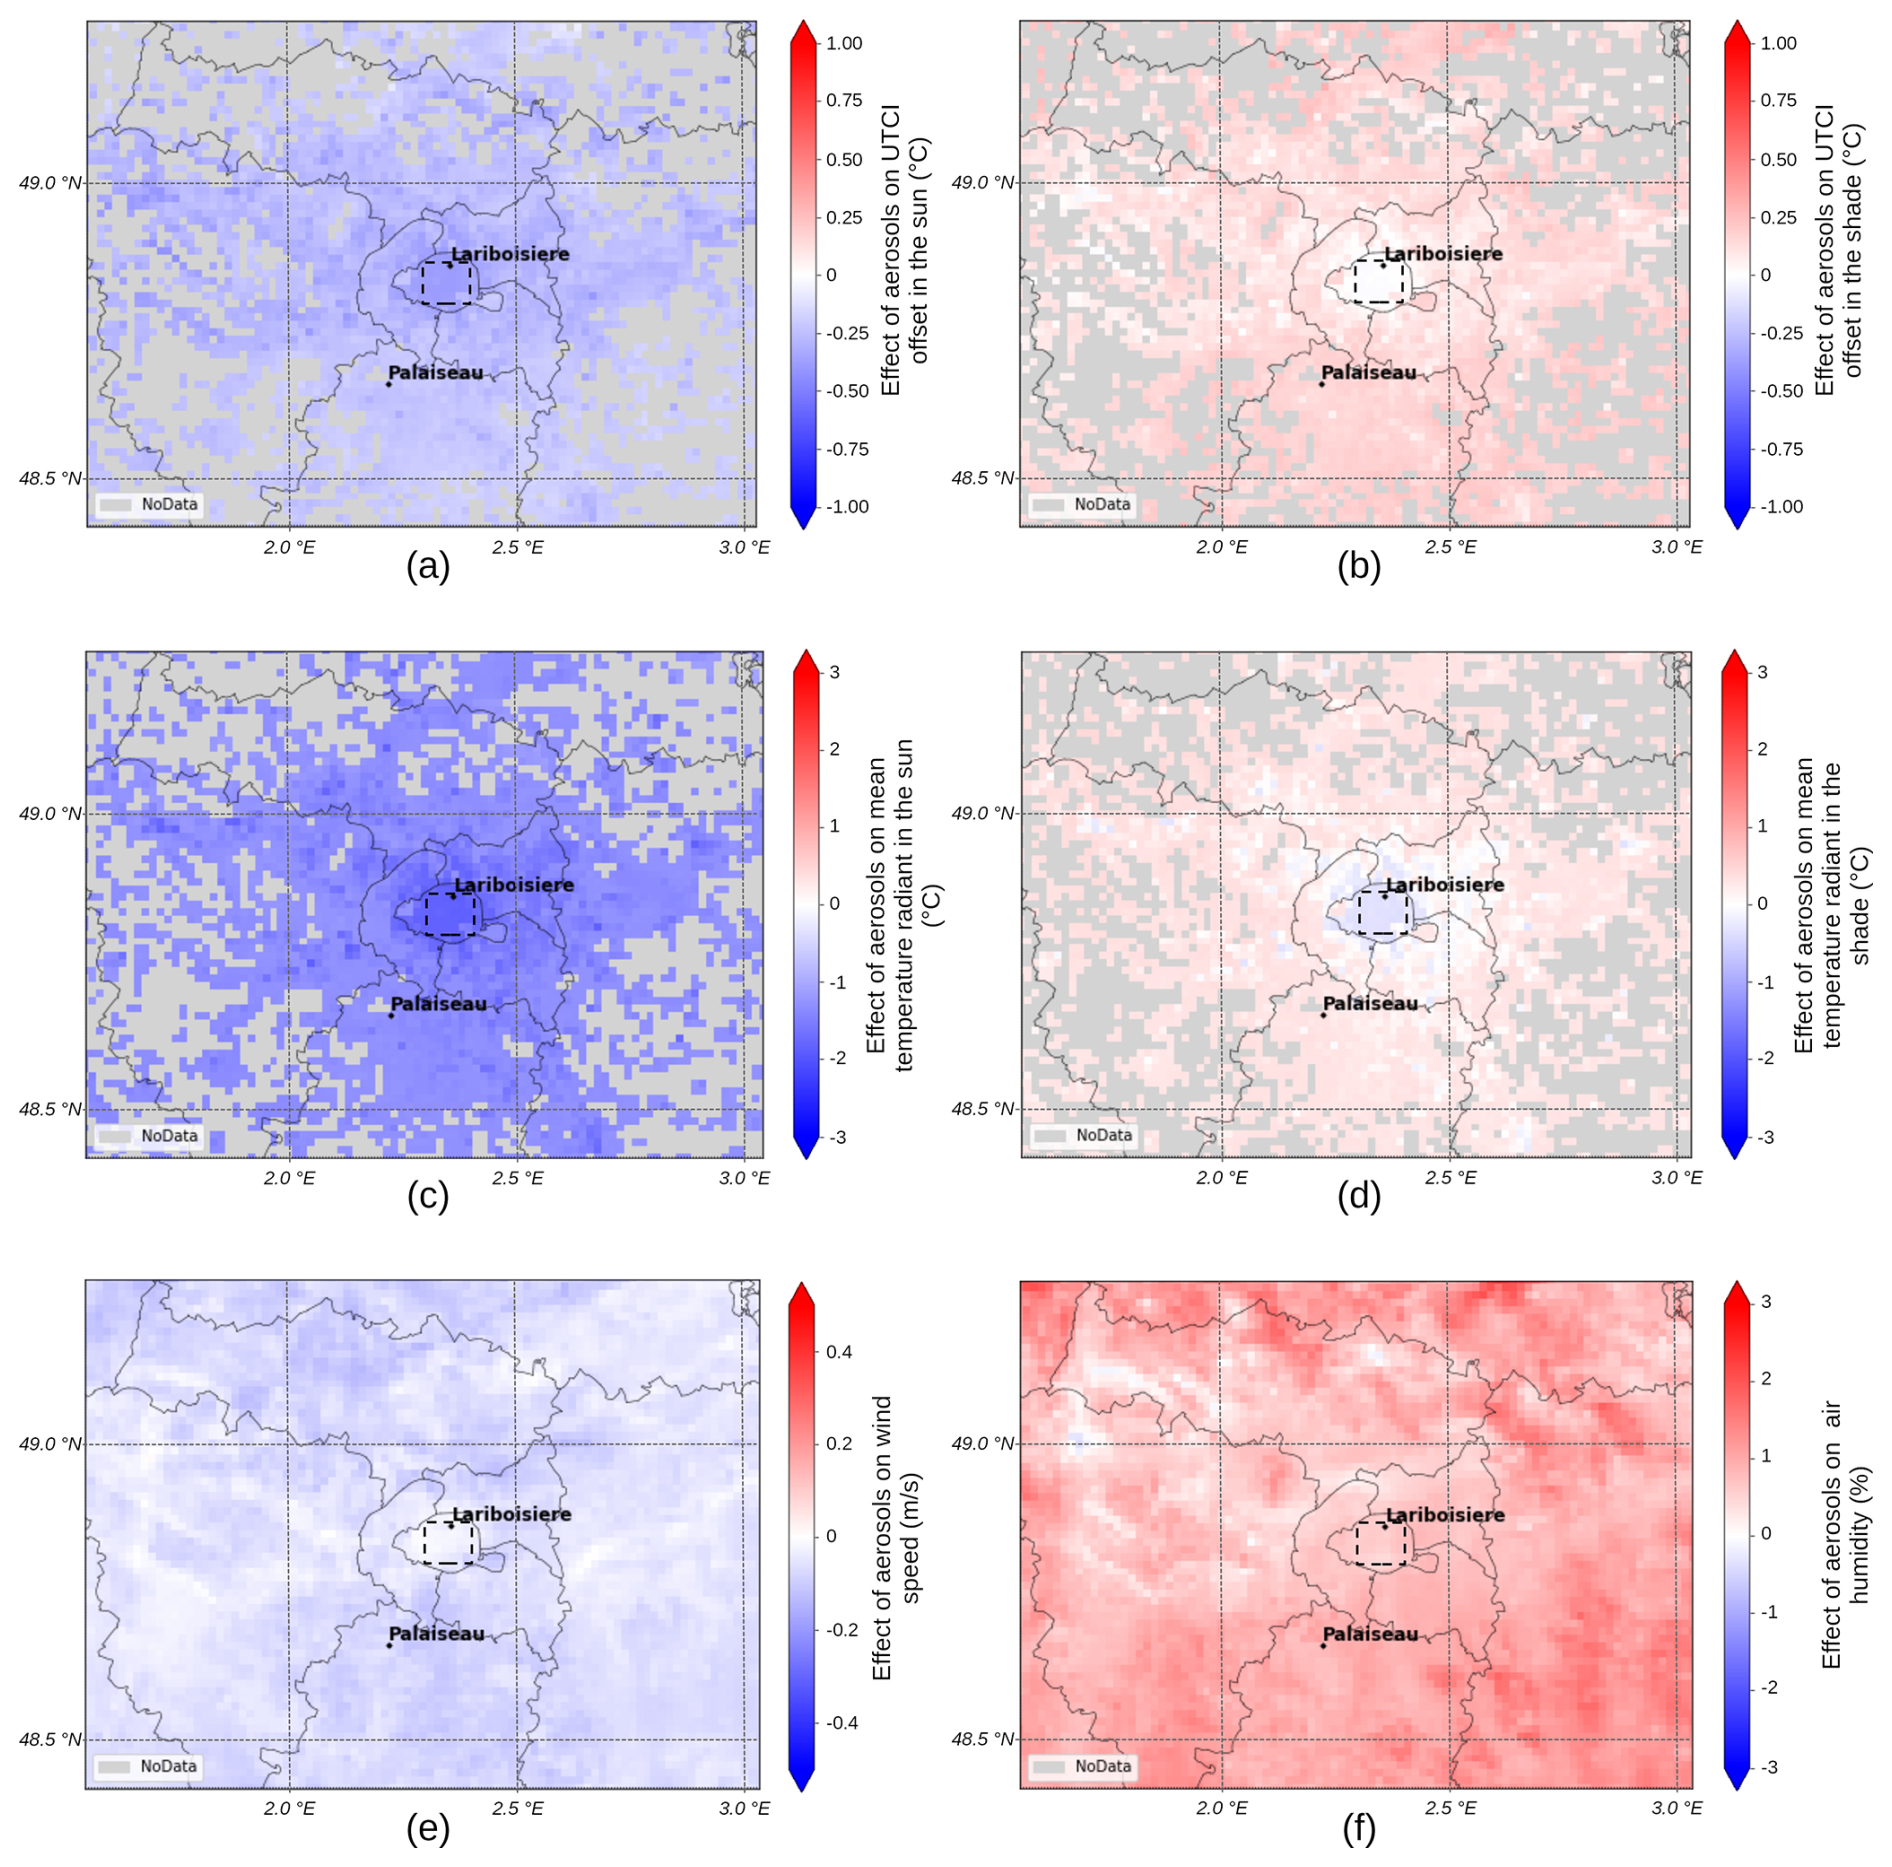
Figure 11Difference between Meso-NH C1 and C0 simulations for the UTCI offset (a) in sun and (b) in shade, the mean radiant temperature (c) in sun and (d) in shade, (e) wind speed and (f) relative humidity. All plots are from 18 June and averaged from 15:00 to 17:00 UTC. Missing data correspond to rural grid cells where the surfaces fluxes are calculated with ISBA only and therefore where no UTCI can calculated by the model.
Two stations located in different environments were chosen to illustrate the temporal variability of the UTCI offset from 15 to 18 June: (i) the Lariboisière station, located in a dense and non-vegetated urban environment within the city of Paris; (ii) the Palaiseau station, a suburban site with grass and sparse and low-rise buildings (see their location in Fig. 3). Note that the definition of each station environment is given based on aggregated spatial information from 1.2 km resolution grid cells.
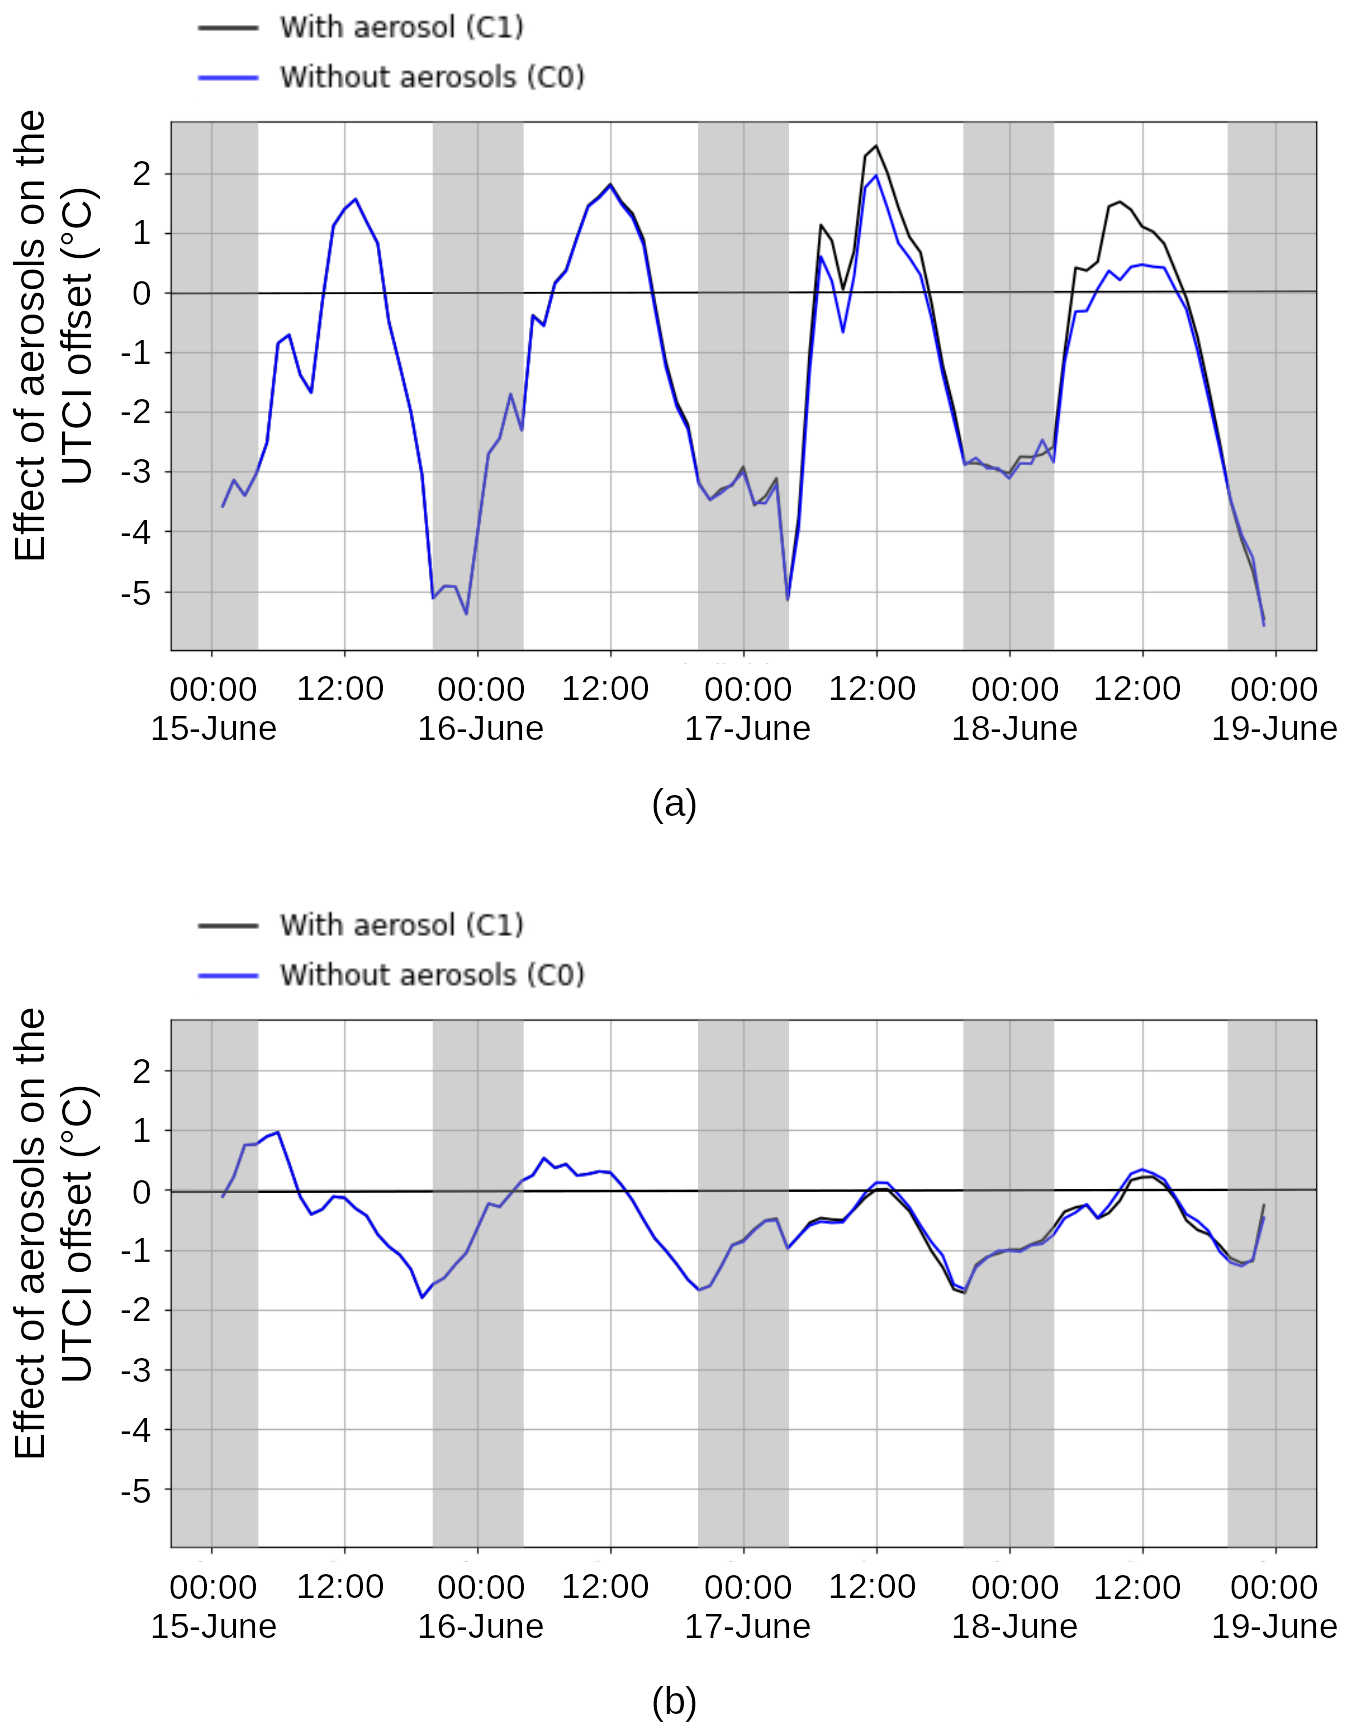
Figure 12Temporal evolution from 15 to 18 June of the UTCI offset in the shade for (a) Palaiseau (suburbs) and (b) Lariboisière (city-center) locations, with and without dust aerosols (black and blue curves, respectively).
Figure 12 shows the temporal evolution from June 15 to June 18 of the UTCI offset in the shade for the locations of Palaiseau (Fig. 12a) and Lariboisière (Fig. 12b). No significant differences are found in the city-center between C0 and C1 simulations. However, while the aerosol plume passes over the Paris region (17 and 18 June), the UTCI offset increases substantially when explicitly considering dust, reaching a maximum difference between C1 and C0 simulations of up to 1.25 °C at 10:00 UTC on 18 June. For that time, in Palaiseau, the differences in Tmrt, wind speed, and relative humidity between C1 and C0 are +1.5 °C, −1 m s−1 and +3 %, respectively (not shown). These effects almost compensate for the cooling due to the air temperature mitigation and thus the presence of aerosol results in a negligible effect on thermal comfort (−0.2 °C). Seen from a different perspective, in terms of thermal comfort for areas in the shade, the level of dust aerosols observed on June 18 is equivalent to a 1.5 °C increase of air temperature.
To identify the contribution of each variable to the effect of aerosols on UTCI (referred to as Ct⋆ with the indice ⋆ for the variable considered), the following calculation, illustrated in Eq. (2) with the variable Ta, is performed for Ta, Tmrt, RH, Uwind.
where the C0 and C1 subscripts refer to values in the C0 and C1 simulations.
Note that the full contribution of each variable can not be considered by this calculation, the UTCI equation defined by Jendritzky et al. (2012) having cross-contribution from each combination of two variables up to order 6. Thus, the sum of the individual contribution of each variable is not equal to the contribution of all variables at once, a residual term attributed to the cross-terms should be added (Eq. 3).
Figure 13a shows the contribution of each meteorological variable to the effect of aerosols on UTCI simulated on 18 June for two locations (Lariboisière and Palaiseau) and two times of the day (10:00 and 16:00 UTC). For all combinations of locations and time, the air temperature is always the most impacted variable (from −1.5 to −0.5 °C). Except for the Palaiseau station at 10:00 UTC, the mean radiant temperature is the second most impacted variable (−0.3 to +0.4 °C). At 10:00 UTC in Palaiseau, the effect of the aerosols on the wind speed is considerable (from 3.1 m s−1 in C0 it drops to 2.2 m s−1 in C1), leading to a +0.5 °C contribution of the wind speed on UTCI value. The rest of the variables has a more limited impacts (absolute value lower than 0.2 °C) for the location and time considered. Note that for all situations investigated here, the cross-term contribution has a rather low value.
As previously observed in Fig. 12, on 18 June, the location (urban versus suburban) has a larger impact on the UTCI offset at 10:00 UTC than at 16:00 UTC: the aerosol-induced reduction of UTCI is higher in Lariboisiere than in Palaiseau with a larger contribution at 10:00 (1 °C) than at 16:00 UTC (0.5 °C). In the afternoon, except for the mean radiant temperature, the contributions of all variables to UTCI are about the same for urban and suburban locations (Fig. 13b).
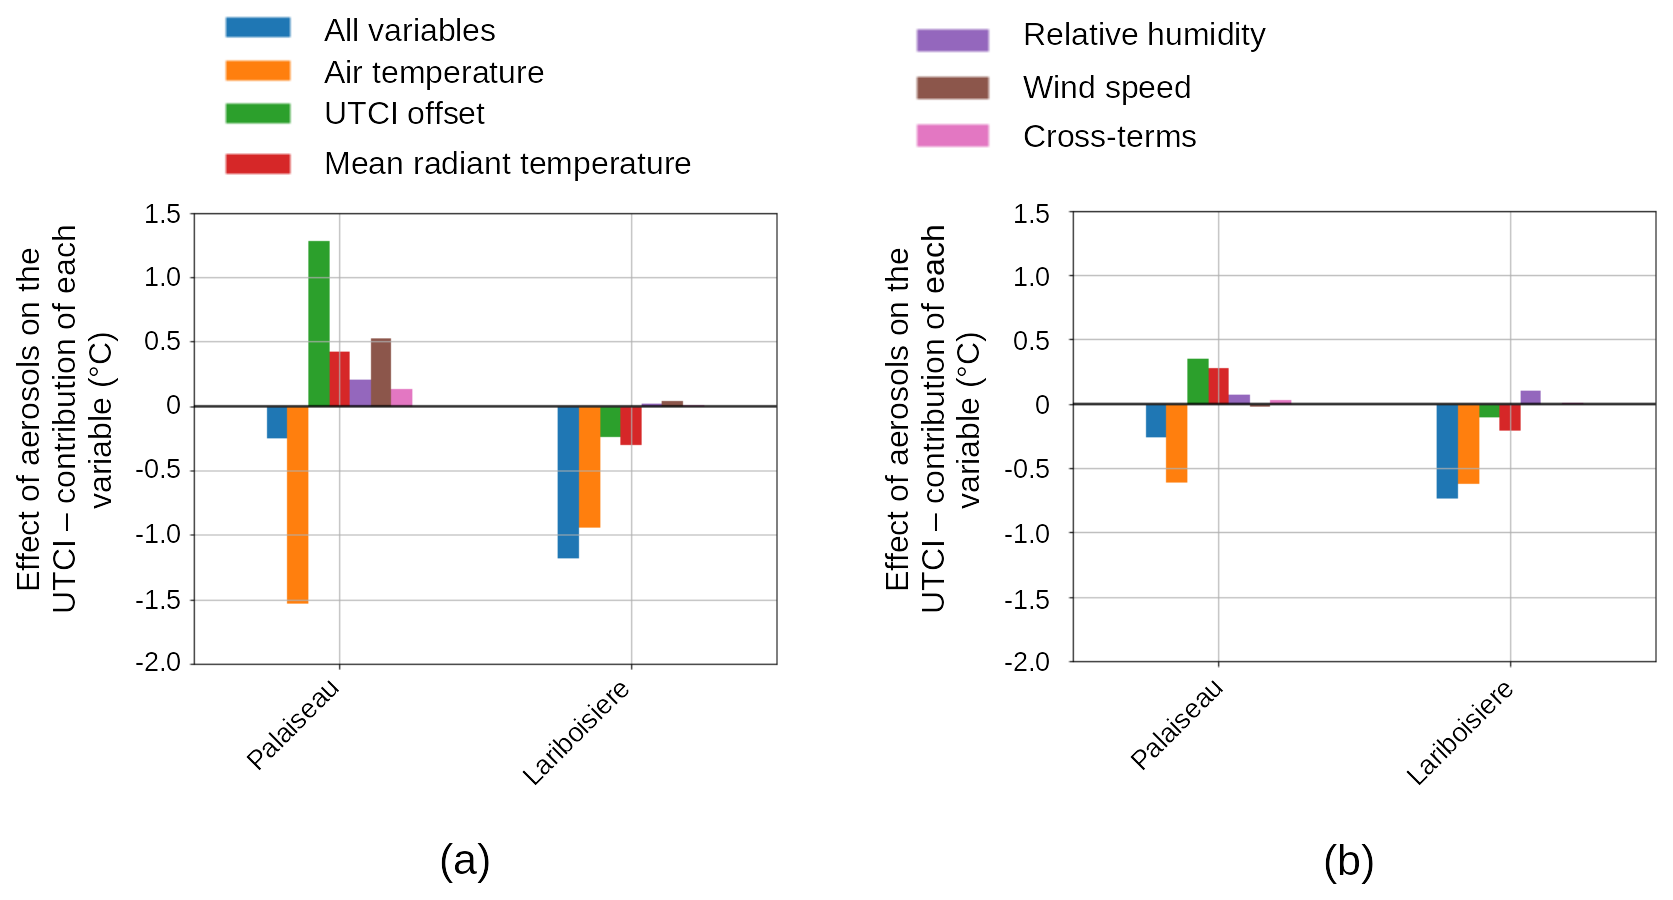
Figure 13Contribution of all and each meteorological variables and cross-terms to the effect of aerosol on the UTCI on 18 June (a) at 10:00 UTC and (b) at 16:00 UTC.
In summary, the presence of a dust plume during a heatwave contributes to reduce global and direct solar radiation and air temperature, improving human thermal comfort in sunlight. However, it also increases diffuse solar radiation and generates a shallower boundary layer, inducing a slightly increased relative humidity and decreased wind-speed. Thus, the thermal comfort improvement under shade is consequently overall limited, and even negligible in suburban areas.
In this study, we showed that dust aerosols significantly affected incident solar radiation leading to an overall attenuation of total radiation and a shift in the direct-to-diffuse ratio toward a larger diffuse component. These radiative effects have consequences on the dynamics of the atmospheric boundary layer, resulting in a decrease in surface air temperature, a slight increase in relative humidity and a slight decrease in wind speed. Such modifications have direct implications for human thermal comfort. Overall, the results of our work are consistent with previous studies that have documented aerosol impacts on meteorological variables and ABL processes, although some differences do emerge, particularly regarding thermal comfort.
Péré et al. (2011) investigated the impact of ozone aerosol pollution on western Europe during the 2003 heatwave using offline-coupled WRF-CHIMERE simulations. Their results showed that aerosols increased AOD, reduced the mean solar radiation received at the surface by 15–30 W m−2, and decreased the near-surface air temperature by approximately 0.3 °C. Aerosol-induced radiation and near-surface air temperature attenuation present geographical variations that can be explained by other influencing factors (properties and distribution of aerosols, or the response of surface fluxes to radiative forcing). This may explain why, in our case, despite comparable AOD values (approximately 0.6 on 18 June 2022) and a similar reduction in solar radiation (−32 W m−2), the decrease in near-surface air temperature was more important (1 °C). The absorption of solar radiation by aerosols is responsible for the heating of air in the ABL. Together with air cooling near the surface, this shrinks the ABL and enhances its stability – even above urban areas (Petäjä et al., 2016) – and weakens the near-surface wind speed (Zhang et al., 2010; Péré et al., 2011), a result also found in the present study.
In the urban environment, most studies have focused on fine anthropogenic aerosols and their influence on radiation and UHI. These studies consistently report a reduction in solar radiation during the day in urban areas, leading to a slight decrease (−0.1 °C) in the daytime air and surface UHI (Li et al., 2018; Wu et al., 2021). At night, fine urban aerosols particles reduce the loss of longwave radiation from the surface (Zheng et al., 2018) and therefore slightly increase the UHI (+0.12 °C, Wu et al., 2021) and the surface UHI (+0.5 °C, Li et al. (2018)). The impact of dust aerosols on UHI has been specifically investigated by Cao et al. (2016) whom showed that, in semi-arid Chinese cities, coarse dust particles enhance surface UHI through increased longwave radiative forcing (up to +0.7 °C for an AOD increase of 0.13). In contrast, the surface UHI increase for cities located in humid or semi-humid climates was found to be negligible. Concerning our Paris study case, although dust aerosols were present over both urban and rural areas, no significant change in nighttime UHI intensity (difference between Lariboisiere and Palaiseau) was observed between aerosol and non-aerosol conditions. During daytime, the average UHI intensity was only marginally higher with aerosols (1.27 °C) than without (1.21 °C). This weak signal likely results from the spatial homogeneity of the dust plume, leading to negligible urban–rural AOD gradients, unlike in Cao et al. (2016).
Finally, the effect of aerosol on the radiative fluxes received by humans have been investigated, to the best of the author's knowledge, only once. Wai et al. (2017) evaluated changes in mean radiant temperature across four East Asian cities for varying AOD conditions by coupling a radiative transfer model and a human thermal comfort model. Their results indicate that increasing AOD (from background levels of 0.1 to seasonal values between 0.4 and 0.9) leads to a higher Tmrt at noon, mainly due to enhanced diffuse radiation. Although the AOD increases in their study is comparable to that observed in the present work (+0.5), our results differ: in our simulations, Tmrt is lower in the presence of dust aerosols. A likely explanation is that, in our framework, aerosols influence not only solar radiation components but also air temperature, thereby affecting longwave radiation exchanges experienced by humans. In contrast, Wai et al. (2017) considered only radiative effects. During summertime and with high AOD value (AOD > 1.4), their results show contrasting responses: AOD ranged between 1.4 and 1.8 led to substantial increases in Tmrt and thermal stress in Chiayi and Hong-Kong, due to an increase in diffuse radiation, whereas very high AOD values (3.1–4) in Beijing and Seoul resulted in lower Tmrt values due to strong attenuation of global radiation. Their analysis also highlights the influence of urban geometry: for all cities and conditions, Tmrt at noon was consistently higher (by 1 °C) in their urban configuration (center of a 18 m wide (W=18 m) street surrounded by 30 m height buildings (H=30 m)) than in their open site reference (i.e without buildings or trees). This contrasts with our findings, where Tmrt for a person standing in the sun on 18 June at noon is significantly higher in the more open site (Palaiseau) than in the urban site (Lariboisière), both without aerosols (+4.46 °C) and with aerosols (+8.07 °C). These discrepancies may arise from differences in urban representation (idealized street canyon vs. building block arrays), as well as street orientation, surface albedo, material thermal properties and air temperature. Despite these differences, both studies converge on a key point: aerosols, through their modulation of direct and diffuse solar radiation, significantly influence human thermal comfort. Depending on aerosol loading and environmental conditions, this could lead to situations where thermal comfort is improved due to the reduction of the total radiative flux, but also where it is negligible – or worsened in Wai et al. (2017) – mainly due to the increase in diffuse solar radiation.
This study investigated the influence of a Saharan dust plume on urban thermal comfort during the 15–19 June 2022 heatwave in the Paris region, leveraging high-resolution atmospheric simulations (Meso-NH at 1.2 km) and observational data from the PANAME-Urban campaign. The results reveal that dust aerosols, with observed aerosol optical depth reaching 0.65 at its highest, substantially reduced incoming solar radiation by up to 75 W m−2 and lower near-surface air temperatures by as much as 1 °C in sunlit urban and suburban areas, leading to measurable improvements in thermal comfort under direct sunlight. However, this radiative attenuation is accompanied by a 30 W m−2 increase in diffuse radiation, a 1 m s−1 reduction in wind speed, and a 0.4 g kg−1 rise in specific humidity, which collectively counteracted the cooling effect in shaded suburban environments, resulting in negligible net changes in thermal comfort (differences of thermal comfort index close to zero between simulations using CAMS dust aerosols – C1 – and no-dust – C0 – scenarios).
The simulations demonstrated that incorporating dust aerosols from CAMS reanalysis improved the accuracy of meteorological predictions, particularly for solar radiation and air temperature, though biases persisted in boundary layer height simulations due to overestimated vertical mixing. The study also underscored the spatial variability of aerosol impacts: while urban centers experience a 1 °C UTCI reduction in sunlit areas, shaded suburban zones showed minimal improvement due to compensatory effects of humidity and wind speed.
While these findings are specific to a Saharan dust event, they provide a foundation for exploring the broader implications of aerosol-climate interactions in urban areas. Future research could extend this framework to cities closer to dust sources (e.g., Athens or Dakar), where aerosol optical depths frequently exceed 1.0, or to anthropogenic aerosols, which may exhibit different radiative and dynamic effects. Additionally, integrating these insights into operational heat-health warning systems – by coupling aerosol forecasts with bioclimatic indices like the UTCI – could enhance adaptive urban planning and public health responses during extreme heat events.
The Meso-NH code is maintained and updated by CNRM and LAERO, and it is freely available for download at https://doi.org/10.5281/zenodo.15095131 (Meso-NH team, 2024). Météo-France data such as Radome observations, and AROME analyses and forecasts are available online at https://meteo.data.gouv.fr/ (last access: 7 September 2026). Raw observational data from the PANAME-Urban campaign are available from the AERIS data centre catalogue at https://paname.aeris-data.fr/data-catalogue-2/ (last access: 7 September 2026). The modified sources of the Meso-NH code, the configuration files and the CAMS data used to run the simulations are freely available for download at https://zenodo.org/records/19374105 (last access: 7 September 2026). Output data are available upon request.
JB has performed the simulations and analyses and contributed to all stages of the paper writing. TN performed the simulations, and contributed to the analyses and writing of the paper. VM coordinated the project proposal for CNRM, supervised the study, and contributed to the analyses and the writing of the paper. AL contributed to the analyses and reviewed the final draft of the paper. JW and QR provided support for the simulations and reviewed the final draft of the paper. PT contributed as expert in aerosols modeling and revised the final draft of the paper.
The contact author has declared that none of the authors has any competing interests.
Publisher's note: Copernicus Publications remains neutral with regard to jurisdictional claims made in the text, published maps, institutional affiliations, or any other geographical representation in this paper. The authors bear the ultimate responsibility for providing appropriate place names. Views expressed in the text are those of the authors and do not necessarily reflect the views of the publisher.
We gratefully acknowledge the support and funding from the EU Action 2021-2-29 User-centric Assessment of Climate Change Impacts for Adaptation [U-CLIMADAPT] under Grant Agreement No 2022/SI2.879178 and SI2.879180/ SGA 20 implementing the FPA 275/G/GRO/COPE/17/10042. We also acknowledge the French National Research Infrastructure CLIMERI-France (https://climeri-france.fr/, last access: 7 September 2026) which provides national label for the code Meso-NH. Numerical simulations have been undertaken on the Belenos HPC facility of Météo-France (Atos Bull Sequana with AMD Rome processors). We would like to thank Alejandra Velazquez-Garcia and Cyrielle Deanjean as well as Simone Kotthaus for the helpful discussions on dust transport and boundary layer height, respectively.
This research has been supported by the European Commission, Horizon 2020 Framework Programme (grant nos. 2022/SI2.879178 and SI2.879180).
This paper was edited by Marco Gaetani and reviewed by two anonymous referees.
Bangert, M., Nenes, A., Vogel, B., Vogel, H., Barahona, D., Karydis, V. A., Kumar, P., Kottmeier, C., and Blahak, U.: Saharan dust event impacts on cloud formation and radiation over Western Europe, Atmos. Chem. Phys., 12, 4045–4063, https://doi.org/10.5194/acp-12-4045-2012, 2012. a
Basart, S., Nickovic, S., Terradellas, E., Cuevas, E., García-Pando, C. P., García-Castrillo, G., Werner, E., and Benincasa, F.: The WMO SDS-WAS Regional Center for Northern Africa, Middle East and Europe, E3S Web of Conferences, 99, 04008, https://doi.org/10.1051/e3sconf/20199904008, 2019. a
Bernstein, D. N., Neelin, J. D., Li, Q. B., and Chen, D.: Could aerosol emissions be used for regional heat wave mitigation?, Atmos. Chem. Phys., 13, 6373–6390, https://doi.org/10.5194/acp-13-6373-2013, 2013. a
Boone, A., Samuelsson, P., Gollvik, S., Napoly, A., Jarlan, L., Brun, E., and Decharme, B.: The interactions between soil–biosphere–atmosphere land surface model with a multi-energy balance (ISBA-MEB) option in SURFEXv8 – Part 1: Model description, Geosci. Model Dev., 10, 843–872, https://doi.org/10.5194/gmd-10-843-2017, 2017. a
Bröde, P., Fiala, D., Błażejczyk, K., Holmér, I., Jendritzky, G., Kampmann, B., Tinz, B., and Havenith, G.: Deriving the operational procedure for the Universal Thermal Climate Index (UTCI), Int. J. Biometeorol., 56, 481–494, https://doi.org/10.1007/s00484-011-0454-1, 2012. a, b
Brousseau, P., Seity, Y., Ricard, D., and Léger, J.: Improvement of the forecast of convective activity from the AROME-France system, Q. J. Roy. Meteorol. Soc., 142, 2231–2243, https://doi.org/10.1002/qj.2822, 2016. a
Cao, C., Lee, X., Liu, S., Schultz, N., Xiao, W., Zhang, M., and Zhao, L.: Urban heat islands in China enhanced by haze pollution, Nat. Commun., 7, 12509, https://doi.org/10.1038/ncomms12509, 2016. a, b, c
Crumeyrolle, S., Tulet, P., Gomes, L., Garcia-Carreras, L., Flamant, C., Parker, D. J., Matsuki, A., Formenti, P., and Schwarzenboeck, A.: Transport of dust particles from the Bodélé region to the monsoon layer – AMMA case study of the 9–14 June 2006 period, Atmos. Chem. Phys., 11, 479–494, https://doi.org/10.5194/acp-11-479-2011, 2011. a
Córdoba-Jabonero, C., Sicard, M., López-Cayuela, M.-Á., Ansmann, A., Comerón, A., Zorzano, M.-P., Rodríguez-Gómez, A., and Muñoz-Porcar, C.: Aerosol radiative impact during the summer 2019 heatwave produced partly by an inter-continental Saharan dust outbreak – Part 1: Short-wave dust direct radiative effect, Atmos. Chem. Phys., 21, 6455–6479, https://doi.org/10.5194/acp-21-6455-2021, 2021. a
Cuxart, J., Bougeault, P., and Redelsperger, J.-L.: A turbulence scheme allowing for mesoscale and large-eddy simulations, Q. J. Roy. Meteorol. Soc., 126, 1–30, https://doi.org/10.1002/qj.49712656202, 2000. a
Decharme, B., Boone, A., Delire, C., and Noilhan, J.: Local evaluation of the Interaction between Soil Biosphere Atmosphere soil multilayer diffusion scheme using four pedotransfer functions, J. Geophys. Res.-Atmos., 116, https://doi.org/10.1029/2011JD016002, 2011. a
de Munck, C., Lemonsu, A., Masson, V., Le Bras, J., and Bonhomme, M.: Evaluating the impacts of greening scenarios on thermal comfort and energy and water consumptions for adapting Paris city to climate change, Urban Climate, 23, 260–286, https://doi.org/10.1016/j.uclim.2017.01.003, 2018. a
Demuzere, M., Kittner, J., Martilli, A., Mills, G., Moede, C., Stewart, I. D., van Vliet, J., and Bechtel, B.: A global map of local climate zones to support earth system modelling and urban-scale environmental science, Earth Syst. Sci. Data, 14, 3835–3873, https://doi.org/10.5194/essd-14-3835-2022, 2022. a
Fiala, D., Havenith, G., Bröde, P., Kampmann, B., and Jendritzky, G.: UTCI-Fiala multi-node model of human heat transfer and temperature regulation, Int. J. Biometeorol., 56, 429–441, https://doi.org/10.1007/s00484-011-0424-7, 2012. a
Fouquart, Y.: Computations of solar heating of the Earth's atmosphere: A new parameterization, Beitraeg. Physik Atmos., 53, 35, http://pascal-francis.inist.fr/vibad/index.php? (action=getRecordDetail&idt=PASCAL8030435628 (last access: 7 September 2026), 1980. a
Fujibe, F.: Urban warming in Japanese cities and its relation to climate change monitoring, Int. J. Climatol., 31, 162–173, https://doi.org/10.1002/joc.2142, 2011. a
Garrouste, O. and Lemonsu, A.: PANAME 2022 thermodynamic profiles from soundings at Bercy, AERIS atmosphere Data and Services Centre [dataset], https://doi.org/10.25326/448, 2023. a
Grini, A., Tulet, P., and Gomes, L.: Dusty weather forecasts using the MesoNH mesoscale atmospheric model, J. Geophys. Res.-Atmos., 111, https://doi.org/10.1029/2005JD007007, 2006. a, b
Haeffelin, M., Barthès, L., Bock, O., Boitel, C., Bony, S., Bouniol, D., Chepfer, H., Chiriaco, M., Cuesta, J., Delanoë, J., Drobinski, P., Dufresne, J.-L., Flamant, C., Grall, M., Hodzic, A., Hourdin, F., Lapouge, F., Lemaître, Y., Mathieu, A., Morille, Y., Naud, C., Noël, V., O'Hirok, W., Pelon, J., Pietras, C., Protat, A., Romand, B., Scialom, G., and Vautard, R.: SIRTA, a ground-based atmospheric observatory for cloud and aerosol research, Ann. Geophys., 23, 253–275, https://doi.org/10.5194/angeo-23-253-2005, 2005. a
Haeffelin, M., Ribaud, J.-F., Céspedes, J., Dupont, J.-C., Lemonsu, A., Masson, V., Nagel, T., and Kotthaus, S.: Impact of boundary layer stability on urban park cooling effect intensity, Atmos. Chem. Phys., 24, 14101–14122, https://doi.org/10.5194/acp-24-14101-2024, 2024. a
Han, W., Li, Z., Wu, F., Zhang, Y., Guo, J., Su, T., Cribb, M., Fan, J., Chen, T., Wei, J., and Lee, S.-S.: The mechanisms and seasonal differences of the impact of aerosols on daytime surface urban heat island effect, Atmos. Chem. Phys., 20, 6479–6493, https://doi.org/10.5194/acp-20-6479-2020, 2020. a, b
Hersbach, H., Bell, B., Berrisford, P., Biavati, G., Horányi, A., Muñoz Sabater, J., Nicolas, J., Peubey, C., Radu, R., Rozum, I., Schepers, D., Simmons, A., Soci, C., Dee, D., and Thépaut, J-N.: ERA5 hourly data on pressure levels from 1940 to present, Copernicus climate change service (c3s) climate data store (cds), Copernicus Climate Change Service, 10, 24381, https://doi.org/10.24381/cds.bd0915c6, 2023. a, b
Hoarau, T., Barthe, C., Tulet, P., Claeys, M., Pinty, J.-P., Bousquet, O., Delanoë, J., and Vié, B.: Impact of the generation and activation of sea salt aerosols on the evolution of Tropical Cyclone Dumile, J. Geophys. Res.-Atmos., 123, 8813–8831, https://doi.org/10.1029/2017JD028125, 2018. a
Hodnebrog, Ø., Myhre, G., Jouan, C., Andrews, T., Forster, P. M., Jia, H., Loeb, N. G., Olivié, D. J. L., Paynter, D., Quaas, J., Raghuraman, S. P., and Schulz, M.: Recent reductions in aerosol emissions have increased Earth's energy imbalance, Commun. Earth Environ., 5, 166, https://doi.org/10.1038/s43247-024-01324-8, 2024. a
Holben, B. N., Eck, T. F., Slutsker, I., Tanré, D., Buis, J. P., Setzer, A., Vermote, E., Reagan, J. A., Kaufman, Y. J., Nakajima, T., Lavenu, F., Jankowiak, I., and Smirnov, A.: AERONET – A Federated Instrument Network and Data Archive for Aerosol Characterization, Remote Sens. Environ., 66, 1–16, https://doi.org/10.1016/S0034-4257(98)00031-5, 1998. a
Honnert, R., Masson, V., Lac, C., and Nagel, T.: A theoretical analysis of mixing length for atmospheric models from micro to large scales, Front. Earth Sci., 8, 582056, https://doi.org/10.3389/feart.2020.582056, 2021. a
Inness, A., Ades, M., Agustí-Panareda, A., Barré, J., Benedictow, A., Blechschmidt, A.-M., Dominguez, J. J., Engelen, R., Eskes, H., Flemming, J., Huijnen, V., Jones, L., Kipling, Z., Massart, S., Parrington, M., Peuch, V.-H., Razinger, M., Remy, S., Schulz, M., and Suttie, M.: The CAMS reanalysis of atmospheric composition, Atmos. Chem. Phys., 19, 3515–3556, https://doi.org/10.5194/acp-19-3515-2019, 2019. a, b, c
IPCC: Climate Change 2021: The Physical Science Basis. Contribution of Working Group I to the Sixth Assessment Report of the Intergovernmental Panel on Climate Change, edited by: Masson-Delmotte, V., Zhai, P., Pirani, A., Connors, S. L., Péan, C., Berger, S., Caud, N., Chen, Y., Goldfarb, L., Gomis, M. I., Huang, M., Leitzell, K., Lonnoy, E., Matthews, J. B. R., Maycock, T. K., Waterfield, T., Yelekçi, O., Yu, R., and Zhou, B., Cambridge University Press, Cambridge, United Kingdom and New York, NY, USA, 2391 pp., https://doi.org/10.1017/9781009157896, 2021. a
Jendritzky, G., De Dear, R., and Havenith, G.: UTCI – why another thermal index?, Int. J. Biometeorol., 56, 421–428, https://doi.org/10.1007/s00484-011-0513-7, 2012. a
Kotthaus, S., Haeffelin, M., Drouin, M.-A., Dupont, J.-C., Grimmond, S., Haefele, A., Hervo, M., Poltera, Y., and Wiegner, M.: Tailored Algorithms for the Detection of the Atmospheric Boundary Layer Height from Common Automatic Lidars and Ceilometers (ALC), Remote Sens., 12, https://doi.org/10.3390/rs12193259, 2020. a
Lac, C., Chaboureau, J.-P., Masson, V., Pinty, J.-P., Tulet, P., Escobar, J., Leriche, M., Barthe, C., Aouizerats, B., Augros, C., Aumond, P., Auguste, F., Bechtold, P., Berthet, S., Bielli, S., Bosseur, F., Caumont, O., Cohard, J.-M., Colin, J., Couvreux, F., Cuxart, J., Delautier, G., Dauhut, T., Ducrocq, V., Filippi, J.-B., Gazen, D., Geoffroy, O., Gheusi, F., Honnert, R., Lafore, J.-P., Lebeaupin Brossier, C., Libois, Q., Lunet, T., Mari, C., Maric, T., Mascart, P., Mogé, M., Molinié, G., Nuissier, O., Pantillon, F., Peyrillé, P., Pergaud, J., Perraud, E., Pianezze, J., Redelsperger, J.-L., Ricard, D., Richard, E., Riette, S., Rodier, Q., Schoetter, R., Seyfried, L., Stein, J., Suhre, K., Taufour, M., Thouron, O., Turner, S., Verrelle, A., Vié, B., Visentin, F., Vionnet, V., and Wautelet, P.: Overview of the Meso-NH model version 5.4 and its applications, Geosci. Model Dev., 11, 1929–1969, https://doi.org/10.5194/gmd-11-1929-2018, 2018. a
Lau, K. K.-L., Tan, Z., Morakinyo, T. E., and Ren, C.: Effects of Urban Geometry on Mean Radiant Temperature, pp. 69–83, Springer Singapore, Singapore, ISBN 978-981-16-5245-5, https://doi.org/10.1007/978-981-16-5245-5_5, 2022. a
Lemonsu, A., Barrau, S., Capo, J., Céspedes, J., Dahech, S., de Munck, C., Dumas, G., Jean-Charles, D., Dupuis, V., Etienne, J.-C., Garrouste, O., Goret, M., Haeffelin, M., Keravec, P., Kotthaus, S., Madelin, M., Martinet, P., Masson, V., Nagel, T., Price, J., Ribaud, J.-F., Rivollet, M., Roberts, G., Roy, A., Unger, V., Wilson, R., Wallois, S., and Wurtz, J.: PANAME-Urban Campaign: Investigating Multiscale Surface – Atmosphere Interactions and Thermal Contrasts in the Paris Region (France), B. Am. Meteorol. Soc., 107, https://doi.org/10.1175/BAMS-D-23-0293.1, 2026. a, b, c
Li, H., Meier, F., Lee, X., Chakraborty, T., Liu, J., Schaap, M., and Sodoudi, S.: Interaction between urban heat island and urban pollution island during summer in Berlin, Sci. Total Environ., 636, 818–828, https://doi.org/10.1016/j.scitotenv.2018.04.254, 2018. a, b
Lindberg, F. and Grimmond, C.: The influence of vegetation and building morphology on shadow patterns and mean radiant temperatures in urban areas: model development and evaluation, Theor. Appl. Climatol., 105, 311–323, https://doi.org/10.1007/s00704-010-0382-8, 2011. a
Lindberg, F., Wallenberg, N., Thorsson, S., Haeger-Eugensson, M., Lönn, J., Holmberg, B., Frid, M., and Fahlström, J.: Micro-scale, city-wide analysis of outdoor thermal comfort during heatwaves in high latitude cities: influence of building geometry and vegetation, Int. J. Biometeorol., 69, 3421–3434, https://doi.org/10.1007/s00484-025-03030-2, 2025. a, b
Liu, B., Ma, Y., Gong, W., Zhang, M., and Shi, Y.: The relationship between black carbon and atmospheric boundary layer height, Atmos. Pollut. Res., 10, 65–72, https://doi.org/10.1016/j.apr.2018.06.007, 2019. a
Lunet, T., Lac, C., Auguste, F., Visentin, F., Masson, V., and Escobar, J.: Combination of WENO and explicit Runge–Kutta methods for wind transport in the Meso-NH model, Mon. Weather Rev., 145, 3817–3838, https://doi.org/10.1175/MWR-D-16-0343.1, 2017. a
Macdonald, R. W.: Modelling The Mean Velocity Profile In The Urban Canopy Layer, Bound.-Layer Meteorol., 97, 25–45, https://doi.org/10.1023/A:1002785830512, 2000. a
Masson, V.: A physically-based scheme for the urban energy budget in atmospheric models, Bound.-Layer Meteorol., 94, 357–397, https://doi.org/10.1023/A:1002463829265, 2000. a
Masson, V., Le Moigne, P., Martin, E., Faroux, S., Alias, A., Alkama, R., Belamari, S., Barbu, A., Boone, A., Bouyssel, F., Brousseau, P., Brun, E., Calvet, J.-C., Carrer, D., Decharme, B., Delire, C., Donier, S., Essaouini, K., Gibelin, A.-L., Giordani, H., Habets, F., Jidane, M., Kerdraon, G., Kourzeneva, E., Lafaysse, M., Lafont, S., Lebeaupin Brossier, C., Lemonsu, A., Mahfouf, J.-F., Marguinaud, P., Mokhtari, M., Morin, S., Pigeon, G., Salgado, R., Seity, Y., Taillefer, F., Tanguy, G., Tulet, P., Vincendon, B., Vionnet, V., and Voldoire, A.: The SURFEXv7.2 land and ocean surface platform for coupled or offline simulation of earth surface variables and fluxes, Geosci. Model Dev., 6, 929–960, https://doi.org/10.5194/gmd-6-929-2013, 2013. a
Masson, V., Lemonsu, A., Hidalgo, J., and Voogt, J.: Urban climates and climate change, Annu. Rev. Environ. Resour., 45, 411–444, https://doi.org/10.1146/annurev-environ-012320-083623, 2020. a
Meso-NH team: Meso-NH (5.7.1), Zenodo [software], https://doi.org/10.5281/zenodo.15095131, 2024. a
Mlawer, E. J., Taubman, S. J., Brown, P. D., Iacono, M. J., and Clough, S. A.: Radiative transfer for inhomogeneous atmospheres: RRTM, a validated correlated-k model for the longwave, J. Geophys. Res.-Atmos., 102, 16663–16682, https://doi.org/10.1029/97JD00237, 1997. a
Morcrette, J.-J. and Fouquart, Y.: The overlapping of cloud layers in shortwave radiation parameterizations, J. Atmos. Sci., 43, 321–328, https://doi.org/10.1175/1520-0469(1986)043<0321:TOOCLI>2.0.CO;2, 1986. a
Noilhan, J. and Planton, S.: A simple parameterization of land surface processes for meteorological models, Mon. Weather Rev., 117, 536–549, https://doi.org/10.1175/1520-0493(1989)117<0536:ASPOLS>2.0.CO;2, 1989. a
Oke, T. R.: Initial guidance to obtain representative meteorological observations at urban sites, vol. 81, World Meteorological Organization, WMO/TD No. 1250, https://library.wmo.int/viewer/35333?medianame=wmo-td_1250_#page=1&viewer=picture&o=bookmark&n=0&q= (last access: 7 September 2026), 2004. a
Oke, T. R., Mills, G., Christen, A., and Voogt, J. A.: Urban climates, Cambridge university press, https://doi.org/10.1017/9781139016476, 2017. a
Park, S.-U., Ahn, H.-J., and Park, M.-S.: Direct shortwave radiative forcing of the Asian dust aerosol on dust emission, Theor. Appl. Climatol., 101, 179–190, https://doi.org/10.1007/s00704-009-0245-3, 2010. a
Pergaud, J., Masson, V., Malardel, S., and Couvreux, F.: A parameterization of dry thermals and shallow cumuli for mesoscale numerical weather prediction, Bound.-Lay. Meteorol., 132, 83–106, https://doi.org/10.1007/s10546-009-9388-0, 2009. a
Petäjä, T., Järvi, L., Kerminen, V.-L., Ding, A. J., Sun, J. N., Nie, W., Kujansuu, J., Virkkula, A., Yang, X., Fu, C. B., Zilitinkevich, S., and Kulmala, M.: Enhanced air pollution via aerosol-boundary layer feedback in China, Sci. Rep., 6, 18998, https://doi.org/10.1038/srep18998, 2016. a
Pinty, J.-P. and Jabouille, P.: A mixed-phase cloud parameterization for use in mesoscale non-hydrostatic model: simulations of a squall line and of orographic precipitations, in: Proceedings of the Conference of Cloud Physics, 17–21 August 1998. Boston MA, pp. 217–220, American Meteorological Society, http://mesonh.aero.obs-mip.fr/mesonh/dir_publication/pinty_jabouille_ams_ccp1998.pdf (last access: 7 September 2026), 1998. a
Péré, J. C., Mallet, M., Pont, V., and Bessagnet, B.: Impact of aerosol direct radiative forcing on the radiative budget, surface heat fluxes, and atmospheric dynamics during the heat wave of summer 2003 over western Europe: A modeling study, J. Geophys. Res.-Atmos., 116, https://doi.org/10.1029/2011JD016240, 2011. a, b, c, d, e, f
Redon, E., Lemonsu, A., and Masson, V.: An urban trees parameterization for modeling microclimatic variables and thermal comfort conditions at street level with the Town Energy Balance model (TEB-SURFEX v8.0), Geosci. Model Dev., 13, 385–399, https://doi.org/10.5194/gmd-13-385-2020, 2020. a
Redon, E. C., Lemonsu, A., Masson, V., Morille, B., and Musy, M.: Implementation of street trees within the solar radiative exchange parameterization of TEB in SURFEX v8.0, Geosci. Model Dev., 10, 385–411, https://doi.org/10.5194/gmd-10-385-2017, 2017. a
Rémy, S., Kipling, Z., Huijnen, V., Flemming, J., Nabat, P., Michou, M., Ades, M., Engelen, R., and Peuch, V.-H.: Description and evaluation of the tropospheric aerosol scheme in the Integrated Forecasting System (IFS-AER, cycle 47R1) of ECMWF, Geosci. Model Dev., 15, 4881–4912, https://doi.org/10.5194/gmd-15-4881-2022, 2022. a, b
Riette, S.: Development of “Physical Parametrizations with PYthon” (PPPY, version 1.1) and its usage to reduce the time-step dependency in a microphysical scheme, Geosci. Model Dev., 13, 443–460, https://doi.org/10.5194/gmd-13-443-2020, 2020. a
Schepanski, K.: Transport of Mineral Dust and Its Impact on Climate, Geosciences, 8, 151, https://doi.org/10.3390/geosciences8050151, 2018. a, b
Schoetter, R., Kwok, Y. T., de Munck, C., Lau, K. K. L., Wong, W. K., and Masson, V.: Multi-layer coupling between SURFEX-TEB-v9.0 and Meso-NH-v5.3 for modelling the urban climate of high-rise cities, Geosci. Model Dev., 13, 5609–5643, https://doi.org/10.5194/gmd-13-5609-2020, 2020. a
Seity, Y., Brousseau, P., Malardel, S., Hello, G., Bénard, P., Bouttier, F., Lac, C., and Masson, V.: The AROME-France convective-scale operational model, Mon. Weather Rev., 139, 976–991, https://doi.org/10.1175/2010MWR3425.1, 2011. a
Skamarock, W. C., Klemp, J. B., Dudhia, J., Gill, D. O., Barker, D. M., Wang, W., and Powers, J. G.: A description of the advanced research WRF version 2, Tech. rep., NCAR, https://www2.mmm.ucar.edu/wrf/users/docs/technote/v2_technote.pdf (last access: 7 September 2026), 2005. a
Slater, J., Tonttila, J., McFiggans, G., Connolly, P., Romakkaniemi, S., Kühn, T., and Coe, H.: Using a coupled large-eddy simulation–aerosol radiation model to investigate urban haze: sensitivity to aerosol loading and meteorological conditions, Atmos. Chem. Phys., 20, 11893–11906, https://doi.org/10.5194/acp-20-11893-2020, 2020. a
Stocker, T. F., Qin, D., Plattner, G.-K., Tignor, M. M. B., Allen, S. K., Boschung, J., Nauels, A., Xia, Y., Bex, V., Midgley, P. M., Alexander, L. V., Allen, S. K., Bindoff, N. L., Breon, F.-M., Church, J. A., Cubasch, U., Emori, S., Forster, P., Friedlingstein, P., Gillett, N., Gregory, J. M., Hartmann, D. L., Jansen, E., Kirtman, B., Knutti, R., Kumar Kanikicharla, K., Lemke, P., Marotzke, J., Masson-Delmotte, V., Meehl, G. A., Mokhov, I. I., Piao, S., Plattner, G.-K., Dahe, Q., Ramaswamy, V., Randall, D., Rhein, M., Rojas, M., Sabine, C., Shindell, D., Stocker, T. F., Talley, L. D., Vaughan, D. G., Xie, S.-P., Allen, M. R., Boucher, O., Chambers, D., Hesselbjerg Christensen, J., Ciais, P., Clark, P. U., Collins, M., Comiso, J. C., Vasconcellos de Menezes, V., Feely, R. A., Fichefet, T., Fiore, A. M., Flato, G., Fuglestvedt, J., Hegerl, G., Hezel, P. J., Johnson, G. C., Kaser, G., Kattsov, V., Kennedy, J., Klein Tank, A. M. G., Le Quere, C., Myhre, G., Osborn, T., Payne, A. J., Perlwitz, J., Power, S., Prather, M., Rintoul, S. R., Rogelj, J., Rusticucci, M., Schulz, M., Sedlacek, J., Stott, P. A., Sutton, R., Thorne, P. W., and Wuebbles, D.: Climate Change 2013. The Physical Science Basis. Working Group I Contribution to the Fifth Assessment Report of the Intergovernmental Panel on Climate Change – Abstract for decision-makers, https://www.osti.gov/etdeweb/biblio/22221318 (last access: 7 September 2026), 2013. a
Tardieu, J. and Leroy, M.: Radome, le réseau temps réel d'observation au sol de Météo-France, La Météorologie, 40, 40–43, https://doi.org/10.4267/2042/36262, 2003. a
Tegen, I., Hollrig, P., Chin, M., Fung, I., Jacob, D., and Penner, J.: Contribution of different aerosol species to the global aerosol extinction optical thickness: Estimates from model results, J. Geophys. Res.-Atmos., 102, 23895–23915, https://doi.org/10.1029/97JD01864, 1997. a, b
Thorsson, S., Rocklöv, J., Konarska, J., Lindberg, F., Holmer, B., Dousset, B., and Rayner, D.: Mean radiant temperature – A predictor of heat related mortality, Urban Clim., 10, 332–345, https://doi.org/10.1016/j.uclim.2014.01.004, 2014. a
Tulet, P., Grini, A., Griffin, R. J., and Petitcol, S.: ORILAM-SOA: A computationally efficient model for predicting secondary organic aerosols in three-dimensional atmospheric models, J. Geophys. Res.-Atmos., 111, https://doi.org/10.1029/2006JD007152, 2006. a
Tulet, P., Mallet, M., Pont, V., Pelon, J., and Boone, A.: The 7–13 March 2006 dust storm over West Africa: Generation, transport, and vertical stratification, J. Geophys. Res.-Atmos., 113, https://doi.org/10.1029/2008JD009871, 2008. a
Wai, K.-M., Ng, E. Y. Y., Wong, C. M. S., Tan, T. Z., Lin, T.-H., Lien, W.-H., Tanner, P. A., Wang, C. S. H., Lau, K. K. L., He, N. M. H., and Kim, J.: Aerosol pollution and its potential impacts on outdoor human thermal sensation: East Asian perspectives, Environ. Res., 158, 753–758, https://doi.org/10.1016/j.envres.2017.07.036, 2017. a, b, c, d, e
Wang, Z., Xue, L., Liu, J., Ding, K., Lou, S., Ding, A., Wang, J., and Huang, X.: Roles of Atmospheric Aerosols in Extreme Meteorological Events: a Systematic Review, Curr. Pollut. Rep., 8, 177–188, https://doi.org/10.1007/s40726-022-00216-9, 2022. a, b
Wiki – CNRM: Wiki – ECOCLIMAP-SG – CNRM Open Source Site, https://opensource.umr-cnrm.fr/projects/ecoclimap-sg/wiki (last access: 20 February 2025), 2018. a
Wu, H., Wang, T., Wang, Q., Cao, Y., Qu, Y., and Nie, D.: Radiative effects and chemical compositions of fine particles modulating urban heat island in Nanjing, China, Atmos. Environ., 247, 118201, https://doi.org/10.1016/j.atmosenv.2021.118201, 2021. a, b
Wurtz, J., Bouniol, D., and Vié, B.: Improvements to the parametrization of snow in AROME in the context of ice crystal icing, Q. J. Roy. Meteorol. Soc., https://doi.org/10.1002/qj.4437, 2023. a
Zhang, Y., Wen, X. Y., and Jang, C. J.: Simulating chemistry-aerosol-cloud-radiation-climate feedbacks over the continental U.S. using the online-coupled Weather Research Forecasting Model with chemistry (WRF/Chem), Atmos. Environ., 44, 3568–3582, https://doi.org/10.1016/j.atmosenv.2010.05.056, 2010. a, b
Zhao, A., Bollasina, M. A., and Stevenson, D. S.: Strong Influence of Aerosol Reductions on Future Heatwaves, Geophys. Res. Lett., 46, 4913–4923, https://doi.org/10.1029/2019GL082269, 2019. a
Zheng, Z., Ren, G., Wang, H., Dou, J., Gao, Z., Duan, C., Li, Y., Ngarukiyimana, J. P., Zhao, C., Cao, C., Jiang, M., and Yang, Y.: Relationship between fine-particle pollution and the urban heat island in Beijing, China: Observational evidence, Bound.-Lay. Meteorol., 169, 93–113, https://doi.org/10.1007/s10546-018-0362-6, 2018. a