
the Creative Commons Attribution 4.0 License.
the Creative Commons Attribution 4.0 License.
 | 07 Sep 2026
Impact of high-resolution soil erodibility datasets on dust simulations in WRF-Chem with the GOCART scheme
Leandro Cristian Segado-Moreno

Juan Pedro Montávez
Ginés Garnés-Morales
Eloisa Raluy-López
Pedro Jiménez-Guerrero
Rajesh Kumar
Mineral dust is a major atmospheric aerosol influencing climate, air quality, and human health through radiative and microphysical processes. The Iberian Peninsula is frequently affected by North African dust intrusions, leading to episodic PM10 exceedances that challenge air quality forecasting. However, accurate representation of dust emissions remains limited by uncertainties in soil erodibility, land surface properties, and meteorological forcing.
This study evaluates the impact of two high-resolution soil erodibility datasets on dust simulations using WRF-Chem with the GOCART scheme. The first dataset, EROD-HR, integrates fine-resolution topography to improve dust source representation at 0.0625° (about 5 km) globally and 1 km over the Iberian Peninsula. The second dataset, SOILHD, further refines dust source characterization by incorporating high-resolution soil texture (sand, silt, and clay fractions) and removing misclassified bare-soil areas, resulting in a 1 km global resolution. Both datasets aim to better capture the spatial heterogeneity of dust sources.
Simulations are conducted for five dust episodes between 2022 and 2025, covering local and long-range transport conditions. Model performance is evaluated against PM10 observations from the SINQLAIR network in the Region of Murcia. Results show improved representation of dust emissions, with better agreement in magnitude and timing of PM10 peaks at inland stations. Improvements are more limited at coastal and anthropogenically influenced sites, although statistical metrics (correlation, bias, RMSE) indicate consistent gains.
Overall, high-resolution erodibility datasets enhance dust simulations by reducing biases and improving variability representation, highlighting the importance of detailed land-surface information for regional dust forecasting systems.
- Article
(33643 KB) - Full-text XML
- BibTeX
- EndNote


Mineral dust is one of the most abundant atmospheric aerosols and exerts a significant influence on the Earth's radiation budget through radiative and microphysical processes (Masson-Delmotte et al., 2021). Dust particles scatter and absorb solar and terrestrial radiation, affecting surface and atmospheric heating rates through aerosol direct and semidirect effects (Johnson et al., 2004; Chung, 2012). In addition, mineral aerosols act as cloud condensation and ice-nucleating particles, modifying cloud microphysics, lifetime, and precipitation processes (Tegen and Schepanski, 2009; Kok et al., 2018). These interactions may also influence large-scale atmospheric circulation patterns (Garnés-Morales et al., 2023). Furthermore, dust episodes significantly affect air quality, visibility, and human health at regional and local scales (Mahowald et al., 2007; Tong et al., 2023; Garnés-Morales et al., 2025), as fine particles can penetrate deep into the respiratory system, increasing the risk of respiratory and cardiovascular diseases and premature mortality (Schraufnagel, 2020; Tarín-Carrasco et al., 2021).
The Iberian Peninsula (IP, see d02 in Fig. 1) is frequently affected by dust intrusions originating from North Africa (NA), particularly during spring and summer (Querol et al., 2009; Pey et al., 2013; Salvador et al., 2022; López-Cayuela et al., 2025). These intrusions contribute significantly to surface concentrations of particulate matter with an effective diameter of 10 µm or less (PM10) and 2.5 µm or less (PM2.5), often exceeding European air quality standards (Beloconi and Vounatsou, 2023). In this context, chemistry transport models (CTMs), coupled both online and offline with numerical weather prediction (NWP) models, arise as a key tool to understand and forecast extreme dust concentration events. Accurate simulation of dust events is essential to support mitigation strategies, public health warnings, and operational air quality forecasting systems, as well as better meteorological forecasts. However, simulating dust emission and transport remains a major challenge due to uncertainties in the representation of dust sources, land surface characteristics, and meteorological drivers, particularly at the regional scale (Knippertz and Todd, 2012; Jin et al., 2020; Kok et al., 2020; Rahmati et al., 2020; Zhao et al., 2020, 2021; Ratcliffe et al., 2024; Tan et al., 2025).
Among the CTMs, the Weather Research and Forecasting model coupled with Chemistry (WRF-Chem) has been widely employed for the simulation of mineral dust emissions and transport at regional scales (Grell et al., 2005). WRF-Chem has become a widely used tool for investigating dust emissions and transport due to its ability to interactively simulate meteorological and chemical processes (Rizza et al., 2017; Palacios-Peña et al., 2019; Zeng et al., 2020; Zhao et al., 2020; Lee et al., 2024). One of the most commonly used aerosol schemes among the multiple available within WRF-Chem is the Goddard Chemistry Aerosol Radiation and Transport (GOCART) scheme (Chin et al., 2000; Ginoux et al., 2001). The balance between computational efficiency and accuracy in dust representation makes GOCART suitable for both research and operational applications using WRF-Chem (e.g., Palacios-Peña et al., 2020; Jerez et al., 2021; Georgiou et al., 2022; Pino-Carmona et al., 2024; Yarragunta et al., 2025, among many others). The GOCART scheme considers five species of aerosols: black carbon, organic carbon, dust (5 size-distributed bins), sea salt (5 bins), and sulfates. For the estimation of dust emissions, the GOCART scheme employs surface wind speed, soil moisture, vegetation cover, and a soil erodibility factor that determines the susceptibility of the surface to wind-driven dust uplift (Chin et al., 2000; LeGrand et al., 2019). In the WRF-Chem implementation of the GOCART scheme, this soil erodibility factor is represented by the EROD variable, which describes the spatial distribution of the fraction of erodible surface material. Consequently, EROD plays a fundamental role in controlling both the magnitude and the spatial variability of simulated dust emissions. Despite the widespread use of the GOCART scheme, the default EROD dataset in WRF-Chem is based on a coarse-resolution (0.25°) global topography dataset, which limits its capacity to capture small-scale variations in surface conditions, vegetation cover, and topography that critically affect dust emission processes. This limitation is particularly problematic in regions like the southern IP, where semi-arid conditions, heterogeneous land surface properties, sparse vegetation, and varying soil moisture lead to localized high-emission dust sources that are inadequately represented in coarse-resolution datasets. As a result, dust emissions and surface concentrations are often underestimated in these regions, leading to discrepancies between model simulations and observations. Incorporating a high-resolution topographic dataset can enhance the spatial characterization of dust source areas, providing a more realistic representation of surface conditions for dust emission parameterizations.
Some previous studies attempted to create a more realistic erodibility field in the past, based on ground measurements, satellite products, or both. For example, Li et al. (2023) created a dataset in which erodibility is computed as a function of soil texture, vegetation coverage, soil moisture, and land use, using satellite products (e.g., NDVI, soil moisture) to dynamically modulate the potential for wind erosion. Their study focused on the East Asia region, dominated by the presence of the Gobi and Taklimakan Deserts, which promote high-concentration dust events periodically. However, when looking at the Sahara Desert, the erodibility dataset retrieves unrealistically high values across the entire region, promoting excessively high concentrations. Additionally, the dataset provides moderate erodibility values over high mountain areas with permanent snow or ice, such as the Alps, which are clearly unrealistic. In a recent study, Lee et al. (2025) proposed a similar method that integrates both satellite-derived land-cover characteristics and surface dust observations over the same region. However, their main goal was to determine the capability of the dataset to characterize dust source regions, not to assess the quality of the new dataset with NWP simulations. Spyrou et al. (2022) developed a dynamic dust source map for the GOCART/AFWA mechanism in the WRF-Chem model by incorporating vegetation variability derived from MODIS NDVI data to vary seasonally in response to changes in surface vegetation cover. Two simulations were carried out for the spring of 2017 over the Mediterranean and the Middle East, one using the default dust source map and another using the NDVI-based scheme. The simulations were compared against AERONET aerosol optical depth (AOD) observations. Results showed that the NDVI-based simulation substantially improved model performance, particularly during intense dust events (AOD >0.25), reducing bias and root mean square error (RMSE), while increasing correlation with observations (Spyrou et al., 2022).
Although the proposed approach shows promising results, the study does not include a direct comparison between the NDVI-based dust source map and other existing erodibility databases, relying instead on separate case studies for each configuration. More recently, Faber et al. (2026) developed a reflectance-derived sediment supply map for implementation in the FENGSHA dust emission scheme (Zhang et al., 2022) within the Unified Forecast System (UFS), using satellite surface reflectance as a proxy for sediment availability and dust source activity. Their approach aimed to provide a more physically meaningful representation of preferential dust source regions by linking spectral surface properties with geomorphological controls on sediment supply. The study demonstrated that the reflectance-based dataset was able to reproduce several known dust hotspots and improved the spatial characterization of active source regions compared to traditional static source functions. However, the work primarily focused on the construction and implementation of the dataset within the modeling framework, while the evaluation of its impact on operational or regional NWP dust forecasts remained limited. Additionally, the methodology was developed mainly for large-scale desert environments, leaving its applicability to other regions and modeling configurations still uncertain.
In this study, the development and application of two new high-resolution global erodibility datasets are presented. Firstly, a high-resolution, topography-based dataset, named EROD-HR, was created (Segado-Moreno et al., 2026a). EROD-HR incorporates the fine-resolution GMTED2010 elevation dataset (Danielson and Gesch, 2011), which is also employed in WRF as the default elevation dataset, and is crafted following the methodology described by LeGrand et al. (2019) as a first approach to enhance the representation of dust sources in WRF-Chem simulations using the GOCART scheme. Secondly, to further improve the representation of local-scale dust uptake sources while accounting for the heterogeneity of soil composition (and therefore the dust size distribution), which varies greatly both locally and globally, a novel, local-scale, soil-type-dependent dataset named SOILHD was created (Segado-Moreno et al., 2026b). This dataset aims to extend and refine the new high-resolution EROD-HR field by explicitly incorporating spatial variations in soil composition while removing areas erroneously identified as bare soil by previous datasets. Specifically, the relative mass fractions of sand, silt, and clay at each grid cell were computed. To accomplish this, we have employed the 0–5 cm layer of the soil type fraction dataset ISRIC SoilGrids at a 250 m resolution (Hengl et al., 2017; Poggio et al., 2021), together with bare soil estimates, sourced from a global map of Local Climate Zones developed by Demuzere et al. (2022) and available open source in Demuzere et al. (2023). The new EROD-HR dataset achieves a spatial resolution of 0.0625° (≈5 km) globally and 1 km locally for the IP, a region frequently affected by dust events as a consequence of its proximity to the Sahara Desert and the presence of highly erodible soils and semi-arid climate conditions. Meanwhile, the SOILHD dataset achieves a 1 km resolution globally.
To evaluate the impact of the new high-resolution datasets, an ensemble of case studies is run, including some above-average PM10 concentration events from both local and convective transport sources. The simulations are validated against ground-based PM10 measurements from the regional SINQLAIR network in the Region of Murcia (RM), allowing for the assessment of improvements in the spatial and temporal representation of dust concentrations. Statistical metrics, such as correlation coefficients, mean bias error (MBE), and root mean square error (RMSE), were computed to quantify model performance. This work aims to evaluate the benefits of employing a high-resolution soil erodibility dataset in operational dust forecasting systems for southern Europe, while also contributing to the advancement of high-resolution modeling by demonstrating the added value of incorporating detailed topography into the soil erodibility parameterizations used in regional air quality models.
2.1 Model configuration and experiment design
The Weather Research and Forecasting model coupled with Chemistry (WRF-Chem v4.6.0) was employed to simulate a set of dust events over the RM using the Goddard Chemistry Aerosol Radiation and Transport (GOCART) aerosol scheme, which explicitly represents the emission, transport, deposition, and removal of dust particles (Chin et al., 2000; Grell et al., 2005).
The model configuration consists of three domains with horizontal resolutions of 9 km (d01, North Africa and central Europe), 5 km (d02, IP), and 1 km (d03, RM), covering North Africa and southern Europe, the IP and the RM, respectively (Fig. 1). The model employs 30 vertical levels extending up to 10 hPa, with enhanced resolution near the surface to better resolve boundary layer processes critical for dust emission and transport.
The physical parameterization includes the Morrison two-moment microphysics scheme, the Grell–3D cumulus parameterization (applied to domains d01 and d02 only, as convection is explicitly resolved in the 1 km domain), the RRTMG shortwave and longwave radiation schemes, the Yonsei University (YSU) planetary boundary layer scheme, and the Noah land surface model. A complete list of model options and references is provided in Table 1.
The chemical mechanism selected was the simplified GOCART scheme without ozone chemistry (WRF option 300). The data used to provide initial and boundary meteorological conditions (IC and BC, respectively) for the outer domain (d01) were obtained from the European Centre for Medium-Range Weather Forecasts (ECMWF) fifth-generation reanalysis dataset (ERA5), which provides global coverage at a horizontal resolution of 0.25° and an hourly temporal resolution (Hersbach et al., 2018).
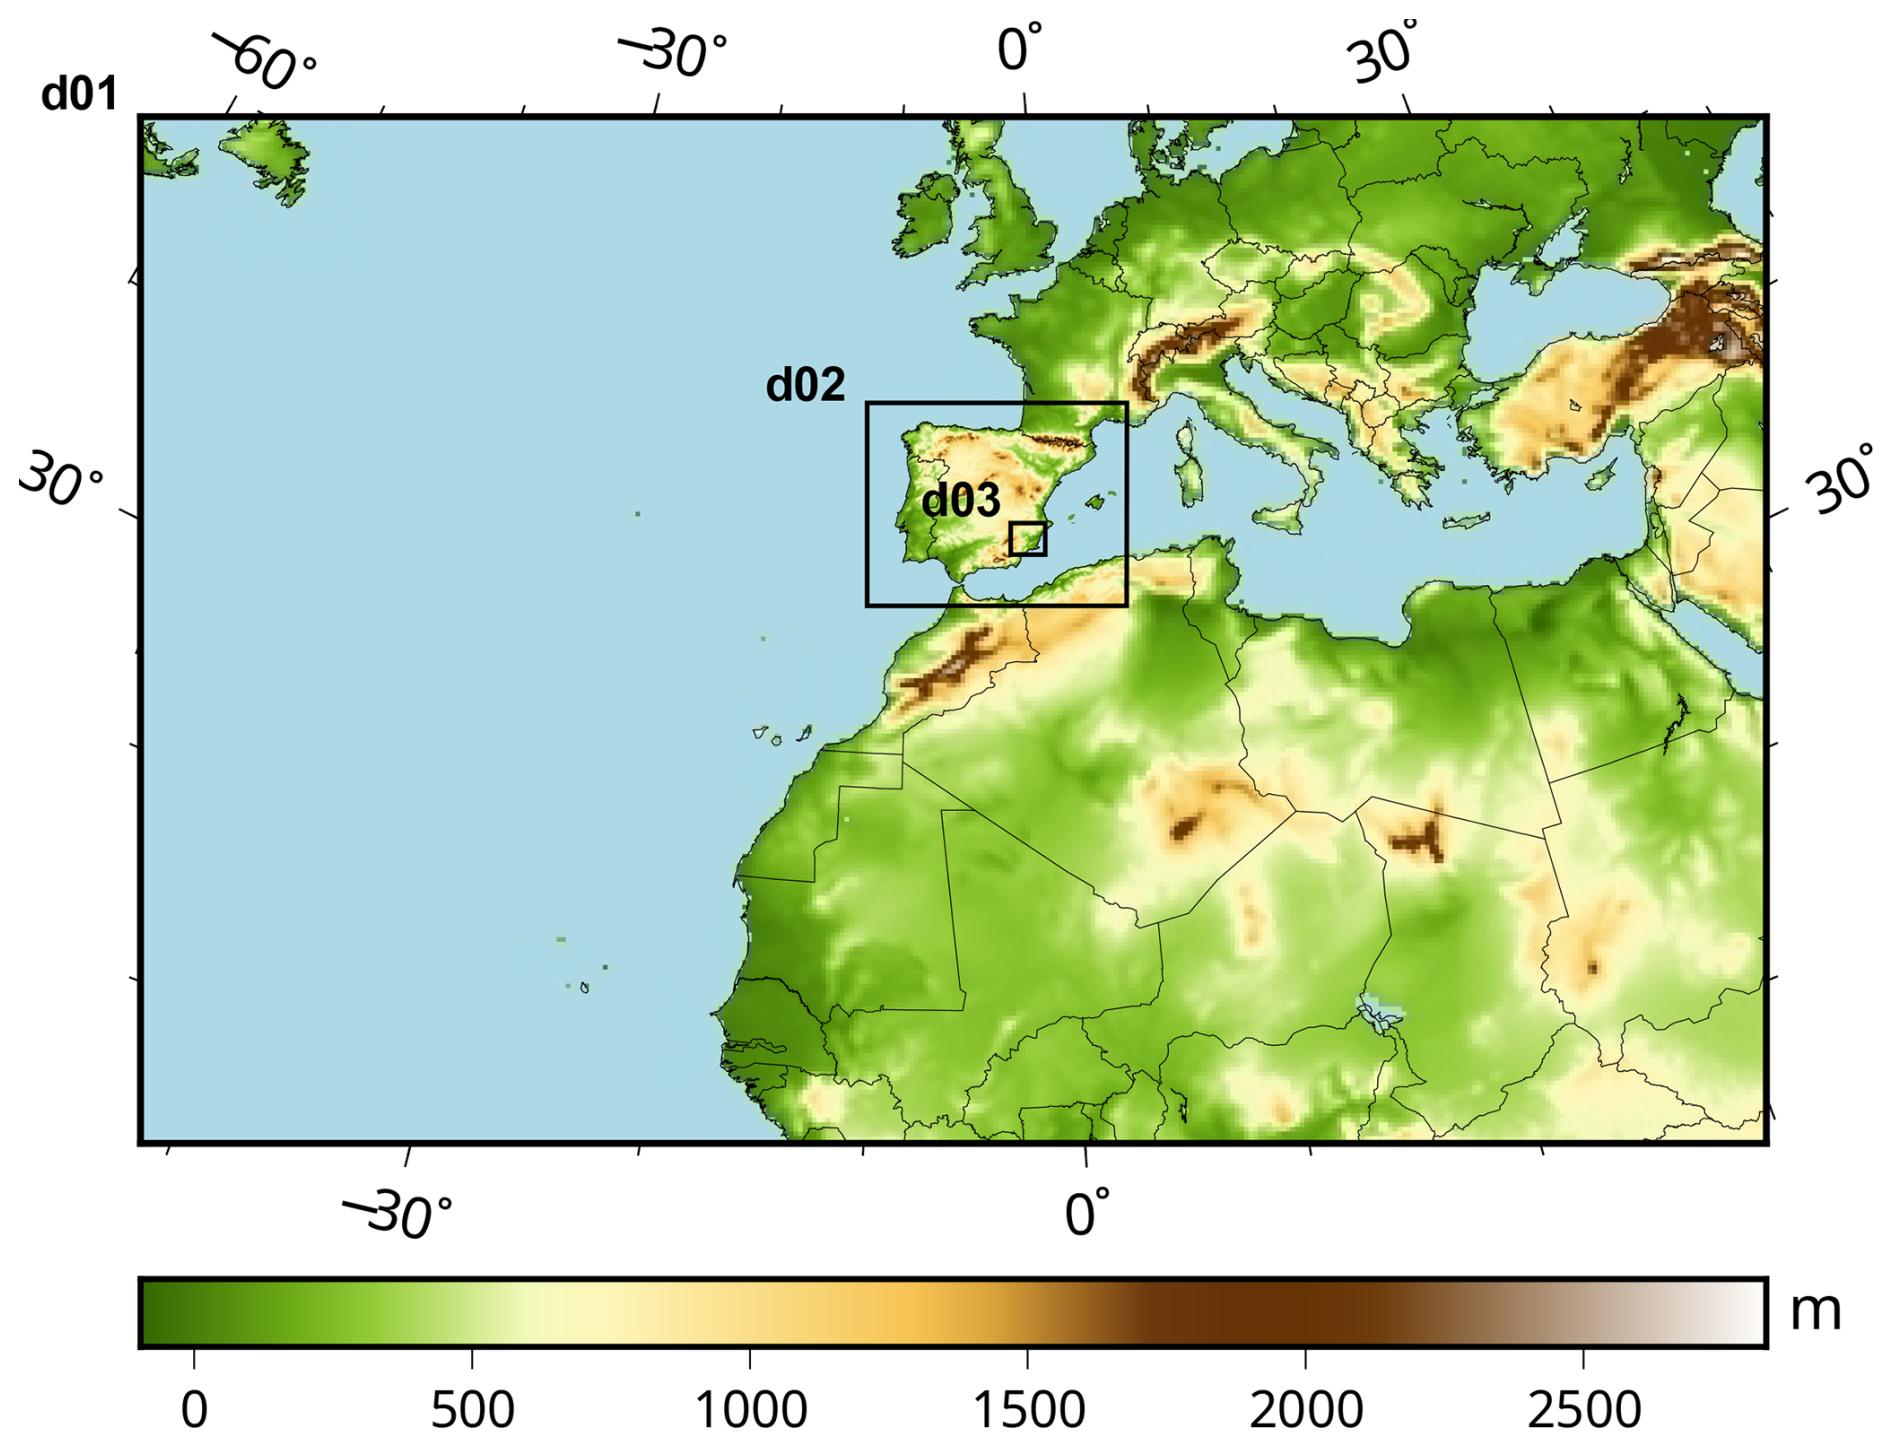
Figure 1Domain of WRF model simulations. The nested domains d02 and d03 are shown in a black frame.
The performance of the newly developed erodibility datasets was evaluated over several simulation periods (Table 2). The simulation periods were not selected to provide a continuous time series but as a set of well-defined case studies representative of the main mechanisms that drive PM10 episodes in the RM. Specifically, the five periods were chosen to sample above-average PM10 events covering the two dominant regimes in the region: long-range Saharan dust advection (March 2022, November 2025) and weak-forcing situations favoring local dust uplift and accumulation (July 2022, August 2025). Additionally, an intermediate situation combining convective dust transport with local uplift processes was included (April 2025). The selection was further constrained by the simultaneous availability of quality-controlled observations across the monitoring network, which is why no episode from 2023–2024 is included. Regarding representativeness, although the five episodes span different seasons and synoptic regimes and are evaluated against eight stations, they constitute an event-based sample. Therefore, the study should be understood as applying to high-PM10 dust episodes rather than to the full climatological PM10 distribution.
To provide meteorological context and characterize the different dust episodes, a synoptic-scale analysis was conducted using daily mean fields of sea-level pressure (SLP), geopotential height at 500 hPa (Z500), and temperature at 850 hPa (T850) derived from the ERA5 reanalysis dataset. Figure C1 presents the daily mean synoptic fields for the peak PM10 day of each episode together with the surrounding days, illustrating the large-scale atmospheric conditions associated with the dust events. Additionally, Figs. C2 and C3 show the corresponding daily mean PM10 distributions simulated using the SOILHD and CTRL datasets, respectively. The synoptic analysis indicates that three of the analyzed episodes (March 2022, April 2025, and November 2025) are associated with large-scale, low-pressure systems over the Atlantic Ocean that promote the transport of Saharan dust toward the IP. In particular, during the March 2022 event, the low-pressure system was centered over northern Morocco, enhancing dust advection into the study region.
In contrast, the remaining two episodes (July 2022 and August 2025) occurred under relatively stable atmospheric conditions characterized by weak synoptic forcing and low wind speeds, favoring the accumulation of PM10. For the August 2025 episode, the simulations reveal a pronounced local dust emission event over the southeastern IP, as shown in the PM10 distribution maps. This behavior is consistent with the observational records, which indicate maximum PM10 concentrations of up to 204.5 µg m−3 during the episode. This event is therefore interpreted as a local dust uplift episode and was selected for a more detailed analysis. In particular, it provides a suitable framework for assessing the capability of the newly developed SOILHD dataset to represent local-scale variability in dust emissions and its subsequent impact on PM10 concentrations. For this reason, a substantial portion of the results discussed in this study focuses on the August 2025 simulations, although all analyzed periods are evaluated throughout the manuscript. For each simulation, the first day was treated as the model spin-up and excluded from the analysis to ensure numerical stability and reduce initialization effects.
Morrison et al. (2005)Iacono et al. (2008)Iacono et al. (2008)Grell (1993); Grell and Dévényi (2002)Hong et al. (2006)Chen and Dudhia (2001)Jiménez et al. (2012)Chin et al. (2000)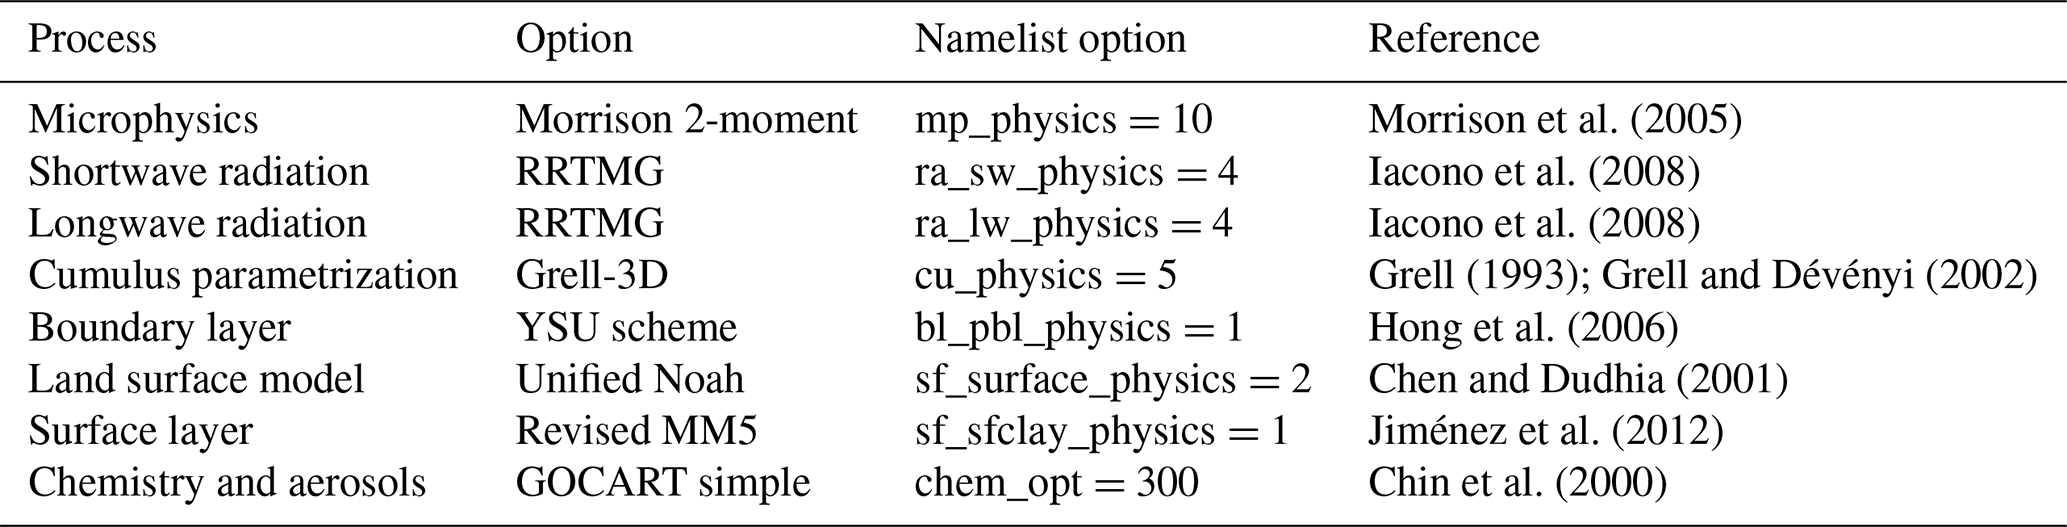
For each period, three experiments were conducted. The first, denoted as the control (CTRL) simulation, employed the default WRF-Chem erodibility dataset. The second, referred to as EROD-HR, utilized the newly developed high-resolution EROD dataset. Finally, the SOILHD experiment incorporated the further enhanced Soil-Type Heterogeneous Dataset. All simulations were run with identical physical and chemical configurations (Table 1), differing only in the erodibility dataset employed to isolate its effect on dust emissions and transport. For the August 2025 period, an additional simulation was performed, featuring the soil erodibility dataset developed by Li et al. (2023), to account for its performance in our domain of simulation. We simply refer to this simulation as LI2023, and its results can be observed in Sect. 3.1 and 3.2 of this work. Dust emissions were computed online using the GOCART scheme, based on 10 m wind speed, soil moisture from the Noah land surface model, and the erodibility factor from the respective dataset, according to Eq. (1).
Table 2Simulation periods covered in this study, together with the mean and maximum observed PM10 concentrations for each event. The reported statistics are computed both temporally over the duration of each episode and spatially across the observational station network.
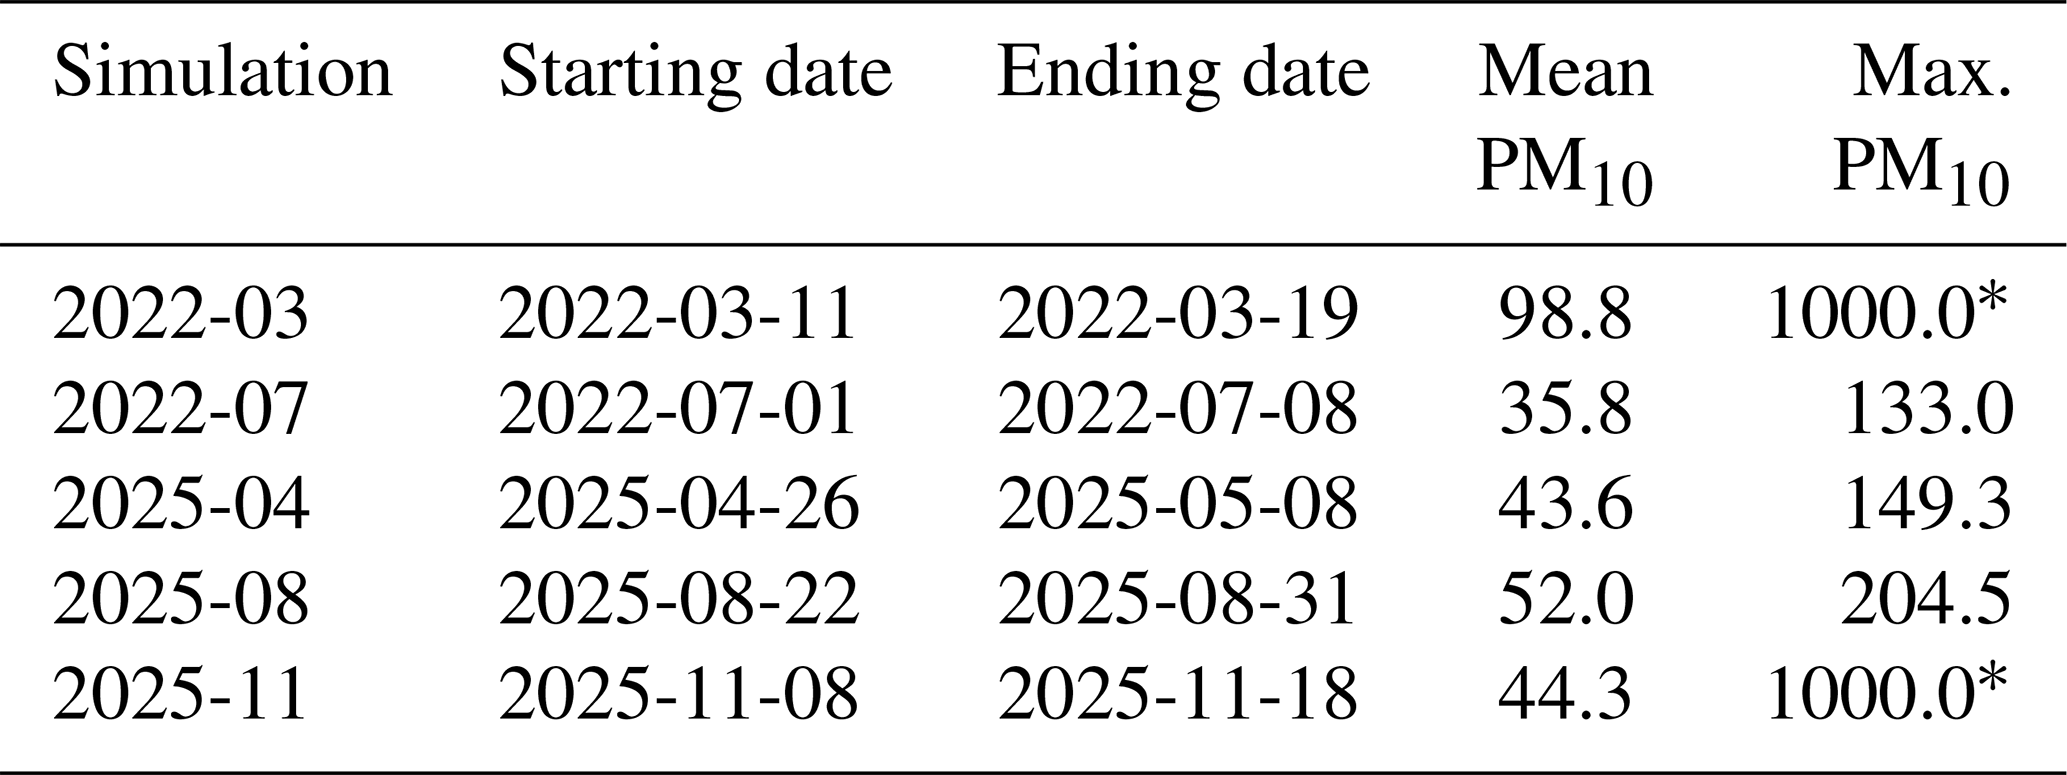
An asterisk (*) denotes saturation of the observational instrument.
2.2 The GOCART scheme and the new erodibility database
In the GOCART scheme, for a given size bin p, the dust emission flux value (kg m−2 s−1) is obtained for each surface model cell using the following equation (Chin et al., 2000; LeGrand et al., 2019):
where C is a dimensional proportionality constant, S is a unitless dust source strength function, sp is the mass fraction of emittable dust from a given dust bin at the surface, U is the horizontal wind speed at 10 m, and Ut is the threshold 10 m wind speed required to initiate erosion for a given particle diameter Dp and soil surface wetness θs. Fp is 0 in any other case where U does not exceed the threshold velocity. Once Ut is surpassed, the dust source function S arises as the key parameter to determine the location and amount of dust emitted. S was originally computed by Chin et al. (2000) based on the idea that dust material is often generated in alluvial processes and accumulates in low points. For this reason, S was determined based on the degree of topographic relief surrounding a model grid cell using the following equation (LeGrand et al., 2019):
where zi is the elevation of the cell, and zmax and zmin are the maximum and minimum elevation in a 10°×10° window centered on the same grid cell. S is set to 0 anywhere bare soil is not indicated by the Advanced Very High Resolution Radiometer (AVHRR) data (DeFries et al., 1999). At the time of this study, the GOCART scheme in WRF uses a precalculated source strength function S, stored in the code as the variable EROD, which is read in and interpolated to the model grid by the WRF-Chem preprocessor (LeGrand et al., 2019). This static field was calculated by applying Eq. (2) to a 0.25° resolution elevation dataset. This results in a coarse-resolution dust source dataset, which limits its ability to represent local-scale dust sources accurately (Figs. 4 and 6).
2.3 Creation of the new databases
In a first step to overcome the spatial limitations of the default 0.25° erodibility field, a new high-resolution dataset (hereafter EROD-HR) was developed following the original formulation of the dust source strength function (Eq. 2), while incorporating higher-resolution and more physically consistent geophysical inputs. The main objective was to improve the spatial representativeness of potential dust sources, particularly in regions where local terrain variability, land cover, and soil texture exert a dominant control on dust uplift. The dust source strength function S was recalculated globally using the GMTED2010 elevation model (Danielson and Gesch, 2011). The native 7.5 arcsec (≈ 250 m) topographic data were resampled to a 0.0625° (≈ 5 km) spatial resolution to balance physical detail and computational feasibility for regional WRF-Chem applications. For the inner domains covering the IP and the RM, a 1 km version was generated to enable fine-scale validation and to assess the impact of convective-scale topographic variability on dust emission.
To ensure physical consistency with the GOCART emission formulation, only grid cells identified as barren or sparsely vegetated were considered active dust sources. Land cover classification was derived from the MODIS 20-category global land use dataset (Friedl et al., 2002), and non-erodible classes (e.g., urban areas, forests, croplands, permanent water bodies, and snow or ice) were masked by setting S=0. This ensures that dust uplift is restricted to areas where bare-soil exposure is physically plausible. The resulting dataset preserves the conceptual structure of the original erodibility field while substantially improving its spatial fidelity.
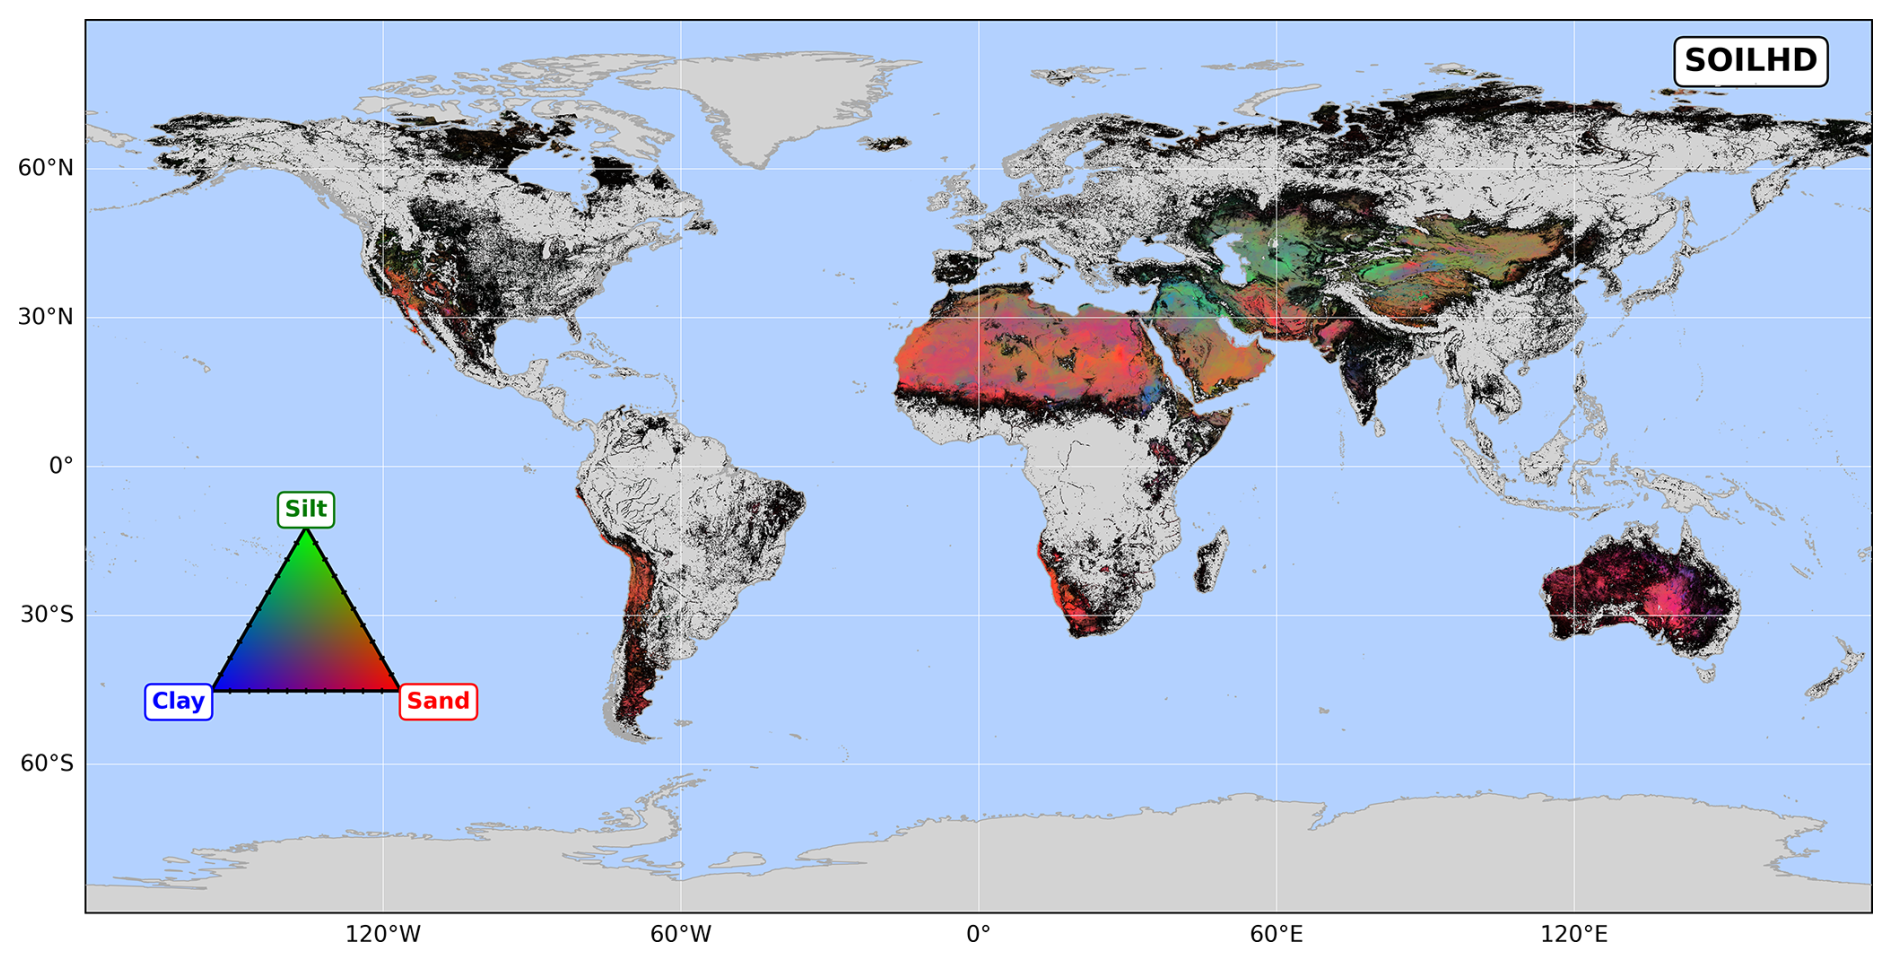
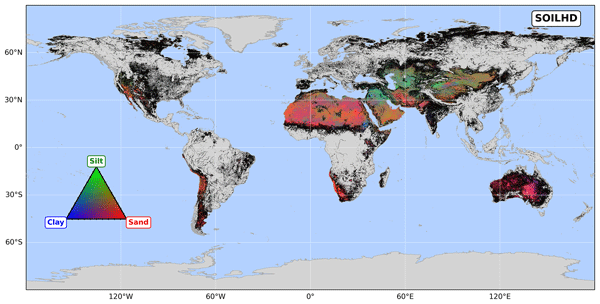
Figure 2Three-band (RGB) composite representation of the SOILHD soil erodibility dataset. The red, green, and blue channels represent the erodibility of the sand, silt, and clay fractions, respectively. Color intensity reflects the combined magnitude of the three soil-fraction erodibility values, while grey indicates areas with no erodible soil.
In WRF-Chem, soil texture is represented in a simplified manner within the dust emission formulation. The erodibility field is defined by three layers corresponding to the soil textural classes contributing to dust emission: sand, silt, and clay. In the standard scheme (Chin et al., 2000), constant global mass fractions are assumed for all grid cells (50 % sand, 25 % silt, and 25 % clay). Accordingly, the EROD-HR dataset was constructed by multiplying the recalculated S field by these fixed fractions. As a result, EROD-HR remains fully compatible with the internal WRF-Chem structure while incorporating higher-resolution topographic and land-cover information. This 50–25–25 % sand-silt-clay assumption has also been adopted in other recent erodibility datasets based on satellite-derived indicators of soil erosion and vegetation scarcity (Li and Wang, 2022; Spyrou et al., 2022). Nevertheless, assuming uniform soil composition can lead to unrealistic dust emission strengths in regions with pronounced soil heterogeneity. To address this limitation, an enhanced erodibility dataset, named SOILHD (Soil-Type Heterogeneous Dataset), was developed by replacing the fixed soil fractions with spatially variable, observation-based soil composition fields (Fig. 2).
SOILHD data were derived from two complementary sources. First, the global map of Local Climate Zones (LCZs) developed by Demuzere et al. (2022) was used to identify potential dust source areas while excluding surfaces erroneously classified as bare soil in previous datasets, such as high-mountain regions, urban areas, snow- and ice-covered surfaces, and greenhouses. This dataset consists of a global LCZ map at 100 m spatial resolution, derived from multiple Earth observation products and LCZ class labels (Demuzere et al., 2023). The LCZ typology (Stewart and Oke, 2012) distinguishes urban and natural surface types based on characteristic combinations of land cover and physical properties. Of the 17 LCZ classes, 10 correspond to built environments, while the remaining seven represent natural land-cover classes. For this study, the natural barren-soil class was extracted and conservatively remapped to a 1 km resolution grid, yielding a global map of barren-soil fraction for each grid cell.
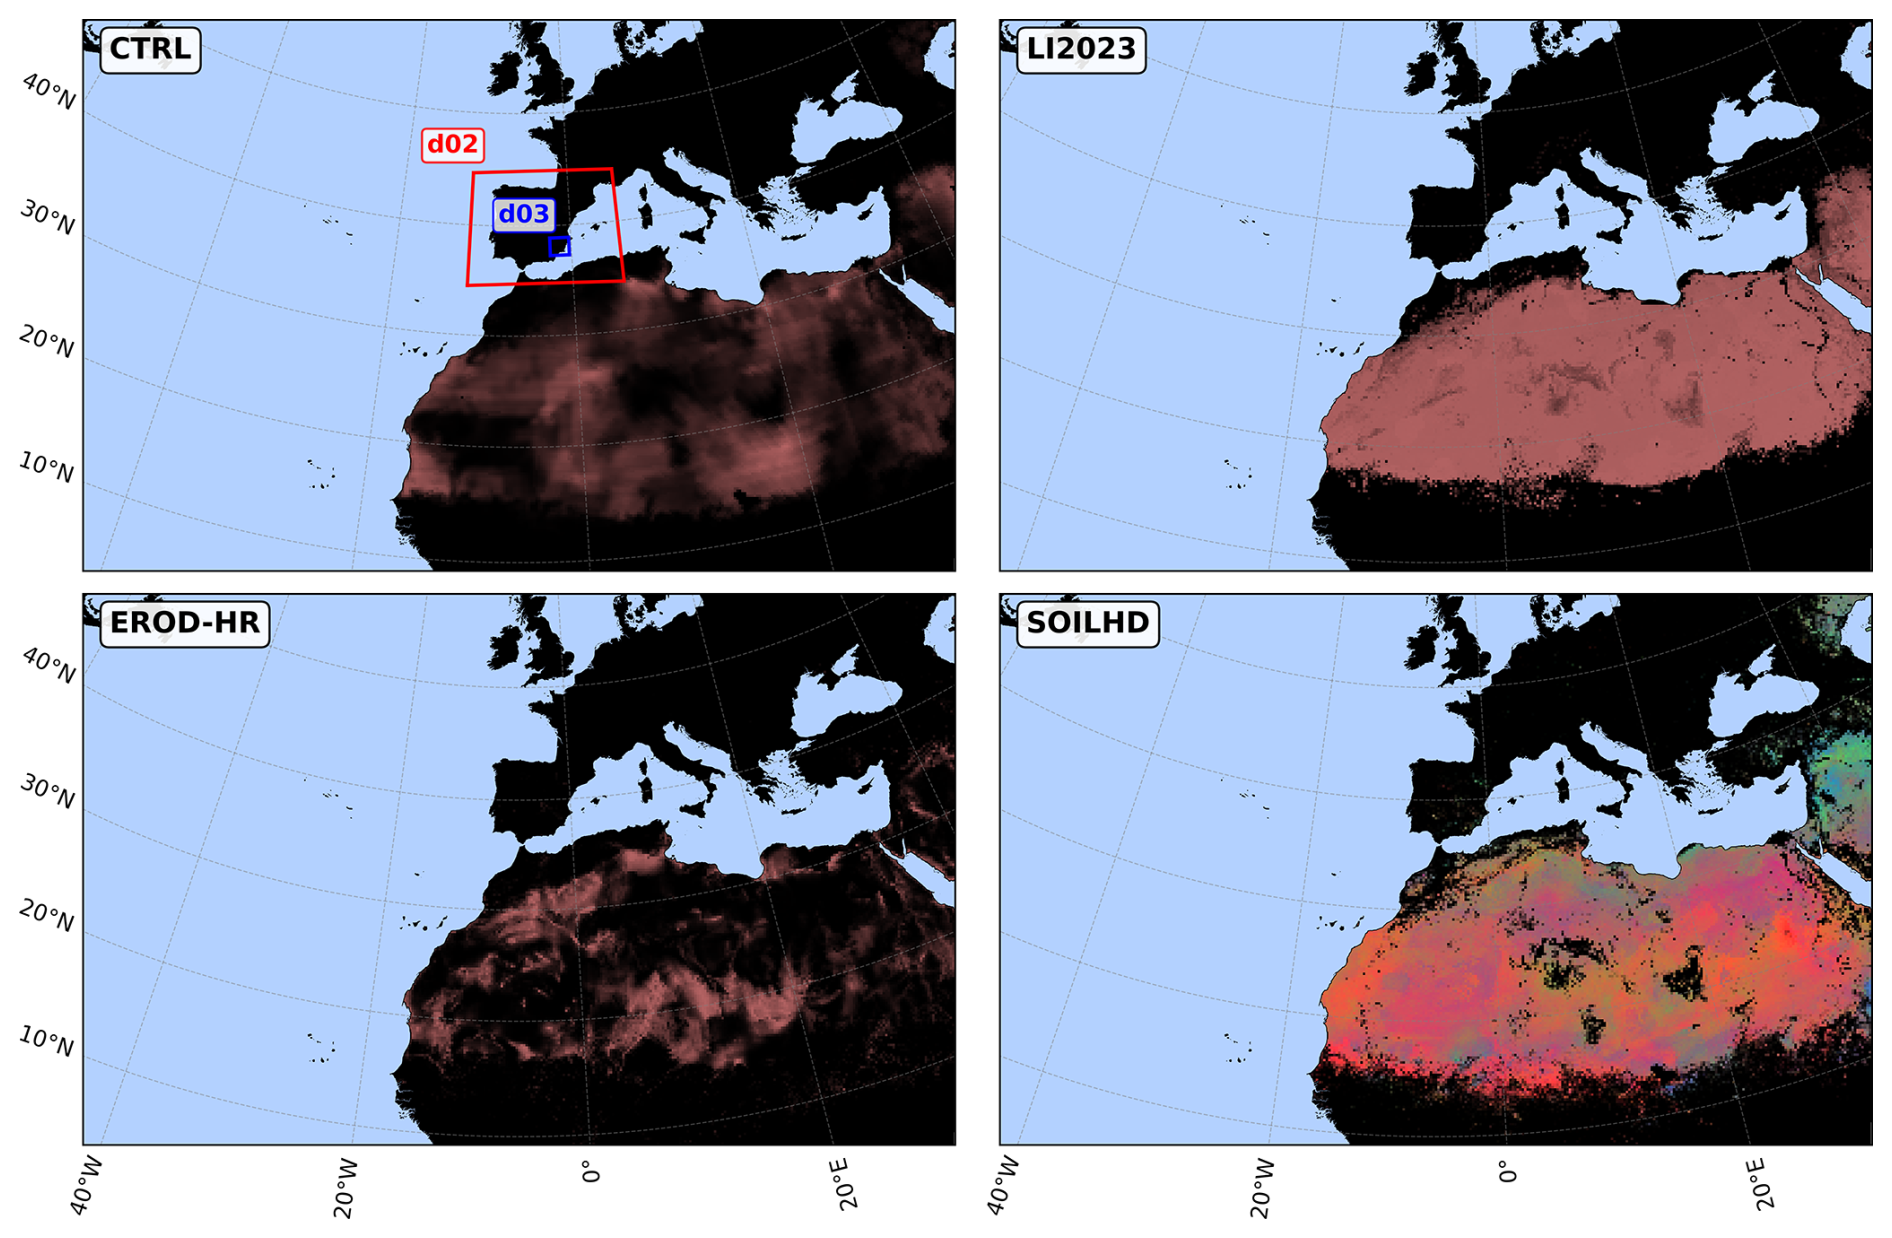
Figure 3Three-band (RGB) composite representation of soil erodibility for the four experiments (CTRL, LI2023, EROD-HR, and SOILHD) over domain d01. The red, green, and blue channels represent the erodibility of the sand, silt, and clay fractions, respectively. The SOILHD experiment shows a distinct color distribution resulting from its different soil-fraction erodibility dataset. Domains d02 and d03 are indicated in the CTRL panel by red and blue rectangles, respectively.
Secondly, the ISRIC SoilGrids250m database (Hengl et al., 2017; Poggio et al., 2021), which provides global estimates of soil properties (including sand, silt, and clay fractions) based on machine-learning models trained on more than 230 000 soil profile observations at 250 m spatial resolution and multiple depth layers (0–200 cm), was employed. Only the 0–5 cm layer was used in this study. The effective radii associated with the silt and clay fractions correspond to the GOCART dust size bins: bin 1 for clay (0–1 µm) and bins 2–4 for silt (1–10 µm). For each soil texture class c (sand, silt, clay), a spatially explicit mass fraction field fc(x,y) was computed by averaging the 0–5 cm layer and converted into binary format. The erodibility layer for the soil class c for the SOILHD dataset (Ec) was then defined as:
where B(x,y) denotes the barren-soil fraction at each grid point. For the SOILHD dataset, Ec is equivalent to the source strength function S in Eq. (1). This formulation introduces realistic spatial variability in soil composition while restricting dust emission to locations where surface conditions are suitable for dust uplift at a 1 km scale. The resulting dataset provides three distinct erodibility layers per grid cell with physically based weighting factors that reflect local soil texture, rather than relying on globally uniform constants. This refinement enhances the ability of WRF-Chem to represent regional heterogeneities in dust emission intensity, particularly across transitions between sand-dominated and fine-grained soils.
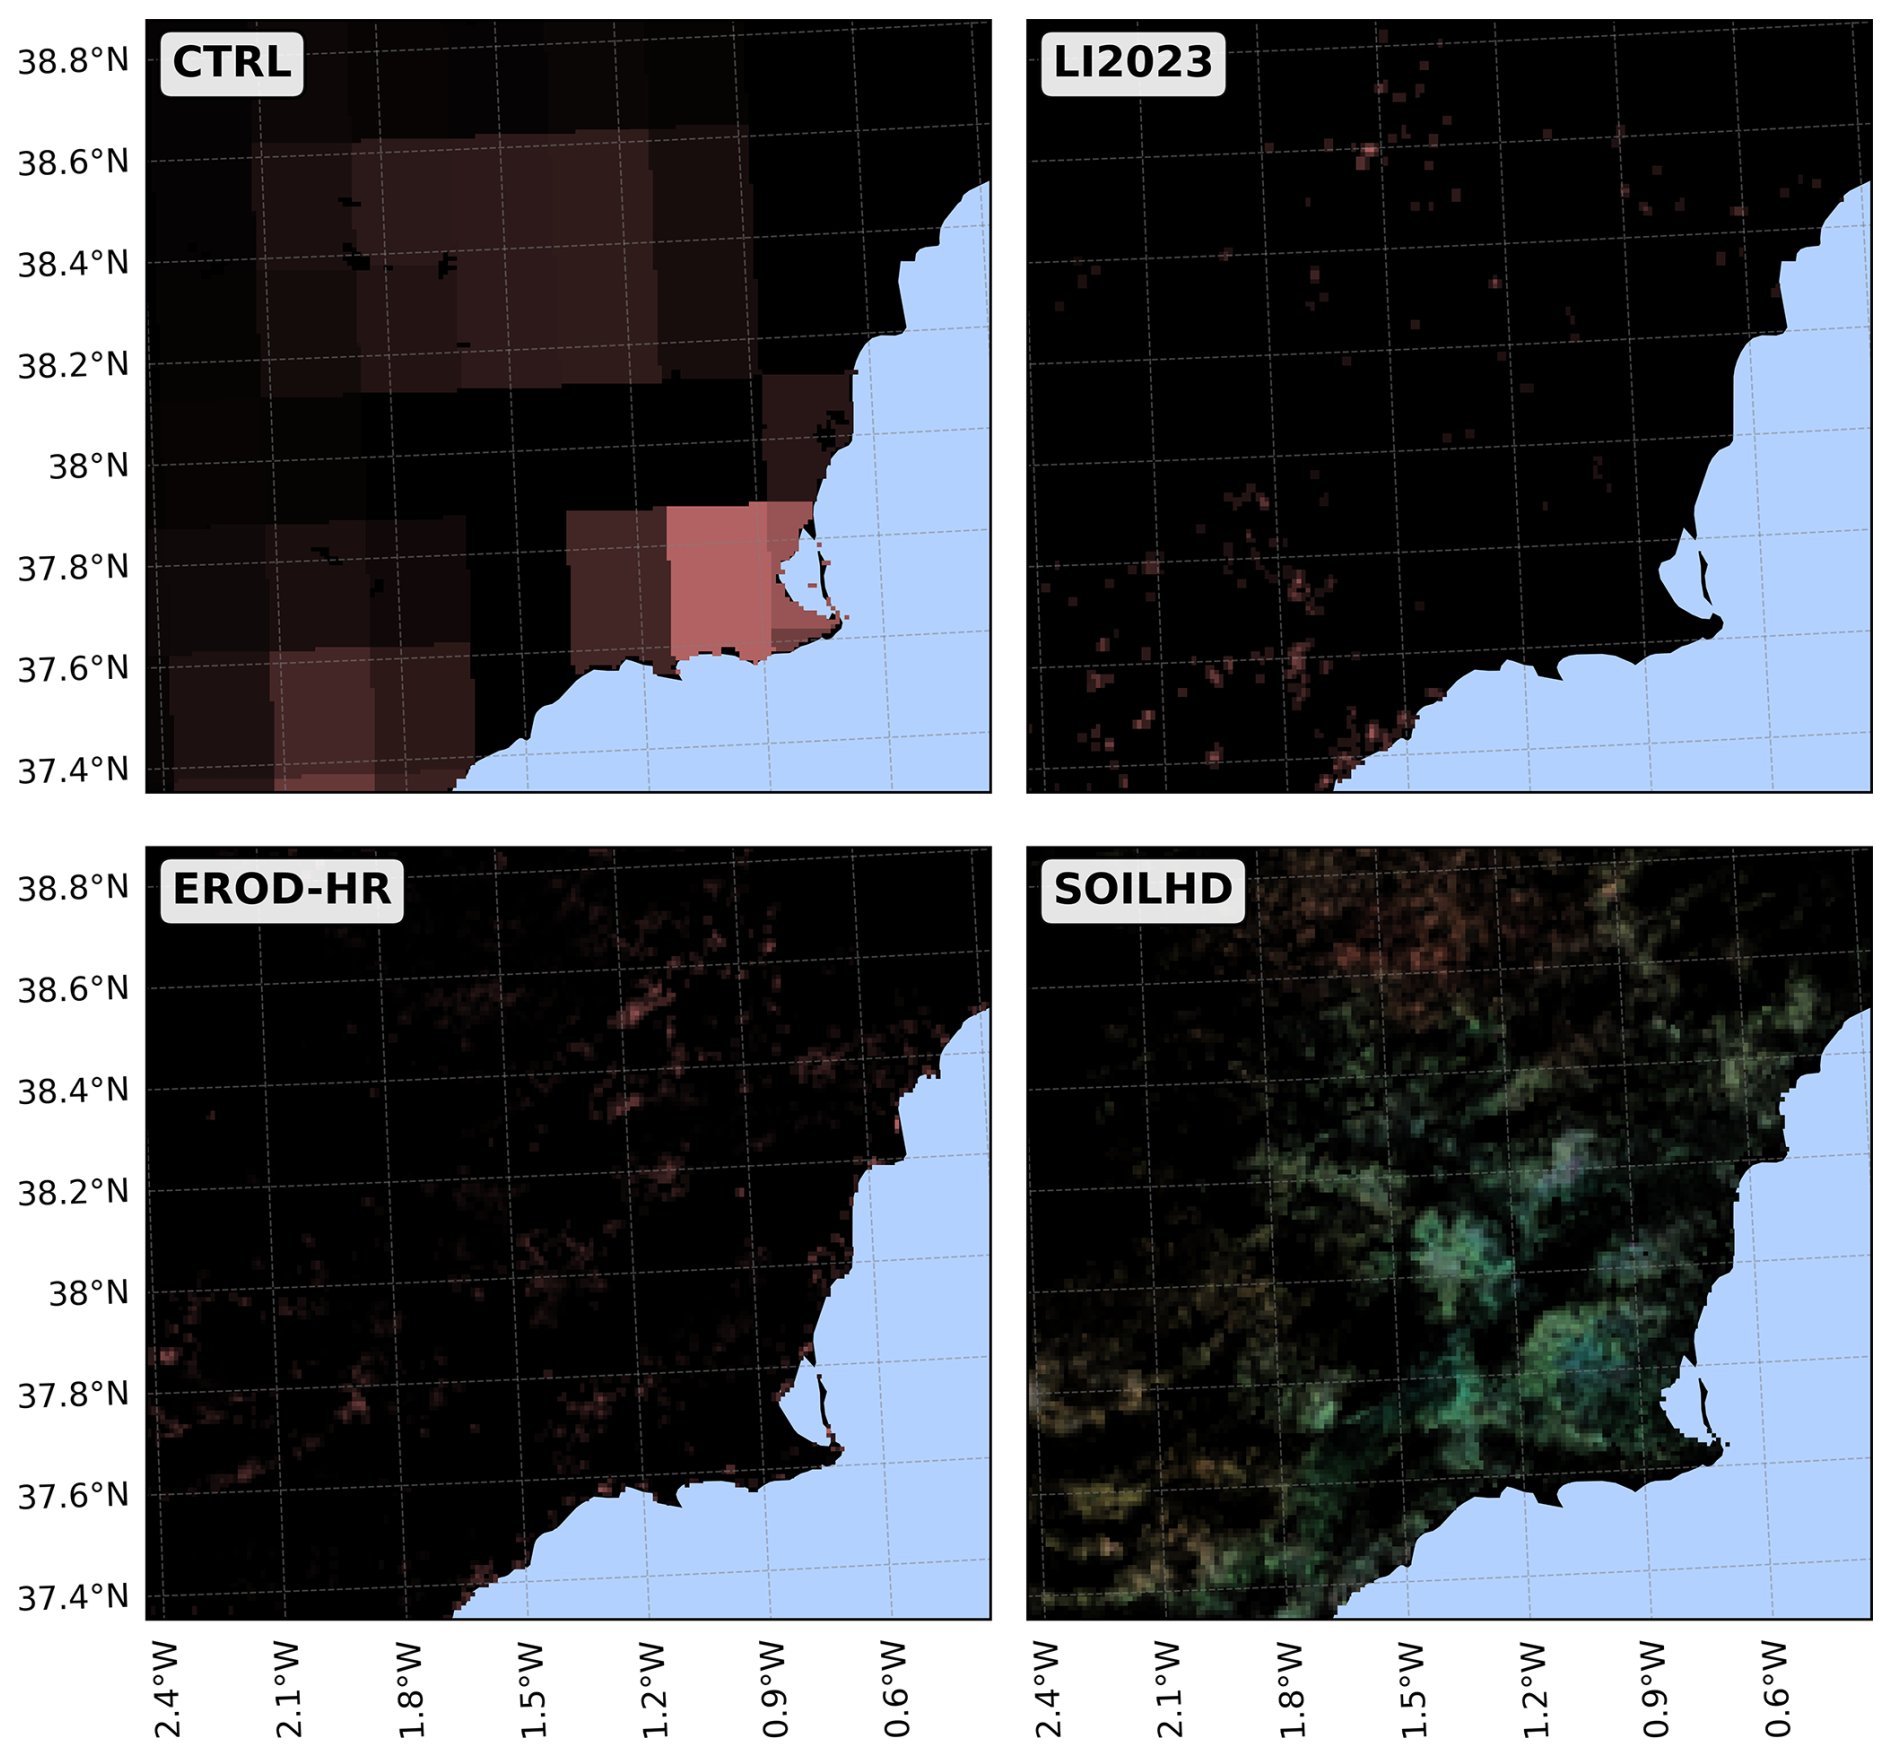
Figure 4As Fig. 3, but for domain d03.
Both the EROD-HR and SOILHD datasets were reprojected onto a regular latitude-longitude grid, converted to binary format, and stored following the same three-dimensional structure as the default erodibility file to ensure direct compatibility with the WRF Preprocessing System (WPS).
Finally, the new datasets were validated against the original erodibility field to ensure structural continuity (see Sect. 3.1), and the SOILHD dataset was rescaled to match the order of magnitude of the default erodibility values (see Sec. 2.4). Test simulations confirmed that both datasets were correctly ingested and interpolated by WRF-Chem without requiring any modifications to the dust emission code. The EROD-HR dataset serves as a baseline high-resolution product emphasizing improved topographic and land-cover representation, whereas SOILHD further incorporates soil-texture heterogeneity to refine the physical characterization of dust source potential.
Figures 3 and 4 show an RGB representation of the different datasets for domains d01 and d03, respectively. The SOILHD dataset introduces a clear modification in the qualitative soil texture distribution compared to both CTRL and EROD-HR configurations. The inclusion of soil-type heterogeneity leads to a more realistic spatial redistribution of erodible fractions. In domain d01, all datasets preserve the dominant sandy character of the Sahara region; however, SOILHD introduces a more structured and physically consistent presence of silt- and clay-enriched areas compared to the more uniform CTRL and EROD-HR configurations. In contrast, EROD-HR mainly preserves the spatial pattern of CTRL while increasing resolution, without substantially altering the underlying soil composition. The SOILHD dataset, instead, redistributes the erodibility in a way that better captures localized heterogeneity associated with fine-particle availability.
The differences become more pronounced in domain d03 (RM), where SOILHD exhibits a clear predominance of silt-rich soils, in contrast to the 50–25–25 % assumption embedded in the CTRL and EROD-HR configurations. This indicates that fine particles play a more relevant role in this region than originally assumed, leading to a more heterogeneous and spatially structured erodibility field. In comparison, LI2023 shows a markedly different behavior, with an almost uniform and higher erodibility across large portions of the Sahara under the default 50–25–25 % assumption, but also with unrealistic values over mountainous regions such as the Alps and the Pyrenees, where soil conditions should not support dust emissions. Conversely, in domain d03, LI2023 exhibits very limited active source areas, resulting in a nearly suppressed local dust emission potential, which is not consistent with the semi-arid and sparsely vegetated characteristics of the RM.
2.4 Tuning the erodibility database: the EROD Tuner tool
The tuning of soil erodibility is a common practice in dust modeling, particularly when introducing new erodibility datasets or transferring models across regions with contrasting soil, land-use, and climatic characteristics. Previous studies (e.g. Darmenova et al., 2009; Eltahan et al., 2018; Parajuli et al., 2019; Ukhov et al., 2020; Li et al., 2023) have shown that moderate, physically motivated adjustments to erodibility can substantially improve the representation of dust emissions and downwind concentrations.
To allow a simple, systematic tuning of the erodibility field, we developed the EROD Tuner tool (Segado-Moreno and Montavez, 2026). This utility operates directly on the EROD variable contained in the WPS geo_em.d0n.nc files, modifying the soil erodibility prior to the WRF-Chem integration. Working at the preprocessing stage ensures that the modified erodibility is consistently propagated through the entire modeling workflow, while allowing different tuning strategies to be applied independently to each model domain.
A key feature of EROD Tuner is its flexibility. The tool supports a wide range of conversion functions, from simple linear scaling to nonlinear formulations targeting specific portions of the erodibility distribution. These include polynomial functions that damp extreme values, power-law transformations that enhance weakly erodible soils, logarithmic and sigmoid functions introducing saturation effects, and hybrid formulations that smoothly combine linear and nonlinear behavior. This flexibility allows the erodibility response to be tailored to different physical hypotheses, such as increased soil cohesion, threshold-like transitions between erodible and non-erodible surfaces, or the suppression of unrealistically strong source areas.
All conversion functions are formulated in a generic, dimensionless form, making them applicable to erodibility datasets beyond those presented here. A dedicated namelist allows the selection of different functions and parameters for each nested domain, enabling region-specific tuning while preserving a unified modeling framework. This design facilitates sensitivity analyses, uncertainty assessments, and intercomparison studies in which the impact of erodibility assumptions must be isolated. The code also allows straightforward implementation of additional custom functions. The EROD Tuner tool is fully open-source and is publicly available on Zenodo (https://doi.org/10.5281/zenodo.18606994, Segado-Moreno and Montavez, 2026).
In the present study, the tuning applied to the SOILHD erodibility dataset was intentionally conservative. The adjustment was limited to a uniform linear scaling of the total erodibility, defined as the sum of the sand, silt, and clay components. A constant multiplicative factor of 10−1 was applied to bring SOILHD erodibility values into the same order of magnitude as the default WRF erodibility field. This approach preserves the spatial variability and relative contrasts introduced by SOILHD while ensuring comparability with the standard model configuration.
2.5 Observational data
Modeled dust concentrations (PM10) were evaluated against ground-based observations within the innermost model domain (d03) using data from the Regional Air Quality Monitoring Network of the RM (SINQLAIR) (Consejería de Medio Ambiente, Universidades, Investigación y Mar Menor. Dirección General de Medio Ambiente, 2018). SINQLAIR is operated by the regional government and provides high-quality, real-time measurements of major atmospheric pollutants for regulatory assessment and public information, with a native temporal resolution of 10 min.
The network currently consists of 11 fixed monitoring stations distributed across urban, industrial, and rural environments, as well as one mobile unit deployed during specific campaigns or pollution episodes. SINQLAIR routinely measures concentrations of particulate matter (PM10 and PM2.5), nitrogen oxides (NOx, NO2), sulfur dioxide (SO2), tropospheric ozone (O3), carbon monoxide (CO), and other trace pollutants.
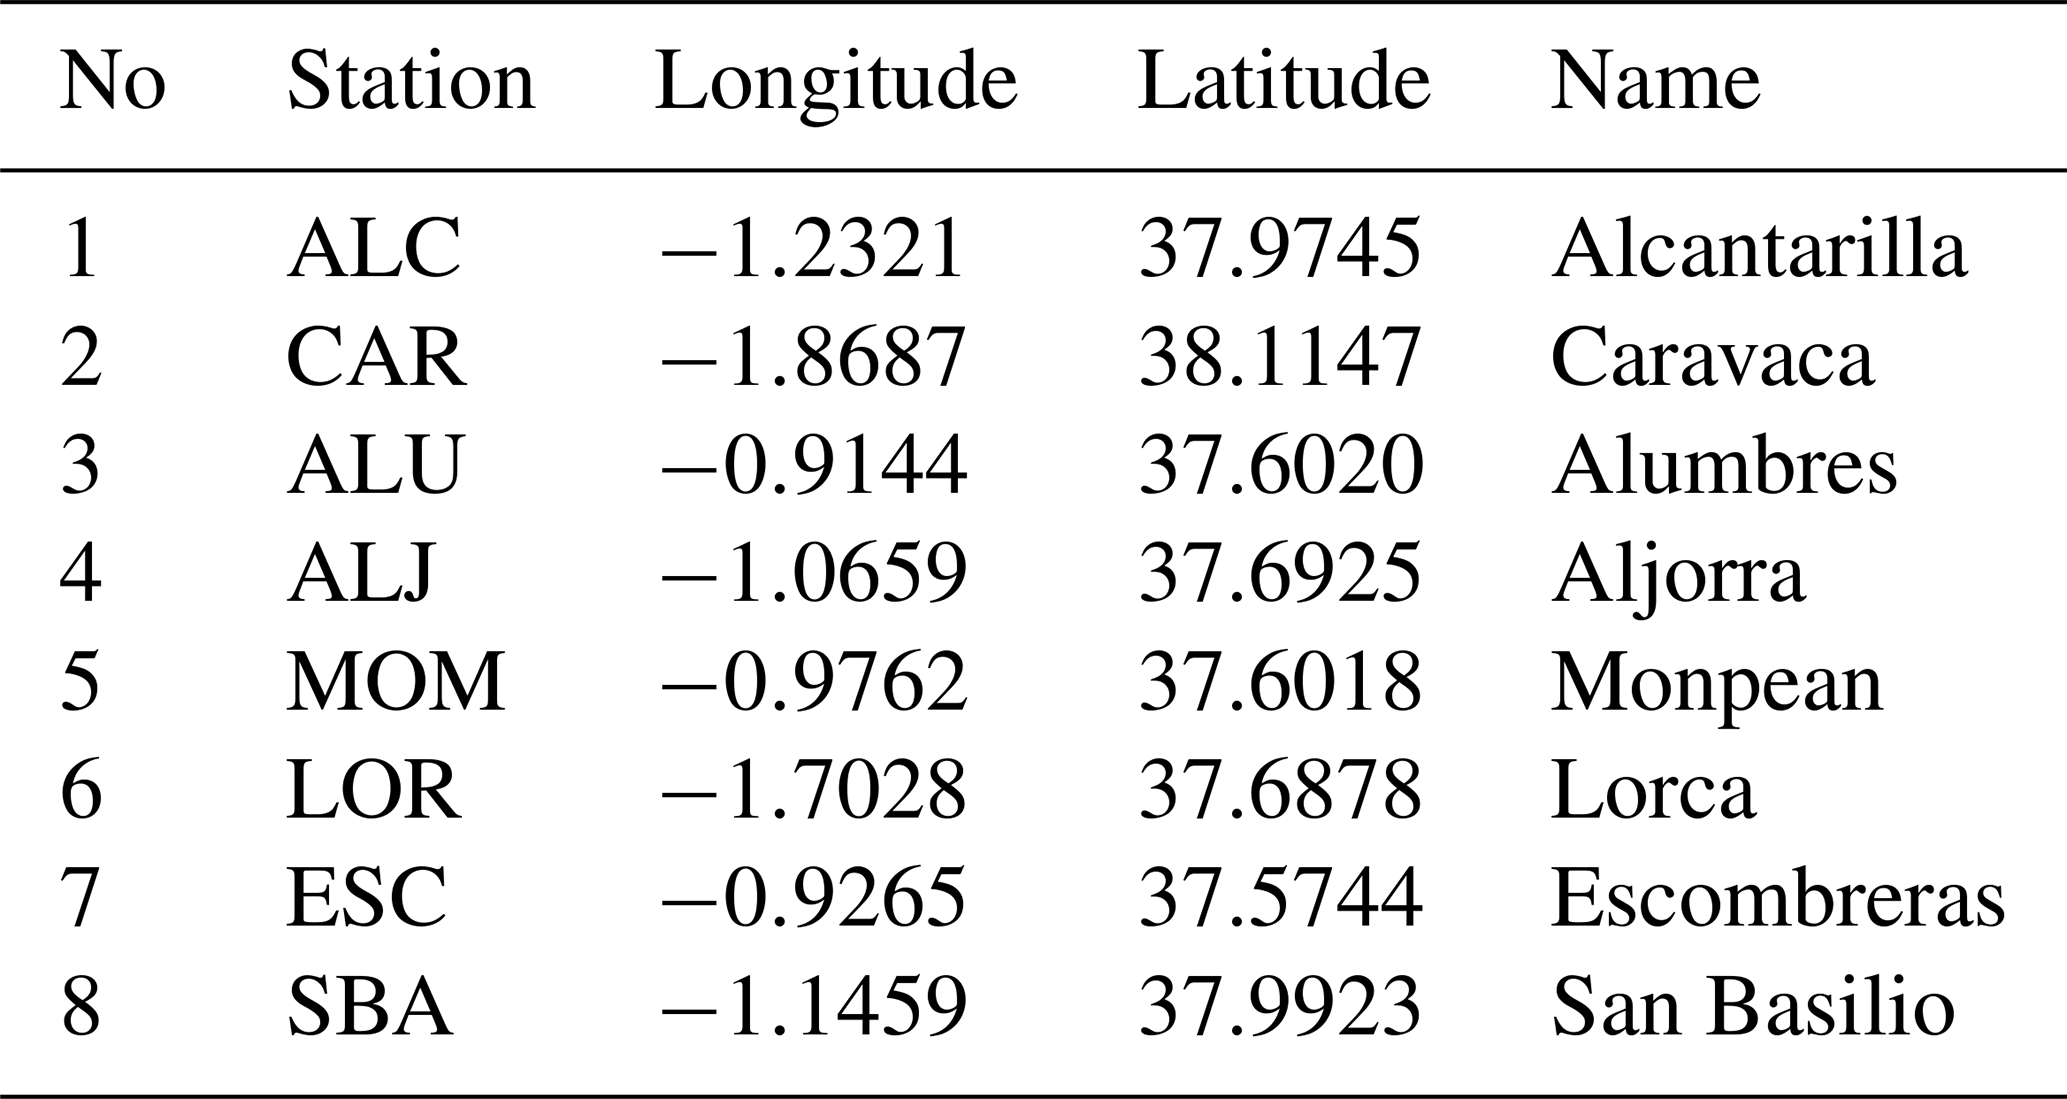
Based on data availability for the simulated periods, 8 stations were selected for the present analysis. These stations are listed in Table 3, and their geographical locations are shown in Fig. B1. To ensure temporal consistency with the model output, the observational time series were aggregated to hourly mean values.
Table 3List of PM10 observational stations from the SINQLAIR network used for domain 3 analysis.
2.6 Statistical analysis
To quantify the model performance and the impact of using the high-resolution EROD-HR and SOILHD datasets, the following statistical metrics were calculated. On one hand, the Pearson correlation coefficient (R) is used to assess the temporal agreement between observed and simulated concentrations. On the other hand, Mean Bias Error (MBE) and Root Mean Square Error (RMSE) are used to evaluate the accuracy and systematic bias of the model.
It should be noted that the interpretation of the Pearson correlation coefficient in event-based analyses involving extreme PM10 concentrations requires caution, as the metric can be sensitive to high-magnitude values and isolated concentration peaks. However, in the present study, such extreme values are not considered statistical anomalies or spurious outliers but rather constitute the primary focus of the analysis, since the selected simulation periods correspond to intense dust episodes and high-impact PM10 events. Consequently, the occurrence of large concentration values and strong temporal variability is an inherent characteristic of the dataset. For this reason, the correlation coefficient is interpreted together with complementary statistical metrics, including RMSE and MBE, as well as through the analysis of temporal series and spatial PM10 distributions, providing a more robust assessment of model performance during extreme dust conditions.
Finally, 24 h moving averages were also calculated to evaluate the ability of the model to capture daily dust variability, which is critical for air quality management and forecasting. The capability of the newly developed datasets to reproduce dust events in WRF-Chem simulations was assessed by computing metrics for several dust intrusion episodes spanning multiple seasons.
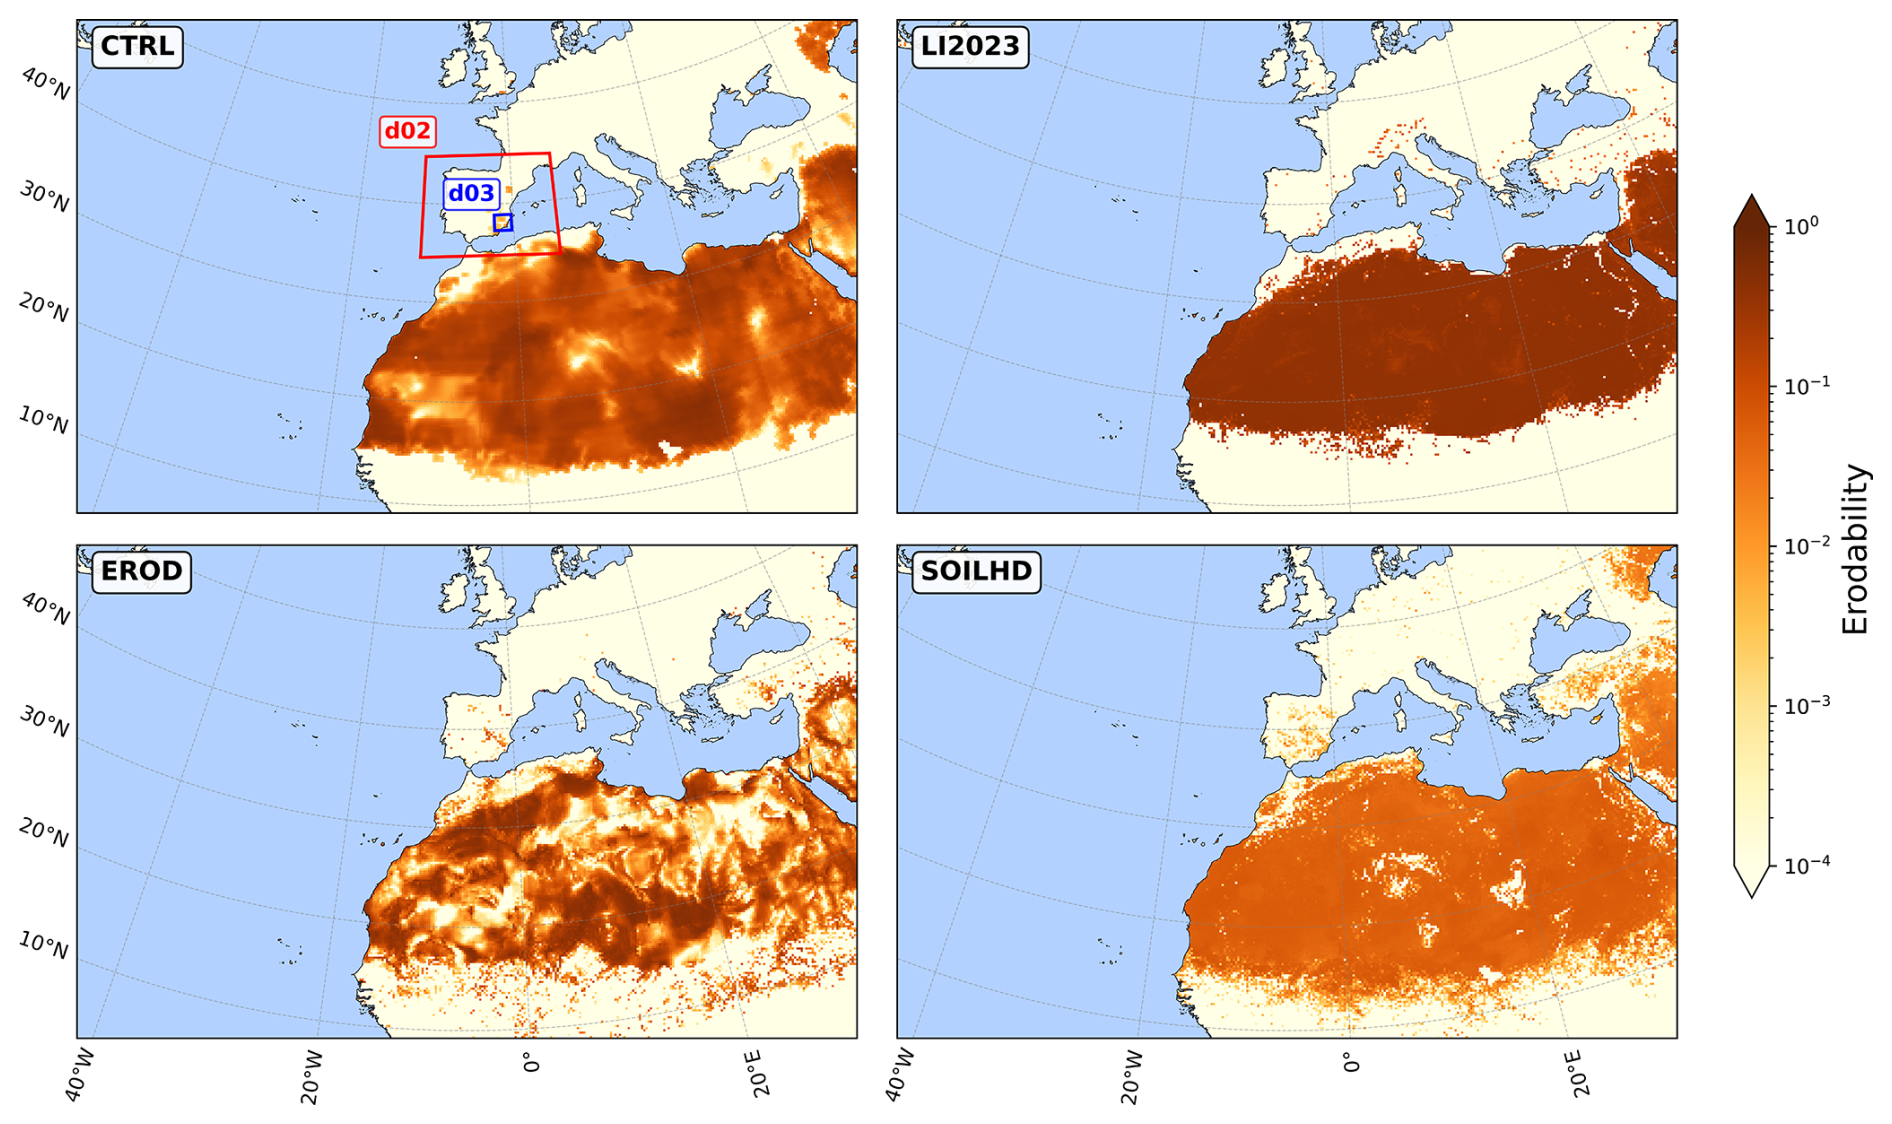
Figure 5Spatial distribution of the sand-fraction soil erodibility for the four experiments (CTRL, LI2023, EROD-HR, and SOILHD) over domain d01. Unlike Fig. 3, only the sand erodibility layer is shown using a monochromatic color scale. Domains d02 and d03 are indicated in the CTRL panel by red and blue rectangles, respectively.
3.1 Erodibility values and dust emission comparison
Figures 5 and 6 show the new high-resolution soil erodibility fields for domains d01 and d03, respectively. In addition, Table 4 summarizes the spatially averaged erodibility values for both domains, together with the total number of valid (non-zero) erodible grid cells for each dataset.
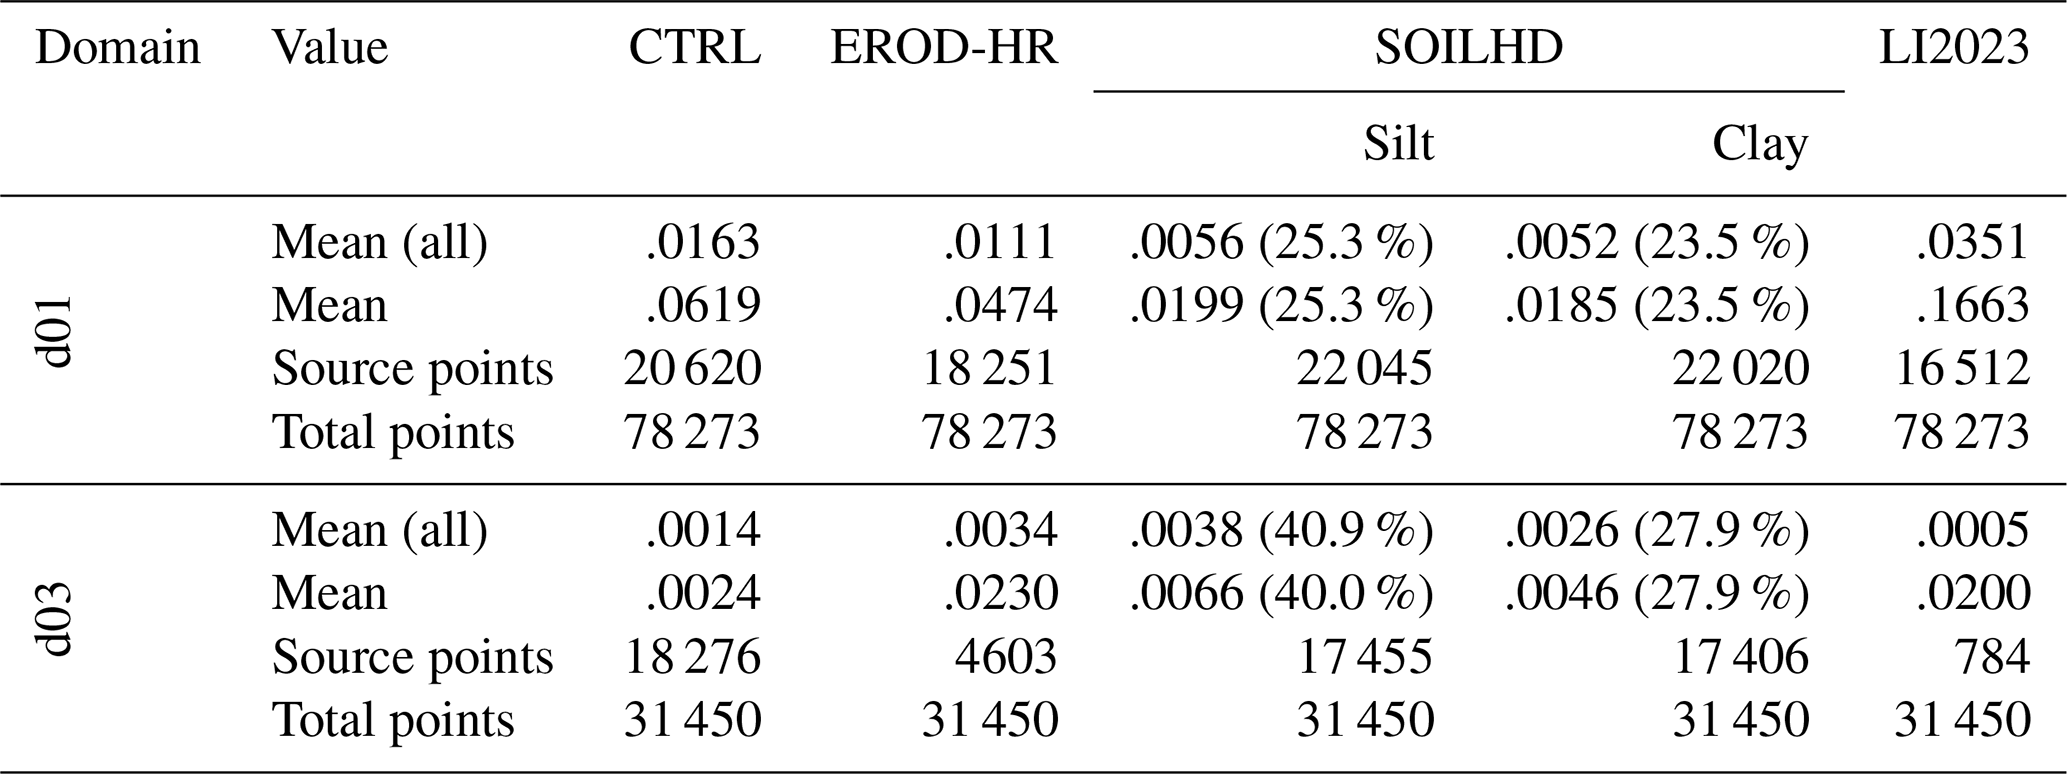
The EROD-HR dataset shows notable differences relative to the CTRL configuration. For domain d01, the average erodibility of the clay-silt classes, which dominate dust emissions in GOCART, is 0.0111 when all grid points are considered and 0.0474 when only source points are included. These values represent differences of −0.53 % and −1.45 %, respectively, relative to the original dataset. Despite the small change in domain-averaged erodibility, the spatial distribution differs markedly from the default field, as commented in Sect. 2.3, with higher erodibility values concentrated in specific areas (Fig. 5). This redistribution, together with a reduction in the number of source grid cells from 20 620 to 18 251 (−11.5 %), indicates that while the overall erosion potential of the domain remains nearly unchanged, the location of dust-emitting areas is substantially modified.
A more pronounced effect is observed over the RM (domain d03), where the number of source grid cells decreases from 18 276 (58.1 % of the total) to 4603 (14.6 %). In contrast, the mean erodibility of these source points increases to 0.023, approximately one order of magnitude larger than in the original dataset. As shown in Fig. 6, the default CTRL configuration exhibits lower erodibility values distributed over broad areas, whereas the EROD-HR dataset produces a more heterogeneous pattern with localized high-erodibility regions. Nevertheless, the domain-averaged erodibility considering all grid points increases by only 0.20 %, suggesting that the total dust uptake potential in domain d03 remains largely unchanged.
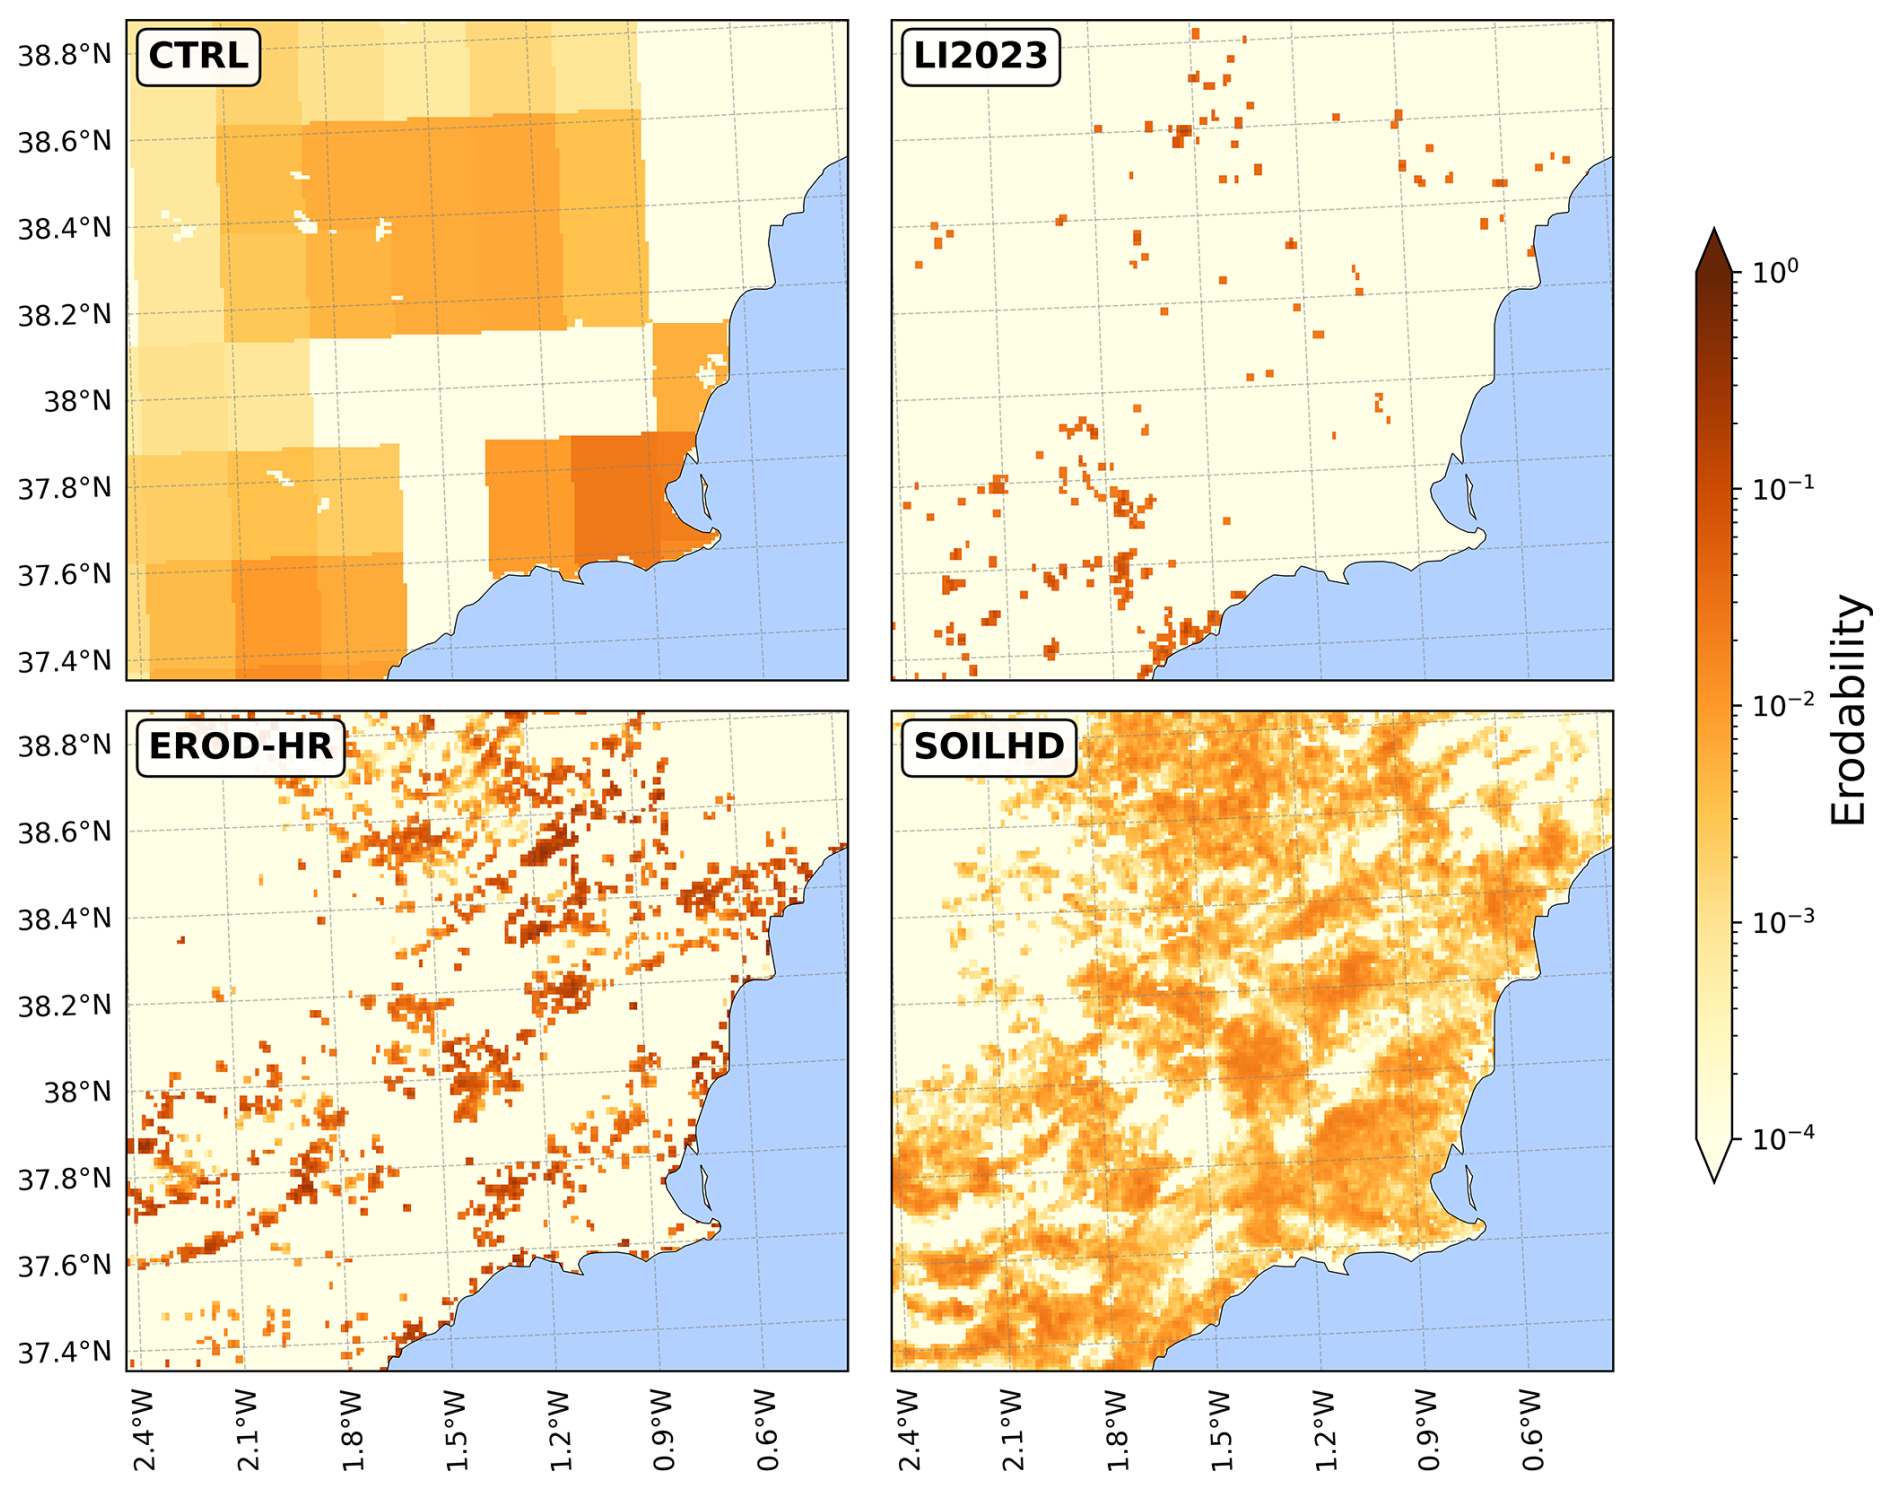
Figure 6As Fig. 5, but for domain d03.
The behavior of the SOILHD dataset differs substantially from that of EROD-HR. As previously discussed in Sect. 2.3, the SOILHD formulation introduces a physically based redistribution of erodible fractions by explicitly incorporating soil texture information. This results in a modification of the spatial organization of source areas while preserving the overall magnitude of domain-integrated erodibility. In particular, the inclusion of soil-type heterogeneity leads to a more realistic representation of fine-particle availability, while maintaining consistency with the baseline magnitude constraints imposed during the rescaling procedure (see Sect. 2.4).
For domain d01, the number of source grid cells increases to 22 045 and 22 020 for the silt and clay classes, respectively, representing increments of 6.9 % and 6.8 %. In contrast, the mean erodibility of these source points decreases to 0.0199 (silt) and 0.0185 (clay). Despite this reduction, the relative contributions of the silt and clay fractions to total erodibility amount to 25.3 % and 23.5 %, respectively, indicating that the assumption of an average sand content of 50 % (i.e., a 50–25–25 % sand-silt-clay composition) remains reasonable for domain d01.
In contrast, the 50–25–25 % soil texture assumption is not suitable for the RM (domain d03). The SOILHD configuration shows a broader spatial distribution of erodibility than EROD-HR, with values comparable to the CTRL configuration but confined to more localized areas at higher spatial resolution. The total number of source points remains close to that of the original dataset (17 455, corresponding to a reduction of 4.7 %). This behavior reflects a clear shift in soil composition within domain d03, where fine particles play a more relevant role than initially assumed, leading to a more heterogeneous and spatially structured erodibility field.
This is consistent with the statistical breakdown reported in Table 4, which shows that the silt fraction accounts for approximately 40 % of total erodibility (0.0066), while the clay fraction contributes about 28 % (0.0046). Accordingly, a soil texture distribution of 30–40–30 (sand-silt-clay) appears more representative for this region. Consequently, the commonly assumed 50–25–25 % distribution likely underestimates the availability of fine erodible particles in the RM, and thus the potential for dust emission.
The difference in the number of source points between the EROD-HR and SOILHD datasets highlights limitations associated with computing the source strength function S at local-scale resolution. In highly erodible regions of the Sahara Desert, this approach can yield very low or near-zero values of S, as illustrated in Fig. 5. The inclusion of soil texture information in SOILHD partially compensates for this effect by increasing the number of active source cells while preserving realistic erodibility magnitudes.
Table 4Erodibility statistics for domains d01 and d03. All-point and source-point mean erodibility values (silt and clay soil classes), as well as the number of total and dust source points, for each dataset, are shown. Exceptionally, for the SOILHD dataset, the clay and silt EROD-HR fields are not equivalent due to the heterogeneous distribution of the erodibility factor based on the specific soil class fraction available in each cell. Therefore, the total erodibility fractions of each separate soil class are displayed (%).
Changes in the relative contribution of dust emission by size bin are illustrated in Fig. 7. Emissions in the CTRL and EROD-HR experiments are nearly identical. In contrast, SOILHD exhibits a marked reduction in emissions from bin 1 (0–1 µm, clay), decreasing from 8.9 % in CTRL to 6.3 % (a reduction of 28.6 %), accompanied by a slight increase in emissions from bins 2 to 4 (silt). The coarsest size class (bin 5) is excluded from the analysis, as it comprises particles with effective diameters larger than 12 µm, exceeding the upper size threshold of PM10.
Finally, average erodibility values were also computed for the previously published erodibility dataset described by Li et al. (2023), which integrates remote sensing products and soil properties to represent the spatial and temporal variability of dust source strength. For domain d01, the resulting mean erodibility values are 0.035 when averaged over all grid cells and 0.166 when considering only source points, indicating a spatially homogeneous erodibility pattern over the Sahara Desert. These values are approximately three times higher than those obtained with the CTRL dataset.
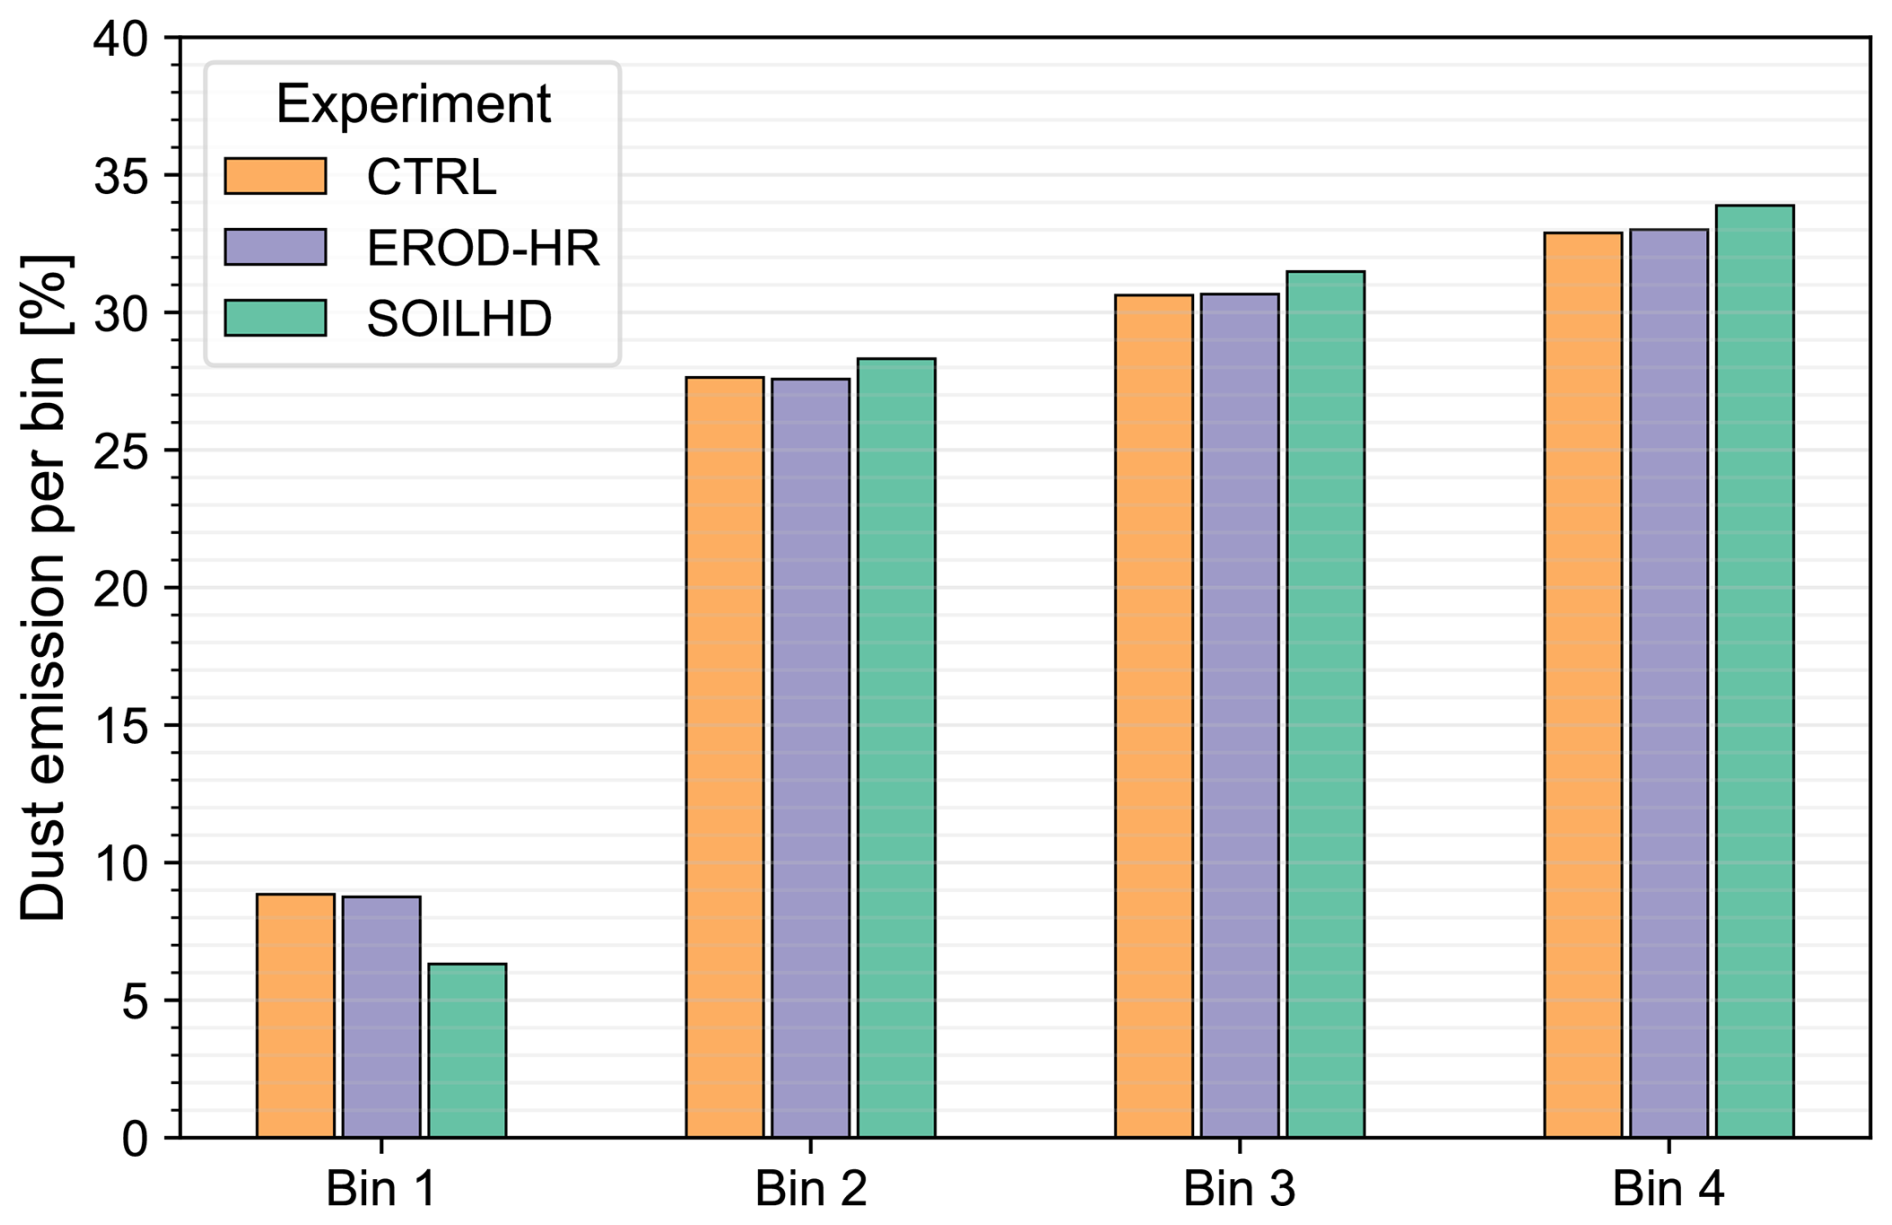
Figure 7Dust emissions distribution by bin size for domain d03 during August 2025 is shown for the control (CTRL, orange), the high-resolution (EROD-HR, violet), and the high-resolution with soil mass fraction (SOILHD, green) experiments. Bin 1 (0.1–1.0 µm effective radius) represents clay particles, whereas bins 2 to 4 correspond to silt-sized particles, with effective radii ranges of 1.0–1.8, 1.8–3.0, and 3.0–6.0 µm, respectively. Bin 5 is not included in the analysis because it contains particles with effective diameters larger than 12 µm, which exceed the upper size threshold considered in the definition of PM10.
For domain d03, the mean erodibility at source points is 0.02, comparable to the EROD-HR dataset, but the number of active dust source cells is limited to only 784, corresponding to 2.5 % of the total grid points. As a result, the domain-averaged erodibility is very low (0.0005). This configuration favors dust contributions dominated by transport from the parent domain, with negligible local dust uptake, which may lead to overestimated PM10 concentrations associated with convective transport (see Sect. 3.2). Such a behavior appears inconsistent with the known characteristics of the RM, which exhibits semi-arid conditions, low precipitation, and widespread areas of sparsely vegetated soils.
Additionally, the strong dependence of this kind of dataset on remote sensing retrievals may result in uncertainties and misvalues. For example, higher erodibility values are observed over the Alps and the Pyrenees, two mountainous regions in central Europe and northern IP, respectively, characterized by rocky, snowy areas with negligible sand content, and therefore null dust uptake potential.
Spatially averaged PM10 profiles were computed for domains d01 and d03 during the August 2025 event to examine the vertical distribution of PM10 (Fig. 8). The motivation for analyzing the vertical structure is to assess whether the differences in surface erodibility translate not only into changes in near-surface concentrations but also into modifications of the vertical redistribution of dust within the atmospheric column. In particular, changes in the erodibility field directly affect dust emission fluxes at the surface, which in turn influence the vertical mixing and uplift of particles through turbulent transport and boundary layer processes. For domain d01, the vertical PM10 profile shows a significant reduction in concentrations in the EROD-HR experiment relative to the CTRL one. This reduction is more pronounced in the SOILHD configuration, particularly near the surface, where the mean PM10 difference with respect to CTRL reaches −63.4 µg m−3.
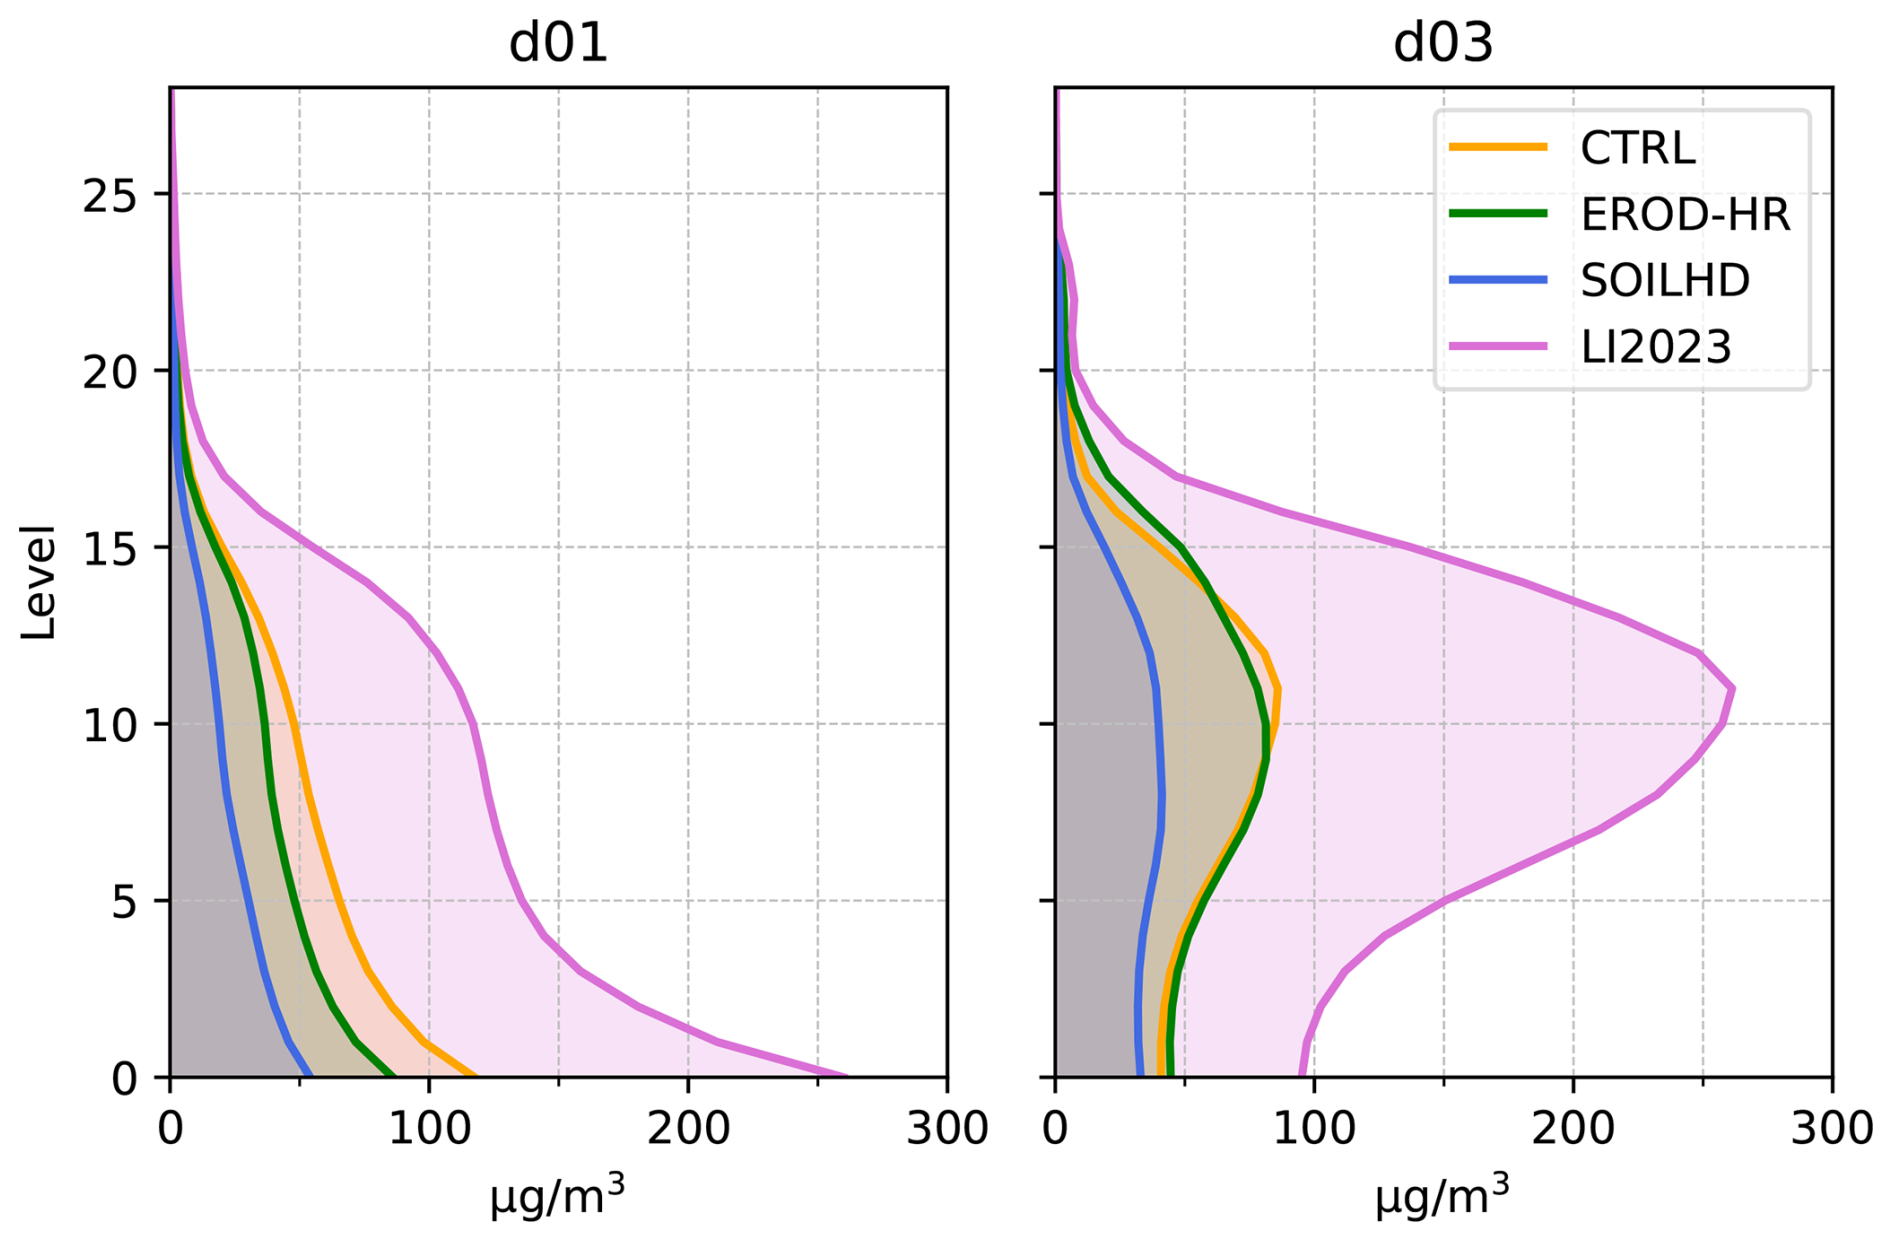
Figure 8Vertical average PM10 distribution for domain 1 (left) and 3 (right) during period 2025-08 for the control (CTRL, red), the high-resolution (EROD-HR, green), the high-resolution with soil mass fraction (SOILHD, blue), and the dataset by Li et al. (2023) (LI2023, purple) experiments.
Over the RM (domain d03), the vertical PM10 profiles obtained with CTRL and EROD-HR are nearly identical. In contrast, the SOILHD experiment exhibits lower PM10 concentrations than CTRL at all vertical levels, with a maximum difference of 47.0 µg m−3 at model level 11 (approximately 750 hPa). This level also corresponds to the maximum PM10 concentrations, indicating that advective transport plays a dominant role in the vertical dust distribution over the region. As a result, modifications in the erodibility distribution of the parent domain propagate into significant differences in the simulated dust burden within the inner domain.
At the surface level, the mean PM10 difference between SOILHD and CTRL amounts to 7.9 µg m−3. Comparable behavior is observed for the remaining simulated periods. These results indicate that changes in soil mass fraction representation introduced by SOILHD affect both dust uplift and transport processes, leading to a modified vertical distribution of PM10.
Additional simulations were performed using the erodibility dataset developed by Li et al. (2023) as the soil erodibility input (LI2023 experiment). The resulting vertical PM10 distributions for domains d01 and d03 indicate substantially higher concentrations than in all other experiments, with values that are two to three times larger than those obtained with the CTRL, EROD-HR, and SOILHD configurations. In domain d03, maximum PM10 concentrations exceed 250 µg m−3, with surface values around 100 µg m−3.
Similar behavior is observed for other simulated periods. For instance, during the 2022-07 event, a maximum PM10 concentration of 149.2 µg m−3 is obtained with LI2023, whereas the CTRL, EROD-HR, and SOILHD experiments yield maxima ranging between 40.9 and 77.8 µg m−3. This contrast suggests that the LI2023 dataset produces excessive dust emissions in the parent domain (d01) while generating very limited local dust uptake over the RM. Such a configuration is difficult to reconcile with the semi-arid conditions and the widespread presence of sparsely vegetated soils characteristic of the region.
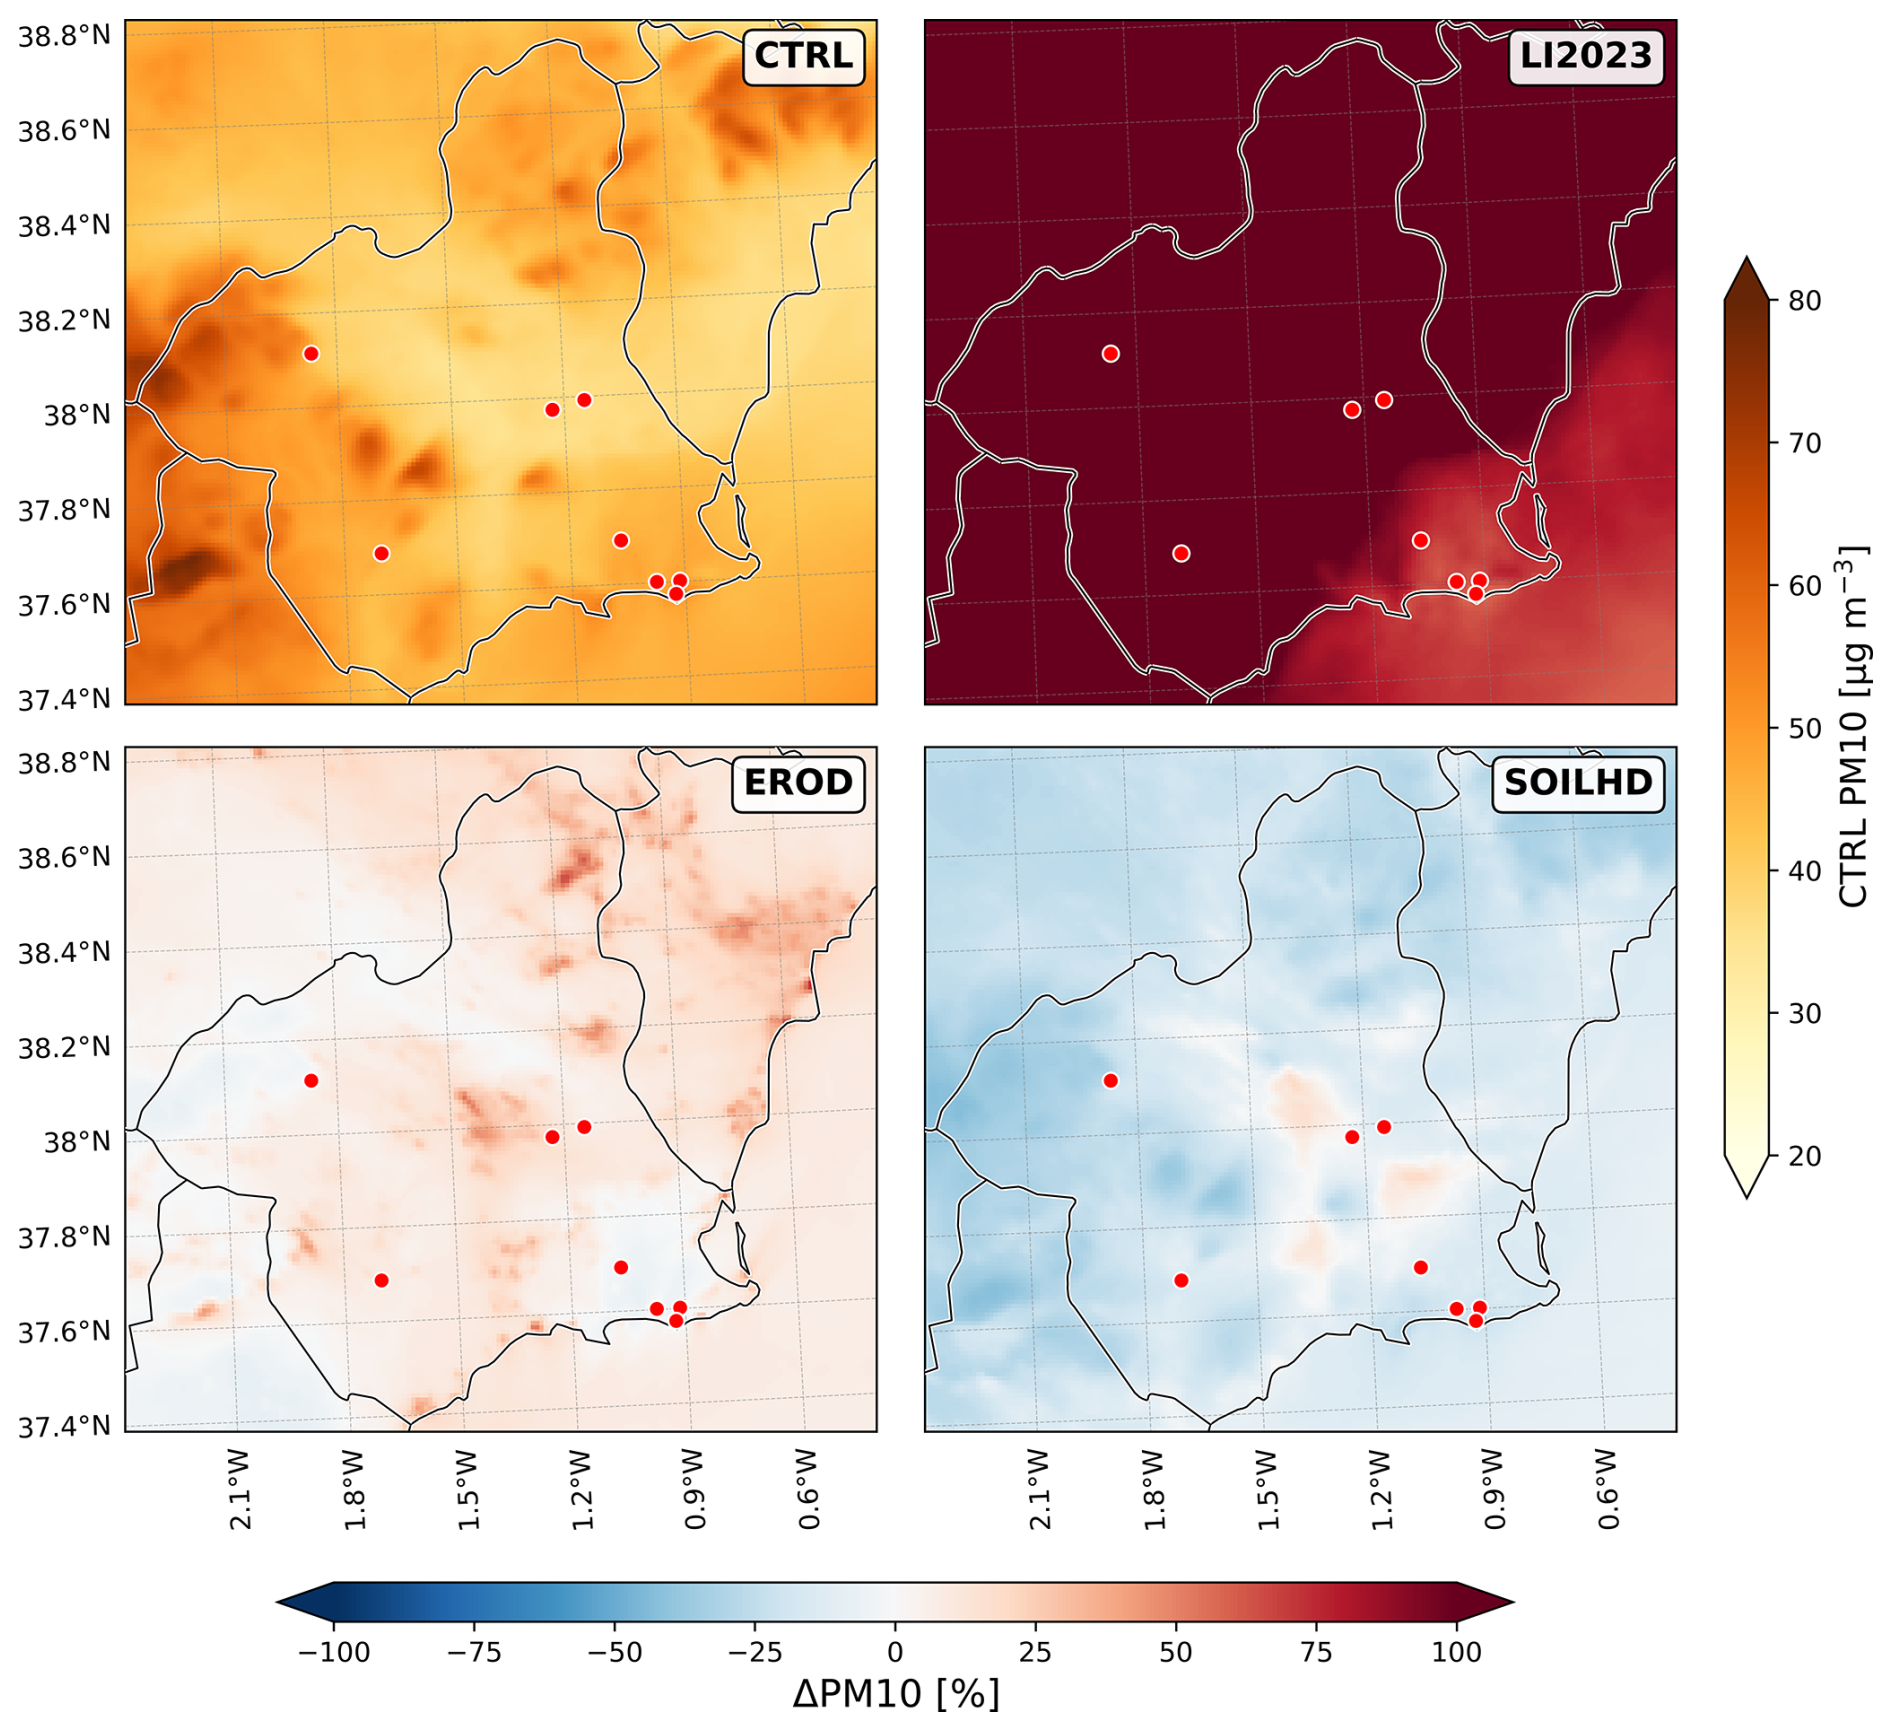
Figure 9Temporal PM10 average for the CTRL experiment during the 2025-08 period (top left) and its relative difference with the other experiments for domain d03. SINQLAIR observational stations are marked with red dots.
To provide a spatially explicit assessment of how the different erodibility configurations affect the simulated PM10 distribution, a domain-scale relative difference analysis was included. Figure 9 shows the temporal mean PM10 fields for the CTRL experiment (top left) during the 2025-08 period, together with the relative differences induced by the EROD-HR, SOILHD, and LI2023 configurations over domain d03, with the SINQLAIR stations indicated in red.
Overall, the LI2023 dataset produces a clear and systematic overestimation of PM10 across the entire domain. Relative differences exceed +100 % in most of the region, indicating a strong enhancement of dust loading with respect to the CTRL experiment. This behavior is consistent with the erodibility statistics in Table 4, which show exceptionally high erodibility values over domain d01 and a highly limited number of active source cells in domain d03. It is also consistent with the results shown in Fig. 8, where LI2023 exhibits substantially higher PM10 concentrations at all vertical levels. This combination leads to enhanced advective transport from the parent domain and an overall amplification of dust concentrations in the inner domain. Based on this and all the previous results, the LI2023 experiment was excluded from the comparison with ground-based observations presented in the following section.
In contrast, the EROD-HR configuration produces PM10 fields that are very similar to those of the CTRL experiment. Relative differences are generally small and mostly below 10 %–20 % over most of the domain, with localized maxima approaching 40 % in a few specific areas. These differences are spatially constrained and do not modify the overall structure of the PM10 field, indicating that the increase in horizontal resolution of the erodibility dataset alone does not significantly modify the modeled PM10 concentrations at the surface.
Finally, the SOILHD experiment shows a more complex spatial response. On average, it yields lower PM10 concentrations than CTRL, with widespread negative differences of approximately −10 % to −25 % across large parts of the domain. However, localized regions also exhibit positive deviations of up to approximately 10 %, indicating that the impact of SOILHD is not uniform in space. This spatial heterogeneity reflects the introduction of soil texture information and the redistribution of erodible fractions, which modifies both the intensity and the location of dust source regions. As a result, SOILHD not only reduces overall dust loading in many areas but also enhances emissions in specific localized hotspots where soil composition favors higher erodibility.
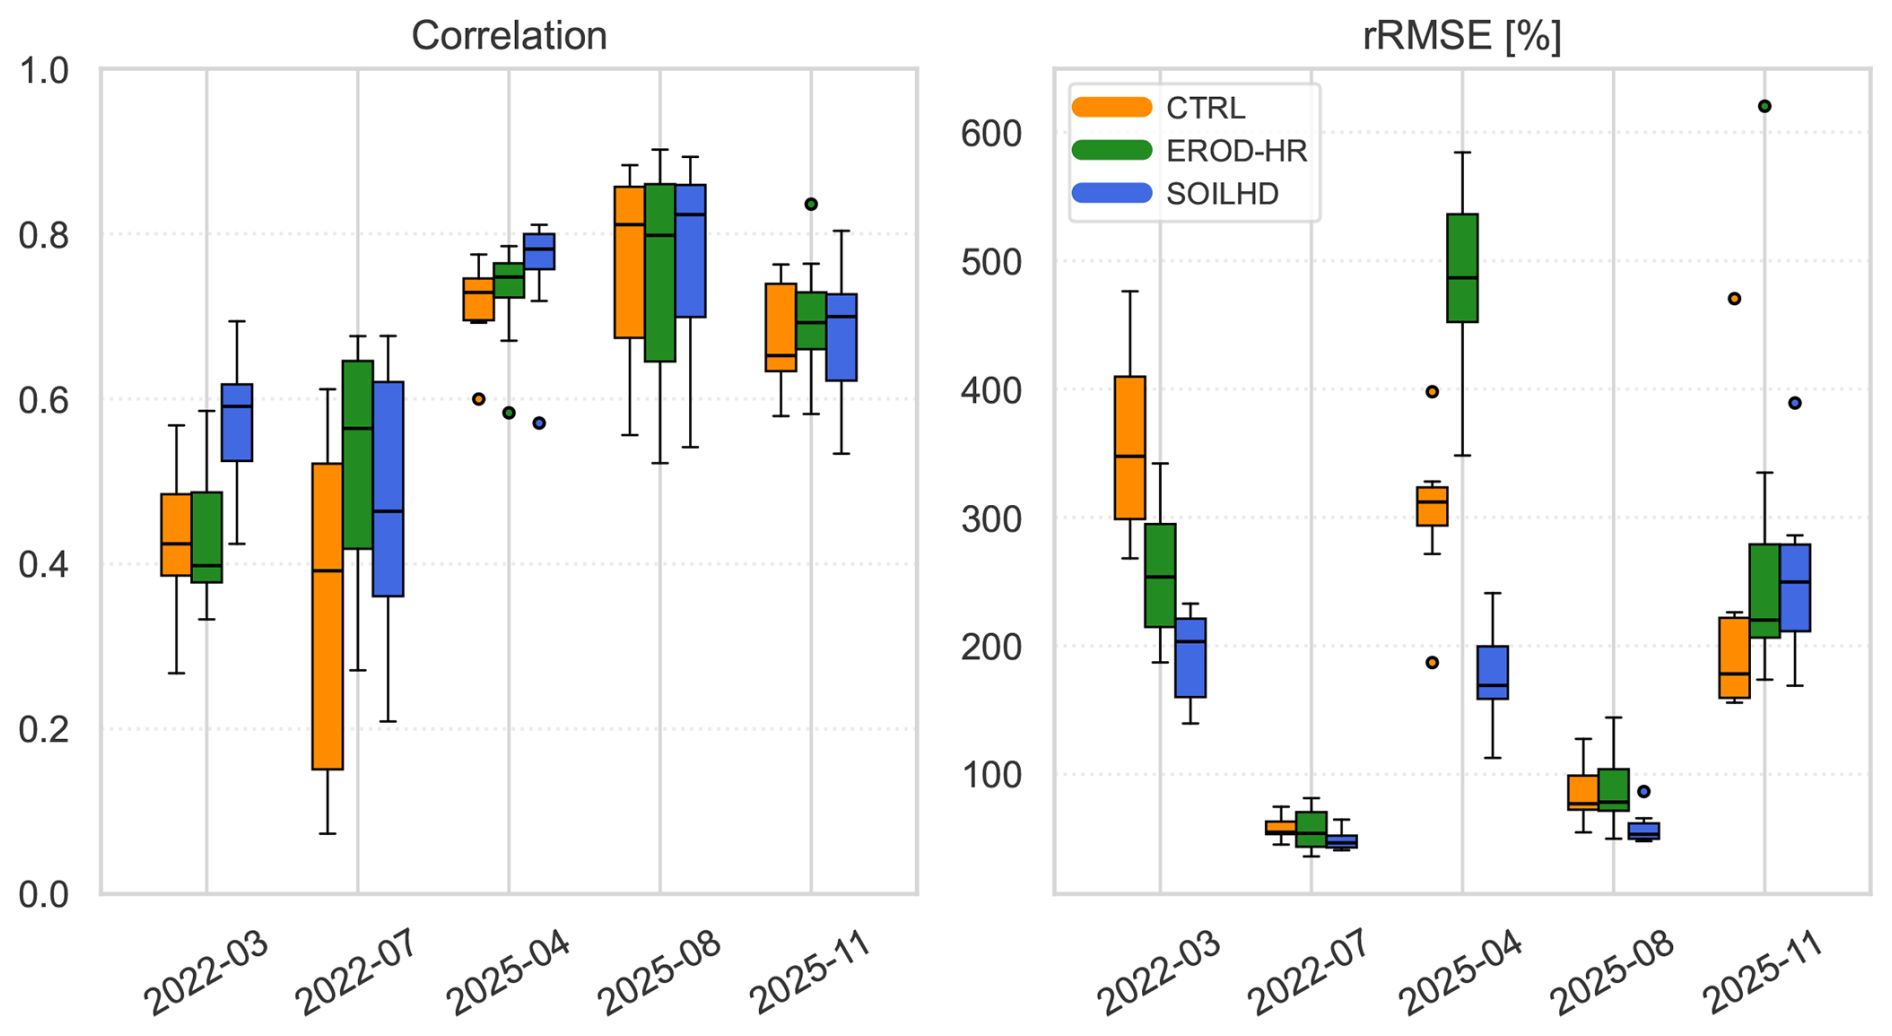
Figure 10Boxplots for Correlation (left) and relative RMSE (right) distributions for every period time series by experiment (CTRL, orange; EROD-HR, green; and SOILHD, blue).
3.2 Comparison with ground-based measurements
Surface PM10 concentrations from all simulations were evaluated against observations from the SINQLAIR regional air quality monitoring network within the RM domain (d03). The evaluation was conducted across five independent simulation periods representing distinct synoptic and emission regimes, ranging from large-scale Saharan dust outbreaks to local uplift and convectively driven events. This multi-event framework allows assessment not only of the overall performance of the different erodibility configurations but also of their robustness under contrasting interannual meteorological conditions and spatial emission patterns. Figure 10 summarizes the distribution of correlation coefficients (left) and relative RMSE values (right) obtained for the modeled PM10 time series at all monitoring stations and simulation periods.
Substantial variability is observed across the analyzed periods, reflecting the strong dependence of model performance on the dominant dust generation and transport mechanisms. Nevertheless, a consistent behavior emerges across most simulations: the inclusion of the high-resolution erodibility datasets, and particularly the SOILHD configuration, generally improves agreement with observations relative to CTRL. Overall, SOILHD yields the most stable behavior across periods, with systematically higher median correlations and lower RMSE dispersion. This indicates that the improvements introduced by the soil-texture-dependent erodibility formulation are not restricted to a single event type but remain robust under different synoptic conditions and emission regimes.
The magnitude of the improvement, however, varies substantially depending on the nature of the event. During intense dust outbreaks dominated by long-range Saharan transport, such as the 2022-03 episode, all simulations exhibit very large RMSE values due to the extreme PM10 concentrations reached during the event. In contrast, for periods more strongly influenced by local uplift and mesoscale variability (e.g., 2022-07 and 2025-08), absolute RMSE values are lower, and differences between experiments become less pronounced, although still significant. In these local-scale situations, SOILHD produces relative RMSE reductions of approximately 12.0 % and 21.0 %, respectively, compared to CTRL.
A marked spatial variability is also evident among stations. Inland stations generally show a clearer separation between experiments, with SOILHD consistently reducing both RMSE and bias relative to CTRL and EROD-HR. Conversely, coastal stations tend to exhibit greater variability and weaker sensitivity to the erodibility configuration. This behavior is likely associated with the combined influence of marine aerosol contributions, local recirculation processes, and anthropogenic sources not represented in the present simulations.
The 2022-03 event represents the most extreme episode analyzed in this study, characterized by persistent and exceptionally high PM10 concentrations across the entire IP and specifically over the RM. Under these conditions, the improvement achieved with SOILHD becomes particularly evident. The average correlation coefficient increases from 0.43 in CTRL to 0.57 in SOILHD, with a maximum station correlation of 0.69 compared to 0.57 in CTRL. At the same time, the average RMSE decreases from 358.2 % to 191.3 %, corresponding to a relative RMSE reduction of 166.9 %. Mean bias error (MBE) also decreases substantially, from 181.4 to 74.1 µg m−3 (105.6 µg m−3 for EROD-HR), further demonstrating the improved representation of dust emissions provided by SOILHD during intense transport-driven episodes.
In contrast, the 2022-07 period exhibits the largest inter-station variability in correlation values. CTRL correlations range from values close to zero (0.07) up to 0.61, whereas EROD-HR and SOILHD slightly reduce this dispersion, yielding ranges of 0.27–0.68 and 0.21–0.68, respectively. This behavior suggests that higher-resolution erodibility fields improve the representation of localized emission structures and temporal PM10 evolution under weak synoptic forcing conditions. During this event, CTRL underestimates PM10 concentrations at six of the eight stations, with an average MBE of −4.00 µg m−3 and RMSE values frequently exceeding 20 µg m−3. In addition, only 50 % of the stations exhibit statistically significant correlations (p-value <0.01). The EROD-HR experiment slightly reduces RMSE values but tends to maintain the overall underestimation pattern, whereas SOILHD further improves the temporal structure and magnitude of the simulated dust peaks.
The 2025-04 period represents an intermediate situation combining convective dust transport from northern Algeria and Morocco with local uplift processes along the eastern Iberian coast. Correlation values remain very similar among experiments, with SOILHD showing a marginally higher average correlation (0.75) relative to CTRL (0.71) and EROD-HR (0.72). However, substantial differences emerge in RMSE values. In particular, EROD-HR produces unrealistically high PM10 concentrations, yielding an average RMSE of 121.6 µg m−3, the highest among all experiments and periods analyzed in relation to the average PM10 observations (rRMSE of 485.4 %). This behavior is likely associated with highly localized regions of excessive erodibility that become strongly activated under intense wind conditions. In contrast, SOILHD provides the lowest average RMSE (44.0 µg m−3), indicating that the inclusion of soil-texture heterogeneity moderates unrealistic localized emissions while preserving the spatial variability of dust uplift.
The 2025-08 event, which is examined in greater detail later in this section, yields the best overall performance for SOILHD. This period exhibits the highest average and maximum correlation values among all simulations, together with substantially reduced RMSE values relative to CTRL and EROD-HR. These results further highlight the capability of SOILHD to improve the representation of local-scale dust uplift and convectively driven transport situations.
Finally, the 2025-11 event is characterized by a strong Atlantic low-pressure system promoting intense southwesterly flow and northward dust transport from North Africa toward the IP. During this period, SOILHD exhibits a more consistent correlation across stations. Although the mean correlation is slightly higher for EROD-HR (0.70 compared to 0.68 for SOILHD), the median value is higher for SOILHD (0.70 versus 0.69), indicating that the apparent advantage of EROD-HR is largely driven by a single outlier station (LOR, 0.84). This suggests a more homogeneous performance of SOILHD across the monitoring network, whereas EROD-HR shows greater sensitivity to site-specific behavior. RMSE values slightly increase on average with SOILHD, from 62.4 to 74.5 µg m−3. This constitutes the only analyzed period in which both RMSE and MBE increase in SOILHD relative to CTRL, a behavior also partially reproduced by EROD-HR. This result likely reflects the sensitivity of long-range transport events to the precise spatial redistribution of erodible areas introduced by the high-resolution datasets. Under these conditions, the modified source regions incorporated in SOILHD may enhance emissions in areas with stronger effective erodibility than those represented in the default configuration.
Overall, SOILHD yields the highest average correlation values in three out of the five analyzed periods, while producing nearly identical values to EROD-HR during the remaining two events (2022-07 and 2025-04). In addition, SOILHD provides the lowest RMSE values in four out of five periods, the only exception being 2025-11. Both EROD-HR and SOILHD consistently produce statistically significant correlations (p-value <0.01), confirming the robustness of the improvements introduced by the high-resolution erodibility formulations. To further complement the statistical evaluation across periods and experiments, a Taylor diagram summarizing the spatially averaged performance metrics (correlation, standard deviation, and RMSE) for each simulation period has been included in the Appendix (Fig. E1). This provides a compact visual synthesis of model skill and its variability across the different interannual regimes analyzed in this study.
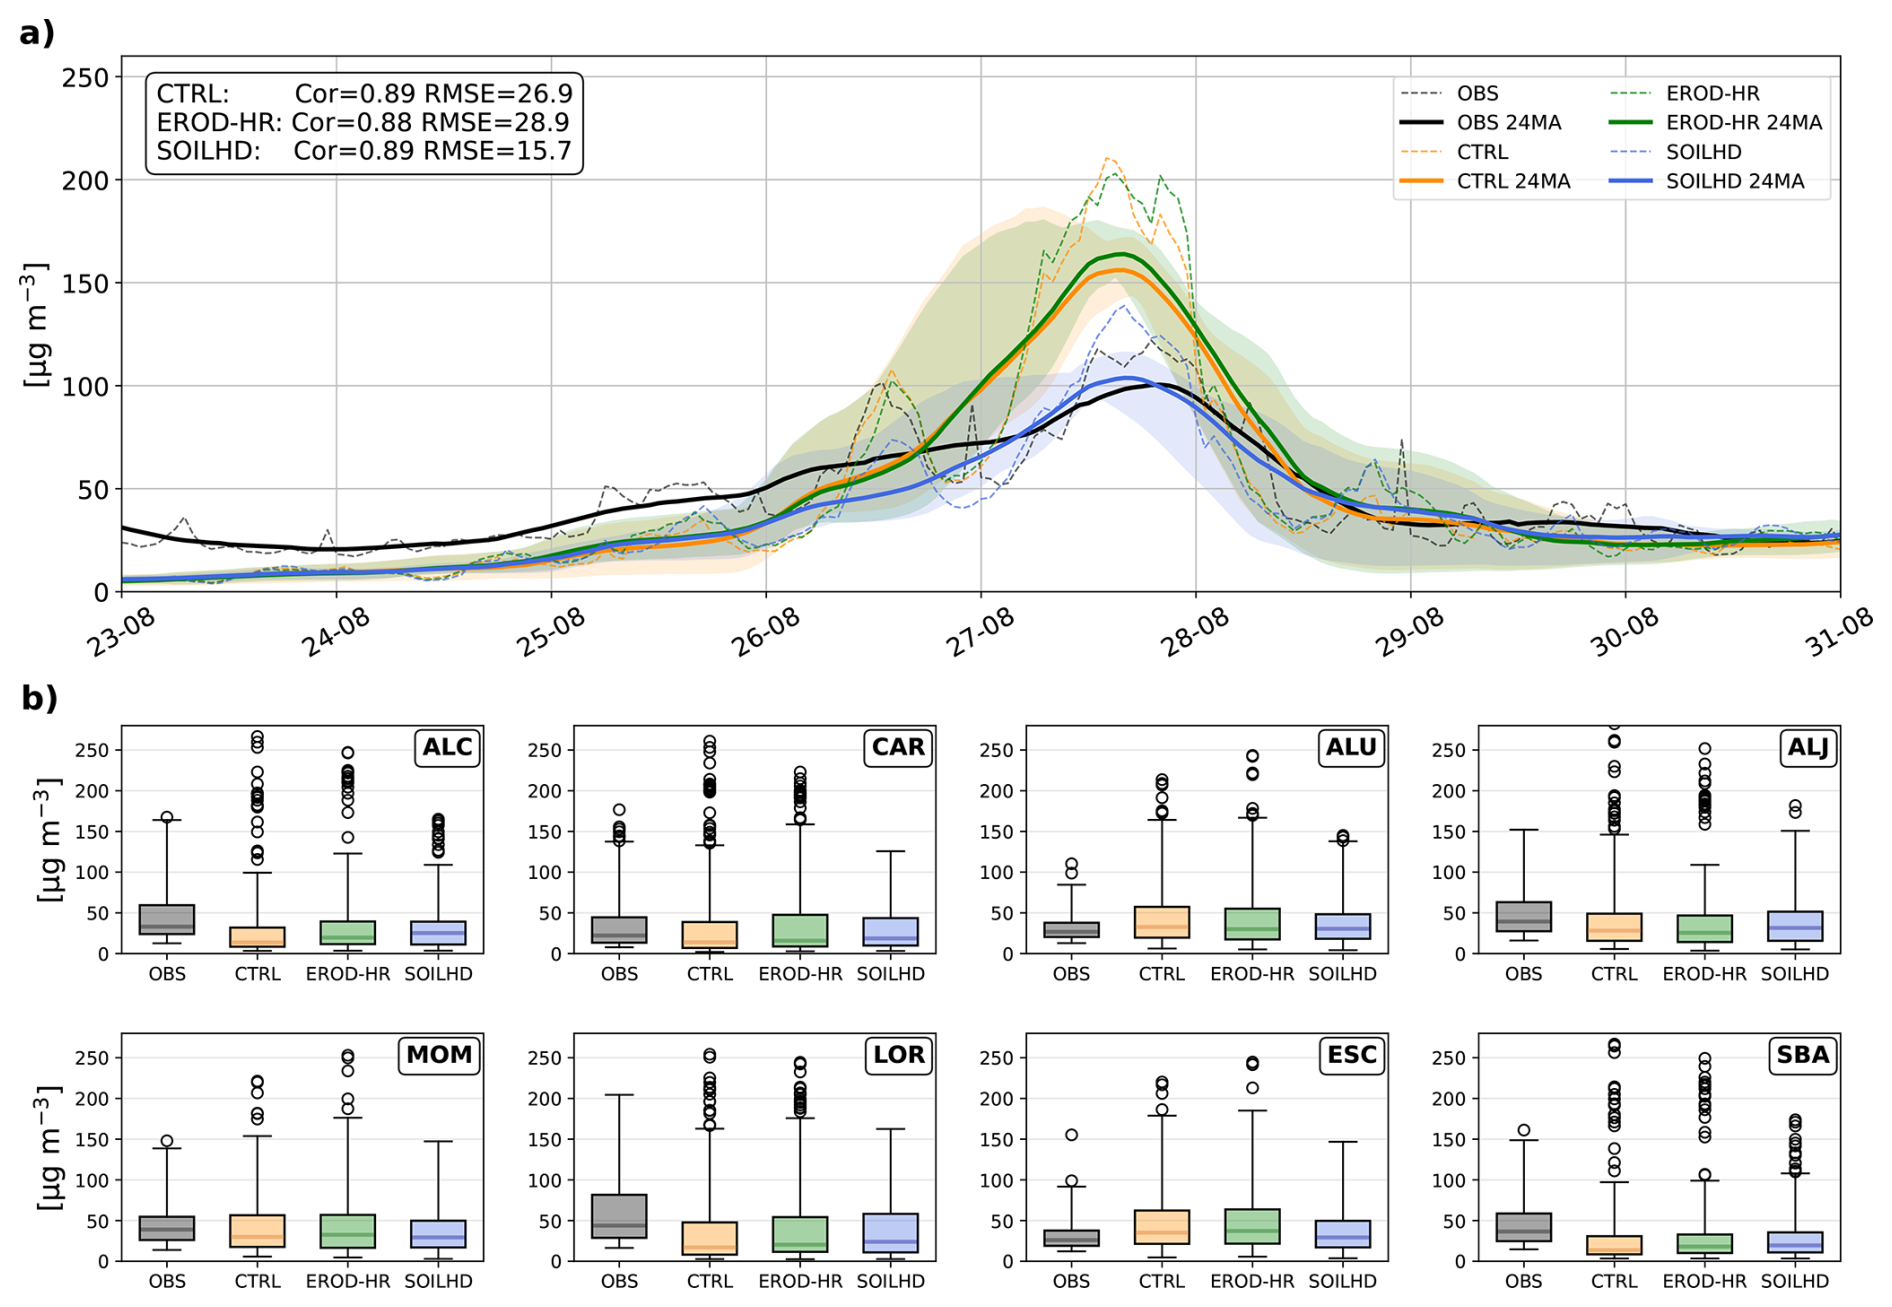
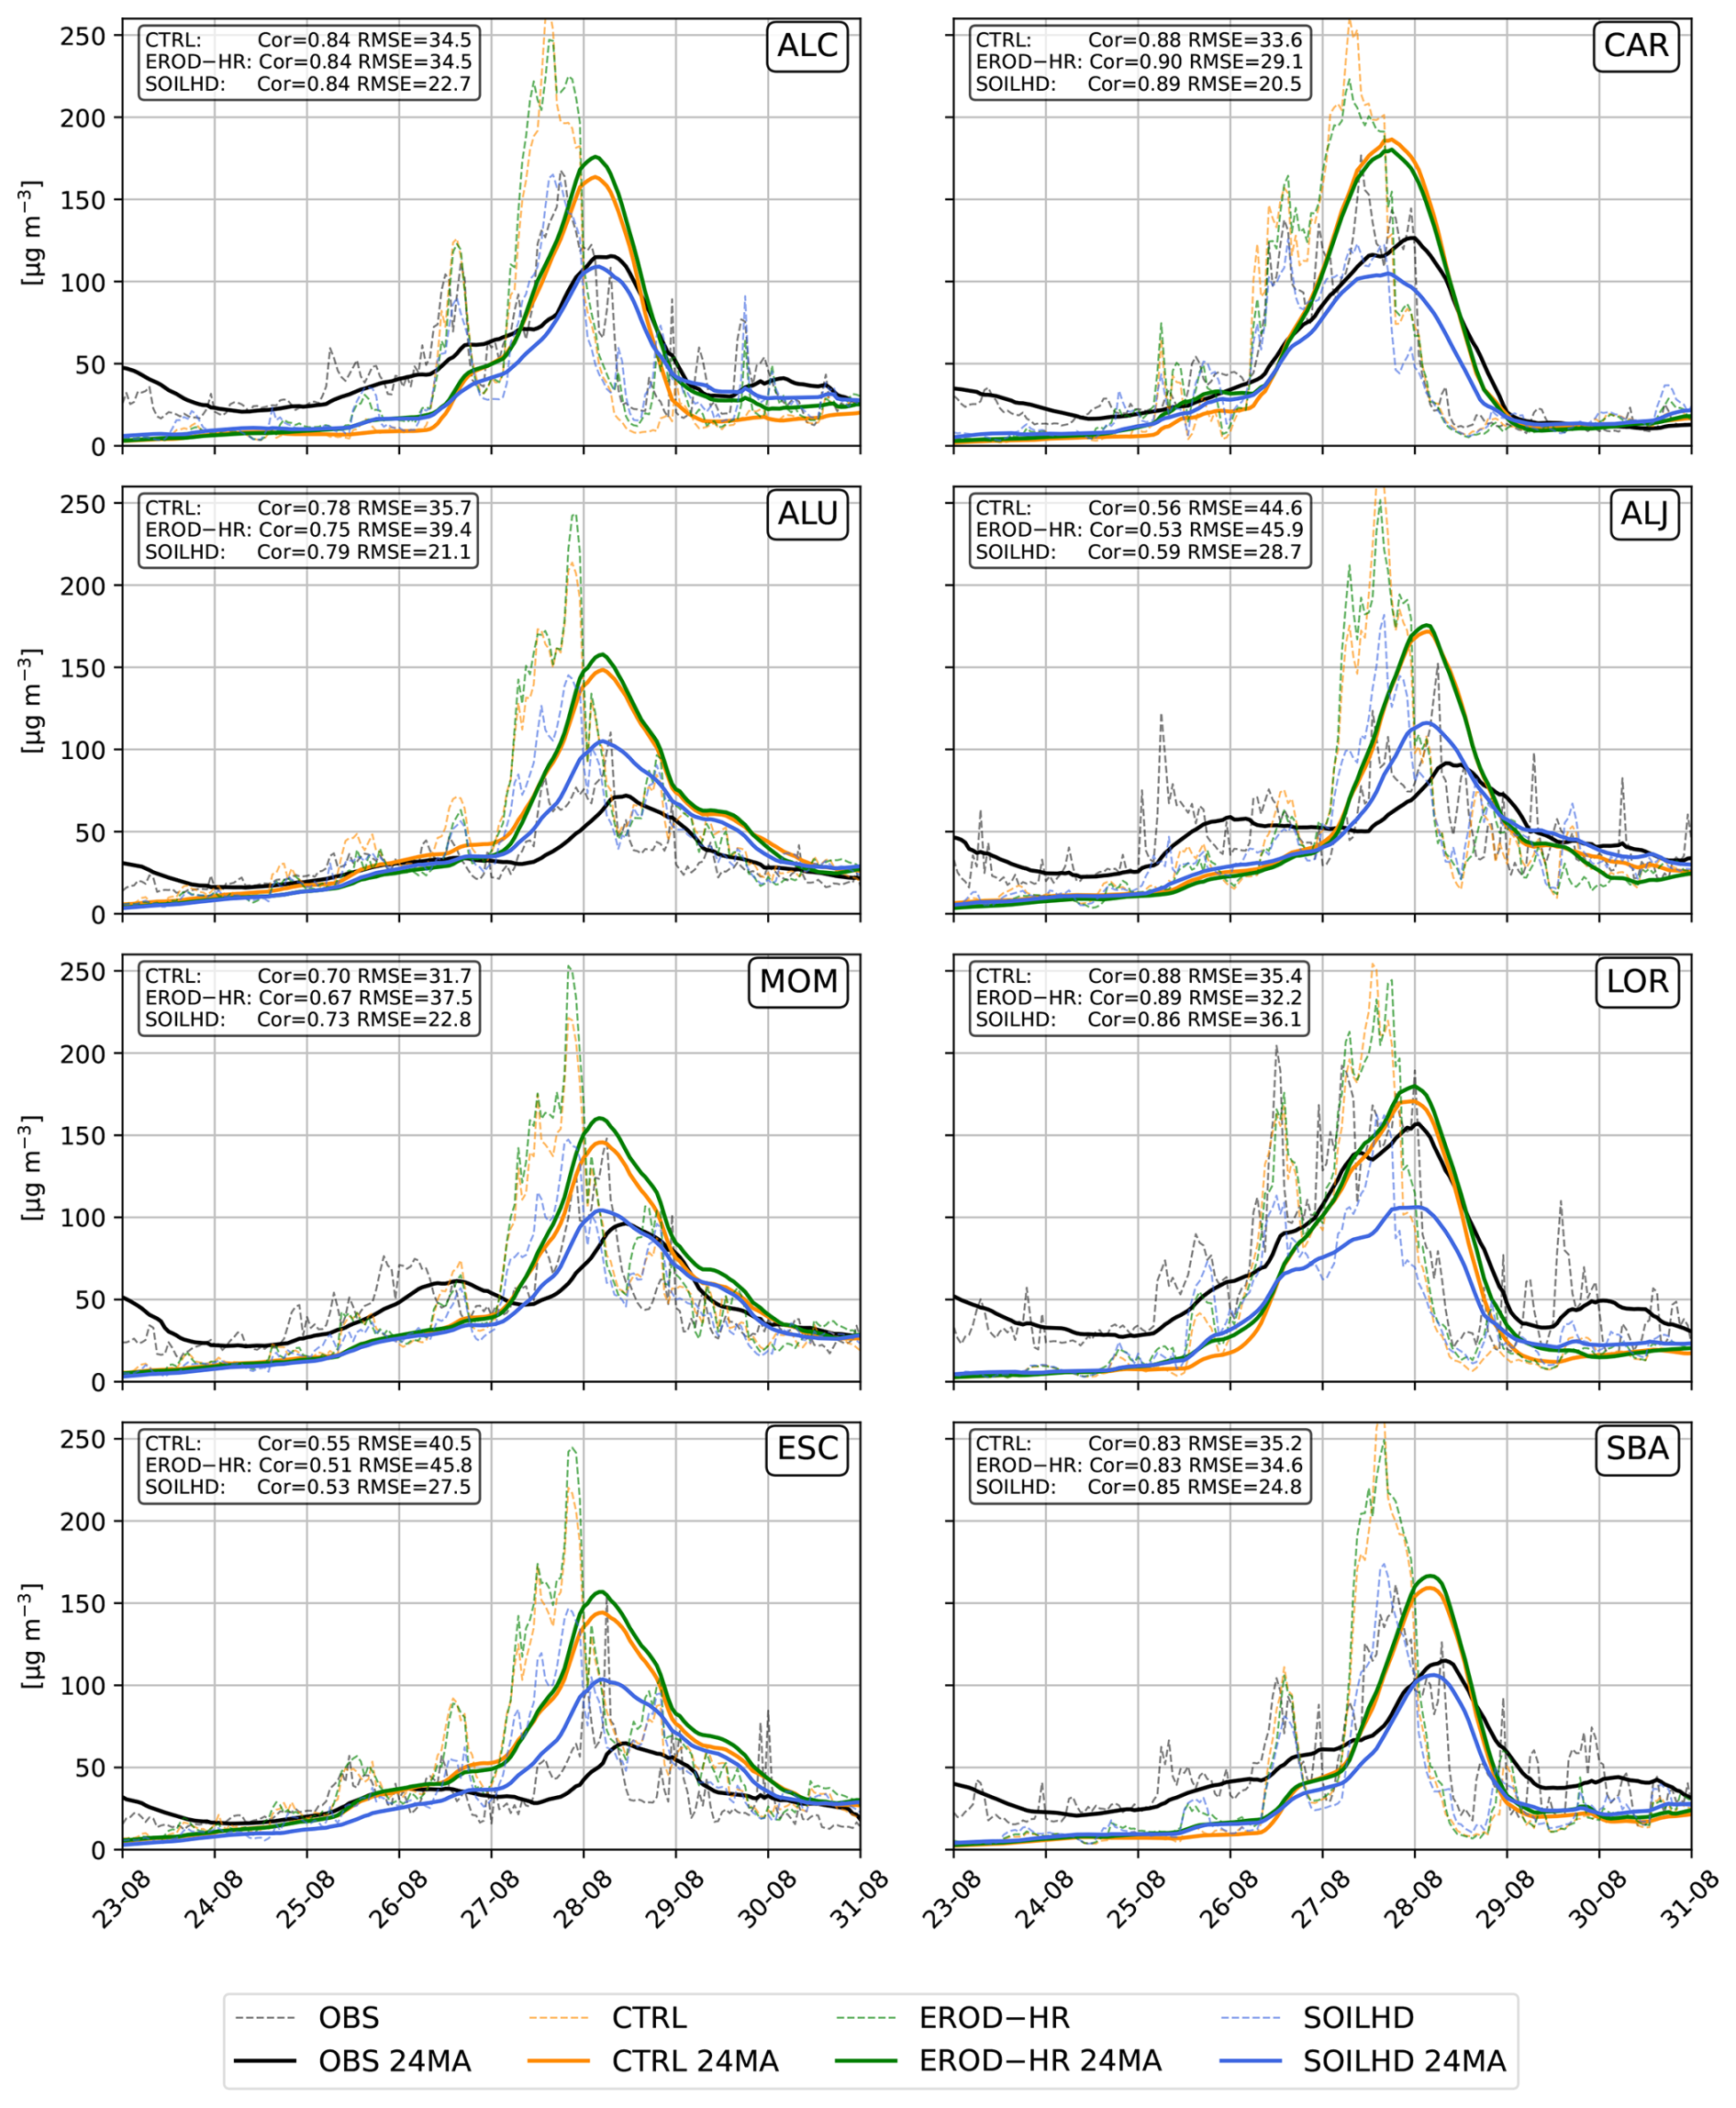
Figure 11(a) Site-averaged PM10 time series (dashed lines) and 24 h moving average series (solid lines) for observations (black) and CTRL (orange), EROD-HR (green), and SOILHD (blue) experiments obtained by bilinearly interpolating the model experiments to each SINQLAIR station location. For a given dataset series, the PM10 span across all stations is also represented (light colors). The metrics of every dataset are displayed in the top-left corner of the plot. (b) Boxplots with the interpolated PM10 values for every station and dataset. Outlier values are represented with circles.
The August 2025 case was examined in greater detail, as it represents a summer dust episode characterized by the combined influence of local dust uplift and convective transport, a situation in which the physical configuration of the erodibility field is particularly influential. Figure 11 presents surface PM10 observational (OBS) and modeled (CTRL, EROD-HR, and SOILHD) time series (dashed lines) for the 2025-08 period, obtained by bilinear interpolation of model output to the geographic coordinates of the SINQLAIR monitoring stations. In addition, 24 h moving averages (24MA) are shown for all series (solid lines), both to improve clarity and visualization and because 24 h averaging is a standard metric in air quality analysis and forecasting. Complementary PM10 boxplots summarizing the distribution at each station and for every dataset are also included. For a more detailed inspection of individual station time series, Fig. F1 is provided.
Overall, the SOILHD configuration provides the best agreement with observations at most monitoring stations, particularly during the main dust event of 27–28 August, when it successfully captures peak PM10 concentrations at multiple sites. From 26 August onwards, the 24 h moving-average (24MA) observational series remains within the envelope defined by the individual station time series simulated with SOILHD, indicating that this configuration produces PM10 concentrations which are representative of the observed inter-station variability. In addition, SOILHD closely matches the observations, reproducing both mean and peak PM10 values at most locations.
In contrast, both the CTRL and EROD-HR experiments substantially overestimate PM10 concentrations across all stations, particularly during high-concentration episodes. For instance, at the San Basilio (SBA) station, CTRL and EROD-HR simulations reach peak values exceeding 250 µg m−3, whereas the observed maximum is approximately 150 µg m−3.
It is worth noting that all simulations in this study only include mineral dust emissions, while anthropogenic PM10 sources (e.g., NOx, SO2, BC, and secondary aerosol formation pathways) are not explicitly represented. Consequently, part of the persistent background PM10 concentrations observed at the monitoring stations is not reproduced by the model. This behavior is evident in both Figs. 11 and F1, where observed PM10 values remain well above near-zero levels outside the main dust peaks, indicating a non-negligible anthropogenic contribution, particularly at inland and industrially influenced locations such as LOR. The absence of these background sources may partly explain the systematic underestimation found in some periods and stations, and should therefore be considered when interpreting the absolute PM10 biases. Under these conditions, a moderate negative bias in the simulations is physically plausible and, to some extent, expected.
Although all configurations yield similar correlation coefficients (0.89), the SOILHD experiment exhibits a substantially lower RMSE (15.7 µg m−3), highlighting its superior quantitative performance. A closer examination of the individual time series at each monitoring station (Table 5) confirms that the SOILHD configuration provides the best overall performance. SOILHD yields lower RMSE values at 7 out of 8 stations, with an average reduction of 10.9 µg m−3 relative to the CTRL experiment. Although all configurations exhibit high correlation coefficients at most sites, SOILHD attains the highest correlation at five of the eight stations, with an average value of 0.77.
Table 5Statistical parameters (correlation and RMSE) for the time series of the three different experiments during the period starting on 22 August 2025. Time series for each location were obtained by bilinearly interpolating every model output to its respective ground station location. All correlations are significant (p-value <0.01). RMSE units are µg m−3.
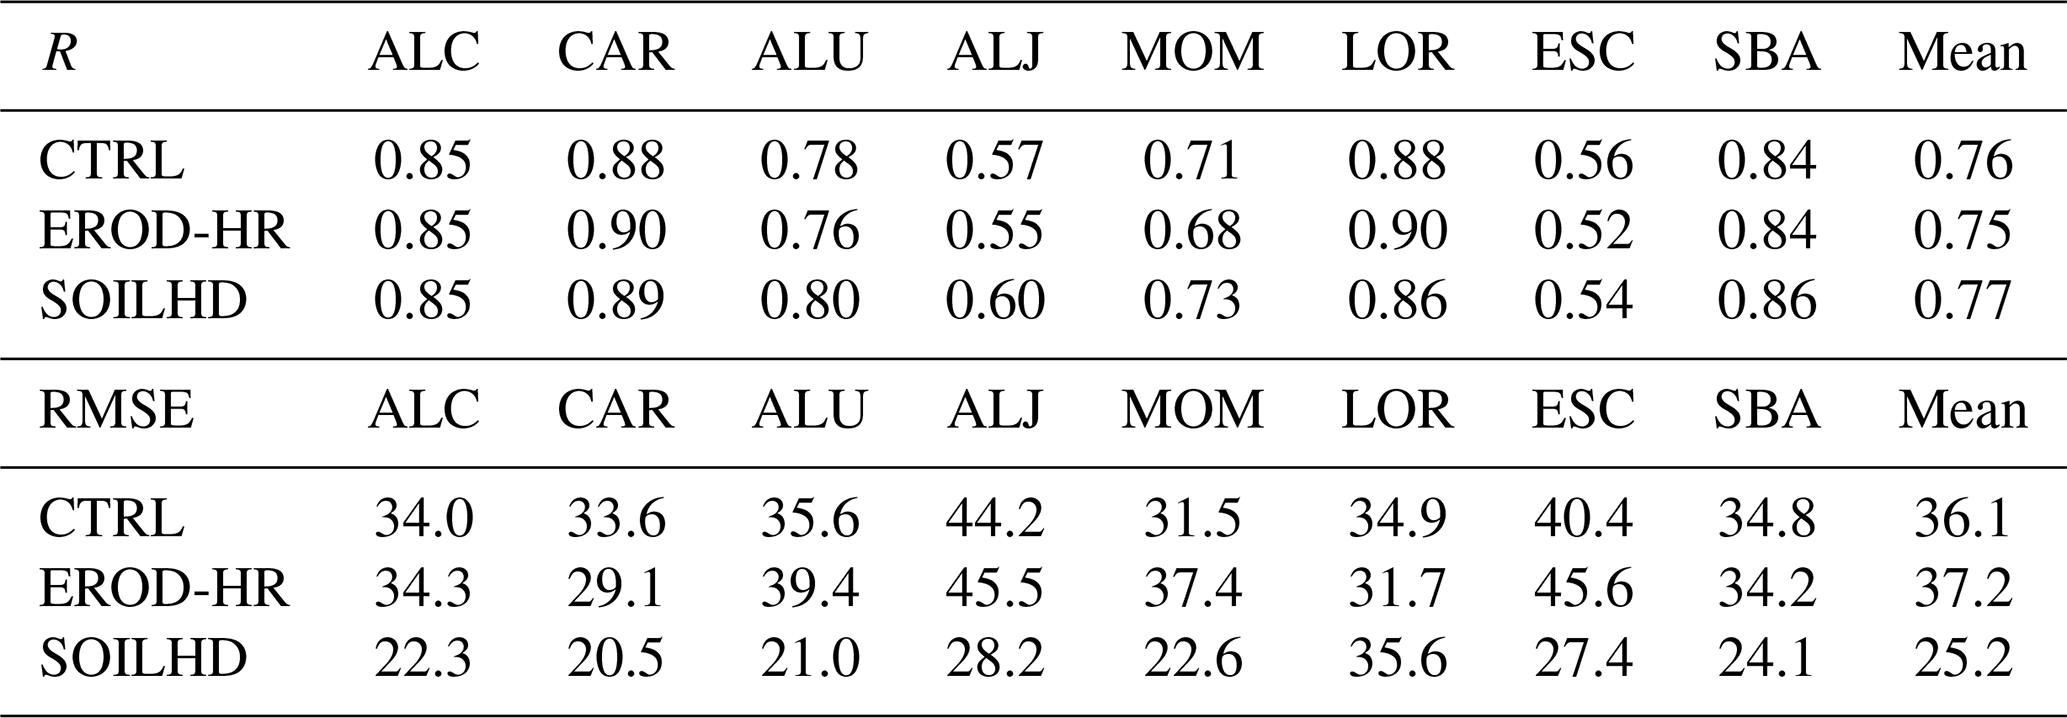
When switching to the new high-resolution erodibility datasets, near-coastal stations (ALU, ALJ, ESC, and MOM) exhibit a weaker, yet still statistically significant, response in terms of correlation, together with a marked improvement in RMSE relative to observations, with the exception of ESC. At these sites, all model configurations tend to overestimate PM10 concentrations, suggesting an overestimation of local dust source strength and/or excessive recirculation within the model domain.
The ESC station represents a particular case, as its observed PM10 variability is substantially higher than at any other site. This behavior may be partly explained by the contribution of sea-salt aerosols to PM10 levels and by the proximity of the station to the Escombreras combined-cycle power plant, a known source of black carbon, nitrates, sulfates, and other anthropogenic pollutants not explicitly represented in the simulations. Nevertheless, the model is able to partially reproduce the observed variability at ESC, particularly in the EROD-HR and SOILHD experiments. These configurations also capture the magnitude of several PM10 peaks, most notably during the dust outbreak of 27–28 August. Among the simulations, the modeled time series transitions from a slight overestimation in the SOILHD experiment to a more pronounced overestimation in CTRL and EROD-HR.
For inland stations (ALC, CAR, LOR, and SBA), CTRL and EROD-HR exhibit nearly identical behavior, substantially overestimating observed PM10 concentrations, especially during the peak associated with the 27–28 August dust event. In contrast, the SOILHD experiment shows a remarkable agreement with observations, accurately reproducing both the timing and magnitude of the PM10 maximum. For instance, at Alcantarilla (ALC), SOILHD simulates a maximum concentration of 165.1 µg m−3 on 27 August, in close agreement with the observed value of 167.6 µg m−3 (relative error of 1.5 %). In comparison, CTRL and EROD-HR yield maxima of 266.6 and 247.1 µg m−3, corresponding to errors of 59.1 % and 47.4 %, respectively. The only notable exception to the overall pattern is observed at the Lorca (LOR) station, where both CTRL and EROD-HR simulations more closely capture the observed peak PM10 concentrations. In contrast, SOILHD consistently exhibits a negative bias throughout the study period. This discrepancy is likely attributable to the strong influence of anthropogenic pollution at LOR, which is not represented in the current simulations. Local industrial activity and traffic emissions, each with distinct diurnal cycles, may contribute an additional PM10 background that is absent from the model, resulting in systematic underestimation in highly polluted areas.
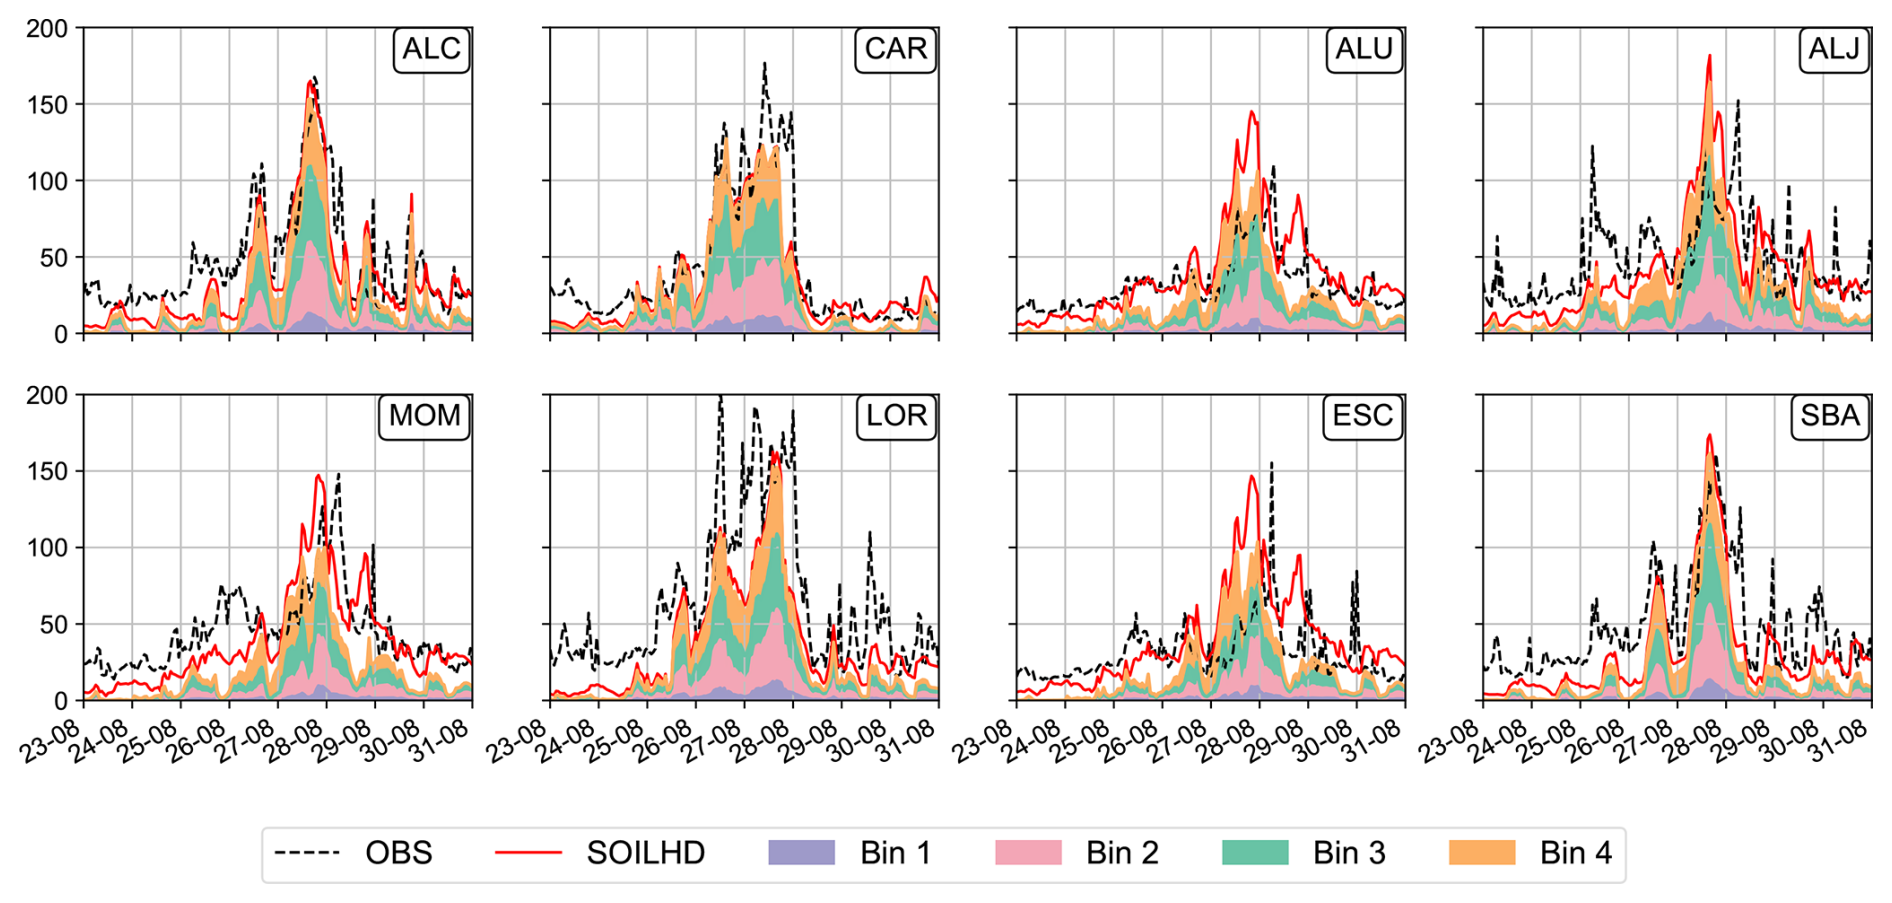
To further illustrate these dynamics, Fig. G1 presents the time series of PM10 and accumulated dust for all eight stations during the 2025-08 period. For coastal stations (ALU, ALJ, MOM, and ESC), it is evident that the accumulated dust concentrations alone cannot account for the modeled PM10 levels, indicating a substantial contribution from marine salt to the natural-origin PM10 fraction (the only component represented in the present simulations). Conversely, at some stations, namely ALC, ALJ, MOM, LOR, ESC, and SBA, SOILHD systematically underestimates the observed PM10 concentrations. The observed deviations can be attributed to a combination of external PM10 sources specific to each location, such as heavy traffic (ALC, MOM, LOR, SBA), industrial emissions (ALC, MOM, ESC), and agricultural activities such as soil tilling (ALJ).
Based on the discrepancy between observations and the SOILHD experiment, which performs well in low-pollution environments, this anthropogenic contribution can be estimated to range between approximately 25 and 50 µg m−3. This interpretation is further supported by results at Caravaca (CAR), a station located in the northwestern part of the RM, where anthropogenic influences are minimal. At this site, SOILHD clearly provides the best agreement with observations. It is important to note that the primary objective of this study is to evaluate the performance of the new erodibility database, rather than to develop an operational air-quality forecasting system. The incorporation of anthropogenic emission inventories is therefore beyond the scope of the present work, but will be addressed in future simulations.
This study presents the development and evaluation of two new high-resolution soil erodibility datasets implemented within the WRF-Chem model coupled with the GOCART aerosol scheme to improve the representation of mineral dust emissions and transport over regions characterized by complex topography and heterogeneous surface properties. To this end, GMTED2010 topographic elevation data were combined with the MODIS 20-category land-use classification to produce a physically consistent global dataset at 5 km resolution (EROD-HR). To further refine the simulations, a high-resolution soil texture dataset from ISRIC SoilGrids (250 m resolution), together with an LCZ-based global land category map at 7.5 arcsec resolution, was incorporated to generate an enhanced dataset including explicit mass fractions of sand, silt, and clay (SOILHD). The resulting datasets substantially modify the spatial distribution of potential dust sources relative to the default WRF-Chem erodibility field (CTRL).
The analysis of the new erodibility fields indicates that, although the overall mean erodibility remains comparable to that of the default dataset, the spatial configuration of dust emission sources changes markedly. Over the RM (d03), the number of active source points is reduced while their mean erodibility increases, resulting in more concentrated and physically consistent dust source regions. This refinement limits the excessive spatial spreading of sources and enhances emissions in areas with higher physical erosion potential, better capturing the heterogeneity of arid and semi-arid environments such as southeastern Spain. The inclusion of explicit soil mass fraction layers in the SOILHD configuration further strengthens the physical basis of the dataset by distinguishing between sand, silt, and clay contributions, thereby modulating dust lifting intensity without artificially increasing total emission fluxes.
When implemented within WRF-Chem, the SOILHD configuration yields substantial improvements in the reproduction of observed PM10 concentrations. A comparative evaluation against a regional air quality observational dataset covering five independent simulation periods and eight monitoring stations shows a consistent improvement in model performance when using the high-resolution erodibility datasets. In particular, SOILHD achieves the highest correlation coefficients and lowest RMSE values in most periods, demonstrating robust performance across contrasting interannual and synoptic regimes. Overall, the results indicate that incorporating spatially variable soil texture substantially enhances the statistical agreement with observations.
The SOILHD configuration achieves the highest correlation in three out of five simulated periods (60 %), although in the 2025-11 case the period-mean value is slightly higher for EROD-HR, while SOILHD exhibits a higher median correlation, indicating a stronger station-wise consistency and reduced sensitivity to outliers. In addition, SOILHD attains the lowest RMSE values in four out of five periods (80 %), with particularly strong performance during the August 2025 dust episode. This event, characterized by the combined influence of local dust uplift and convective transport, highlights the sensitivity of PM10 simulations to the physical structure of the erodibility field. Vertical profile analyses further indicate a more balanced partition between local and advected dust under SOILHD, resulting in more realistic surface concentrations and vertical gradients compared to the default configuration.
In contrast, simulations employing the erodibility dataset proposed by Li et al. (2023) (LI2023 experiment) produce unrealistically high PM10 levels, consistent with an overestimation of dust emission potential over highly arid regions such as the Sahara Desert. Overall, the refined EROD-HR and SOILHD datasets enhance model realism, with SOILHD emerging as the most robust configuration in terms of both temporal variability and quantitative performance.
A clear spatial dependency in model performance is also evident. At near-coastal stations, improvements in RMSE are accompanied by slightly weaker but still statistically significant correlations, reflecting the combined influence of marine aerosols and local circulation effects. Despite these improvements, a general overestimation of PM10 persists at coastal sites, suggesting an overestimation of local dust source strength and/or excessive recirculation within the model domain.
This spatial contrast becomes more pronounced at inland stations, where CTRL and EROD-HR exhibit nearly identical behavior and substantially overestimate PM10 concentrations during major dust events, particularly the 27–28 August episode. In this context, the SOILHD configuration markedly reduces these biases, accurately reproducing both the timing and magnitude of observed peaks. For example, at Alcantarilla (ALC), SOILHD reproduces the observed maximum concentration with an error below 2 %, whereas CTRL and EROD-HR overestimate the peak by more than 45 %–60 %. The LOR (Lorca) station constitutes an exception to this pattern, where SOILHD underestimates PM10 throughout the period. This behavior is likely associated with strong local anthropogenic influences from industrial activity and traffic emissions, which are not included in the simulations and introduce a persistent diurnal background signal. This suggests an additional anthropogenic contribution of approximately 25–50 µg m−3, consistent with the discrepancies observed at other urban-influenced sites.
Overall, this work demonstrates that improving the physical realism of soil erodibility representation substantially enhances the simulation of mineral dust emissions and PM10 variability in WRF-Chem. Although the absence of anthropogenic emissions limits performance in heavily polluted areas, this does not affect the main objective of the study, which is the evaluation of the added value of the new erodibility datasets.
The SOILHD dataset notably improves both spatial and temporal consistency of dust simulations, enabling a more realistic representation of Saharan transport and local dust uplift processes over the Iberian Peninsula. These results indicate that both operational and research-oriented dust forecasting systems would benefit from incorporating high-resolution, physically based erodibility fields. Future work will focus on incorporating temporally varying vegetation cover, extending the evaluation to other dust-prone regions, and integrating anthropogenic emission inventories to develop a fully coupled air-quality modeling framework.
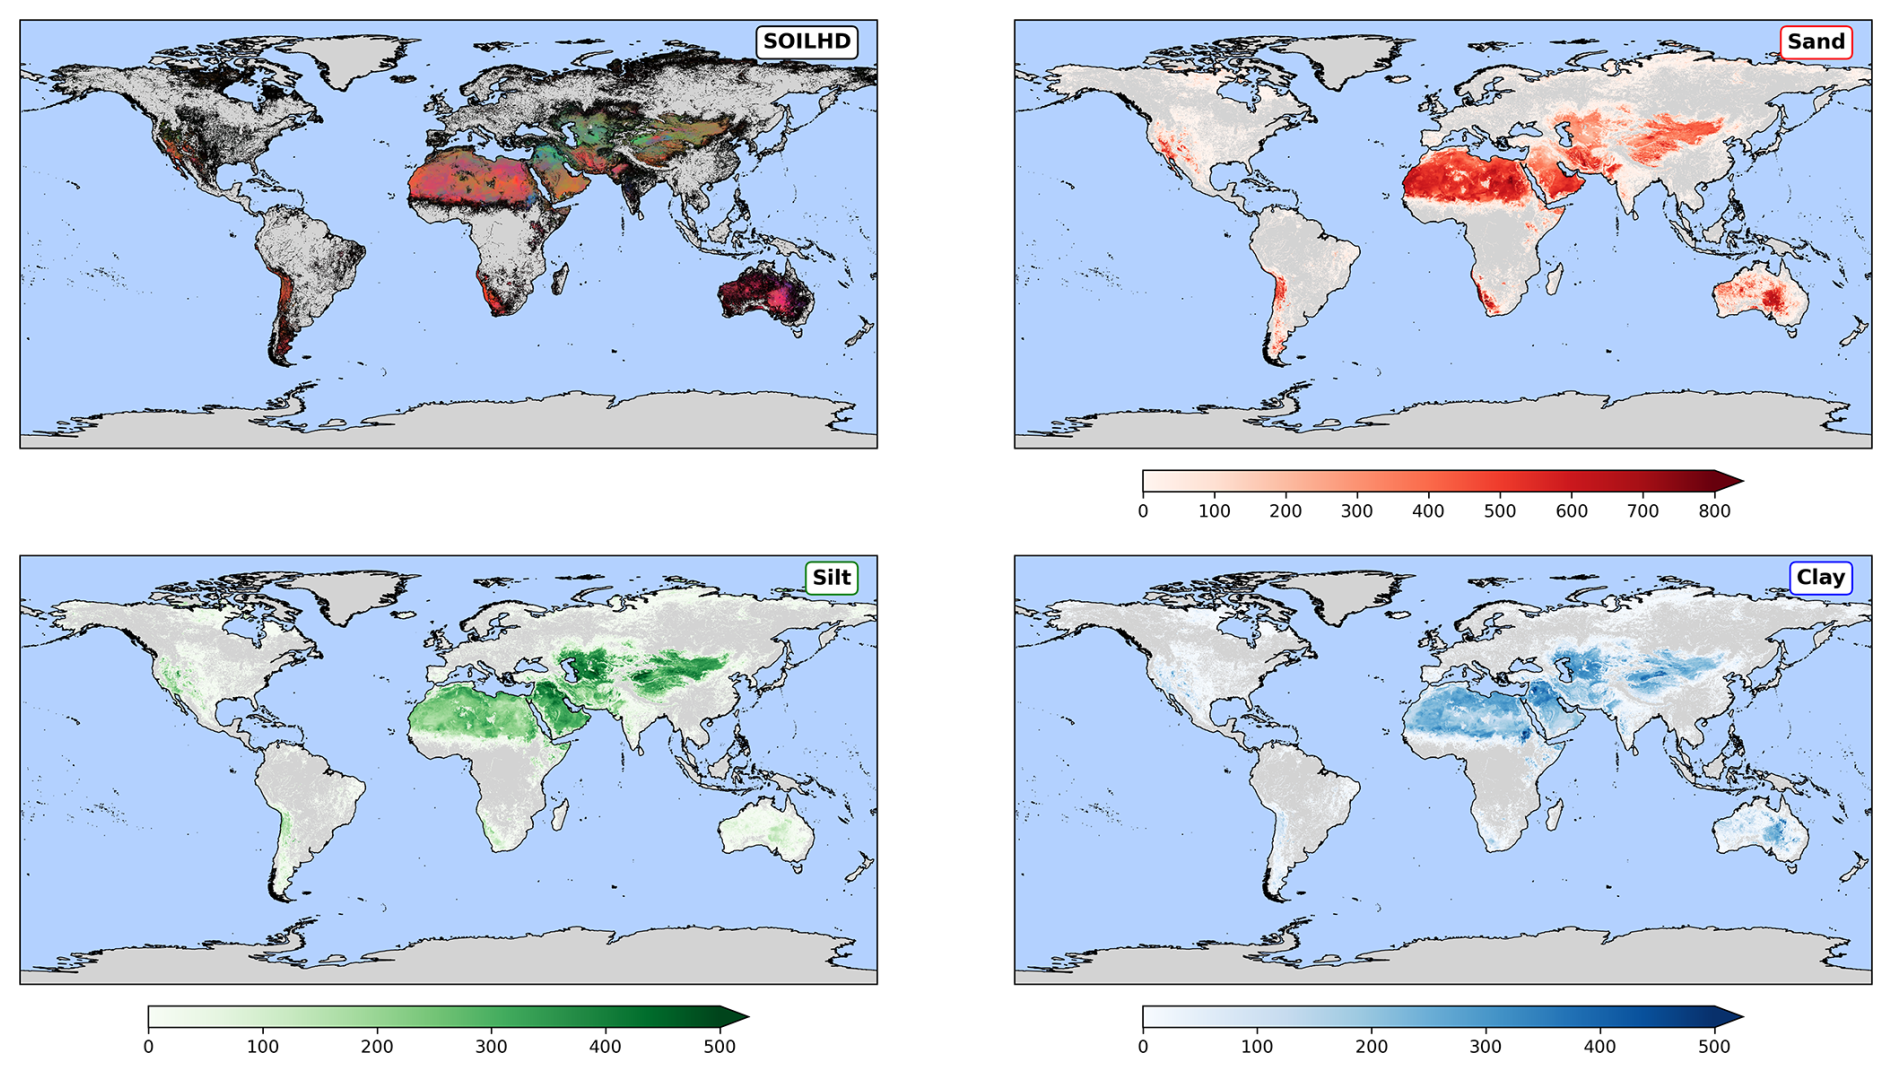
Figure A1SOILHD erodibility maps. First (top left), a 3-band RGB representation as in Fig. 2. The other three panels correspond to the different soil-type erodibility layers (sand, top right, red; silt, bottom left, green; clay, bottom right, blue).
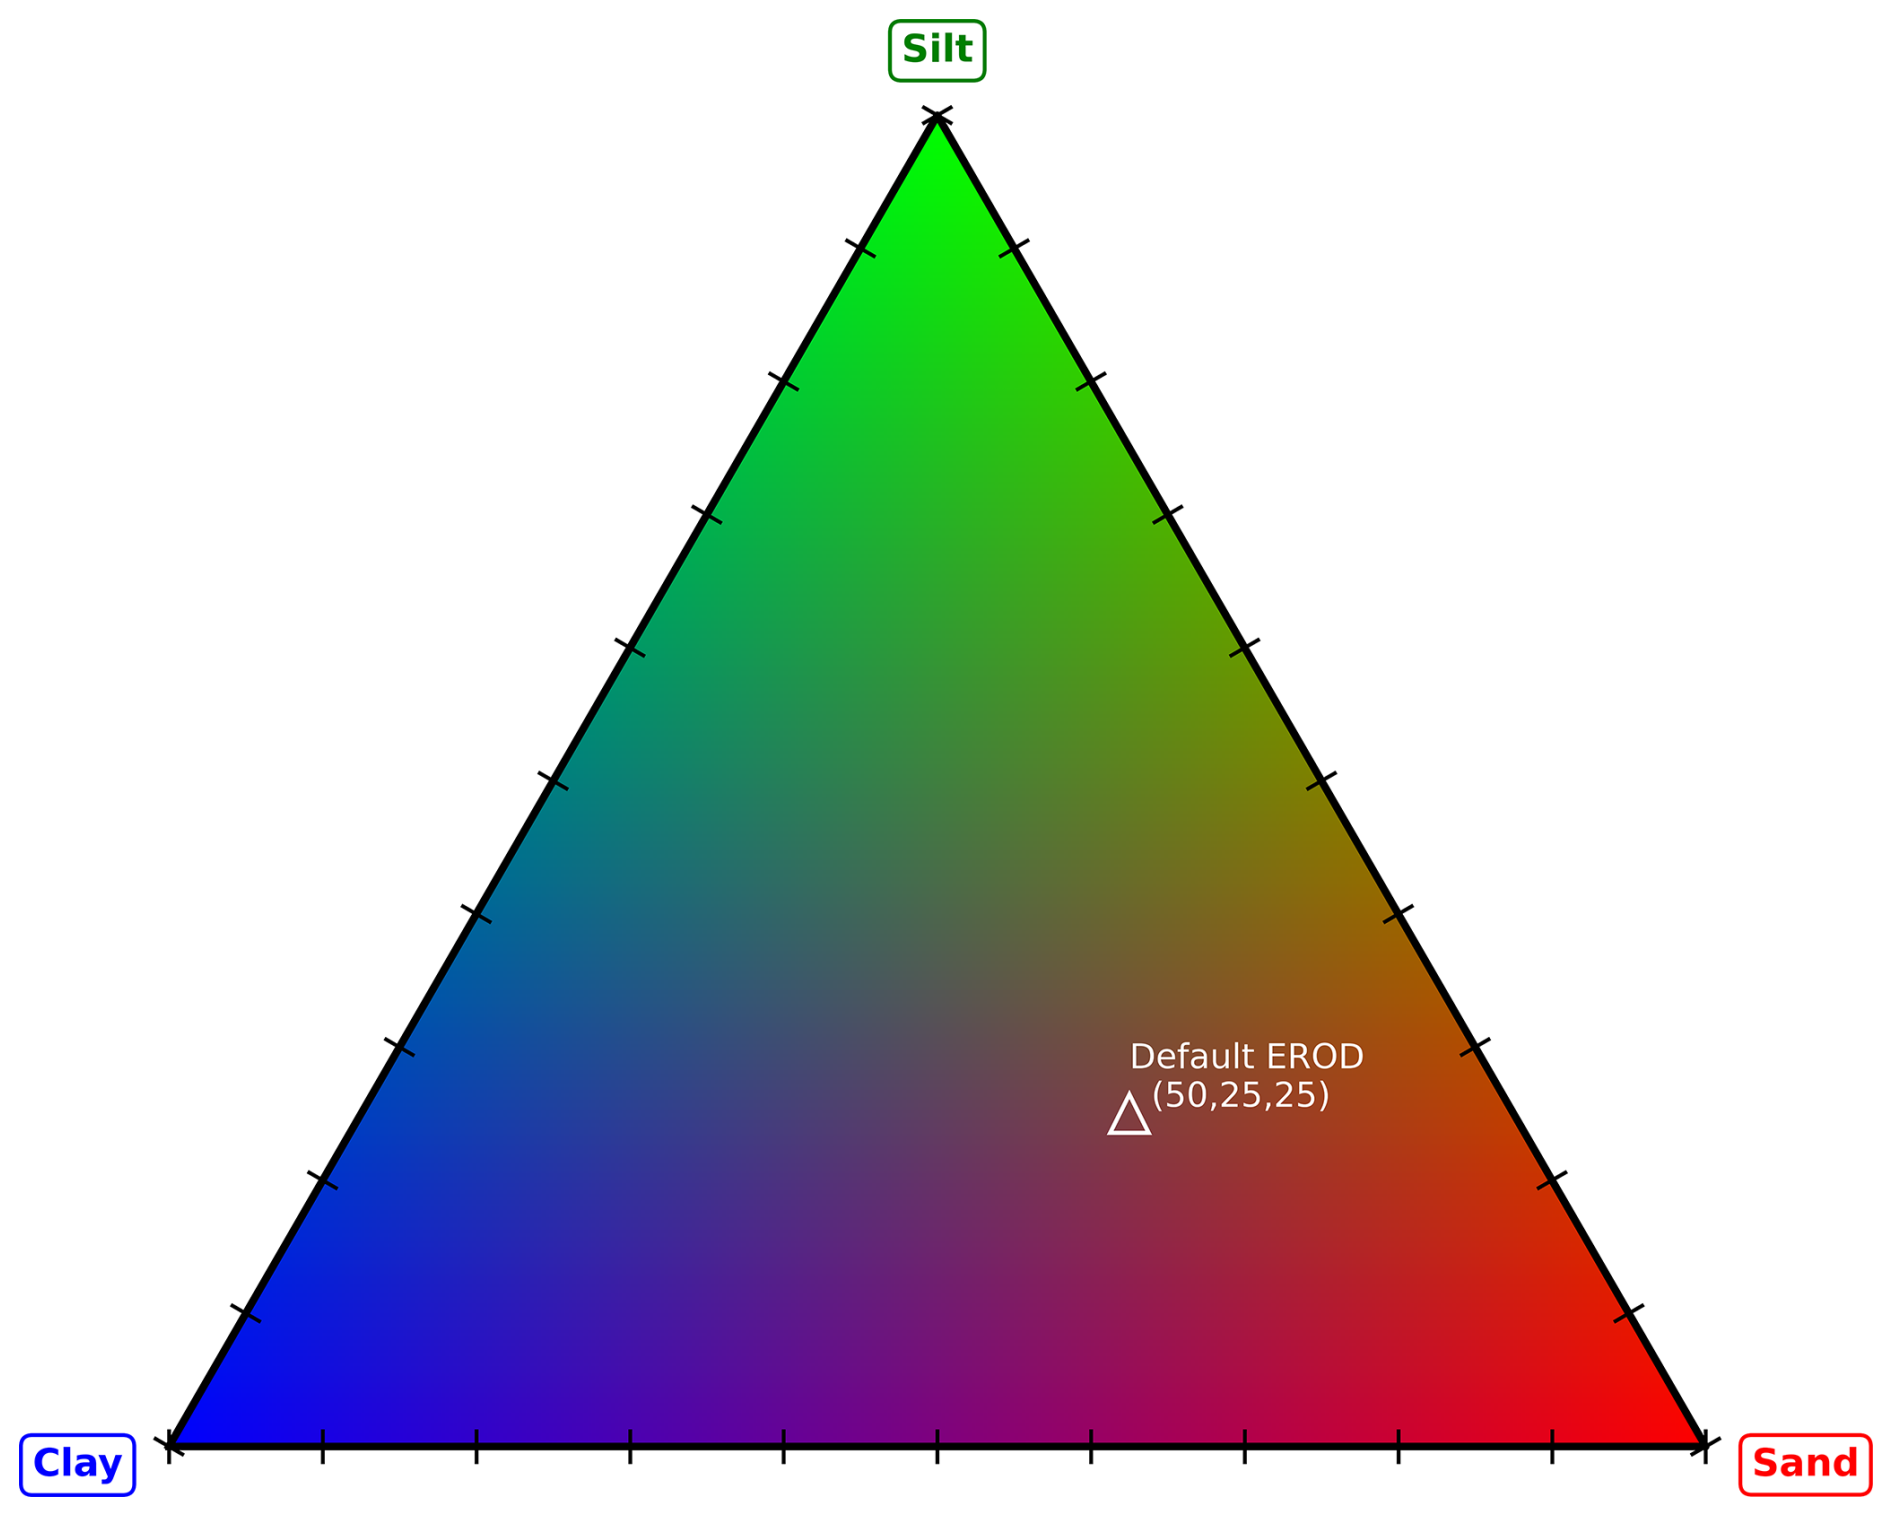
Figure A2Three-band RGB legend. The different colors correspond to a specific combination of sand (R), silt (G), and clay (B). A white triangle marks the color of the default soil composition for the GOCART scheme (50 % sand, 25 % silt, and 25 % clay).
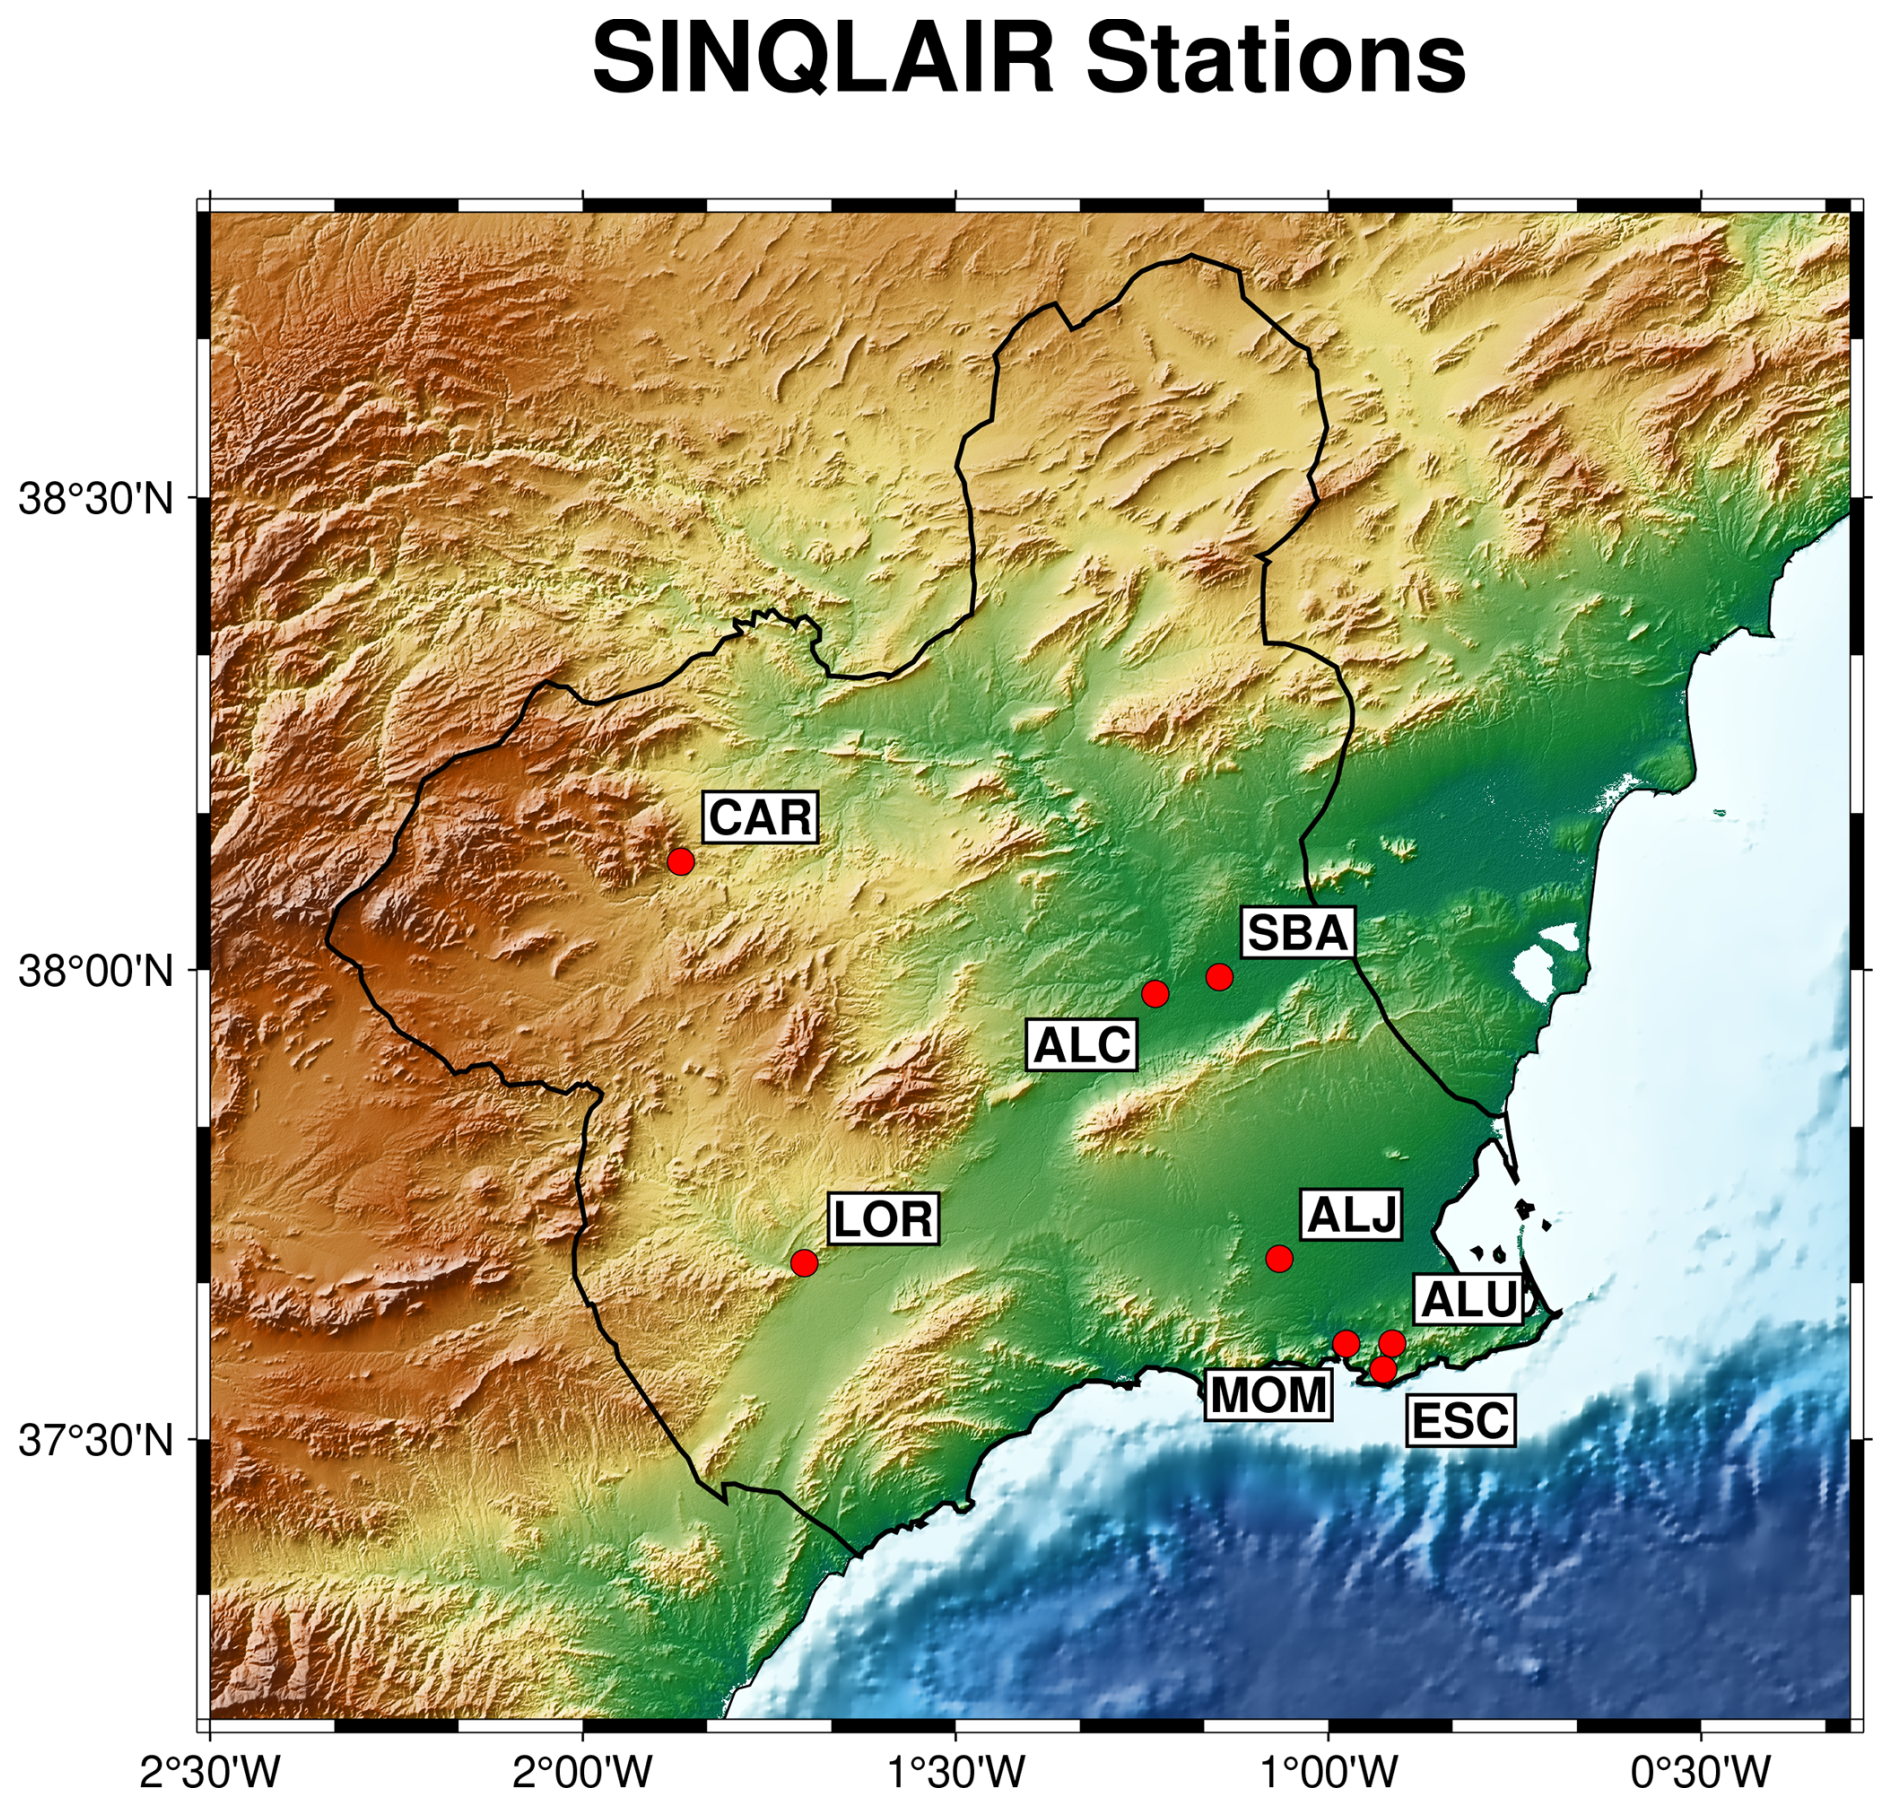
Figure B1Distribution of SINQLAIR stations network.
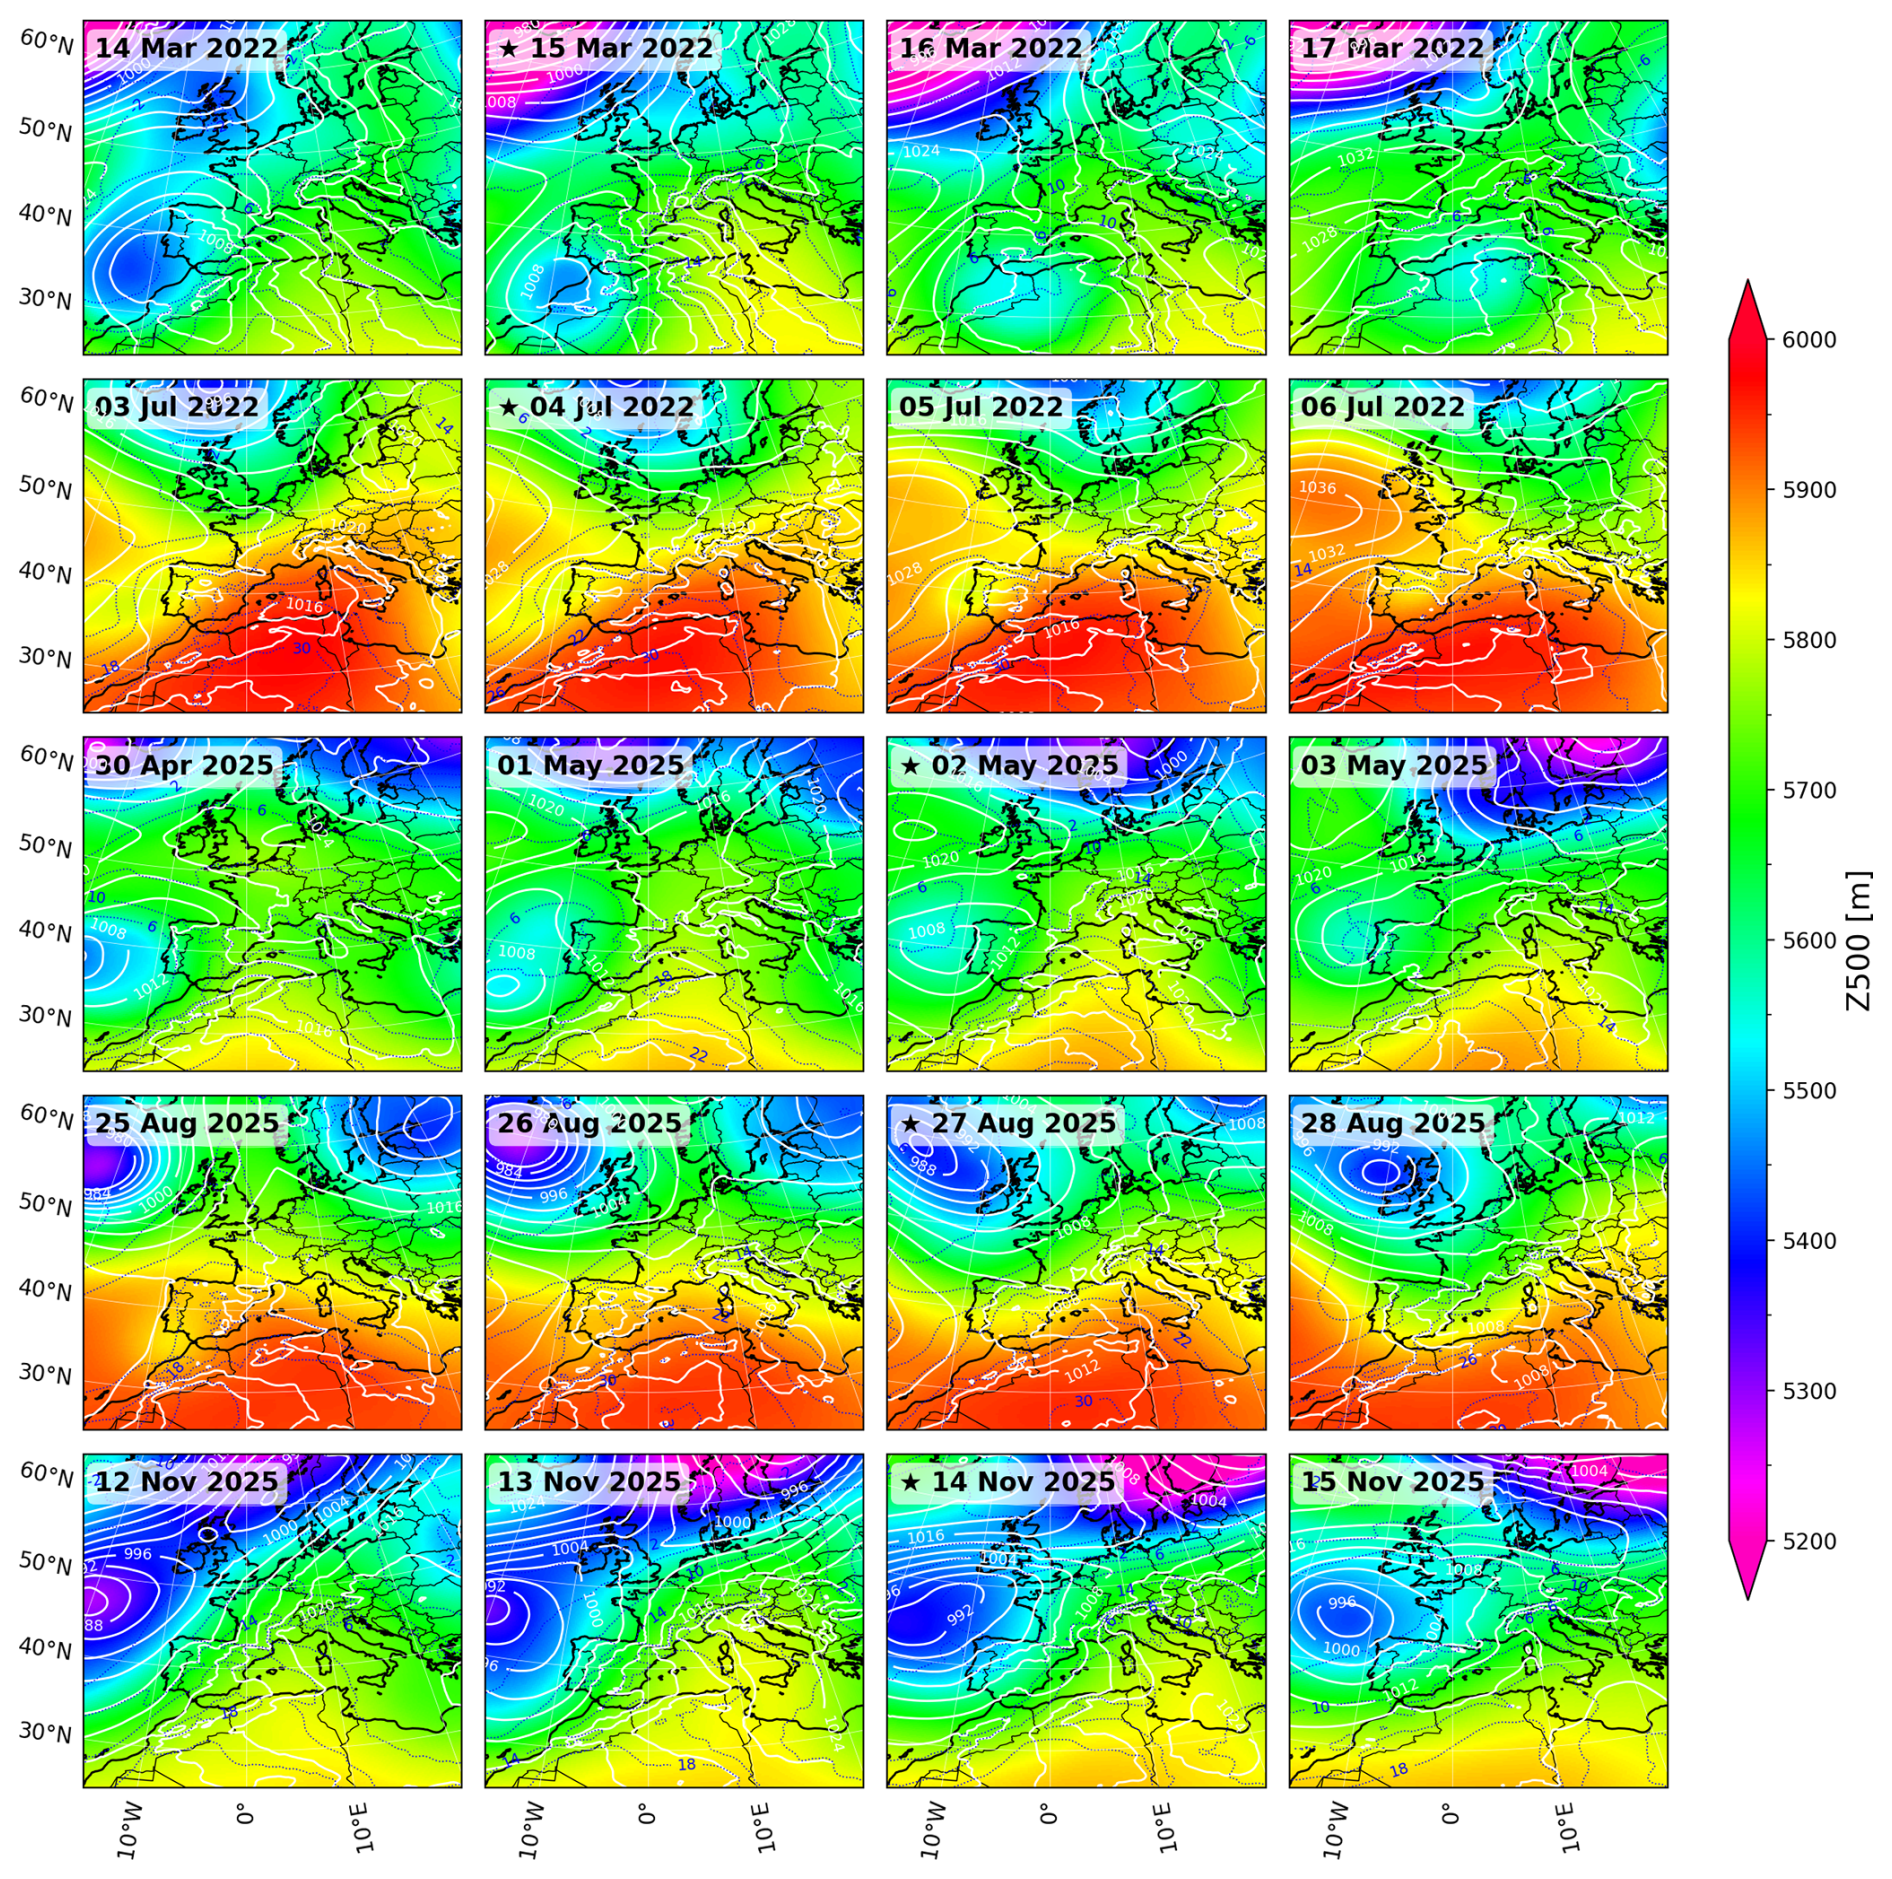
Figure C1Synoptic charts for all the simulated periods. For each period, the average PM10 peak and surrounding days (total 4 d) were represented. Shading refers to Z500; white solid lines represent SLP contours, and blue dashed lines correspond to T850 contours. For each simulation period, a black star marks the day with the highest PM10 concentration.
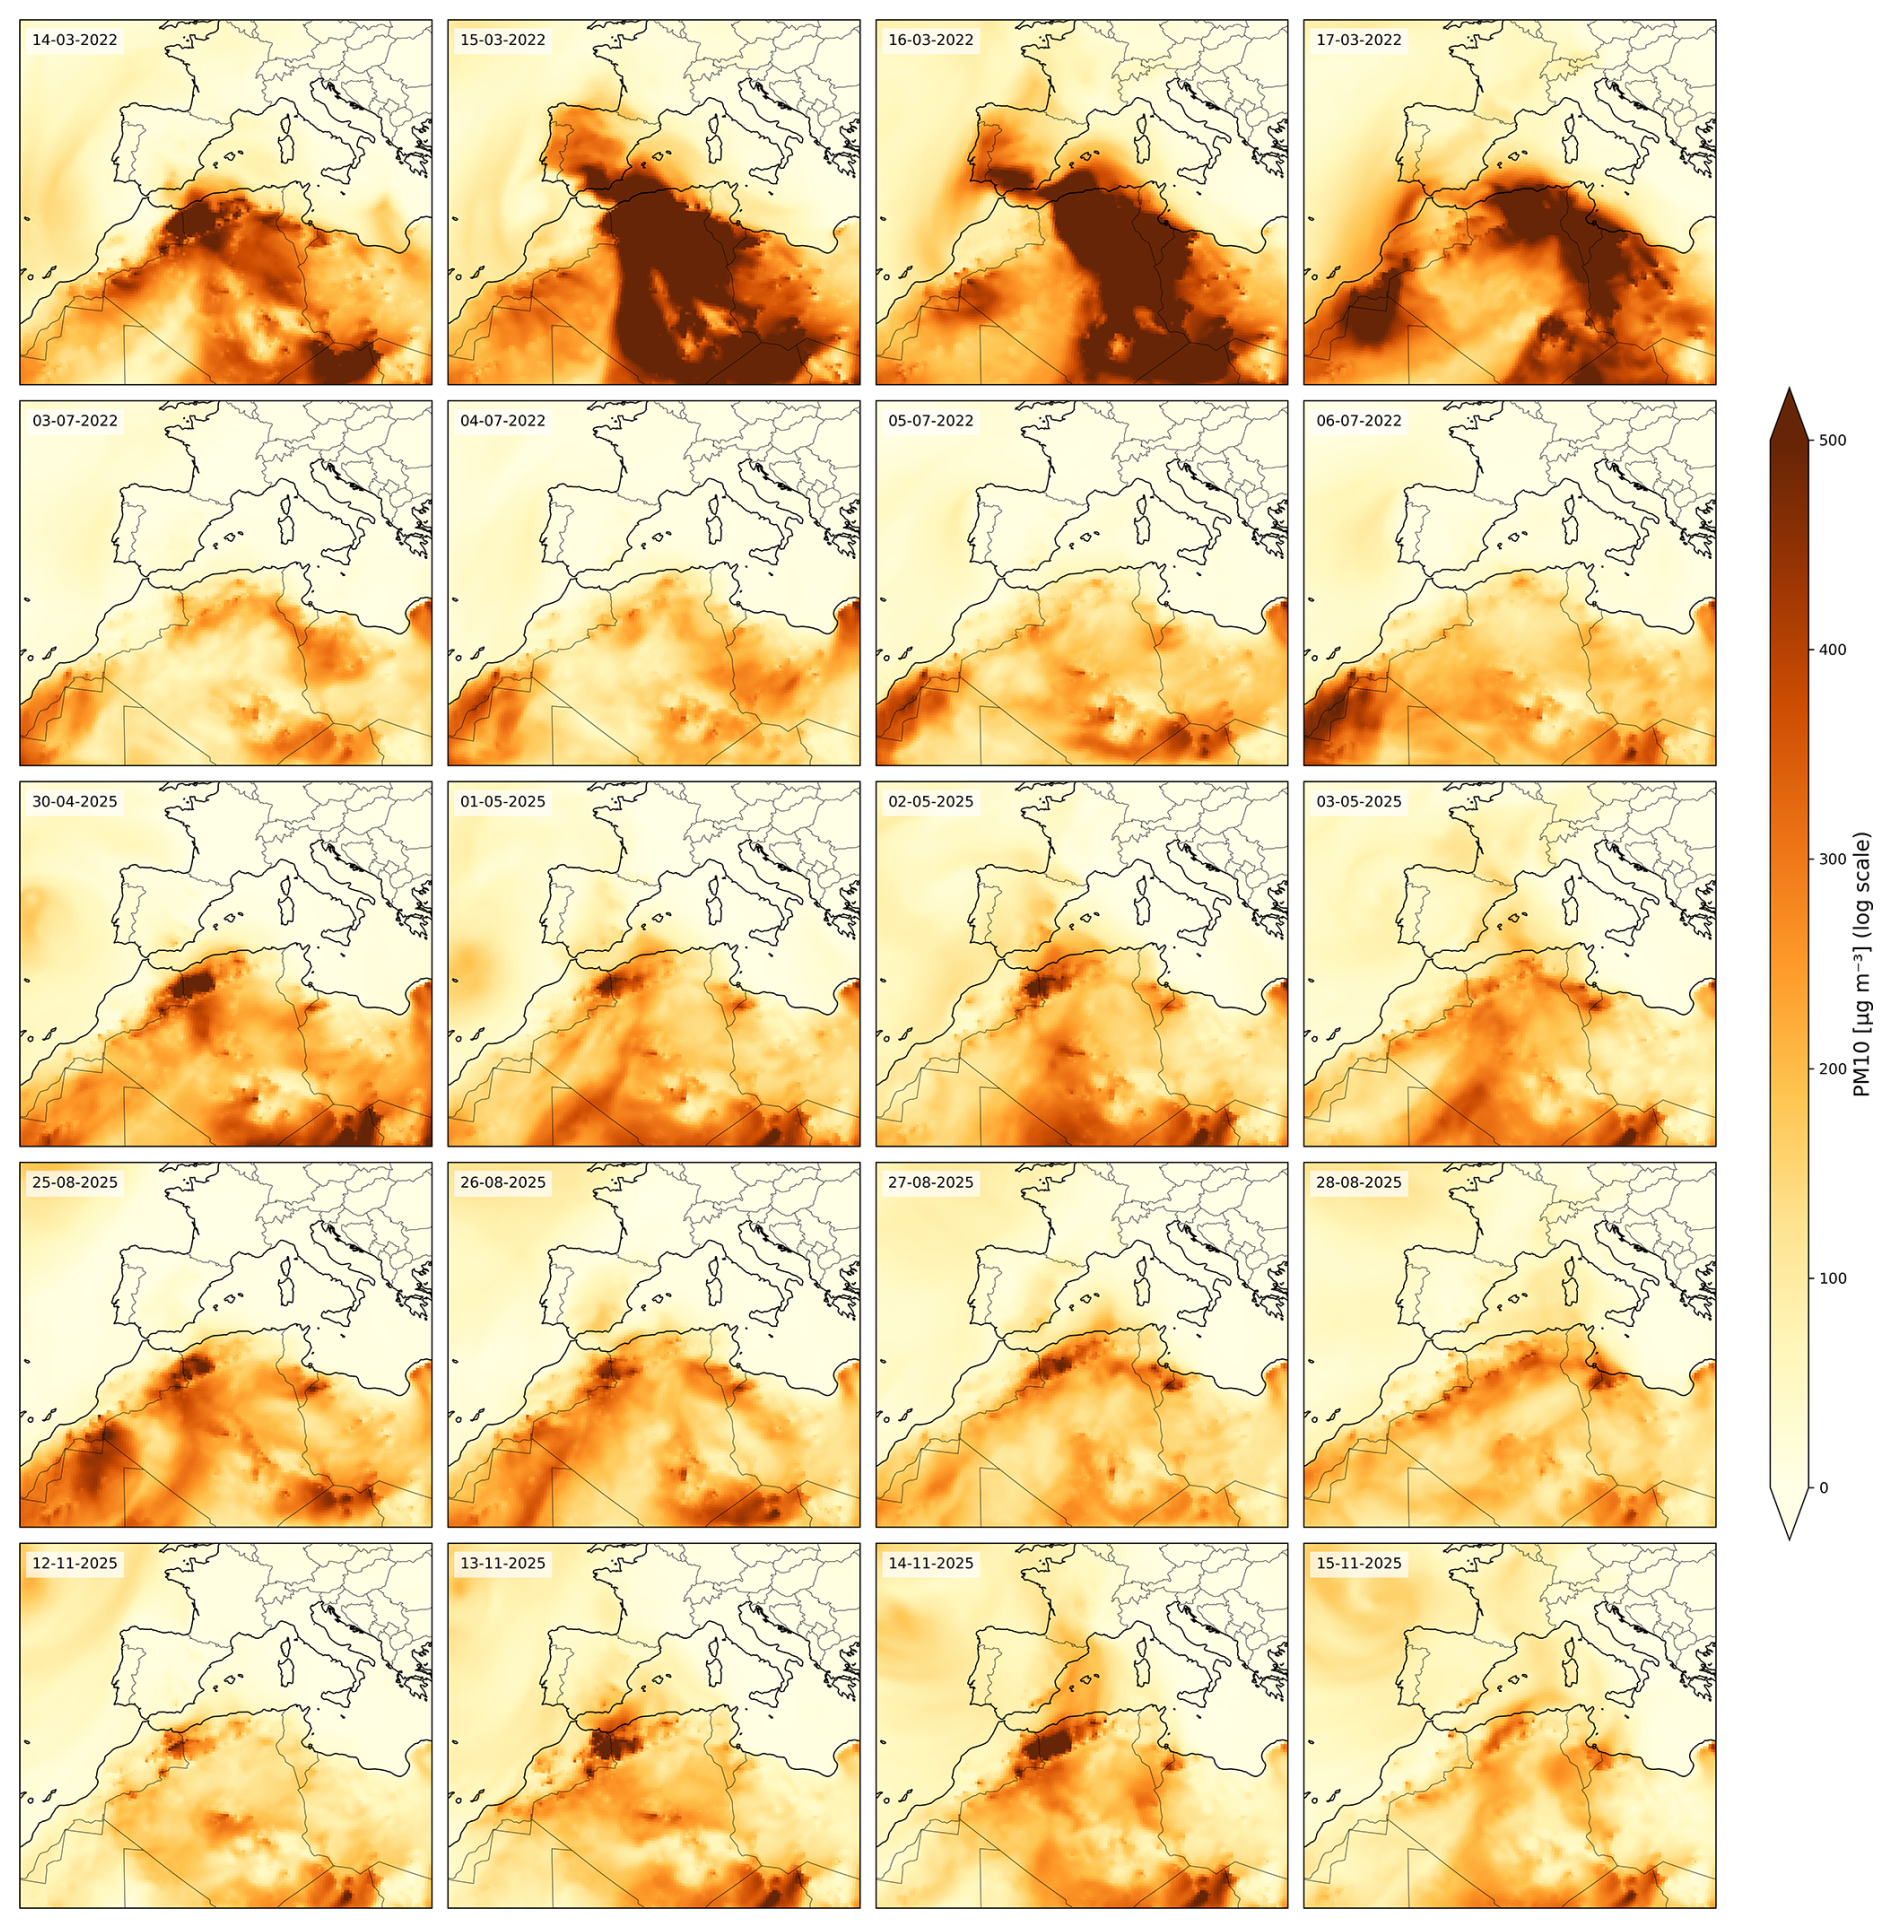
Figure C2Daily averaged PM10 maps for the same simulation days from Fig. C1. Units are µg m−3. Simulations use the SOILHD erodibility dataset.
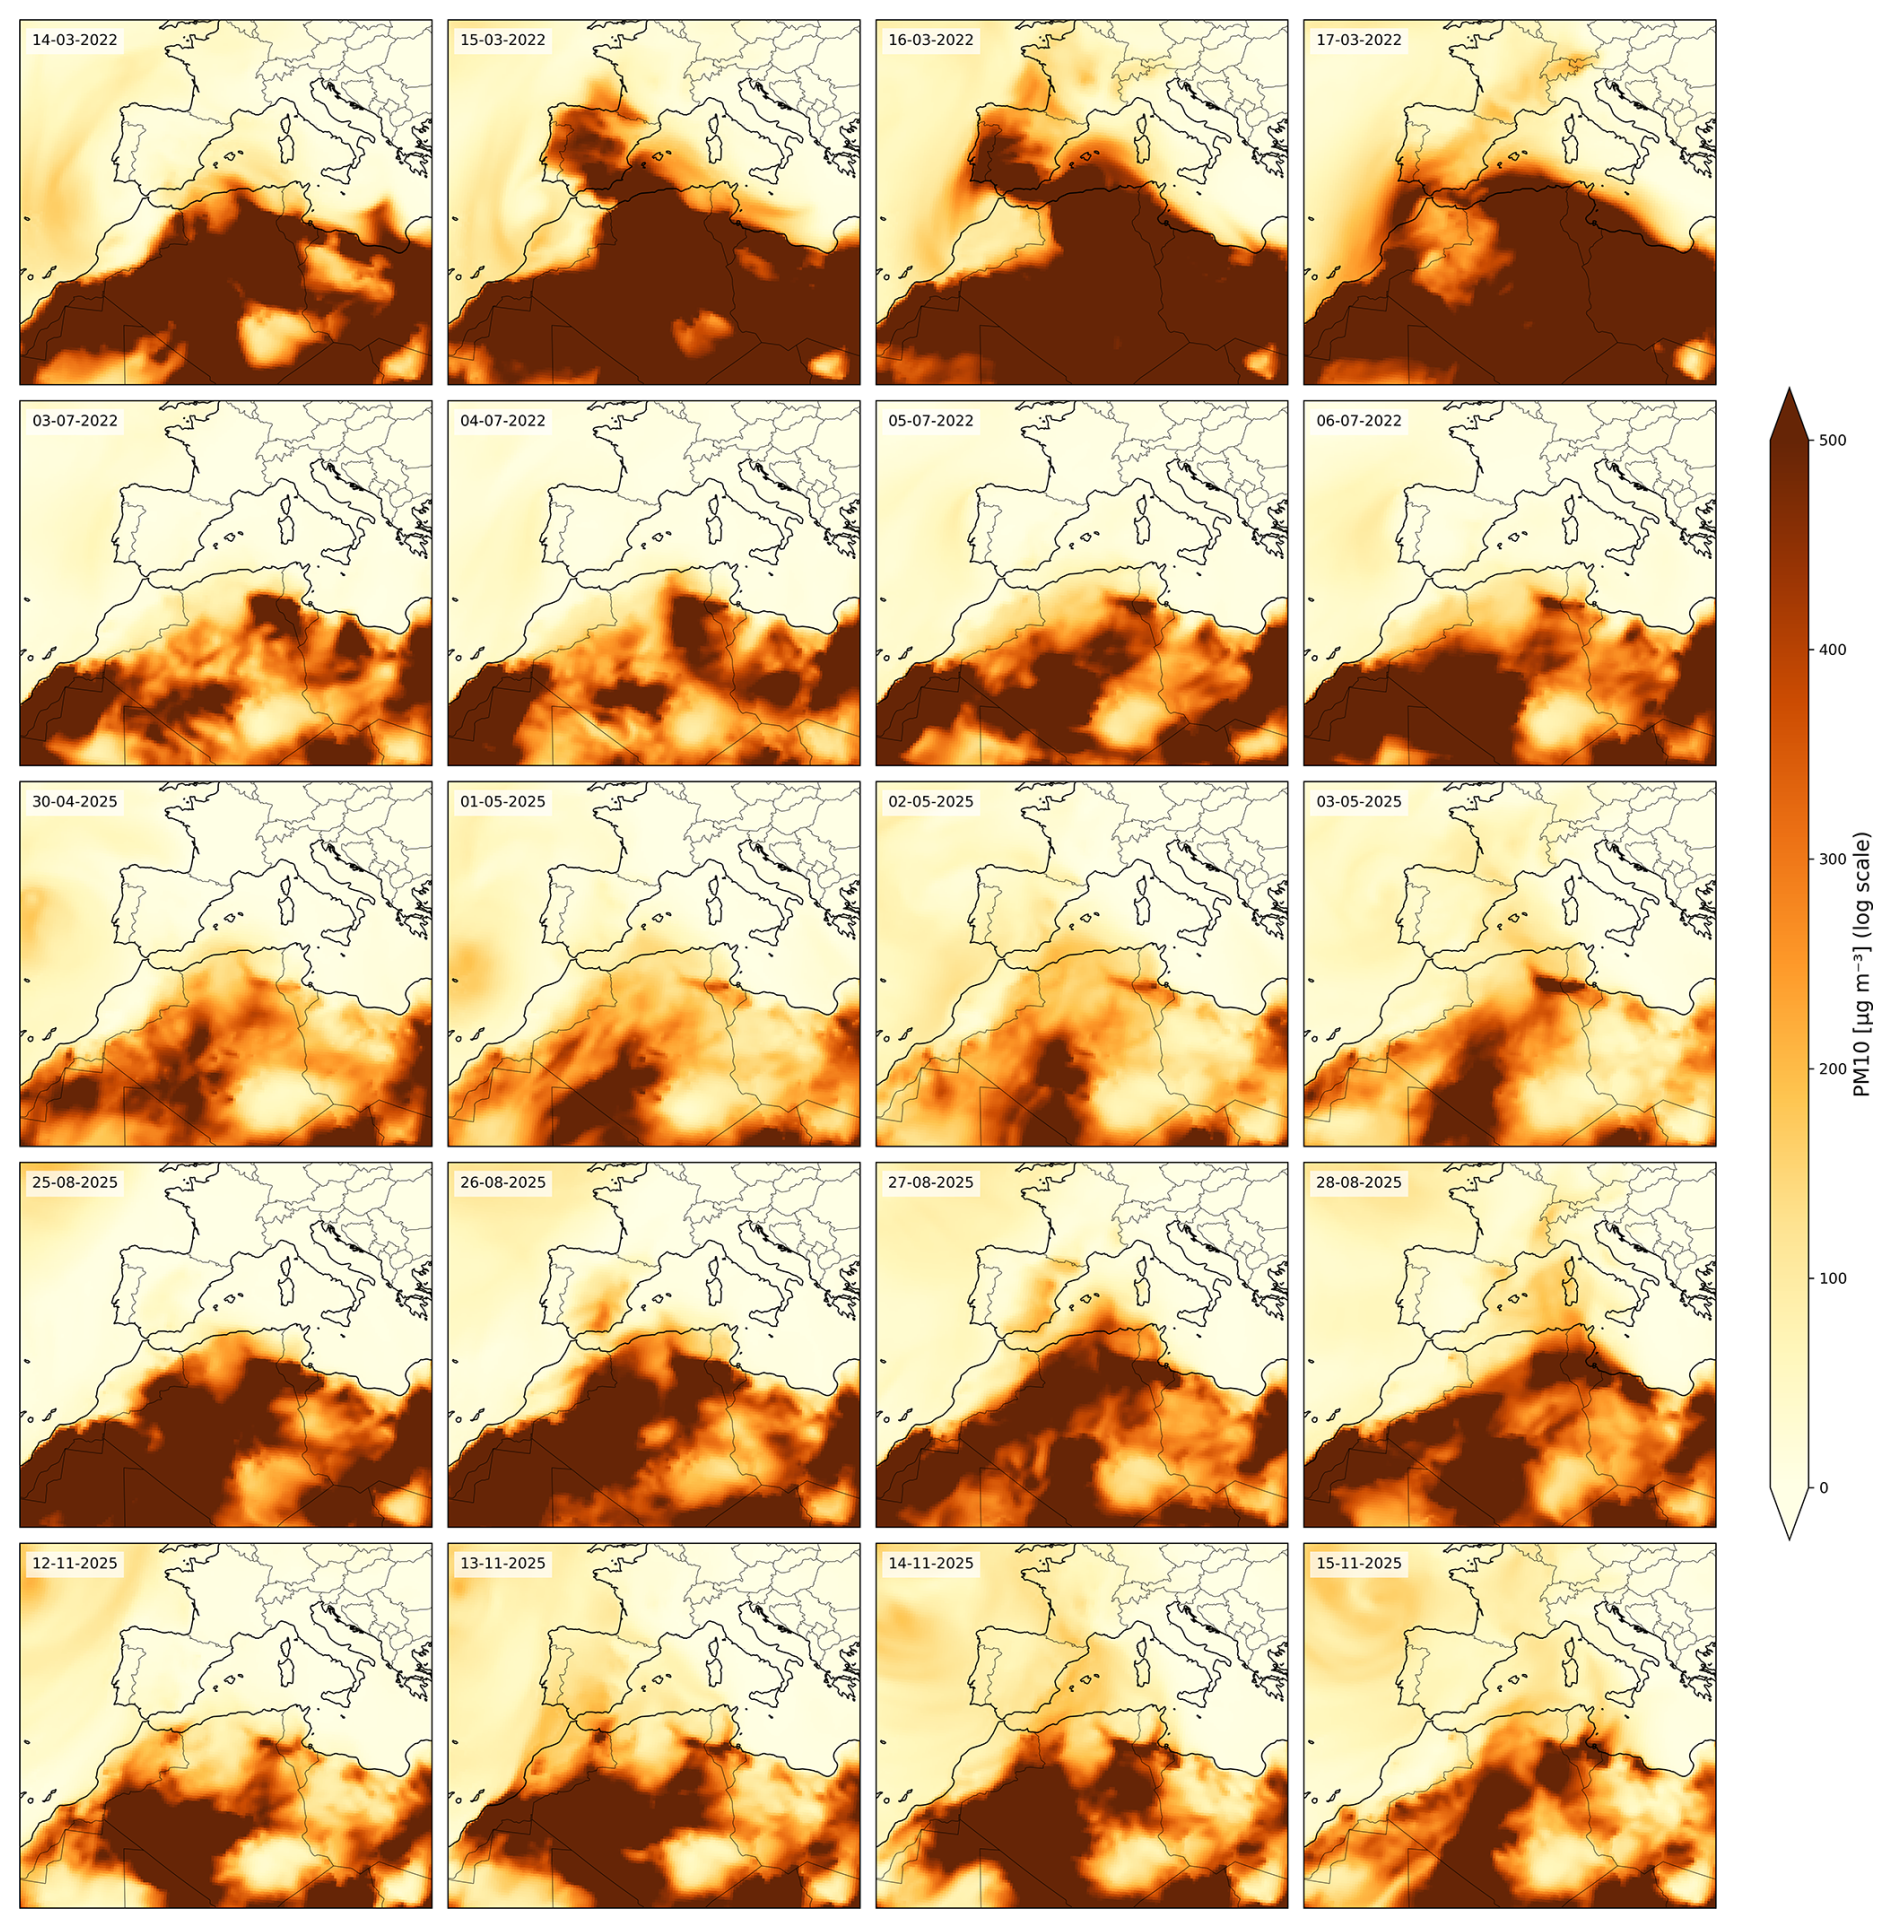
Figure C3As Fig. C2, but using the CTRL erodibility dataset.
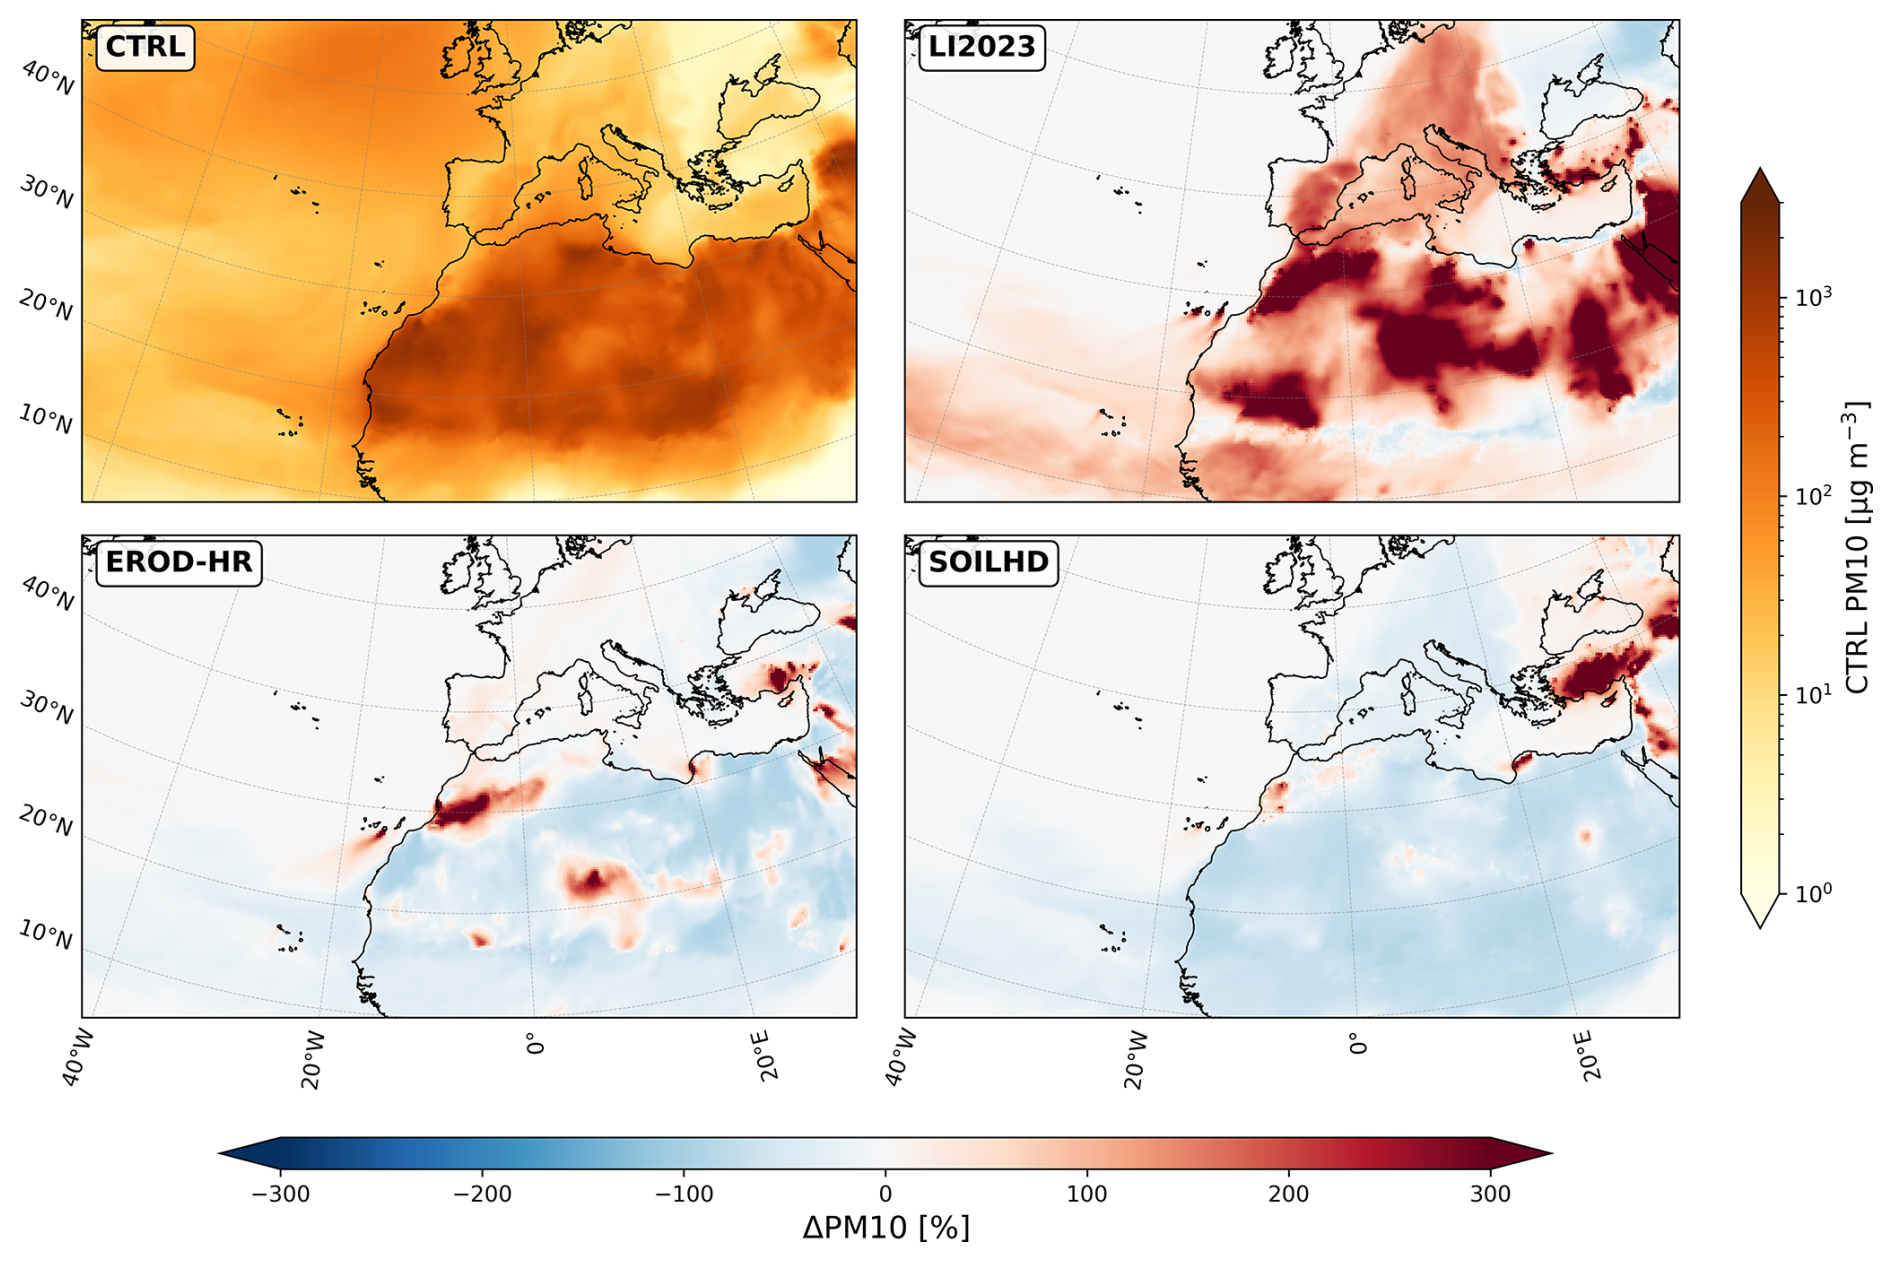
Figure D1Temporal PM10 average for the CTRL experiment during the 2025-08 period (top left) and its relative difference with the other experiments.
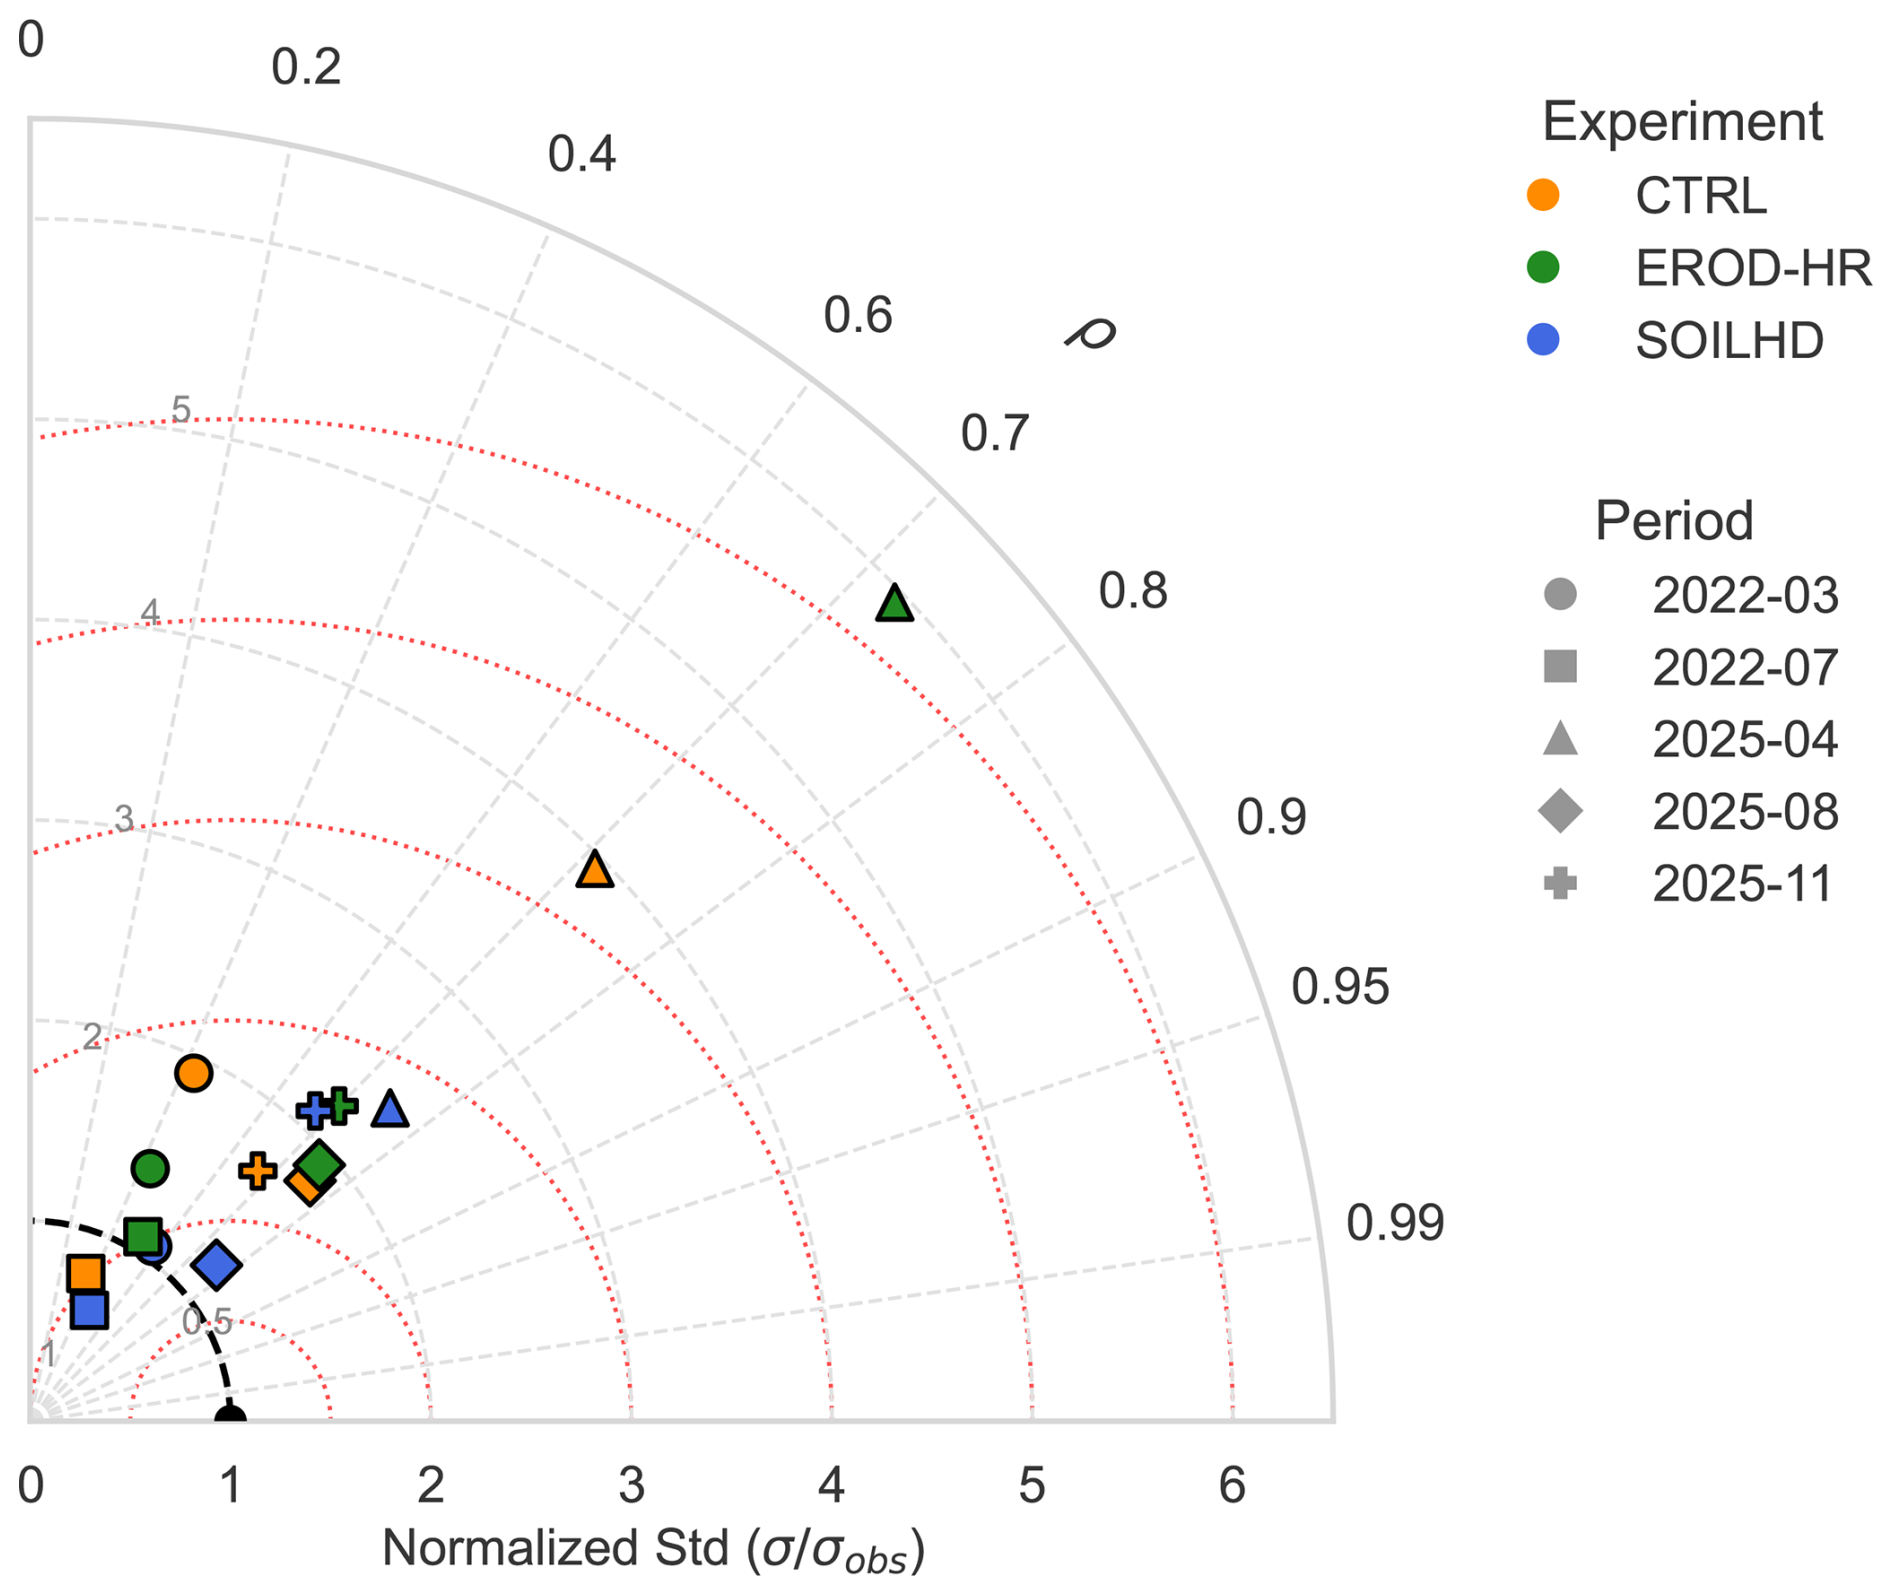
Figure E1Taylor diagram employing site-average metrics for all experiments and periods of simulation.
The datasets and software used and produced in this study are publicly available through Zenodo:
-
EROD-HR – A High Resolution Global Dust Erodibility Dataset (Segado-Moreno et al., 2026a), DOI: https://doi.org/10.5281/zenodo.18594482, version 1.0.0, provides global high-resolution information on soil erodibility for dust emission modeling.
-
SOILHD – Soil-Type Heterogeneous Erodibility Dataset (Segado-Moreno et al., 2026b), DOI: https://doi.org/10.5281/zenodo.18596292, version 1.0.0, offers a 1 km resolution representation of dust erodibility potential considering a heterogeneous soil type classification.
-
EROD Tuner (Segado-Moreno and Montavez, 2026), DOI: https://doi.org/10.5281/zenodo.18606994, version 1.0.0, is a preprocessing utility that enables flexible modification of the soil erodibility factor (EROD) in the WRF Preprocessing System (WPS).
Both datasets and the source code can be directly accessed and downloaded via the provided DOI links.
L. C. Segado-Moreno contributed to all stages of the study, including the initial conceptualization, data acquisition and processing, production and analysis of results, interpretation of findings, manuscript writing, and subsequent revisions. J. P. Montávez participated in the development of the research concept, contributed to the interpretation and discussion of the results, and was involved in the revision of the manuscript. G. Garnés-Morales, E. Raluy-López, and P. Jiménez-Guerrero contributed to the critical review and editing of the manuscript. All authors read and approved the final version of the paper.
At least one of the (co-)authors is a member of the editorial board of Atmospheric Chemistry and Physics. The peer-review process was guided by an independent editor, and the authors also have no other competing interests to declare.
Publisher's note: Copernicus Publications remains neutral with regard to jurisdictional claims made in the text, published maps, institutional affiliations, or any other geographical representation in this paper. The authors bear the ultimate responsibility for providing appropriate place names. Views expressed in the text are those of the authors and do not necessarily reflect the views of the publisher.
The authors acknowledge that artificial intelligence-based tools were used in the preparation of this manuscript to assist in the drafting and refinement of parts of the Abstract and Introduction. These tools were used solely for language improvement and text structuring purposes, and all scientific content, interpretations, and conclusions were developed, reviewed, and validated by the authors.
This research has been supported by the Ministerio de Ciencia e Innovación (grant nos. PRE2021-099236, PID2020-115693RB-I00, and PID2023-149080OB-I00), the Agencia Estatal de Investigación (grant nos. PID2020-115693RB-I00 and PID2023-149080OB-I00), and the Fundación Séneca (grant no. FSRM/10.13039/100007801). L. C. Segado-Moreno is supported by the predoctoral contract FPI (PRE2021-099236) from Ministerio de Ciencia e Innovación.
This paper was edited by Zhibo Zhang and reviewed by I. Pérez and one anonymous referee.
Beloconi, A. and Vounatsou, P.: Revised EU and WHO air quality thresholds: Where does Europe stand?, Atmos. Environ., 314, 120110, https://doi.org/10.1016/j.atmosenv.2023.120110, 2023. a
Chen, F. and Dudhia, J.: Coupling an advanced land surface–hydrology model with the Penn State–NCAR MM5 modeling system. Part I: Model implementation and sensitivity, Mon. Weather Rev., 129, 569–585, https://doi.org/10.1175/1520-0493(2001)129<0587:CAALSH>2.0.CO;2, 2001. a
Chin, M., Rood, R. B., Lin, S.-J., Müller, J.-F., and Thompson, A. M.: Atmospheric sulfur cycle simulated in the global model GOCART: Model description and global properties, J. Geophys. Res.-Atmos., 105, 24671–24687, https://doi.org/10.1029/2000JD900384, 2000. a, b, c, d, e, f, g
Chung, C. E.: Aerosol Direct Radiative Forcing: A Review, in: Atmospheric Aerosols – Regional Characteristics – Chemistry and Physics, edited by: Abdul-Razzak, H., chap. 14, IntechOpen, London, https://doi.org/10.5772/50248, 2012. a
Consejería de Medio Ambiente, Universidades, Investigación y Mar Menor. Dirección General de Medio Ambiente: Regional SINQLAIR Air Quality Network, https://sinqlair.carm.es/calidadaire/ (last access: 23 January 2026), 2018. a
Danielson, J. and Gesch, D.: Global multi-resolution terrain elevation data 2010 (GMTED2010), Tech. rep., U.S. Department of the Interior, https://doi.org/10.3133/ofr20111073, 2011. a, b
Darmenova, K., Sokolik, I. N., Shao, Y., Marticorena, B., and Bergametti, G.: Development of a physically based dust emission module within the Weather Research and Forecasting (WRF) model: Assessment of dust emission parameterizations and input parameters for source regions in Central and East Asia, J. Geophys. Res.-Atmos., 114, https://doi.org/10.1029/2008JD011236, 2009. a
DeFries, R., Townshend, J., and Hansen, M.: Continuous fields of vegetation characteristics at the global scale at 1-km resolution, J. Geophys. Res.-Atmos., 104, 16911–16923, https://doi.org/10.1029/1999JD900057, 1999. a
Demuzere, M., Kittner, J., Martilli, A., Mills, G., Moede, C., Stewart, I. D., van Vliet, J., and Bechtel, B.: A global map of local climate zones to support earth system modelling and urban-scale environmental science, Earth Syst. Sci. Data, 14, 3835–3873, https://doi.org/10.5194/essd-14-3835-2022, 2022. a, b
Demuzere, M., Kittner, J., Martilli, A., Mills, G., Moede, C., Stewart, I. D., van Vliet, J., and Bechtel, B.: Global map of Local Climate Zones, Zenodo, https://doi.org/10.5281/zenodo.8419340, 2023. a, b
Eltahan, M., Shokr, M., and Sherif, A. O.: Simulation of severe dust events over Egypt using tuned dust schemes in weather research forecast (WRF-Chem), Atmosphere, 9, 246, https://doi.org/10.3390/atmos9070246, 2018. a
Faber, E., Baker, B., Rocha Lima, A., and Schepanski, K.: Making a Dust Source Map: Can We Build, Implement, and Learn From a Reflectance Derived Sediment Supply Map in the Unified Forecast System (UFS)?, J. Geophys. Res.-Atmos., 131, e2025JD045333, https://doi.org/10.1029/2025JD045333, 2026. a
Friedl, M., McIver, D., Hodges, J., Zhang, X., Muchoney, D., Strahler, A., Woodcock, C., Gopal, S., Schneider, A., Cooper, A., Baccini, A., Gao, F., and Schaaf, C.: Global land cover mapping from MODIS: algorithms and early results, Remote Sens. Environ., 83, 287–302, https://doi.org/10.1016/S0034-4257(02)00078-0, 2002. a
Garnés-Morales, G., Montávez, J. P., Halifa-Marín, A., and Jiménez-Guerrero, P.: Role of aerosols on atmospheric circulation in regional climate Experiments over Europe, Atmosphere, 14, 491, https://doi.org/10.3390/atmos14030491, 2023. a
Garnés-Morales, G., Tortosa, J., Jiménez-Guerrero, P., Gil-Guirado, S., García-Fernández, E., and Montávez, J. P.: Assessing the effects of compound events of temperature and air pollution on weekly mortality in Spain using random forests, Weather and Climate Extremes, 100816, https://doi.org/10.1016/j.wace.2025.100816, 2025. a
Georgiou, G. K., Christoudias, T., Proestos, Y., Kushta, J., Pikridas, M., Sciare, J., Savvides, C., and Lelieveld, J.: Evaluation of WRF-Chem model (v3.9.1.1) real-time air quality forecasts over the Eastern Mediterranean, Geosci. Model Dev., 15, 4129–4146, https://doi.org/10.5194/gmd-15-4129-2022, 2022. a
Ginoux, P., Chin, M., Tegen, I., Prospero, J. M., Holben, B., Dubovik, O., and Lin, S.-J.: Sources and distributions of dust aerosols simulated with the GOCART model, J. Geophys. Res.-Atmos., 106, 20255–20273, https://doi.org/10.1029/2000JD000053, 2001. a
Grell, G. A.: Prognostic evaluation of assumptions used by cumulus parameterizations, Mon. Weather Rev., 121, 764–787, https://doi.org/10.1175/1520-0493(1993)121<0764:PEOAUB>2.0.CO;2, 1993. a
Grell, G. A. and Dévényi, D.: A generalized approach to parameterizing convection combining ensemble and data assimilation techniques, Geophys. Res. Lett., 29, 38-1–38-4, https://doi.org/10.1029/2002GL015311, 2002. a
Grell, G. A., Peckham, S. E., Schmitz, R., McKeen, S. A., Frost, G., Skamarock, W. C., and Eder, B.: Fully coupled “online” chemistry within the WRF model, Atmos. Environ., 39, 6957–6975, https://doi.org/10.1016/j.atmosenv.2005.04.027, 2005. a, b
Hengl, T., Mendes de Jesus, J., Heuvelink, G. B., Ruiperez Gonzalez, M., Kilibarda, M., Blagotić, A., Shangguan, W., Wright, M. N., Geng, X., Bauer-Marschallinger, B., Guevara, M. A., Vargas, R., MacMillan, R. A., Batjes, N. H., Leenaars, J. G., Ribeiro, E., Wheeler, I., Mantel, S., and Kempen, B.: SoilGrids250m: Global gridded soil information based on machine learning, PLoS one, 12, e0169748, https://doi.org/10.1371/journal.pone.0169748, 2017. a, b
Hersbach, H., Bell, B., Berrisford, P., Biavati, G., Horányi, A., Muñoz Sabater, J., Nicolas, J., Peubey, C., Radu, R., Rozum, I., Schepers, D., Simmons, A., Soci, C., Dee, D., and Thépaut, J.-N.: ERA5 hourly data on pressure levels from 1940 to present, Copernicus Climate Change Service (C3S) Climate Data Store (CDS), https://doi.org/10.24381/cds.bd0915c6, 2018. a
Hong, S.-Y., Noh, Y., and Dudhia, J.: A new vertical diffusion package with an explicit treatment of entrainment processes, Mon. Weather Rev., 134, 2318–2341, https://doi.org/10.1175/MWR3199.1, 2006. a
Iacono, M. J., Delamere, J. S., Mlawer, E. J., Shephard, M. W., Clough, S. A., and Collins, W. D.: Radiative forcing by long-lived greenhouse gases: Calculations with the AER radiative transfer models, J. Geophys. Res.-Atmos., 113, https://doi.org/10.1029/2008JD009944, 2008. a, b
Jerez, S., Palacios-Peña, L., Gutiérrez, C., Jiménez-Guerrero, P., López-Romero, J. M., Pravia-Sarabia, E., and Montávez, J. P.: Sensitivity of surface solar radiation to aerosol–radiation and aerosol–cloud interactions over Europe in WRFv3.6.1 climatic runs with fully interactive aerosols, Geosci. Model Dev., 14, 1533–1551, https://doi.org/10.5194/gmd-14-1533-2021, 2021. a
Jiménez, P. A., Dudhia, J., González-Rouco, J. F., Navarro, J., Montávez, J. P., and García-Bustamante, E.: A revised scheme for the WRF surface layer formulation, Mon. Weather Rev., 140, 898–918, https://doi.org/10.1175/MWR-D-11-00056.1, 2012. a
Jin, J., Segers, A., Liao, H., Heemink, A., Kranenburg, R., and Lin, H. X.: Source backtracking for dust storm emission inversion using an adjoint method: case study of Northeast China, Atmos. Chem. Phys., 20, 15207–15225, https://doi.org/10.5194/acp-20-15207-2020, 2020. a
Johnson, B., Shine, K., and Forster, P.: The semi-direct aerosol effect: Impact of absorbing aerosols on marine stratocumulus, Q. J. Roy. Meteor. Soc., 130, 1407–1422, https://doi.org/10.1256/qj.03.61, 2004. a
Knippertz, P. and Todd, M.: Mineral dust aerosols over the Sahara: Meteorological controls on emission and transport and implications for modeling, Rev. Geophys., 50, https://doi.org/10.1029/2011rg000362, 2012. a
Kok, J. F., Ward, D. S., Mahowald, N. M., and Evan, A. T.: Global and regional importance of the direct dust-climate feedback, Nat. Commun., 9, 241, https://doi.org/10.1038/s41467-017-02620-y, 2018. a
Kok, J. F., Adebiyi, A. A., Albani, S., Balkanski, Y., Checa-Garcia, R., Chin, M., Colarco, P. R., Hamilton, D. S., Huang, Y., Ito, A., Klose, M., Leung, D. M., Li, L., Mahowald, N. M., Miller, R. L., Obiso, V., Pérez García-Pando, C., Rocha-Lima, A., Wan, J. S., and Whicker, C. A.: Improved representation of the global dust cycle using observational constraints on dust properties and abundance, Atmos. Chem. Phys., 21, 8127–8167, https://doi.org/10.5194/acp-21-8127-2021, 2021. a
Lee, J. A., Jiménez, P. A., Kumar, R., and He, C.: Impact of direct insertion of SMAP soil moisture retrievals in WRF-Chem for dust storm events in the western US, Atmos. Environ., 321, 120349, https://doi.org/10.1016/j.atmosenv.2024.120349, 2024. a
Lee, J.-H., Lee, S.-H., and Cho, J. H.: A novel method for detecting natural dust source regions using satellite and ground-based measurements, Atmos. Environ., 344, 121024, https://doi.org/10.1016/j.atmosenv.2024.121024, 2025. a
LeGrand, S. L., Polashenski, C., Letcher, T. W., Creighton, G. A., Peckham, S. E., and Cetola, J. D.: The AFWA dust emission scheme for the GOCART aerosol model in WRF-Chem v3.8.1, Geosci. Model Dev., 12, 131–166, https://doi.org/10.5194/gmd-12-131-2019, 2019. a, b, c, d, e
Li, H. and Wang, C.: Impact of dust radiation effect on simulations of temperature and wind–A case study in Taklimakan Desert, Atmos. Res., 273, 106163, https://doi.org/10.1016/j.atmosres.2022.106163, 2022. a
Li, H., Wang, C., Wang, M., Liu, Z., Mamtimin, A., and Pan, X.: A new dataset of erodibility in dust source for WRF-Chem model based on remote sensing and soil texture-Application and Validation, Atmos. Environ., 315, 120156, https://doi.org/10.1016/j.atmosenv.2023.120156, 2023. a, b, c, d, e, f
López-Cayuela, M.-Á., Córdoba-Jabonero, C., Sicard, M., Abril-Gago, J., Salgueiro, V., Comerón, A., Granados-Muñoz, M. J., Costa, M. J., Muñoz-Porcar, C., Bravo-Aranda, J. A., Bortoli, D., Rodríguez-Gómez, A., Alados-Arboledas, L., and Guerrero-Rascado, J. L.: Fine and coarse dust radiative impact during an intense Saharan dust outbreak over the Iberian Peninsula – short-wave direct radiative effect, Atmos. Chem. Phys., 25, 3213–3231, https://doi.org/10.5194/acp-25-3213-2025, 2025. a
Mahowald, N. M., Ballantine, J. A., Feddema, J., and Ramankutty, N.: Global trends in visibility: implications for dust sources, Atmos. Chem. Phys., 7, 3309–3339, https://doi.org/10.5194/acp-7-3309-2007, 2007. a
Masson-Delmotte, V., Zhai, P., Pirani, A., Connors, S. L., Péan, C., Berger, S., Caud, N., Chen, Y., Goldfarb, L., Gomis, M., et al.: Climate change 2021: the physical science basis, Contribution of working group I to the sixth assessment report of the intergovernmental panel on climate change, 2, 2391, https://doi.org/10.1017/9781009157896, 2021. a
Morrison, H., Curry, J., and Khvorostyanov, V.: A new double-moment microphysics parameterization for application in cloud and climate models. Part I: Description, J. Atmos. Sci., 62, 1665–1677, https://doi.org/10.1175/JAS3446.1, 2005. a
Palacios-Peña, L., Lorente-Plazas, R., Montávez, J. P., and Jiménez-Guerrero, P.: Saharan dust modeling over the Mediterranean basin and Central Europe: does the resolution matter?, Front. Earth Sci., 7, 290, https://doi.org/10.3389/feart.2019.00290, 2019. a
Palacios-Peña, L., Fast, J. D., Pravia-Sarabia, E., and Jiménez-Guerrero, P.: Sensitivity of aerosol optical properties to the aerosol size distribution over central Europe and the Mediterranean Basin using the WRF-Chem v.3.9.1.1 coupled model, Geosci. Model Dev., 13, 5897–5915, https://doi.org/10.5194/gmd-13-5897-2020, 2020. a
Parajuli, S. P., Stenchikov, G. L., Ukhov, A., and Kim, H.: Dust emission modeling using a new high-resolution dust source function in WRF-Chem with implications for air quality, J. Geophys. Res.-Atmos., 124, 10109–10133, https://doi.org/10.1029/2019JD030248, 2019. a
Pey, J., Querol, X., Alastuey, A., Forastiere, F., and Stafoggia, M.: African dust outbreaks over the Mediterranean Basin during 2001–2011: PM10 concentrations, phenomenology and trends, and its relation with synoptic and mesoscale meteorology, Atmos. Chem. Phys., 13, 1395–1410, https://doi.org/10.5194/acp-13-1395-2013, 2013. a
Pino-Carmona, M., Ruiz-Arias, J. A., Fernández-Carvelo, S., Bravo-Aranda, J. A., and Alados-Arboledas, L.: Intercomparison of WRF-chem aerosol schemes during a dry Saharan dust outbreak in Southern Iberian Peninsula, Atmos. Environ., 339, 120872, https://doi.org/10.1016/j.atmosenv.2024.120872, 2024. a
Poggio, L., de Sousa, L. M., Batjes, N. H., Heuvelink, G. B. M., Kempen, B., Ribeiro, E., and Rossiter, D.: SoilGrids 2.0: producing soil information for the globe with quantified spatial uncertainty, SOIL, 7, 217–240, https://doi.org/10.5194/soil-7-217-2021, 2021. a, b
Querol, X., Pey, J., Pandolfi, M., Alastuey, A., Cusack, M., Pérez, N., Moreno, T., Viana, M., Mihalopoulos, N., Kallos, G., and Kleanthous, S.: African dust contributions to mean ambient PM10 mass-levels across the Mediterranean Basin, Atmos. Environ., 43, 4266–4277, https://doi.org/10.1016/j.atmosenv.2009.06.013, 2009. a
Rahmati, O., Mohammadi, F., Ghiasi, S. S., Tiefenbacher, J., Moghaddam, D. D., Coulon, F., Nalivan, O. A., and Bui, D. T.: Identifying sources of dust aerosol using a new framework based on remote sensing and modelling, Sci. Total Environ., 737, 139508, https://doi.org/10.1016/j.scitotenv.2020.139508, 2020. a
Ratcliffe, N. G., Ryder, C. L., Bellouin, N., Woodward, S., Jones, A., Johnson, B., Wieland, L.-M., Dollner, M., Gasteiger, J., and Weinzierl, B.: Long-range transport of coarse mineral dust: an evaluation of the Met Office Unified Model against aircraft observations, Atmos. Chem. Phys., 24, 12161–12181, https://doi.org/10.5194/acp-24-12161-2024, 2024. a
Rizza, U., Barnaba, F., Miglietta, M. M., Mangia, C., Di Liberto, L., Dionisi, D., Costabile, F., Grasso, F., and Gobbi, G. P.: WRF-Chem model simulations of a dust outbreak over the central Mediterranean and comparison with multi-sensor desert dust observations, Atmos. Chem. Phys., 17, 93–115, https://doi.org/10.5194/acp-17-93-2017, 2017. a
Salvador, P., Pey, J., Pérez, N., Querol, X., and Artíñano, B.: Increasing atmospheric dust transport towards the western Mediterranean over 1948–2020, npj Climate and Atmospheric Science, 5, 34, https://doi.org/10.1038/s41612-022-00256-4, 2022. a
Schraufnagel, D. E.: The health effects of ultrafine particles, Exp. Mol. Med., 52, 311–317, https://doi.org/10.1038/s12276-020-0403-3, 2020. a
Segado-Moreno, L. C. and Montavez, J. P.: EROD Tuner, Zenodo [code], https://doi.org/10.5281/zenodo.18606994, 2026. a, b, c
Segado-Moreno, L. C., Montavez, J. P., Raluy-López, E., Garnés-Morales, G., and Jiménez-Guerrero, P.: EROD-HR – A High Resolution Global Dust Erodibility Dataset, Zenodo [data set], https://doi.org/10.5281/zenodo.18594482, 2026a. a, b
Segado-Moreno, L. C., Montavez, J. P., Raluy-López, E., Garnés-Morales, G., and Jiménez-Guerrero, P.: SOILHD – Soil-Type Heterogeneous Erodibility Dataset , Zenodo [data set], https://doi.org/10.5281/zenodo.18596292, 2026b. a, b
Spyrou, C., Solomos, S., Bartsotas, N. S., Douvis, K. C., and Nickovic, S.: Development of a Dust Source Map for WRF-Chem Model Based on MODIS NDVI, Atmosphere, 13, https://doi.org/10.3390/atmos13060868, 2022. a, b, c
Stewart, I. D. and Oke, T. R.: Local climate zones for urban temperature studies, B. Am. Meteor. Soc., 93, 1879–1900, https://doi.org/10.1175/BAMS-D-11-00019.1, 2012. a
Tan, C., Liu, C., Li, T., Luan, Z., Tang, M., and Zhao, T.: A Dynamically Updated Dust Source Function for Dust Emission Scheme: Improving Dust Aerosol Simulation on an East Asian Dust Storm, Atmosphere, https://doi.org/10.3390/atmos16040357, 2025. a
Tarín-Carrasco, P., Im, U., Geels, C., Palacios-Peña, L., and Jiménez-Guerrero, P.: Contribution of fine particulate matter to present and future premature mortality over Europe: A non-linear response, Environ. Int., 153, 106517, https://doi.org/10.1016/j.envint.2021.106517, 2021. a
Tegen, I. and Schepanski, K.: The global distribution of mineral dust, in: IOP Conference Series: Earth and Environmental Science, IOP Publishing, 7, 012001, https://doi.org/10.1088/1755-1307/7/1/012001, 2009. a
Tong, D. Q., Gill, T. E., Sprigg, W. A., Van Pelt, R. S., Baklanov, A. A., Barker, B. M., Bell, J. E., Castillo, J., Gassó, S., Gaston, C. J., Griffin, D. W., Huneeus, N., Kahn, R. A., Kuciauskas, A. P., Ladino, L. A., Li, J., Mayol-Bracero, O. L., McCotter, O. Z., Méndez-Lázaro, P. A., Mudu, P., Nickovic, S., Oyarzun, D., Prospero, J., Raga, G. B., Raysoni, A. U., Ren, L., Sarafoglou, N., Sealy, A., Sun, Z., and Vimic, A. V.: Health and safety effects of airborne soil dust in the Americas and beyond, Rev. Geophys., 61, https://doi.org/10.1029/2021RG000763, 2023. a
Ukhov, A., Ahmadov, R., Grell, G., and Stenchikov, G.: Improving dust simulations in WRF-Chem v4.1.3 coupled with the GOCART aerosol module, Geosci. Model Dev., 14, 473–493, https://doi.org/10.5194/gmd-14-473-2021, 2021. a
Yarragunta, Y., Francis, D., Fonseca, R., and Nelli, N.: Evaluation of the WRF-Chem performance for the air pollutants over the United Arab Emirates, Atmos. Chem. Phys., 25, 1685–1709, https://doi.org/10.5194/acp-25-1685-2025, 2025. a
Zeng, Y., Wang, M., Zhao, C., Chen, S., Liu, Z., Huang, X., and Gao, Y.: WRF-Chem v3.9 simulations of the East Asian dust storm in May 2017: modeling sensitivities to dust emission and dry deposition schemes, Geosci. Model Dev., 13, 2125–2147, https://doi.org/10.5194/gmd-13-2125-2020, 2020. a
Zhang, L., Montuoro, R., McKeen, S. A., Baker, B., Bhattacharjee, P. S., Grell, G. A., Henderson, J., Pan, L., Frost, G. J., McQueen, J., Saylor, R., Li, H., Ahmadov, R., Wang, J., Stajner, I., Kondragunta, S., Zhang, X., and Li, F.: Development and evaluation of the Aerosol Forecast Member in the National Center for Environment Prediction (NCEP)'s Global Ensemble Forecast System (GEFS-Aerosols v1), Geosci. Model Dev., 15, 5337–5369, https://doi.org/10.5194/gmd-15-5337-2022, 2022. a
Zhao, A., Ryder, C. L., and Wilcox, L. J.: How well do the CMIP6 models simulate dust aerosols?, Atmos. Chem. Phys., 22, 2095–2119, https://doi.org/10.5194/acp-22-2095-2022, 2022. a
Zhao, J., Ma, X., Wu, S., and Sha, T.: Dust emission and transport in Northwest China: WRF-Chem simulation and comparisons with multi-sensor observations, Atmos. Res., 241, 104978, https://doi.org/10.1016/j.atmosres.2020.104978, 2020. a, b
- Abstract
- Introduction
- Data and methods
- Results
- Conclusions
- Appendix A: SOILHD maps and RGB legend
- Appendix B: SINQLAIR Stations Map
- Appendix C: Dust events synoptic charts and PM10 concentrations
- Appendix D: Average PM10 differences
- Appendix E: Taylor Diagram for the simulated periods
- Appendix F: Time series by station (2025-08)
- Appendix G: Stacked Dust series (2025-08)
- Code and data availability
- Author contributions
- Competing interests
- Disclaimer
- Acknowledgements
- Financial support
- Review statement
- References
- Abstract
- Introduction
- Data and methods
- Results
- Conclusions
- Appendix A: SOILHD maps and RGB legend
- Appendix B: SINQLAIR Stations Map
- Appendix C: Dust events synoptic charts and PM10 concentrations
- Appendix D: Average PM10 differences
- Appendix E: Taylor Diagram for the simulated periods
- Appendix F: Time series by station (2025-08)
- Appendix G: Stacked Dust series (2025-08)
- Code and data availability
- Author contributions
- Competing interests
- Disclaimer
- Acknowledgements
- Financial support
- Review statement
- References