
the Creative Commons Attribution 4.0 License.
the Creative Commons Attribution 4.0 License.
 | 07 Sep 2026
Modelling mineral dust emissions from proglacial valleys of the St. Elias Mountains, Canada
Daniel Bellamy

Martina Klose
Daniel F. Nadeau
Sebastian Engelstaedter
Richard Washington
James King
Proglacial valleys of western Canada and Alaska demonstrate extensive historical and contemporary records of mineral dust emissions. These contributions remain unresolved by current dust emission modelling and unaccounted for in global emission estimates. We developed and evaluated a sub-km implementation of the Weather Research and Forecasting model with Chemistry (WRF-Chem) capable of simulating dust emissions from proglacial valleys of the St. Elias Mountains, Canada. Modelling these dust sources required precise treatment of surface characteristics and wind dynamics to accurately resolve surface erodibility, emission rates and aerosol dispersion within this mountainous terrain. Land-surface inputs were overhauled, with explicit treatment of glaciofluvial deposit heterogeneity and inundation conditions. Simulations covering 5–19 d periods across 2019–2022 were evaluated against in situ meteorological and dust emission measurements, camera stations and surface-based Doppler LiDAR data. A total emission rate of 1.0×10⁴ kg km−2 d−1 was estimated from erodible deposits across 47 d of simulation, providing a first-order estimate of emissions from these valleys during dusty periods. Seasonal-dependent skill in reproducing surface meteorology and in-valley vertical dispersion is demonstrated, modifying dust dispersion. Emission dynamics from a variety of glaciofluvial deposits were successfully reproduced, however the sensitivity of the emission scheme to soil texture is discussed in light of glaciofluvial deposit heterogeneity and dataset scarcity. The successful model implementation under extreme topographic conditions and arguably the most severely constrained deposits (channel width: 0.1–3 km; sidewalls up to +1.7 km) supports the potential of this approach to simulate dust emissions from currently unaccounted for proglacial valleys across northwest North America and other regions.
- Article
(16614 KB) - Full-text XML
-
Supplement
(3135 KB) - BibTeX
- EndNote


Mineral dust constitutes a key aerosol in the climate system (Kok et al., 2023; Shao et al., 2011a). Airborne mineral dust can alter cloud properties and microphysics (Creamean et al., 2013; Karydis et al., 2017; Nenes et al., 2014; Rosenfeld et al., 2014), modify the atmospheric radiative balance (Choobari et al., 2014; Highwood and Ryder, 2014; Miller et al., 2014) and influence biogeochemical cycles (Maher et al., 2010; Ravi et al., 2011). Mineral dust deposition on snow or ice surfaces can reduce surface albedo, enhancing melting rates (Clarke and Noone, 2007; McCutcheon et al., 2021; Nagorski et al., 2019). Proglacial landscapes are key sources of contemporary high-latitude (≥50° N and ≥40° S) dust emissions (Arnalds et al., 2016; Baddock et al., 2024; Bullard et al., 2016, 2023; Meinander et al., 2022). These glacigenic sources frequently remain coupled to active fluvial systems, resulting in coinciding aeolian, glacial and fluvial processes governing dust emissions (Bullard, 2013; Crusius et al., 2011). The contribution of emissions from these sources to regional climate modification is becoming increasingly established (Barr et al., 2023; Groot Zwaaftink et al., 2016; Koffman et al., 2021), however they remain excluded from almost all dust emission modelling efforts (Crusius, 2021; Kok et al., 2021a).
The coastal mountains of southern Alaska and western Canada exhibit some of the highest rates of glacier erosion and sediment evacuation globally (Hallet et al., 1996; Sheaf et al., 2003), sourcing extensive aeolian deposits across Alaska (Bettis et al., 2003; Black, 1951; Pewe, 1975). Contemporary dust emissions, previously only evidenced in grey literature (e.g. Moffit, 1938; Trainer, 1961), have now been identified in many of the region's proglacial valleys by loess studies (Muhs et al., 2013, 2016), remote sensing approaches (Huck et al., 2023; Sayedain et al., 2023; Schroth et al., 2017) and in situ investigations (Bachelder et al., 2019; Crusius et al., 2011; Nickling, 1978). Studies indicate the ubiquitous presence of locally-sourced dust on snowpacks at lower elevation sites in the St. Elias Mountains (2.0–2.8 km a.s.l) (Zdanowicz et al., 2006) and southern Alaska (∼2.1 km a.s.l) (Koffman et al., 2022). Dust loading at higher elevation sites (3–4 km a.s.l) is primarily of Asian provenance, though locally-sourced dust is present (Koffman et al., 2022; Zdanowicz et al., 2006). The impacts of aerosol deposition are notably absent from glacier melt projections (Nagorski et al., 2019), hence the impacts of local dust deposition in enhancing regional glacier melting are currently unknown. Current high-resolution modelling efforts covering the region (Dowell et al., 2022; Milbrandt et al., 2016) are underprepared to generate representative dust emissions from these sources, lacking appropriate land-surface treatment. While recent work has included dispersion modelling from coastal outwash deposits (Barr et al., 2023), no targeted effort to simulate dust emissions from these proglacial valleys has been performed.
Multiple challenges need to be overcome to explicitly resolve dust emissions from proglacial valleys of the St. Elias Mountains. A regional-scale modelling approach is necessary to delineate the confined glaciofluvial deposits sourcing dust emissions (Bellamy et al., 2025b). Knowledge of deposit sediment texture, fundamental to simulating dust emissions (Shao, 2008), is wholly absent, continuing a prevalent insufficiency of soil characteristic datasets in aeolian studies and emission modelling efforts (Darmenova et al., 2009; Kok et al., 2014b; Laurent et al., 2006; Meinander et al., 2022; Zender et al., 2003). Sedimentary facies within proglacial braided channels are a complex mosaic of cobbles, gravels and fine deposits, dependent on time-variant hydrological conditions and sediment supply, and susceptible to frequent reworking, erosion and deposition (Maizels, 1993; Marren, 2005; Rust, 1972). Deposit configurations are further dependent on topographical-constraints and the presence of proglacial lakes modifying catchment connectivity and acting as sediment sinks with varying depositional behaviour (Bennett et al., 2002; Carrivick and Tweed, 2013; Schiefer and Gilbert, 2008). No simple model exists to ascertain channel bed lithologies in proglacial river channels. Situated in proglacial landscapes, diurnal–seasonal variability in water level and seasonal snow cover (Bullard, 2013; Marren, 2005) join common surface-limiting factors of the aeolian system, such as soil moisture, vegetation cover and aerodynamic roughness (McKenna Neuman, 1993; Wiggs et al., 2004; Wolfe and Nickling, 1993).
The mountainous terrain bounding these deposits further complicates attempts to simulate representative surface winds. Atmospheric processes over complex terrain are challenging to simulate (Chow et al., 2019; Rohanizadegan et al., 2023; Serafin et al., 2018), and local mountain wind systems (Zardi and Whiteman, 2013) have been associated with strong wind events in this region (Bellamy et al., 2025a; Crusius et al., 2024). Post-emission, the dispersion and eventual fate of suspended material is governed by exchange processes in complex terrain, determining the total consequences of dust emissions (Baddock et al., 2017; Uno et al., 2009). Model capacity to reproduce vertical exchange mechanisms and convective boundary layer (CBL) dynamics (Serafin et al., 2018) is key to accurately reproducing emission trajectories and subsequently understand aerosol impacts.
In this work, we develop and evaluate a high-resolution, i.e. valley-resolving, modelling approach capable of simulating dust emissions from proglacial valleys of the St. Elias Mountains, Canada. We detail land-surface data preparation and modifications to existing dust emission schemes to enable representation of confined glaciofluvial surfaces. We target high emission periods from late-spring to early autumn with three simulation periods to evaluate model surface meteorology, dust emission activity and transport processes against a comprehensive array of ground-based observations. We present emission estimates for the region and argue for the applicability of this approach to investigate other glacigenic dust sources across the region.
2.1 Study region
This investigation focused on several proglacial valleys of the southeast St. Elias Mountains situated in Yukon, Canada (Fig. 1). The region exhibits a sub-arctic continental climate with a mean annual precipitation of 265 mm (1991–2020) (ECCC, 2023), despite close proximity (∼170 km) to the maritime climate of southern Alaska (3000–4000 mm) (Wendler et al., 2017). Steep-sided valleys range from 23–45 km long, channel widths of 0.1–3.0 km, and sidewall heights up to 1.3–1.7 km above the valley floor (Bellamy et al., 2025a). Outwash deposits within these proglacial valleys are the source of frequent dust emissions (Bellamy et al., 2025b).
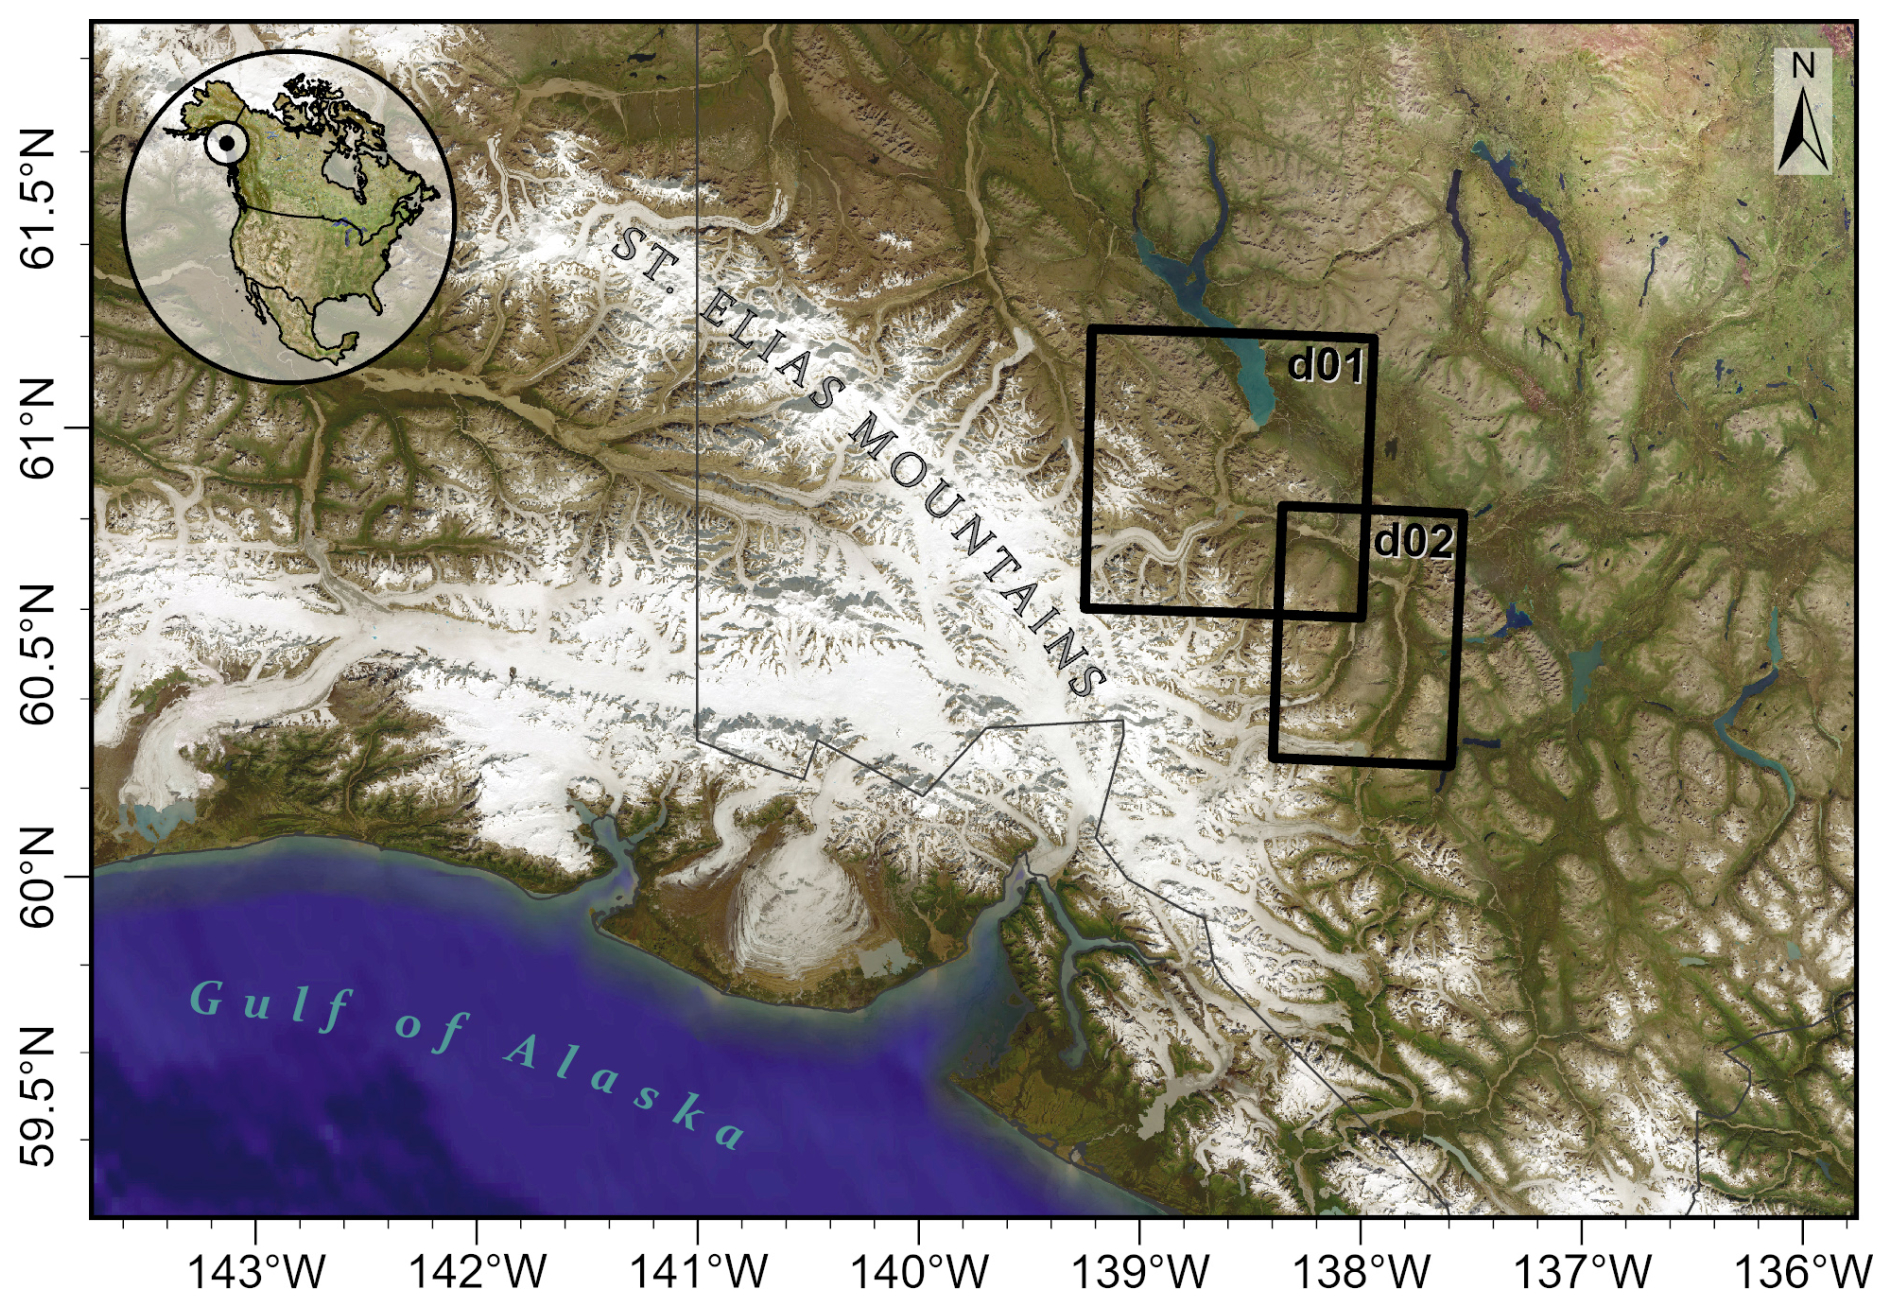
Figure 1Overview of the study region and location of the two model domains (d01; d02) (Source: Maxar, Esri, USGS | Powered by Esri).
2.2 WRF-Chem
To simulate dust emissions, we employed the Weather Research and Forecasting coupled with Chemistry (WRF-Chem v.4.6.0) model, a non-hydrostatic atmospheric model widely employed for regional-scale numerical weather prediction and research (Grell et al., 2005; Skamarock et al., 2021). With several dust emission schemes implemented, this model is frequently applied in aeolian research (Darmenova et al., 2009; Hao et al., 2024; Kang et al., 2011; LeGrand et al., 2019). Two domains, covering several proglacial valleys in the study region are illustrated in Fig. 1. The two principal challenges to simulating dust emissions from these sources were: (1) delineating erodible glaciofluvial deposits; (2) reproducing complex terrain meteorology for emissions and aerosol dispersion. A modelling approach designed to overcome these challenges is outlined in the following sections, detailing run-time settings, land-surface dataset preparation and the dust emission scheme.
2.2.1 Run-time settings and parameterisations
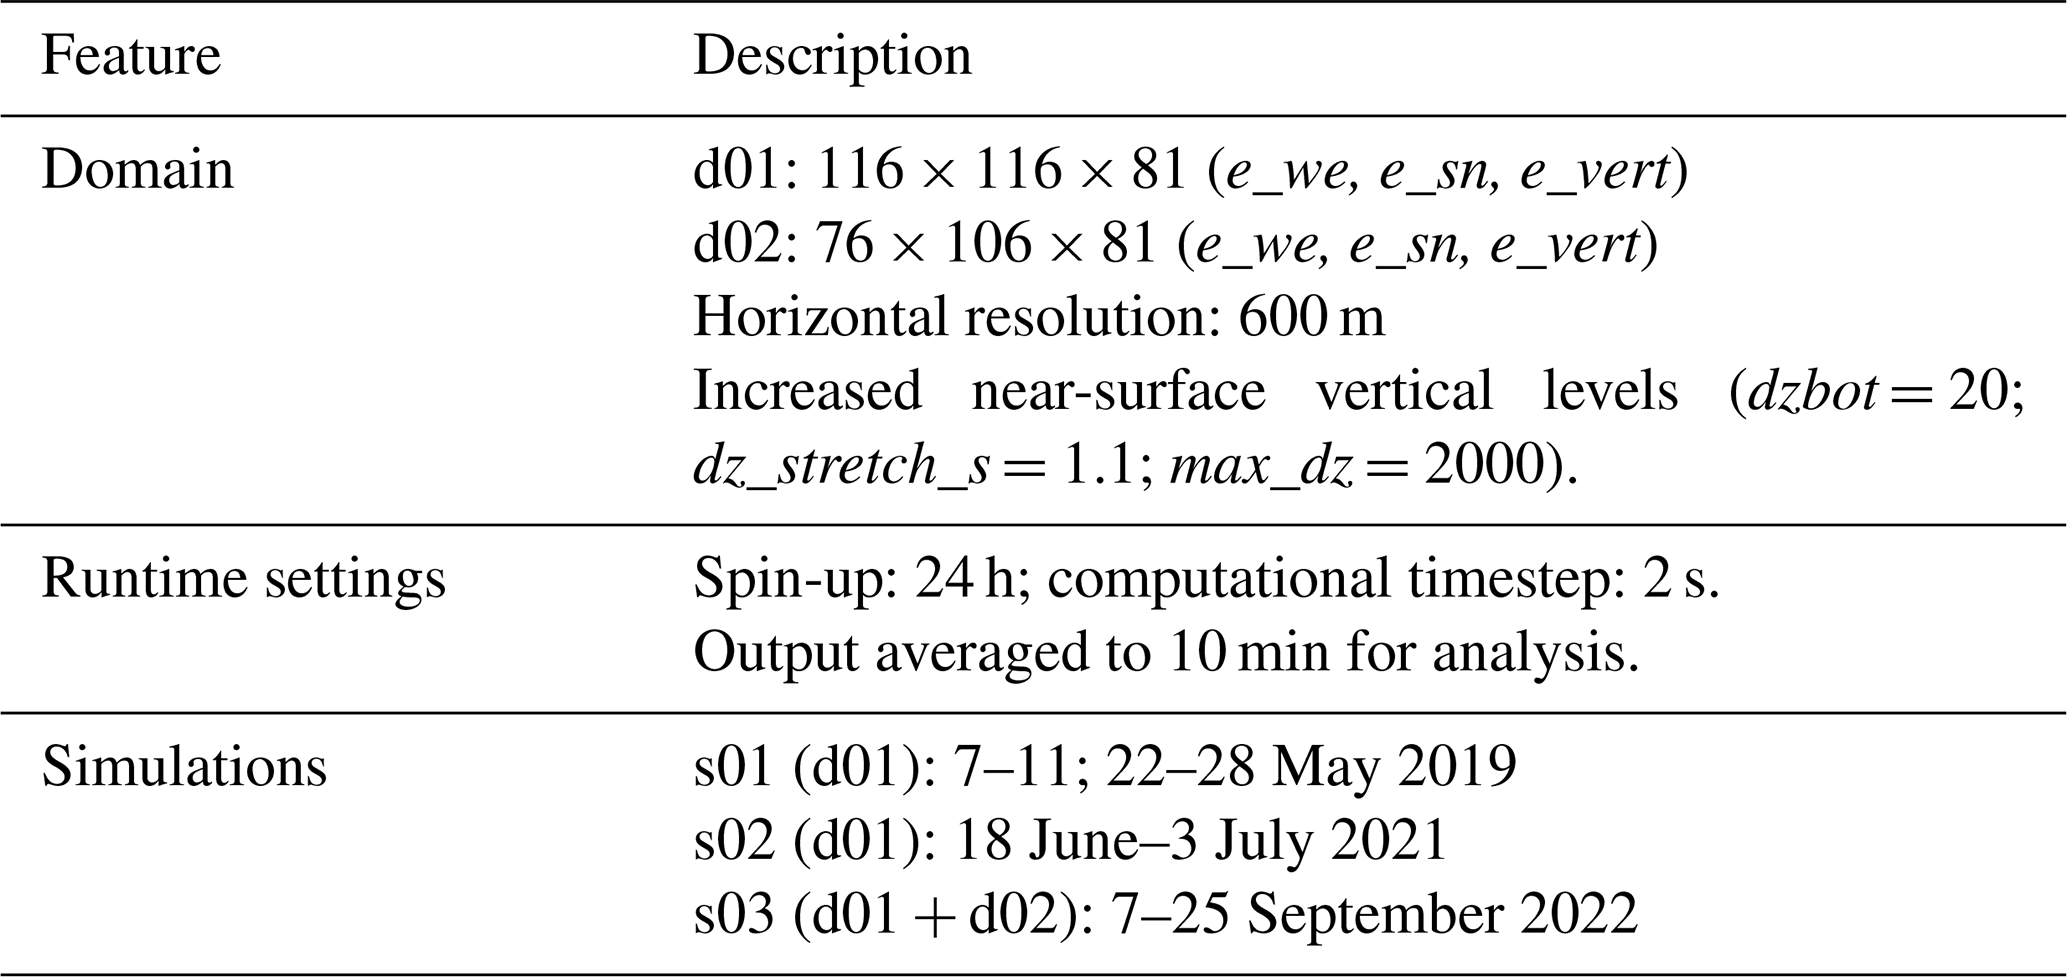
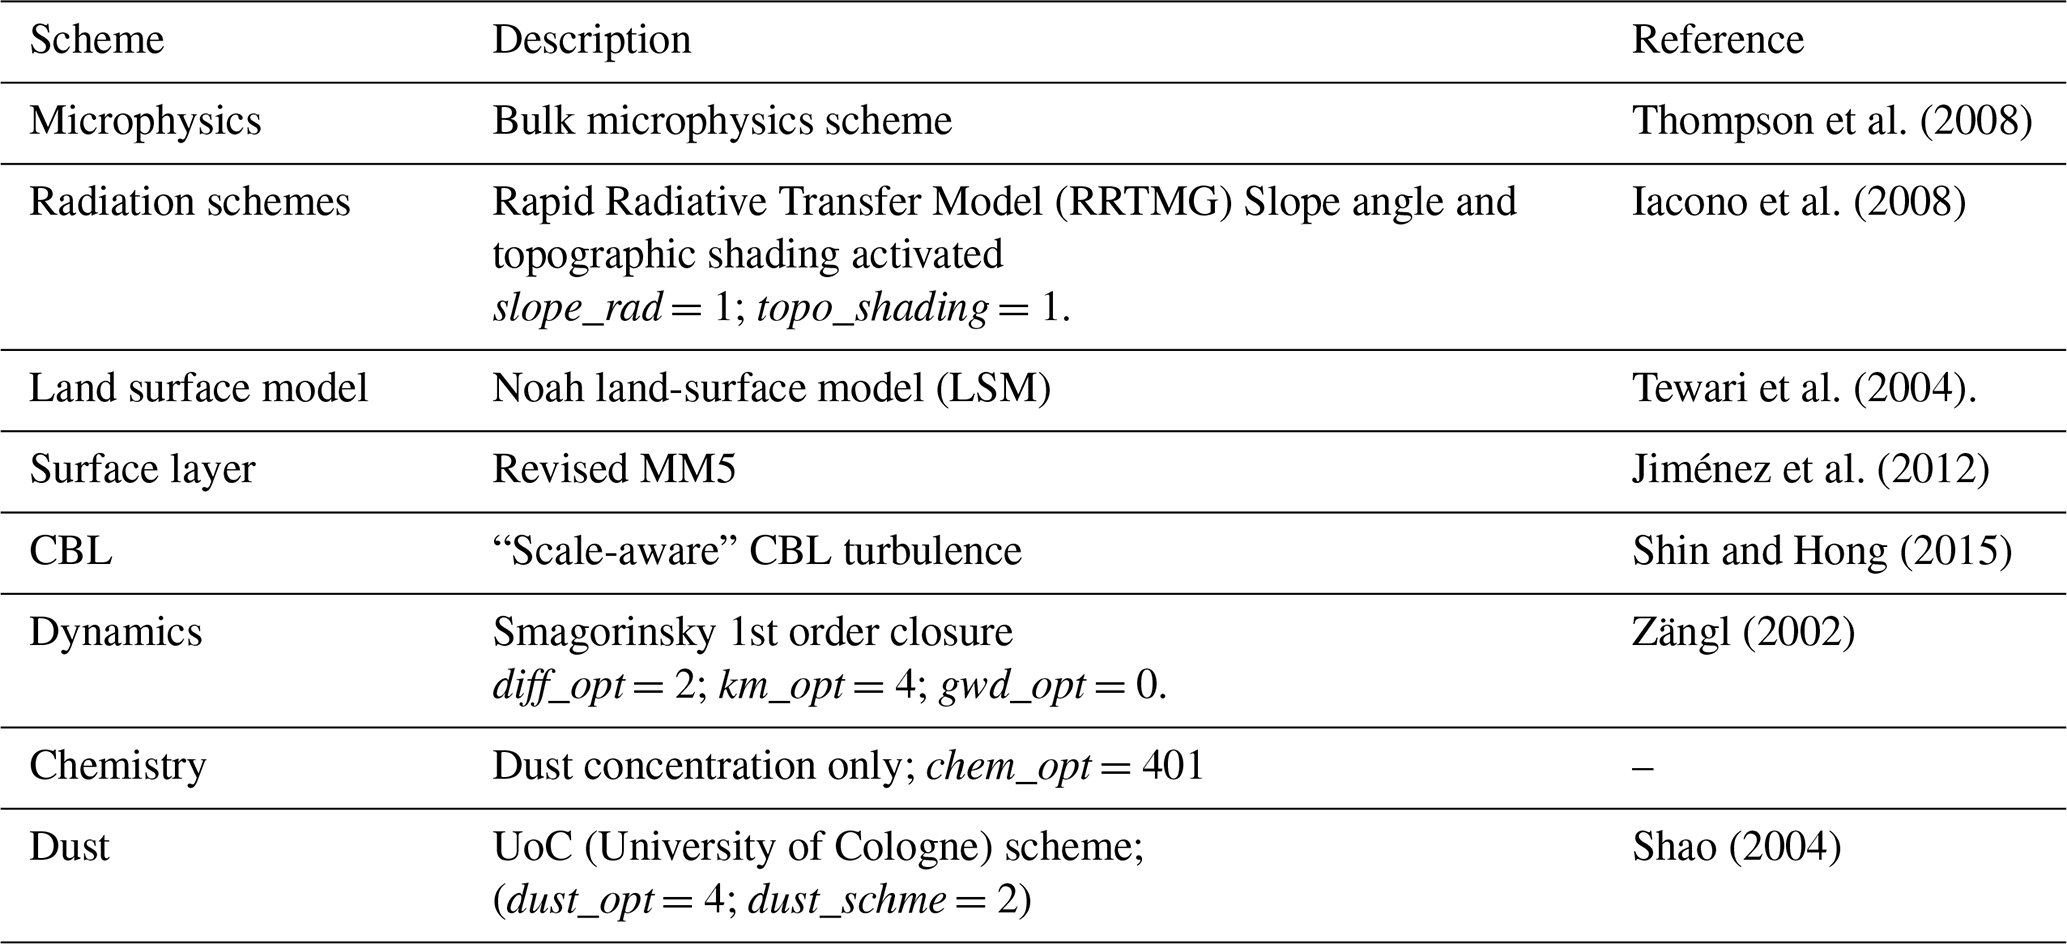
The model run-time settings and parameterisations used in simulations are detailed in Table 1 and 2, respectively. Simulations were performed covering three ∼ 1–3 week-long periods (s01–03) between 2019 and 2022, reflecting periods of concurrent in situ data availability and major dust activity (detailed in Sect. 2.3). Selected study periods covered principal emission seasons, from late spring–summer–early autumn conditions. Simulation 1 (s01) comprised two short periods within May 2019, where intermittent data availability and emission events intersected (see Supplement 2). Domain d02 (Fig. 1) was only employed in a separate 2022 simulation, corresponding to in situ data availability. Meteorological input was sourced from the High-Resolution Rapid Refresh–Alaska (HRRR-AK) product, a 3 km implementation of the WRF model with real-time data assimilation and hourly forecasts updated every 3 h (Dowell et al., 2022). Hourly input files were compiled from forecast timesteps of 0 to 2 h (Blaylock, 2022), with timesteps of 3–5 h used when the initial forecast file was not available. The application of HRRR-AK output to initialise simulations permitted a cost-efficient, single domain set-up with a horizontal resolution of 600 m: sufficient to resolve both complex topography and erodible deposits. To resolve issues with the turbulence grey zone at this resolution (Chow et al., 2019), we employed the Shin and Hong (2015) “scale-aware” CBL scheme, which accounts for resolved and parameterised turbulence as a function of model resolution. The effectiveness of these scale-aware schemes for parameterising turbulence within the grey zone remains under review (Doubrawa and Muñoz-Esparza, 2020; Giani et al., 2022; Honnert et al., 2020), however they constitute the best approach for studies at this resolution to date. Spin-up periods of 24 h were used, with no chemistry initialised.
Table 1Run-time settings for WRF-Chem (v4.6.0) simulations. For namelist options see the WRF Users' Guide.
2.2.2 Preparing model input
Substantial improvements to default land-surface datasets were required for this implementation (Table 3). Modifications to land-use, soil classification and the erodible source function are further detailed in this section.
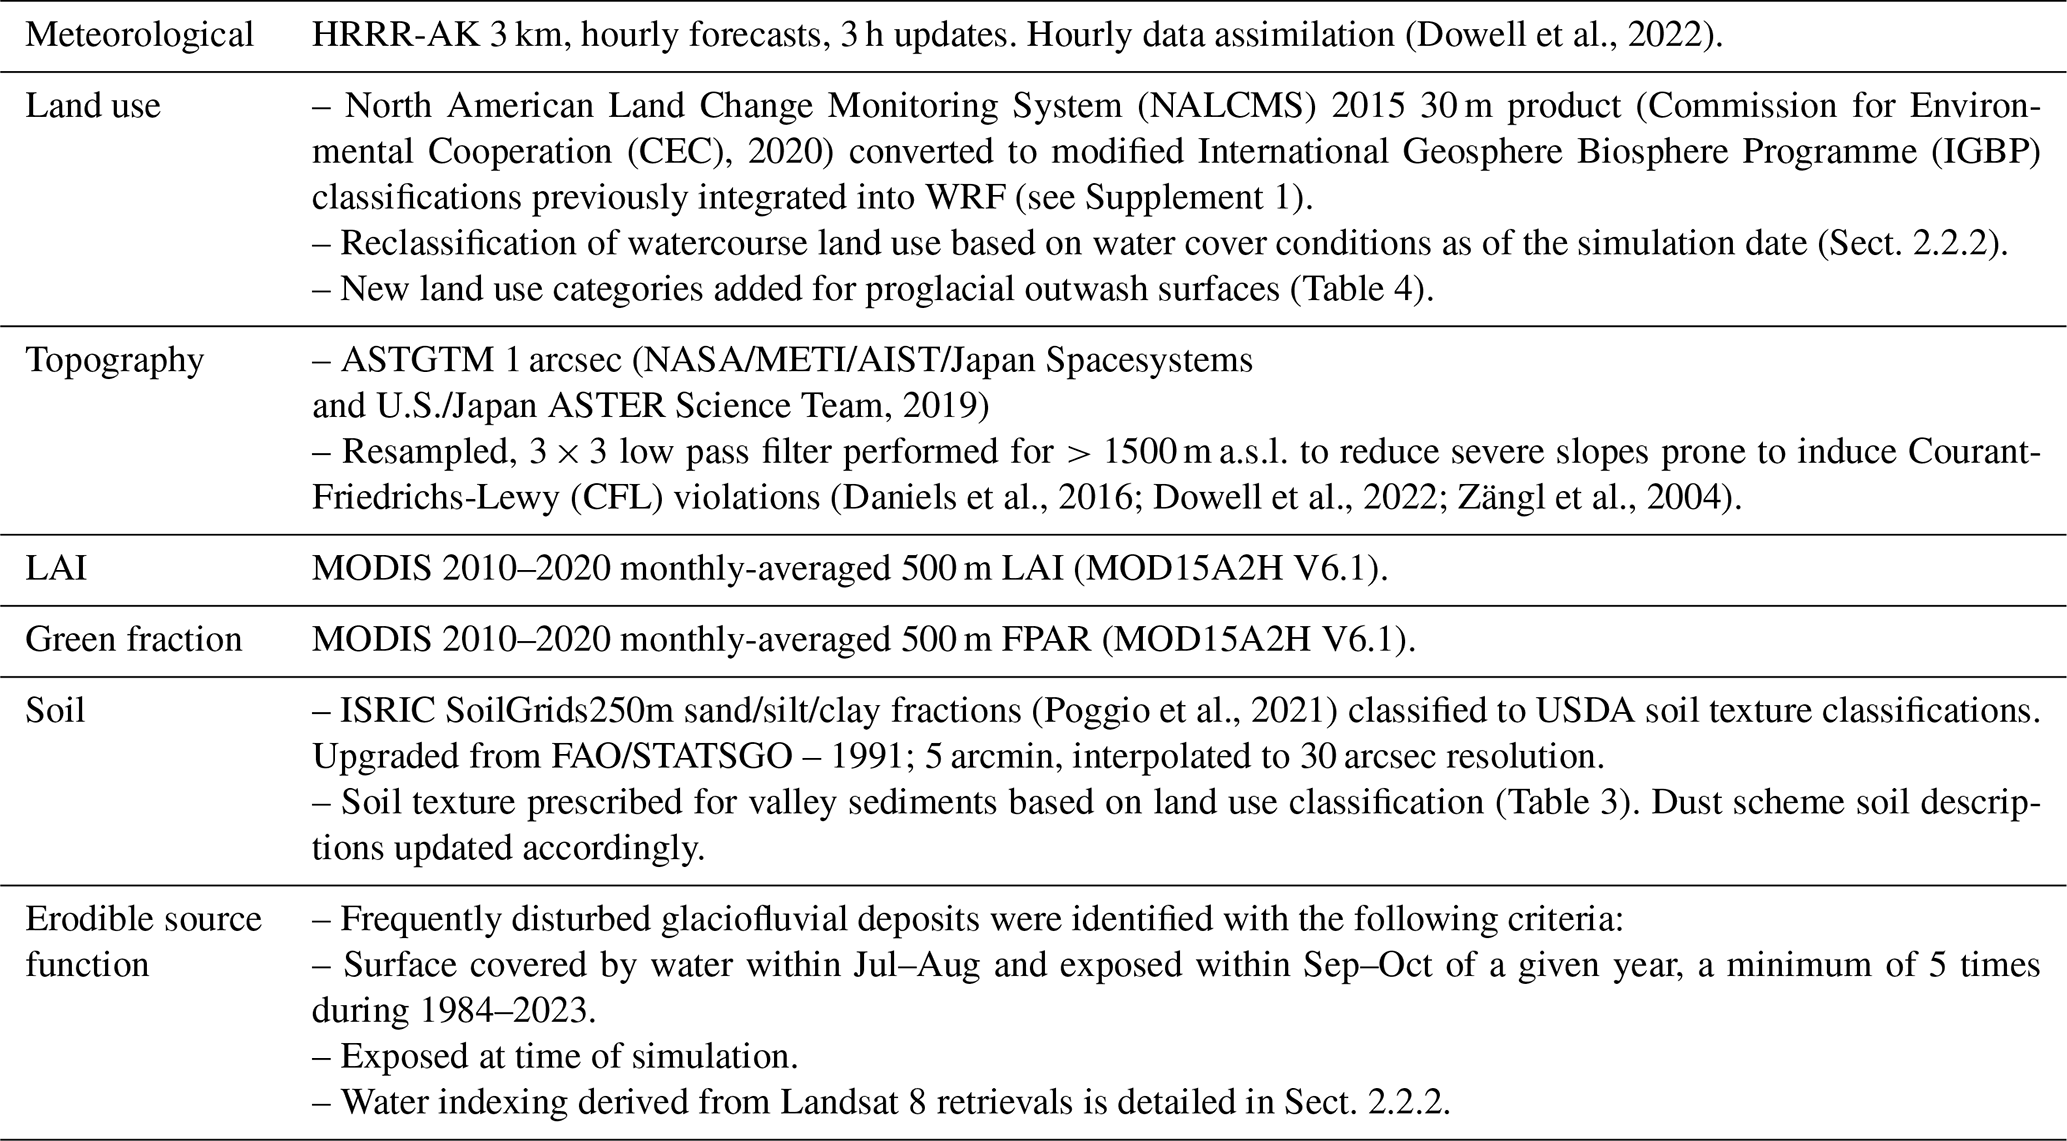
A binary erodible source factor was employed to constrain erodible glaciofluvial deposits, identifying surfaces prone to frequent seasonal inundation and exposure, inferring fluvial deposition of glacigenic sediment. Surface water mapping was performed with Landsat 5–8 retrievals following Feyisa et al. (2014), with river conditions and exposed outwash deposits constrained for each simulation date. Following Bellamy et al. (2025b), potential erodible area was identified as surfaces inundated during summer and subsequently exposed in autumn a minimum of 5 years across 40 years of available retrievals (1984–2023). The criteria identified regularly reworked surfaces only but was sufficiently lenient to capture conditions following a major hydrological reorganisation in 2016 (Shugar et al., 2017). The erodible source factor is subsequently defined for each simulation period as potential erodible area exposed at the time of the simulation, incorporating date-specific water cover conditions.
No datasets were available that provide an adequate representation of outwash deposit characteristics. To overcome this, four outwash deposit classifications were added to the land surface scheme: very coarse; coarse; fine; very fine (Table 4). We link these classifications to similar lithofacies groupings in Maizels (1993). Each group was prescribed a representative sediment texture which were used to update model soil inputs and soil descriptions in the emission scheme. Representative examples of each classification are provided in Fig. 2, while a domain overview is available in Fig. S1 in the Supplement.
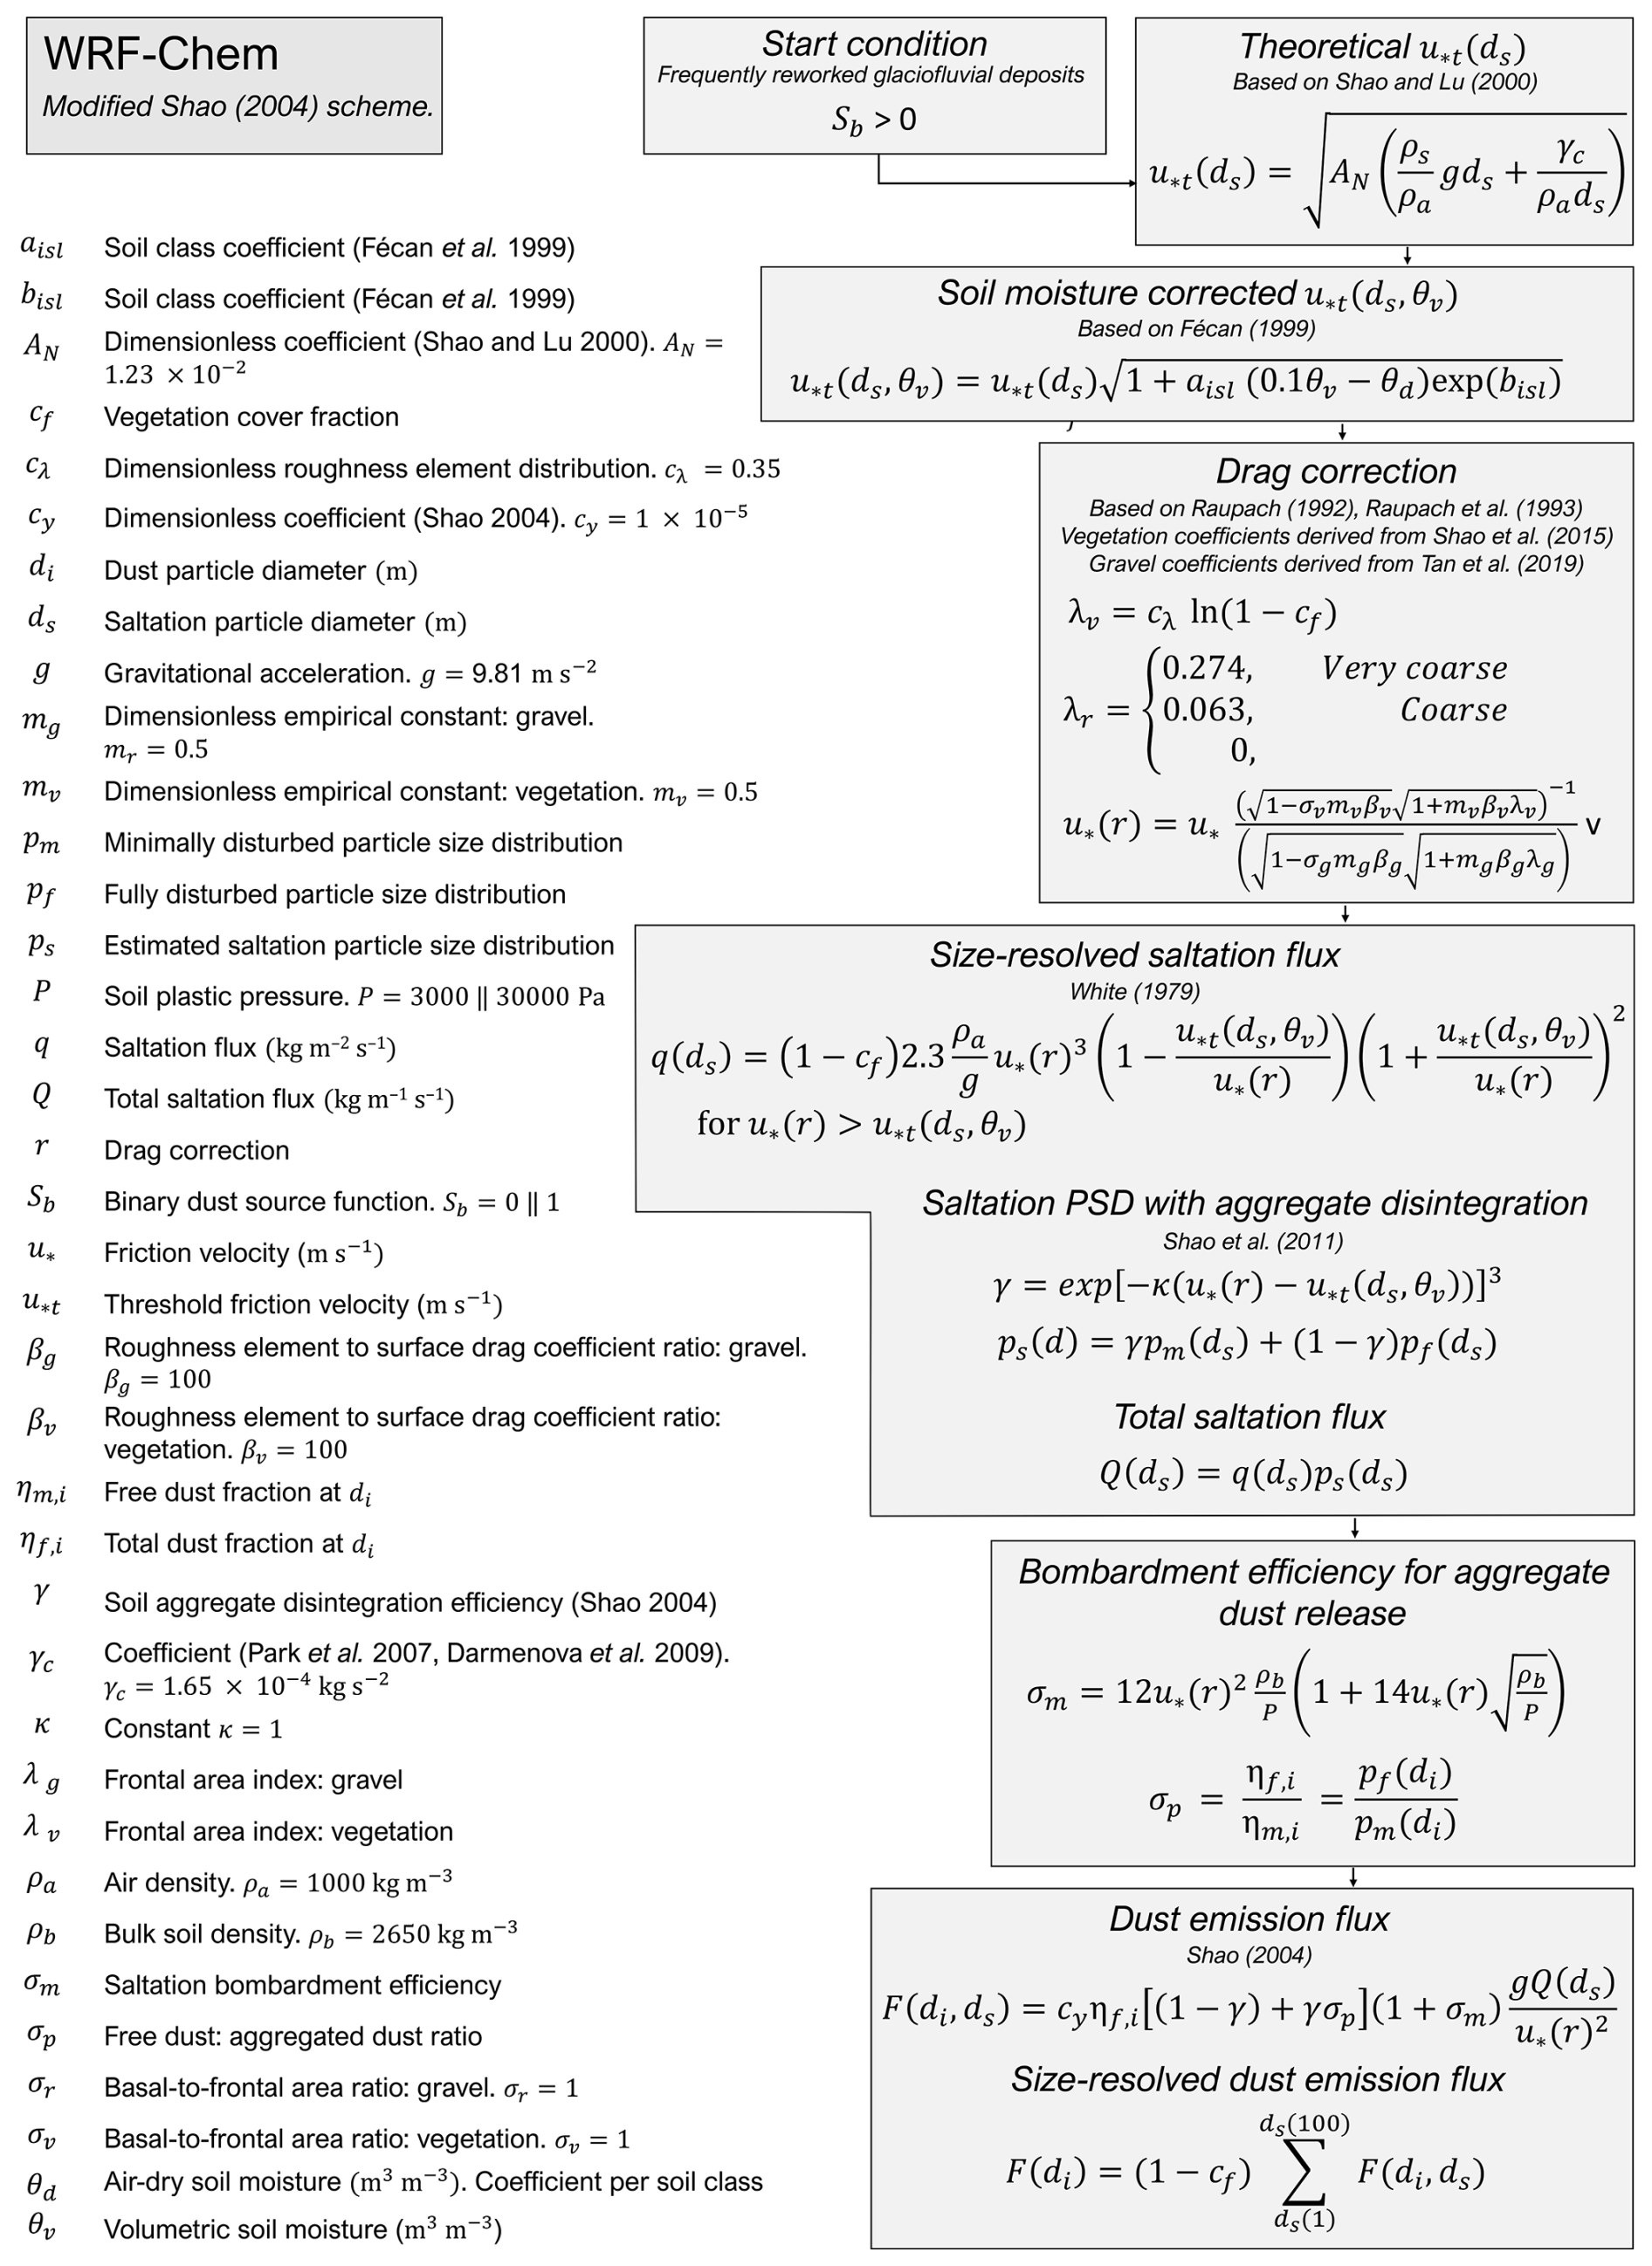
Figure 2Overview of the modified Shao (2004) scheme in WRF-Chem developed in this work. Modifications were applied to the drag partition parameterisation (), further detailed in Sect. 2.2.3.
Table 4Additional land use classifications for outwash plains and prescribed sediment textures. Description indicates corresponding geomorphological unit classifications in Maizels (1993). D, h are the diameter and height of particles, respectively.
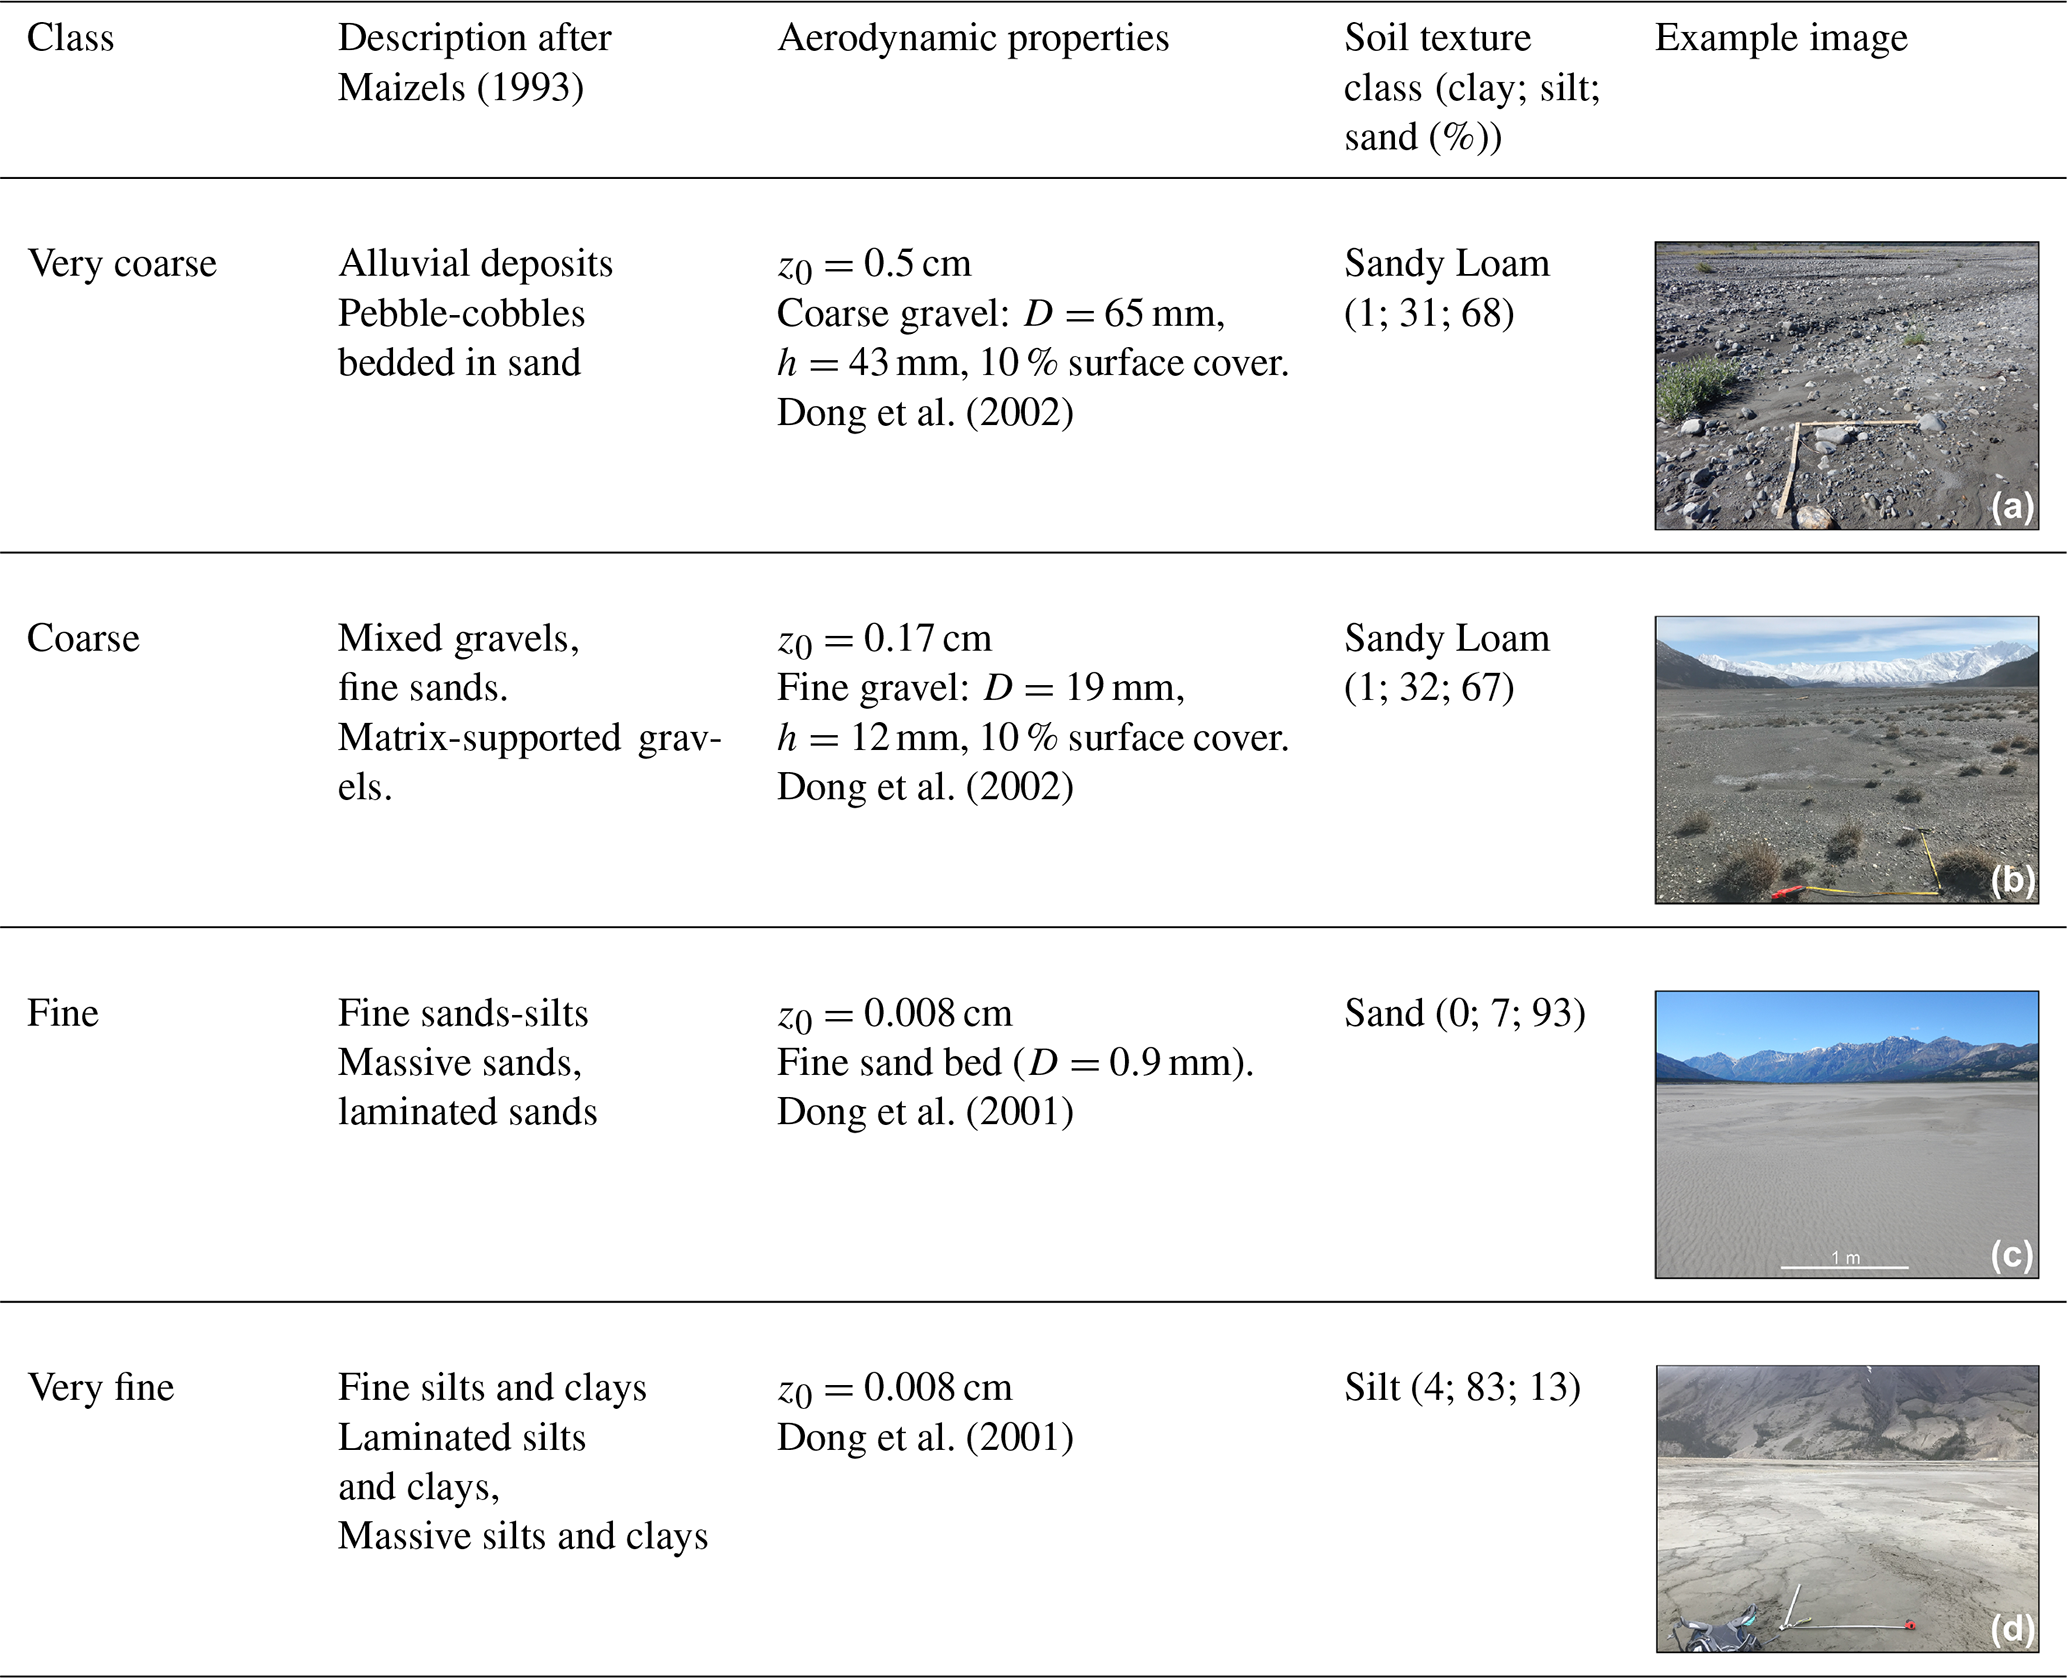
Outwash deposit classification was performed based on field observations (Bellamy et al., 2026) and surficial geological maps (Rampton, 1977; Rampton and Paradis, 1982). In lieu of detailed information of surface deposits in the upper Kaskawulsh river valley (60.82° N, 138.51° W to 60.69° N, 137.97° W), all outwash units are characterised as coarse. Representative soil texture classifications were derived from multiple sediment samples from each deposit grouping, collected within the A'ą̈y Chù valley (see Supplement Fig. S2). For scheme consistency, minimally and fully disturbed volume size distributions were obtained following the procedure of Shao et al. (2011b) using a MasterSizer 3000 (Malvern Instruments) and parameterised as lognormal distributions (supplementary 1). The newly implemented particle-size distributions (PSDs) for sandy loam, sand and silt soil classes increased the fully-disturbed ≤20 µm mass from 1.6 %–14.7 %, <0.1 %–9.8 %, and 8.8 %–64.3 %, respectively, compared to existing soil descriptions for the Shao (2004) scheme in WRF-Chem (see Supplement Fig. S3). Roughness lengths (z0) were attributed to each new land use classification based on wind-tunnel investigations of aerodynamic roughness for gravel and sand surfaces (Table 4) (Dong et al., 2001, 2002).
Preliminary modelling and sensitivity testing for s01 indicated a significant overestimation of reflected shortwave radiation on the valley floor, inducing an underestimated surface energy budget with influence on dust emission estimates (Supplement 3). Accordingly, the albedo parameter for the four glaciofluvial deposits was set to 0.14 (compared to 0.38 for “barren or sparsely vegetated”) based on the average albedo at solar noon as measured at the surface meteorological station DV (Sect. 2.3) across all simulation periods. This adaptation improved outgoing radiative fluxes (Supplement 3), however replacing the single value does not improve on domain-wide albedo discrepancies due to variable surface moisture or deposit type. Remaining characteristics required by the unified Noah land-surface model (LSM) in WRF-Chem remain identical to the “barren or sparsely vegetated” classification.
2.2.3 Dust emission scheme
We employed the University of Cologne (UoC) Shao (2004) scheme as implemented in WRF-Chem v4.6.0 to simulate dust emissions. While the dust emission flux is predicated on Shao (2004), the complete scheme draws from Shao and Lu (2000), Shao et al. (2011b) and references herein. This scheme determines threshold friction velocity (u*t) for saltation, calculates saltation flux across a range of saltating particle sizes, and subsequently evaluates the dust emission flux and passes dust concentrations in five particle size bins (0.2–2.0, 2.0–3.6, 3.6–6.0, 6.0–12.0, 12.0–20.0 µm) to the wider WRF-Chem model for transport. Employed extensively for dust emission modelling (Darmenova et al., 2009; Edwards et al., 2022; Klose et al., 2021; LeGrand et al., 2019; Park et al., 2007) this scheme is transcribed in Fig. 2. Modifications to enhance the treatment of surface erodibility in our study region were implemented and are detailed below.
Shao (2004) incorporates the variable soil plastic pressure (P) (also referred to as soil penetrometer resistance) to represent soil binding strength in determining the mass ejected by saltation bombardments (Lu and Shao, 1999). This term is currently held constant across all soil types despite being soil texture and time-variant (Zobeck, 1991), as noted by LeGrand et al. (2019). P is currently estimated by model fitting (Klose et al., 2019; Shao, 2004) as appropriate penetration resistance measurements (e.g. Rice et al., 1997) are not widely reported. Based on the estimates available in Rice et al. (1997) we approximated P for sandy soils as 3×10³ N m−2 and silt soils as 3×10⁴ N m−2. Constraining P further as a function of sediment texture as pertinent for saltation is currently not possible. The dimensionless tuning coefficient (cy), used to adjust the emission scheme for specific soil conditions (Klose et al., 2019; Shao et al., 2011b), was fixed at (Shao, 2004).
Previous approaches to constrain gravel cover in drag partitioning (Klose et al., 2021; Laurent et al., 2006; Leung et al., 2023) were inapplicable at this scale of study. In lieu of this, we assigned gravel characteristics during our outwash deposit characterisation (Table 4) and derived a second drag coefficient following Raupach et al. (1993). The drag partition scheme (Fig. 2) was modified to apply an inverse correction for vegetation and gravel shear stress partitioning to u* instead of u*t (Kok et al., 2014a). Gravel scheme coefficients (βg; λg; mg – see Fig. 2) were set following the results of Tan et al. (2019). This effectively corresponds to a fixed decrease of u* by a factor of 2.15 and 3.56 for the coarse and very coarse outwash deposits, respectively. Separately, the soil-moisture correction to u*t was implemented with a modified soil moisture (0.1θv) to account for discrepancies between model top soil layer conditions and those of surface grains subject to aeolian processes, as frequently performed in dust emission modelling (Darmenova et al., 2009; Klose et al., 2021).
2.3 In situ observations for model evaluation
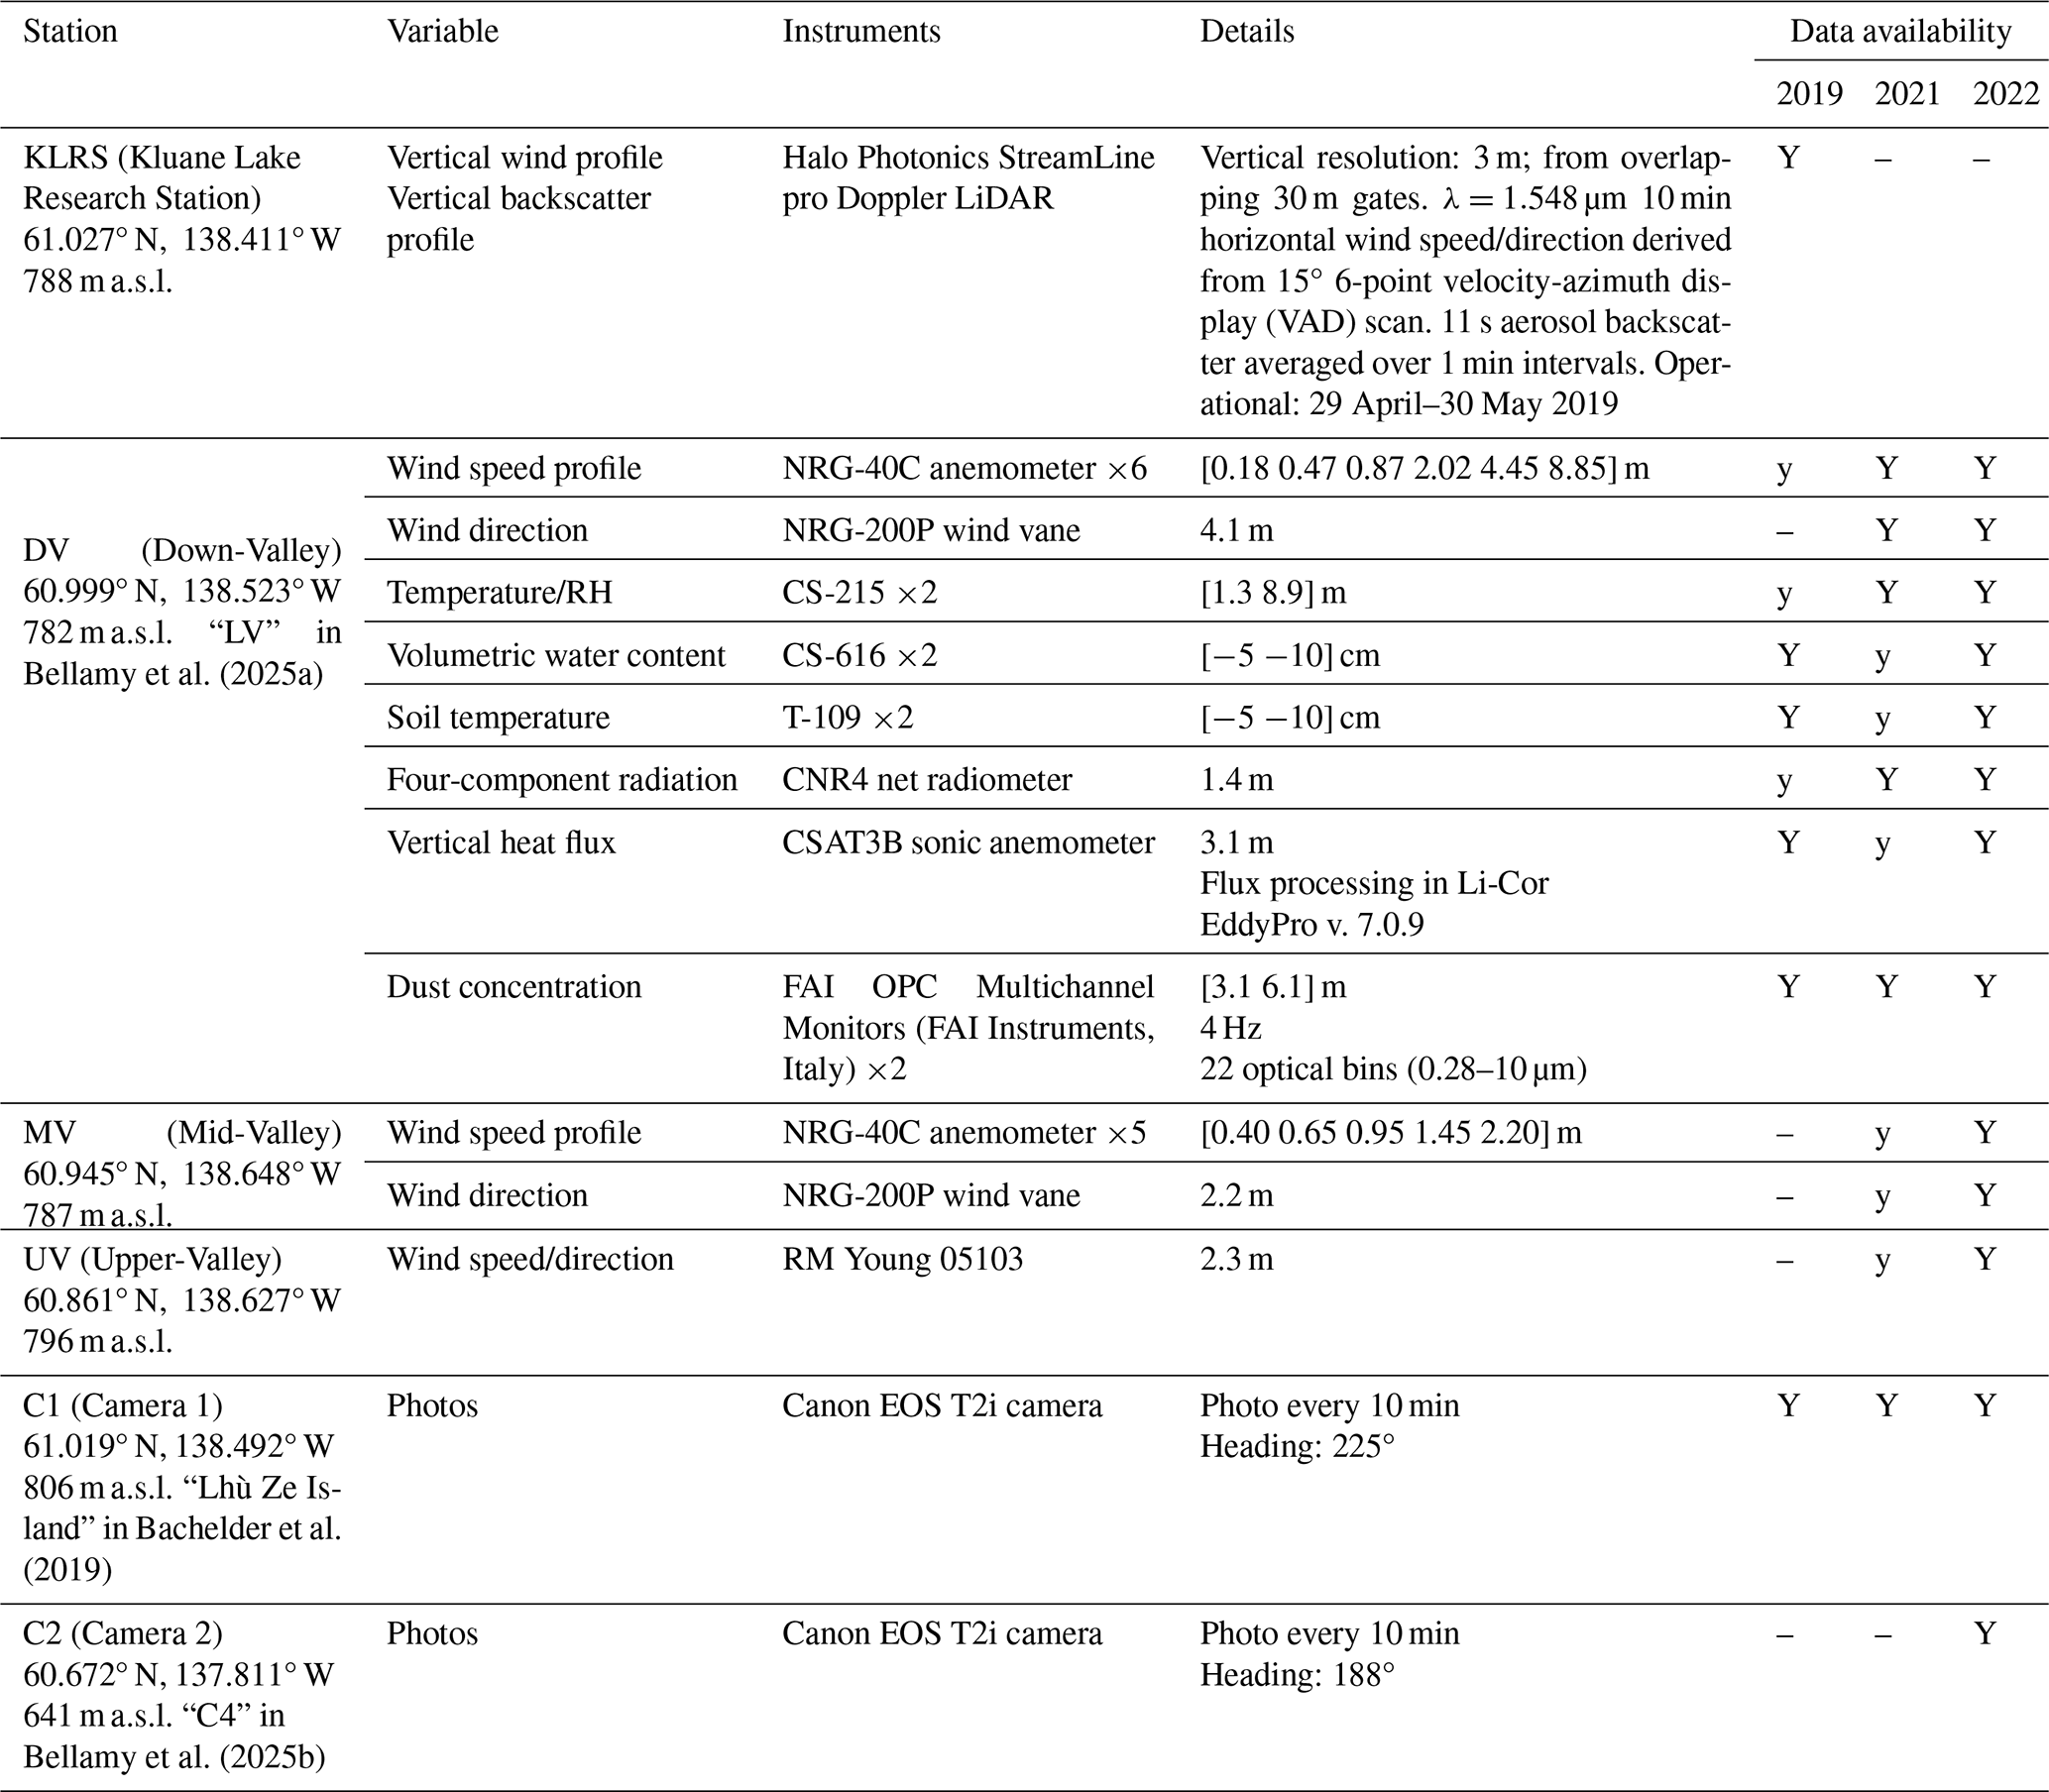
To fully test model performance, we evaluated model skill in reproducing: (1) near-surface meteorology; (2) dust emissions (location, timing and fluxes); (3) vertical mixing and aerosol transport within the mountainous terrain. Data collected during field campaigns in 2019, 2021 and 2022 are valuable in evaluating these processes, and are detailed separately in the following sections. An overview of station installations in the study region is given in Fig. 3, with instrumentation summarised in Table 5.
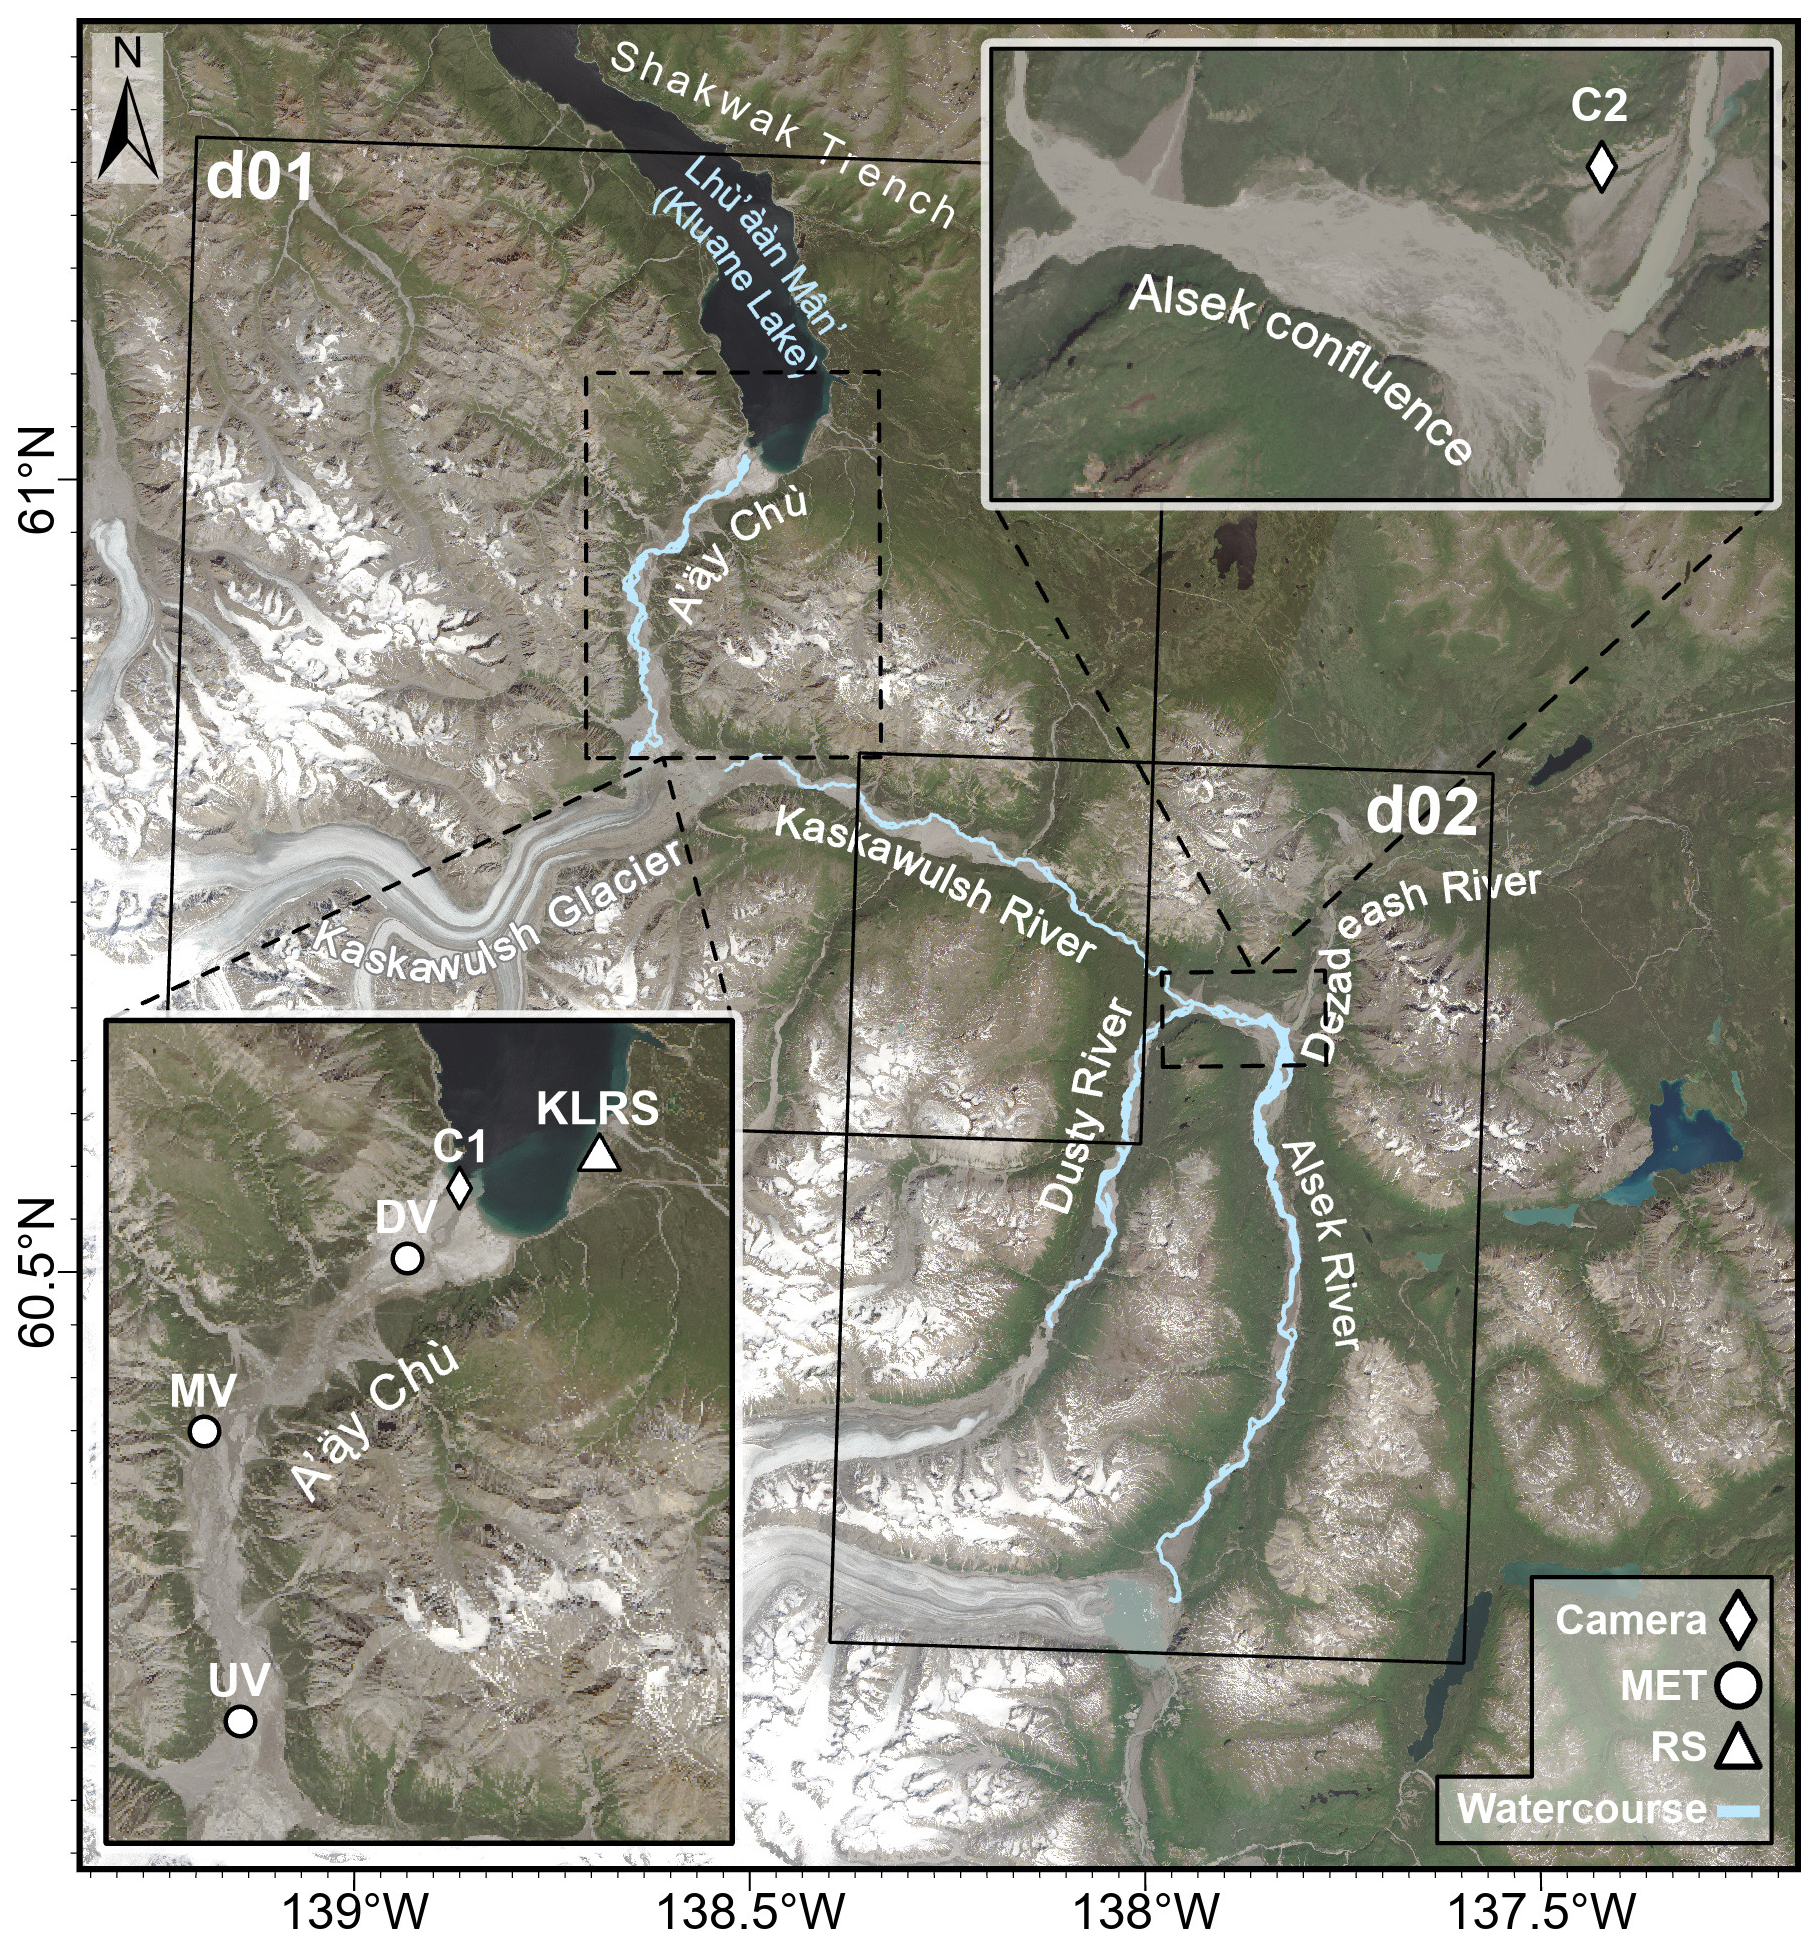
Figure 3An overview of camera, MET (meteorological station) and RS (remote sensing) installations in the region. The two model domains (d01; d02) are indicated. Landsat 9 imagery (7 July 2023) courtesy of the U.S. Geological Survey.
Table 5Station details. Data availability during years indicated as yes (Y), partial (y) or no (–).
2.3.1 Surface meteorology
Surface meteorology was evaluated across all simulation periods using three meteorological stations in the A'ą̈y Chù valley, covering late spring–early autumn conditions. Near-surface wind diagnostics were re-evaluated at sensor height for each station following the surface layer scheme (Jiménez et al., 2012) (Eq. 24):
where u(z) is the wind speed at diagnostic height z, ua is wind speed at the lowest model level of height za, z0 is the roughness length, L is the Obukhov length, and ψm is the momentum stability function. Radiative forcing and turbulent fluxes were evaluated at DV, with turbulent fluxes measured with an eddy covariance system (Aubinet et al., 2012). Due to an incomplete sonic anemometer record, friction velocity (u*) at DV was calculated using a stability-corrected law-of-the-wall approach (e.g. Dupont et al., 2018) with wind and temperature profile measurements at DV (Table 5) over 30 min averaging periods. Linear regression fits of R2<0.9 were discarded. Limited in consistent stability measurements across the three years, we relied on a simple two criteria momentum similarity function (Bonan, 2019) to address the impact of stability on surface layer profiles:
where: .
2.3.2 Boundary-layer meteorology
Vertical profiles of horizontal wind speed, wind direction and backscatter were obtained from a Halo Photonics Doppler LiDAR deployed at KLRS in May 2019 (Table 5). Significant signal attenuation limits consistent retrievals to ∼ 700–1500 m, a common limitation for locations with low background aerosol levels (Wiggs et al., 2022). We derive dust mass concentrations from LiDAR backscatter measurements following Ansmann et al. (2019), deriving a novel conversion parameter for 1.548 µm Doppler LiDAR from AERONET (Giles et al., 2019; Holben et al., 1998) retrievals at the Kluane Lake site (61.027° N 138.411° W), with reference to Sayedain et al. (2023). Further details are provided in Supplement 4. LiDAR vertical profiles and WRF vertical profiles from the closest grid point to KLRS were averaged or interpolated, respectively, to 30 m levels for direct comparison. The calculation of LiDAR diurnal averages is restricted to vertical bins with a majority of QC-passed retrievals during simulation periods.
2.3.3 Dust emission flux
The gradient method (Gillette et al., 1972) has seen extensive use in measuring the vertical dust flux (Fd) within aeolian literature (Ishizuka et al., 2014; Khalfallah et al., 2020; Nickling and Gillies, 1993; Shao et al., 2011b; Sow et al., 2009). Fd () was calculated using 30 min averaged measurements from two optical particle counters situated on a tower at the DV site, at heights of 3.1 and 6.1 m during 2019 and 2021 (Table 5) such that:
where C1 and C2 are dust concentration measurements at heights z1 and z2, ψm is the momentum stability function and L is the Obukhov length. ψm was determined following Eq. (2) (Sect. 2.3.1). We estimate and correct for the effect of gravitational settling following González-Flórez et al. (2023) to infer the surface emission flux from the gradient-method derived diffusive flux, further detailed in Bellamy et al. (2026). Size-resolved dust fluxes across 22 optical bins between 0.28–10 µm were summed to yield Fd. We converted from optical to geometric diameters (0.25–9.81 µm) following Huang et al. (2021), based on an OPC laser wavelength of λ=630 nm, 90° ± 90° and dust refractive index of 1.54–0.001i. For the direct comparison of observed vs. simulated Fd, WRF size-resolved emission fluxes were summed across the same geometric range, partitioning fluxes in size bins 1 and 4 assuming a log-normal distribution of particle volume in each bin (μ=1.1, σ=0.25; μ=9, σ=0.8, respectively). Missing data periods within the outlined simulation periods are evaluated in Supplement 2, though they are sparse (19.4 %) and predominantly limited to the early morning hours (6–10 h), the calmest period of the day.
2.3.4 Camera-derived dust observations
Camera stations permit a broader assessment of emission activity across heterogenous glaciofluvial deposits. Model capacity to simulate emissions in adjacent valleys was evaluated through camera observations and a manual binary identification of dust emission activity. A qualitative emission log was derived from regular 10 min photos obtained in 2022 by C1 and C2 to evaluate emissions simulated in the A'ą̈y Chù valley and at the Alsek confluence (Fig. 3). Camera records detail periods of visible dust suspension, examples of which are given in Fig. 4. Near contiguous periods of emissions were classified into events. Visually observed precipitation was also logged to discuss model precipitation in relation to dust emissions. Due to the qualitative nature of camera-derived observations, this assessment was limited to evaluating the reliability of simulated emission timings across the broader region. As the approach required the visual identification of suspended dust, weaker events may be absent from camera-based emission logs.
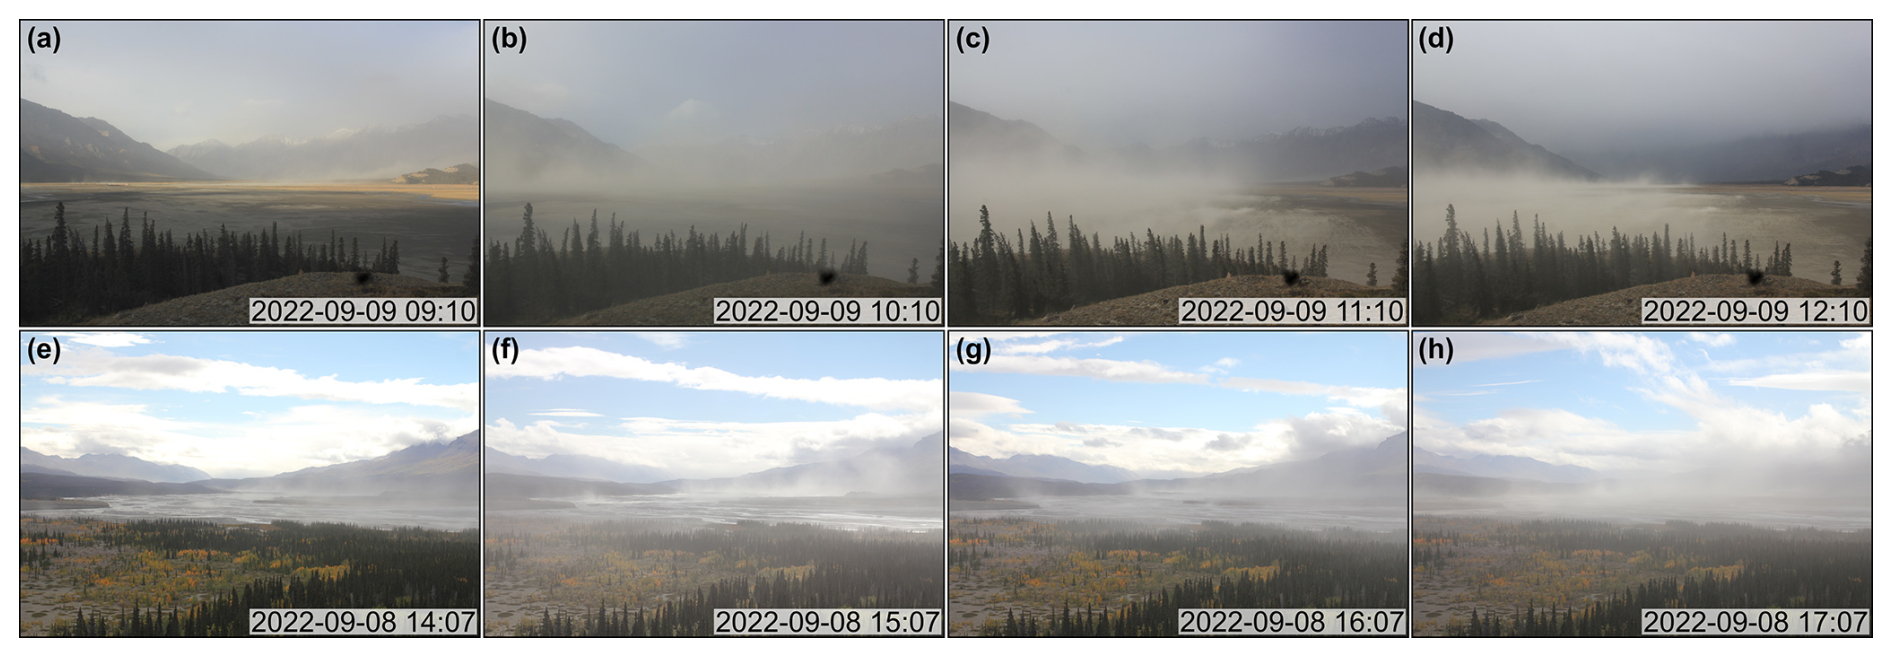
Figure 4Examples of dust activity from deployed camera stations C1 (top) and C2 (bottom) during September 2022.
The first subsection (Sect. 3.1) evaluates modelled surface meteorology, emission dynamics and vertical dispersion against a suite of in situ observations to analyse model performance. The second subsection (Sect. 3.2) summarises modelling output with total emission estimates and investigates dispersion characteristics. We conclude on model estimate shortcomings, in light of the evaluation results, in Sect. 4.1.
3.1 Model evaluation
3.1.1 Surface meteorology
An evaluation of meteorological variables at DV across all simulation periods is shown in Fig. 5. Simulated net radiation (Fig. 5i–l) was slightly overestimated vs. DV (mean bias of +23 W m−2), with daily discrepancies attributed to disparate cloud cover. The close reproduction of diurnal transitions across all simulation periods indicates good performance of topographic shading routines. When observations were available, sensible heat fluxes exhibited a minor overestimation (mean bias of +19 W m−2) due to persisting discrepancies from cloud-cover differences. During model spin-up (24 h – not shown), soil moisture decreased rapidly, falling 8 %–11 % at DV between simulation periods. The adjustment continued in day 1 of s01 (Fig. 5e), suggesting insufficient spin-up time for soil moisture adjustment. This may have contributed to the subdued dynamic instability during 7 May (Fig. 5m), inhibiting surface wind speeds and dust emissions. Simulated soil moisture content remained overestimated across all simulation periods. With simulations focused on major emission periods, model precipitation was not comprehensively evaluated but is discussed briefly in Sect. 3.1.3. Simulated winds (Fig. 5a–d) closely followed observations across simulation periods, with a tendency to underestimate (mean bias of −1.24 m s−1), and performing best in reproducing winds at DV during s02 (June–July 2021).
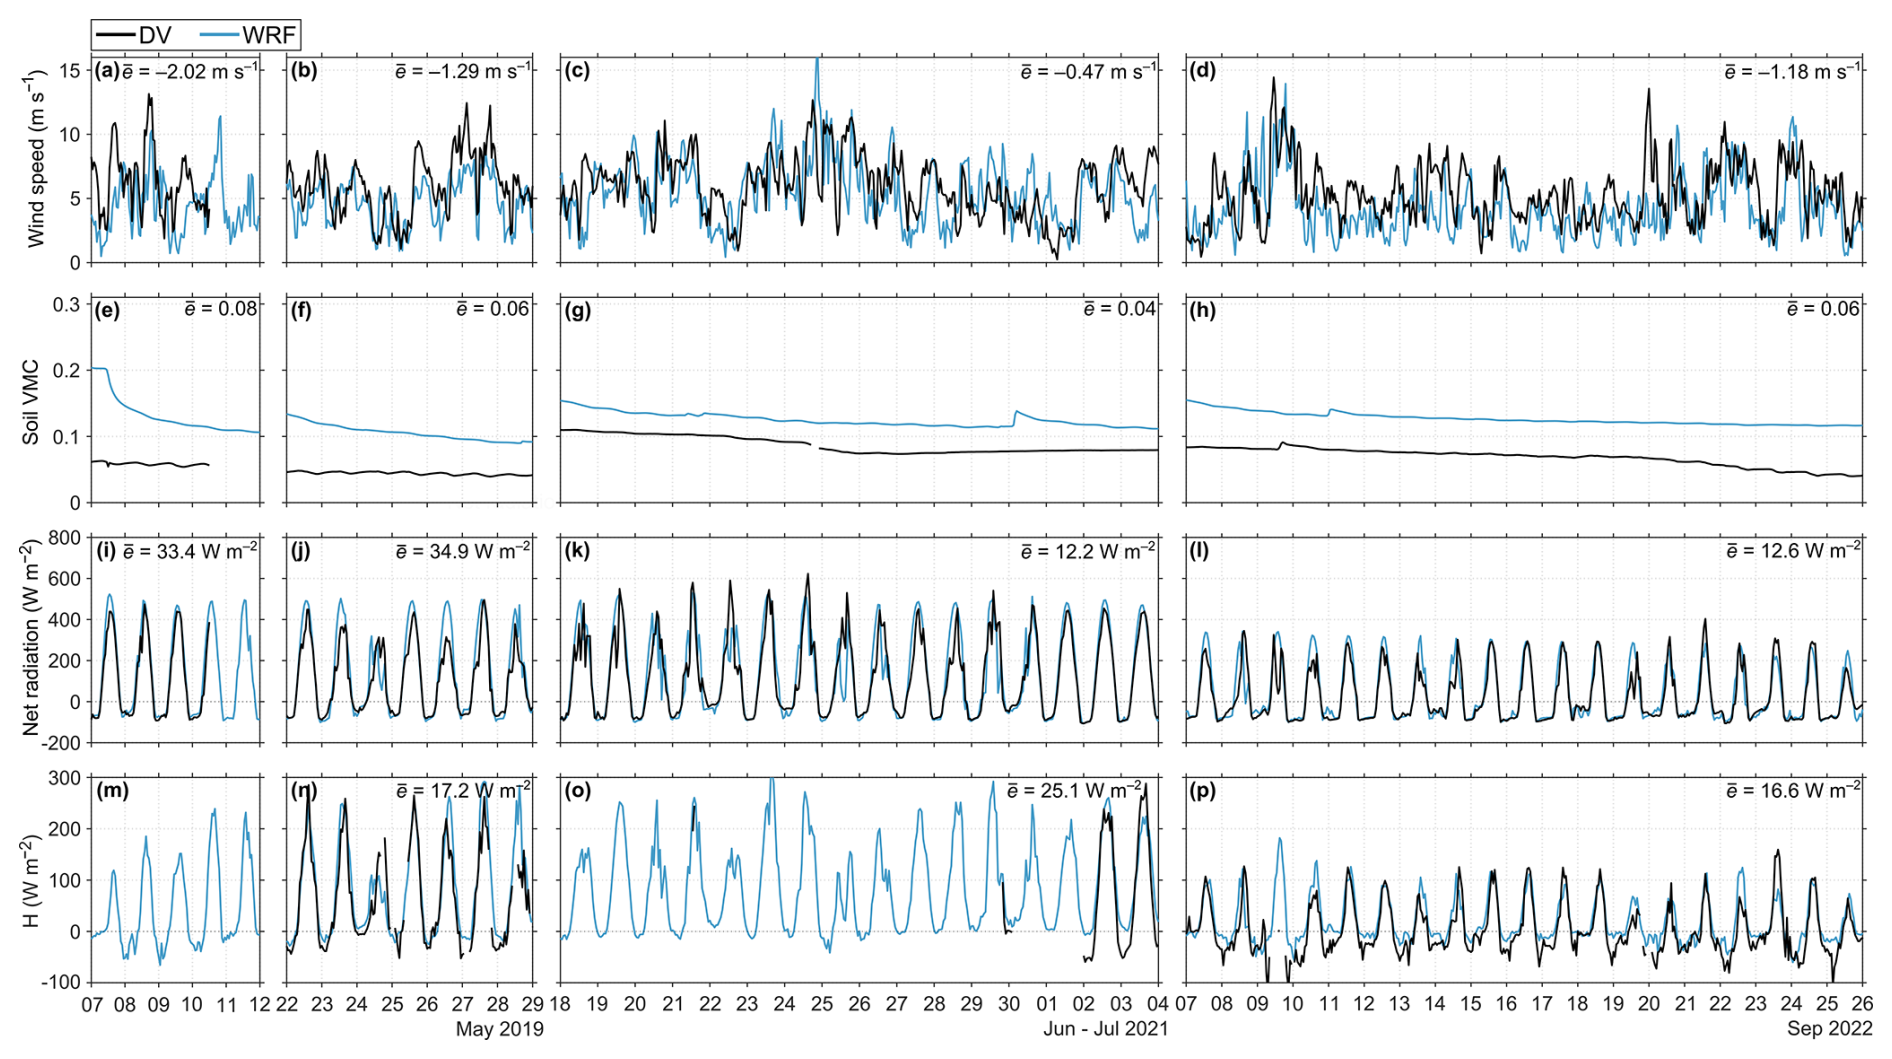
Figure 5Comparison of hourly mean observed vs. simulated meteorological variables at DV across all simulation periods for: (a–d) wind speed (4.5 m), (e–h) soil volumetric moisture content (VMC) at 10 cm (DV) vs. 0–10 cm (WRF), (i–l) net radiation and (m–p) sensible heat flux (H). Period-wise bias () for each variable is indicated. All results presented in local time (UTC −7).
An evaluation of diurnal wind speed distribution and bias in Fig. 6 indicated varying model skill to simulate surface winds between study periods and locations. Wind speed distributions for s02 (Fig. 6b, d, f) compared the best, with a mean bias of −0.03 and −0.19 m s−1 for MV and UV, respectively. Estimates at DV for s02 are underestimated (mean bias of −1.25 m s−1), a feature persisting across all simulations at this station (Fig. 6a–c). During s03 (Fig. 6c, e, g) poorer model performance is evident (mean bias of −1.58 to −1.86 m s−1), underestimating surface winds despite covering a period subject to intense synoptic forcing (see Supplement 6). Notable diurnal bias at MV and UV during s02 and s03 (Fig. 6i–n) suggests that model capacity to reproduce valley CBL dynamics may have underlain wind speed discrepancies and induced seasonal variability in model ability to capture surface forcing.
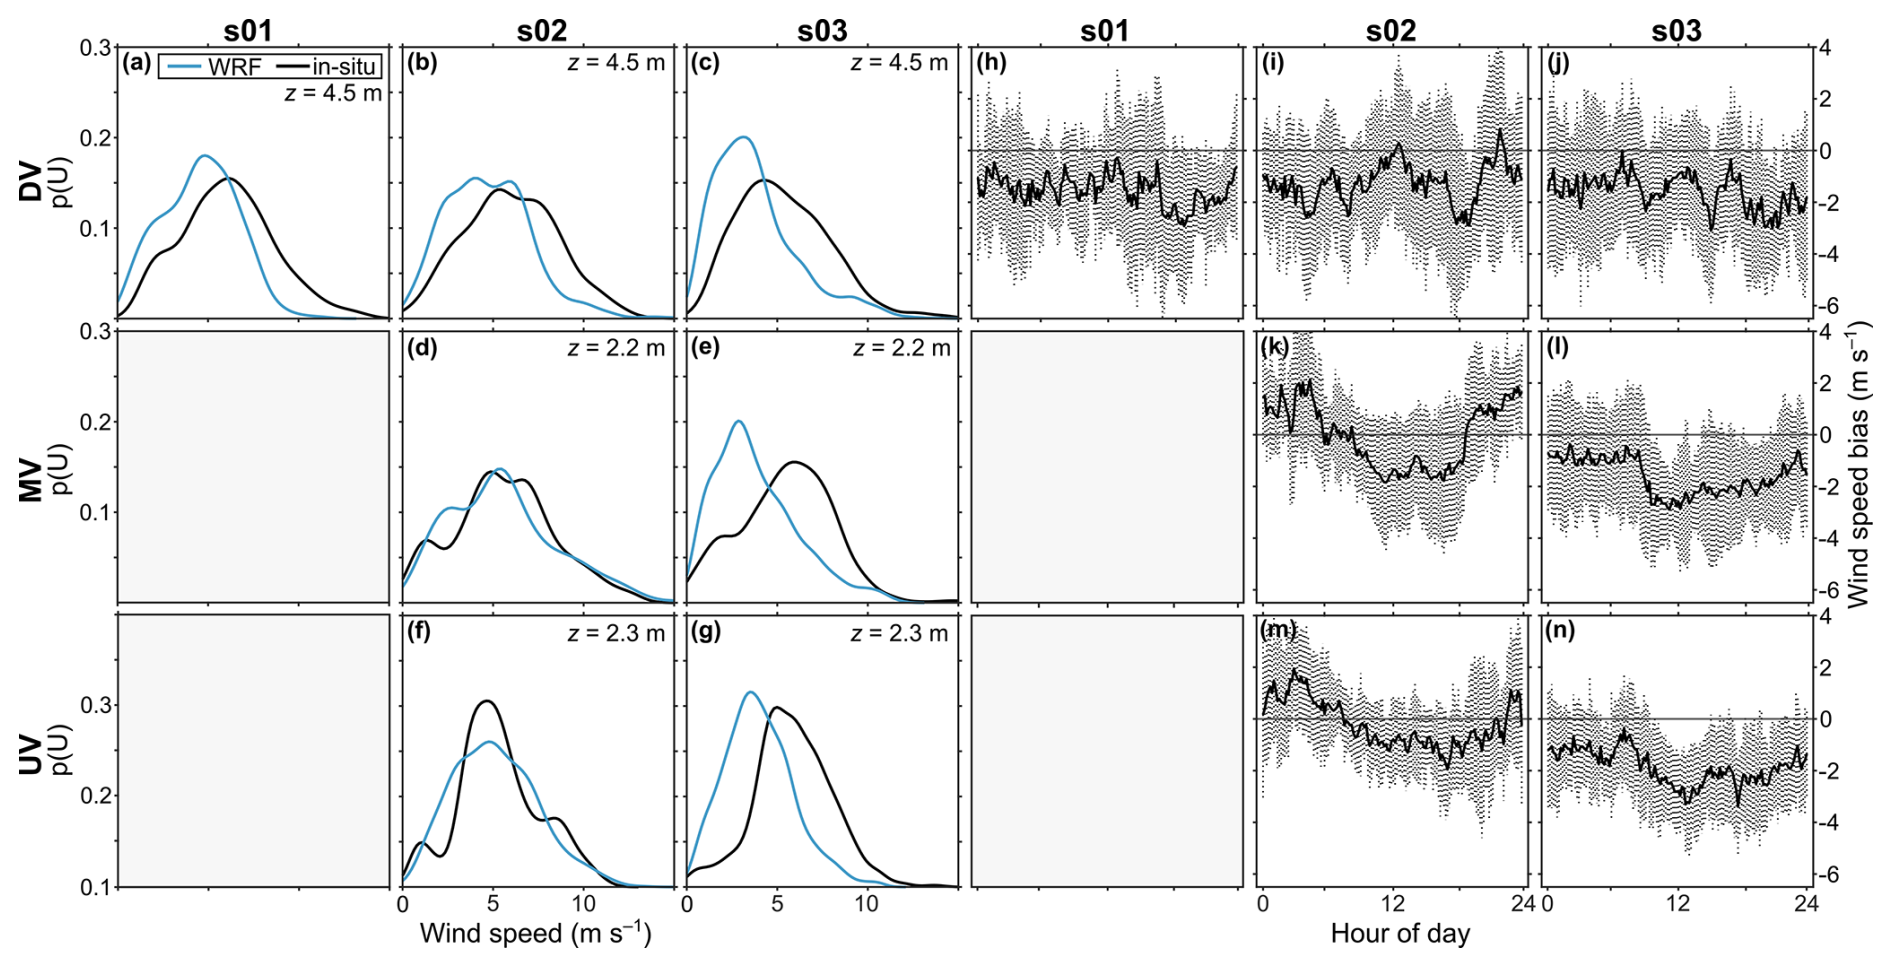
Figure 6(a–g) Observed and simulated wind speed distributions at respective sensor height (z) for each simulation periods (s01: 2019 – 12 d; s02: 2021 – 11 d; s03: 2022 – 19 d). The s02 comparison only compares records from 24 June 2021–3 July 2021 due to station data availability. (h–n) WRF wind speed bias vs. surface observations, shaded interval indicates 1σ.
3.1.2 Vertical dust fluxes on the A'ą̈y Chù delta
Friction velocity (u*) and the vertical dust flux (Fd) (0.25–9.81 µm) were evaluated against measurements at DV during s01 and s02, as presented in Fig. 7. The underestimation of simulated surface winds (previous section) is further apparent in the u* comparison, with a mean bias of −0.08 m s−1 at DV. Despite this, of 27 d of observed dust emission events on the A'ą̈y Chù delta during this period, all were simulated in WRF. Across both simulation periods, we measured a total vertical dust flux of 0.166 kg m−2 at DV, with a daily average of 5.9×10³ kg m−2 d−1, notwithstanding observational gaps. In contrast, the closest grid point to DV simulated a total vertical dust flux of kg m−2, approximately 4 % of that measured. In Fig. 7, simulated values of Fd at DV (soil class: sand) and Fd averaged over emissive grid cells of the delta (soil class: 56 % silt; 44 % sand) are illustrated separately to examine sediment texture sensitivity in the Shao (2004) scheme. Simulated Fd at DV was substantially underestimated (mean bias of −86 ) however fluxes averaged across the delta compare more favourably (mean bias of +26 ), notwithstanding u* discrepancies. Below we highlight the causes of emission flux variability across the delta and the main factors underlying discrepancies at the point-scale comparison.
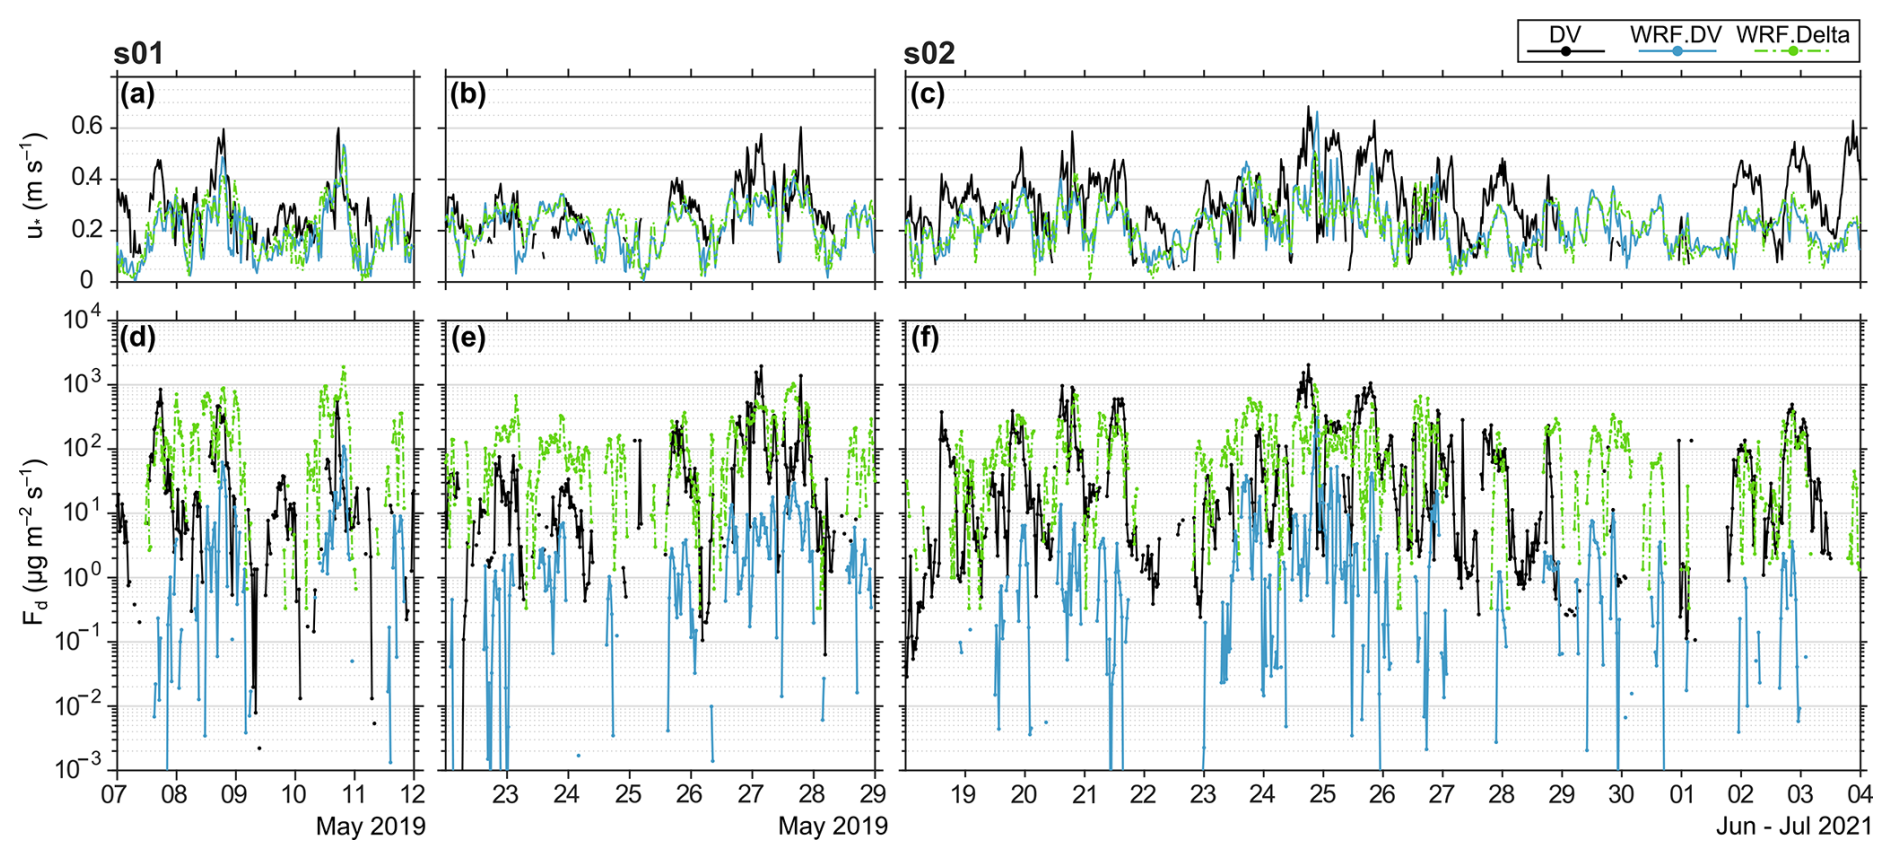
Figure 7Comparison of measured (DV) and WRF-simulated variables: at the DV grid point (WRF.DV) and averaged over emissive grid cells of the A'ą̈y Chù delta (WRF.Delta). (a–c) Friction velocity (u*). (d–f) Vertical dust flux(Fd) (0.25–9.81 µm).
The impact of soil moisture varied across the delta and influenced Fd substantially at low u*–u*t values. Sediment texture heterogeneity, combined with simulated θv overestimates (Fig. 5e–h) and the texture-dependent soil moisture corrections of Fécan et al. (1999), also yielded moisture-induced spatial discrepancies in u*t. Across all simulation periods (47 d) fine outwash deposits (sand) experienced moisture-induced heightening of u*t for 45 d, despite the modified soil moistures used in dust emission parameterisation (Fig. 2), while very fine deposits (silt) remained unaffected. For s01, with no rain and dry conditions, a soil moisture-induced u*t modification of +0 % to +40 % was effected at DV (average +11 %) under the modified emission scheme (Fig. 2), despite dry surface conditions being observed. Under this effect, u*t ranged from 0.21–0.29 m s−1. For very low values of u*–u*t (<0.1 m s−1) this can induce Fd reductions of 101–104 vs. dry soil u*t: the source of the extremely low values for the DV comparison in Fig. 7d–f. While minor precipitation events did occur during s02 on the 21, 22 and 30 June, we note an average soil moisture correction of +16 % was effected for the simulation duration.
For higher values of u*–u*t, sediment texture prescribed to the two-outwash classes present on the delta becomes the key control on variability, with differing sub-20 µm particle mass and variable dust production as a function of u*–u*t, following the aggregate disintegration scheme γ (Shao, 2001). Under ideal conditions at low u*–u*t, minimally-disturbed PSD definitions account for Fd discrepancies on the order of 101–102. For silt outwash, between minimally- and fully-disturbed PSDS, sub-20 µm particle mass only increase ∼30 % (Supplement Fig. S3), yielding limited influence on Fd as a function of u*–u*t. For sand outwash deposits as defined in this study (Table 4), sub-20 µm particle mass increased ∼1800 % for the same fixed u* range as defined by γ, with 95 % of the 9.75 % ≤20 µm mass aggregated as saltation-sized particles, only released in the fully-disturbed PSD. The spatial differences in emission across the delta narrow with increasing u*–u*t.
Concerning the grid point comparison at DV, the identified soil moisture adjustments to u*t are insufficient to account for persistent Fd underestimation during major dust events in high u* conditions. During the peak emission in s02 (24 June 2021 18:00), observations provide m s−1, Fd=2033 , while simulated u* at DV was 0.301 m s−1 with Fd=1.16 . A 1D implementation of S04 suggests bringing u* in-line with observations would increase Fd by ∼102, insufficient to match observations. The implemented κ=1, representing a relatively resistant soil to disaggregation (Shao et al., 2011b), may have been too low for these sand deposits and simulated saltation failed to release fine-grained materials as observed. However, field measurements of aggregate stability (κ) are limited and time-variant (Klose et al., 2019), challenging the implementation of soil-specific coefficients in modelling efforts. The impact of underestimated u* on simulated fluxes at DV is exacerbated by the aggregate disintegration efficacy in this scheme. Separately, we note that in applying stress partitioning correction for u*(r) instead of u*t (Fig. 2), the aggregate disintegration mechanism applied over an extended range of u*, for the very coarse and coarse outwash deposits subject to enhanced stress partitioning. Sediment textures were measured during 2022 (see Supplement 1), however with outwash deposits prone to rapid reworking by active sands and exposing finer sediment layers, fine sediment exposure may have been higher during 2019 and 2021 (Bellamy et al., 2026), and fine content may be underestimated in the average soil PSD.
3.1.3 Adjacent valley emissions
Having evaluated emission fluxes against point measurements at DV, we consider model skill in reproducing dust events from other valleys. In Fig. 8, we compare simulated emissions against a timelapse photography-derived log of dust emissions, providing a qualitative record of emission activity at the A'ą̈y Chù delta and the Alsek confluence (∼54 km away) during s03 (September 2022). This period is characterised by strong emissions early in the month (8–9 September), with a wetter mid-month period, followed by a recurrence of major emissions from 20 September onwards. Emissions within the A'ą̈y Chù were more frequent than at the Alsek confluence, with 16 vs. 9 individual events identified within the 19 d simulation period, respectively. During periods of observed dust activity at the A'ą̈y Chù delta and Alsek confluence, substantial (>100 µg m−3) dust concentrations were simulated for 31.3 and 14.7 h, respectively, corresponding to 47 % and 27 % of the periods. Conversely, the same dust concentration threshold was exceeded 48.5 and 24.0 h, at each respective location, without emissions being observed. This false positive simulated dust activity can be partially attributed to missing precipitation (e.g. evening of 9 September 2022). During s03, the Alsek confluence was more prone to precipitation, potentially inhibiting similar emission activity to that observed in the A'ą̈y Chù between 13 and 16 September 2022. This discrepancy between observed and simulated precipitation, and the subsequent influence on surface erodibility, was an anticipated limitation due to the complex terrain.
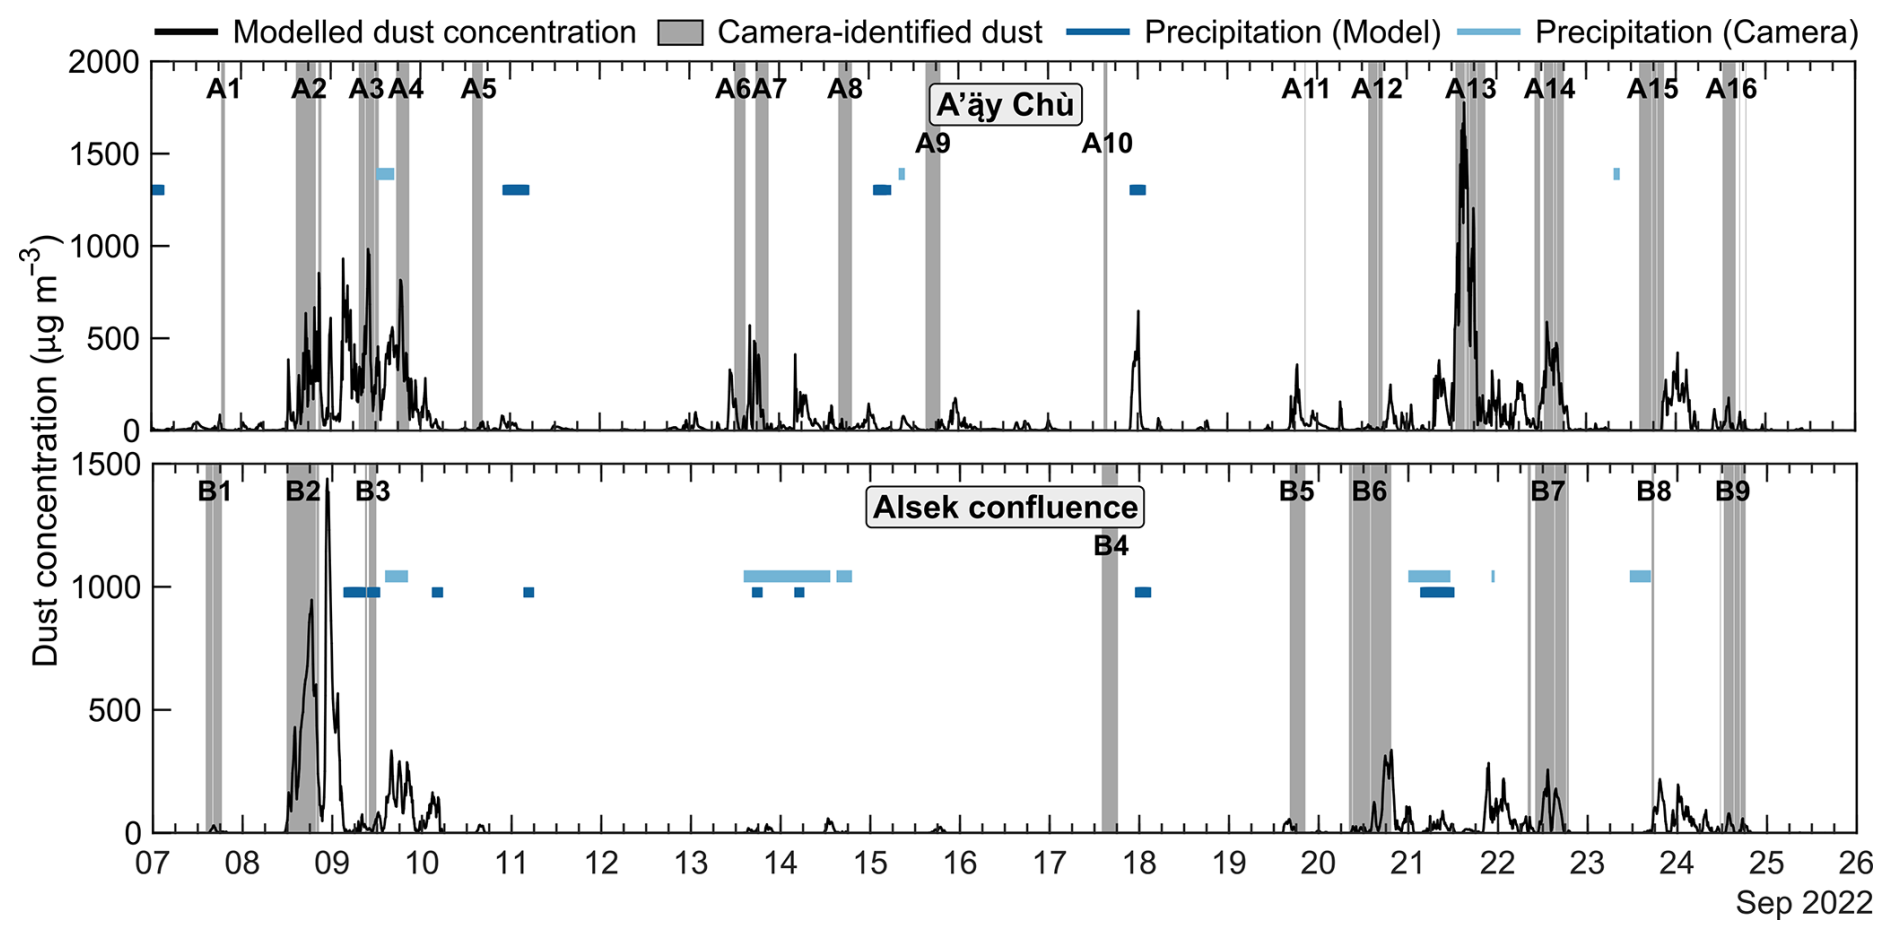
Figure 8Dust observations and precipitation record derived from 10 min photography from C1 (A'ą̈y Chù) and C2 (Alsek confluence) during s03. Simulated dust concentration at 50 m was averaged for the area of the Alsek confluence covered by the viewshed of C2 (60.561–60.670° N, 137.772–137.855° W), and for the A'ą̈y Chù delta covered by C1 viewshed (60.988–61.022° N, 138.446–138.553° W). Simulated precipitation index indicates precipitation ≥0.1 mm h−1 averaged over viewsheds.
3.1.4 Profile meteorology
To evaluate model skill in reproducing CBL behaviour and dust dispersion, a diurnal comparison of LiDAR retrievals and WRF near-surface profiles at KLRS is given in Fig. 9. LiDAR observations evidenced consistent south-westerly winds from the direction of the A'ą̈y Chù valley over KLRS in May 2019 (Fig. 9c), however in s01 near-surface south-easterly winds were a persistent feature (Fig. 9d). Upon inspection, simulated south-easterly winds appeared to be enhanced by a nighttime temperature contrast between the lake surface (13 °C) and immediately adjacent boreal forest with skin temperatures 4–5 °C lower. Lake temperature measurements from previous years (Crookshanks and Gilbert, 2008; McKnight et al., 2021) suggest simulated lake temperatures were overestimated for this time of year. This may pose a persistent challenge to reproducing surface meteorology in the lake vicinity and influence late-spring and early autumn dust emission periods, requiring modifications to the initialising datasets.
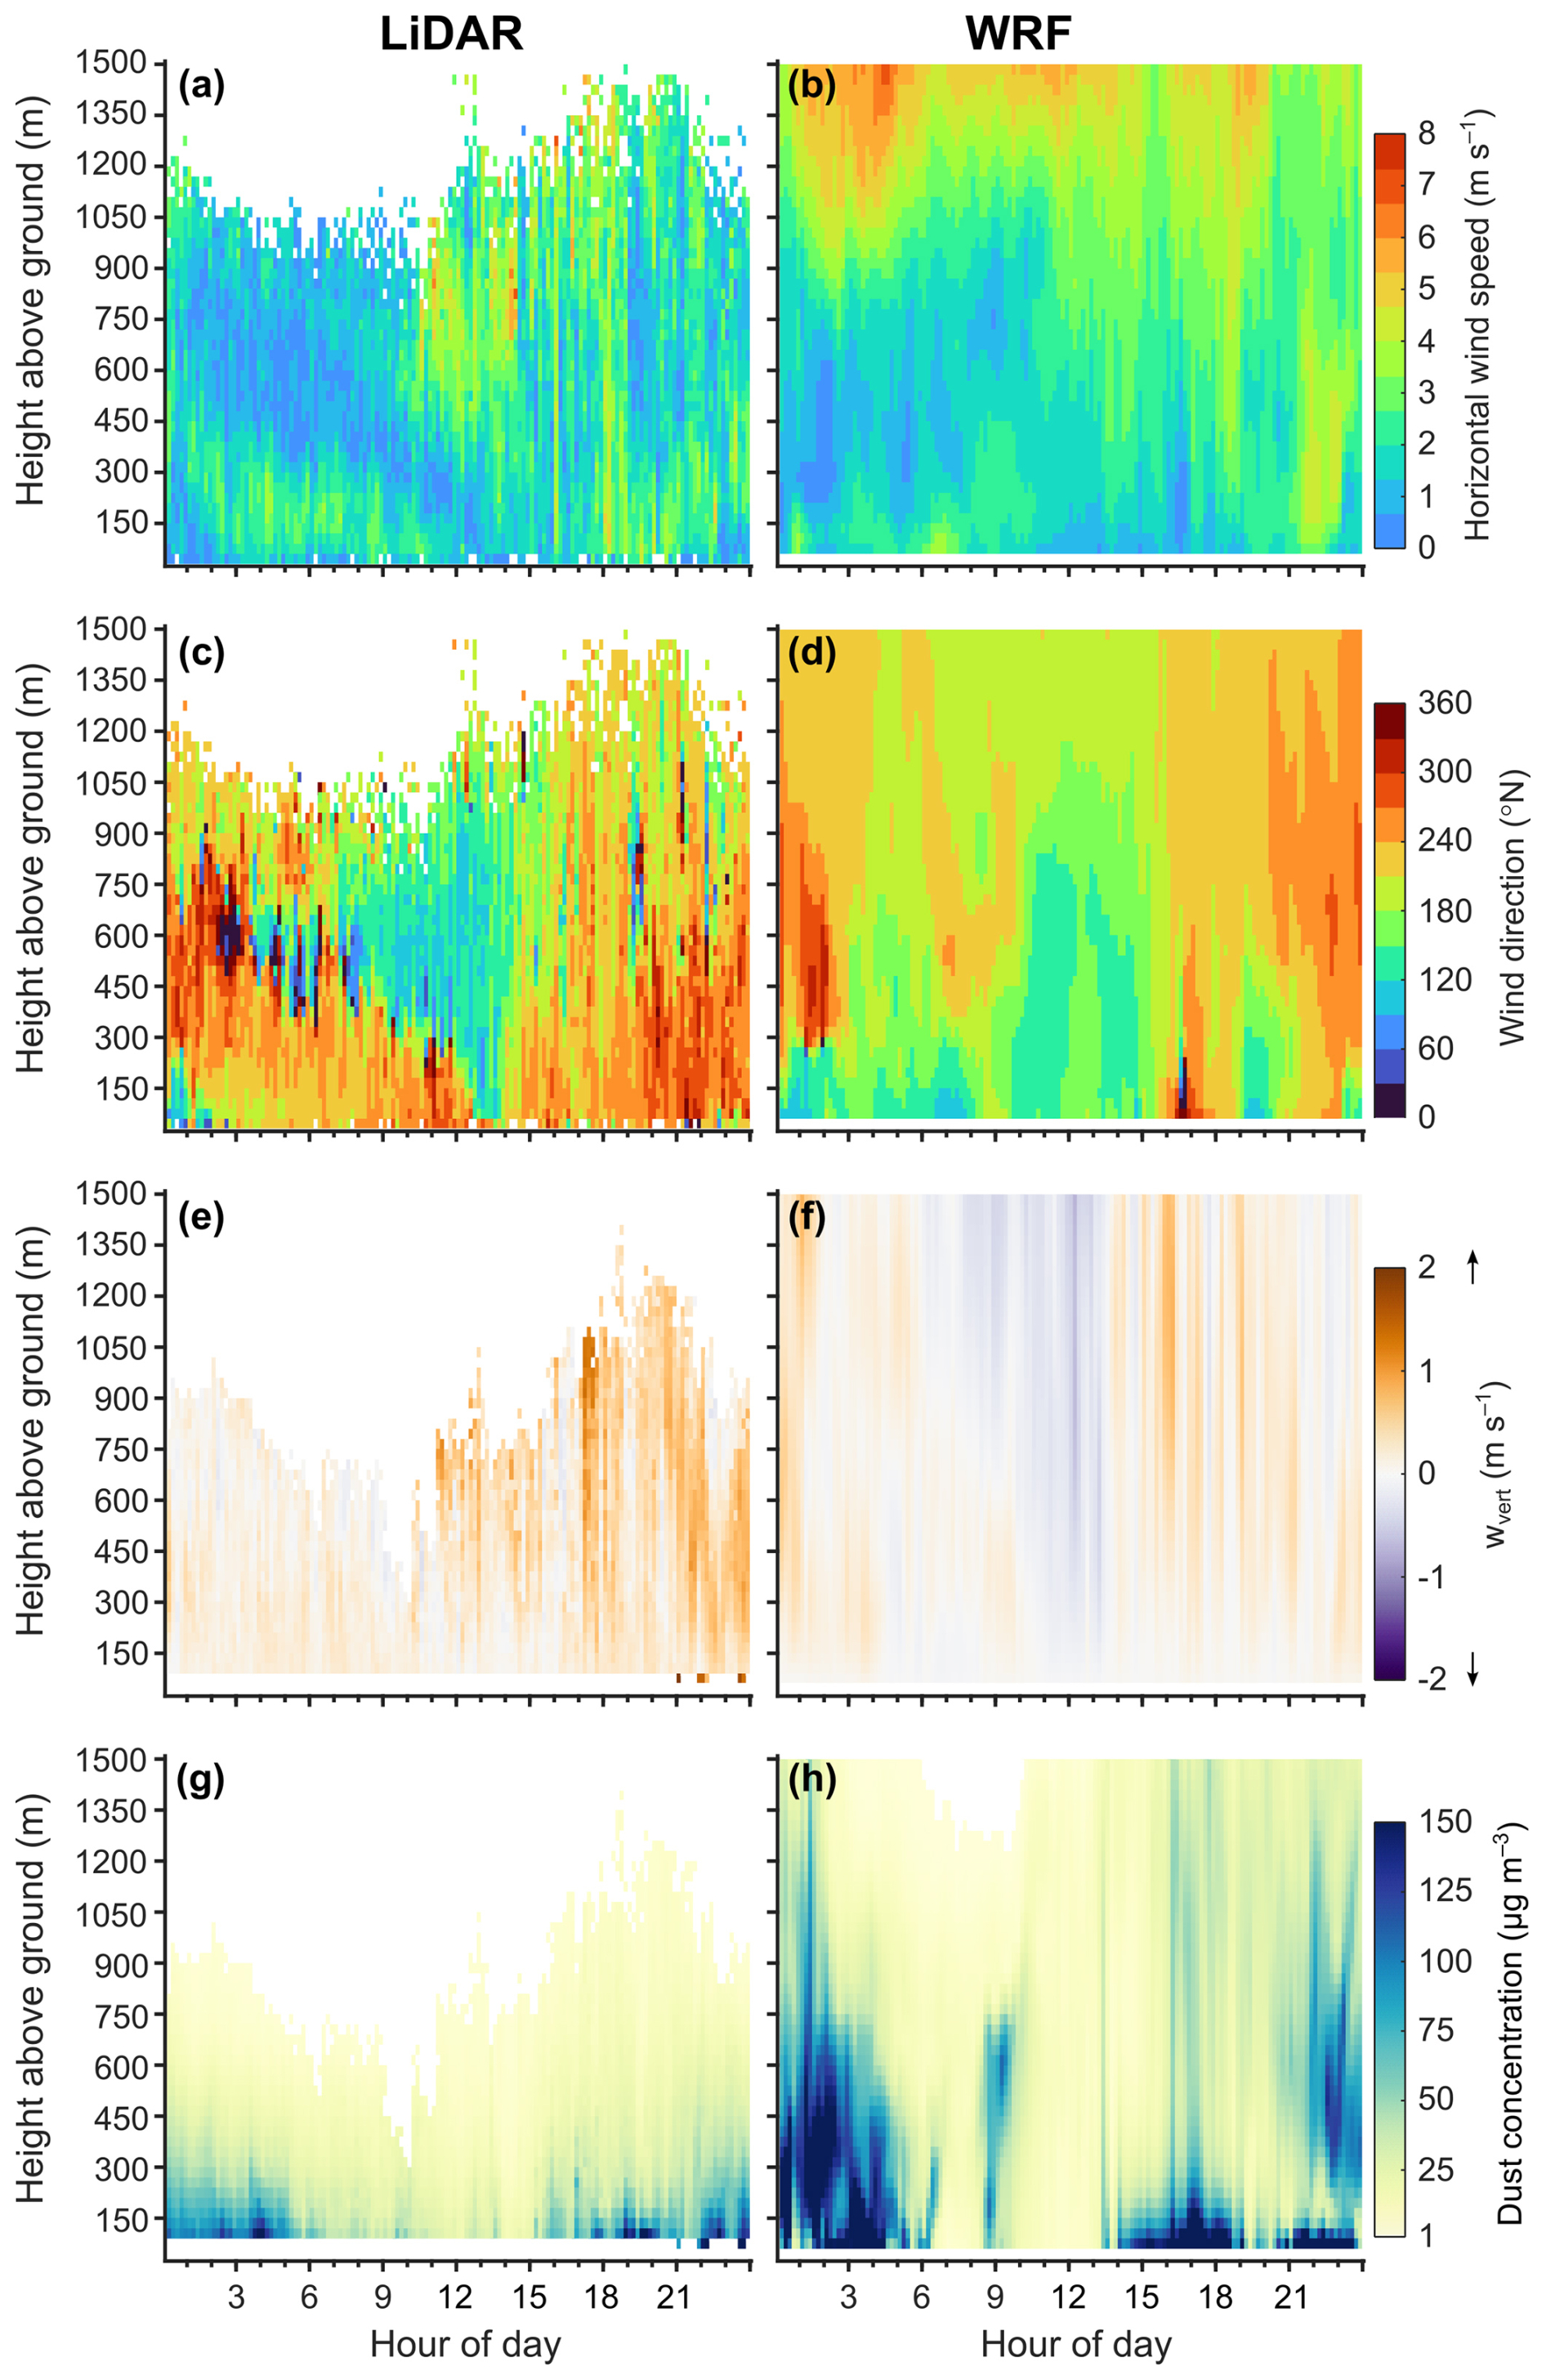
Figure 9Diurnal mean profiles from LiDAR and WRF output at KLRS during s01 (May 2019) for: (a–b) horizontal wind speed; (c–d) wind direction; (e–f) vertical velocity; (g–h) dust concentration.
Dust was simulated over KLRS throughout the diurnal cycle, through nighttime to the early morning at DV (Fig. 9h). While LiDAR-derived dust concentrations indicate that dust remains concentrated near the surface (≲500 m – Fig. 9g), simulated dust was dispersed beyond 1000 m, with the largest discrepancies occurring during the night (Fig. 9h). Despite this, average wvert values observed/simulated for the afternoon and night compare well. We note that the paucity of negative wvert in Fig. 9e is likely associated with limited aerosol content in these stable layers. A side-by-side comparison of observed vs. simulated dust concentration profiles is given in Fig. 10. While comparison on an hourly basis emphasised substantial model deviations, the timeseries in Fig. 10 suggests broader agreement in the timing of suspended dust over KLRS. The two records indicate that the simulated vertical dispersion of emissions was regularly overestimated at KLRS during s01. Overestimated lake surface water temperatures, as previously established, may have contributed to enhanced plume dispersal. Further reference to Fig. 5d–e suggests simulated elevated dust may have originated from emissions at the glacier terminus and upper-valley, being dispersed over Vulcan Mountain or advected down-valley. Further comparisons of LiDAR and WRF retrievals are included in the Supplement 5.
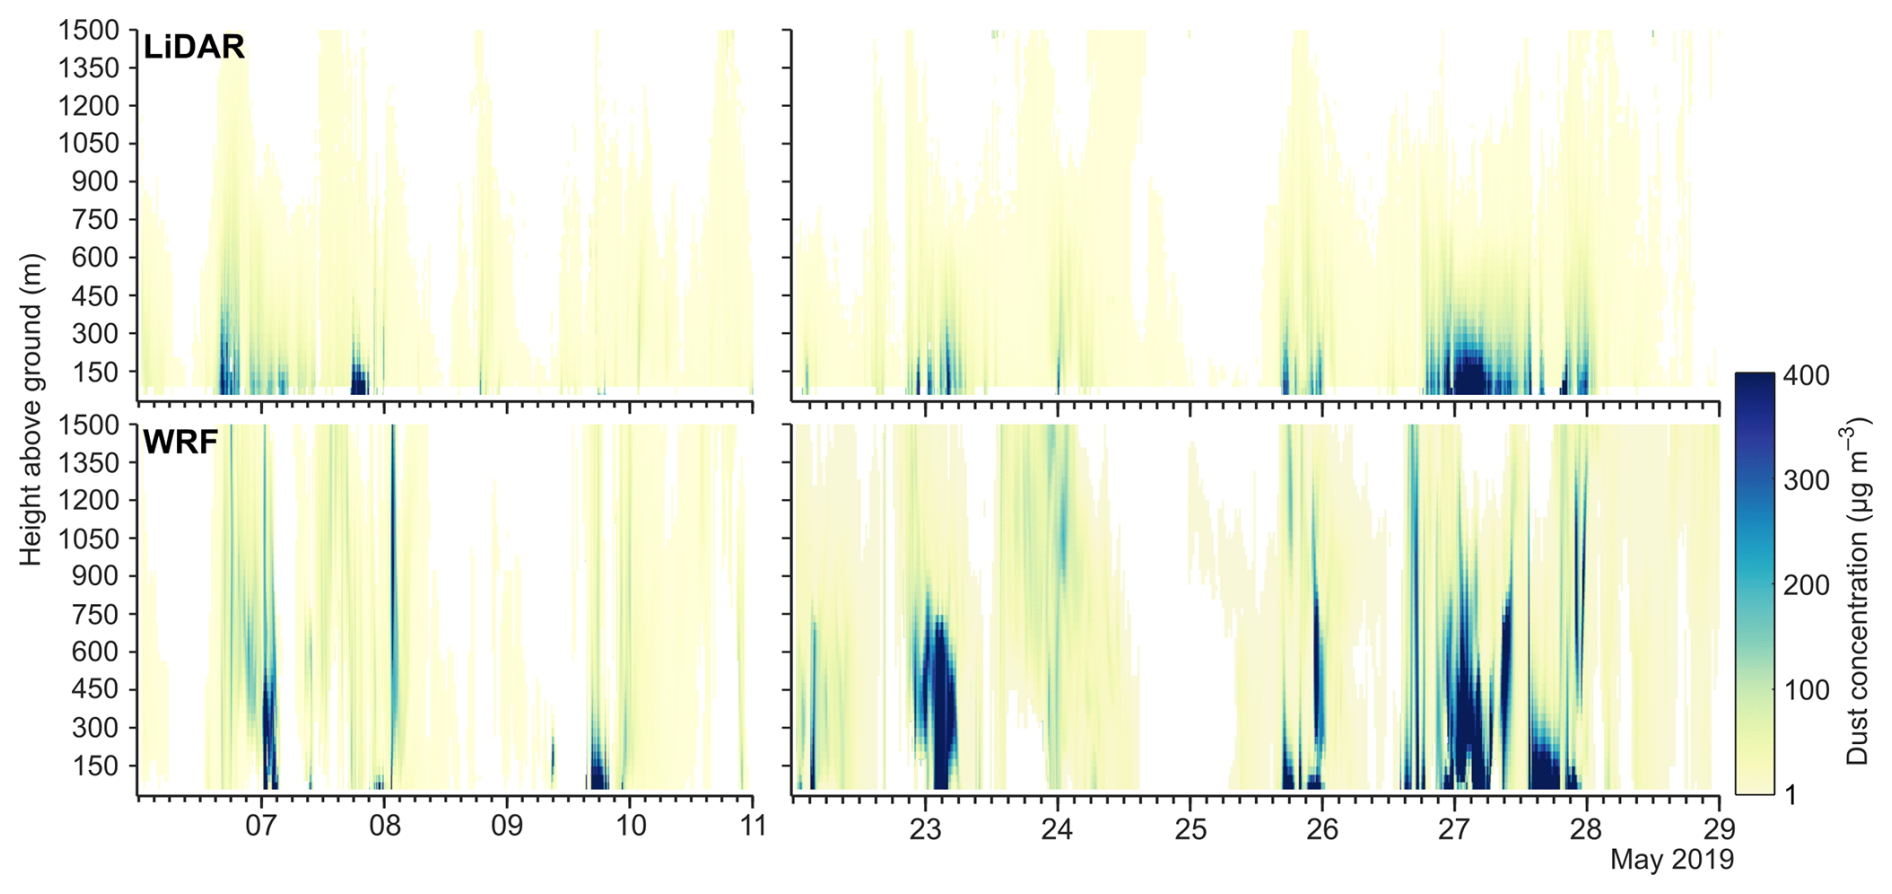
Figure 10LiDAR- and WRF-derived dust concentration profiles retrieved/simulated at KLRS during s01 (May 2019).
3.2 Model results
3.2.1 Emission maps
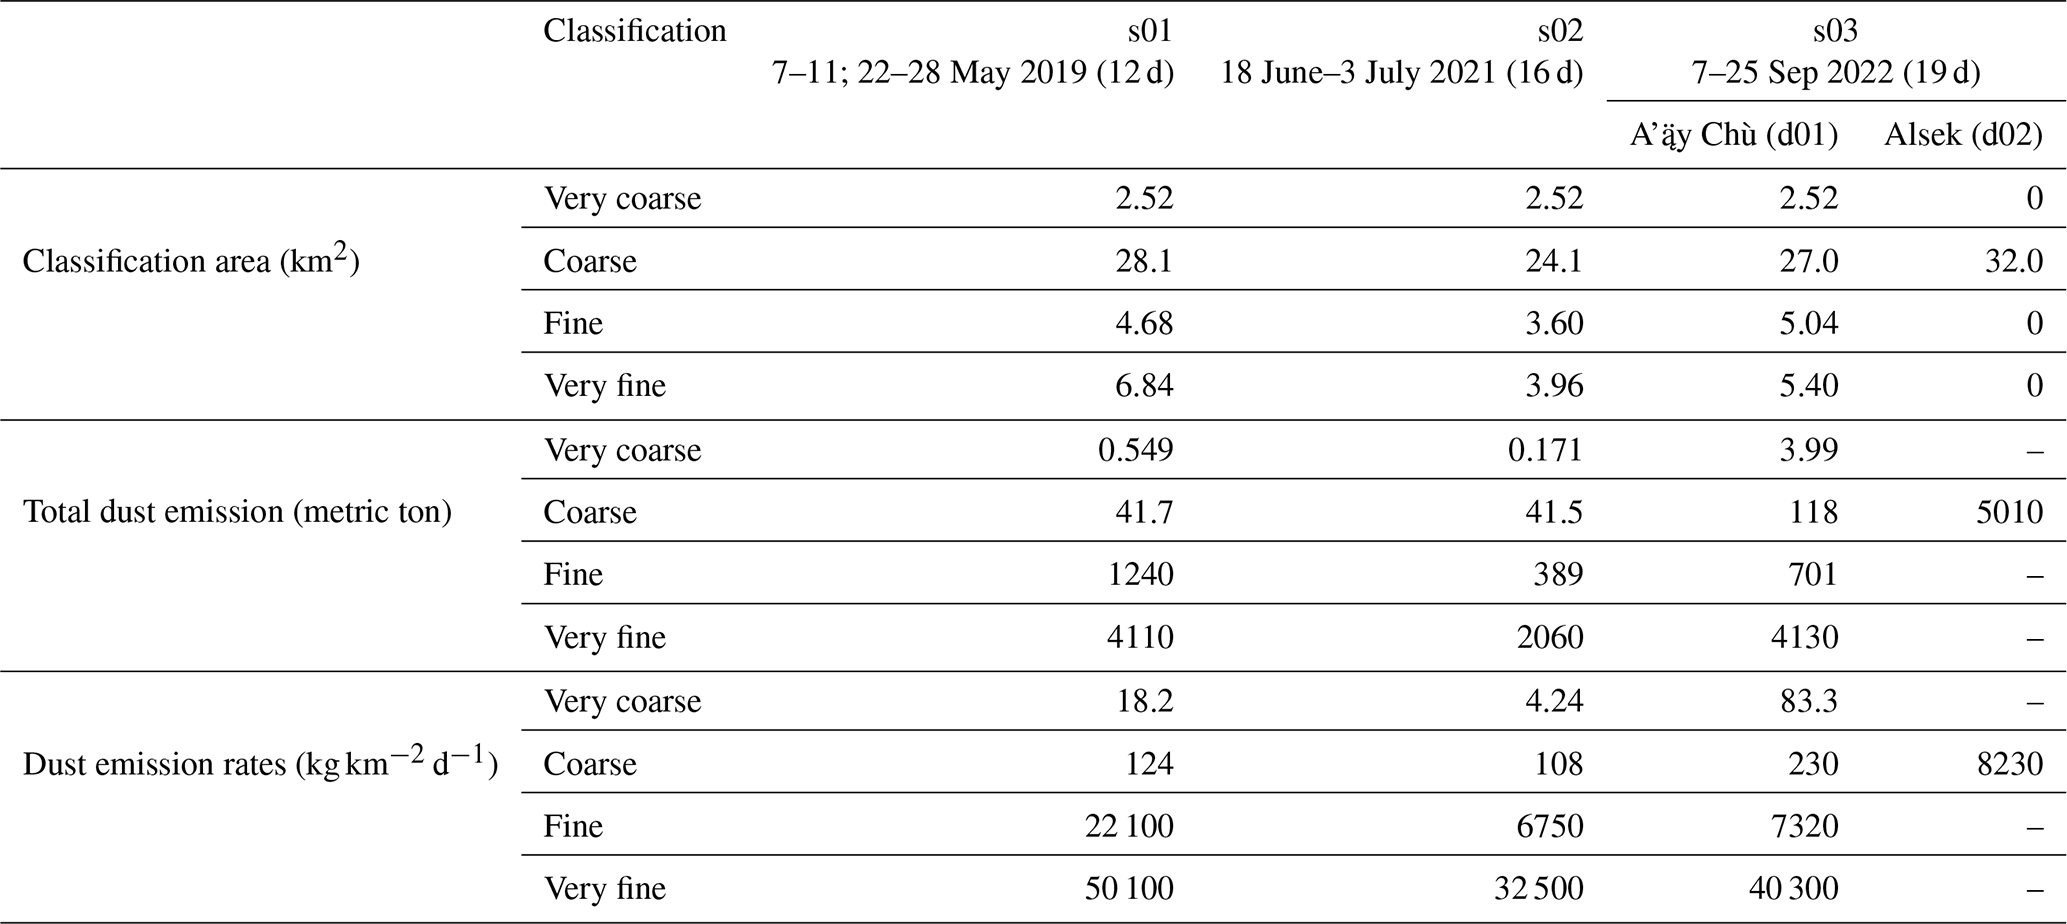
A summary of cumulative emissions and average dust concentrations for each simulation period is illustrated in Fig. 11. Total emissions by glaciofluvial deposit classification are summarised in Table 6. Emissions occurred across the four glaciofluvial classifications, moderated by gravel-induced shear stress partitioning for the coarser deposits (Fig. 2). Emissions from very fine deposits dominated total mass loading, accounting for 54 % of total emissions. The strongest dust emission source was the A'ą̈y Chù delta, consisting of fine and very fine deposits. Spatial discrepancies in Fd due to these deposits (i.e. sediment texture) were also evident. During simulation periods, emissions from the A'ą̈y Chù delta were predominantly carried northward by southeasterly winds in the Shakwak Trench, however some dispersion to the southeast was noted. Dust sources in the upper A'ą̈y Chù, the terminal moraine and the Kaskawulsh valley, and subsequent transport indicated by concentration plots demonstrates the potential for dust dispersal up adjoining tributaries and over the Kaskawulsh glacier, while strong emissions from fine deposits in the terminal moraine were carried over the peak of Vulcan Mountain (60.89° N, 138.46° W; ∼2.7 km a.s.l). Emissions from the terminal moraine peaked in s01, though, we are limited in our capacity to validate fluxes from these deposits. We highlight the extensive emissions simulated for coarse deposits (no other classes present) at the Alsek confluence and Dusty River valley during s03 (Fig. 11d), which due to rock-induced drag corrections applied, indicates marked erosivity. Emissions from the Alsek confluence were dispersed up-valley to the northeast, but more predominantly northward up Ferguson Creek (60.70° N, 137.89° W) or through the Dezadeash River valley (60.69° N, 137.77° W). In summary, a dust (0.2–20 µm) emission rate of 1.0×10⁴ kg km−2 d−1 was simulated for erodible surfaces across all simulation periods.
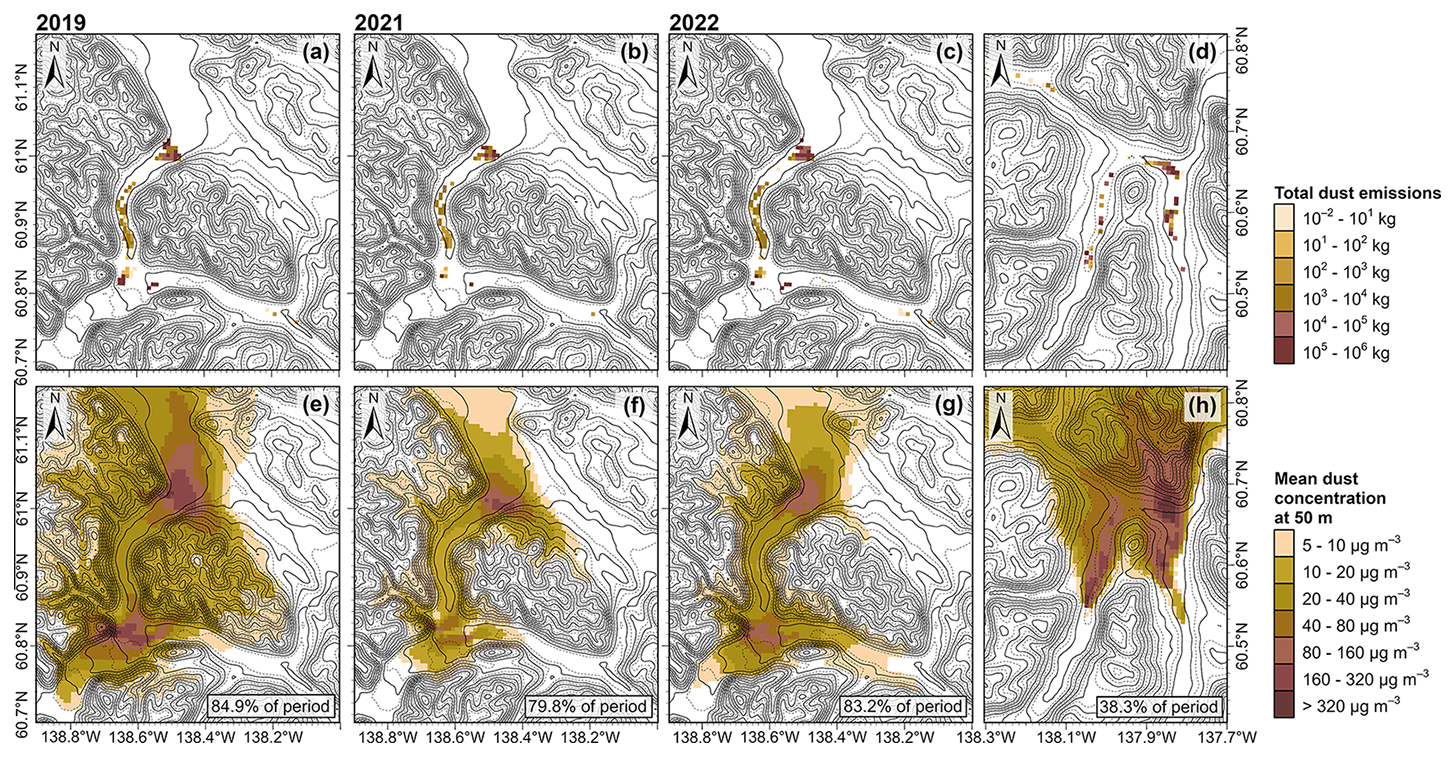
Figure 11(top row) Summed dust (0.2–20.0 µm) emissions (kg) from 0.6 km2 grid cells across simulation periods in d01 (a–c) and d02 (d). (bottom row) Mean dust concentration at 50 m during active emission periods (non-zero emissions anywhere within domain) in d01 (e–g) and d02 (h). Percentage of period with active emissions indicated in each figure. Contours kriged from model topography.
Table 6Summary of emission loading (3 s.f.) by land-use classification for simulations in d01 (s01–03) and d02 (s03). Dust emission rates are calculated for the total area of outwash deposit surfaces classified as erodible (Sect. 2.2.2) – simulation dependent.
3.2.2 Vertical dispersion
We explored simulated vertical dispersion in the A'ą̈y Chù valley, including the delta where vertical transport from a strong emission source immediately contends with convective dynamics over a large proglacial lake. Figure 12 presents cross-sections of model output averaged during periods of non-zero simulated dust emissions at DV. While vector averaged wind conditions suggest nondescript synoptic forcing on s01–s02, neither period was bereft of major synoptic forcing (see Supplement 5); average conditions indicate the heterogeneity of aloft conditions under which emissions at DV occur. During s01, emissions from the glacier terminus and upper valley dispersed well above ridge height (>1.5 km a.s.l). Dust remained at high altitudes through to the lower valley, where emissions climbed slowly during and after traversing the lake (Fig. 12e, h, k). Infrequent up-valley emissions from the delta also occurred (e.g. afternoon 24 May). During s02, dust was well-dispersed within the valley (Fig. 12g–h), however emissions primarily failed to traverse the lake, instead carried in variable directions along the Shakwak Trench (Fig. 11f). During s03, vertical dispersion within the valley (Fig. 12j) was strongly restricted relative to previous periods, despite occurring under intense synoptic forcing. Emissions from the upper-valley failed to advect down-valley, in contrast to s01–s02. Upon exiting the valley, vertical dispersion occurred steadily and substantial dust concentrations persisted to the edge of the Ruby Range (Fig. 12k – km 28) and beyond. Variability in the vertical dispersion of emitted dust between simulation periods is apparent. With s01–s03 situated within late spring, summer and early autumn of their respective years, we highlight these “seasonal” differences in emission trajectories between periods.
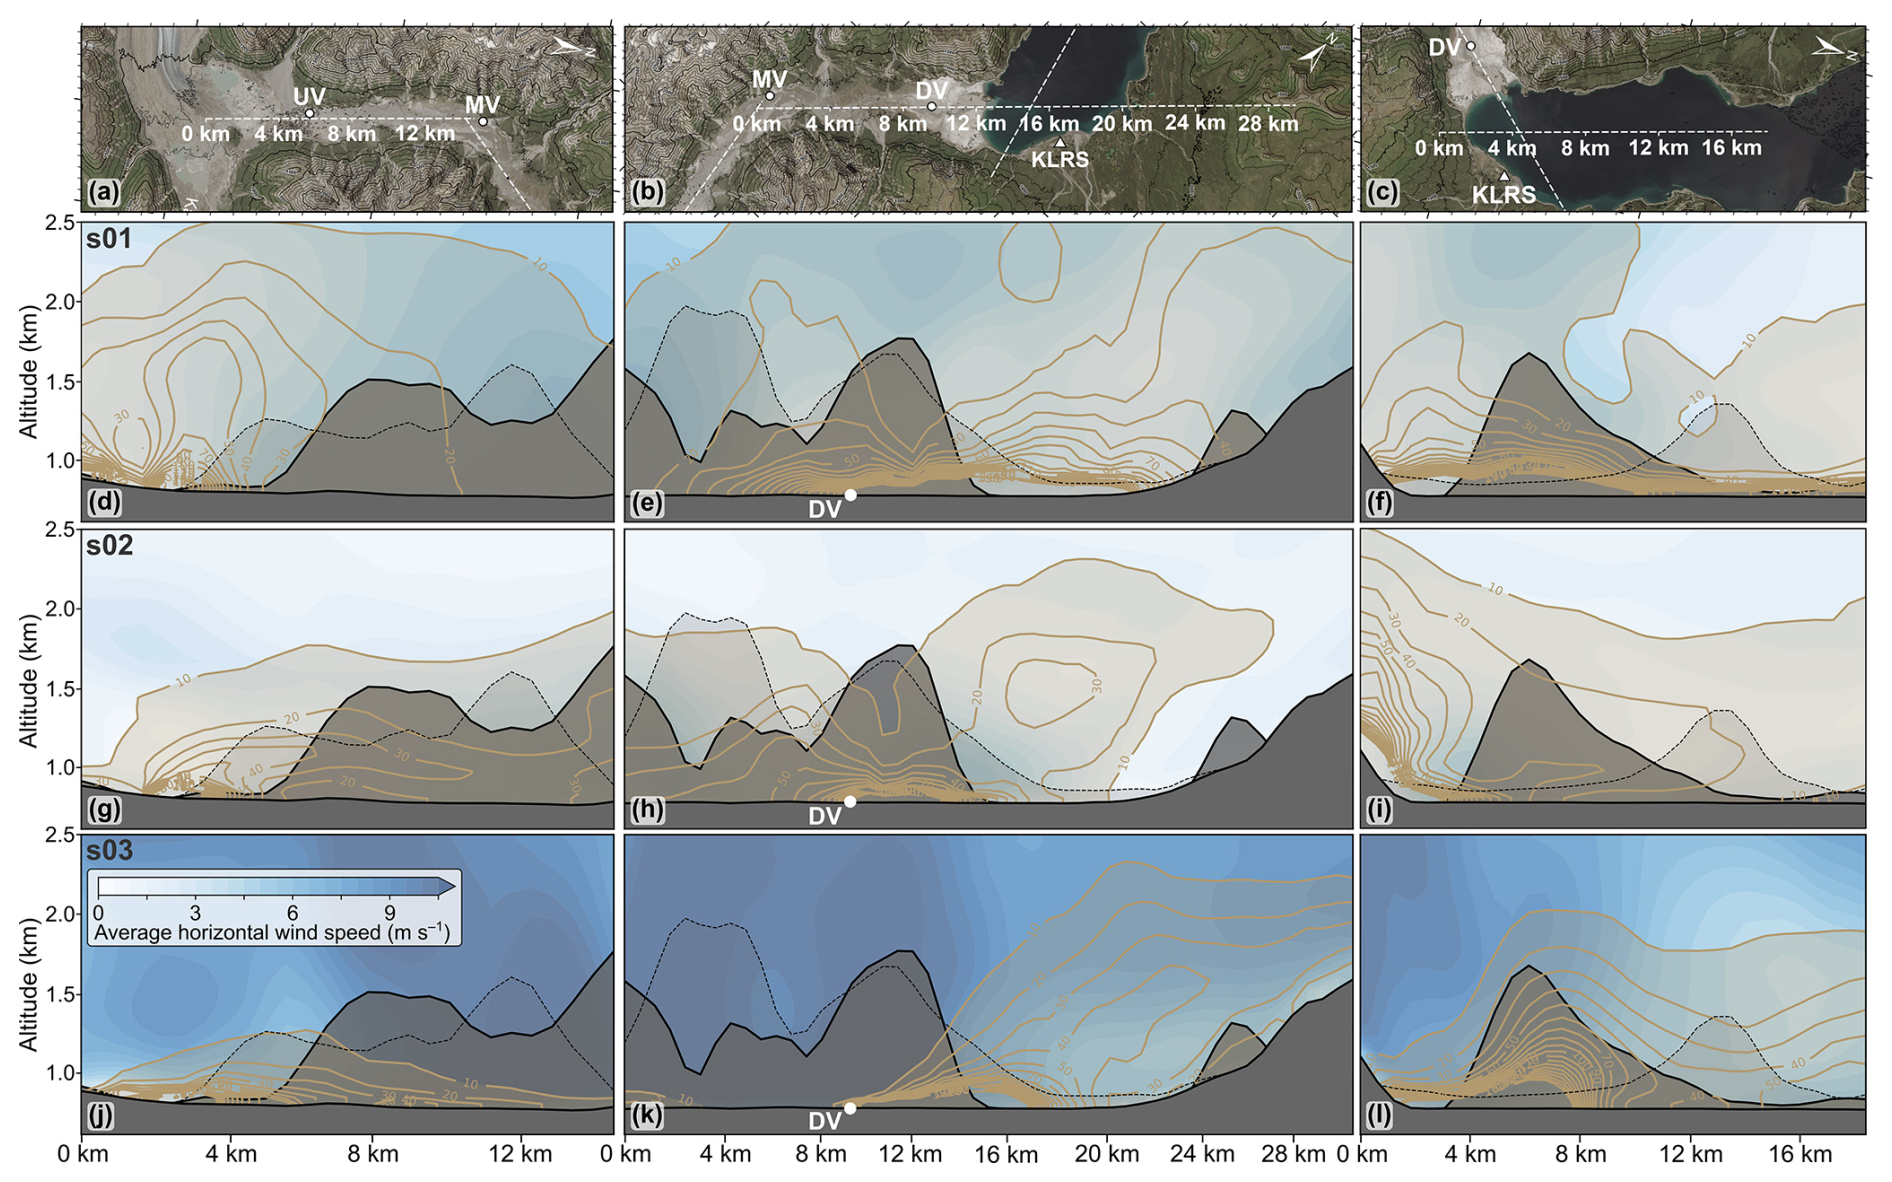
Figure 12Cross sections of average horizontal wind speed and dust concentrations for (d–f) s01, (g–i) s02 and (j–l) s03. Contours range from 10–200 µg m−3. Grey contouring indicates a parallel track of background valley sidewalls; (–) partial transparency indicates foreground topography (axis not to scale). Landsat 9 imagery (7 July 2023) courtesy of the U.S. Geological Survey.
The simulations detailed in the previous section targeted coinciding periods of high dust activity and observation availability to obtain regional dust emissions estimates while permitting an evaluation of model performance. In the following sections we discuss: (1) model estimate reliability considering evaluation results and model construction; (2) insights gained regarding investigating proglacial landscapes with modelling; (3) the potential to target other known high-latitude dust sources with this approach.
4.1 Model performance: how accurate are simulated emissions?
4.1.1 Total dust estimates
We assess the model emission estimates presented in Sect. 3.2 following model evaluation findings (Sect. 3.1). Surface winds were underestimated during s01 and s03 in the A'ą̈y Chù valley, reducing simulated emissions. At DV, an underestimated u* (Fig. 7) contributed to the notable underestimation of Fd from fine (sand) glaciofluvial deposits, however analysis in Sect. 3.1.2 indicates soil moisture overestimates prescribed sediment fine content at DV contribute to discrepancies. Eschewing spatial variability and comparing domain-wide averages, the average estimate of 1.0×10⁴ kg km−2 d−1 remains within an order of magnitude of the average vertical dust flux measured at DV during s01 and s02 of 5.9×10³ kg km−2 d−1. Substantial emissions were simulated from currently exposed proglacial lake deposits at the Kaskawulsh terminus (Fig. 11a–c) with dust transported up-glacier. Uncertainty remains in ascribing sediment characteristics to these lacustrine deposits, given their morphological complexity (Carrivick and Tweed, 2013). Sediment textures prescribed across the terminal moraine based on field observations likely do not capture full sediment heterogeneity in this geomorphologically-active proglacial environment, hence emission fluxes cannot be well validated. Nevertheless, we highlight the high erosivity simulated at these proximal dust sources. For emissions at the Alsek confluence we were limited to evaluating emission timing, however simulated emissions broadly aligned with available observations (Fig. 8), with discrepancies principally attributed to model precipitation and erodibility conditions.
4.1.2 Outwash deposit characterisation
The mandatory overhaul of land-surface descriptions required the prescription of representative aerodynamic roughness lengths and sediment textures to mapped outwash deposit classes (Table 4), two key variables controlling the spatial pattern and strength of emissions. For the classes defined in this work, gravel-induced roughness across classes reduced u* by a factor of 1–3.56 during emission parameterisation, while the assigned sediment textures had minimally-disturbed <20 µm particle counts of 0.9 %–48.2 %. Both ranges can induce order-of-magnitude changes in the simulated dust emission flux; however, this captures the heterogeneity of deposits within glaciofluvial system we attempted to resolve (Maizels 1993). Within the A'ą̈y Chù valley, surface characteristics were well constrained with field observations and sediment sampling. Larger uncertainty exists in ascribing sediment characteristics within the Kaskawulsh and Alsek River systems. Surficial geological mapping, where available, is dated (Rampton and Paradis, 1982) and precedes major seasonal inundation experienced since a 2016 hydrological reorganization (Shugar et al., 2017) that enhanced river levels and likely extended deposits of erodible fine sediments (Bellamy et al., 2025b). Considerable uncertainty subsequently remains in the characterisation of these surfaces and the final emission estimates presented. For studies modelling dust emissions from these active river systems, uncertainty in these prescribed surface properties is likely to remain persistent.
4.1.3 Transport processes and dispersion
Beyond emissions, aerosol dispersion within complex terrain and the altitude suspended dust can attain is an important crux in determining the residence time and fate of emitted particles (Baddock et al., 2017; Knippertz et al., 2009). Our evaluation of vertical dispersion was limited to a single location immediately adjacent to a large lake, however simulated vertical dispersion appears to be overestimated (Sect. 3.1.4). Clear discrepancies were seen in simulating surface winds (Fig. 6) and aerosol dispersion (Fig. 12) within the valley between simulation periods, allocated as seasonal variability. During s03, limited aerosol mixing occurred despite intense and suitably orientated synoptic forcing. Considering the underestimated surface winds, it is likely that vertical dispersion was underestimated due to shortcomings in resolving CBL dynamics within the valley. Future HLD studies of emissions in complex terrain should not omit consideration of the dynamics underlying vertical dispersion post-emission.
This work's model domains, focused on reproducing meteorological forcing and dust emissions at targeted dust sources at relatively low computational cost, were not extensive enough to fully evaluate emission trajectories and deposition. Nevertheless, we highlight extensive northward dispersion simulated from the A'ą̈y Chù delta and the potential for up-glacier dispersion from exposed proglacial lake deposits. Diurnal LiDAR comparison at KLRS (Fig. 9) suggested that simulations overestimated early morning and afternoon-evening vertical dispersion. However, even at low altitudes (Fig. 11), we highlight significant dispersion at least 15 km up-glacier and over 24 km along the Shakwak Trench to the model domain edge. A dispersion model could be quickly applied, benefitting from improved WRF meteorological fields, to interrogate wider transport pathways.
4.2 Lessons learned for initialising proglacial dust emission modelling
4.2.1 Land-use
A focus of this study was the production of detailed land-surface datasets from remote sensing products. Modifications detailed in Sect. 2.2.2 were necessary to simulate any emissions from these deposits, let alone resolving accurate surface characteristics. Within this, resolution improvements to vegetation cover input (LAI and FPAR) proved influential for the dust emission scheme given the narrow channel width (∼ 2–3 grid-cells), and the influence of vegetation cover within the shear stress partitioning scheme (e.g. 10 % vegetation cover yields a 65 % reduction to u*). Due to the binary source factor and riparian vegetation abounding channel deposits, specific care is required in setting spatial alignment and interpolation options for continuous and categorical land-surface datasets. Application of dynamic land-surface characteristics, for example dynamic retrievals of surface albedo (e.g. Seiler et al., 2021), should be considered. Given the propensity of proglacial lakes, variable water cover, or marine-adjacent positioning of deposits, one should ensure the accurate mapping of surface for appropriate treatment of atmospheric dynamics above water surfaces.
4.2.2 Surface characteristics
The principal challenge for proglacial dust modelling resides in attributing sediment textures in active glaciofluvial settings, with deposits exhibiting strong spatial heterogeneity as a function of sediment supply and hydrological processes, alongside temporal variance induced by migrating channels (Maizels, 1993; Marren, 2005). This challenge is not unique to this landscape; large spatial heterogeneity in aeolian activity as a function of landscape unit is a common feature across dust emission regions (Bullard et al., 2011; Zender et al., 2003), where despite widespread potential deflation surfaces, hotspots arguably contribute most critically to total emission loadings (Arnalds et al., 2016; Gillette, 1999; Prospero et al., 2002). The nature of braided channels means that within an area of coarse-grained river terraces (gravel bars), exposed ephemeral channels are primarily silt and much more susceptible to aeolian erosion. At this resolution, the model is unable to resolve these fine channels of high erodibility within a coarser landscape. Depending on river morphology, this issue may persist for larger proglacial sources also and may merit a novel sub-grid scale approach to erodibility in future efforts.
Performing simulations at a resolution where fluvial deposit heterogeneity can be explicitly resolved, a double drag partitioning approach was implemented to include gravel coverage on glaciofluvial deposits. This simple approach helped ensure more representative emissions from coarse deposits in the study region, however extensive mapping of glaciofluvial sediment textures would be required to develop a continuous gravel shear stress partitioning scheme. Remote sensing approaches to estimate surface roughness (Marticorena et al., 2004; Prigent et al., 2005, 2012) have been employed in global models (Darmenova et al., 2009; Klose et al., 2021; Laurent et al., 2006; Leung et al., 2023; Zhang et al., 2022), but remain inapplicable at this resolution of study. Resolving gravel-induced roughness in these valleys remains limited by observations of sufficient resolution to characterise gravel coverage (∼ cm scale) across fluvial deposits. The mechanical strength of surfaces as pertinent for aeolian processes remains largely unconstrained across modelling efforts, despite a variety of observation approaches being developed (e.g. Rice et al., 1997; Li et al., 2010). The selection of frequently reworked surfaces with Sb was implemented to counter uncertainty for surface crusting, fine sediment exhaustion and shortcomings in resolving sparse vegetation with an LAI approach. Despite this, surface crusting was not explicitly resolved in our model, and the erodibility of certain deposits was likely overestimated. The physically-explicit scheme of Shao (2004) offers versatility in simulating emissions from heterogeneous glaciofluvial deposits. However, further application remains restricted in the absence of advancements in mapping sediment texture across dynamic fluvial landscapes, and constraining soil parameter estimates (cy; P; γ) to explicitly treat soil aggregation state. Separately, we note that the application of schemes of enhanced physical representation for specific sources demands more detail in how model sediment PSDs have been evaluated and parameterized. For glacigenic deposits especially, enhanced fine fractions in soil class vs. model-prescribed soil PSDs may exist (e.g. glaciofluvial sands vs. beach sand).
4.2.3 Soil moisture
Soil moisture discrepancies were anticipated in this study; this approach endeavoured to represent well-drained glaciofluvial deposits from surfaces previously ascribed inaccurate sediment textures or masked as water in land-surface datasets. Results in Sect. 3.1.1 suggested a minimum of 24 h is required for soil moisture adjustment in simulations to realistic values under warm conditions, to be extended in periods of reduced insolation. Soil moisture contents may still fail to reach accurate values regardless of simulation length (Fig. 5), suggesting that LSM drainage characteristics do not permit obtaining accurate levels across short term (∼ weekly) simulations. Beyond surface meteorology, the impact on certain dust-emitting sediments was pronounced (Sect. 3.2.1). Accurately resolving soil moisture conditions is more critical for proglacial dust sources as glaciofluvial deposits can persist as viable emission sources under wet maritime climates (Crusius et al., 2011; Schroth et al., 2017). Sediment drainage and the wind-induced moisture loss critical for deposit erodibility (Crusius, 2021; Schroth et al., 2017) require accurate representation to appropriately treat deposit erodibility and simulate dust emissions. Furthermore, extended investigation of proglacial emissions must contend with time-variant snow cover during transitional seasons, ensuring the land-surface scheme appropriately accounts for snow melting in soil moisture conditions. Pre-simulation modification of initial soil moisture values across erodible surfaces may benefit future “case-study” efforts of simulating proglacial dust emissions.
4.3 Extending to other regions
4.3.1 Approach transferability
Model development and testing was performed with the overarching objective of applying this approach to adjacent proglacial landscapes, becoming a tool to estimate emission loading from these unstudied valleys. This study's application of WRF-Chem has been implemented and tested under arguably the most extreme topographic conditions, for glaciofluvial deposits constrained in narrow channels (0.1–3 km wide), bordered by sheer topography (1.3–1.7 km high). Adjacent dust-producing valleys across the St. Elias Mountains (Alsek, Donjek, Chitina) are all wider, and the Alaskan coastal delta sources are further removed from immediate topography (Crusius et al., 2011; Schroth et al., 2017). While the choice of 3 km HRRR-AK output to initialise and bound the model permitted lower computational costs during this work, the approach is equally implementable with more common reanalysis products such as 0.25° ERA5 (Hersbach et al., 2020) with a series of nested domains; the core of this study's approach lies in the surface modifications required to yield representative emissions from these glaciofluvial deposits. Initialising from coarser datasets may induce sensitivity to lateral boundary conditions (terrain smoothing/discontinuity), requiring additional boundary buffer distances or encompassing the entire region of complex topography so boundaries can be situated over smooth terrain (Warner et al., 1997).
The approach to constrain erodible surfaces to fluvially active deposits (Sb) is highly scalable to assess erodibility across the region. Currently employed with Landsat 5–8 imaging, retrieval timings permit reliable constraint of surface conditions approximately biweekly. The method identifies surfaces subject to regular ephemeral inundation but does not explicitly index long-term deposition features (e.g. proglacial lakes) that may be exposed following major hydrological reorganisation events (Clague and Shugar, 2023). However, currently exposed proglacial lake surfaces were still identified as erodible in this study. The method cannot capture diurnal variability in meltwater that will reduce erodibility diurnally during summer months, however we note that larger glacier systems (such as the Icefield Ranges) have a greater component of baseflow, and at high-latitudes – extended daylight hours – dampening diurnal variability (Marren, 2005).
4.3.2 Discerning missing regional emissions
Contemporary dust emissions have been identified in many Alaskan proglacial valleys by loess studies (Muhs et al., 2013, 2016) and in situ investigations (Barr et al., 2023; Crusius et al., 2011; Schroth et al., 2017), yet these regions continue to be excluded from current global estimates. Explicit calls to resolve these valleys in dust emission modelling efforts (Crusius, 2021; Crusius et al., 2024) have not yet been met. It is unlikely these sources can be explicitly resolved in global-scale approaches due to source spatial extent and the complexity of surface controls, however regional applications such as this work can be leveraged to estimate missing emission loading. While Crusius et al. (2024) suggests the principal obstacle for simulating dust emissions from this region is the lack of high-resolution meteorological data, such data is readily available at 3 km resolution (Dowell et al., 2022) and is likely suitable for simulating emissions from the wide coastal outwash plains. Instead, due to the heterogeneity of depositional facies, the lack of detailed sediment texture (and potentially surface drainage properties) may be key to ensuring representative emissions. The upcoming operational RRFS (Rapid Refresh Forecast System) (NOAA, 2026) is planning to provide hourly forecasts at 3 km resolution across CONUS-AK with a dust emission module based on the FENGSHA scheme (e.g. Zhang et al., 2022). With operational models at a resolution likely sufficient to reproduce meteorological forcing for the larger proglacial valleys and coastal dust sources, dust emissions may remain unresolved due to unrealistic soil texture, deposit roughness, and potentially soil moisture dynamics. Regardless of improvements to model resolution, simulating representative emissions from western Canada and Alaska remains foremost limited by appropriate land-surface treatments. Large potential exists to employ this approach for recently identified glacigenic dust emission from proglacial valleys of Svalbard (Di Mauro et al., 2023; Spolaor et al., 2021; Tobo et al., 2019) and Greenland (Bullard et al., 2023).
Sources across the Canadian Arctic are frequently identified in assessments of emission potential at high latitudes (Meinander et al., 2022) and identified as proximal sources in deposition studies (Zdanowicz et al., 1998). These areas are anticipated to be less operationally complex to simulate due to the less severe topography in contrast to the study site presented in this paper. Conversely, polythermal glacier systems of the Canadian Arctic (Copland et al., 2003) likely yield active fluvial deposits of limited extents (e.g. Pissart et al., 1977; Ranjbar et al., 2021) compared to warm-based glacier systems of coastal Yukon and Alaska, hence model spatial resolution may be challenged to resolve deposits. Due to poor availability of sediment data, these Canadian Arctic “hotspots” require further study before surface erodibility can be appropriately determined. Future application of this modelling approach endeavours to establish an annual dust loading estimate for the St. Elias Mountains, integrating a time-variant source function for a continuous run. Large potential exists to employ this approach for other proglacial dust sources situated within complex terrain (Kok et al., 2021b; Crusius et al., 2024).
A dust emission modelling approach covering four proglacial valleys of the St. Elias Mountains (Canada) was developed, resolving mineral dust emissions from this region for the first time. Three simulation periods were investigated in May 2019, June–July 2021 and September 2022, targeting major emission events in the A'ą̈y Chù, Kaskawulsh, Dusty and Alsek River valleys. Model evaluation against in situ meteorological observations, aerosol monitors and Doppler LiDAR retrievals permitted a holistic assessment of model capacity to simulate emission and transport processes within mountainous terrain. It is highly feasible to simulate dust emission timing and magnitude from topographically-confined proglacial valleys (channel width ∼ 1–2 km; sidewalls up to +1.7 km with 40 % slope) with appropriate care given to surface characteristics and model parameterisations. Depending on the complexity of the emission scheme employed, descriptions of sediment texture can be key to simulating emissions. The approach developed in this work offers an option to future research efforts to resolve these emissions, however they will continue to be challenged to better resolve surface heterogeneity across glaciofluvial deposits. With seasonal discrepancies in vertical dispersion in complex terrain, further work is necessary to ensure transport processes can be appropriately treated across CBL conditions to determine the fate of emitted material.
This work provides a first estimate of mineral dust emissions for several proglacial valleys in the region, contributing significantly to a rising need to appraise emission activity from high-latitude sources under global rapid cryosphere loss. Dust emission estimates for high-latitude sources remain exceedingly rare. The approach developed in this work is highly applicable to proglacial dust sources across northwest North America and beyond, currently unresolved by existing modelling efforts. Forthcoming work may extend this approach for annual dust emission estimates from this region and a comprehensive assessment of emission pathways, as pertinent for regional climate impacts.
Processed surface-based observational datasets (meteorological, timelapse photography, aerosol and LiDAR measurements) are publicly available in a repository (https://doi.org/10.5281/zenodo.18927429, Bellamy, 2026). Simulated dust variables (vertical dust flux, dust concentration at 50 m) from the four simulation periods are available in the same repository.
The supplement related to this article is available online at https://doi.org/10.5194/acp-26-12613-2026-supplement.
DB, MK, JK and DFN contributed to study conceptualisation and design. Data collection was performed by DB, JK, JB, PH, RW and SE. RW and SE contributed to LiDAR data processing. Data processing and analysis, model development, model simulations and model analysis was performed by DB. The initial manuscript was prepared by DB. All authors contributed to manuscript revisions.
The contact author has declared that none of the authors has any competing interests.
Publisher's note: Copernicus Publications remains neutral with regard to jurisdictional claims made in the text, published maps, institutional affiliations, or any other geographical representation in this paper. The authors bear the ultimate responsibility for providing appropriate place names. Views expressed in the text are those of the authors and do not necessarily reflect the views of the publisher.
This research was performed on the traditional territory of Kluane First Nation and the Champagne and Aishihik First Nations (Science and Explorers Permits 19-34S&E, 21-35S&E, 22-32S&E). We are grateful to Parks Canada for permission to deploy instrumentation in Kluane National Park and Reserve (Permits KLU-2019-31938; KLU-2021-38964). Modelling was performed on Narval (Compute Canada) (project number: deu-214-01). The authors thank P. Hayes, J. Bachelder, MP. Bastien-Thibault, B. Brault, É. Boutin, A. Downey, E. Thévenin, U. Richter, Y Tardif and A. Sayedain for fieldwork contributions over successive years. Additional thanks are given to S. Sayedain and N. O'Neill for helpful discussions regarding AERONET data. We thank two anonymous reviewers whose prompts improved this work. Lastly, broad thanks are due to the community of researchers that have contributed to the development of WRF and WRF-Chem.
This research was funded by the Canadian Mountain Network, a Network of the Centres of Excellence of Canada (PV143493-NCE), the Canada Foundation for Innovation (grant no. 365664), the Fonds de Recherche du Québec– Nature et Technologies to DB (B2X-318074), Mitacs Globalink (IT28141), NSERC Discovery Grant to JK (RGPIN-2016-05417). MK received funding from the Helmholtz Association's Initiative and Networking Fund (grant no. VH-NG-1533).
This paper was edited by Joshua Fu and reviewed by Chandru Dhandapani and one anonymous referee.
Ansmann, A., Mamouri, R.-E., Hofer, J., Baars, H., Althausen, D., and Abdullaev, S. F.: Dust mass, cloud condensation nuclei, and ice-nucleating particle profiling with polarization lidar: updated POLIPHON conversion factors from global AERONET analysis, Atmos. Meas. Tech., 12, 4849–4865, https://doi.org/10.5194/amt-12-4849-2019, 2019.
Arnalds, O., Dagsson-Waldhauserova, P., and Olafsson, H.: The Icelandic volcanic aeolian environment: Processes and impacts – A review, Aeolian Res., 176–195, https://doi.org/10.1016/j.aeolia.2016.01.004, 2016.
Aubinet, M., Vesala, T., and Papale, D.: Eddy covariance: a practical guide to measurement and data analysis, 1st ed., Springer, New York, 438 pp., https://doi.org/10.1007/978-94-007-2351-1, 2012.
Bachelder, J., Cadieux, M., Liu-Kang, C., Lambert, P., Filoche, A., Galhardi, J. A., Hadioui, M., Chaput, A., Bastien-Thibault, M. P., Wilkinson, K. J., King, J., and Hayes, P. L.: Chemical and microphysical properties of wind-blown dust near an actively retreating glacier in Yukon, Canada, Aerosol Sci. Tech., 54, 2–20, https://doi.org/10.1080/02786826.2019.1676394, 2019.
Baddock, M., Hall, A., Rideout, J., Bryant, R., Bullard, J., and Gassó, S.: Satellite observations of Arctic blowing dust events >82° N, Weather, 99, 61–66, https://doi.org/10.1002/wea.7617, 2024.
Baddock, M. C., Mockford, T., Bullard, J. E., and Thorsteinsson, T.: Pathways of high-latitude dust in the North Atlantic, Earth Planet. Sci. Lett., https://doi.org/10.1016/j.epsl.2016.11.034, 2017.
Barr, S. L., Wyld, B., McQuaid, J. B., Neely, R. R., and Murray, B. J.: Southern Alaska as a source of atmospheric mineral dust and ice-nucleating particles, Sci. Adv., 9, 1–12, https://doi.org/10.1126/sciadv.adg3708, 2023.
Bellamy, D.: Meteorological and aerosol data used to evaluate a regional dust emission model in Yukon, Canada, Zenodo [data set], https://doi.org/10.5281/zenodo.18927429, 2026.
Bellamy, D., Nadeau, D. F., and King, J.: Forcing mechanisms of strong surface winds in a dust storm-prone, high latitude proglacial valley, J. Appl. Meteorol. Climatol., 64, 77–97, https://doi.org/10.1175/JAMC-D-24-0044.1, 2025a.
Bellamy, D., King, J., and Nadeau, D. F.: Mineral dust emissions from proglacial valleys of western Canada: historical and future dynamics, Earth Surf. Process. Landf., 50, 1–18, https://doi.org/10.1002/esp.70069, 2025b.
Bellamy, D., King, J., and Nadeau, D. F.: Measuring and parameterising mineral dust emissions from a proglacial valley in western Canada, Zenodo [preprint], https://doi.org/10.5281/zenodo.18928065, 2026.
Bennett, M. R., Huddart, D., and Thomas, G. S. P.: Facies architecture within a regional glaciolacustrine basin: Copper River, Alaska, Quat. Sci. Rev., 21, 2237–2279, https://doi.org/10.1016/S0277-3791(02)00027-6, 2002.
Bettis, E. A., Muhs, D. R., Roberts, H. M., and Wintle, A. G.: Last Glacial loess in the conterminous USA, Quat. Sci. Rev., 22, 1907–1946, https://doi.org/10.1016/S0277-3791(03)00169-0, 2003.
Black, R. F.: Eolian Deposits of Alaska, Arctic, 4, 89–111, 1951.
Blaylock, B. K.: Herbie: Retrieve Numerical Weather Prediction Model Data (Version 2022.9.0), Zenodo [code], https://doi.org/10.5281/zenodo.4567540, 2022.
Bonan, G.: Climate Change and Terrestrial Ecosystem Modeling, Cambridge University Press, Cambridge, https://doi.org/10.1017/9781107339217, 2019.
Bullard, J. E.: Contemporary glacigenic inputs to the dust cycle, Earth Surf. Process. Landf., 38, 71–89, https://doi.org/10.1002/esp.3315, 2013.
Bullard, J. E., Harrison, S. P., Baddock, M. C., Drake, N., Gill, T. E., McTainsh, G., and Sun, Y.: Preferential dust sources: A geomorphological classification designed for use in global dust-cycle models, J. Geophys. Res. Earth Surf., 116, https://doi.org/10.1029/2011JF002061, 2011.
Bullard, J. E., Matthew, B., Tom, B., John, C., Eleanor, D., Diego, G., Santiago, G., Gudrun, G., Richard, H., Robert, M., Cheryl, M.-N., Tom, M., Helena, S., and Thorsteinsson, T.: High-latitude dust in the Earth system, Rev. Geophys., 54, 447–485, https://doi.org/10.1002/2016RG000518, 2016.
Bullard, J. E., Prater, C., Baddock, M. C., and Anderson, N. J.: Diurnal and seasonal source-proximal dust concentrations in complex terrain, West Greenland, Earth Surf. Process. Landf., 48, 2808–2827, https://doi.org/10.1002/esp.5661, 2023.
Carrivick, J. L. and Tweed, F. S.: Proglacial Lakes: Character, behaviour and geological importance, Quat. Sci. Rev., 78, 34–52, https://doi.org/10.1016/j.quascirev.2013.07.028, 2013.
Choobari, O. A., Zawar-Reza, P., and Sturman, A.: The global distribution of mineral dust and its impacts on the climate system: A review, Atmos. Res., 138, 152–165, https://doi.org/10.1016/j.atmosres.2013.11.007, 2014.
Chow, F. K., Schär, C., Ban, N., Lundquist, K. A., Schlemmer, L., and Shi, X.: Crossing multiple gray zones in the transition from mesoscale to microscale simulation over complex terrain, Atmosphere-Basel, 10, https://doi.org/10.3390/atmos10050274, 2019.
Clague, J. J. and Shugar, D. H.: Impacts of Loss of Cryosphere in the High Mountains of Northwest North America, Quaternary, 6, https://doi.org/10.3390/quat6010001, 2023.
Clarke, A. D. and Noone, K. J.: Soot in the arctic snowpack: a cause for perturbations in radiative transfer, Atmos. Environ., 41, 64–72, https://doi.org/10.1016/j.atmosenv.2007.10.059, 2007.
Copland, L., Sharp, M. J., and Dowdeswell, J. A.: The distribution and flow characteristics of surge-type glaciers in the Canadian High Arctic, Ann. Glaciol., 36, 73–81, https://doi.org/10.3189/172756403781816301, 2003.
Creamean, J. M., Suski, K. J., Rosenfeld, D., Cazorla, A., DeMott, P. J., Sullivan, R. C., White, A. B., Ralph, F. M., Minnis, P., Comstock, J. M., Tomlinson, J. M., and Prather, K. A.: Dust and Biological Aerosols from the Sahara and Asia Influence Precipitation in the Western U.S., Science, 339, 1572–1578, https://doi.org/10.1126/science.1227279, 2013.
Crookshanks, S. and Gilbert, R.: Continuous, diurnally fluctuating turbidity currents in Kluane Lake, Yukon Territory, Can. J. Earth Sci., 45, 1123–1138, https://doi.org/10.1139/E08-058, 2008.
Crusius, J.: Dissolved Fe Supply to the Central Gulf of Alaska Is Inferred to Be Derived From Alaskan Glacial Dust That Is Not Resolved by Dust Transport Models, J. Geophys. Res. Biogeosci., 126, 1–13, https://doi.org/10.1029/2021JG006323, 2021.
Crusius, J., Schroth, A. W., Gassó, S., Moy, C. M., Levy, R. C., and Gatica, M.: Glacial flour dust storms in the Gulf of Alaska: Hydrologic and meteorological controls and their importance as a source of bioavailable iron, Geophys. Res. Lett., 38, 1–5, https://doi.org/10.1029/2010GL046573, 2011.
Crusius, J., Lao, C. A., Holmes, T. M., and Murray, J. W.: Alaskan Glacial Dust Is an Important Iron Source to Surface Waters of the Gulf of Alaska, Geophys. Res. Lett., 51, https://doi.org/10.1029/2023GL106778, 2024.
Daniels, M. H., Lundquist, K. A., Mirocha, J. D., Wiersema, D. J., and Chow, F. K.: A new vertical grid nesting capability in the Weather Research and Forecasting (WRF) model, Mon. Weather Rev., 144, 3725–3747, https://doi.org/10.1175/MWR-D-16-0049.1, 2016.
Darmenova, K., Sokolik, I. N., Shao, Y., Marticorena, B., and Bergametti, G.: Development of a physically based dust emission module within the Weather Research and Forecasting (WRF) model: Assessment of dust emission parameterizations and input parameters for source regions in Central and East Asia, J. Geophys. Res.-Atmos., 114, 1–28, https://doi.org/10.1029/2008JD011236, 2009.
Di Mauro, B., Cappelletti, D., Moroni, B., Mazzola, M., Gilardoni, S., Nawrot, A., Lewandowski, M., Waldhauserova, P. D., Meinander, O., Kaspari, S., Khan, A., and Republic, C.: Dust in Svalbard: local sources versus long-range transported dust (SVALDUST), SESS Report 2022 – The State of Environmental Science in Svalbard, 0–2, ISBN 978-82-93871-06-4, http://hdl.handle.net/10138/566904 (last access: 1 April 2025), 2023.
Dong, Z., Wang, X., Zhao, A., Liu, L., and Liu, X.: Aerodynamic roughness of fixed sandy beds, J. Geophys. Res.-Sol. Ea., 106, 11001–11011, https://doi.org/10.1029/2001jb900009, 2001.
Dong, Z., Liu, X., and Wang, X.: Aerodynamic roughness of gravel surfaces, Geomorphology, 43, 17–31, https://doi.org/10.1016/S0169-555X(01)00097-6, 2002.
Doubrawa, P. and Muñoz-Esparza, D.: Simulating real atmospheric boundary layers at gray-zone resolutions: How do currently available turbulence parameterizations perform?, Atmosphere-Basel, 11, https://doi.org/10.3390/atmos11040345, 2020.
Dowell, D. C., Alexander, C. R., James, E. P., Weygandt, S. S., Benjamin, S. G., Manikin, G. S., Blake, B. T., Brown, J. M., Olson, J. B., Hu, M., Smirnova, T. G., Ladwig, T., Kenyon, J. S., Ahmadov, R., Turner, D. D., Duda, J. D., and Alcott, T. I.: The High-Resolution Rapid Refresh (HRRR): An Hourly Updating Convection-Allowing Forecast Model. Part I: Motivation and System Description, Weather Forecast., 37, 1371–1395, https://doi.org/10.1175/WAF-D-21-0151.1, 2022.
Dupont, S., Rajot, J. L., Labiadh, M., Bergametti, G., Alfaro, S. C., Bouet, C., Fernandes, R., Khalfallah, B., Lamaud, E., Marticorena, B., Bonnefond, J. M., Chevaillier, S., Garrigou, D., Henry-des-Tureaux, T., Sekrafi, S., and Zapf, P.: Aerodynamic Parameters Over an Eroding Bare Surface: Reconciliation of the Law of the Wall and Eddy Covariance Determinations, J. Geophys. Res.-Atmos., 123, 4490–4508, https://doi.org/10.1029/2017JD027984, 2018.
ECCC: 1991–2020 Climate Normals & Averages, Government of Canada [data set], https://climate.weather.gc.ca/climate_normals/ (last access: 20 February 2025), 2023.
Edwards, B. L., Webb, N. P., Galloza, M. S., Van Zee, J. W., Courtright, E. M., Cooper, B. F., Metz, L. J., Herrick, J. E., Okin, G. S., Duniway, M. C., Tatarko, J., Tedala, N. H., Moriasi, D. N., Newingham, B. A., Pierson, F. B., Toledo, D., and Van Pelt, R. S.: Parameterizing an aeolian erosion model for rangelands, Aeolian Res., 54, 100769, https://doi.org/10.1016/j.aeolia.2021.100769, 2022.
Fécan, F., Marticorena, B., and Bergametti, G.: Parametrization of the increase of the aeolian erosion threshold wind friction velocity due to soil moisture for arid and semi-arid areas, Ann. Geophys., 17, 149–157, https://doi.org/10.1007/s00585-999-0149-7, 1999.
Feyisa, G. L., Meilby, H., Fensholt, R., and Proud, S. R.: Automated Water Extraction Index: A new technique for surface water mapping using Landsat imagery, Remote Sens. Environ., 140, 23–35, https://doi.org/10.1016/j.rse.2013.08.029, 2014.
Giani, P., Genton, M. G., and Crippa, P.: Modeling the Convective Boundary Layer in the Terra Incognita: Evaluation of Different Strategies with Real-Case Simulations, Mon. Weather Rev., 150, 981–1001, https://doi.org/10.1175/MWR-D-21-0216.1, 2022.
Giles, D. M., Sinyuk, A., Sorokin, M. G., Schafer, J. S., Smirnov, A., Slutsker, I., Eck, T. F., Holben, B. N., Lewis, J. R., Campbell, J. R., Welton, E. J., Korkin, S. V., and Lyapustin, A. I.: Advancements in the Aerosol Robotic Network (AERONET) Version 3 database – automated near-real-time quality control algorithm with improved cloud screening for Sun photometer aerosol optical depth (AOD) measurements, Atmos. Meas. Tech., 12, 169–209, https://doi.org/10.5194/amt-12-169-2019, 2019.
Gillette, D. A.: A qualitative geophysical explanation for hot spot dust emitting source regions, Contributions to Atmospheric Physics, 72, 67–77, 1999.
Gillette, D. A., Blifford, I. H., and Fenster, C. R.: Measurements of Aerosol Size Distributions and Vertical Fluxes of Aerosols on Land Subject to Wind Erosion, J. Appl. Meteorol. Clim., https://doi.org/10.1175/1520-0450(1972)011<0977:moasda>2.0.co;2, 1972.
González-Flórez, C., Klose, M., Alastuey, A., Dupont, S., Escribano, J., Etyemezian, V., Gonzalez-Romero, A., Huang, Y., Kandler, K., Nikolich, G., Panta, A., Querol, X., Reche, C., Yus-Díez, J., and Pérez García-Pando, C.: Insights into the size-resolved dust emission from field measurements in the Moroccan Sahara, Atmos. Chem. Phys., 23, 7177–7212, https://doi.org/10.5194/acp-23-7177-2023, 2023.
Grell, G. A., Peckham, S. E., Schmitz, R., McKeen, S. A., Frost, G., Skamarock, W. C., and Eder, B.: Fully coupled “online” chemistry within the WRF model, Atmos. Environ., 39, 6957–6975, https://doi.org/10.1016/j.atmosenv.2005.04.027, 2005.
Groot Zwaaftink, C. D., Grythe, H., Skov, H., and Stohl, A.: Substantial contribution of northern high-latitude sources to mineral dust in the Arctic, J. Geophys. Res., 121, 13678–13697, https://doi.org/10.1002/2016JD025482, 2016.
Hallet, B., Hunter, L., and Bogen, J.: Rates of erosion and sediment evacuation by glaciers: A review of field data and their implications, Glob. Planet. Change, 12, 213–235, https://doi.org/10.1016/0921-8181(95)00021-6, 1996.
Hao, Y., Wang, Z., Xue, L., Lou, S., Ding, K., Qin, Y., and Huang, X.: Modeling the Effects of Vegetation and Snow on Dust Storm Over the Gobi Desert, J. Geophys. Res.-Atmos., 129, 1–19, https://doi.org/10.1029/2024JD041407, 2024.
Hersbach, H., Bell, B., Berrisford, P., Hirahara, S., Horányi, A., Muñoz-Sabater, J., Nicolas, J., Peubey, C., Radu, R., Schepers, D., Simmons, A., Soci, C., Abdalla, S., Abellan, X., Balsamo, G., Bechtold, P., Biavati, G., Bidlot, J., Bonavita, M., De Chiara, G., Dahlgren, P., Dee, D., Diamantakis, M., Dragani, R., Flemming, J., Forbes, R., Fuentes, M., Geer, A., Haimberger, L., Healy, S., Hogan, R. J., Hólm, E., Janisková, M., Keeley, S., Laloyaux, P., Lopez, P., Lupu, C., Radnoti, G., de Rosnay, P., Rozum, I., Vamborg, F., Villaume, S., and Thépaut, J. N.: The ERA5 global reanalysis, Q. J. Roy. Meteor. Soc., 146, 1999–2049, https://doi.org/10.1002/qj.3803, 2020.
Highwood, E. J. and Ryder, C. L.: Radiative Effects of Dust, in: Mineral Dust: A Key Player in the Earth System, edited by: Knippertz, P. and Stuut, J.-B. W., Springer Netherlands, Dordrecht, 267–286, https://doi.org/10.1007/978-94-017-8978-3_11, 2014.
Holben, B. N., Eck, T. F., Slutsker, I., Tanré, D., Buis, J. P., Setzer, A., Vermote, E., Reagan, J. A., Kaufman, Y. J., Nakajima, T., Lavenu, F., Jankowiak, I., and Smirnov, A.: AERONET – A federated instrument network and data archive for aerosol characterization, Remote Sens. Environ., 66, 1–16, https://doi.org/10.1016/S0034-4257(98)00031-5, 1998.
Honnert, R., Efstathiou, G. A., Beare, R. J., Ito, J., Lock, A., Neggers, R., Plant, R. S., Shin, H. H., Tomassini, L., and Zhou, B.: The Atmospheric Boundary Layer and the “Gray Zone” of Turbulence: A Critical Review, J. Geophys. Res.-Atmos., 125, 1–26, https://doi.org/10.1029/2019JD030317, 2020.
Huck, R., Bryant, R. G., and King, J.: The (mis)identification of high-latitude dust events using remote sensing methods in the Yukon, Canada: a sub-daily variability analysis, Atmos. Chem. Phys., 23, 6299–6318, https://doi.org/10.5194/acp-23-6299-2023, 2023.
Iacono, M. J., Delamere, J. S., Mlawer, E. J., Shephard, M. W., Clough, S. A., and Collins, W. D.: Radiative forcing by long-lived greenhouse gases: Calculations with the AER radiative transfer models, J. Geophys. Res.-Atmos., 113, 2–9, https://doi.org/10.1029/2008JD009944, 2008.
Ishizuka, M., Mikami, M., Leys, J. F., Shao, Y., Yamada, Y., and Heidenreich, S.: Power law relation between size-resolved vertical dust flux and friction velocity measured in a fallow wheat field, Aeolian Res., 12, 87–99, https://doi.org/10.1016/j.aeolia.2013.11.002, 2014.
Jiménez, P. A., Dudhia, J., González-Rouco, J. F., Navarro, J., Montávez, J. P., and García-Bustamante, E.: A revised scheme for the WRF surface layer formulation, Mon. Weather Rev., 140, 898–918, https://doi.org/10.1175/MWR-D-11-00056.1, 2012.
Kang, J. Y., Yoon, S. C., Shao, Y., and Kim, S. W.: Comparison of vertical dust flux by implementing three dust emission schemes in WRF/Chem, J. Geophys. Res.-Atmos., 116, 1–18, https://doi.org/10.1029/2010JD014649, 2011.
Karydis, V. A., Tsimpidi, A. P., Bacer, S., Pozzer, A., Nenes, A., and Lelieveld, J.: Global impact of mineral dust on cloud droplet number concentration, Atmos. Chem. Phys., 17, 5601–5621, https://doi.org/10.5194/acp-17-5601-2017, 2017.
Khalfallah, B., Bouet, C., Labiadh, M. T., Alfaro, S. C., Bergametti, G., Marticorena, B., Lafon, S., Chevaillier, S., Féron, A., Hease, P., des Tureaux, T., Sekrafi, S., Zapf, P., and Rajot, J. L.: Influence of Atmospheric Stability on the Size Distribution of the Vertical Dust Flux Measured in Eroding Conditions Over a Flat Bare Sandy Field, J. Geophys. Res.-Atmos., 125, 1–20, https://doi.org/10.1029/2019JD031185, 2020.
Klose, M., Gill, T. E., Etyemezian, V., Nikolich, G., Ghodsi Zadeh, Z., Webb, N. P., and Van Pelt, R. S.: Dust emission from crusted surfaces: Insights from field measurements and modelling, Aeolian Res., 40, 1–14, https://doi.org/10.1016/j.aeolia.2019.05.001, 2019.
Klose, M., Jorba, O., Gonçalves Ageitos, M., Escribano, J., Dawson, M. L., Obiso, V., Di Tomaso, E., Basart, S., Montané Pinto, G., Macchia, F., Ginoux, P., Guerschman, J., Prigent, C., Huang, Y., Kok, J. F., Miller, R. L., and Pérez García-Pando, C.: Mineral dust cycle in the Multiscale Online Nonhydrostatic AtmospheRe CHemistry model (MONARCH) Version 2.0, Geosci. Model Dev., 14, 6403–6444, https://doi.org/10.5194/gmd-14-6403-2021, 2021.
Knippertz, P., Ansmann, A., Althausen, D., Müller, D., Tesche, M., Bierwirth, E., Dinter, T., Müller, T., Von Hoyningen-huene, W., Schepanski, K., Wendisch, M., Heinold, B., Kandler, K., Petzold, A., Schütz, L., and Tegen, I.: Dust mobilization and transport in the northern Sahara during SAMUM 2006 – A meteorological overview, Tellus B, 61, 12–31, https://doi.org/10.1111/j.1600-0889.2008.00380.x, 2009.
Koffman, B. G., Yoder, M. F., Methven, T., Hanschka, L., Sears, H. B., Saylor, P. L., and Wallace, K. L.: Glacial Dust Surpasses Both Volcanic Ash and Desert Dust in Its Iron Fertilization Potential, Global Biogeochem. Cycles, 35, 1–29, https://doi.org/10.1029/2020GB006821, 2021.
Koffman, B. G., Saylor, P., Zhong, R., Sethares, L., Yoder, M. F., Hanschka, L., Methven, T., Cai, Y., Bolge, L., Longman, J., Goldstein, S. L., and Osterberg, E. C.: Provenance of Anthropogenic Pb and Atmospheric Dust to Northwestern North America, Environ. Sci. Technol., 56, 13107–13118, https://doi.org/10.1021/acs.est.2c03767, 2022.
Kok, J. F., Mahowald, N. M., Fratini, G., Gillies, J. A., Ishizuka, M., Leys, J. F., Mikami, M., Park, M.-S., Park, S.-U., Van Pelt, R. S., and Zobeck, T. M.: An improved dust emission model – Part 1: Model description and comparison against measurements, Atmos. Chem. Phys., 14, 13023–13041, https://doi.org/10.5194/acp-14-13023-2014, 2014a.
Kok, J. F., Albani, S., Mahowald, N. M., and Ward, D. S.: An improved dust emission model – Part 2: Evaluation in the Community Earth System Model, with implications for the use of dust source functions, Atmos. Chem. Phys., 14, 13043–13061, https://doi.org/10.5194/acp-14-13043-2014, 2014b.
Kok, J. F., Adebiyi, A. A., Albani, S., Balkanski, Y., Checa-Garcia, R., Chin, M., Colarco, P. R., Hamilton, D. S., Huang, Y., Ito, A., Klose, M., Li, L., Mahowald, N. M., Miller, R. L., Obiso, V., Pérez García-Pando, C., Rocha-Lima, A., and Wan, J. S.: Contribution of the world's main dust source regions to the global cycle of desert dust, Atmos. Chem. Phys., 21, 8169–8193, https://doi.org/10.5194/acp-21-8169-2021, 2021a.
Kok, J. F., Adebiyi, A. A., Albani, S., Balkanski, Y., Checa-Garcia, R., Chin, M., Colarco, P. R., Hamilton, D. S., Huang, Y., Ito, A., Klose, M., Leung, D. M., Li, L., Mahowald, N. M., Miller, R. L., Obiso, V., Pérez García-Pando, C., Rocha-Lima, A., Wan, J. S., and Whicker, C. A.: Improved representation of the global dust cycle using observational constraints on dust properties and abundance, Atmos. Chem. Phys., 21, 8127–8167, https://doi.org/10.5194/acp-21-8127-2021, 2021b.
Kok, J. F., Storelvmo, T., Karydis, V. A., Adebiyi, A. A., Mahowald, N. M., Evan, A. T., He, C., and Leung, D. M.: Mineral dust aerosol impacts on global climate and climate change, Nat. Rev. Earth Environ., 4, 71–86, https://doi.org/10.1038/s43017-022-00379-5, 2023.
Laurent, B., Marticorena, B., Bergametti, G., and Mei, F.: Modeling mineral dust emissions from Chinese and Mongolian deserts, Glob. Planet. Change, 52, 121–141, https://doi.org/10.1016/j.gloplacha.2006.02.012, 2006.
LeGrand, S. L., Polashenski, C., Letcher, T. W., Creighton, G. A., Peckham, S. E., and Cetola, J. D.: The AFWA dust emission scheme for the GOCART aerosol model in WRF-Chem v3.8.1, Geosci. Model Dev., 12, 131–166, https://doi.org/10.5194/gmd-12-131-2019, 2019.
Leung, D. M., Kok, J. F., Li, L., Okin, G. S., Prigent, C., Klose, M., Pérez García-Pando, C., Menut, L., Mahowald, N. M., Lawrence, D. M., and Chamecki, M.: A new process-based and scale-aware desert dust emission scheme for global climate models – Part I: Description and evaluation against inverse modeling emissions, Atmos. Chem. Phys., 23, 6487–6523, https://doi.org/10.5194/acp-23-6487-2023, 2023.
Li, J., Okin, G. S., Herrick, J. E., Belnap, J., Munson, S. M., and Miller, M. E.: A simple method to estimate threshold friction velocity of wind erosion in the field, Geophys. Res. Lett., 37, 1–5, https://doi.org/10.1029/2010GL043245, 2010.
Lu, H. and Shao, Y.: A new model for dust emission by saltation bombardment, J. Geophys. Res.-Atmos., 104, 16827–16842, https://doi.org/10.1029/1999JD900169, 1999.
Maher, B. A., Prospero, J. M., Mackie, D., Gaiero, D., Hesse, P. P., and Balkanski, Y.: Global connections between aeolian dust, climate and ocean biogeochemistry at the present day and at the last glacial maximum, Earth. Sci. Rev., 99, 61–97, https://doi.org/10.1016/j.earscirev.2009.12.001, 2010.
Maizels, J.: Lithofacies variations within sandur deposits: the role of runoff regime, flow dynamics and sediment supply characteristics, Sediment. Geol., 85, 299–325, https://doi.org/10.1016/0037-0738(93)90090-R, 1993.
Marren, P. M.: Magnitude and frequency in proglacial rivers: A geomorphological and sedimentological perspective, Earth. Sci. Rev., 70, 203–251, https://doi.org/10.1016/j.earscirev.2004.12.002, 2005.
Marticorena, B., Chazette, P., Bergametti, G., Dulac, F., and Legrand, M.: Mapping the aerodynamic roughness length of desert surfaces from the POLDER/ADEOS bi-directional reflectance product, Int. J. Remote Sens., 25, 603–626, https://doi.org/10.1080/0143116031000116976, 2004.
McCutcheon, J., Lutz, S., Williamson, C., Cook, J. M., Tedstone, A. J., Vanderstraeten, A., Wilson, S. A., Stockdale, A., Bonneville, S., Anesio, A. M., Yallop, M. L., McQuaid, J. B., Tranter, M., and Benning, L. G.: Mineral phosphorus drives glacier algal blooms on the Greenland Ice Sheet, Nat. Commun., 12, 1–11, https://doi.org/10.1038/s41467-020-20627-w, 2021.
McKenna Neuman, C.: A review of aeolian transport processes in cold environments, Prog. Phys. Geogr., 17, 137–155, https://doi.org/10.1177/030913339301700203, 1993.
McKnight, E. A., Swanson, H., Brahney, J., and Hik, D. S.: The physical and chemical limnology of yukon's largest lake, lhù'ààn mân' (Kluane lake), prior to the 2016 `aäy chù' diversion, Arct. Sci., 7, 655–678, https://doi.org/10.1139/as-2020-0012, 2021.
Meinander, O., Dagsson-Waldhauserova, P., Amosov, P., Aseyeva, E., Atkins, C., Baklanov, A., Baldo, C., Barr, S. L., Barzycka, B., Benning, L. G., Cvetkovic, B., Enchilik, P., Frolov, D., Gassó, S., Kandler, K., Kasimov, N., Kavan, J., King, J., Koroleva, T., Krupskaya, V., Kulmala, M., Kusiak, M., Lappalainen, H. K., Laska, M., Lasne, J., Lewandowski, M., Luks, B., McQuaid, J. B., Moroni, B., Murray, B., Möhler, O., Nawrot, A., Nickovic, S., O’Neill, N. T., Pejanovic, G., Popovicheva, O., Ranjbar, K., Romanias, M., Samonova, O., Sanchez-Marroquin, A., Schepanski, K., Semenkov, I., Sharapova, A., Shevnina, E., Shi, Z., Sofiev, M., Thevenet, F., Thorsteinsson, T., Timofeev, M., Umo, N. S., Uppstu, A., Urupina, D., Varga, G., Werner, T., Arnalds, O., and Vukovic Vimic, A.: Newly identified climatically and environmentally significant high-latitude dust sources, Atmos. Chem. Phys., 22, 11889–11930, https://doi.org/10.5194/acp-22-11889-2022, 2022.
Milbrandt, J. A., Bélair, S., Faucher, M., Vallée, M., Carrera, M. L., and Glazer, A.: The Pan-Canadian high resolution (2.5 km) deterministic prediction system, Weather Forecast., 31, 1791–1816, https://doi.org/10.1175/WAF-D-16-0035.1, 2016.
Miller, R. L., Knippertz, P., Pérez García-Pando, C., Perlwitz, J. P., and Tegen, I.: Impact of Dust Radiative Forcing upon Climate, in: Mineral Dust: A Key Player in the Earth System, edited by: Knippertz, P. and Stuut, J.-B. W., Springer Netherlands, Dordrecht, 327–357, https://doi.org/10.1007/978-94-017-8978-3_13, 2014.
Moffit, F. H.: Geology of the Chitina Valley and adjacent area, Alaska, https://doi.org/10.3133/b894, 1938.
Muhs, D. R., Budahn, J. R., McGeehin, J. P., Bettis, E. A., Skipp, G., Paces, J. B., and Wheeler, E. A.: Loess origin, transport, and deposition over the past 10,000 years, Wrangell-St. Elias National Park, Alaska, Aeolian Res., 11, 85–99, https://doi.org/10.1016/j.aeolia.2013.06.001, 2013.
Muhs, D. R., Budahn, J. R., Skipp, G. L., and McGeehin, J. P.: Geochemical evidence for seasonal controls on the transportation of Holocene loess, Matanuska Valley, southern Alaska, USA, Aeolian Res., 21, 61–73, https://doi.org/10.1016/j.aeolia.2016.02.005, 2016.
Nagorski, S. A., Kaspari, S. D., Hood, E., Fellman, J. B., and Skiles, S. M. K.: Radiative Forcing by Dust and Black Carbon on the Juneau Icefield, Alaska, J. Geophys. Res.-Atmos., 124, 3943–3959, https://doi.org/10.1029/2018JD029411, 2019.
NASA/METI/AIST/Japan Spacesystems and U.S./Japan ASTER Science Team: ASTER Global Digital Elevation Model V003, NASA [data set], https://doi.org/10.5067/ASTER/ASTGTM.003, 2019.
Nenes, A., Murray, B., and Bougiatioti, A.: Mineral Dust and its Microphysical Interactions with Clouds, in: Mineral Dust: A Key Player in the Earth System, edited by: Knippertz, P. and Stuut, J.-B. W., Springer Netherlands, Dordrecht, 287–325, https://doi.org/10.1007/978-94-017-8978-3_12, 2014.
Nickling, W. G.: Eolian Sediment Transport During Dust Storms: Slims River Valley, Yukon Territory., Can. J. Earth Sci., 15, 1069–1084, https://doi.org/10.1139/e78-114, 1978.
Nickling, W. G. and Gillies, J. A.: Dust emission and transport in Mali, West Africa, Sedimentology, 40, 859–868, https://doi.org/10.1111/j.1365-3091.1993.tb01365.x, 1993.
NOAA: NOAA Rapid Refresh Forecast System (RRFS) [Prototype]: https://registry.opendata.aws/noaa-rrfs, last access: 8 March 2026.
Park, S. H., Gong, S. L., Zhao, T. L., Vet, R. J., Bouchet, V. S., Gong, W., Makar, P. A., Moran, M. D., Stroud, C., and Zhang, J.: Simulation of entrainment and transport of dust particles within North America in April 2001 (“Red Dust Episode”), J. Geophys. Res.-Atmos., 112, 1–16, https://doi.org/10.1029/2007JD008443, 2007.
Pewe, T. L.: Quaternary geology of Alaska, Professional Paper, https://doi.org/10.3133/pp835, 1975.
Pissart, A., Vincent, J., and Edlund, S. A.: Dépôts et phénomènes éoliens sur l'île de Banks, Territoires du Nord-Ouest, Canada, Can. J. Earth Sci., 14, 2462–2480, 1977.
Poggio, L., De Sousa, L. M., Batjes, N. H., Heuvelink, G. B. M., Kempen, B., Ribeiro, E., and Rossiter, D.: SoilGrids 2.0: Producing soil information for the globe with quantified spatial uncertainty, Soil, 7, 217–240, https://doi.org/10.5194/soil-7-217-2021, 2021.
Prigent, C., Tegen, I., Aires, F., Marticorena, B., and Zribi, M.: Estimation of the aerodynamic roughness length in arid and semi-arid regions over the globe with the ERS scatterometer, J. Geophys. Res.-Atmos., 110, 1–12, https://doi.org/10.1029/2004JD005370, 2005.
Prigent, C., Jiménez, C., and Catherinot, J.: Comparison of satellite microwave backscattering (ASCAT) and visible/near-infrared reflectances (PARASOL) for the estimation of aeolian aerodynamic roughness length in arid and semi-arid regions, Atmos. Meas. Tech., 5, 2703–2712, https://doi.org/10.5194/amt-5-2703-2012, 2012.
Prospero, J. M., Ginoux, P., Torres, O., Nicholson, S. E., and Gill, T. E.: Environmental characterization of global sources of atmospheric soil dust identified with the Nimbus 7 Total Ozone Mapping Spectrometer (TOMS) absorbing aerosol product, Rev. Geophys., 40, 2-1–2-31, https://doi.org/10.1029/2000RG000095, 2002.
Rampton, V. N.: Surficial geology and geomorphology, Congdon Creek, Yukon Territory, Geological Survey of Canada, https://doi.org/10.4095/109193, 1977.
Rampton, V. N. and Paradis, S.: Surficial geology and geomorphology, Pine Lake, Yukon Territory, Geological Survey of Canada, https://doi.org/10.4095/119387, 1982.
Ranjbar, K., O'Neill, N. T., Ivanescu, L., King, J., and Hayes, P. L.: Remote sensing of a high-Arctic, local dust event over Lake Hazen (Ellesmere Island, Nunavut, Canada), Atmos. Environ., 246, 118102, https://doi.org/10.1016/j.atmosenv.2020.118102, 2021.
Raupach, M. R., Gillette, D. A., and Leys, J. F.: The effect of roughness elements on wind erosion threshold, J. Geophys. Res., 98, 3023–3029, https://doi.org/10.1029/92JD01922, 1993.
Ravi, S., D'Odorico, P., Breshears, D. D., Field, J. P., Goudie, A. S., Huxman, T. E., Li, J., Okin, G. S., Swap, R. J., Thomas, A. D., Van Pelt, S., Whicker, J. J., and Zobeck, T. M.: Aeolian processes and the biosphere, Rev. Geophys., 49, 1–45, https://doi.org/10.1029/2010RG000328, 2011.
Rice, M. A., Mullins, C. E., and Mcewan, I. K.: An analysis of soil crust strength in relation to potential abrasion by saltating particles, Earth Surf. Process. Landf., 22, 869–883, https://doi.org/10.1002/(sici)1096-9837(199709)22:9<869::aid-esp785>3.0.co;2-p, 1997.
Rohanizadegan, M., Petrone, R. M., Pomeroy, J. W., Kosovic, B., Muñoz-Esparza, D., and Helgason, W. D.: High-Resolution Large-Eddy Simulations of Flow in the Complex Terrain of the Canadian Rockies, Earth Space Sci., 10, https://doi.org/10.1029/2023EA003166, 2023.
Rosenfeld, D., Sherwood, S., Wood, R., and Donner, L.: Climate Effects of Aerosol-Cloud Interactions, Science, 343, 379–380, https://doi.org/10.1126/science.1247490, 2014.
Rust, B. R.: Structure and Process in a Braided River, Sedimentology, 18, 221–245, https://doi.org/10.1111/j.1365-3091.1972.tb00013.x, 1972.
Sayedain, S. A., O'Neill, N. T., King, J., Hayes, P. L., Bellamy, D., Washington, R., Engelstaedter, S., Vicente-Luis, A., Bachelder, J., and Bernhard, M.: Detection and analysis of Lhù'ààn Man' (Kluane Lake) dust plumes using passive and active ground-based remote sensing supported by physical surface measurements, Atmos. Meas. Tech., 16, 4115–4135, https://doi.org/10.5194/amt-16-4115-2023, 2023.
Schiefer, E. and Gilbert, R.: Proglacial sediment trapping in recently formed Silt Lake, Upper Lillooet Valley, Coast Mountains, British Columbia, Earth Surf. Process. Landf., 33, 1542–1556, https://doi.org/10.1002/esp.1625, 2008.
Schroth, A. W., Crusius, J., Gassó, S., Moy, C. M., Buck, N. J., Resing, J. A., and Campbell, R. W.: Atmospheric deposition of glacial iron in the Gulf of Alaska impacted by the position of the Aleutian Low, Geophys. Res. Lett., 44, 5053–5061, https://doi.org/10.1002/2017GL073565, 2017.
Seiler, C., Melton, J. R., Arora, V. K., and Wang, L.: CLASSIC v1.0: the open-source community successor to the Canadian Land Surface Scheme (CLASS) and the Canadian Terrestrial Ecosystem Model (CTEM) – Part 2: Global benchmarking, Geosci. Model Dev., 14, 2371–2417, https://doi.org/10.5194/gmd-14-2371-2021, 2021.
Serafin, S., Adler, B., Cuxart, J., De Wekker, S. F. J., Gohm, A., Grisogono, B., Kalthoff, N., Kirshbaum, D. J., Rotach, M. W., Schmidli, J., Stiperski, I., Večenaj, Ž., and Zardi, D.: Exchange processes in the atmospheric boundary layer over mountainous terrain, Atmosphere-Basel, 9, https://doi.org/10.3390/atmos9030102, 2018.
Shao, Y.: A model for mineral dust emission, J. Geophys. Res.-Atmos., 106, 20239–20254, https://doi.org/10.1029/2001JD900171, 2001.
Shao, Y.: Simplification of a dust emission scheme and comparison with data, J. Geophys. Res.-Atmos., 109, 1–6, https://doi.org/10.1029/2003JD004372, 2004.
Shao, Y.: Physics and Modelling of Wind Erosion, 2nd ed., Springer, Berlin, https://doi.org/10.1007/978-1-4020-8895-7, 2008.
Shao, Y. and Lu, H.: A simple expression for wind erosion threshold friction velocity, J. Geophys. Res.-Atmos., 105, 22437–22443, https://doi.org/10.1029/2000JD900304, 2000.
Shao, Y., Wyrwoll, K. H., Chappell, A., Huang, J., Lin, Z., McTainsh, G. H., Mikami, M., Tanaka, T. Y., Wang, X., and Yoon, S.: Dust cycle: An emerging core theme in Earth system science, Aeolian Res., 2, 181–204, https://doi.org/10.1016/j.aeolia.2011.02.001, 2011a.
Shao, Y., Ishizuka, M., Mikami, M., and Leys, J. F.: Parameterization of size-resolved dust emission and validation with measurements, J. Geophys. Res.-Atmos., 116, 1–19, https://doi.org/10.1029/2010JD014527, 2011b.
Sheaf, M. A., Serpa, L., and Pavlis, T. L.: Exhumation rates in the St. Elias Mountains, Alaska, Tectonophysics, 367, 1–11, https://doi.org/10.1016/S0040-1951(03)00124-0, 2003.
Shin, H. H. and Hong, S. Y.: Representation of the subgrid-scale turbulent transport in convective boundary layers at gray-zone resolutions, Mon. Weather Rev., 143, 250–271, https://doi.org/10.1175/MWR-D-14-00116.1, 2015.
Shugar, D. H., Clague, J. J., Best, J. L., Schoof, C., Willis, M. J., Copland, L., and Roe, G. H.: River piracy and drainage basin reorganization led by climate-driven glacier retreat, Nat. Geosci., 10, 370–375, https://doi.org/10.1038/ngeo2932, 2017.
Skamarock, W. C., Klemp, J. B., Dudhia, J. B., Gill, D. O., Barker, D. M., Duda, M. G., Huang, X.-Y., Wang, W., and Powers, J. G.: A Description of the Advanced Research WRF Model Version 4.3, NCAR Technical Note, TN–556+STR, 1–165, https://doi.org/10.5065/1dfh-6p97, 2021.
Sow, M., Alfaro, S. C., Rajot, J. L., and Marticorena, B.: Size resolved dust emission fluxes measured in Niger during 3 dust storms of the AMMA experiment, Atmos. Chem. Phys., 9, 3881–3891, https://doi.org/10.5194/acp-9-3881-2009, 2009.
Spolaor, A., Moroni, B., Luks, B., Nawrot, A., Roman, M., Larose, C., Stachnik, Ł., Bruschi, F., Kozioł, K., Pawlak, F., Turetta, C., Barbaro, E., Gallet, J. C., and Cappelletti, D.: Investigation on the Sources and Impact of Trace Elements in the Annual Snowpack and the Firn in the Hansbreen (Southwest Spitsbergen), Front. Earth Sci., 8, 1–10, https://doi.org/10.3389/feart.2020.536036, 2021.
Tan, L., Zhang, W., An, Z., Xiao, J., and Qu, J.: The effect of roughness density of gobi beds on the entrainment of sediment by wind: A wind tunnel study, J. Wind Eng. Ind. Aerod., 190, 183–189, https://doi.org/10.1016/j.jweia.2019.05.002, 2019.
Tewari, M., Chen, F., Wang, W., Dudhia, J., LeMone, M. A., Mitchell, K., Ek, M., Gayno, G., Wegiel, J., and Cuenca, R. H.: Implementation and verification of the unified Noah land surface model in the WRF model (Formerly Paper Number 17.5), Proceedings of the 20th Conference on Weather Analysis and Forecasting/16th Conference on Numerical Weather Prediction, 14, 1115, 2004.
Thompson, G., Field, P. R., Rasmussen, R. M., and Hall, W. D.: Explicit forecasts of winter precipitation using an improved bulk microphysics scheme. Part II: Implementation of a new snow parameterization, Mon. Weather Rev., 136, 5095–5115, https://doi.org/10.1175/2008MWR2387.1, 2008.
Tobo, Y., Adachi, K., DeMott, P. J., Hill, T. C. J., Hamilton, D. S., Mahowald, N. M., Nagatsuka, N., Ohata, S., Uetake, J., Kondo, Y., and Koike, M.: Glacially sourced dust as a potentially significant source of ice nucleating particles, Nat. Geosci., 12, 253–258, https://doi.org/10.1038/s41561-019-0314-x, 2019.
Trainer, F. W.: Eolian Deposits of the Matanuska Valley, Alaska, 35 pp., https://doi.org/10.3133/b1121C, 1961.
Uno, I., Eguchi, K., Yumimoto, K., Takemura, T., Shimizu, A., Uematsu, M., Liu, Z., Wang, Z., Hara, Y., and Sugimoto, N.: Asian dust transported one full circuit around the globe, Nat. Geosci., 2, 557–560, https://doi.org/10.1038/ngeo583, 2009.
Warner, T. T., Peterson, R. A., and Treadon, R. E.: A Tutorial on Lateral Boundary Conditions as a Basic and Potentially Serious Limitation to Regional Numerical Weather Prediction, Bull. Am. Meteorol. Soc., 78, 2599–2617, https://doi.org/10.1175/1520-0477(1997)078<2599:ATOLBC>2.0.CO;2, 1997.
Wendler, G., Gordon, T., and Stuefer, M.: On the precipitation and precipitation change in Alaska, Atmosphere-Basel, 8, https://doi.org/10.3390/atmos8120253, 2017.
Wiggs, G. F. S., Baird, A. J., and Atherton, R. J.: The dynamic effects of moisture on the entrainment and transport of sand by wind, Geomorphology, 59, 13–30, https://doi.org/10.1016/j.geomorph.2003.09.002, 2004.
Wiggs, G. F. S., Baddock, M. C., Thomas, D. S. G., Washington, R., Nield, J. M., Engelstaedter, S., Bryant, R. G., Eckardt, F. D., von Holdt, J. R. C., and Kötting, S.: Quantifying Mechanisms of Aeolian Dust Emission: Field Measurements at Etosha Pan, Namibia, J. Geophys. Res. Earth Surf., 127, 1–21, https://doi.org/10.1029/2022JF006675, 2022.
Wolfe, S. and Nickling, W. G.: The protective role of sparse vegetation in wind erosion, Prog. Phys. Geogr., 17, 50–68, https://doi.org/10.1177/030913339301700104, 1993.
Zängl, G.: An improved method for computing horizontal diffusion in a sigma-coordinate model and its application to simulations over mountainous topography, Mon. Weather Rev., 130, 1423–1432, https://doi.org/10.1175/1520-0493(2002)130<1423:AIMFCH>2.0.CO;2, 2002.
Zängl, G., Gantner, L., Hartjenstein, G., and Noppel, H.: Numerical errors above steep topography: A model intercomparison, Meteorol. Z., 13, 69–76, https://doi.org/10.1127/0941-2948/2004/0013-0069, 2004.
Zardi, D. and Whiteman, C. D.: Diurnal Mountain Wind Systems, in: Mountain Weather Research and Forecasting: Recent Progress and Current Challenges, edited by: Chow, F. K., De Wekker, S. F. J., and Snyder, B. J., Springer Netherlands, Dordrecht, 35–119, https://doi.org/10.1007/978-94-007-4098-3_2, 2013.
Zdanowicz, C., Hall, G., Vaive, J., Amelin, Y., Percival, J., Girard, I., Biscaye, P., and Bory, A.: Asian dustfall in the St. Elias Mountains, Yukon, Canada, Geochim. Cosmochim. Acta, 70, 3493–3507, https://doi.org/10.1016/j.gca.2006.05.005, 2006.
Zdanowicz, C. M., Zielinski, G. A., and Wake, C. P.: Characteristics of modern atmospheric dust deposition in snow on the Penny Ice Cap, Baffin Island, Arctic Canada, Tellus B, 50, 506–520, https://doi.org/10.3402/tellusb.v50i5.16234, 1998.
Zender, C. S., Bian, H., and Newman, D.: Mineral Dust Entrainment and Deposition (DEAD) model: Description and 1990s dust climatology, J. Geophys. Res.-Atmos., 108, https://doi.org/10.1029/2002jd002775, 2003.
Zhang, L., Montuoro, R., McKeen, S. A., Baker, B., Bhattacharjee, P. S., Grell, G. A., Henderson, J., Pan, L., Frost, G. J., McQueen, J., Saylor, R., Li, H., Ahmadov, R., Wang, J., Stajner, I., Kondragunta, S., Zhang, X., and Li, F.: Development and evaluation of the Aerosol Forecast Member in the National Center for Environment Prediction (NCEP)'s Global Ensemble Forecast System (GEFS-Aerosols v1), Geosci. Model Dev., 15, 5337–5369, https://doi.org/10.5194/gmd-15-5337-2022, 2022.
Zobeck, T. M.: Soil properties affecting wind erosion, J. Soil Water Conserv., 46, 112–118, 1991.