
the Creative Commons Attribution 4.0 License.
the Creative Commons Attribution 4.0 License.
 | 04 Sep 2026
Planetary albedo change exacerbates surface warming: a perspective from cloud-type changes
Ruixue Li
Jiming Li

Bida Jian
Lijie Zhang
Persistent global warming is modulated by cloud changes, yet the specific contributions and associated controlling factors remain inadequately quantified. Using CERES radiation data with a surface energy-balance framework, we quantify the contribution of cloud radiative changes to decadal surface temperature trends over 2002–2023. Cloud changes exert a weak net effect on global mean warming due to near-cancellation between shortwave warming and longwave cooling, but strongly modulate the meridional pattern of zonal-mean warming. Specifically, clouds enhance warming in low- and mid-latitudes while mitigating warming at high latitudes. This pattern is associated with a systematic redistribution of cloud occurrence from low-/mid-level cloud types to high-level optically thin clouds, which reduce planetary albedo and weaken cloud longwave emission. These changes exhibit hemispheric difference. In 30–60° N, the region contributing most to global warming, the decline in the cloud-reflected solar radiation is mainly driven by decreased cloud fraction, linked to elevated sea surface temperatures, aerosol reductions, and mid-tropospheric drying. In 30–60° S, reduced cloud reflectivity resulting from decreased cloud optical thickness and increased liquid droplet radius dominates. However, at high latitudes in both hemispheres, increased mid-/high-clouds and enhanced cloud reflectivity, driven by enhanced moisture, upper-tropospheric static stability and increased cloud optical thickness, lead to greater reflected solar radiation and reduced downwelling longwave radiation, thereby attenuating local warming. Our results establish a direct observational link between cloud-type changes, planetary albedo decline, and contrasting warming across latitude zones, characterizing the cloud-radiative changes in recent climate change.
- Article
(1988 KB) - Full-text XML
-
Supplement
(3710 KB) - BibTeX
- EndNote


Over the past two decades, the Earth is experiencing unprecedented warming, which exacerbates global heatwaves, wildfires, droughts, and glacier melt, and poses increasing threats to human health and life (Ripple et al., 2024; Gould et al., 2025). The 2023–2024 period experienced frequent record-breaking global mean surface temperatures (Li et al., 2024a; Cheng et al., 2025). While such record-breaking temperatures may be influenced by internal variability (Li et al., 2024a; Blanchard-Wrigglesworth et al., 2025; Goessling et al., 2025; Minobe et al., 2025), such as the El Niño-Southern Oscillation (ENSO), the magnitude of these extremes would be improbable without an underlying and sustained warming trend driven by earth's energy accumulation. This motivates a quantitative assessment of how observed radiative changes have accompanied and modulated the recent persistent global warming.
While the role of longwave radiation changes driven by factors such as greenhouse gases and aerosols in surface warming has been extensively studied, the contribution of shortwave radiation has often been overlooked. Planetary albedo (PA), which regulates the absorption and distribution of solar energy, plays a critical role in controlling surface temperature (Ts). A record-low PA has been identified as a key driver of both recent extreme temperature anomalies (Goessling et al., 2025) and marine heatwaves (Dong et al., 2025), while its accurate representation has proven crucial for improving the predictive skill of climate models (Blanchard-Wrigglesworth et al., 2025). Clouds, as the dominant regulator of PA (Stephens et al., 2015; Jian et al., 2018; Loeb et al., 2021; Li et al., 2024b, 2025b), influence the amount of solar radiation reaching the surface and thereby affect Ts. Liu et al. (2024) have highlighted that, after accounting for near-surface air temperature feedbacks, cloud radiative effects are the primary physical process driving monthly Ts variability over land. Under global warming, large-scale circulation adjustments and their associated dynamical and thermodynamic changes may trigger adjustments in cloud type, coverage, and albedo, thereby altering cloud radiative properties. Several model simulations have emphasized changes in cloud feedbacks under global warming. For example, Ceppi and Hartmann (2016) demonstrated that shortwave cloud radiative changes substantially intensify meridional temperature gradients and dominate the poleward expansion of large-scale circulation systems. Similarly, Zelinka et al. (2020) found that enhanced positive low-cloud feedbacks in CMIP6 models, driven by decreased extratropical low-cloud amount and optical depth, are the primary cause of their higher effective climate sensitivity. In addition, observations also reveal the extensive changes in cloud properties in recent years. Several studies have reported the reductions in low cloud cover at low-mid latitudes (Loeb et al., 2024; Goessling et al., 2025; Minobe et al., 2025). From a macroscopic perspective, Tselioudis et al. (2025) indicated that the contraction of storm zones drives the observed increase in global solar absorption. However, the contribution of these cloud changes to long-term Ts trends remains unquantified, and there is no observational evidence to support which specific cloud property changes have been most responsible.
To address these gaps, this study quantitatively assesses the radiative contribution of clouds to decadal Ts trends over 2002–2023 using satellite radiation data within a surface energy-balance framework. By isolating the cloud component of PA and decomposing it into cloud fraction and intrinsic cloud reflectivity for different cloud types, we separate their respective roles and further identify the underlying mechanisms. This observation-based assessment provides a benchmark for evaluating the representation of cloud radiative effects in climate models and offers new insights into the cloud type changes that influence recent warming trends.
2.1 CERES data
This study uses radiation and cloud data from July 2002 to February 2023 obtained from the Clouds and the Earth's Radiant Energy System (CERES) project. Two primary CERES products are employed: the Energy Balanced and Filled (EBAF) Edition 4.2.1 to quantify cloud radiative impacts on Ts trends and decompose PA, and the FluxbyCldTyp (FBCT) Edition 4.1 to analyze cloud-type changes.
We use monthly mean observed incoming solar radiation (ISR) and reflected shortwave radiation (RSR) at the top of atmosphere (TOA), alongside modeled surface upwelling and downwelling shortwave and longwave radiation fluxes at 1° resolution from EBAF (Wielicki et al., 1996; Kato et al., 2018; Loeb et al., 2018). This product provides diurnally complete averages by integrating geostationary satellite corrections (Loeb et al., 2018). Moreover, it ensures temporal continuity across satellite transitions and applies objective constraint algorithm to achieve energy balance closure based on ocean heat storage estimates (Loeb et al., 2009).
The FBCT Terra+Aqua Edition 4.1 product provides cloud-type partitioned radiative fluxes and cloud properties across pressure and optical depth bins (Sun et al., 2022), derived from CERES Single Scanner Footprint (SSF) Edition 4A and Moderate Resolution Imaging Spectroradiometer (MODIS) data. Both single-layer and multi-layer portions of upper-level clouds are classified as upper-level clouds. In this study, we employ 1° gridded monthly mean regional clear-sky shortwave fluxes, along with shortwave fluxes, cloud fraction (CF), cloud visible optical depth (CVOD), liquid cloud particle radius (rliq) and ice cloud particle radius (rice) for different cloud types. Following the cloud type classification from International Satellite Cloud Climatology Project (ISCCP), we classify the clouds into nine types based on cloud top pressure and optical depth: cumulus (Cu), stratocumulus (Sc), stratus (St), altocumulus (Ac), altostratus (As), nimbostratus (Ns), cirrus (Ci), cirrostratus (Cs), cumulonimbus (Cb).
The shortwave cloud radiative forcing at the TOA (SWCRFTOA) for the specific cloud type c is defined as:
where RSRc is the upwelling overcast TOA flux for that cloud type, RSRclr is the upwelling clear-sky TOA flux, and CFc is the cloud fraction of that type. The term in parentheses represents the change in reflected shortwave radiation per unit cloud cover – i.e., the intrinsic shortwave cloud radiative effect of the cloud itself. We refer to this quantity as cloud reflectivity (CR):
CR is determined by the cloud's own microphysical properties, such as cloud thickness and the size of water droplets or ice crystals within the cloud. Multiplying CR by the corresponding cloud fraction yields the total shortwave cloud radiative forcing contributed by that cloud type.
The variable, SWCRFTOA,c, is only used in decomposing the cloud component of RSR in Sect. 2.4. The classification thresholds and global mean climatology of CF and CR are provided in Fig. S1 in the Supplement.
2.2 Reanalysis data
In this study, monthly skin temperature data are obtained from the ECMWF Reanalysis v5 (ERA5). To further investigate the thermodynamic and dynamic drivers of cloud changes, several key monthly averaged meteorological variables from ERA5 are employed. Additionally, the aerosol optical depth (AOD) data from MERRA-2 are used to assess the potential influence of aerosols on cloud microphysics (Kaufman et al., 2005). The specific cloud controlling factors used are detailed in Sect. 2.5 and Table 1. All reanalysis datasets are regridded to a 1°×1° spatial resolution to match with the CERES data.
2.3 Radiative Contribution of Clouds to Surface Warming
Radiative forcing and climate feedbacks are often diagnosed using radiation fluxes at the TOA, which provide a useful framework for understanding global energy balance and temperature responses (Bony et al., 2006). However, regional Ts changes are strongly influenced by atmospheric and oceanic energy transports, so local temperature variations are not necessarily directly tied to TOA radiative anomalies (Liu et al., 2024). Therefore, examining the surface energy budget provides a more direct way to relate Ts changes to local radiative and turbulent energy fluxes (Andrews et al., 2009; Lu and Cai, 2009; Colman, 2015; Boeke and Taylor, 2018; Sejas et al., 2021), motivating the surface energy balance framework used in this study.
Following Lu and Cai (2009), we can quantify the contribution of clouds to Ts changes through both shortwave and longwave pathways. The monthly anomaly of Ts for each grid can be decomposed into contributions from different physical processes based on the surface energy balance framework (Lu and Cai, 2009):
Each term on the right-hand side represents the contribution to Ts anomalies from distinct physical processes:
- (a)
Surface albedo feedback (SAF):
- (b)
Surface cloud radiative forcing:
- (c)
Non-SAF-induced clear-sky shortwave radiation:
- (d)
Clear-sky downward longwave radiation:
- (e)
Surface heat storage (includes oceanic energy transport in oceans): −ΔQ
- (f)
Combined sensible and latent heat fluxes:
Here, Δ denotes monthly anomalies relative to the climatological mean; overbars indicate monthly climatological means; α is surface albedo; SW (LW) denotes shortwave (longwave) radiation flux; downward arrows represent surface downward fluxes; SH (LE) represents sensible (latent) heat flux; and σ is the Stefan-Boltzmann constant. Subscripts clr and cld refer to clear-sky and cloudy conditions, respectively, with cloudy conditions calculated as the difference between all-sky and clear-sky conditions. Temperature units are in Kelvin (K).
Therefore, the monthly Ts anomalies caused by changes in surface cloud radiative forcing (ΔCRC, units: K) at each grid point is calculated as:
The ΔCRC comprehensively captures both the shortwave radiative influences of clouds on Ts (ΔCRCsw), which is not induced by surface albedo feedback, and the longwave radiative influences of clouds on Ts (ΔCRClw).
To analyze latitudinal patterns, we calculate area-weighted regional averages of ΔCRC within 30° latitude zones. The resulting time series for each latitudinal zone are then used to determine trends, representing the Ts trends caused by cloud radiative changes across different latitude zones (CRCsw and CRClw).
The surface energy balance decomposition provides a useful diagnostic framework for quantifying the contributions of different energy flux components to Ts anomalies. However, its application over oceanic regions warrants careful interpretation. Over oceans, the large heat capacity of the ocean mixed layer and the influence of horizontal heat transport can result in a non-negligible local surface energy imbalance term (Donohoe and Battisti, 2013; Sejas et al., 2021). In addition, turbulent heat fluxes and ocean heat storage may covary with cloud radiative forcing. For instance, Liu et al. (2024) showed that over land, the cloud radiative effect is largely offset by its negative covariance with turbulent heat fluxes, as reduced cloud cover enhances surface heat loss. Therefore, the quantity ΔCRC derived from Eq. (5) should be interpreted as the direct radiative contribution associated with cloud changes under the linearized surface energy balance framework, rather than a complete attribution of Ts variability. Despite this limitation, the approach has been employed to diagnose the radiative effects of clouds on Ts at global scales, including over oceans (Izumi et al., 2015).
2.4 Decomposition of the cloud component of TOA RSR
In order to further clarify how clouds modulate solar radiation reaching the Earth's surface, we isolate the cloud component of TOA RSR, denoted as RSRcloud, which represent the direct radiative effect of clouds on the TOA reflected shortwave radiation.
Following the simplified radiative model (Donohoe and Battisti, 2011; Stephens et al., 2015), the all-sky TOA RSR () can be decomposed into the atmospheric and surface components (RSRatm and RSRsurf).
The simplified calculation equations are as follows (Li et al., 2025b):
where S is the incident solar radiation at TOA, is the RSR at TOA, and and represent the upwelling and downwelling shortwave radiation fluxes at the surface, respectively. Similarly, the clear-sky RSR () can be decomposed into RSRsurfclr and RSRatmclr.
The cloud component RSRcloud is defined as the difference in the atmospheric component of RSR between all-sky and clear-sky conditions:
This quantity represents the solar radiation directly reflected by clouds themselves. Its magnitude and variability are primarily determined by the CF and CR. Notably, RSRcloud is distinct from the traditional shortwave cloud radiative forcing at TOA (SWCRFTOA), which also includes the effect of clouds masking the surface-reflected component. The SWCRFTOA is defined as the difference in TOA RSR between all-sky and clear-sky conditions:
The relationship between the RSRcloud and the SWCRFTOA can be derived by substituting the decompositions:
where represents the cloud masking effect on surface-reflected radiation – i.e., the reduction in TOA upwelling shortwave flux caused by clouds obscuring the surface.
Therefore, RSRcloud can be equivalently expressed as the difference between the shortwave cloud radiative effect at TOA and this masking effect. Using the decomposition of SWCRFTOA into contributions from nine cloud types (Eq. 1), we have:
where CFc and CRc are the cloud fraction and intrinsic cloud radiative effect for cloud type c, respectively.
Thus, the monthly anomalies of grid RSRcloud can be decomposed as follows:
The first two terms on the right-hand side represent the anomalies in RSRcloud driven by changes in CF and CR, respectively, and the third term is their co-variation. The fourth term, −ΔFmask, represents the anomalies in RSRcloud arising from changes in the cloud masking effect (ΔFmask). It is important to note that the cloud masking effect (ΔFmask) is intrinsically tied to changes in CF and CR. Building on this decomposition, we can further investigate the sources of trends in RSRcloud across different latitudinal zones. Note that in Fig. 4c, we plot the trends in −ΔFmask term but not ΔFmask to show its contribution to ΔRSRcloud trends.
It is important to clarify that SWCRFTOA used here differs from the surface shortwave cloud radiative effect () employed in Sect. 2.3 to compute the cloud contribution to Ts trends; the latter is a surface flux quantity. SWCRFTOA is used here solely for decomposing RSRcloud and is not employed in subsequent analyses.
2.5 Quantifying Meteorological Contributions to Cloud Fraction Anomalies
To investigate the drivers of observed CF trends, we perform a stepwise multiple linear regression linking monthly CF anomalies for each cloud type to a set of relevant cloud-controlling variables. The cloud-controlling factors for low-level clouds have been extensively discussed in previous studies (Qu et al., 2015; Klein et al., 2017; Scott et al., 2020; Andersen et al., 2022; Naud et al., 2023; Li et al., 2025c; Naud et al., 2025), and those for high clouds have also been examined (Wilson Kemsley et al., 2024). In contrast, studies focusing on the controlling factors for middle-level clouds remain limited. Therefore, we select a set of candidate factors for middle clouds from dynamical, thermodynamical, and microphysical perspectives. Based on established physical understanding of cloud formation and dissipation, we select a set of cloud-controlling factors for each cloud height category (low, middle, and high clouds) as shown in Table 1. The detailed calculation methods for several variable selections are presented in Appendix A. All meteorological variables used in the calculations are derived from monthly mean ERA5 pressure-level data, while AOD is obtained from MERRA-2 monthly mean products.
Importantly, the observed CF trends and associated cloud-radiative changes may reflect a combination of aerosol-driven cloud adjustments (Bellouin et al., 2020), rapid adjustments to greenhouse-gas forcing and temperature-mediated cloud feedbacks (Zelinka et al., 2013; Sherwood et al., 2015), and internal climate variability (Zhou et al., 2016). Because each predictor may respond to more than one of these processes, the regression quantifies statistical relationships and trend contributions but does not uniquely attribute the observed trends to individual forcing, adjustment, internal-variability, or feedback components.
Table 1Cloud controlling factors for low, middle, and high clouds.
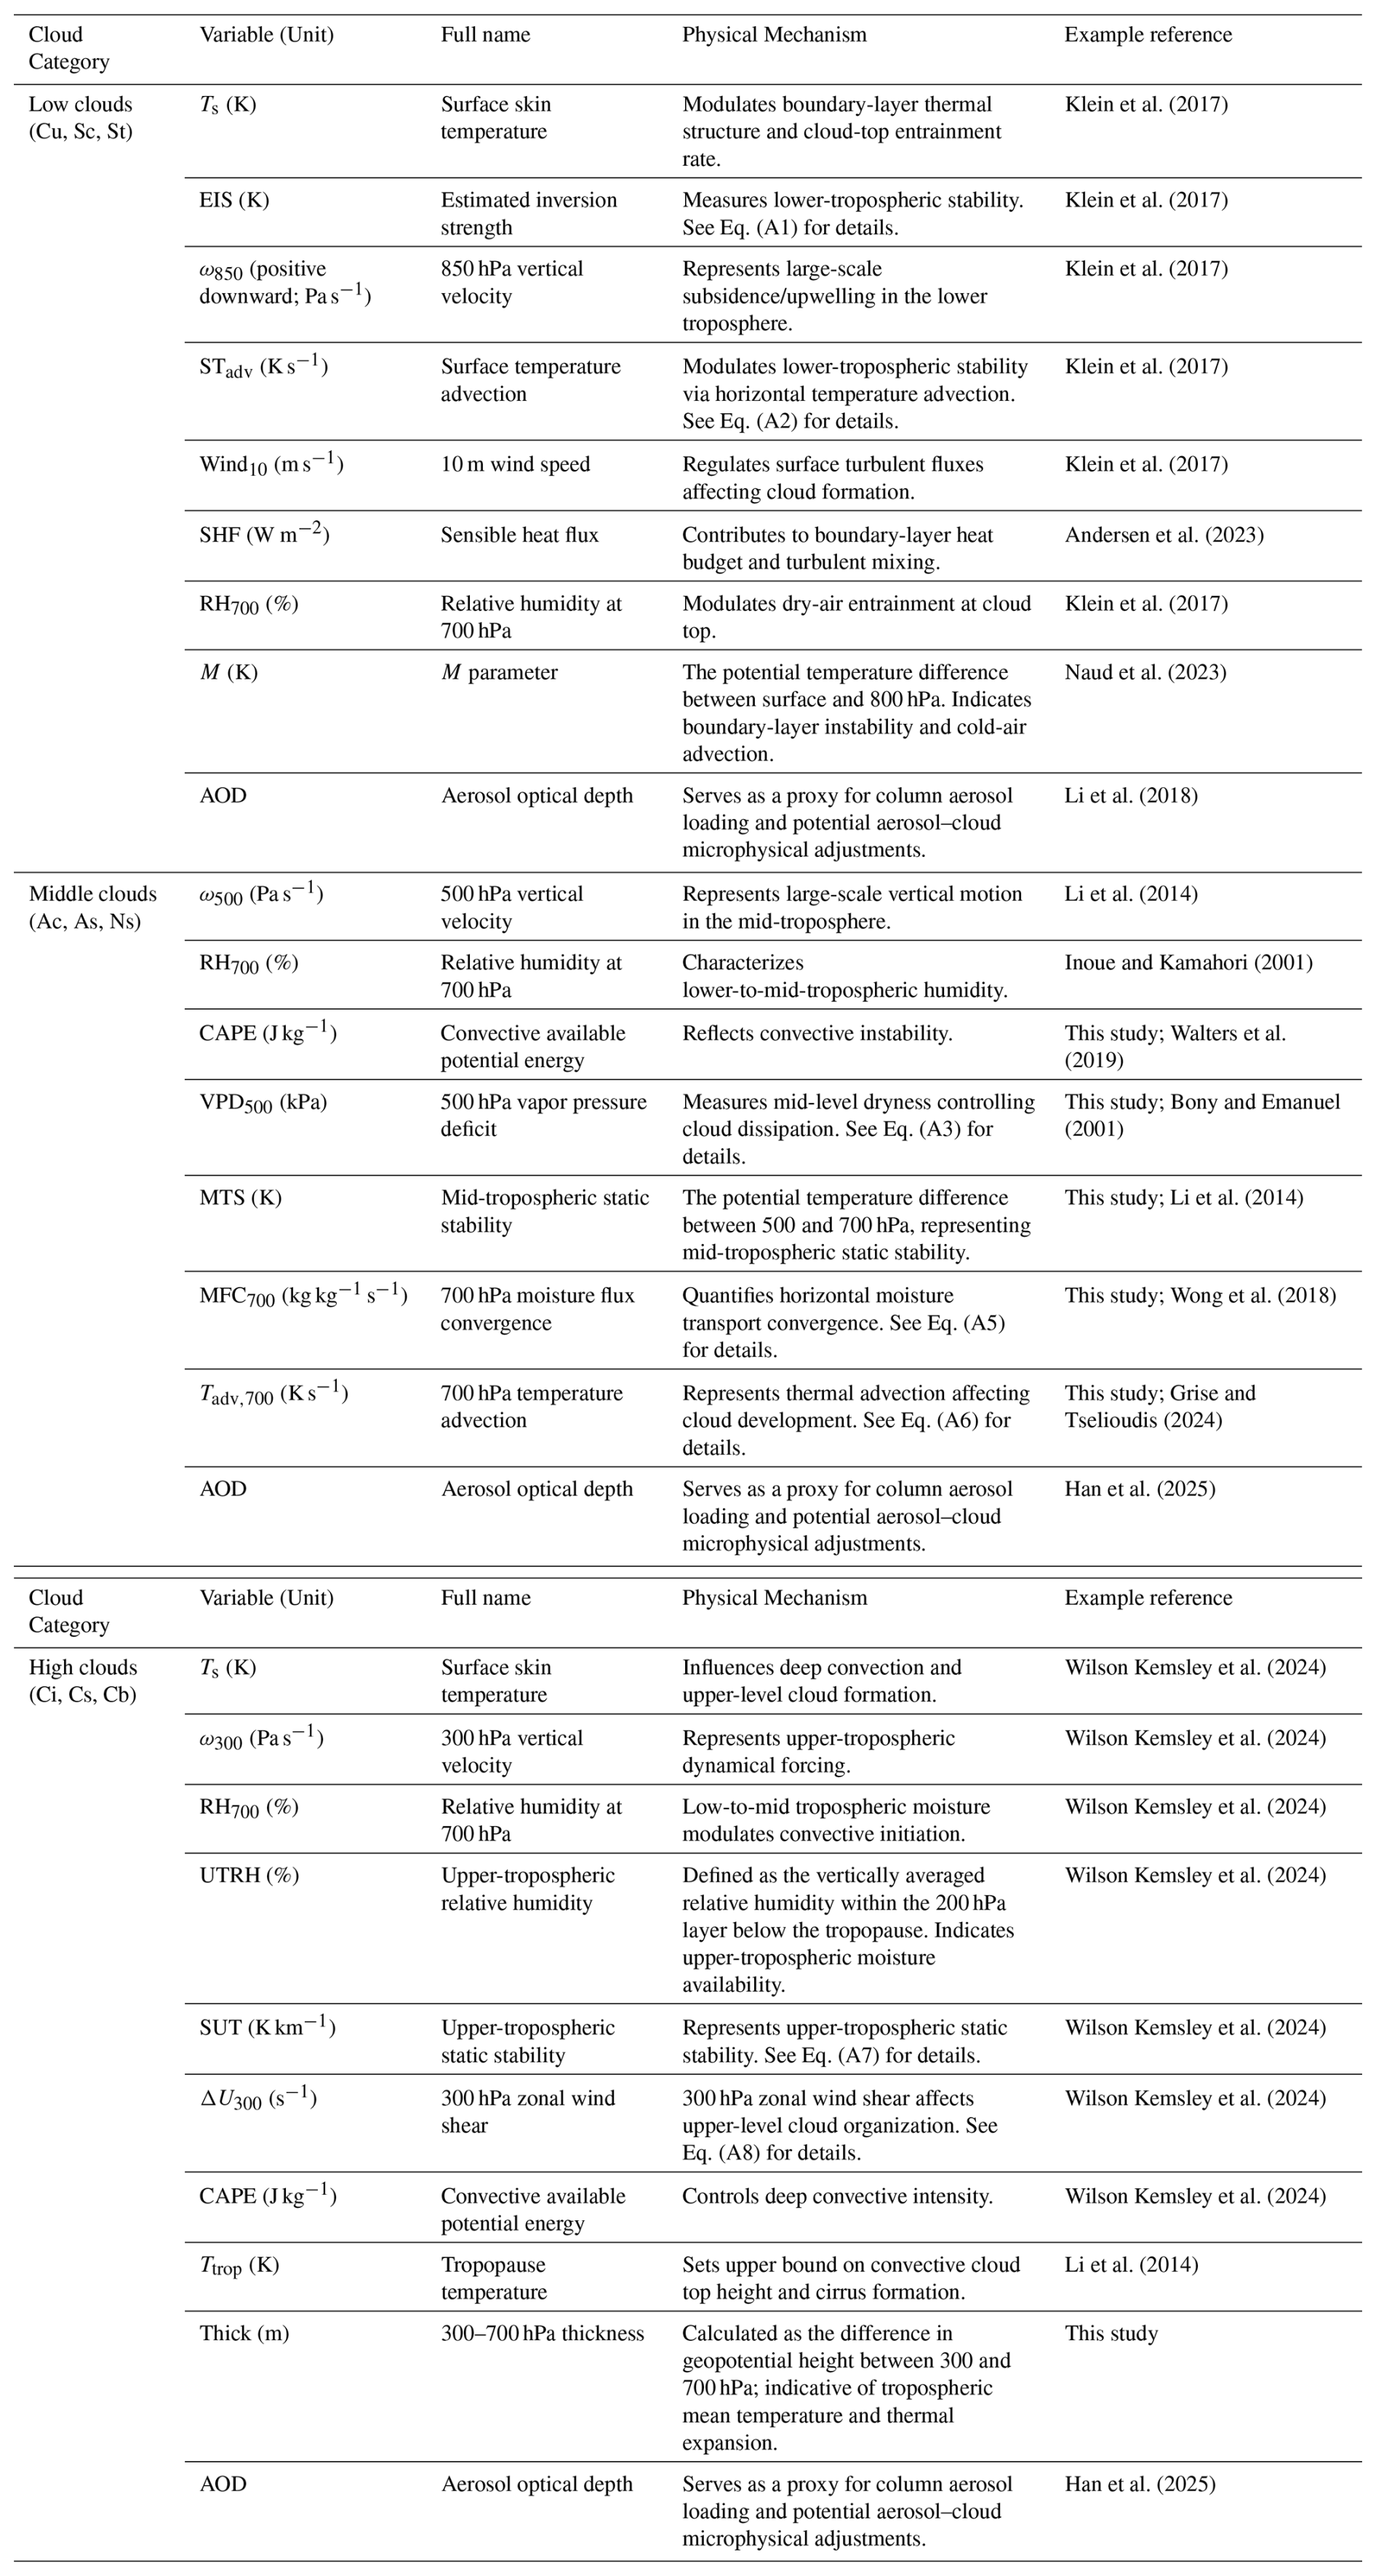
Note: Factors labeled “This study” were not adopted directly from an established cloud-controlling-factor framework but were selected based on their expected dynamical or thermodynamic relevance to the corresponding cloud category. The accompanying references support the physical basis of the factor, although they may not use the identical variable definition or pressure level adopted here.
For each grid cell and cloud type, we first remove the seasonal cycles from CF and the meteorological predictors. To prevent common long-term trends from biasing the regression coefficients, linear trends are then removed from both the deseasonalized CF and predictor anomalies. The detrended predictor anomalies are standardized, whereas the detrended CF anomalies remain unstandardized. A stepwise multiple linear regression is then fitted as:
where is the detrended CF anomaly for cloud type c at location x and time t, is the detrended and standardized anomaly of the kth meteorological variable, βk are the regression coefficients, and β0 is the intercept. The stepwise procedure is implemented with an entry significance level of p<0.05 and a removal significance level of p<0.10, ensuring that only variables with statistically meaningful explanatory power are retained. Because only the predictors are standardized, the resulting coefficients βk represent the change in CF per unit standard deviation (SD) change in each predictor.
To estimate each factor's contribution to the observed CF trend, we apply the regression coefficient to the deseasonalized predictor anomaly before detrending, thereby retaining its observed long-term trend:
where denotes the deseasonalized predictor anomaly retaining its linear trend and scaled using the same standard deviation as in Eq. (17). For each of the six latitude zones, cloud type, and meteorological variable, we compute the area-weighted zonal mean contribution at each month. For each resulting zonal-mean time series, we then estimate the linear trend (% per decade) using ordinary least squares, representing the contribution of each meteorological factor to the long-term CF trend in that latitude zone.
2.6 Quantification of TOA longwave cloud masking
The conventional TOA longwave cloud radiative effect (LWCRE) is defined as the difference between clear-sky and all-sky outgoing longwave radiation.
It can also be partitioned among the nine cloud types. For cloud type c, its contribution is calculated as
where OLRc is the overcast outgoing longwave radiation for cloud type c, OLRclr is the corresponding clear-sky outgoing longwave radiation, and CFc is the fractional coverage of that cloud type. Summing LWCRETOA,c across the nine cloud types gives the total LWCRETOA.
Changes in LWCRE do not arise exclusively from changes in cloud properties. Clouds modify the TOA radiative response to changes in non-cloud variables. For example, the radiative effects of changes in surface and atmospheric temperature, water vapor, greenhouse-gas concentrations, and ozone generally differ between clear-sky and cloudy conditions because clouds partly obscure longwave emission from the surface and lower atmosphere. Consequently, changes in these non-cloud variables can produce a change in LWCRE even if the clouds themselves remain unchanged. This contribution is referred to as the cloud-masking effect (Soden et al., 2004, 2008).
An LWCRE anomaly can therefore be expressed as
where the longwave cloud-masking component is
and x represents surface temperature (Ts), atmospheric temperature (Ta), water vapor (H2O), well-mixed greenhouse gases (GHGs, including CO2, CH4, N2O, CFCs, and HFCs), and ozone (O3). We quantified these components using the publicly available ERA5 partial radiation perturbation (ERA5–PRP) dataset (Raghuraman et al., 2023b), following the methodology described by Raghuraman et al. (2023a). The dataset was generated using a two-sided PRP method with ERA5 monthly atmospheric fields, observed greenhouse-gas concentrations, and the offline RRTMGP radiative-transfer model. For each non-cloud variable, its cloud-masking contribution was calculated as the difference between its clear-sky and all-sky TOA longwave radiative perturbations.
As the ERA5–PRP dataset is available only through December 2020, this analysis covers the common period from July 2002 to December 2020, rather than the full July 2002–February 2023 period used in the main analysis. We use this overlapping period to demonstrate the magnitude and importance of longwave cloud masking rather than to extend the masking estimate over the full study period. The cloud-type decomposition is therefore interpreted as the observed LWCRE associated with each cloud category, which includes both cloud-property changes and cloud-masking contributions.
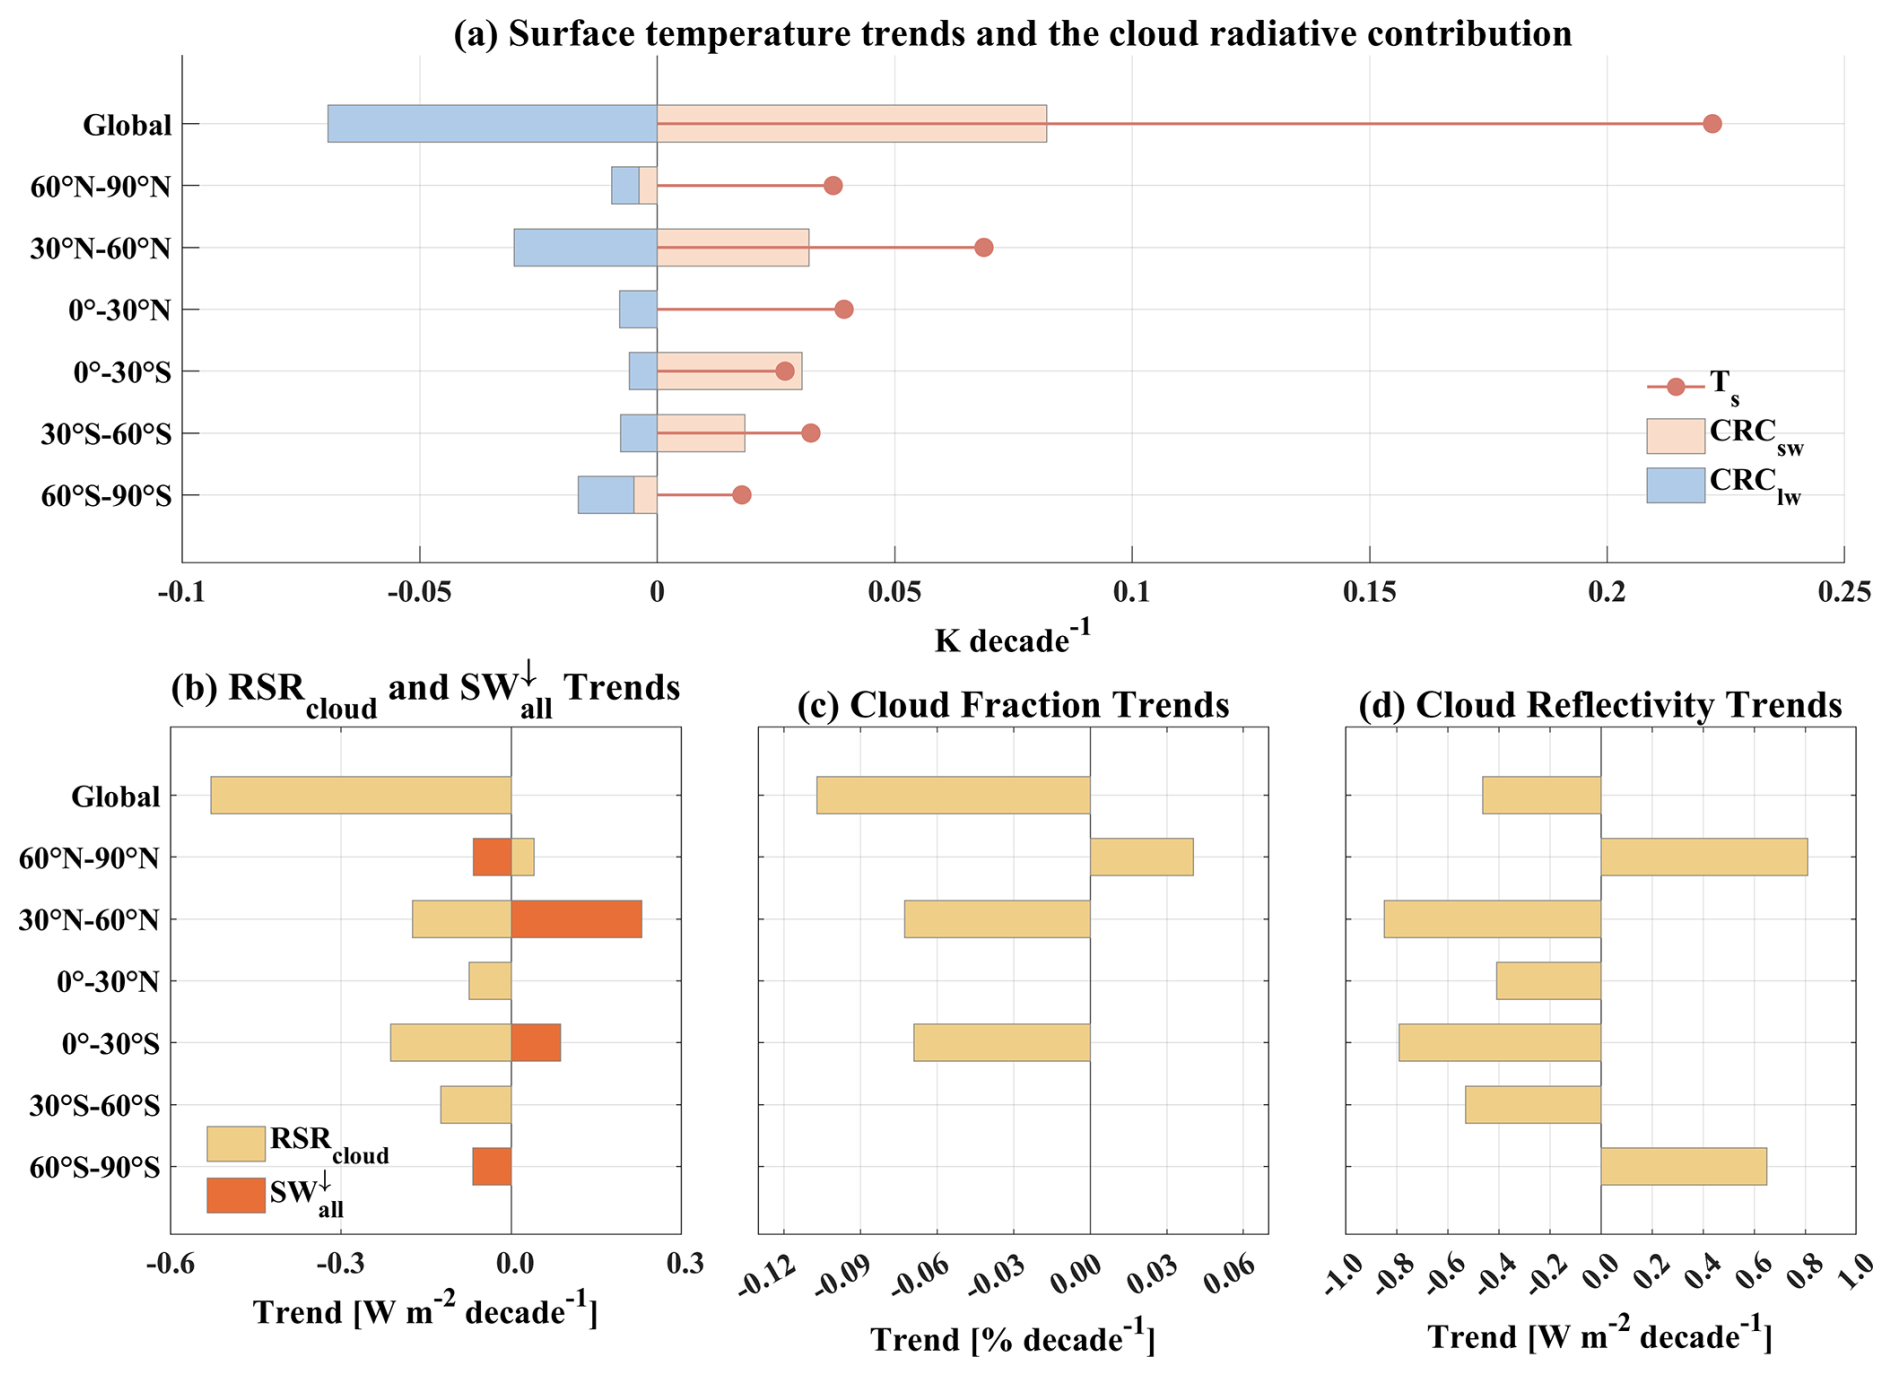
Figure 1(a) ERA5 Ts trends from July 2002 to February 2023 and the Ts trends caused by changes in surface shortwave and longwave cloud radiative forcing (CRCsw and CRClw) (methodology detailed in Sect. 2.3). (b) Global and latitude-zone averaged trends in the all-sky surface downward shortwave radiation fluxes ()and the cloud component of TOA RSR (RSRcloud), (c) CF, and (d) CR. Note that the latitudinal-mean trends in (a)–(c) are weighted by their area to account for their contributions to the global mean; the sum of the zonal trends approximately equals the global trend. Only trends significant at the 95 % confidence level are shown.
3.1 Surface Warming Trends and the Radiative Contribution from Clouds
Figure 1a shows the global and latitude-zone averaged Ts warming trend along with the Ts trends caused by changes in the surface shortwave and longwave cloud radiative forcing. Note that the latitudinal-mean values are area-weighted, and thus the sum of the zonal-mean trends constitutes the global trend. From 2002 to 2023, the global average Ts rose significantly by 0.22 K per decade. While the fastest warming occurred in the high-latitudes of the Northern Hemisphere (NH) (Fig. S2), the NH mid-latitudes contributes most to the global warming trend (Fig. 1a), primarily over Europe, the North Pacific, and the western Atlantic off the southeastern coast of North America (Fig. S2).
Previous research emphasized the role of longwave radiation in surface warming, particularly from greenhouse gases like water vapor. While clouds also contribute to the greenhouse effect by absorbing and re-emitting longwave radiation (Arking, 1991), cloud changes over the past two decades have induced a longwave cooling effect on Ts trends (Fig. 1a). This implies that the longwave effects alone are inadequate to accurately understand clouds' full radiative contribution to Ts trends. In fact, the radiative influence of clouds on the surface is twofold, involving longwave warming and shortwave cooling effects (Arking, 1991; Hartmann and Doelling, 1991; Wood, 2012). Changes in cloud properties also modify the amount of shortwave radiation reflected by clouds, thereby influencing the solar radiation reaching the surface. Although the surface longwave warming effect has weakened, the shortwave cooling effect has diminished even more markedly. Consequently, clouds have exerted a strong positive (warming) shortwave contribution that outweighs the negative longwave contribution, leading to a net enhancement of the global Ts trend, with notable latitudinal differences (Fig. 1a). Globally, the opposing shortwave and longwave cloud contributions largely cancel, resulting in a modest net cloud-induced warming of approximately 0.013 K per decade (derived from the sum of CRCsw and CRClw in Fig. 1a). This suggests that non-cloud components – such as clear-sky greenhouse gas forcing – are the primary drivers of the global mean Ts trend.
However, the near-cancellation at the global scale belies the critical role of clouds in affecting the meridional variation of zonal-mean warming. The individual shortwave and longwave cloud effects represent large, opposing radiative perturbations, quantifying them separately is therefore essential for characterizing their contributions to the observed meridional warming pattern. At low and mid-latitudes, these effects compete: changes in CRCsw enhance surface warming, while the CRClw partially offset it. Notably, in the Southern Hemisphere (SH) low latitudes, the CRCsw trend even exceeds the total Ts warming trend, which is partially offset by a negative CRClwtrend. In the mid-latitudes of both hemispheres, the trends in the CRCsw account for 57 % (SH) and 47 % (NH) of their Ts warming trend, underscoring its important role in the warming. In contrast, at high latitudes, the effects combine, as both cloud shortwave and longwave effects contribute to negative Ts trends, indicating that cloud changes partially mitigate polar warming (Kay and Gettelman, 2009; Alkama et al., 2020; Sledd and L'Ecuyer, 2021). Therefore, while the global net cloud impact on the Ts trend is small, clouds exert a meridionally contrasting influence that is fundamental to understanding the observed pattern of climate change.
To further investigate the drivers of cloud-induced Ts trends, Fig. 1b shows the global and latitude-zone averaged trends in surface downwelling shortwave radiation under all-sky condition (). While the directly affects surface energy balance, its changes are fundamentally governed by cloud-induced changes in RSR at the TOA. We therefore also examine the trends in cloud component of TOA RSR (RSRcloud) (Fig. 1b) and its key drivers – CF (Fig. 1c) and CR (Fig. 1d). In 30–60° N and 0–30° S, the shortwave warming contribution from clouds (Fig.1a) is primarily due to significant increased solar radiation reaching the surface (Fig. 1b), resulting from reduced RSRcloud (Fig. 1b), which is driven by both decreased CF (Fig. 1c) and reduced CR (Fig. 1d). This finding is consistent with Goessling et al. (2025), who highlighted that the recent decline in PA, particularly the record-low value in 2023, was predominantly driven by reduced low-level cloud cover over NH mid-latitudes and tropics, substantially amplifying global warming. In 0–30° N, although decreased CR leads to significantly less RSRcloud, the solar radiation reaching the surface shows no significant increase (Fig. 1b), likely due to enhanced absorption by atmospheric water vapor (Loeb et al., 2021). Consequently, the shortwave cloud contribution to Ts trends is not significant here (Fig. 1a). Differently, in 30–60° S, despite no significant trend in (Figs. 1b, S3a), clouds exhibit a substantially positive shortwave contribution to the Ts trend (Fig. 1a). This is because a decrease in RSRcloud related to reduced CR contributes to an increase in solar radiation reaching the surface, which offsets the concurrent reduction in clear-sky surface downwelling solar radiation (Fig. S3b). This clear-sky reduction may reflect increased atmospheric attenuation associated with greater aerosol extinction and stronger water-vapor absorption (Haywood and Boucher, 2000; Wild, 2009; Trenberth et al., 2009; Li et al., 2024b). Therefore, clouds exert a positive shortwave contribution to Ts trends by counteracting the observed clear-sky reduction. Conversely, at high latitudes, increased CF and enhanced CR result in more solar radiation being reflected, reducing the solar radiation reaching the surface (Fig. 1b) and thereby partially mitigating surface warming.
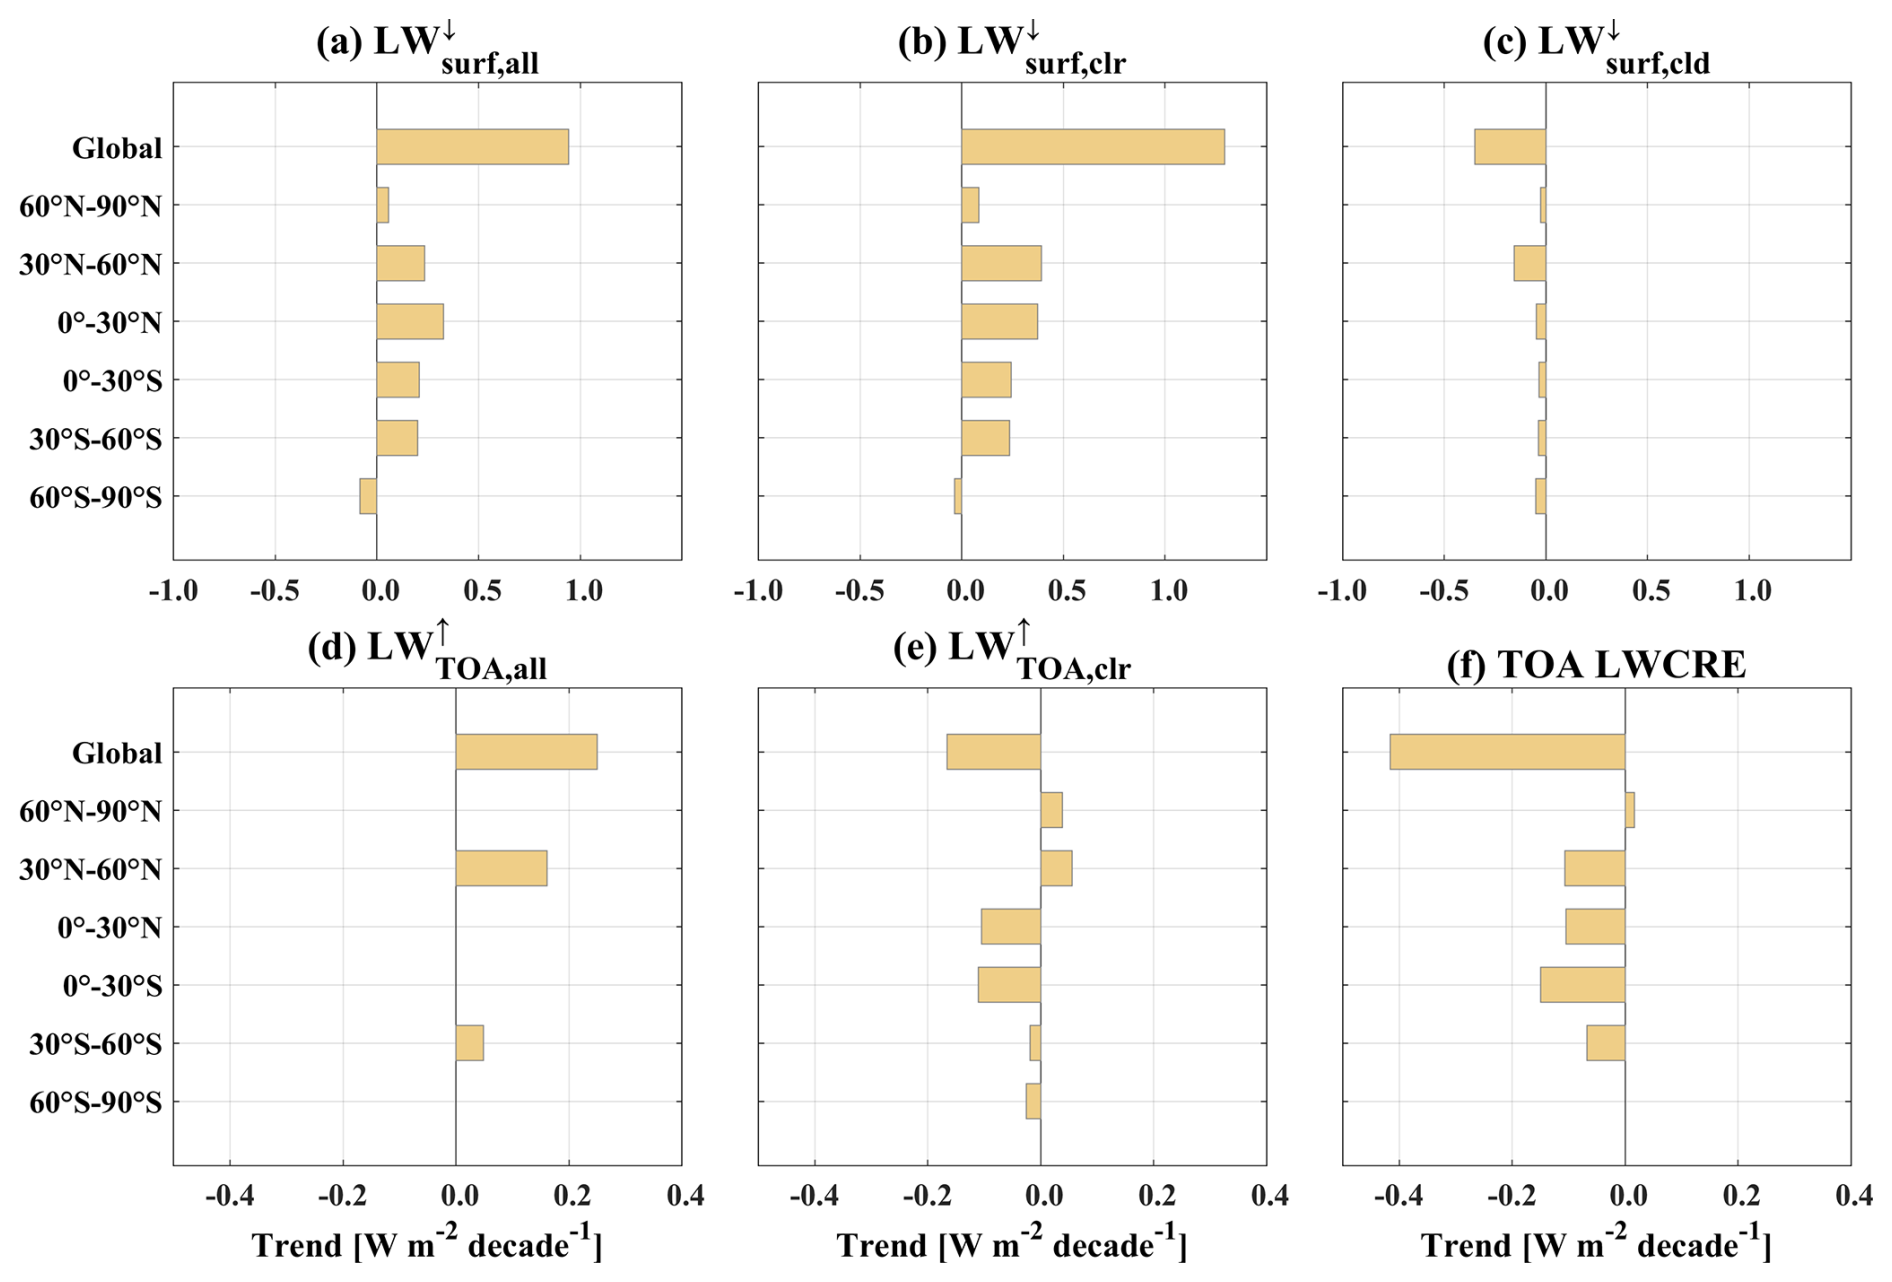
Figure 2Global and latitude-zone averaged trends in longwave radiation fluxes from July 2002 to February 2023. (a) All-sky surface downward longwave radiation (), (b) clear-sky surface downward longwave radiation (), and (c) the difference between all-sky and clear-sky conditions ( =). (d) All-sky TOA outgoing longwave radiation (), (e) clear-sky TOA outgoing longwave radiation (), (f) TOA longwave cloud radiative effect (TOA LWCRE = ). Note that latitudinal-mean trends are area-weighted to account for their contributions to the global mean; the sum of the zonal trends approximately equals the global mean. Only trends significant at the 95 % confidence level are shown.
Concurrently, changes in cloud properties can also affect trends in the longwave cloud contribution to Ts trends (CRClw). Fig. 2 shows the trends in surface and TOA longwave radiation fluxes. In the 30–60° N and 0–30° S regions, although clear-sky components (e.g., water vapor and greenhouse gases) lead to an increasing trend in surface downward longwave radiation (Fig. 2b), the significant decrease in CF (Fig. 1c) causes the cloud-induced change in surface downward longwave radiation (i.e., the difference between all-sky and clear-sky; Fig. 2c) to exhibit negative trends. This indicates a weakened cloud greenhouse effect, allowing more surface heat to escape to space and thereby partially offsetting surface warming (Fig. 1a). Similarly, Liu et al. (2025) identified a widespread negative longwave cloud feedback over low- and mid-latitude continents, where declining low-level cloud cover reduces downwelling longwave radiation and partially mitigates surface warming. However, in the NH high latitudes, despite a significant increase in total CF, the cloud-induced change in surface downward longwave radiation shows a decreasing trend (Fig. 2c). One possible explanation is the observed redistribution of cloud vertical structure. Because cloud-base temperature generally decreases with increasing cloud-base height, lower and warmer clouds typically emit more longwave radiation toward the surface than higher and colder clouds (Intrieri et al., 2002; Shupe and Intrieri, 2004; Viúdez-Mora et al., 2015). Consequently, the concurrent decrease in low-level clouds and increase in high-level clouds may contribute to the reduction in cloud-related surface downwelling longwave radiation. At the TOA, the outgoing longwave radiation (OLR) trends (Fig. 2d–f) further support these interpretations. Over 30–60° N and 0–30° S, the reduction in CF allows more longwave radiation to escape to space, resulting in an increase in outgoing longwave radiation, corresponding to a negative TOA LWCRE trend. In contrast, over the NH high latitudes, the increase in high clouds (with colder cloud tops) reduces the OLR emitted to space. Overall, the changes in cloud amount and reflectivity are both relevant to the contrasting shortwave and longwave cloud contributions. The cloud-type analysis below evaluates these contributions more directly.
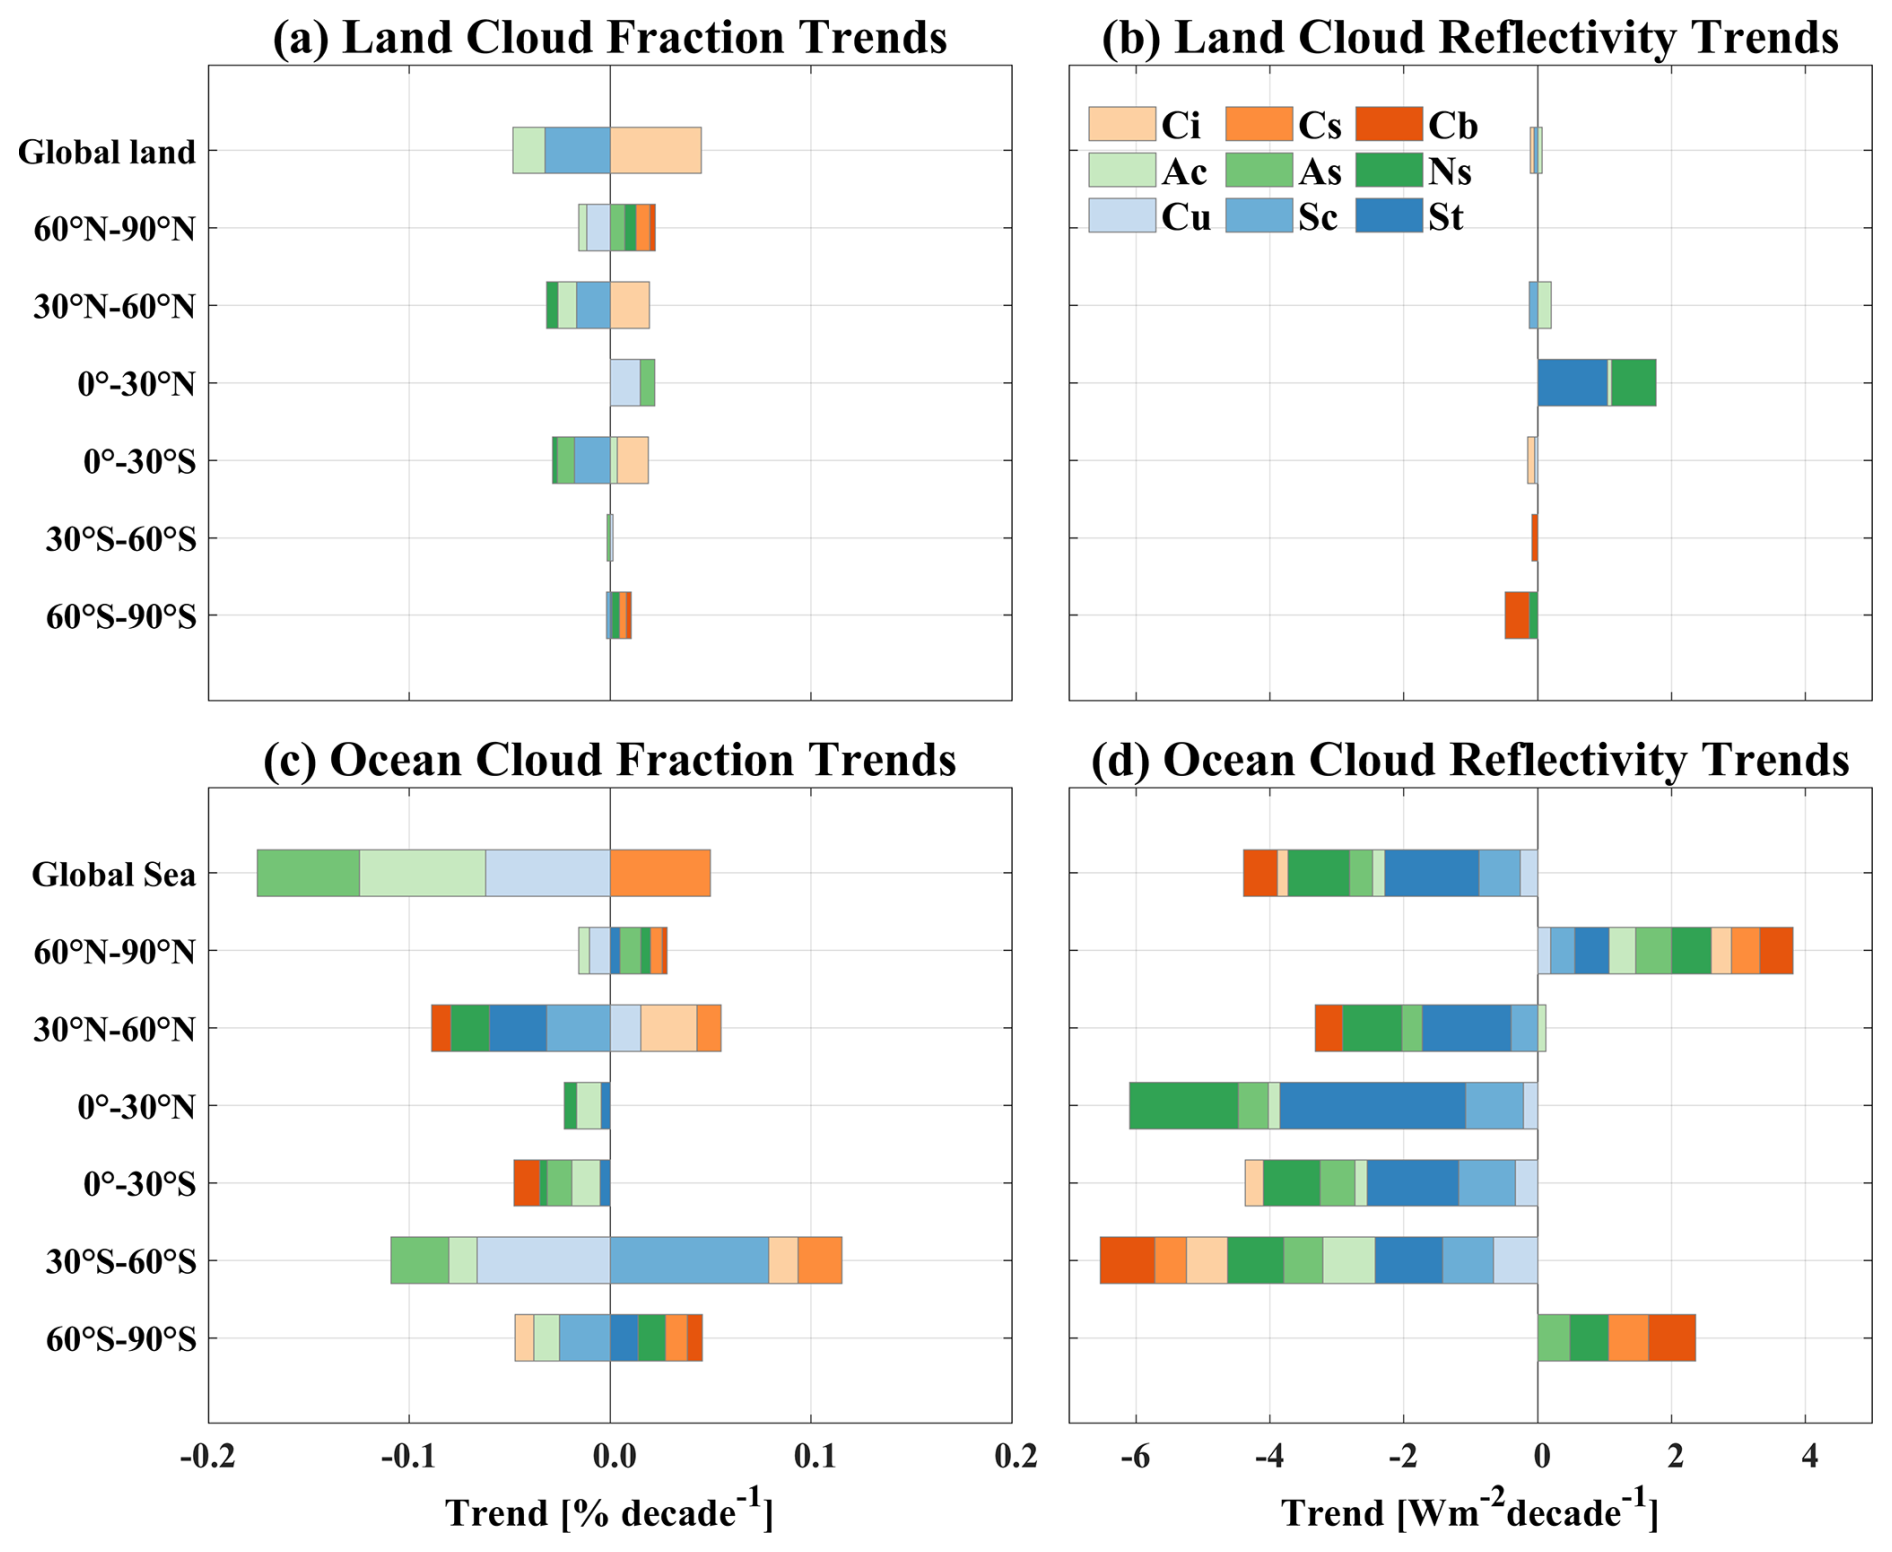
Figure 3Latitude-zone and global averaged trends (July 2002 to February 2023) for CF and CR over (a–b) lands and (c–d) oceans. The CF trends for each zone are area-weighted to represent global contributions. Only trends significant at the 95 % confidence level are shown.
3.2 The Key Role of Cloud-type changes and Its Potential Mechanisms
Given the distinct radiative properties of clouds at different altitudes and optical depths (Hartmann et al., 1992), systematic changes in their distribution and characteristics significantly influence the cloud radiative effects and their contribution to Ts trends. The signal of these changes, however, is often masked within analyses of total cloud properties. To clarify this issue, we first examine the observed trends in CF and CR across nine cloud types (Fig. S4). These trends vary substantially between land and ocean (Fig. 3). We then quantify how these CF and CR changes affect the reflected solar radiation by clouds (RSRcloud). Figure 4 displays the global and latitude-zone averaged RSRcloud trends driven by changes in CF and CR across nine cloud types.
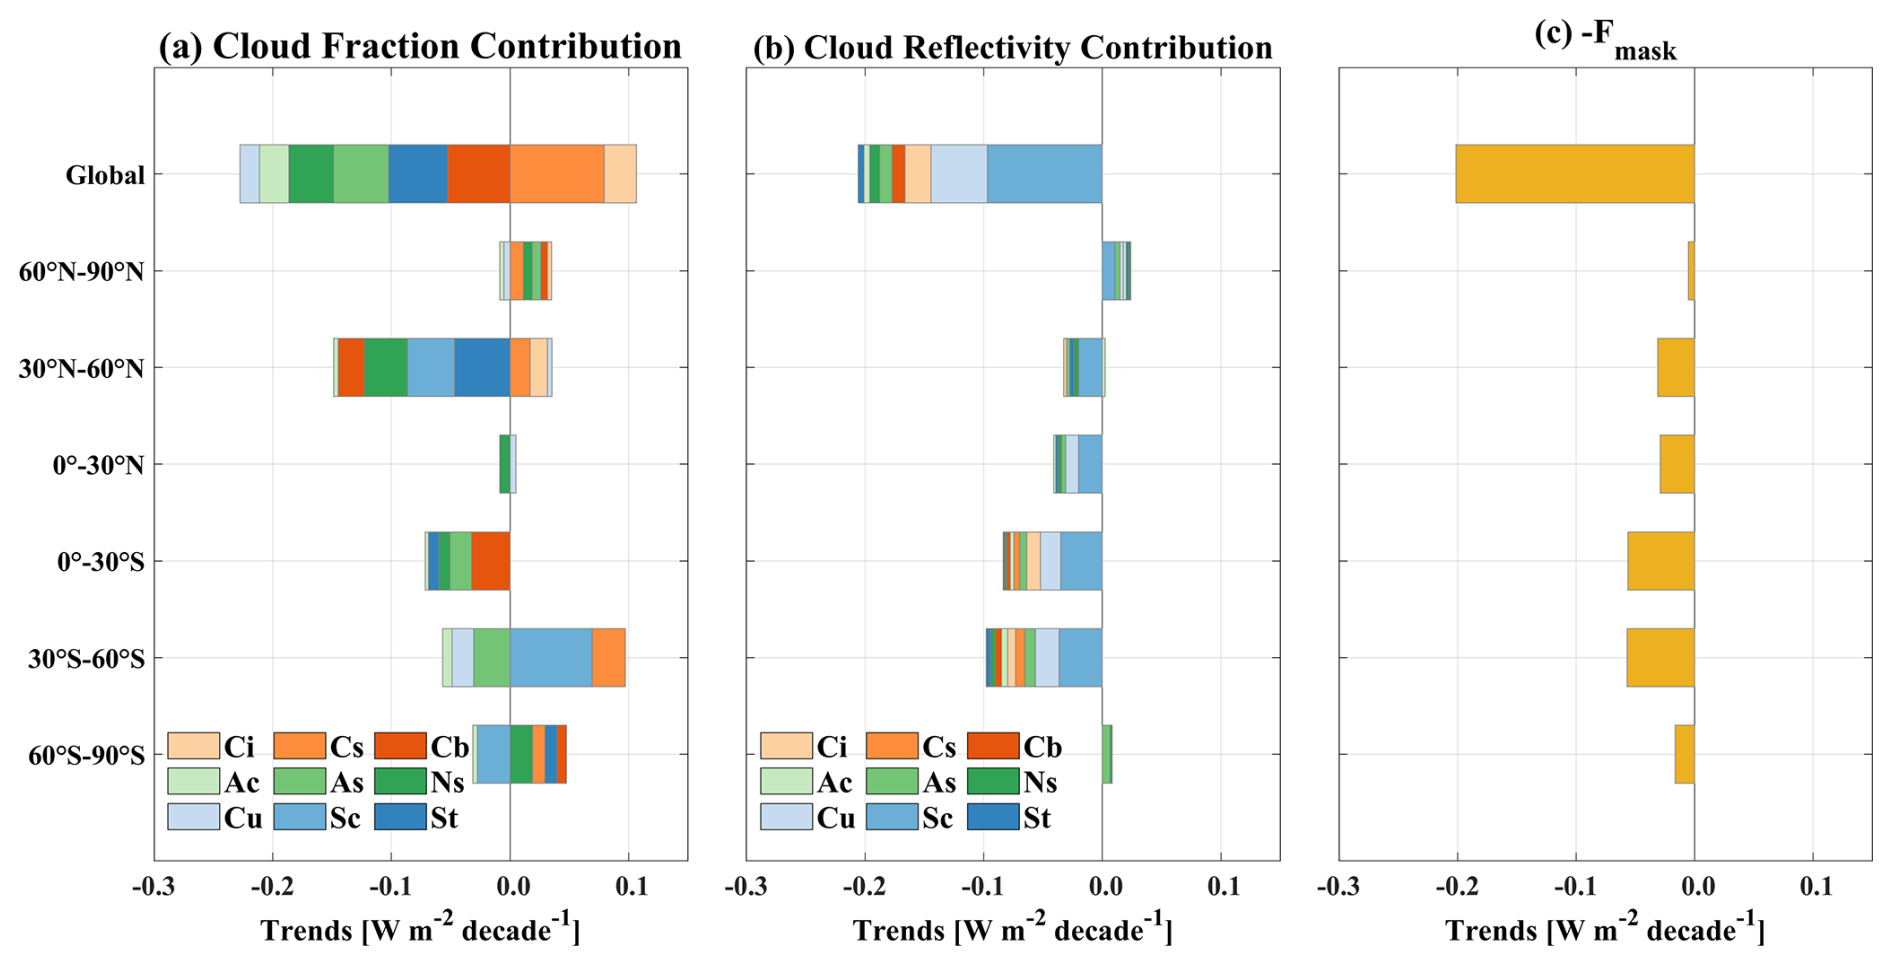
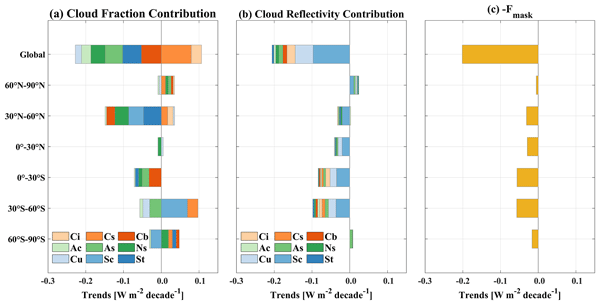
Figure 4The trends in domain-averaged RSRcloud caused by the changes in (a) CF and (b) CR across nine cloud types, and (c) the cloud masking effect (−ΔFmask), at global and latitudinal scales, sorted in descending order of magnitude. Note that the latitudinal-mean trends are weighted by their area to account for their contributions to the global mean; the sum of the zonal trends approximately equals the global trend. Only trends significant at the 95 % confidence level are shown.
Globally, the decline in RSRcloud is predominantly driven by the reduced CR, with the CF playing a secondary role (Fig. 4a, b). Specifically, the global RSRcloud reduction trend of −0.22 W m−2 per decade (the sum of contributions from all cloud types, including non-significant ones) is attributed to the cumulative decrease in CR of most cloud types (Fig. 4b), whereas the reduction of −0.14 W m−2 per decade arises from compensating CF changes among different cloud types (Fig. 4a). The CF contribution reflects concurrent decreases in low-level (St and Cu), mid-level, and Cb clouds, which are partly offset by increases in optically thin high clouds (Cs and Ci). This redistribution among distinct cloud types and altitude categories is associated with broader changes in atmospheric circulation and thermodynamic conditions. As a result, the negative RSRcloud contributions from the displaced low-level, mid-level, and Cb clouds are partially offset by the positive contributions from the increasing high-level optically thin clouds. This change would also reduce the downwelling longwave emission from clouds to the surface, thereby confirming the observed longwave cooling contribution of clouds to the Ts trend (Fig. 1a). The potential role of cloud masking effects will be discussed later in this section.
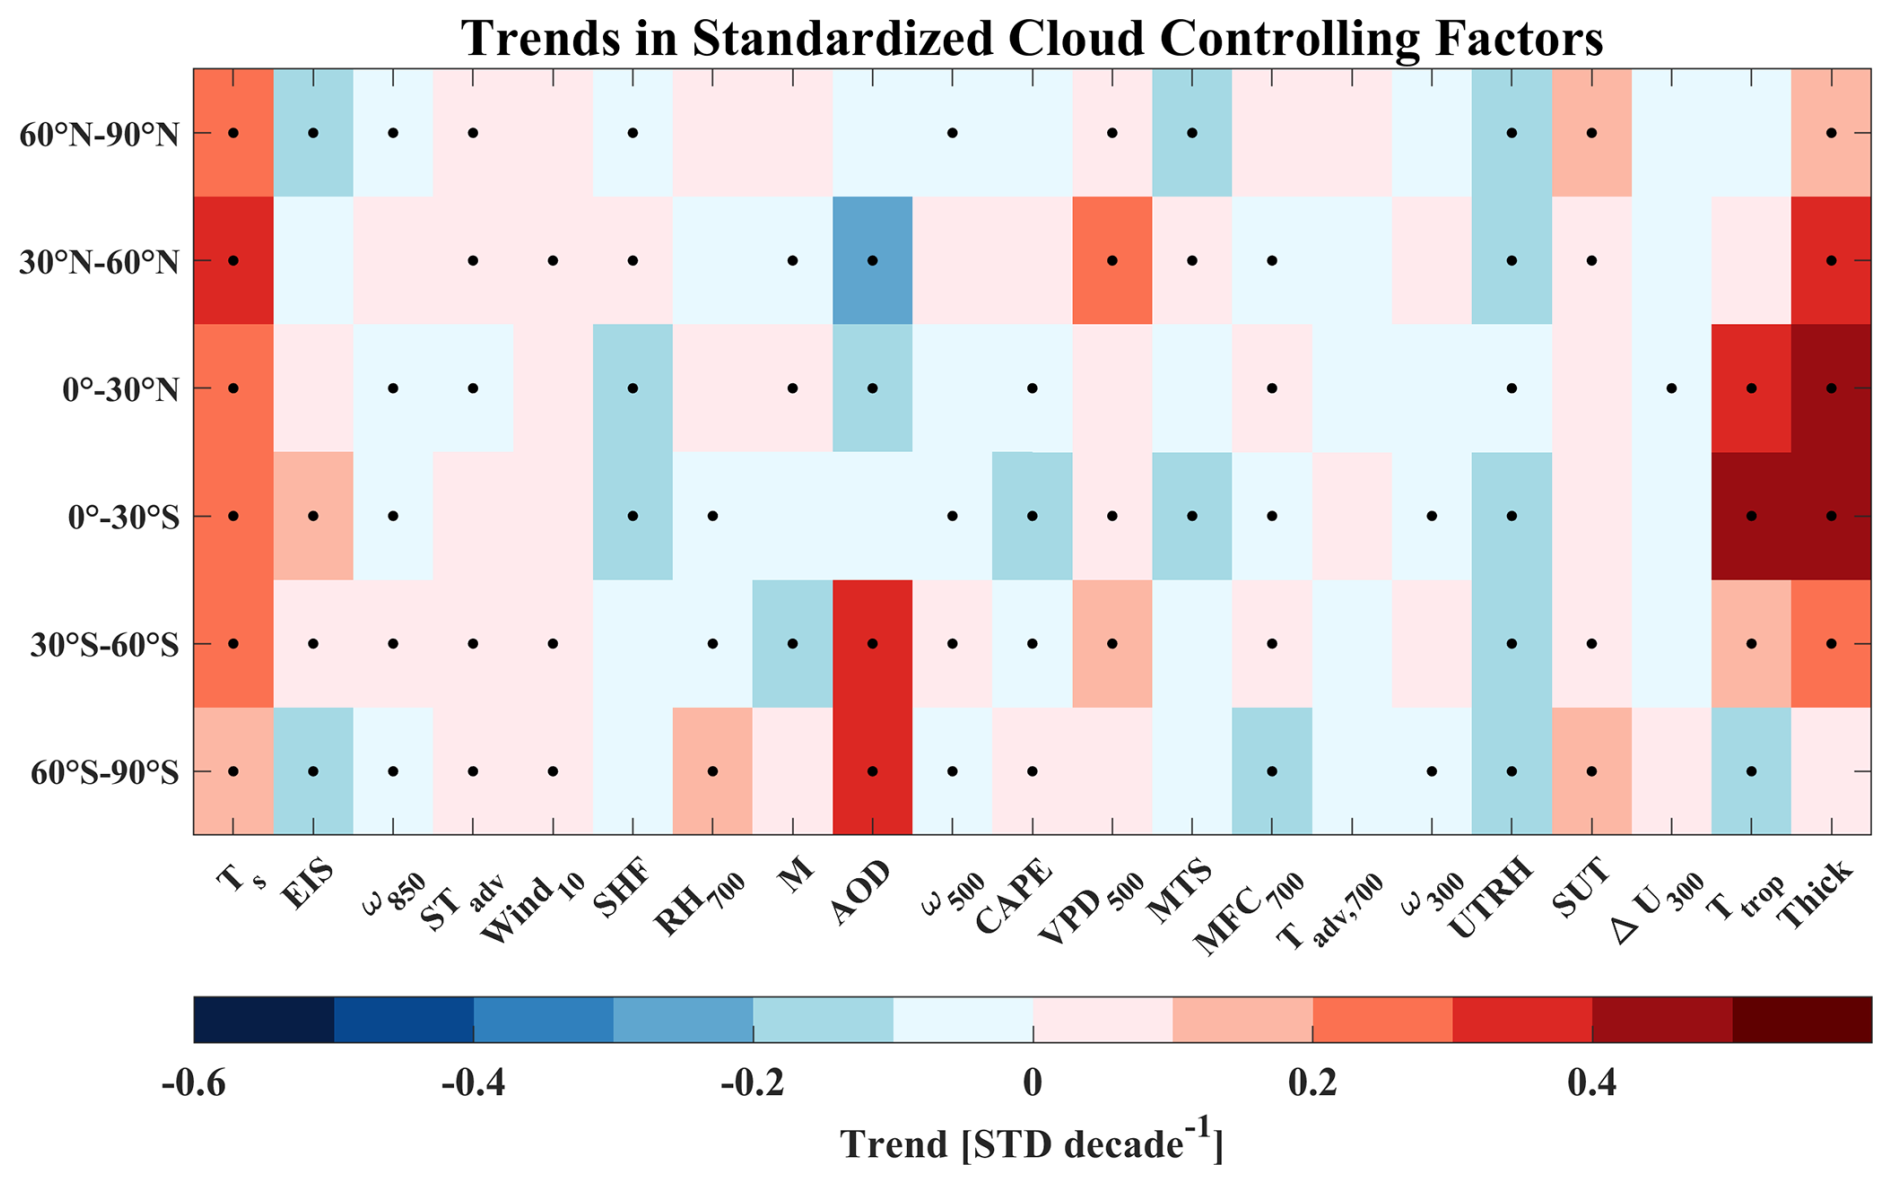
Figure 5Decadal trends of standardized cloud controlling factors over the period 2002–2023 (units: per decade). Black dots indicate trends that are statistically significant at the 95 % confidence level (p<0.05). The factor list includes all variables considered for low-, mid-, and high-level cloud analyses.
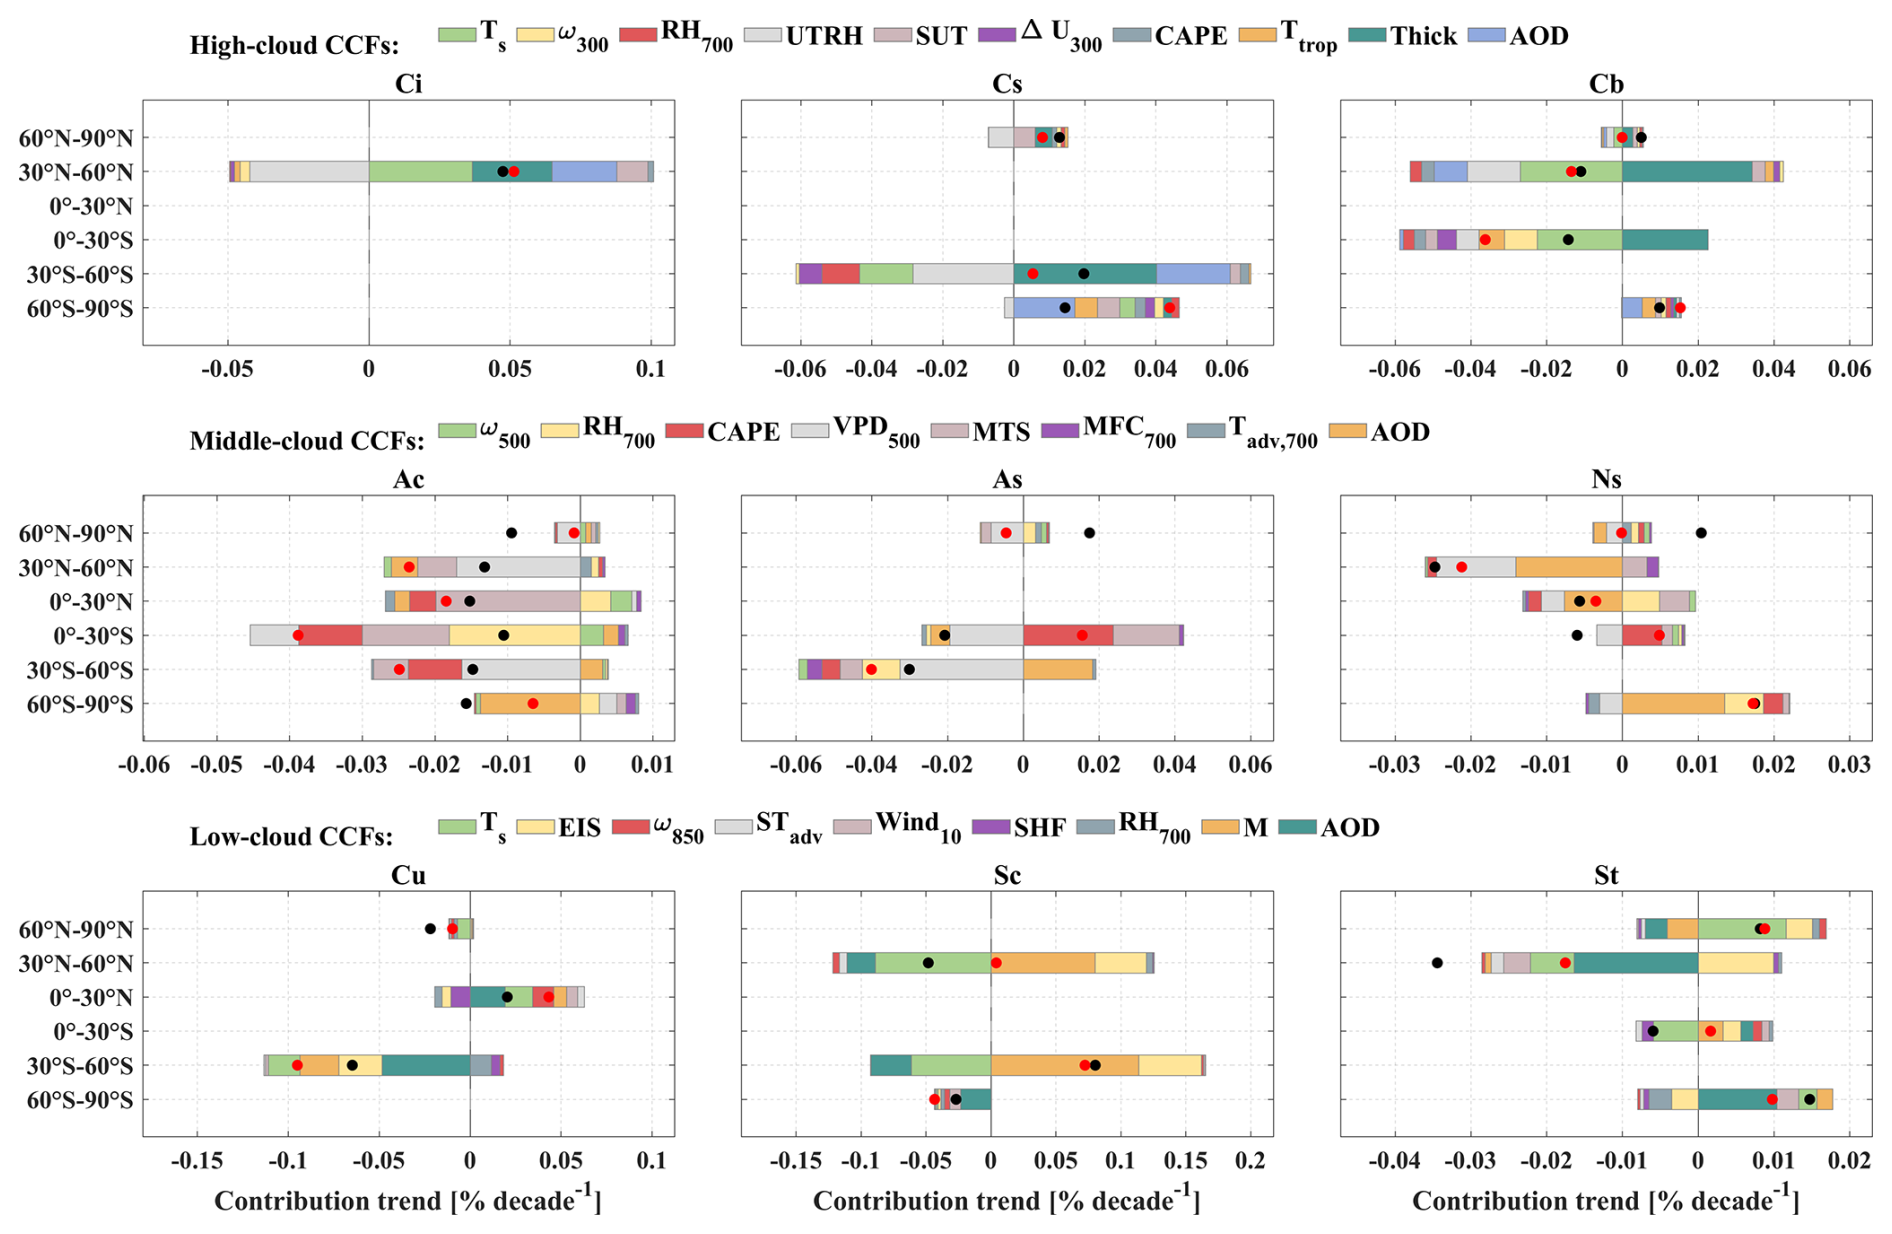
Figure 6Contributions of meteorological factors to CF trends (% per decade) for nine cloud types across six latitude zones, sorted in descending order of magnitude. Black dots indicate the observed significant CF trend, while red dots denote the sum of factor contributions. Latitudinal means are area-weighted to account for their contributions to the global mean. Only trends significant at the 95 % confidence level are highlighted.
To understand the drivers of the observed CF trends, we perform a stepwise multiple linear regression linking monthly CF anomalies to a set of cloud-controlling factors (Table 1). The temporal correlation coefficient between observed and regressed CF anomalies exceeds 0.6 for Cu, Sc, As, Ci, Cs, and Cb over mid- and low-latitude oceans, and reaches above 0.9 in the tropics (Fig. S5). For other cloud types, the correlation remains above 0.5 in regions where they are climatologically prevalent, indicating reasonable explanatory power. The contributions of each factor to the CF trend are calculated at the grid-cell level (by multiplying the regression coefficient by the local factor trend) and then area-weighted to zonal means. For clarity, we have only presented the zonal-mean coefficients and factor trends as shown in Figs. S6 and 5, respectively. Figure 6 shows the area-weighted contributions of individual factors to the CF trend across nine cloud types and six latitude zones. The close agreement between the observed CF trend and the sum of all CCF contributions indicates that the model captures a reasonable portion of the trends. However, the underlying mechanisms are more complex, and the statistical relationships should not be overinterpreted as a complete physical explanation, particularly for cloud vertical structure and microphysical processes (Wang et al., 2022; Zhao et al., 2026). Nonetheless, the close agreement in Fig. 6 suggests that the selected factors represent the dominant large-scale drivers, especially for cloud types that dominate the RSRcloud decline.
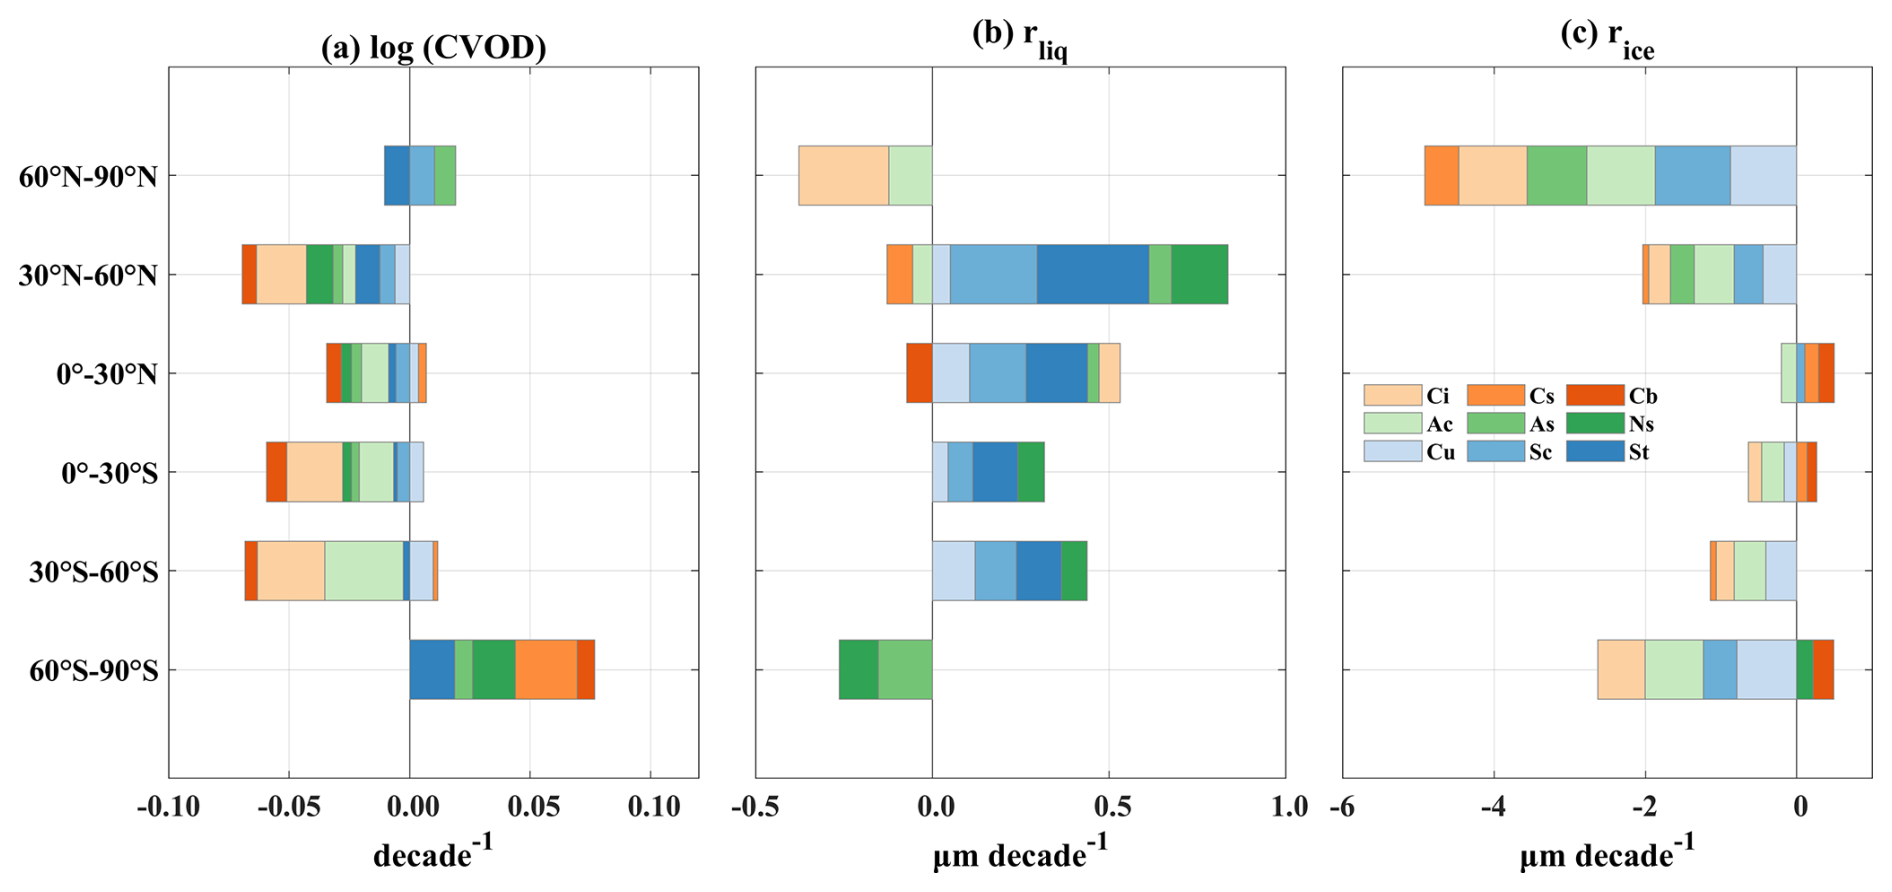
Figure 7Latitude-zone averaged trends in cloud properties (July 2002–February 2023) for (a) logarithm of cloud visible optical depth (log CVOD), (b) liquid cloud particle radius (rliq), and (c) ice cloud particle radius (rice). Only trends significant at the 95 % confidence level are shown.
In contrast, the trends in CR are not explicitly regressed against meteorological factors, as CR is more directly linked to cloud microphysical properties. Figure 7 presents the zonal-mean trends in CVOD and particle radii (rliq, rice), which serve as the primary controls on CR and provide complementary insights into the mechanisms underlying the RSRcloud changes.
The most pronounced reductions in CF contributions occur in the NH mid-latitudes and the SH low latitudes (Fig. 4a). In the NH mid-latitudes, these decreases are most pronounced over the oceans (Fig. 3), mainly attributed to St, Sc, Ns, and Cb. The CF decline of St and Sc, which contribute most to the reduction in RSRcloud, is largely statistically explained by rising Ts and decreasing AOD (Figs. 5, 6). The warming-induced suppression of low clouds is consistent with the positive cloud–temperature feedback mechanisms (Klein et al., 2017; Myers et al., 2018). Meanwhile, the tight coupling between CF reduction and AOD decline explicitly highlights the impact of aerosols on cloud lifetime (Albrecht, 1989). The reduction in aerosol loading may decrease cloud condensation nuclei (CCN) and cloud droplet number concentrations (CDNC), favoring larger droplets and more efficient collision–coalescence and precipitation, which may in turn reduce cloud persistence and fractional coverage (Twomey, 1974, 1977; Albrecht, 1989; Rosenfeld et al., 2019; Bellouin et al., 2020; Szopa et al., 2023). For Ns, the decreasing trend is mainly attributed to reduced AOD and increased mid-tropospheric dryness, as indicated by the positive VPD500 trend. The higher VPD reflects lower relative humidity and less saturated conditions, making it harder for cloud droplets to form and persist, thereby inhibiting cloud growth. The decline in Cb is jointly driven by decreasing UTRH, and reduced AOD, while the increase in tropospheric thickness partially offsets this decline. Although the zonal-mean attribution suggests a substantial contribution from Ts (Fig. 6), this relationship is primarily evident over land (Fig. S7b), whereas the dominant decrease in Cb occurs over oceanic regions (Figs. 3, S7a). Therefore, increasing Ts does not explain the principal oceanic Cb reduction. Furthermore, the decreases in Ns and Cb are statistically consistent with thermodynamic and dynamical changes accompanying large-scale circulation adjustments under global warming. Model projections have suggested that in a warmer climate, baroclinic activity in the NH mid-latitudes may weaken due to Arctic amplification (Hadas et al., 2023). As a result, the frequency and intensity of mid-latitude cyclones are expected to diminish, thereby weakening large-scale ascent and directly reducing storm-associated cloud occurrence. Moreover, Tselioudis et al. (2025) also provide observational evidence of a continuous contraction of mid-latitude storm cloud regions over the past 24 years.
In the SH low latitudes, the largest contribution to the RSRcloud decrease comes from the reduction in Cb, followed by Ns, As, and St. The reduction in Cb is primarily controlled by decreasing trends in upper-level ascent (as indicated by ω300), reduced UTRH, and increasing trends in tropopause temperature. Similar to the NH mid-latitudes, the Ts signal in the zonal-mean attribution is dominated by land, while the observed Cb reduction is primarily oceanic. Moreover, although standardized ω300 exhibits a negative zonal-mean trend over 0–30° S (Fig. 5), this zonal mean does not directly determine its contribution to the Cb trend because the contributions are calculated at each grid point before spatial averaging. The spatial distributions in Fig. S8 show that the negative ω300–Cb regression coefficients over the western equatorial Pacific coincide with significant positive local trends in ω300, indicating weakened ascent. This spatial correspondence produces a negative contribution of ω300 to the Cb trend in this region (Fig. S8c), which dominates the negative zonal-mean contribution shown in Fig. 6. The local weakening of ascent over the western equatorial Pacific would tend to suppress convective development and vertical moisture transport, thereby limiting Cb formation. While recent studies have emphasized a strengthening trend in the Walker circulation over recent decades (Wu et al., 2021; Wills et al., 2022), our result should not be interpreted as a weakening of the Pacific Walker circulation as a whole. Instead, the local signal may reflect regional variability or a zonal reorganization within the broader Walker circulation. Taken together, the decline in Cb over 0–30° S is accompanied by reduced ascent and moisture supply and by upper-tropospheric warming and drying (Figs. 5 and 6), which may reflect a broader reorganization of tropical circulation. Their overall sign is consistent with a northward shift of the zonal-mean Intertropical Convergence Zone (ITCZ) and a corresponding adjustment of the ascending branch of the Hadley circulation (Schneider et al., 2014; Loeb et al., 2025; Guo et al., 2026; Shrestha et al., 2026), which would reduce deep convection and Cb occurrence south of the equator.
Notably, the net contribution of total CF changes to the RSRcloud trend differs in sign between the two mid-latitude zones (Fig. 4). In 30–60° N, CF changes contribute approximately −0.12 W m−2 per decade, reinforcing the decrease in RSRcloud; this negative contribution arises mainly from decreases in St, Sc, Ns, and Cb. By contrast, in 30–60° S, the net CF contribution is positive (approximately 0.03 W m−2 per decade) and therefore partly offsets the CR-driven decrease in RSRcloud. This positive contribution can be attributed to an increase in more reflective Sc, which compensates for the RSRcloud decrease caused by reduced Cu and mid-level clouds. As shown in Fig. 6, the increasing EIS trend and decreasing instability (M parameter) trend suppress convective Cu while favoring the formation of the more stable Sc.
The decrease in RSRcloud contributed by reduced CR is primarily concentrated in the mid- to low-latitudes, particularly across the SH, with the Sc contributing most significantly (Fig. 4b). In both the SH low latitudes and NH mid- to low-latitudes, the diminished reflectivity of Sc can be attributed to significant decrease in its CVOD (Fig. 7a). Furthermore, a pronounced increase in the rliq over mid- and low-latitude regions reduces the total scattering surface area of cloud droplets, resulting in less RSR (Fig. 7b). In addition, the decline in CR in the NH mid-latitudes coincides with a decreasing AOD trend (Fig. 5), which is potentially linked to controls on industrial and shipping sulfur emissions (Bai et al., 2020; Cao et al., 2023; Hodnebrog et al., 2024; Yuan et al., 2024; von Salzen et al., 2025). The aerosol decline may lead to decreased CCN, decreased CDNC, and larger effective droplet radii (Fig. 7b), thereby lowering cloud albedo (Twomey, 1974, 1977; Li et al., 2018, 2025a; Cao et al., 2023; Hodnebrog et al., 2024; Yuan et al., 2024). Similarly, Bai et al. (2020) have reported a persistent decline in both CDNC and AOD along the east coast of the United States, the west coast of Europe, and the east coast of China from 2003 to 2017. Moreover, von Salzen et al. (2025) have observed that the decrease in marine CR over the North Atlantic and Northeast Pacific from 2003 to 2022 can be attributed to the reduction in sulfur dioxide and other aerosol precursors. Notably, across SH low and mid-latitudes, a reduction in CR across nearly all cloud types has significantly contributed to the negative trend in RSRcloud, which is consistent with their significant reduction in CVOD (Fig. 7a). This widespread darkening of clouds occurs despite increasing AOD in the SH mid-latitudes (Fig. 5), suggesting that the rising aerosol burden has not been efficiently translated into CCN (Cao et al., 2023). This is likely because the increased AOD is dominated by natural aerosols (e.g., sea salt) and above-cloud smoke, which are less effective as CCN or reside above the cloud layer, limiting their influence on boundary-layer clouds (Cao et al., 2023).
In contrast to the low- to mid-latitudes, increased CF and enhanced CR have led to a rise in RSRcloud at high latitudes in both hemispheres, thereby mitigating regional warming (Fig. 4a, b). The increase in CF is primarily attributed to optically thick mid- and high-level clouds. Although the model performance is relatively limited at high latitudes (Fig. S5), the regression still captures part of the statistical relationship between CF anomalies and the selected environmental factors. They should, however, be interpreted as statistical indications rather than as evidence that the underlying physical processes are fully represented by the model. In the NH high latitudes, the positive trend in high clouds (Cs) is mainly linked to enhanced SUT and increased tropospheric thickness. For mid-level clouds (Ns), the increasing trend is primarily associated with enhanced mid-tropospheric moisture supply (RH700) and strengthened warm advection (Tadv,700), which promote large-scale ascent and stratiform cloud formation. In the SH high latitudes, the increase in Ns is primarily driven by positive trends in AOD, RH700, and CAPE, indicating the combined effects of increased CCN, enhanced moisture supply, and strengthened convective instability. The increase in high clouds (Cs and Cb) is associated with increasing AOD and SUT, along with decreasing Ttrop. Additionally, the increase in St is linked to rising AOD and enhanced near-surface wind speed, which promote boundary-layer cloud formation through enhanced turbulent mixing. These statistically derived relationships are consistent with large-scale environmental changes in the polar regions. Enhanced atmospheric moisture (Ding et al., 2022; Patel and Kuttippurath, 2023) stems from intensified evaporation due to a wider ocean surface resulting from sea ice retreat (He et al., 2019) and increased poleward moisture transport from lower latitudes (Woods and Caballero, 2016; Kim et al., 2017), creating conditions more favourable for cloud development. This process is further amplified by the poleward shift of cyclone and storm tracks, which brings extensive cloud systems to the polar region (Tselioudis et al., 2024). Simultaneously, the observed cloud type changes, characterized by a decrease in high-emissivity low-level clouds and an increase in low-emissivity high-level clouds, provides the key to understanding the longwave cloud contribution to polar Ts trends. This change explains why the longwave cloud radiative effect has weakened, contributing negatively to the surface warming trend in both polar regions (Fig. 1a), despite the increased total CF in the NH and the stable total CF in the SH (Fig. 1c).
Moreover, the increase in CR at high-latitudes is mainly driven by low- and mid-level clouds in the NH and mid-level clouds in the SH. This enhancement is largely due to a significant increase in CVOD (Fig. 7a), likely resulting from greater moisture availability and elevated in-cloud liquid water content. Satellite observations have revealed that, over the past two decades, Arctic clouds have shown a tendency to shift from the ice to the liquid phase, with increased liquid water content enhancing cloud albedo (Lelli et al., 2023). More recently, Wang et al. (2026) found that declining mineral dust may amplify the ice-to-liquid replacement of high clouds over the NH mid- and high latitudes, increasing cloud optical depth and partially buffering warming through enhanced shortwave reflection. Additionally, the expansion of open ocean area enhances emissions of sea salt and biogenic aerosols, increasing the availability of cloud condensation and ice nuclei (Fig. 7c) (Schmale et al., 2021; Twohy et al., 2021; Lapere et al., 2023). This promotes higher CDNC and reduces droplet size (Fig. 7b, c), contributing to brighter and longer-lasting clouds.
It is noteworthy that the contribution of CF and CR changes to the trend in RSRcloud also encompasses the masking effect of clouds on surface-reflected radiation (ΔFmask). The total contribution of this effect to RSRcloud trends (−ΔFmask), defined as the difference of the TOA RSR surface component between clear-sky and all-sky conditions, is shown in Fig. 4c (see Sect. 2.4 for detailed explanation). This term (typically positive) exhibits a significant negative trend, which likely arises from two interrelated surface-cloud processes: first, a reduction in surface albedo due to declining snow/ice cover (Wu et al., 2020) or vegetation greening (Chen et al., 2019) lowers the clear-sky surface reflection (Li et al., 2024b), thereby diminishing the potential masking effect of clouds; second, a decrease in CF or a reduction in CR directly weakens the masking intensity by allowing more surface-reflected radiation to escape under cloudy conditions.
We further examined the cloud-type-resolved trends in TOA LWCRE (Fig. S9). Across the low and middle latitudes, nearly all statistically significant cloud-type contributions show decreasing LWCRE trends, except for a small positive Cu contribution in the NH midlatitudes. For several cloud types, particularly the low- and mid-level clouds and Cb over the NH midlatitudes and SH tropics, the negative LWCRE trends coincide with decreases in CF (Fig. S4a). However, the correspondence is not one-to-one. For example, Cs occurrence increases globally, and both Cs and Sc increase over 30–60° S, whereas their associated LWCRE trends remain negative. These contrasting signs demonstrate that changes in cloud amount alone cannot explain the LWCRE trends. The concurrent decreases in cloud reflectivity for many cloud types, especially over the SH midlatitudes (Fig. S4b), suggest accompanying changes in cloud optical properties, although shortwave reflectivity does not directly constrain longwave emissivity. At a given cloud amount, LWCRE can also vary with cloud-top altitude and temperature, as well as cloud optical depth and emissivity (Zelinka et al., 2012; Raghuraman et al., 2024). Because these cloud-property contributions are not explicitly separated here, they are considered possible explanations rather than quantitatively attributed drivers. Moreover, conventional LWCRE includes the masking of changes in non-cloud properties by clouds (Soden et al., 2004, 2008; Raghuraman et al., 2023a). Using the ERA5–PRP dataset, we quantified the masking effects of surface temperature, atmospheric temperature, water vapor, well-mixed greenhouse gases, and ozone over the common period from July 2002 to December 2020 (Fig. S10). The global longwave cloud-masking trend is negative, with major negative contributions from water vapor and well-mixed greenhouse gases partly offset by the surface-temperature contribution, and accounts for approximately 32 % of the magnitude of the total negative LWCRE trend. Although this assessment ends 26 months earlier than the main analysis period, it demonstrates that longwave cloud masking is substantial.
Motivated by the rapid recent warming, ongoing climate crisis, and the need to understand cloud changes, this study quantifies the cloud radiative contribution to surface warming over 2002–2023 using CERES data and a surface energy balance framework. Globally, cloud-radiative changes cause shortwave warming, partly offset by longwave cooling. These contrasting effects are associated with a broad redistribution of cloud occurrence across vertical levels, characterized by decreases in low-/mid-level and Cb clouds, together with increases in high-level optically thin clouds (Cs, Ci), which is associated with large-scale circulation adjustments (Tselioudis et al., 2025), thermodynamic feedbacks (Klein et al., 2017), and microphysical processes (Li et al., 2018; Gui et al., 2026). This redistribution is consistent with the reduction in the cloud component of PA and the decrease in longwave radiation emitted by clouds towards surface.
Regionally, both cloud changes and the relative CF and CR contributions exhibit hemispheric differences. In 30–60° N, the RSRcloud decline stems mainly from reduced CF (especially St, Sc, Ns, and Cb), which is consistent with rising SSTs, reduced AOD, and mid-tropospheric drying. In contrast, in 30–60° S, it is mainly driven by reduced CR, partially mitigated by increased Sc and Cs resulting from enhanced atmospheric stability. Climatologically, greater cloud reflection in the SH mid-latitudes compensates for the higher clear-sky albedo of the NH, helping maintain hemispheric PA symmetry (Bender et al., 2017; Datseris and Stevens, 2021; Jönsson and Bender, 2023; Hadas et al., 2023). During the study period, however, the larger reduction in RSRcloud over the NH mid-latitudes is not balanced by the SH mid-latitude cloud changes, suggesting that this compensation pathway did not fully operate on the observed short timescale (Diamond et al., 2024; Loeb et al., 2025). Moreover, in 0–30° S, decreased CF (high-/mid-level clouds) and reduced CR (low-level clouds) contribute equally, associated with weakened ascent velocity, upper-tropospheric drying, and decreased CVOD with increased rliq, respectively. Conversely, across both polar regions, clouds mitigate warming through both shortwave and longwave radiation changes, linked to increased CF and CR, particularly for mid/high clouds, resulting from increased water vapor, AOD, SUT, and enhanced CVOD.
The observed reductions in CF and CR are consistent with the long-term decline in global PA reported over recent decades (Loeb et al., 2021, 2024; Goessling et al., 2025; Hodnebrog et al., 2024; Li et al., 2024b, 2025b). Looking forward, this trend is projected to persist, with continued declines in RSR expected across the 21st century under all emission scenarios, particularly under high-emission pathways where the rate of decline accelerates (Li et al., 2025b). These findings highlight that the observed cloud changes in fraction and reflectivity not only contribute to current surface warming but also imply a sustained reduction in PA that will amplify future climate change. Moreover, given that subtropical low clouds dominate unforced interannual-to-decadal fluctuations in global energy imbalance (Miyamoto et al., 2026), their projected long-term decline under warming may not only amplify the forced energy uptake but also modulate the amplitude of future internal variability.
It should be also noted, however, that our findings are derived from passive satellite measurements, which have inherent limitations in distinguishing clouds from aerosols and over highly reflective surfaces (Yamanouchi et al., 1987; King et al., 1992; Mahesh et al., 2004), and cannot provide vertical cloud profile information. Future research based on active satellite observations is necessary to advance the understanding of cloud type changes.
This appendix provides the definitions and calculation methods for the cloud-controlling factors summarized in Table 1.
Estimating Inversion Strength (EIS) is calculated according to the formula:
where lower-tropospheric stability (LTS) is defined as the potential temperature difference between 700 hPa and the surface, represents the moist adiabatic lapse rate at 850 hPa, and Z700 and ZLCL denote the geopotential height at 700 hPa and the lifting condensation level relative to the surface, respectively. Following Wood and Bretherton (2006), the surface relative humidity is assumed to be 80 % to simplify the estimation of surface dewpoint temperature, with ZLCL computed following Georgakakos and Bras (1984).
Surface temperature advection (STadv) is computed as:
where u and v denote eastward and northward 10 m winds, φ and λ represent latitude and longitude, RE is the Earth's radius, and ST denotes the 2 m air temperature. Positive/negative STadv indicates warm/cold advection.
Vapor pressure deficit at 500 hPa (VPD500) is defined as the difference between the saturation vapor pressure (SVP) and the actual vapor pressure (AVP) at 500 hPa (Murray, 1966; Buck, 1981):
here RH is the relative humidity, Ta is the air temperature at 500 hPa. The constants a and b depend on the phase of water: for Ta at or above 0 °C (liquid water), a=17.27 and b=237.3; for Ta below 0 °C (ice), a=21.875 and b=265.5.
Moisture flux convergence at 700 hPa (MFC700) is calculated as the negative divergence of the horizontal moisture flux:
where q is specific humidity (kg kg−1) and is the horizontal wind vector at 700 hPa. Convergence (positive MFC) indicates accumulation of moisture, which favors cloud formation.
Temperature advection at 700 hPa (Tadv,700) is given by:
where u700 and v700 denote eastward and northward wind components at 700 hPa, φ and λ represent latitude and longitude, RE is the Earth's radius, and T700 is the air temperature at 700 hPa.
Upper-tropospheric static stability (SUT) is computed following the method described by Wilson Kemsley et al. (2024). Temperature and pressure profiles are first interpolated to 100 vertical levels using cubic spline interpolation from standard pressure levels to resolve fine vertical gradients. At each interpolated pressure level p, the static stability Sp is calculated as
where Tp is the temperature at pressure p, RC is the gas constant, and cp is the specific heat capacity at constant pressure. Finally, SUT is defined as the vertical average of Sp over the interpolated levels spanning from the tropopause pressure plus 50 hPa to the tropopause pressure plus 200 hPa. The tropopause pressure is identified on a monthly-mean basis using the standard World Meteorological Organization (WMO) definition (Reichler et al., 2003).
300 hPa zonal wind shear (ΔU300) is defined as the vertical gradient of the zonal wind between 300 and 925 hPa (Wilson Kemsley et al., 2024):
where U is the easterly wind speeds and z the geopotential height.
All data used in this study are available to the public. The CERES_EBAF_Ed4.2.1 (Kato et al., 2018; Loeb et al., 2018; NASA/LARC/SD/ASDC, 2025, https://ceres-tool.larc.nasa.gov/ord-tool/jsp/EBAF421Selection.jsp) and FluxByCldTyp Edition 4A (https://ceres-tool.larc.nasa.gov/ord-tool/jsp/FluxByCldTypSelection.jsp, NASA/LARC/SD/ASDC, 2020; Sun et al., 2022) products are available through the NASA Langley Research Center CERES ordering tool. The ERA5 datasets can be downloaded through Climate Data Store (CDS) (https://doi.org/10.24381/cds.6860a573, Hersbach et al., 2023a; https://doi.org/10.24381/cds.f17050d7, Hersbach et al., 2023b). The MERRA-2 datasets can be obtained from https://doi.org/10.5067/FH9A0MLJPC7N (GMAO, 2015; Buchard et al., 2017; Randles et al., 2017). The ERA5 partial radiation perturbation data used to quantify longwave cloud masking are archived at Zenodo at https://doi.org/10.5281/zenodo.7623726 (Raghuraman et al., 2023b).
The supplement related to this article is available online at https://doi.org/10.5194/acp-26-12591-2026-supplement.
R.L.: Methodology, Formal analysis, Visualization, Writing – original draft. J.M.L.: Conceptualization, Supervision, Writing – review and editing. B.J.: Methodology, Writing – review and editing. L.Z.: Validation, Writing – review and editing. J.Y.L.: Investigation, Writing – review and editing. All authors contributed to interpretation of the results and approved the submitted manuscript.
The contact author has declared that none of the authors has any competing interests.
Publisher's note: Copernicus Publications remains neutral with regard to jurisdictional claims made in the text, published maps, institutional affiliations, or any other geographical representation in this paper. The authors bear the ultimate responsibility for providing appropriate place names. Views expressed in the text are those of the authors and do not necessarily reflect the views of the publisher.
We would like to thank the CERES, MERRA-2, and ERA5 science teams for providing excellent and accessible data products that made this study possible. We also thank Shiv Priyam Raghuraman, David Paynter, Raymond Menzel, and Venkatachalam Ramaswamy for developing and publicly archiving the ERA5–PRP dataset used in the longwave cloud-masking analysis. We sincerely thank the handling editor and referees for their constructive and insightful comments, which substantially improved the clarity and scientific rigor of the manuscript.
This research has been supported by the National Key Research and Development Program of China (grant no. 2024YFB3907900), the National Natural Science Foundation of China, Key Programme (grant no. 42430601), the National Natural Science Foundation of China (grant no. 42305072), and the Gansu Provincial Department of Finance (grant no. 2025CXZX-075).
This paper was edited by Kevin Grise and reviewed by Aiden Jönsson and one anonymous referee.
Albrecht, B. A.: Aerosols, Cloud Microphysics, and Fractional Cloudiness, Science, 245, 1227–1230, https://doi.org/10.1126/science.245.4923.1227, 1989.
Alkama, R., Taylor, P. C., Garcia-San Martin, L., Douville, H., Duveiller, G., Forzieri, G., Swingedouw, D., and Cescatti, A.: Clouds damp the radiative impacts of polar sea ice loss, The Cryosphere, 14, 2673–2686, https://doi.org/10.5194/tc-14-2673-2020, 2020.
Andersen, H., Cermak, J., Zipfel, L., and Myers, T. A.: Attribution of observed recent decrease in low clouds over the Northeastern Pacific to cloud‐controlling factors, Geophys. Res. Lett., 49, e2021GL096498, https://doi.org/10.1029/2021GL096498, 2022.
Andersen, H., Cermak, J., Douglas, A., Myers, T. A., Nowack, P., Stier, P., Wall, C. J., and Wilson Kemsley, S.: Sensitivities of cloud radiative effects to large-scale meteorology and aerosols from global observations, Atmos. Chem. Phys., 23, 10775–10794, https://doi.org/10.5194/acp-23-10775-2023, 2023.
Andrews, T., Forster, P. M., and Gregory, J. M.: A surface energy perspective on climate change, J. Climate, 22, 2557–2570, https://doi.org/10.1175/2008JCLI2759.1, 2009.
Arking, A.: The radiative effects of clouds and their impact on climate, B. Am. Meteor. Soc., 72, 795–814, https://doi.org/10.1175/1520-0477(1991)072<0795:TREOCA>2.0.CO;2, 1991.
Bai, H., Wang, M., Zhang, Z., and Liu, Y.: Synergetic satellite trend analysis of aerosol and warm cloud properties ver ocean and its implication for aerosol‐cloud interactions, J. Geophys. Res.-Atmos., 125, e2019JD031598, https://doi.org/10.1029/2019JD031598, 2020.
Bellouin, N., Quaas, J., Gryspeerdt, E., Kinne, S., Stier, P., Watson‐Parris, D., Boucher, O., Carslaw, K. S., Christensen, M., Daniau, A. L., Dufresne, J. L., Feingold, G., Fiedler, S., Forster, P., Gettelman, A., Haywood, J. M., Lohmann, U., Malavelle, F., Mauritsen, T., McCoy, D. T., Myhre, G., Mülmenstädt, J., Neubauer, D., Possner, A., Rugenstein, M., Sato, Y., Schulz, M., Schwartz, S. E., Sourdeval, O., Storelvmo, T., Toll, V., Winker, D., and Stevens, B.: Bounding Global Aerosol Radiative Forcing of Climate Change, Rev. Geophys., 58, e2019RG000660, https://doi.org/10.1029/2019RG000660, 2020.
Bender, F. A. M., Engström, A., Wood, R., and Charlson, R. J.: Evaluation of Hemispheric Asymmetries in Marine Cloud Radiative Properties, J. Climate, 30, 4131–4147, https://doi.org/10.1175/jcli-d-16-0263.1, 2017.
Blanchard-Wrigglesworth, E., Bilbao, R., Donohoe, A., and Materia, S.: Record warmth of 2023 and 2024 was highly predictable and resulted from ENSO transition and Northern Hemisphere absorbed shortwave anomalies, Geophys. Res. Lett., 52, e2025GL115614, https://doi.org/10.1029/2025GL115614, 2025.
Boeke, R. C. and Taylor, P. C.: Seasonal energy exchange in sea ice retreat regions contributes to differences in projected Arctic warming, Nat. Commun., 9, 5017, https://doi.org/10.1038/s41467-018-07061-9, 2018.
Bony, S. and Emanuel, K. A.: A Parameterization of the Cloudiness Associated with Cumulus Convection; Evaluation Using TOGA COARE Data, J. Atmos. Sci., 58, 3158–3183, https://doi.org/10.1175/1520-0469(2001)058<3158:apotca>2.0.co;2, 2001.
Bony, S., Colman, R., Kattsov, V. M., Allan, R. P., Bretherton, C. S., Dufresne, J.-L., Hall, A., Hallegatte, S., Holland, M. M., and Ingram, W.: How well do we understand and evaluate climate change feedback processes?, J. Climate, 19, 3445–3482, https://doi.org/10.1175/JCLI3819.1, 2006.
Buchard, V., Randles, C., Da Silva, A., Darmenov, A., Colarco, P., Govindaraju, R., Ferrare, R., Hair, J., Beyersdorf, A., and Ziemba, L.: The MERRA-2 aerosol reanalysis, 1980 onward. Part II: Evaluation and case studies, J. Climate, 30, 6851–6872, https://doi.org/10.1175/JCLI-D-16-0613.1, 2017.
Buck, A. L.: New Equations for Computing Vapor Pressure and Enhancement Factor, J. Appl. Meteorol., 20, 1527–1532, https://doi.org/10.1175/1520-0450(1981)020<1527:nefcvp>2.0.co;2, 1981.
Cao, Y., Zhu, Y., Wang, M., Rosenfeld, D., Liang, Y., Liu, J., Liu, Z., and Bai, H.: Emission reductions significantly reduce the hemispheric contrast in cloud droplet number concentration in recent two decades, J. Geophys. Res.-Atmos., 128, e2022JD037417, https://doi.org/10.1029/2022JD037417, 2023.
Ceppi, P. and Hartmann, D. L.: Clouds and the atmospheric circulation response to warming, J. Climate, 29, 783–799, https://doi.org/10.1175/JCLI-D-15-0394.1, 2016.
Chen, C., Park, T., Wang, X., Piao, S., Xu, B., Chaturvedi, R. K., Fuchs, R., Brovkin, V., Ciais, P., and Fensholt, R.: China and India lead in greening of the world through land-use management, Nat. Sustain., 2, 122–129, https://doi.org/10.1038/s41893-019-0220-7, 2019.
Cheng, L., Abraham, J., Trenberth, K. E., Reagan, J., Zhang, H.-M., Storto, A., Von Schuckmann, K., Pan, Y., Zhu, Y., and Mann, M. E.: Record high temperatures in the ocean in 2024, Adv. Atmos. Sci., 42, 1092–1109, https://doi.org/10.1007/s00376-025-4541-3, 2025.
Colman, R.: Climate radiative feedbacks and adjustments at the Earth's surface, J. Geophys. Res.-Atmos., 120, 3173–3182, https://doi.org/10.1002/2014JD022896, 2015.
Datseris, G. and Stevens, B.: Earth's Albedo and Its Symmetry, AGU Adv., 2, e2021AV000440, https://doi.org/10.1029/2021AV000440, 2021.
Diamond, M. S., Gristey, J. J., and Feingold, G.: Testing Cloud Adjustment Hypotheses for the Maintenance of Earth's Hemispheric Albedo Symmetry with Observed Trends and Natural Experiments, Geophys. Res. Lett., 51, e2024GL111733, https://doi.org/10.1029/2024GL111733, 2024.
Ding, J., Chen, J., and Tang, W.: Increasing trend of precipitable water vapor in Antarctica and Greenland, China Satellite Navigation Conference, 286–296, https://doi.org/10.1007/978-981-19-2588-7_27, 2022.
Dong, T., Zeng, Z., Pan, M., Wang, D., Chen, Y., Liang, L., Yang, S., Jin, Y., Luo, S., and Liang, S.: Record-breaking 2023 marine heatwaves, Science, 389, 369–374, https://doi.org/10.1126/science.adr0910, 2025.
Donohoe, A. and Battisti, D. S.: Atmospheric and surface contributions to planetary albedo, J. Climate, 24, 4402–4418, https://doi.org/10.1175/2011JCLI3946.1, 2011.
Donohoe, A. and Battisti, D. S.: The seasonal cycle of atmospheric heating and temperature, J. Climate, 26, 4962–4980, https://doi.org/10.1175/JCLI-D-12-00713.1, 2013.
Georgakakos, K. P. and Bras, R. L.: A hydrologically useful station precipitation model: 1. Formulation, Water Resour. Res., 20, 1585–1596, https://doi.org/10.1029/WR020i011p01585, 1984.
Global Modeling and Assimilation Office (GMAO): MERRA-2 tavgM_2d_aer_Nx: 2d, monthly mean, time-averaged, single-level, assimilation, aerosol diagnostics V5.12.4, Goddard Earth Sciences Data and Information Services Center [data set], https://doi.org/10.5067/FH9A0MLJPC7N, 2015.
Goessling, H. F., Rackow, T., and Jung, T.: Recent global temperature surge intensified by record-low planetary albedo, Science, eadq7280, https://doi.org/10.1126/science.adq7280, 2025.
Gould, C. F., Heft-Neal, S., Heaney, A. K., Bendavid, E., Callahan, C. W., Kiang, M. V., Graff Zivin, J., and Burke, M.: Temperature extremes impact mortality and morbidity differently, Sci. Adv., 11, eadr3070, https://doi.org/10.1126/sciadv.adr3070, 2025.
Grise, K. M. and Tselioudis, G.: Understanding the Relationship between Cloud Controlling Factors and the ISCCP Weather States, J. Climate, 37, 5387–5403, https://doi.org/10.1175/jcli-d-24-0011.1, 2024.
Gui, K., Zhang, X., Che, H., Li, L., Zheng, Y., An, L., Miao, Y., Zhao, H., Dubovik, O., Holben, B., Wang, J., Gupta, P., Lind, E. S., Toledano, C., Wang, H., Wang, Z., Wang, Y., Huang, X., Dai, K., Xia, X., Xu, X., and Zhang, X.: Advancing operational global aerosol forecasting with machine learning, Nature, 651, 658–665, https://doi.org/10.1038/s41586-026-10234-y, 2026.
Guo, Y., Hu, A., Meehl, G. A., Molina, M. J., Li, H., Bellomo, K., and Rosenbloom, N.: Migration of the intertropical convergence zone driven by ocean circulation changes, Nat. Commun., 17, 6501, https://doi.org/10.1038/s41467-026-73200-2, 2026.
Hadas, O., Datseris, G., Blanco, J., Bony, S., Caballero, R., Stevens, B., and Kaspi, Y.: The role of baroclinic activity in controlling Earth's albedo in the present and future climates, P. Natl. Acad. Sci. USA, 120, e2208778120, https://doi.org/10.1073/pnas.2208778120, 2023.
Han, X., Chen, Q., Song, Z., Fu, D., and Shi, H.: Impacts of Aerosol Optical Depth on Different Types of Cloud Macrophysical and Microphysical Properties over East Asia, Remote Sens., 17, 3535, https://doi.org/10.3390/rs17213535, 2025.
Hartmann, D. L. and Doelling, D.: On the net radiative effectiveness of clouds, J. Geophys. Res.-Atmos., 96, 869–891, https://doi.org/10.1029/90JD02065, 1991.
Hartmann, D. L., Ockert-Bell, M. E., and Michelsen, M. L.: The effect of cloud type on Earth's energy balance: Global analysis, J. Climate, 5, 1281–1304, https://doi.org/10.1175/1520-0442(1992)005<1281:TEOCTO>2.0.CO;2, 1992.
Haywood, J. and Boucher, O.: Estimates of the direct and indirect radiative forcing due to tropospheric aerosols: A review, Rev. Geophys., 38, 513–543, https://doi.org/10.1029/1999RG000078, 2000.
He, M., Hu, Y., Chen, N., Wang, D., Huang, J., and Stamnes, K.: High cloud coverage over melted areas dominates the impact of clouds on the albedo feedback in the Arctic, Sci. Rep., 9, 9529, https://doi.org/10.1038/s41598-019-44155-w, 2019.
Hersbach, H., Bell, B., Berrisford, P., Biavati, G., Horányi, A., Muñoz Sabater, J., Nicolas, J., Peubey, C., Radu, R., and Rozum, I.: ERA5 monthly averaged data on pressure levels from 1940 to present, Copernicus Climate Change Service (C3S) Climate Data Store (CDS) [data set], https://doi.org/10.24381/cds.6860a573, 2023a.
Hersbach, H., Bell, B., Berrisford, P., Biavati, G., Horányi, A., Muñoz Sabater, J., Nicolas, J., Peubey, C., Radu, R., Rozum, I., Schepers, D., Simmons, A., Soci, C., Dee, D., and Thépaut, J.-N.: ERA5 monthly averaged data on single levels from 1940 to present, Copernicus Climate Change Service (C3S) Climate Data Store (CDS) [data set], https://doi.org/10.24381/cds.f17050d7, 2023b.
Hodnebrog, Ø., Myhre, G., Jouan, C., Andrews, T., Forster, P. M., Jia, H., Loeb, N. G., Olivié, D. J., Paynter, D., and Quaas, J.: Recent reductions in aerosol emissions have increased Earth's energy imbalance, Commun. Earth Environ., 5, 166, https://doi.org/10.1038/s43247-024-01324-8, 2024.
Inoue, T. and Kamahori, H.: Statistical Relationship between ISCCP Cloud Type and Vertical Relative Humidity Profile, J. Meteorol. Soc. Jpn., 79, 1243-1256, https://doi.org/10.2151/jmsj.79.1243, 2001.
Intrieri, J. M., Fairall, C. W., Shupe, M. D., Persson, P. O. G., Andreas, E. L., Guest, P. S., and Moritz, R. E.: An annual cycle of Arctic surface cloud forcing at SHEBA, J. Geophys. Res.-Oceans, 107, https://doi.org/10.1029/2000JC000439, 2002.
Izumi, K., Bartlein, P. J., and Harrison, S. P.: Energy-balance mechanisms underlying consistent large-scale temperature responses in warm and cold climates, Clim. Dynam., 44, 3111–3127, https://doi.org/10.1007/s00382-014-2189-2, 2015.
Jian, B., Li, J., Wang, G., He, Y., Han, Y., Zhang, M., and Huang, J.: The Impacts of Atmospheric and Surface Parameters on Long-Term Variations in the Planetary Albedo, J. Climate, 31, 8705–8718, https://doi.org/10.1175/jcli-d-17-0848.1, 2018.
Jönsson, A. R. and Bender, F. A.-M.: The implications of maintaining Earth's hemispheric albedo symmetry for shortwave radiative feedbacks, Earth Syst. Dynam., 14, 345–365, https://doi.org/10.5194/esd-14-345-2023, 2023.
Kato, S., Rose, F. G., Rutan, D. A., Thorsen, T. J., Loeb, N. G., Doelling, D. R., Huang, X., Smith, W. L., Su, W., and Ham, S.-H.: Surface irradiances of edition 4.0 clouds and the earth's radiant energy system (CERES) energy balanced and filled (EBAF) data product, J. Climate, 31, 4501–4527, https://doi.org/10.1175/JCLI-D-17-0523.1, 2018.
Kaufman, Y. J., Koren, I., Remer, L. A., Rosenfeld, D., and Rudich, Y.: The effect of smoke, dust, and pollution aerosol on shallow cloud development over the Atlantic Ocean, P. Natl. Acad. Sci. USA, 102, 11207–11212, https://doi.org/10.1073/pnas.0505191102, 2005.
Kay, J. E. and Gettelman, A.: Cloud influence on and response to seasonal Arctic sea ice loss, J. Geophys. Res.-Atmos., 114, 2009JD011773, https://doi.org/10.1029/2009JD011773, 2009.
Kim, B.-M., Hong, J.-Y., Jun, S.-Y., Zhang, X., Kwon, H., Kim, S.-J., Kim, J.-H., Kim, S.-W., and Kim, H.-K.: Major cause of unprecedented Arctic warming in January 2016: Critical role of an Atlantic windstorm, Sci. Rep., 7, 40051, https://doi.org/10.1038/srep40051, 2017.
King, M. D., Kaufman, Y. J., Menzel, W. P., and Tanre, D.: Remote sensing of cloud, aerosol, and water vapor properties from the moderate resolution imaging spectrometer(MODIS), IEEE T. Geosci. Remote, 30, 2–27, https://doi.org/10.1109/36.124212, 1992.
Klein, S. A., Hall, A., Norris, J. R., and Pincus, R.: Low-cloud feedbacks from cloud-controlling factors: A review, Surv. Geophys., 38, 1307–1329, https://doi.org/10.1007/s10712-017-9433-3, 2017.
Lapere, R., Thomas, J. L., Marelle, L., Ekman, A. M., Frey, M. M., Lund, M. T., Makkonen, R., Ranjithkumar, A., Salter, M. E., and Samset, B. H.: The representation of sea salt aerosols and their role in polar climate within CMIP6, J. Geophys. Res.-Atmos., 128, e2022JD038235, https://doi.org/10.1029/2022JD038235, 2023.
Lelli, L., Vountas, M., Khosravi, N., and Burrows, J. P.: Satellite remote sensing of regional and seasonal Arctic cooling showing a multi-decadal trend towards brighter and more liquid clouds, Atmos. Chem. Phys., 23, 2579–2611, https://doi.org/10.5194/acp-23-2579-2023, 2023.
Li, J., Jian, B., Huang, J., Hu, Y., Zhao, C., Kawamoto, K., Liao, S., and Wu, M.: Long-term variation of cloud droplet number concentrations from space-based Lidar, Remote Sens. Environ., 213, 144–161, https://doi.org/10.1016/j.rse.2018.05.011, 2018.
Li, J., Wang, Y., Li, J., Zhang, W., Zhang, L., and Wang, Y.: Strong aerosol indirect radiative effect from dynamic-driven diurnal variations of cloud water adjustments, Atmos. Chem. Phys., 25, 17455–17472, https://doi.org/10.5194/acp-25-17455-2025, 2025a.
Li, K., Zheng, F., Zhu, J., and Zeng, Q.-C.: El Niño and the AMO sparked the astonishingly large margin of warming in the global mean surface temperature in 2023, Adv. Atmos. Sci., 41, 1017–1022, https://doi.org/10.1007/s00376-023-3371-4, 2024a.
Li, R., Jian, B., Li, J., Li, J., Cao, Z., Wang, Y., Wang, Y., and Huang, J.: Planetary albedo and reflected shortwave flux: Basic characteristics, mechanisms of change and future projections, Earth Sci. Rev., 105274, https://doi.org/10.1016/j.earscirev.2025.105274, 2025b.
Li, R., Jian, B., Li, J., Wen, D., Zhang, L., Wang, Y., and Wang, Y.: Understanding the trends in reflected solar radiation: a latitude- and month-based perspective, Atmos. Chem. Phys., 24, 9777–9803, https://doi.org/10.5194/acp-24-9777-2024, 2024b.
Li, Y., Thompson, D. W. J., Stephens, G. L., and Bony, S.: A global survey of the instantaneous linkages between cloud vertical structure and large-scale climate, J. Geophys. Res.-Atmos., 119, 3770–3792, https://doi.org/10.1002/2013JD020669, 2014.
Li, Y., Ge, J., Hu, Y., Xu, Z., Du, J., and Mu, Q.: Global Low Clouds Evolution and Their Meteorological Drivers Across Multiple Timescales, Remote Sens., 17, 4045, https://doi.org/10.3390/rs17244045, 2025c.
Liu, L., Huang, Y., and Gyakum, J. R.: Clouds reduce downwelling longwave radiation over land in a warming climate, Nature, 637, 868–874, https://doi.org/10.1038/s41586-024-08323-x, 2025.
Liu, Y., Huang, Y., Yuan, J., Xie, Y., and Zhou, C.: Contribution of surface radiative effects, heat fluxes and their interactions to land surface temperature variability, J. Geophys. Res.-Atmos., 129, e2023JD039495, https://doi.org/10.1029/2023JD039495, 2024.
Loeb, N. G., Wielicki, B. A., Doelling, D. R., Smith, G. L., Keyes, D. F., Kato, S., Manalo-Smith, N., and Wong, T.: Toward optimal closure of the Earth's top-of-atmosphere radiation budget, J. Climate, 22, 748–766, https://doi.org/10.1175/2008JCLI2637.1, 2009.
Loeb, N. G., Doelling, D. R., Wang, H., Su, W., Nguyen, C., Corbett, J. G., Liang, L., Mitrescu, C., Rose, F. G., and Kato, S.: Clouds and the Earth's Radiant Energy System (CERES) Energy Balanced and Filled (EBAF) Top-of-Atmosphere (TOA) Edition-4.0 Data Product, J. Climate, 31, 895–918, https://doi.org/10.1175/jcli-d-17-0208.1, 2018.
Loeb, N. G., Johnson, G. C., Thorsen, T. J., Lyman, J. M., Rose, F. G., and Kato, S.: Satellite and ocean data reveal marked increase in Earth's heating rate, Geophys. Res. Lett., 48, e2021GL093047, https://doi.org/10.1029/2021GL093047, 2021.
Loeb, N. G., Ham, S.-H., Allan, R. P., Thorsen, T. J., Meyssignac, B., Kato, S., Johnson, G. C., and Lyman, J. M.: Observational Assessment of Changes in Earth's Energy Imbalance Since 2000, Surv. Geophys., 45, 1757–1783, https://doi.org/10.1007/s10712-024-09838-8, 2024.
Loeb, N. G., Thorsen, T. J., Kato, S., Rose, F. G., Hodnebrog, Ø., and Myhre, G.: Emerging hemispheric asymmetry of Earth's radiation, P. Natl. Acad. Sci. USA, 122, e2511595122, https://doi.org/10.1073/pnas.2511595122, 2025.
Lu, J. and Cai, M.: Seasonality of polar surface warming amplification in climate simulations, Geophys. Res. Lett., 36, https://doi.org/10.1029/2009GL040133, 2009.
Mahesh, A., Gray, M. A., Palm, S. P., Hart, W. D., and Spinhirne, J. D.: Passive and active detection of clouds: Comparisons between MODIS and GLAS observations, Geophys. Res. Lett., 31, https://doi.org/10.1029/2003GL018859, 2004.
Minobe, S., Behrens, E., Findell, K. L., Loeb, N. G., Meyssignac, B., and Sutton, R.: Global and regional drivers for exceptional climate extremes in 2023-2024: beyond the new normal, npj Clim. Atmos. Sci., 8, 138, https://doi.org/10.1038/s41612-025-00996-z, 2025.
Miyamoto, A., Xie, S.-P., and Deser, C.: Unforced interannual to decadal variability of global radiation imbalance: Role of low clouds, J. Climate, e250320, https://doi.org/10.1175/JCLI-D-25-0320.1, 2026.
Murray, F. W.: On the computation of saturation vapor pressure, RAND Corporation Paper P-3423, Santa Monica, CA, USA, https://www.rand.org/pubs/papers/P3423.html (last access: 1 September 2026), 1966.
Myers, T. A., Mechoso, C. R., Cesana, G. V., DeFlorio, M. J., and Waliser, D. E.: Cloud feedback key to marine heatwave off Baja California, Geophys. Res. Lett., 45, 4345–4352, https://doi.org/10.1029/2018GL078242, 2018.
NASA/LARC/SD/ASDC: CERES Energy Balanced and Filled (EBAF) Ed4.2.1, NASA Langley Atmospheric Science Data Center DAAC [data set], https://ceres-tool.larc.nasa.gov/ord-tool/jsp/EBAF421Selection.jsp (last access: 1 September 2026), 2025.
NASA/LARC/SD/ASDC: CERES Monthly Daytime Mean Regionally Averaged Terra and Aqua TOA Fluxes and Associated Cloud Properties Stratified by Optical Depth and Effective Pressure Edition4A, NASA Langley Atmospheric Science Data Center DAAC [data set], https://doi.org/10.5067/Terra-Aqua/CERES/FLUXBYCLDTYP-MONTH_L3.004A, 2020.
Naud, C. M., Elsaesser, G. S., and Booth, J. F.: Dominant cloud controlling factors for low‐level cloud fraction: Subtropical versus extratropical oceans, Geophys. Res. Lett., 50, e2023GL104496, https://doi.org/10.1029/2023GL104496, 2023.
Naud, C. M., Elsaesser, G. S., and Booth, J. F.: A map of dominant cloud‐controlling factors for cloud fraction and total liquid water path can identify marine low‐level cloud types, J. Geophys. Res.-Atmos., 130, e2025JD044503, https://doi.org/10.1029/2025JD044503, 2025.
Patel, V. K. and Kuttippurath, J.: Increase in tropospheric water vapor amplifies global warming and climate change, Ocean-Land-Atmosphere Research, 2, 0015, https://doi.org/10.34133/olar.0015, 2023.
Qu, X., Hall, A., Klein, S. A., and Caldwell, P. M.: The strength of the tropical inversion and its response to climate change in 18 CMIP5 models, Clim. Dynam., 45, 375–396, https://doi.org/10.1007/s00382-014-2441-9, 2015.
Raghuraman, S. P., Paynter, D., Menzel, R., and Ramaswamy, V.: Forcing, Cloud Feedbacks, Cloud Masking, and Internal Variability in the Cloud Radiative Effect Satellite Record, J. Climate, 36, 4151–4167, https://doi.org/10.1175/JCLI-D-22-0555.1, 2023a.
Raghuraman, S. P., Paynter, D., Menzel, R., and Ramaswamy, V.: Forcing, Cloud Feedbacks, Cloud Masking, and Internal Variability in the Cloud Radiative Effect Satellite Record (Data), Zenodo [data set], https://doi.org/10.5281/zenodo.7623726, 2023b.
Raghuraman, S. P., Medeiros, B., and Gettelman, A.: Observational Quantification of Tropical High Cloud Changes and Feedbacks, J. Geophys. Res.-Atmos., 129, e2023JD039364, https://doi.org/10.1029/2023JD039364, 2024.
Randles, C., Da Silva, A., Buchard, V., Colarco, P., Darmenov, A., Govindaraju, R., Smirnov, A., Holben, B., Ferrare, R., and Hair, J.: The MERRA-2 aerosol reanalysis, 1980 onward. Part I: System description and data assimilation evaluation, J. Climate, 30, 6823–6850, https://doi.org/10.1175/JCLI-D-16-0609.1, 2017.
Reichler, T., Dameris, M., and Sausen, R.: Determining the tropopause height from gridded data, Geophys. Res. Lett., 30, https://doi.org/10.1029/2003GL018240, 2003.
Ripple, W. J., Wolf, C., Gregg, J. W., Rockström, J., Mann, M. E., Oreskes, N., Lenton, T. M., Rahmstorf, S., Newsome, T. M., and Xu, C.: The 2024 state of the climate report: Perilous times on planet Earth, Bioscience, 74, 812–824, https://doi.org/10.1093/biosci/biae087, 2024.
Rosenfeld, D., Zhu, Y., Wang, M., Zheng, Y., Goren, T., and Yu, S.: Aerosol-driven droplet concentrations dominate coverage and water of oceanic low-level clouds, Science, 363, eaav0566, https://doi.org/10.1126/science.aav0566, 2019.
Schmale, J., Zieger, P., and Ekman, A. M.: Aerosols in current and future Arctic climate, Nat. Clim. Change, 11, 95–105, https://doi.org/10.1038/s41558-020-00969-5, 2021.
Schneider, T., Bischoff, T., and Haug, G. H.: Migrations and dynamics of the intertropical convergence zone, Nature, 513, 45–53, https://doi.org/10.1038/nature13636, 2014.
Scott, R. C., Myers, T. A., Norris, J. R., Zelinka, M. D., Klein, S. A., Sun, M., and Doelling, D. R.: Observed sensitivity of low-cloud radiative effects to meteorological perturbations over the global oceans, J. Climate, 33, 7717–7734, https://doi.org/10.1175/JCLI-D-19-1028.1, 2020.
Sejas, S. A., Hu, X., Cai, M., and Fan, H.: Understanding the differences between TOA and surface energy budget attributions of surface warming, Front. Earth Sci., 9, 725816, https://doi.org/10.3389/feart.2021.725816, 2021.
Sherwood, S. C., Bony, S., Boucher, O., Bretherton, C., Forster, P. M., Gregory, J. M., and Stevens, B.: Adjustments in the forcing-feedback framework for understanding climate change, B. Am. Meteor. Soc., 96, 217–228, https://doi.org/10.1175/BAMS-D-13-00167.1, 2015.
Shrestha, S., Soden, B. J., and He, H.: Reversal of the ITCZ Shift During the Satellite Era, Geophys. Res. Lett., 53, e2026GL123402, https://doi.org/10.1029/2026GL123402, 2026.
Shupe, M. D. and Intrieri, J. M.: Cloud radiative forcing of the Arctic surface: The influence of cloud properties, surface albedo, and solar zenith angle, J. Climate, 17, 616–628, https://doi.org/10.1175/1520-0442(2004)017<0616:CRFOTA>2.0.CO;2, 2004.
Sledd, A. and L'Ecuyer, T. S.: A Cloudier Picture of Ice-Albedo Feedback in CMIP6 Models, Front. Earth Sci., 9, 769844, https://doi.org/10.3389/feart.2021.769844, 2021.
Soden, B. J., Broccoli, A. J., and Hemler, R. S.: On the Use of Cloud Forcing to Estimate Cloud Feedback, J. Climate, 17, 3661–3665, https://doi.org/10.1175/1520-0442(2004)017<3661:OTUOCF>2.0.CO;2, 2004.
Soden, B. J., Held, I. M., Colman, R., Shell, K. M., Kiehl, J. T., and Shields, C. A.: Quantifying Climate Feedbacks Using Radiative Kernels, J. Climate, 21, 3504–3520, https://doi.org/10.1175/2007JCLI2110.1, 2008.
Stephens, G. L., O'Brien, D., Webster, P. J., Pilewski, P., Kato, S., and Li, J.-L.: The albedo of Earth, Rev. Geophys., 53, 141–163, https://doi.org/10.1002/2014rg000449, 2015.
Sun, M., Doelling, D. R., Loeb, N. G., Scott, R. C., Wilkins, J., Nguyen, L. T., and Mlynczak, P.: Clouds and the Earth's Radiant Energy System (CERES) FluxByCldTyp edition 4 data product, J. Atmos. Ocean. Tech., 39, 303–318, https://doi.org/10.1175/JTECH-D-21-0029.1, 2022.
Szopa, S., Naik, V., Adhikary, B., Artaxo, P., Berntsen, T., Collins, W. D., Fuzzi, S., Gallardo, L., Kiendler-Scharr, A., Klimont, Z., Liao, H., Unger, N., and Zanis, P.: Short-lived climate forcers, in: Climate Change 2021: The Physical Science Basis, edited by: Masson-Delmotte, V., Zhai, P., Pirani, A., Connors, S. L., Pean, C., Berger, S., Caud, N., Chen, Y., Goldfarb, L., Gomis, M. I., Huang, M., Leitzell, K., Lonnoy, E., Matthews, J. B. R., Maycock, T. K., Waterfield, T., Yelekci, O., Yu, R., and Zhou, B., Cambridge University Press, Cambridge, UK and New York, NY, USA, 817–922, https://doi.org/10.1017/9781009157896.008, 2023.
Trenberth, K. E., Fasullo, J. T., and Kiehl, J.: Earth's Global Energy Budget, B. Am. Meteor. Soc., 90, 311–324, https://doi.org/10.1175/2008bams2634.1, 2009.
Tselioudis, G., Rossow, W. B., Bender, F., Oreopoulos, L., and Remillard, J.: Oceanic cloud trends during the satellite era and their radiative signatures, Clim. Dynam., 62, 9319–9332, https://doi.org/10.1007/s00382-024-07396-8, 2024.
Tselioudis, G., Remillard, J., Jakob, C., and Rossow, W. B.: Contraction of the world's storm‐cloud zones the primary contributor to the 21st century increase in the Earth's sunlight absorption, Geophys. Res. Lett., 52, e2025GL114882, https://doi.org/10.1029/2025GL114882, 2025.
Twohy, C. H., DeMott, P. J., Russell, L. M., Toohey, D. W., Rainwater, B., Geiss, R., Sanchez, K. J., Lewis, S., Roberts, G. C., and Humphries, R. S.: Cloud‐nucleating particles over the Southern Ocean in a changing climate, Earth's Future, 9, e2020EF001673, https://doi.org/10.1029/2020EF001673, 2021.
Twomey, S.: Pollution and the planetary albedo, Atmos. Environ., 8, 1251–1256, https://doi.org/10.1016/0004-6981(74)90004-3, 1974.
Twomey, S.: The influence of pollution on the shortwave albedo of clouds, J. Atmos. Sci., 34, 1149–1152, https://doi.org/10.1175/1520-0469(1977)034<1149:TIOPOT>2.0.CO;2, 1977.
Viúdez-Mora, A., Costa-Surós, M., Calbó, J., and González, J.: Modeling atmospheric longwave radiation at the surface during overcast skies: The role of cloud base height, J. Geophys. Res.-Atmos., 120, 199–214, https://doi.org/10.1002/2014JD022310, 2015.
von Salzen, K., Akingunola, A., Cole, J. N., Digby, R. A., Doherty, S. J., Fraser-Leach, L., Gryspeerdt, E., Sigmond, M., and Wood, R.: Reduced aerosol pollution diminished cloud reflectivity over the North Atlantic and Northeast Pacific, Nat. Commun., 16, 9433, https://doi.org/10.1038/s41467-025-65127-x, 2025.
Walters, D., Baran, A. J., Boutle, I., Brooks, M., Earnshaw, P., Edwards, J., Furtado, K., Hill, P., Lock, A., Manners, J., Morcrette, C., Mulcahy, J., Sanchez, C., Smith, C., Stratton, R., Tennant, W., Tomassini, L., Van Weverberg, K., Vosper, S., Willett, M., Browse, J., Bushell, A., Carslaw, K., Dalvi, M., Essery, R., Gedney, N., Hardiman, S., Johnson, B., Johnson, C., Jones, A., Jones, C., Mann, G., Milton, S., Rumbold, H., Sellar, A., Ujiie, M., Whitall, M., Williams, K., and Zerroukat, M.: The Met Office Unified Model Global Atmosphere 7.0/7.1 and JULES Global Land 7.0 configurations, Geosci. Model Dev., 12, 1909–1963, https://doi.org/10.5194/gmd-12-1909-2019, 2019.
Wang, Y., Li, J., Zhao, Y., Li, Y., Zhao, Y., and Wu, X.: Distinct Diurnal Cycle of Supercooled Water Cloud Fraction Dominated by Dust Extinction Coefficient, Geophys. Res. Lett., 49, e2021GL097006, https://doi.org/10.1029/2021GL097006, 2022.
Wang, Y., Chai, T., Li, J., Feng, L., Jian, J., Huang, J., and McFarquhar, G. M.: Dust Decline Amplifies High-Cloud Ice-to-Liquid Transition and Buffers the Radiative Feedback Under Warming, Geophys. Res. Lett., 53, e2026GL121917, https://doi.org/10.1029/2026GL121917, 2026.
Wielicki, B. A., Barkstrom, B. R., Harrison, E. F., Lee III, R. B., Smith, G. L., and Cooper, J. E.: Clouds and the Earth's Radiant Energy System (CERES): An earth observing system experiment, B. Am. Meteor. Soc., 77, 853–868, https://doi.org/10.1175/1520-0477(1996)077<0853:CATERE>2.0.CO;2, 1996.
Wild, M.: Global dimming and brightening: A review, J. Geophys. Res.-Atmos., 114, 2008JD011470, https://doi.org/10.1029/2008JD011470, 2009.
Wills, R. C. J., Dong, Y., Proistosescu, C., Armour, K. C., and Battisti, D. S.: Systematic climate model biases in the large-scale patterns of recent sea-surface temperature and sea-level pressure change, Geophys. Res. Lett., 49, e2022GL100011, https://doi.org/10.1029/2022GL100011, 2022.
Wilson Kemsley, S., Ceppi, P., Andersen, H., Cermak, J., Stier, P., and Nowack, P.: A systematic evaluation of high-cloud controlling factors, Atmos. Chem. Phys., 24, 8295–8316, https://doi.org/10.5194/acp-24-8295-2024, 2024.
Wong, S., Naud, C. M., Kahn, B. H., Wu, L., and Fetzer, E. J.: Coupling of Precipitation and Cloud Structures in Oceanic Extratropical Cyclones to Large-Scale Moisture Flux Convergence, J. Climate, 31, 9565–9584, https://doi.org/10.1175/jcli-d-18-0115.1, 2018.
Wood, R.: Stratocumulus clouds, Mon. Weather Rev., 140, 2373–2423, https://doi.org/10.1175/MWR-D-11-00121.1, 2012.
Wood, R. and Bretherton, C. S.: On the relationship between stratiform low cloud cover and lower-tropospheric stability, J. Climate, 19, 6425–6432, https://doi.org/10.1175/JCLI3988.1, 2006.
Woods, C. and Caballero, R.: The role of moist intrusions in winter Arctic warming and sea ice decline, J. Climate, 29, 4473–4485, https://doi.org/10.1175/JCLI-D-15-0773.1, 2016.
Wu, D. L., Lee, J. N., Kim, K.-M., and Lim, Y.-K.: Interannual variations of TOA albedo over the Arctic, Antarctic and Tibetan plateau in 2000–2019, Remote Sens., 12, 1460, https://doi.org/10.3390/rs12091460, 2020.
Wu, M., Zhou, T., Li, C., Li, H., Chen, X., Wu, B., Zhang, W., and Zhang, L.: A very likely weakening of Pacific Walker Circulation in constrained near-future projections, Nat. Commun., 12, 6502, https://doi.org/10.1038/s41467-021-26693-y, 2021.
Yamanouchi, T., Suzuki, K., and Kawaguchi, S.: Detection of clouds in Antarctica from infrared multispectral data of AVHRR, J. Meteorol. Soc. Jpn. Ser. II, 65, 949–962, https://doi.org/10.2151/jmsj1965.65.6_949, 1987.
Yuan, T., Song, H., Oreopoulos, L., Wood, R., Bian, H., Breen, K., Chin, M., Yu, H., Barahona, D., and Meyer, K.: Abrupt reduction in shipping emission as an inadvertent geoengineering termination shock produces substantial radiative warming, Commun. Earth Environ., 5, 281, https://doi.org/10.1038/s43247-024-01442-3, 2024.
Zelinka, M. D., Klein, S. A., and Hartmann, D. L.: Computing and Partitioning Cloud Feedbacks Using Cloud Property Histograms. Part II: Attribution to Changes in Cloud Amount, Altitude, and Optical Depth, J. Climate, 25, 3736–3754, https://doi.org/10.1175/JCLI-D-11-00249.1, 2012.
Zelinka, M. D., Klein, S. A., Taylor, K. E., Andrews, T., Webb, M. J., Gregory, J. M., and Forster, P. M.: Contributions of Different Cloud Types to Feedbacks and Rapid Adjustments in CMIP5, J. Climate, 26, 5007–5027, https://doi.org/10.1175/JCLI-D-12-00555.1, 2013.
Zelinka, M. D., Myers, T. A., McCoy, D. T., Po‐Chedley, S., Caldwell, P. M., Ceppi, P., Klein, S. A., and Taylor, K. E.: Causes of higher climate sensitivity in CMIP6 models, Geophys. Res. Lett., 47, e2019GL085782, https://doi.org/10.1029/2019GL085782, 2020.
Zhao, D., Miuqian, K., Dong, W., Lin, Y., Jian, B., Li, Y., and Zhang, B.: Evaluation of clouds and precipitation in the WRF convection-permitting model over the Tibetan Plateau, J. Geophys. Res.-Atmos., 131, e2025JD046099, https://doi.org/10.1029/2025JD046099, 2026.
Zhou, C., Zelinka, M. D., and Klein, S. A.: Impact of decadal cloud variations on the Earth's energy budget, Nat. Geosci., 9, 871–874, https://doi.org/10.1038/ngeo2828, 2016.