
the Creative Commons Attribution 4.0 License.
the Creative Commons Attribution 4.0 License.
 | 01 Sep 2026
Source-dependent optical and mineral signatures of dust outbreaks over the Mediterranean

Celia Herrero del Barrio
S. Yeşer Aslanoğlu
Rizos-Theodoros Chadoulis
Georgia Charalampous
Sara Herrero-Anta
Dimitra Kouklaki
Michail Mytilinaios
Anna Moustaka
Emmanouil Proestakis
Vassilis Amiridis
Christos Spyrou
Antonis Gkikas
Michael Pikridas
Maria Kezoudi
Franco Marenco
Jean Sciare
Sophie Vandenbussche
Stavros Solomos
Stelios Kazadzis
Ilias Fountoulakis
Dust events frequently affect the Mediterranean Basin, however, the evolution of their optical and microphysical properties during transport remains poorly characterized. This study examines four major dust outbreaks in 2021–2022 affecting the Mediterranean, originating from the Eastern, Western, and Central Sahara and the Middle East. Combining ground-based AERONET sun photometers (24 stations), satellite (IASI, MODIS MIDAS) dust optical depth (DOD) data, and HYSPLIT back-trajectories, we track these events across Mediterranean sites. Results reveal regional differences in dust optical properties, including aerosol optical depth, single scattering albedo, and asymmetry factor, arising from source regions and transport processes. The Saharan events examined were dominated by coarse, scattering mineral dust, while the event originating from the Middle East featured finer, more absorbing particles, likely influenced by anthropogenic sources. MIDAS DOD-to-AOD ratios indicate that only one East-Central Saharan event maintained high dust fractions (DOD-to-AOD >0.8), suggesting relatively pure dust, while other events exhibited stronger spatial variability, with the Middle East event showing the lowest ratios, reflecting enhanced mixing with anthropogenic or marine aerosols. A regional case study in Cyprus using in situ elemental and absorption measurements shows that Middle Eastern dust event, despite lower mass concentrations, exhibited stronger absorption than the Saharan dust events observed in Cyprus. METAL-WRF mineralogical simulations indicate broadly similar mineral fractions across events, which alone could not explain the optical variability that observed across events. UAV-based composition data provide a first case-specific evaluation of modeled variability, although discrepancies in aluminum and magnesium highlight limitations in current dust representations.
- Article
(12894 KB) - Full-text XML
- BibTeX
- EndNote


Dust particles, referred to as dust henceforth, significantly influence climate (Kok et al., 2023), energy production systems (Kosmopoulos et al., 2018; Masoom et al., 2021), aviation (Ryder et al., 2024), and health globally (Proestakis et al., 2025), as these particles can travel vast distances from their source, often reaching locations thousands of kilometres away (Mona et al., 2023; Monteiro et al., 2022). The effect of dust, absorbing and scattering solar radiation, depends on its optical and physical properties (Adebiyi et al., 2023; Ito et al., 2021), which vary with its source region. These properties also determine whether dust will act as cloud condensation nuclei (CCN; Hatch et al., 2008) or as ice-nucleating particles (INPs; DeMott et al., 2009; Marinou et al., 2019), thereby affecting cloud development and precipitation (Casquero-Vera et al., 2023). During transport, dust composition and morphology can evolve due to aging and mixing with other aerosol types. For instance, Prospero (1999) noted that dust can carry pollutants, altering its composition and amplifying its environmental and health impacts. Size-segregated analyses also show that dust from different sources may evolve differently, with temporal changes in mineralogy driven by processes like gravitational settling (Di Biagio et al., 2023; Ebert et al., 2009).
The Sahara Desert in northern Africa and the Rub’ al Khali in the Arabian region rank among the most significant dust-emitting regions worldwide. The Mediterranean region, due to its proximity to these desert regions, is heavily influenced by dust transport, leading to pronounced changes in aerosol loading and regional radiative balance, primarily under the prevalence of cyclonic systems (Gkikas et al., 2013, 2014, 2016; Flaounas et al., 2015; Marinou et al., 2017). Zittis et al. (2022) identified that aerosol radiative forcing in this area is one of the highest on a global scale. Dust transport from the Sahara to the Mediterranean follows distinct seasonal patterns, with activity typically peaking in spring over the eastern basin and in summer over the western basin (Mateos et al., 2015; Raptis et al., 2020). However, recent observations show a notable increase in winter dust inputs in Western Mediterranean, particularly in February and March, with unprecedented dust transport observed between 2020 and 2022 (Cuevas-Agulló et al., 2024). In parallel, research on Middle Eastern dust events points to a rise in storm frequency, attributed to land use changes that have generated new emission sources (Papi et al., 2022; Al Ameri et al., 2019). These sources are particularly significant because dust reaching the Mediterranean from the Middle East is often mixed with anthropogenic pollution, such as carbonaceous particles and trace metals (Teri et al., 2025; Bimenyimana et al., 2023). The Mediterranean’s complex aerosol mixture, comprising of dust, sea salt particles, and continental aerosols, makes the region highly relevant for radiative closure studies (Papachristopoulou et al., 2022).
Beyond radiative effects, dust significantly impacts both marine and terrestrial ecosystems due to its influence across multiple physical, chemical, and biological processes. Dust deposition over sea can provide essential nutrients for phytoplankton growth (Rodríguez et al., 2023). On land, dust alters soil composition, affecting crop yields and agricultural productivity (Middleton, 2024). However, extreme dust events disrupt aviation, energy production, and infrastructure, leading to substantial economic losses (Cuevas et al., 2021). In addition, high concentrations of airborne dust exacerbate respiratory disease (De Longueville et al., 2010; Goudie, 2014) and increase hospital admissions. In southern Europe, frequent dust outbreaks often exceed the World Health Organization (WHO) and the European Union (EU) air quality thresholds, including when mixed with pollutants and bioaerosols (Querol et al., 2019; Proestakis et al., 2025).
Despite its notable importance, only few studies have specifically focused on the evolution of dust optical and chemical properties during atmospheric transport in the Mediterranean, whilst measurements to support this research remain limited (Zender et al., 2004; Textor et al., 2006; Mahowald et al., 2014) with more recent work further addressing this gap (Gkikas et al., 2021; Logothetis et al., 2021; Gkikas et al., 2022; González-Romero et al., 2023; Castellanos et al., 2024). As a result, our understanding of the underlying processes, such as deposition and aggregation, is still poor. In addition, there is limited discussion of the impact of dust mixing with other aerosol types in relation to dust origin and transport pathways. The primary tools available for studying this evolution at high temporal and spatial resolution are satellite and ground-based remote sensing, including lidars (Papayannis et al., 2008; Balis et al., 2004; Amiridis et al., 2005) as well as atmospheric-dust regional models (Pérez et al., 2006; Gkikas et al., 2018). The AErosol RObotic NETwork (AERONET; https://aeronet.gsfc.nasa.gov/, last access: 6 February 2026), a globally distributed network of sun photometers, provides long-term, quality-assured observations of column-integrated aerosol properties (Holben et al., 1998). In the Mediterranean region, AERONET has a relatively dense coverage, with over 40 stations having recorded at least one full annual cycle between 2015 and 2025.
Through the analysis of measured aerosol properties with respect to dust origin and transport pathways, this study aims to assess the influence of transport processes, including aerosol mixing. To address these gaps, this study examines the optical and mineralogical properties of dust during four dust episodes over the Mediterranean Basin in 2021–2022. The approach of this paper is to combine ground-based and satellite-based remote sensing observations to assess the optical properties of dust. In addition, the mineralogical signature of dust will be studied through ground and unmanned aerial vehicle (UAV)-based in situ observations along with simulations.
The study is structured in three main parts. In the second section, the datasets and methodology used for the identification and characterization of the events is described. Section 3 presents the four selected dust events, describing their temporal and geographical extent, transport pathways, and main optical characteristics. Following, in the results section, the optical properties of aerosols measured at various AERONET stations impacted by each event are compared to understand the evolution of dust optical properties within single events and to assess how different dust sources influence the optical characteristics of the selected events. The dust fraction at each station is evaluated using the MODIS Dust Aerosol (MIDAS) dataset described by Gkikas et al. (2021) to better characterize the aerosol mixture at each location. A further analysis using ground-based observations has been developed, focusing on the island country of Cyprus, which lies at the crossroad of three continents (Asia, Africa, Europe) and is the only area in Europe affected by both Saharan and M. East dust sources. As a result, Cyprus was affected by three of the four dust events considered, which allows the investigation of aerosol mixtures and mineralogical composition using ground-based observations from the Cyprus Atmospheric Observatory in Agia Marina Xyliatou. Finally, to examine how transport history and source attribution relate to the simulated mineralogical composition in the selected events, the METAL-WRF model (Solomos et al., 2023) is utilized. The mineralogical composition simulated by METAL-WRF is compared with UAV-based observations in Cyprus to assess the simulated dust composition during these events.
2.1 Global Datasets and Models
2.1.1 AERONET
AERONET (AErosol RObotic NETwork) is a global network of ground-based sun–sky photometers that provides aerosol optical and radiative properties of more than 200 sites around the globe (Giles et al., 2019; Zhang et al., 2025). The most widely used product of AERONET is the spectral aerosol optical depth (AOD), which is derived from direct sun irradiance measurements at wavelengths from 440 to 1640 nm and is proportional to the amount of aerosol in the atmospheric column. The spectral dependency of the AOD is expressed in terms of the scattering Ångström exponent (AE), which is an indicator of the aerosol particle size. In addition, AERONET measures sky radiances at different sky geometries, which are used in combination with AOD measurements to retrieve microphysical and optical aerosol properties using inversion algorithms (Sinyuk et al., 2020; Dubovik and King, 2000; Dubovik et al., 2000). Its long-term, high-quality, and globally distributed observations have been instrumental in studying dust variability and aerosol properties across diverse regions (Dubovik et al., 2002; Kim et al., 2011).
In this study, data products from Level 1.5 Version 3.0 (v3) AERONET retrievals (Giles et al., 2019) have been used. This decision is made against Level 2 data in order to achieve better data availability. For Level 1.5 products, as full re-calibration may not yet have been applied, we expect slightly larger uncertainties than Level 2.0 (0.01–0.02), with more relative impact in low AOD cases. AOD and AE data are primarily used to identify intense dust events in the Mediterranean basin. In addition, some inversion properties like the single scattering albedo (SSA), asymmetry parameter (ASY), and particle size distribution (PSD) are further analyzed to examine the evolution of the optical and microphysical aerosol properties.
More specifically, ASY is the integral of the energy distribution (phase function) weighted by the angle of scattering. Its value varies between −1 and 1, depending on whether the scattering is perfectly backward or forward with respect to the direction of incidence. It takes the value of zero in the case of isotropic scattering, which would correspond to scattering from gas molecules (Rayleigh scattering). For dust particles, which are 3 orders of magnitude larger in size, typical values are between 0.6 and 0.8 (e.g., Hess et al., 1998). The asymmetry factor is wavelength-dependent, providing insight into aerosol size and type. Higher values of the asymmetry parameter are associated with the presence of larger particles (Zeb et al., 2024).
SSA describes the scattering efficiency of particles, such as aerosols or clouds, relative to the total extinction (scattering + absorption) of light. Particles with SSA ≃1, e.g., like sulfate aerosols, reflect sunlight and have a cooling effect, while highly absorbing particles (SSA ≃0.2), such as black carbon, contribute to warming by converting sunlight into heat. Aerosols with intermediate properties, like organic carbon or dust, can have varying climate direct impacts depending on their altitude and the surface albedo underlying them.
Finally PSD provides a quantitative description of aerosol concentrations across different particle sizes, which is important for understanding the mixture of fine and coarse particles during dust events.
For the inversions, the residual sky error was selected to be less than 6 %. A higher value for the sky error value than the commonly used 5 % threshold is chosen, as it is observed that 5 % cuts off a significant number of valid retrievals, as also mentioned in Holben et al. (2006).
2.1.2 ModIs Dust AeroSol (MIDAS) dataset
The MIDAS dataset, a MODIS-based dust aerosol product described by Gkikas et al. (2021), provides global estimates of dust optical depth (DOD) on a high-resolution 0.1° × 0.1° grid. It is derived from MODIS-Aqua (and more recently MODIS-Terra) AOD retrievals, combined with dust fraction information from the MERRA-2 reanalysis. The original dataset spanned from 2003 to 2017 and has recently been extended to 2023. Only high-quality MODIS retrievals are used, after filtering for cloud contamination and applying standard quality assurance criteria. Validation of the dataset was performed through comparison with AERONET observations, showing strong agreement and minimal bias. This validation confirms the accuracy of the MIDAS product in representing dust aerosols, particularly over key dust regions such as North Africa and the Middle East. MIDAS offers significant advancements compared with existing datasets, with higher spatial resolution and more accurate dust-specific retrievals. Since its development, the dataset has been applied across a range of studies, including studies on dust climatology (Gkikas et al., 2022; Logothetis et al., 2021) to modeling of emission and transport processes (Kiriakidis et al., 2023), as well as studies of dust impacts on solar energy production (Masoom et al., 2021; Papachristopoulou et al., 2022).
In this study, MIDAS is used to map the spatial extent and intensity of selected dust events over the Mediterranean by calculating daily mean DOD and AOD values at 550 nm at 0.1° × 0.1° resolution. These observations support the identification of the most affected regions and enable estimates of the dust fraction in the total aerosol load through DOD-to-AOD ratios. Maps of DOD overlaid with station locations are shown in Appendix C.
2.1.3 METAL-WRF
To complement the observational analysis, we employ the METAL-WRF modelling system, which simulates the distribution of dust mineral fractions in the atmosphere (Solomos et al., 2023). METAL-WRF couples the GOCART-AFWA dust emission scheme with prognostic tracers for nine mineral species – illite, kaolinite, smectite, calcite, quartz, feldspar, hematite, gypsum, and phosphorus – plus iron. Mineral fractions of the source regions are taken from the high-resolution GMINER30 (Nickovic et al., 2012) and FERRUM30 (Nickovic et al., 2013) databases. In the model, each mineral is treated as an independent prognostic scalar (Solomos et al., 2023), allowing its full life cycle – emission, transport, gravitational settling, diffusion, and wet scavenging – to be explicitly resolved. This approach enables the airborne mineral mixture to evolve both spatially and temporally, producing spatially explicit fields of mineral-specific dust mass that can be used to trace source fingerprints and their evolution during Mediterranean transport.
2.2 In Situ Measurements at Cyprus Atmospheric Observatory (CAO)
2.2.1 Ground-based
The study uses ground-based in situ measurements recorded at the Cyprus Atmospheric Observatory (CAO) in Agia Marina Xyliatou, operated by the Climate and Atmosphere Research Centre (CARE-C) of the Cyprus Institute (CyI), to compare dust concentrations, elemental composition, and dust absorption during these events. PM10 and PM2.5 were measured at Agia Marina Xyliatou using pre- and post-weighted filters, providing insights into the temporal variation of the particulate matter (PM) levels. Applying acid digestion on integrated daily samples combined with inductively coupled plasma-mass spectrometer (ICP-MS) analysis on parts of the samples, the elemental composition could be directly estimated (Bimenyimana et al., 2023). Based on the method described in Querol et al. (2001), dust concentrations were estimated by indirectly calculating Si and using the following empirical relationships:
The absorption coefficient for the dust events is calculated using observations from two Aethelometers instruments (model AE33, Magee Scientific, USA) installed at CAO Agia Marina Xyliatou. The AE33 determines the light attenuation coefficient (bATN) by continuously collecting particles on a filter tape and measuring the change in optical transmission between a clear and a clean part and a sampled spot.
Two different inlet configurations were used to investigate size-resolved absorption properties. One AE33 was equipped with a PM1 cyclone providing the submicron absorption coefficient. The second instrument was connected to a virtual impactor (VI), which enhances the coarse particle fraction by concentrating particles larger than approximately 2.5 µm in the minor flow. This setup allows the characterization of dust-dominated absorption associated with coarse-mode particles.
The dust absorption is then defined by subtracting the submicron absorption from the VI absorption following the methodology described in Drinovec et al. (2020):
where EF is the enhancement factor describing the enrichment of the coarse fraction in VI.
2.2.2 UAV-based
During the 2021 Cyprus Fall Campaign, carried out from 18 October to 18 November, the Unmanned Systems Research Laboratory (USRL, Kezoudi et al., 2021) of the Cyprus Institute (CyI) utilized UAVs equipped with advanced instruments like OPCs and impactors to collect samples, alongside ground-based remote sensing and in situ instrumentation of the CAO of the CyI. The study investigated the microphysical and optical characteristics of mineral dust transported over Cyprus. For the sample collection at different altitudes, a 3D-printed miniaturized version of the Giant Particle Collector (GPAC or impactors) was deployed on the UAVs. Overall, the Scanning Electron Microscope (SEM) analysis of these samples identified silicates as the dominant component, with Ca-rich materials and clay minerals also present in significant proportions.
2.3 Heights, Trajectories and Origin Analysis
In addition to the information provided by the different datasets mentioned, the heights, trajectories, and origin of the different aerosol events were analyzed as well.
2.3.1 EARLINET
The vertical distribution of dust particles was estimated using European Aerosol Research Lidar Network (EARLINET; Pappalardo et al., 2014) measurements from stations co-located with or located sufficiently close to the AERONET sites listed in Table 1, performed on the peak date of the event, as reported in the same table. For each measurement, the particle backscatter coefficient and the particle depolarization ratio were used to retrieve the dust backscatter coefficient profile. In particular, the dust component was separated from the total aerosol backscatter profile based on depolarization ratio values, following the methodology described by Tesche et al. (2009). The altitude of the dust layer was then determined by identifying the level at which the dust backscatter coefficient reached its maximum value, indicating the highest dust concentration (see Appendix A).
2.3.2 LIVAS
Aerosol optical properties profiles provided by Cloud–Aerosol Lidar with Orthogonal Polarization (CALIOP), the primary instrument onboard the Cloud–Aerosol Lidar and Infrared Pathfinder Satellite Observations (CALIPSO; Winker et al., 2010) satellite, were applied under a similar approach, towards addressing the four-dimensional structure of dust aerosol layers transported over the broader Mediterranean region. More specifically, vertical profiles of dust extinction coefficient at 532 nm and total aerosol particulate depolarisation ratio at 532 nm, as well as peak height of the atmospheric dust component along the CALIPSO orbit path, were extracted by the European Space Agency (ESA) “LIdar climatology of Vertical Aerosol Structure” (LIVAS) dust climate data record (Amiridis et al., 2013, 2015; Marinou et al., 2017; Proestakis et al., 2018, 2024; Aslanoğlu et al., 2022) and analysed as in the example seen in Fig. B1 (see Appendix B).
2.3.3 IASI-MAPIR
The IASI-MAPIR dataset (version 5.11, available at https://doi.org/10.18758/f7el2zbr, Vandenbussche and De Maziere, 2025; Vandenbussche et al., 2026) was used to independently identify and characterize the dust events. Specifically, the retrieved dust vertical profiles and integrated dust AOD were employed to (i) confirm the presence of mineral dust over the study region, (ii) determine the spatial extent of the dust plumes, and (iii) estimate the altitude of the dust layers upon arrival at the affected stations (Appendix D).
The dataset is particularly valuable because the thermal infrared retrieval allows direct separation of mineral dust from other aerosols without requiring post-processing. Although subject to some limitations in quality control (e.g., the data set is “cloud-free” only, sensitivity is reduced at low AOD, and when the surface and the dust layer are at similar temperatures), these data contribute valuable insight into the intensity, spatial spread, and vertical extent of dust plumes at the affected stations.
2.3.4 HYSPLIT
The Hybrid Single-Particle Lagrangian Integrated Trajectory (HYSPLIT) model (Stein et al., 2015; Rolph et al., 2017) was run with using Global Data Assimilation System (GDAS) meteorological reanalysis fields at approximately 50 km resolution to investigate the trajectories of observed airmasses over the stations affected by dust events. Grid ensemble 120 h backtrajectories were computed from each station arriving at the date, time, and altitude of the observed dust event. A set of trajectories is automatically calculated around a cube (3-dimensional), centered on the initial point. The cube comprises 27 points across three planes, with nine trajectories per plane located at a vertical spacing of ± 250 m. The horizontal spacing of these trajectories is 1° in latitude (∼111 km) and 1° in longitude (∼111 km ⋅ cosine latitude).
Using the tools described in the previous section, the following methodology was applied to determine the dates for analysis, select relevant stations, and classify data sources.
The first step was to identify significant dust events across the Mediterranean Basin using AERONET observations in the years 2021–2022 from all the stations in the area. Dust episodes were identified based on two concurrent criteria on daily averaged data from AERONET:
-
AOD at 500 nm >0.2 and
-
AE between 380–500 nm less than 0.3.
IASI pure dust satellite AOD retrievals were also analysed to complement this information in order to ensure that the aerosol type could be classified as mineral dust (Appendix D).
Using these thresholds, spatial maps were generated to identify 20 d periods during which dust impacted over 10 AERONET stations. These maps allowed us to highlight widespread dust activity across the region.
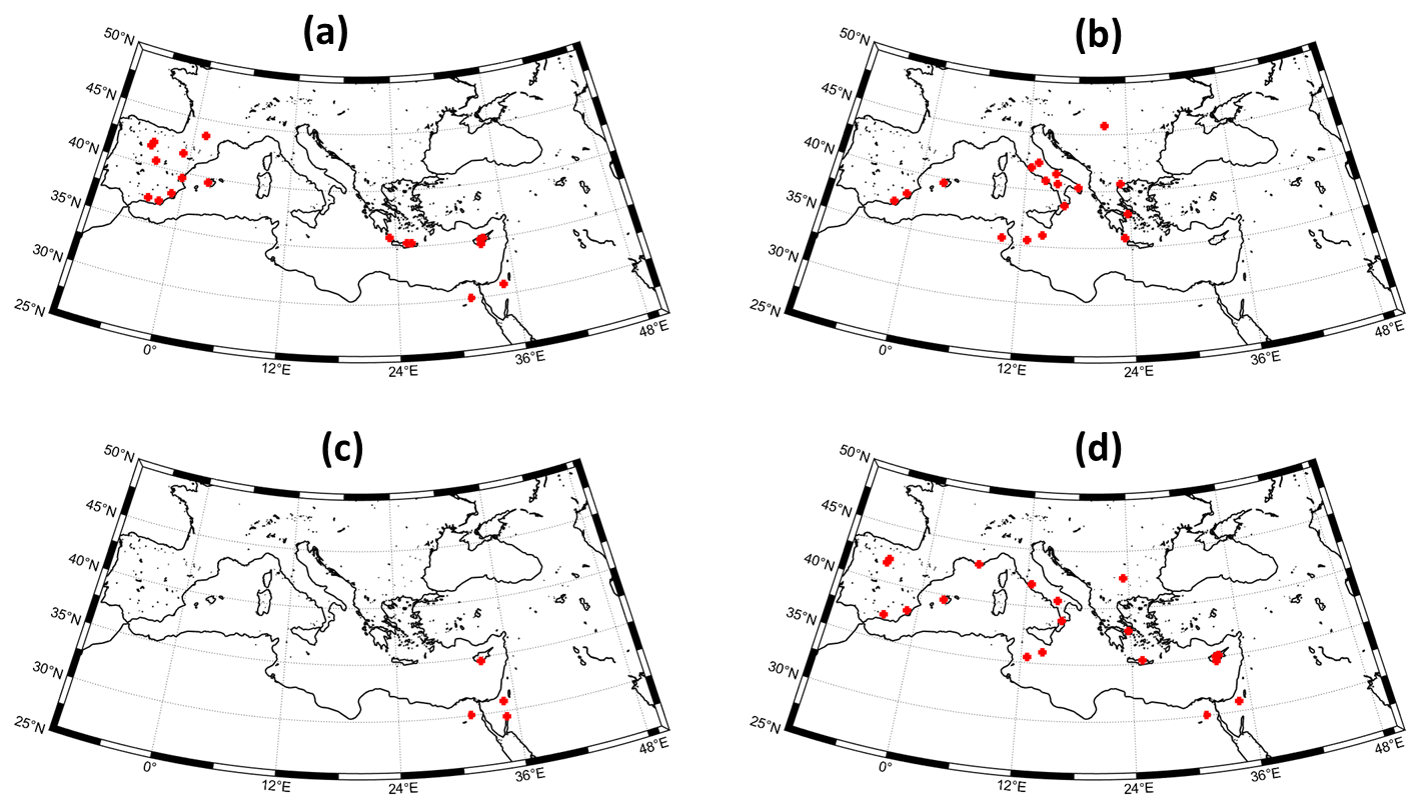
Figure 1Map of AERONET stations where AOD >0.2 and (ii) between (a) 18 and 29 March 2021, (b) 17 and 28 June 2021, (c) 10 and 21 November 2021, and (d) 20 April and 10 May 2022.
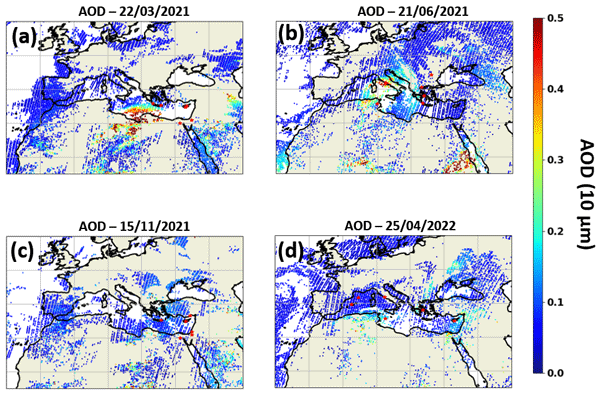
Figure 1 shows four selected cases where dust influenced several stations across the Mediterranean basin. During the first event (Fig. 1a), intense dust influenced both the Eastern Mediterranean and the Iberian Peninsula between 18 and 29 March 2021. This study focuses only on the Eastern Mediterranean part of this event, as the associated dust plume followed a more clearly traceable transport pathway across the Mediterranean. According to IASI, the event originated over Algeria, subsequently moving eastward across the Mediterranean Sea and reaching the Eastern Mediterranean (Fig. D1a). The AOD levels were relatively high along the transport path, particularly over the Central Mediterranean and near the affected stations, indicating a dense and well-developed dust plume. The mean altitude appeared to be relatively low, about 3 km (Fig. D2a).
In the second event, stations in the Central Mediterranean and Central Europe were affected (Fig. 1b). The outbreak appears to have originated over northern Algeria and Tunisia, before moving northeastward across the Central Mediterranean Sea. The IASI-derived AOD indicated enhanced dust loads, with the most affected areas being in the Central Mediterranean and parts of southern Italy and Greece (Fig. D1b). The mean altitude for this event ranged between 4 to 5 km, suggesting efficient long-range transport in the mid-troposphere and a well-developed dust plume extending over a wide area (Fig. D2b).
The third event was weaker and more localized affecting only the Eastern Mediterranean and the Middle East (Fig. 1c). AOD values were generally lower than in the previous events, and the spatial extent of the plume was limited (Fig. D1c). This event originated from the Middle East, affecting mainly the Eastern Mediterranean. The mean altitude remained lower than in the previous events, between 2 to 3 km, indicating a more confined plume, possibly due to less intense uplift or less favorable transport conditions (Fig. D2c).
Finally, the fourth event on the other hand, affected more than ten stations spanning from the Eastern to the Western Mediterranean (Fig. 1d). According to HYSPLIT backtrajectories, the latter was composed of multiple successive sub-events: the first originated over the Tunisia–Libya region and impacted Central and Eastern Europe; this was followed by a Middle Eastern dust outbreak affecting parts of Eastern Europe; finally, a plume emerging from the Tunisia–Algeria region was transported toward Western Europe. Overall, the main dust activity appears to have originated from Algeria and Libya, and shows moderate AOD levels as the dust travels eastward across the Mediterranean according to IASI (Fig. D1d). The mean altitude was approximately 3 km, comparable to event A, but the broader distribution and slightly higher altitude suggest a moderate-intensity event with widespread influence across the basin (Fig. D2d).
A more detailed analysis was performed to determine the exact timing of the dust events and the origins of the dust plumes. A visual inspection of AERONET products was conducted to pinpoint the specific dates of the dust episodes with increased accuracy. The detailed analysis is based on selected stations affected during each event, ensuring broad spatial coverage across the region, based on the availability of sufficient inversion data (e.g., size distribution, asymmetry factor, single scattering albedo), with preference given to those providing lidar or ceilometer observations to capture the vertical variability of the dust layers during transport. The arrival height of the dust plumes was estimated using co-located vertical profile observations, where available (e.g., from ACTRIS/EARLINET lidar instruments). It should be emphasized that in the case of Cyprus, three stations are equipped with instrumentation providing the observations relative to the vertical structure of the dust layers (CUT-TEPAK, Agia Marina Xyliatou, and Nicosia), and therefore, the selection of the most suitable station was based on the retrieval availability.
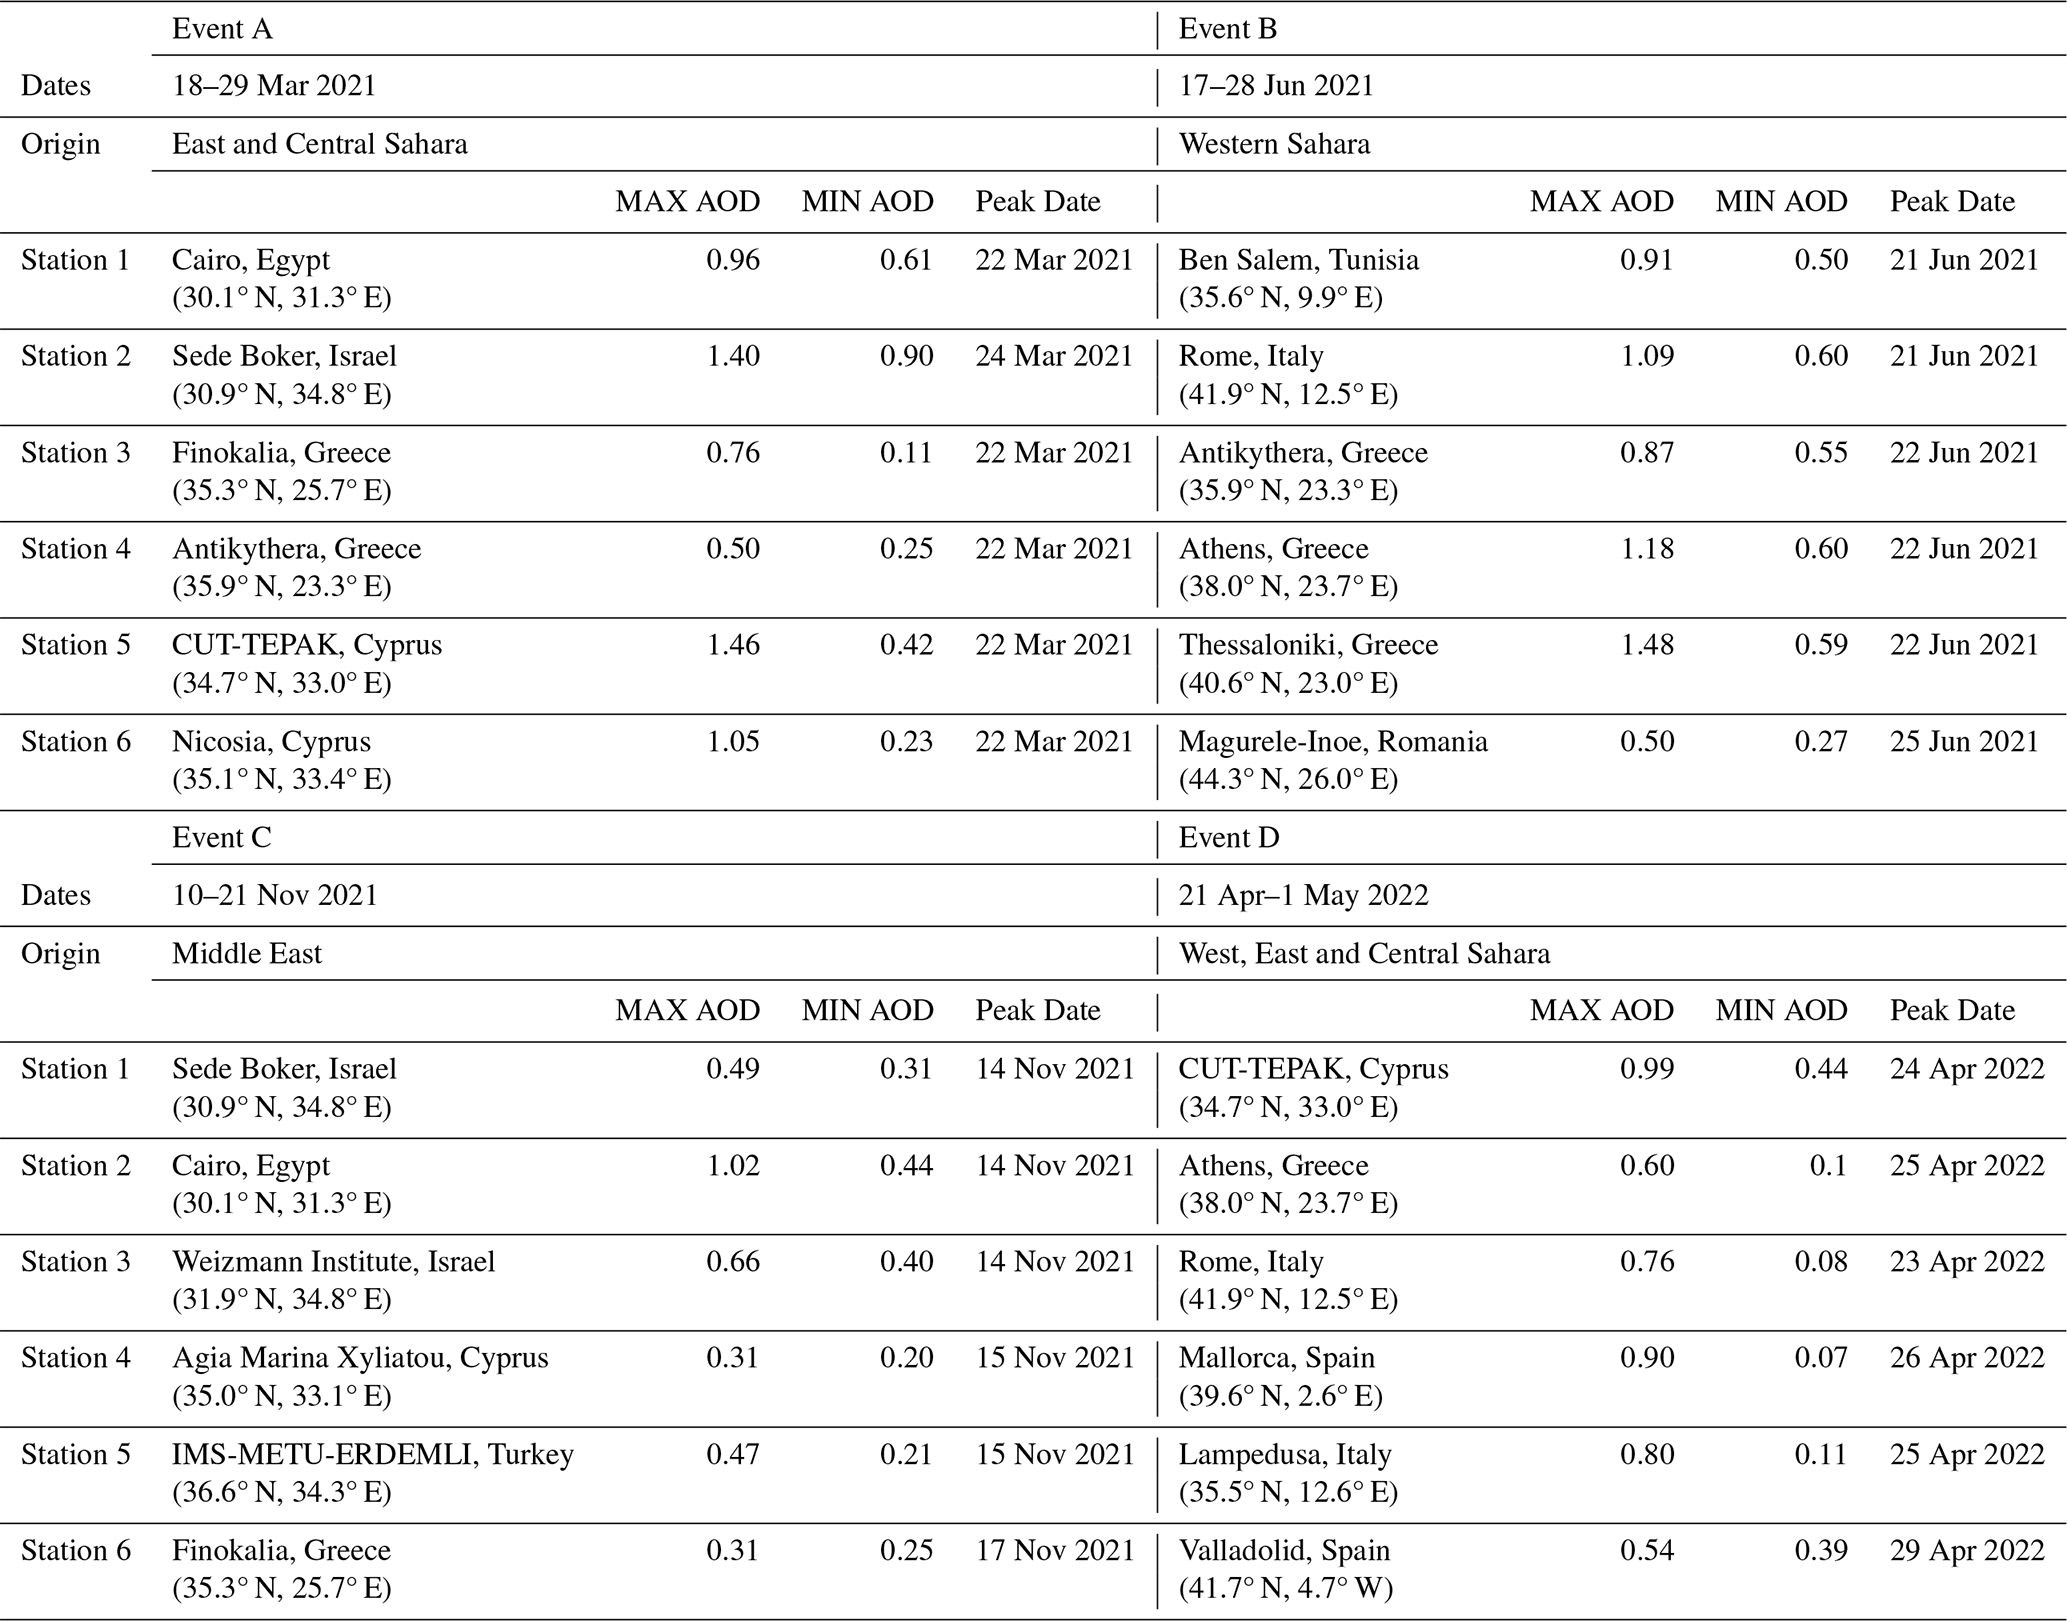
Table 1 provides an overview of the dust events in the period 2021–2022 and the corresponding stations selected for analysis in the framework of the present study. The peak date refers to the day with the highest AOD during the main dust event identified in each period. In cases where two sub-events occurred within the same period, only the most intense (in area and AOD) is considered. Maximum and minimum AODs for the peak date are also provided in the table. The stations are numbered in ascending order (from 1 to 6) based on their distance from the source, from the nearest to farthest. For specific events (like event D), the sequence was not clear due to the multiple occurring events, and the numbering may not accurately reflect the actual station's distance from the source. For this reason, numbering in this case is used only as a plotting convention and does not represent the transport pathway.
To confirm the diversity of the origin and transport pathways of the dust plumes, we conducted trajectory analysis using the HYSPLIT model. The resulting back trajectories, illustrated in Fig. 2, depict the transport pathways at two representative stations affected during each event and provide the origins shown in Table 1.
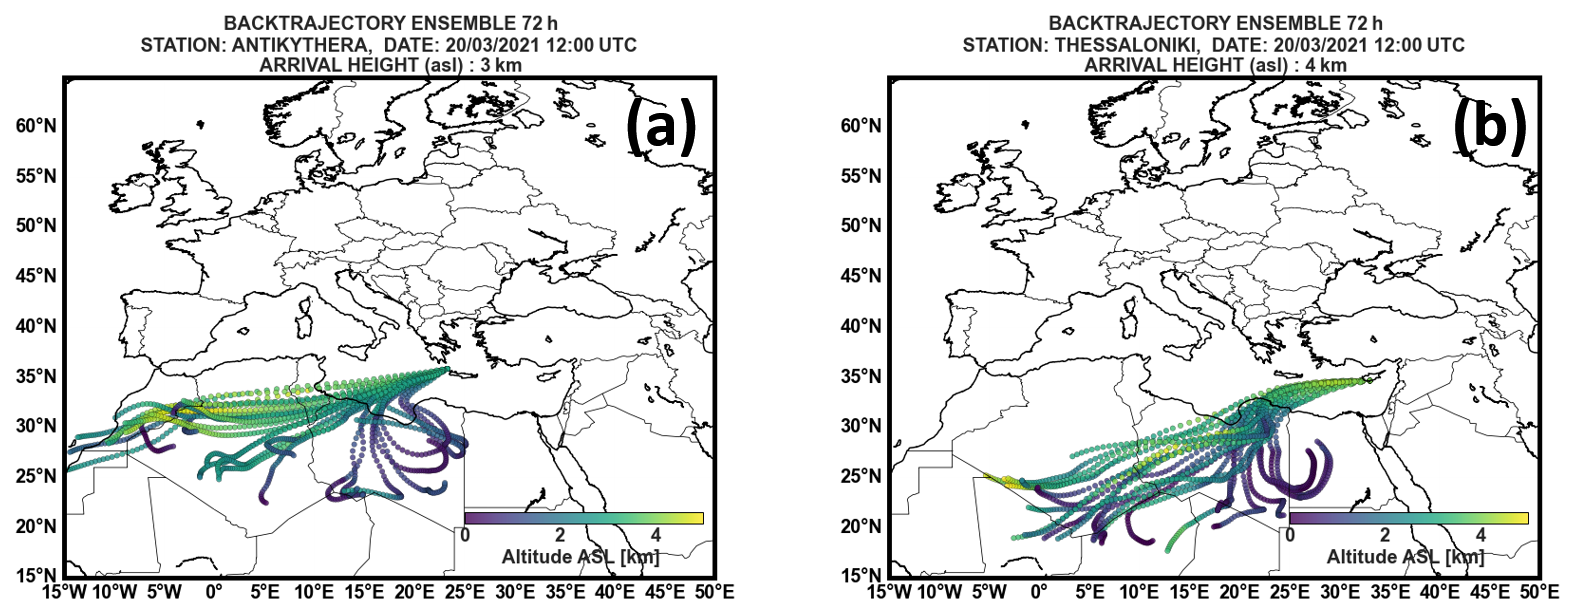
Figure 2120 h HYSPLIT Ensemble backtrajectories for event A (a, b) at two stations affected by the event: (a) Antilythera and (b) Thessaloniki. Each ensemble member is generated by applying a fixed grid offset to the meteorological data, highlighting the variability in transport pathways. Arrival heights are calculated based on vertical profiles from collocated lidar observations. The color scale along each trajectory represents altitude above sea level (km).
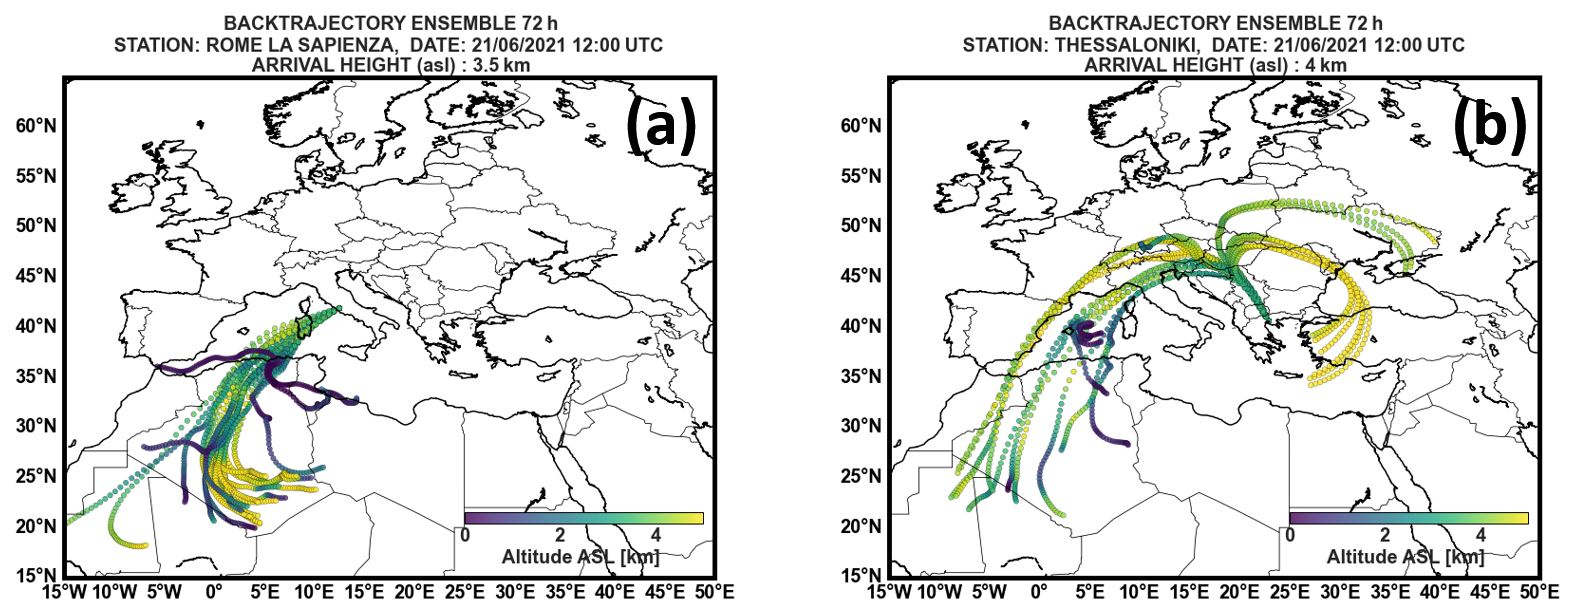
Figure 3120 h HYSPLIT Ensemble backtrajectories for event B at two stations affected by the event: (a) Rome La Sapienza and (b) Thessaloniki. Each ensemble member is generated by applying a fixed grid offset to the meteorological data, highlighting the variability in transport pathways. Arrival heights are calculated based on vertical profiles from collocated lidar observations. The color scale along each trajectory represents altitude above sea level (km).
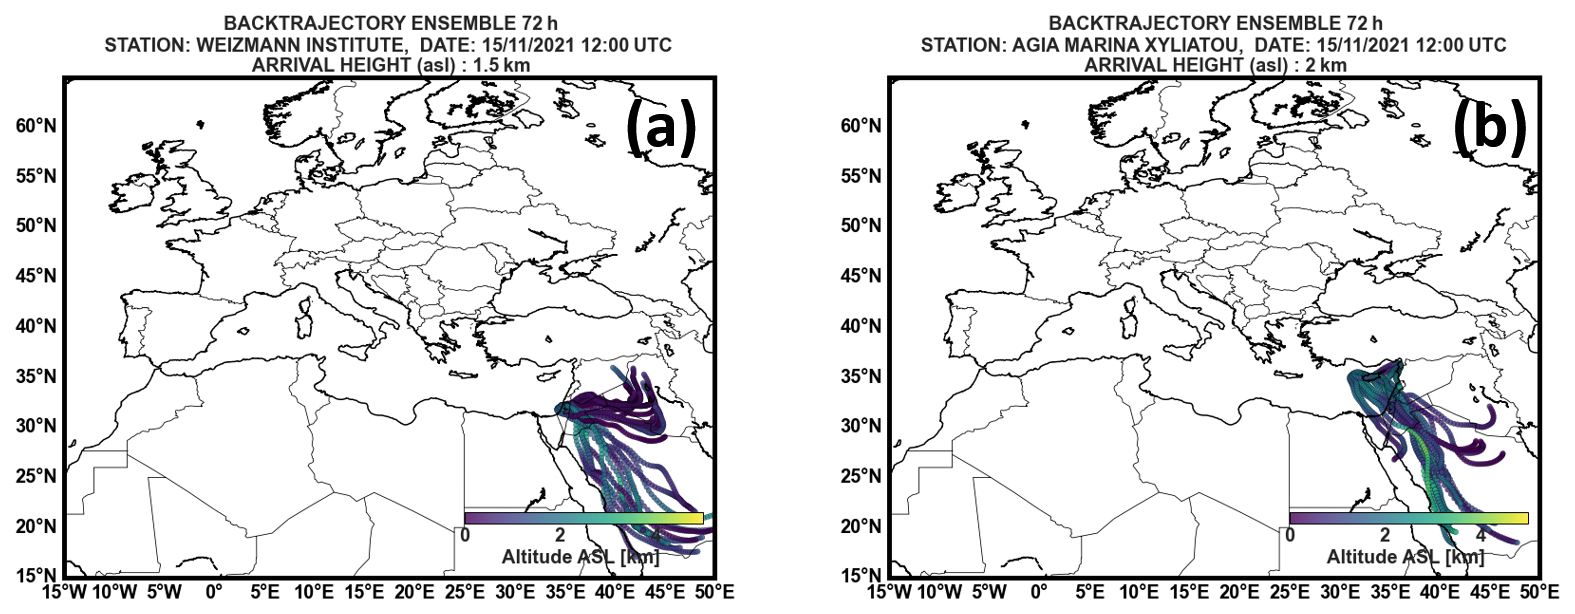
Figure 4120 h HYSPLIT Ensemble backtrajectories for event C at two stations affected by the event: (a) Weiszmann Institute and (b) Agia Marina Xyliatou. Each ensemble member is generated by applying a fixed grid offset to the meteorological data, highlighting the variability in transport pathways. Arrival heights are calculated based on vertical profiles from collocated lidar observations. The color scale along each trajectory represents altitude above sea level (km).
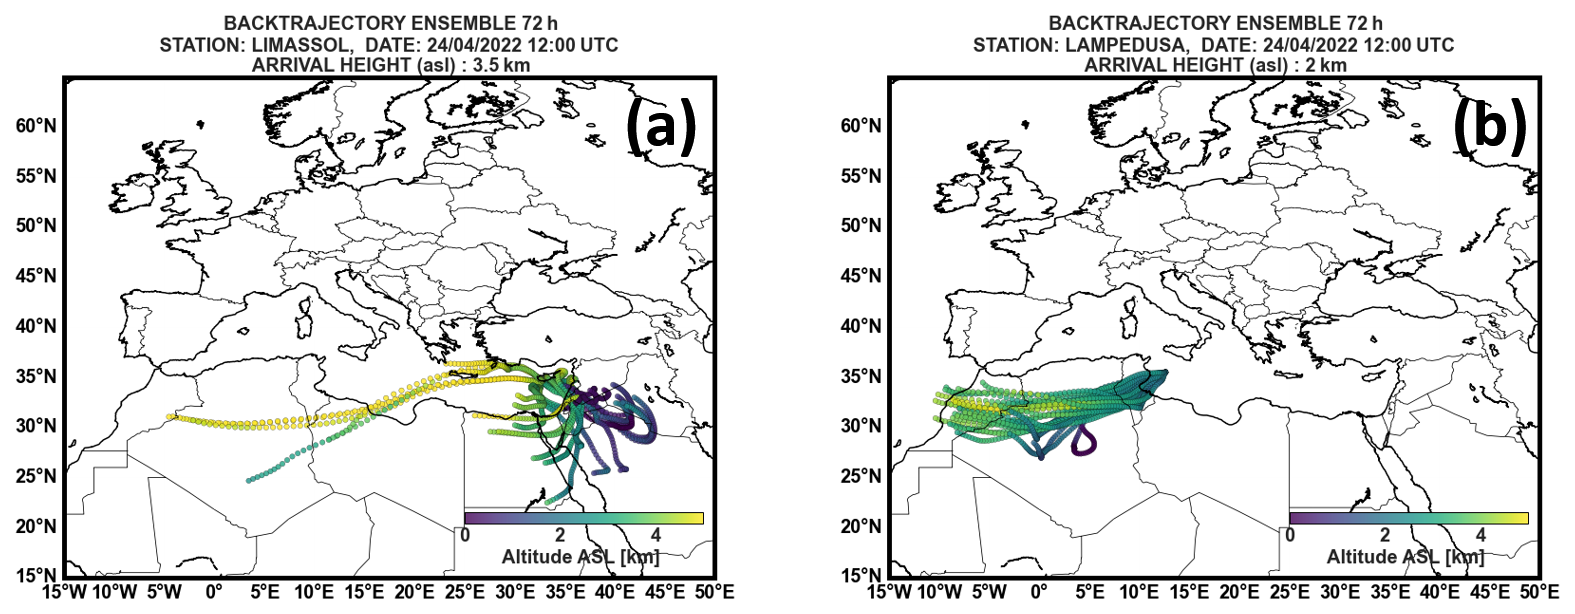
Figure 5120 h HYSPLIT Ensemble backtrajectories for event D at two stations affected by the event: (a) Limassol and (b) Lampedusa. Each ensemble member is generated by applying a fixed grid offset to the meteorological data, highlighting the variability in transport pathways. Arrival heights are calculated based on vertical profiles from collocated lidar observations. The color scale along each trajectory represents altitude above sea level (km).
Table 1Selected dust events along the Mediterranean Basin during the period 2021–2022. Stations are listed in ascending order according to the sequence in which they were affected by each dust event. The minimum and maximum AOD values correspond to the instantaneous values recorded on the peak day of the event at each station.
4.1 Aerosol Optical Properties and Size Distributions
4.1.1 Aerosol classification based on AOD and AE
Figure 6 shows the relation between AOD at 500 nm and AE 440–675 nm, for the peak date at each station, during each event, which combined provides insight on the intensity and composition of each of the events at different locations. The AE parameter provides aerosol particle size; the lower this parameter is the bigger the particle size. Coarse particles usually present AE values below 1 since they have a lower spectral dependency. In particular, values of AE <0.3 have been found for very high AOD Saharan aerosol dust events (Toledano et al., 2007; Valenzuela et al., 2015; Gkikas et al., 2009, 2013, 2016).
Observations are categorized into four aerosol types following the boundaries defined in Kalapureddy et al. (2009): desert dust, pollution, mixed aerosols, and background. The colour scheme in the plots corresponds to the direct distance of the affected stations from the source, with the closest station to the source shown in turquoise and the furthest in grey. The full sequence of colours is as follows: turquoise, green, orange, magenta, brown, and grey. The aerosol regimes inferred from the AOD–AE diagrams should be interpreted only as indicative classifications, particularly because dust–pollution and dust–marine mixtures may occupy overlapping regions of the AOD–AE space. They are therefore used only as complementary information alongside the additional optical, transport, observational, and modelling evidence presented in this study.
For event A (see Fig. 6a) a wide range of AOD values are observed reachin up to 1 for Cairo_EMA_2, Nicosia and CUT-TEPAK stations. Relatively similar AE values were observed in all stations on the peak day, with values below 0.5, indicating that a similar aerosol plume with large particles, classified as desert dust, was affecting these stations.
During event B (see Fig. 6b), the AOD and AE values remained above 0.5 and below 0.4, respectively, for almost all the stations, classifying the aerosols as desert dust. The only exception is seen for Magurele_Inoe (Romania), where the significantly lower AOD values and higher AE suggest the presence of a more mixed or polluted air mass. This station exhibited a weaker response to the dust event, as also reflected in the time series of AOD and AE (Figs. E1b and E2b).
With respect to event C (see Fig. 6c), this event shows a lower intensity than the rest of the analyzed events, with AOD values ∼ 0.4. In this case, AE is relatively high and constant (Fig. E2c) in all the stations, with values between 0.5 and 1.5, indicative of a mixed aerosol event likely influenced by both dust and anthropogenic pollution.
Event D (see Fig. 6d) is characterized by high AOD (>0.4), for all the stations, AE reaches values close to when the maximum AOD occurs. Looking at the time series of this event (see Figs. E1d and E2d), it is noticeable that the event is characterized by high variability in terms of AERONET observations, possibly attributed to the significant geographical extent of the event, between Eastern and Western Mediterranean. Most observations are classified as desert dust, with only a few measurements at Palma_de_Mallorca (Eastern Spain) corresponding to background aerosol conditions.
Detailed time series of both AOD and AE are found in the Appendix E.
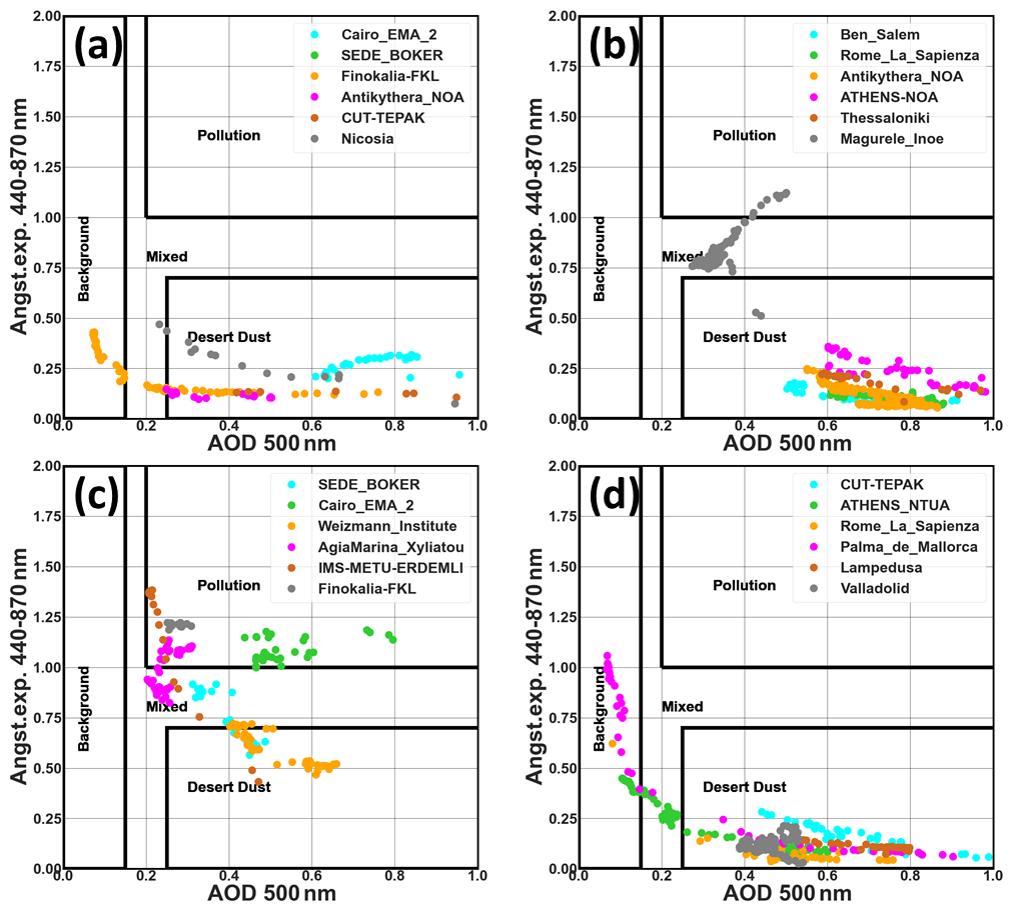
Figure 6Scatter plots of Ångström exponent (440–870 nm) versus AOD at 500 nm for the four dust events: (a) event A, (b) event B, (c) event C, and (d) event D. Different colors denote the observations on the peak date at individual AERONET stations. The black lines indicate classification thresholds that separate the background, mixed, desert dust, and pollution-dominated aerosol regimes.
4.1.2 Retrieved optical properties
As a next step, the optical aerosol properties retrieved by AERONET at the selected stations are discussed. The average of the retrievals that meet the criteria considered (see Sect. 2) are calculated for the day with the highest AOD value at each station for each event. Error bars with standard deviation are plotted for cases where more than one observation are available. For the Middle East and Central Sahara events, it was feasible to retrieve inversions only for some of the stations affected, as not all of the inversions were meeting the criteria.
The first parameter derived from inversion considered here is the asymmetry parameter. Figure 7 shows that the values of this parameter for these events are in the range expected for dust particles (0.6–0.8) (Korras-Carraca et al., 2015). Low ASY values are observed for all the stations affected by event C (originating from Middle East), comparable to those recorded at Magurele during event B and at CUT-TEPAK during event D. These reduced ASY values may be associated with the presence of smaller particles in the dust mixture observed at these stations. In the case of Magurele, the relatively lower ASY values observed can possibly be attributed to the elevated levels of continental aerosols and the lower amount of dust reaching this site. There is a strong wavelength dependence in all cases at shorter wavelengths. A similar ASY behavior is observed between events A and B (originating from Eastern and Western Sahara, respectively). A wider spread in ASY is observed in the case of event D (originating from Central Sahara), which can be explained by dust particles of varying properties resulting from the wide source area these particles originated from initially.
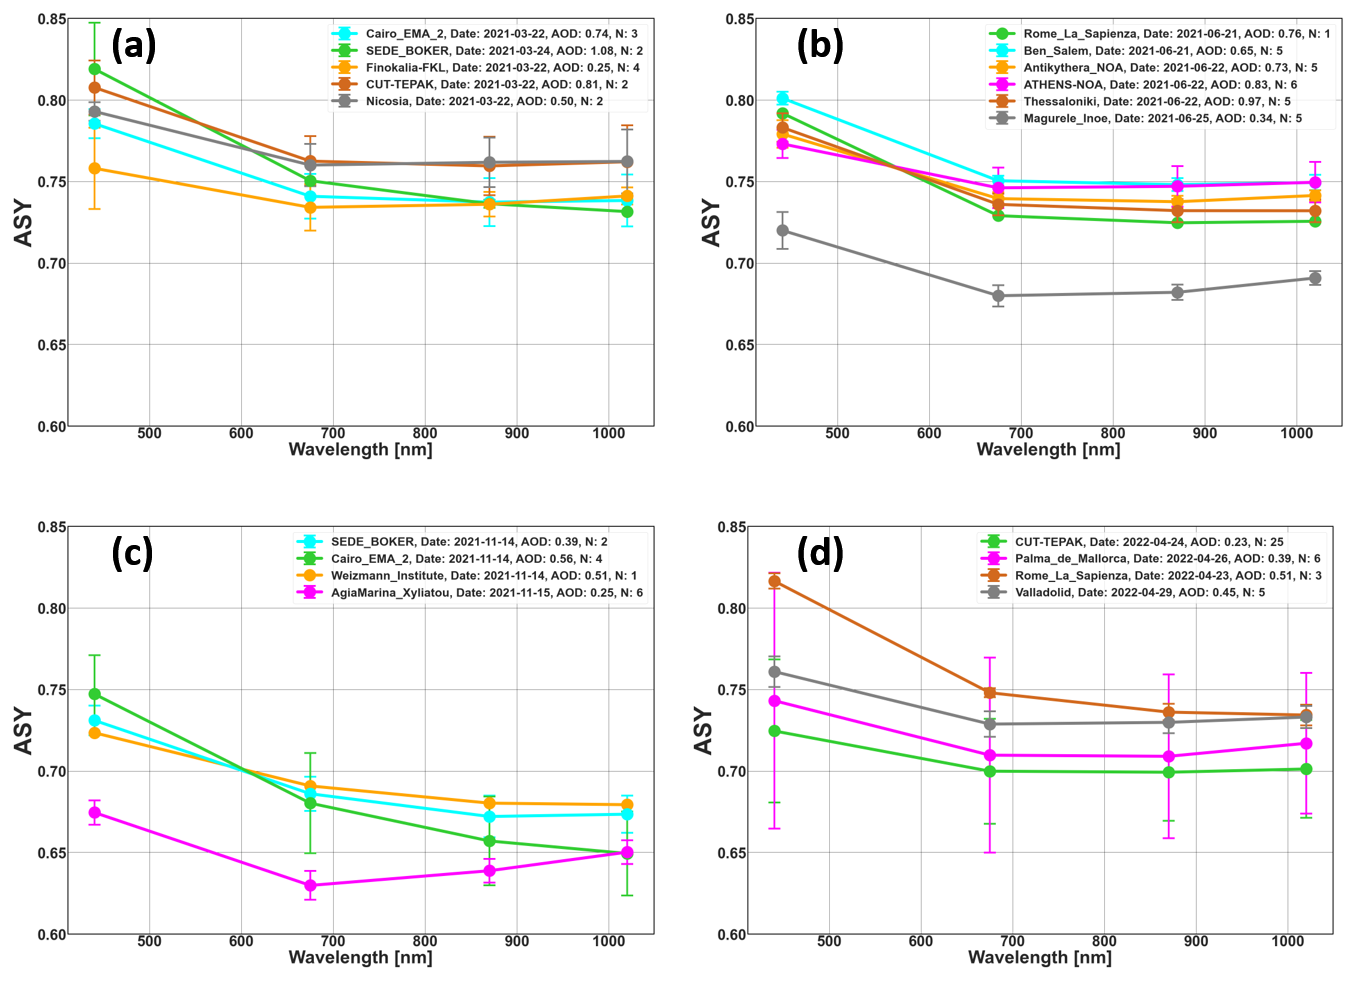
Figure 7Daily averaged asymmetry factor (ASY) from AERONET inversion products (level 1.5, sky error <6 %) for all the events (A: March 2021, B: June 2021, C: November 2021, D: March 2022), for the day with the highest AOD of the events at each station. Error bars correspond to the standard deviation of the size distributions during the day. Legend shows which is the day with highest AOD for each station, the averaged AOD value for that day and the number of inversions available (N).
It is possible to compare the ASY values obtained for the same station for different source regions (different events). Small differences are observed for Rome, with event D showing a slightly stronger spectral dependence than event B. A more pronounced effect is observed at the Cairo station, where ASY values are significantly lower (indicating smaller particles) when the dust originates from the Middle East (event C) compared to the East and Central Sahara (event A). A similar reduction in ASY pattern is observed at CUT-TEPAK when comparing events A and D, where the station in the latter event is influenced by Middle Eastern air masses, as shown in Figs. 2–5. This consistent pattern suggests that the observed ASY behavior, characterized by lower ASY values, is primarily driven by source characteristics (Middle East) rather than by local mixing effects at the measurement stations.
Another parameter derived from inversion that can give us information on the scattering properties of the dust events is the single scattering albedo.
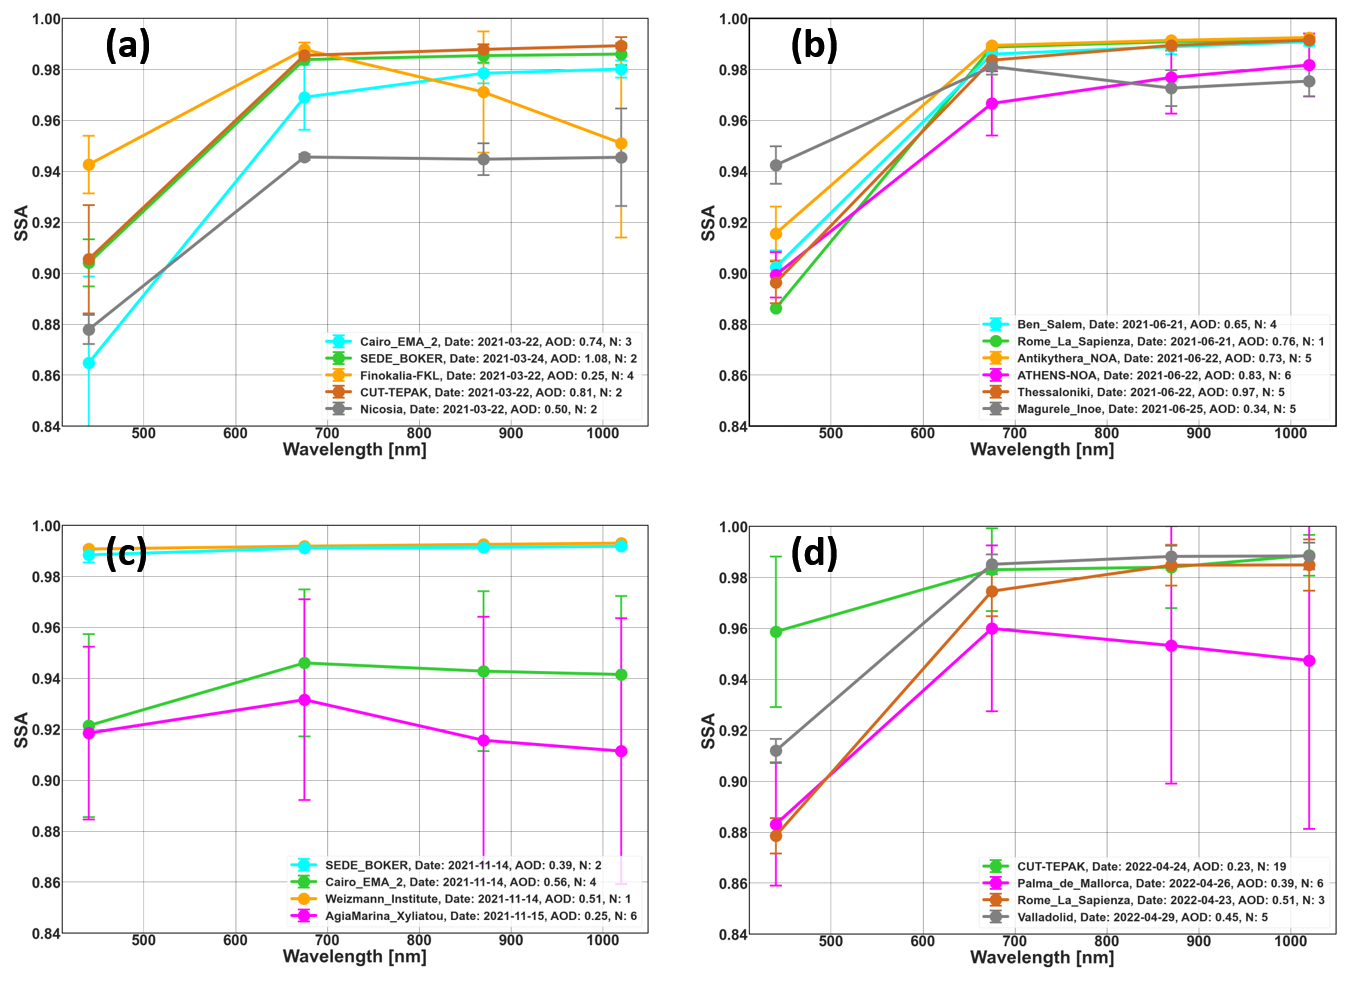
Figure 8Daily averaged Single Scattering Albedo (SSA) from AERONET inversion products (level 1.5, sky error <6 %) for all the events (A: March 2021, B: June 2021, C: November 2021, D: March 2022), for the day with the highest AOD of the events at each station. Error bars correspond to the standard deviation of the size distributions during the day. Legend shows which is the day with highest AOD for each station, the averaged AOD value for that day and the number of inversions available (N).
In Fig. 8, the SSA values are shown for all the inversions that fulfil the criteria explained above, at each station, for all the events. In general, the observed values and wavelength dependence are consistent with those found in previous works (Dubovik et al., 2002; Cachorro et al., 2010; Kim et al., 2011; Giles et al., 2012; Burgos et al., 2016). For the three Saharan dust events (A, B and D), low values (0.86–0.94) are found around 440 nm wavelength, with higher values (0.94–0.99) at 675–1020 nm. During the Middle East event (C), Cairo and Agia Marina show relatively low SSA values (SSA ≤0.94), consistent with more absorbing particles. In contrast, Sede Boker and Weizmann display the highest SSA values observed across all events. HYSPLIT back-trajectories indicate that the air mass arriving at these two stations originated over inland Saudi Arabia and that other stations affected by the same airmass have also similar SSA behaviour (e.g., Technion_Haifa_IL, Israel and KAUST_Campus, Saudi Arabia). This inland trajectory excludes significant marine influence, suggesting that sea salt aerosols are unlikely to explain the very high SSA observed (∼0.99). Another speculation is that these inland trajectories are not affected by compastion while in the other cases the trajectories could be affected by combustion. Instead, the elevated SSA (also observed on 15 November 2021) may result from the presence of mineral dust with inherently low absorption or long-range transported dust internally mixed with secondary scattering aerosols, such as sulfates or nitrates. Such aging and coating processes are known to increase SSA significantly during transport as also described in Bauer et al. (2007). It should be noted that no level 2 data are available for the two stations on that date.
In the case of the East-Central Sahara event (A), it is noticeable that Nicosia has smaller values than the rest of the stations, especially when compared with CUT-TEPAK, which is the nearest. This suggests that there might be some local aerosol mixing with the dust, for example, through interaction with emissions from power stations in the outskirts of Limassol as the dust plume moves inland toward Nicosia. The decrease seen at Finokalia for longer wavelengths could be explained by the lower AOD values at Finokalia, since small variations in AOD can have a large effect on SSA retrievals (Andrews et al., 2017). In the Western Sahara event (B), there is less variability between stations, except for Magurele, which has a higher SSA at 440 nm.
For event D, there is high variability in SSA, especially at the shortest wavelength, where dust is mostly absorbing. Palma de Mallorca station and Rome have in overall, the lowest values at the 440 nm wavelength indicating stronger absorption compared to other stations. Interestingly for Palma de Mallorca there is a decreasing trend of SSA at longer wavelengths, which, in combination with low AOD suggests locally mixed aerosols.
4.1.3 Particle size distributions and fine-mode contribution
Figure 9 presents the volume size distributions for each event, at the corresponding stations. For each station, the daily averaged size distribution on the day with the highest AOD is shown. It is important to note that the sky error criterion of <6 % is applied once again. Error bars correspond to the standard deviation of the size distributions during the day, when more than one observation is available.
For the East-Central Sahara event (A), the volume size distribution shapes are similar across different sites, with significant contribution by coarse-mode particles, with radius around 2.24 µm. The concentrations of coarse particles are more prominent at sites closer to the source (Cairo and Sede Boker).
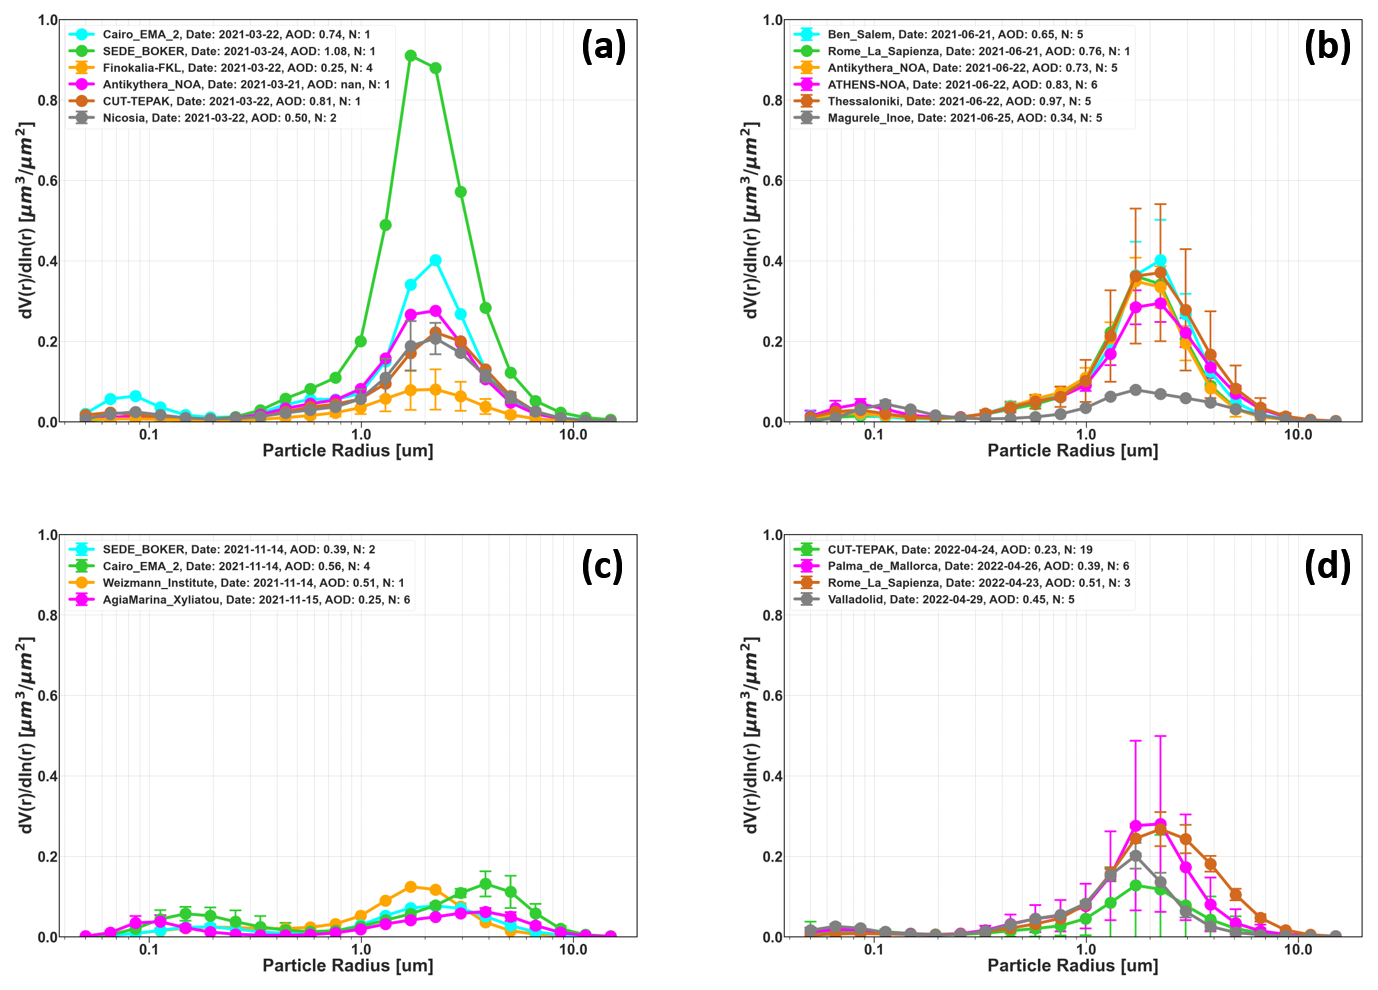
Figure 9Daily averaged size distribution from AERONET inversion products (level 1.5, sky error <6 %) for all the events (A: March 2021, B: June 2021, C: November 2021, D: March 2022), for the day with the highest AOD of the events at each station. Error bars correspond to the standard deviation of the size distributions during the day. Legend shows which is the day with highest AOD for each station, the averaged AOD value for that day and the number of inversions available (N).
Notably, for Western and Central Sahara events (B and D), in which the stations are widely distributed across the Mediterranean, the size distributions at different stations exhibit similar shapes and values, particularly for the coarse mode, which is predominant in these events. One exception is at Magurele site in event B, where the coarse mode is not significantly higher than the fine mode, suggesting the possibility that fewer particles arrive due to deposition during transport, as it is the furthest station from the source. In both cases, the peak of the coarse mode is between 1.7–2.24 µm while the concentrations at the peak are between 0.1–0.4 µm3 µm−2 with no clear link between distance form source and concentration magnitude.
For the Middle East event (C), the volume concentration is lower at all the stations compared with the rest of the events, reflecting the lower overall AOD values, and there are notable variations in the size distributions among the sites. At all sites, the coarse mode is dominant, however there is also a significant fraction of the fine mode, meaning that there is a mixture of different aerosols species. The radius for the maximum concentration value is found around 1.7 µm except at Cairo station, which has the highest volume concentration and the peak corresponds to the radius value of 3.86 µm (the highest amongst all events considered here), indicating significantly larger particles compared to the other stations affected by the same event. In Fig. 10 the fine-mode-fraction (FMF) product from AERONET at 500 nm, which describes the proportion of fine-mode aerosol optical depth to the total aerosol optical depth, is compared to the averaged ASY and SSA parameters for the four events discussed in this study. This analysis provides insight into the relative contribution of fine absorbing particles and coarse mineral dust, allowing a clearer assessment of aerosol mixing processes during each event. In this comparison, event C originating from the Middle East stands out from the rest of the events, exhibiting the highest FMF (∼0.6) and lowest ASY (<0.75). Although event C does not exhibit enhanced absorption at 440 nm on average based on SSA, it shows the lowest average SSA at 675 nm among all events. However, these averages are influenced by the relatively high SSA values observed at the Weizmann and Cairo stations, which increase the overall event mean. In contrast, events A,B and D generally displayed lower FMF. These findings are further supported by the retrieved particle size distributions and the dust fractions derived from the MIDAS dataset, which confirm the increased fine-mode influence during event C.
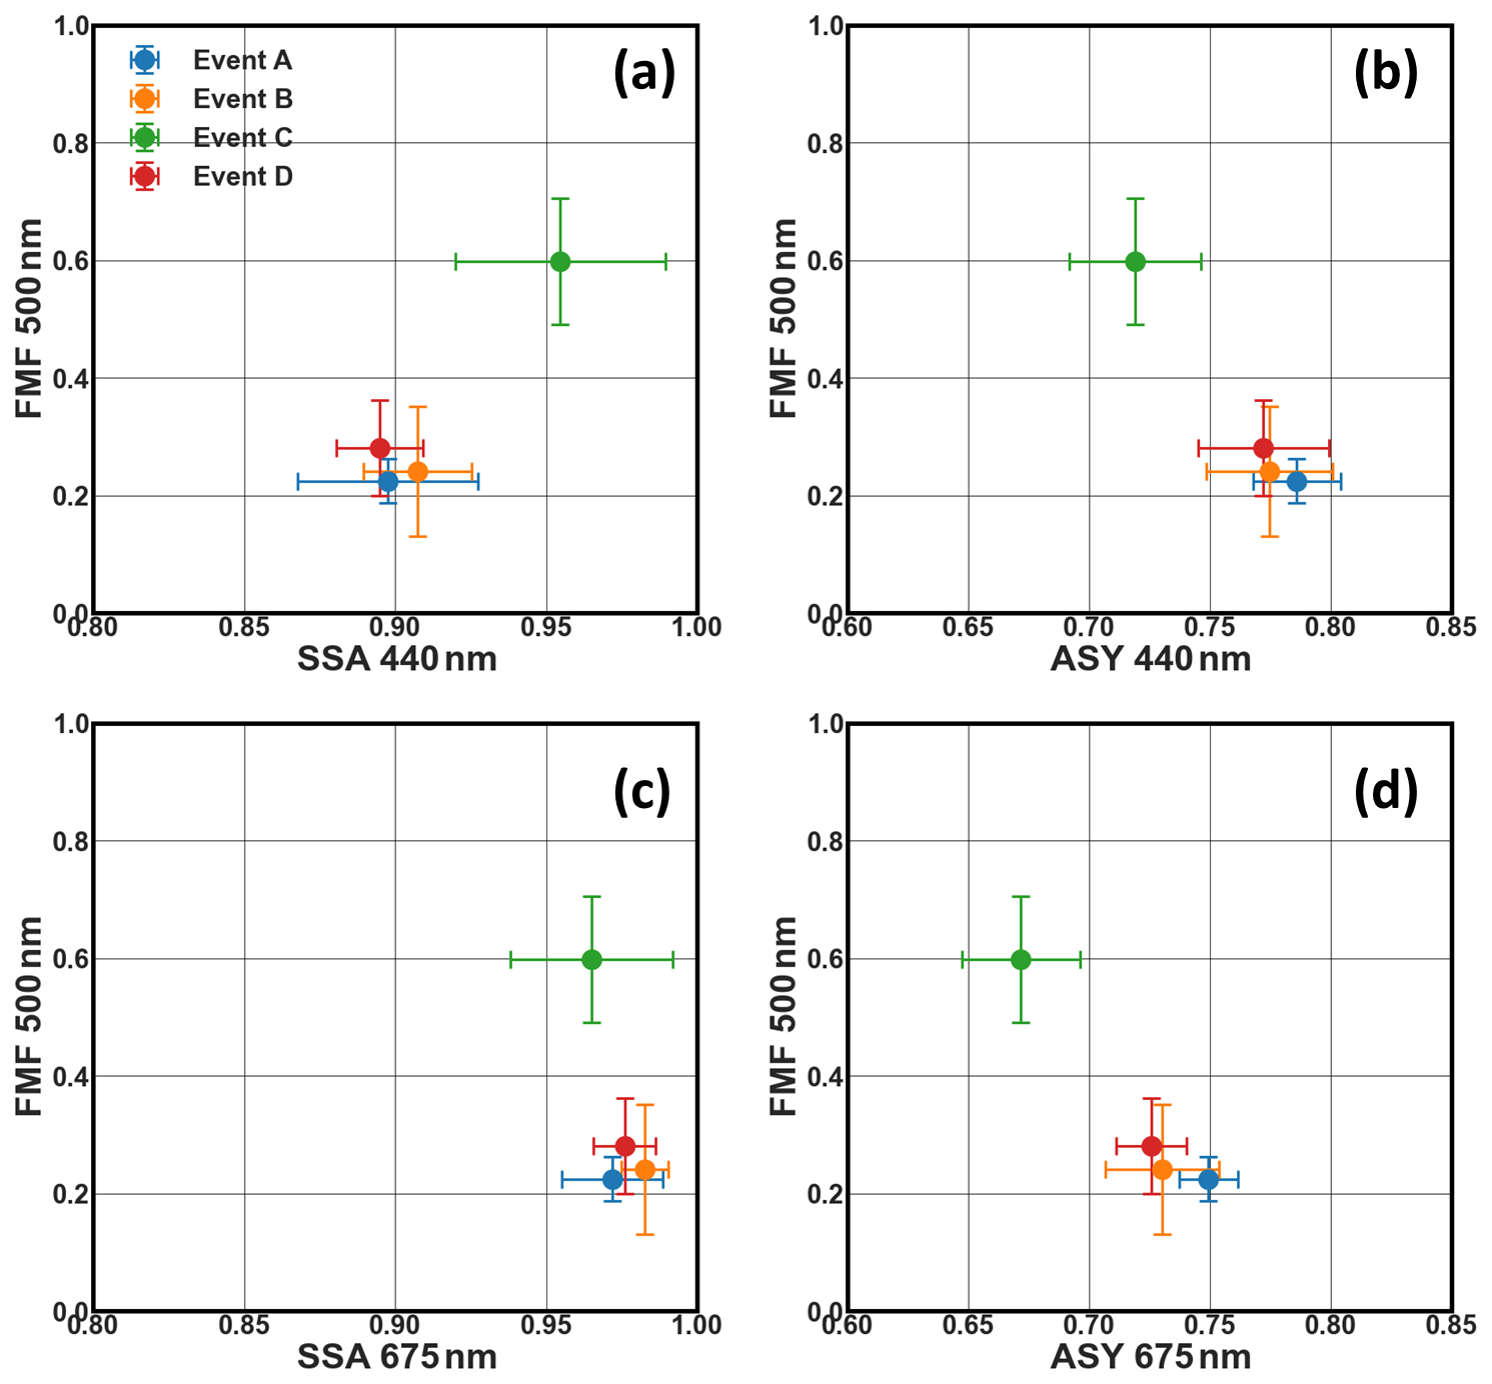
Figure 10Comparison of FMF at 500 nm with (a, c) SSA at 440 and 675 nm and (b, d) ASY at 440 and 675 nm for different aerosol events. Data points represent the averaged values over all stations on their peak date during event A (blue), event B (orange), event C (green), and Event D (red), with horizontal and vertical error bars indicating uncertainties in the respective measurements.
4.2 Dust fraction and transport-related evolution
To examine the contribution of dust to the total aerosol load, we estimated the DOD-to-AOD ratios based on the MIDAS dataset. For the DOD-to-AOD ratio, values close to 1 denote the sole presence of dust particles, while as the ratio decreases the contribution of other types (dust mixtures) in the specific event becomes more prominent. The ratios are estimated for each day of the four dust events with provided concurrent observations from AERONET stations (as per Table 1).
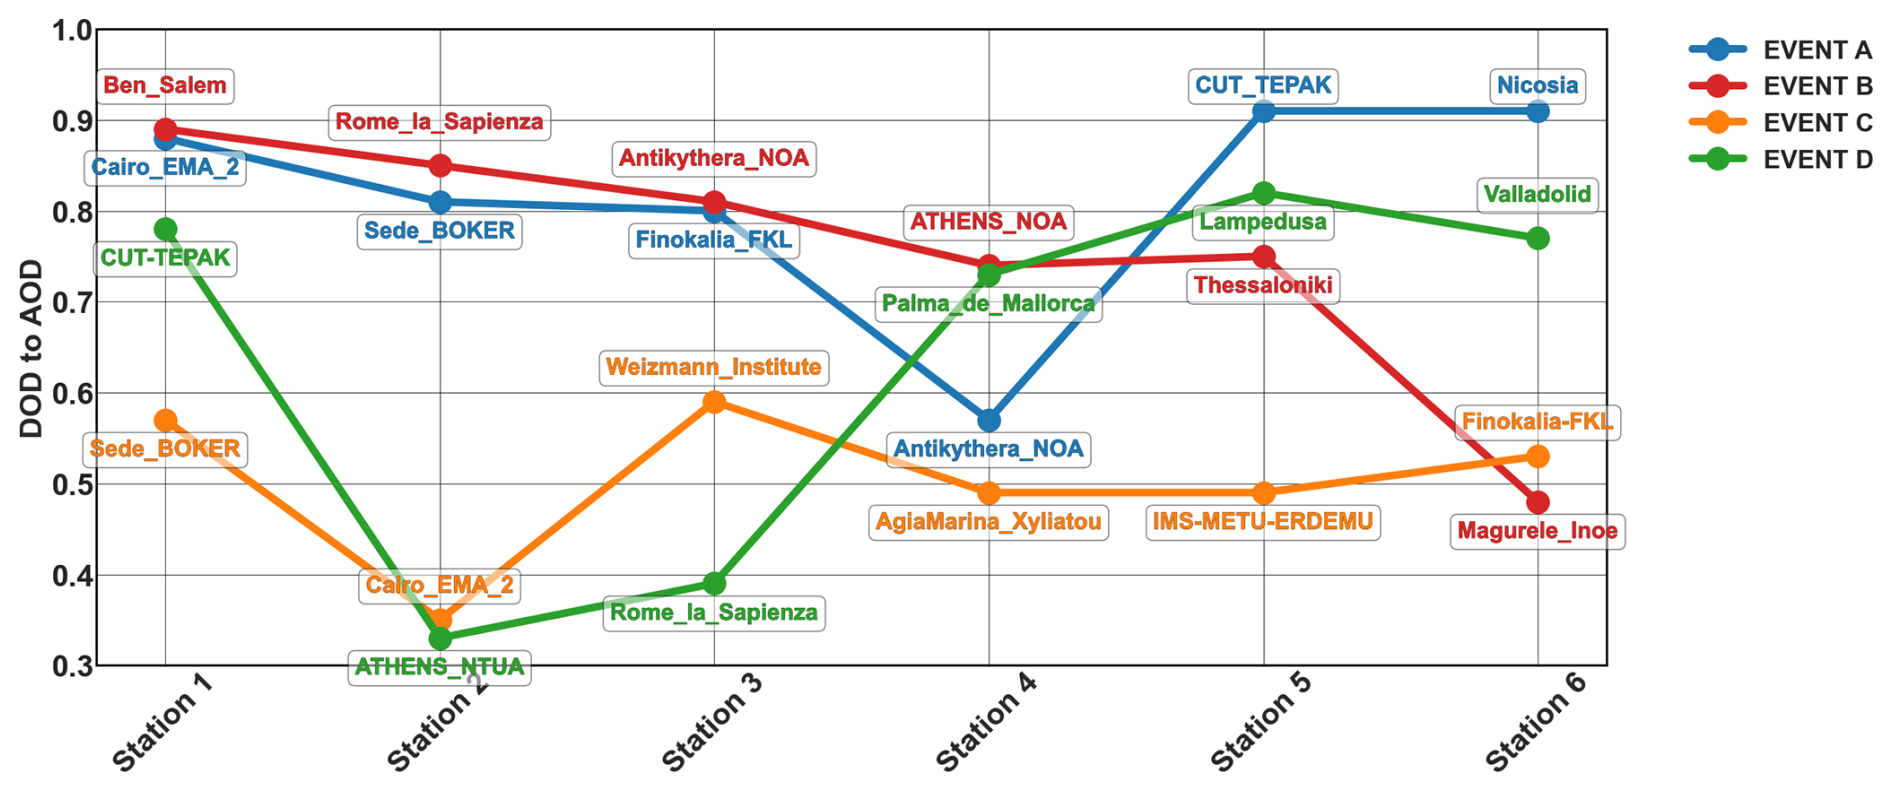
Figure 11DOD-to-AOD ratios (at 550 nm) from MIDAS at the stations affected during events A-D shown in ascending order starting from the closest station to the source.
For event A, based on Fig. 11, the dominance of pure mineral particles is prominent (values greater than 0.8) at all stations, except Antikythera station. This significant transport of pure dust layers, starting from different sources over the Saharan region (Fig. 2), is reflected on the DOD-to-AOD ratios over a large part of the Eastern Mediterranean and Middle East.
A different situation is presented for event B, where DOD-to-AOD ratio seems to decrease for increasing distance from the source. Specifically, over Bucharest (Magurele_Inoe), the DOD-to-AOD ratio is ∼0.45, almost half that of the first station (Ben_Salem). Over Magurele_Inoe, the higher SSA at 440 nm (Fig. 8b), which weakens the characteristic spectral signature of dust, the nearly equal contribution of finer and coarser particles in SD (Fig. 9b) and the lower ASY values (Fig. 7b), highlight the coexistence of coarser dust with finer urban or biomass burning particles. During event B, the extent of the dust transport from the western part of the Sahara affects the whole Mediterranean basin, while over Balkan countries, dust layers seem to be mixed with those arriving from the regions encompassing the Black Sea and overpassing industrialized European cities (e.g., Milan, Munich, see Fig. 3).
The smallest contribution of pure dust to the aerosol mixture is recorded during event C (values <0.6). According to the backward trajectories (Fig. 4), the aerosol layers originated from the Arabian Peninsula, could be affected by both dust particles (e.g., desert regions) and industrial/urban aerosol layers. Event D extends across the entire Mediterranean Basin, with the AERONET stations located on the western part to be affected mainly by layers originating from both the western and central part of North Africa. Toward the east, the contribution of trajectories originating within the Arabian Peninsula and a large part of Egypt, including the Libyan Desert, is also significant (Fig. 5). According to the DOD-to-AOD ratios, it appears that in apart from the stations operating in urban environments, such as Rome and Athens, all the other stations are characterized by a prominent presence of dust particles (values mainly over ∼ 0.7). The smaller DOD-to-AOD ratios in combination with the higher contribution of coarse mode (Fig. 9d) and the high ASY values (Fig. 7d) possibly indicate the coexistence of coarse sea salt particles in the dust layers. This conclusion is also supported by the backward trajectories (Fig. 5) with a discernible impact of layers arriving over the western coasts of North Africa from the Atlantic Ocean. Nevertheless, except for event A, the other three events are characterized by the simultaneous presence of dust alongside other fine or coarse-mode particles. Furthermore, even in the case of mineral particles, it is important to consider that their origin plays a critical role in their spectral properties due to the varying mineralogy of dust (Di Biagio et al., 2019).
4.3 Cyprus: A regional case study
4.3.1 Dust mass and elemental composition
Cyprus was affected by three out of the four selected dust events (A, C, and D), making it possible to utilize ground-based observations on the island to compare the dust events (see Sect. 2). Figure 12 compares dust concentrations over ±5 d from the peak of each event at the station (defined by the AERONET observations), highlighting differences in intensity and duration among the events. As seen from this figure whilst event A exhibits higher dust concentrations, event C shows a lower but more consistent concentration over a longer period. The few observations during event D exhibit similar concentrations with event A before the peak date. The second part of the event (arriving from Middle East) is seen 4 d following the peak day with significant concentrations. Similar trends are seen in the concentration of dominant elements during dust events, i.e., Fe, Al, and Ca, whereas there is no clear trend for Mg, as shown in Fig. 13. It is worth mentioning that, despite the overall lower dust loading during event C, the relative elemental abundance at comparable levels as in event A.
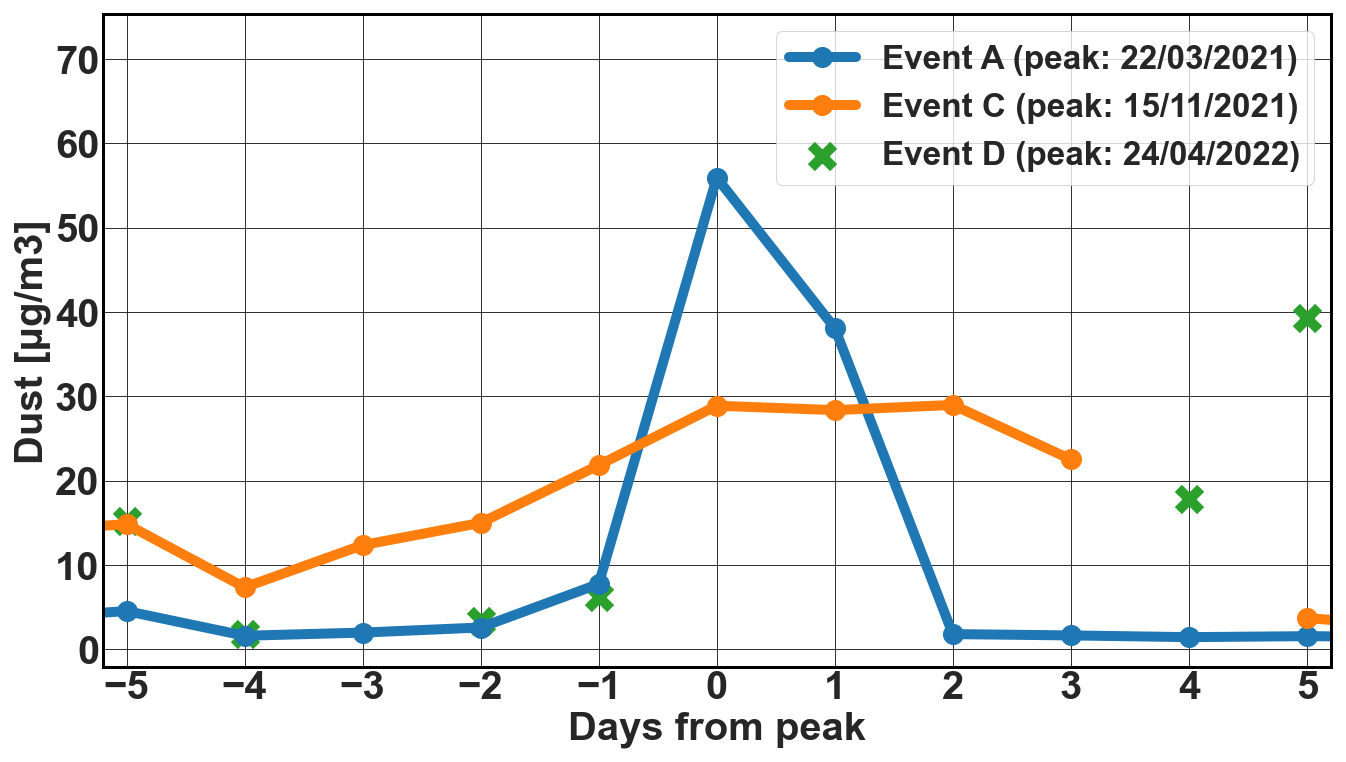
Figure 12Surface dust concentration measured at CAO-Agia Marina Xiliatou during the events that affected the station.
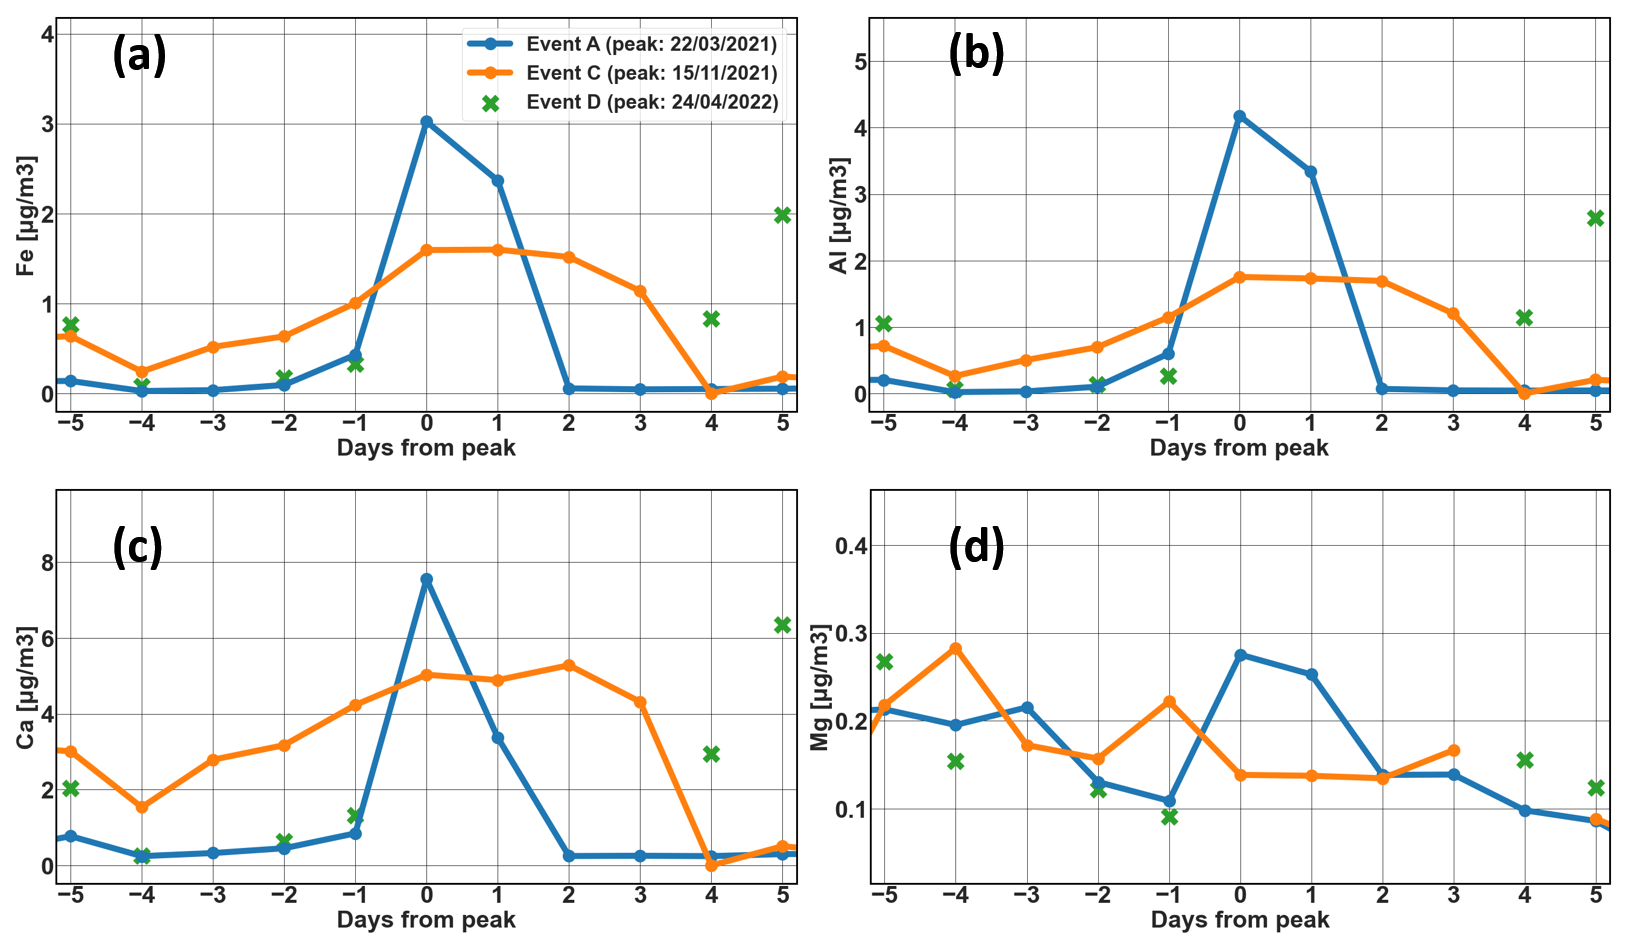
Figure 13Dominant element ground concentrations (Fe (a), Al (b), Ca (c), and Mg (d)) as measured at CAO-Agia Marina Xyliatou station during events A, C and D.
4.3.2 Absorption
The average absorption coefficient calulated by the aethelometers at Agia Marina Xyliatou (see Sect. 2) during events A, C, and D are compared in Fig. 14. When comparing the three events (events A, C, and D), event C exhibits the highest absorption (∼50 % more absorption than the other events across the entire spectral range, suggesting a greater concentration of absorbing aerosols. Events A and D show similar absorption levels, ∼0.6 Mm−1 at 440 nm, and much lower for the larger wavelengths. These findings are consistent with previous indicators of mixed aerosol conditions during event C (i.e., lower SSA, Assymetry factor, DOD-to-AOD ratio and higher Angstrom Exponent). For the analysed cases, this indicates that source region and transport-related mixing may both contribute to the optical differences. In particular, dust transported from the Middle East appears to be mixed with more absorbing aerosols, potentially carrying anthropogenic pollutants.
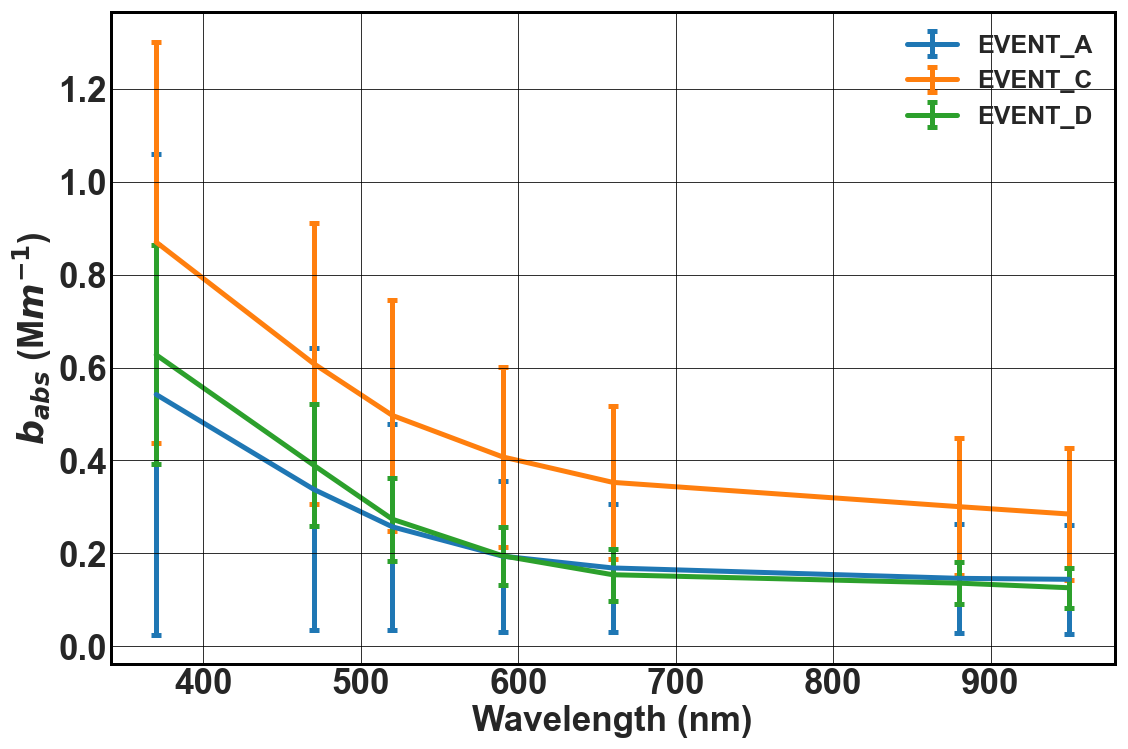
Figure 14Average absorption coefficient measured during events A (blue line), C (orange line), and D (green line) at CAO Agia Marina Xyliatou station.
4.4 Mineralogical simulations
4.4.1 Inter-event variability in simulated mineral fractions
Mineralogical composition of events C and D was simulated using METAL-WRF. The relative abundance of different elements typical for dust at the stations affected during the events is seen in Fig. 15. The elemental composition is calculated only at the altitudes with presence of dust. The altitude of dust in the model is derived by applying a concentration threshold for aluminum, with Al ≥0.5 µg m−3 considered indicative of dust. Aluminum was selected because it is commonly used as a tracer of mineral dust. The threshold was chosen to distinguish from background conditions, considering the concentrations during the two events. Whenever possible, the lidar profiles were also used to qualitatively assess whether the model-derived dust-layer altitudes were consistent with the observed vertical aerosol structure. A sensitivity analysis using different vertical averaging intervals indicated only minor changes in the relative elemental composition. In this analysis, Agia Marina Xyliatou station is examined for the region of Cyprus to facilitate a direct comparison with the in situ results presented herein. The analysis that was done here contributes to a better understanding of: (i) the composition differences between events C and D and (ii) the variability of composition during the same event across different stations.
As seen also from the observations, the simulated concentrations for event C are, in general, lower than event D. During both events, there is a consistent and intense elemental signature of dust across all stations, with higher concentrations of silica (Si), aluminum (Al), calcium (Ca) and iron (Fe), which are enhanced during dust events (Formenti et al., 2008). Within event C, whilst silicon, aluminium and calcium are the dominant elements, there is a small variability across stations. Early stations like Weizmann and Sede Boker show higher iron and aluminum concentrations (nearly ∼20 % in both cases), while stations farther along the dust plume trajectories, like Agia Marina Xyliatou and IMS METU, show decreases in both concentration and elemental diversity. In event D, there is a relatively uniform composition across stations dominated also in this case by silicon, aluminum, calcium and iron. However, the total concentrations during event D vary significantly, with Lampedusa exhibiting the highest dust loading and Mallorca the lowest, suggesting weakening of the plume as it moved westward.
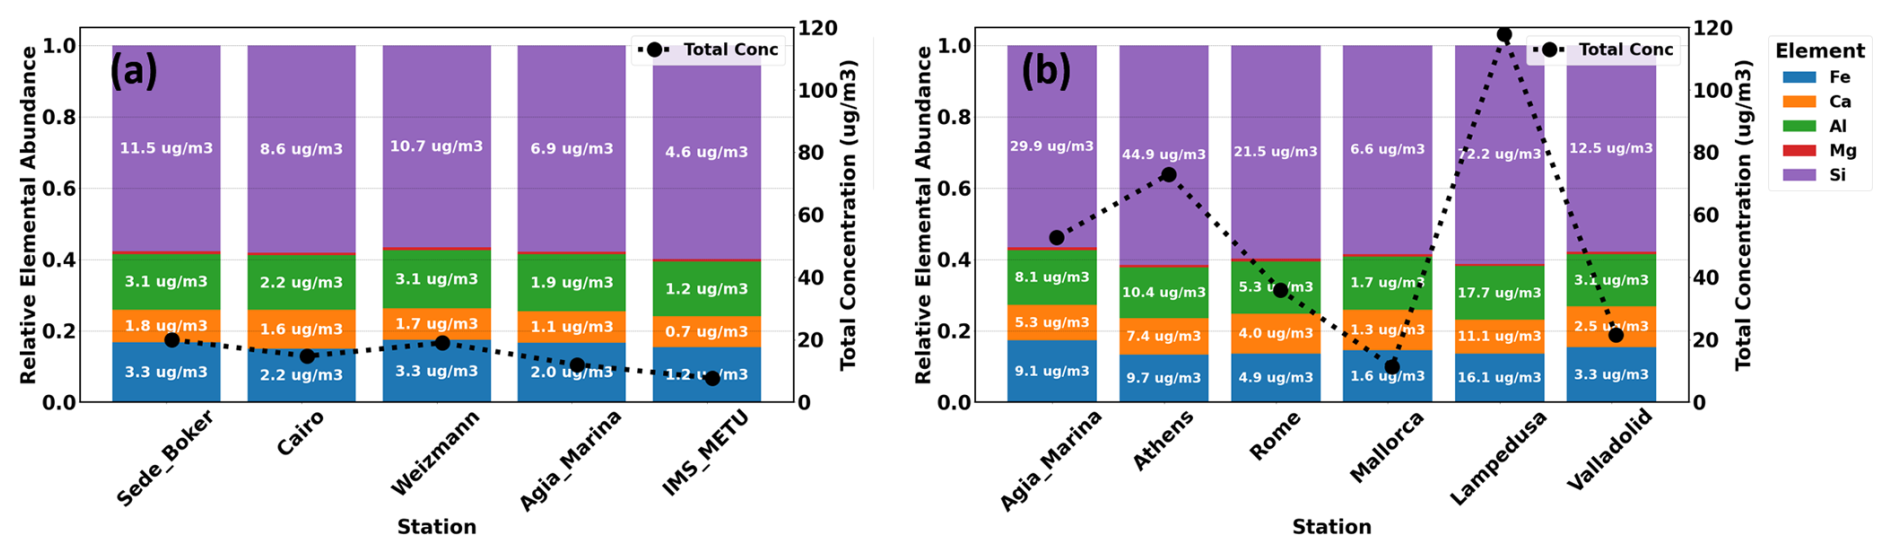
Figure 15Dust-layer averaged relative concentrations of selected elements on AOD peak days during events C (a) and D (b), as simulated by the METAL-WRF model at the affected AERONET stations. The black line illustrates the total simulated dust concentrations at each statrion.
Overall, the relative contribution of the selected elements remains nearly constant (changing by only a few percent) despite large differences in total dust concentration. For example, stations exhibiting concentrations of ∼ 120 mg cm−3 (Lampedusa, event D) show nearly the same elemental percentage composition as stations with ∼15 mg cm−3 (Mallorca, event D). For Events C and D, this limited variability suggests that differences in modelled composition alone cannot explain the full range of observed optical differences. This conclusion is restricted to the two simulated events and does not exclude mineralogical effects or broader variability across other Saharan and Middle Eastern outbreaks.
4.4.2 UAV-based evaluation
To better assess the results of the mineralogical composition from METAL-WRF, the simulated compositions are compared to the in situ observations obtained during Fall Campaign 2021, in Cyprus (Kezoudi et al., 2026), which coincided with event C (see Sect. 2).
Figure 16 presents the first attempt for a case-specific comparison focused on event C between the model, ground and UAV-based observations for dominant dust elemental mass fractions (Ca, Al, Fe, Si and Mg). The comparison based on elemental mass fractions provides a more direct assessment of the simulated dust composition, as it reduces the influence of the differences in the total dust load between the two methods. The UAV-based mass fractions were derived from SEM analysis of particles collected on filters mounted on the UAVs, using the number of analysed particles, sampling duration, and UAV airspeed for the concentration calculation. The simulated values (blue dashed line) were extracted over the altitude intervals sampled by the UAV filters and corresponding to the identified dust layers. The resulting UAV-based estimates are shown by the red and green boxes, with their standard deviation shown with the shaded area. This approach allows direct comparison of the modelled and observed elevated concentrations. Ground-based observations from Agia Marina Xyliatou are also shown for reference (black line).
The statistical UAV-model comparison, which includes the relative deviations and z scores, is provided in Appendix G. Here, the z score expresses the UAV–model difference relative to the standard deviation of the observed concentrations.
The comparison reveals element dependent variability. The best agreement is found for Al, with absolute z scores generally below unity and relative deviations mostly within approximately 30 %. Similarly, Fe and Si show a good agreement with positive biases, with average relative deviations of approximately 29 % and 31 %, respectively, and z scores generally close to unity.
In contrast, Ca and Mg are systematically underestimated by the model. Ca deviations exceed 70 % throughout the measurement period, while Mg deviations are consistently around 90 %. Interestingly, for Ca the UAV-based observed elemental mass fractions are closer to the ground-based observations rather than the simulations of the elevated mass fraction for Ca. This effect might partly reflect size-dependent transport and removal. For example, Ca-bearing minerals, which are often associated with coarse particles, and therefore can be removed faster during gravitational settling during transport. In the case of Mg, the large deviations could be linked to its very low absolute concentrations in the model. This analysis suggests that the main compositional discrepancies at elevated layers are associated with the representation of Ca- and Mg-bearing minerals.
The results herein complement the findings of Solomos et al. (2023), who reported the agreement of METAL-WRF for ground-level elemental concentrations during 2017 dust event at Agia Marina Xyliatou. The present analysis extends this evaluation by providing, for the first time, a comparison with UAV-based elemental observations within an elevated dust layer.
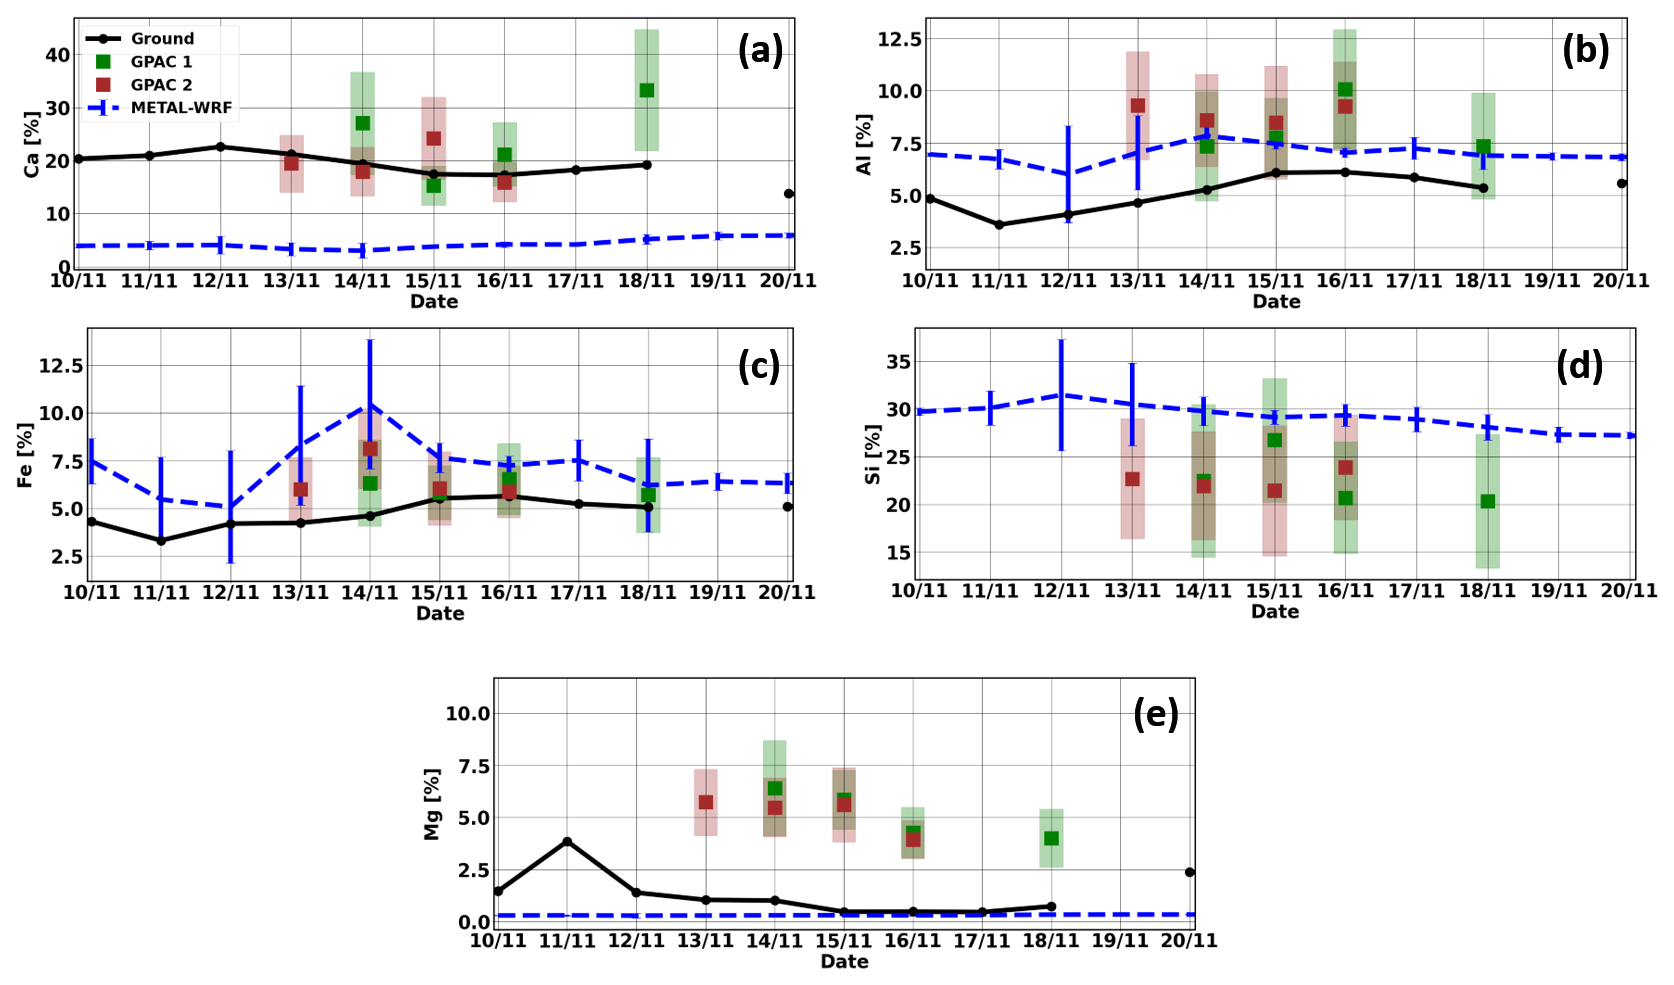
Figure 16Mass fractions of the dominant dust-related elements (Ca (a), Al (b), Fe (c), Si (d), and Mg (e)) during event C. Solid black lines represent the ground-based observations (no available ground-based measurements for Si). UAV-based observations are represented as boxes at different altitudes for each day: on 13 November, GPAC-1 0.7–1.3 km a.s.l.; on 14 November GPAC-1 at 1.9–2.3 and GPAC-2 1.4–1.8 km a.s.l.; on 15 November GPAC-1 at 1.7 km and GPAC-2 1.8–4.3 km a.s.l.; on 16 November GPAC-1 at 1.9 km, and GPAC-2 2.1–2.6 km a.s.l.; and on 18 November GPAC-1 at 0.9–2.7 km a.s.l. Shaded area around the boxes represents the standard deviation of the observations. Dashed lines show METAL-WRF simulations of elemental concentration centered around the UAV-based filter observations range.
5.1 Cross-event interpretation
Table 2 summarizes the transport, optical, and compositional characteristics of the four analysed events. The strongest contrasts among the events were observed in dust contribution, particle-size-related properties and absorption, especially when comparing Saharan and Middle East events. Events A and B exhibited high dust-to-total AOD ratios and a pronounced coarse-mode contribution. Event D was also largely dust-dominated, but its interpretation is more complex because it consisted of several successive plume branches with contributions from different source regions.
Event C, originating primarily from the Middle East, showed the highest fine-mode fraction, the lowest dust-to-total AOD ratio, lower asymmetry parameter values, and the strongest absorption among the events observed in Cyprus. These observations indicate the presence of more absorbing aerosols, potentially carrying anthropogenic pollutants. This interpretation is supported by the ground-based observations at Agia Marina Xyliatou, which show concurrent enhancements in elemental carbon, estimated organic matter, sulfate, and nitrate during the event period (Fig. F1). These species are commonly associated with combustion emissions and secondary aerosol formation and therefore provide additional evidence of anthropogenic influence on the transported dust plume. Previous studies (Bimenyimana et al., 2023; Christodoulou et al., 2023) have identified the Middle East as a major source of fine particles, including organic aerosols and black carbon, reaching Cyprus, mainly originating from fossil fuel sources. Major contributing sectors in the region include fossil-fuel extraction and processing and power generation, as illustrated by the spatial distribution of emissions shown in Fig. F2.
Table 2Summary of the main source regions, optical characteristicss and composition of the four events. Peak dust mass and elemental concentrations were measured at ground level at Ayia Marina Xyliatou, Cyprus and are unavailable for Event B. The mixing descriptions are based on the combined interpretation of trajectories, optical properties, and compositional observations.
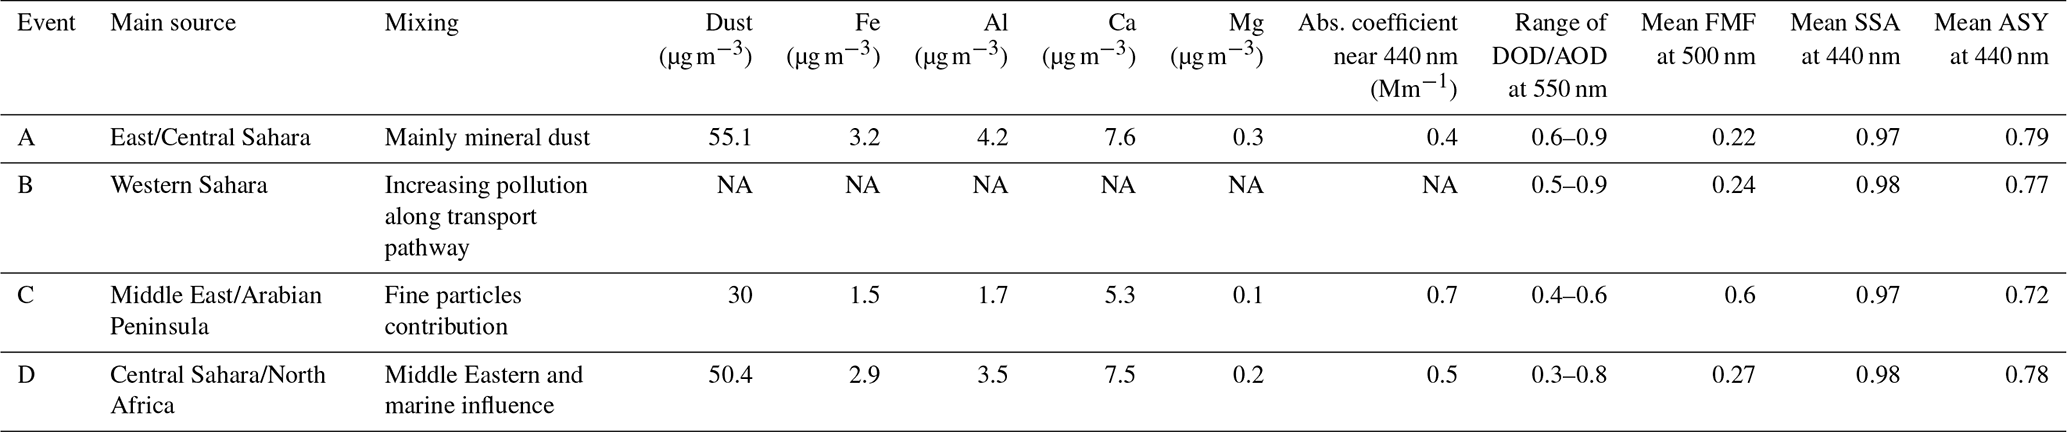
NA: not available
The combined observations indicate that differences among the events cannot be described solely by source region or transport distance. Instead, the observed optical characteristics reflect the combined effects of dust loading, particle-size distribution and mixing with non-dust aerosol. For example, the concurrence of higher FMF, lower DOD/AOD, lower ASY, stronger absorption, and enhanced EC, OM, sulfate and nitrate during event C support the scenario of a larger fine, anthropogenic contribution to the observed properties. From another perspective, event's C characteristics could be also influenced by dust mineralogy. Nevertheless, the limited inter-event and inter-station variability in the simulated elemental composition suggests that the much larger observed optical differences cannot be explained by the METAL-WRF composition alone. For the selected events, variability in dust fraction, particle-size distribution, transport history, and mixing with non-dust aerosol therefore appears to have been more important than mineralogy. However, mineralogical effects cannot be ruled out, as the simulated composition is subject to model uncertainties (e.g., simulated particle-size distribution, deposition processes, model-grid resolution).
5.2 Representativeness and limitations
The results of the presented analysis are limited to the four selected outbreaks, which were chosen because they affected a broad part of the Mediterranean and were supported by sufficient multi-platform observations. These cases are important to assess the impact of contrasting transport pathways, dust loading, aerosol mixing, and composition. The most robust findings within this dataset are the pronounced event-to-event variability in dust fraction, optical properties, absorption, and mixing state, as well as the added value of combining satellite, ground-based, lidar, UAV, and modelling information.
However, these cases do not represent a climatological sample of Saharan and Middle Eastern dust. In particular, additional Middle Eastern dust outbreaks should be analyzed before interpreting the finer and more absorbing character of event C as a general property of events arriving from this region, even though previous studies have documented substantial anthropogenic aerosol influence from the Middle East. Similarly, the relatively limited variability in the mineral fractions simulated by METAL-WRF shouldn't be interpreted as a source region characteristic.
The discrepancies between the measured and simulated elemental composition in the first UAV-based evaluation of METAL-WRF presented in this study should also be interpreted cautiously. Both the observational and modelling approaches are subject to uncertainties that may contribute to the identified differences. In METAL-WRF, elemental concentrations are derived from simulated mineral species using assumptions about mineral stoichiometry, following the conversion factors provided in Table S1 of Pérez García-Pando et al. (2016). The pronounced discrepancies could be attributed to limitations in the soil mineralogy databases used in METAL-WRF. For example, as also mentioned in Solomos et al. (2023), the large discrepancies in the comparison of magnesium can be linked to the absence of Mg-bearing minerals in the GMINER30 and FERRUM30 datasets used in METAL-WRF. Discrepancies may also arise from differences between the observed and simulated particle-size distributions, as particle size influences the transport, gravitational settling, and deposition of individual mineral components.
Additional uncertainty may result from spatial and temporal mismatches between the observed and simulated dust layers. The horizontal resolution of the model is 12×12 km, whereas the UAV measurements represent a much smaller air volume along the flight path. Regarding vertical representativeness, the sensitivity analysis showed that increasing the model averaging interval to 500 m resulted in an average deviation of approximately 10 %. The UAV-derived concentrations are also affected by uncertainties in the impactor collection efficiency and in the estimation of the sampled air volume, which depends on the assumed UAV airspeed. Taken together, the study of Solomos et al. (2023) who also reported element-specific discrepancies in METAL-WRF, and the current study, indicate that both the magnitude and direction of model biases may vary with element, source region, transport pathway, and observational setting. A larger multi-year dataset covering different seasons, source sectors, transport pathways, particle-size distributions, and mixing conditions would therefore be required both to evaluate model performance systematically and to determine whether the observed optical and compositional contrasts represent persistent source-region characteristics.
Dust transport is a frequent phenomenon in the Mediterranean Basin, where it significantly affects regional climate, air quality, ocean biogeochemistry, and human health. However, the dust is often not pure, and the origin, the transport-related processes, and the mixing with local or other transported pollution are difficult to categorize and define. These processes influence the dust’s radiative effects and its environmental impacts, however to-date, they remain poorly represented in many models (Perlwitz et al., 2015; Adebiyi and Kok, 2020; Taylor et al., 2015; Mahowald et al., 2025).
This study presents a detailed characterization from AERONET observations of four major desert dust outbreaks in the Mediterranean Basin during 2021–2022, with relatively different characteristics. Through this analysis, the spatiotemporal evolution of optical and chemical properties of dust during the events is examined through the synergistic use of ground-based, satellite-based, and UAV-based observations and models.
The selected events showed substantial differences in terms of optical properties, size distribution, and aerosol composition, depending on their origin and transport pathways. While Saharan events (A, B, D) were predominantly composed of coarse-mode mineral dust, the Middle East event (C) displayed a more complex mixture, with finer, more absorbing particles indicative of anthropogenic origin. This effect was also pronounced at stations where dust had to pass over densely populated or industrial regions, like in the case of Magurele in Romania (event B), highlighting the role of urban pollution and biomass burning in modifying the optical signature of transported dust.
UAV-based in situ measurements and METAL-WRF model outputs provided insights into the mineralogy of the dust events. Both model results and observations indicate that the dust in the two examined cases was dominated by silicates and calcium-rich minerals, while iron concentrations remained comparatively low. However, only small variations in mineral contributions were observed between events, suggesting that source-related mineralogical differences were limited during the studied events.
This is the first time, to our knowledge, that chemical composition simulations are evaluated against UAV-based in situ observations. This exercise was performed by comparing METAL-WRF simulations and UAV-based in situ observations near Agia Marina Xyliatou, Cyprus, during event C. A fair agreement was seen between the two methods for iron, silicon and aluminum elements (with relative deviations <30 %), showing the capabilities of the model. On the other hand, pronounced differences were found between observations and simulations for magnesium and calcium, with relative deviations often exceeding ∼80 %. Such comparisons pave the road for further improvements in models and highlight the importance of airborne in situ observations for better representation of dust in the models. This is particularly relevant given that only a few models currently account for dust mineralogical composition, and none are yet operational, highlighting a gap in the full characterization of mineral dust within modeling frameworks. More targeted comparisons between modeled and observed chemical composition (e.g., dedicated field experiments with vertical profiling of chemical composition) are essential for constraining mineral-specific emissions, transport, and deposition processes.
Whilst the optical parameters examined in this study (AOD, SSA, AE, ASY, size distribution) exhibited some regional variability between Middle Eastern and Saharan dust, this variability is consistent with a stronger contribution from variations in dust fraction and mixing state than to differences in mineral composition. In this context, the dust-to-total aerosol ratio (e.g., MIDAS DOD-to-AOD or AERONET fine mode fraction) is a key parameter controlling the net scattering and absorbing behaviour in the atmospheric column. When interpreted together with SSA and ASY, this ratio provides critical information for radiative transfer calculations, as it not only provides information on the magnitude of solar radiation but also on how it is distributed between direct and diffuse radiation and the angular distribution of scattered light. This information provides essential input for solar energy applications, where an accurate estimation of the diffuse radiation field and sky radiance distribution is required. Therefore, considering both the dust fraction and the optical properties provides more realistic input for radiative transfer models and improves estimates of shortwave radiative forcing and solar energy potential; these parameters have already been applied in the companion study by Kouklaki et al. (2026), which quantifies the shortwave radiative forcing of the four examined events.
Beyond the analysis of the four specific outbreaks, this study demonstrates a comprehensive methodological framework for the in-depth characterization of desert dust events. By combining ground-based sun-photometer observations, satellite-derived dust products, back-trajectory analysis, UAV-based in situ chemical measurements, absorption observations, and mineralogical modeling, we provide a multi-dimensional perspective on dust evolution during transport. This synergistic approach enables the separation of source-related characteristics from transport mixing effects and allows linking the optical properties to both aerosol composition and dust fraction. The methodology presented here can be applied to other dust episodes and regions to improve the characterization of dust events and their radiative impacts.
The four selected outbreaks should nevertheless be regarded as detailed case studies rather than a climatological representation of Saharan and Middle Eastern dust. The most robust findings are the pronounced event-to-event variability and the added value of the multi-platform analysis. The finer, more absorbing character observed during event C, as well as the broadly similar mineral fractions simulated across the selected events, should be evaluated using a larger multi-year climatology. Overall, this study reinforces the importance of region-specific, event-based analysis to understand the variability of desert dust in a region. Event-specific variability in optical and mineralogical properties highlights the influence of source regions and transport dynamics, emphasizing that dust cannot be treated as a uniform aerosol type. Future work should extend the analysis to a larger number of events over multiple years to improve source-specific characterisation of dust properties and better separate natural dust from anthropogenic contributions. METAL-WRF and other dust models should be further validated with in situ observations across diverse regions to identify biases and enhance predictive capabilities. Datasets from missions like Earth Surface Mineral Dust Source Investigation (EMIT) (Green et al., 2020) can help to resolve current uncertainties in dust mineralogy, and therefore improve the representation of dust in climate models and our ability to assess its environmental and societal impacts.
The EARLINET network (Pappalardo et al., 2014), established in 2000, is the longest-running and the most extensive high-power lidar network in Europe, dedicated to aerosol profile measurements. Several of the EARLINET stations operate nowadays under the aerosol remote sensing component of the Aerosol, Clouds and Trace Gases Research Infrastructure (ACTRIS; Laj et al., 2024), which coordinates and supports their activities. EARLINET network comprises institutions conducting lidar observations, development, and aerosols and clouds research. The network is designed to facilitate scientific collaboration, technological innovation, and fundamental research on aerosol–cloud processes. Currently, 35 active stations contribute to EARLINET, providing extensive spatial coverage across the continent (https://earlinet.eu/earlinet-map/, last access: 8 November 2025). Additionally to ACTRIS aerosol remote sensing stations, ACTRIS supports also EARLINET stations not belonging to ACTRIS research infrastructure offering all the services and supports for data processing, data access and provision and in general data curation. ACTRIS also offers support in terms of aerosol lidar system quality assurance and guidance in ACTRIS standard operation procedure compliance.
The geographical distribution of the ACTRIS/EARLINET stations and their routine measurements enable the observation of the three-dimensional temporal evolution of aerosol transport, which can affect vast areas for several days, such as desert dust intrusions (Papanikolaou et al., 2024). In the Mediterranean region, in particular, intense dust episodes are closely monitored by a significant number of ACTRIS/EARLINET stations across the basin, most of which, following ACTRIS requirements, are co-located with AERONET sites. In this study, profiles of aerosol optical properties were used to estimate the height of dust plumes that arrived over the AERONET sites during the four analyzed events. Specifically, profiles of the particle backscatter coefficient and the particle linear depolarization ratio at 532 nm were used to retrieve the dust backscatter coefficient profile, which represents the vertical distribution of dust particles.
Figure A1 presents an example from a selected ACTRIS/EARLINET station for each of the four events, displaying the particle depolarization ratio profile (blue), and the total aerosol backscatter coefficient profile (yellow), as well as the derived dust backscatter coefficient profile (orange). In the first event (top left), a measurement from Limassol on 22 March 2021 (Baars and Mamouri, 2024) shows a dust profile extending up to 7 km a.s.l., with two distinct dust layers, the most prominent centered approximately around 2.8 km a.s.l. During the second event (top right), a measurement from Antikythera on 22 June 2021 (Amiridis, 2025) estimates the dust layer peak at 4 km a.s.l. For the third (bottom left) and fourth (bottom right) events, both observed from Limassol, the maximum dust concentration was found at 2.4 km on 15 November 2021 (Baars and Mamouri, 2025a) and at 3.1 km a.s.l. on 24 April 2022 (Baars and Mamouri, 2025b), respectively.
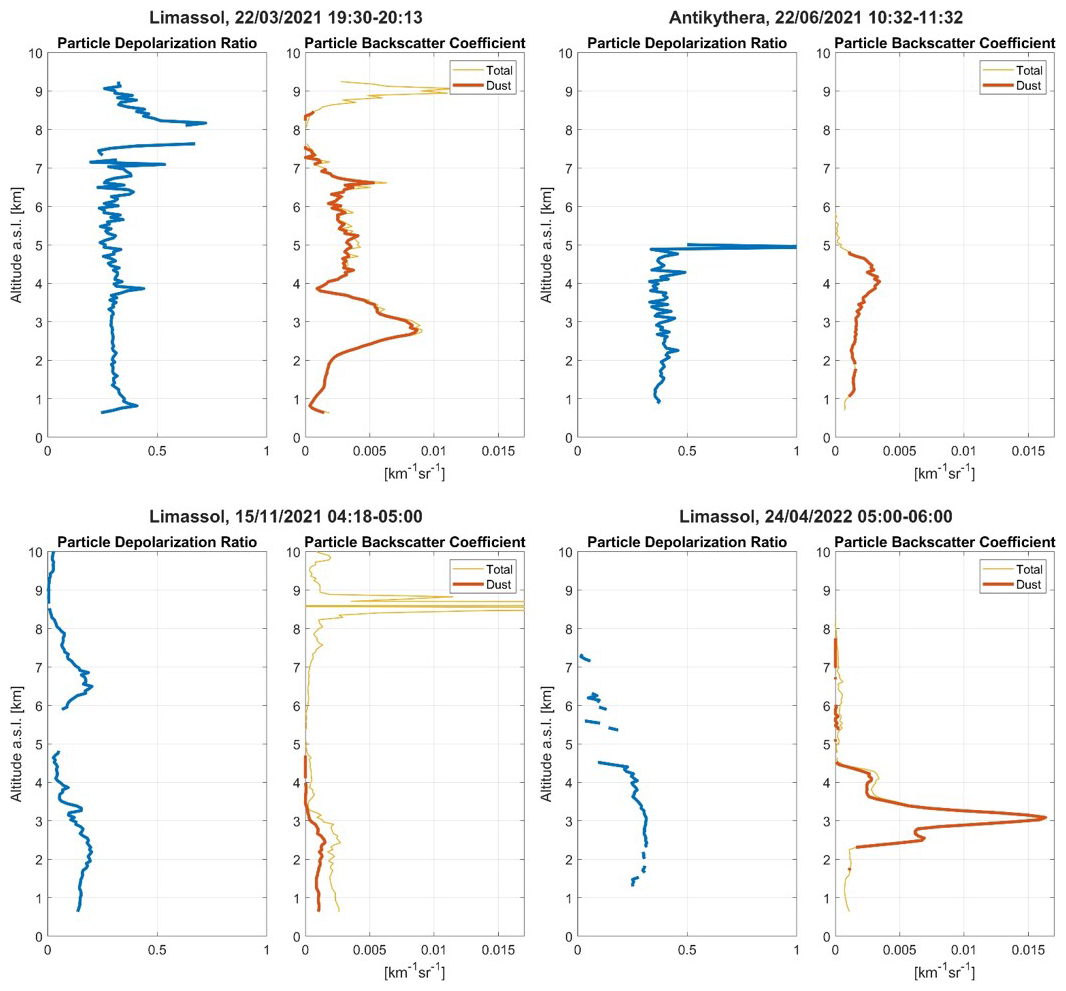
Figure A1The dust component (orange) was separated from the total backscatter coefficient profile (yellow) using the depolarization ratio profile (blue). The lidar measurements were conducted at the following ACTRIS/EARLINET stations: (i) Limassol (34.7° N, 33.0° E), Cyprus, on 22 March 2021 during the first event (top left), (ii) Antikythera (35.9° N, 23.3° E), Greece, on 22 June 2021 during the second event (top right), (iii) Limassol on 15 November 2021 during the third event (bottom left), and (iv) Limassol on 22 April 2022 during the fourth event (bottom right).
Towards investigating the horizontal, vertical, and temporal evolution of the dust events, the four-dimensional atmospheric dust product established by the European Space Agency (ESA) in the framework of the “LIdar climatology of Vertical Aerosol Structure” (LIVAS; Amiridis et al., 2013, 2015) project is implemented. More specifically, the LIVAS climate data record is based on the well-established one-step POlarization LIdar PHOtometer Networking (POLIPHON; Tesche et al., 2009) technique, developed within EARLINET activities, applied to optical products provided by CALIOP (Cloud–Aerosol Lidar with Orthogonal Polarization; Hunt et al., 2009) aboard the CALIPSO satellite (Cloud–Aerosol Lidar and Infrared Pathfinder Satellite Observation; Winker et al., 2010), which follows a sun-synchronous polar orbit (Stephens et al., 2018). The final dataset provides quality-assured (Tackett et al., 2018) profiles of the dust backscatter and extinction coefficient (both at 532 nm) and mass concentration, decoupled from the contribution and load of other aerosols, along the CALIPSO orbit path, with 5 km horizontal resolution and the original vertical resolution of CALIOP, for the period June 2006 to August 2023 (Marinou et al., 2017; Proestakis et al., 2024). Figure B1 provides an indicative example, in terms of the CALIPSO overpass (Fig. B1a), CALIOP profiles of particulate depolarization ratio at 532 nm (Fig. B1b), the ESA-LIVAS quality-assured profiles of the extinction coefficient for pure dust at 532 nm (Fig. B1c), and the mean total aerosol (black line) and pure-dust (red line) mean extinction coefficient at 532 nm profiles (Fig. B1d).
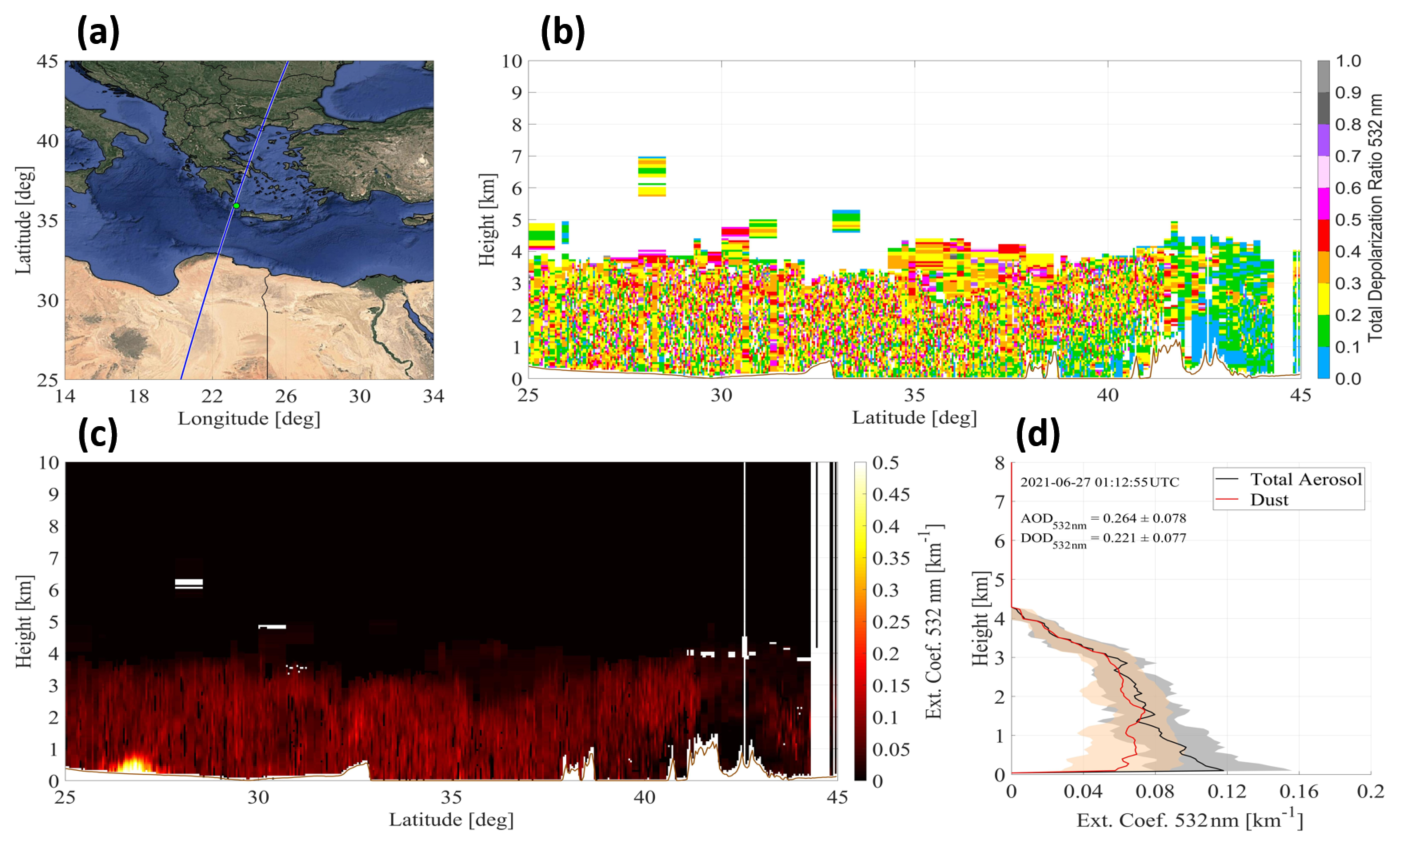
Figure B1CALIPSO nighttime overpass in the proximity of Antikythera station on 27 June 2021 and over the broader Eastern Mediterranean region depicting the orbit-track of the satellite (Map data © 2026 Google Earth) (a), the particulate depolarization ratio at 532 nm profiles (b), the ESA-LIVAS quality-assured pure-dust extinction coefficient at 532 nm profiles (c), and the mean total aerosol (black line) and pure-dust (red line) mean extinction coefficient at 532 nm profiles (d).
Figures C1–C4 illustrate the MODIS derived DOD-to-AOD maps for the four events and the affected stations. As the event peaks on different date at each station, the maps are created for different days. The stations are pinned on the maps with the color of the pins indicating the timeline of the affected stations, with the first station impacted shown in gray and the last in turquoise.
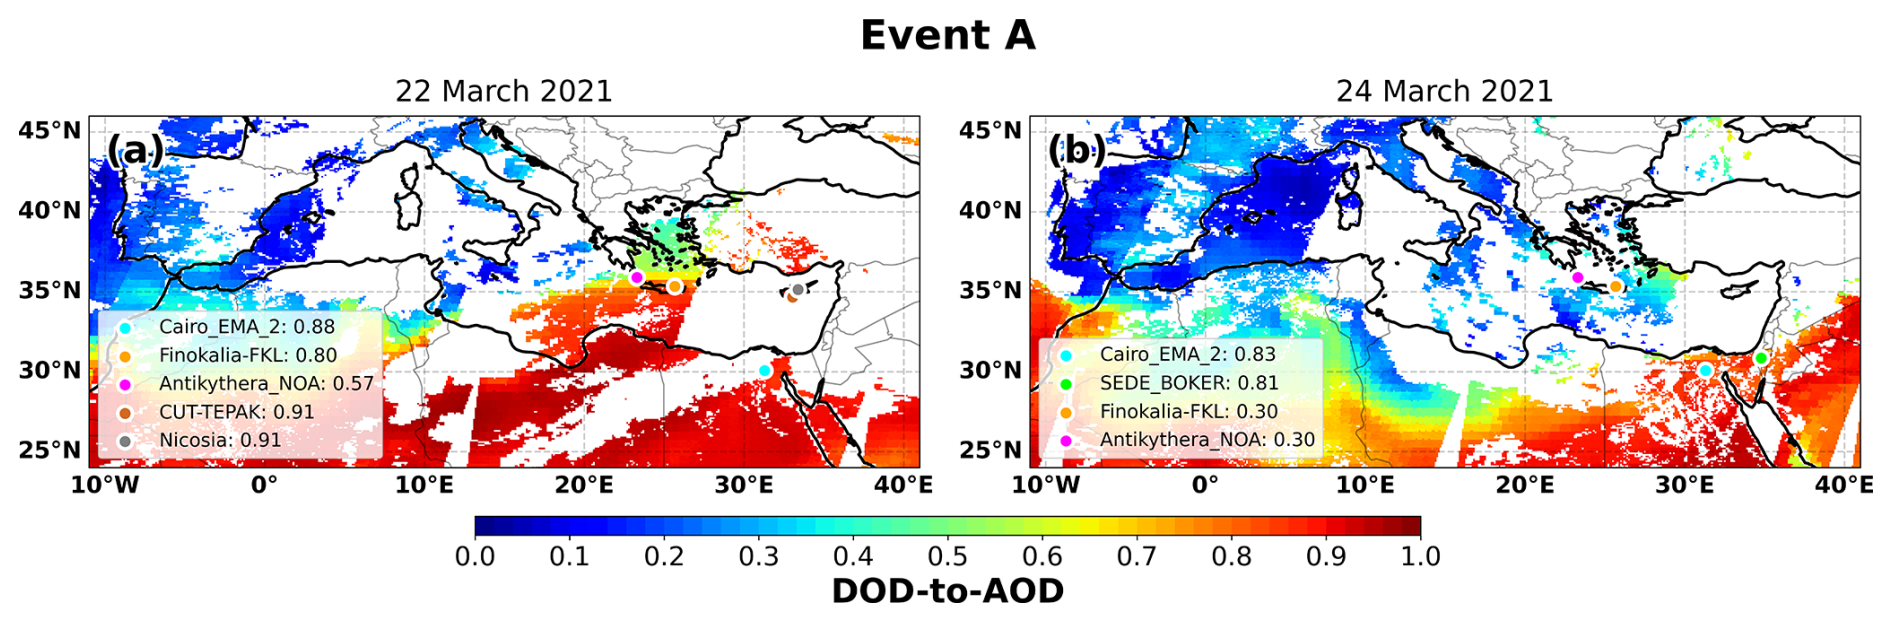
Figure C1DOD-to-AOD ratios (at 550 nm) over the Mediterranean Basin from MIDAS for event A. The days with the available almucantar AERONET retrievals are displayed along with the specific stations (colored circles).
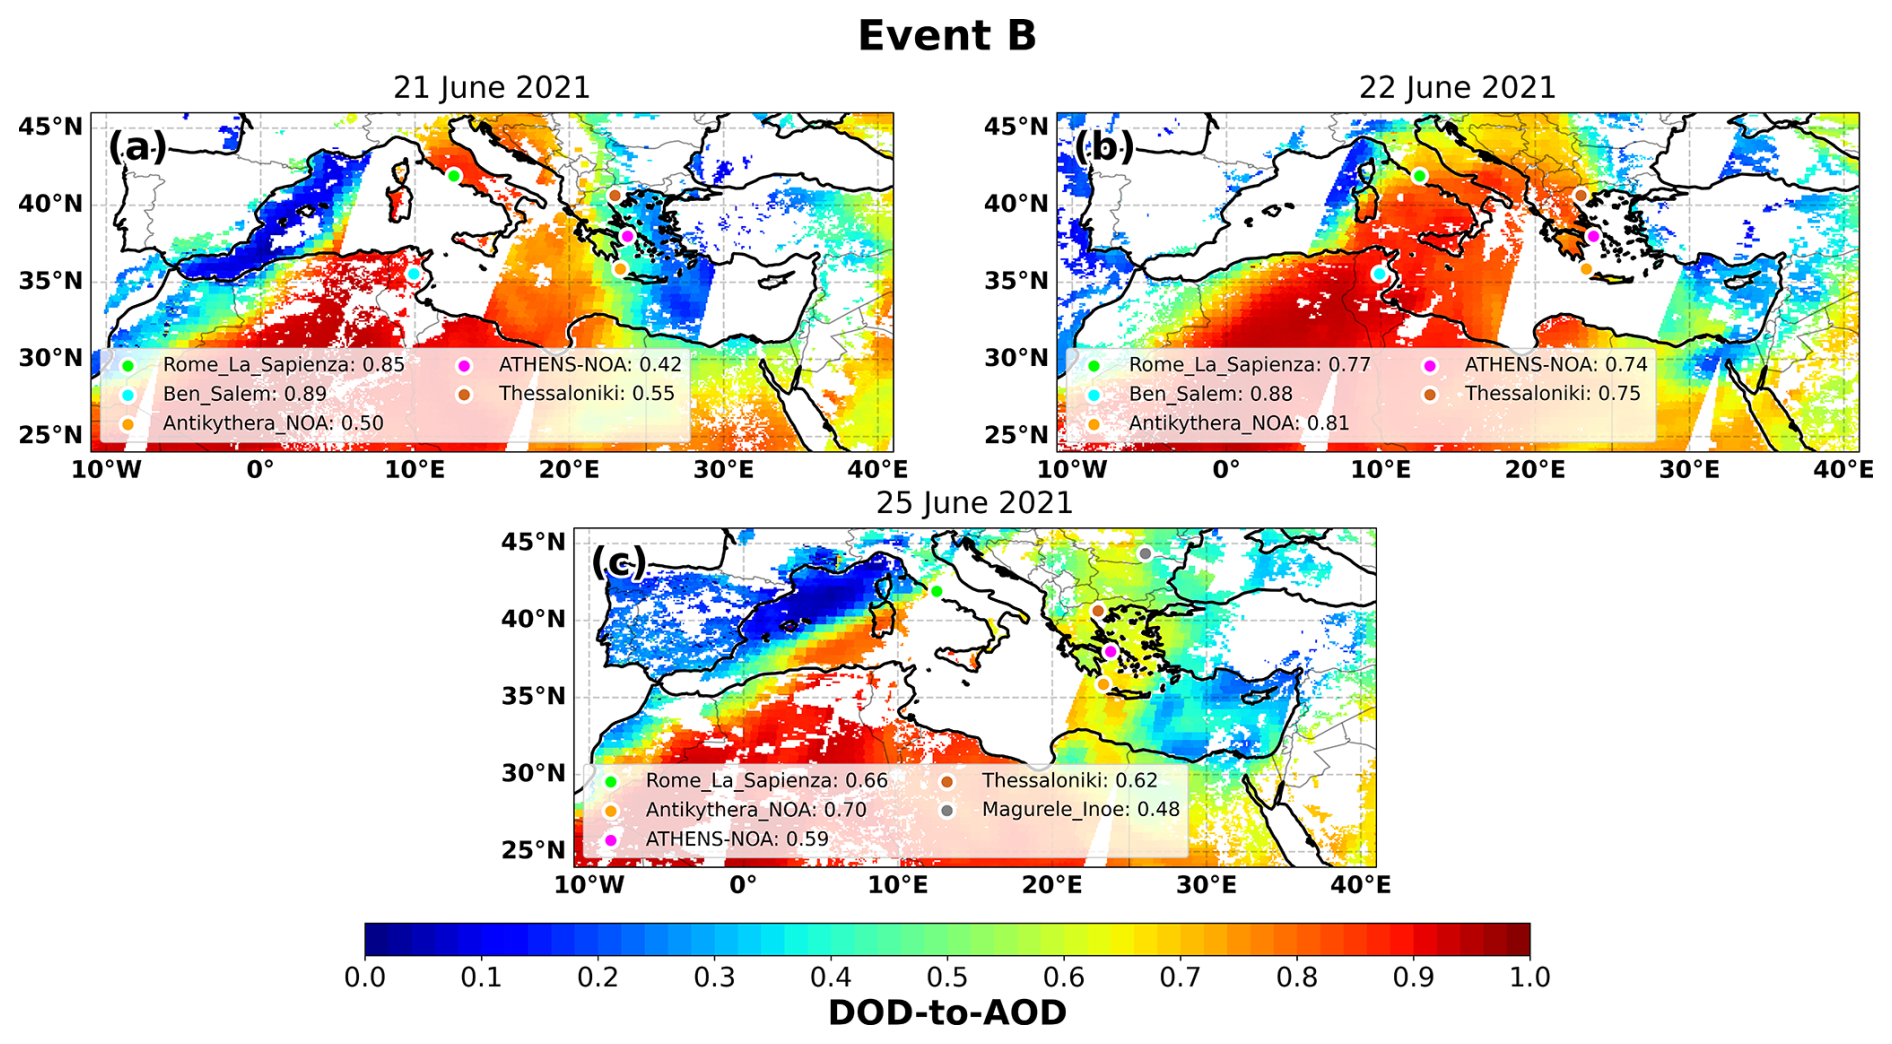
Figure C2DOD-to-AOD ratios (at 550 nm) over the Mediterranean Basin from MIDAS for event B. The days with the available almucantar AERONET retrievals are displayed along with the specific stations (colored circles).
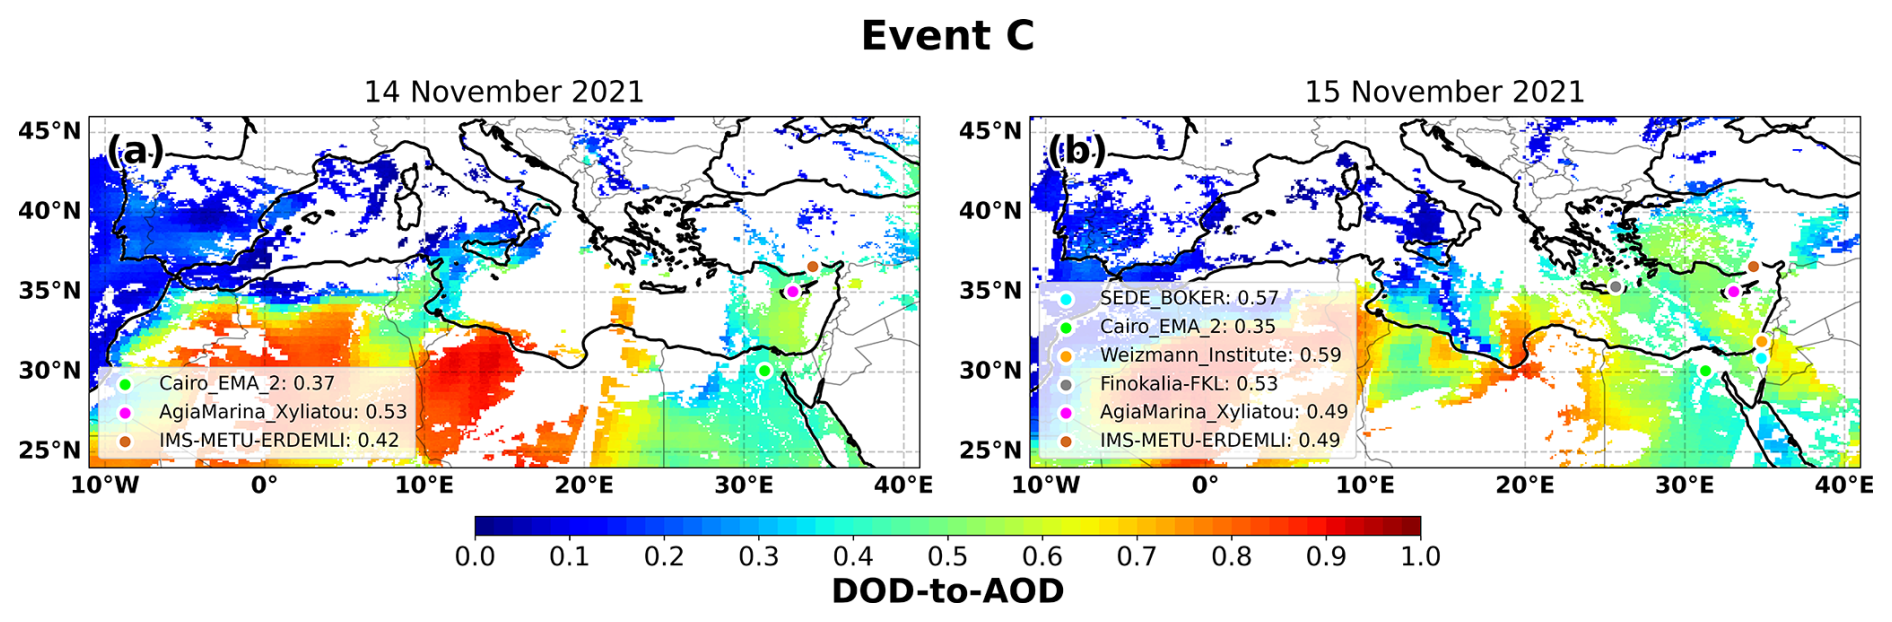
Figure C3DOD-to-AOD ratios (at 550 nm) over the Mediterranean Basin from MIDAS for event C. The days with the available almucantar AERONET retrievals are displayed along with the specific stations (colored circles).
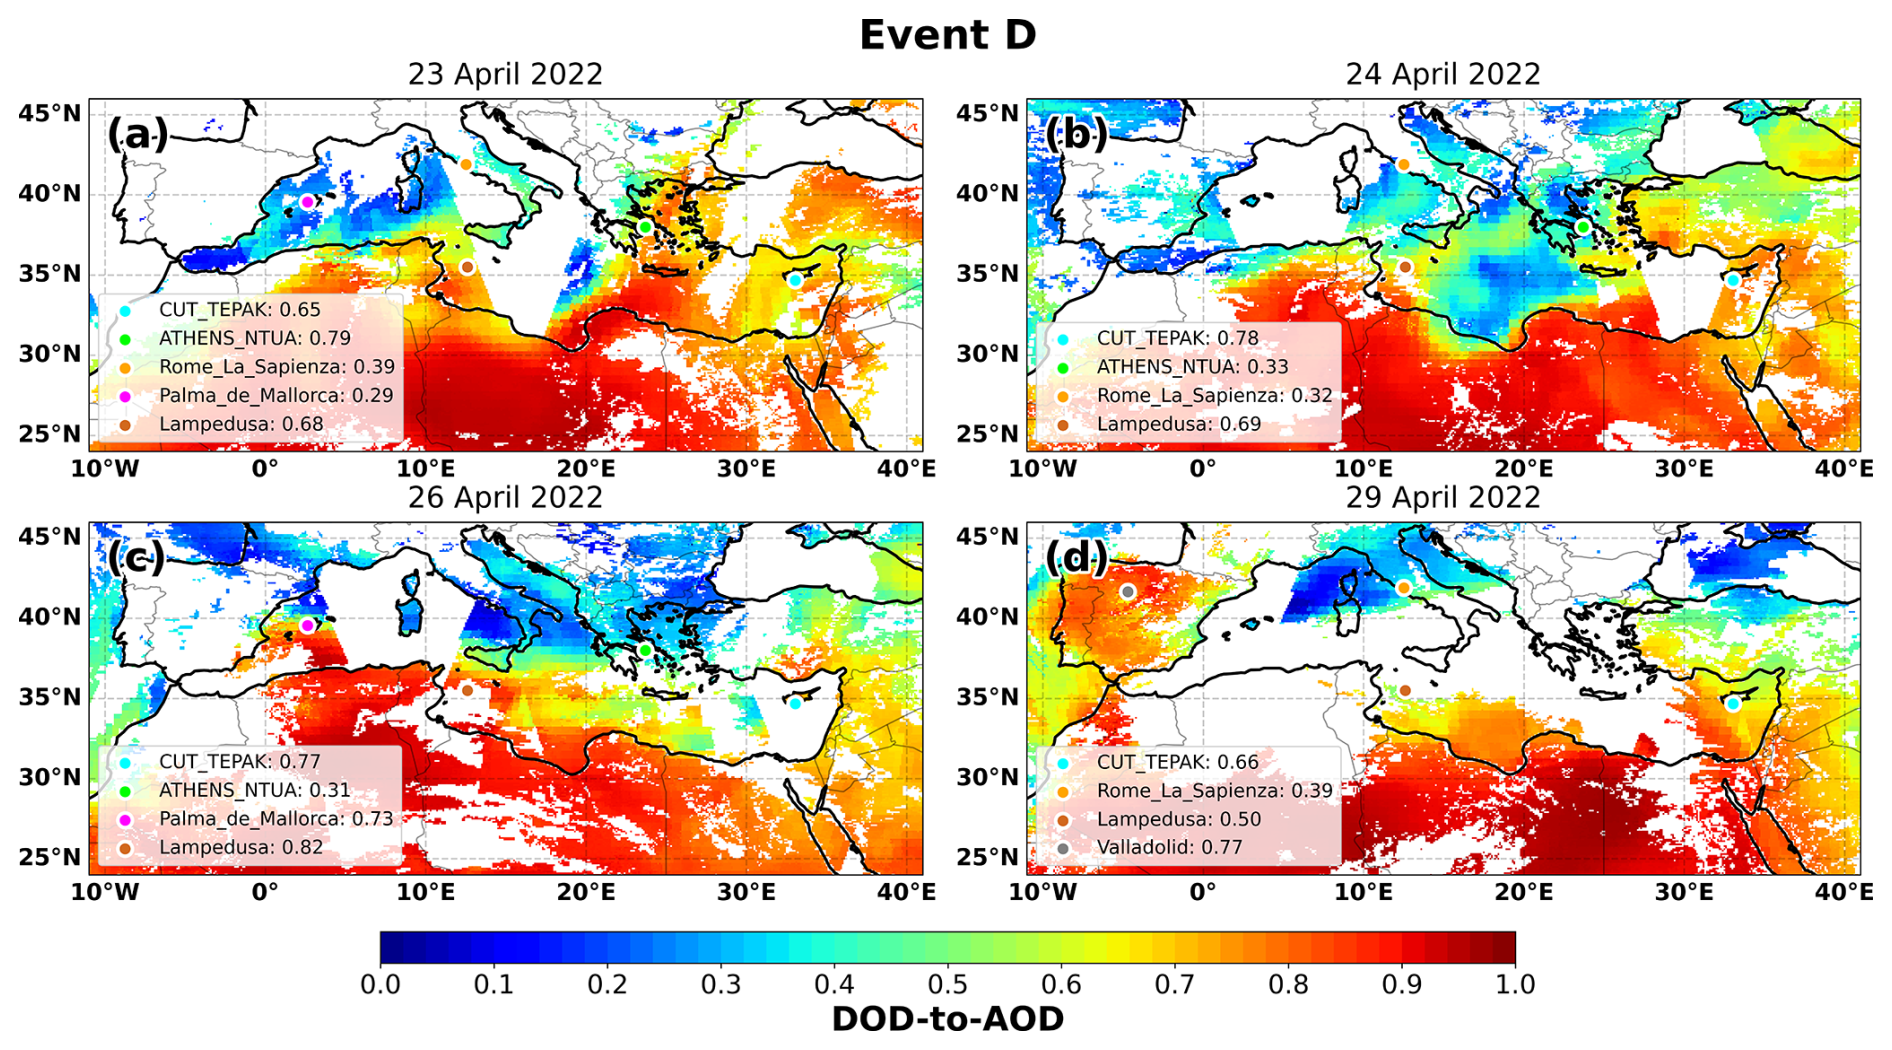
Figure C4DOD-to-AOD ratios (at 550 nm) over the Mediterranean Basin from MIDAS for event D. The days with the available almucantar AERONET retrievals are displayed along with the specific stations (colored circles).
The Mineral Aerosol Profiling from Infrared Radiances (MAPIR, Callewaert et al., 2019) provides vertical profiles of dust aerosol concentration, using remote sensing data from the Infrared Atmospheric Sounding Interferometer (IASI) instrument onboard the Metop satellite series (launched in 2006, 2012 and 2018). Those satellites fly on a sun-synchronous orbit, crossing the equator at about 09:30 and 21:30 local solar time. The IASI observations are done in the thermal infrared (TIR) spectral range, which allows both day and nighttime observations. In addition, the TIR spectral range offers intrinsic specificity to mineral aerosols in comparison to other types and much higher sensitivity to coarse mode particles than to fine mode particles. This means that no post-processing is needed to separate dust from other aerosol types and that the fine particles are mostly absent from the retrieved AOD. The retrieval only works under cloud-free conditions, and the cloud removal is part of the quality check. Figures D1 and D2 present some of the observations during the selected dust events.
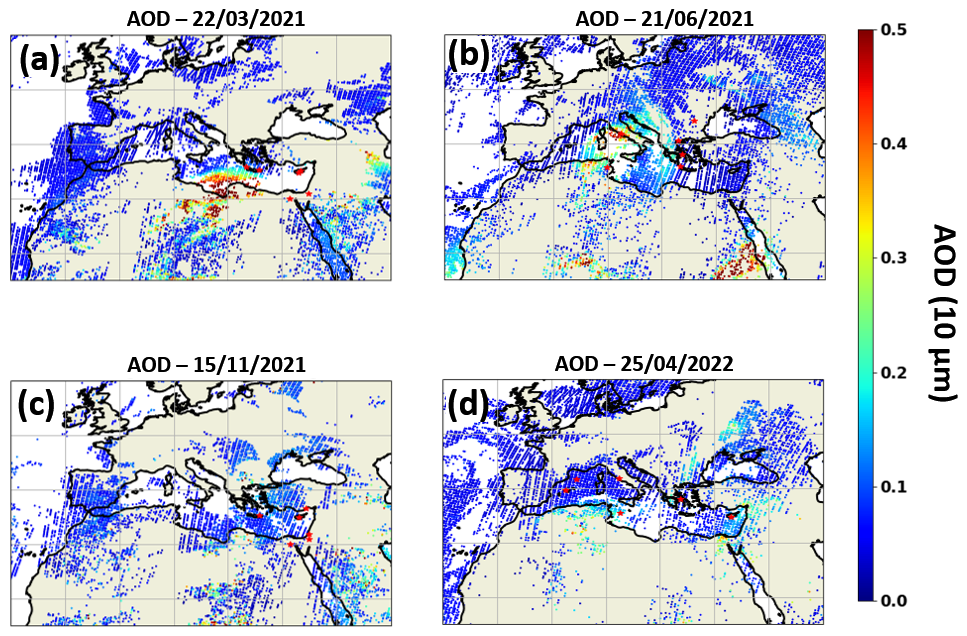
Figure D1Spatial distribution of dust AOD retrieved from IASI-MAPIR during the peak day of the four selected events. Colored pixels represent IASI-derived dust AOD, while blue shading indicates areas with lower dust loading.
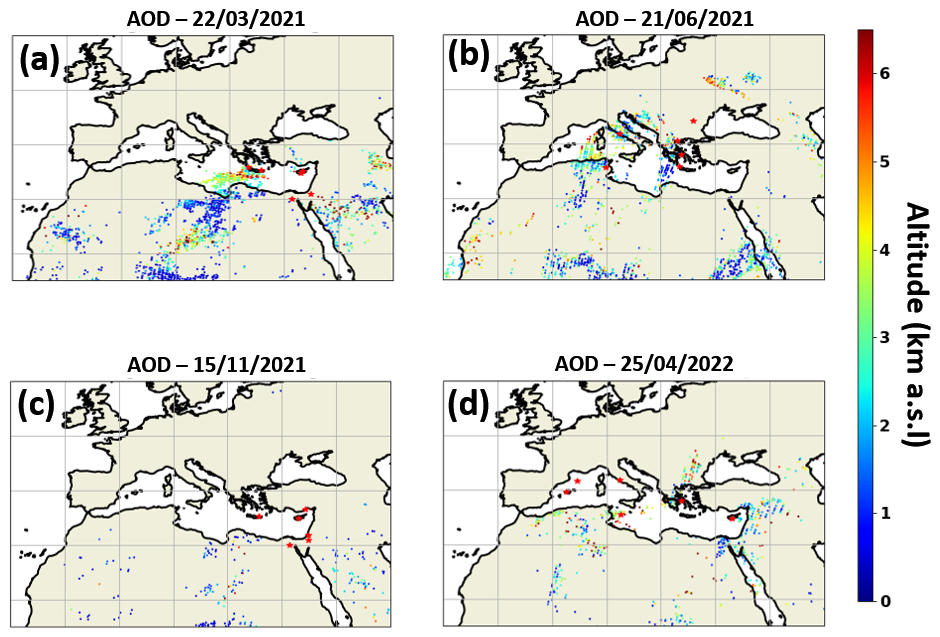
Figure D2Spatial distribution of IASI-MAPIR derived mean dust plume altitude (colored pixels, km a.s.l.), during the four selected dust events.
Figures E1 and E2 show the time series of AOD at 500 nm and AE 440–675 nm, respectively, which combined provides insight on the date of arrival and intensity of the dust event at different locations. For event A (see Figs. E1a and E2a) the AOD and AE show a similar evolution between stations, but with different intensity. On 22 March, most stations reach an AOD value of approximately 0.8, while over CUT-TEPAK AOD maximum values as high as 1.5 were apparent. Relatively similar AE values were observed in all stations on the days with the highest aerosol loads, with values below 0.5, indicating that a similar aerosol plume with large particles (i.e., dust) was affecting these stations.
During event B (see Figs. E1b and E2b), the AOD and AE evolution was not as uniform as for event A. A first increase in AOD is observed in Bem_Salem (Tunisian) and Rome_La_Sapienza (Central Italy) on 18 June, characterized by AE close to 0, which combined are an indication of dust. ATHENS-NOA (Central Greece), Thessaloniki (northern Greece), and Antikythera_NOA (southern Greece) are affected by the same dust plume 4 d later, with elevated AOD and low AE, between 21 and 22 June. Magurele_Inoe (Romania) shows a weaker response to the dust event starting also between 21 and 22 June and reaching minimum AE and maximum AOD between 25 and 26 June. The highest AOD values are measured in Rome_La_Sapienza on 19 June and in Thessaloniki on 22 June with values of 1.2 and 1.5, respectively. Values of AE <0.2 are observed in Bem_Salem and Rome_La_Sapienza throughout most of the period, with these stations being more affected by the event.
With respect to event C (see Figs. E1c and E2c), the evolution of the AOD and AE properties followed the same temporal pattern in all station observations, similar to event A. A noticeable increase in AOD is observed, especially from 13 to 18 November in Weizmann_Institute (Israel) and Cairo_EMA_2 (Egypt). This increase is also evident in IMS-METU-ERDEMLI (Turkey), Agia Marina Xyliatou (Cyprus) and Finokalia-FKL (Southern Greece). Except for the high values observed in Cairo_EMA_2 at the end of the event, this event shows a lower intensity than the rest of the analyzed events, with AOD values ∼0.4. In this case, AE is relatively high and constant in all the stations, with values between 0.5 and 1.6. The highest (around 1.6) and lowest (around 0.5) values are observed in IMS-METU-ERDEMLI (Turkey) and CUT-TEPAK (Cyprus), respectively, with the same minimum observed also at Finokalia-FKL (Greece).
Event D (see Figs. E1d and E2d) is characterized by high variability in terms of AERONET observations, possibly attributed to the significant geographical extent of the event, between Eastern and Western Mediterranean. The highest AOD values are observed in Lampedusa (southern Italy) on 21 April, when high values are also observed at ATHENS-NOA (Central Greece). During the following days, a decrease is observed in both stations, while on 23 April, the AOD increases in CUT-TEPAK (Cyprus) and in Rome_La_Sapienza (Central Italy). In addition to Rome_La_Sapienza, during the following days, high AOD values were observed by the rest of the other three stations mentioned, until 26 April, when AOD drops in all these stations except in Lampedusa. On this day, the aerosol plume reaches Palma_de_Mallorca (Eastern Spain), and finally on April 29 it arrives in Valladolid (Central Spain). For all the stations, AE reaches values close to 0 on the days when the maximum AOD occured.
As a next step, the microphysical and optical aerosol properties retrieved by AERONET at the selected station are discussed. The average of the retrievals that meet the criteria considered (see Sect. 2) are calculated for the day with the highest AOD value at each station for each event. Error bars with standard deviation are plotted for cases where more than one observation are available. For the Middle East and Central Sahara events, it was feasible to retrieve inversions only for some of the stations affected, as not all of the inversions were meeting the criteria.
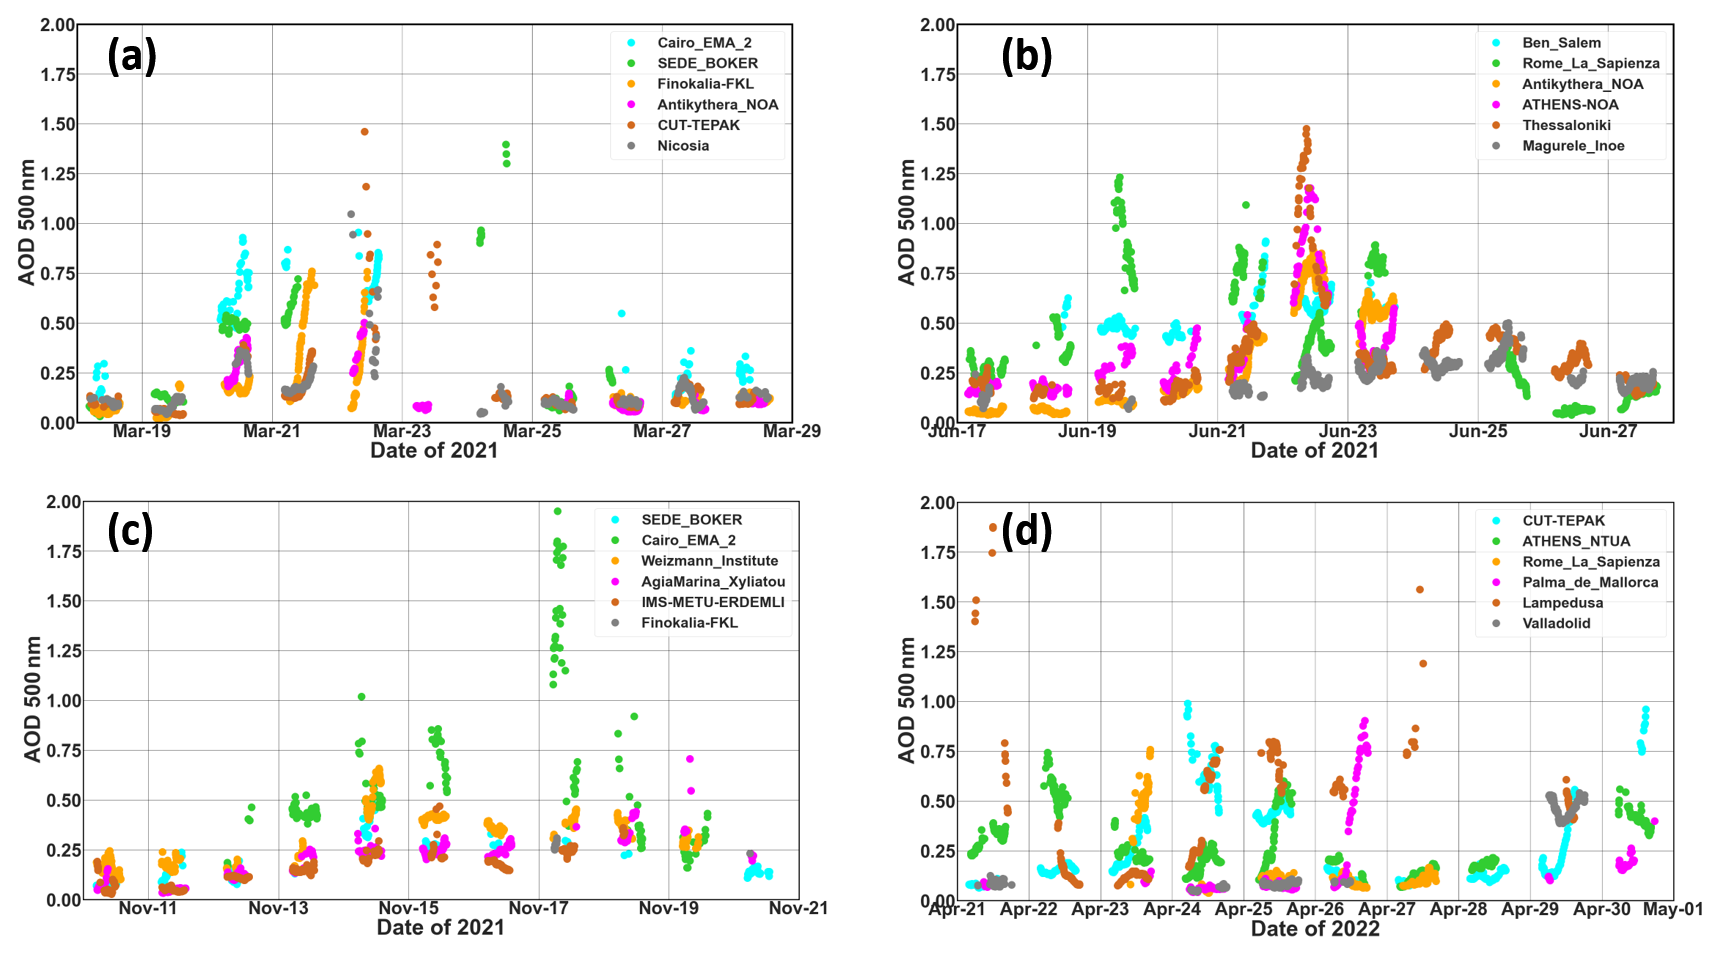
Figure E1Time series AOD at 500 nm at each station for the four events: Event A (A), Event B (B), Event C (C), and Event D (D). Color scheme representing the timeline of affected stations, with the first station in gray and the last in turquoise. The full sequence is: turquoise, green, orange, magenta, brown, and grey.
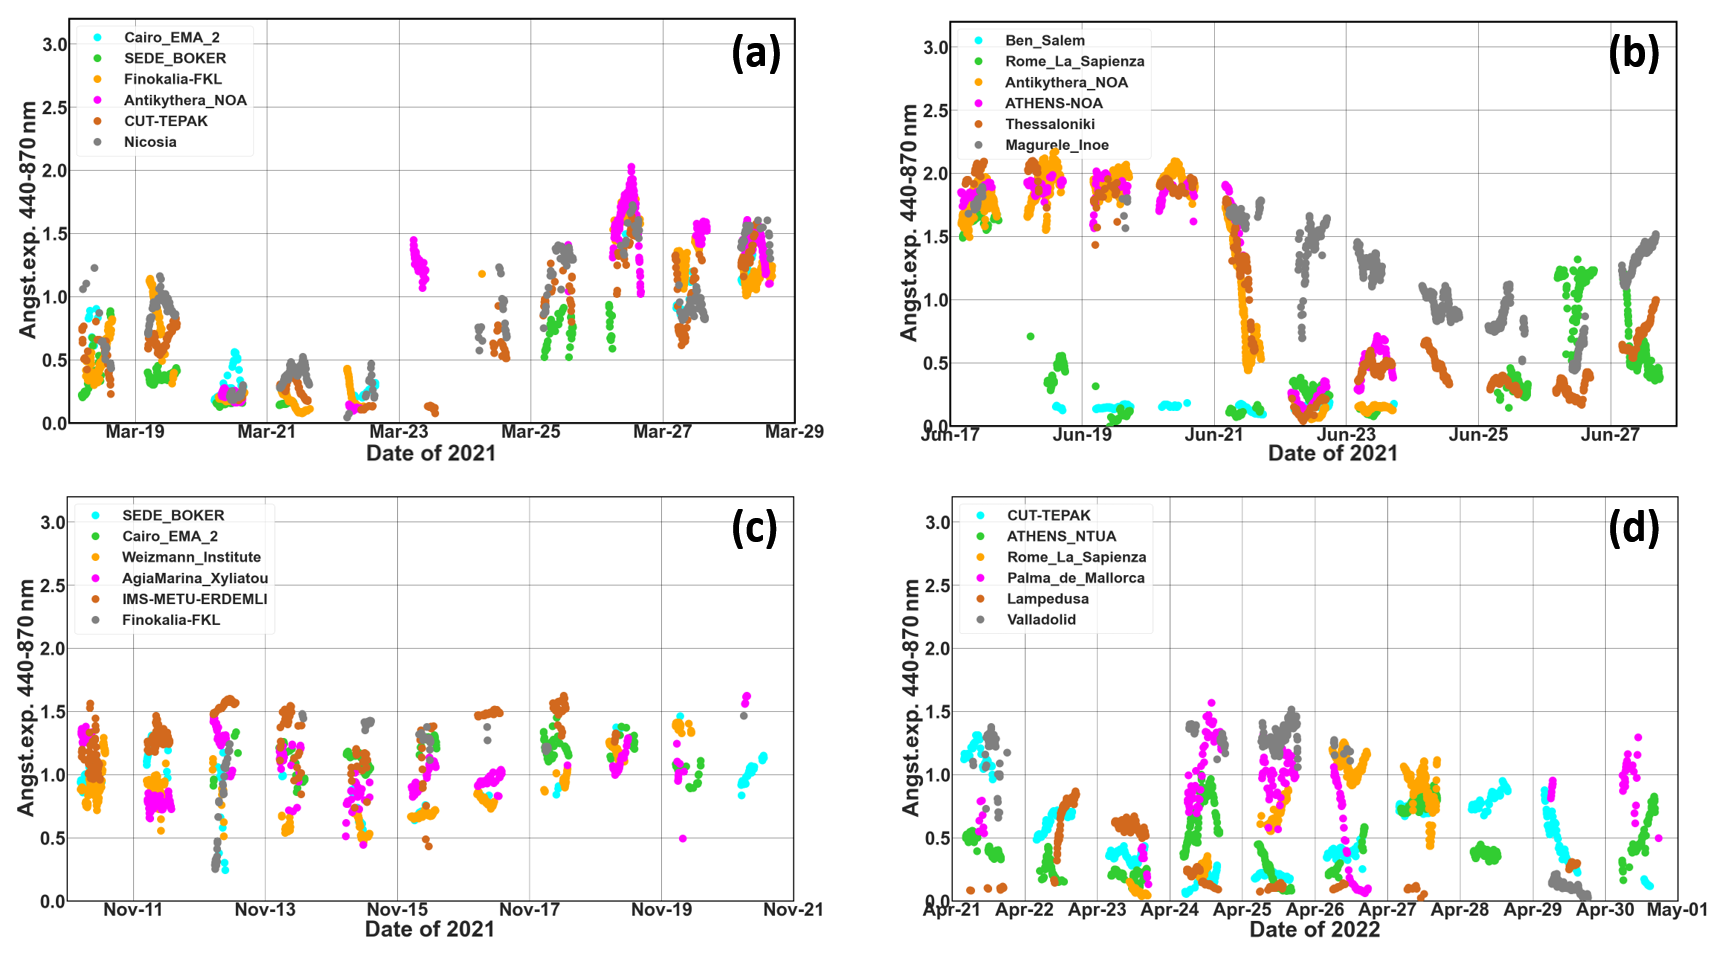
Figure E2Time series of AE 440-675 nm at each station for the four events: Event A (A), Event B (B), Event C (C), and Event D (D). Color scheme representing the timeline of affected stations, with the first station in gray and the last in turquoise. The full sequence is: turquoise, green, orange, magenta, brown, and grey.
To further investigate the possible contribution of anthropogenic aerosol during Event C, Fig. F1 presents the temporal evolution. Their concurrent enhancement during the event period provides complementary evidence that the transported dust plume was influenced by anthropogenic aerosol. Figure F2 provides additional regional context by showing the locations of major fossil-fuel-related facilities together with important natural aerosol source regions in the Eastern Mediterranean and Middle East. The map is not intended to quantify the emissions contributing to Event C, but rather to illustrate the presence of major potential anthropogenic source sectors along the broader transport region.
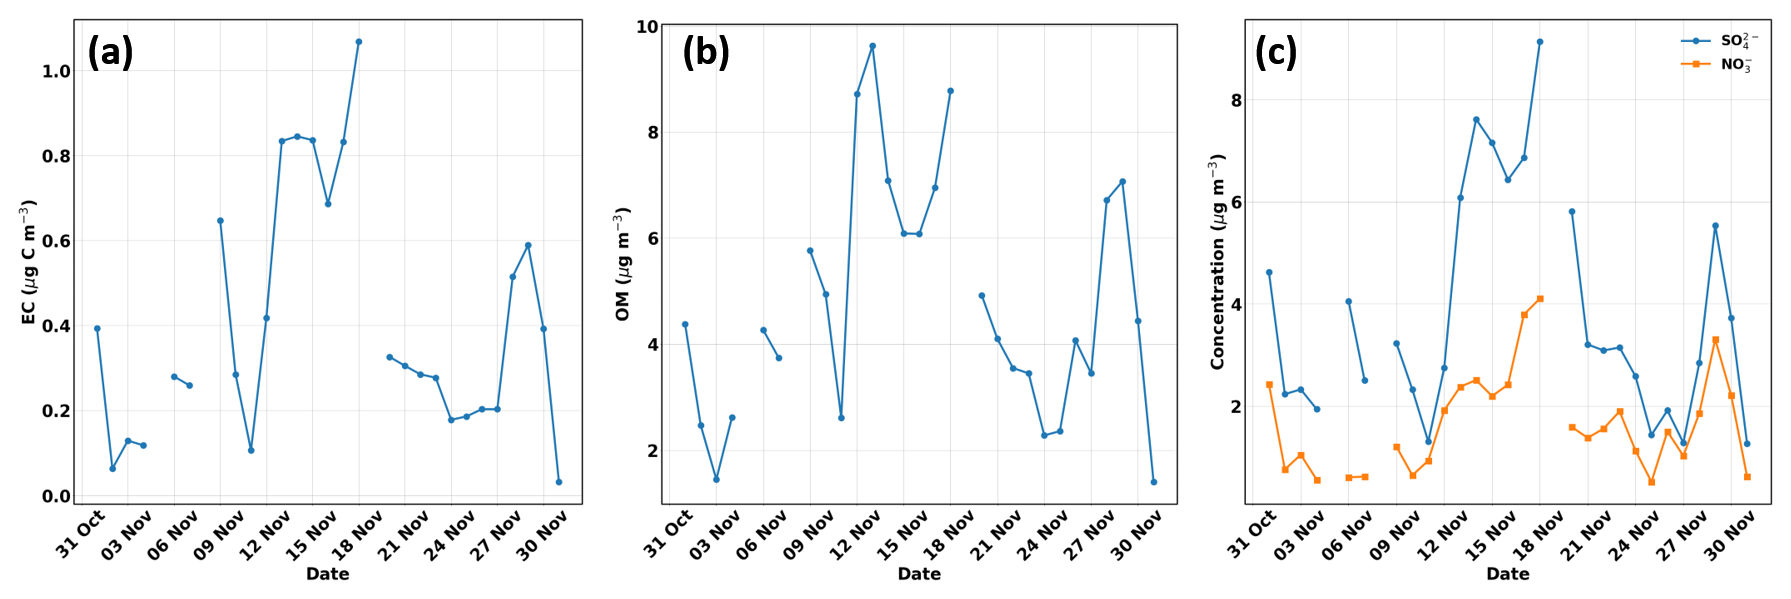
Figure F1Time series of elemental carbon (a), organic matter (b), sulfates and nitrates (c) for the period of Event D, measured at Agia Marina Xyliatou.
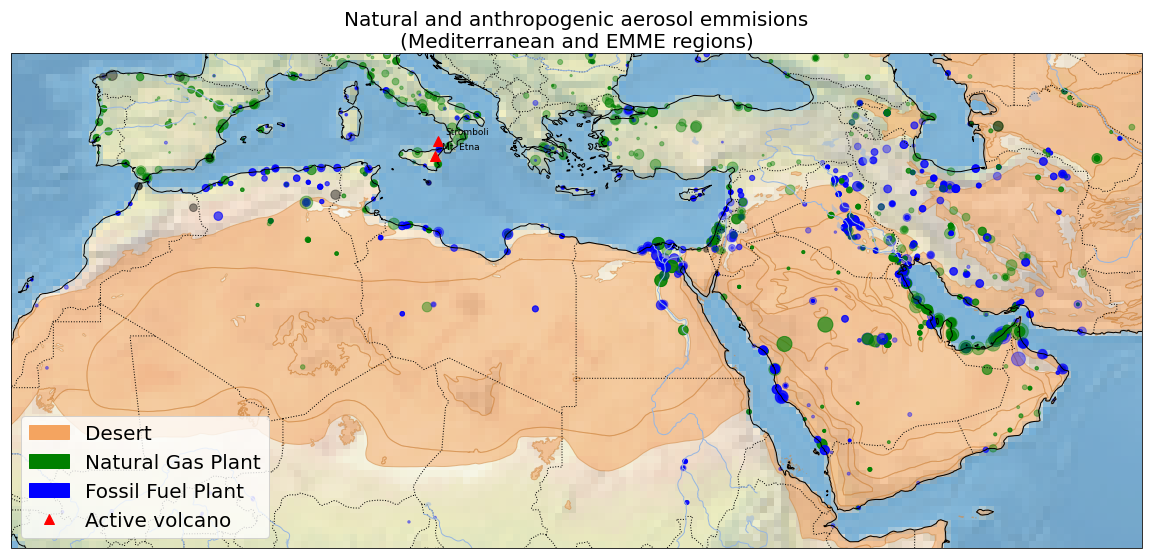
Figure F2Natural (deserts and active volcanoes) and anthropogenic (natural gas and fossil fuel plants) aerosol emission sources in the EMME and Mediterranean region. The size of the natural gas and fossil fuel plants represents the capacity of the plant in MW. Source for Oil and Gas Plants: Global Energy Monitor, Global Oil and Gas Plant Tracker, January 2025 release.
Table G1Statistical comparison between METAL-WRF elevated simulated and UAV-based (GPAC) observed elemental mass fractions during the dust event of 13–18 November 2021. For each sampling date and GPAC ID, the z score is calculated as , where σobs represents the vertical standard deviation of the simulated concentrations within the corresponding altitude range. The relative difference Δ (%) = . Results are shown for Ca, Fe, Mg, Si, and Al. Positive values reflect overestimation by the model, whereas negative values reflect underestimation relative to the UAV observations.
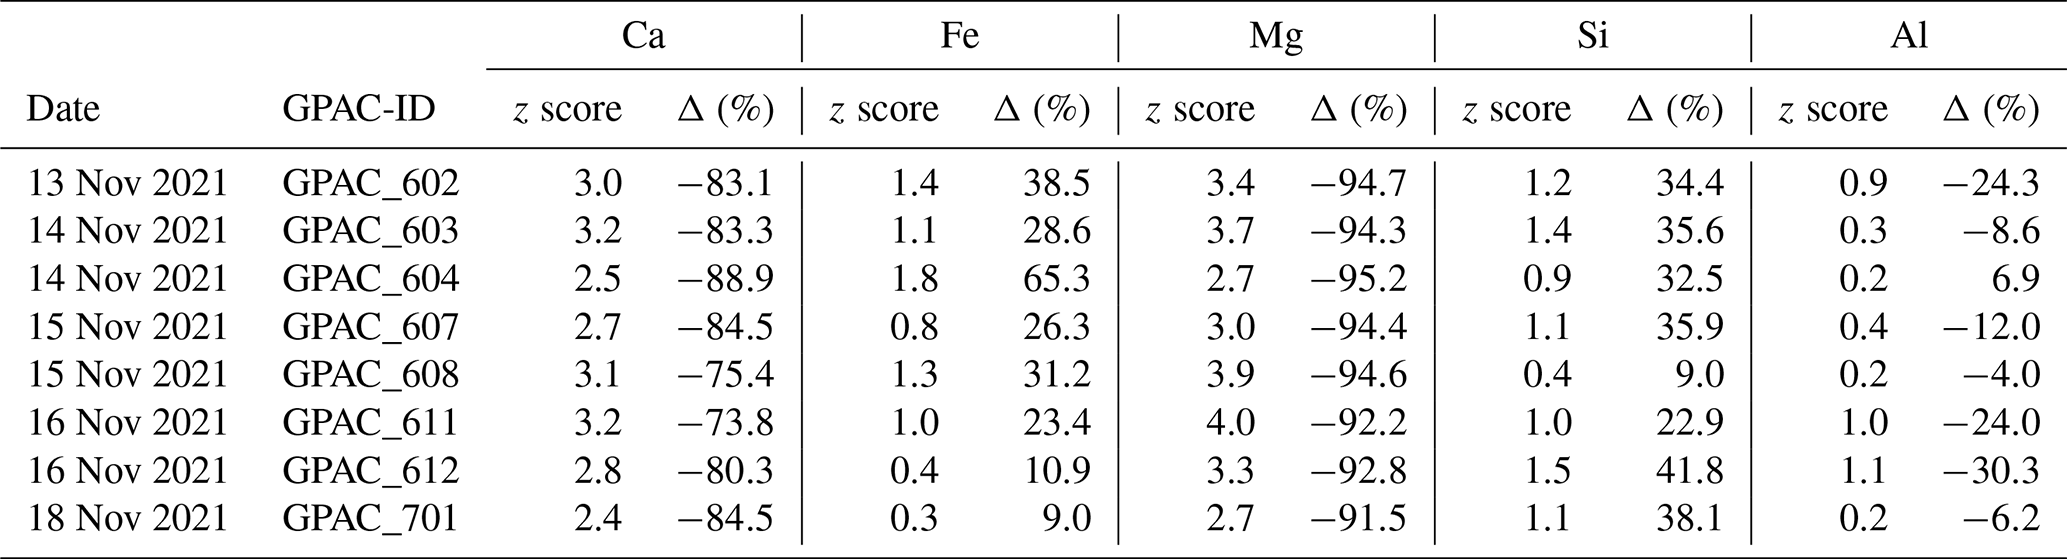
The AERONET products are publicly available at the AERONET website (https://https://aeronet.gsfc.nasa.gov/, last access: 27 February 2026). The IASI-MAPIR dust AOD and mean layer height are available at https://cds.climate.copernicus.eu/datasets/satellite-aerosol-properties?tab=download (last access: 27 February 2026). The MIDAS dataset is available at https://doi.org/10.5281/zenodo.4244106 (Gkikas et al., 2020) upon request. The CALIPSO lidar level 1B and level 2 data products are publicly available from the Atmospheric Science Data Center at NASA Langley Research Center (https://earthdata.nasa.gov/eosdis/daacs/asdc, last access: 27 February 2026, Earthdata). The LIVAS pure-dust database is available upon personal communication with Emmanouil Proestakis (proestakis@noa.gr) and/or Vassilis Amiridis (vamoir@noa.gr). The LIVAS L2 pure-dust total, fine-mode, and coarse-mode dataset is available at https://doi.org/10.5281/zenodo.10389741 (Proestakis, 2023). Three-dimensional METAL-WRF mineralogical simulations are available at https://doi.org/10.5281/zenodo.20179898 (Papetta et al., 2026). Ground-based observations from Agia Marina Cyprus and UAV-based mineralogical data are available at https://doi.org/10.5281/zenodo.20179588 (Pikridas and Papetta, 2026) and https://doi.org/10.5281/zenodo.20179843 (Papetta, 2026).
Conceptualization, IF and SS within the framework of the HARMONIA COST Action, with contributions from all authors; methodology, all authors; formal analysis, all authors; METAL-WRF simulations, SS and CS; MODIS data analysis, AM and AG; EARLINET data provision and analysis, MM; IASI-MAPIR data analysis, SV; LIVAS-CALIPSO data analysis, EP; Cyprus observational data acquisition, AP, MK, FM, MP and JS; LIVAS data provision, EP; original draft preparation, AP and CH; writing, review and editing, all authors; All authors have read and agreed to the published version of the manuscript.
At least one of the (co-)authors is a member of the editorial board of Atmospheric Chemistry and Physics. The peer-review process was guided by an independent editor, and the authors also have no other competing interests to declare.
Publisher's note: Copernicus Publications remains neutral with regard to jurisdictional claims made in the text, published maps, institutional affiliations, or any other geographical representation in this paper. The authors bear the ultimate responsibility for providing appropriate place names. Views expressed in the text are those of the authors and do not necessarily reflect the views of the publisher.
This study is based on the work from COST Action HARMONIA (CA21119), supported by COST (European Cooperation in Science and Technology). The authors would like to sincerely thank Konrad Kandler for performing the SEM analysis of the samples collected during the Fall Campaign in Cyprus.
The authors acknowledge the support from the Spanish Ministry for Science and Innovation for ACTRIS ERIC and from SNF Switzerland for the ACTRIS-CH project. E. Proestakis acknowledges support from the Hellenic Foundation for Research and Innovation (H.F.R.I.) under the “4th Call for H.F.R.I. Research Projects to support Post-Doctoral Researchers” under the project “Earth Observation for Mediterranean Sea biogeochemistry - Dust Soluble Iron Fertilization” (Project Number: 29034). D. Kouklaki would like to acknowledge the PANGEA4CalVal project (Grant Agreement 101079201) funded by the European Union. A. Papetta acknowledges EMME-CARE project for supporting this work under the European Union's Horizon 2020 Research and Innovation Programme (Grant Agreement No. 856612). G. Charalampous would like to acknowledge the EXCELSIOR: ERATOSTHENES: Excellence Research Centre for Earth Surveillance and Space-Based Monitoring of the Environment H2020 Widespread Teaming project (http://www.excelsior2020.eu/, last access: 31 August 2026).
This research has been supported by the European Cooperation in Science and Technology, EU-CardioRNA (grant no. CA21119), the NextGenerationEU (PRTR), the European Space Agency (grant no. 4000147847/25/I/AG), the EU Horizon 2020 Framework Programme, H2020 European Institute of Innovation and Technology (grant nos. 856612 and 857510), and the EU HORIZON EUROPEWidening Participation and Strengthening the European Research Area (grant no. 101160258). This work was also supported by the Ministerio de Ciencia e Innovacion (MICINN), with the grant nos. PID2021-127588OB-I00 and TED2021-131211B-I00375 funded by MCIN/AEI/10.13039/501100011033.
This paper was edited by Joshua Fu and reviewed by two anonymous referees.
Adebiyi, A., Kok, J. F., Murray, B. J., Ryder, C. L., Stuut, J.-B. W., Kahn, R. A., Knippertz, P., Formenti, P., Mahowald, N. M., Pérez García-Pando, C., Klose, M., Ansmann, A., Samset, B. H., Ito, A., Balkanski, Y., Di Biagio, C., Romanias, M. N., Huang, Y., and Meng, J.: A review of coarse mineral dust in the Earth system, Aeolian Res., 60, 100849, https://doi.org/10.1016/j.aeolia.2022.100849, 2023. a
Adebiyi, A. A. and Kok, J. F.: Climate models miss most of the coarse dust in the atmosphere, Sci. Adv., 6, eaaz9507, https://doi.org/10.1126/sciadv.aaz9507, 2020. a
Al Ameri, I. D. S., Briant, R. M., and Engels, S.: Drought severity and increased dust storm frequency in the Middle East: a case study from the Tigris-Euphrates alluvial plain, central Iraq, Weather, 74, 416–426, https://doi.org/10.1002/wea.3445, 2019. a
Amiridis, V.: Aerosol particle backscatter profile at 532 nm in Antikythera, Greece at 2021-06-22T10:32 : 2021-06-22T11:32 UTC, ACTRIS Aerosol remote sensing data centre unit (ARES) hosted by CNR IMAA, https://hdl.handle.net/20.500.12911/1.FK5Z2L55OWAH4CZG (last access: 21 February 2025), 2025. a
Amiridis, V., Balis, D. S., Kazadzis, S., Bais, A., Giannakaki, E., Papayannis, A., and Zerefos, C.: Four-year aerosol observations with a Raman lidar at Thessaloniki, Greece, in the framework of European Aerosol Research Lidar Network (EARLINET), J. Geophys. Res.-Atmos., 110, https://doi.org/10.1029/2005JD006190, 2005. a
Amiridis, V., Wandinger, U., Marinou, E., Giannakaki, E., Tsekeri, A., Basart, S., Kazadzis, S., Gkikas, A., Taylor, M., Baldasano, J., and Ansmann, A.: Optimizing CALIPSO Saharan dust retrievals, Atmos. Chem. Phys., 13, 12089–12106, https://doi.org/10.5194/acp-13-12089-2013, 2013. a, b
Amiridis, V., Marinou, E., Tsekeri, A., Wandinger, U., Schwarz, A., Giannakaki, E., Mamouri, R., Kokkalis, P., Binietoglou, I., Solomos, S., Herekakis, T., Kazadzis, S., Gerasopoulos, E., Proestakis, E., Kottas, M., Balis, D., Papayannis, A., Kontoes, C., Kourtidis, K., Papagiannopoulos, N., Mona, L., Pappalardo, G., Le Rille, O., and Ansmann, A.: LIVAS: a 3-D multi-wavelength aerosol/cloud database based on CALIPSO and EARLINET, Atmos. Chem. Phys., 15, 7127–7153, https://doi.org/10.5194/acp-15-7127-2015, 2015. a, b
Andrews, E., Ogren, J. A., Kinne, S., and Samset, B.: Comparison of AOD, AAOD and column single scattering albedo from AERONET retrievals and in situ profiling measurements, Atmos. Chem. Phys., 17, 6041–6072, https://doi.org/10.5194/acp-17-6041-2017, 2017. a
Aslanoğlu, S. Y., Proestakis, E., Gkikas, A., Güllü, G., and Amiridis, V.: Dust Climatology of Turkey as a Part of the Eastern Mediterranean Basin via 9-Year CALIPSO-Derived Product, Atmosphere, 13, 733, https://doi.org/10.3390/atmos13050733, 2022. a
Baars, H. and Mamouri, R.: Aerosol particle backscatter profile at 532nm in Limassol, Cyprus at 2021-03-22T19:30 : 2021-03-22T20:13 UTC, ACTRIS Aerosol remote sensing data centre unit (ARES) hosted by CNR IMAA, https://hdl.handle.net/20.500.12911/1.URGLJGD10RYBPA7W (last access: 10 February 2026), 2024. a
Baars, H. and Mamouri, R.: Aerosol particle backscatter profile at 532 nm in Limassol, Cyprus at 2021-11-15T04:18 : 2021-11-15T05:00 UTC, ACTRIS Aerosol remote sensing data centre unit (ARES) hosted by CNR IMAA, https://hdl.handle.net/20.500.12911/1.MSW32QGCPZP3UTNF (last access: 10 February 2026), 2025a. a
Baars, H. and Mamouri, R.: Aerosol particle backscatter profile at 532nm in Limassol, Cyprus at 2022-04-24T05:00 : 2022-04-24T06:00 UTC, ACTRIS Aerosol remote sensing data centre unit (ARES) hosted by CNR IMAA, https://hdl.handle.net/20.500.12911/1.VVLNWA7YCGK55BMN (last access: 10 February 2026), 2025b. a
Balis, D. S., Amiridis, V., Nickovic, S., Papayannis, A., and Zerefos, C.: Optical properties of Saharan dust layers as detected by a Raman lidar at Thessaloniki, Greece, Geophys. Res. Lett., 31, https://doi.org/10.1029/2004GL019881, 2004. a
Bauer, S. E., Mishchenko, M. I., Lacis, A. A., Zhang, S., Perlwitz, J., and Metzger, S. M.: Do sulfate and nitrate coatings on mineral dust have important effects on radiative properties and climate modeling?, J. Geophys. Res.-Atmos., 112, https://doi.org/10.1029/2005JD006977, 2007. a
Bimenyimana, E., Pikridas, M., Oikonomou, K., Iakovides, M., Christodoulou, A., Sciare, J., and Mihalopoulos, N.: Fine aerosol sources at an urban background site in the Eastern Mediterranean (Nicosia; Cyprus): Insights from offline versus online source apportionment comparison for carbonaceous aerosols, Sci. Total Environ., 893, 164741, https://doi.org/10.1016/j.scitotenv.2023.164741, 2023. a, b, c
Burgos, M., Mateos, D., Cachorro, V., Toledano, C., and de Frutos, A.: Aerosol properties of mineral dust and its mixtures in a regional background of north-central Iberian Peninsula, Sci. Total Environ., 572, 1005–1019, https://doi.org/10.1016/j.scitotenv.2016.08.001, 2016. a
Cachorro, V. E., Toledano, C., Antón, M., Berjón, A., de Frutos, A., Vilaplana, J. M., Arola, A., and Krotkov, N. A.: Comparison of UV irradiances from Aura/Ozone Monitoring Instrument (OMI) with Brewer measurements at El Arenosillo (Spain) – Part 2: Analysis of site aerosol influence, Atmos. Chem. Phys., 10, 11867–11880, https://doi.org/10.5194/acp-10-11867-2010, 2010. a
Callewaert, S., Vandenbussche, S., Kumps, N., Kylling, A., Shang, X., Komppula, M., Goloub, P., and De Mazière, M.: The Mineral Aerosol Profiling from Infrared Radiances (MAPIR) algorithm: version 4.1 description and evaluation, Atmos. Meas. Tech., 12, 3673–3698, https://doi.org/10.5194/amt-12-3673-2019, 2019. a
Casquero-Vera, J. A., Pérez-Ramírez, D., Lyamani, H., Rejano, F., Casans, A., Titos, G., Olmo, F. J., Dada, L., Hakala, S., Hussein, T., Lehtipalo, K., Paasonen, P., Hyvärinen, A., Pérez, N., Querol, X., Rodríguez, S., Kalivitis, N., González, Y., Alghamdi, M. A., Kerminen, V.-M., Alastuey, A., Petäjä, T., and Alados-Arboledas, L.: Impact of desert dust on new particle formation events and the cloud condensation nuclei budget in dust-influenced areas, Atmos. Chem. Phys., 23, 15795–15814, https://doi.org/10.5194/acp-23-15795-2023, 2023. a
Castellanos, P., Colarco, P., Espinosa, W. R., Guzewich, S. D., Levy, R. C., Miller, R. L., Chin, M., Kahn, R. A., Kemppinen, O., Moosmüller, H., Nowottnick, E. P., Rocha-Lima, A., Smith, M. D., Yorks, J. E., and Yu, H.: Mineral dust optical properties for remote sensing and global modeling: A review, Remote Sens. Environ., 303, 113982, https://doi.org/10.1016/j.rse.2023.113982, 2024. a
Christodoulou, A., Stavroulas, I., Vrekoussis, M., Desservettaz, M., Pikridas, M., Bimenyimana, E., Kushta, J., Ivančič, M., Rigler, M., Goloub, P., Oikonomou, K., Sarda-Estève, R., Savvides, C., Afif, C., Mihalopoulos, N., Sauvage, S., and Sciare, J.: Ambient carbonaceous aerosol levels in Cyprus and the role of pollution transport from the Middle East, Atmos. Chem. Phys., 23, 6431–6456, https://doi.org/10.5194/acp-23-6431-2023, 2023. a
Cuevas, E., Milford, C., Barreto, A., Bustos, J. J., García, R. D., Marrero, C. L., Prats, N., Bayo, C., Ramos, R., Terradellas, E., Suárez, D., Rodríguez, S., de la Rosa, J., Vilches, J., Basart, S., Werner, E., López-Villarrubia, E., Rodríguez-Mireles, S., Pita Toledo, M. L., González, O., Belmonte, J., Puigdemunt, R., Lorenzo, J. A., Oromí, P., and del Campo-Hernández, R.: Desert Dust Outbreak in the Canary Islands (February 2020): Assessment and Impacts, Tech. Rep. GAW Report No. 259, WWRP 2021-1, WMO Global Atmosphere Watch (GAW), State Meteorological Agency (AEMET), World Meteorological Organization (WMO), Madrid, Spain and Geneva, Switzerland, https://www.aemet.es/documentos/es/conocermas/recursos_en_linea/publicaciones_y_estudios/publicaciones/GAW_Report_No_259/GAW_Report_No_259.pdf (last access: 10 February 2026), 2021. a
Cuevas-Agulló, E., Barriopedro, D., García, R. D., Alonso-Pérez, S., González-Alemán, J. J., Werner, E., Suárez, D., Bustos, J. J., García-Castrillo, G., García, O., Barreto, Á., and Basart, S.: Sharp increase in Saharan dust intrusions over the western Euro-Mediterranean in February–March 2020–2022 and associated atmospheric circulation, Atmos. Chem. Phys., 24, 4083–4104, https://doi.org/10.5194/acp-24-4083-2024, 2024. a
De Longueville, F., Hountondji, Y.-C., Henry, S., and Ozer, P.: What do we know about effects of desert dust on air quality and human health in West Africa compared to other regions?, Sci. Total Environ., 409, 1–8, https://doi.org/10.1016/j.scitotenv.2010.09.025, 2010. a
DeMott, P. J., Sassen, K., Poellot, M. R., Baumgardner, D., Rogers, D. C., Brooks, S. D., Prenni, A. J., and Kreidenweis, S. M.: Correction to African dust aerosols as atmospheric ice nuclei, Geophys. Res. Lett., 36, https://doi.org/10.1029/2009GL037639, 2009. a
Di Biagio, C., Formenti, P., Balkanski, Y., Caponi, L., Cazaunau, M., Pangui, E., Journet, E., Nowak, S., Andreae, M. O., Kandler, K., Saeed, T., Piketh, S., Seibert, D., Williams, E., and Doussin, J.-F.: Complex refractive indices and single-scattering albedo of global dust aerosols in the shortwave spectrum and relationship to size and iron content, Atmos. Chem. Phys., 19, 15503–15531, https://doi.org/10.5194/acp-19-15503-2019, 2019. a
Di Biagio, C., Doussin, J.-F., Cazaunau, M., Pangui, E., Cuesta, J., Sellitto, P., Ródenas, M., and Formenti, P.: Infrared optical signature reveals the source–dependency and along–transport evolution of dust mineralogy as shown by laboratory study, Sci. Rep., 13, 13252, https://doi.org/10.1038/s41598-023-39336-7, 2023. a
Drinovec, L., Sciare, J., Stavroulas, I., Bezantakos, S., Pikridas, M., Unga, F., Savvides, C., Višić, B., Remškar, M., and Močnik, G.: A new optical-based technique for real-time measurements of mineral dust concentration in PM10 using a virtual impactor, Atmos. Meas. Tech., 13, 3799–3813, https://doi.org/10.5194/amt-13-3799-2020, 2020. a
Dubovik, O. and King, M. D.: A flexible inversion algorithm for retrieval of aerosol optical properties from Sun and sky radiance measurements, J. Geophys. Res.-Atmos., 105, 20673–20696, https://doi.org/10.1029/2000JD900282, 2000. a
Dubovik, O., Smirnov, A., Holben, B. N., King, M. D., Kaufman, Y. J., Eck, T. F., and Slutsker, I.: Accuracy assessments of aerosol optical properties retrieved from Aerosol Robotic Network (AERONET) Sun and sky radiance measurements, J. Geophys. Res.-Atmos., 105, 9791–9806, https://doi.org/10.1029/2000JD900040, 2000. a
Dubovik, O., Holben, B., Eck, T. F., Smirnov, A., Kaufman, Y. J., King, M. D., Tanré, D., and Slutsker, I.: Variability of Absorption and Optical Properties of Key Aerosol Types Observed in Worldwide Locations, J. Atmos. Sci., 59, 590–608, https://doi.org/10.1175/1520-0469(2002)059<0590:VOAAOP>2.0.CO;2, 2002. a, b
Kandler, K., Schütz, L., Deutscher, C., Ebert, M., Hofmann, H., Jäckel, S., Jaenicke, R., Knippertz, P., Lieke, K., Massling, A., Petzold, A., Schladitz, A., Weinzierl, B., Wiedensohler, A., Zorn, S., and Weinbruch, S.: Size distribution, mass concentration, chemical and mineralogical composition and derived optical parameters of the boundary layer aerosol at Tinfou, Morocco, during SAMUM 2006, Tellus B, 61, 32–50, https://doi.org/10.1111/j.1600-0889.2008.00385.x, 2009. a
Flaounas, E., Kotroni, V., Lagouvardos, K., Kazadzis, S., Gkikas, A., and Hatzianastassiou, N.: Cyclone contribution to dust transport over the Mediterranean region, Atmos. Sci. Lett., 16, 473–478, https://doi.org/10.1002/asl.584, 2015. a
Formenti, P., Rajot, J. L., Desboeufs, K., Caquineau, S., Chevaillier, S., Nava, S., Gaudichet, A., Journet, E., Triquet, S., Alfaro, S., Chiari, M., Haywood, J., Coe, H., and Highwood, E.: Regional variability of the composition of mineral dust from western Africa: Results from the AMMA SOP0/DABEX and DODO field campaigns, J. Geophys. Res.-Atmos., 113, https://doi.org/10.1029/2008JD009903, 2008. a
Giles, D. M., Holben, B. N., Eck, T. F., Sinyuk, A., Smirnov, A., Slutsker, I., Dickerson, R. R., Thompson, A. M., and Schafer, J. S.: An analysis of AERONET aerosol absorption properties and classifications representative of aerosol source regions, J. Geophys. Res.-Atmos., 117, https://doi.org/10.1029/2012JD018127, 2012. a
Giles, D. M., Sinyuk, A., Sorokin, M. G., Schafer, J. S., Smirnov, A., Slutsker, I., Eck, T. F., Holben, B. N., Lewis, J. R., Campbell, J. R., Welton, E. J., Korkin, S. V., and Lyapustin, A. I.: Advancements in the Aerosol Robotic Network (AERONET) Version 3 database – automated near-real-time quality control algorithm with improved cloud screening for Sun photometer aerosol optical depth (AOD) measurements, Atmos. Meas. Tech., 12, 169–209, https://doi.org/10.5194/amt-12-169-2019, 2019. a, b
Gkikas, A., Hatzianastassiou, N., and Mihalopoulos, N.: Aerosol events in the broader Mediterranean basin based on 7-year (2000–2007) MODIS C005 data, Ann. Geophys., 27, 3509–3522, https://doi.org/10.5194/angeo-27-3509-2009, 2009. a
Gkikas, A., Hatzianastassiou, N., Mihalopoulos, N., Katsoulis, V., Kazadzis, S., Pey, J., Querol, X., and Torres, O.: The regime of intense desert dust episodes in the Mediterranean based on contemporary satellite observations and ground measurements, Atmos. Chem. Phys., 13, 12135–12154, https://doi.org/10.5194/acp-13-12135-2013, 2013. a, b
Gkikas, A., Houssos, E. E., Lolis, C. J., Bartzokas, A., Mihalopoulos, N., and Hatzianastassiou, N.: Atmospheric circulation evolution related to desert-dust episodes over the Mediterranean, Q. J. Roy. Meteor. Soc., 141, https://doi.org/10.1002/qj.2466, 2014. a
Gkikas, A., Basart, S., Hatzianastassiou, N., Marinou, E., Amiridis, V., Kazadzis, S., Pey, J., Querol, X., Jorba, O., Gassó, S., and Baldasano, J. M.: Mediterranean intense desert dust outbreaks and their vertical structure based on remote sensing data, Atmos. Chem. Phys., 16, 8609–8642, https://doi.org/10.5194/acp-16-8609-2016, 2016. a, b
Gkikas, A., Obiso, V., Pérez García-Pando, C., Jorba, O., Hatzianastassiou, N., Vendrell, L., Basart, S., Solomos, S., Gassó, S., and Baldasano, J. M.: Direct radiative effects during intense Mediterranean desert dust outbreaks, Atmos. Chem. Phys., 18, 8757–8787, https://doi.org/10.5194/acp-18-8757-2018, 2018. a
Gkikas, A., Proestakis, E., Amiridis, V., Kazadzis, S., Di Tomaso, E., Tsekeri, A., Marinou, E., Hatzianastassiou, N., and Pérez García-Pando, C.: ModIs Dust AeroSol (MIDAS): A global fine resolution dust optical depth dataset, Zenodo [data set], https://doi.org/10.5281/zenodo.4244106, 2020. a
Gkikas, A., Proestakis, E., Amiridis, V., Kazadzis, S., Di Tomaso, E., Tsekeri, A., Marinou, E., Hatzianastassiou, N., and Pérez García-Pando, C.: ModIs Dust AeroSol (MIDAS): a global fine-resolution dust optical depth data set, Atmos. Meas. Tech., 14, 309–334, https://doi.org/10.5194/amt-14-309-2021, 2021. a, b, c
Gkikas, A., Proestakis, E., Amiridis, V., Kazadzis, S., Di Tomaso, E., Marinou, E., Hatzianastassiou, N., Kok, J. F., and García-Pando, C. P.: Quantification of the dust optical depth across spatiotemporal scales with the MIDAS global dataset (2003–2017), Atmos. Chem. Phys., 22, 3553–3578, https://doi.org/10.5194/acp-22-3553-2022, 2022. a, b
González-Romero, A., González-Flórez, C., Panta, A., Yus-Díez, J., Reche, C., Córdoba, P., Moreno, N., Alastuey, A., Kandler, K., Klose, M., Baldo, C., Clark, R. N., Shi, Z., Querol, X., and Pérez García-Pando, C.: Variability in sediment particle size, mineralogy, and Fe mode of occurrence across dust-source inland drainage basins: the case of the lower Drâa Valley, Morocco, Atmos. Chem. Phys., 23, 15815–15834, https://doi.org/10.5194/acp-23-15815-2023, 2023. a
Goudie, A. S.: Desert dust and human health disorders, Environ. Int., 63, 101–113, https://doi.org/10.1016/j.envint.2013.10.011, 2014. a
Green, R. O., Mahowald, N., Ung, C., Thompson, D. R., Bator, L., Bennet, M., Bernas, M., Blackway, N., Bradley, C., Cha, J., Clark, P., Clark, R., Cloud, D., Diaz, E., Ben Dor, E., Duren, R., Eastwood, M., Ehlmann, B. L., Fuentes, L., Ginoux, P., Gross, J., He, Y., Kalashnikova, O., Kert, W., Keymeulen, D., Klimesh, M., Ku, D., Kwong-Fu, H., Liggett, E., Li, L., Lundeen, S., Makowski, M. D., Mazer, A., Miller, R. L., Mouroulis, P., Oaida, B., Okin, G. S., Ortega, A., Oyake, A., Nguyen, H., Pace, T., Painter, T. H., Pempejian, J., Pérez García-Pando, C., Pham, T., Phillips, B., Pollock, R., Purcell, R., Realmuto, V., Schoolcraft, J., Sen, A., Shin, S., Shaw, L., Soriano, M., Swayze, G., Thingvold, E., Vaid, A., and Zan, J.: The Earth Surface Mineral Dust Source Investigation: An Earth science imaging spectroscopy mission, in: 2020 IEEE Aerospace Conference, online, IEEE, https://doi.org/10.1109/AERO47225.2020.9172731, 2020. a
Hatch, C. D., Gierlus, K. M., Schuttlefield, J. D., and Grassian, V. H.: Water adsorption and cloud condensation nuclei activity of calcite and calcite coated with model humic and fulvic acids, Atmos. Environ., 42, 5672–5684, https://doi.org/10.1016/j.atmosenv.2008.03.005, 2008. a
Hess, M., Koepke, P., and Schult, I.: Optical Properties of Aerosols and Clouds: The Software Package OPAC, B. Am. Meteorol. Soc., 79, 831–844, https://doi.org/10.1175/1520-0477(1998)079<0831:OPOAAC>2.0.CO;2, 1998. a
Holben, B., Eck, T., Slutsker, I., Tanré, D., Buis, J., Setzer, A., Vermote, E., Reagan, J., Kaufman, Y., Nakajima, T., Lavenu, F., Jankowiak, I., and Smirnov, A.: AERONET: A Federated Instrument Network and Data Archive for Aerosol Characterization, Remote Sens. Environ., 66, 1–16, https://doi.org/10.1016/S0034-4257(98)00031-5, 1998. a
Holben, B. N., Eck, T. F., Slutsker, I., Smirnov, A., Sinyuk, A., Schafer, J., Giles, D., and Dubovik, O.: AERONET's Version 2.0 quality assurance criteria, in: Remote Sensing of the Atmosphere and Clouds, Proc. SPIE 6408, 64080Q, https://doi.org/10.1117/12.706524, 2006. a
Hunt, W. H., Winker, D. M., Vaughan, M. A., Powell, K. A., Lucker, P. L., and Weimer, C.: CALIPSO Lidar Description and Performance Assessment, J. Atmos. Ocean. Tech., 26, 1214–1228, https://doi.org/10.1175/2009JTECHA1223.1, 2009. a
Ito, A., Adebiyi, A. A., Huang, Y., and Kok, J. F.: Less atmospheric radiative heating by dust due to the synergy of coarser size and aspherical shape, Atmos. Chem. Phys., 21, 16869–16891, https://doi.org/10.5194/acp-21-16869-2021, 2021. a
Kalapureddy, M. C. R., Kaskaoutis, D. G., Ernest Raj, P., Devara, P. C. S., Kambezidis, H. D., Kosmopoulos, P. G., and Nastos, P. T.: Identification of aerosol type over the Arabian Sea in the premonsoon season during the Integrated Campaign for Aerosols, Gases and Radiation Budget (ICARB), J. Geophys. Res.-Atmos., 114, https://doi.org/10.1029/2009JD011826, 2009. a
Kezoudi, M., Keleshis, C., Antoniou, P., Biskos, G., Bronz, M., Constantinides, C., Desservettaz, M., Gao, R. S., Girdwood, J., Harnetiaux, J., Kandler, K., Leonidou, A., Liu, Y., Lelieveld, J., Marenco, F., Mihalopoulos, N., Močnik, G., Neitola, K., Paris, J. D., Pikridas, M., Sarda-Esteve, R., Stopford, C., Unga, F., Vrekoussis, M., and Sciare, J.: The unmanned systems research laboratory (Usrl): A new facility for uav-based atmospheric observations, Atmosphere, 12, 1042, https://doi.org/10.3390/atmos12081042, 2021. a
Kezoudi, M., Papetta, A., Kandler, K., Ryder, C. L., Leonidou, A., Keleshis, C., Stopford, C., Thornberry, T., Mamouri, R.-E., Sciare, J., and Marenco, F.: Microphysical and Compositional Differences Between Saharan and Middle Eastern Dust Revealed by UAS Observations, Atmos. Chem. Phys., 26, 7361–7385, https://doi.org/10.5194/acp-26-7361-2026, 2026. a
Kim, D., Chin, M., Yu, H., Eck, T. F., Sinyuk, A., Smirnov, A., and Holben, B. N.: Dust optical properties over North Africa and Arabian Peninsula derived from the AERONET dataset, Atmos. Chem. Phys., 11, 10733–10741, https://doi.org/10.5194/acp-11-10733-2011, 2011. a, b
Kiriakidis, P., Gkikas, A., Papangelis, G., Christoudias, T., Kushta, J., Proestakis, E., Kampouri, A., Marinou, E., Drakaki, E., Benedetti, A., Rennie, M., Retscher, C., Straume, A. G., Dandocsi, A., Sciare, J., and Amiridis, V.: The impact of using assimilated Aeolus wind data on regional WRF-Chem dust simulations, Atmos. Chem. Phys., 23, 4391–4417, https://doi.org/10.5194/acp-23-4391-2023, 2023. a
Kok, J. F., Storelvmo, T., Karydis, V. A., Adebiyi, A. A., Mahowald, N. M., Evan, A. T., He, C., and Leung, D. M.: Mineral dust aerosol impacts on global climate and climate change, Nat. Rev. Earth Environ., 4, 71–86, https://doi.org/10.1038/s43017-022-00379-5, 2023. a
Korras-Carraca, M. B., Hatzianastassiou, N., Matsoukas, C., Gkikas, A., and Papadimas, C. D.: The regime of aerosol asymmetry parameter over Europe, the Mediterranean and the Middle East based on MODIS satellite data: evaluation against surface AERONET measurements, Atmos. Chem. Phys., 15, 13113–13132, https://doi.org/10.5194/acp-15-13113-2015, 2015. a
Kosmopoulos, P. G., Kazadzis, S., El-Askary, H., Taylor, M., Gkikas, A., Proestakis, E., Kontoes, C., and El-Khayat, M. M.: Earth-Observation-Based Estimation and Forecasting of Particulate Matter Impact on Solar Energy in Egypt, Remote Sens., 10, https://doi.org/10.3390/rs10121870, 2018. a
Kouklaki, D., Charalampous, G., Moustaka, A., Papetta, A., Herrero del Barrio, C., Chadoulis, R.-T., Aslanoğlu, S. Y., Herrero-Anta, S., Mytilinaios, M., Papadimitriou, N., Anyfanti, K., Spyrou, C., Meloni, D., Fragkos, K., Derimian, Y., Di Iorio, T., Mamouri, R.-E., Amiridis, V., Solomos, S., Kazadzis, S., and Fountoulakis, I.: Dust Radiative Effects and Impact on Energy Production over the Mediterranean Basin, EGUsphere [preprint], https://doi.org/10.5194/egusphere-2026-2775, 2026. a
Laj, P., Myhre, C. L., Riffault, V., Amiridis, V., Fuchs, H., Eleftheriadis, K., Petäjä, T., Salameh, T., Kivekäs, N., Juurola, E., Saponaro, G., Philippin, S., Cornacchia, C., Arboledas, L. A., Baars, H., Claude, A., Mazière, M. D., Dils, B., Dufresne, M., Evangeliou, N., Favez, O., Fiebig, M., Haeffelin, M., Herrmann, H., Höhler, K., Illmann, N., Kreuter, A., Ludewig, E., Marinou, E., Möhler, O., Mona, L., Murberg, L. E., Nicolae, D., Novelli, A., O’Connor, E., Ohneiser, K., Altieri, R. M. P., Picquet-Varrault, B., van Pinxteren, D., Pospichal, B., Putaud, J.-P., Reimann, S., Siomos, N., Stachlewska, I., Tillmann, R., Voudouri, K. A., Wandinger, U., Wiedensohler, A., Apituley, A., Comerón, A., Gysel-Beer, M., Mihalopoulos, N., Nikolova, N., Pietruczuk, A., Sauvage, S., Sciare, J., Skov, H., Svendby, T., Swietlicki, E., Tonev, D., Vaughan, G., Zdimal, V., Baltensperger, U., Doussin, J.-F., Kulmala, M., Pappalardo, G., Sundet, S. S., and Vana, M.: Aerosol, Clouds and Trace Gases Research Infrastructure (ACTRIS): The European Research Infrastructure Supporting Atmospheric Science, B. Am. Meteorol. Soc., 105, E1098–E1136, https://doi.org/10.1175/BAMS-D-23-0064.1, 2024. a
Logothetis, S.-A., Salamalikis, V., Gkikas, A., Kazadzis, S., Amiridis, V., and Kazantzidis, A.: 15-year variability of desert dust optical depth on global and regional scales, Atmos. Chem. Phys., 21, 16499–16529, https://doi.org/10.5194/acp-21-16499-2021, 2021. a, b
Mahowald, N., Albani, S., Kok, J. F., Engelstaeder, S., Scanza, R., Ward, D. S., and Flanner, M. G.: The size distribution of desert dust aerosols and its impact on the Earth system, Aeolian Res., 15, 53–71, https://doi.org/10.1016/j.aeolia.2013.09.002, 2014. a
Mahowald, N. M., Li, L., Vira, J., Prank, M., Hamilton, D. S., Matsui, H., Miller, R. L., Lu, P. L., Akyuz, E., Meidan, D., Hess, P., Lihavainen, H., Wiedinmyer, C., Hand, J., Alaimo, M. G., Alves, C., Alastuey, A., Artaxo, P., Barreto, A., Barraza, F., Becagli, S., Calzolai, G., Chellam, S., Chen, Y., Chuang, P., Cohen, D. D., Colombi, C., Diapouli, E., Dongarra, G., Eleftheriadis, K., Engelbrecht, J., Galy-Lacaux, C., Gaston, C., Gomez, D., González Ramos, Y., Harrison, R. M., Heyes, C., Herut, B., Hopke, P., Hüglin, C., Kanakidou, M., Kertesz, Z., Klimont, Z., Kyllönen, K., Lambert, F., Liu, X., Losno, R., Lucarelli, F., Maenhaut, W., Marticorena, B., Martin, R. V., Mihalopoulos, N., Morera-Gómez, Y., Paytan, A., Prospero, J., Rodríguez, S., Smichowski, P., Varrica, D., Walsh, B., Weagle, C. L., and Zhao, X.: AERO-MAP: a data compilation and modeling approach to understand spatial variability in fine- and coarse-mode aerosol composition, Atmos. Chem. Phys., 25, 4665–4702, https://doi.org/10.5194/acp-25-4665-2025, 2025. a
Marinou, E., Amiridis, V., Binietoglou, I., Tsikerdekis, A., Solomos, S., Proestakis, E., Konsta, D., Papagiannopoulos, N., Tsekeri, A., Vlastou, G., Zanis, P., Balis, D., Wandinger, U., and Ansmann, A.: Three-dimensional evolution of Saharan dust transport towards Europe based on a 9-year EARLINET-optimized CALIPSO dataset, Atmos. Chem. Phys., 17, 5893–5919, https://doi.org/10.5194/acp-17-5893-2017, 2017. a, b, c
Marinou, E., Tesche, M., Nenes, A., Ansmann, A., Schrod, J., Mamali, D., Tsekeri, A., Pikridas, M., Baars, H., Engelmann, R., Voudouri, K.-A., Solomos, S., Sciare, J., Groß, S., Ewald, F., and Amiridis, V.: Retrieval of ice-nucleating particle concentrations from lidar observations and comparison with UAV in situ measurements, Atmos. Chem. Phys., 19, 11315–11342, https://doi.org/10.5194/acp-19-11315-2019, 2019. a
Masoom, A., Kosmopoulos, P., Bansal, A., Gkikas, A., Proestakis, E., Kazadzis, S., and Amiridis, V.: Forecasting dust impact on solar energy using remote sensing and modeling techniques, Solar Energy, 228, 317–332, https://doi.org/10.1016/j.solener.2021.09.033, 2021. a, b
Mateos, D., Cachorro, V., Toledano, C., Burgos, M., Bennouna, Y., Torres, B., Fuertes, D., González, R., Guirado, C., Calle, A., and de Frutos, A.: Columnar and surface aerosol load over the Iberian Peninsula establishing annual cycles, trends, and relationships in five geographical sectors, Sci. Total Environ., 518–519, 378–392, https://doi.org/10.1016/j.scitotenv.2015.03.002, 2015. a
Middleton, N.: Impacts of sand and dust storms on food production, Environ. Res.: Food Systems, 1, 022003, https://doi.org/10.1088/2976-601X/ad63ac, 2024. a
Mona, L., Amiridis, V., Cuevas, E., Gkikas, A., Trippetta, S., Vandenbussche, S., Benedetti, A., Dagsson-Waldhauserova, P., Formenti, P., Haefele, A., Kazadzis, S., Knippertz, P., Laurent, B., Madonna, F., Nickovic, S., Papagiannopoulos, N., Pappalardo, G., García-Pando, C. P., Popp, T., Rodríguez, S., Sealy, A., Sugimoto, N., Terradellas, E., Vimic, A. V., Weinzierl, B., and Basart, S.: Observing Mineral Dust in Northern Africa, the Middle East, and Europe: Current Capabilities and Challenges ahead for the Development of Dust Services, B. Am. Meteorol. Soc., 104, E2223–E2264, https://doi.org/10.1175/BAMS-D-23-0005.1, 2023. a
Monteiro, A., Basart, S., Kazadzis, S., Votsis, A., Gkikas, A., Vandenbussche, S., Tobias, A., Gama, C., García-Pando, C. P., Terradellas, E., Notas, G., Middleton, N., Kushta, J., Amiridis, V., Lagouvardos, K., Kosmopoulos, P., Kotroni, V., Kanakidou, M., Mihalopoulos, N., Kalivitis, N., Dagsson-Waldhauserová, P., El-Askary, H., Sievers, K., Giannaros, T., Mona, L., Hirtl, M., Skomorowski, P., Virtanen, T. H., Christoudias, T., Di Mauro, B., Trippetta, S., Kutuzov, S., Meinander, O., and Nickovic, S.: Multi-sectoral impact assessment of an extreme African dust episode in the Eastern Mediterranean in March 2018, Sci. Total Environ., 843, 156861, https://doi.org/10.1016/j.scitotenv.2022.156861, 2022. a
Nickovic, S., Vukovic, A., Vujadinovic, M., Djurdjevic, V., and Pejanovic, G.: Technical Note: High-resolution mineralogical database of dust-productive soils for atmospheric dust modeling, Atmos. Chem. Phys., 12, 845–855, https://doi.org/10.5194/acp-12-845-2012, 2012. a
Nickovic, S., Vukovic, A., and Vujadinovic, M.: Atmospheric processing of iron carried by mineral dust, Atmos. Chem. Phys., 13, 9169–9181, https://doi.org/10.5194/acp-13-9169-2013, 2013. a
Papachristopoulou, K., Fountoulakis, I., Gkikas, A., Kosmopoulos, P. G., Nastos, P. T., Hatzaki, M., and Kazadzis, S.: 15-Year Analysis of Direct Effects of Total and Dust Aerosols in Solar Radiation/Energy over the Mediterranean Basin, Remote Sens., 14, https://doi.org/10.3390/rs14071535, 2022. a, b
Papanikolaou, C.-A., Papayannis, A., Gidarakou, M., Abdullaev, S. F., Ajtai, N., Baars, H., Balis, D., Bortoli, D., Bravo-Aranda, J. A., Collaud-Coen, M., de Rosa, B., Dionisi, D., Eleftheratos, K., Engelmann, R., Floutsi, A. A., Abril-Gago, J., Goloub, P., Giuliano, G., Gumà-Claramunt, P., Hofer, J., Hu, Q., Komppula, M., Marinou, E., Martucci, G., Mattis, I., Michailidis, K., Muñoz-Porcar, C., Mylonaki, M., Mytilinaios, M., Nicolae, D., Rodríguez-Gómez, A., Salgueiro, V., Shang, X., Stachlewska, I. S., Ștefănie, H. I., Szczepanik, D. M., Trickl, T., Vogelmann, H., and Voudouri, K. A.: Large-Scale Network-Based Observations of a Saharan Dust Event across the European Continent in Spring 2022, Remote Sens., 16, https://doi.org/10.3390/rs16173350, 2024. a
Papayannis, A., Amiridis, V., Mona, L., Tsaknakis, G., Balis, D., Bösenberg, J., Chaikovski, A., De Tomasi, F., Grigorov, I., Mattis, I., Mitev, V., Müller, D., Nickovic, S., Pérez, C., Pietruczuk, A., Pisani, G., Ravetta, F., Rizi, V., Sicard, M., Trickl, T., Wiegner, M., Gerding, M., Mamouri, R. E., D'Amico, G., and Pappalardo, G.: Systematic lidar observations of Saharan dust over Europe in the frame of EARLINET (2000–2002), J. Geophys. Res.-Atmos., 113, D10204, https://doi.org/10.1029/2007JD009028, 2008. a
Papetta, A.: UAV-based mineralogical composition during Fall Campaign 2021, Zenodo [data set], https://doi.org/10.5281/zenodo.20179843, 2026. a
Papetta, A., Solomos, S., and Spyrou, C.: METAL WRF Simulation results for major dust events in the Mediterranean, Zenodo [data set], https://doi.org/10.5281/zenodo.20179898, 2026. a
Papi, R., Attarchi, S., Darvishi Boloorani, A., and Neysani Samany, N.: Characterization of Hydrologic Sand and Dust Storm Sources in the Middle East, Sustainability, 14, https://doi.org/10.3390/su142215352, 2022. a
Pappalardo, G., Amodeo, A., Apituley, A., Comeron, A., Freudenthaler, V., Linné, H., Ansmann, A., Bösenberg, J., D'Amico, G., Mattis, I., Mona, L., Wandinger, U., Amiridis, V., Alados-Arboledas, L., Nicolae, D., and Wiegner, M.: EARLINET: towards an advanced sustainable European aerosol lidar network, Atmos. Meas. Tech., 7, 2389–2409, https://doi.org/10.5194/amt-7-2389-2014, 2014. a, b
Pérez, C., Nickovic, S., Pejanovic, G., Baldasano, J. M., and Özsoy, E.: Interactive dust-radiation modeling: A step to improve weather forecasts, J. Geophys. Res.-Atmos., 111, D16206, https://doi.org/10.1029/2005JD006717, 2006. a
Pérez García-Pando, C., Miller, R. L., Perlwitz, J. P., Rodríguez, S., and Prospero, J. M.: Predicting the mineral composition of dust aerosols: Insights from elemental composition measured at the Izaña Observatory, Geophys. Res. Lett., 43, 10520–10529, https://doi.org/10.1002/2016GL069873, 2016. a
Perlwitz, J. P., Pérez García-Pando, C., and Miller, R. L.: Predicting the mineral composition of dust aerosols – Part 2: Model evaluation and identification of key processes with observations, Atmos. Chem. Phys., 15, 11629–11652, https://doi.org/10.5194/acp-15-11629-2015, 2015. a
Pikridas, M. and Papetta, A.: EMEP dataset: Agia Marina Xyliatou, Cyprus, Zenodo [data set], https://doi.org/10.5281/zenodo.20179588, 2026. a
Proestakis, E.: A four-dimensional, multiyear, and near-global climate data record of the fine-mode (sub-micrometer in terms of diameter) and coarse-mode (super-micrometer in terms of diameter) components of atmospheric pure-dust. (Version Version 1), Zenodo [data set], https://doi.org/10.5281/zenodo.10389741, 2023. a
Proestakis, E., Amiridis, V., Marinou, E., Georgoulias, A. K., Solomos, S., Kazadzis, S., Chimot, J., Che, H., Alexandri, G., Binietoglou, I., Daskalopoulou, V., Kourtidis, K. A., de Leeuw, G., and van der A, R. J.: Nine-year spatial and temporal evolution of desert dust aerosols over South and East Asia as revealed by CALIOP, Atmos. Chem. Phys., 18, 1337–1362, https://doi.org/10.5194/acp-18-1337-2018, 2018. a
Proestakis, E., Gkikas, A., Georgiou, T., Kampouri, A., Drakaki, E., Ryder, C. L., Marenco, F., Marinou, E., and Amiridis, V.: A near-global multiyear climate data record of the fine-mode and coarse-mode components of atmospheric pure dust, Atmos. Meas. Tech., 17, 3625–3667, https://doi.org/10.5194/amt-17-3625-2024, 2024. a, b
Proestakis, E., Papachristopoulou, K., Georgiou, T., Chatoutsidou, S. E., Lazaridis, M., Gkikas, A., Fountoulakis, I., Tsikoudi, I., Petrakis, M. P., and Amiridis, V.: Atmospheric dust and air quality over large-cities and megacities of the world, Atmos. Chem. Phys., 25, 14777–14823, https://doi.org/10.5194/acp-25-14777-2025, 2025. a, b
Prospero, J. M.: Long-range transport of mineral dust in the global atmosphere: Impact of African dust on the environment of the southeastern United States, P. Natl. Acad. Sci. USA, 96, 3396–3403, https://doi.org/10.1073/pnas.96.7.3396, 1999. a
Querol, X., Alastuey, A., Rodriguez, S., Plana, F., Ruiz, C. R., Cots, N., Massagué, G., and Puig, O.: PM10 and PM2.5 source apportionment in the Barcelona Metropolitan area, Catalonia, Spain, Atmos. Environ., 35, 6407–6419, https://doi.org/10.1016/S1352-2310(01)00361-2, 2001. a
Querol, X., Tobías, A., Pérez, N., Karanasiou, A., Amato, F., Stafoggia, M., Pérez García-Pando, C., Ginoux, P., Forastiere, F., Gumy, S., Mudu, P., and Alastuey, A.: Monitoring the impact of desert dust outbreaks for air quality for health studies, Environ. Int., 130, 104867, https://doi.org/10.1016/j.envint.2019.05.061, 2019. a
Raptis, I.-P., Kazadzis, S., Amiridis, V., Gkikas, A., Gerasopoulos, E., and Mihalopoulos, N.: A Decade of Aerosol Optical Properties Measurements over Athens, Greece, Atmosphere, 11, https://doi.org/10.3390/atmos11020154, 2020. a
Rodríguez, S., Riera, R., Fonteneau, A., Alonso-Pérez, S., and López-Darias, J.: African desert dust influences migrations and fisheries of the Atlantic skipjack-tuna, Atmos. Environ., 312, 120022, https://doi.org/10.1016/j.atmosenv.2023.120022, 2023. a
Rolph, G., Stein, A., and Stunder, B.: Real-time Environmental Applications and Display sYstem: READY, Environ. Model. Softw., 95, 210–228, https://doi.org/10.1016/j.envsoft.2017.06.025, 2017. a
Ryder, C. L., Bézier, C., Dacre, H. F., Clarkson, R., Amiridis, V., Marinou, E., Proestakis, E., Kipling, Z., Benedetti, A., Parrington, M., Rémy, S., and Vaughan, M.: Aircraft engine dust ingestion at global airports, Nat. Hazards Earth Syst. Sci., 24, 2263–2284, https://doi.org/10.5194/nhess-24-2263-2024, 2024. a
Sinyuk, A., Holben, B. N., Eck, T. F., Giles, D. M., Slutsker, I., Korkin, S., Schafer, J. S., Smirnov, A., Sorokin, M., and Lyapustin, A.: The AERONET Version 3 aerosol retrieval algorithm, associated uncertainties and comparisons to Version 2, Atmos. Meas. Tech., 13, 3375–3411, https://doi.org/10.5194/amt-13-3375-2020, 2020. a
Solomos, S., Spyrou, C., Barreto, A., Rodríguez, S., González, Y., Neophytou, M. K. A., Mouzourides, P., Bartsotas, N. S., Kalogeri, C., Nickovic, S., Vukovic Vimic, A., Vujadinovic Mandic, M., Pejanovic, G., Cvetkovic, B., Amiridis, V., Sykioti, O., Gkikas, A., and Zerefos, C.: The Development of METAL-WRF Regional Model for the Description of Dust Mineralogy in the Atmosphere, Atmosphere, 14, https://doi.org/10.3390/atmos14111615, 2023. a, b, c, d, e, f
Stein, A. F., Draxler, R. R., Rolph, G. D., Stunder, B. J. B., Cohen, M. D., and Ngan, F.: NOAA HYSPLIT Atmospheric Transport and Dispersion Modeling System, B. Am. Meteorol. Soc., 96, 2059–2077, https://doi.org/10.1175/BAMS-D-14-00110.1, 2015. a
Stephens, G., Winker, D., Pelon, J., Trepte, C., Vane, D., Yuhas, C., L'Ecuyer, T., and Lebsock, M.: CloudSat and CALIPSO within the A-Train: Ten Years of Actively Observing the Earth System, B. Am. Meteorol. Soc., 99, 569–581, https://doi.org/10.1175/BAMS-D-16-0324.1, 2018. a
Tackett, J. L., Winker, D. M., Getzewich, B. J., Vaughan, M. A., Young, S. A., and Kar, J.: CALIPSO lidar level 3 aerosol profile product: version 3 algorithm design, Atmos. Meas. Tech., 11, 4129–4152, https://doi.org/10.5194/amt-11-4129-2018, 2018. a
Taylor, M., Kazadzis, S., Amiridis, V., and Kahn, R.: Global aerosol mixtures and their multiyear and seasonal characteristics, Atmos. Environ., 116, 112–129, https://doi.org/10.1016/j.atmosenv.2015.06.029, 2015. a
Teri, M., Gasteiger, J., Heimerl, K., Dollner, M., Schöberl, M., Seibert, P., Tipka, A., Müller, T., Aryasree, S., Kandler, K., and Weinzierl, B.: Pollution affects Arabian and Saharan dust optical properties in the eastern Mediterranean, Atmos. Chem. Phys., 25, 6633–6662, https://doi.org/10.5194/acp-25-6633-2025, 2025. a
Tesche, M., Ansmann, A., Müller, D., Althausen, D., Engelmann, R., Freudenthaler, V., and Groß, S.: Vertically resolved separation of dust and smoke over Cape Verde using multiwavelength Raman and polarization lidars during Saharan Mineral Dust Experiment 2008, J. Geophys. Res.-Atmos., 114, D13202, https://doi.org/10.1029/2009JD011862, 2009. a, b
Textor, C., Schulz, M., Guibert, S., Kinne, S., Balkanski, Y., Bauer, S., Berntsen, T., Berglen, T., Boucher, O., Chin, M., Dentener, F., Diehl, T., Easter, R., Feichter, H., Fillmore, D., Ghan, S., Ginoux, P., Gong, S., Grini, A., Hendricks, J., Horowitz, L., Huang, P., Isaksen, I., Iversen, I., Kloster, S., Koch, D., Kirkevåg, A., Kristjansson, J. E., Krol, M., Lauer, A., Lamarque, J. F., Liu, X., Montanaro, V., Myhre, G., Penner, J., Pitari, G., Reddy, S., Seland, Ø., Stier, P., Takemura, T., and Tie, X.: Analysis and quantification of the diversities of aerosol life cycles within AeroCom, Atmos. Chem. Phys., 6, 1777–1813, https://doi.org/10.5194/acp-6-1777-2006, 2006. a
Toledano, C., Cachorro, V. E., Berjon, A., de Frutos, A. M., Sorribas, M., de la Morena, B. A., and Goloub, P.: Aerosol optical depth and Ångström exponent climatology at El Arenosillo AERONET site (Huelva, Spain), Q. J. Roy. Meteor. Soc., 133, 795–807, https://doi.org/10.1002/qj.54, 2007. a
Valenzuela, A., Olmo, F., Lyamani, H., Antón, M., Titos, G., Cazorla, A., and Alados-Arboledas, L.: Aerosol scattering and absorption Angström exponents as indicators of dust and dust-free days over Granada (Spain), Atmos. Res., 154, 1–13, https://doi.org/10.1016/j.atmosres.2014.10.015, 2015. a
Vandenbussche, S. and De Maziere, M.: Vertical Profiles of Mineral Dust Aerosols from IASI (MAPIR algorithm version 5.11) (Version 3), Royal Belgian Institute for Space Aeronomy [data set], https://doi.org/10.18758/f7el2zbr, 2025. a
Vandenbussche, S., Biskas, C., Koukouli, M.-E., Kazadzis, S., and De Mazière, M.: The mineral aerosol profiling from infrared radiances version 5.1 algorithm and its evaluation, Atmos. Meas. Tech., 19, 4889–4922, https://doi.org/10.5194/amt-19-4889-2026, 2026. a
Winker, D. M., Pelon, J., Coakley, J. A., Ackerman, S. A., Charlson, R. J., Colarco, P. R., Flamant, P., Fu, Q., Hoff, R. M., Kittaka, C., Kubar, T. L., Le Treut, H., Mccormick, M. P., Mégie, G., Poole, L., Powell, K., Trepte, C., Vaughan, M. A., and Wielicki, B. A.: The CALIPSO Mission: A Global 3D View of Aerosols and Clouds, B. Am. Meteorol. Soc., 91, 1211–1230, https://doi.org/10.1175/2010BAMS3009.1, 2010. a, b
Zeb, B., Alam, K., Khan, R., Ditta, A., Iqbal, R., Elsadek, M. F., Raza, A., and Elshikh, M. S.: Characteristics and optical properties of atmospheric aerosols based on long-term AERONET investigations in an urban environment of Pakistan, Sci. Rep., 14, 8548, https://doi.org/10.1038/s41598-024-58981-0, 2024. a
Zender, C. S., Miller, R. L. L., and Tegen, I.: Quantifying mineral dust mass budgets:Terminology, constraints, and current estimates, Eos, Transactions American Geophysical Union, 85, 509–512, https://doi.org/10.1029/2004EO480002, 2004. a
Zhang, Z., Li, J., Che, H., Dong, Y., Dubovik, O., Eck, T., Gupta, P., Holben, B., Kim, J., Lind, E., Saud, T., Tripathi, S. N., and Ying, T.: Long-term trends in aerosol properties derived from AERONET measurements, Atmos. Chem. Phys., 25, 4617–4637, https://doi.org/10.5194/acp-25-4617-2025, 2025. a
Zittis, G., Almazroui, M., Alpert, P., Ciais, P., Cramer, W., Dahdal, Y., Fnais, M., Francis, D., Hadjinicolaou, P., Howari, F., Jrrar, A., Kaskaoutis, D. G., Kulmala, M., Lazoglou, G., Mihalopoulos, N., Lin, X., Rudich, Y., Sciare, J., Stenchikov, G., Xoplaki, E., and Lelieveld, J.: Climate Change and Weather Extremes in the Eastern Mediterranean and Middle East, Rev. Geophys., 60, e2021RG000762, https://doi.org/10.1029/2021RG000762, 2022. a
- Abstract
- Introduction
- Data and Methodology
- Event Identification
- Results
- Discussion
- Conclusions
- Appendix A: ACTRIS/EARLINET aerosol high-power lidars
- Appendix B: Atmospheric dust and the LIVAS data record, CALIPSO
- Appendix C: MIDAS Maps
- Appendix D: IASI-MAPIR
- Appendix E: AERONET observations
- Appendix F: Evidence of aerosol mixing during the Middle Eastern event
- Appendix G: METAL-WRF model evaluation
- Data availability
- Author contributions
- Competing interests
- Disclaimer
- Acknowledgements
- Financial support
- Review statement
- References
- Abstract
- Introduction
- Data and Methodology
- Event Identification
- Results
- Discussion
- Conclusions
- Appendix A: ACTRIS/EARLINET aerosol high-power lidars
- Appendix B: Atmospheric dust and the LIVAS data record, CALIPSO
- Appendix C: MIDAS Maps
- Appendix D: IASI-MAPIR
- Appendix E: AERONET observations
- Appendix F: Evidence of aerosol mixing during the Middle Eastern event
- Appendix G: METAL-WRF model evaluation
- Data availability
- Author contributions
- Competing interests
- Disclaimer
- Acknowledgements
- Financial support
- Review statement
- References