
the Creative Commons Attribution 4.0 License.
the Creative Commons Attribution 4.0 License.
 | 01 Sep 2026
Aircraft observations suggest an important contribution of methanesulfonic and sulfuric acids to tropical Indo-Pacific aerosol
Hannah Klebach

Martin Heinritzi
Katharina Kaiser
Lisa Beck
Samuel Ruhl
Samira Atabakhsh
Nirvan Bhattacharyya
Lucía Caudillo-Plath
Philipp Joppe
Thomas Klimach
Peter Lloyd
Mira Pöhlker
Ulrich Pöschl
Sarah Richter
Douglas M. Russell
Johannes Schneider
Marcel Zauner-Wieczorek
Joachim Curtius
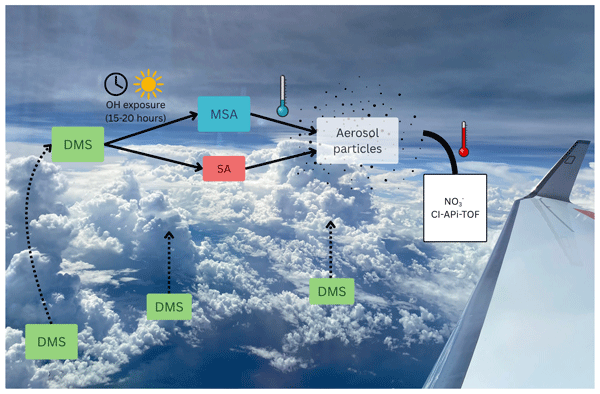
In the marine environment dimethyl sulfide (DMS) is the most abundant sulfur-containing trace gas. It serves as a key precursor to new particle formation and growth via its oxidation products, sulfuric acid (SA, H2SO4) and methanesulfonic acid (MSA, CH3SO3H). Here, we present measurements of MSA and SA in the Indo-Pacific region during the CAFE-Pacific (Chemistry of the Atmosphere Field Experiment in the Pacific) campaign in January–February 2024. The measurements were conducted on board the HALO (High Altitude and LOng-range) aircraft using nitrate mass spectrometry. We observe gas-phase concentrations of up to 4×107 cm−3 MSA and 6×107 cm−3 SA in the marine boundary layer. In the lower free troposphere, the MSA SA ratio increases with altitude in agreement with the temperature-dependent DMS oxidation. At higher altitudes, adiabatic heating and subsequent evaporation of acidic particles within the instrument inlet enable the detection of both particle- and gas-phase MSA and SA. A detailed analysis of two flights shows that marine deep convection can lead to DMS transport from the boundary layer to the upper troposphere and subsequent particle formation and growth after approximately 10–20 h of OH exposure aligning with the DMS lifetime determined by kinetic modelling. We frequently observe MSA concentrations significantly exceeding those of SA, suggesting that free-tropospheric particles – particularly over the Indo-Pacific Warm Pool – may be dominated by MSA. Our results imply that marine convection represents an important source of airborne particles in the upper tropical troposphere, one of the most pristine regions of Earth's atmosphere.
- Article
(23922 KB) - Full-text XML
- BibTeX
- EndNote


High concentrations of small particles in the upper tropical troposphere have been observed during previous aircraft measurements over both oceanic and continental regions (Brock et al., 1995; Clarke and Kapustin, 2002; Andreae et al., 2018; Williamson et al., 2019), which indicates a strong source of nucleation that cannot be captured accurately by current models (Williamson et al., 2019; He et al., 2026). A likely explanation for this shortcoming in models is an incomplete representation of nucleation mechanisms or an inaccurate description of precursor emissions and their transport within this region. Recent aircraft and laboratory studies have confirmed the importance of isoprene oxidation products for particle formation above the tropical rainforests (Curtius et al., 2024; Shen et al., 2024). Deep convective systems transport isoprene from the boundary layer to the upper troposphere, where high actinic fluxes enable efficient oxidation and formation of low-volatility compounds, which nucleate at cold upper tropospheric conditions. These particles might subsequently be distributed over vast areas and transported downwards where they can act as cloud condensation nuclei (CCN) (Hernández Pardo et al., 2026).
However, the majority of the tropics is not covered by rainforests but by oceans, with limited isoprene emissions, and other chemical mechanisms are therefore needed to explain the observations. Measurements of precursor gases in these pristine regions are very sparse and the composition of small particles remains unknown.
In the marine environment, dimethyl sulfide (DMS, (CH3)2S) is expected to be one of the most abundant volatile organic compounds (VOCs) with an estimated annual flux of 16–24 Tg S yr−1 (Bock et al., 2021). Main oxidation products of DMS are SO2, sulfuric acid (SA), methanesulfonic acid (MSA) and hydroperoxymethyl thioformate (HPMTF). The initial oxidation step occurs mostly by OH, via H-abstraction or OH-addition. Regionally NO3 and halogen species, predominantly BrO, can contribute significantly to the oxidation (Tashmim et al., 2024; Jongebloed et al., 2025). The initial DMS oxidation is followed by multiple steps, including reactions with O3, NOx, HO2,RO2 and photochemical reactions. The exact pathways and reaction rates are still an active area of research with multiple schemes differing in complexity proposed (e.g. Chen et al., 2018; Shen et al., 2022; Fung et al., 2022; Tashmim et al., 2024; Jacob et al., 2024).
One important group of intermediates are the CH3SOx radicals (). Their relative abundance and further reactions depend on temperature, NOx, HOx, O3 and RO2 concentrations (Jacob et al., 2024). The key competition is between pathways that keep the carbon-sulfur skeleton intact long enough to form MSA, and pathways that break it down toward SO2 or SA (via SO3).
Temperature plays an important role in the MSA SA ratio from DMS oxidation. At cold temperatures the addition pathway is favoured over the abstraction pathway (Cala et al., 2023; Tashmim et al., 2024). Additionally, decreased thermal decomposition reduces fragmentation towards SO3 and SO2. Overall, this leads to an enhanced MSA production at cold temperatures resulting in higher yields at high latitudes (Shen et al., 2022; Cala et al., 2023; Tashmim et al., 2024).
In addition to the gas-phase mechanism, DMS is also oxidised in the aqueous phase. This pathway contributes substantially to total atmospheric MSA (predominantly present as methanesulfonate, MS−, in cloud and aerosol water) and DMS-derived sulfate, especially in cloud-processed marine air (Chen et al., 2018; Hoffmann et al., 2016; Jongebloed et al., 2025). HPMTF is efficiently scavenged by cloud droplets, which leads to enhanced sulfate formation and a decrease in gas-phase SO2 (Novak et al., 2021).
Ambient measurements suggest that MSA can evaporate from the particle phase back into the gas phase, a process likely dependent on temperature, ambient relative humidity (RH) and aerosol pH (Zhang et al., 2014; Miljevic et al., 2025). Similar to isoprene, DMS can be transported in deep convective systems to the upper tropical troposphere (Thornton et al., 1997), although direct measurements in these high altitudes remain sparse.
While SA is a crucial compound in almost all global aerosol models, MSA is rarely considered due to its lower nucleation potential and limited data availability. However, it has been shown to nucleate with ammonia (Johnson and Jen, 2023) or amines (Chen et al., 2016) and is a major contributor to particle growth in the boundary layer (Beck et al., 2021; Loh et al., 2023). Aircraft studies in the American tropics found acidic sulfate particles associated with convection in the Pacific and related these to gas-phase oxidation of transported DMS. These air masses also contained high concentrations of MSA in the particle phase (Froyd et al., 2009). However, the particle composition was only determined for larger particles above 200 nm sampled likely days or weeks after their initial formation.
The CAFE (Chemistry of the Atmosphere Field Experiment) campaigns conducted with the HALO (High Altitude and LOng range) research aircraft operated by the German Aerospace Centre (Deutsches Zentrum für Luft- und Raumfahrt, DLR) aimed to investigate the tropical atmosphere in different regions of the Earth with a focus on the upper troposphere. The final campaign, CAFE-Pacific (January and February 2024), was based in Cairns, Australia, probing the Indo-Pacific during the wet season. A special focus was placed on the Indo-Pacific Warm Pool, a region with particularly high ocean surface temperatures that fuel intense convection (Liu and Zipser, 2015; de Deckker, 2016). It is characterised by pristine marine air masses with low ozone, NOx, and OH values (Nussbaumer et al., 2025). Ambient measurements in the area are sparse, especially in the free troposphere.
Here we present MSA and SA measurements by a nitrate Chemical Ionisation – Atmospheric Pressure interface – Time Of Flight mass spectrometer (CI-APi-TOF) performed during CAFE-Pacific. At lower altitudes, these represent gas-phase values, whereas at higher altitudes particles evaporate in the inlet, allowing combined gas- and particle-phase concentrations to be reported.
2.1 Nitrate CI-APi-TOF
The SCORPION (Switchable CORona Powered ION Source) instrument is a CI-APi-TOF that uses a corona discharge to produce nitrate ions which cluster with or ionise the target molecules in the sample flow (Zauner-Wieczorek et al., 2022; Curtius et al., 2024). This method has been shown to efficiently measure compounds like SA or highly oxidised organic molecules (Jokinen et al., 2012; Kürten et al., 2011; Simon et al., 2020). SCORPION was specifically designed for aircraft operation: The ion source remains at a constant pressure of 200 mbar while the inlet pressure can vary from 1000 mbar at ground level to 200 mbar or less in the upper troposphere. A core sampling system with a total sampling flow of 20 L min−1 minimises wall losses and an efficient flow system allows a very low consumption of synthetic air. A schematic drawing of SCORPION can be found in Fig. A1 in the Appendix.
The instrument is calibrated with a setup similar to the one described by Kürten et al. (2012). SA is generated through the oxidation of SO2 by OH radicals formed via photolysis of water vapour. The SA produced by the calibration unit is modelled based on the gas mixing ratios, reaction rate coefficients and light intensity. The calibration was performed at different pressures and hence yields a pressure-dependent calibration equation. The same equation is applied for SA and MSA since both compounds have a similar structure and are assumed to react with at the kinetic limit based on cluster enthalpy calculations by Shen et al. (2022). During every flight, at least one 10 min background measurement is performed during which only synthetic air is measured. The concentration throughout this background period is then subtracted from the ambient data. For SA and MSA, this background is usually 1–2 ×106 cm−3. Lastly, a temperature-dependent loss correction is applied accounting for wall losses to the inlet line (Gormley and Kennedy, 1948). The systematic uncertainty is estimated to be a factor of two, resulting mainly from the uncertainty in the calibration factor.
The background measurements allow the calculation of the lower limit of detection using LOD =3σC, where σ is the standard deviation of all background measurements combined, averaged to 1 min. C is the calibration factor, which is pressure-dependent. Hence the LOD changes with altitude from values of 3–4 ×106 cm−3 at ground level to 1–2 ×106 cm−3 (2–3 µg m−3) in the upper troposphere.
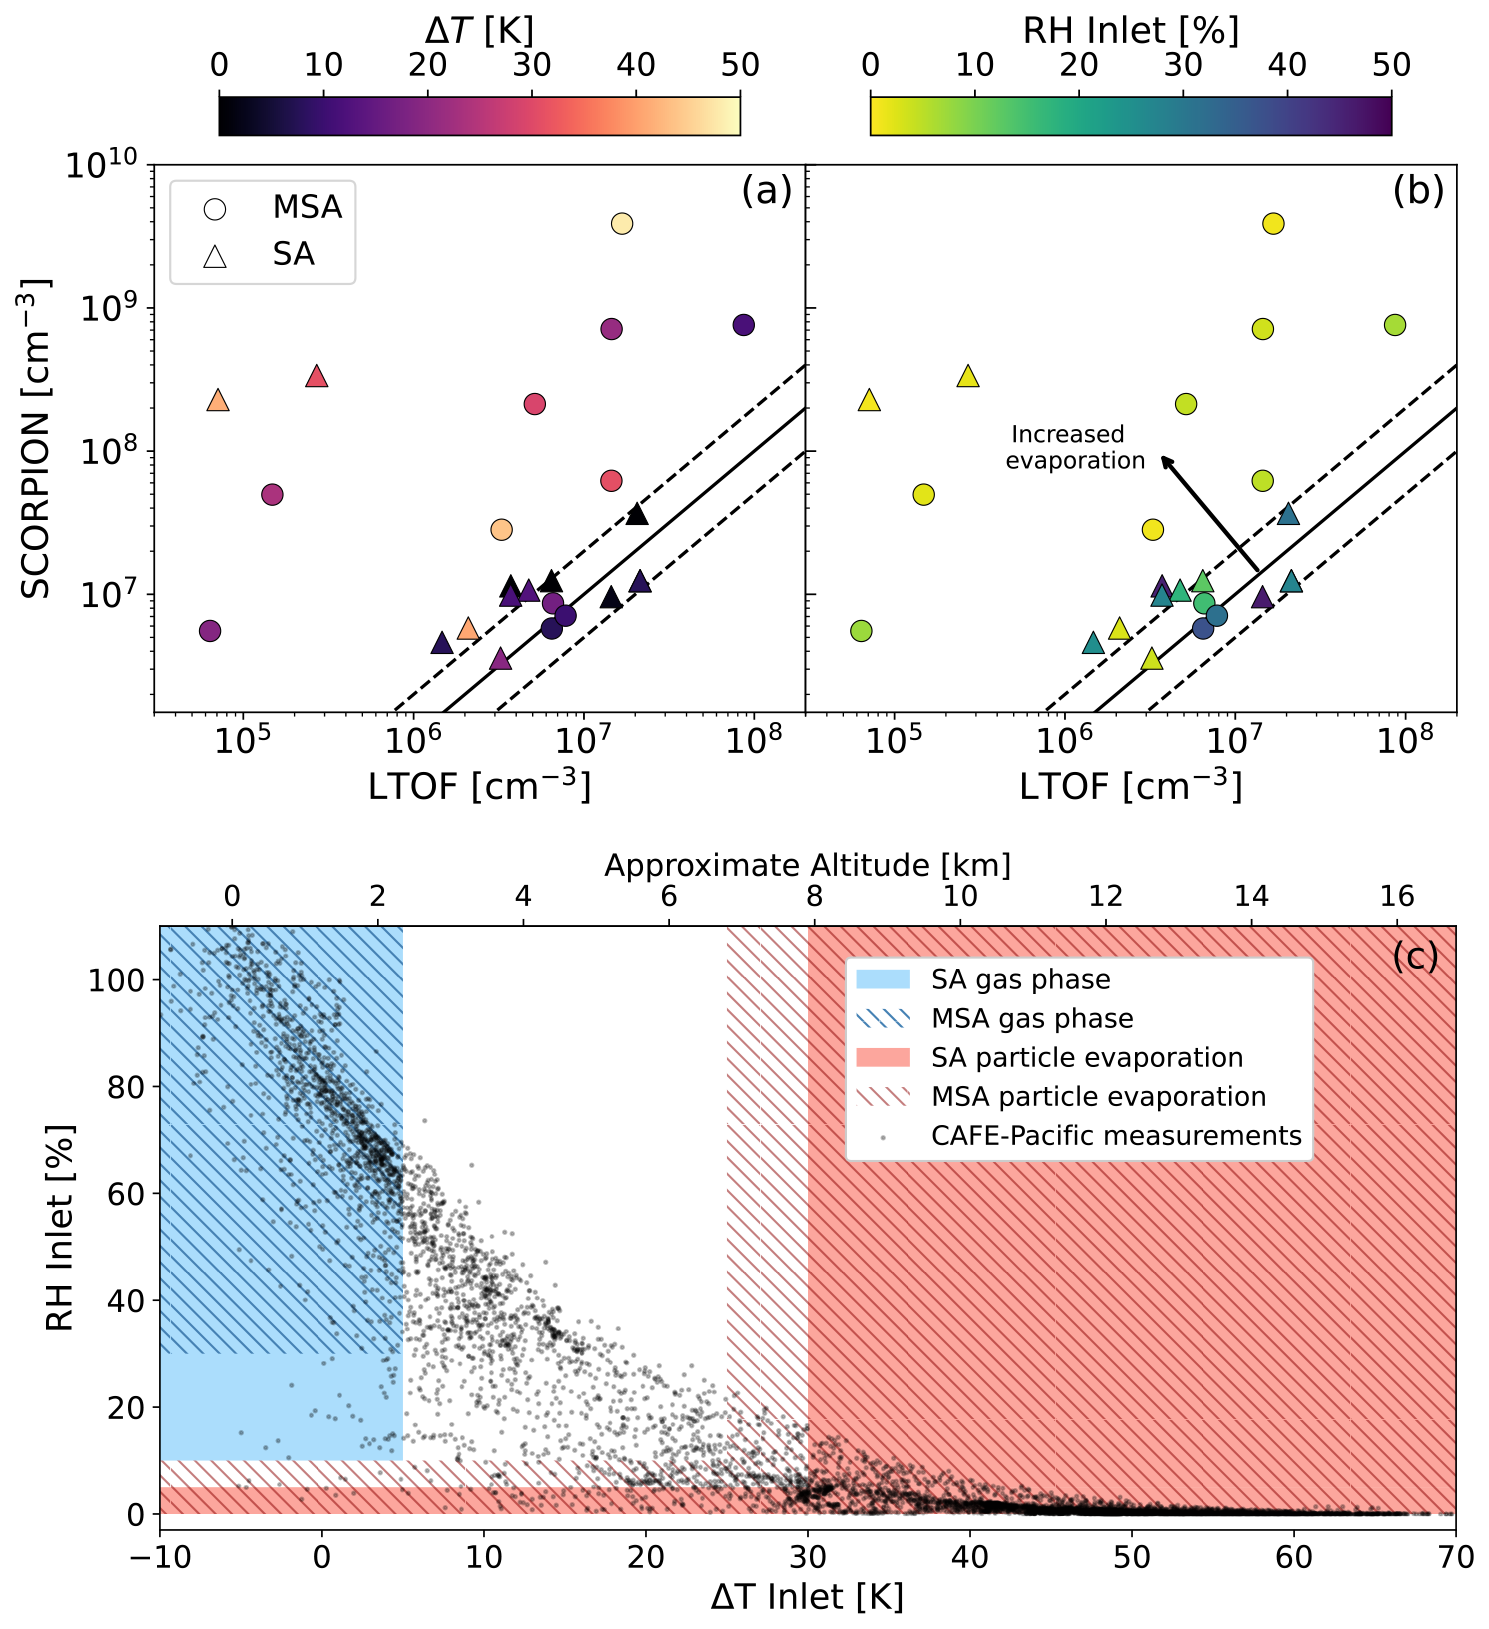
Figure 1CLOUD chamber comparison (a–b) of SCORPION (HALO CI-APi-TOF) with another nitrate CI-APi-TOF (LTOF) coloured by ΔT (a) and RH in the inlet (b). Data points close to the 1:1 line indicate both instruments measuring gas phase while points significantly above the 1:1 show that the values measured by SCORPION are influenced by particle evaporation. The latter is the case for large temperature differences and low RH in the inlet. The absolute values detected by SCORPION additionally depend on the aerosol mass in the chamber. In (c) we use the CLOUD measurements to categorize the CAFE-Pacific data into different regimes as a function of inlet RH (y-axis) and inlet-ambient temperature difference (x-axis). Black points indicate 1 min measurement averages during CAFE-Pacific flights. Blue regions indicate gas phase measurement of SA (solid) and MSA (striped), while red regions indicate total measurement. Outside of these regions, inlet evaporation is not constrained and this data is excluded from analysis. At low altitudes the relative change in pressure in the inlet is minimal and the ambient temperature close to the one in the inlet.
Evaporation in the inlet
A crucial part of the measurement setup is the aircraft inlet. It consists of a 1.8 m long stainless steel tube with an inner diameter of 20.5 mm and two bends with radii of 120 and 500 mm. The sampling probe outside the aircraft was specifically designed to reduce wall losses by slowing down the air by a factor of 10 before sampling (Broch, 2012). However, this increases the pressure in the inlet line and leads to an adiabatic heating and consequently a decrease in relative humidity. This heating is weak at low altitudes where the relative pressure change is small but can lead to a temperature difference between ambient and inlet (ΔT) of up to 70 K at high altitudes, where the outside temperature is low and the relative change in pressure is high. Due to the long inlet line with a residence time between 0.45 and 1.7 s, this can influence sampled particles and, in some cases, lead to their evaporation.
To investigate this effect, SCORPION was compared to another nitrate CI-APi-TOF (LTOF) during experiments at the CERN CLOUD chamber in 2024. Figure 1a and b show averaged data for different experimental conditions, the full data set can be seen in Fig. A2 in the Appendix. The chamber operates at 5 mbar above ambient pressure. Despite this, the temperature difference between the cooled chamber (down to 223 K) and the instrument creates conditions comparable to those experienced during aircraft measurements. As the sample flow of the LTOF does not experience heating due to a much shorter inlet and better insulation, it can be used as a reference instrument measuring solely gas-phase concentrations. A set of different experiments were conducted including SA, MSA and organic vapours. Some experiments involved particle formation from precursors in the chamber while others used a separate flow tube system to inject larger particles directly into the chamber. This allowed testing of the instrument during a wide variety of conditions and particle compositions.
Some general points should be noted before analysing the results in more depth: SCORPION was connected to the CLOUD chamber using a fairly long inlet with three almost 90° bends, which was unavoidable due to the geometry of the instrument and the chamber, and led to increased wall losses. Additionally, the instrument performance during the chamber measurements was generally poorer and more unstable than during aircraft operation. This was caused by fluctuations in the ion source pressure and contamination from the large particle loadings in the chamber. This resulted in a higher instrumental background and increased noise levels.
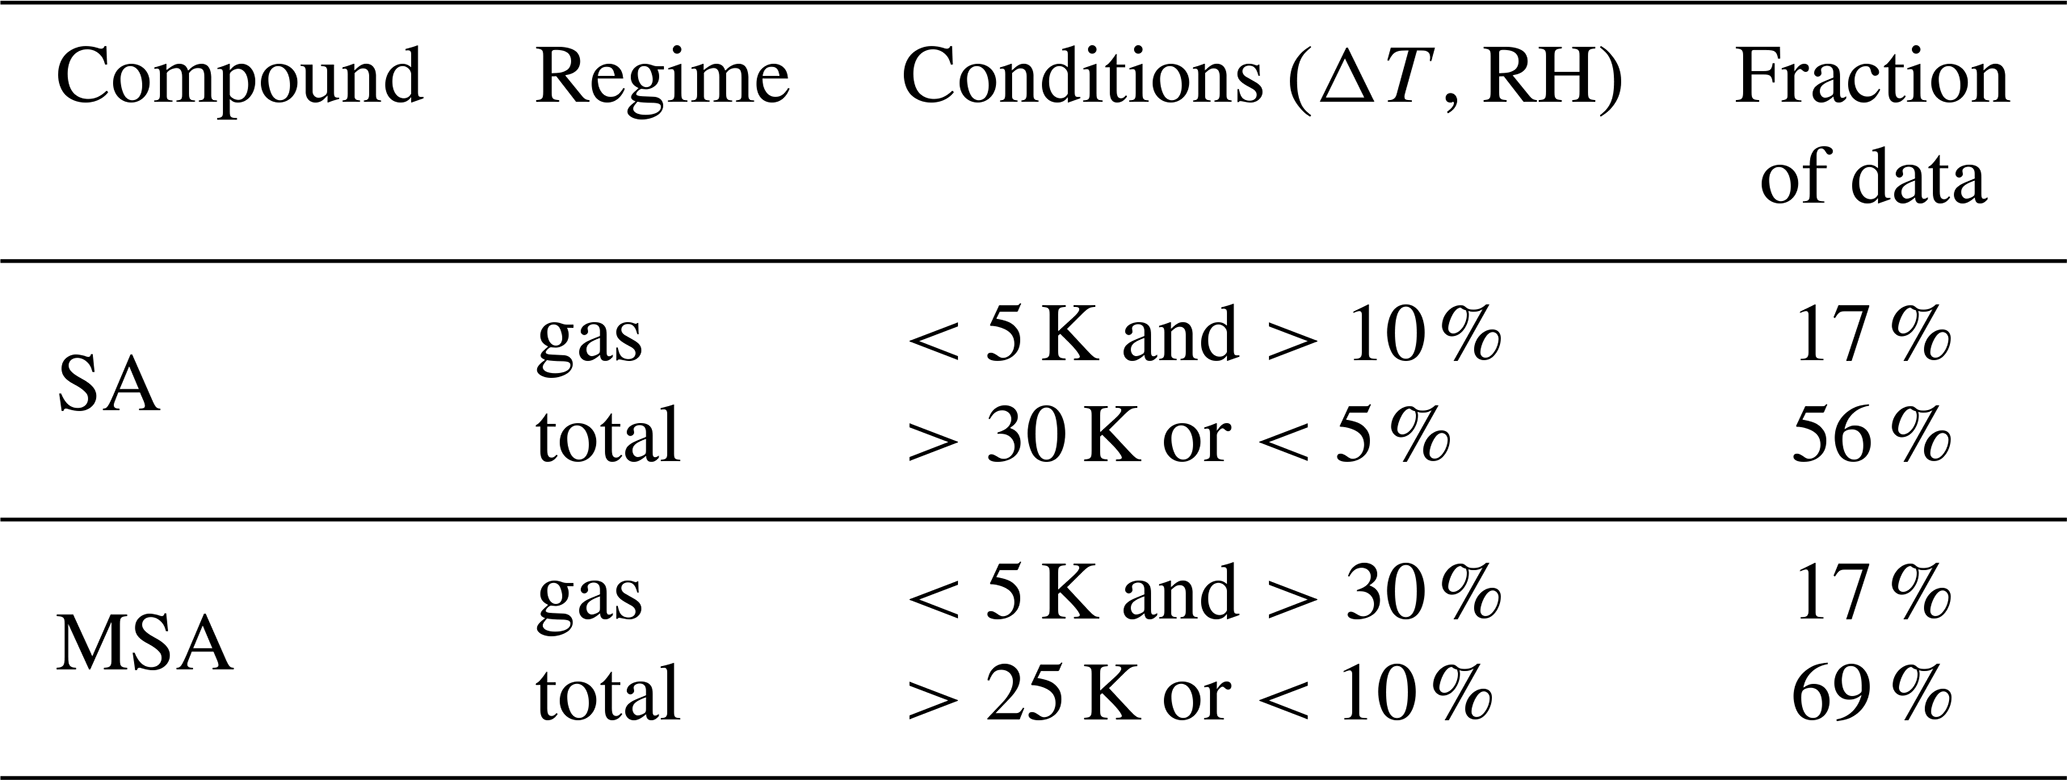
Table 1Definition of different measurement regimes for MSA and SA during CAFE-Pacific. Whether gas or total (gas and evaporated particle) phase is measured is defined by the temperature difference between ambient and inlet (ΔT) and the RH in the inlet.
Two areas of operation can be identified in Fig. 1a and b. For a temperature difference below approximately 10 K, most of the measured points agree within a factor of two between both instruments. Deviations can be explained by the instrumental setup and conditions as explained above, as well as uncertainties in the calibration factor of the two instruments. For larger temperature differences of 30 K or more, the SCORPION measurements lie well above the 1:1 line and up to four orders of magnitude above the gas-phase concentrations (Fig. A2), suggesting that significant evaporation occurs in the inlet. Whether this evaporation is caused by the increase in temperature or the associated decrease in RH, cannot be determined at this point. Sparse MSA measurements indicate that it already evaporates at lower values of ΔT than SA, which is consistent with the higher vapour pressure of MSA (Hodshire et al., 2019). Absolute temperature undoubtedly influences the volatility of MSA and SA; however, evaporation in the inlet is primarily driven by the rapid change in conditions. Therefore, the temperature difference serves as a more relevant indicator of this effect.
For low enough RH and high enough values of ΔT we expect the evaporation to be complete. An experiment with injection of pure SA particles at <0.5 % RH in the inlet is shown in Fig. A3 in the Appendix. The comparison between the SA mass concentration measured by SCORPION and the mass calculated from the particle size distribution shows almost identical values, hence confirming the total evaporation of the particles.
Note that the pressure drop in the ion source from ambient conditions to 200 mbar could also contribute to the observed evaporation. However, this effect is expected to be small compared to the heating in the inlet since we observe evaporation at high altitudes, where the pressure difference between the inlet and the ion source is below 50 mbar. We can confirm evaporation is the primary SA source since the observed SA concentrations would result in unrealistically high nucleation rates >100 at temperatures typical for the upper troposphere (Dunne et al., 2016), which were not observed during the campaign.
The previous findings only apply to acidic particles. Experiments in the presence of ammonia show that no evaporation of SA in the inlet is observed for neutralised or partially neutralised particles (Fig. A4). This is caused by the increased presence of the acid in the ionic form, which strongly increases the energy required for a phase transition to the gas phase. The neutralisation state of particles below 40 nm could not be measured during CAFE-Pacific. For particles above this diameter the composition measurements remain highly uncertain due to the very low mass concentrations, especially of ammonium (Figs. A5 and A6). Therefore, the values shown in the subsequent analysis represent lower limits for the total MSA and SA concentrations. However, outside the Asian monsoon region, very low ammonia concentrations are expected in the upper troposphere (Froyd et al., 2009; Hoepfner et al., 2016; Nair and Yu, 2020; Johansson et al., 2024) and large parts of the measurement region show the lowest impact of anthropogenic NH3 on CCN concentrations globally (Xenofontos et al., 2025).
The observations during the chamber experiments allow us to categorise the measurements during the aircraft campaign into three categories: gas phase (no evaporation), total (definite evaporation) and undefined (potential evaporation). The particle-phase measurements are a combined measurement of gas and particle phase since we cannot distinguish between evaporated particles and gas phase. However, the concentrations are dominated by evaporated particles even at relatively low particle number concentrations. For example, as few as 10–20 pure MSA particles cm−3 with diameters of 60 nm or larger are sufficient to produce MSA concentrations that exceed typical gas-phase MSA levels (see Fig. A7 in the Appendix). The classification is done using the ambient temperature and the temperature in the inlet line, as well as the RH. The conditions derived from the chamber experiments are used to categorise the ambient measurements according to Table 1 and as shown in Fig. 1c. The majority of data points fall into the total acid category due to the focus of the campaign on high-altitude measurements.
For data that do not fall into either category, we cannot confidently assess evaporation, and they are therefore excluded from the analysis. Approximately 27 % of SA data and 15 % of MSA data are excluded, primarily from mid-tropospheric observations (3–7 km), whereas measurements in the boundary layer and upper troposphere can be reliably interpreted.
Since it was not possible to reproduce the full phase space of ΔT, RH and particle mass in the chamber experiments and the impact of bases remains largely unquantified in the aircraft measurements, we cannot fully rule out incomplete evaporation. This would primarily impact measurements in the middle troposphere where ΔT is lower and the RH in the inlet higher, which could lead to an underestimation of acid concentrations there. The values reported here therefore represent a lower limit of total MSA and SA.
2.2 Additional data sources and methods
2.2.1 Aircraft instrumentation
The HALO aircraft is operated by DLR and has conducted multiple research campaigns worldwide (Krautstrunk and Giez, 2012). During the CAFE-Pacific campaign, 17 research flights (RF) were performed from Cairns, each lasting 6–12 h. Flight altitudes ranged from the boundary layer up to 14 km, covering an extensive area above Australia, Papua New Guinea and the Indo-Pacific Ocean. An overview of all flight paths is provided in Appendix Fig. A8.
The large variety of instruments on board allows a detailed study of atmospheric conditions from physical parameters to chemical trace gas analysis. The position and altitude of the aircraft, as well as the ambient temperature, are recorded by the BAsic HALO Measurement And sensor System (BAHAMAS) developed and operated by the DLR (Giez et al., 2022). The O3 concentration is measured by the Fast AIRborne Ozone (FAIRO) instrument using UV photometry and chemiluminescence detection (Zahn et al., 2012).
Apart from the previously described SCORPION instrument, data from the Compact – Time of Flight – Aerosol Mass Spectrometer (C-TOF-AMS) are used in this analysis (Drewnick et al., 2005; Schulz et al., 2018). The C-TOF-AMS flash vaporises the particles and measures the composition using time-of-flight mass spectrometry. The data are usually separated in sulfate (), ammonium (), nitrate () and organic compounds given in µg m−3. The C-TOF-AMS can measure particles in a size range of approximately 40 to 800 nm and the LOD for sulfate is around 0.01 µg m−3 for a time resolution of 1 min. The systematic uncertainty amounts to 30 % (Canagaratna et al., 2007; Bahreini et al., 2009; Middlebrook et al., 2012).
Particle number concentrations and size distributions are determined by a combination of two instruments: The FASD instrument consists of 10 ultrafine Condensation Particle Counters (CPC) (Curtius et al., 2024; Riese et al., 2025) with different fixed cut-off diameters and measures particles in the range of 2–20 nm. The larger particles between 60 and 1000 nm are measured by an Ultra-High Sensitivity Aerosol Spectrometer (UHSAS) and can be integrated over the respective diameter range to obtain a cumulative size distribution similar to the FASD data. Particle number concentrations in different size intervals are subsequently obtained by taking the difference between cumulative concentrations at the corresponding diameter thresholds. For research flight number 8 (RF08), these instruments were not operating, hence an Optical Particle Counter (OPC) is used for particles above 250 nm diameter.
It is important to note here that the particle measurements do not experience the same adiabatic heating as SCORPION. Nevertheless, the inlet lines in the aircraft are rather long and only partially insulated, which does lead to a significant temperature increase between the ambient and the instrument in the upper troposphere. Our chamber studies suggest that this could be sufficient to evaporate acidic particles in these instruments, which might lead to a decrease in measured size or in absolute concentration. We are currently not able to quantify this effect, but it should certainly be considered in future campaigns when designing inlets or analysing data collected in the free troposphere.
2.2.2 Model and satellite data
To analyse the origin of the measured air masses, the HYSPLIT model (Version 5.2.1) developed by the National Oceanic and Atmospheric Administration (NOAA) was used. This is a Lagrangian single particle model as described in detail by Stein et al. (2015); Draxler and Hess (1997); Draxler (1998, 1999). The meteorological data was obtained from the National Oceanic and Atmospheric Administration (NOAA Global Forecast System, 2026) with a spatial resolution of 0.25°. The trajectories were calculated backwards from the flight path of the aircraft every minute. The altitude is given in meters above ground and the mixing depth is calculated by the meteorological model. The ability of the model to resolve small scale convective transport correctly is limited due to the grid size of the underlying meteorological data. At high altitudes, the trajectories are used to estimate the last contact with a convective cell.
The Himawari satellite, a geostationary weather satellite operated by the Japan Meteorological Agency, is utilized for the identification of convective clouds. The data used here is part of the Himawari 8/9 cloud type package accessed via NCI Australia (Bureau Of Meteorology, 2024). Each data point is assigned to one of 15 possible cloud types based on different threshold values in the optical channels (Kerdraon and Fontaine, 2021). The cloud type associated with deep convection is “very high opaque cloud”, which represents the core of the convective system. This parameter is chosen since it is available during day and night and in the full coverage of the satellite.
Data from the Copernicus Atmospheric Monitoring Service (CAMS) global reanalysis (EAC4) was used to estimate average DMS mixing ratios in the measurement region during January and February 2024 (Inness et al., 2019). Chlorophyll concentrations during the same period were obtained from the E.U. Copernicus Marine Service Information as part of the Global Ocean Biogeochemistry Analysis and Forecast.
Gas-phase chemistry was simulated with the community atmospheric chemistry box model, CAABA, coupled to the Module Efficiently Calculating the Chemistry of the Atmosphere (MECCA) (Sander et al., 2019), version 4.7.5. CAABA provides a zero-dimensional framework for integrating detailed chemistry under prescribed meteorological and radiative conditions. MECCA solves the coupled system of ordinary differential equations for all chemical species using the KPP Rosenbrock solvers, which are optimized for stiff atmospheric chemistry systems. Gas-phase reaction chemistry followed the standard MECCA mechanism for the troposphere as implemented in CAABA/MECCA. This mechanism includes on the order of 100–150 gas-phase species and several hundred reactions, providing a chemically comprehensive description of HOx–NOx–VOC–O3 interactions suitable for global and upper-tropospheric applications.
To adequately represent marine sulfur chemistry, the default DMS scheme was extended following the recent mechanistic work of Shen et al. (2022) and Jacob et al. (2024). The Shen mechanism is based on MCMv3.3.1 as well as reactions from Hoffmann et al. (2016) and other recent publications. It was validated against CLOUD chamber measurements. Similarly the Jacob mechansim is based on the MCM but added 73 reactions and changed 21. It performed best in comparison to several other chemical schemes (Jacob et al., 2024). Both schemes include HPMTF reactions but no aqueous-phase or halogen reactions. For a sensitivity test, halogen reactions for Br2 and Cl2 were added from Burkholder et al. (2019).
As described previously, the measurements of SCORPION are influenced by the temperature increase in the inlet caused by adiabatic heating. At low altitudes, this effect is minimal and we report gas-phase concentrations in the first part of our results, while the high altitude data is presented afterwards as a combined gas- and particle-phase measurement. Three flights are examined as case studies before all measurements in the upper troposphere are considered to draw a coherent picture of particle composition and origin in the marine tropics. We use trajectories combined with satellite data to determine the history of the measured air masses and confirm our findings with a simple chemical box model.
3.1 Low-altitude measurements
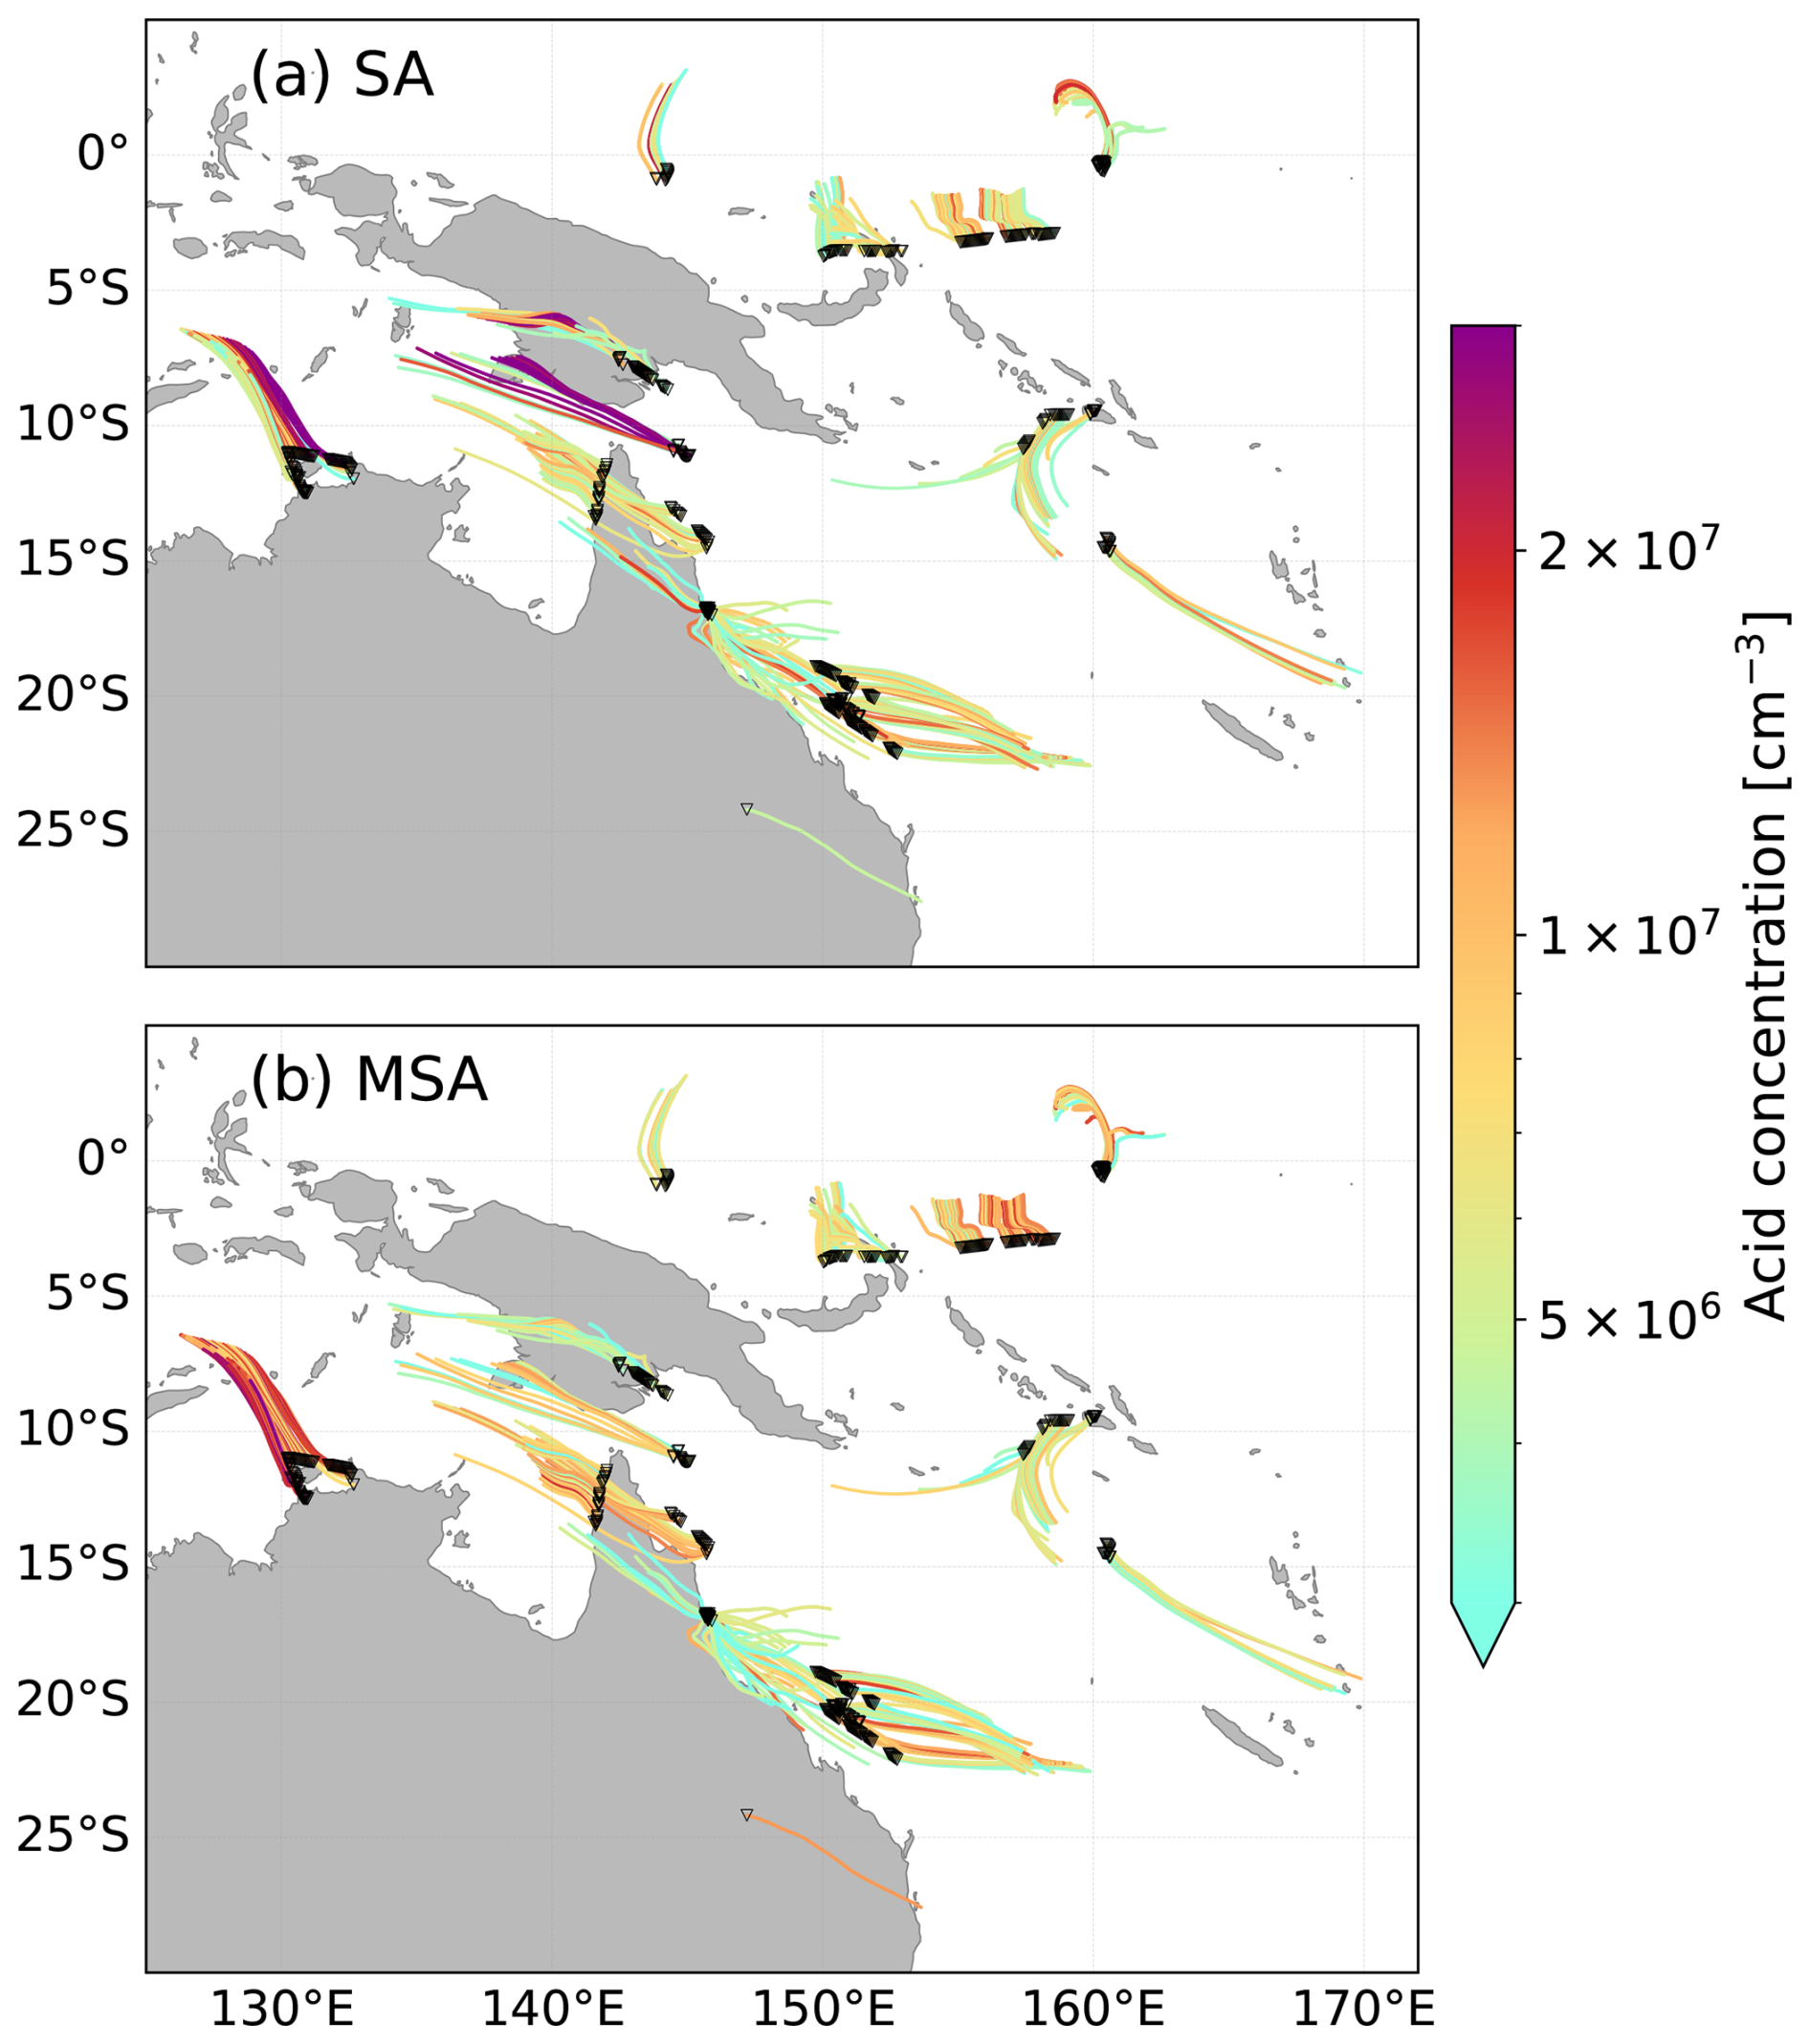
Figure 2Gas-phase measurements of SA (a) and MSA (b) with 24 h backward trajectories. The trajectories were calculated with the HYSPLIT model and are coloured by the concentrations measured with SCORPION. Only data points with a ΔT below 5 K are shown to avoid the influence of evaporated particles. The plots show values measured below 1 km altitude. Values below the LOD are not shown. The black triangles indicate the starting points of each backward trajectory, i.e. the location of the aircraft.
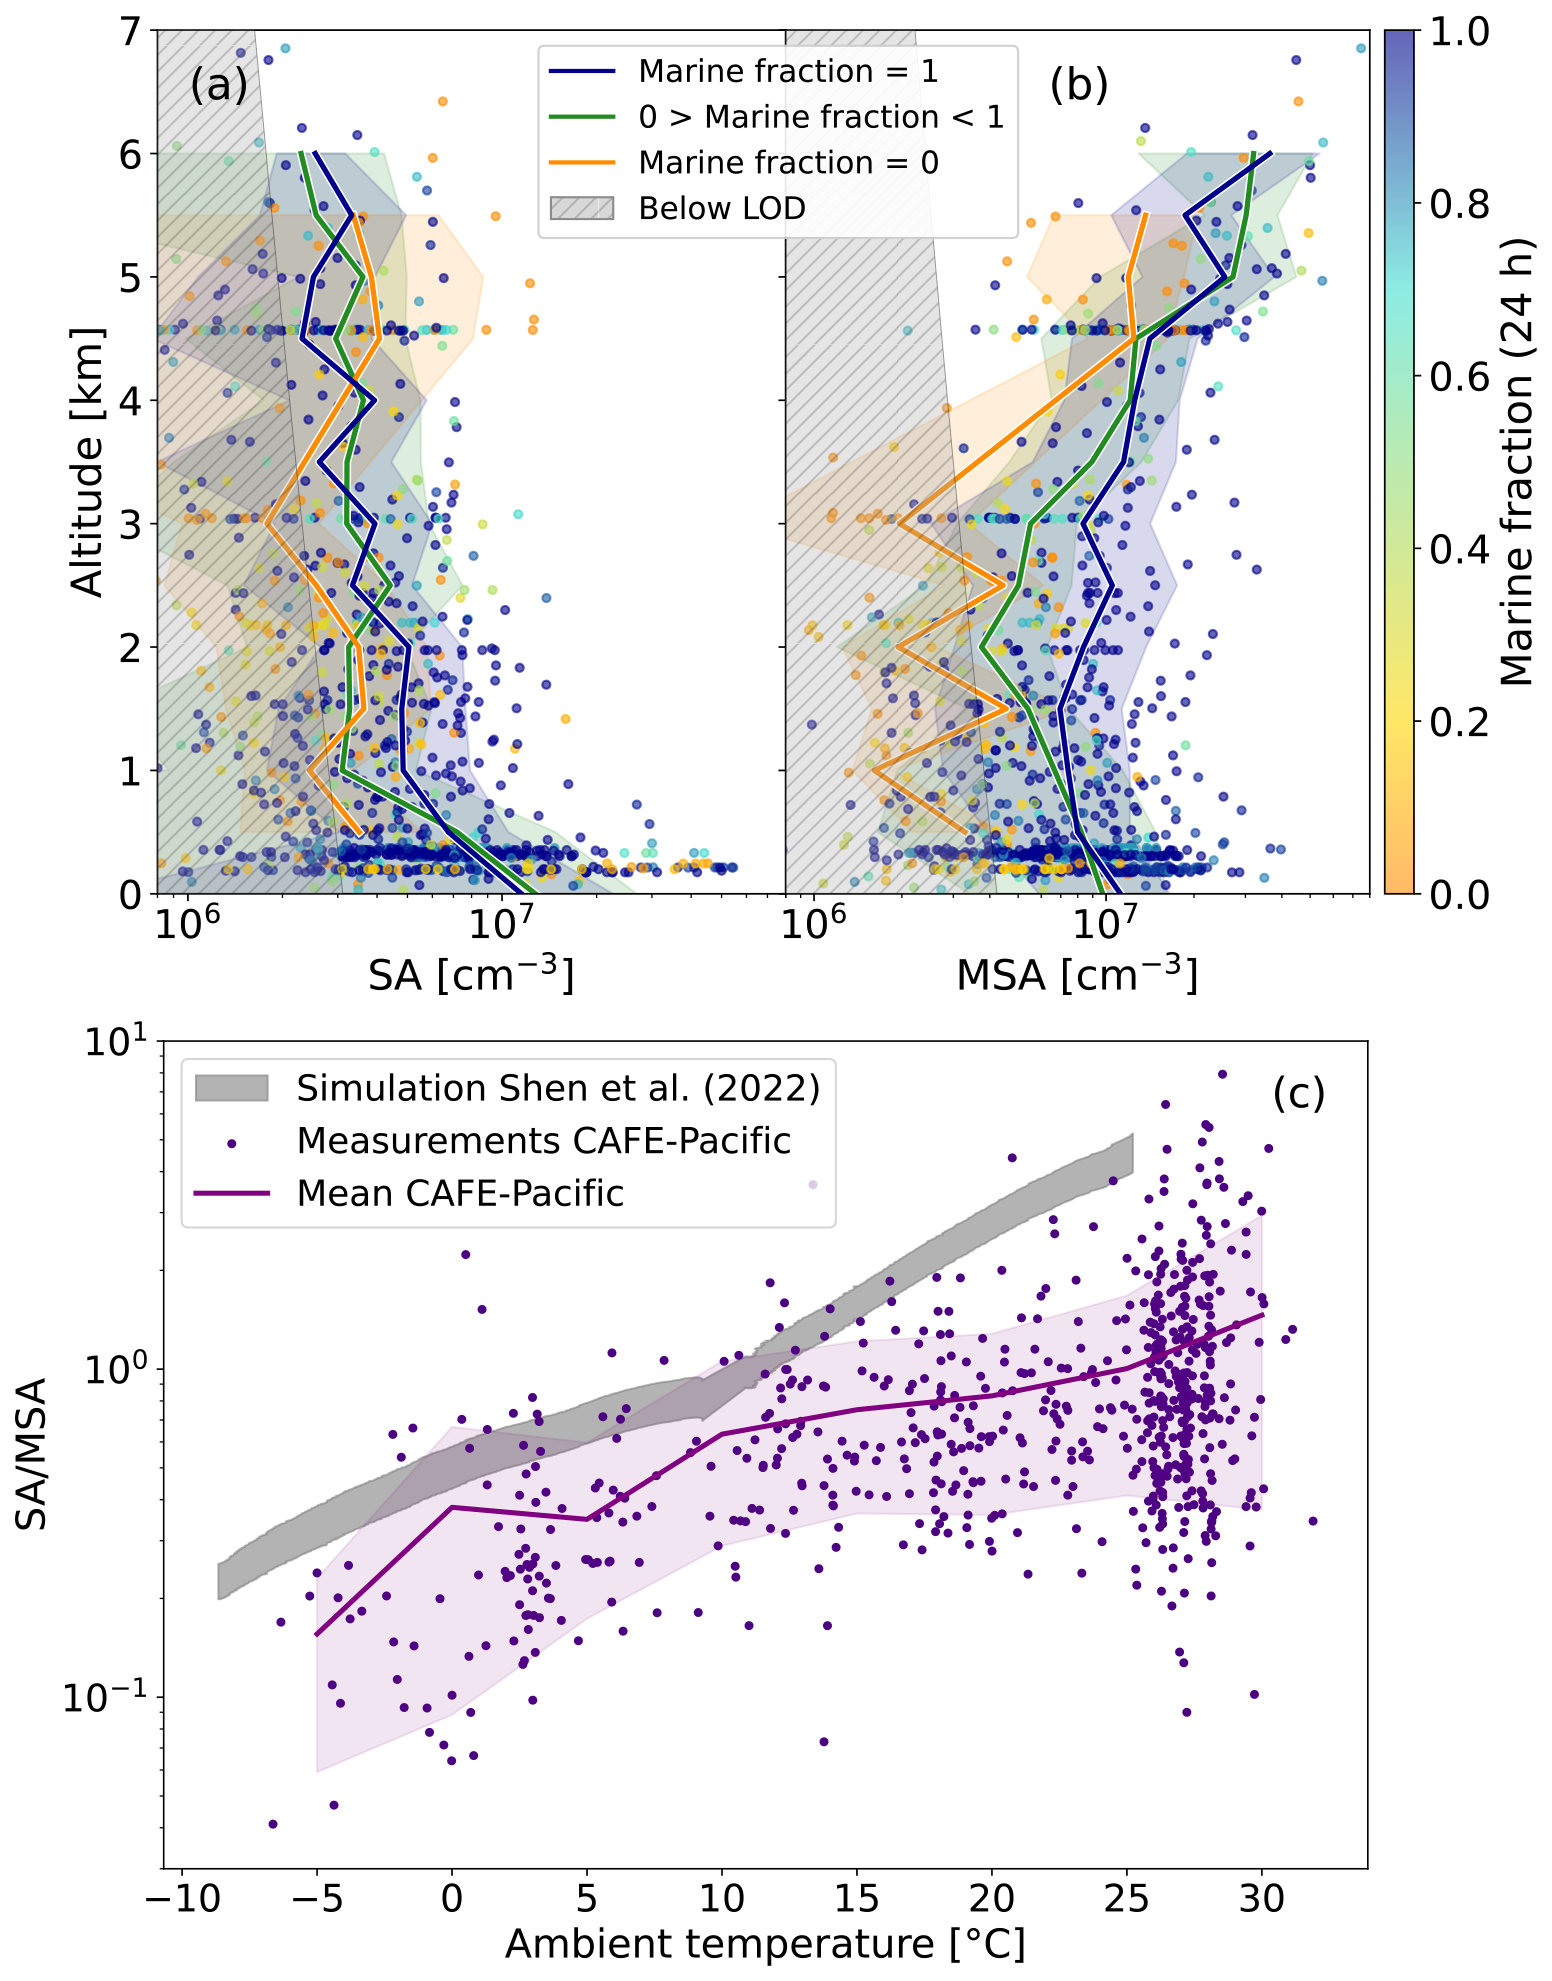
Figure 3Altitude profiles of gas-phase SA (a) and MSA (b) as measured by SCORPION. The points are coloured by the fraction of hours spent over the ocean during their 24 h HYSPLIT trajectory. The grey striped area indicates data below LOD. The solid lines show mean values for 500 m altitude bins and for different air mass origins: marine is defined as no time spent over land, inland as no time spent over the ocean and mixed for all other cases. The coloured shaded areas shows the respective standard deviation. The data points below the LOD are included in the averaging. (c) shows the SA to MSA ratio for the gas-phase measurements against the ambient temperature. Only values above the LOD were included and only where the conditions for gas-phase MSA were fulfilled (Table 1). The mean and central 75th percentile (12.5th–87.5th) are indicated by the purple line and shaded area. The grey area shows the kinetic simulations of DMS oxidation by Shen et al. (2022).
Low-altitude measurements of gas-phase SA and MSA are shown combined with the trajectory analysis performed by the HYSPLIT model in Fig. 2. The trajectories were calculated 24 h backwards from the aircraft position and are coloured by the concentration measured on board. Here, only data collected in an altitude of up to 1 km is shown, which is representative of the boundary layer (BL) height during most flights.
The concentrations of MSA and SA in the BL vary from below our limit of detection (<3–4 ×106 cm−3) to several 107 cm−3. These values are comparable but slightly higher than measurements in the Arctic (Beck et al., 2021), Antarctica and the Southern Ocean (Jokinen et al., 2018; Baccarini et al., 2021; Quéléver et al., 2022), while similar values have been reported in the tropical Indian Ocean (Salignat et al., 2024).
Whether the air masses originate in the remote Pacific or closer to the coast does not seem to have a major influence on the concentrations, indicating that emission source regions are distributed over broad areas. Especially the region between Papua New Guinea and along the Australian coast is characterised by a high biological activity (Fig. A11a in the Appendix). However, the Copernicus Atmospheric Monitoring System (CAMS) predicts DMS values of 100–250 pptv (parts per trillion by volume) mainly further east (Fig. A11b in the Appendix). Besides DMS, SA can also be produced from anthropogenic or volcanic SO2 emissions. CAMS shows hotspot regions for volcanic sites in Papua New Guinea and in the denser populated south east of Australia. However, none of the trajectories in Fig. 2 overlap with these regions indicating minor influence of non-DMS-derived SO2.
The altitude profiles for MSA and SA in the boundary layer and the lower free troposphere are shown in Fig. 3a and b. Most measurements were conducted during daytime, as shown in Fig. A12 in the Appendix. SA exhibits the highest concentrations within the BL and decreases to values often below our limit of detection at altitudes exceeding approximately 500 m above ground level. MSA on the other hand shows an increasing trend with altitude.
Marine influence is quantified by marine fraction, defined as the fraction of hours the HYSPLIT backward trajectory is located over the ocean. For the gas-phase data, the marine fraction of the last day is considered, i.e. a marine fraction of one corresponds to the past 24 h spent entirely over the ocean. The solid lines in Fig. 3a and b represent the mean for marine (0 h over land), mixed (1–23 h over land) and inland (24 h over land) air masses. For SA, the highest concentrations are measured closest to the ground in all air masses indicating the diverse sources and its short lifetime (seconds to few hours depending on the condensation sink Dal Maso et al., 2002; Ranjithkumar et al., 2021; Tuovinen et al., 2021). Air of purely marine origin shows slightly higher concentrations up to 2 km. Above this altitude, the data points are too scarce to determine a reliable trend.
MSA shows a clearer marine connection with all data points above 107 cm−3 having a high marine fraction and the mean MSA concentration in marine air being roughly a factor 3 greater than for the inland air up until 3 km altitude. Above that, the MSA concentration increases with altitude regardless of the air mass origin. The different trends of concentrations with altitude of both acids indicate an enhanced MSA source in the free troposphere, potentially due to a higher chemical production from DMS oxidation.
Figure 3c compares the ratios measured during the CAFE-Pacific campaign with the kinetic model simulation by Shen et al. (2022), which has been verified by chamber experiments. Both in the model and the measurements, a clear shift towards MSA at colder temperatures can be confirmed. However, the measured SA MSA ratios consistently fall below the model prediction, with the strongest discrepancy in the BL. A reason for this could be uncertainties in the chemical mechanism. Shen et al. (2022) is only one of multiple DMS oxidation schemes proposed. However, in a comparison it has been shown to underpredict SO2 rather than MSA (Jacob et al., 2024). The effect of NOx on the chemistry should be negligible due to the low mixing ratios above the ocean (mostly below 100 pptv, see Fig. A10). Even higher mixing ratios closer to the coast or shipping routes would only slightly enhance the SA MSA ratio according to experimental results in Shen et al. (2022), although the literature on the effect of NOx on DMS oxidation is not conclusive (Koga and Tanaka, 1999; Librando et al., 2004; Ye et al., 2022).
Processes that are not considered in the kinetic model but can impact the atmospheric SA MSA ratio include, for example, the oxidation of DMS by halogen compounds. These reactions promote the addition pathway and, consequently, enhance MSA formation. However, the effect of Cl is expected to be minor and BrO has a significant impact mainly at higher latitudes (Khan et al., 2016; Chen et al., 2018; Tashmim et al., 2024). Another missing mechanism are aqueous-phase reactions. For example, HPMTF (formed efficiently under the low-NOx conditions) is rapidly taken up into cloud droplets eventually reducing gas-phase SO2 concentrations and subsequent SA formation (Novak et al., 2021; Kilgour et al., 2025). This is a likely reason for the low SA MSA ratios in the BL measurements. Another important source could be evaporation of MSA from particles at low ambient RH values. While the RH in the BL is mostly high (∼ 80 %, Fig. A9 in the Appendix), the range of values in the free troposphere is broad. This might also explain the high MSA values measured for low marine fractions in Fig. 3b. The higher values cannot be caused by evaporation in the instrument since only data points with a very low ΔT and sufficiently high RH in the inlet are considered.
In the absence of ammonia or other bases, the concentrations detected here are mostly not sufficient to initiate significant new particle formation at temperatures of the boundary layer or the lower free troposphere (Dunne et al., 2016; Baalbaki et al., 2026). They can, however, contribute to the growth of small particles producing growth rates of 1–10 nm h−1 (Stolzenburg et al., 2020).
3.2 High-altitude measurements
For the data collected in the middle and upper troposphere, the heating and subsequent evaporation of particles in the inlet need to be considered. Therefore, we report total concentrations (gas and evaporated particle phase) for the conditions detailed in Table 1 and Fig. 1c. To highlight the distinction from gas-phase measurements, mass concentrations are reported in this section. For consistency across instruments, the data have been corrected to standard temperature and pressure (STP; 1013 hPa, 273 K). We first analyse three different case studies before broadening the picture to all flights. The first case study (Sect. 3.2.1) provides a comparison with the C-TOF-AMS to show our ability to quantify particle phase acids and to distinguish between MSA and SA with SCORPION, which is not possible with the C-TOF-AMS instrument.
The second case study (Sect. 3.2.2) explores the relationship between the concentrations of MSA, SA and small particles for a flight in an approximately 14 h old convective outflow. The third case shows data from an outflow of a convective system that has not experienced significant OH exposure and therefore shows lower acid and particle concentrations (Sect. 3.2.3). The flight tracks for all research flights can be found in the Appendix (Fig. A8), including those used in the case studies.
3.2.1 RF08 – Quantitative measurements of particle phase MSA and SA in the upper troposphere
As discussed in the methods section and confirmed by chamber experiments, our measurement is dominated by evaporated particle-phase acids at higher altitudes. This can be seen particularly well during a period in RF08, where we compare measurements by SCORPION with sulfate values obtained by the C-TOF-AMS. The AMS on board HALO is not capable of distinguishing between MSA and SA but MSA is expected to fragment mostly on the peaks considered for the sulfate trace.
The aircraft was flying at approximately 9 km altitude and passed repeatedly through the same area close to the Australian coast in a zig-zag pattern. The agreement between both instruments is remarkably good (Fig. 4), not only is the relationship linear over more than one order of magnitude, but the absolute values agree to a great extent. This indicates that under these conditions (3 % RH–7 % RH in the inlet and ΔT≈ 30 K), SCORPION efficiently evaporates particles, which are simultaneously measured by the C-TOF-AMS. No precise measurement of the particle size is available but the strong signal in the C-TOF-AMS and low signal in the OPC indicate a diameter well above 40 nm but mostly below 250 nm. The good agreement also indicates that the particles are highly acidic since otherwise evaporation could not occur in our inlet. The C-TOF-AMS confirms this by showing no detectable ammonia even during the periods with higher mass loadings, which is consistent with the low ammonia levels expected in the upper troposphere (Hoepfner et al., 2016; Johansson et al., 2024).
Plotting the MSA concentration instead of the acid sum, coloured by the MSA SA ratio (Fig. 4b), shows only a very small decrease in the agreement between both instruments, since MSA exceeds SA in most cases by at least a factor of 10. This leads to the conclusion that the sulfate particle mass is dominated by MSA rather than SA.
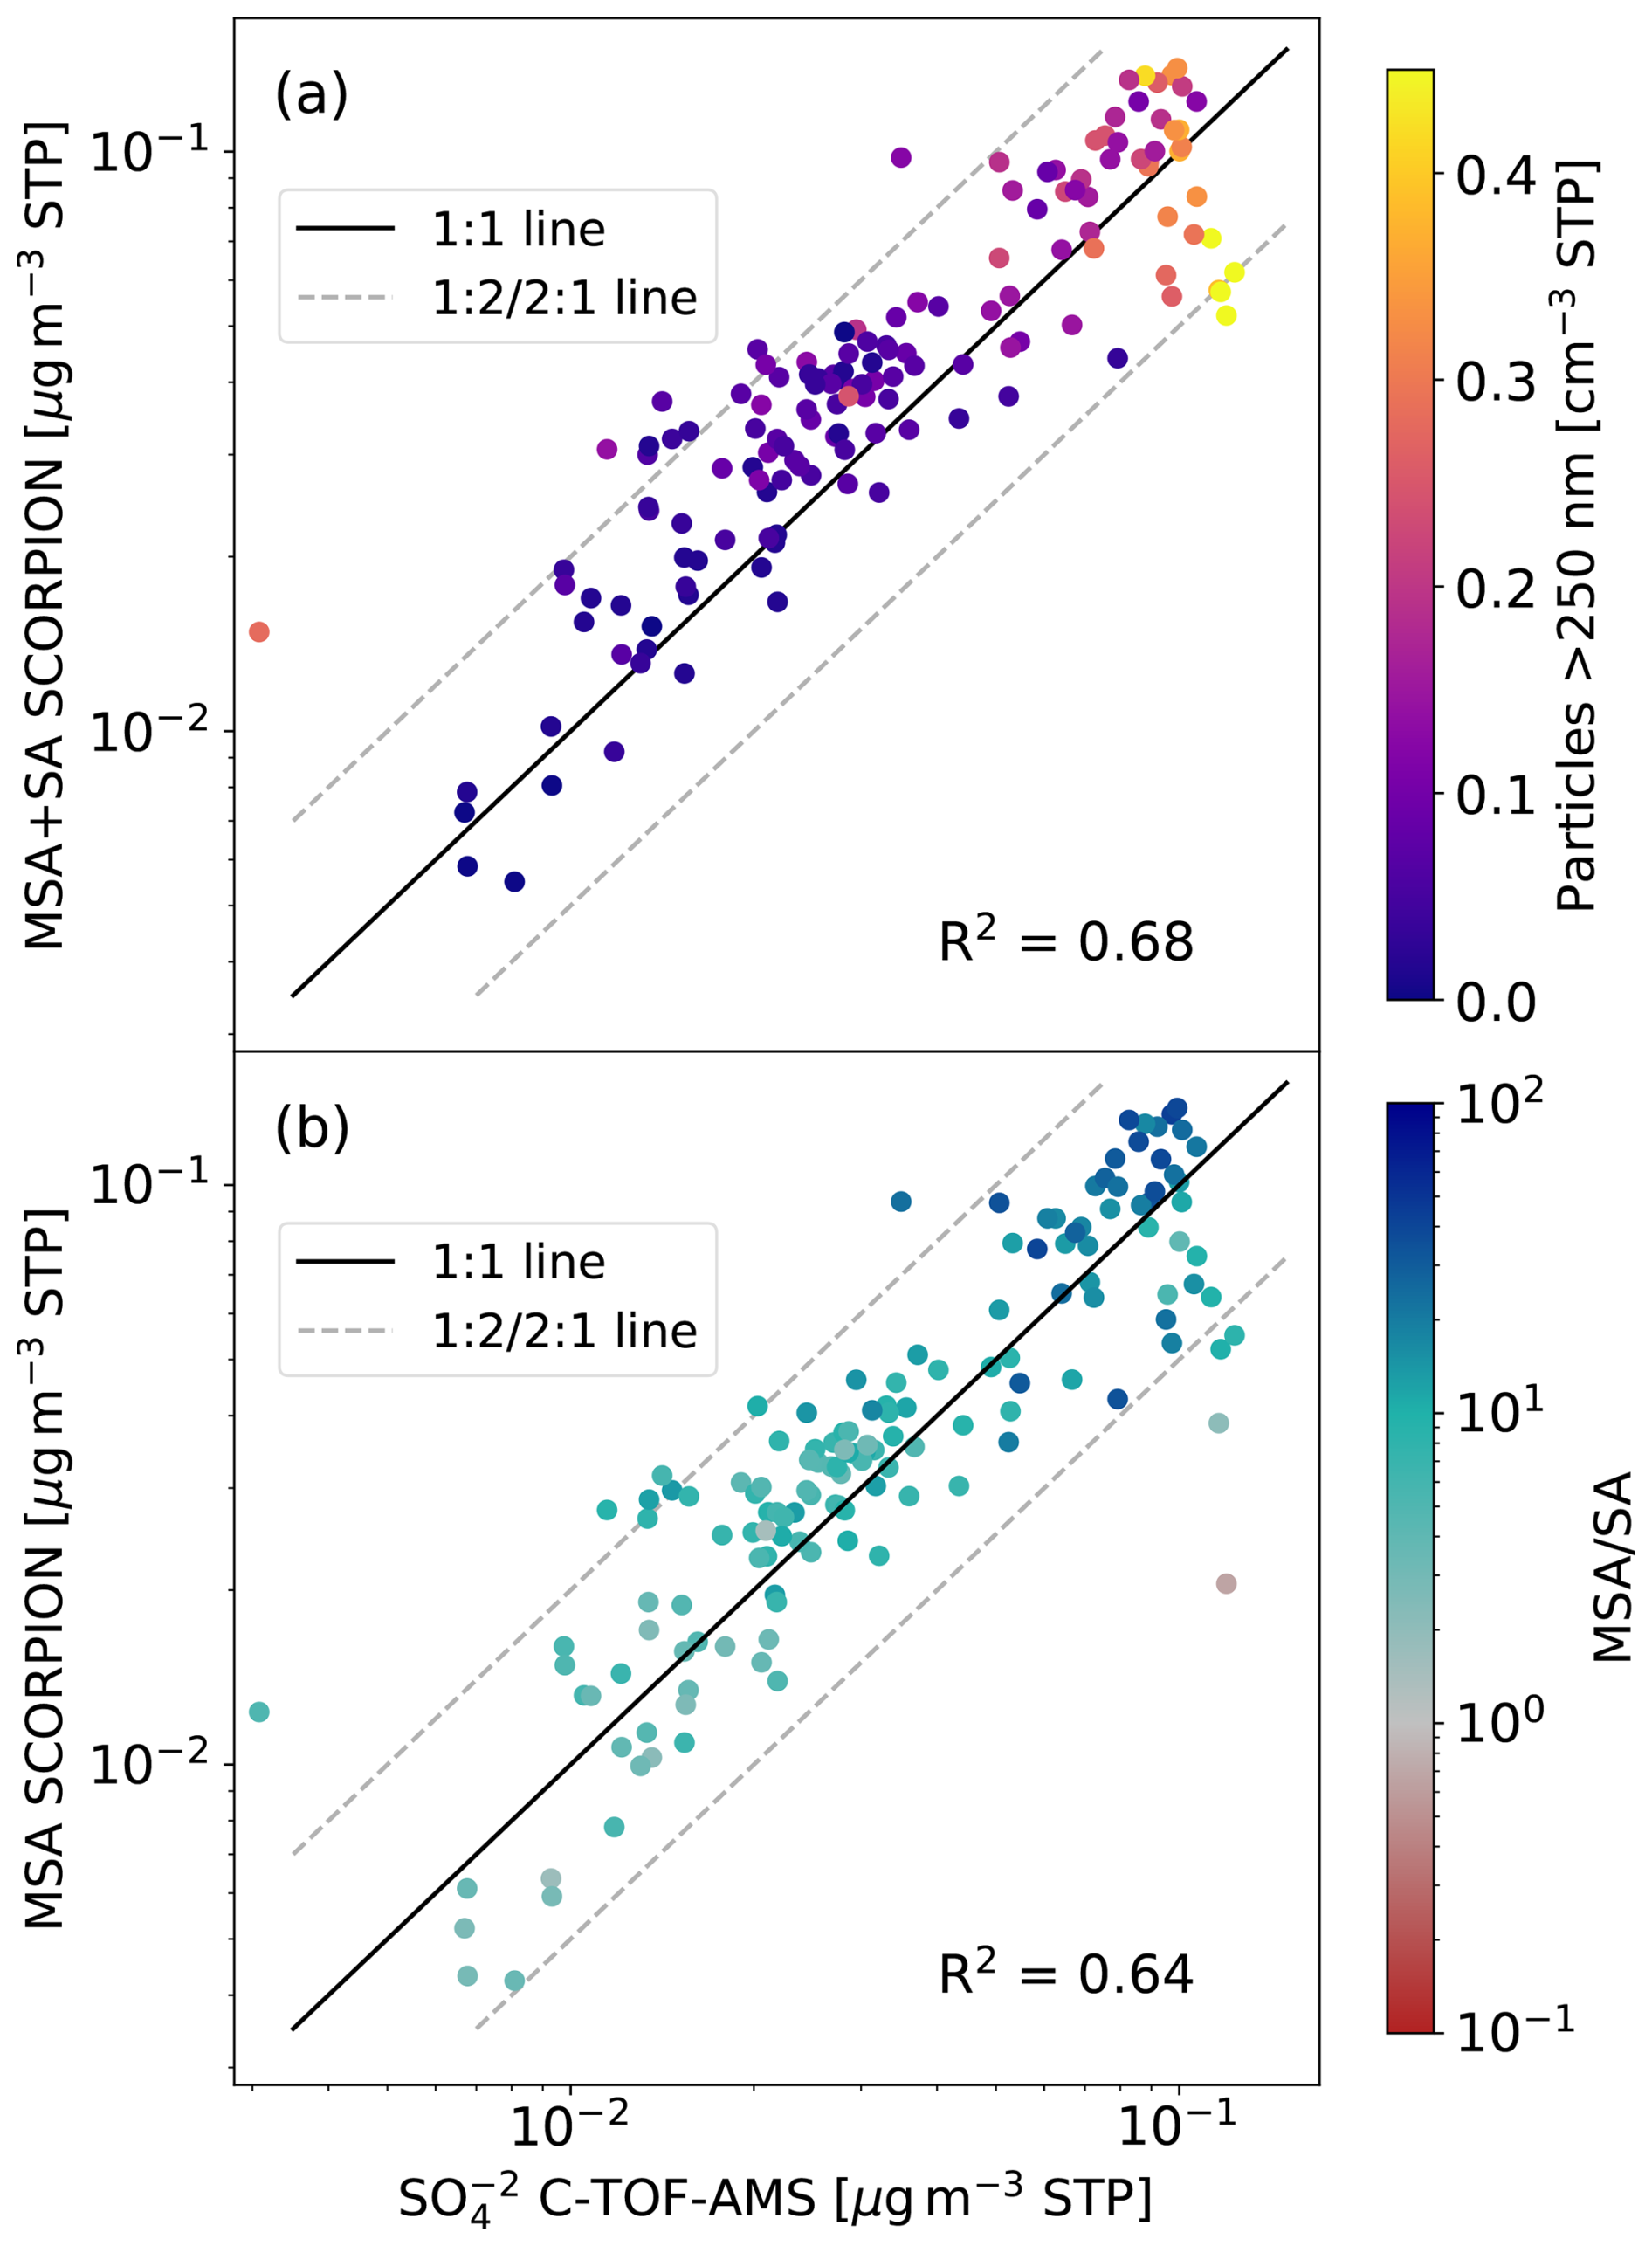
Figure 4Comparison of C-TOF-AMS and SCORPION measurements during a 2 h 40 min period of RF08. The aircraft was flying at an altitude of approximately 9 km above the ocean, close to the Australian coast. The x-axis shows the particulate sulfate of particles between 40 and 800 nm measured by the C-TOF-AMS. In (a) the sum of MSA and SA from SCORPION is plotted coloured by the concentration of >250 nm particles measured by the OPC. (b) shows just the MSA mass concentration coloured by the ratio of MSA to SA. SCORPION cannot distinguish between evaporated particles and gas phase. The solid line represents the 1:1 ratio and the dashed lines represent the 1:2 and 2:1 ratios, reflecting the systematic uncertainty of SCORPION. The 30 % uncertainty for the C-TOF-AMS measurements is not shown. The R2 values are indicated in each plot.
A similar comparison for a flight in the marine BL can be found in Fig. A13 in the Appendix. No correlation is found with the C-TOF-AMS values strongly exceeding the measurements by SCORPION, which confirms that at low altitudes, SCORPION measures the gas phase and is not affected by particles. This is the case despite the substantially higher particle mass concentrations at lower altitudes, as indicated by the AMS sulfate measurements and OPC concentrations, both of which are approximately one order of magnitude greater than those shown in Fig. 4. Instead, the air masses with higher particle mass seem to have lower gas-phase concentrations, possibly due to the enhanced condensation sink. This is an independent confirmation of the instrumental behaviour already discussed in Fig. 1.
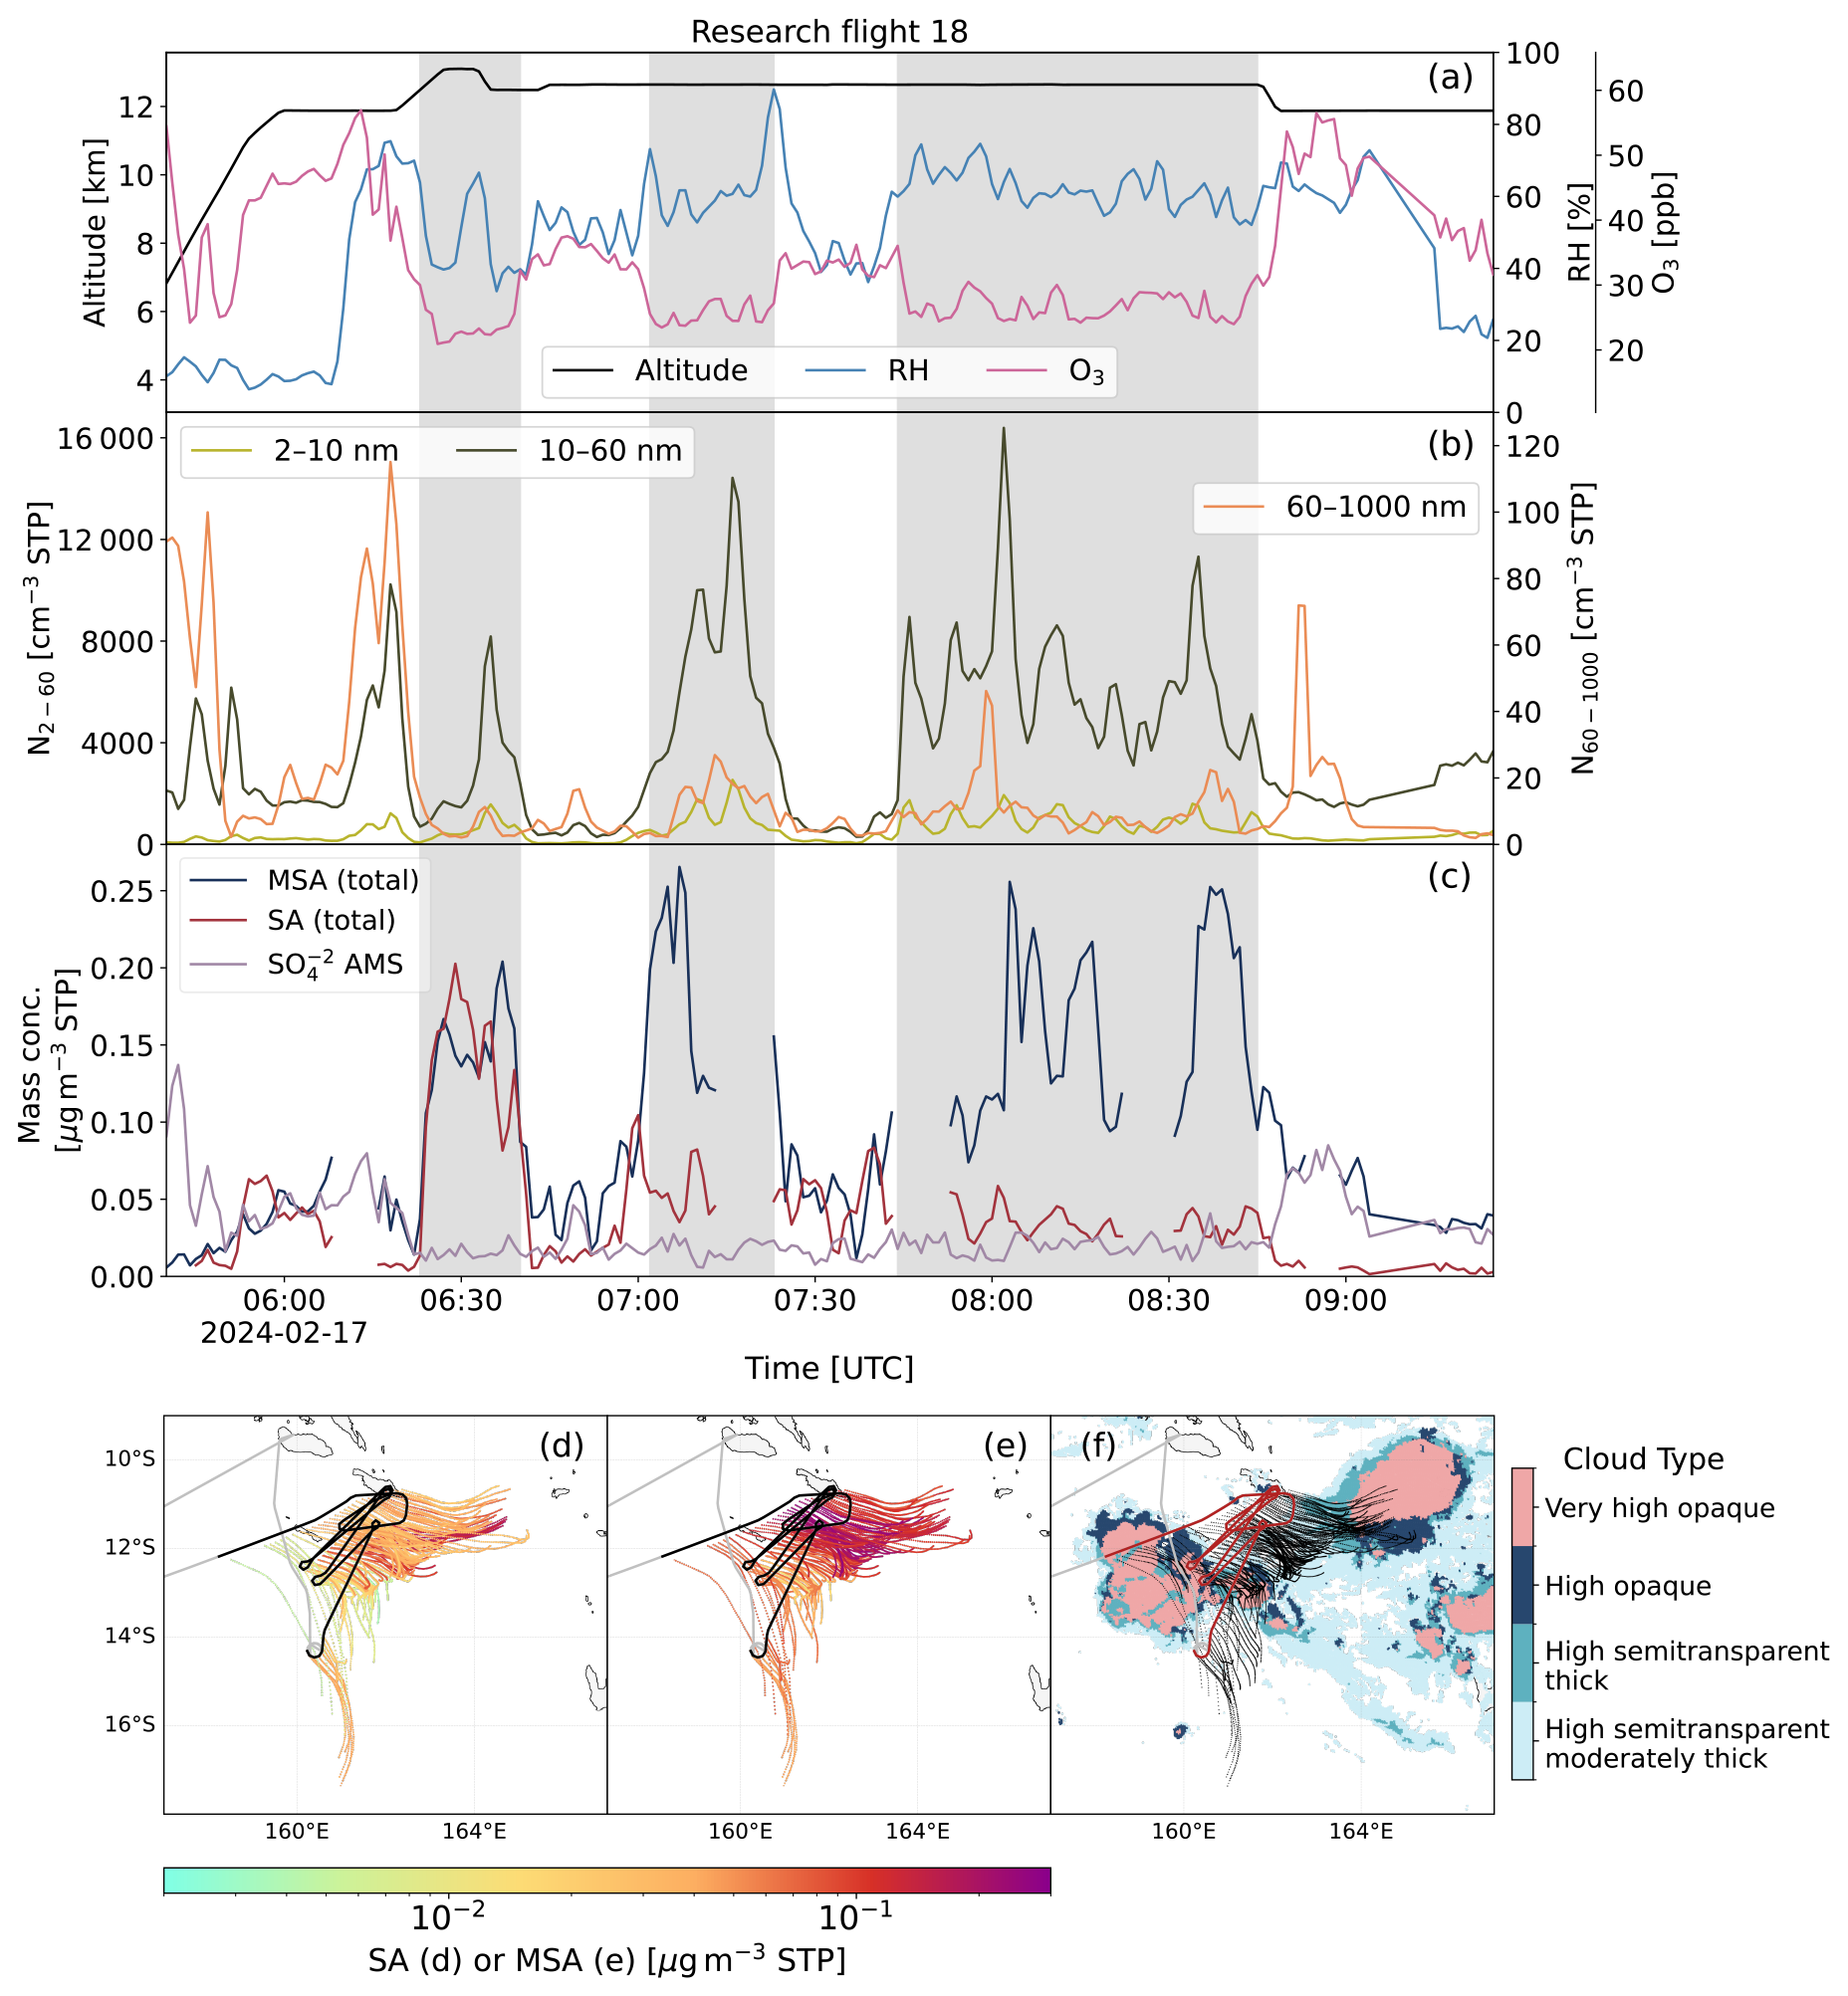
Figure 5Section of RF18 close to the Solomon Islands. (a) shows the time series of altitude, RH and O3, (b) particle number concentrations for three size ranges (diameters between 2 and 1000 nm) from FASD and UHSAS and (c) MSA and SA detected by SCORPION (combined gas and particle phase) alongside from the C-TOF-AMS. The grey shaded areas mark the air mass of interest originating from convective uplift. (d)–(f) show map plots with 14 h backward HYSPLIT trajectories calculated from the position of the aircraft every minute, coloured by the SA (d) and MSA (e) measurements. In (f) the trajectories are shown in black and the cloud type as identified by the Himawari satellite, with only four of the total 15 categories depicted. The flight path is indicated in grey, black or red in all three panels.
3.2.2 RF18 – Aitken mode MSA and SA particles observed in convective outflow after OH exposure
Figure 5 shows a segment of RF18 between 06:00 and 09:00 UTC, during which the aircraft flew at an altitude of approximately 12 km over the Indo-Pacific Warm Pool, passing back and forth through an area of roughly 30 000 km2. As this altitude and consequently ΔT (Tinlet−Tambient) is even higher than the data shown in Fig. 4, we expect to fully evaporate both SA and MSA particles. The time series of O3 indicates two distinct air masses which were passed multiple times. The air mass of interest here has lower ozone mixing ratios and is marked by a grey shading in Fig. 5a–c.
This air mass is characterised by high number concentrations of small particles, as seen in the second panel. The concentration of nucleation mode particles between 2 and 10 nm is slightly enhanced but mostly below 1000 cm−3. However, there is a high abundance of particles of 10 to 60 nm diameter with number concentrations frequently exceeding 5000 cm−3 and peak values above 10 000 cm−3. The concentration of even larger particles above 60 nm, on the other hand, stays mostly below 20 cm−3.
Finally, the air mass also shows high MSA concentrations reaching above 0.2 µg m−3 and slightly elevated SA concentrations. Unlike RF08, there is no correlation with C-TOF-AMS sulfate data, which measures concentrations approximately one order of magnitude lower than SCORPION. This can be explained by the minimum cut-off diameter of the AMS, which lies at approximately 40 nm. The particles in this air mass are mostly too small to be detected by the C-TOF-AMS, but they still lead to a strong signal in SCORPION after evaporation in the inlet. All other compounds in the AMS stay below or close to the limit of detection (Fig. A14).The simultaneous presence of high particle number concentrations and high total MSA concentrations indicates that these particles are a result of DMS oxidation in the upper troposphere. Due to the kinetic condensation of MSA onto particles (Baalbaki et al., 2026; Yu et al., 2026), the measured concentrations could not be sustained in the gas phase and represent almost exclusively particle phase measurements. Assuming an average particle diameter of 30 nm, concentration of 5000 cm−3 and density of 1.5 g cm−3 (Perraud et al., 2023), the expected mass of MSA would be 0.1 µg m−3 which is consistent with the values detected by SCORPION. Although we cannot fully exclude the presence of other compounds in the particles that do not evaporate in our inlet, these are not required to explain the observed particle concentrations.
To determine the air mass history, the HYSPLIT trajectories were calculated from the aircraft position backwards. Figure 5d and e show that the air mass with higher acid concentrations seems to originate from the east, while lower values are measured for trajectories from the south or south east.
The only source of DMS at these altitudes (∼12 km) in the tropics is transport from the boundary layer by deep convection since DMS is expected to be too short-lived for long-range transport and does not have any chemical sources in this altitude. The low O3 mixing ratio, high RH and low condensation sink are consistent with conditions in a convective outflow (Müller et al., 2024; Murphy et al., 2015). Figure 5f shows the cloud types identified by the Himawari satellite. The values shown in the plot were recorded 14 h before the aircraft measurements and hence depict the situation at the end of the back trajectories. A large deep convective system is located north east of the flight track at the end of the trajectories. This convection can be identified as the most likely source of the probed aerosol.
CAMS simulates slightly enhanced surface DMS mixing ratios on average at the location of this convective cell. Substantial amounts of DMS can be transported to high altitudes with CAMS predicting average values of up to 20 pptv at 200 hPa and peak values exceeding 60 pptv (Fig. A11 in the Appendix). Daylight exposure transforms this surface DMS into MSA after convective uplift. The data in RF18 were recorded in the late afternoon (17:00–20:00 local time) and the convection occurred during the previous night. The air mass has experienced at least 10 h of light and thereby OH exposure. This leads to efficient oxidation of the transported DMS to MSA and SA and hence concentrations which are one order of magnitude higher than during other flights.
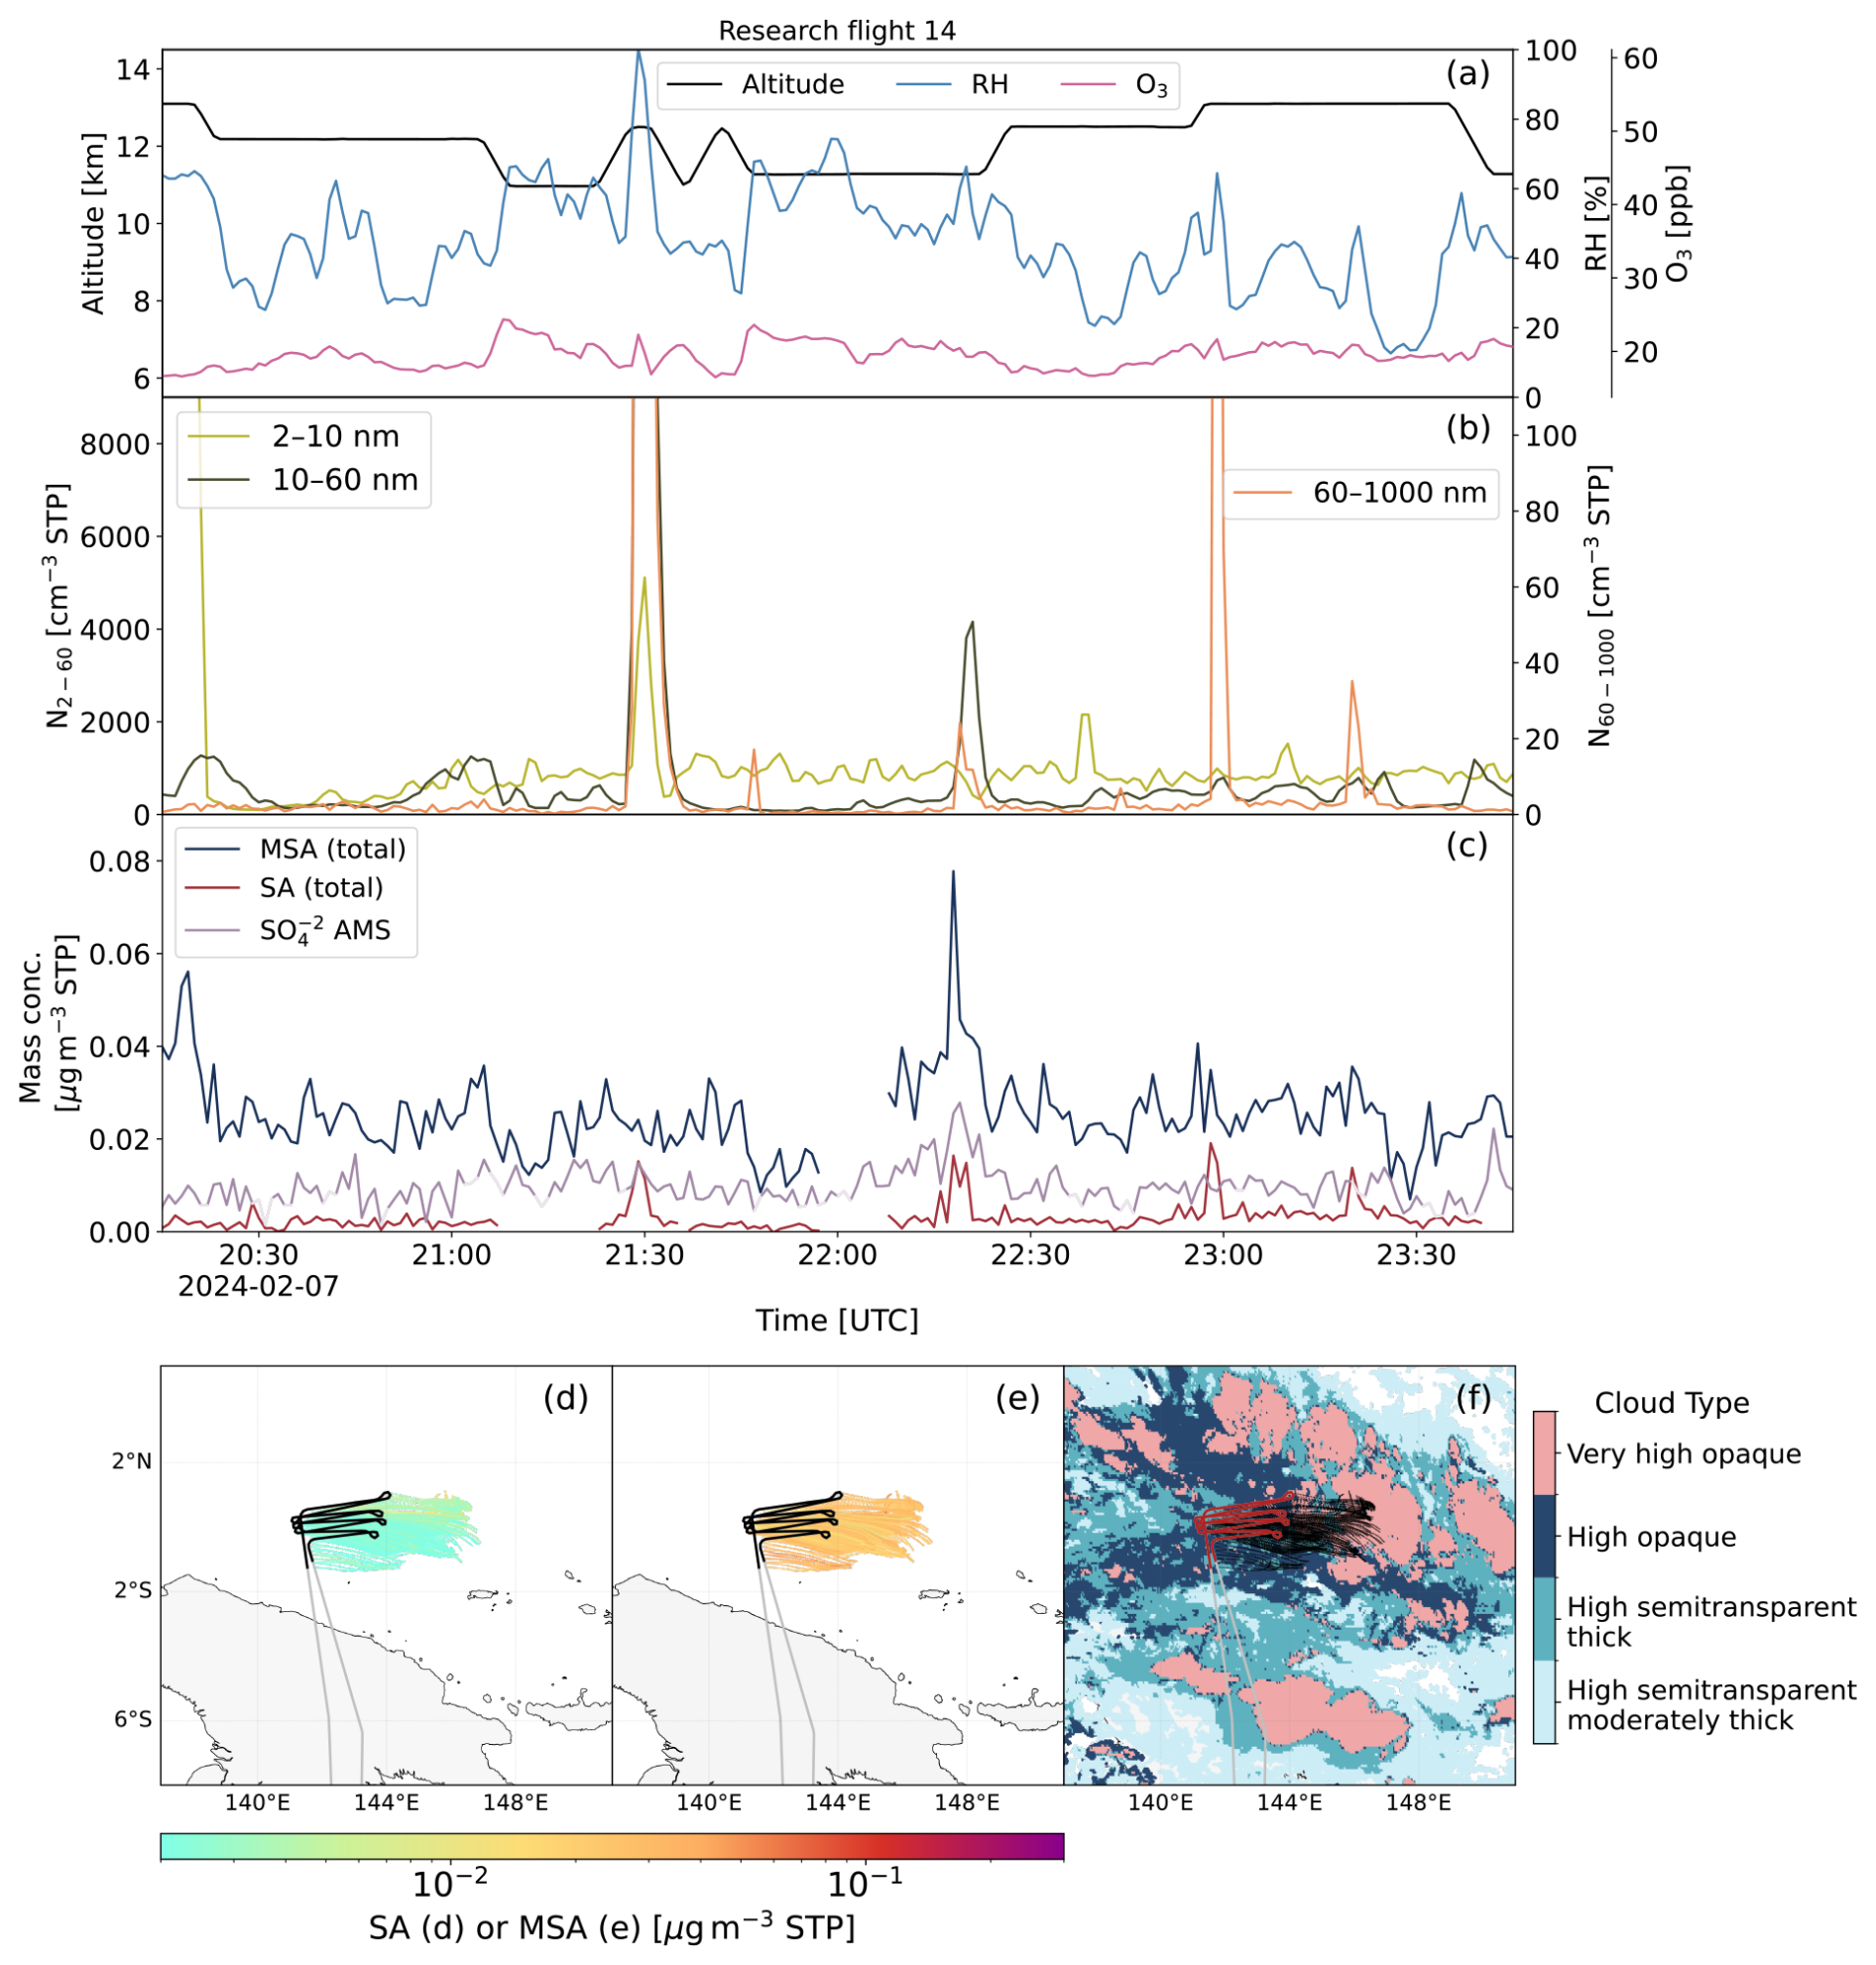
Figure 6Section of RF14 north of Papua New Guinea measuring a convective outflow event. (a) shows the time series of altitude, RH and O3, (b) particle number concentrations for three size ranges (diameters between 2 and 1000 nm) from FASD and UHSAS and (c) MSA and SA detected by SCORPION (combined gas and particle phase) alongside from the C-TOF-AMS. (d)–(f) show map plots with 10 h backward HYSPLIT trajectories calculated from the position of the aircraft every minute, coloured by the SA (d) and MSA (e) measurements. In (f) the trajectories are shown in black and the cloud type as identified by the Himawari satellite, with only four of the total 15 categories depicted. The flight path is indicated in grey, black or red in all three panels.
3.2.3 RF14 – Low acid and particle number concentrations observed in convective outflow before OH exposure
The objective of RF14 was to measure the fresh outflow of a marine convective system. A series of repeated back-and-forth transects at an altitude of approximately 12 km was flown north of Papua New Guinea close to a convective system that was active during the past evening and night. A time series of the flight is shown in Fig. 6a–c. The high relative humidity and low O3 values (∼20 ppbv) are consistent with convective outflow conditions similar to RF18.
The air is characterised by very low number concentrations of particles of all sizes, likely resulting from efficient removal during the convective transport and precipitation scavenging (Murphy et al., 2015). The spikes in the time series are connected to the passing of clouds. The sulfate values recorded by the C-TOF-AMS remain close to the limit of detection and the SA values are also consistently low, just rarely exceeding µg m−3. MSA has an almost constant value around 0.02 µg m−3 which is in agreement with the low particle concentrations. Assuming a density of 1.5 g cm−3 (Perraud et al., 2023), merely 400 particles per cm3 with a diameter of 40 nm are required to account for 0.02 µg m−3 of MSA. All other compounds measured by the C-TOF-AMS also barely exceed the limit of detection (Fig. A15).
The HYSPLIT trajectories in Fig. 6d–f confirm the air mass origin at the location of a deep convective system, identified by the Himawari satellite cloud type. In this case, HYSPLIT captures the vertical transport caused by the convection and estimates that it occurred 8–18 h before the measurement (Fig. A16 Appendix). The data was collected around 06:30–09:30 am local time, suggesting the uplift occurred during the afternoon or night of the previous day. This is an important distinction from the previously discussed RF18, as the air mass did not experience significant OH exposure after the convective uplift. The measured MSA and SA values are hence likely not products of gas-phase DMS oxidation in the upper troposphere but more likely produced by aqueous-phase reactions in the cloud. However, the resulting mass concentration is one order of magnitude lower than in the previous case after DMS oxidation. This indicates that while some acids can be directly injected into the upper troposphere by deep convection, the in-situ gas-phase production from DMS might be the dominant source.
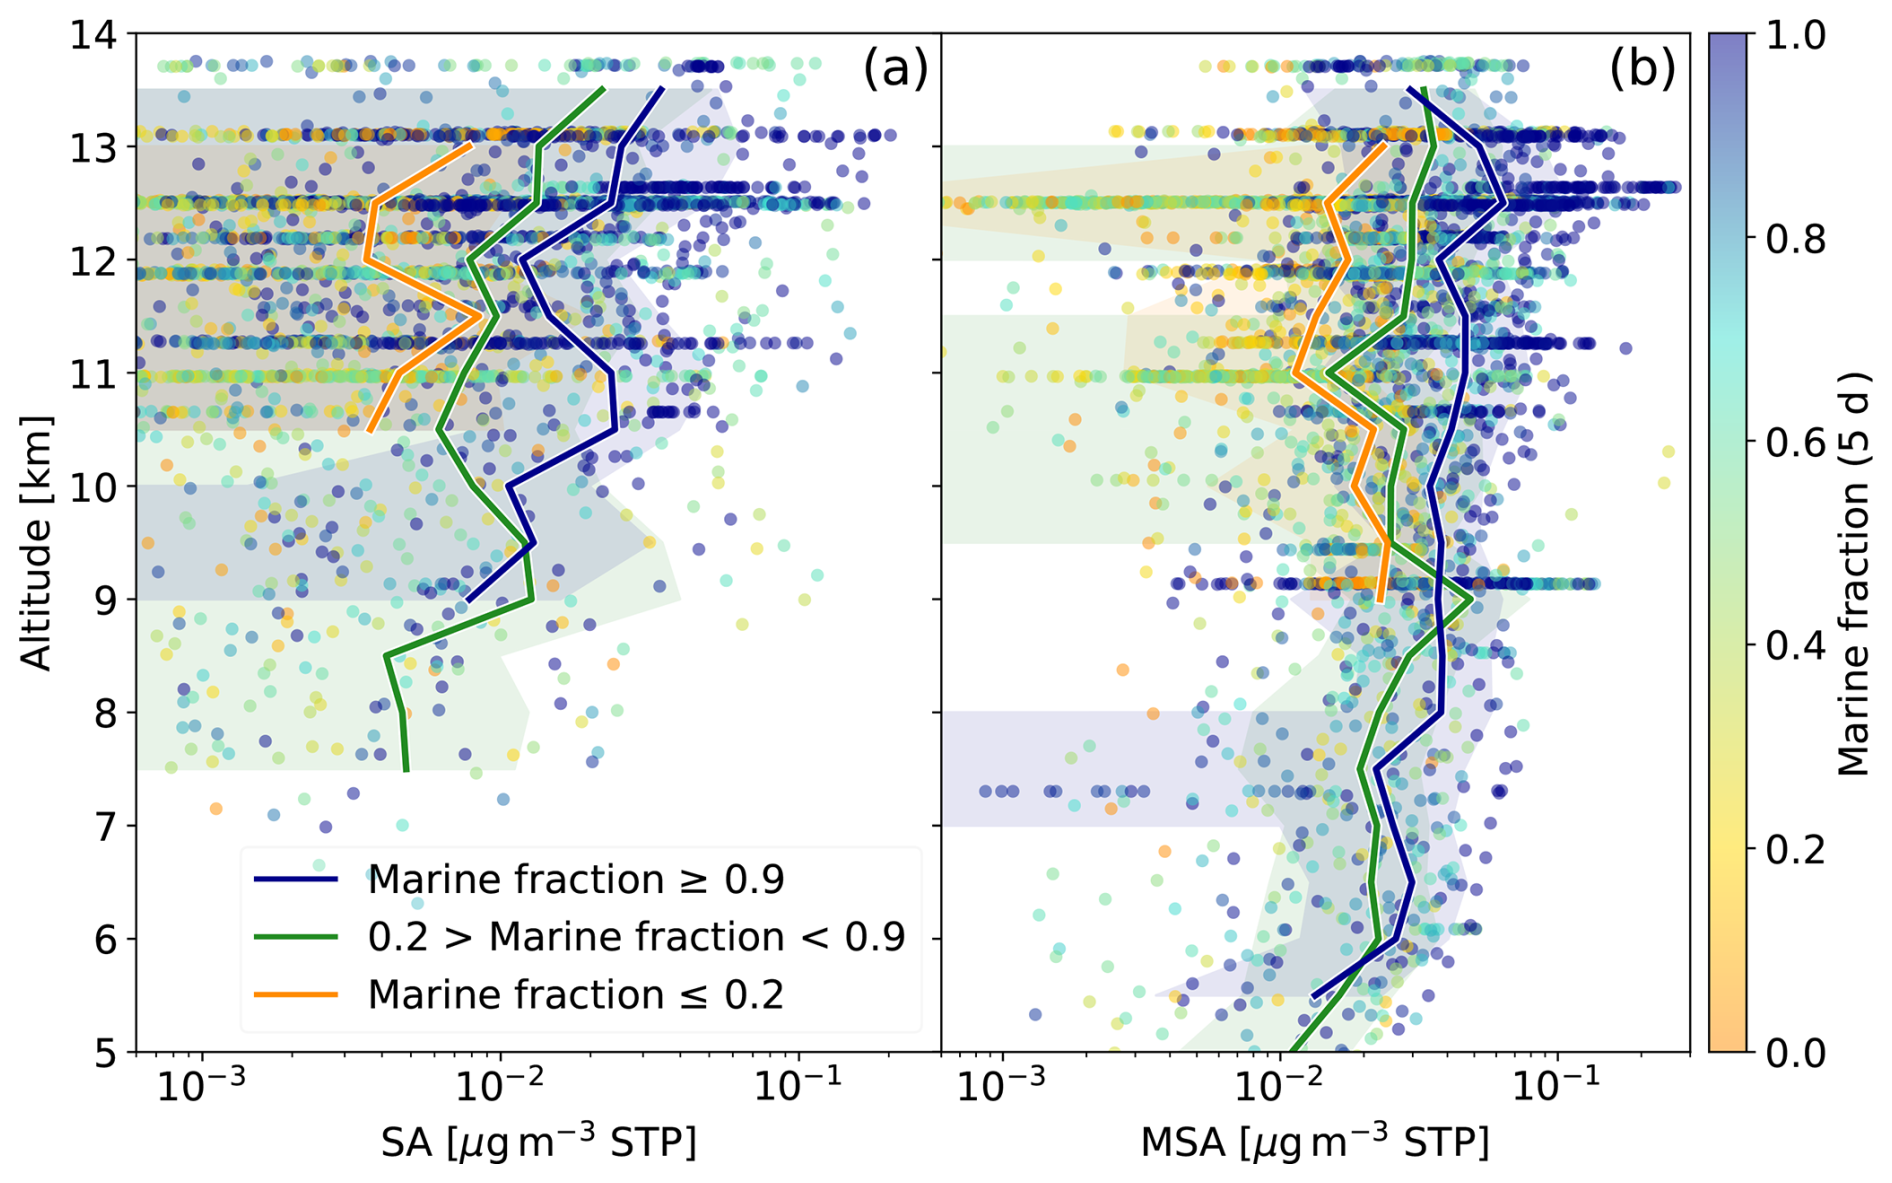
Figure 7Altitude profiles of combined gas and evaporated particle phase measurements during CAFE-Pacific for SA (a) and MSA (b). The colour scale indicates the marine fraction for the last 5 d, i.e. the fraction of hours the HYSPLIT back trajectory spent over the ocean. The solid lines indicate mean values for high, medium and low marine fractions with the shaded areas indicating the corresponding standard deviation. Due to the easier evaporation of MSA, more data points are available than for SA.
3.2.4 Altitude profile
The altitude profiles in Fig. 7 illustrate the gas and evaporated particle phase concentrations measured in the upper troposphere during all flights, which varied by over two orders of magnitude. The marine fraction was calculated for the past 5 d due to the longer lifetime of particles compared to the gas phase and is indicated by the colour scale. Note that the marine fraction simply refers to the location above the ocean and not to direct contact with the marine BL. High marine fractions should hence be interpreted as air masses from the remote Pacific or Indian Ocean rather than reflecting direct marine emissions. The mean values for both acids show that higher concentrations are detected in marine air masses compared to air with a lower marine fraction. Especially the peak values above µg m−3 are solely associated with high marine influence. For MSA, no clear change with altitude can be observed. The concentration of SA in marine and mixed air seems to increase slightly with altitude, although this could be biased by the decreasing amount of data points below 11 km.
Overall, MSA concentrations exceed those of SA, with SA MSA ratios typically ranging from 0.02 to 10 and averaging 0.48, independent of altitude and marine fraction. The over-abundance of MSA is consistent with the temperature-dependent oxidation of DMS. This trend was observed in the gas phase for lower altitudes (Fig. 3) and likely continues as the temperature decreases to −60 °C, resulting in a dominance of MSA. SA shows a larger spread in the measured concentrations, while MSA shows consistently high concentrations with lower variability. This indicates efficient horizontal and vertical transport of MSA in the gas or particle phase.
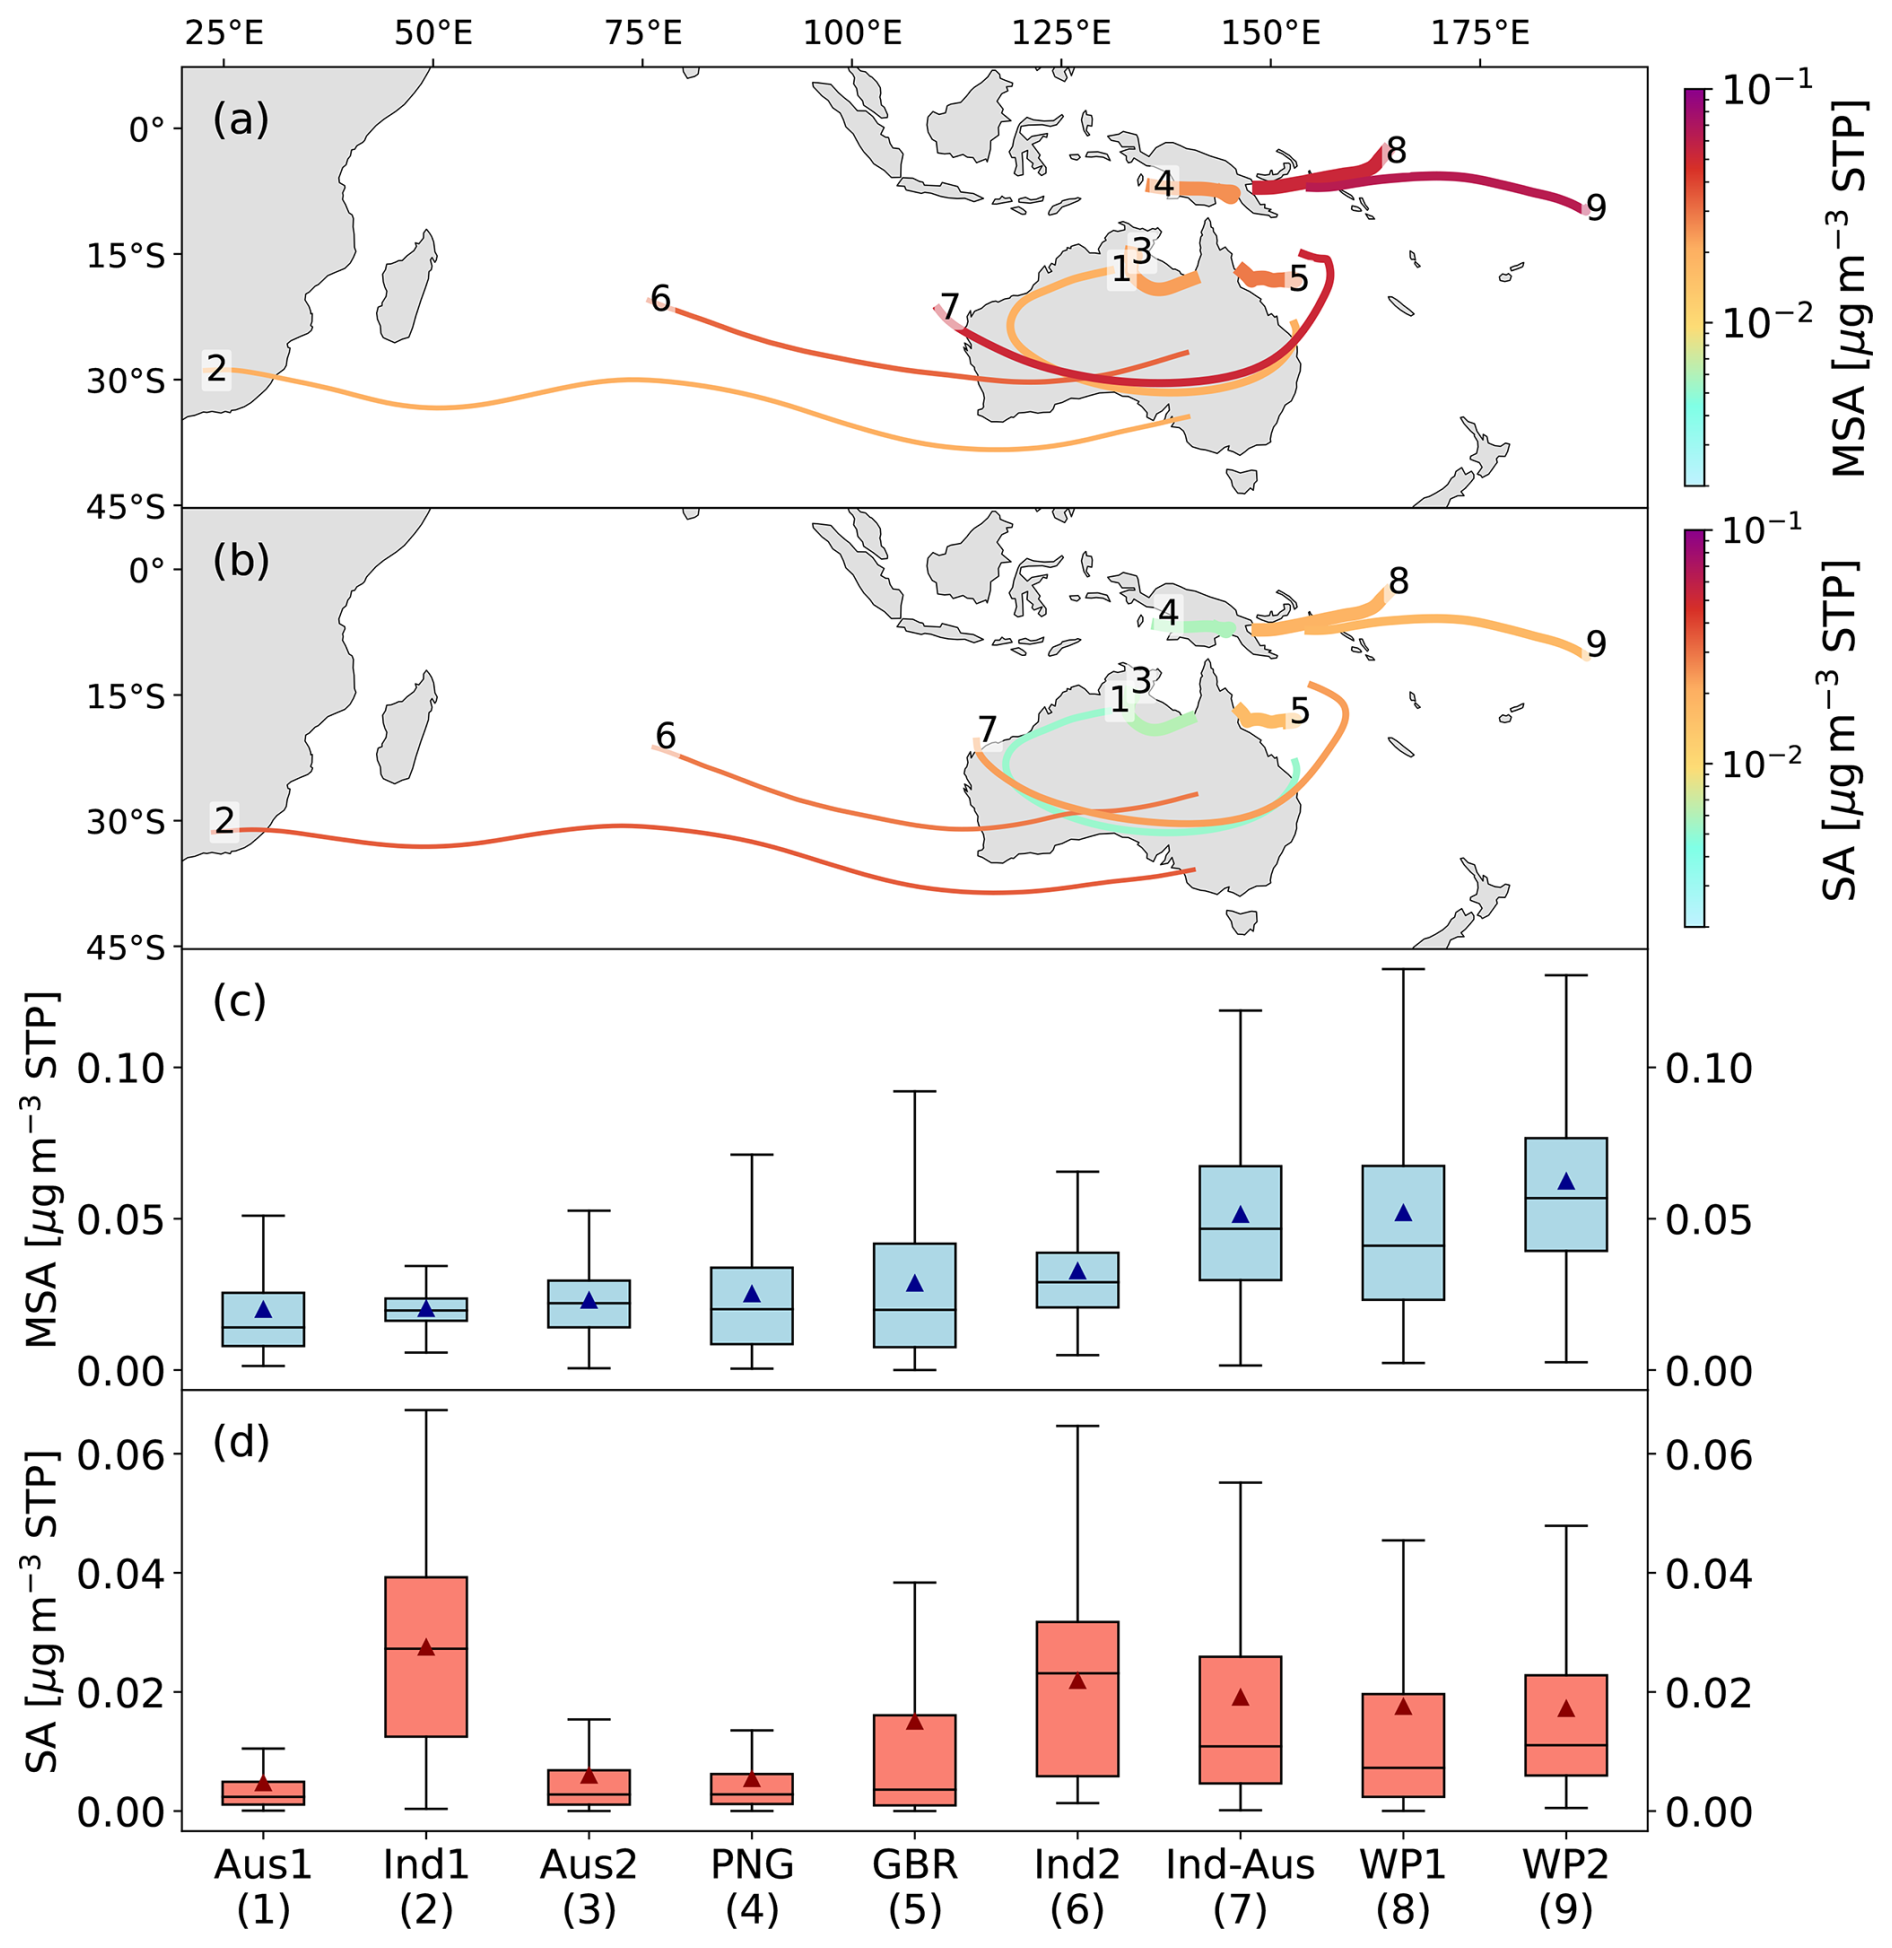
Figure 8Main air mass origins and corresponding MSA and SA concentrations. All HYSPLIT backtrajectories were sorted into nine main air mass origins using K-means clustering. The mean trajectory for each is plotted, coloured by the mean (a) MSA or (b) SA concentration. The line width is linearly scaled to the number of trajectories in the respective cluster (120–802 trajectories for MSA and 83–712 for SA). The clusters are numbered by increasing mean MSA concentration as indicated by the digit at the end of each mean trajectory. Box plots for (c) MSA and (d) SA show the nine clusters, with the mean indicated as a triangle marker. The clusters are identified by their origin (Aus – Australia, Ind – Indian Ocean, PNG – Papua New Guinea, GBR – Great Barrier Reef and WP – Warm Pool) and the respective number shown in (a) and (b).
3.2.5 Airmass origin
The process of aerosol formation from DMS transport and oxidation observed in RF18 is likely to occur frequently in the area as large convective systems form daily during the wet season (Wilcox et al., 2023). MSA and SA found in the particle phase might have been produced days before sampling the air mass. Therefore, it is necessary to consider the origin of the air mass and its history during the past days. Five-day HYSPLIT backward trajectories and K-means clustering (MacQueen, 1967) were used to determine the main source regions. Euclidean distance clustering is applied to account for spatial, temporal and transport-path similarity. The number of clusters was determined empirically to achieve an optimal representation of distinct but representative airmass origins. Figure 8a and b show the mean trajectories for the nine clusters that were identified, coloured by the mean acid concentration. The mean, median and standard deviation for each cluster are shown in Fig. 8c and d. A density plot of the trajectories contributing to the different clusters can be found in the Appendix (Figs. A17 and A18).
The lowest mean MSA concentrations are measured in trajectories around Papua New Guinea, above the Australian continent or in long-range transport from southern Africa (cluster numbers: 1, 2, 3, 4). Slightly higher values are measured for air masses close to the Australian coast and the Great Barrier Reef, but also in air from the Indian ocean (cluster numbers: 5, 6). The high MSA concentrations in cluster 7 could be a result of long range transport from the Indian Ocean or originate closer to the Australian coast. The highest MSA concentrations are found in trajectories originating in the Pacific Warm Pool (8, 9) with average concentrations of around 0.05–0.06 µg m−3. These trajectories pass through a region with one of the highest convective activities on earth (Wilcox et al., 2023). They also exhibit the lowest mean ozone values with only 22 and 17 ppbv, respectively, in agreement with convective uplift of low ozone air from the boundary layer.
The lowest SA values are also found in terrestrial air masses from Australia or Papua New Guinea (cluster numbers: 1, 3, 4). SA concentrations are elevated in air from the Pacific Warm Pool and the water off the Australian coast (cluster numbers: 5, 8, 9). Air originating from the Indian Ocean exhibits the highest SA levels (cluster numbers: 2, 6). Cluster 2 is the only cluster in which the mean SA concentration exceeds the mean MSA concentration. A likely reason is the influence of stratospheric air at these higher latitudes, which typically contains high concentrations of sulfate particles (Kremser et al., 2016). This is confirmed by the high O3 mixing ratio in this cluster, with a mean of 115 ppbv, which is at least a factor of 2 higher than for the other clusters. For all other clusters the SA MSA ratio is below 1 with values between 0.23 and 0.87.
There are no chemical sources for DMS in the free troposphere, hence its transport from the boundary layer is the most important source for SA and MSA. This can happen efficiently through the frequent deep convection in the ITCZ (Inter-Tropical Convergence Zone). The ability of the HYSPLIT model to capture small-scale convection and accurately represent vertical transport associated with it is limited due to the large grid size of the meteorological data. Therefore, satellite data is crucial for the identification of convective events. Combining the cloud type identification of the Himawari satellite and the trajectories, we can trace back each measurement to the last contact with a convective system. This is done by computing the mode cloud type in a 15 km radius around the location of the air parcel for every hour. The first encounter of a very high opaque cloud (type 9) is considered convective outflow if the air parcel is in an altitude between 8 and 15 km. The convection is subsequently characterised as over land or over ocean.
Using this method, approximately 75 % of the measured data points can be traced back to convection during the past five days. Figure 9 shows the mean MSA and SA concentrations (combined gas and particle phase) as a function of the time since the most recent convective encounter. It is distinguished between convection that occurred over land and over the ocean.
Low SA values are detected for convection over land, regardless of the time of convection. MSA concentrations are elevated and show a small increase between 5–20 h. This indicates that even for terrestrial convection, some DMS is transported, which might be the case for convection in coastal areas. In the boundary layer, DMS has a lifetime of more than one day (Xu et al., 2016) and could be transported inland during this time. For continental convection, especially over tropical rainforests other precursors will dominate, mainly isoprene (Curtius et al., 2024), with only small contributions from MSA and SA.
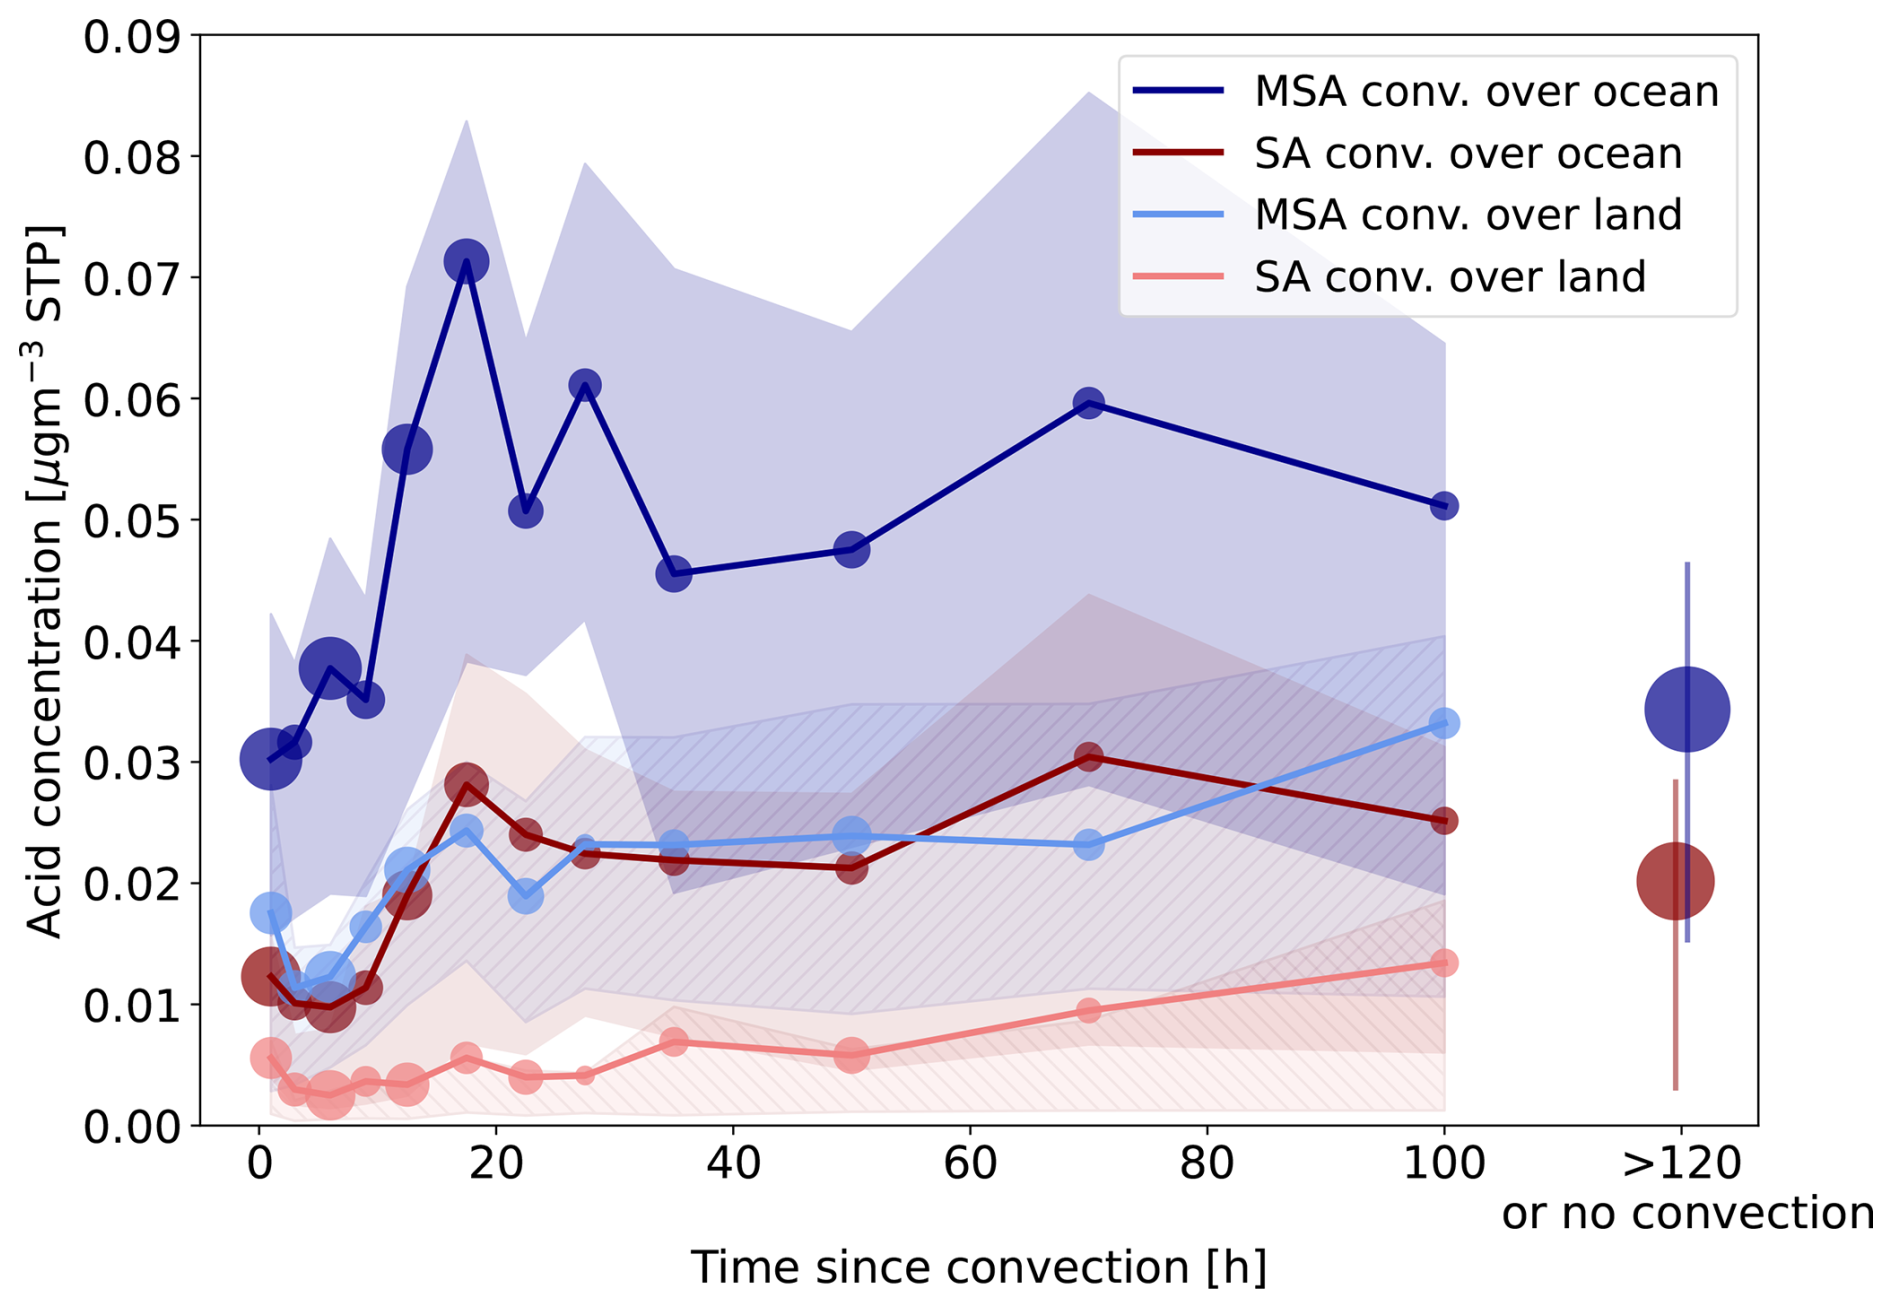
Figure 9MSA and SA concentrations plotted against the time since the last encounter of a deep convective cloud over ocean or land. HYSPLIT trajectories and Himawari cloud type data were used to determine the time and location of the convection. Only if the position of the air parcel was at the position of a high opaque cloud and at an altitude of 8–15 km, a convective uplift is assumed. The markers represent the mean concentrations and are placed at the midpoints of the identified bins. Their size is linearly scaled to the number of data points in each bin with a minimum of 32 and maximum of 832 points. The vertical line or shaded areas show the interquartile range with the striped ones indicating convection over land.
In fresh convection over the ocean, both MSA and SA concentrations are higher compared to over land due to the higher DMS emissions. Their presence immediately after the uplift indicates a rapid conversion of DMS in the cloud, similar to the situation in flight 14. The most striking feature, however, is the strong increase in both SA and MSA concentrations seen 15–20 h after the convection where the concentration increases by more than a factor of 2. This is most likely caused by the oxidation of DMS, which had been transported from the boundary layer by convection.
At cold upper tropospheric temperatures, low SA concentrations can initiate nucleation, with only 4×106 cm−3 SA (in the absence of any bases) being sufficient to produce a nucleation rate of 1 at −65 °C (Dunne et al., 2016). The particles accumulate mass by further condensation of acids, as observed in RF18. A slight decrease in concentrations is observed with increasing time since convection; however, values remain elevated, indicating that enhanced MSA and SA concentrations persist even in aged convection. The small decrease could be caused by the increasing uncertainty of the trajectories or mixing of the outflow with other air masses containing lower aerosol and acid concentrations.
The air masses that did not experience convection in the previous 5 d show lower MSA concentrations comparable to those of very fresh convection. The SA values are elevated, comparable to aged convective outflow. These concentrations could result from older convective events or other transport processes. The high SA MSA ratio here hints towards an additional source of SA not connected to convection, potentially stratospheric influence from air masses originating in higher latitudes, as discussed for cluster 2 in Fig. 8.
Most of the identified convective systems are located around northern Australia, Papua New Guinea and in the remote Pacific with a small contribution from the Indian Ocean (Fig. A19 Appendix). The highest acid values originate from the Pacific, as already indicated by the trajectory clusters. The surface DMS mixing ratios in this area are expected to be much lower compared to higher latitudes, however the high convective activity makes the region a hot spot for high upper tropospheric DMS (Fig. A11 in the Appendix).
Despite the relatively simple method for identifying convective transport used here, the results present a coherent picture confirming convection as a source of MSA and SA to the upper troposphere in the marine environment.
3.3 Chemical box model
To compare our results with expected DMS oxidation timescales in the upper troposphere, a kinetic box model was used (Fig. 10). The simulations were performed under fixed meteorological upper-tropospheric conditions. The model temperature was held constant at 223 K, the pressure at 200 hPa, and the relative humidity at 60 %. These values are representative for an outflow altitude of 12 km similar to the case studies of RF14 and RF18 and within literature values of tropical outflow altitudes of 10–17 km (Folkins and Martin, 2005). The mixing ratios of major background constituents O2, N2, CO, O3 and H2O were kept constant, to isolate the chemical evolution of the sulfur and radical species of interest. O3 was set to 30 ppbv comparable to the values in RF18. NO was initialised with 40 pptv corresponding to the low values encountered in the marine upper troposphere (Nussbaumer et al., 2025). NOx and all other species in the mechanism were allowed to evolve freely according to the coupled gas-phase chemistry and photolysis.
The DMS mixing ratio is initialised with 50 pptv. After initial equilibration, it is around 45 pptv, a value that can be reached in convective outflows in the region and during the time of the campaign according to the CAMS global reanalysis (EAC4), see Fig. A11 in the Appendix. The DMS chemistry is based on Shen et al. (2022) and Jacob et al. (2024). The OH mixing ratio follows a diurnal cycle determined by the solar radiation and chemical reactions. Photolysis rate coefficients were computed online with the JVAL module, configured to represent an upper-tropospheric air mass in the vicinity of the equator. No additional primary emissions or loss processes were imposed beyond those implicit in the chemical mechanism; thus, the temporal evolution reflects purely chemical transformation.
DMS decreases strongly within the first 10–15 h and is essentially completely oxidised during the second day. Consequently, a steep increase in SA and MSA concentrations can be seen around the same time with MSA concentrations strongly exceeding those of SA. Due to the lack of losses, the acids simply accumulate over time. The increase of MSA seems to be quicker, whereas SA increases more gradually over multiple days due to the slower oxidation of SO2. Consequently the SA MSA ratio increases slightly over time from 0.05 to 0.13 (Shen) or 0.05 to 0.25 (Jacob).
The DMS mixing ratio decreases more slowly in the Jacob mechanism than in the Shen mechanism. However, more MSA and SA are produced using the Jacob scheme, which indicates a more efficient conversion of DMS to acids. The DMS in the Shen mechanism is largely converted to HPMTF, which has mixing ratios 3–4 orders of magnitude higher than in the Jacob scheme (Fig. A20). This could be caused by the low OH reaction rate in the Shen scheme or the additional HPMTF photolysis included by Jacob et al. The higher SA formation in the Jacob scheme likely results from the enhanced production of SO2 (Fig. A20), while the Shen scheme has been shown to underpredict SO2 formation (Jacob et al., 2024). Overall, acid production is comparable between the two schemes, with the Jacob mechanism yielding 10 %–60 % more SA than the Shen mechanism. MSA concentrations are initially up to 20 % higher using the Jacob scheme but later remain up to 20 % lower than using the Shen scheme.
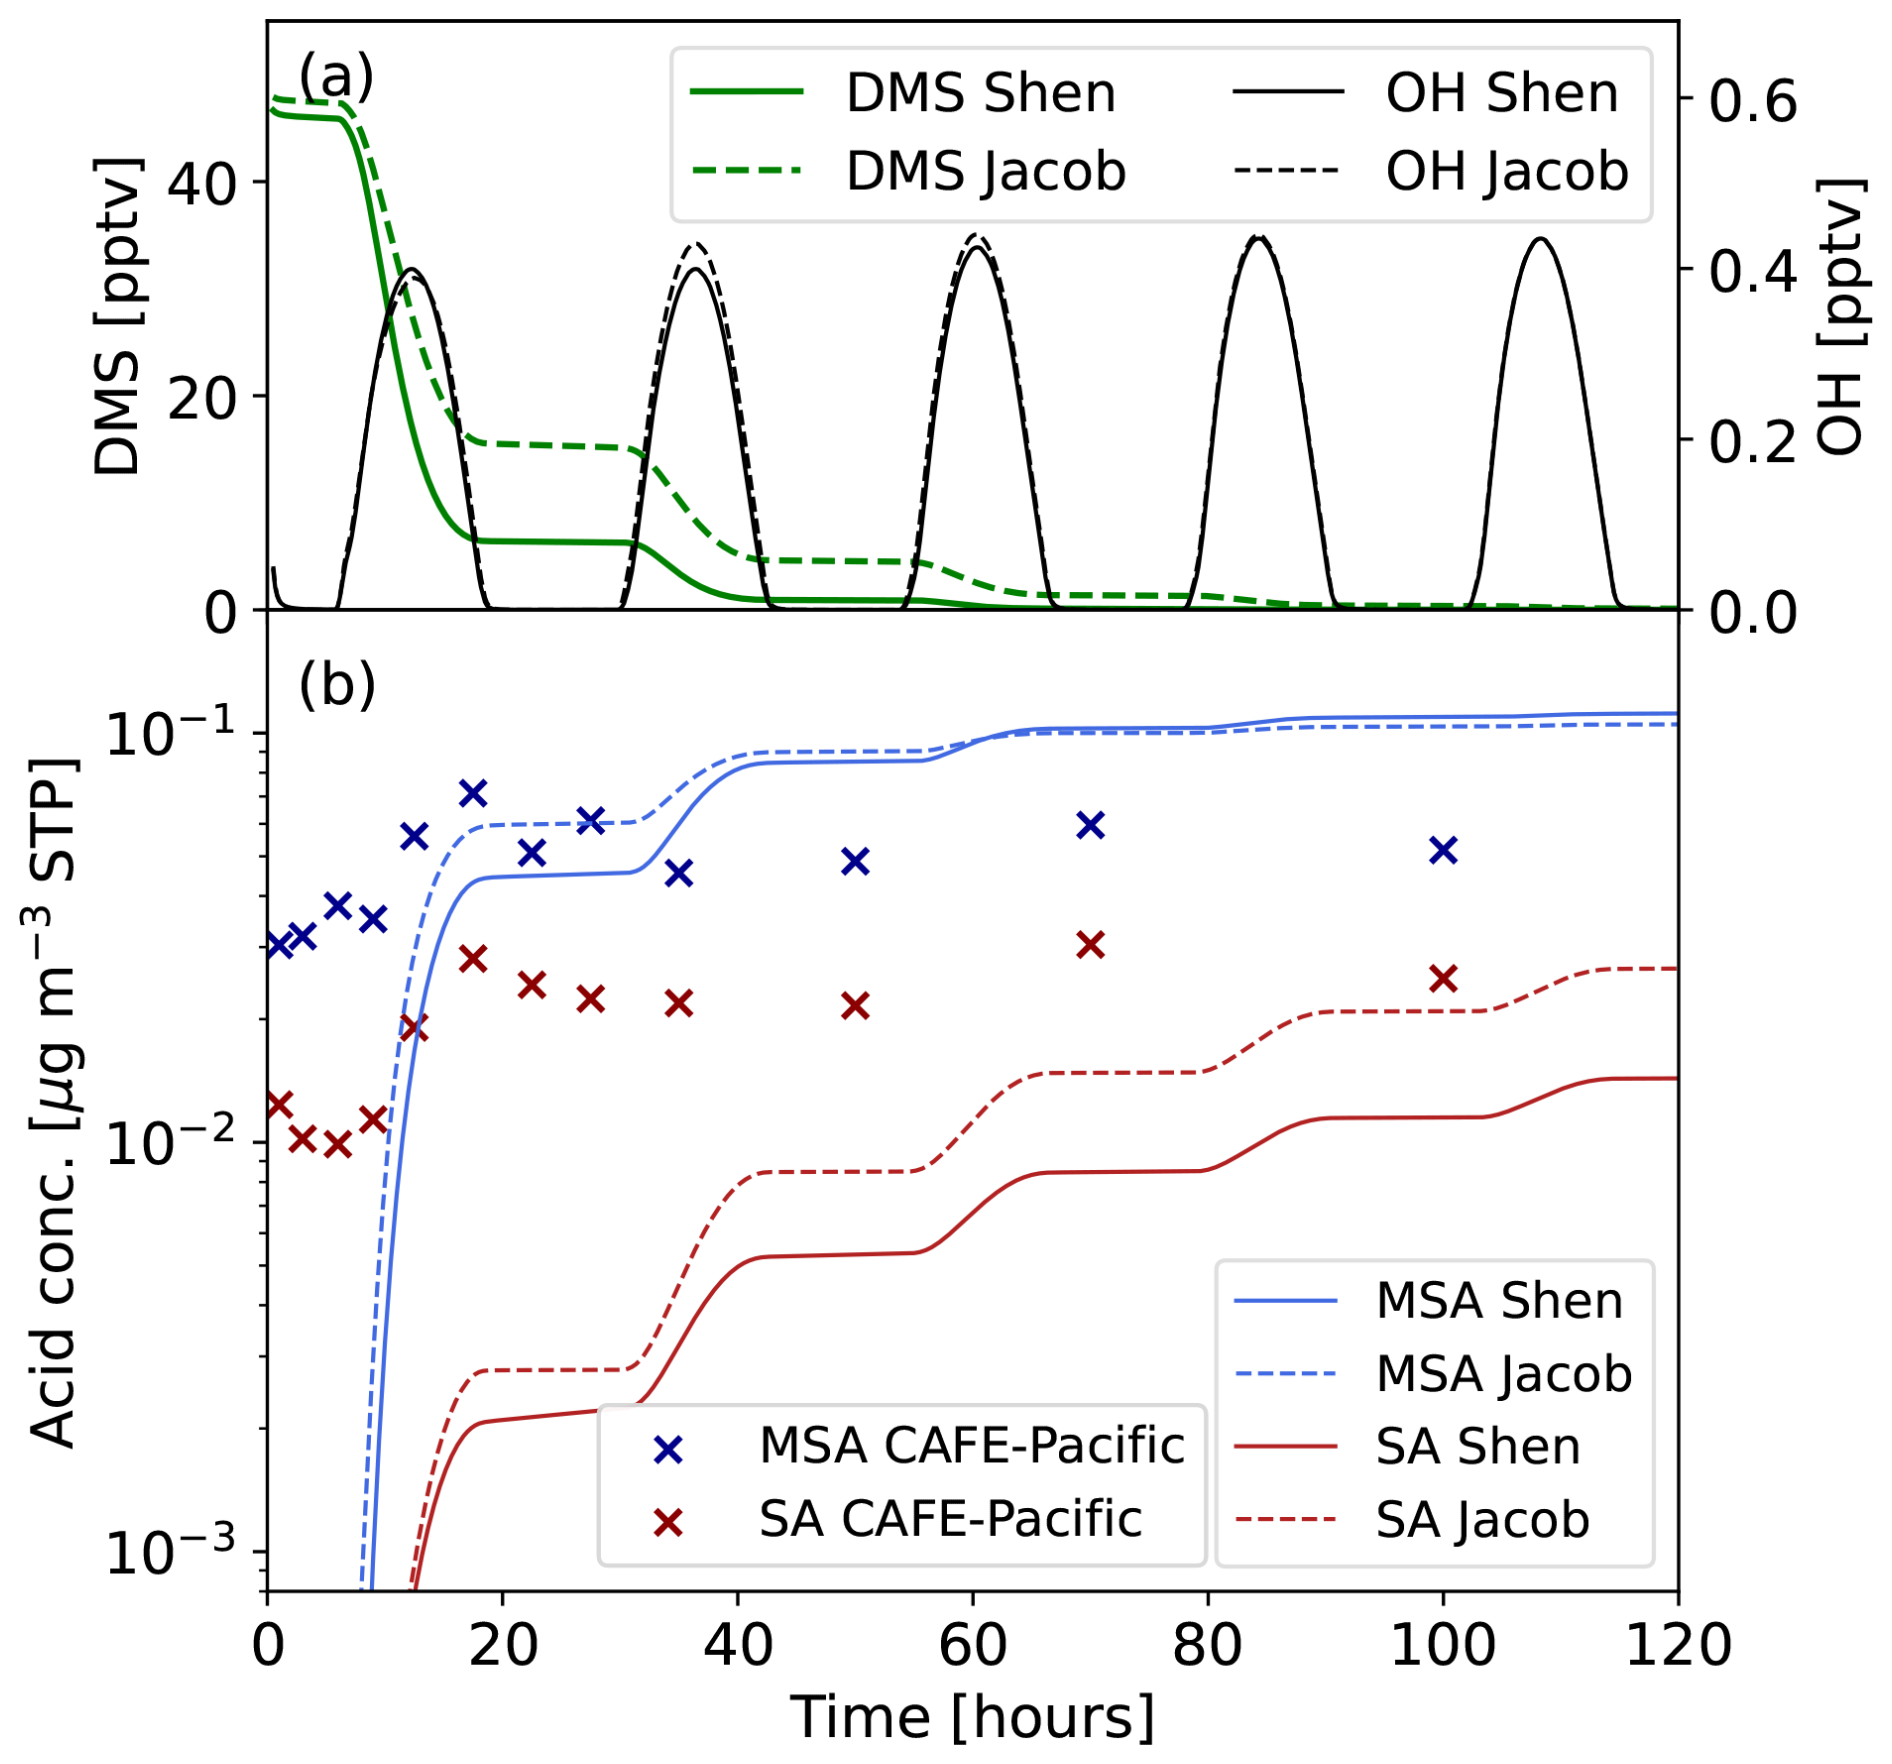
Figure 10Box-modelling of upper-tropospheric DMS oxidation using the chemistry schemes by Shen et al. (2022). Modelling is conducted under upper-tropospheric temperature and pressure (223 K and 200 hPa). Panel (a) shows DMS and OH mixing ratios over time; concentrations of other parameters can be found in Fig. A20, (b) shows modelled MSA and SA mass concentrations (converted to standard conditions) as well as their ratios. Only gas-phase chemistry is considered without dilution, nucleation or condensational loss processes for MSA or SA. Additionally, the markers represent the data collected during CAFE-Pacific and traced back to marine convection as shown in Fig. 9.
The oxidation timescale of DMS agrees well with our observations of maximum acid concentrations 15–20 h after the convective uplift (Fig. 9). The model output corresponds to the total production of SA and MSA by gas-phase oxidation of DMS. It can be directly compared to the measured data if aqueous-phase processes are disregarded. We did not observe the more gradual increase in SA or MSA suggested by the model, although it could be masked by atmospheric mixing processes. The predominance of MSA over SA aligns well with our measurements and with the altitude trend already observed in the gas phase. However, the measured SA MSA ratio is higher than in the model, indicating a stronger formation of SA in the atmosphere than predicted.
The absolute values predicted by the model are in the same range as our measurements with mean MSA values between 0.045 and 0.07 µg m−3 but peak values, for example in RF18, reaching above 0.2 µg m−3 (Fig. 5). The variations are likely caused by different initial DMS concentrations depending on the strength of convective transport and surface DMS mixing ratios. The SA concentrations are lower than our measured values of around 0.02 µg m−3. This indicates either an overly slow or overly weak production of SA in the model, or the presence of additional SA sources in the atmosphere, such as transport of volcanic or anthropogenic SO2 – though this is not expected to be efficient (Ma et al., 2025). The branching ratio between MSA and SA can also be influenced by the O3 or NOx concentrations. However, NOx is expected to have a minor influence (Fig. A10, Shen et al., 2022; Nussbaumer et al., 2025) and the approximate agreement in MSA concentrations rules this out as an explanation for the discrepancy unless the initial DMS concentration is significantly higher. Chemical processes that could increase the SA yield are a more efficient conversion of SO2 to SA, of DMSO2 to SO2 or of HPMTF to SO2. It should be considered that most DMS chemical schemes and experiments have been focused on marine BL conditions potentially missing pathways or accurate reaction rates for the cold conditions of the upper troposphere.
Oxidation of DMS by halogens is not considered in the box model. To estimate the potential impact, a sensitivity run was initialised with 5 pptv of Br2 and 5 pptv Cl2 which are rapidly converted to BrO and ClO. The results in Fig. A21 show a more rapid oxidation of DMS an enhanced production of MSA (50 % in Shen and 90 % in Jacob) while SA concentrations are affected less. As these halogen mixing ratios are within the upper range of ambient observations (Hobe et al., 2011; Koenig et al., 2017), their omission in Fig. 10 is unlikely to have a major impact. NO3 and O3 oxidation are included in the chemical scheme but play negligible roles due to the low concentrations.
A shortcoming of the box model setup is the lack of aqueous-phase reactions, which have been shown to play a major role in DMS processes (Hoffmann et al., 2016; Chen et al., 2018). In the BL, cloud processing is a crucial process promoting MSA formation and reducing SO2 concentrations through the uptake of HPMTF (Hoffmann et al., 2016; Chen et al., 2018; Jernigan et al., 2024; Novak et al., 2021). It can occur in the convective cloud during the uplift and the resulting MSA and SA may be injected in the particle phase into the upper troposphere. This could be the reason for the enhanced values shortly after contact to a convective cloud. However, the case study of RF14 and previous aircraft campaigns indicate low particle concentrations in cloud outflows (Andreae et al., 2018; Curtius et al., 2024). More detailed modelling would be required to quantify this pathway. Cloud processing can additionally happen after the injection of gas-phase DMS into the upper troposphere if another cloud is encountered. Using back trajectories and Himawari satellite data we estimate that less than 30 % and in many cases less than 10 % of data points had a second cloud encounter after convective uplift (Fig. A23). Excluding these data from the analysis changes the results only marginally. Furthermore, the majority of the encountered clouds are likely ice clouds, where aqueous-phase reactions are expected to be considerably less important than in liquid-phase cloud droplets. We have hence no evidence that aqueous-phase reactions strongly impact our results.
Another important drawback is the lack of dilution processes. After release into the upper troposphere, the air parcel undergoes dilution through mixing with the surrounding air. The decrease in MSA and SA by dilution can be calculated assuming an e-folding timescale of 2 or 3 d (Wang et al., 2000; Hernández Pardo et al., 2026), as shown in Fig. A22 in the Appendix. The resulting decrease does not negatively affect the agreement with MSA measurements. For SA, the dilution counteracts the slow increase, improving the comparison in the temporal trend with our measurements, while the absolute concentrations remain significantly lower in the model.
The simple box modelling here is limited in its representation of atmospheric processes, specifically due to the lack of aqueous-phase reactions and dynamic processes. Nevertheless, we achieve good agreement regarding the time scale of DMS oxidation and produced MSA concentrations. Discrepancies in the SA concentrations should be addressed in further studies using more advanced modelling and potentially chemical reaction coefficients optimised for upper tropospheric conditions.
The CAFE-Pacific campaign allowed a unique insight into the atmospheric processes of the tropical troposphere. We found high concentrations of gaseous MSA and SA in the marine boundary layer exceeding 107 cm−3, indicating significant DMS emissions and efficient oxidation in the region. While SA values decreased steeply above the boundary layer, MSA concentrations increased with altitude in the free troposphere. The trend agrees well with chamber studies on the temperature dependence of DMS oxidation (Shen et al., 2022). However, the detected MSA SA ratios seem higher than expected from a kinetic model indicating additional MSA sources potentially from evaporation of particles in the free troposphere or DMS oxidation by halogens which is not considered in the model.
At high altitudes, we were able to measure MSA and SA as a combination of gas and particle phase with a significantly lower limit of detection and cut-off diameter than the C-TOF-AMS. For acidic particles, a comparison of both instruments confirms the quantitative nature of our measurements. Most importantly, we were able to measure the MSA and SA content of ultrafine particles below the cut-off diameter of the C-TOF-AMS. We detect a wide range of SA concentrations from 0.001 to more than 0.1 µg m−3, with higher concentrations typically associated with marine origin. MSA is the dominating acid and appears to be uniformly distributed both horizontally and vertically, suggesting efficient long-range transport and ubiquitous presence in the upper troposphere.
We identified the last contact of the measured air masses with deep convective systems by combining HYSPLIT back trajectories and satellite observations. MSA and SA were found at low concentrations in recently advected air with limited OH exposure, in agreement with the low particle abundances, which are likely remnants of evaporated clouds. Roughly one order of magnitude higher MSA concentrations and up to 10 000 particles per cm−3 were detected for a recent convection with OH exposure. This is a clear evidence of DMS transport in the gas phase and subsequent oxidation in the upper troposphere. While we cannot exclude the contribution of other gases to the nucleation mechanism, our results indicate that DMS oxidation products are the dominant component of these particles, with MSA serving as the most important growth species.
Enhanced MSA concentrations were encountered during multiple other flights as well. RF08 is another example of enhanced particle-phase MSA with a marine origin (Figs. 4, A24). During RF21 in the Warm Pool region up to 20 000 cm−3 nucleation mode and 10 000 cm−3 Aitken mode particles were detected with enhanced SA and MSA concentrations of around 0.05 and 0.1 µg m−3 respectively (Fig. A25). These could originate from a convective system observed approximately 24 h before the flight (Fig. A26). A more detailed analysis of the particle size distribution during the entire campaign and their origin will be the focus of a future publication.
Combining all research flights, a doubling in concentration of both particulate MSA and SA is seen 15–20 h after marine convection. This aligns well with the lifetime of DMS against oxidation, as confirmed by the kinetic model. This indicates that, similar to the isoprene system above tropical rainforests, DMS emitted by the oceans can be transported by deep convection to high altitudes where it is oxidised to MSA and SA, thereby presenting an essential particle source in a very pristine environment. The marine nucleation process is however somewhat weaker and slower than the isoprene system observed over the Amazon (Curtius et al., 2024), which makes it difficult to observe during a single research flight with a limited time span of 8–9 h. A longer OH exposure is needed to form sufficiently high acid concentrations to enable particle nucleation and growth. However, the high frequency and large spatial extent of deep convection above tropical oceans could lead to a slow but steady source of particles in the region (Williamson et al., 2019). Despite moderate surface DMS mixing ratios, the Indo-Pacific Warm Pool is a critical area for upper tropospheric particle formation due to the high convective activity.
The substantial evaporation of particles, which we observed in our inlet for temperature increases as low as 20 K above ambient temperature, could be highly relevant also for other instruments that rely on in-situ sampling of air and particles in low-temperature environments. Acidic particles appear to be very susceptible to evaporating gas-phase acids in response to changes of humidity or temperature. This could lead to a significant underestimation of particle size or concentration. In our aircraft measurements, this effect is weaker for the particle instruments than for SCORPION since they do not experience adiabatic heating due to the ram pressure effect. However, this could be offset by the lower flow rates and longer residence time in the inlets. Beyond MSA and SA, evaporation may influence gas-phase measurements of other species, such as nitric acid or low-volatile organic compounds. This effect was already implied in the publication about isoprene oxidation products in the Amazon's upper troposphere (Curtius et al., 2024). While we can not quantify the impact on all the organic species detected, the enhanced MSA concentrations reported in that publication can be attributed to particle evaporation. However, this does not alter the conclusions drawn in this study concerning the role of isoprene nitrates in particle formation.
The observed evaporation also raises the question of to what extent these acidic particles would survive downward transport through the atmosphere and can eventually act as CCN at lower altitudes. If MSA partitions from the particle phase back into the gas phase in response to changes in RH or temperature, it could participate in aerosol formation or growth multiple times before being removed from the atmosphere. This could provide a source of gas-phase MSA thousands of kilometres away from DMS sources and may explain the large horizontal and vertical distribution of MSA that we observed in the area. However, further studies are needed to fully understand marine aerosol formation, growth, and evaporation, as well as cloud processing and horizontal and vertical transport processes associated with tropical convection.
Our findings indicate that an accurate representation of particle concentrations in models requires accounting for the influence of marine deep convection and the aerosol formation it induces. In particular, the role of MSA is largely overlooked in current models. Note that the tropical Pacific is one of the few regions on Earth, which are less perturbed by human influence and can be regarded as approximately representative of pre-industrial conditions (Carslaw et al., 2017). The globally observable decrease in anthropogenic precursors such as SO2 could make these observations valuable for the prediction of future aerosol concentrations and effects. While the impact of climate change on DMS concentrations is still highly uncertain, Joge et al. (2025) suggests DMS fluxes could increase in the future, highlighting the importance of understanding its impacts on aerosol formation.
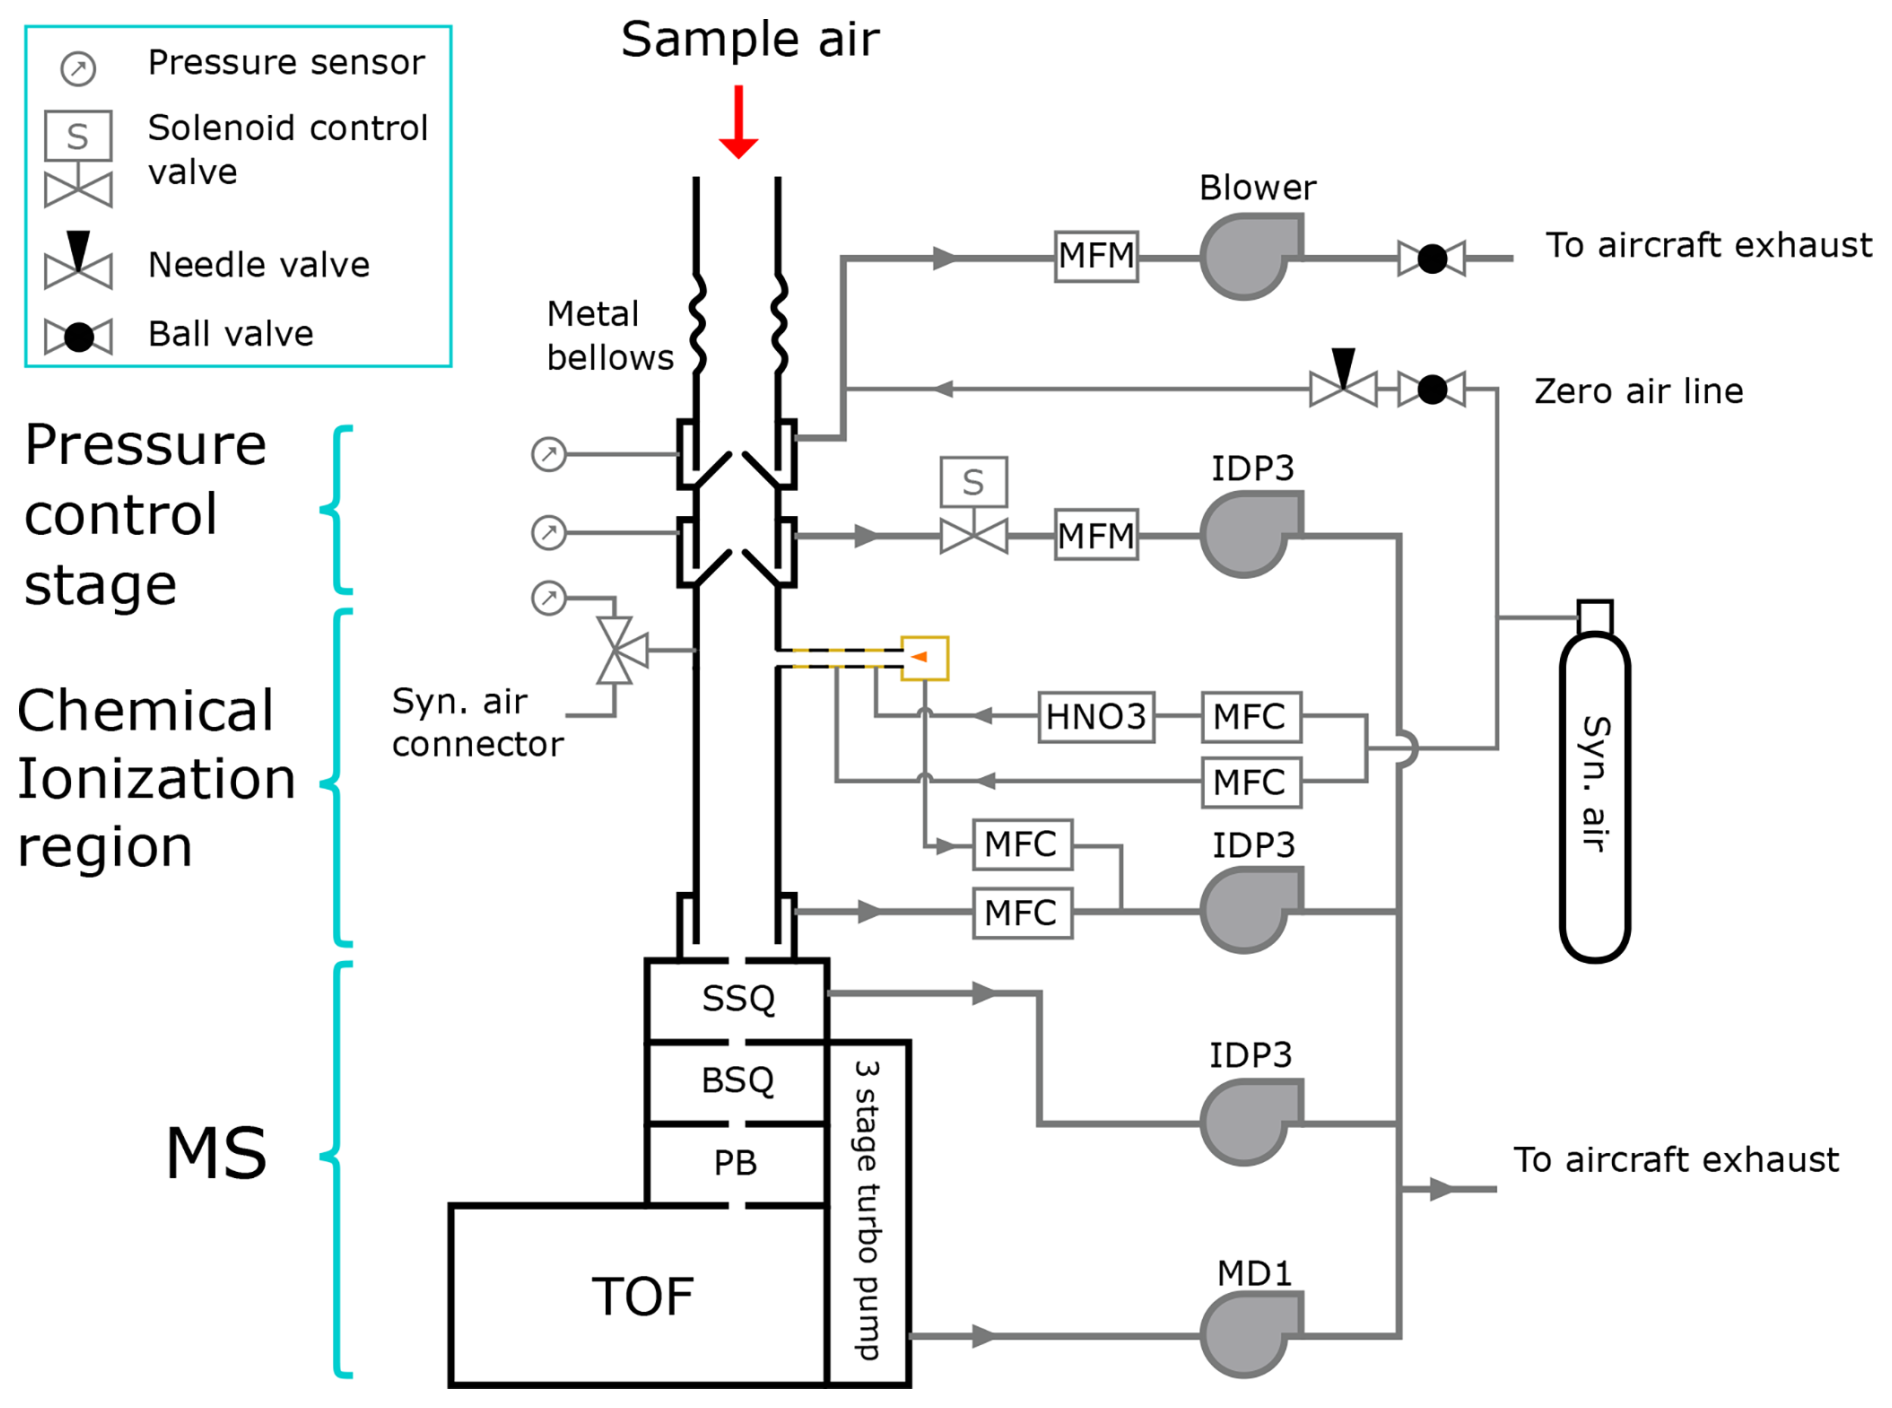
Figure A1Schematic of the SCORPION instrument used to detect MSA and SA during CAFE-Pacific. The instrument is connected to the LIF-OH inlet (not shown) and the sample flow is controlled at 20 L min−1. The pressure control stage retains the ion source pressure at 200 mbar. Nitric acid is delivered via a flow of synthetic air over a liquid reservoir and the reagent ions are produced by a corona discharge. The synthetic air is additionally used for background measurements during the flights.
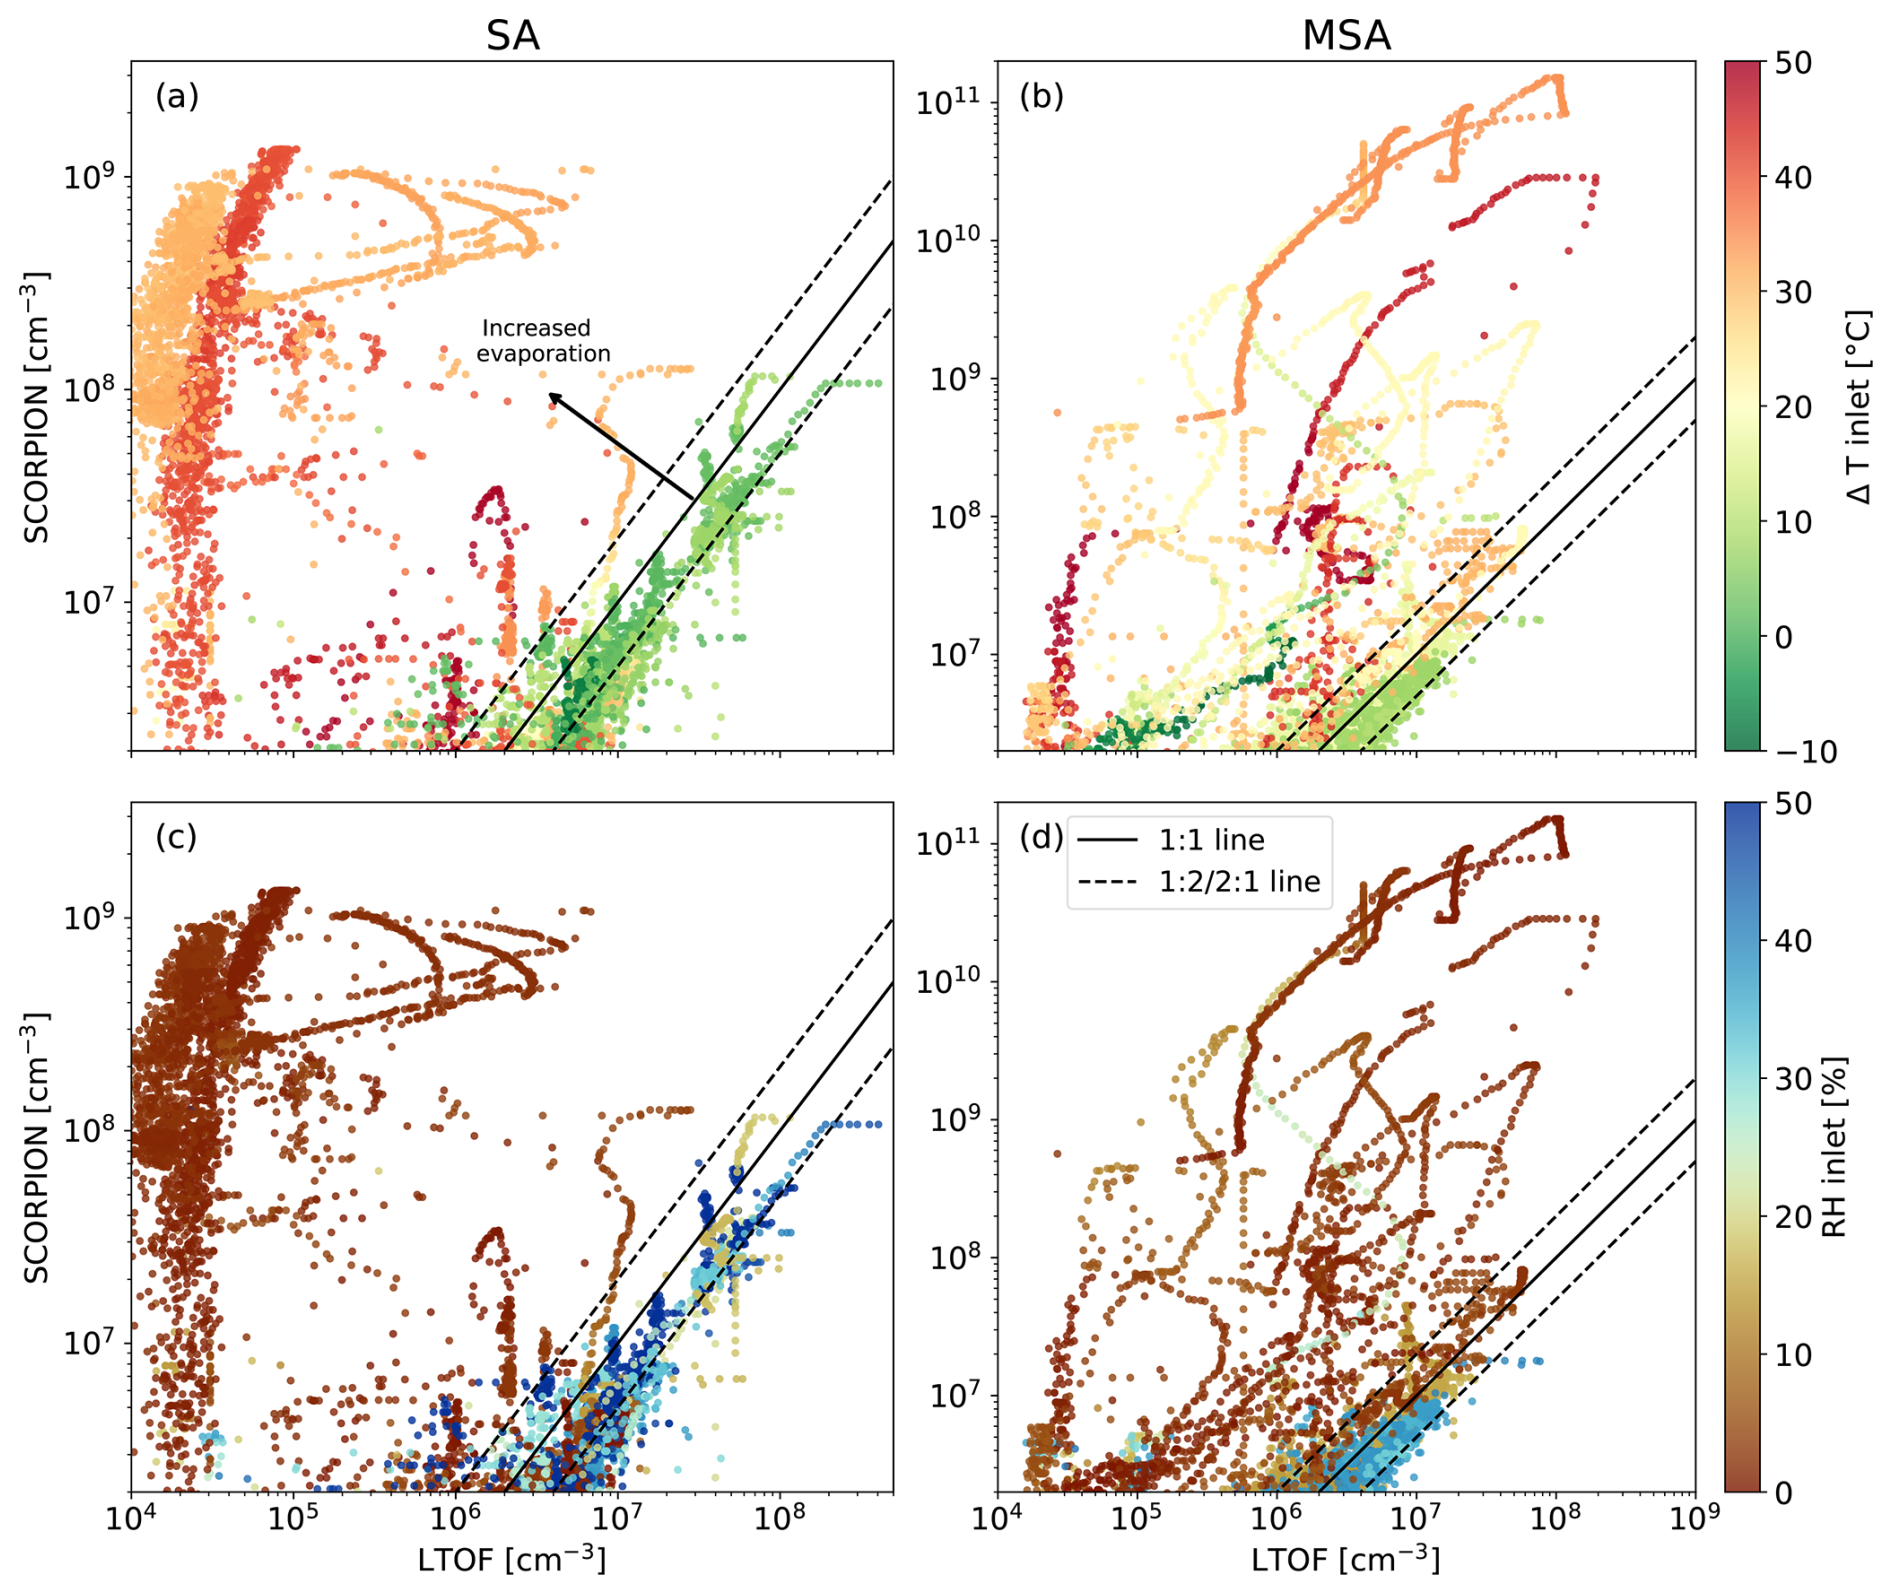
Figure A2CLOUD chamber comparison of SCORPION (HALO CI-APi-TOF) with another nitrate CI-APi-TOF (LTOF) measuring only gas phase for SA (a, c) and MSA (b, d). The data points are coloured by the temperature difference between the chamber and the SCORPION inlet (ΔT) in (a) and (b) or the corresponding RH in the inlet in (c) and (d). Datapoints close to the 1:1 line indicate both instruments measuring gas phase while points significantly above the 1:1 show that the values measured by SCORPION are influenced by particle evaporation. The colour scales show that the latter is the case for large temperature differences and low RH in the inlet.
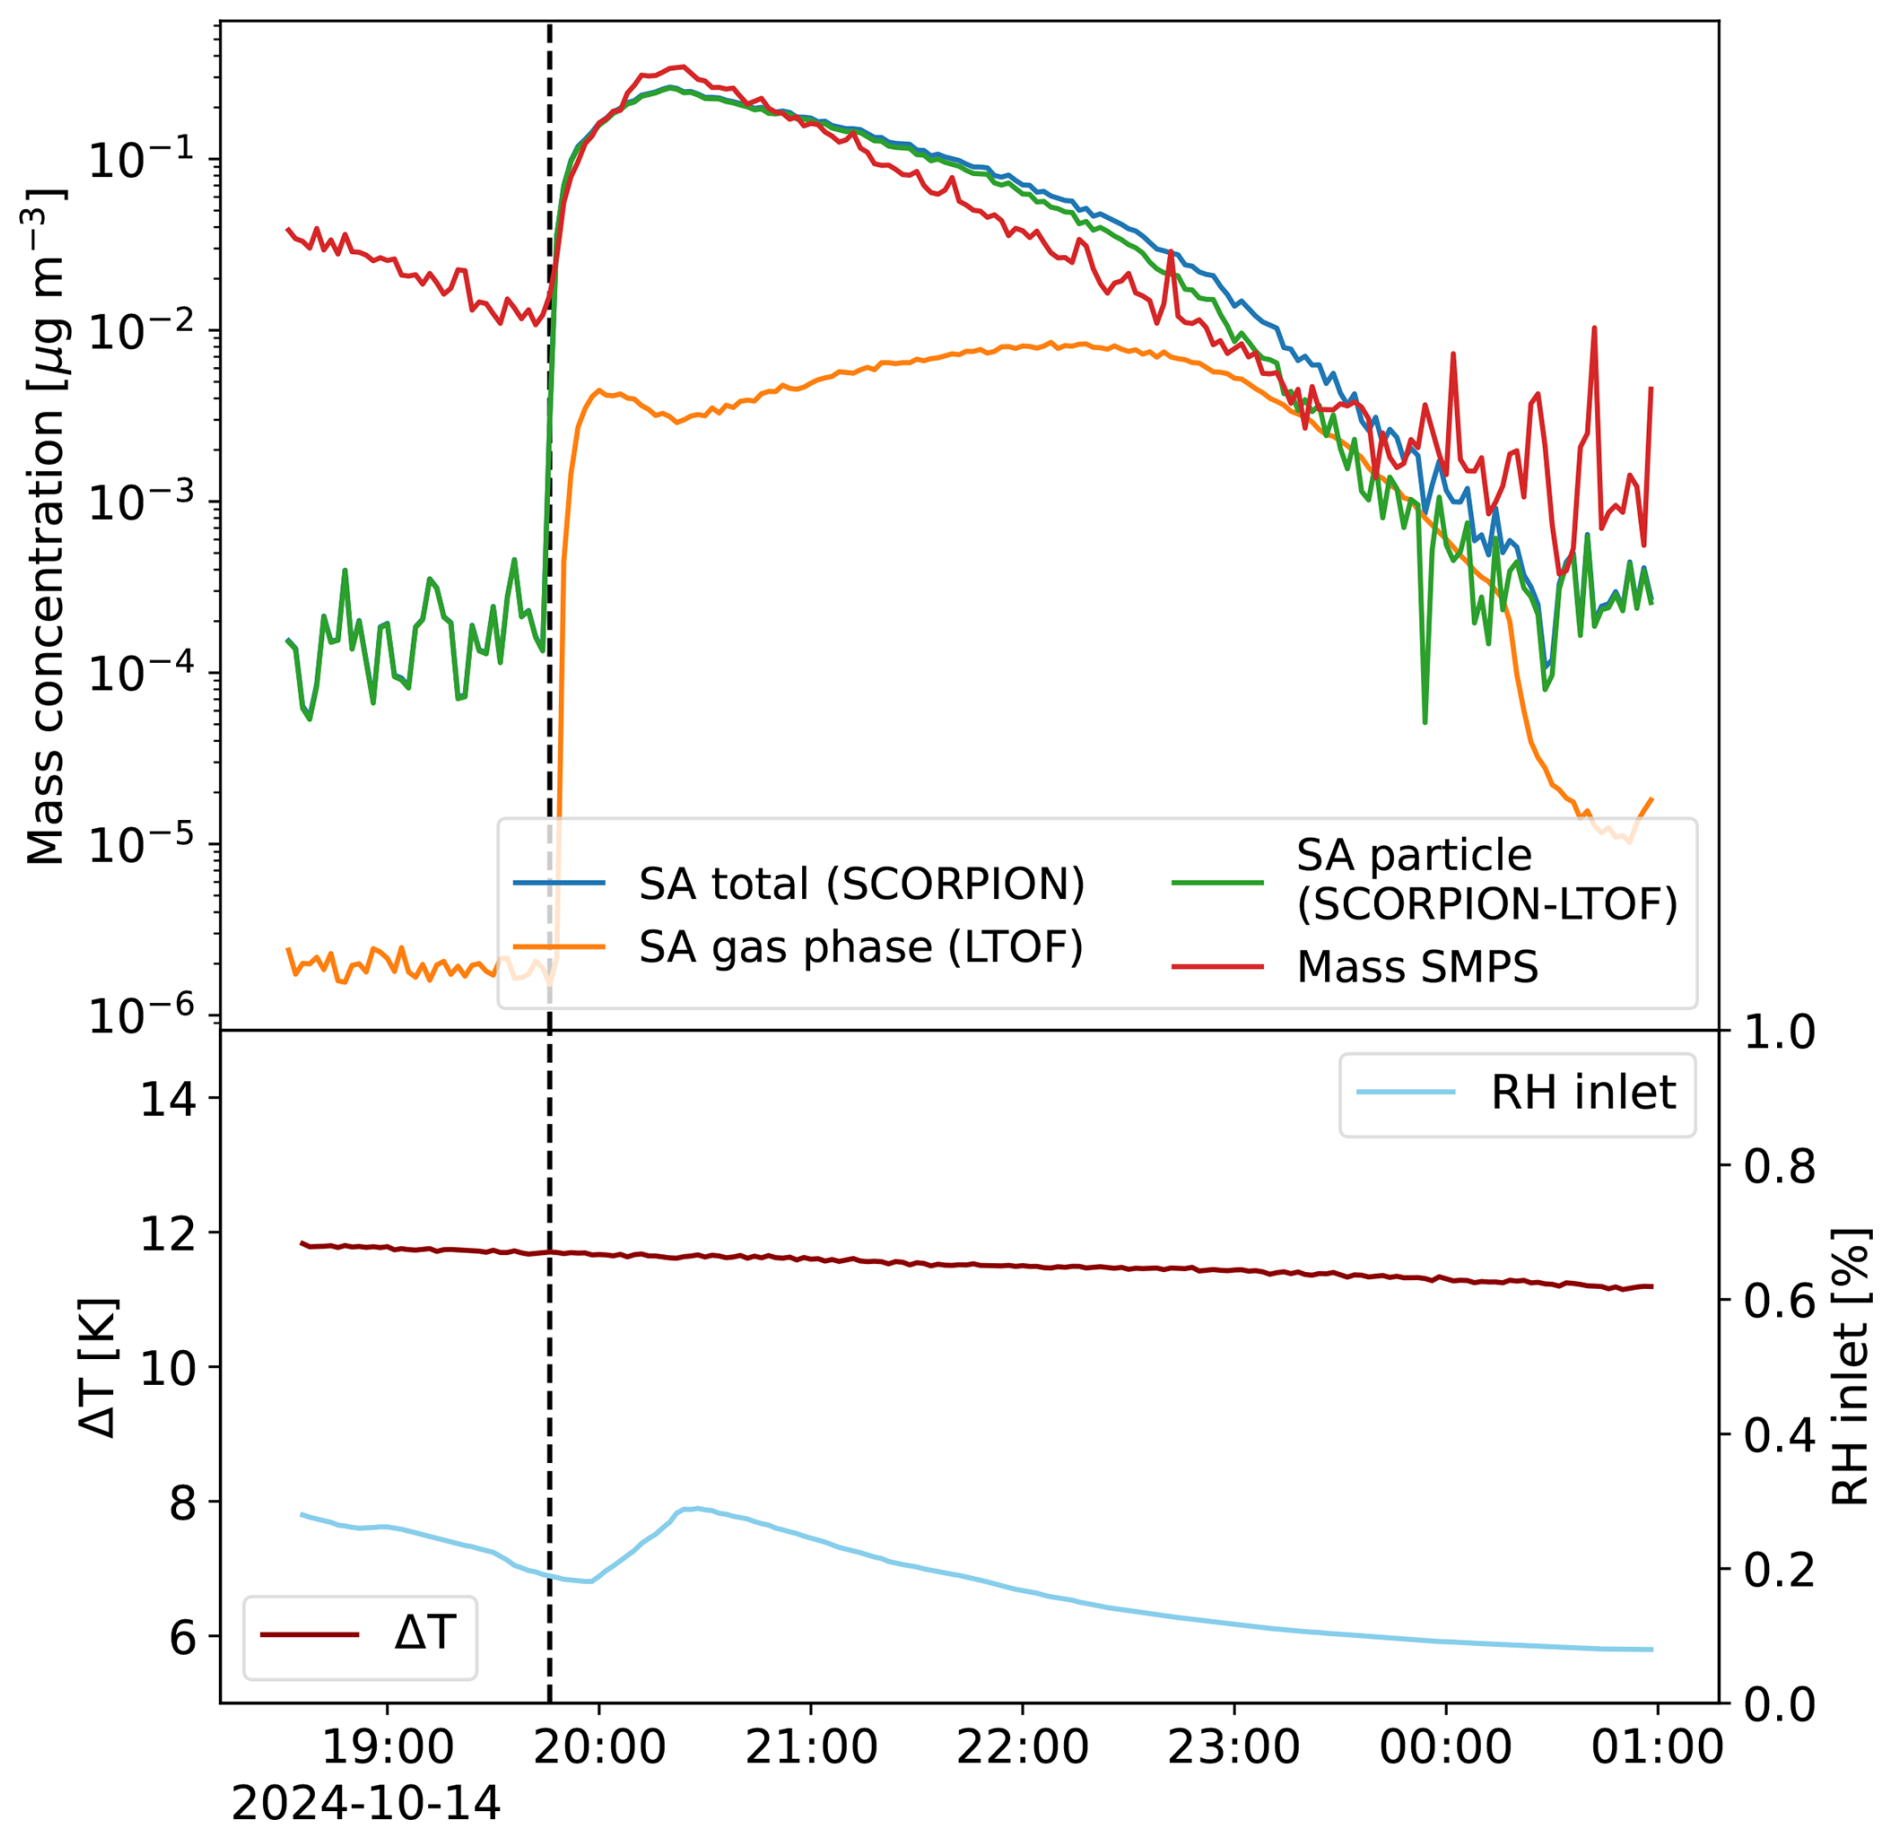
Figure A3Time series of an experiment at the CLOUD chamber showing the injection of approximately 30 nm pure SA particles from a flow tube into the CLOUD chamber. (a) shows the mass of SA detected by SCORPION, the gas-phase SA detected by the LTOF, the difference between both and the mass calculated from the particle size distribution recorded by the SMPS assuming a density of 1.8 g cm−3.
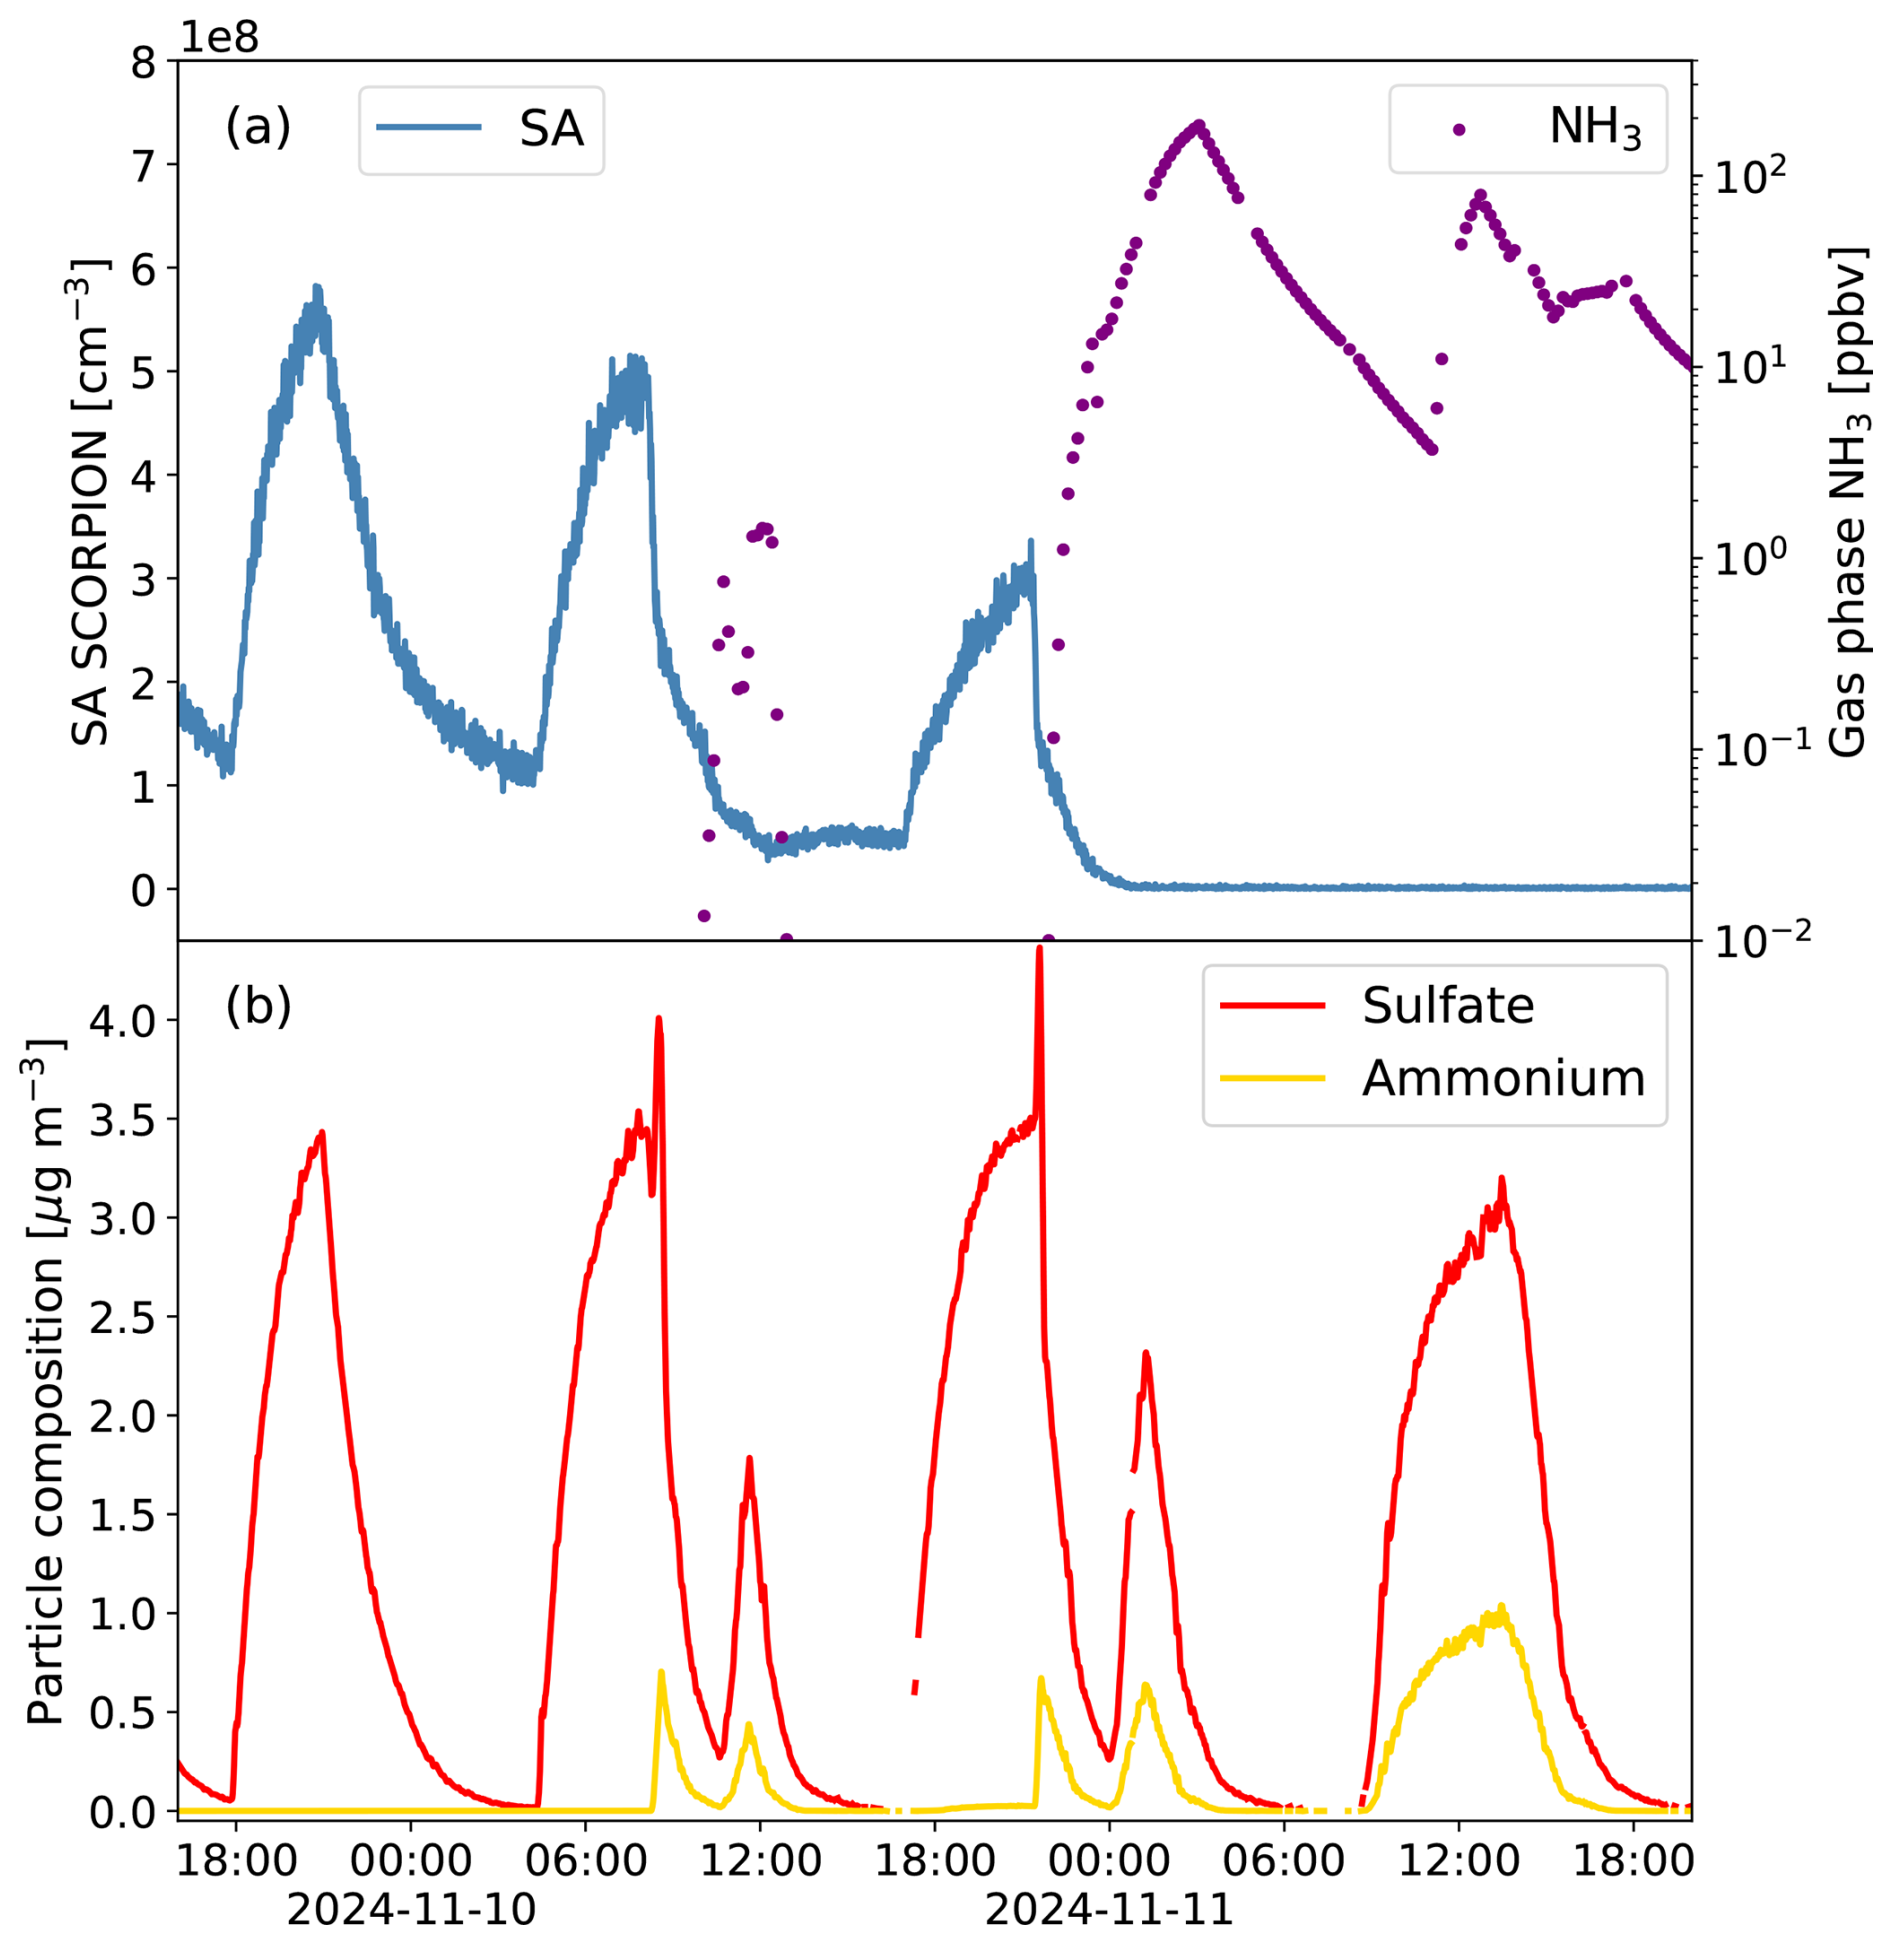
Figure A4Time series of multiple particle injection experiments during the CLOUD campaign in 2024. (a) shows the SA measured by SCORPION (combined particle and gas phase) and the gas-phase ammonia (NH3) detected by the TILDAS instrument. In (b) the particulate sulfate and ammonium measured by an HR-TOF-AMS are shown. Each peak in the sulfate data indicates an injection of pure SA particles from a connected flow tube. NH3 is only injected in the gas phase but rapidly neutralises the acidic particles. The gas-phase SA concentration is below 107 cm−3 for the entire period (not shown). With no or just background levels of NH3 present, the SA detected by SCORPION closely follows the sulfate measured by the HR-TOF-AMS, due to strong aerosol evaporation in the inlet. After the injection of ammonia, the SA concentration is decoupled from the particulate sulfate. This confirms that neutralised or partially neutralised particles are not susceptible to evaporation in the SCORPION inlet. Note that in these experiments evaporation was not complete due to the much larger particle size and mass compared to the upper tropospheric measurements.
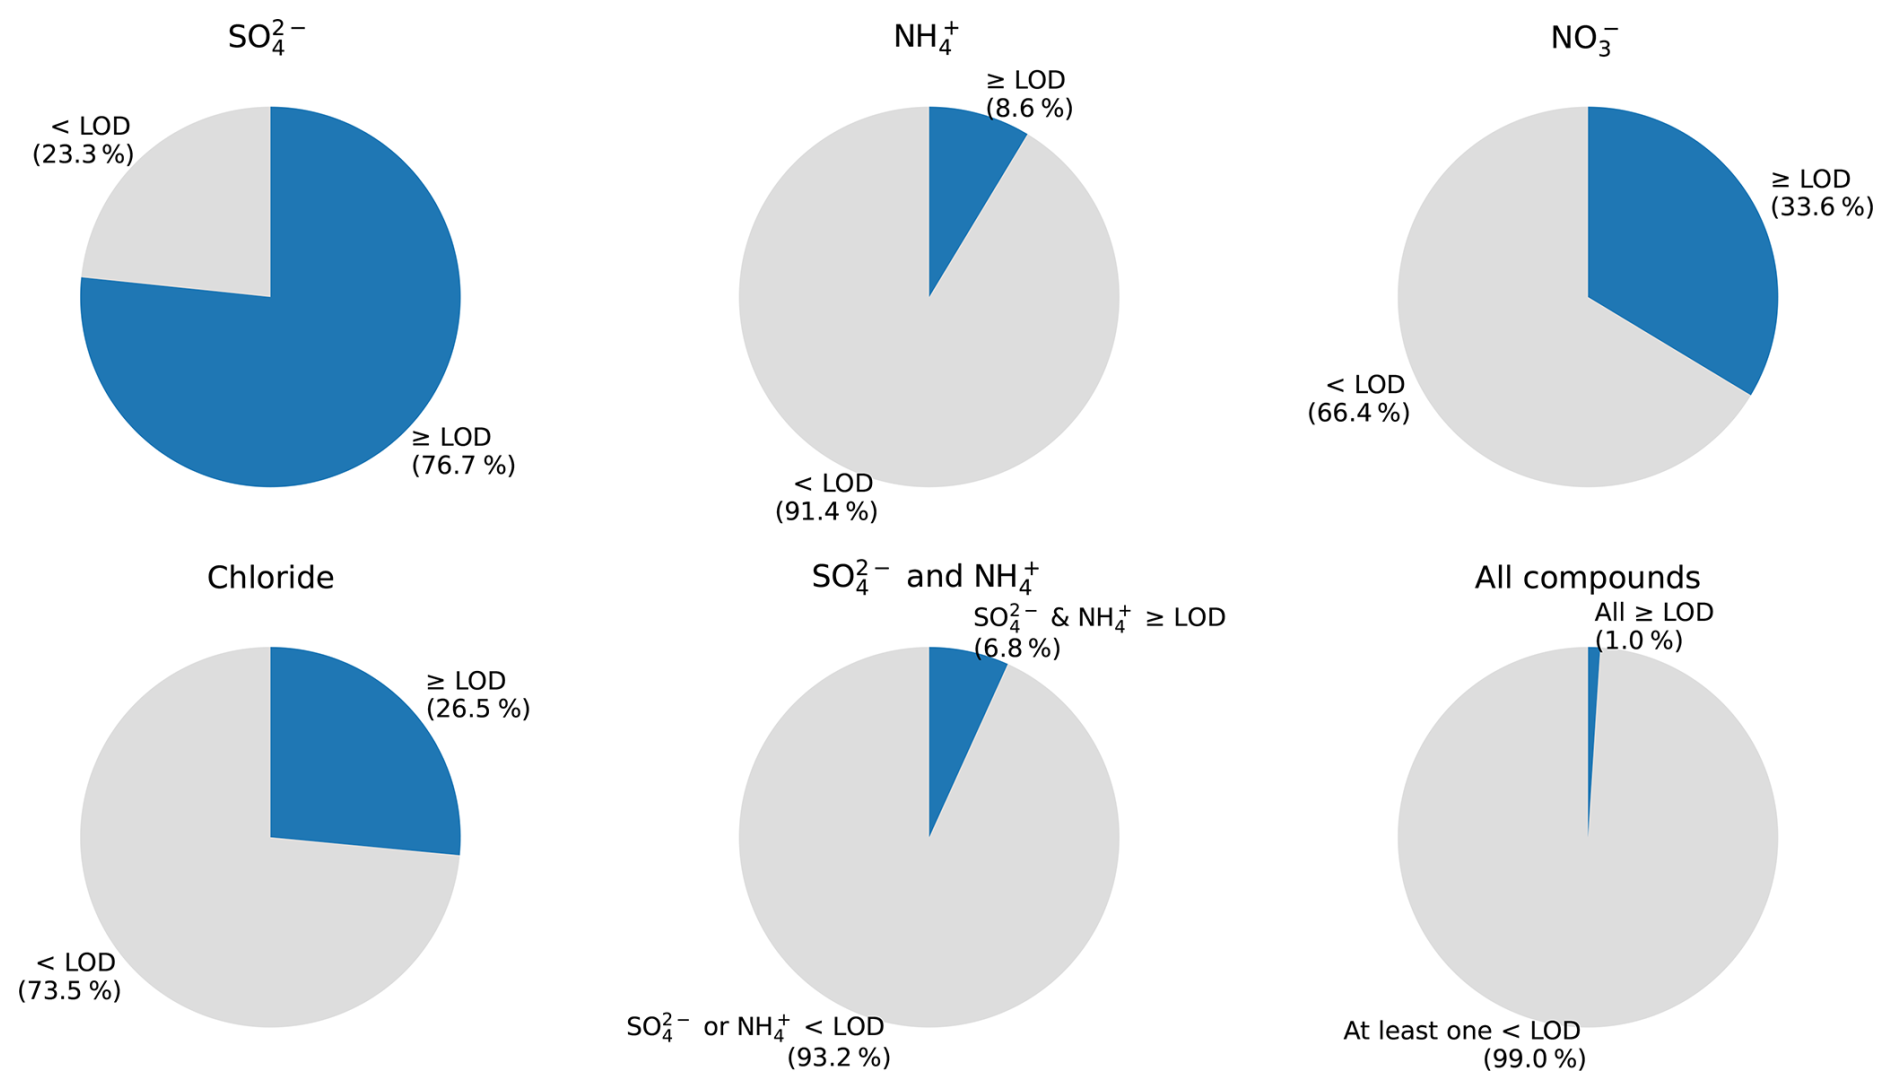
Figure A5Fraction of C-TOF-AMS measurements during CAFE-Pacific above and below the limit of detection. Only data points in the middle and upper troposphere are considered, where SCORPION is expected to measure particle phase as well.
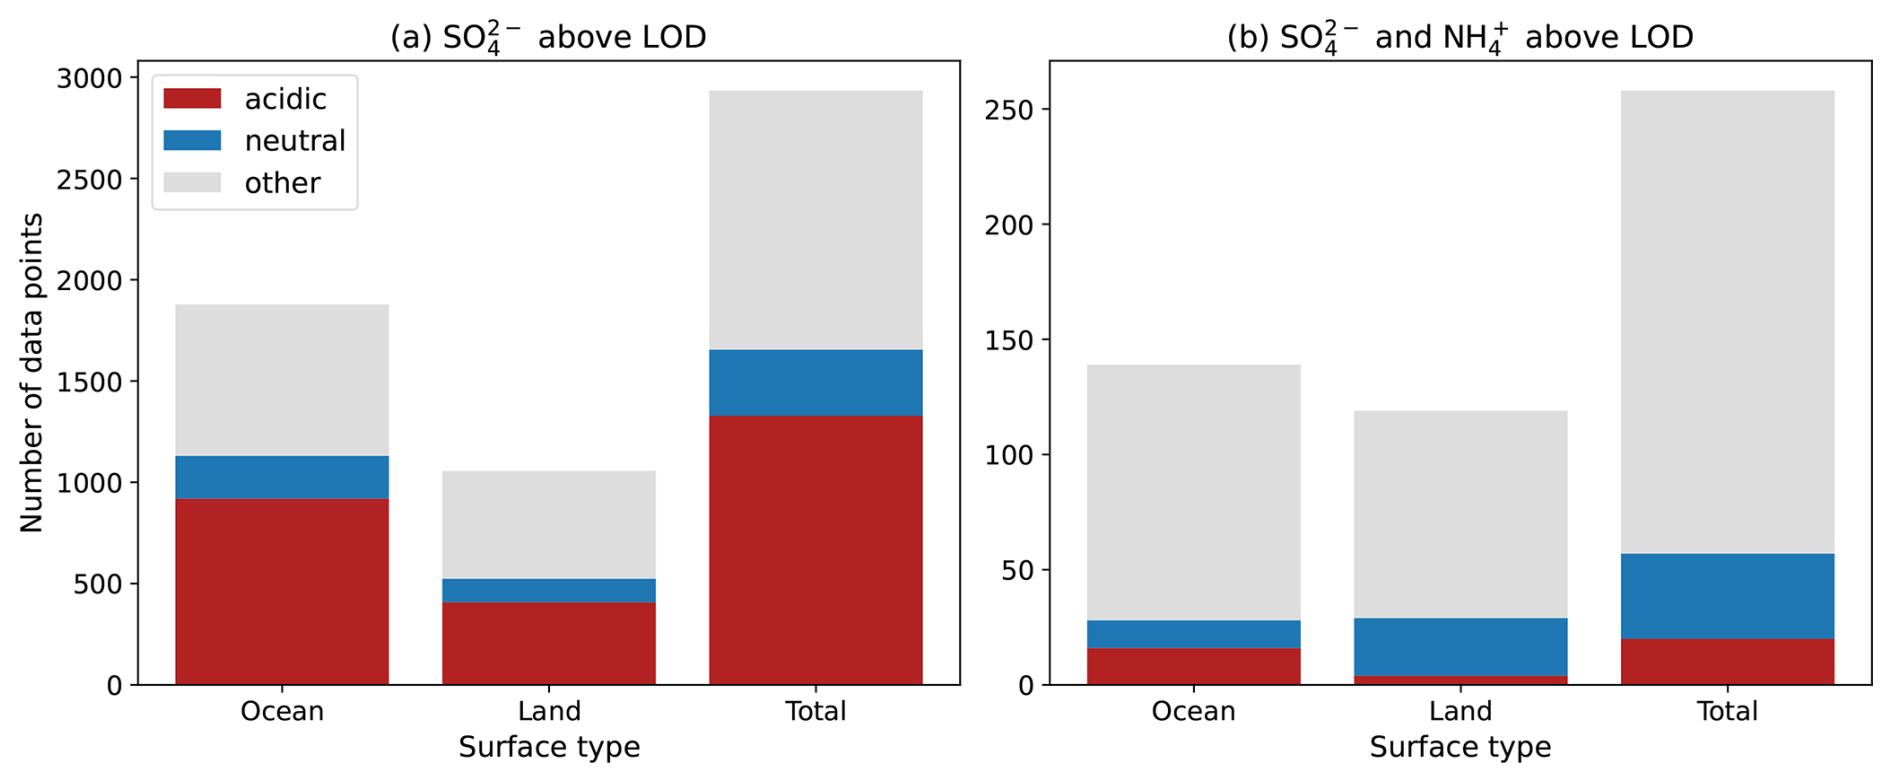
Figure A6Acidity measurements by the C-TOF-AMS during CAFE-Pacific. Shown are the amount of 1 min-measurements with acidic and neutral particles. Acidic particles are identified by a neutralisation ratio below 0.75 calculated according to Zhang et al. (2007). Neutral particles have a neutralisation ratio between 0.75 and 1.25. Ratios above 1.25 are considered artefacts of low overall concentrations and high uncertainties and cannot be classified with certainty. Data was separated by surface type based on the location of the measurement, not the airmass origin. (a) shows the data set used for the high altitude measurements in the main manuscript with sulfate above the LOD. (b) shows the subset with sulfate and ammonium measurements above the LOD. Note that only considering these measurements reduces the available data strongly and does not provide a representative picture of the conditions during the campaign.
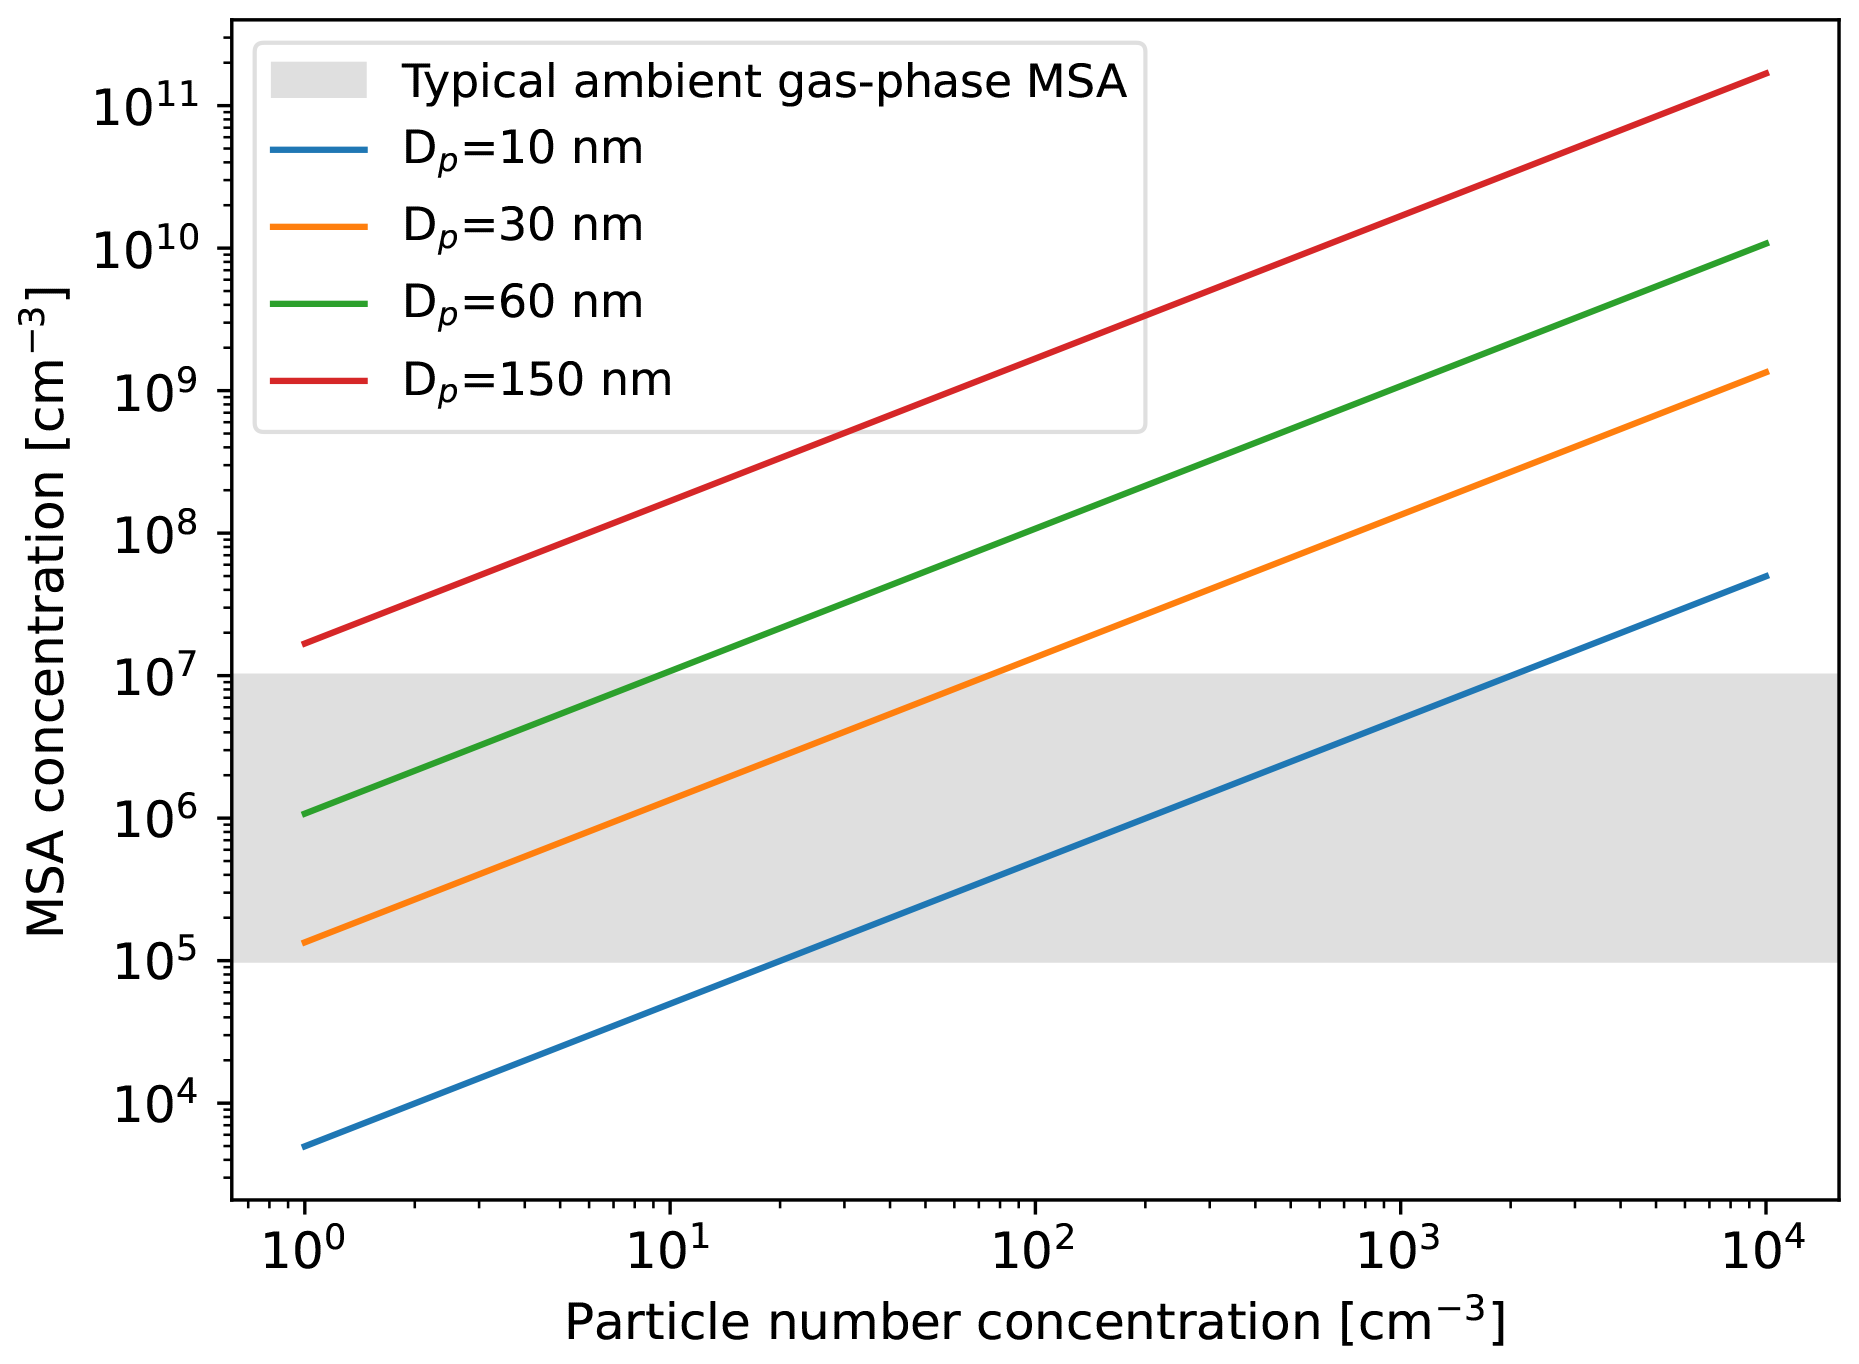
Figure A7Calculation of gas-phase MSA produced by the evaporation of pure MSA particles of different diameters and concentrations. The grey area shows typical gas-phase concentrations of MSA.
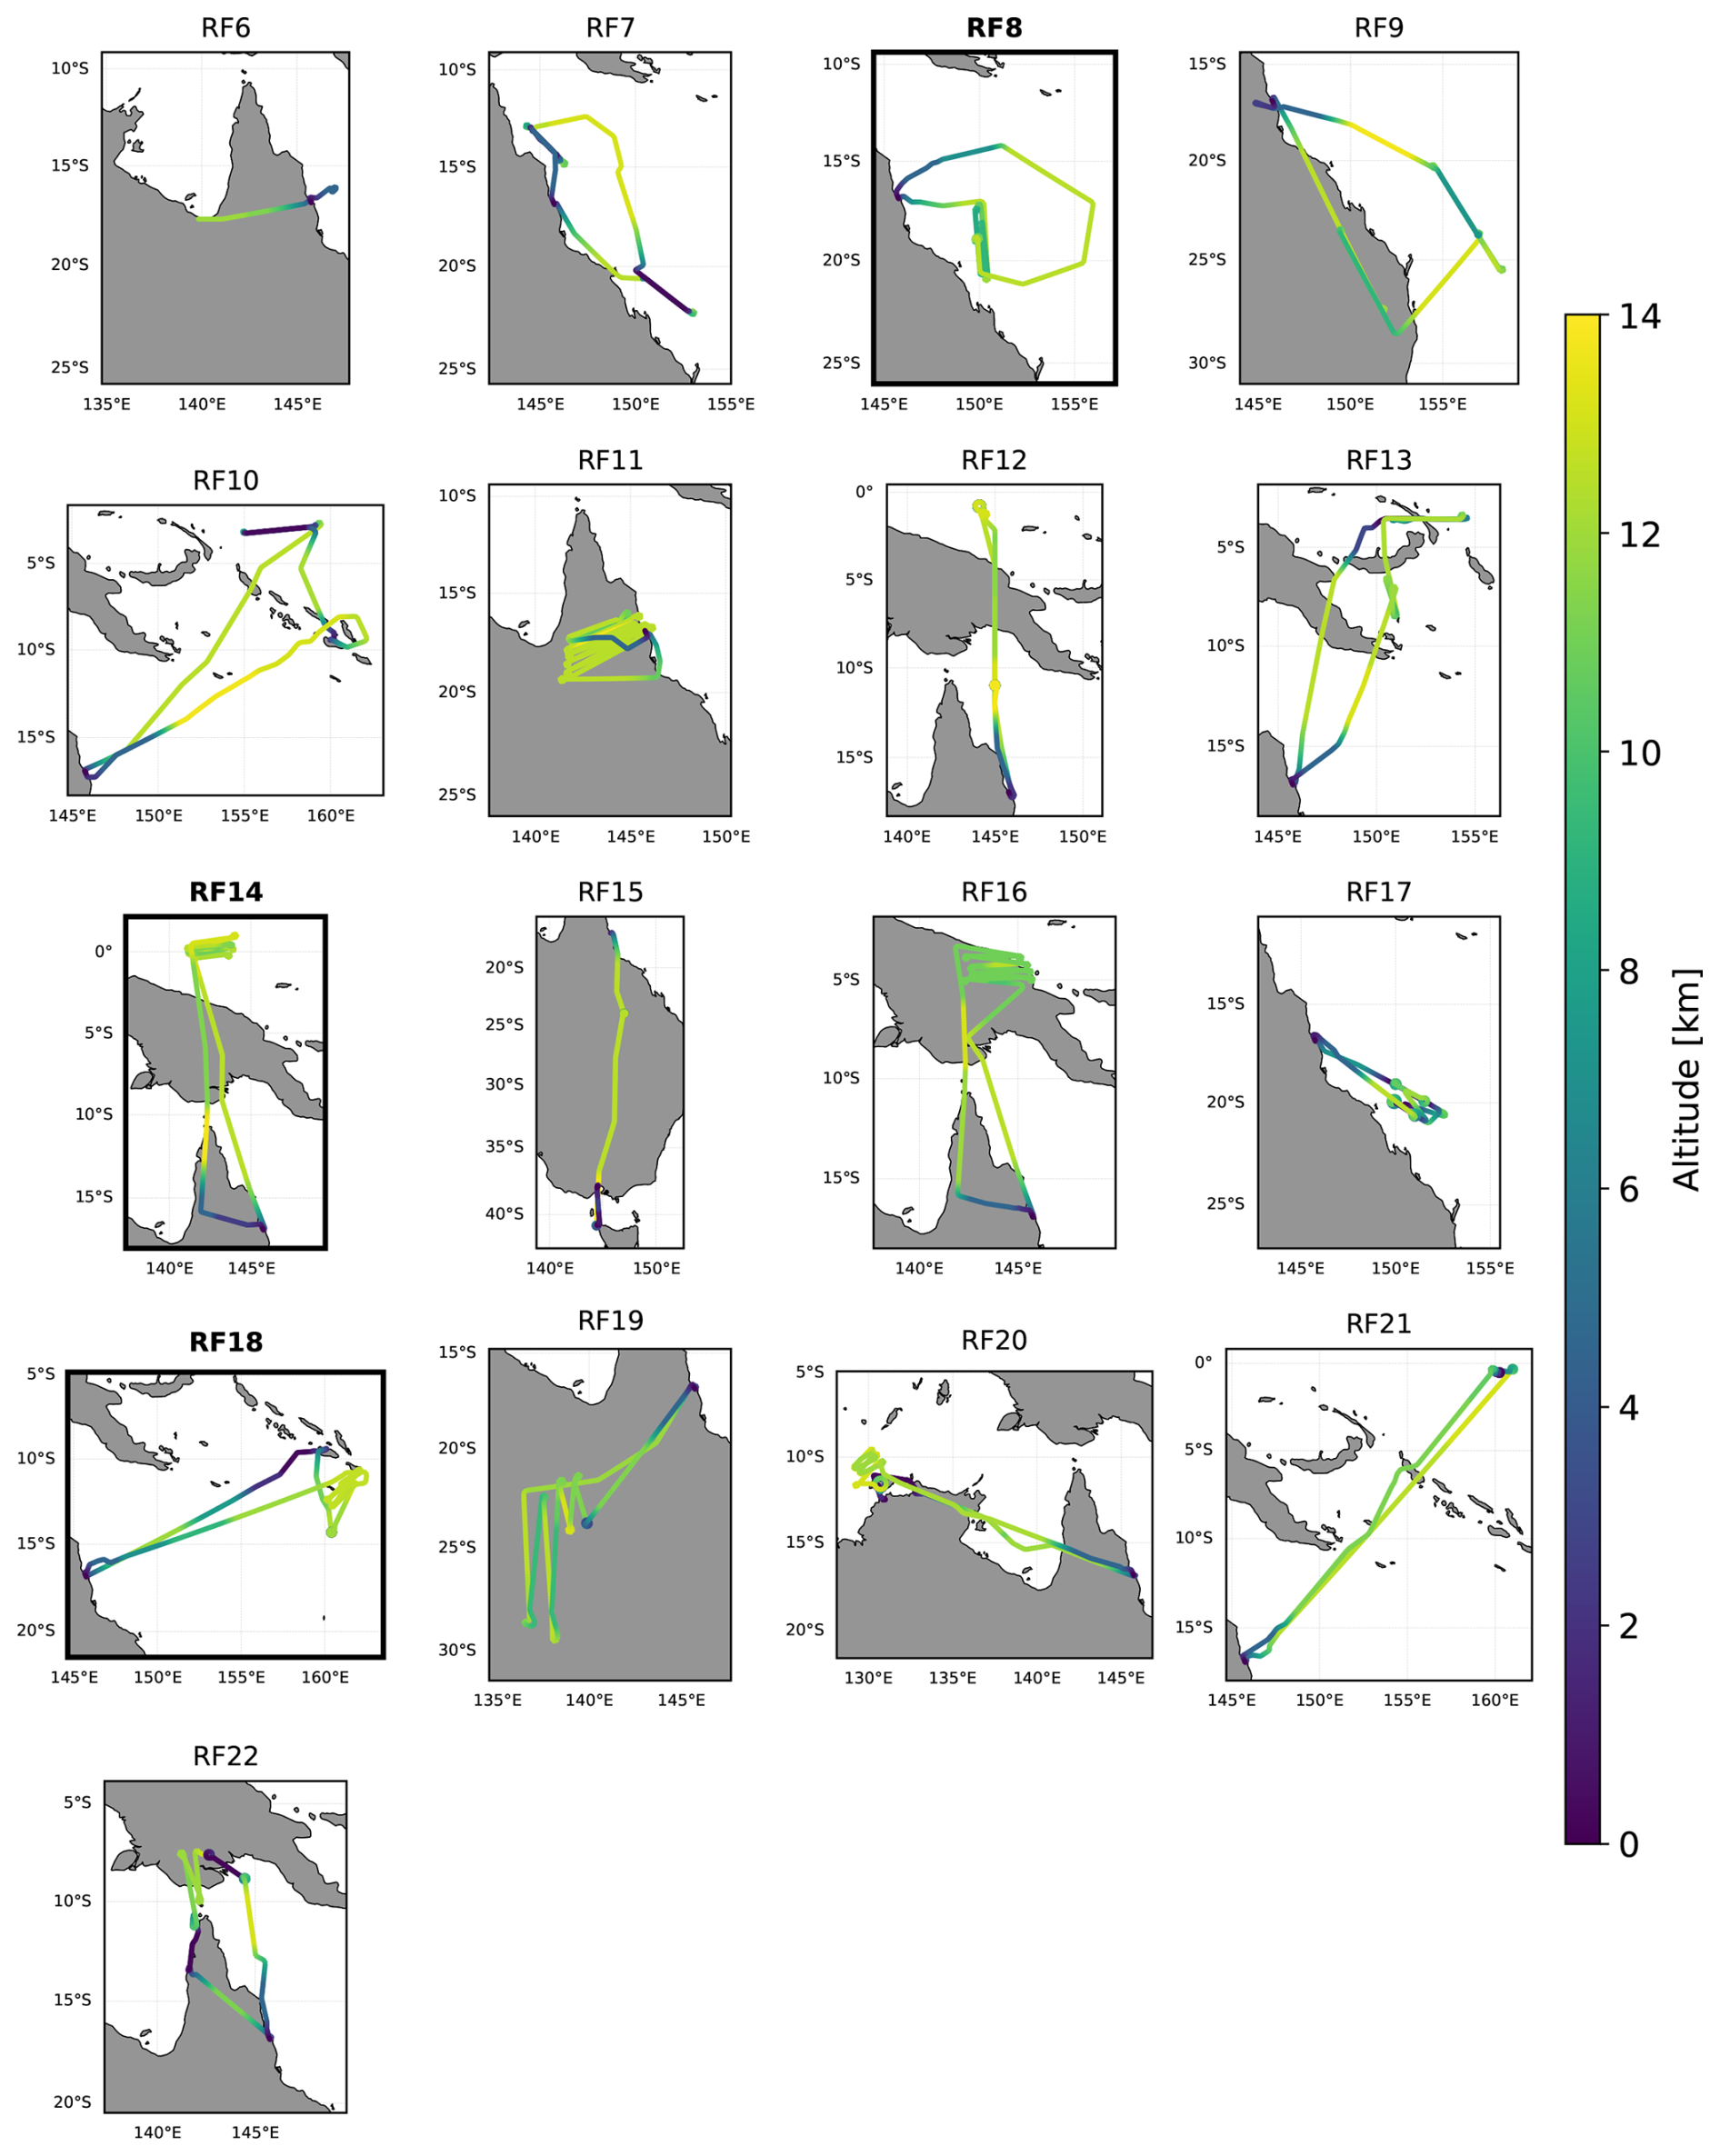
Figure A8Map plots of all research flights starting and ending in Cairns. The colour scale shows the altitude of the aircraft. Bold titles and outlines indicate flights that were used in case studies in this paper (RF08, RF14, RF18). Note that some low altitude tracks are hidden by overlapping higher altitude points.
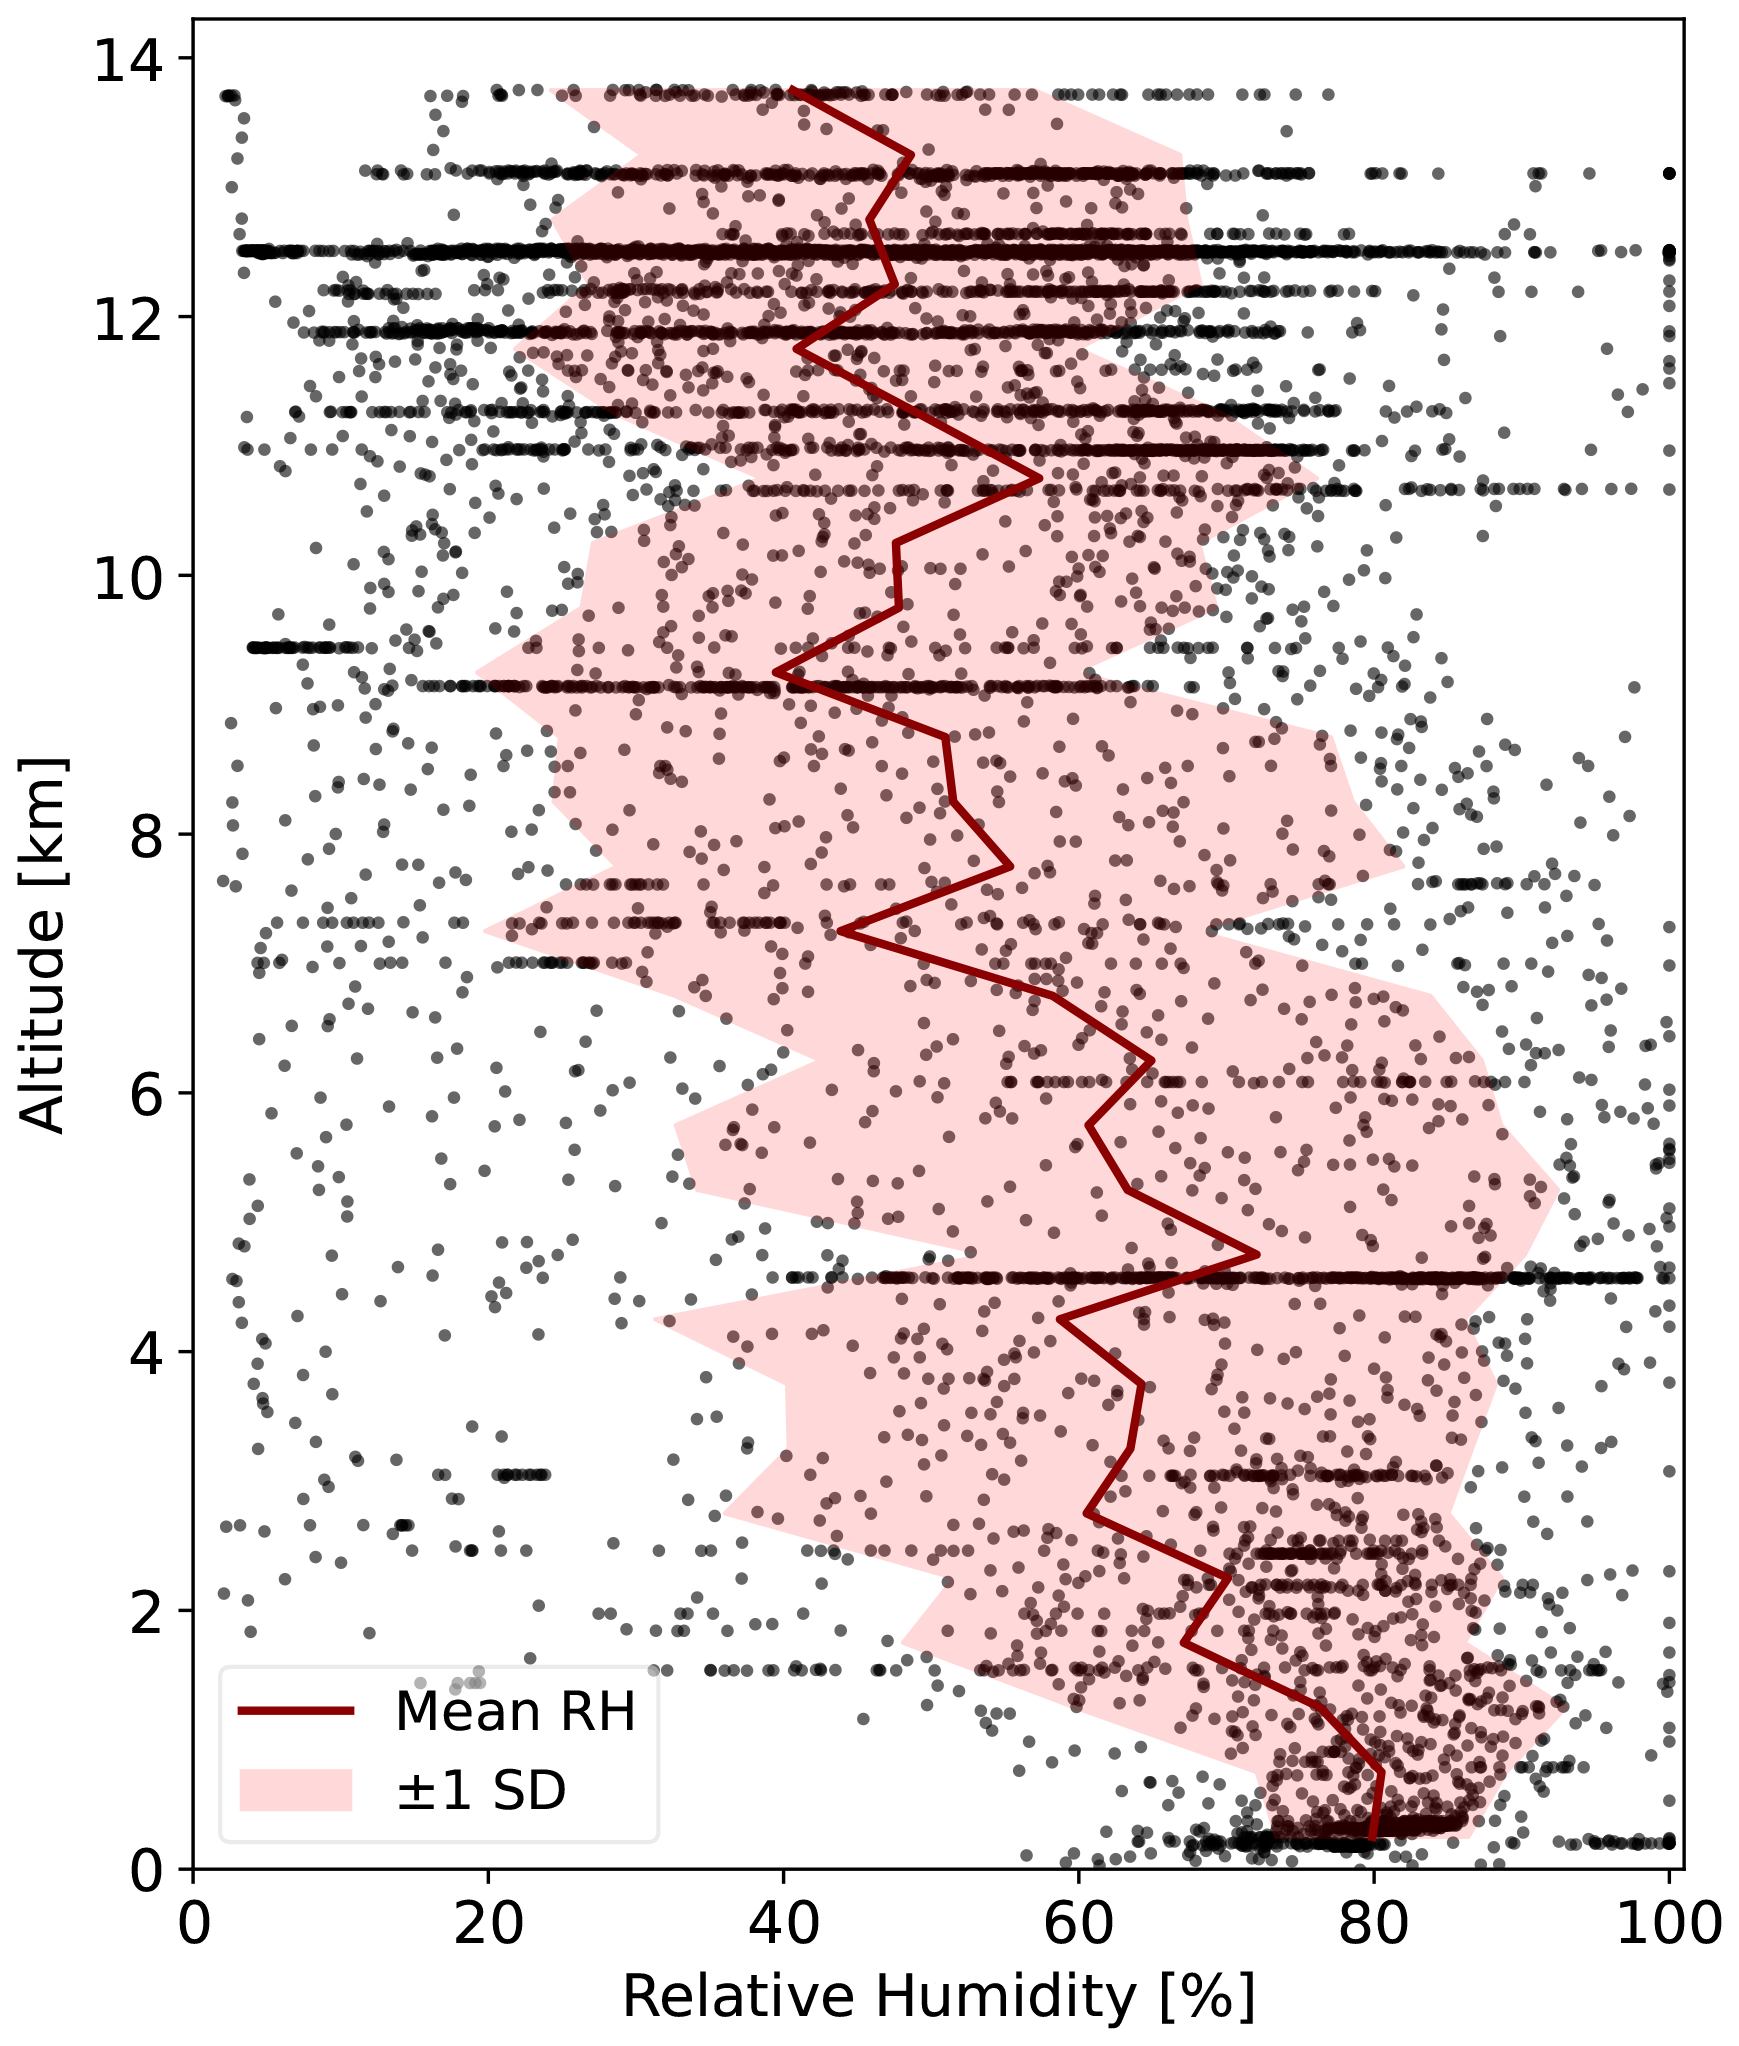
Figure A9Altitude profile of the measured relative humidity (above water) during all 17 research flights of CAFE-Pacific. The red line shows the mean values with the standard deviation as shaded area. Data points with values above 100 % were recorded during cloud encounters and for simplicity set to 100 % in this plot.
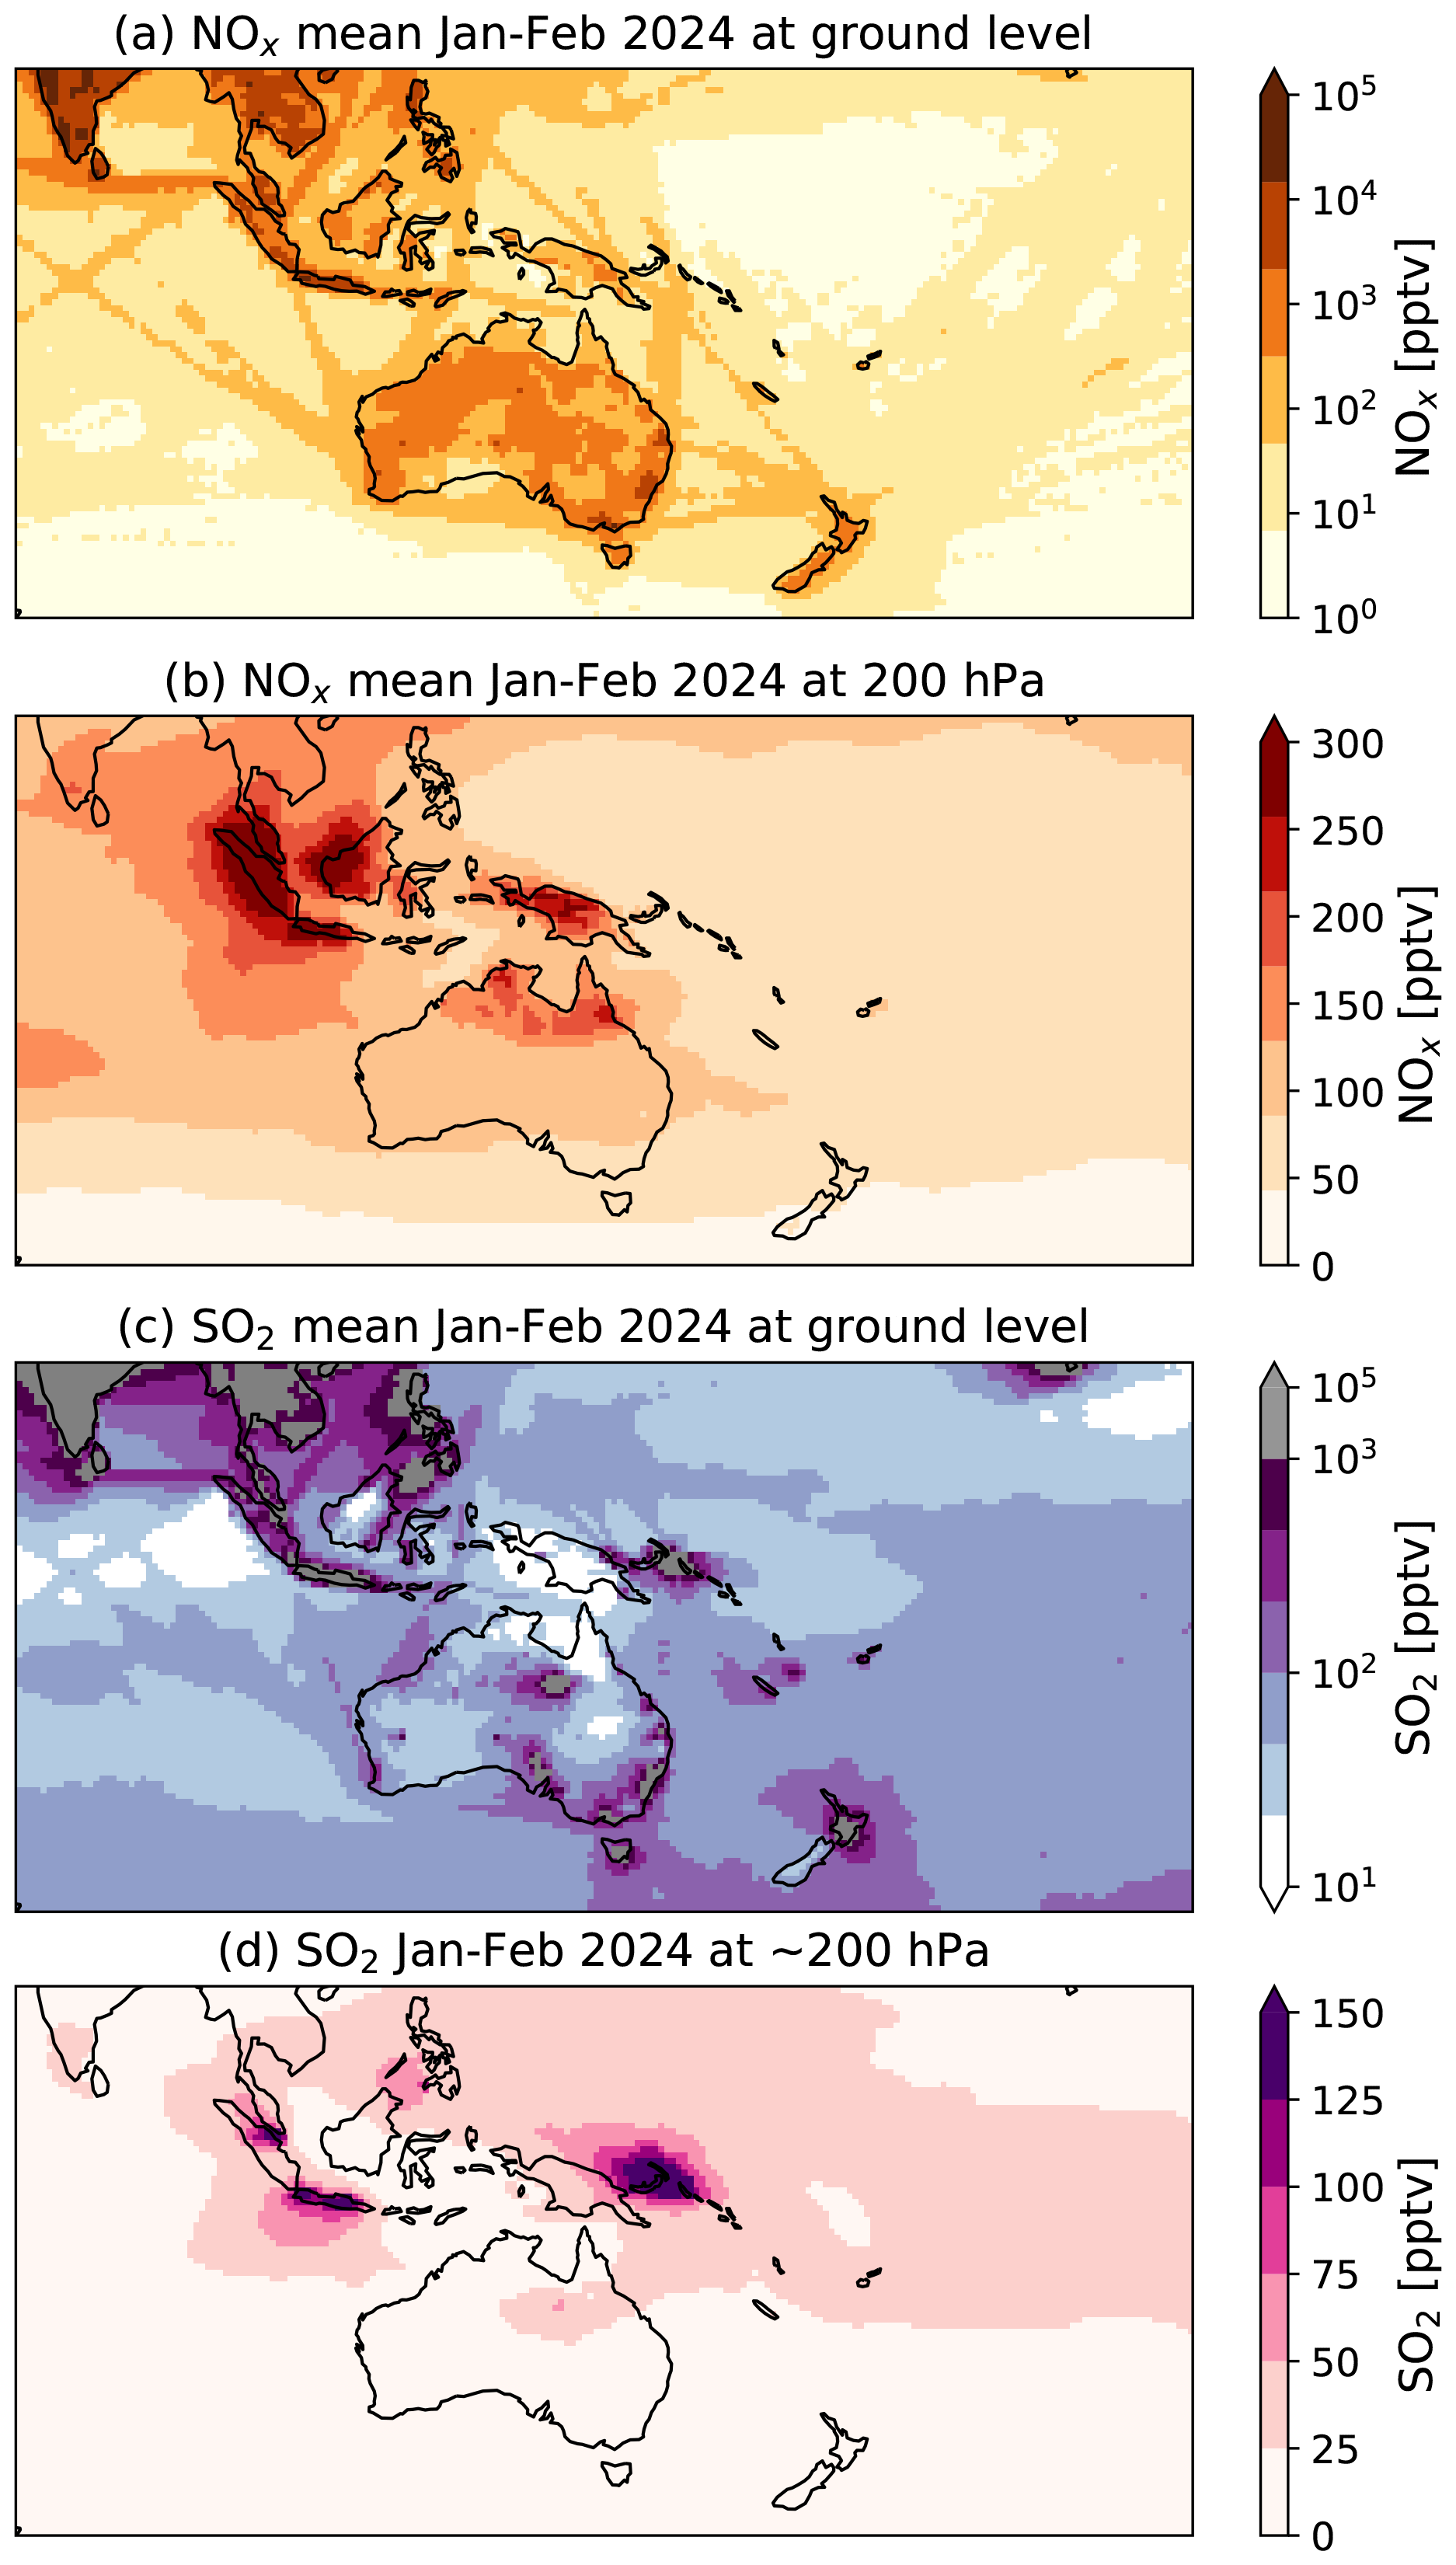
Figure A10CAMS data for January and February 2024. The panels show the NOx mixing ratios at ground level (a) and 200 hPa (b) (sum of NO and NO2), the SO2 mixing ratios at ground level (c) and approximately 200 hPa (d). The figure was generated using data by the Copernicus Atmosphere Monitoring Service (2020): CAMS global reanalysis (EAC4). Copernicus Atmosphere Monitoring Service (CAMS) Atmosphere Data Store, https://doi.org/10.24381/d58bbf47 (Inness et al., 2019).
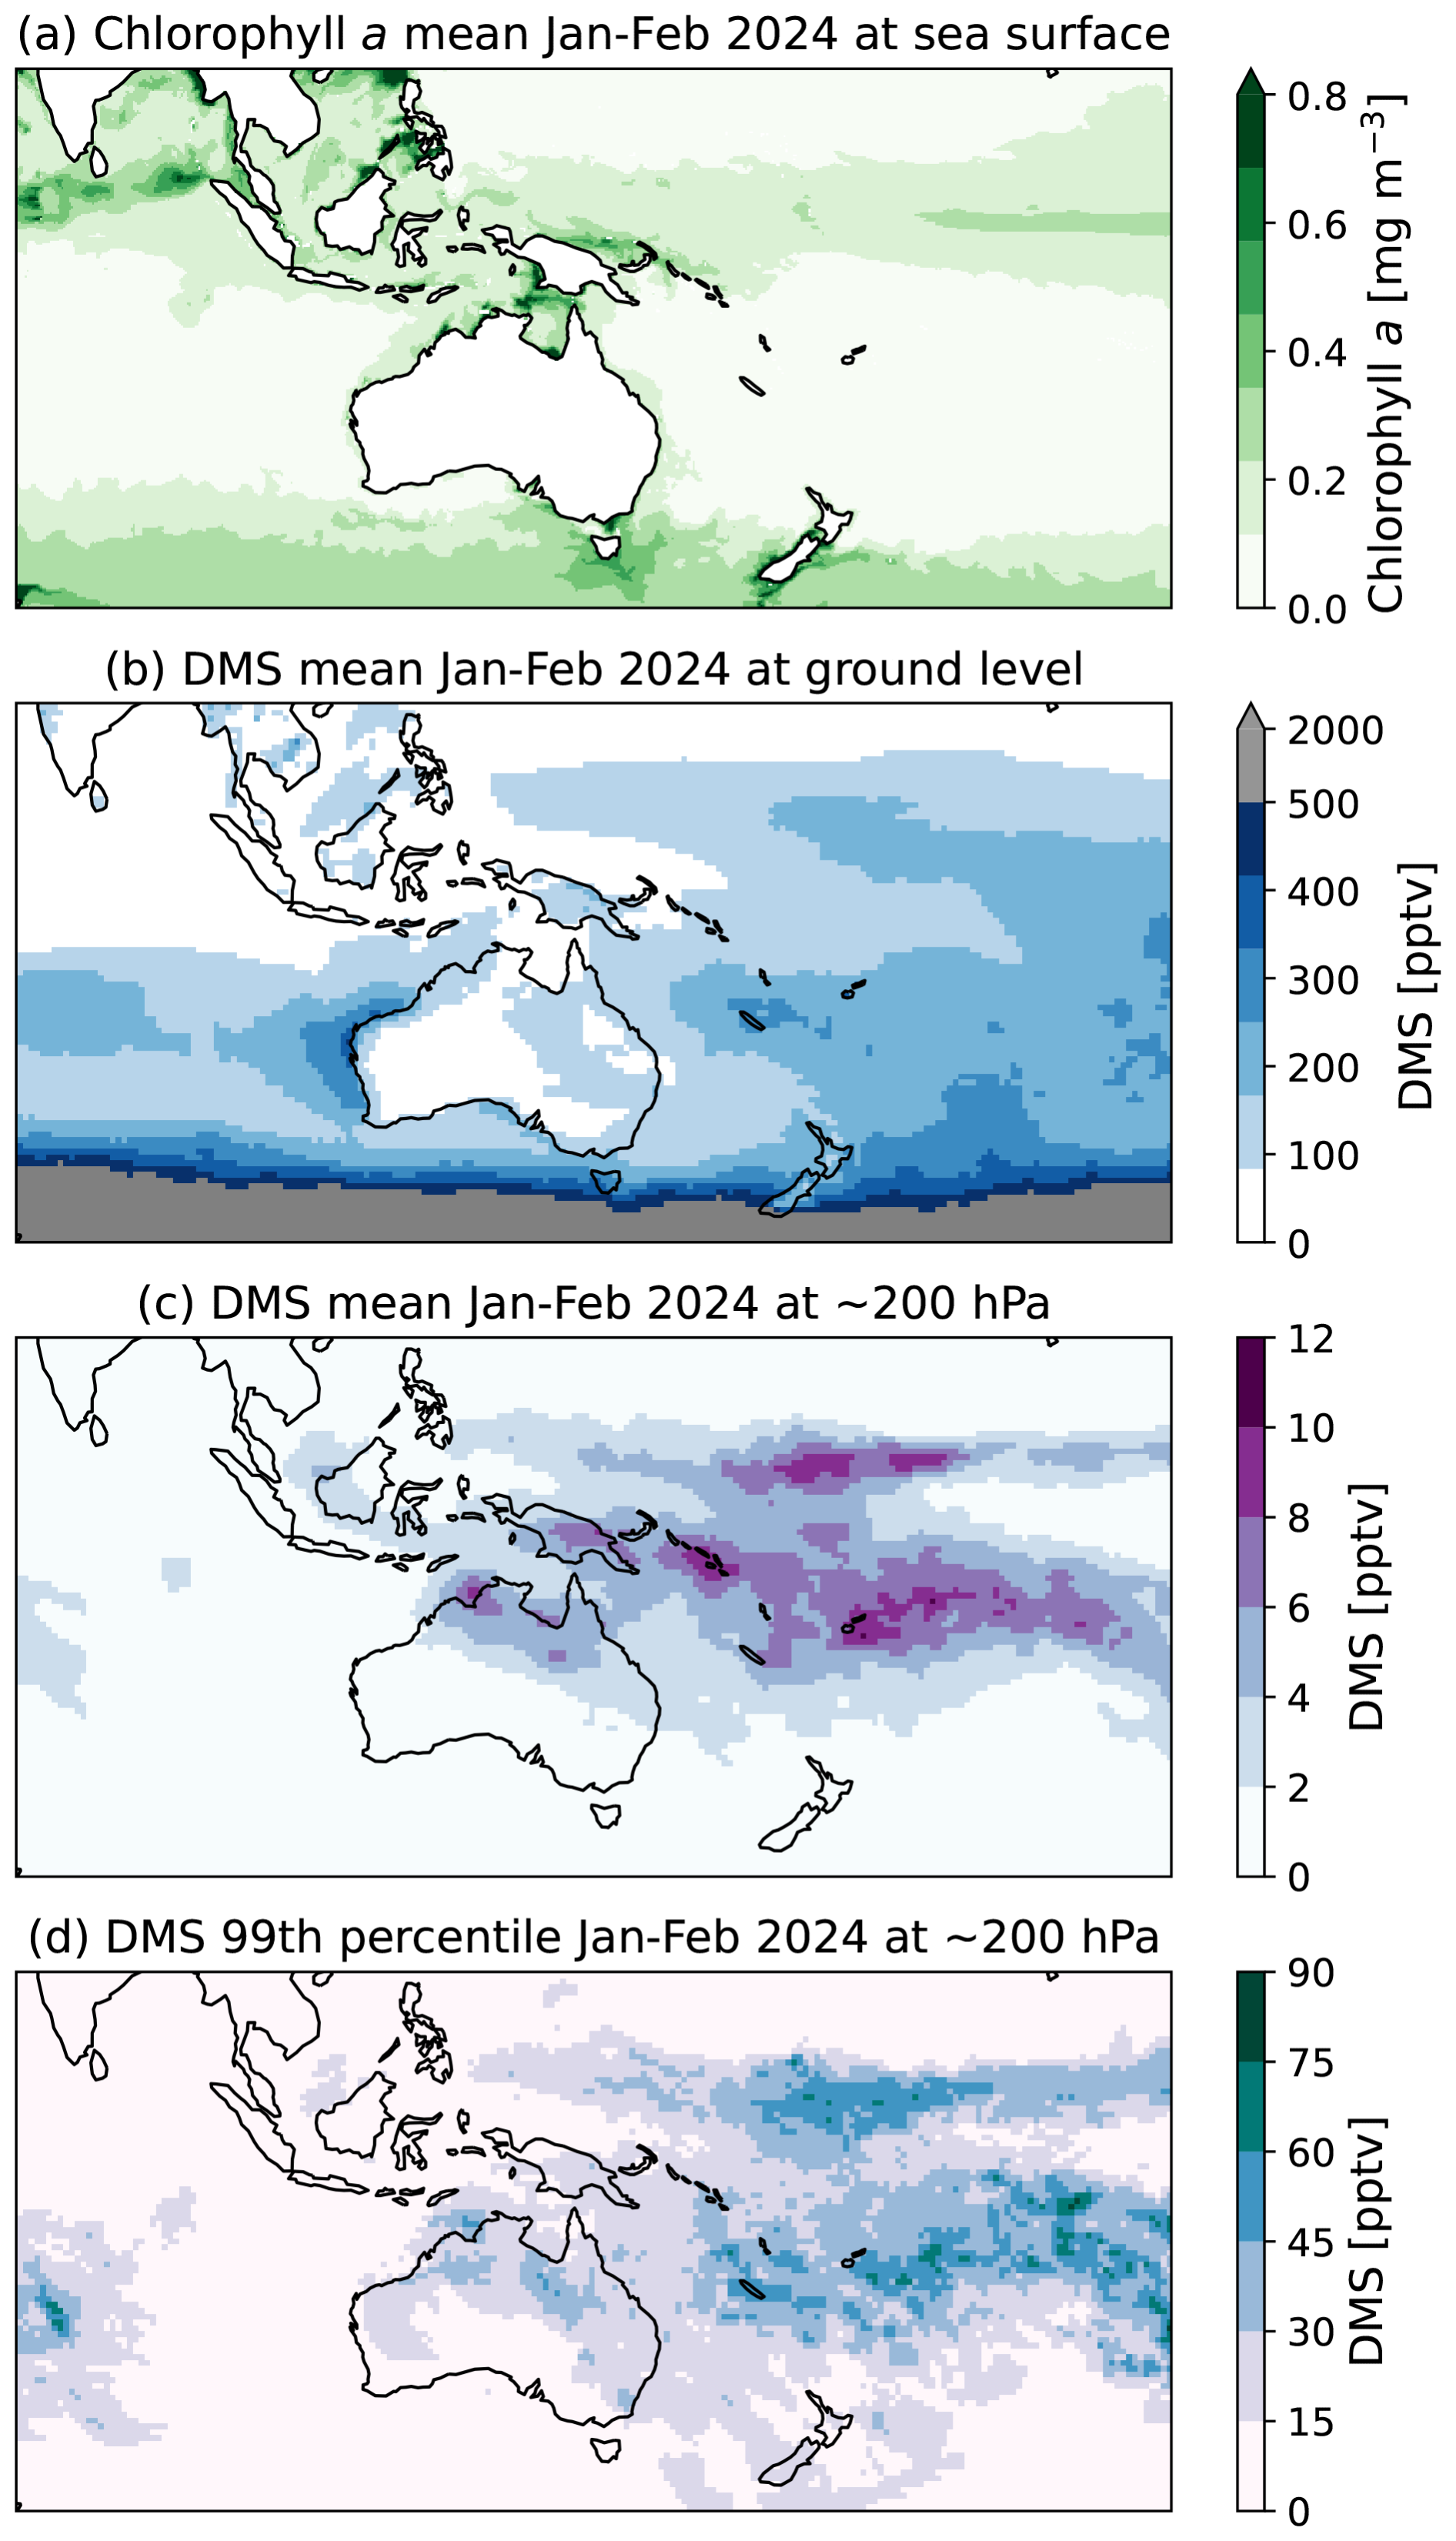
Figure A11CAMS data for January and February 2024. The panels show (a) the chlorophyll a mass concentration in the sea surface layer, (b) the mean atmospheric DMS mixing ratio at the surface (model level 60), (c) the mean DMS mixing ratio at approximately 200 hPa (model level 30) and (d) the 99th percentile of the DMS mixing ratio at approximately 200 hPa (model level 30). (a) was generated using E.U. Copernicus Marine Service Information as part of the Global Ocean Biogeochemistry Analysis and forecast (https://doi.org/10.48670/moi-00015, Global Ocean Biogeochemistry Analysis and Forecast, 2026). (b), (c) and (d) contain data obtained from Copernicus Atmosphere Monitoring Service (2020): CAMS global reanalysis (EAC4). Copernicus Atmosphere Monitoring Service (CAMS) Atmosphere Data Store, https://doi.org/10.24381/d58bbf47 (Inness et al., 2019).
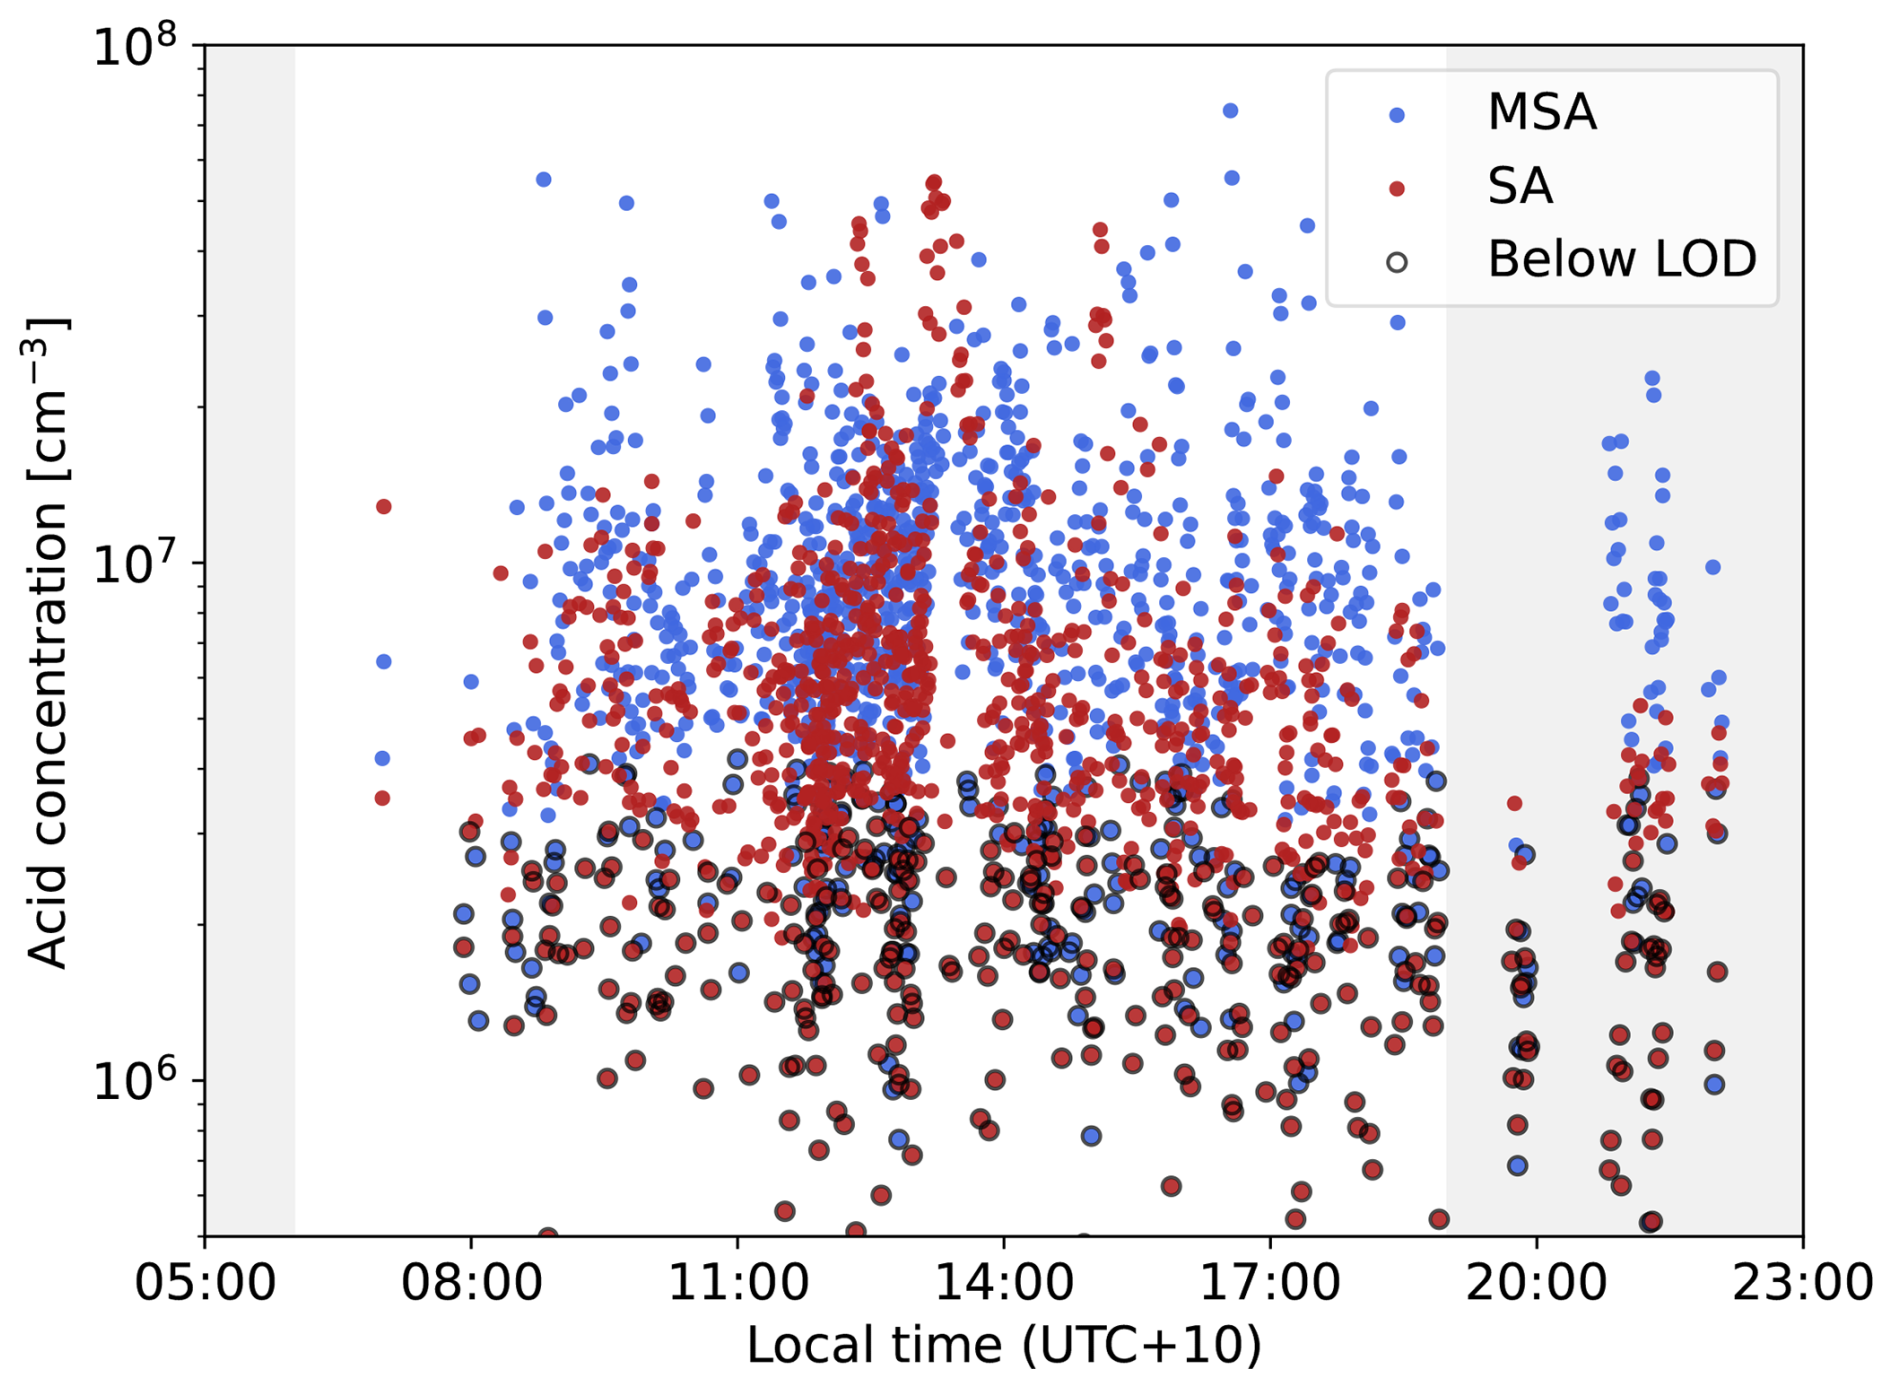
Figure A12Gas-phase MSA and SA values plotted against the local time of day including data from RF06-RF22. Note that local time refers to Cairns, hence it might vary by one hour from the local time of the actual flight position. The grey shaded areas indicate the time before sunrise and after sunset. Black outline denote data below the LOD. Note that while concentrations are lower during nighttime, we still detect MSA and SA values above our LOD. For MSA, this may result from degassing from aerosols and it has previously been reported to exhibit no diurnal cycle (Baccarini et al., 2021). In contrast, the nighttime SA could be potentially be the result of a long lifetime due to the low condensations sink. Observations of high SA during the night have previously been reported in remote marine environments (Mauldin et al., 2003).
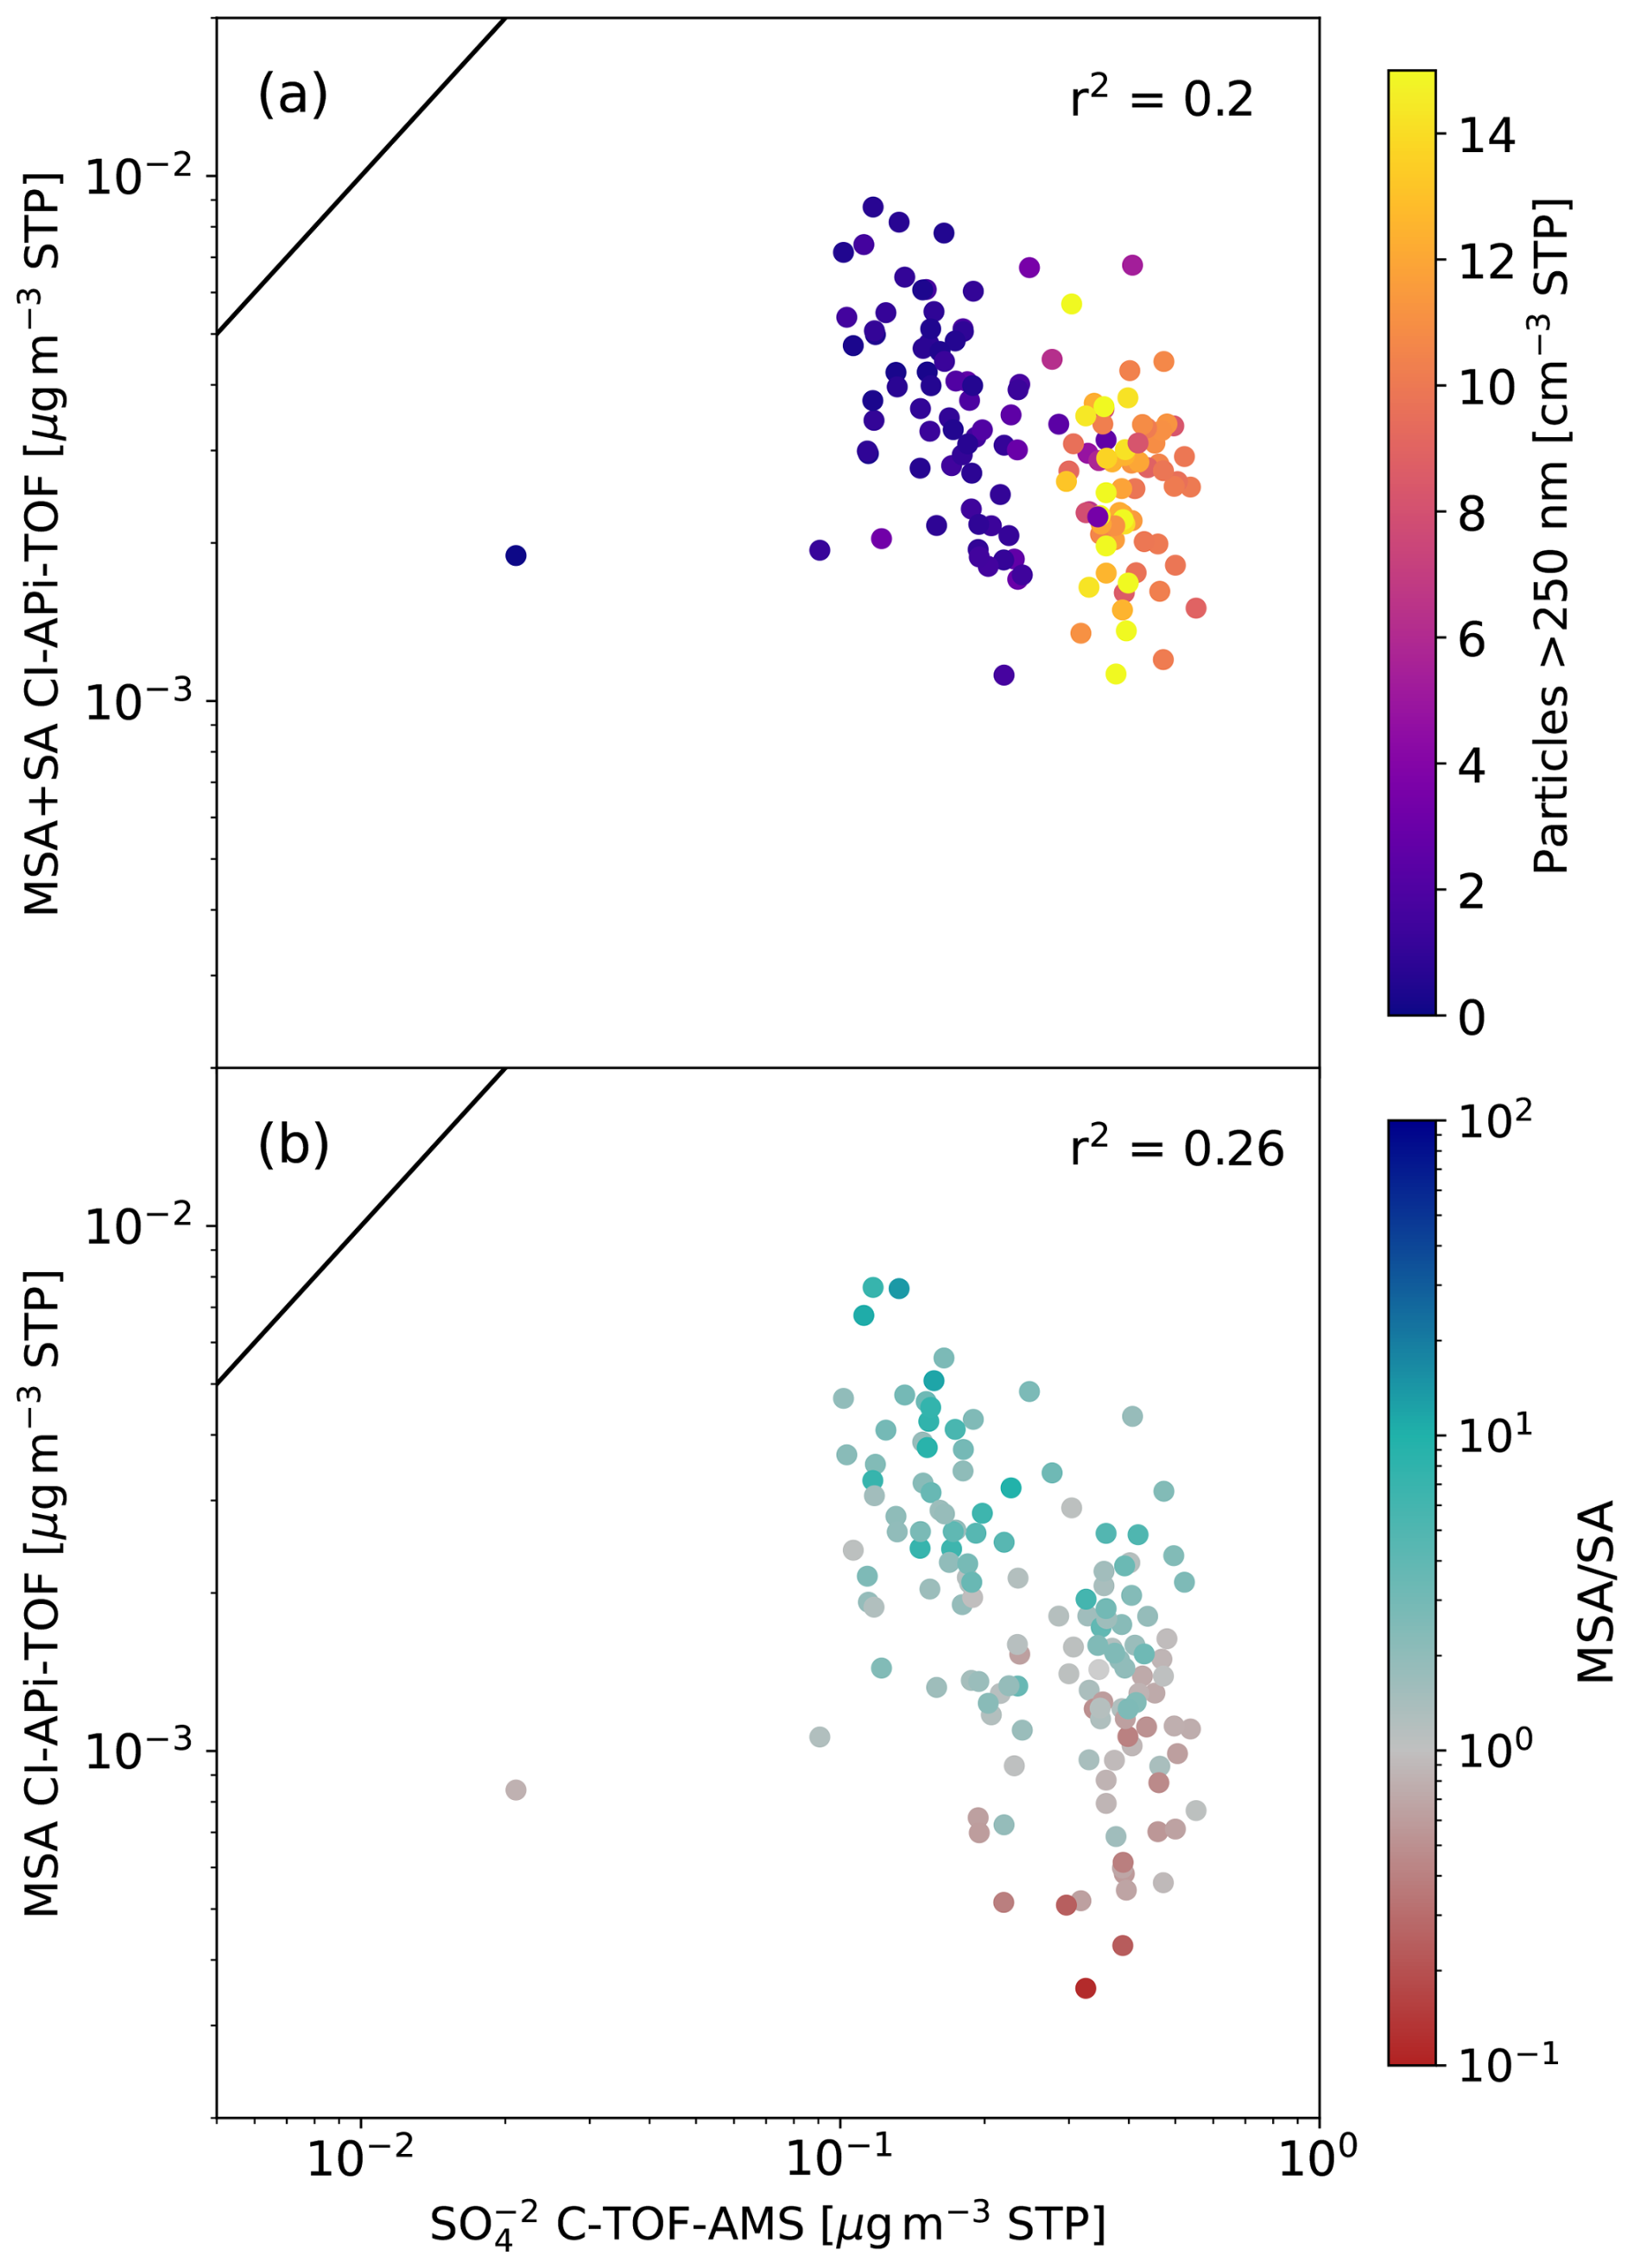
Figure A13Comparison of C-TOF-AMS and SCORPION measurements during a 2 h period of RF17. The aircraft was flying between 300 m and 3 km altitude above the ocean close to the Australian coast. The ambient air temperatures were between 12 and 27 °C. The x-axis shows the particulate sulfate mass concentration of particles between 40 and 800 nm measured by the C-TOF-AMS. In the upper panel, the sum of MSA and SA from SCORPION is plotted coloured by the concentration of particles with >250 nm diameter measured by the OPC. The lower panel shows just the MSA values colour coded by the ratio of MSA to SA. The black line shows a 1:1-relation. The lack of correlation between both instruments indicates that no evaporation of particles happens in the inlet of SCORPION at low altitudes.
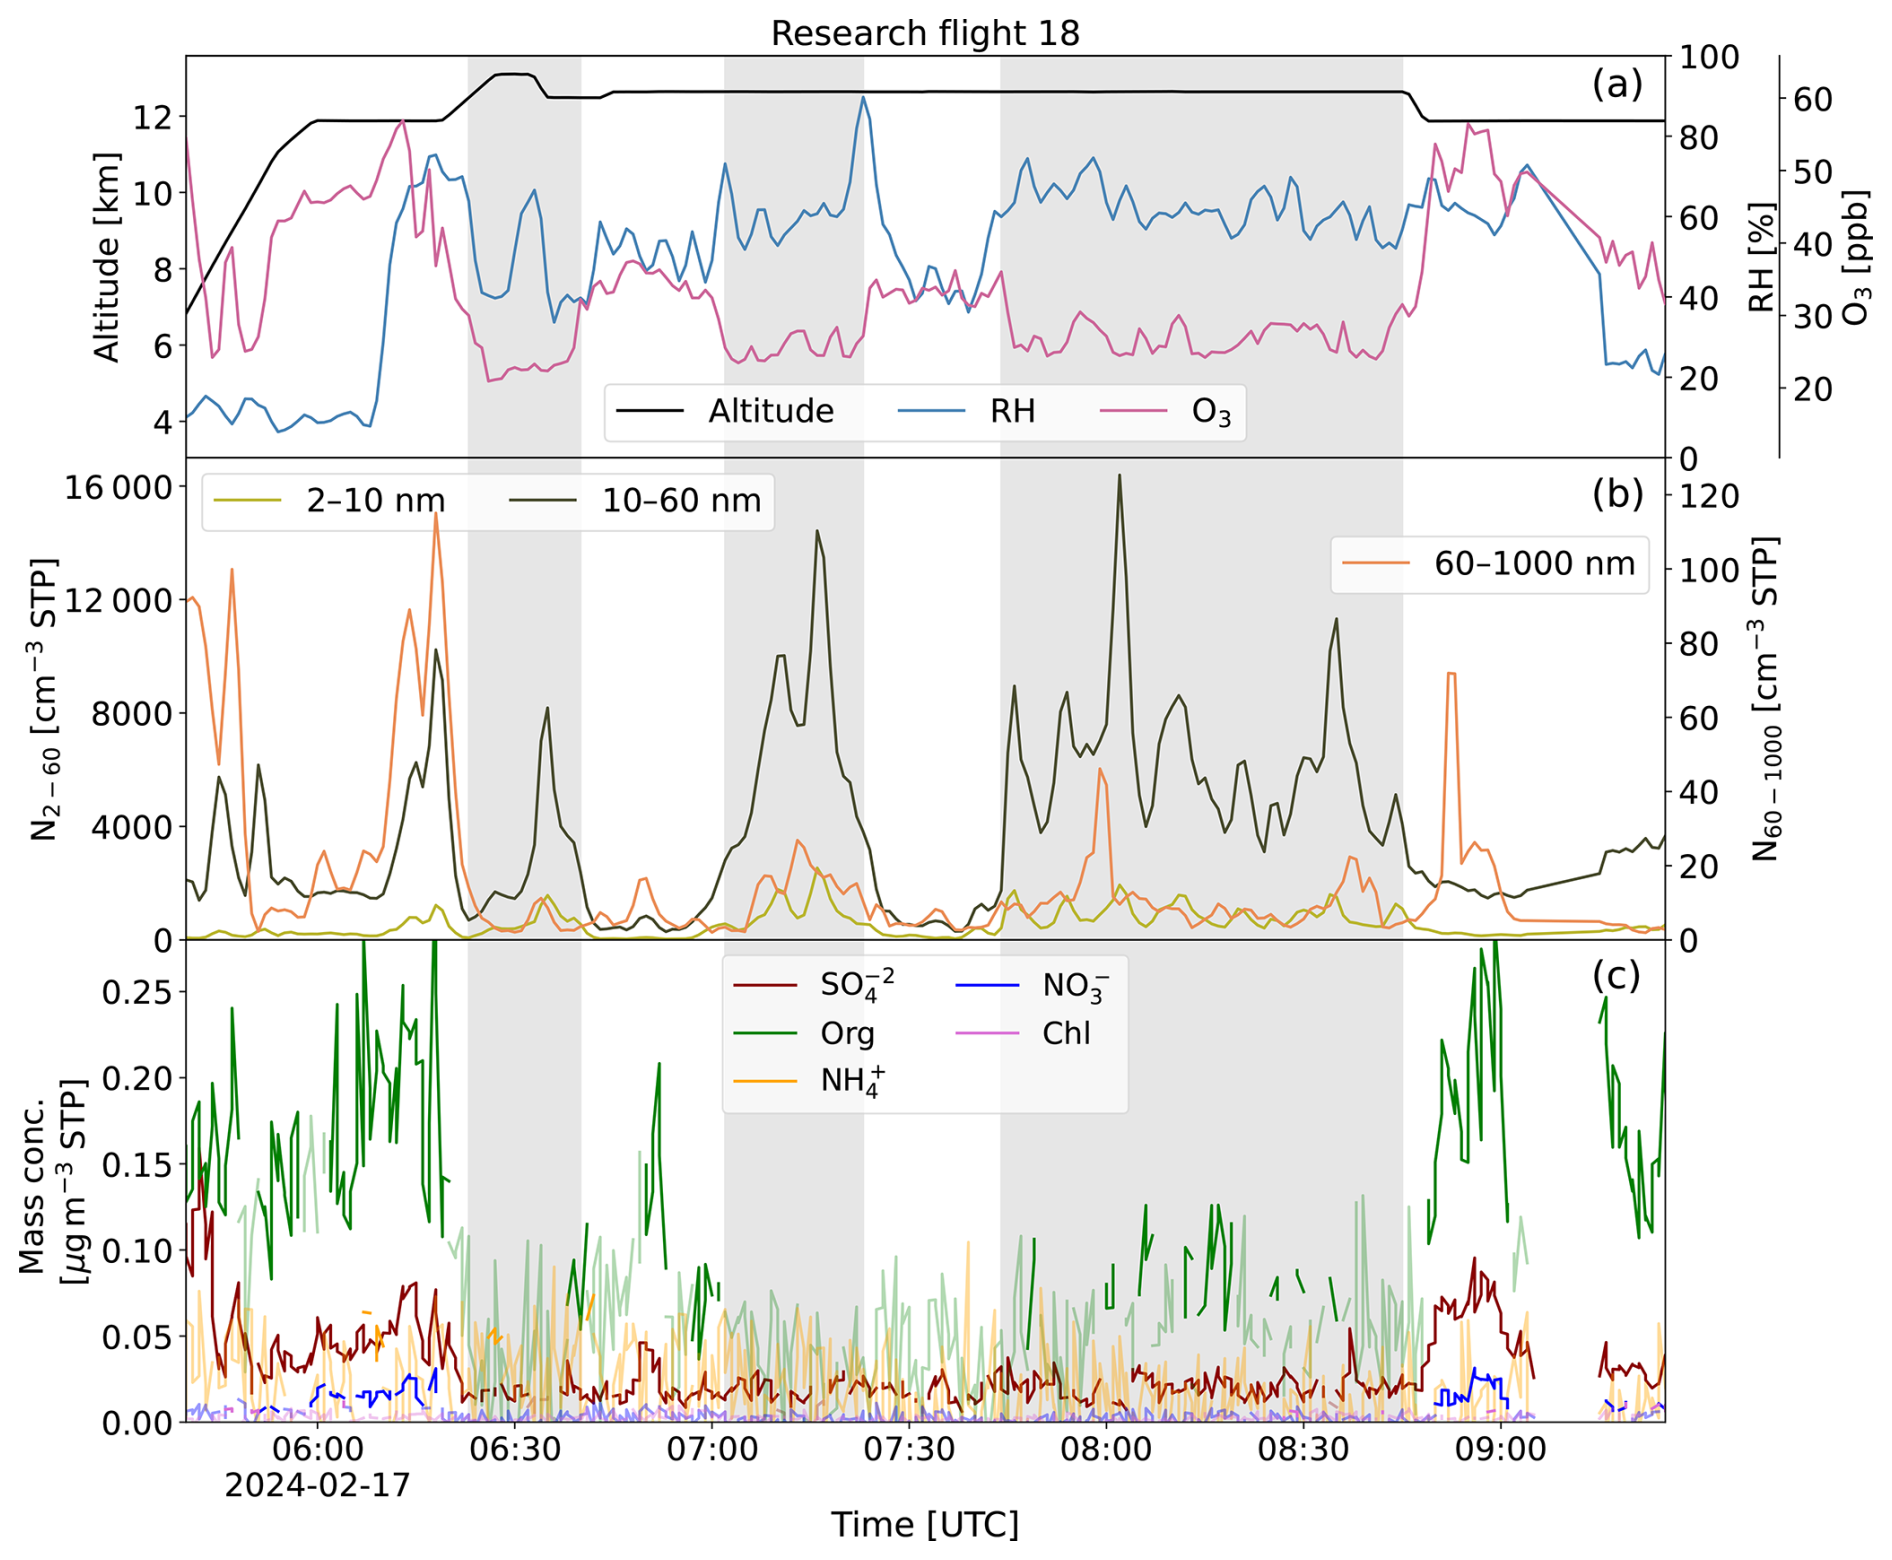
Figure A14Similar to Fig. 5 in the main text but with all species detected by the C-TOF-AMS plotted in (c). The faded out colour indicates values below the limit of detection of the instrument. In the air mass of interest ammonium, nitrate and chloride are not detected at all, whereas sulfate and occasionally organics reach values slightly above the LOD.
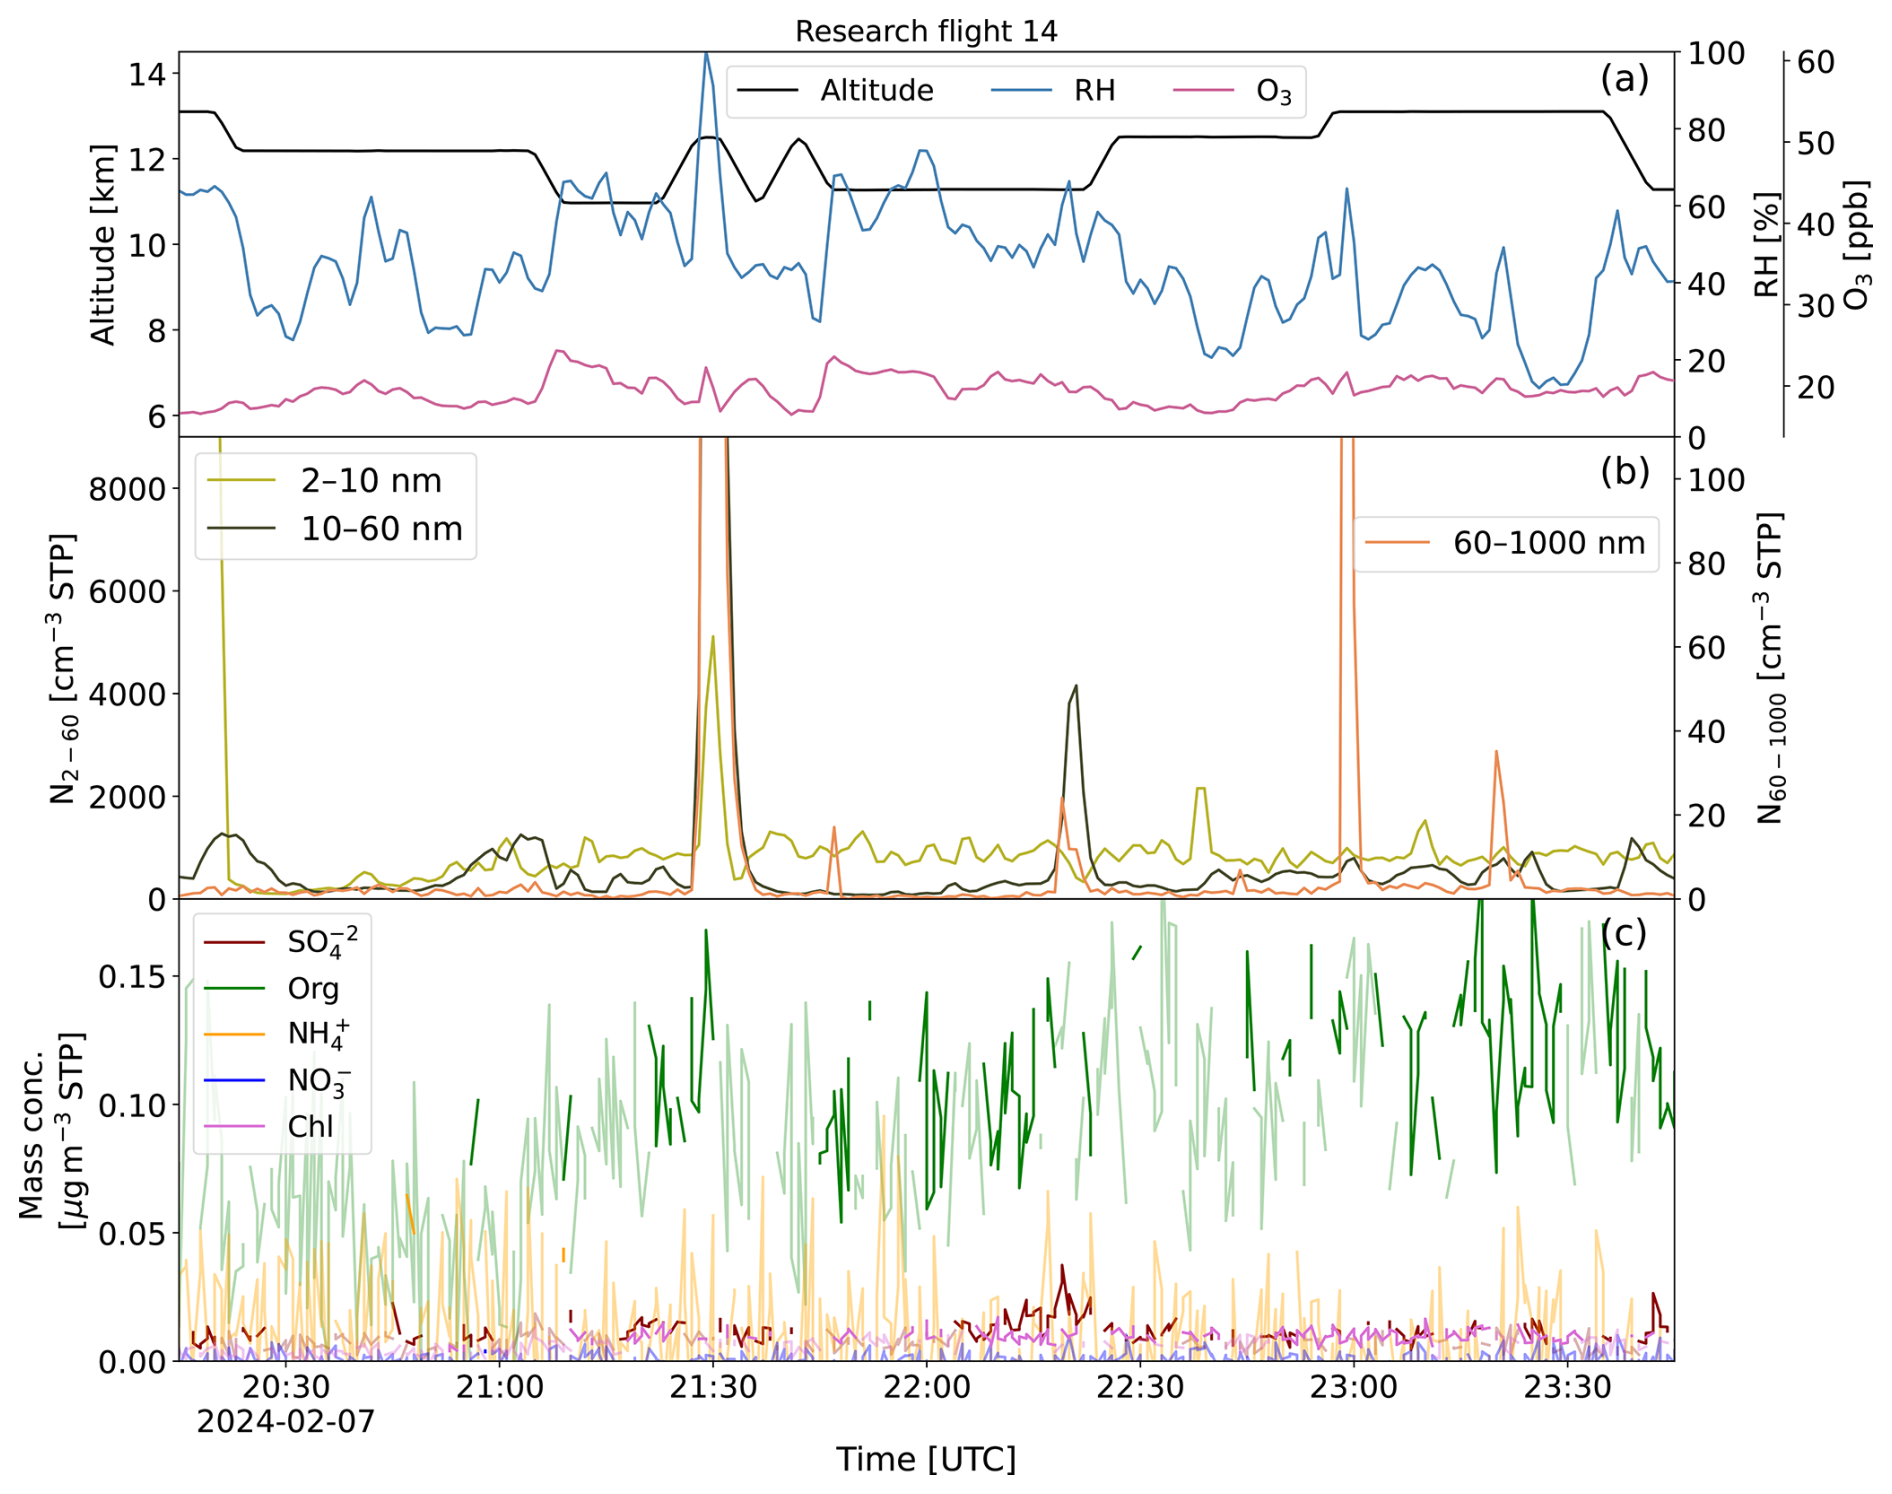
Figure A15Similar to Fig. 6 in the main text but with all species detected by the C-TOF-AMS plotted in (c). The faded out colour indicates values below the limit of detection of the instrument. Ammonium and nitrate are not detected at all, whereas sulfate, chloride and organics occasionally reach values slightly above the LOD.
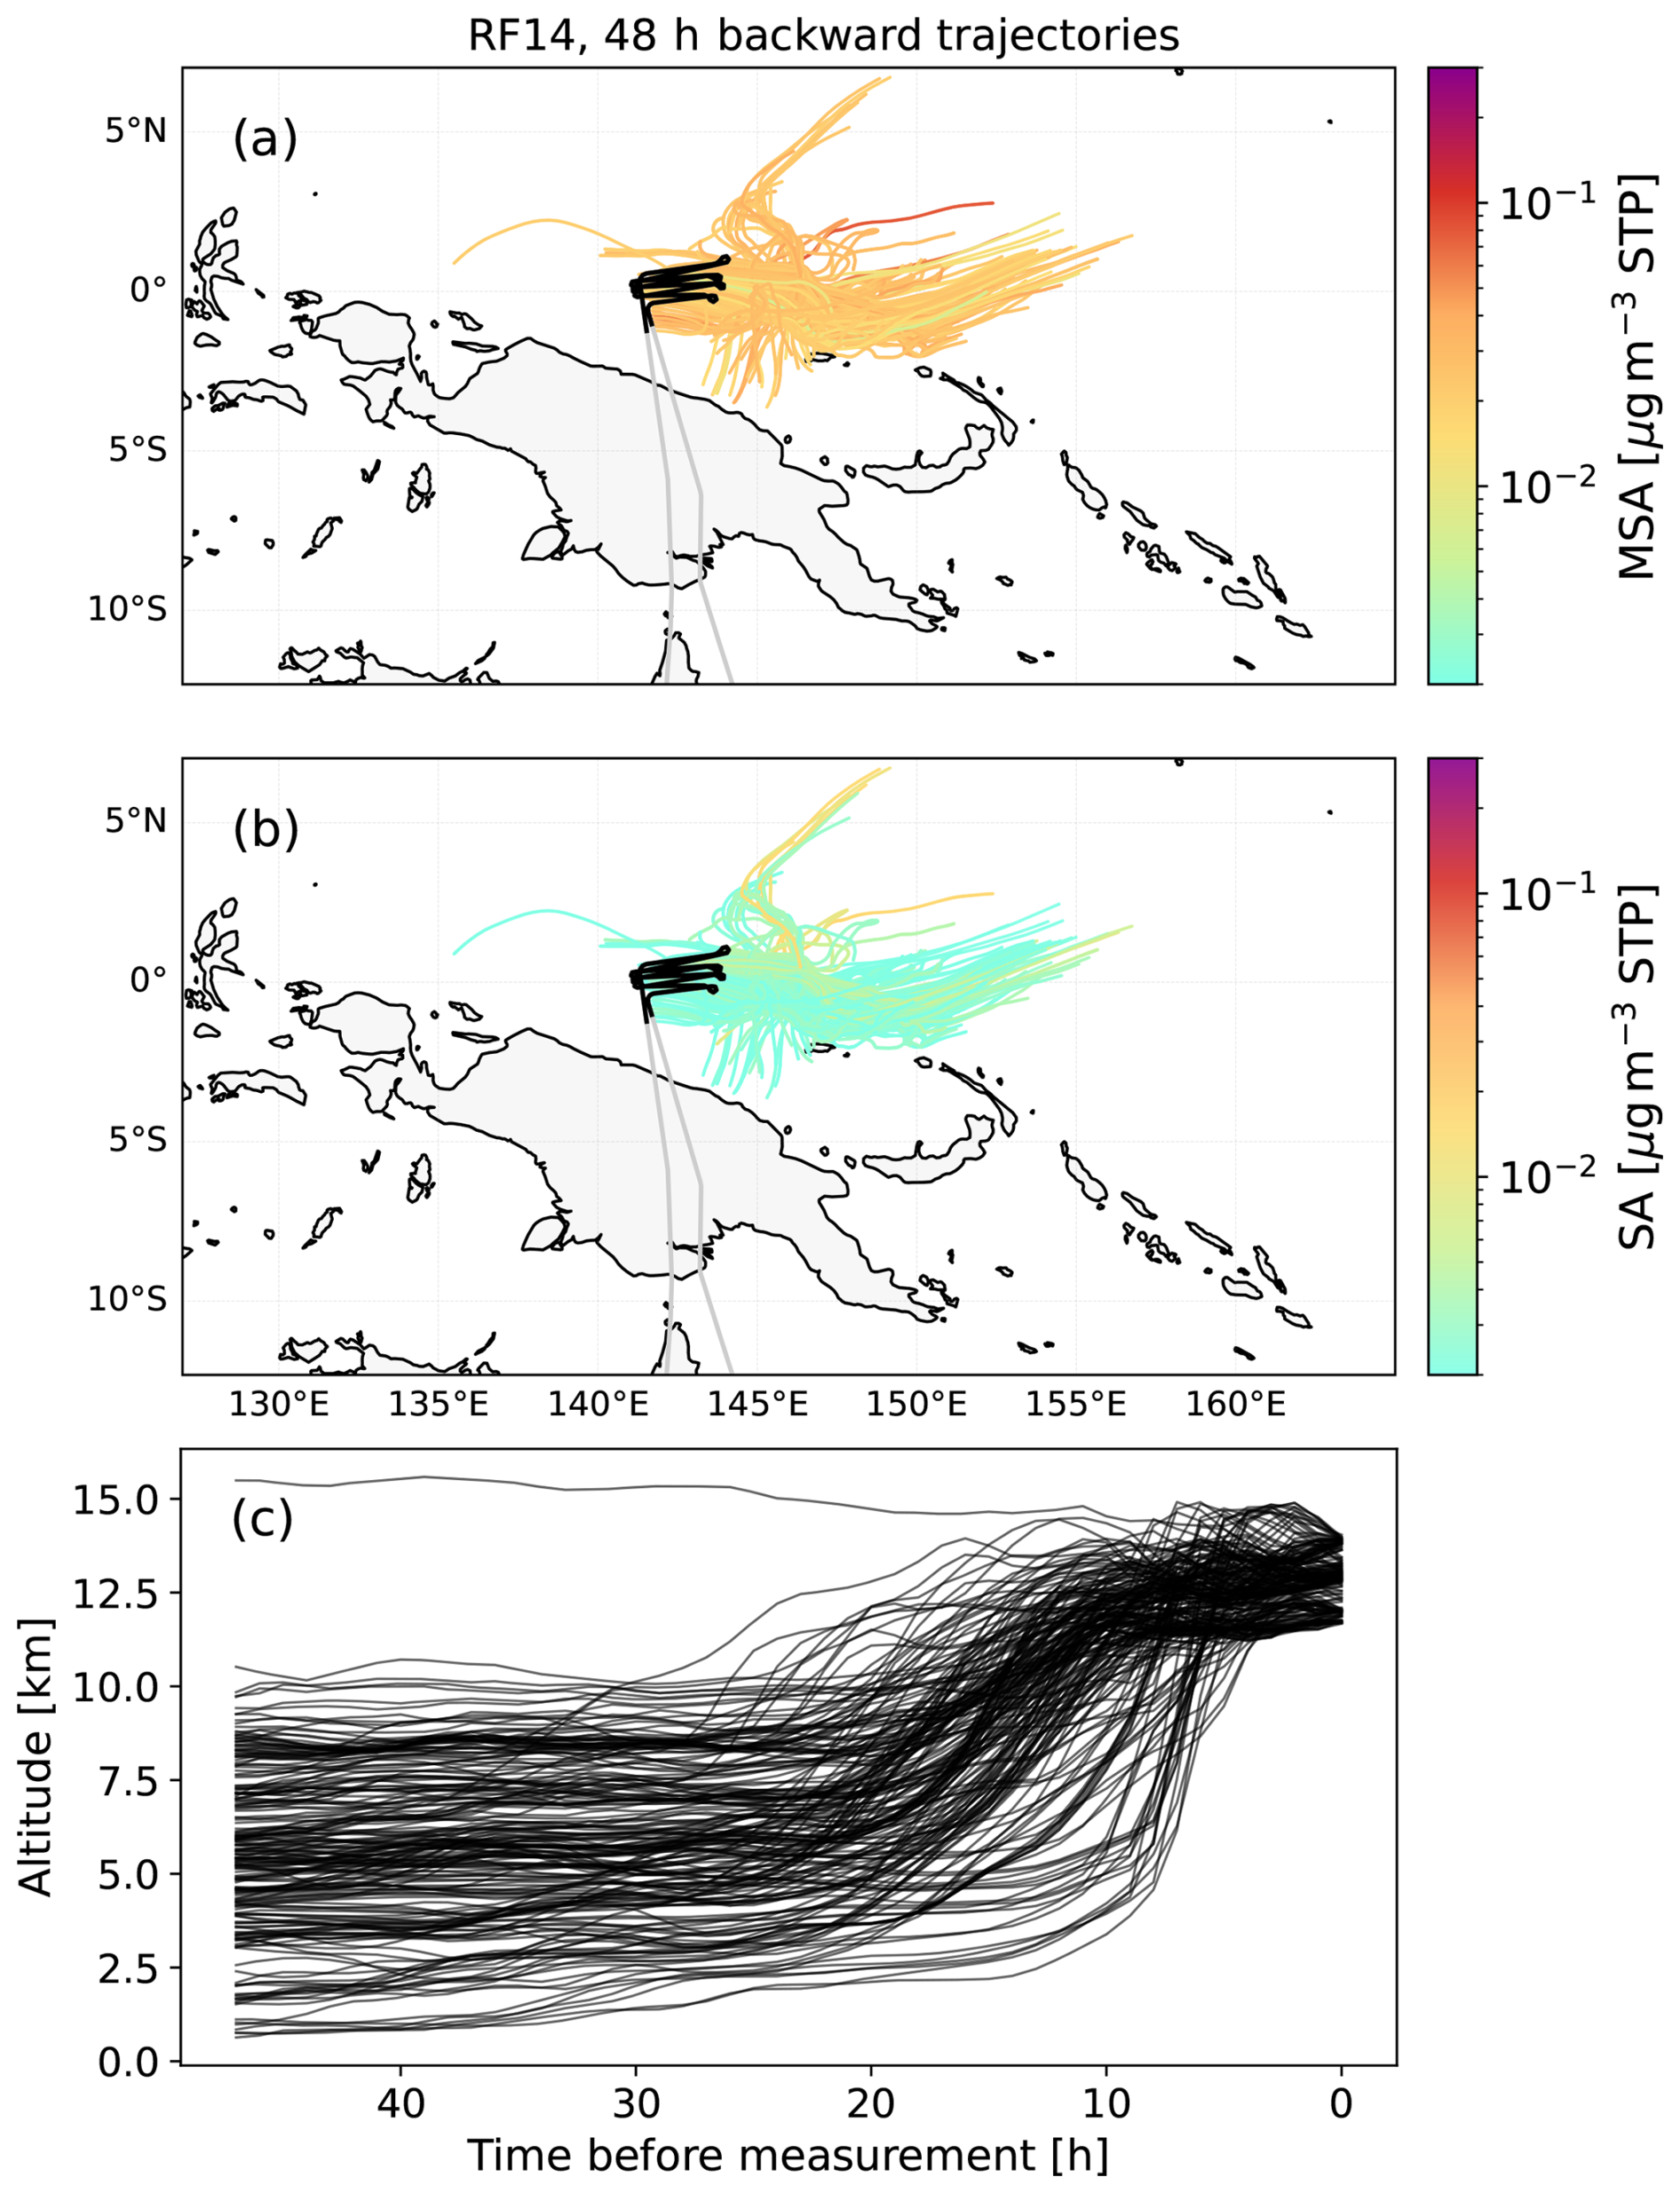
Figure A1648 h backward trajectories for RF14 during the period of marine convective outflow colour coded by (a) MSA or (b) SA concentrations. (c) shows the altitude time series of the trajectories. The air masses have a clear marine origin and HYSPLIT captures the vertical transport during the past 8–18 h.
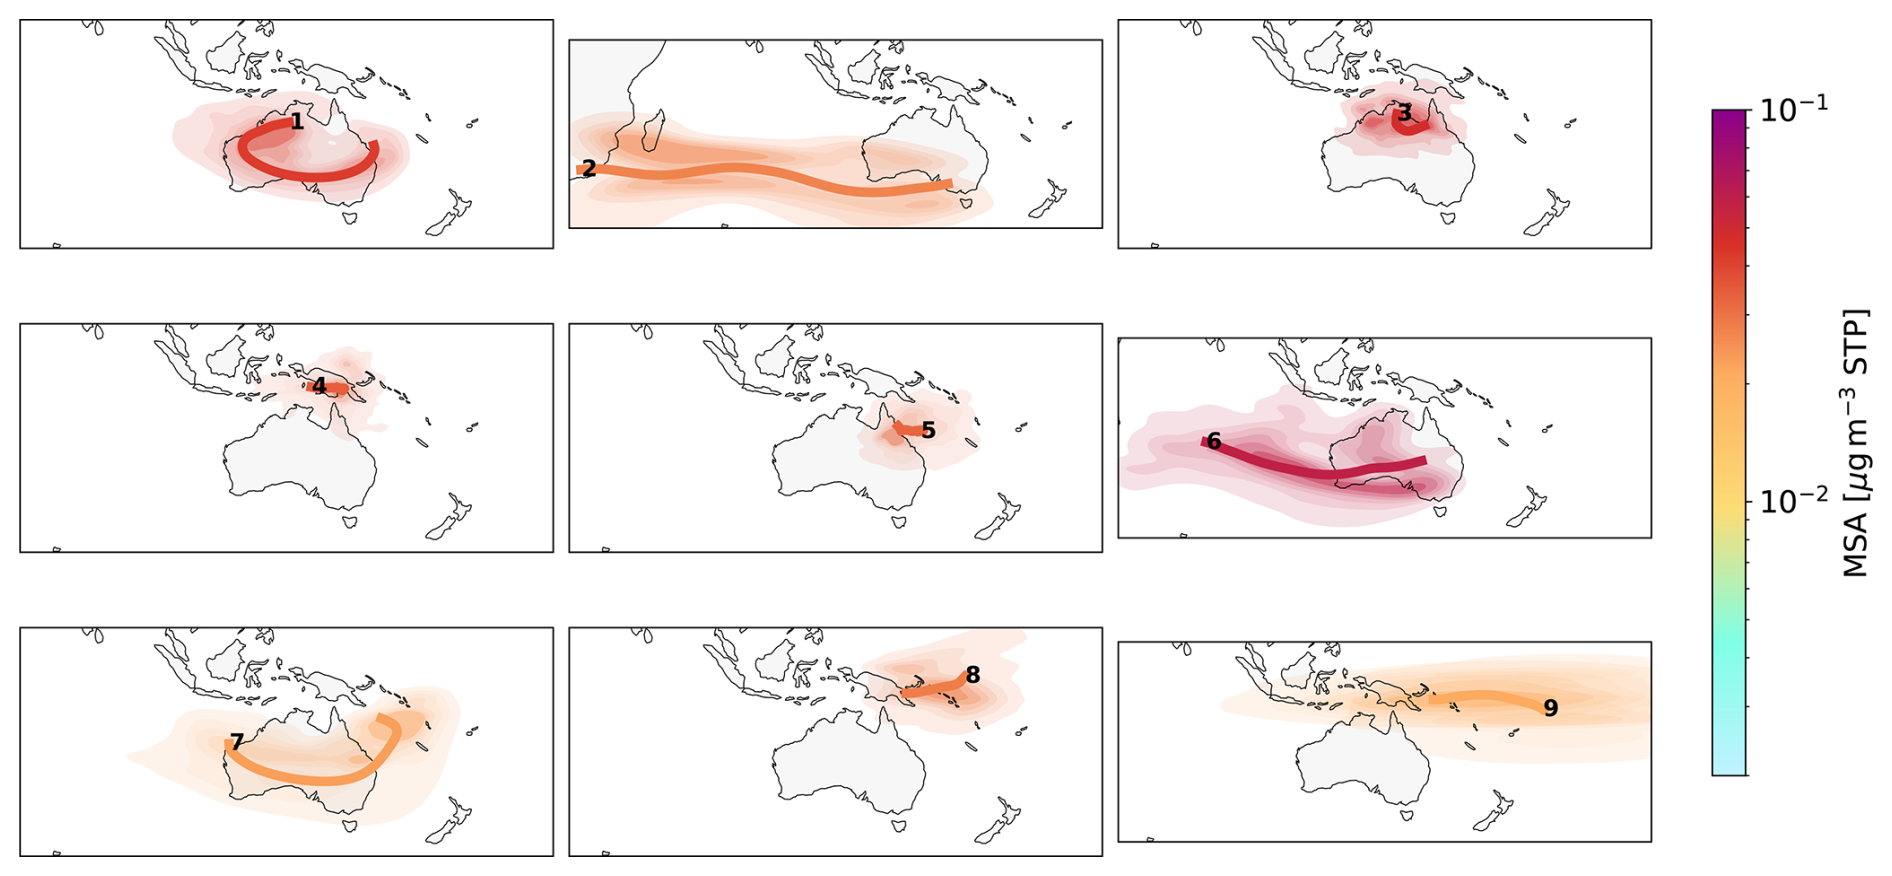
Figure A17Density plots for trajectories contributing to the nine clusters identified as main air mass origins, colour coded by the mean MSA concentration. The thick line indicates the mean trajectory. All trajectories were calculated 120 h backwards from the aircraft position.
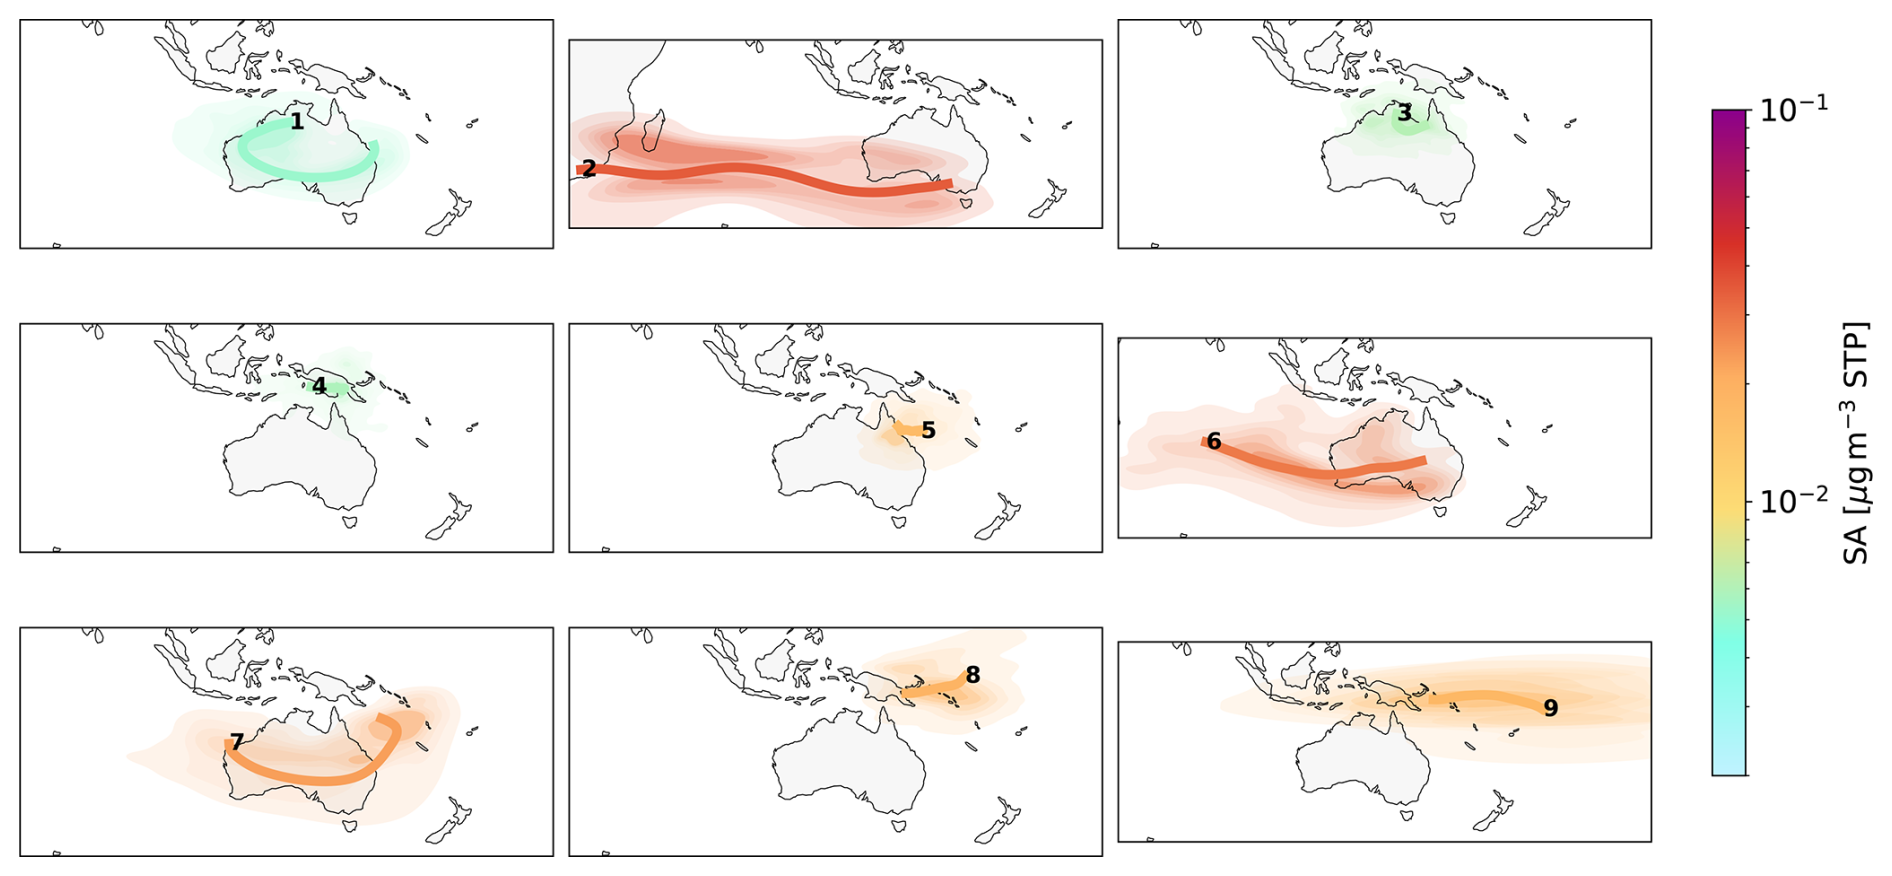
Figure A18Density plots for trajectories contributing to the nine clusters identified as main air mass origins, colour coded by the mean SA concentration. The thick line indicates the mean trajectory. All trajectories were calculated 120 h backwards from the aircraft position.
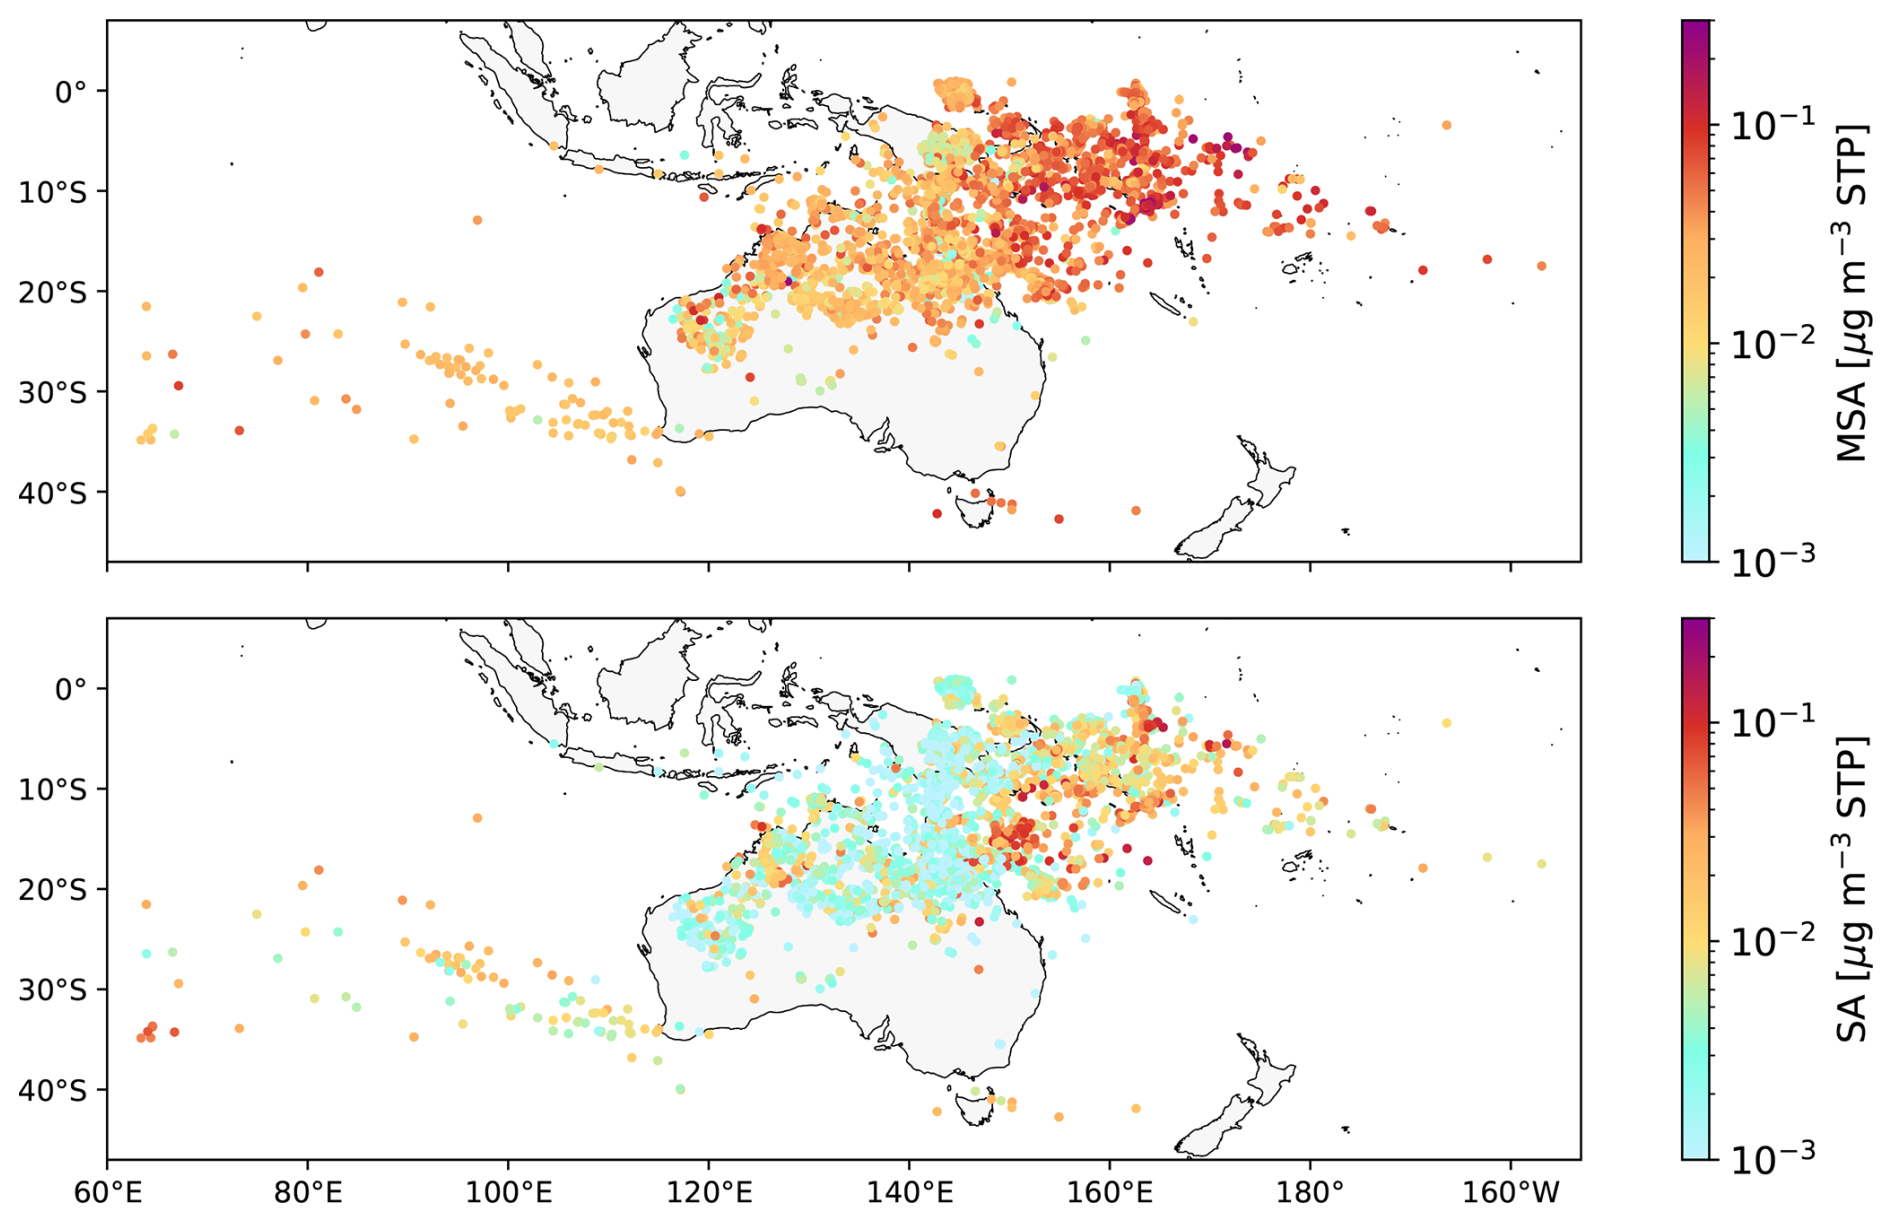
Figure A19Locations of the last trajectory contact with deep convection of all high altitude data points during CAFE-Pacific. The points are colour coded by the MSA and SA mass concentrations. Convection is identified using the cloud type variable “very high opaque cloud” from the Himawari satellite.
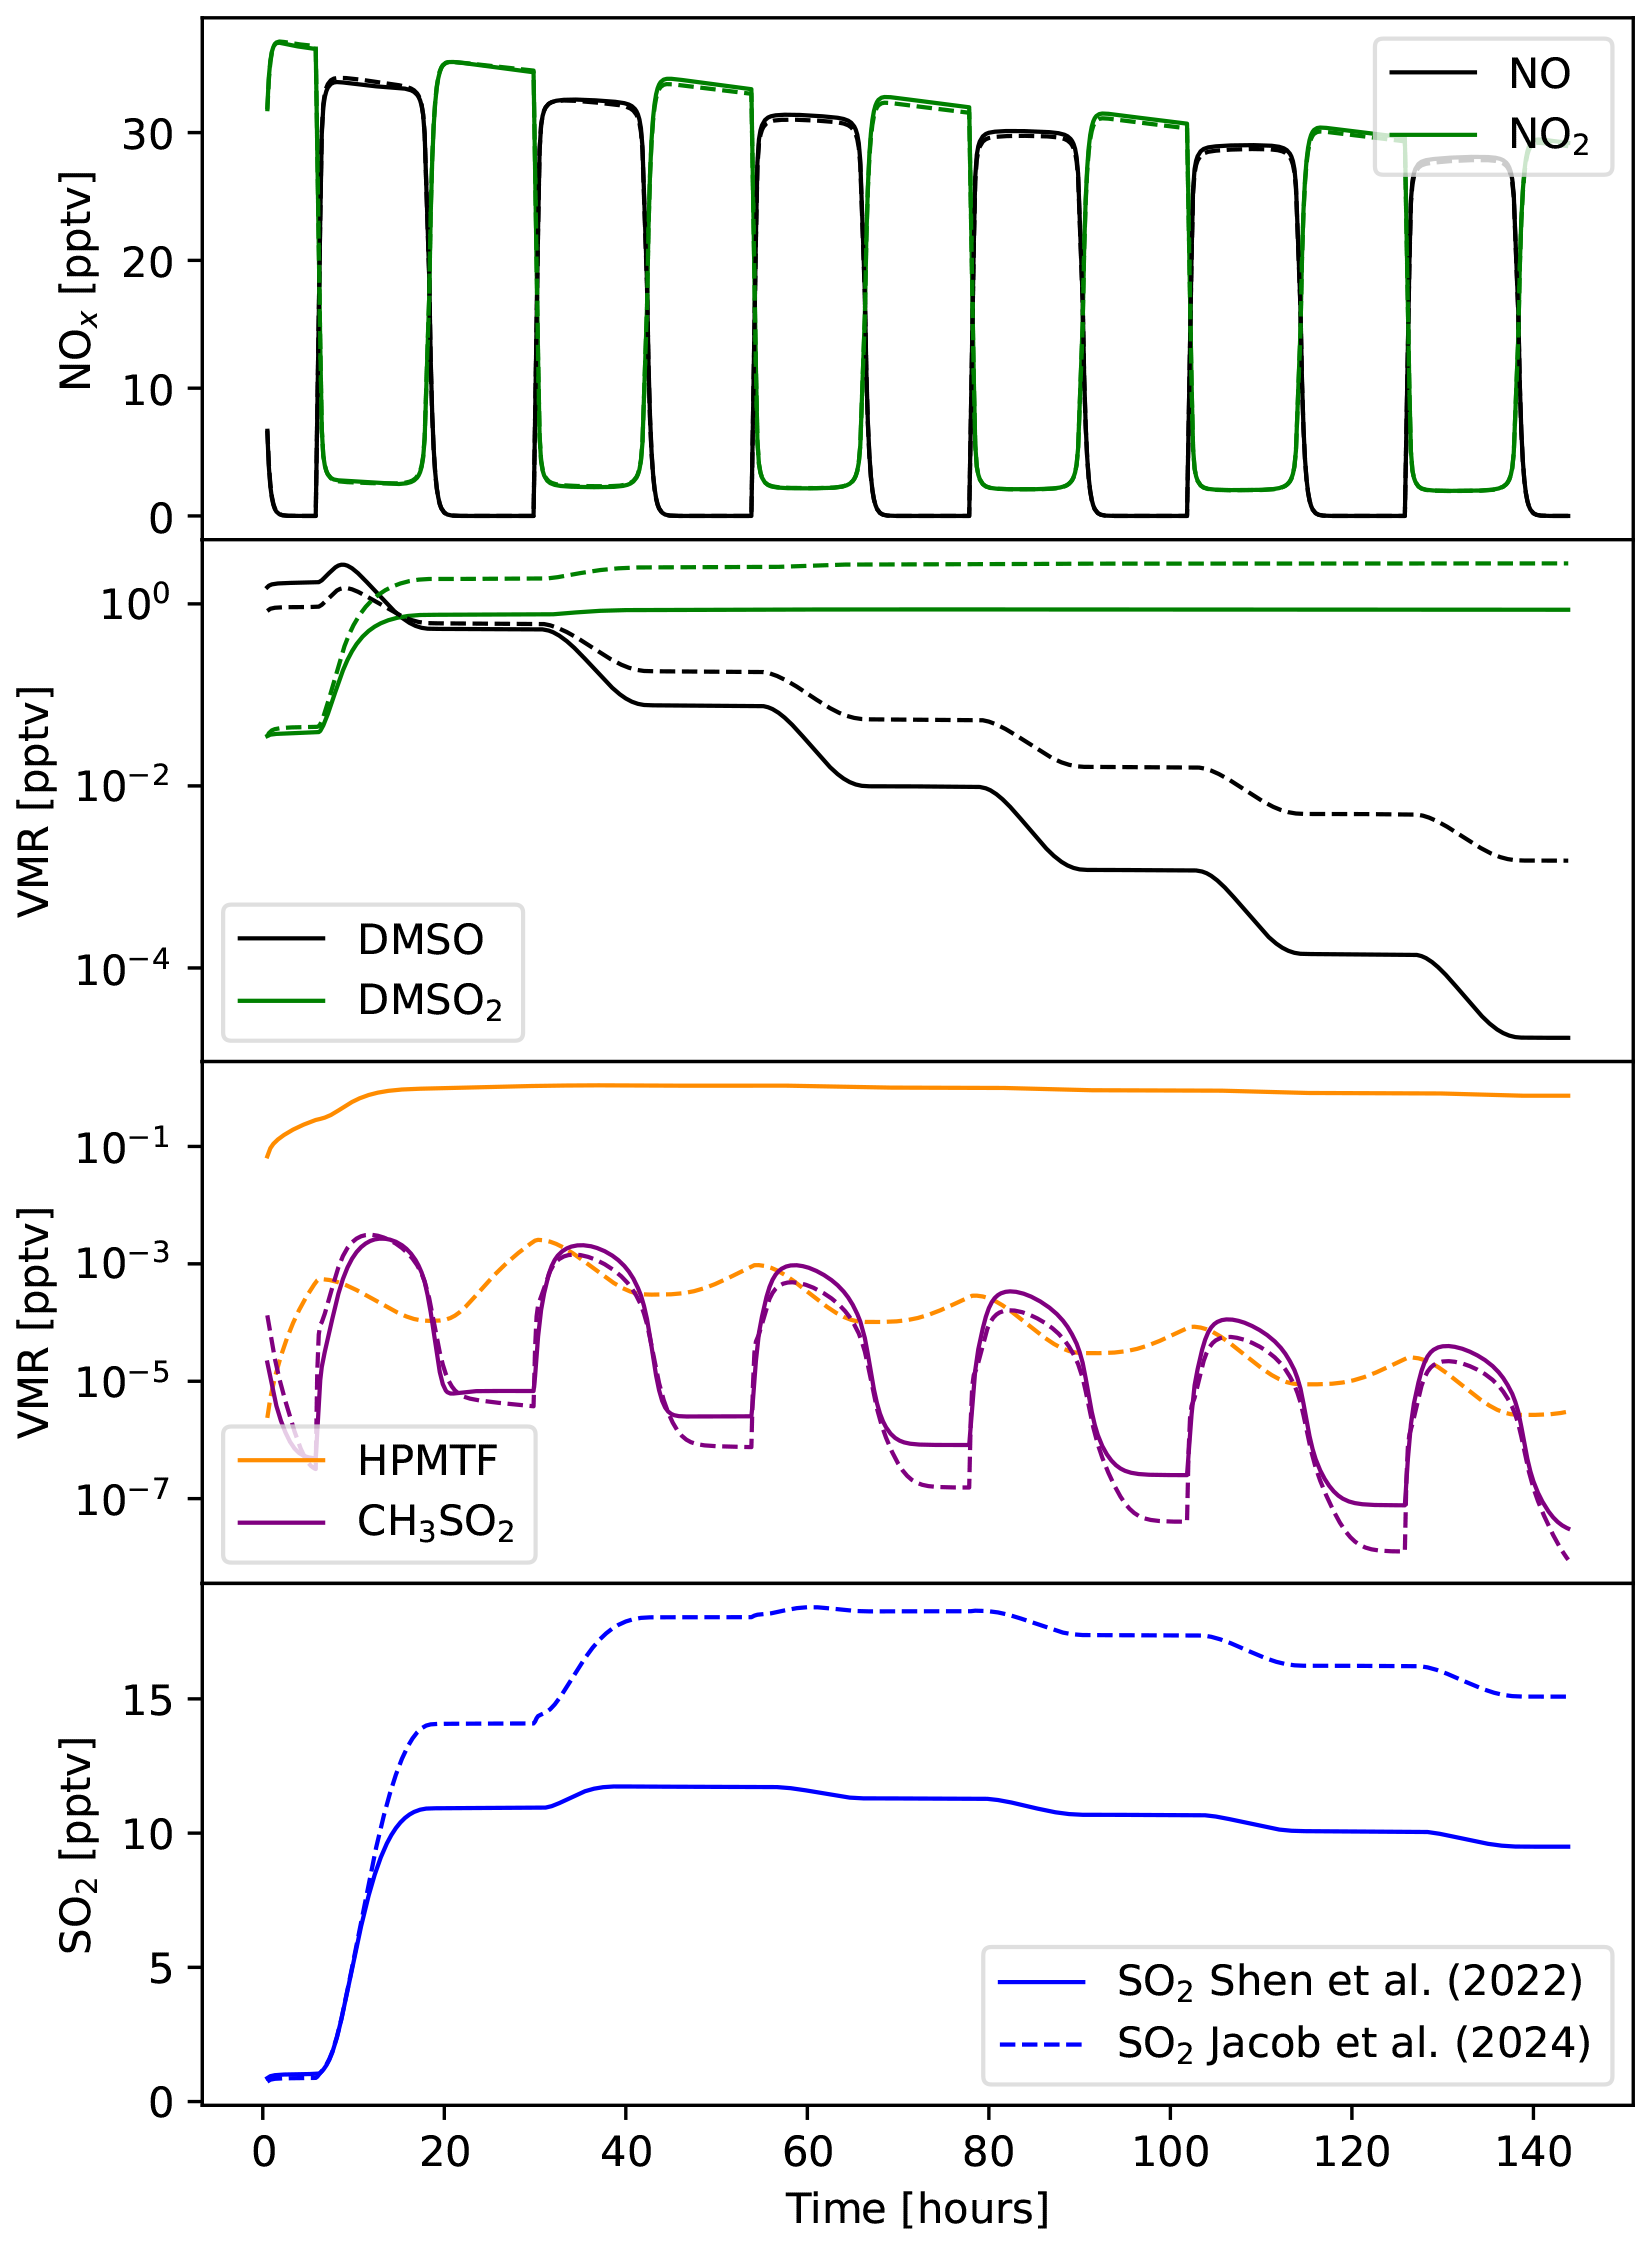
Figure A20Additional mixing ratios from the kinetic model simulations shown in Fig. 10 based on the chemical scheme published in Shen et al. (2022) (solid lines) and Jacob et al. (2024) (dashed lines). The model operates at a temperature of 223 K, a pressure of 200 hPa and a relative humidity of 60 %, representative for upper tropospheric outflow conditions. Reactive nitrogen was initialized with 40 pptv NO, while all other nitrogen species followed the background values implied by the MECCA mechanism. The largest discrepancy between both schemes is seen in the HMPTF mixing ratios which are significantly higher in the Shen mechanism.
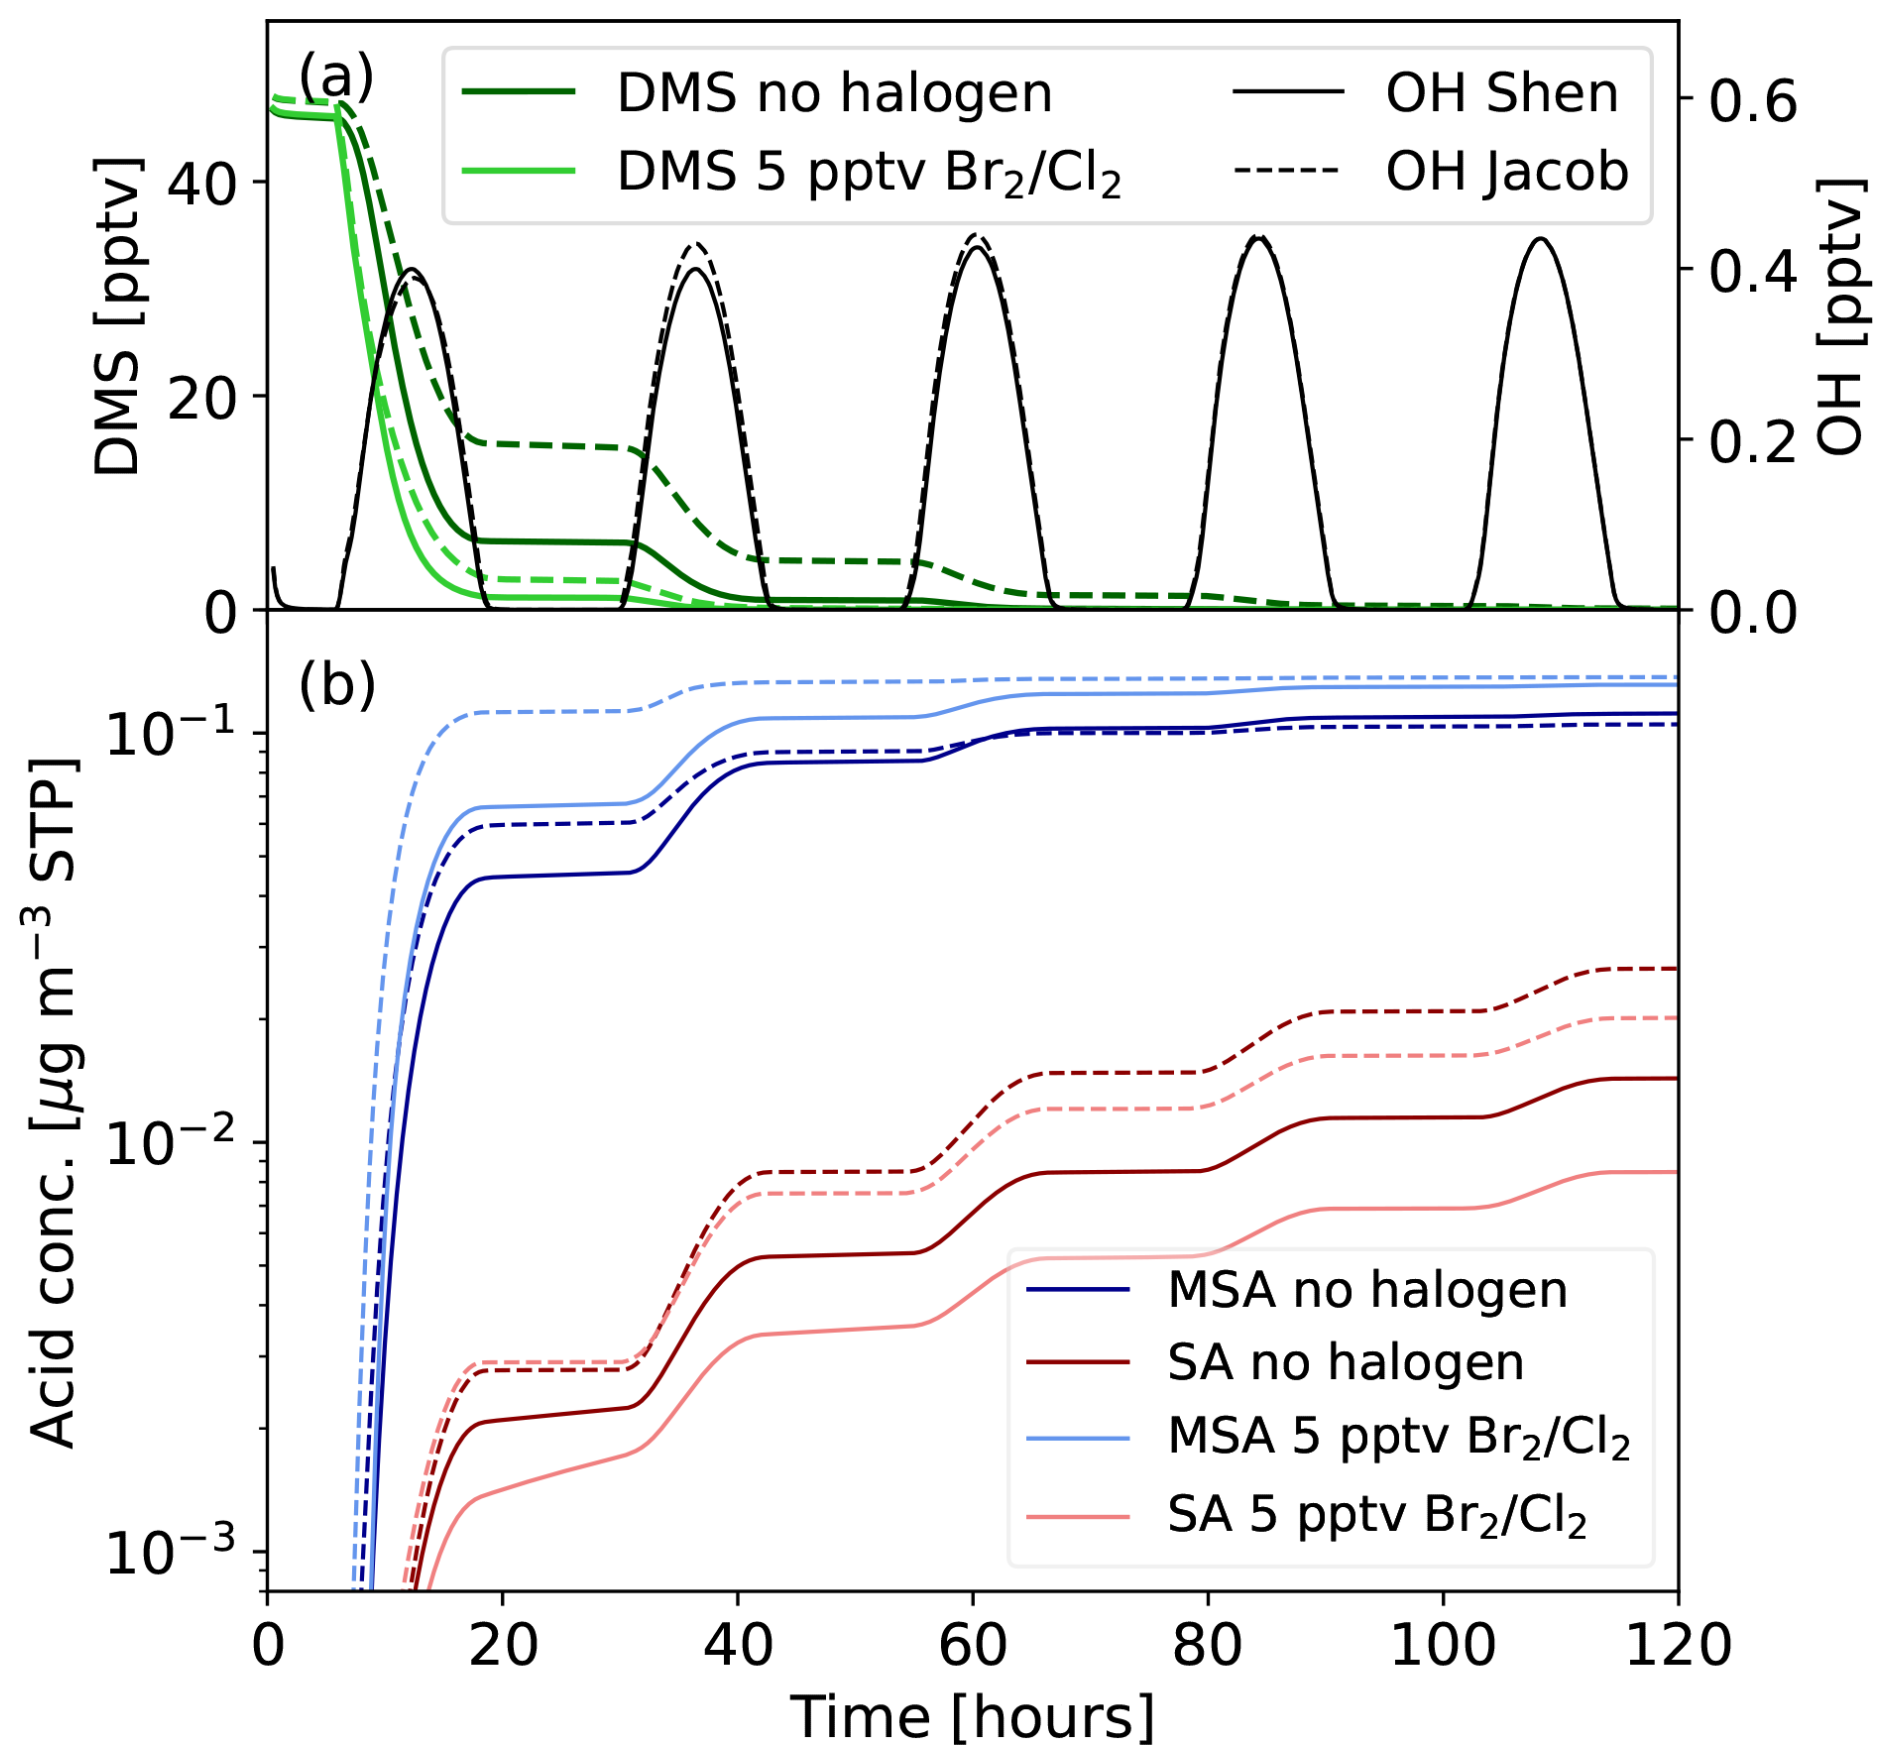
Figure A21Box model simulations of upper tropospheric DMS oxidation including halogen reactions. The model set up is identical to Fig. 10 for the darker colours and 5 pptv Br2 and 5 pptv Cl2 were added for the lighter lines. The chemistry schemes by Shen et al. (2022) (solid lines) and Jacob et al. (2024) (dashed lines) were used with additional halogen reactions from Burkholder et al. (2019). For better readability the OH mixing ratios are only plotted without halogens.
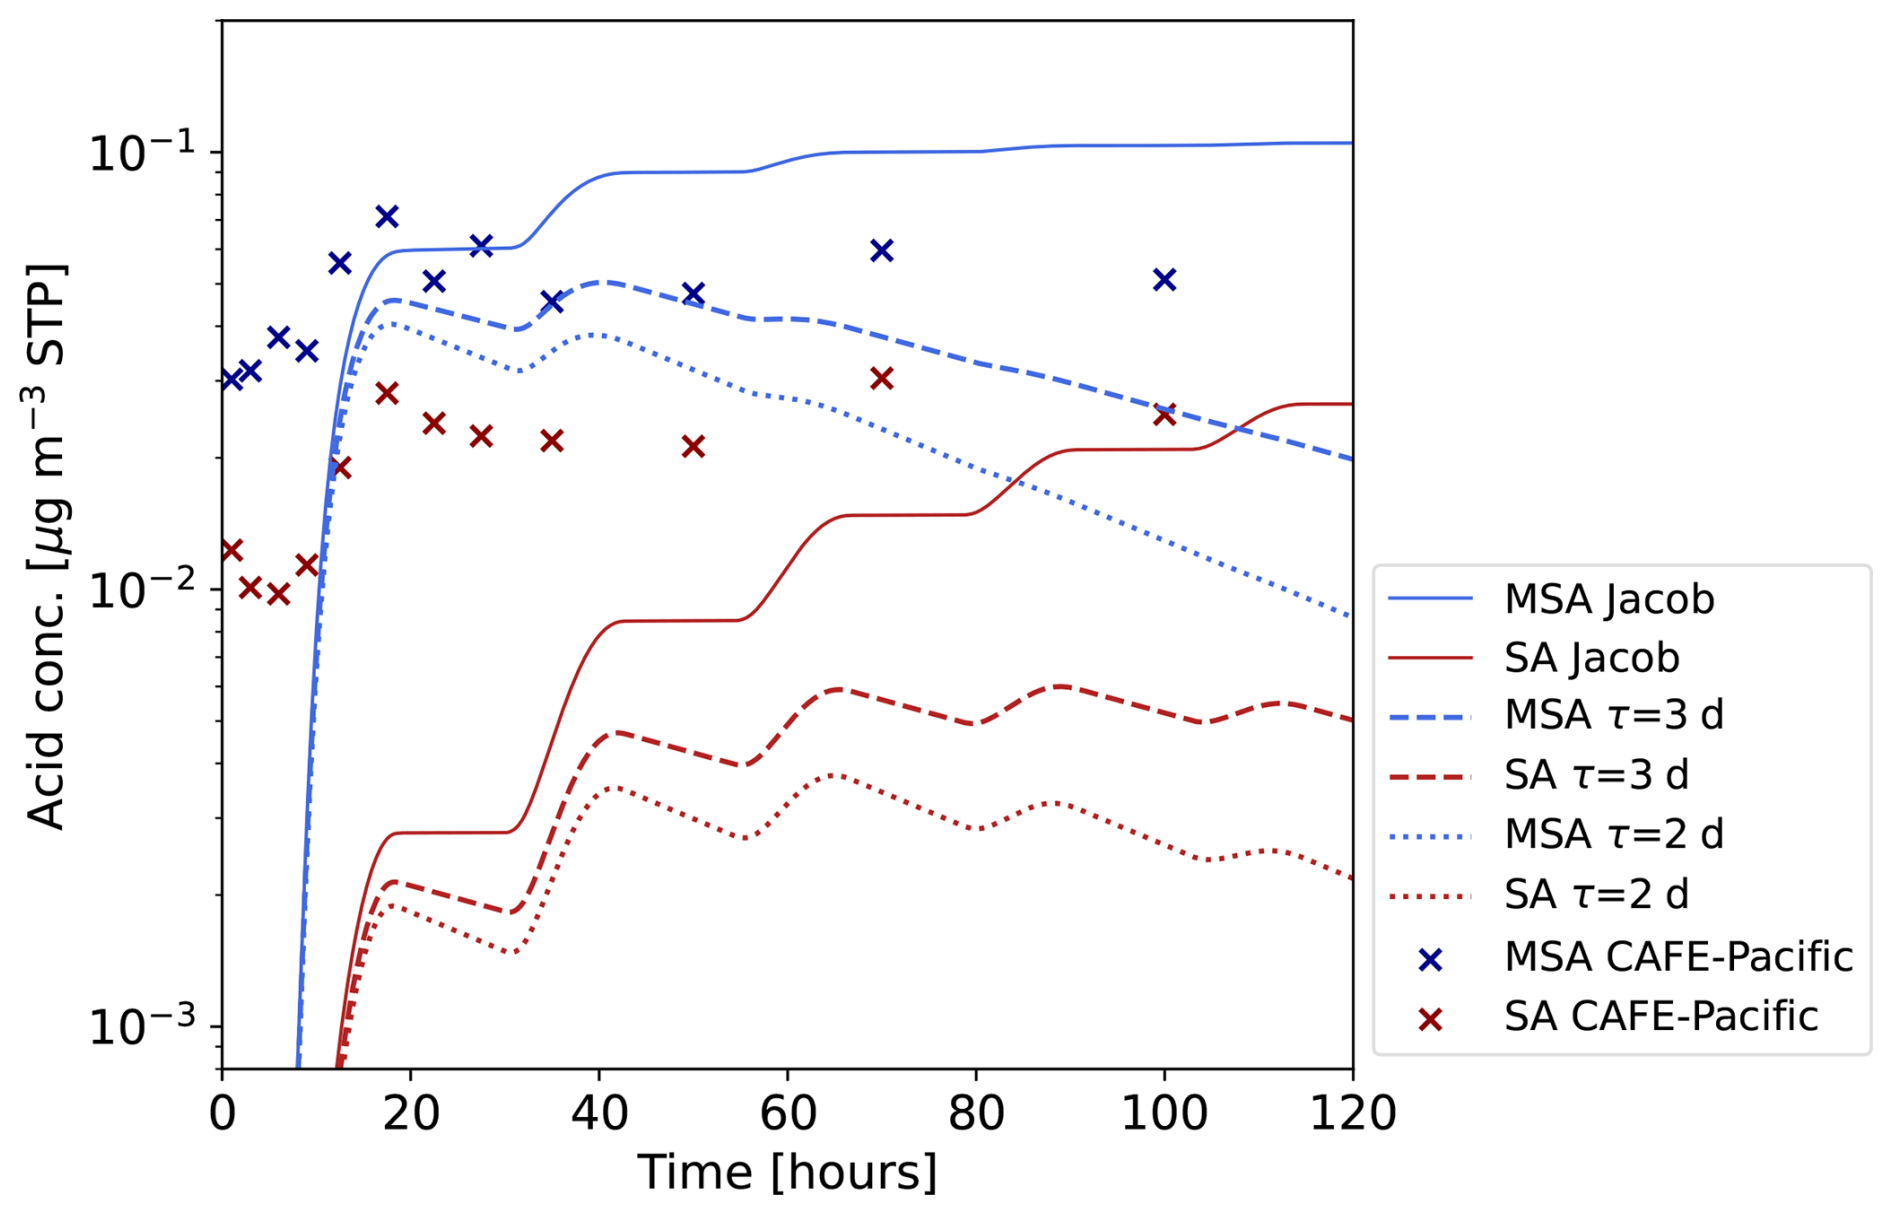
Figure A22Box modelling results of upper tropospheric DMS oxidation including dilution of MSA and SA with two different time scales of 2 and 3 d (dotted and dashed lines). Only the Jacob et al. (2024) chemical scheme results from Fig. 10 were used and the dilution was only applied to MSA and SA concentrations not to intermediate products or DMS.
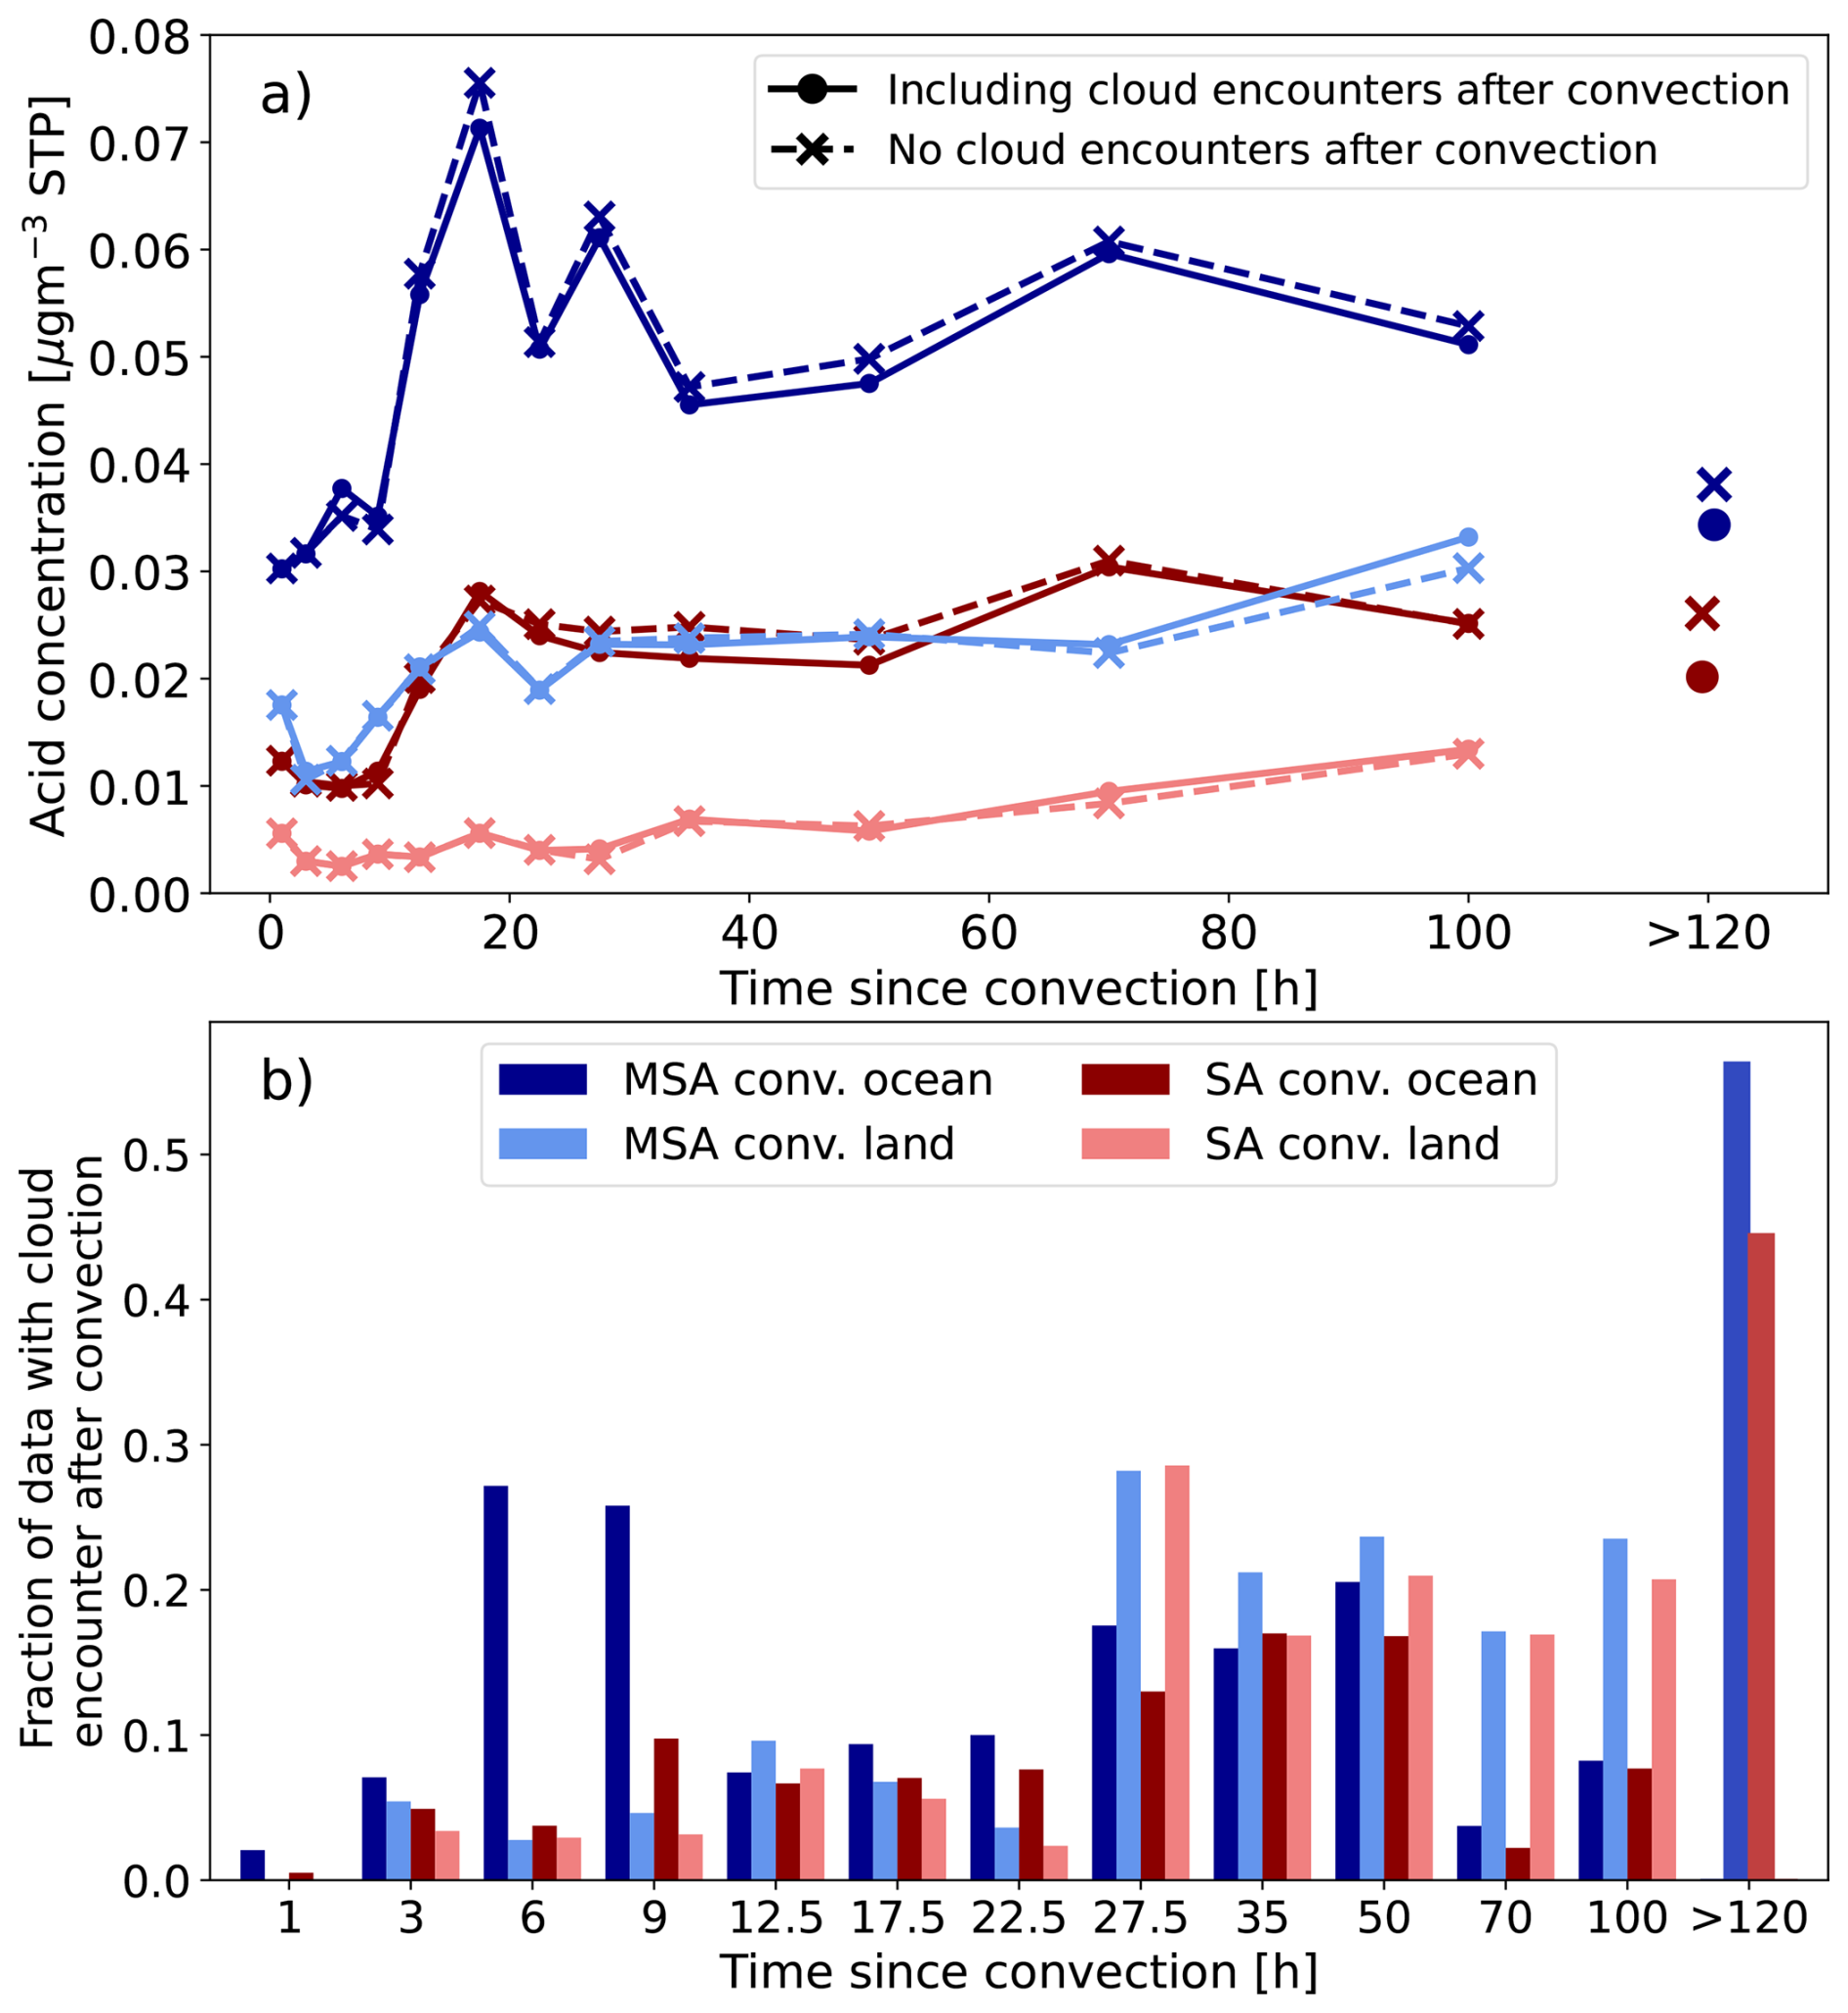
Figure A23Analysis of cloud encounters after the initial convective uplift. (a) shows the data in Fig. 9 and (solid lines, round markers) and additionally the data excluding second cloud encounters after the convection (dashed lines, cross markers). (b) shows the fraction of data points with a second cloud encounters at each time bin. Note that the x-axes are not aligned.
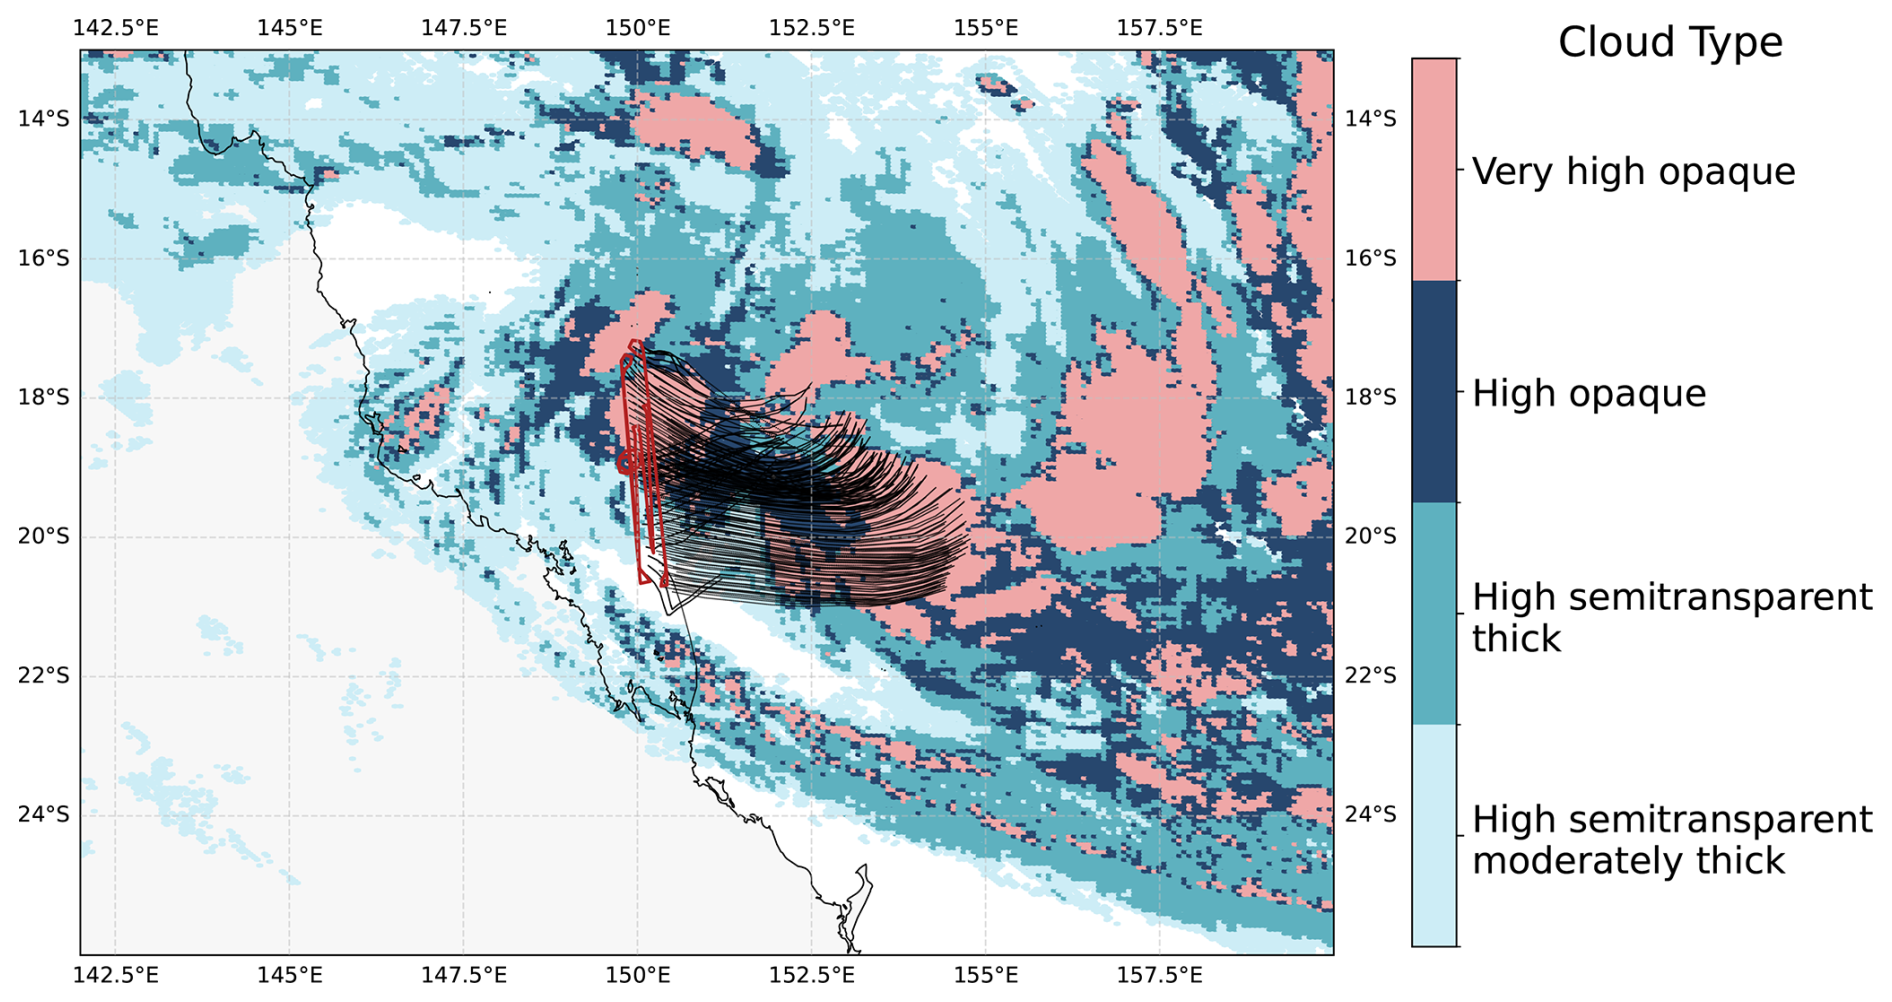
Figure A24Trajectories during a section of RF08 over the ocean close the the Australian coast with a Himawari satellite picture indicating the cloud types. The flight path is shown in red, the 10 h backward trajectories in black. The satellite picture shows the situation at 23 January 2026 15:00 UTC which corresponds to 8–12 h before the measurement. This convection is a possible origin of the particles, however low RH and comparably high O3 mixing ratios could hint towards a more aged convective outflow.
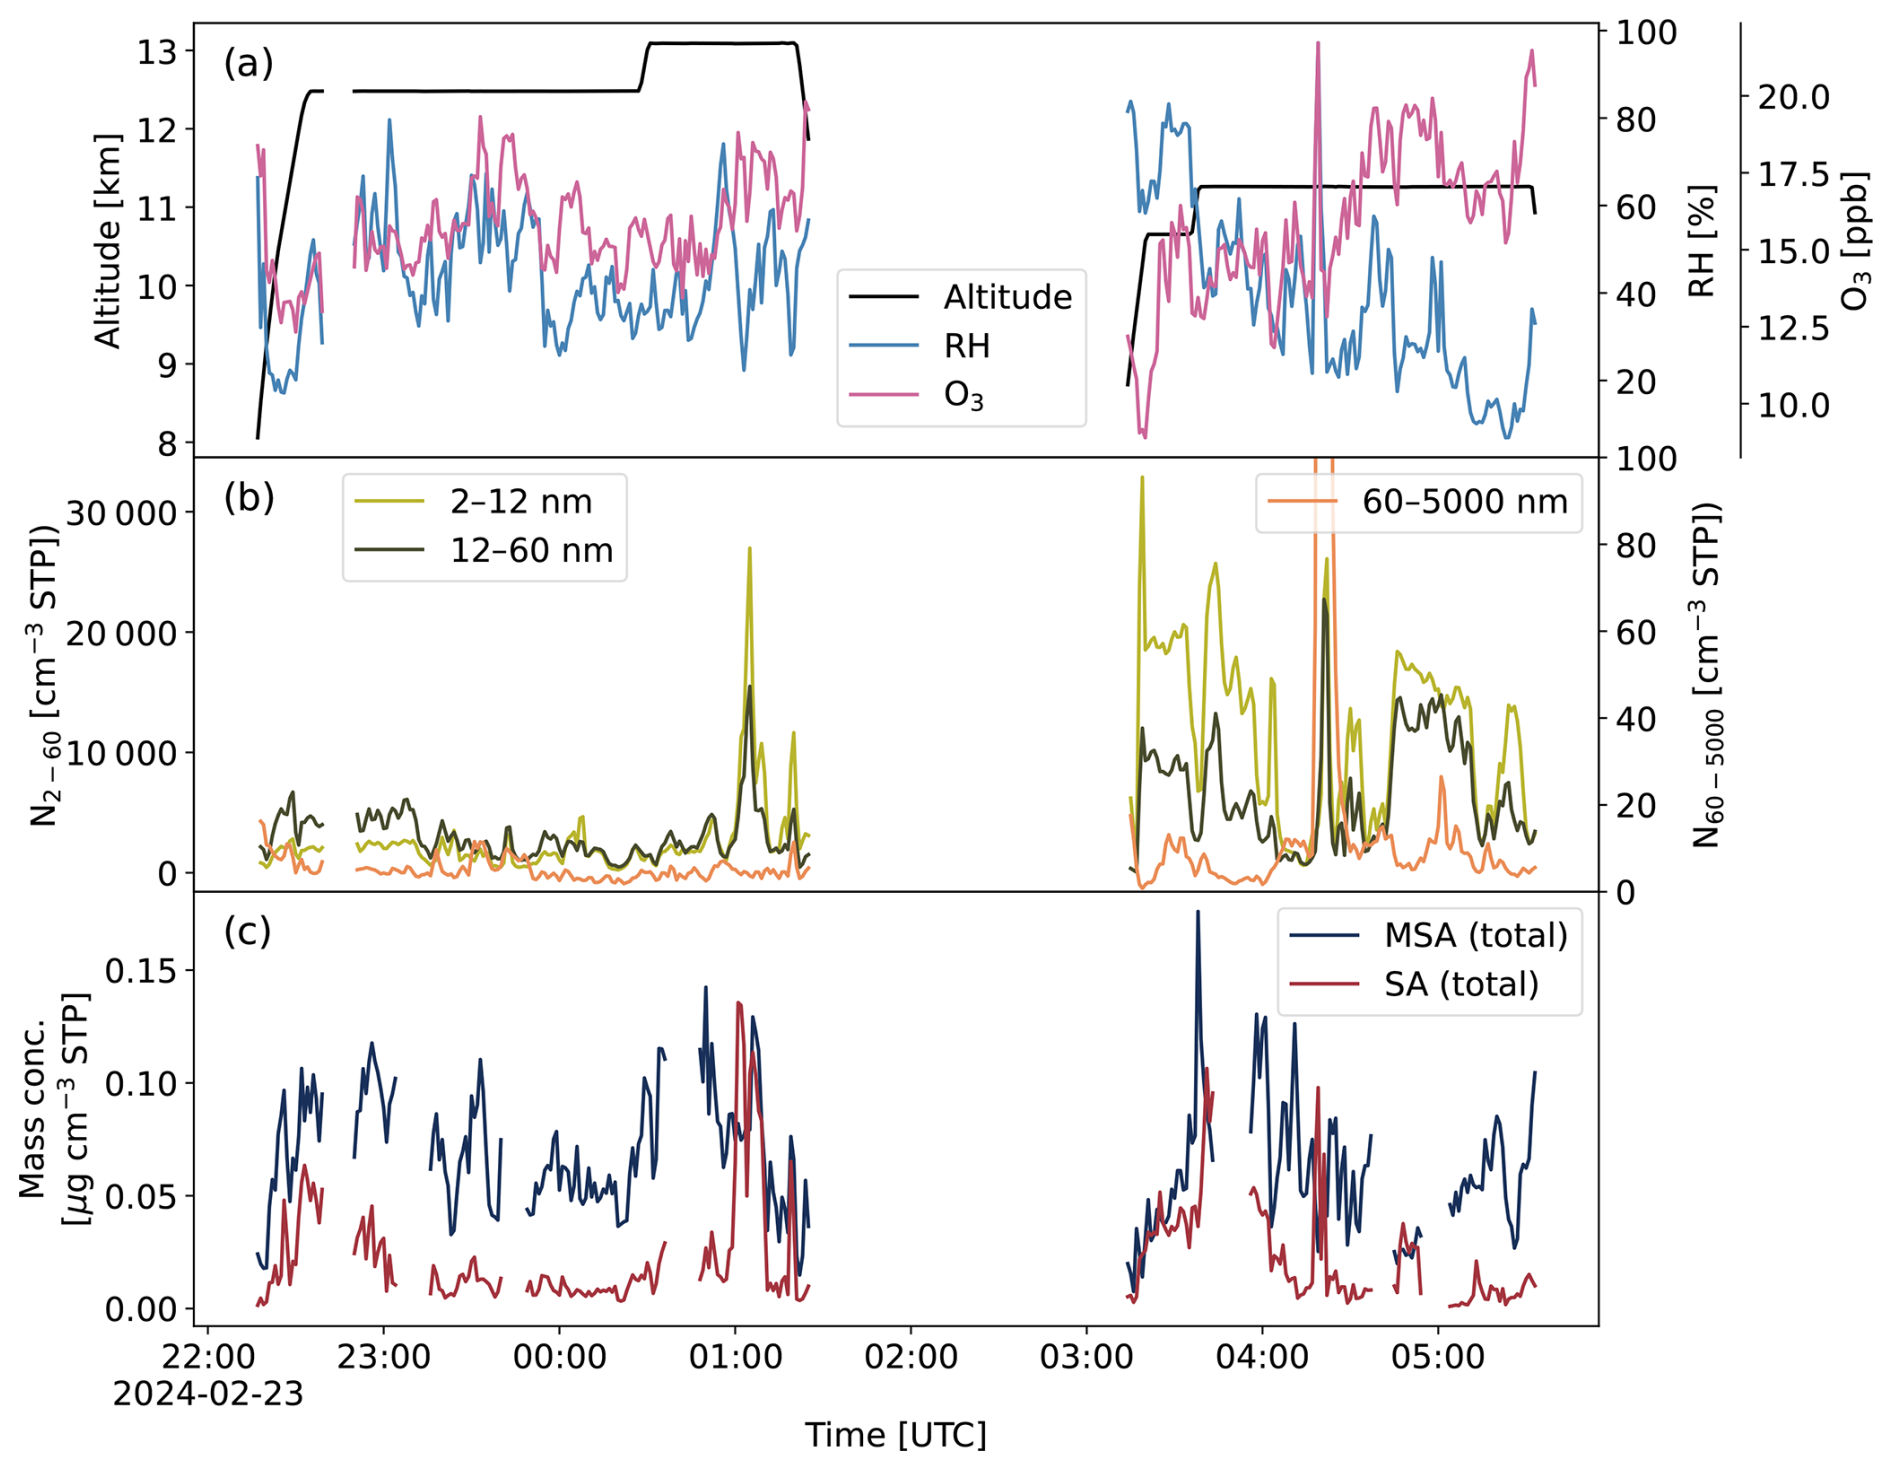
Figure A25Time series of RF21 with (a) showing the altitude, RH and O3 mixing ratios, (b) the particle number concentrations in different size ranges and (c) the mass concentration of total MSA and SA.
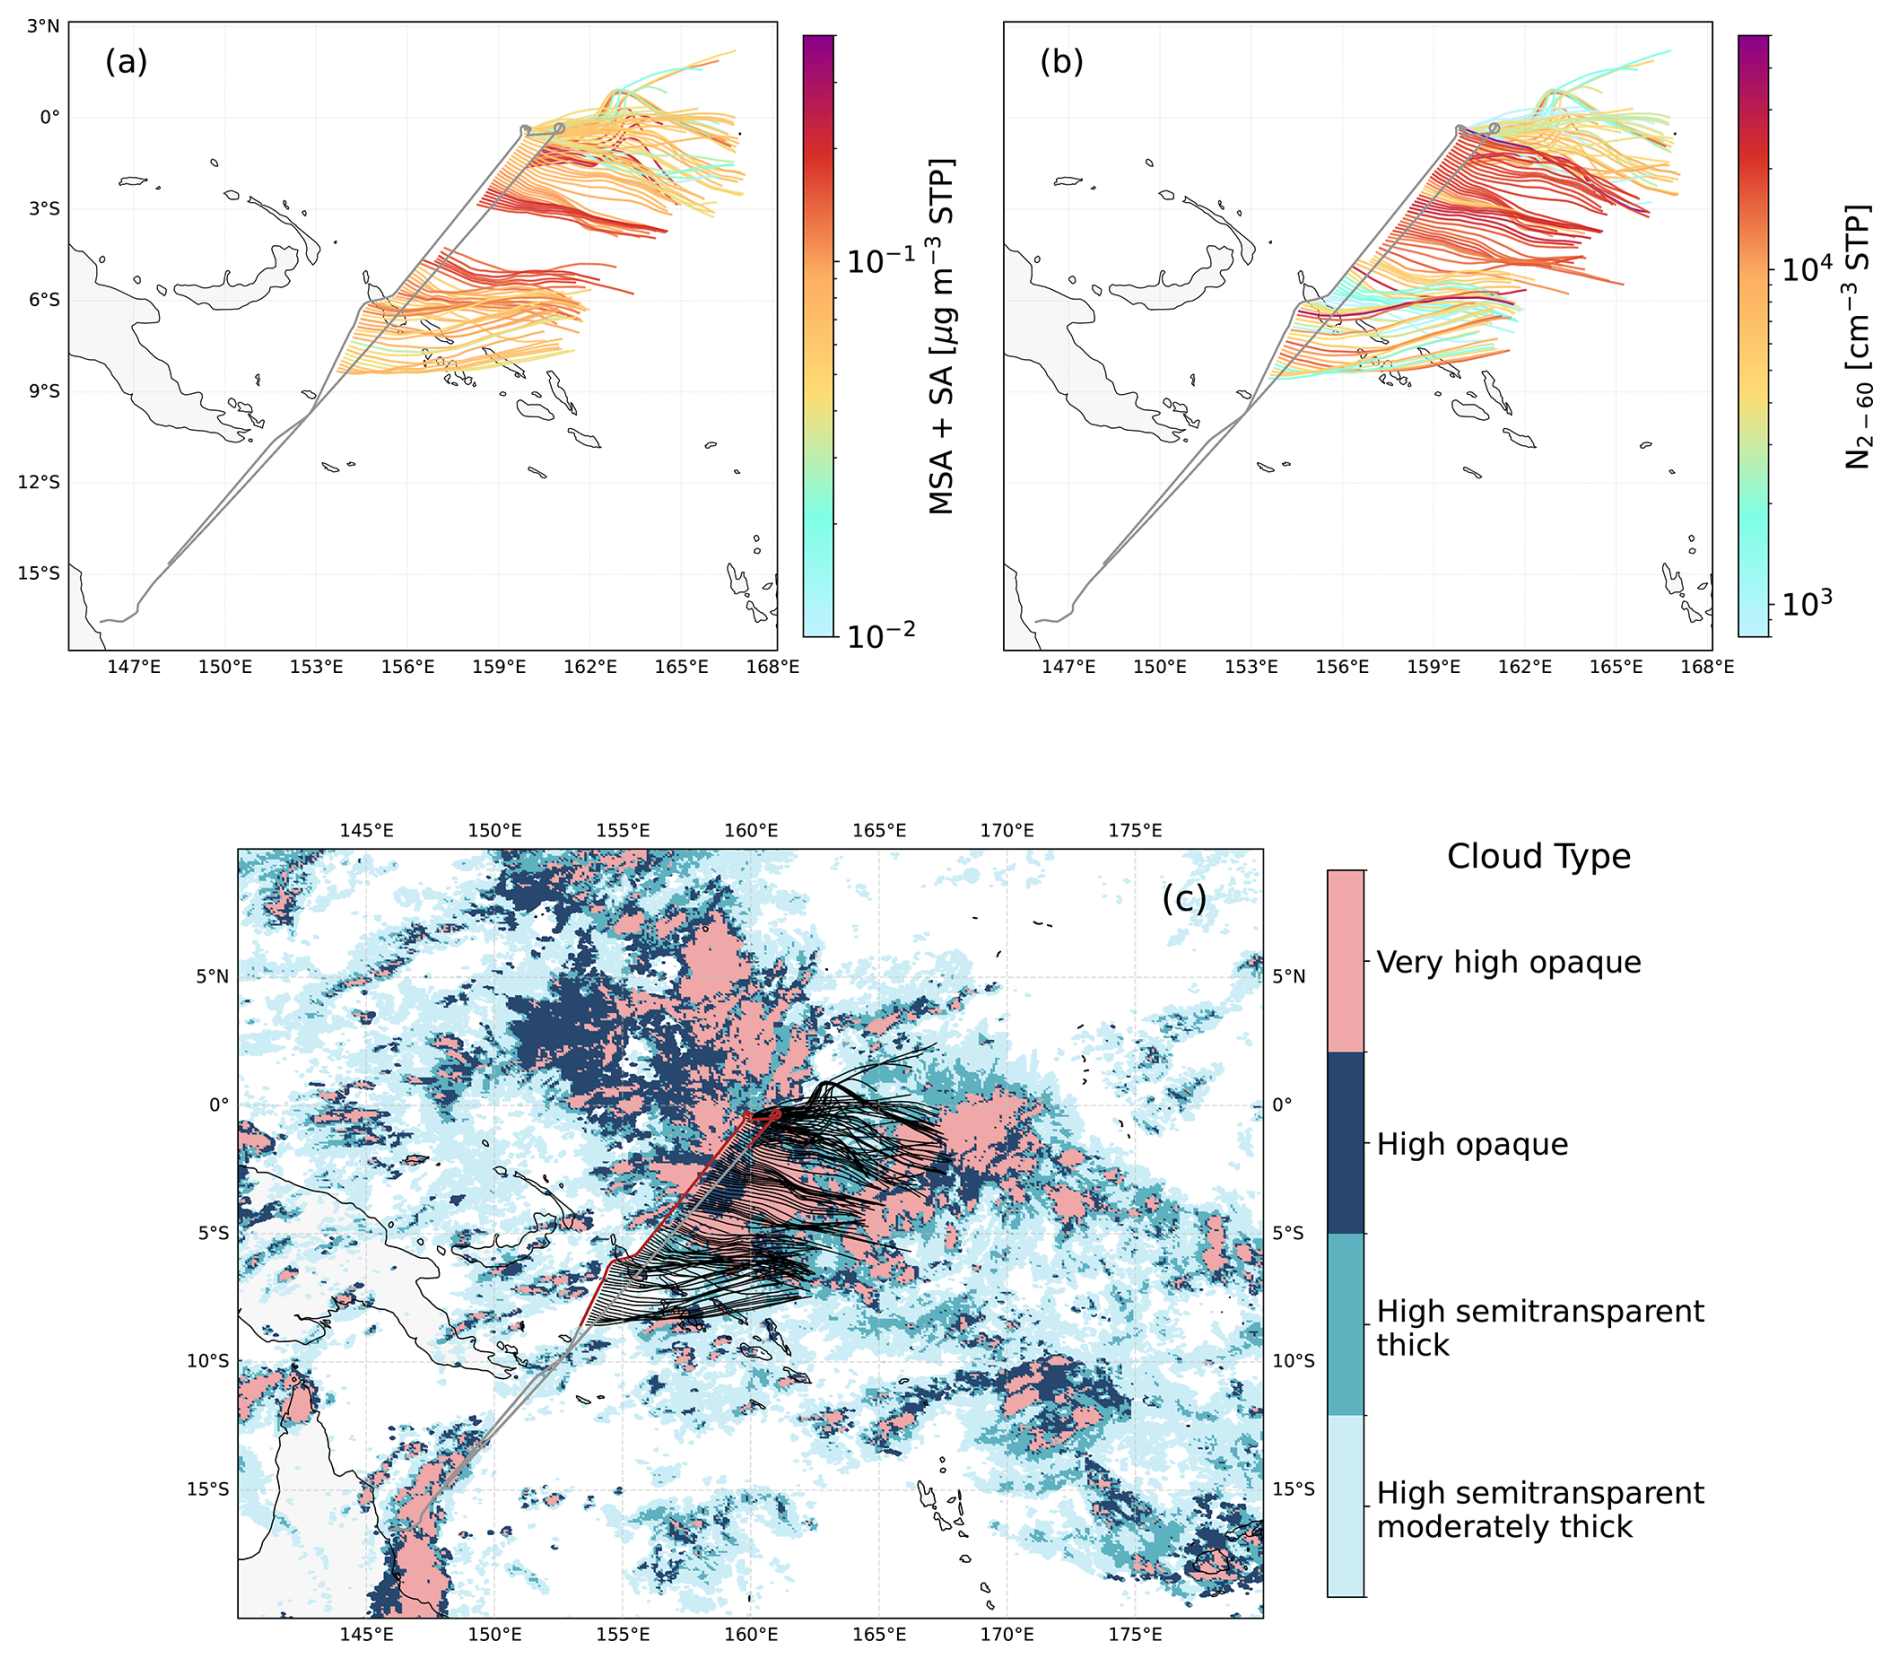
Figure A26Flight track (grey) and 24 h backward trajectories for a section of RF21. The trajectories are coloured by the sum of MSA and SA mass concentrations (a) and the concentration of particles with diameters between 2 and 60 nm (b). In (c) a Himawari satellite picture is shown from 23 January 2024 03:00 UTC which corresponds to 22–26 h before the measurements in (a) and (b).
The data displayed in the main figures is available on Zenodo under: https://doi.org/10.5281/zenodo.19555789 (Klebach et al., 2026).
Conceptualization was performed by H.K., M.H., and J.C.; Methodology by H.K., M.H. and L.B.; Investigation by H.K., M.H., K.K., L.B., P.J., M.P., S.Ri., J.S., M.Z-W. (CAFE data) and by H.K., L.C-P. and D.R. (CLOUD data); Formal Analysis by H.K., K.K. and S.A. (Aircraft data) and H.K., L.C-P. and D.R. (CLOUD data), Data Curation and Validation by H.K., K.K., S.A. and P.L.; Visualization by H.K. The box modelling was done by S.Ru. (Software & Formal Analysis). Resources were provided by J.C., M.P., U.P. and J.S.; Supervision by M.H., N.B. and J.C. The original draft was written by H.K. and reviewed and edited by M.H., K.K., L.B., S.A., N.B., M.P., U.P., S.Ri., S.Ru., J.S., M.Z-W. and J.C.
At least one of the (co-)authors is a member of the editorial board of Atmospheric Chemistry and Physics. The peer-review process was guided by an independent editor, and the authors also have no other competing interests to declare.
Publisher's note: Copernicus Publications remains neutral with regard to jurisdictional claims made in the text, published maps, institutional affiliations, or any other geographical representation in this paper. The authors bear the ultimate responsibility for providing appropriate place names. Views expressed in the text are those of the authors and do not necessarily reflect the views of the publisher.
We would like to thank the German Aerospace Center Flight Experiments (DLR-FX) for organizing the CAFE-Pacific campaign and operating the HALO aircraft, with special thanks to the pilots, technicians, engineers and operations team. We would like to also acknowledge the CLOUD collaboration for the possibility of conducting the instrumental comparison at the CLOUD chamber. We thank Timo Keber, Manuel Granzin and Mario Simon for technical support during the measurements, Clara Lietzke and Hao Liqing for providing data for Fig. A4, and Zhensen Zheng and Armin Hansel for helpful discussions on DMS oxidation. We acknowledge NOAA for providing GFS data. This research was undertaken with the use of the National Computational Infrastructure (NCI Australia). NCI Australia is enabled by the National Collaborative Research Infrastructure Strategy (NCRIS). This study has been conducted using E.U. Copernicus Marine Service Information (https://doi.org/10.48670/moi-00015) and data obtained from Copernicus Atmosphere Monitoring Service (2020): CAMS global reanalysis (EAC4) (Atmosphere Data Store, https://doi.org/10.24381/d58bbf47).
This research has been supported by the Deutsche Forschungsgemeinschaft (grant nos. 502272415, 502266535, 461450880, 316646266, 461448963, 461450583, and TRR 301, 428312742), the Bundesministerium für Forschung, Technologie und Raumfahrt (grant no. 01LK2201A), and the HORIZON EUROPE Marie Sklodowska-Curie Actions (grant no. 101073026).
This open-access publication was funded by Goethe University Frankfurt.
This paper was edited by Chiara Giorio and reviewed by three anonymous referees.
Andreae, M. O., Afchine, A., Albrecht, R., Holanda, B. A., Artaxo, P., Barbosa, H. M. J., Borrmann, S., Cecchini, M. A., Costa, A., Dollner, M., Fütterer, D., Järvinen, E., Jurkat, T., Klimach, T., Konemann, T., Knote, C., Krämer, M., Krisna, T., Machado, L. A. T., Mertes, S., Minikin, A., Pöhlker, C., Pöhlker, M. L., Pöschl, U., Rosenfeld, D., Sauer, D., Schlager, H., Schnaiter, M., Schneider, J., Schulz, C., Spanu, A., Sperling, V. B., Voigt, C., Walser, A., Wang, J., Weinzierl, B., Wendisch, M., and Ziereis, H.: Aerosol characteristics and particle production in the upper troposphere over the Amazon Basin, Atmos. Chem. Phys., 18, 921–961, https://doi.org/10.5194/acp-18-921-2018, 2018. a, b
Baalbaki, R., Shen, J., Simon, M., Klebach, H., Ruhl, S., DeVivo, J., Wang, M., Scholz, W., Dada, L., Rörup, B., Stolzenburg, D., Manninen, H. E., Sommer, E., Caudillo-Plath, L., Marie, G., Friedrich, M., Yu, W., Leiminger, M., Alfaouri, D., Amorim, A., Arnoldi-Meadows, T., Beckmann, H., Berntheusel, M., Bräkling, S., Brasseur, Z., Chiu, R., Duplissy, J., Finkenzeller, H., Heinritzi, M., Kunkler, F., Lamkaddam, H., Lopez, B., Mahfouz, N., Makhmutov, V., Martinez, M., Marten, R., Massabo, D., Mauldin, R., Mentler, B., Müller, M., Philippov, M., Piedehierro, A. A., Rato, P., Reinecke, T., Richter, S., Russell, D. M., Schulze, B., Surdu, M., Thakur, R., Tham, Y. J., Tian, P., Tomé, A., Tong, Y., Top, J., Wagner, A. C., Wang, D. S., Wang, Y., Ward, R. X., Weber, S. K., Welti, A., Wu, Y., Zauner-Wieczorek, M., Zhang, J., Curtius, J., Donahue, N. M., El Haddad, I., Flagan, R. C., Hansel, A., Harder, H., Kürten, A., Petäjä, T., Schobesberger, S., Sipilä, M., Volkamer, R., Winkler, P. M., Worsnop, D. R., Christoudias, T., Pozzer, A., Kulmala, M., Kirkby, J., Lehtipalo, K., and He, X.-C.: Role of methanesulfonic acid in atmospheric particle nucleation and growth, Nature, https://doi.org/10.1038/s41586-026-10810-2, 2026. a, b
Baccarini, A., Dommen, J., Lehtipalo, K., Henning, S., Modini, R. L., Gysel-Beer, M., Baltensperger, U., and Schmale, J.: Low-Volatility Vapors and New Particle Formation Over the Southern Ocean During the Antarctic Circumnavigation Expedition, J. Geophys. Res.-Atmos., 126, e2021JD035126, https://doi.org/10.1029/2021JD035126, 2021. a, b
Bahreini, R., Ervens, B., Middlebrook, A. M., Warneke, C., de Gouw, J. A., DeCarlo, P. F., Jimenez, J. L., Brock, C. A., Neuman, J. A., Ryerson, T. B., Stark, H., Atlas, E., Brioude, J., Fried, A., Holloway, J. S., Peischl, J., Richter, D., Walega, J., Weibring, P., Wollny, A. G., and Fehsenfeld, F. C.: Organic aerosol formation in urban and industrial plumes near Houston and Dallas, Texas, J. Geophys. Res.-Atmos., 114, https://doi.org/10.1029/2008JD011493, 2009. a
Beck, L. J., Sarnela, N., Junninen, H., Hoppe, C. J. M., Garmash, O., Bianchi, F., Riva, M., Rose, C., Peräkylä, O., Wimmer, D., Kausiala, O., Jokinen, T., Ahonen, L., Mikkilä, J., Hakala, J., He, X.-C., Kontkanen, J., Wolf, K. K. E., Cappelletti, D., Mazzola, M., Traversi, R., Petroselli, C., Viola, A. P., Vitale, V., Lange, R., Massling, A., Nøjgaard, J. K., Krejci, R., Karlsson, L., Zieger, P., Jang, S., Lee, K., Vakkari, V., Lampilahti, J., Thakur, R. C., Leino, K., Kangasluoma, J., Duplissy, E.-M., Siivola, E., Marbouti, M., Tham, Y. J., Saiz-Lopez, A., Petäjä, T., Ehn, M., Worsnop, D. R., Skov, H., Kulmala, M., Kerminen, V.-M., and Sipilä, M.: Differing Mechanisms of New Particle Formation at Two Arctic Sites, Geophys. Res. Lett., 48, https://doi.org/10.1029/2020GL091334, 2021. a, b
Bock, J., Michou, M., Nabat, P., Abe, M., Mulcahy, J. P., Olivié, D. J. L., Schwinger, J., Suntharalingam, P., Tjiputra, J., van Hulten, M., Watanabe, M., Yool, A., and Séférian, R.: Evaluation of ocean dimethylsulfide concentration and emission in CMIP6 models, Biogeosciences, 18, 3823–3860, https://doi.org/10.5194/bg-18-3823-2021, 2021. a
Broch, S.: Ein neues LIF-Instrument für flugzeug- und bodengebundene Messungen von OH- und HO 2 -Radikalen in der Troposphäre, PhD thesis, Bergische Universität Wuppertal, Jülich, https://nbn-resolving.org/urn:nbn:de:hbz:468-20120305-092715-1 (last access: 9 April 2026), 2012. a
Brock, C. A., Hamill, P., Wilson, J. C., Jonsson, H. H., and Chan, K. R.: Particle Formation in the Upper Tropical Troposphere: A Source of Nuclei for the Stratospheric Aerosol, Science, 270, 1650–1653, https://doi.org/10.1126/science.270.5242.1650, 1995. a
Bureau Of Meteorology: Bureau of Meteorology Satellite Derived Products, https://doi.org/10.25914/c2vt-8n41, 2024. a
Burkholder, J. B., Sander, S. P., Abbatt, J., Barker, J. R., Cappa, C., Crounse, J. D., Dibble, T. S., Huie, R. E., Kolb, C. E., Kurylo, M. J., Orkin, V. L., Percival, C. J., Wilmouth, D. M., and Wine, P. H.: Chemical Kinetics and Photochemical Data for Use in Atmospheric Studies, Evaluation No. 19, JPL Publication 19-5, https://science.jpl.nasa.gov/documents/1487/NASA-JPL_Evaluation_19-5.pdf (last access: 15 March 2026), 2019. a, b
Cala, B. A., Archer-Nicholls, S., Weber, J., Abraham, N. L., Griffiths, P. T., Jacob, L., Shin, Y. M., Revell, L. E., Woodhouse, M., and Archibald, A. T.: Development, intercomparison, and evaluation of an improved mechanism for the oxidation of dimethyl sulfide in the UKCA model, Atmos. Chem. Phys., 23, 14735–14760, https://doi.org/10.5194/acp-23-14735-2023, 2023. a, b
Canagaratna, M. R., Jayne, J. T., Jimenez, J. L., Allan, J. D., Alfarra, M. R., Zhang, Q., Onasch, T. B., Drewnick, F., Coe, H., Middlebrook, A., Delia, A., Williams, L. R., Trimborn, A. M., Northway, M. J., DeCarlo, P. F., Kolb, C. E., Davidovits, P., and Worsnop, D. R.: Chemical and microphysical characterization of ambient aerosols with the aerodyne aerosol mass spectrometer, Mass Spectrom. Rev., 26, 185–222, https://doi.org/10.1002/mas.20115, 2007. a
Carslaw, K. S., Gordon, H., Hamilton, D. S., Johnson, J. S., Regayre, L. A., Yoshioka, M., and Pringle, K. J.: Aerosols in the Pre-industrial Atmosphere, Current Climate Change Reports, 3, 1–15, https://doi.org/10.1007/s40641-017-0061-2, 2017. a
Chen, H., Varner, M. E., Gerber, R. B., and Finlayson-Pitts, B. J.: Reactions of Methanesulfonic Acid with Amines and Ammonia as a Source of New Particles in Air, J. Phys. Chem. B, 120, 1526–1536, https://doi.org/10.1021/acs.jpcb.5b07433, 2016. a
Chen, Q., Sherwen, T., Evans, M., and Alexander, B.: DMS oxidation and sulfur aerosol formation in the marine troposphere: a focus on reactive halogen and multiphase chemistry, Atmos. Chem. Phys., 18, 13617–13637, https://doi.org/10.5194/acp-18-13617-2018, 2018. a, b, c, d, e
Clarke, A. D. and Kapustin, V. N.: A Pacific Aerosol Survey. Part I: A Decade of Data on Particle Production, Transport, Evolution, and Mixing in the Troposphere, J. Atmos. Sci., 59, 363–382, https://doi.org/10.1175/1520-0469(2002)059<0363:APASPI>2.0.CO;2, 2002. a
Curtius, J., Heinritzi, M., Beck, L. J., Pöhlker, M. L., Tripathi, N., Krumm, B. E., Holzbeck, P., Nussbaumer, C. M., Hernández Pardo, L., Klimach, T., Barmpounis, K., Andersen, S. T., Bardakov, R., Bohn, B., Cecchini, M. A., Chaboureau, J.-P., Dauhut, T., Dienhart, D., Dörich, R., Edtbauer, A., Giez, A., Hartmann, A., Holanda, B. A., Joppe, P., Kaiser, K., Keber, T., Klebach, H., Krüger, O. O., Kürten, A., Mallaun, C., Marno, D., Martinez, M., Monteiro, C., Nelson, C., Ort, L., Raj, S. S., Richter, S., Ringsdorf, A., Rocha, F., Simon, M., Sreekumar, S., Tsokankunku, A., Unfer, G. R., Valenti, I. D., Wang, N., Zahn, A., Zauner-Wieczorek, M., Albrecht, R. I., Andreae, M. O., Artaxo, P., Crowley, J. N., Fischer, H., Harder, H., Herdies, D. L., Machado, L. A. T., Pöhlker, C., Pöschl, U., Possner, A., Pozzer, A., Schneider, J., Williams, J., and Lelieveld, J.: Isoprene nitrates drive new particle formation in Amazon's upper troposphere, Nature, 636, 124–130, https://doi.org/10.1038/s41586-024-08192-4, 2024. a, b, c, d, e, f, g
Dal Maso, M., Kulmala, M., Lehtinen, K. E. J., Mäkelä, J. M., Aalto, P., and O'Dowd, C. D.: Condensation and coagulation sinks and formation of nucleation mode particles in coastal and boreal forest boundary layers, J. Geophys. Res.-Atmos., 107, PAR 2-1–PAR 2-10, https://doi.org/10.1029/2001JD001053, 2002. a
de Deckker, P.: The Indo-Pacific Warm Pool: critical to world oceanography and world climate, Geoscience Letters, 3, 20, https://doi.org/10.1186/s40562-016-0054-3, 2016. a
Draxler, R. R.: An Overview of the HYSPLIT_4 Modelling System for Trajectories, Dispersion, and Deposition, Australian Meteorological Magazine, 295–308, https://www.arl.noaa.gov/documents/reports/MetMag.pdf (last access: 10 December 2025), 1998. a
Draxler, R. R.: HYSPLIT4 user's guide: NOAA Technical Momerandum ERL ARL-230, Air Resources Laboratory Silver Spring, Maryland, https://arl.noaa.gov/wp_arl/wp-content/uploads/documents/reports/arl-230.pdf (last access: 10 December 2025), 1999. a
Draxler, R. R. and Hess, G. D.: Description of the HYSPLIT_4 modeling system: NOAA Technical Memorandum ERL ARL-224, Air Resources Laboratory Silver Spring, Maryland, https://www.arl.noaa.gov/wp_arl/wp-content/uploads/documents/reports/arl-224.pdf (last access: 10 December 2025), 1997. a
Drewnick, F., Hings, S. S., DeCarlo, P., Jayne, J. T., Gonin, M., Fuhrer, K., Weimer, S., Jimenez, J. L., Demerjian, K. L., Borrmann, S., and Worsnop, D. R.: A New Time-of-Flight Aerosol Mass Spectrometer (TOF-AMS)–Instrument Description and First Field Deployment, Aerosol Science and Technology, 39, 637–658, https://doi.org/10.1080/02786820500182040, 2005. a
Dunne, E. M., Gordon, H., Kürten, A., Almeida, J., Duplissy, J., Williamson, C., Ortega, I. K., Pringle, K. J., Adamov, A., Baltensperger, U., Barmet, P., Benduhn, F., Bianchi, F., Breitenlechner, M., Clarke, A., Curtius, J., Dommen, J., Donahue, N. M., Ehrhart, S., Flagan, R. C., Franchin, A., Guida, R., Hakala, J., Hansel, A., Heinritzi, M., Jokinen, T., Kangasluoma, J., Kirkby, J., Kulmala, M., Kupc, A., Lawler, M. J., Lehtipalo, K., Makhmutov, V., Mann, G., Mathot, S., Merikanto, J., Miettinen, P., Nenes, A., Onnela, A., Rap, A., Reddington, C. L. S., Riccobono, F., Richards, N. A. D., Rissanen, M. P., Rondo, L., Sarnela, N., Schobesberger, S., Sengupta, K., Simon, M., Sipilä, M., Smith, J. N., Stozkhov, Y., Tomé, A., Tröstl, J., Wagner, P. E., Wimmer, D., Winkler, P. M., Worsnop, D. R., and Carslaw, K. S.: Global atmospheric particle formation from CERN CLOUD measurements, Science, 354, 1119–1124, https://doi.org/10.1126/science.aaf2649, 2016. a, b, c
Folkins, I. and Martin, R. V.: The Vertical Structure of Tropical Convection and Its Impact on the Budgets of Water Vapor and Ozone, J. Atmos. Sci., 62, 1560–1573, https://doi.org/10.1175/JAS3407.1, 2005. a
Froyd, K. D., Murphy, D. M., Sanford, T. J., Thomson, D. S., Wilson, J. C., Pfister, L., and Lait, L.: Aerosol composition of the tropical upper troposphere, Atmos. Chem. Phys., 9, 4363–4385, https://doi.org/10.5194/acp-9-4363-2009, 2009. a, b
Fung, K. M., Heald, C. L., Kroll, J. H., Wang, S., Jo, D. S., Gettelman, A., Lu, Z., Liu, X., Zaveri, R. A., Apel, E. C., Blake, D. R., Jimenez, J.-L., Campuzano-Jost, P., Veres, P. R., Bates, T. S., Shilling, J. E., and Zawadowicz, M.: Exploring dimethyl sulfide (DMS) oxidation and implications for global aerosol radiative forcing, Atmos. Chem. Phys., 22, 1549–1573, https://doi.org/10.5194/acp-22-1549-2022, 2022. a
Giez, A., Zöger, M., Mallaun, C., Nenakhov, V., Schimpf, M., Grad, C., Numberger, A., and Raynor, K.: Determination of the Measurement Errors for the HALO Basic Data System BAHAMAS by Means of Error Propagation, DLR electronic library, https://doi.org/10.57676/5RDC-Q708, 2022. a
Global Ocean Biogeochemistry Analysis and Forecast: E.U. Copernicus Marine Service Information (CMEMS), Marine Data Store (MDS), https://doi.org/10.48670/moi-00015, 2026. a
Gormley, P. G. and Kennedy, M.: Diffusion from a Stream Flowing through a Cylindrical Tube, P. Roy. Irish Acad. A, 52, 163–169, http://www.jstor.org/stable/20488498 (last access: 23 July 2026), 1948. a
He, X.-C., Abraham, N. L., Ding, H., Russo, M. R., Grosvenor, D. P., Ge, Y., Wang, X., Jones, A. C., Campuzano-Jost, P., Nault, B., Kupc, A., Blake, D., Jimenez, J. L., Williamson, C. J., Weber, J., Archibald, A. T., and Gordon, H.: Evaluation of UKESM aerosol size and composition using ATom measurements indicates missing marine aerosol formation mechanisms, Atmos. Chem. Phys., 26, 3805–3851, https://doi.org/10.5194/acp-26-3805-2026, 2026. a
Hernández Pardo, L., Curtius, J., Jöckel, P., Menken, M., and Possner, A.: Global transport of upper-tropospheric tropical tracers: multi-year insights from idealized simulations, EGUsphere [preprint], https://doi.org/10.5194/egusphere-2025-4338, 2026. a, b
von Hobe, M., Grooß, J.-U., Günther, G., Konopka, P., Gensch, I., Krämer, M., Spelten, N., Afchine, A., Schiller, C., Ulanovsky, A., Sitnikov, N., Shur, G., Yushkov, V., Ravegnani, F., Cairo, F., Roiger, A., Voigt, C., Schlager, H., Weigel, R., Frey, W., Borrmann, S., Müller, R., and Stroh, F.: Evidence for heterogeneous chlorine activation in the tropical UTLS, Atmos. Chem. Phys., 11, 241–256, https://doi.org/10.5194/acp-11-241-2011, 2011. a
Hodshire, A. L., Campuzano-Jost, P., Kodros, J. K., Croft, B., Nault, B. A., Schroder, J. C., Jimenez, J. L., and Pierce, J. R.: The potential role of methanesulfonic acid (MSA) in aerosol formation and growth and the associated radiative forcings, Atmos. Chem. Phys., 19, 3137–3160, https://doi.org/10.5194/acp-19-3137-2019, 2019. a
Höpfner, M., Volkamer, R., Grabowski, U., Grutter, M., Orphal, J., Stiller, G., von Clarmann, T., and Wetzel, G.: First detection of ammonia (NH3) in the Asian summer monsoon upper troposphere, Atmos. Chem. Phys., 16, 14357–14369, https://doi.org/10.5194/acp-16-14357-2016, 2016. a, b
Hoffmann, E. H., Tilgner, A., Schrödner, R., Bräuer, P., Wolke, R., and Herrmann, H.: An advanced modeling study on the impacts and atmospheric implications of multiphase dimethyl sulfide chemistry, P. Natl. Acad. Sci. USA, 113, 11776–11781, https://doi.org/10.1073/pnas.1606320113, 2016. a, b, c, d
Inness, A., Ades, M., Agustí-Panareda, A., Barré, J., Benedictow, A., Blechschmidt, A.-M., Dominguez, J. J., Engelen, R., Eskes, H., Flemming, J., Huijnen, V., Jones, L., Kipling, Z., Massart, S., Parrington, M., Peuch, V.-H., Razinger, M., Remy, S., Schulz, M., and Suttie, M.: The CAMS reanalysis of atmospheric composition, Atmos. Chem. Phys., 19, 3515–3556, https://doi.org/10.5194/acp-19-3515-2019, 2019. a, b, c
Jacob, L. S. D., Giorio, C., and Archibald, A. T.: Extension, development, and evaluation of the representation of the OH-initiated dimethyl sulfide (DMS) oxidation mechanism in the Master Chemical Mechanism (MCM) v3.3.1 framework, Atmos. Chem. Phys., 24, 3329–3347, https://doi.org/10.5194/acp-24-3329-2024, 2024. a, b, c, d, e, f, g, h, i
Jernigan, C. M., Rivard, M. J., Berkelhammer, M. B., and Bertram, T. H.: Sulfate and Carbonyl Sulfide Production in Aqueous Reactions of Hydroperoxymethyl Thioformate, ACS ES&T Air, 1, 397–404, https://doi.org/10.1021/acsestair.3c00098, 2024. a
Joge, S. D., Mansour, K., Simó, R., Galí, M., Steiner, N., Saiz-Lopez, A., and Mahajan, A. S.: Climate warming increases global oceanic dimethyl sulfide emissions, P. Natl. Acad. Sci. USA, 122, e2502077122, https://doi.org/10.1073/pnas.2502077122, 2025. a
Johansson, S., Höpfner, M., Friedl-Vallon, F., Glatthor, N., Gulde, T., Huijnen, V., Kleinert, A., Kretschmer, E., Maucher, G., Neubert, T., Nordmeyer, H., Piesch, C., Preusse, P., Riese, M., Sinnhuber, B.-M., Ungermann, J., Wetzel, G., and Woiwode, W.: Ammonia in the upper troposphere–lower stratosphere (UTLS): GLORIA airborne measurements for CAMS model evaluation in the Asian monsoon and in biomass burning plumes above the South Atlantic, Atmos. Chem. Phys., 24, 8125–8138, https://doi.org/10.5194/acp-24-8125-2024, 2024. a, b
Johnson, J. S. and Jen, C. N.: Role of Methanesulfonic Acid in Sulfuric Acid-Amine and Ammonia New Particle Formation, ACS Earth & Space Chemistry, 7, 653–660, https://doi.org/10.1021/acsearthspacechem.3c00017, 2023. a
Jokinen, T., Sipilä, M., Junninen, H., Ehn, M., Lönn, G., Hakala, J., Petäjä, T., Mauldin III, R. L., Kulmala, M., and Worsnop, D. R.: Atmospheric sulphuric acid and neutral cluster measurements using CI-APi-TOF, Atmos. Chem. Phys., 12, 4117–4125, https://doi.org/10.5194/acp-12-4117-2012, 2012. a
Jokinen, T., Sipilä, M., Kontkanen, J., Vakkari, V., Tisler, P., Duplissy, E. M., Junninen, H., Kangasluoma, J., Manninen, H. E., Petäjä, T., Kulmala, M., Worsnop, D. R., Kirkby, J., Virkkula, A., and Kerminen, V. M.: Ion-induced sulfuric acid–ammonia nucleation drives particle formation in coastal Antarctica, Sci. Adv., 4, eaat9744, https://doi.org/10.1126/sciadv.aat9744, 2018. a
Jongebloed, U. A., Chalif, J. I., Tashmim, L., Porter, W. C., Bates, K. H., Chen, Q., Osterberg, E. C., Koffman, B. G., Cole-Dai, J., Winski, D. A., Ferris, D. G., Kreutz, K. J., Wake, C. P., and Alexander, B.: Dimethyl sulfide chemistry over the industrial era: comparison of key oxidation mechanisms and long-term observations, Atmos. Chem. Phys., 25, 4083–4106, https://doi.org/10.5194/acp-25-4083-2025, 2025. a, b
Kerdraon, G. and Fontaine, E.: Algorithm Theoretical Basis Documentfor the Cloud Product Processors of the NWC/GEO, https://opus.nci.org.au/spaces/NDP/pages/206110970/Himawari-AHI+Cloud+Type+CT?preview=/206110970/206373617/NWC-CDOP3-GEO-MFL-SCI-ATBD-Cloud_v1.0.1.pdf (last access: 9 April 2026), 2021. a
Khan, M. A. H., Gillespie, S. M. P., Razis, B., Xiao, P., Davies-Coleman, M. T., Percival, C. J., Derwent, R. G., Dyke, J. M., Ghosh, M. V., Lee, E. P. F., and Shallcross, D. E.: A modelling study of the atmospheric chemistry of DMS using the global model, STOCHEM-CRI, Atmos. Environ., 127, 69–79, https://doi.org/10.1016/j.atmosenv.2015.12.028, 2016. a
Kilgour, D. B., Jernigan, C. M., Garmash, O., Aggarwal, S., Zhou, S., Mohr, C., Salter, M. E., Thornton, J. A., Wang, J., Zieger, P., and Bertram, T. H.: Cloud processing of dimethyl sulfide (DMS) oxidation products limits sulfur dioxide (SO2) and carbonyl sulfide (OCS) production in the eastern North Atlantic marine boundary layer, Atmos. Chem. Phys., 25, 1931–1947, https://doi.org/10.5194/acp-25-1931-2025, 2025. a
Klebach, H., Heinritzi, M., Kaiser, K., Beck, L., Ruhl, S., Atabakhsh, S., Bhattacharyya, N., Caudillo-Plath, L., Joppe, P., Klimach, T., Lloyd, P., Pöhlker, M., Pöschl, U., Richter, S., Russell, D. M., Schneider, J., Zauner-Wieczorek, M., and Curtius, J.: Aircraft observations suggest an important contribution of methanesulfonic and sulfuric acids to tropical Indo-Pacific aerosol: Data, Zenodo [data set], https://doi.org/10.5281/zenodo.19555789, 2026. a
Koenig, T. K., Volkamer, R., Baidar, S., Dix, B., Wang, S., Anderson, D. C., Salawitch, R. J., Wales, P. A., Cuevas, C. A., Fernandez, R. P., Saiz-Lopez, A., Evans, M. J., Sherwen, T., Jacob, D. J., Schmidt, J., Kinnison, D., Lamarque, J.-F., Apel, E. C., Bresch, J. C., Campos, T., Flocke, F. M., Hall, S. R., Honomichl, S. B., Hornbrook, R., Jensen, J. B., Lueb, R., Montzka, D. D., Pan, L. L., Reeves, J. M., Schauffler, S. M., Ullmann, K., Weinheimer, A. J., Atlas, E. L., Donets, V., Navarro, M. A., Riemer, D., Blake, N. J., Chen, D., Huey, L. G., Tanner, D. J., Hanisco, T. F., and Wolfe, G. M.: BrO and inferred Bry profiles over the western Pacific: relevance of inorganic bromine sources and a Bry minimum in the aged tropical tropopause layer, Atmos. Chem. Phys., 17, 15245–15270, https://doi.org/10.5194/acp-17-15245-2017, 2017. a
Koga, S. and Tanaka, H.: Modeling the methanesulfonate to non-sea-salt sulfate molar ratio and dimethylsulfide oxidation in the atmosphere, J. Geophys. Res.-Atmos., 104, 13735–13747, https://doi.org/10.1029/1999JD900069, 1999. a
Krautstrunk, M. and Giez, A.: The Transition From FALCON to HALO Era Airborne Atmospheric Research, in: Atmospheric Physics: Background – Methods – Trends, edited by: Schumann, U., Springer Berlin Heidelberg, Berlin, Heidelberg, 609–624, ISBN 978-3-642-30183-4, https://doi.org/10.1007/978-3-642-30183-4_37, 2012. a
Kremser, S., Thomason, L. W., von Hobe, M., Hermann, M., Deshler, T., Timmreck, C., Toohey, M., Stenke, A., Schwarz, J. P., Weigel, R., Fueglistaler, S., Prata, F. J., Vernier, J.-P., Schlager, H., Barnes, J. E., Antuña-Marrero, J.-C., Fairlie, D., Palm, M., Mahieu, E., Notholt, J., Rex, M., Bingen, C., Vanhellemont, F., Bourassa, A., Plane, J. M. C., Klocke, D., Carn, S. A., Clarisse, L., Trickl, T., Neely, R., James, A. D., Rieger, L., Wilson, J. C., and Meland, B.: Stratospheric aerosol-Observations, processes, and impact on climate, Rev. Geophys., 54, 278–335, https://doi.org/10.1002/2015RG000511, 2016. a
Kürten, A., Rondo, L., Ehrhart, S., and Curtius, J.: Performance of a corona ion source for measurement of sulfuric acid by chemical ionization mass spectrometry, Atmos. Meas. Tech., 4, 437–443, https://doi.org/10.5194/amt-4-437-2011, 2011. a
Kürten, A., Rondo, L., Ehrhart, S., and Curtius, J.: Calibration of a chemical ionization mass spectrometer for the measurement of gaseous sulfuric acid, J. Phys. Chem. A, 116, 6375–6386, https://doi.org/10.1021/jp212123n, 2012. a
Librando, V., Tringali, G., Hjorth, J., and Coluccia, S.: OH-initiated oxidation of DMS/DMSO: reaction products at high NOx levels, Environ. Pollut., 127, 403–410, https://doi.org/10.1016/j.envpol.2003.08.003, 2004. a
Liu, C. and Zipser, E. J.: The global distribution of largest, deepest, and most intense precipitation systems, Geophys. Res. Lett., 42, 3591–3595, https://doi.org/10.1002/2015GL063776, 2015. a
Loh, A., Kim, D., An, J. G., Choi, N., and Yim, U. H.: Chemical characterization of sub-micron aerosols over the East Sea (Sea of Japan), Sci. Total Environ., 856, 159173, https://doi.org/10.1016/j.scitotenv.2022.159173, 2023. a
Ma, J., Chen, B., He, Q., Yan, X., Wang, G., Cheng, S., Steil, B., Brühl, C., Tost, H., Höpfner, M., Pozzer, A., and Lelieveld, J.: Modelling the deep convective transport of trace gases (CO, NH3 and SO2) from the planetary boundary layer to the Asian summer monsoon anticyclone, Atmos. Chem. Phys., 26, 8125–8144, https://doi.org/10.5194/acp-26-8125-2026, 2026. a
MacQueen, J.: Some methods for classification and analysis of multivariate observations, Proc. Fifth Berkeley Sympos. Math. Statist. and Probability (Berkeley, Calif., 1965/66), 281–297, 0214.46201, https://zbmath.org/?format=complete&q=an:0214.46201 (last access: 25 March 2026), 1967. a
Mauldin, R. L., Cantrell, C., Zondlo, M. A., Kosciuch, E., Eisele, F. L., Chen, G., Davis, D. D., Weber, R., Crawford, J. H., Blake, D. R., Bandy, A. R., and Thornton, D. C.: Highlights of OH, H2SO4, and methane sulfonic acid measurements made aboard the NASA P–3B during Transport and Chemical Evolution over the Pacific, J. Geophys. Res., 108, 8796, https://doi.org/10.1029/2003JD003410, 2003. a
Middlebrook, A. M., Bahreini, R., Jimenez, J. L., and Canagaratna, M. R.: Evaluation of Composition-Dependent Collection Efficiencies for the Aerodyne Aerosol Mass Spectrometer using Field Data, Aerosol Sci. Technol., 46, 258–271, https://doi.org/10.1080/02786826.2011.620041, 2012. a
Miljevic, B., Mallet, M. D., Osuagwu, C. G., Ristovski, Z. D., Humphries, R. S., Selleck, P., Taylor, S., and Keywood, M. D.: Aerosol acidity controls methanesulfonic acid evaporation from aerosols during Antarctic katabatic outflow, Commun. Earth Environ., 6, 1057, https://doi.org/10.1038/s43247-025-03041-2, 2025. a
Müller, K., von der Gathen, P., and Rex, M.: Air mass transport to the tropical western Pacific troposphere inferred from ozone and relative humidity balloon observations above Palau, Atmos. Chem. Phys., 24, 4693–4716, https://doi.org/10.5194/acp-24-4693-2024, 2024. a
Murphy, B. N., Julin, J., Riipinen, I., and Ekman, A. M. L.: Organic aerosol processing in tropical deep convective clouds: Development of a new model (CRM–ORG) and implications for sources of particle number, J. Geophys. Res.-Atmos., 120, https://doi.org/10.1002/2015JD023551, 2015. a, b
Nair, A. A. and Yu, F.: Quantification of Atmospheric Ammonia Concentrations: A Review of Its Measurement and Modeling, Atmosphere, 11, https://doi.org/10.3390/atmos11101092, 2020. a
NOAA Global Forecast System: National Oceanic and Atmospheric Administration Global Forecast System (GFS), meteorological data, https://registry.opendata.aws/noaa-gfs-bdp-pds (last access: 9 April 2026), 2026. a
Novak, G. A., Fite, C. H., Holmes, C. D., Veres, P. R., Neuman, J. A., Faloona, I., Thornton, J. A., Wolfe, G. M., Vermeuel, M. P., Jernigan, C. M., Peischl, J., Ryerson, T. B., Thompson, C. R., Bourgeois, I., Warneke, C., Gkatzelis, G. I., Coggon, M. M., Sekimoto, K., Bui, T. P., Dean-Day, J., Diskin, G. S., DiGangi, J. P., Nowak, J. B., Moore, R. H., Wiggins, E. B., Winstead, E. L., Robinson, C., Thornhill, K. L., Sanchez, K. J., Hall, S. R., Ullmann, K., Dollner, M., Weinzierl, B., Blake, D. R., and Bertram, T. H.: Rapid cloud removal of dimethyl sulfide oxidation products limits SO2 and cloud condensation nuclei production in the marine atmosphere, P. Natl. Acad. Sci. USA, 118, e2110472118, https://doi.org/10.1073/pnas.2110472118, 2021. a, b, c
Nussbaumer, C. M., Pozzer, A., Hewson, M., Ort, L., Krumm, B., Byron, J., Williams, J., Joppe, P., Obersteiner, F., Zahn, A., Lelieveld, J., and Fischer, H.: Low Tropospheric Ozone Over the Indo-Pacific Warm Pool Related to Non-Electrified Convection, Geophys. Res. Lett., 52, e2024GL112788, https://doi.org/10.1029/2024GL112788, 2025. a, b, c
Perraud, V., Smith, J. N., and Olfert, J.: High-accuracy effective density measurements of sodium methanesulfonate and aminium chloride nanoparticles using a particulate calibration standard, Aerosol Sci. Technol., 57, 355–366, https://doi.org/10.1080/02786826.2023.2176739, 2023. a, b
Quéléver, L. L. J., Dada, L., Asmi, E., Lampilahti, J., Chan, T., Ferrara, J. E., Copes, G. E., Pérez-Fogwill, G., Barreira, L., Aurela, M., Worsnop, D. R., Jokinen, T., and Sipilä, M.: Investigation of new particle formation mechanisms and aerosol processes at Marambio Station, Antarctic Peninsula, Atmos. Chem. Phys., 22, 8417–8437, https://doi.org/10.5194/acp-22-8417-2022, 2022. a
Ranjithkumar, A., Gordon, H., Williamson, C., Rollins, A., Pringle, K., Kupc, A., Abraham, N. L., Brock, C., and Carslaw, K.: Constraints on global aerosol number concentration, SO2 and condensation sink in UKESM1 using ATom measurements, Atmos. Chem. Phys., 21, 4979–5014, https://doi.org/10.5194/acp-21-4979-2021, 2021. a
Riese, M., Hoor, P., Rolf, C., Kunkel, D., Vogel, B., Köllner, F., Pöhlker, M., Ploeger, F., Ungermann, J., Woiwode, W., Johansson, S., Bauer, R., Barmpounis, K., Borrmann, S., Brauner, P., Clemens, J., Dragoneas, A., Ekinci, F., Emig, N., Engel, A., Eppers, O., Fadnavis, S., Friedl-Vallon, F., Geldenhuys, M., Günther, G., Grooß, J. U., Hegglin, M. I., Höpfner, M., Jesswein, M., Joppe, P., Kaumanns, J., Kachula, O., Keber, T., Kretschmer, E., Lachnitt, H. C., Lauther, V., Lloyd, P. E., Molleker, S., Müller, R., Neubert, T., Ort, L., Pöschl, U., Pöhlker, C., Rapp, M., Retzlaff, M., Rhode, S., Schneider, J., Schuck, T., Sinnhuber, B. M., Spelten, N., Strobel, J., Tomsche, L., Turhal, K., van Luijt, R., Versick, S., Voigt, C., Volk, M., Hobe, M. v., Weyland, F., Zahn, A., Ziereis, H., and Zlotos, L. O.: Long-range transport of polluted Asian summer monsoon air to high latitudes during the PHILEAS campaign in the boreal summer 2023, B. Am. Meteor. Soc., BAMS-D-24-0232.1, https://doi.org/10.1175/BAMS-D-24-0232.1, 2025. a
Salignat, R., Rissanen, M., Iyer, S., Baray, J.-L., Tulet, P., Metzger, J.-M., Brioude, J., Sellegri, K., and Rose, C.: Measurement report: Insights into the chemical composition and origin of molecular clusters and potential precursor molecules present in the free troposphere over the southern Indian Ocean: observations from the Maïdo Observatory (2150 m a.s.l., Réunion), Atmos. Chem. Phys., 24, 3785–3812, https://doi.org/10.5194/acp-24-3785-2024, 2024. a
Sander, R., Baumgaertner, A., Cabrera-Perez, D., Frank, F., Gromov, S., Grooß, J.-U., Harder, H., Huijnen, V., Jöckel, P., Karydis, V. A., Niemeyer, K. E., Pozzer, A., Riede, H., Schultz, M. G., Taraborrelli, D., and Tauer, S.: The community atmospheric chemistry box model CAABA/MECCA-4.0, Geosci. Model Dev., 12, 1365–1385, https://doi.org/10.5194/gmd-12-1365-2019, 2019. a
Schulz, C., Schneider, J., Amorim Holanda, B., Appel, O., Costa, A., de Sá, S. S., Dreiling, V., Fütterer, D., Jurkat-Witschas, T., Klimach, T., Knote, C., Krämer, M., Martin, S. T., Mertes, S., Pöhlker, M. L., Sauer, D., Voigt, C., Walser, A., Weinzierl, B., Ziereis, H., Zöger, M., Andreae, M. O., Artaxo, P., Machado, L. A. T., Pöschl, U., Wendisch, M., and Borrmann, S.: Aircraft-based observations of isoprene-epoxydiol-derived secondary organic aerosol (IEPOX-SOA) in the tropical upper troposphere over the Amazon region, Atmos. Chem. Phys., 18, 14979–15001, https://doi.org/10.5194/acp-18-14979-2018, 2018. a
Shen, J., Scholz, W., He, X.-C., Zhou, P., Marie, G., Wang, M., Marten, R., Surdu, M., Rörup, B., Baalbaki, R., Amorim, A., Ataei, F., Bell, D. M., Bertozzi, B., Brasseur, Z., Caudillo, L., Chen, D., Chu, B., Dada, L., Duplissy, J., Finkenzeller, H., Granzin, M., Guida, R., Heinritzi, M., Hofbauer, V., Iyer, S., Kemppainen, D., Kong, W., Krechmer, J. E., Kürten, A., Lamkaddam, H., Lee, C. P., Lopez, B., Mahfouz, N. G. A., Manninen, H. E., Massabò, D., Mauldin, R. L., Mentler, B., Müller, T., Pfeifer, J., Philippov, M., Piedehierro, A. A., Roldin, P., Schobesberger, S., Simon, M., Stolzenburg, D., Tham, Y. J., Tomé, A., Umo, N. S., Wang, D., Wang, Y., Weber, S. K., Welti, A., Wollesen de Jonge, R., Wu, Y., Zauner-Wieczorek, M., Zust, F., Baltensperger, U., Curtius, J., Flagan, R. C., Hansel, A., Möhler, O., Petäjä, T., Volkamer, R., Kulmala, M., Lehtipalo, K., Rissanen, M., Kirkby, J., El-Haddad, I., Bianchi, F., Sipilä, M., Donahue, N. M., and Worsnop, D. R.: High Gas-Phase Methanesulfonic Acid Production in the OH-Initiated Oxidation of Dimethyl Sulfide at Low Temperatures, Environ. Sci. Technol., 56, 13931–13944, https://doi.org/10.1021/acs.est.2c05154, 2022. a, b, c, d, e, f, g, h, i, j, k, l, m, n
Shen, J., Russell, D. M., DeVivo, J., Kunkler, F., Baalbaki, R., Mentler, B., Scholz, W., Yu, W., Caudillo-Plath, L., Sommer, E., Ahongshangbam, E., Alfaouri, D., Almeida, J., Amorim, A., Beck, L. J., Beckmann, H., Berntheusel, M., Bhattacharyya, N., Canagaratna, M. R., Chassaing, A., Cruz-Simbron, R., Dada, L., Duplissy, J., Gordon, H., Granzin, M., Große Schute, L., Heinritzi, M., Iyer, S., Klebach, H., Krüger, T., Kürten, A., Lampimäki, M., Liu, L., Lopez, B., Martinez, M., Morawiec, A., Onnela, A., Peltola, M., Rato, P., Reza, M., Richter, S., Rörup, B., Sebastian, M. K., Simon, M., Surdu, M., Tamme, K., Thakur, R. C., Tomé, A., Tong, Y., Top, J., Umo, N. S., Unfer, G., Vettikkat, L., Weissbacher, J., Xenofontos, C., Yang, B., Zauner-Wieczorek, M., Zhang, J., Zheng, Z., Baltensperger, U., Christoudias, T., Flagan, R. C., El Haddad, I., Junninen, H., Möhler, O., Riipinen, I., Rohner, U., Schobesberger, S., Volkamer, R., Winkler, P. M., Hansel, A., Lehtipalo, K., Donahue, N. M., Lelieveld, J., Harder, H., Kulmala, M., Worsnop, D. R., Kirkby, J., Curtius, J., and He, X.-C.: New particle formation from isoprene under upper-tropospheric conditions, Nature, 636, 115–123, https://doi.org/10.1038/s41586-024-08196-0, 2024. a
Simon, M., Dada, L., Heinritzi, M., Scholz, W., Stolzenburg, D., Fischer, L., Wagner, A. C., Kürten, A., Rörup, B., He, X.-C., Almeida, J., Baalbaki, R., Baccarini, A., Bauer, P. S., Beck, L., Bergen, A., Bianchi, F., Bräkling, S., Brilke, S., Caudillo, L., Chen, D., Chu, B., Dias, A., Draper, D. C., Duplissy, J., El-Haddad, I., Finkenzeller, H., Frege, C., Gonzalez-Carracedo, L., Gordon, H., Granzin, M., Hakala, J., Hofbauer, V., Hoyle, C. R., Kim, C., Kong, W., Lamkaddam, H., Lee, C. P., Lehtipalo, K., Leiminger, M., Mai, H., Manninen, H. E., Marie, G., Marten, R., Mentler, B., Molteni, U., Nichman, L., Nie, W., Ojdanic, A., Onnela, A., Partoll, E., Petäjä, T., Pfeifer, J., Philippov, M., Quéléver, L. L. J., Ranjithkumar, A., Rissanen, M. P., Schallhart, S., Schobesberger, S., Schuchmann, S., Shen, J., Sipilä, M., Steiner, G., Stozhkov, Y., Tauber, C., Tham, Y. J., Tomé, A. R., Vazquez-Pufleau, M., Vogel, A. L., Wagner, R., Wang, M., Wang, D. S., Wang, Y., Weber, S. K., Wu, Y., Xiao, M., Yan, C., Ye, P., Ye, Q., Zauner-Wieczorek, M., Zhou, X., Baltensperger, U., Dommen, J., Flagan, R. C., Hansel, A., Kulmala, M., Volkamer, R., Winkler, P. M., Worsnop, D. R., Donahue, N. M., Kirkby, J., and Curtius, J.: Molecular understanding of new-particle formation from α-pinene between −50 and +25 °C, Atmos. Chem. Phys., 20, 9183–9207, https://doi.org/10.5194/acp-20-9183-2020, 2020. a
Stein, A. F., Draxler, R. R., Rolph, G. D., Stunder, B. J. B., Cohen, M. D., and Ngan, F.: NOAA's HYSPLIT Atmospheric Transport and Dispersion Modeling System, B. Am. Meteor. Soc., 96, 2059–2077, https://doi.org/10.1175/BAMS-D-14-00110.1, 2015. a
Stolzenburg, D., Simon, M., Ranjithkumar, A., Kürten, A., Lehtipalo, K., Gordon, H., Ehrhart, S., Finkenzeller, H., Pichelstorfer, L., Nieminen, T., He, X.-C., Brilke, S., Xiao, M., Amorim, A., Baalbaki, R., Baccarini, A., Beck, L., Bräkling, S., Caudillo Murillo, L., Chen, D., Chu, B., Dada, L., Dias, A., Dommen, J., Duplissy, J., El Haddad, I., Fischer, L., Gonzalez Carracedo, L., Heinritzi, M., Kim, C., Koenig, T. K., Kong, W., Lamkaddam, H., Lee, C. P., Leiminger, M., Li, Z., Makhmutov, V., Manninen, H. E., Marie, G., Marten, R., Müller, T., Nie, W., Partoll, E., Petäjä, T., Pfeifer, J., Philippov, M., Rissanen, M. P., Rörup, B., Schobesberger, S., Schuchmann, S., Shen, J., Sipilä, M., Steiner, G., Stozhkov, Y., Tauber, C., Tham, Y. J., Tomé, A., Vazquez-Pufleau, M., Wagner, A. C., Wang, M., Wang, Y., Weber, S. K., Wimmer, D., Wlasits, P. J., Wu, Y., Ye, Q., Zauner-Wieczorek, M., Baltensperger, U., Carslaw, K. S., Curtius, J., Donahue, N. M., Flagan, R. C., Hansel, A., Kulmala, M., Lelieveld, J., Volkamer, R., Kirkby, J., and Winkler, P. M.: Enhanced growth rate of atmospheric particles from sulfuric acid, Atmos. Chem. Phys., 20, 7359–7372, https://doi.org/10.5194/acp-20-7359-2020, 2020. a
Tashmim, L., Porter, W. C., Chen, Q., Alexander, B., Fite, C. H., Holmes, C. D., Pierce, J. R., Croft, B., and Ishino, S.: Contribution of expanded marine sulfur chemistry to the seasonal variability of dimethyl sulfide oxidation products and size-resolved sulfate aerosol, Atmos. Chem. Phys., 24, 3379–3403, https://doi.org/10.5194/acp-24-3379-2024, 2024. a, b, c, d, e
Thornton, D. C., Bandy, A. R., Blomquist, B. W., Bradshaw, J. D., and Blake, D. R.: Vertical transport of sulfur dioxide and dimethyl sulfide in deep convection and its role in new particle formation, J. Geophys. Res.-Atmos., 102, 28501–28509, https://doi.org/10.1029/97JD01647, 1997. a
Tuovinen, S., Kontkanen, J., Cai, R., and Kulmala, M.: Condensation sink of atmospheric vapors: the effect of vapor properties and the resulting uncertainties, Environ. Sci.: Atmos., 1, 543–557, https://doi.org/10.1039/D1EA00032B, 2021. a
Wang, Y., Liu, S. C., Anderson, B. E., Kondo, Y., Gregory, G. L., Sachse, G. W., Vay, S. A., Blake, D. R., Singh, H. B., and Thompson, A. M.: Evidence of convection as a major source of condensation nuclei in the northern midlatitude upper troposphere, Geophys. Res. Lett., 27, 369–372, https://doi.org/10.1029/1999GL010930, 2000. a
Wilcox, E. M., Yuan, T., and Song, H.: Deep convective cloud system size and structure across the global tropics and subtropics, Atmos. Meas. Tech., 16, 5387–5401, https://doi.org/10.5194/amt-16-5387-2023, 2023. a, b
Williamson, C. J., Kupc, A., Axisa, D., Bilsback, K. R., Bui, T., Campuzano-Jost, P., Dollner, M., Froyd, K. D., Hodshire, A. L., Jimenez, J. L., Kodros, J. K., Luo, G., Murphy, D. M., Nault, B. A., Ray, E. A., Weinzierl, B., Wilson, J. C., Yu, F., Yu, P., Pierce, J. R., and Brock, C. A.: A large source of cloud condensation nuclei from new particle formation in the tropics, Nature, 574, 399–403, https://doi.org/10.1038/s41586-019-1638-9, 2019. a, b, c
Xenofontos, C., Kohl, M., Ruhl, S., Almeida, J., Caudillo-Plath, L., Cruz-Simbron, R., Dada, L., Duplissy, J., Ehrhart, S., Finkenzeller, H., Höhler, K., Kong, W., Kunkler, F., Lietzke, C. J., Mentler, B., Morawiec, A., Onnela, A., Rato, P., Rörup, B., Russell, D. M., Schervish, M., Scholz, W., Sebastian, M. K., Simon, M., Sommer, E., Tong, Y., Umo, N. S., Unfer, G. R., Vettikkat, L., Yang, B., Yu, W., Zgheib, I., Zheng, Z., Curtius, J., Donahue, N. M., Flagan, R. C., Gordon, H., Haddad, I. E., Hansel, A., Harder, H., He, X.-C., Kirkby, J., Kulmala, M., Lehtipalo, K., Möhler, O., Petäjä, T., Pöhlker, M. L., Schobesberger, S., Stolzenburg, D., Wang, M., Winkler, P. M., Worsnop, D. R., Höpfner, M., Volkamer, R., Pozzer, A., Lelieveld, J., and Christoudias, T.: Global impact of anthropogenic NH3 emissions on upper tropospheric aerosol formation, P. Natl. Acad. Sci. USA, 122, e2506658122, https://doi.org/10.1073/pnas.2506658122, 2025. a
Xu, L., Cameron-Smith, P., Russell, L. M., Ghan, S. J., Liu, Y., Elliott, S., Yang, Y., Lou, S., Lamjiri, M. A., and Manizza, M.: DMS role in ENSO cycle in the tropics, J. Geophys. Res.-Atmos., 121, 13537–13558, https://doi.org/10.1002/2016JD025333, 2016. a
Ye, Q., Goss, M. B., Krechmer, J. E., Majluf, F., Zaytsev, A., Li, Y., Roscioli, J. R., Canagaratna, M., Keutsch, F. N., Heald, C. L., and Kroll, J. H.: Product distribution, kinetics, and aerosol formation from the OH oxidation of dimethyl sulfide under different RO2 regimes, Atmos. Chem. Phys., 22, 16003–16015, https://doi.org/10.5194/acp-22-16003-2022, 2022. a
Yu, W., Baalbaki, R., Shen, J., DeVivo, J., Caudillo-Plath, L., Sommer, E., Heitto, A., Klebach, H., Russell, D. M., Amorim, A., Beckmann, H., Bhattacharyya, N., Blankenship, V., Chassaing, A., Cruz-Simbron, R., Dada, L., Jacobshagen, A., Judmaier, B., Kaniyodical Sebastian, M., Konrat, R., Krüger, T., Kunkler, F., Lietzke, C. J., Liu, L., Mauldin, R., Mentler, B., Morawiec, A., Rato, P., Rörup, B., Ruhl, S., Scholz, W., Simon, M., Stinchfield, A., Tomé, A., Tong, Y., Top, J., Umo, N. S., Unfer, G. R., Vettikkat, L., Weissbacher, J., Xenofontos, C., Yang, B., Zauner-Wieczorek, M., Zhang, J., Zheng, Z., Christoudias, T., Curtius, J., El Haddad, I., Flagan, R., Hansel, A., Harder, H., Kürten, A., Möhler, O., Petäjä, T., Volkamer, R., Winkler, P. M., Worsnop, D. R., Kulmala, M., Donahue, N. M., Kirkby, J., Yli-Juuti, T., Riipinen, I., He, X.-C., and Lehtipalo, K.: Impact of humidity on aerosol growth from methanesulfonic acid, Environmental Science: Atmospheres, https://doi.org/10.1039/d5ea00123d, 2026. a
Zahn, A., Weppner, J., Widmann, H., Schlote-Holubek, K., Burger, B., Kühner, T., and Franke, H.: A fast and precise chemiluminescence ozone detector for eddy flux and airborne application, Atmos. Meas. Tech., 5, 363–375, https://doi.org/10.5194/amt-5-363-2012, 2012. a
Zauner-Wieczorek, M., Heinritzi, M., Granzin, M., Keber, T., Kürten, A., Kaiser, K., Schneider, J., and Curtius, J.: Mass spectrometric measurements of ambient ions and estimation of gaseous sulfuric acid in the free troposphere and lowermost stratosphere during the CAFE-EU/BLUESKY campaign, Atmos. Chem. Phys., 22, 11781–11794, https://doi.org/10.5194/acp-22-11781-2022, 2022. a
Zhang, Q., Jimenez, J. L., Worsnop, D. R., and Canagaratna, M.: A Case Study of Urban Particle Acidity and Its Influence on Secondary Organic Aerosol, Environ. Sci. Technol., 41, 3213–3219, https://doi.org/10.1021/es061812j, 2007. a
Zhang, Y., Wang, Y., Gray, B. A., Gu, D., Mauldin, L., Cantrell, C., and Bandy, A.: Surface and free tropospheric sources of methanesulfonic acid over the tropical Pacific Ocean, Geophys. Res. Lett., 41, 5239–5245, https://doi.org/10.1002/2014GL060934, 2014. a