
the Creative Commons Attribution 4.0 License.
the Creative Commons Attribution 4.0 License.
 | 01 Sep 2026
Simulation of contrasting impacts of dust ice-nucleating particles on the evolution and radiative effects of mixed-phase and ice clouds
Hua Zhang
Shuxiao Wang
Xi Zhao
Zhijun Wu
Siyu Chen
Dantong Liu
Jingchuan Chen
Hui Jiang
Jiewen Shen
Da Gao
Dejia Yin
Yicong He
Shengyue Li
Zhaoxin Dong
Manish Shrivastava
Jonathan H. Jiang
Muyan Peng

The effect of aerosols acting as ice-nucleating particles (INPs) remains one of the least understood processes in aerosol–cloud–climate interactions. Mineral dust can serve as INPs in both mixed-phase and ice clouds, yet few studies have simultaneously considered dust INPs in both cloud types, limiting our understanding of their impacts on clouds and radiation. Here, we develop an improved INP parameterization in WRF-Chem that explicitly represents dust INPs in both cloud types, incorporating both non-size-resolved and size-resolved INP parameterizations. Model evaluation against ground-based and satellite observations shows good agreement with the observed spatiotemporal variations of surface PM10, dust INPs, liquid water path (LWP), and ice water path (IWP) over East Asia. Simulations for spring 2018 reveal that dust INPs in mixed-phase clouds accelerate the Wegener–Bergeron–Findeisen (WBF) process, increasing IWP by 3.2 % and decreasing LWP by 2.9 %, thereby reducing cloud albedo and producing a warming of 0.20 W m−2. In ice clouds, dust INPs enhance heterogeneous nucleation, increase ice crystal number concentrations, and reduce their effective radius. Sedimenting ice crystals from ice clouds further intensify the WBF process in mixed-phase clouds, ultimately yielding a stronger warming of 3.56 W m−2. Differences among INP parameterizations are comparable to those between simulations with and without INPs, whereas the size-resolved scheme may more reasonably represent the spatial variability of dust INP effects. This study highlights the distinct roles of dust INPs in mixed-phase and ice clouds from the microphysical perspective and advances our understanding of aerosol–cloud–climate interactions.
- Article
(15180 KB) - Full-text XML
-
Supplement
(8931 KB) - BibTeX
- EndNote


Ice-nucleating particles (INPs) play a crucial role in initiating ice crystal formation in the atmosphere, yet this process remains one of the least understood aspects of aerosol–cloud–climate interactions (Cantrell and Heymsfield, 2005; Gultepe and Heymsfield, 2016; Seinfeld et al., 2016). Ice crystals can form through homogeneous nucleation, which occurs when supercooled droplets or solutions freeze spontaneously below −37 °C (Koop et al., 2000). They can also form through heterogeneous nucleation, in which INPs enable ice formation at higher temperature and lower supersaturation (DeMott et al., 2010; Kiselev et al., 2017; Bi et al., 2017; Knopf et al., 2018; Holden et al., 2019; Zhao et al., 2019). Understanding the sources, properties, and representation of INPs is therefore fundamental to improving cloud and climate simulations.
INP-induced ice formation can occur in both mixed-phase clouds, which contain supercooled liquid droplets and ice crystals, and ice clouds (cirrus) that consist entirely of ice crystals (Vali, 1985; DeMott et al., 2015; Kanji et al., 2017). A variety of aerosol types can act as INPs in the atmosphere, and their relative importance depends strongly on thermodynamic conditions and aerosol sources. Mineral dust is widely recognized as one of the most important INP types because of its strong ice-nucleating ability and large global emissions from arid regions (Burrows et al., 2022; Textor et al., 2006; Murray et al., 2012; Chen et al., 2021). Other aerosol types may also contribute to heterogeneous ice formation under certain conditions. For example, biological particles such as bacteria, fungal spores, and pollen fragments can dominate ice nucleation at relatively warm temperatures above about −15 °C (Cornwell et al., 2023). Biomass-burning smoke may also act as INPs under cirrus conditions, although their ice-nucleating efficiency depends strongly on particle composition and atmospheric processing (Phillips et al., 2013; Vergara‐Temprado et al., 2018; Nichman et al., 2019). Among these aerosol types, mineral dust has received particular attention because of its high ice-nucleating efficiency, large emission fluxes, long-range transport capability, and relatively well-characterized ice-nucleating properties (Murray et al., 2012; Kanji et al., 2017; Burrows et al., 2022). Dust can be activated as INPs in both mixed-phase clouds and ice clouds, influencing cloud microphysics across a wide temperature range (Vali, 1985). In East Asia, frequent springtime dust outbreaks originating from the Taklimakan and Gobi deserts provide a strong and regionally dominant source of INPs (Chen et al., 2014; Shi and Liu, 2019), offering an ideal natural laboratory for investigating dust–cloud interactions.
Observational studies have provided important constraints on the relationship between INPs and cloud microphysics. For example, collocated A-Train satellite observations reveal that enhanced ice particle production in mid-level stratiform mixed-phase clouds is associated with elevated dust loading, indicating that dust-induced ice formation can substantially modify cloud phase and ice crystal number concentrations (Zhang et al., 2018). Aerosol–cloud closure studies further demonstrate that lidar-derived INP concentrations in Saharan dust layers can explain observed ice crystal number concentrations within an order of magnitude, highlighting the importance of heterogeneous nucleation on mineral dust in altocumulus and cirrus (Ansmann et al., 2019). Recent coordinated lidar-radar observations and process simulations during the MOSAiC expedition further suggest that aged Siberian wildfire smoke substantially influenced Arctic cirrus formation and may have suppressed homogeneous freezing under smoke-polluted upper-tropospheric conditions (Ansmann et al., 2025a, b). More recently, long-term observations from two sites with contrasting aerosol conditions, characterized by desert dust and continental aerosols versus marine aerosol, also indicate that variations in INP concentrations can significantly influence mixed-phase cloud microphysics and precipitation formation (He et al., 2025). At larger spatial scales, satellite analyses further suggest that dust-driven droplet freezing plays a key role in determining cloud-top phase across the Northern Hemisphere (Villanueva et al., 2025).
Process-level insight into these interactions has also been obtained from high-resolution spectral-bin simulations. For example, Lee et al. (2024) demonstrated that higher INP concentrations lead to smaller ice particles and more irregular crystal shapes, highlighting the influence of INP levels on ice particle morphology, number, and cloud microphysics. However, these studies typically focus on idealized cloud systems and therefore do not directly quantify the large-scale impacts of INPs on cloud evolution and radiation.
Numerical modeling at regional and global scales is therefore essential for assessing the climatic effects of dust INPs, but most studies rely on limited parameterization schemes that capture only part of the dust INP spectrum, either for mixed-phase or ice clouds, rarely both. For mixed-phase clouds, most modeling studies have used empirical parameterization schemes to describe dust INP activation. These studies generally found that dust INPs accelerate the Wegener–Bergeron–Findeisen (WBF) process, which speeds up the conversion of liquid water to ice (Shi and Liu, 2019; Kawai et al., 2021; Shi et al., 2022; Luo et al., 2023; Liu et al., 2011). The result is usually a reduction in the liquid water path (LWP), a decrease in shortwave reflectivity, and an increase in longwave transmittance. However, the radiative response differs strongly across regions and seasons, as shown in Shi and Liu (2019) and Shi et al. (2022). These differences reflect a major limitation. Dust INPs in mixed-phase clouds have rarely been validated with observations, and parameterization schemes differ greatly in their treatment of dust size distributions and activation spectra. As a result, current understanding is highly uncertain, and systematic evaluation using multiple schemes is still needed.
For ice clouds, most studies have represented dust INPs with deposition nucleation or immersion freezing schemes that were designed for cirrus conditions. Using these approaches, Liu et al. (2012), Kuebbeler et al. (2014), and Beer et al. (2024) reported that dust INPs reduce the number of ice crystals and produce larger crystals compared to homogeneous freezing. This is often called the negative Twomey effect. It usually results in thinner cirrus clouds and a cooling effect. However, event-based simulations have reported different microphysical responses. For example, Weger et al. (2018) and Zeng et al. (2023) found that high dust concentrations during the April 2014 European dust outbreak and the May 2017 East Asian event enhanced deposition nucleation and reduced ice crystal size. Su and Fung (2018b) showed that dust increased ice water but slightly reduced liquid water over East Asia. These results are valuable, but they depend strongly on the INP parameterization used. Because most schemes are based solely on cirrus cloud conditions and neglect mixed-phase cloud conditions, they do not fully capture the impact of dust INPs on clouds and radiation.
In summary, existing modeling studies have usually examined either mixed-phase or ice clouds, but very few have treated both together. This separation is mainly because parameterization schemes were developed for only one type of cloud. As a result, the overall effects of dust INPs on clouds and radiation remain poorly understood. In this study, we developed a comprehensive dust INP parameterization that consistently represents both mixed-phase and ice-phase activation. The scheme also considers size-resolved dust properties and is evaluated against various observations, including INP concentrations. This allows us to perform a systematic assessment of dust INP effects across both cloud types. Our results provide a stronger basis for understanding aerosol–cloud–climate interactions and for improving climate prediction.
In this study, we developed an improved INP parameterization within version 4.2 of the Weather Research and Forecasting model coupled with Chemistry (WRF-Chem; Grell et al., 2005). The new scheme explicitly represents dust INPs in both mixed-phase and ice clouds, together with several modifications to the dust simulation, thereby providing a more comprehensive description of atmospheric INPs. Specifically, we (1) implemented the Shao2011 dust emission scheme (Shao et al., 2011) within the Model for Simulating Aerosol Interactions and Chemistry (MOSAIC) aerosol module (Zaveri et al., 2008) with 20 size bins, (2) introduced dust-aware INP parameterizations for mixed-phase and ice clouds, and (3) coupled the diagnosed dust INP concentrations to the Morrison two-moment microphysics scheme (Morrison et al., 2005). These developments directly affect the number concentrations and effective radius of cloud droplets and ice crystals, and further influence liquid water path (LWP), ice water path (IWP), and radiative balance.
2.1 Dust emission scheme
The Taklimakan Desert (TD) and the Gobi Desert (GD) are the two dominant dust source regions in East Asia (Sun et al., 2001; Zhang et al., 2008; Wang et al., 2012). Dust cycle is simulated using the Shao2011 dust emission scheme (Shao et al., 2011) in combination with the Zhang2001 dry deposition scheme (Zhang, 2001), following the evaluation of Zeng et al. (2020), who identified this configuration as optimal for East Asia.
The Shao2011 scheme calculates dust emission as a function of surface erodibility, vegetation fraction, soil particle size distribution, soil moisture, and near-surface winds (Shao et al., 2011). Specifically, the erodibility factor prescribes the fraction of erodible surface in each grid cell, and the vegetation fraction reduces the effective bare soil area exposed to wind erosion. The soil particle size distribution regulates the emitted dust mass across different size bins, while soil moisture suppresses dust emission by enhancing inter-particle cohesion. The erodibility distribution applied in this study is shown in Fig. S1 in the Supplement.
In WRF-Chem, the Shao2011 scheme is originally implemented only within the Goddard Chemistry Aerosol Radiation and Transport (GOCART) aerosol module. Here, we established a new coupling by integrating Shao2011 with MOSAIC, which resolves 20 size bins (0.000968–10 µm). Moreover, as suggested by Zeng et al. (2020), we adopted the soil particle size distribution from WRF-Chem v3.7.1, as it yields dust simulations that are more consistent with observations compared with the default distribution in WRF-Chem v4.2.
It has been shown that the National Centers for Environmental Prediction Final Operational Global Analysis (NCEP/FNL) reanalysis data that drive the WRF-Chem model are biased towards high soil moisture, often resulting in unsatisfactory dust simulations (Chen and Mitchell, 1999). To mitigate this problem, we employed the Climate Change Initiative soil moisture (CCIrec, 1989–2021) global long-term non-missing satellite soil moisture product developed by Hu et al. (2023), which avoids the overestimation of soil moisture inherent in the FNL reanalysis data.
2.2 Ice nucleation parameterizations
In the atmosphere, four major heterogeneous nucleation pathways are identified: deposition nucleation, immersion freezing, contact freezing, and condensation freezing (Kanji et al., 2017). Deposition nucleation refers to the direct deposition of water vapor onto the surface of INPs under ice-supersaturated conditions, in the absence of liquid droplets (Burrows et al., 2022). Immersion freezing occurs when INPs are first activated as cloud condensation nuclei to form droplets, which subsequently freeze upon further cooling (Kanji et al., 2017). Contact freezing, by contrast, takes place when INPs collide with supercooled droplets, leading to the rapid freezing of the droplets (Murray et al., 2012). Condensation freezing occurs when water vapor condenses onto INP surfaces at subzero temperatures while simultaneously freezing to form ice (Burrows et al., 2022). However, the latter mechanism remains under debate, as it is not yet clear from a microphysical perspective whether condensation freezing is distinct from immersion freezing or deposition nucleation (Kanji et al., 2017). Therefore, it is not regarded as a separate mechanism in this study.
In the default Morrison cloud microphysics scheme (see Text S1 in the Supplement for details), heterogeneous nucleation parameterization schemes (Bigg, 1953; Cooper, 1986; Meyers et al., 1992) rely solely on temperature or ice supersaturation. However, the combined application of these schemes is still unable to reproduce the observed ice nucleation concentrations (DeMott et al., 2010). In this study, we revised the default Morrison microphysics scheme by incorporating aerosol-aware parameterizations for both mixed-phase clouds (Sect. 2.2.1) and ice clouds (Sect. 2.2.2), which successfully reproduce the observed INP−temperature relationships in natural environments.
2.2.1 Mixed-phase clouds parameterizations
In this study, we improved the representation of ice nucleation in mixed-phase clouds by replacing the Bigg (1953) parameterizations for immersion freezing with those of DeMott et al. (2015), Reicher et al. (2019), and Chen et al. (2021). Deposition nucleation and contact freezing are not included for mixed-phase clouds, as their contribution is generally negligible compared to immersion freezing (Hoose et al., 2008). Immersion freezing is restricted to the presence of liquid water droplets, as the ice nucleation rate is activated only within these droplets. DeMott et al. (2015) derived a parameterization scheme for dust INP number concentration as a function of temperature and dust number concentration with diameters larger than 0.5 µm (Eq. 1; hereafter DeMott2015), based on laboratory experiments and field observation datasets of Saharan and Asian desert dust. This parameterization scheme has since been widely adopted for representing dust INPs in both global and regional models (Shi and Liu, 2019; Kawai et al., 2021; Zeng et al., 2023).
where nINP(T) denotes the number concentration of INPs (in std L−1) at temperature T (in K), na>0.5 µm represents the number concentration of dust with diameters larger than 0.5 µm (in std cm−3), and the constant coefficients, α, β, γ, and δ, are 0, 1.25, 0.46, and −11.6, respectively. The calibration factor, cf, was set to 3, following DeMott et al. (2015).
Reicher et al. (2019) developed a dust INP parameterization scheme (Eqs. 2 and 3; hereafter Reicher2019) for two particle size intervals (0.3 µm < Dp<1 µm and Dp>1 µm; Dp denotes the diameter of dust) based on six dust events in the eastern Mediterranean during 2016–2017, as well as on measurements reported by Price et al. (2018) and Boose et al. (2016).
where A is the dust surface area per unit volume of air, ns(T) is the density of surface active sites of INP (in m−2) at temperature T (in K), and the parameters y0, a, b, and c are determined by the dust diameter, as listed in Table S1 in the Supplement.
Chen et al. (2021), using observational data from East Asian dust events in March and May 2018 and April and May 2019 together with the observational data of Reicher et al. (2019), established parameterizations for five particle size intervals (0.18 µm µm, 1 µm µm, 1.8 µm <Dp <3.2 µm, 3.2 µm < Dp < 5.6 µm, 5.6 µm < Dp < 10 µm). They reported that the ice-forming efficiency of dust increased with particle size and then leveled off, as decreasing dust number concentration with increasing size limited further enhancement. The parameterization of Chen et al. (2021, hereafter Chen2021) retains the fundamental framework of Reicher2019, but with a modified ns(T) (Eq. 4).
where the values of the parameters a and b depend on the dust diameter, as listed in Table S2.
2.2.2 Ice clouds parameterizations
In the default Morrison microphysics scheme, all cloud droplets and raindrops are assumed to homogeneously freeze into ice crystals at temperatures below −40 °C. However, for aerosol solution, the occurrence of homogeneous or heterogeneous nucleation is governed by supersaturation, and freezing does not necessarily occur below −40 °C. Heterogeneous nucleation requires lower supersaturation and is therefore easier to occur, as INPs provide surfaces for ice formation, thereby lowering the activation barrier for freezing (Koop et al., 2000; Kanji et al., 2017). At higher, colder, and drier altitudes, deposition nucleation becomes the dominant heterogeneous nucleation pathway.
Previous studies have demonstrated that the competition between homogeneous and heterogeneous nucleation plays a critical role in ice clouds (Liu and Penner, 2005; Kuebbeler et al., 2014). In ice clouds, homogeneous nucleation of supercooled droplets can produce numerous small ice crystals, whereas heterogeneous nucleation requires lower relative humidity, may occur earlier than homogeneous nucleation, produces fewer but larger ice crystals, and suppresses homogeneous nucleation.
In this study, we implemented the parameterization of Barahona and Nenes (2009) to simulate the competition between homogeneous and heterogeneous nucleation, enabling the model to explicitly represent interactions between these two nucleation pathways. The ice nucleation spectrum integrated in Barahona and Nenes (2009) includes classical nucleation theory, Meyers et al. (1992), Phillips et al. (2007), and Phillips et al. (2008), which is used in this study. The parameterization of Phillips et al. (2008), based on observations, includes deposition nucleation and immersion freezing and accounts for three aerosol types: dust and metal compounds, inorganic black carbon, and insoluble organic aerosols. In this study, only dust INPs were considered in order to isolate dust-specific microphysical and radiative effects. The dust INP number concentration is calculated according to Eq. (5).
where μ(Si,T) is the average number of activated ice embryos per dust particle at ice supersaturation Si and temperature T, n is the number concentration of dust particles, and Dp (in µm) is the dust particle diameter. μ(Si,T) is calculated according to Eq. (6).
where denotes the ice supersaturation at water saturation. H(Si,T) is an empirically determined fraction () representing the scarcity of heterogeneous nucleation of ice seen in substantially subsaturated conditions. At water saturation, H=1. When T<0 °C and , H(Si,T) is defined by Eq. (7). The factor ξ(T) accounts for the observation that droplets containing INPs are typically seen not to freeze at temperatures warmer than about −2 °C. At temperatures colder than −5 °C and warmer than −2 °C, ξ(T) is assigned values of unity and zero, respectively, with a cubic interpolation in between. α is the fractional contribution from dust to the INP concentration inferred from the continuous flow diffusion chamber (CFDC) measurements, and is set to for dust. The term Ω is the total surface area concentration of all dust particles with dry diameters larger than 0.1 µm, and Ω1 represents the component of Ω contributed by aerosols with diameters between 0.1 and 1 µm. nINP,1 is the component of nINP due to dust with diameters between 0.1 and 1 µm, parameterized by Phillips et al. (2007) (Eqs. 9 and 10).
where fc denotes the contribution to H from nucleation modes (e.g., deposition nucleation) under subsaturated conditions, as defined by Eq. (8). denotes a cubic interpolation function used to interpolate y within [y1,y2] onto the interval [a,b] (see Text S2). Sw is the saturation ratio with respect to water, parameterized following Murphy and Koop (2005). Sw,0 is the threshold of Sw when H=0, which is set to 0.97.
where h is the small fraction to which δ is reduced by warming over ΔT. h=0.15, °C, ΔT=5 °C, °C °C), and ΔSi=0.1 for dust. , where , , , and . γ is a factor that enhances INP concentration due to bulk-liquid modes and is set to 2.
where nINP is the number concentration of INPs (in m−3), including contributions from deposition nucleation, immersion freezing, and condensation freezing. Si denotes the ice supersaturation, and ψ is a normalization factor set to 0.06.
The parameterization of Barahona and Nenes (2009) has been widely applied in global models and has demonstrated good performance (Liu et al., 2012; Shi et al., 2015). Further details of the parameterization scheme can be found in Barahona and Nenes (2009) and Phillips et al. (2008).
At the model resolution used in this study, vertical motions associated with individual air parcels are not resolved, yet they are essential for determining local cooling rates, supersaturation, and thus cloud droplet activation and ice nucleation (Donner et al., 2016). Using only grid-resolved vertical velocity would therefore lead to an underestimation of supersaturation and ice formation (Ghan et al., 1997; Morrison and Pinto, 2005).
To account for this, a subgrid-scale vertical velocity parameterization is applied following Morrison et al. (2005) and Ghan et al. (1997). A characteristic subgrid vertical velocity, w′, is used to represent unresolved turbulent fluctuations within each grid cell. The subgrid vertical velocity is parameterized as:
where K (in m2 s−1) is the vertical eddy diffusivity calculated online by the planetary boundary layer scheme, and Δz is the model layer thickness. Thus, K is not a fixed constant but varies spatially and temporally according to the simulated turbulence and atmospheric stability. Here, w′ represents the magnitude of turbulence-induced vertical velocity fluctuations.
Larger K leads to stronger vertical fluctuations, enhancing cooling rates and supersaturation, and thereby promoting cloud droplet activation and ice nucleation. Similar formulations are widely used in cloud microphysics schemes in both regional and global models (Storelvmo et al., 2006; Morrison and Gettelman, 2008).
2.3 Model configurations
We employed the WRF-Chem model with a horizontal resolution of 27 km, 23 vertical layers, and a top pressure of 50 hPa, with denser layers within the planetary boundary layer (PBL). The simulation domain covers most of East Asia (14–60° N, 74°–130° E), as shown in Fig. S1. The simulated period for analysis is spring 2018 (March–May), which corresponds to the peak dust season in East Asia.
Meteorological initial and boundary conditions were obtained from FNL reanalysis data with a temporal resolution of 6 h and a spatial resolution of 1° × 1° (https://gdex.ucar.edu/datasets/d083002/, last access: 28 October 2025). Chemical initial and boundary conditions were acquired from the simulation results of the Community Atmosphere Model with Chemistry (CAM-Chem) with a temporal resolution of 6 h and a spatial resolution of 0.94° × 1.25° (https://www.acom.ucar.edu/cam-chem/cam-chem.shtml, last access: 28 October 2025). Each simulation was initialized five days before the analysis period (March–May 2018) to minimize the influence of initial conditions. The meteorological fields were reinitialized daily using FNL reanalysis data, while the chemical fields were carried over from the previous day's simulation. This treatment allows for continuous chemical evolution and more reliable meteorological conditions (Zeng et al., 2020). Anthropogenic emissions over mainland China were taken from the ABaCAS-EI 2017 inventory (Air Benefit and Cost and Attainment Assessment System–Emission Inventory), while emissions outside China were based on the IIASA 2015 inventory (International Institute for Applied Systems Analysis) (Zheng et al., 2019; Gao et al., 2020; Li et al., 2023).
The major physical parameterizations employed in this study include the rapid radiative transfer model for GCMs (RRTMG) shortwave and longwave radiative transfer schemes (Iacono et al., 2008), the revised MM5 Monin-Obukhov surface layer scheme (Jiménez et al., 2012), the unified Noah land surface scheme (Tewari et al., 2004), Yonsei University (YSU) PBL scheme (Hong et al., 2006), and the Grell-Freitas ensemble cumulus scheme (Grell and Freitas, 2014). For atmospheric chemistry, we employed version 1999 of the Statewide Air Pollution Research Center mechanism (SAPRC-99; Carter, 2000) gas-phase chemistry mechanism and the MOSAIC aerosol chemistry module using a 20-bin size representation.
2.4 Experimental design
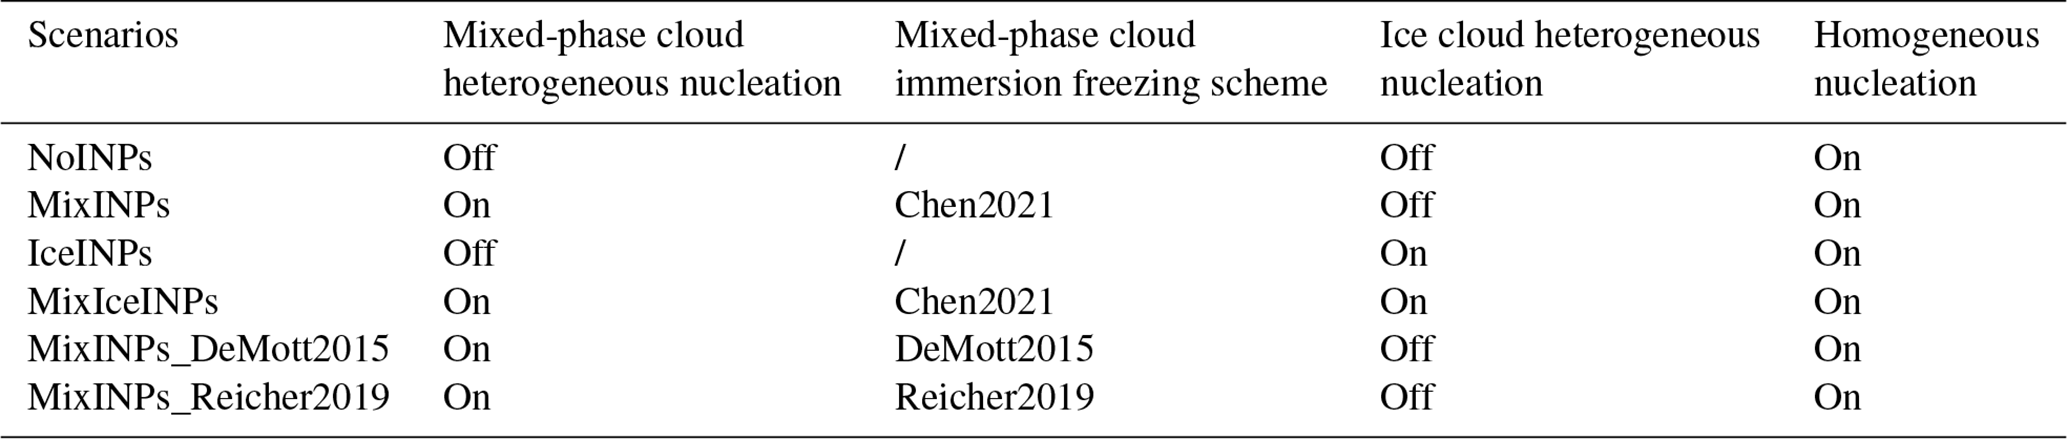
Six simulation scenarios, summarized in Table 1, were designed to investigate the impacts of dust INPs on clouds and radiation, with all scenarios sharing identical model configurations except for the treatment of ice nucleation. In this study, heterogeneous nucleation in mixed-phase clouds included immersion freezing, whereas that in ice clouds comprised both deposition nucleation and immersion freezing. The heterogeneous and homogeneous nucleation processes for each scenario were specified as follows:
-
NoINPs: Heterogeneous nucleation was turned off in both mixed-phase and ice clouds (INPs were removed entirely), while homogeneous nucleation of cloud droplets was active.
-
MixINPs: Heterogeneous nucleation was enabled in mixed-phase clouds by employing the immersion freezing scheme of Chen2021, while heterogeneous nucleation in ice clouds remained off. Homogeneous nucleation was active.
-
IceINPs: Heterogeneous nucleation was enabled in ice clouds, while heterogeneous nucleation in mixed-phase clouds was off. Homogeneous nucleation was active.
-
MixIceINPs: Heterogeneous nucleation was enabled in both mixed-phase and ice clouds. The immersion freezing process followed the parameterization of Chen2021. Homogeneous nucleation was active.
-
MixINPs_DeMott2015: Similar to MixINPs, but immersion freezing in mixed-phase clouds employed the scheme of DeMott2015.
-
MixINPs_Reicher2019: Similar to MixINPs, but immersion freezing in mixed-phase clouds employed the scheme of Reicher2019.
Only dust was considered as INPs in this study. To separate the effects of aerosol ice nucleation from the thermodynamic impacts of aerosols on cloud microphysics resulting from changes in solar radiation, dust emissions were activated in the NoINPs scenario to maintain consistent thermodynamic conditions with other scenarios, but heterogeneous ice nucleation by dust was not considered. In all scenarios, aerosol–radiation interactions were enabled, so that the direct radiative effects of dust were consistently represented. The differences MixINPs – NoINPs, IceINPs – NoINPs, and MixIceINPs – NoINPs represented the indirect effects of dust INPs in mixed-phase clouds, ice clouds, and both cloud types, respectively. For mixed-phase cloud immersion freezing, the scheme of Chen2021 was applied in MixINPs, as it shows the best performance in reproducing dust INPs (see Sect. 3.1). To assess sensitivity to different parameterizations, two additional experiments, MixINPs_DeMott2015 and MixINPs_Reicher2019, employed alternative immersion freezing schemes. Comparisons among MixINPs, MixINPs_DeMott2015, and MixINPs_Reicher2019 allowed evaluation of the uncertainties associated with different parameterizations, particularly regarding dust particle size effects.
Table 1Ice nucleation treatments in six simulation scenarios designed to investigate the effects of dust INPs on clouds and radiation. Homogeneous and heterogeneous ice nucleation in ice clouds followed Barahona and Nenes (2009). All other model configurations were identical.
2.5 Measurements
Surface PM10 concentrations were obtained from the National Environmental Monitoring Center of China (https://quotsoft.net/air/, last access: 28 October 2025) and correspond to the observation sites shown in Fig. 1. For model–observation comparison, simulated PM10 values were extracted from the nearest grid cell to each monitoring station. Monthly aerosol optical depth (AOD), IWP, and LWP were derived from the Moderate Resolution Imaging Spectroradiometer (MODIS) onboard the Aqua satellite, using the MYD08_M3 (Collection 6.1) product with a spatial resolution of 1° × 1° (https://ladsweb.modaps.eosdis.nasa.gov/, last access: 28 October 2025). Modeled AOD was compared with MODIS retrievals at the wavelength of 550 nm, obtained using the Combined Dark Target and Deep Blue algorithms.
Dust INPs under mixed-phase cloud conditions were derived from aerosol samples collected at the Peking University Atmospheric Environment Monitoring Station (116.31° E, 39.99° N), a typical urban site influenced by East Asian dust transport, using the Peking University Ice Nucleation Array (PKU-INA) during two representative dust events on 1 and 26 May 2018, covering temperatures from −5 to −25 °C (Chen et al., 2021). PKU-INA is a cold-stage-based instrument designed for immersion freezing measurements. Particle number size distributions (PNSDs) from 3 nm to 10 µm were measured with two scanning mobility particle sizers (SMPS) and an aerodynamic particle sizer (APS). Further details of the measurement setup can be found in Chen et al. (2021).
Dust INPs under ice cloud conditions were derived from ambient aerosol samples collected on 22 May 2014 at the Kuqa Meteorological Bureau (83.04° E, 41.43° N) in the Aksu region of Xinjiang, China, with INP concentrations measured using a Static Vacuum Diffusion Cloud Chamber (Jiang et al., 2016). The deposition mode measurements were performed at following temperatures (ice supersaturations): −14 °C (5 %, 8 %, 12 %, 15 %), −16 °C (5 %, 8 %, 12 %, 17 %), −18 °C (5 %, 8 %, 12 %, 16 %, 20 %), and −20 °C (5 %, 8 %, 12 %, 16 %, 20 %, 22 %). Although the Phillips et al. (2008) parameterization accounts for both immersion freezing and deposition nucleation, the observations represent deposition nucleation only. The contribution from immersion freezing is likely negligible, as the site is located near the Taklamakan Desert, where anthropogenic pollution is minimal and deposition nucleation dominates dust ice formation. PNSDs from 0.1 to 10 µm were measured using a Passive Cavity Aerosol Spectrometer Probe (PCASP) and an APS. Additional information is provided in Jiang et al. (2016).
For comparison with observations, modeled INP concentrations were diagnosed offline using parameterization schemes and simulated aerosol properties. The supersaturation used in the simulation is assumed to be identical to that used in the observations, and no subgrid-scale variability is considered. The observational INP concentrations are derived from aerosol samples collected at surface sites under specific temperatures and ice supersaturation conditions, reflecting the potential for aerosol activation as INP. To compare the simulation results with the observed data, the same activation conditions (temperature and ice supersaturation) as in the observations are applied in the simulation, and the modeled INP concentrations are calculated based on the simulated aerosol number concentrations and the relevant parameterization schemes.
2.6 Statistical methods
To ensure a physically meaningful analysis of cloud-related variables, we applied a threshold to select grid cells within clouds. Specifically, a grid cell was considered to be inside a cloud if the sum of the ice water mixing ratio and liquid water mixing ratio exceeded 10−6 kg kg−1, as suggested by Hines et al. (2019). For cloud-related variables, including ice crystal number concentration, ice crystal effective radius, ice water content, cloud droplet number concentration, cloud droplet effective radius, liquid water content, IWP, and LWP, only cloud grid cells were included in the statistical analysis. This criterion excludes non-cloud grid cells in which cloud microphysical variables are zero or, for some variables, not physically meaningful, and prevents the calculated cloud-property averages from being diluted by cloud-free conditions.
For PM10 concentration, dust number concentration, dust INP concentration, and radiative variables, no threshold was applied as these variables are relevant across all grid cells. In particular, the shortwave, longwave, and net radiative effects were calculated as all-sky, domain-mean differences in top-of-atmosphere radiative fluxes over the entire simulation domain to represent the overall radiative effects of dust INPs on the regional energy balance. Radiative fluxes are defined over both cloudy and cloud-free grid cells, and a grid cell may be cloudy in one simulation scenario but cloud-free in another. Applying the cloud threshold separately to each simulation scenario would therefore result in comparisons between different spatial samples and would exclude radiative changes associated with the formation, dissipation, or displacement of clouds. All grid cells were consequently retained to ensure that the same spatial domain was compared among the simulations and that both changes in cloud properties and changes in cloud occurrence were included in the overall radiative effects of dust INPs.
We compared the mean values of cloud-related variables with and without threshold filtering applied to cloud grids. This comparison, presented in Tables S3 and S4, showed that filtering the data generally resulted in higher average values for cloud-related variables because non-cloud grid cells were excluded. However, the responses of cloud properties to dust INPs were generally consistent with and without threshold filtering, confirming that the central conclusions regarding dust-cloud interactions were not substantially affected by the threshold.
We focused on analyzing mean values in this study because they provide a comprehensive overview of model performance and aerosol-cloud interactions. Median values were not analyzed because they may not adequately represent domain-integrated responses in large-scale simulations, particularly for variables with many zero values or strong spatial heterogeneity.
3.1 Model evaluation
To evaluate the accuracy and reliability of the model, the simulated results were compared with multiple observational datasets. The evaluation focused on surface PM10 mass concentration, AOD, IWP, LWP, and dust INP number concentration in both mixed-phase clouds and ice clouds.
The simulated monthly mean surface PM10 mass concentrations for March–May 2018 are evaluated against observations from 1035 sites within the domain shown in Fig. 1a. In March 2018 (Fig. 1a), the observed site-averaged monthly mean is 95.13 µg m−3, whereas the simulated mean is 68.6 µg m−3, corresponding to an overall underestimation of 28 %. The bias is more pronounced near the Taklamakan Desert than over the Gobi Desert or in eastern China, likely due to an inaccurate representation of soil particle size distribution (Zeng et al., 2020). In April 2018 (Fig. 1b), the model slightly overestimates PM10 concentrations by 2 % on average, with underestimation near the Taklamakan Desert and eastern China and overestimation over the Gobi Desert. In May 2018 (Fig. 1c), the simulated monthly mean concentrations are generally consistent with the observations, capturing the observed spatial distribution with a normalized mean bias (NMB) of −8 % and a spatial correlation coefficient (R) of 0.64. Overall, the model reasonably reproduces the spatial distribution of PM10 and performs comparably to previous studies (Su and Fung, 2018a; Zeng et al., 2020).
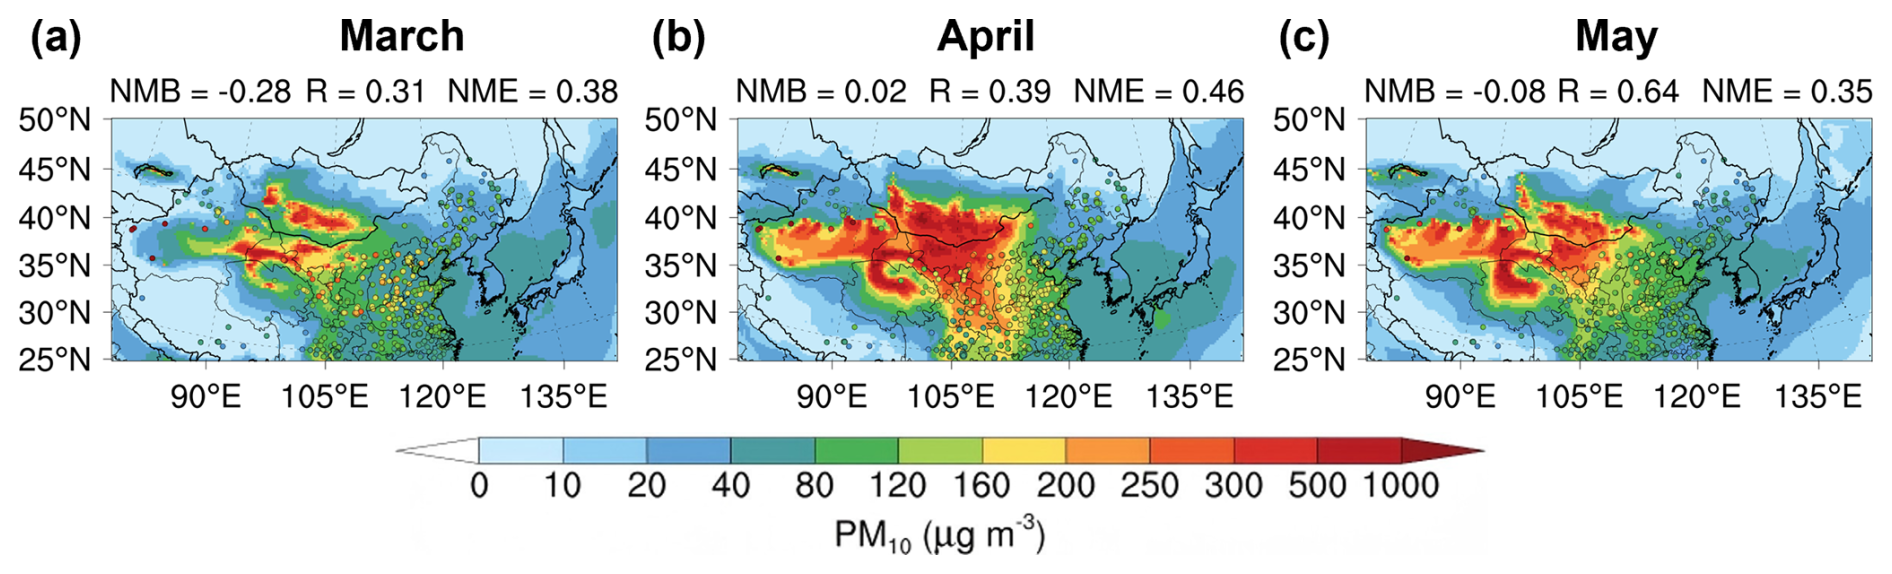
Figure 1Comparison between simulated and observed surface monthly mean PM10 mass concentrations in (a) March, (b) April, and (c) May 2018. Circles denote monthly mean observations from 1035 sites, and color shading indicates the corresponding simulated monthly means. The statistics shown above each panel include the normalized mean bias (NMB), normalized mean error (NME), and correlation coefficient (R). The simulated results are from the MixIceINPs scenario and represent averages of hourly values. The observation data were obtained from the National Environmental Monitoring Center of China.
The modeled monthly mean AOD for March–May 2018 is evaluated against MODIS observations. In March 2018 (Fig. S2a and d), AOD is underestimated over the Taklamakan Desert, consistent with the PM10 underestimation since dust dominates the aerosol burden in this region. The model reproduces the elevated AOD in eastern China, mainly driven by anthropogenic emissions, with minor spatial discrepancies that are acceptable given that anthropogenic pollution is not the focus of this study. In April (Fig. S2b and e), AOD is slightly underestimated over the Taklamakan Desert and overestimated over the Gobi Desert, consistent with the PM10 distribution. In May (Fig. S2c and f), AOD remains overestimated over the Gobi Desert. Overall, the model reasonably captures the spatial distribution of AOD.
The simulated monthly mean IWP and LWP for March–May 2018 are evaluated against MODIS observations (Fig. S3). The simulated IWP is in satisfactory agreement with the observations and reproduces their spatial distribution. The simulated LWP also shows good agreement with observations over the Yangtze River Delta in China and Japan, although noticeable discrepancies remained in northern China. These differences may have resulted from limitations in the cloud parameterization schemes in the model or from uncertainties in the retrievals from the MODIS dataset. Overall, the model reproduces the spatial distribution of both IWP and LWP reasonably well, providing a useful basis for assessing the impacts of dust INPs on clouds and radiation.
The simulated dust INP concentrations under mixed-phase cloud conditions are evaluated against observations at Peking University on 1 and 26 May 2018 (Chen et al., 2021). On both days, simulations with Chen2021 reproduces the observed INP concentrations within one order of magnitude across most temperatures, outperforming both DeMott2015 and Reicher2019 (Fig. 2a). On 1 May 2018, Chen2021 underestimates INPs but remains within one order of magnitude, while DeMott2015 agrees well between −12 and −18 °C but overestimates above −12 and below −18 °C. Reicher2019 showed larger deviations than Chen2021 at all temperatures. On 26 May 2018, Chen2021 overestimates INPs between −6 and −9 °C and underestimates between −9 and −20 °C, yet errors still remain within one order of magnitude. In contrast, DeMott2015 overestimates INPs at all temperatures, whereas Reicher2019 underestimates below −9 °C and overestimates above −9 °C, again with larger errors than Chen2021.
Biases in simulated dust INP concentrations are closely linked to errors in simulated dust number or surface area concentrations. In the absence of dust number observations, simulated PNSDs are used for evaluation, which is reasonable since dust dominated the aerosol composition during both events. On 1 May 2018 (Fig. 2c), the model underestimates aerosol number concentrations in the 1–10 µm range by up to one order of magnitude. Correcting this underestimate would improve the agreement of Chen2021 with the observations but exacerbate the overestimation by DeMott2015. On 26 May (Fig. 2c), the model overestimates aerosol number concentrations in the 0.1–2 µm range and slightly underestimates in the 2–10 µm range, likely contributing to the modest underestimation of INPs in Fig. 2a. However, since the observations represent total INPs from all aerosol types while the simulations consider dust only, some compensating biases may exist.
Overall, DeMott2015 predicts INP concentrations about five and ten times higher than Chen2021 on 1 and 26 May, respectively, at a representative urban site influenced by East Asian dust transport. This discrepancy may be associated with the use of uniform parameters for all dust particles larger than 0.5 µm in DeMott2015, which could overrepresent the ice-forming efficiency of smaller particles. In DeMott et al. (2015), the predicted INP concentrations were in excellent agreement with those from the aerosol-surface-area-based parameterization of Niemand et al. (2012), whereas Chen et al. (2021) found that their parameterization for the 5.6–10 µm size interval is consistent with the Niemand et al. (2012) scheme. These findings suggest that the DeMott2015 parameterization is more suitable for representing larger dust particles (> 5.6 µm), while Chen et al. (2021) further indicate that the ice-forming efficiency of dust increases with particle size. However, at this observation site, smaller dust particles (0.18–5.6 µm) contribute over 95 % of the total dust surface area (Fig. S4), implying that large-particle-oriented schemes may overestimate INP concentrations under such conditions. Because smaller dust particles can be transported to higher altitudes and over long distances, DeMott2015 is likely to predict higher INP concentrations aloft and downwind of dust sources. By incorporating size-resolved effects, Chen2021 offers an alternative representation that may better capture the spatial variability of dust INPs.
The simulated dust INP concentrations under ice cloud conditions are evaluated against observations at a station located near the Taklimakan Desert, China (Jiang et al., 2016). As the observational data were obtained on 22 May 2014, the period from 14 to 25 May 2014 is simulated using the same model configuration as in the IceINPs scenario. As shown in Fig. 2b, the error between the simulation and observation decreased with decreasing temperature, but the model increasingly overestimated INPs with higher ice supersaturation at a given temperature. At −14 °C, simulated INP concentrations deviated from observations by about one order of magnitude, whereas at −20 °C the maximum deviation was a factor of 5. These errors likely arise from biases in simulated aerosol number concentrations. To further investigate, the simulated PNSDs on 22 May 2014 were compared with measurements (Fig. 2c). The model generally overestimated aerosol number concentrations in the 0.1–10 µm range, with the smallest bias (near agreement) at 1 µm. The overestimation was within one order of magnitude for particles between 1 and 10 µm, but reached up to two orders of magnitude in the 0.1–1 µm range. The overestimation of aerosol number concentrations in the 0.1–10 µm range explains the overestimation of dust INP number concentrations.
In summary, the performance of the model in simulating dust, dust INP, and cloud water over East Asia is fairly good, and the discrepancies between the simulations and observations are reasonable and acceptable.
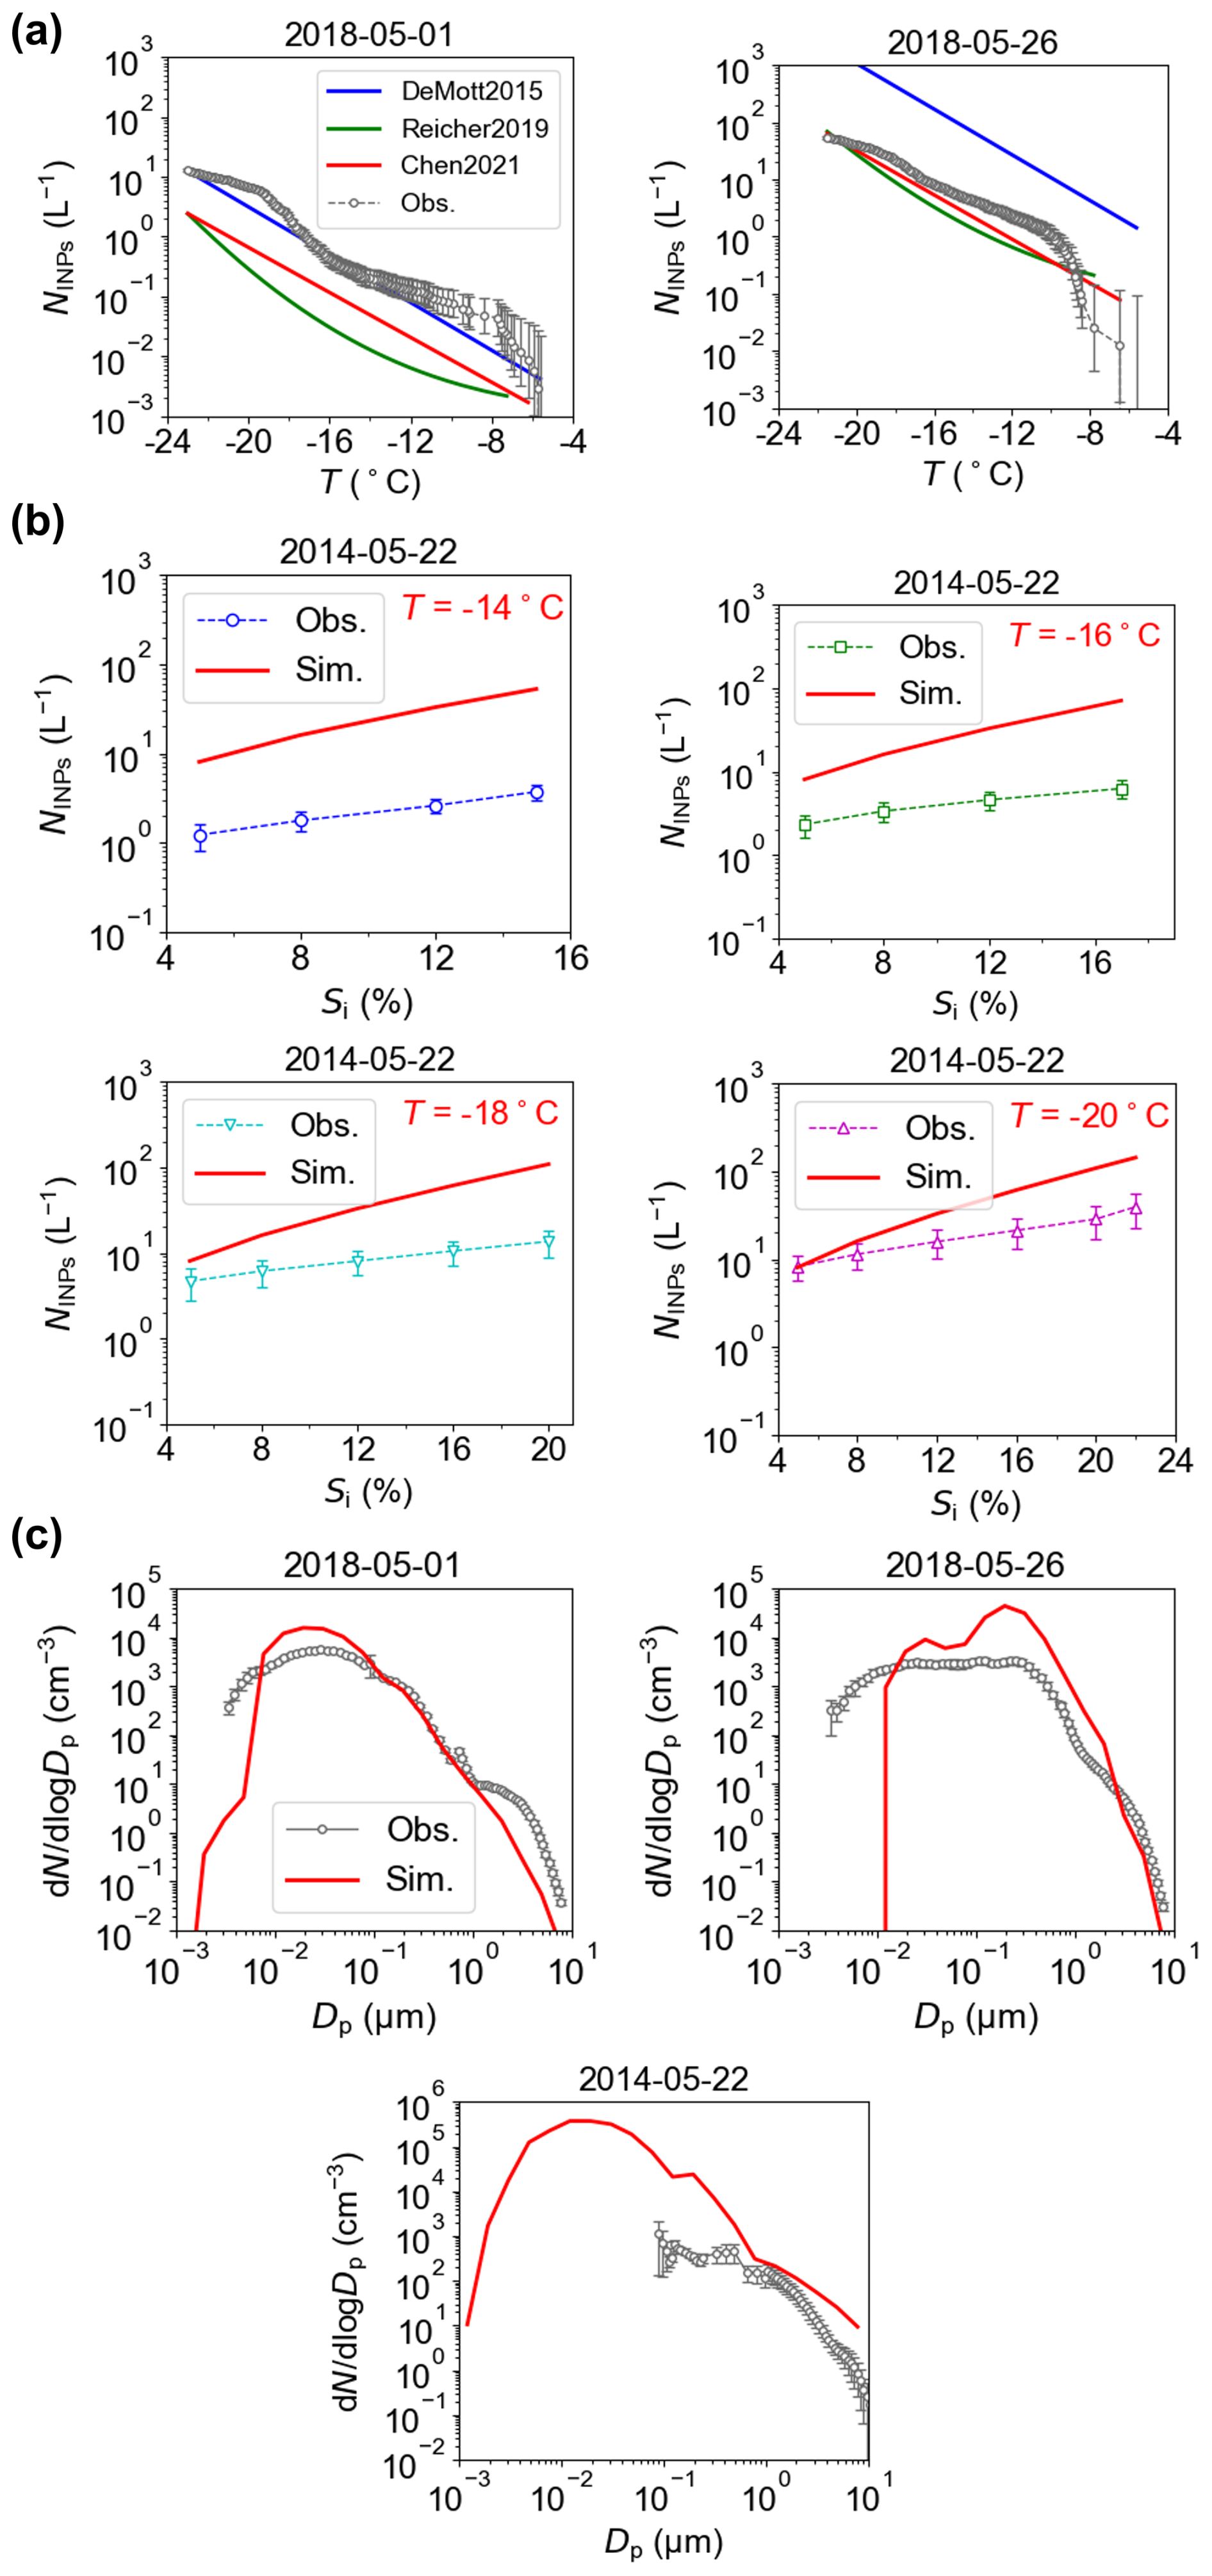
Figure 2Comparison of simulated and observed dust INP number concentrations and particle number size distributions (PNSDs). (a) Simulated dust INP number concentrations in mixed-phase clouds compared with observations on 1 and 26 May 2018 at the Peking University Atmosphere Environment Monitoring Station (116.31° E, 39.99° N). NINPs denotes the number concentration of dust INPs, and T denotes the temperature. (b) Simulated dust INP number concentrations in ice clouds compared with observations at −14, −16, −18, and −20 °C on 22 May 2014 at the Kuqa Meteorological Bureau (83.04° E, 41.43° N) in the Aksu region of Xinjiang, China. Si denotes ice supersaturation, Obs. denotes observations, and Sim. denotes simulations. (c) Simulated PNSDs compared with observations from the same stations and dates as in panels (a) and (b). N denotes the aerosol number concentration, and Dp denotes the aerosol diameter. Error bars indicate the 95 % confidence intervals for the observations. The simulated results are from the MixIceINPs scenario and represent averages of hourly values.
3.2 Impacts of dust INPs on clouds and radiation
3.2.1 Spatial distribution of dust INPs
Figure 3 shows the meridionally averaged vertical cross-sections of dust INPs and ice crystals formed by homogeneous nucleation for each scenario. Unless otherwise noted, the simulations are averaged over March–May 2018. For the NoINPs scenario, ice crystals formed through homogeneous nucleation are mainly found at temperatures below −40 °C. The occurrence of ice crystals formed through homogeneous nucleation at temperatures greater than −37 °C is noted, which is due to temporal averaging and meridional averaging.
For the MixINPs scenario, the distribution of ice crystals formed by homogeneous nucleation closely resembles that in NoINPs, whereas dust INPs in mixed-phase clouds are mainly distributed below the −40 °C isotherm. The mean concentration of INPs in mixed-phase clouds (1.8 × 10⁻³ L−1) is about one order of magnitude lower than that of ice crystals from homogeneous nucleation (1.7 × 10⁻² L−1).
For the IceINPs scenario, INPs in ice clouds are also mainly distributed at temperatures below −40 °C. The mean concentration of ice crystals formed from homogeneous nucleation (9.1 × 10⁻⁴ L−1) in IceINPs is only 5.4 % of that in NoINPs, indicating strong suppression of homogeneous nucleation by heterogeneous nucleation. By contrast, the mean concentration of INPs in ice clouds (3.7 × 10⁻¹ L−1) is about 22 times higher than that of ice crystals formed through homogeneous nucleation in NoINPs, which may be due to the relatively low ice supersaturation limiting the occurrence of homogeneous nucleation, as further supported by sensitivity experiments with alternative subgrid vertical velocity parameterizations (Sect. 3.2.5). Homogeneous nucleation mainly occurs at ice saturation greater than 1.3, but grid cells with ice saturation greater than 1.3 account for less than 0.7 % of the grids at temperatures below −37 °C (Fig. S5). This higher concentration of INPs relative to homogeneous ice crystals is further supported by high dust concentrations at temperatures below −40 °C (Fig. S6a) and by the fact that heterogeneous nucleation can occur at warmer temperatures and lower ice supersaturation. Overall, INPs in ice clouds are about 206 times more abundant than INPs in mixed-phase clouds in MixINPs, reflecting that ice-phase conditions are more favorable for heterogeneous nucleation.
For the MixIceINPs scenario, the concentrations of ice crystal number formed by homogeneous nucleation and dust INPs in ice clouds are similar to those in IceINPs. However, the mean concentration of dust INPs in mixed-phase clouds (1.9 × 10⁻⁴ L−1) is about one order of magnitude lower than in MixINPs. This reduction is likely related to latent heat release during heterogeneous nucleation in ice clouds, which increases temperatures in the mixed-phase layer (Fig. S8b).
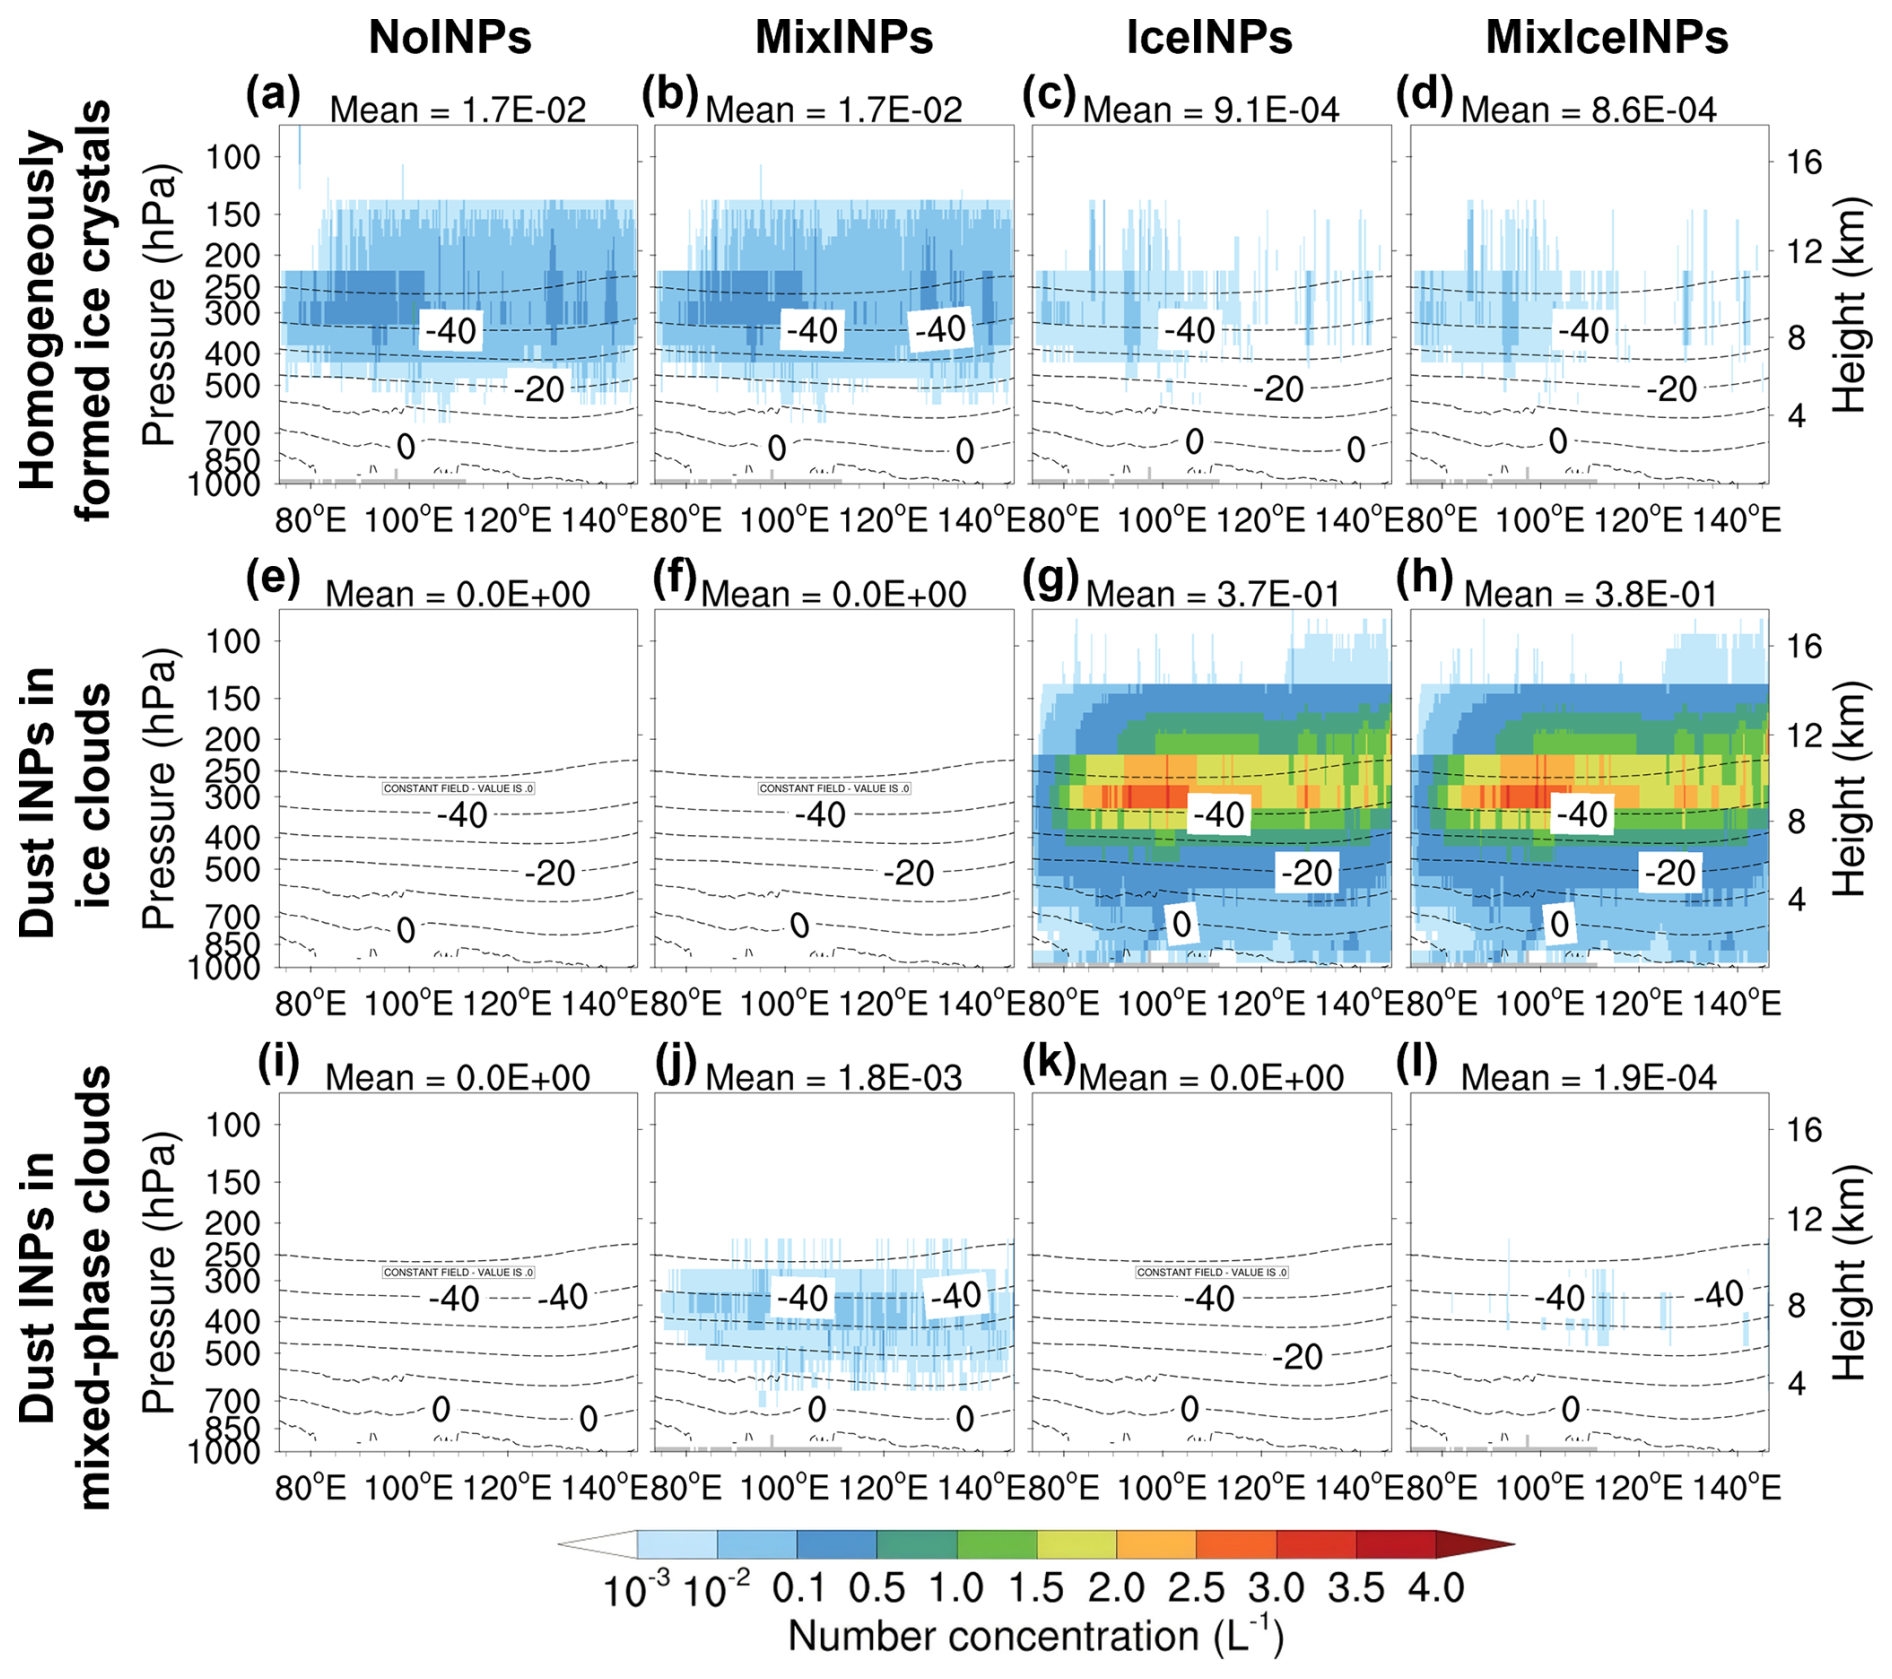
Figure 3Simulated meridional mean vertical cross-sections of (a–d) homogeneously formed ice crystals, (e–h) dust INPs in ice clouds, and (i–l) dust INPs in mixed-phase clouds, for the NoINPs (first column), MixINPs (second column), IceINPs (third column), and MixIceINPs (fourth column) scenarios. Dashed lines indicate isotherms, and grey shading denotes missing values due to terrain. The mean value over the plotted region is shown above each panel. The simulated results are averages of hourly values from March to May 2018.
The horizontal distributions of dust INP number concentrations under different scenarios are presented (Fig. 4). Dust INPs in ice clouds are analyzed at 250 hPa, representing a typical ice cloud altitude, while dust INPs in mixed-phase clouds are analyzed at 450 hPa, representing a typical mixed-phase cloud altitude (Hoinka, 1998). For the MixINPs scenario, dust INPs in mixed-phase clouds are mainly concentrated over dust source regions, with substantially lower values in downwind areas, likely due to the removal of coarse particles during long-range transport (Fig. S7). Notably, the Qinghai–Tibetan Plateau appears as a hotspot of dust INPs in mixed-phase clouds, suggesting their potential influence on cloud and radiation processes over this region. For the IceINPs scenario, dust INPs in ice clouds are more evenly distributed between source and downwind regions, as they are primarily contributed by fine dust particles that can be transported over longer distances. For the MixIceINPs scenario, a suppression effect of dust INPs in mixed-phase clouds by those in ice clouds is also evident.
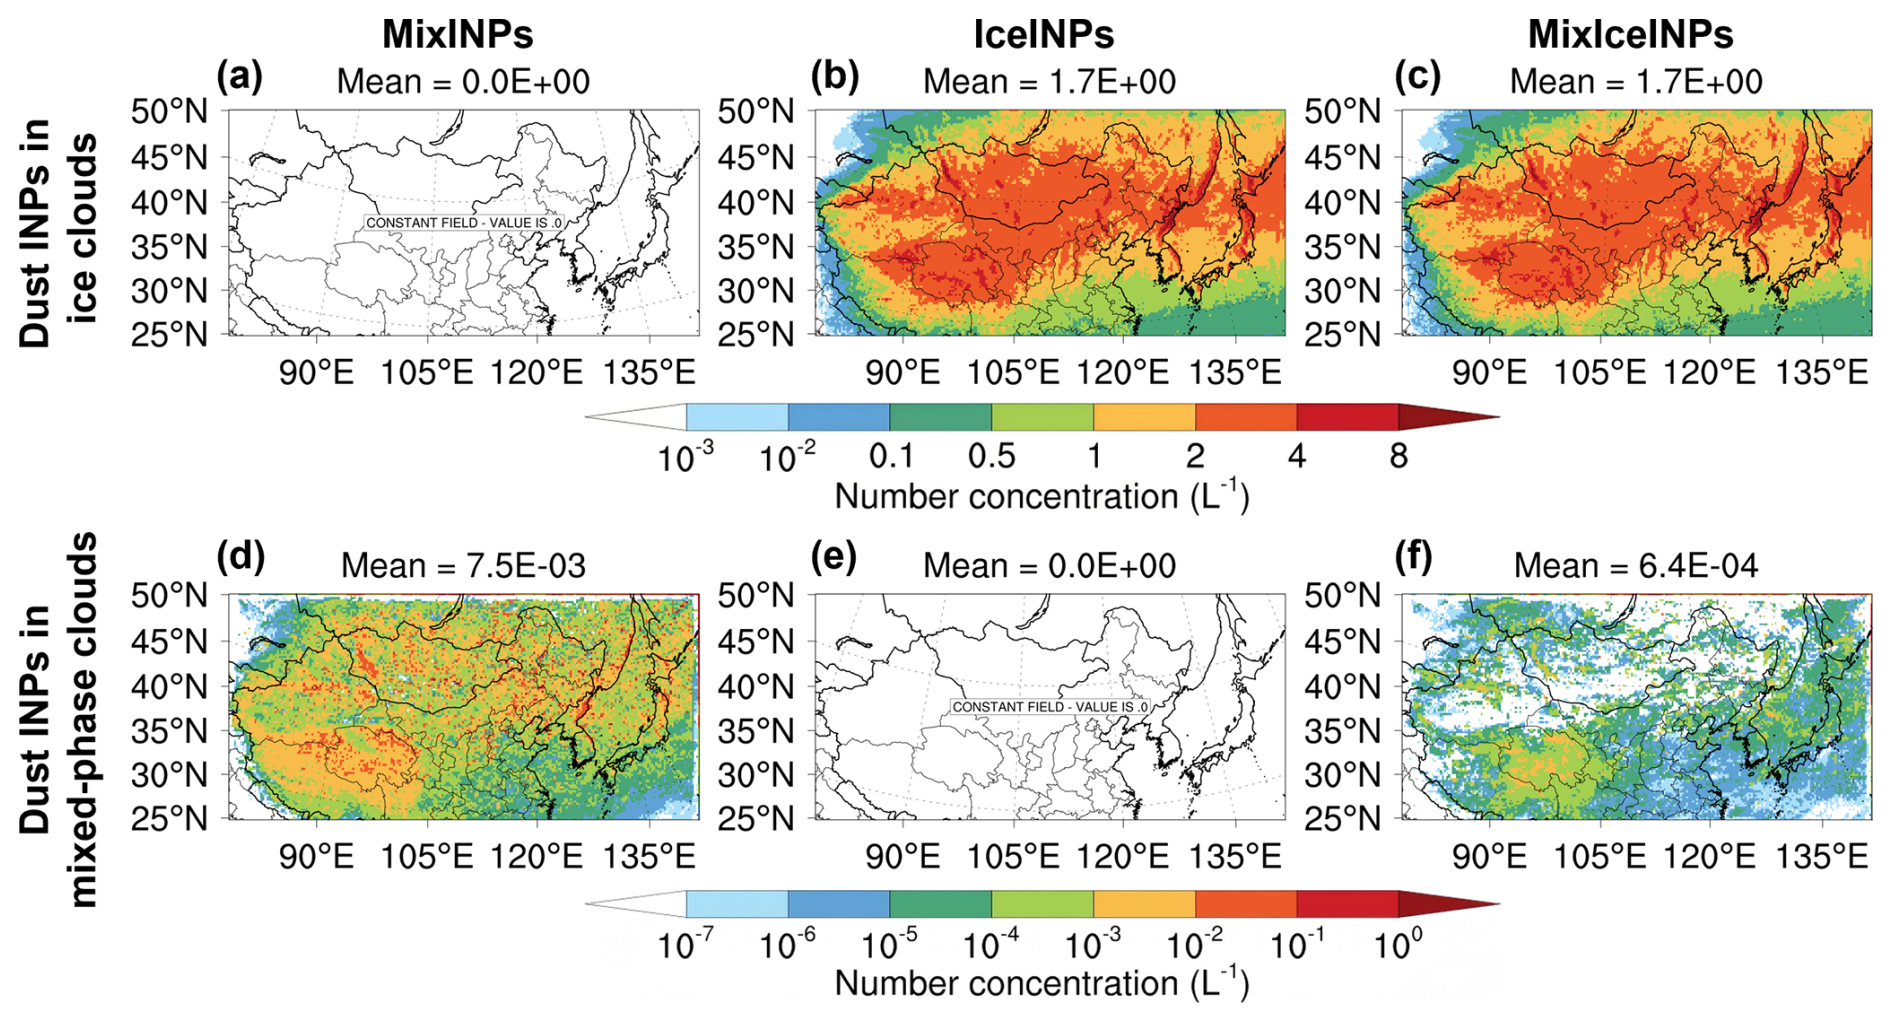
Figure 4Simulated spatial distributions of (a–c) dust INP number concentrations in ice clouds at 250 hPa and (d–f) dust INP number concentrations in mixed-phase clouds at 450 hPa, for the MixINPs (left column), IceINPs (middle column), and MixIceINPs (right column) scenarios. The mean value over the plotted region is shown above each panel. The simulated results are averages of hourly values from March to May 2018.
3.2.2 Impacts of dust INPs on clouds
The meridionally averaged vertical cross-section of ice-phase and liquid-phase variables is shown in Fig. 5. For the NoINPs scenario, ice crystals are mainly found at temperatures below −40 °C, consistent with ice crystals formed by homogeneous nucleation. The effective radius of ice crystals tends to be larger between −40 and −20 °C, with smaller radii at the upper and lower boundaries of this range. This pattern reflects gravitational sedimentation of larger ice crystals, during which rising temperature enhances the saturation vapor pressure. When the ambient vapor pressure falls below the saturation level, sublimation occurs and reduces crystal size. The distribution of ice water content shows a similar pattern, though with maximum values between −30 and −10 °C. The number concentration of cloud droplets decreases steadily with altitude. The effective radius of cloud droplets remains nearly uniform vertically, but increases gradually eastward. This east–west contrast likely arises from differences in water vapor supply, as the domain is bounded by the Pacific Ocean to the east and the Taklamakan Desert to the west. The vertical distribution of liquid water content largely mirrors that of droplet number concentration.
For the MixINPs scenario, dust-induced ice nucleation in mixed-phase clouds enhances the number concentration of ice crystals, the effective radius of ice crystals, and ice water content, while reducing the number concentration of cloud droplets and liquid water content, but increasing droplet mean radius. These changes are caused by the acceleration of the WBF process by dust particles (Liu et al., 2011), as confirmed by process-rate diagnostics (Sect. 3.2.6). Dust INPs initiate additional ice crystals, increasing crystal number concentration, while the WBF process transfers mass from liquid to ice, promoting crystal growth. The combined increase in number concentration and radius leads to higher ice water content. Small droplets, with higher saturation vapor pressures, evaporate preferentially during WBF, leaving fewer but larger droplets, thus lowering droplet concentration, enlarging their mean radius, and reducing liquid water content.
For the IceINPs scenario, ice crystal number concentration in ice clouds (< −37 °C) increases sharply because dust INP concentrations are about 22 times larger than the concentration of ice crystals formed via homogeneous nucleation in the NoINPs scenario. Under a fixed water content, this increase in number concentration reduces crystal radius, an effect analogous to the Twomey effect (Twomey, 1974). This contrasts with the global-scale “anti-Twomey effect” reported in Liu et al. (2012), Kuebbeler et al. (2014), and Beer et al. (2024), as here the dust INP concentrations in ice clouds greatly exceed those of homogeneously nucleated crystals. This result is robust across sensitivity experiments with alternative subgrid-scale vertical velocity parameterizations (Sect. 3.2.5), indicating that it is not driven by underestimated vertical velocity fluctuations. Although the effective radius decreases, the increase in number concentration dominates, leading to enhanced ice water content in ice clouds. Moreover, precipitation of ice crystals from ice clouds into mixed-phase clouds further increases ice crystal number concentration there, reinforcing the WBF process, as supported by the diagnosed sedimentation flux (Sect. 3.2.6). This produces larger ice crystals, higher ice water content, fewer cloud droplets, larger droplet mean radius, and reduced liquid water content in mixed-phase clouds. The magnitude of these changes in the IceINPs scenario exceeds those in MixINPs, because the flux of ice crystals sedimenting from ice clouds into mixed-phase clouds is greater than the number of crystals nucleated in situ by dust INPs. As a result, the influence of dust INPs in ice clouds dominates over those in mixed-phase clouds, and the outcomes of MixIceINPs and IceINPs are nearly identical.
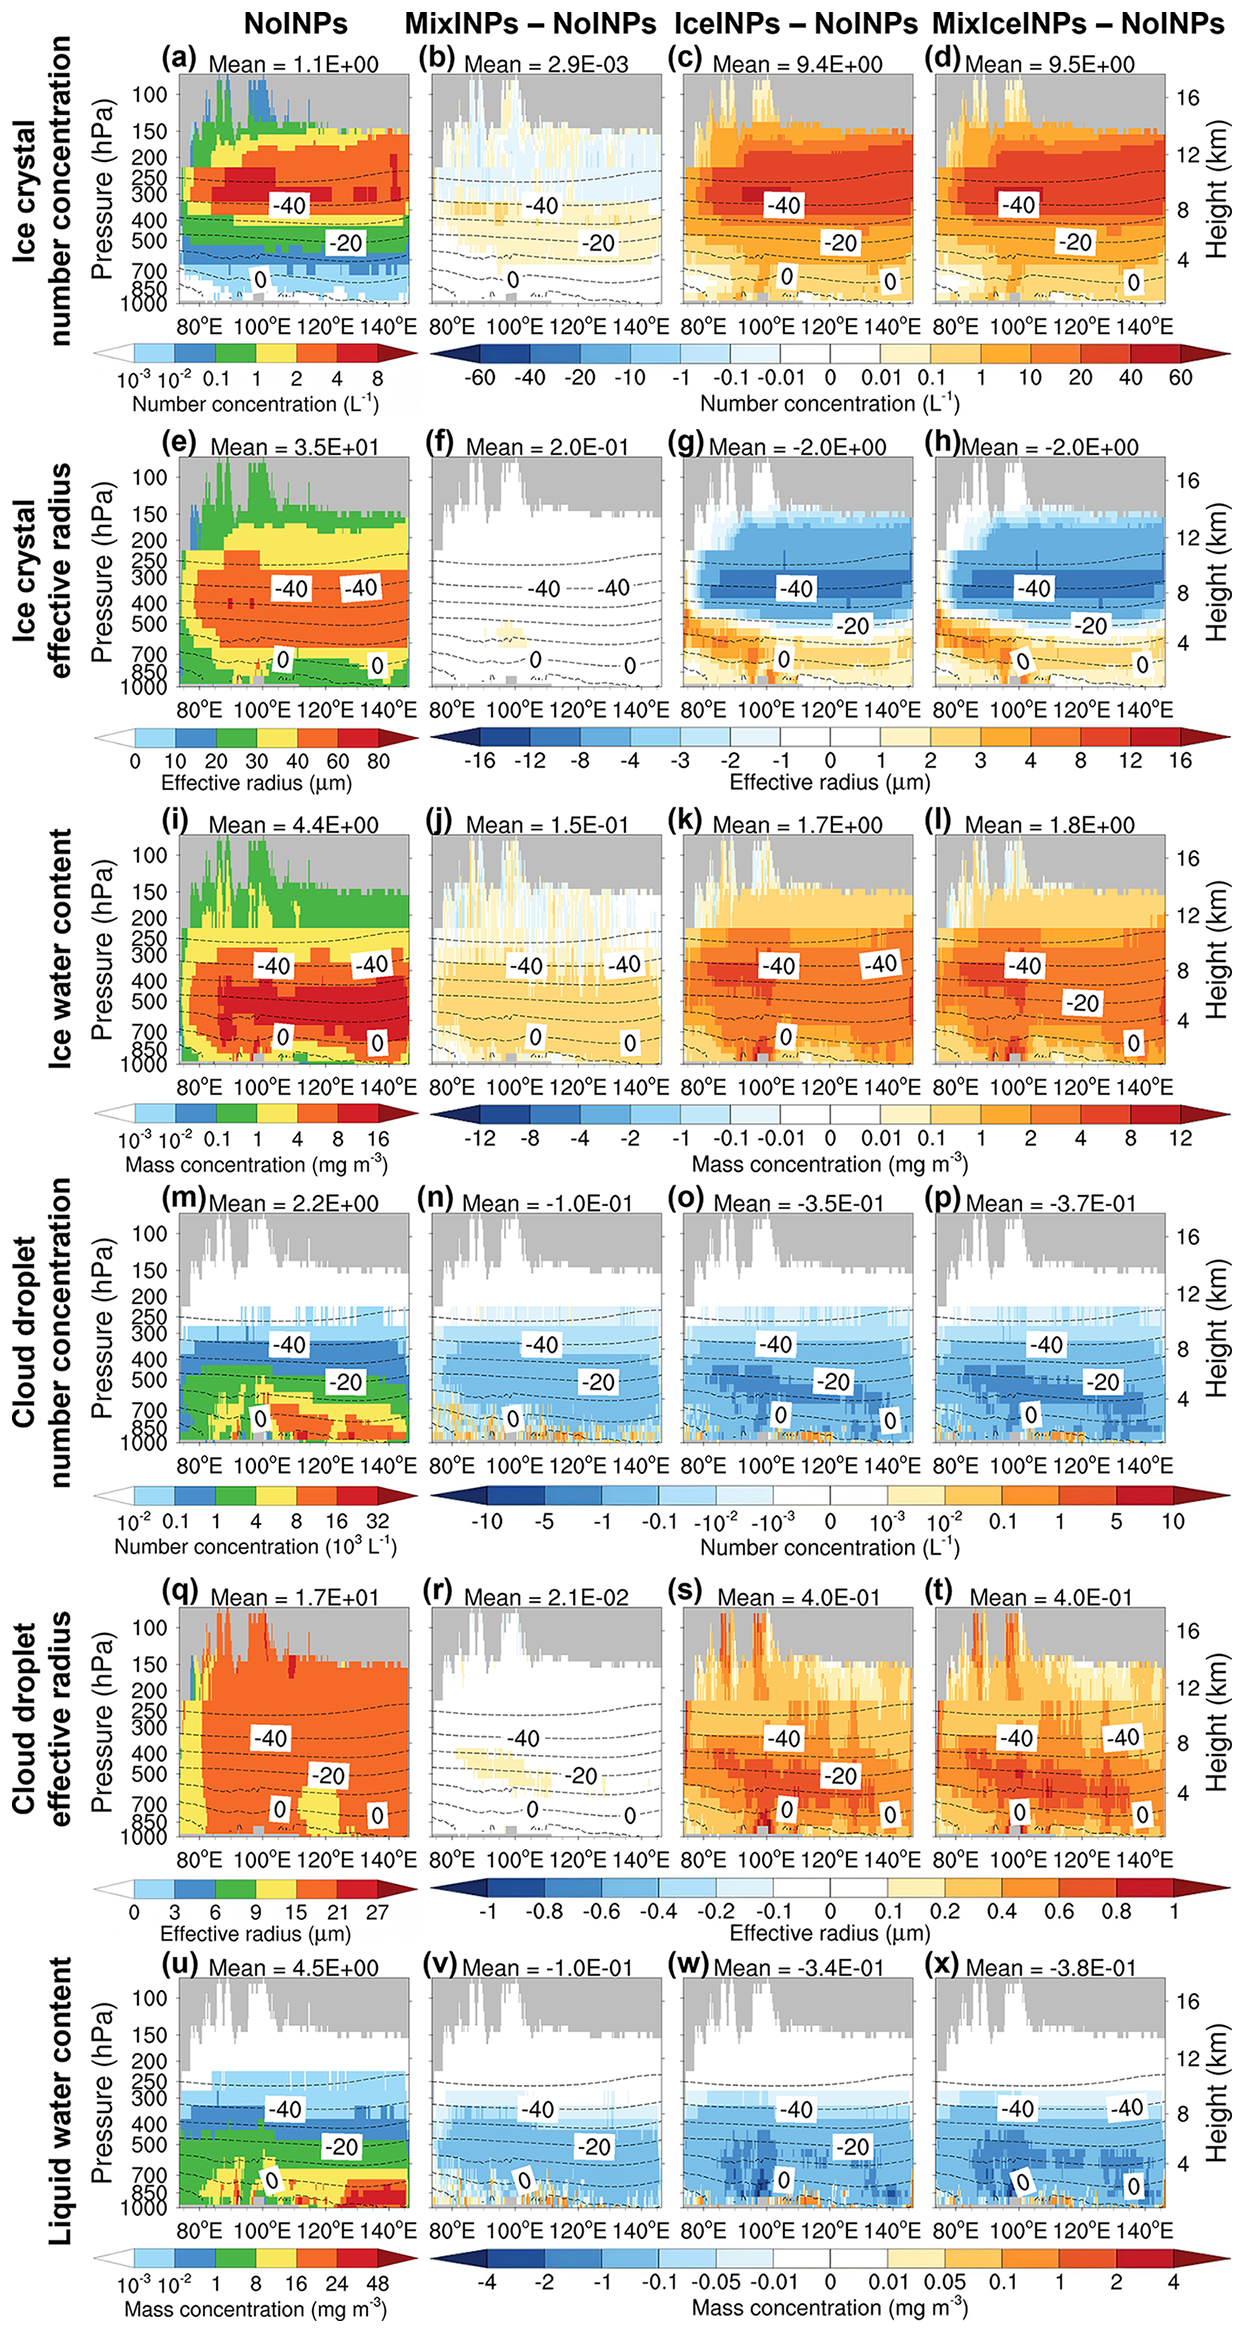
Figure 5Simulated meridional mean vertical cross-sections of (a–d) ice crystal number concentration, (e–h) ice crystal effective radius, (i–l) ice water content, (m–p) cloud droplet number concentration, (q–t) cloud droplet effective radius, and (u–x) liquid water content, for the NoINPs (first column), MixINPs – NoINPs (second column), IceINPs – NoINPs (third column), and MixIceINPs – NoINPs (fourth column) scenarios. Dashed lines indicate isotherms, and grey shading denotes missing values due to terrain or filtering of non-cloud grid cells (where the sum of ice and liquid water mixing ratios is less than 10−6 kg kg−1). The mean value over the plotted region is shown above each panel. The simulated results are averages of hourly values from March to May 2018.
The horizontal distributions of ice-phase and liquid-phase variables are presented (Fig. 6). For this analysis, the ice crystal number concentration, cloud droplet number concentration, ice water content, and liquid water content were vertically integrated to obtain column concentrations, while the effective radii of ice crystals and cloud droplets were vertically averaged.
For the NoINPs scenario, higher values of ice crystal column number concentration are found over the Qinghai–Tibetan Plateau, the middle and lower reaches of the Yangtze River Plain, Mongolia, and the western Pacific. Larger ice crystal effective radii are found over the Qinghai–Tibetan Plateau and Northeast Asia, where lower temperatures favor ice crystal growth. High IWP values are located over the western Pacific, the Qinghai–Tibetan Plateau, and the middle–lower Yangtze River plain, consistent with higher water content (see the spatial distribution of temperature and total water column mass concentration in Fig. S9). Elevated cloud droplet number concentrations in the Yangtze River plain are associated with higher moisture and temperatures compared to the Plateau and northern regions. The distribution of cloud droplet effective radius resembles that of ice crystals, while LWP broadly follows the distribution of cloud droplet column number concentration.
For the MixINPs scenario, ice crystal column number concentration increases slightly in most regions. The effective radius of ice crystals is larger over the Qinghai–Tibetan Plateau and dust source regions, driven by the enhanced WBF process induced by dust INPs in mixed-phase clouds. On average, IWP increases by 3.2 %, cloud droplet column number concentration decreases by 6.4 %, cloud droplet mean effective radius increases by 0.2 %, and LWP decreases by 2.9 %.
For the IceINPs scenario, dust INPs in ice clouds lead to an average increase of 928.6 % in ice crystal column number concentration and 41.1 % in IWP across the domain. The increase in ice crystal effective radius over the Tibetan Plateau and northern regions is likely associated with lower temperatures in these regions, where ice crystals sedimenting from ice clouds into mixed-phase clouds grow larger via the WBF process, with the increase in ice crystal effective radius in mixed-phase clouds exceeding the decrease in ice clouds. Ice crystals precipitating from ice clouds into mixed-phase clouds accelerate the WBF process, resulting in an average 19.1 % decrease in cloud droplet column number concentration, a 3.1 % increase in cloud droplet mean effective radius, and a 8.6 % decrease in LWP. These changes are more pronounced over the Qinghai–Tibetan Plateau and northern regions than elsewhere. Results for the MixIceINPs scenario are generally consistent with those of the IceINPs scenario.
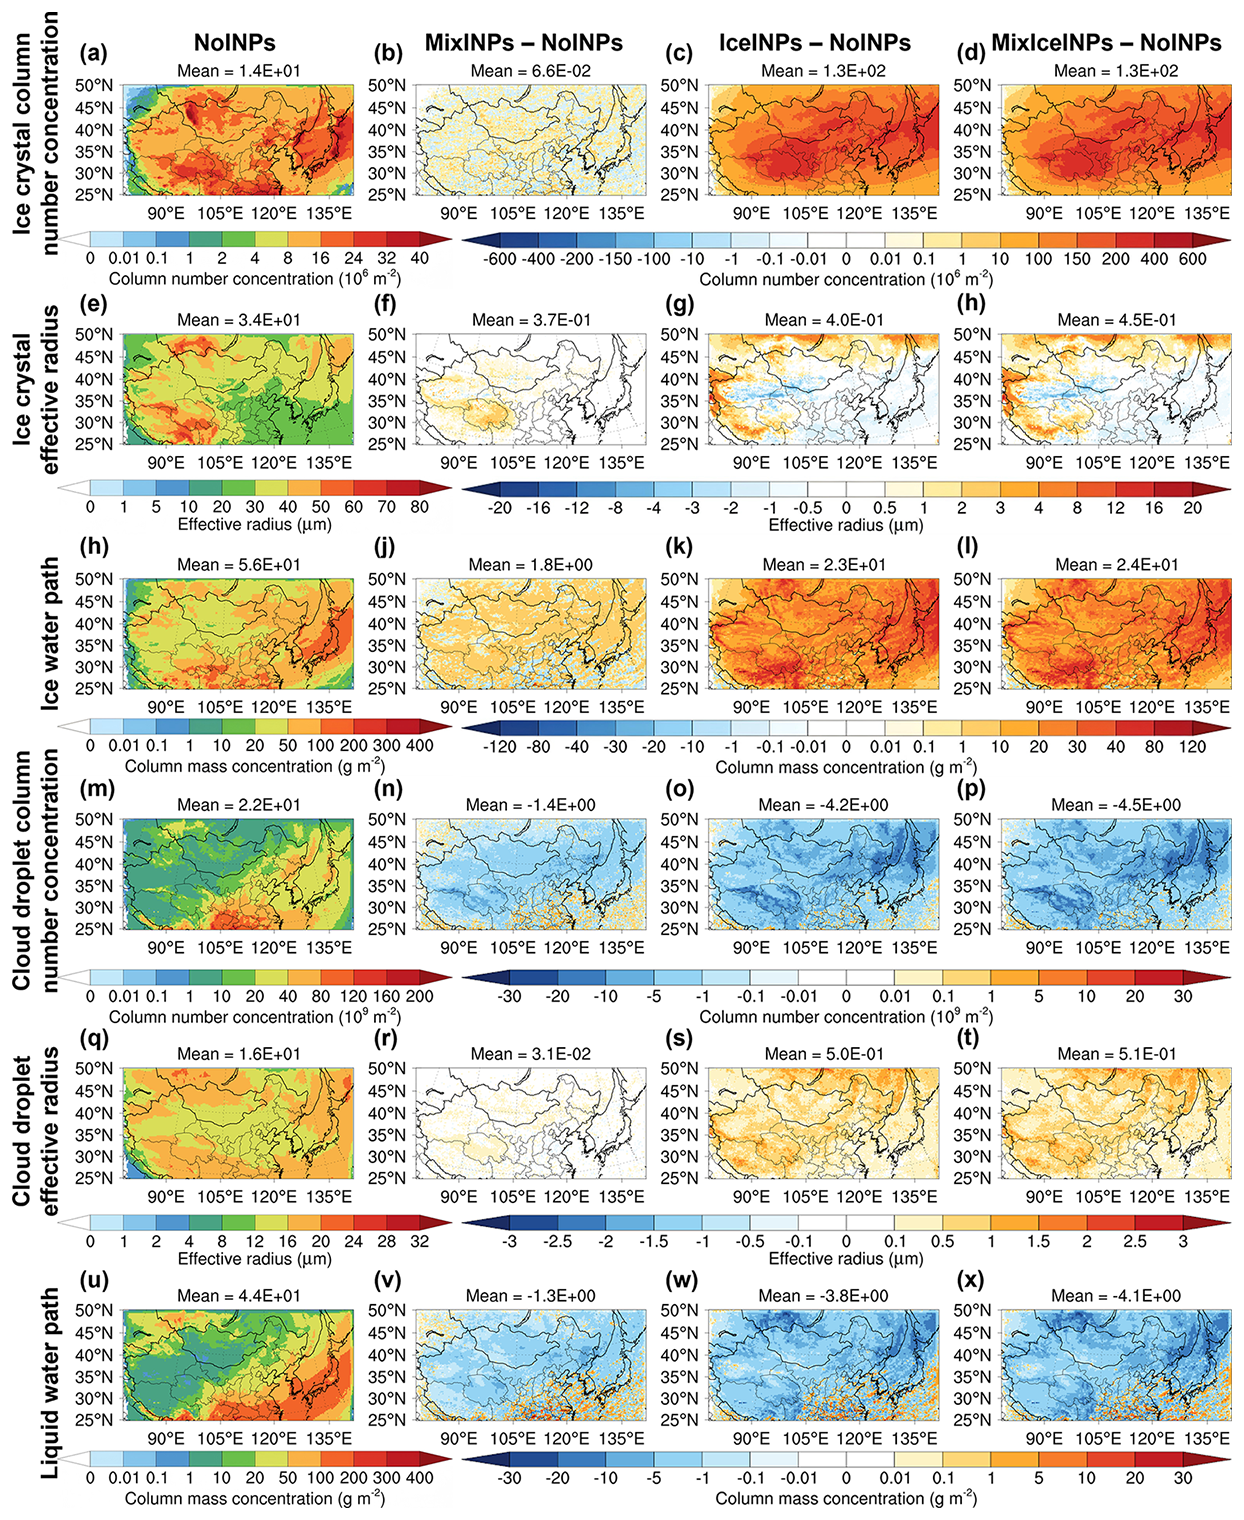
Figure 6Simulated spatial distributions of (a–d) ice crystal column number concentrations (vertically integrated), (e–h) ice crystal effective radius (vertically averaged), (i–l) ice water path, (m–p) cloud droplet column number concentrations (vertically integrated), (q-t) cloud droplet effective radius (vertically averaged), and (u–x) liquid water path, for the NoINPs (first column), MixINPs – NoINPs (second column), IceINPs – NoINPs (third column), and MixIceINPs – NoINPs (fourth column) scenarios. The mean value over the plotted region is shown above each panel. The simulated results are averages of hourly values from March to May 2018, calculated for cloud grid cells only, defined by a threshold where the sum of ice and liquid water mixing ratios exceeds 10−6 kg kg−1.
To enhance the robustness of the simulation results, monthly averages were calculated and analyzed. Figure S10 presents the horizontal monthly means of ice-phase and liquid-phase variables. Overall, the direction and magnitude of changes for each variable in individual months are consistent with the results from multi-month averages, except for the effective radius of ice crystals in May 2018. In this case, the difference between the IceINPs and NoINPs scenarios is a very small negative value, arising from compensating regional signals where the effective radius of ice crystals increases in some areas but decreases in others.
For all variables, the perturbations induced by dust INPs in ice clouds are larger than those induced by dust INPs in mixed-phase clouds. In mixed-phase clouds, the increase in ice crystal column number concentration is much smaller than the corresponding decrease in cloud droplet column number concentration; the enhancement in the effective radius of ice crystals is about one order of magnitude larger than the enhancement in cloud droplet effective radius; and the increase in IWP slightly exceeds the decrease in LWP. In contrast, for dust INPs in ice clouds, the increase in ice crystal column number concentration is greater than the decrease in cloud droplet column number concentration, the increase in the effective radius of ice crystals is slightly larger than the increase in cloud droplet effective radius, and the increase in IWP clearly exceeds the decrease in LWP. These findings are consistent with the results reported by Su and Fung (2018b).
3.2.3 Impacts of dust INPs on radiation
The radiative effects of dust INPs in mixed-phase and ice clouds at the top of the atmosphere are shown in Fig. 7. For the MixINPs scenario, shortwave radiation over the simulated region increases by an average of 0.35 W m−2, longwave radiation decreases by an average of 0.15 W m−2, and net radiation increases by an average of 0.20 W m−2. The presence of dust INPs in mixed-phase clouds accelerates the WBF process, leading to more numerous and larger ice crystals, fewer cloud droplets, and a larger cloud droplet mean radius. These changes reduce cloud albedo, allowing more shortwave radiation to enter and more longwave radiation to escape. Because the increase in shortwave radiation exceeds the decrease in longwave radiation, the net effect is an increase in net radiation. The radiative effect of dust INPs in mixed-phase clouds found here contrasts with the results of Shi and Liu (2019) and Kawai et al. (2021), where increases in low-cloud fraction and decreases in droplet radius offset the shortwave response to reduced LWP. In this study, no such changes in low-cloud fraction or droplet radius are evident.
For the IceINPs scenario, shortwave radiation decreases by an average of 5.73 W m−2, longwave radiation increases by an average of 9.29 W m−2, and net radiation increases by an average of 3.56 W m−2. Dust INPs in ice clouds enhance heterogeneous nucleation, producing more ice crystals with a smaller radius and higher ice water content. These processes intensify ice cloud formation, resulting in greater reflection of shortwave radiation to space and stronger trapping of longwave radiation within the atmosphere. Because the longwave effect dominates, the net radiation increases, strengthening the warming effect of ice clouds. This behavior reflects the Twomey effect and leads to a radiative response opposite to the globally averaged results reported by Liu et al. (2012), Kuebbeler et al. (2014), and Beer et al. (2024).
Monthly calculations (Fig. S11) show radiative effects with consistent sign and magnitude compared to the three-month averages, confirming the robustness of our simulation results.
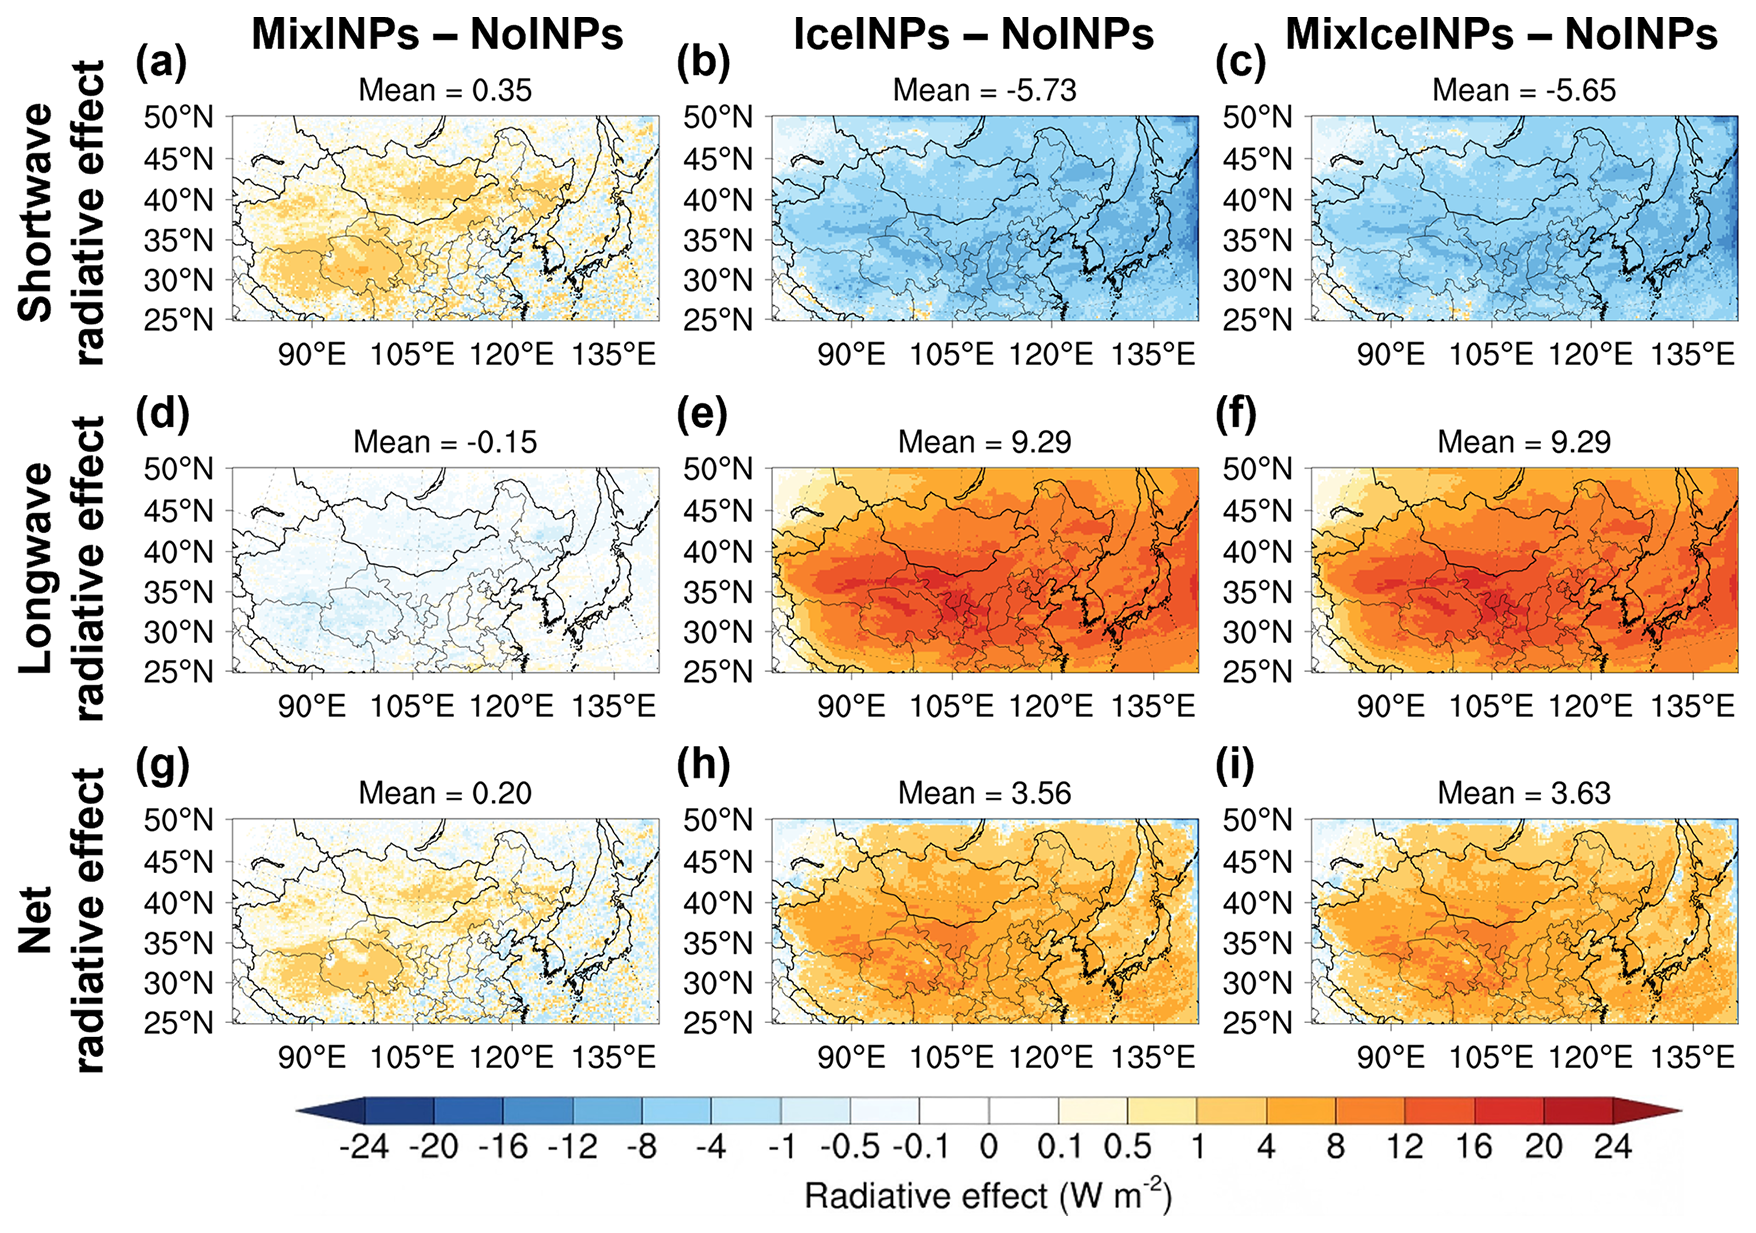
Figure 7Simulated spatial distributions of (a–c) shortwave radiative effect, (d–f) longwave radiative effect, and (g–i) net radiative effect of dust INPs at the top of the atmosphere (left column: MixINPs – NoINPs; middle column: IceINPs – NoINPs; right column: MixIceINPs – NoINPs). The mean value over the plotted region is shown above each panel. The simulated results are averages of hourly values from March to May 2018.
3.2.4 Comparison of INP parameterization schemes
The meridional averaged vertical cross-section differences between simulations employing the DeMott2015 and Reicher2019 schemes for mixed-phase clouds and those employing the Chen2021 scheme are presented (Fig. 8). Simulations with DeMott2015 produced higher dust INP concentrations than Chen2021, particularly between the −20 and −40 °C isotherms, with an average increase by a factor of 2.3. Consistently, DeMott2015 yielded higher ice water content (mean: 7.9 × 10⁻² mg m−3) and lower liquid water content (mean: 6.0 × 10⁻² mg m−3) compared to Chen2021, suggesting enhanced activity of the WBF process and stronger liquid-to-ice conversion due to elevated INP concentrations. Notably, the mean liquid water content difference between DeMott2015 and Chen2021 (−6.0 × 10⁻² mg m−3) is comparable to that between Chen2021 and simulations without dust INPs (MixINPs – NoINPs; Fig. 5v; −1.0 × 10⁻¹ mg m−3), underscoring that the choice of parameterization can induce differences as large as the inclusion or exclusion of dust INPs.
In contrast, Reicher2019 produced lower dust INP concentrations than Chen2021 between the 0 and −20 °C isotherms, but higher concentrations at temperatures below −20 °C. The underestimation in the warmer temperature range is consistent with evaluation against observations (Fig. 2a). Since most laboratory INP measurements are performed at relatively high temperatures (Jiang et al., 2016; Reicher et al., 2019; Chen et al., 2021), the reversed trend below −20 °C highlights the need for additional measurements at lower temperatures. Reduced INP concentrations in the 0 to −20 °C range weakened the WBF process in Reicher2019, leading to higher liquid water content relative to Chen2021.
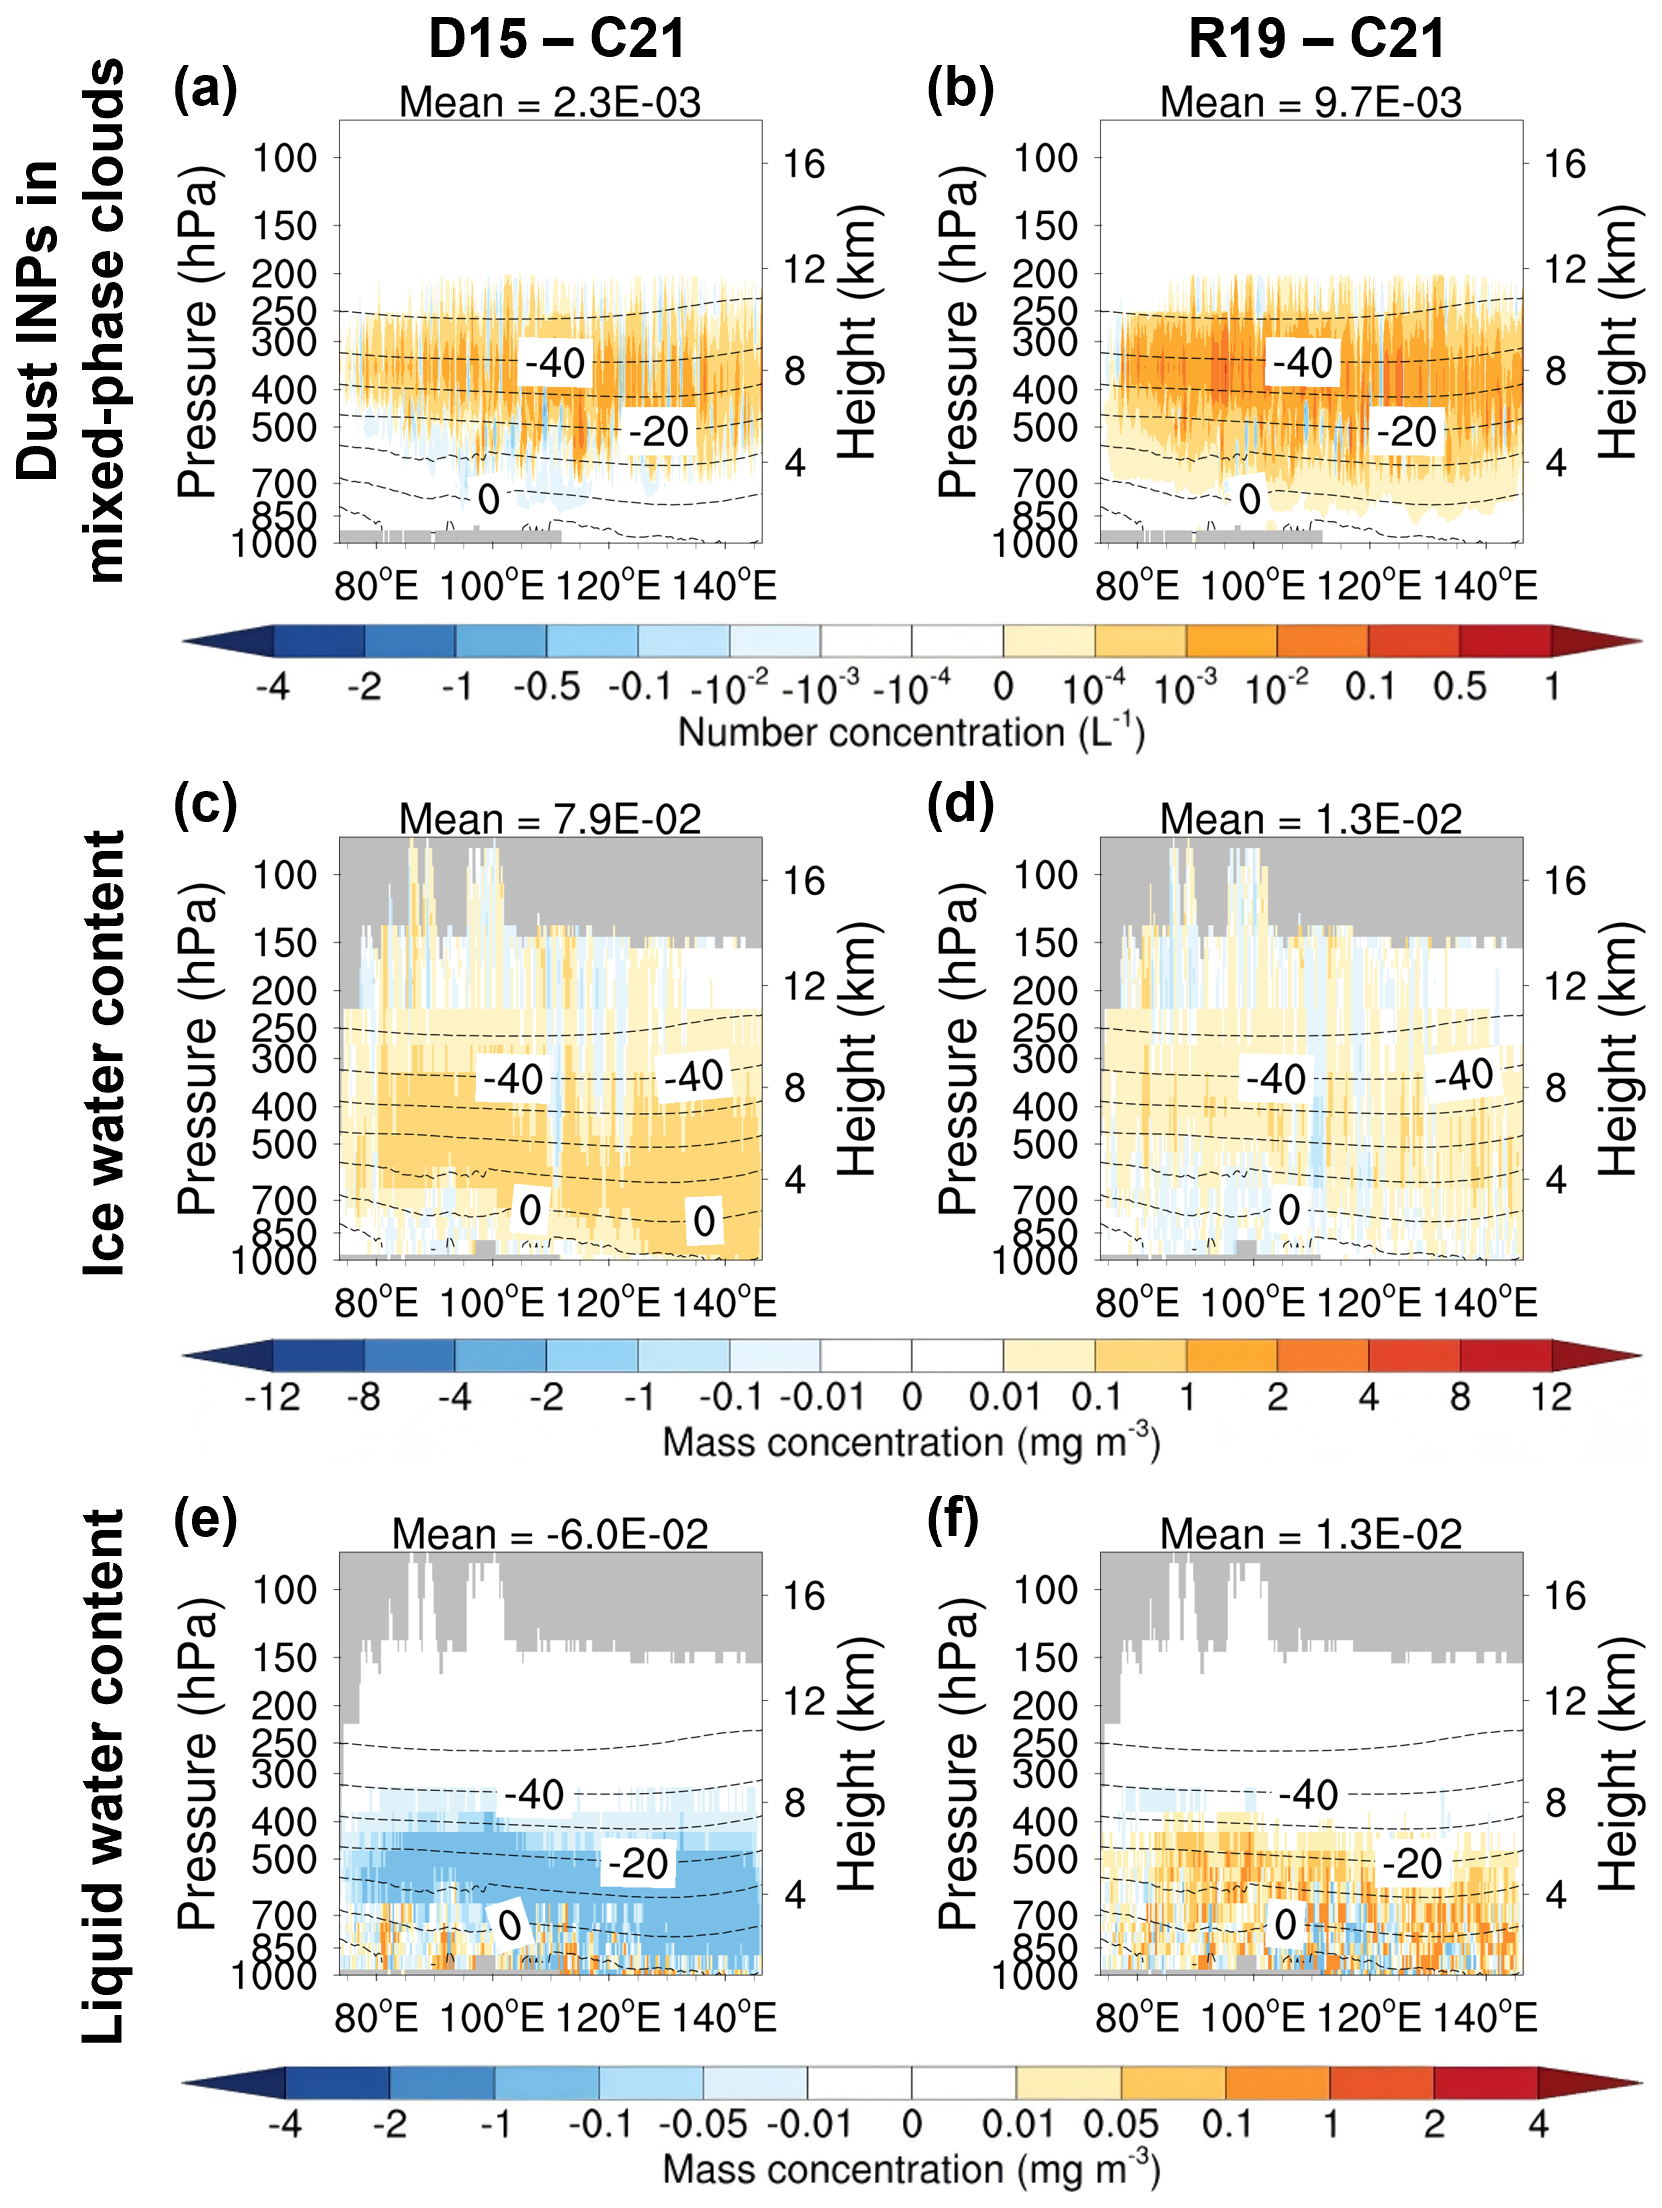
Figure 8Simulated meridional mean vertical cross-sections of (a–b) dust INPs in mixed-phase clouds, (c–d) ice water content, and (e–f) liquid water content. The left column shows differences between the MixINPs_DeMott2015 scenario (DeMott2015, D15) and the MixINPs scenario (Chen2021, C21), and the right column shows differences between the MixINPs_Reicher2019 scenario (Reicher2019, R19) and the MixINPs scenario (Chen2021, C21). Dashed lines indicate isotherms, and grey shading denotes missing values due to terrain or filtering of non-cloud grid cells (where the sum of ice and liquid water mixing ratios is less than 10−6 kg kg−1). The mean value over the plotted region is shown above each panel. The simulated results are averages of hourly values from March to May 2018.
The horizontal distribution differences for the same sets of simulations are presented in Fig. 9. Consistent with the vertical sections, DeMott2015 produced higher INP concentrations, higher ice water path, and lower liquid water path than Chen2021, reaffirming enhanced ice formation through the WBF process. These differences ultimately resulted in a net top-of-atmosphere radiative forcing difference of 0.18 W m−2 between DeMott2015 and Chen2021, comparable to the forcing difference between Chen2021 and the NoINPs scenario (MixINPs – NoINPs; Fig. 7g; 0.2 W m−2). Larger differences in INPs, cloud water paths, and radiative effects were found downwind of dust source regions (e.g., from eastern China to Japan), indicating that non-size-resolved parameterizations such as DeMott2015 may overestimate the ice-nucleating ability of finer dust particles and hence their downwind impacts. In contrast, the opposing tendencies in Reicher2019 at temperatures above and below −20 °C largely offset each other, resulting in minimal net impacts on clouds and radiation.
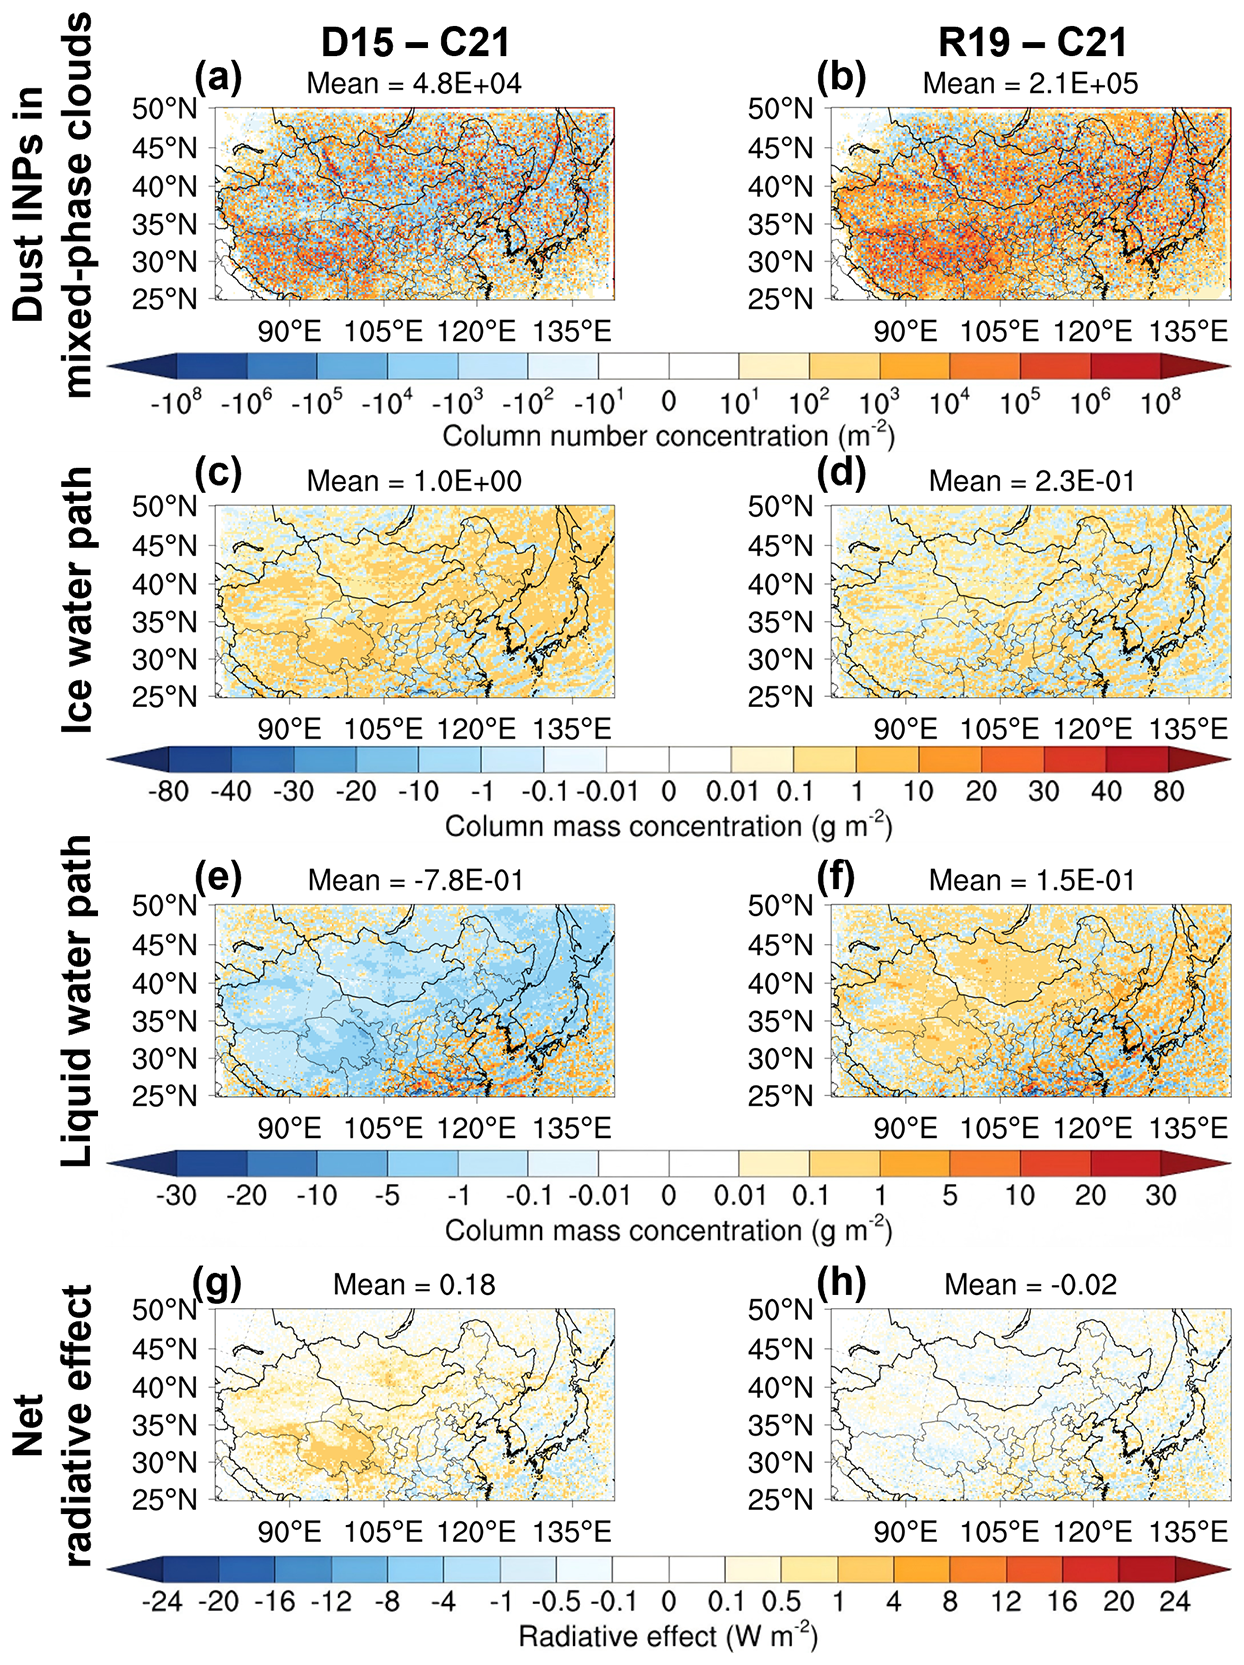
Figure 9Simulated spatial distributions of (a–b) dust INP column number concentrations (vertically integrated) in mixed-phase clouds, (c–d) ice water path, (e–f) liquid water path, and (g–h) net radiative effect at the top of the atmosphere. The left column shows differences between the MixINPs_DeMott2015 scenario (DeMott2015, D15) and the MixINPs scenario (Chen2021, C21), and the right column shows differences between the MixINPs_Reicher2019 scenario (Reicher2019, R19) and the MixINPs scenario (Chen2021, C21). The mean value over the plotted region is shown above each panel. The simulated results are averages of hourly values from March to May 2018.
3.2.5 Sensitivity to subgrid vertical velocity parameterization
The relatively low concentration of ice crystals formed through homogeneous nucleation raises the question of whether this behavior is influenced by the representation of subgrid vertical velocity. To examine this, we conducted an additional sensitivity experiment using an alternative parameterization based on turbulent kinetic energy (TKE), following Morrison and Pinto (2005). The subgrid vertical velocity is parameterized as , where TKE is provided by the PBL scheme. Compared to the eddy-diffusivity-based formulation used in the base simulation, the TKE-based approach generally produces stronger vertical velocity fluctuations, as supported by the simulated subgrid vertical velocity in Fig. S12. Previous studies have shown that such parameterizations may even lead to overestimation of ice crystal number concentrations due to enhanced supersaturation (Zhou et al., 2016). Therefore, this experiment provides a useful upper-bound test for the role of subgrid vertical velocity in controlling homogeneous nucleation.
The sensitivity experiments were conducted for May 2018, rather than the entire spring season (March–May), for two reasons: (1) The results for May are representative of the entire spring season, as demonstrated by the similarity between the May and spring averages (Figs. 3 and S13, 5 and S15, and 6 and S17). (2) Limiting the simulation to May reduced computational costs while maintaining the robustness of the results.
Despite the stronger subgrid vertical velocities in the TKE-based simulation, the overall results remain qualitatively consistent with the base case (Figs. S13 and S14, S15 and S16, and S17 and S18). Homogeneous nucleation still contributes much less to ice crystal number concentrations than heterogeneous nucleation, and the occurrence frequency of homogeneous nucleation remains low.
These results suggest that the limited contribution of homogeneous nucleation is not primarily controlled by weak vertical velocities, but rather by the infrequent occurrence of sufficiently high ice supersaturation conditions. This is consistent with the fact that homogeneous nucleation requires ice supersaturation exceeding a critical threshold (typically > 1.3), which is rarely achieved in the simulated conditions. Furthermore, the relatively low frequency of high ice supersaturation is consistent with the climate characteristics of the dust regions of East Asia in spring, where dry conditions prevail (Gerelmaa et al., 2015).
3.2.6 Microphysical process analysis
To further elucidate the mechanisms underlying the simulated cloud responses, we analyze key microphysical process rates associated with the WBF process and ice crystal sedimentation.
The Morrison microphysics scheme does not provide a direct diagnostic of the WBF process. Instead, the process is implicitly represented through the combined effects of cloud droplet evaporation and vapor deposition. To quantify the WBF process, we diagnose these rates under conditions favorable for WBF (Pruppacher et al., 1998), defined as grid cells where (1) the air is supersaturated with respect to ice but subsaturated with respect to liquid water, (2) temperature ranges between −37 and 0 °C, and (3) cloud droplets and ice crystals coexist.
Figure S19 shows that, in the MixINPs scenario, both cloud droplet evaporation and vapor deposition rates increase markedly compared to the NoINPs scenario, particularly within the −20 to 0 °C temperature range. The comparable enhancement of these two rates indicates an accelerated transfer of water from the liquid phase to the ice phase, providing direct evidence of an enhanced WBF process due to dust-induced ice nucleation. Nevertheless, the quantitative strength of the simulated WBF process remains subject to uncertainties in cloud microphysics parameterizations (Omanovic et al., 2024). These process-rate diagnostics support the occurrence and relative strengthening of the WBF process among the simulations, but observational constraints are still required to evaluate the absolute magnitude of this response.
To examine sedimentation effects, we analyze the ice crystal sedimentation flux (Fig. S20). In the IceINPs scenario, regions of enhanced sedimentation flux are collocated with areas of increased ice crystal number concentration compared to the NoINPs scenario (Fig. 5c). Below these regions, the increase in sedimentation flux is relatively weaker, suggesting that part of the sedimenting ice crystals is retained within the mixed-phase cloud layer. This leads to an accumulation of ice crystals in mixed-phase clouds, which further enhances ice number concentrations and promotes the WBF process, as supported by the diagnosed cloud droplet evaporation and vapor deposition rates in Fig. S19b and e.
To investigate how dust ice-nucleating particles (INPs) in mixed-phase and ice clouds modulate cloud microphysical processes and radiative effects, we conducted WRF-Chem simulations over East Asia during spring 2018, using a newly developed dust INP parameterization that explicitly accounts for dust INPs in mixed-phase and ice clouds. Three aerosol-aware parameterizations for dust INPs in mixed-phase clouds were evaluated. Among them, the widely used, non-size-resolved DeMott et al. (2015) scheme predicts INP concentrations about one order of magnitude higher than the size-resolved Chen et al. (2021) scheme at a typical urban site affected by East Asian dust transport, likely due to an overrepresentation of the ice-forming efficiency of smaller dust particles (< 5.6 µm). For ice clouds, the Barahona and Nenes (2009) parameterization provided predictions consistent with available observations.
Our results indicate that dust INPs in mixed-phase clouds trigger ice formation, thereby accelerating the WBF process and enhancing the conversion of hydrometeors from liquid to ice phase. This process increases the number and effective radius of ice crystals, while decreasing the number concentration of cloud droplets and slightly increasing their mean effective radius. Consequently, the IWP increases by 3.2 % while the LWP decreases by 2.9 %. These microphysical changes lead to a reduction in cloud albedo, allowing more shortwave radiation to enter the atmosphere (0.35 W m−2) and more longwave radiation to escape (0.15 W m−2), resulting in a net radiation increase of 0.20 W m−2.
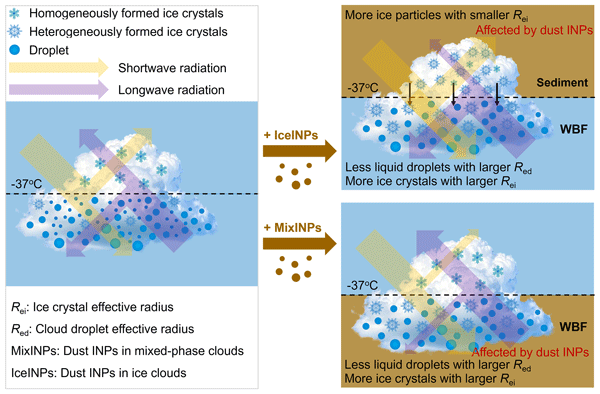
Dust INPs in ice clouds substantially enhance heterogeneous nucleation, producing approximately 22 times more ice crystals than homogeneous nucleation in the absence of INPs. The presence of dust INP increases the number concentration of ice particles but reduces their effective radius within ice clouds. Sedimentation of ice particles from ice clouds into underlying mixed-phase clouds further accelerates the WBF process, leading to an increase in number and effective radius of ice particles, a reduction in cloud droplet number concentration, and a slight enlargement of droplet mean effective radius. Overall, the IWP increases by 41.1 % whereas the LWP decreases by 8.6 %. This pronounced enhancement of ice cloud development strengthens both the shortwave reflection to space (5.73 W m−2) and longwave radiation back to the surface (9.29 W m−2). As the longwave effect dominates, the net radiative flux increases by 3.56 W m−2, indicating a notable warming effect. The overall impacts of dust INPs in mixed-phase and ice clouds on cloud properties and radiation are summarized in Fig. 10.
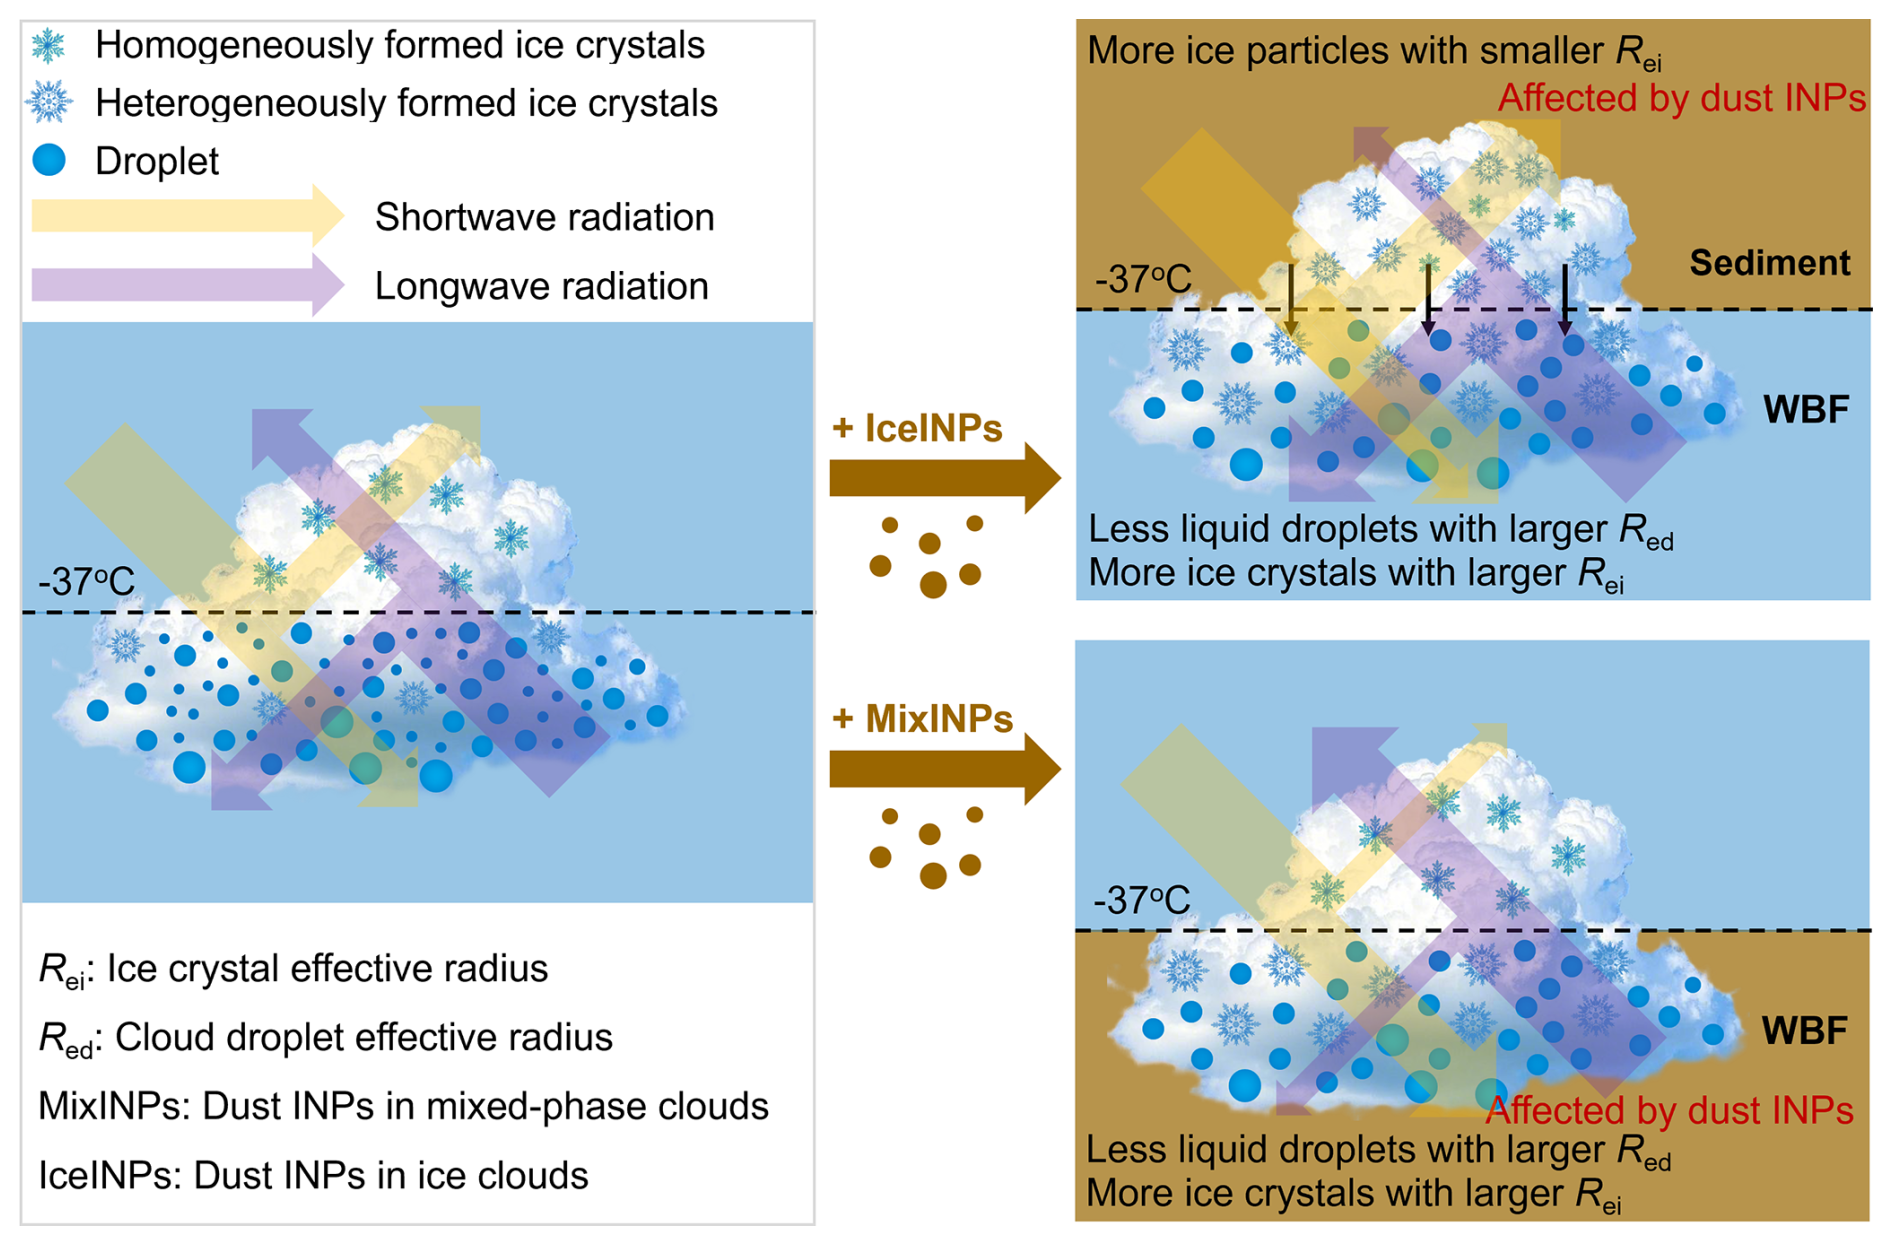
Figure 10Schematic of the effects of dust INPs in mixed-phase and ice clouds on clouds and radiation. Dust INPs in mixed-phase clouds enhance the Wegener–Bergeron–Findeisen (WBF) process, producing fewer but larger droplets and more, larger ice crystals, which reduce shortwave albedo, increase longwave transmittance, and lead to a net warming effect. In ice clouds, dust INPs intensify heterogeneous nucleation, generating more but smaller ice crystals; their sedimentation further enhances the WBF process in mixed-phase clouds. The much stronger changes in ice clouds amplify the warming effect, dominated by longwave radiation, resulting in an overall net warming.
Our results demonstrate that the variability among mixed-phase cloud INP parameterizations is comparable to the difference between simulations with and without INPs, highlighting the need for further evaluation to constrain inter-scheme uncertainties. The widely used non-size-resolved DeMott et al. (2015) scheme tends to overestimate the ice-nucleating efficiency of fine dust particles, potentially exaggerating the downwind impacts of dust INPs on cloud properties and radiation. In addition, the reversed trends among schemes at temperatures below −20 °C underscore the importance of extending INP measurements to colder conditions, thereby enabling the development of parameterizations applicable across a broader temperature range.
It should be noted that this study focuses exclusively on mineral dust as the source of INPs. The simulations were conducted for spring over East Asia, a period characterized by frequent dust outbreaks originating from the Taklimakan and Gobi deserts. Under these conditions, mineral dust is expected to dominate the regional INP population and therefore represents the primary driver of heterogeneous ice nucleation in the simulated environment. Nevertheless, other aerosol types such as biological particles or biomass-burning smoke may also contribute to ice nucleation under different environmental conditions or during other seasons. Their potential roles should therefore be investigated in future studies.
This study elucidates the distinct effects of dust INPs in the mixed-phase and ice clouds on cloud microphysical properties and radiation, highlighting the underlying microphysical mechanisms. These finding advance our understanding of aerosol–cloud–climate interactions and provide a foundation for improving the accuracy of climate model projections. Looking ahead, future studies could investigate how climate change and land use changes (such as afforestation) might alter vegetation cover, soil moisture, and wind speed, which in turn affect dust emission. These changes in dust emissions would likely influence cloud properties and radiative effects through dust-cloud interactions, offering an important area for further research in the context of regional climate impacts in East Asia and surrounding regions.
The source data used to generate all figures in this study have been archived in a Zenodo repository and are currently accessible at https://doi.org/10.5281/zenodo.19113407 (Zhang et al., 2026). The model used in this study is based on the official release of WRF-Chem v4.2, which is publicly accessible at https://github.com/wrf-model/WRF/tree/release-v4.2 (last access: 27 August 2026). Additional developments, including the implementation of dust emission schemes and aerosol-aware ice nucleation parameterizations, were carried out based on the WRF-Chem framework as described in Sect. 2. The modified model code is available upon request from the corresponding author.
The supplement related to this article is available online at https://doi.org/10.5194/acp-26-12329-2026-supplement.
HZ and BZ designed the research; HZ, BZ, JS, DG, DY, YH, XZ, and SC improved the WRF-Chem performance; HZ and BZ performed the WRF-Chem simulations; JC and HJ processed the observed data of ice-nucleating particles and aerosol number size distribution; SL and ZD processed the anthropogenic emissions; HZ analyzed the data with help from BZ and XZ; ZL and MP helped to design some figures; SW, ZW, YY, DL, MS, and JHJ presented important suggestions for the analysis and writings; HZ and BZ wrote the paper with input from all the co-authors.
At least one of the (co-)authors is a member of the editorial board of Atmospheric Chemistry and Physics. The peer-review process was guided by an independent editor, and the authors also have no other competing interests to declare.
Publisher's note: Copernicus Publications remains neutral with regard to jurisdictional claims made in the text, published maps, institutional affiliations, or any other geographical representation in this paper. The authors bear the ultimate responsibility for providing appropriate place names. Views expressed in the text are those of the authors and do not necessarily reflect the views of the publisher.
This research is funded by National Natural Science Foundation of China (grant no. 42275110). It is also supported by the Center of High Performance Computing, Tsinghua University. Manish Shrivastava acknowledges support from the US Department of Energy (DOE) Biological and Environmental Research (BER) through its Atmospheric System Research (ASR) program. The Pacific Northwest National Laboratory is operated by Battelle Memorial Institute for the US DOE under Contract DE-AC05-76RL01830.
This research has been supported by the National Natural Science Foundation of China (grant no. 42275110). Manish Shrivastava acknowledges support from the US Department of Energy (DOE) Biological and Environmental Research (BER) through its Atmospheric System Research (ASR) program. The Pacific Northwest National Laboratory is operated by Battelle Memorial Institute for the US DOE under Contract DE-AC05-76RL01830.
This paper was edited by Martina Krämer and reviewed by two anonymous referees.
Ansmann, A., Mamouri, R.-E., Bühl, J., Seifert, P., Engelmann, R., Hofer, J., Nisantzi, A., Atkinson, J. D., Kanji, Z. A., Sierau, B., Vrekoussis, M., and Sciare, J.: Ice-nucleating particle versus ice crystal number concentrationin altocumulus and cirrus layers embedded in Saharan dust:a closure study, Atmos. Chem. Phys., 19, 15087–15115, https://doi.org/10.5194/acp-19-15087-2019, 2019.
Ansmann, A., Jimenez, C., Roschke, J., Bühl, J., Ohneiser, K., Engelmann, R., Radenz, M., Griesche, H., Hofer, J., Althausen, D., Knopf, D. A., Dahlke, S., Gaudek, T., Seifert, P., and Wandinger, U.: Impact of wildfire smoke on Arctic cirrus formation – Part 1: Analysis of MOSAiC 2019–2020 observations, Atmos. Chem. Phys., 25, 4847–4866, https://doi.org/10.5194/acp-25-4847-2025, 2025a.
Ansmann, A., Jimenez, C., Knopf, D. A., Roschke, J., Bühl, J., Ohneiser, K., and Engelmann, R.: Impact of wildfire smoke on Arctic cirrus formation – Part 2: Simulation of MOSAiC 2019–2020 cases, Atmos. Chem. Phys., 25, 4867–4884, https://doi.org/10.5194/acp-25-4867-2025, 2025b.
Barahona, D. and Nenes, A.: Parameterizing the competition between homogeneous and heterogeneous freezing in ice cloud formation – polydisperse ice nuclei, Atmos. Chem. Phys., 9, 5933–5948, https://doi.org/10.5194/acp-9-5933-2009, 2009.
Beer, C. G., Hendricks, J., and Righi, M.: Impacts of ice-nucleating particles on cirrus clouds and radiation derived from global model simulations with MADE3 in EMAC, Atmos. Chem. Phys., 24, 3217–3240, https://doi.org/10.5194/acp-24-3217-2024, 2024.
Bi, Y., Cao, B., and Li, T.: Enhanced heterogeneous ice nucleation by special surface geometry, Nat. Commun., 8, 15372, https://doi.org/10.1038/ncomms15372, 2017.
Bigg, E. K.: The formation of atmospheric ice crystals by the freezing of droplets, Q. J. Roy. Meteor. Soc., 79, 510–519, https://doi.org/10.1002/qj.49707934207, 1953.
Boose, Y., Sierau, B., García, M. I., Rodríguez, S., Alastuey, A., Linke, C., Schnaiter, M., Kupiszewski, P., Kanji, Z. A., and Lohmann, U.: Ice nucleating particles in the Saharan Air Layer, Atmos. Chem. Phys., 16, 9067–9087, https://doi.org/10.5194/acp-16-9067-2016, 2016.
Burrows, S. M., McCluskey, C. S., Cornwell, G., Steinke, I., Zhang, K., Zhao, B., Zawadowicz, M., Raman, A., Kulkarni, G., China, S., Zelenyuk, A., and DeMott, P. J.: Ice‐nucleating particles that impact clouds and climate: Observational and modeling research needs, Rev. Geophys., 60, e2021RG000745, https://doi.org/10.1029/2021RG000745, 2022.
Cantrell, W. and Heymsfield, A.: Production of ice in tropospheric clouds: A review, B. Am. Meteorol. Soc., 86, 795–808, https://doi.org/10.1175/BAMS-86-6-795, 2005.
Carter, W.: Documentation of the SAPRC-99 chemical mechanism for VOC reactivity assessment, Final Report to California Air Resources Board, Contracts No. 92-329 and 95-308, University of California, Riverside, Riverside, California, USA, Zenodo, https://doi.org/10.5281/zenodo.12600705, 2000.
Chen, F. and Mitchell, K.: Using the GEWEX-ISLSCP forcing data to simulate global soil moisture fields and hydrological cycle for 1987–1988, J. Meteorol. Soc. Jpn., II, 77, 167–182, https://doi.org/10.2151/jmsj1965.77.1B_167, 1999.
Chen, J., Wu, Z., Chen, J., Reicher, N., Fang, X., Rudich, Y., and Hu, M.: Size-resolved atmospheric ice-nucleating particles during East Asian dust events, Atmos. Chem. Phys., 21, 3491–3506, https://doi.org/10.5194/acp-21-3491-2021, 2021.
Chen, S., Zhao, C., Qian, Y., Leung, L. R., Huang, J., Huang, Z., Bi, J., Zhang, W., Shi, J., Yang, L., Li, D., and Li, J.: Regional modeling of dust mass balance and radiative forcing over East Asia using WRF-Chem, Aeolian Res., 15, 15–30, https://doi.org/10.1016/j.aeolia.2014.02.001, 2014.
Cooper, W. A.: Ice initiation in natural clouds, in: Precipitation Enhancement – A Scientific Challenge, American Meteorological Society, Boston, MA, 29–32, https://doi.org/10.1007/978-1-935704-17-1_4, 1986.
Cornwell, G. C., McCluskey, C. S., Hill, T. C. J., Levin, E. T., Rothfuss, N. E., Tai, S.-L., Petters, M. D., DeMott, P. J., Kreidenweis, S., Prather, K. A., and Burrows, S. M.: Bioaerosols are the dominant source of warm-temperature immersion-mode INPs and drive uncertainties in INP predictability, Sci. Adv., 9, eadg3715, https://doi.org/10.1126/sciadv.adg3715, 2023.
DeMott, P. J., Prenni, A. J., Liu, X., Kreidenweis, S. M., Petters, M. D., Twohy, C. H., Richardson, M. S., Eidhammer, T., and Rogers, D. C.: Predicting global atmospheric ice nuclei distributions and their impacts on climate, P. Natl. Acad. Sci. USA, 107, 11217–11222, https://doi.org/10.1073/pnas.0910818107, 2010.
DeMott, P. J., Prenni, A. J., McMeeking, G. R., Sullivan, R. C., Petters, M. D., Tobo, Y., Niemand, M., Möhler, O., Snider, J. R., Wang, Z., and Kreidenweis, S. M.: Integrating laboratory and field data to quantify the immersion freezing ice nucleation activity of mineral dust particles, Atmos. Chem. Phys., 15, 393–409, https://doi.org/10.5194/acp-15-393-2015, 2015.
Donner, L. J., O'Brien, T. A., Rieger, D., Vogel, B., and Cooke, W. F.: Are atmospheric updrafts a key to unlocking climate forcing and sensitivity?, Atmos. Chem. Phys., 16, 12983–12992, https://doi.org/10.5194/acp-16-12983-2016, 2016.
Gao, M., Han, Z., Tao, Z., Li, J., Kang, J.-E., Huang, K., Dong, X., Zhuang, B., Li, S., Ge, B., Wu, Q., Lee, H.-J., Kim, C.-H., Fu, J. S., Wang, T., Chin, M., Li, M., Woo, J.-H., Zhang, Q., Cheng, Y., Wang, Z., and Carmichael, G. R.: Air quality and climate change, Topic 3 of the Model Inter-Comparison Study for Asia Phase III (MICS-Asia III) – Part 2: aerosol radiative effects and aerosol feedbacks, Atmos. Chem. Phys., 20, 1147–1161, https://doi.org/10.5194/acp-20-1147-2020, 2020.
Gerelmaa, D., Liu, G.-R., Kuo, T.-H., and Lin, T.-H.: Analysis of aerosol properties coupled with meteorological parameters over east Asia, Terr. Ocean. Atmos. Sci., 26, 301, https://doi.org/10.3319/TAO.2014.12.03.01(A), 2015.
Ghan, S. J., Leung, L. R., Easter, R. C., and Abdul-Razzak, H.: Prediction of cloud droplet number in a general circulation model, J. Geophys. Res.-Atmos., 102, 21777–21794, https://doi.org/10.1029/97JD01810, 1997.
Grell, G. A. and Freitas, S. R.: A scale and aerosol aware stochastic convective parameterization for weather and air quality modeling, Atmos. Chem. Phys., 14, 5233–5250, https://doi.org/10.5194/acp-14-5233-2014, 2014.
Grell, G. A., Peckham, S. E., Schmitz, R., McKeen, S. A., Frost, G., Skamarock, W. C., and Eder, B.: Fully coupled “online” chemistry within the WRF model, Atmos. Environ., 39, 6957–6975, https://doi.org/10.1016/j.atmosenv.2005.04.027, 2005.
Gultepe, I. and Heymsfield, A. J.: Introduction ice fog, ice clouds, and remote sensing, Pure Appl. Geophys., 173, 2977–2982, https://doi.org/10.1007/s00024-016-1380-2, 2016.
He, Y., Seifert, P., Jimenez, C., Radenz, M., Ansmann, A., Bühl, J., Mamouri, R.-E., and Barja González, B.: Response of mixed-phase cloud microphysics to aerosol perturbations at the contrasting sites of Limassol, Cyprus, and Punta Arenas, Chile, J. Geophys. Res.-Atmos., 130, e2024JD043157, https://doi.org/10.1029/2024JD043157, 2025.
Hines, K. M., Bromwich, D. H., Wang, S.-H., Silber, I., Verlinde, J., and Lubin, D.: Microphysics of summer clouds in central West Antarctica simulated by the Polar Weather Research and Forecasting Model (WRF) and the Antarctic Mesoscale Prediction System (AMPS), Atmos. Chem. Phys., 19, 12431–12454, https://doi.org/10.5194/acp-19-12431-2019, 2019.
Hoinka, K. P.: Statistics of the global tropopause pressure, Mon. Weather Rev., 126, 3303–3325, https://doi.org/10.1175/1520-0493(1998)126<3303:SOTGTP>2.0.CO;2, 1998.
Holden, M. A., Whale, T. F., Tarn, M. D., O'Sullivan, D., Walshaw, R. D., Murray, B. J., Meldrum, F. C., and Christenson, H. K.: High-speed imaging of ice nucleation in water proves the existence of active sites, Sci. Adv., 5, eaav4316, https://doi.org/10.1126/sciadv.aav4316, 2019.
Hong, S.-Y., Noh, Y., and Dudhia, J.: A new vertical diffusion package with an explicit treatment of entrainment processes, Mon. Weather Rev., 134, 2318–2341, https://doi.org/10.1175/MWR3199.1, 2006.
Hoose, C., Lohmann, U., Erdin, R., and Tegen, I.: The global influence of dust mineralogical composition on heterogeneous ice nucleation in mixed-phase clouds, Environ. Res. Lett., 3, 025003, https://doi.org/10.1088/1748-9326/3/2/025003, 2008.
Hu, Y., Wang, G., Wei, X., Zhou, F., Kattel, G., Amankwah, S. O. Y., Hagan, D. F. T., and Duan, Z.: Reconstructing long-term global satellite-based soil moisture data using deep learning method, Front. Earth Sci., 11, 1130853, https://doi.org/10.3389/feart.2023.1130853, 2023.
Iacono, M. J., Delamere, J. S., Mlawer, E. J., Shephard, M. W., Clough, S. A., and Collins, W. D.: Radiative forcing by long‐lived greenhouse gases: Calculations with the AER radiative transfer models, J. Geophys. Res.-Atmos., 113, 2008JD009944, https://doi.org/10.1029/2008JD009944, 2008.
Jiang, H., Yin, Y., Wang, X., Gao, R., Yuan, L., Chen, K., and Shan, Y.: The measurement and parameterization of ice nucleating particles in different backgrounds of China, Atmos. Res., 181, 72–80, https://doi.org/10.1016/j.atmosres.2016.06.013, 2016.
Jiménez, P. A., Dudhia, J., González-Rouco, J. F., Navarro, J., Montávez, J. P., and García-Bustamante, E.: A revised scheme for the WRF surface layer formulation, Mon. Weather Rev., 140, 898–918, https://doi.org/10.1175/MWR-D-11-00056.1, 2012.
Kanji, Z. A., Ladino, L. A., Wex, H., Boose, Y., Burkert-Kohn, M., Cziczo, D. J., and Krämer, M.: Overview of ice nucleating particles, Meteorol. Monogr., 58, 1.1–1.33, https://doi.org/10.1175/AMSMONOGRAPHS-D-16-0006.1, 2017.
Kawai, K., Matsui, H., and Tobo, Y.: High potential of asian dust to act as ice nucleating particles in mixed‐phase clouds simulated with a global aerosol‐climate model, J. Geophys. Res.-Atmos., 126, e2020JD034263, https://doi.org/10.1029/2020JD034263, 2021.
Kiselev, A., Bachmann, F., Pedevilla, P., Cox, S. J., Michaelides, A., Gerthsen, D., and Leisner, T.: Active sites in heterogeneous ice nucleation – the example of K-rich feldspars, Science, 355, 367–371, https://doi.org/10.1126/science.aai8034, 2017.
Knopf, D. A., Alpert, P. A., and Wang, B.: The role of organic aerosol in atmospheric ice nucleation: A review, ACS Earth Space Chem., 2, 168–202, https://doi.org/10.1021/acsearthspacechem.7b00120, 2018.
Koop, T., Luo, B., Tsias, A., and Peter, T.: Water activity as the determinant for homogeneous ice nucleation in aqueous solutions, Nature, 406, 611–614, https://doi.org/10.1038/35020537, 2000.
Kuebbeler, M., Lohmann, U., Hendricks, J., and Kärcher, B.: Dust ice nuclei effects on cirrus clouds, Atmos. Chem. Phys., 14, 3027–3046, https://doi.org/10.5194/acp-14-3027-2014, 2014.
Lee, J., Seifert, P., Hashino, T., Maahn, M., Senf, F., and Knoth, O.: Simulations of the impact of cloud condensation nuclei and ice-nucleating particles perturbations on the microphysics and radar reflectivity factor of stratiform mixed-phase clouds, Atmos. Chem. Phys., 24, 5737–5756, https://doi.org/10.5194/acp-24-5737-2024, 2024.
Li, S., Wang, S., Wu, Q., Zhang, Y., Ouyang, D., Zheng, H., Han, L., Qiu, X., Wen, Y., Liu, M., Jiang, Y., Yin, D., Liu, K., Zhao, B., Zhang, S., Wu, Y., and Hao, J.: Emission trends of air pollutants and CO2 in China from 2005 to 2021, Earth Syst. Sci. Data, 15, 2279–2294, https://doi.org/10.5194/essd-15-2279-2023, 2023.
Liu, X. and Penner, J. E.: Ice nucleation parameterization for global models, Meteorol. Z., 14, 499–514, https://doi.org/10.1127/0941-2948/2005/0059, 2005.
Liu, X., Xie, S., Boyle, J., Klein, S. A., Shi, X., Wang, Z., Lin, W., Ghan, S. J., Earle, M., Liu, P. S. K., and Zelenyuk, A.: Testing cloud microphysics parameterizations in NCAR CAM5 with ISDAC and M-PACE observations, J. Geophys. Res.-Atmos., 116, D00T11, https://doi.org/10.1029/2011JD015889, 2011.
Liu, X., Shi, X., Zhang, K., Jensen, E. J., Gettelman, A., Barahona, D., Nenes, A., and Lawson, P.: Sensitivity studies of dust ice nuclei effect on cirrus clouds with the Community Atmosphere Model CAM5, Atmos. Chem. Phys., 12, 12061–12079, https://doi.org/10.5194/acp-12-12061-2012, 2012.
Luo, R., Liu, Y., Luo, M., Li, D., Tan, Z., Shao, T., and Alam, K.: Dust effects on mixed-phase clouds and precipitation during a super dust storm over Northern China, Atmos. Environ., 313, 120081, https://doi.org/10.1016/j.atmosenv.2023.120081, 2023.
Meyers, M. P., DeMott, P. J., and Cotton, W. R.: New primary ice-nucleation parameterizations in an explicit cloud model, J. Appl. Meteorol., 31, 708–721, https://doi.org/10.1175/1520-0450(1992)031<0708:NPINPI>2.0.CO;2, 1992.
Morrison, H. and Gettelman, A.: A new two-moment bulk stratiform cloud microphysics scheme in the Community Atmosphere Model, Version 3 (CAM3). Part I: Description and numerical tests, J. Climate, 21, 3642–3659, https://doi.org/10.1175/2008JCLI2105.1, 2008.
Morrison, H. and Pinto, J. O.: Mesoscale modeling of springtime arctic mixed-phase stratiform clouds using a new two-moment bulk microphysics scheme, J. Atmos. Sci., 62, 3683–3704, https://doi.org/10.1175/JAS3564.1, 2005.
Morrison, H., Curry, J. A., and Khvorostyanov, V. I.: A new double-moment microphysics parameterization for application in cloud and climate models. Part I: Description, J. Atmos. Sci., 62, 1665–1677, https://doi.org/10.1175/JAS3446.1, 2005.
Murphy, D. M. and Koop, T.: Review of the vapour pressures of ice and supercooled water for atmospheric applications, Q. J. Roy. Meteor. Soc., 131, 1539–1565, https://doi.org/10.1256/qj.04.94, 2005.
Murray, B. J., O'Sullivan, D., Atkinson, J. D., and Webb, M. E.: Ice nucleation by particles immersed in supercooled cloud droplets, Chem. Soc. Rev., 41, 6519, https://doi.org/10.1039/c2cs35200a, 2012.
Nichman, L., Wolf, M., Davidovits, P., Onasch, T. B., Zhang, Y., Worsnop, D. R., Bhandari, J., Mazzoleni, C., and Cziczo, D. J.: Laboratory study of the heterogeneous ice nucleation on black-carbon-containing aerosol, Atmos. Chem. Phys., 19, 12175–12194, https://doi.org/10.5194/acp-19-12175-2019, 2019.
Niemand, M., Möhler, O., Vogel, B., Vogel, H., Hoose, C., Connolly, P., Klein, H., Bingemer, H., DeMott, P., Skrotzki, J., and Leisner, T.: A particle-surface-area-based parameterization of immersion freezing on desert dust particles, J. Atmos. Sci., 69, 3077–3092, https://doi.org/10.1175/JAS-D-11-0249.1, 2012.
Omanovic, N., Ferrachat, S., Fuchs, C., Henneberger, J., Miller, A. J., Ohneiser, K., Ramelli, F., Seifert, P., Spirig, R., Zhang, H., and Lohmann, U.: Evaluating the Wegener–Bergeron–Findeisen process in ICON in large-eddy mode with in situ observations from the CLOUDLAB project, Atmos. Chem. Phys., 24, 6825–6844, https://doi.org/10.5194/acp-24-6825-2024, 2024.
Phillips, V. T. J., Donner, L. J., and Garner, S. T.: Nucleation processes in deep convection simulated by a cloud-system-resolving model with double-moment bulk microphysics, J. Atmos. Sci., 64, 738–761, https://doi.org/10.1175/JAS3869.1, 2007.
Phillips, V. T. J., DeMott, P. J., and Andronache, C.: An empirical parameterization of heterogeneous ice nucleation for multiple chemical species of aerosol, J. Atmos. Sci., 65, 2757–2783, https://doi.org/10.1175/2007JAS2546.1, 2008.
Phillips, V. T. J., Demott, P. J., Andronache, C., Pratt, K. A., Prather, K. A., Subramanian, R., and Twohy, C.: Improvements to an empirical parameterization of heterogeneous ice nucleation and its comparison with observations, J. Atmos. Sci., 70, 378–409, https://doi.org/10.1175/JAS-D-12-080.1, 2013.
Price, H. C., Baustian, K. J., McQuaid, J. B., Blyth, A., Bower, K. N., Choularton, T., Cotton, R. J., Cui, Z., Field, P. R., Gallagher, M., Hawker, R., Merrington, A., Miltenberger, A., Neely Iii, R. R., Parker, S. T., Rosenberg, P. D., Taylor, J. W., Trembath, J., Vergara‐Temprado, J., Whale, T. F., Wilson, T. W., Young, G., and Murray, B. J.: Atmospheric ice‐nucleating particles in the dusty tropical Atlantic, J. Geophys. Res.-Atmos., 123, 2175–2193, https://doi.org/10.1002/2017JD027560, 2018.
Pruppacher, H. R., Klett, J. D., and Wang, P. K.: Microphysics of clouds and precipitation, Aerosol Sci. Technol., 28, 381–382, https://doi.org/10.1080/02786829808965531, 1998.
Reicher, N., Budke, C., Eickhoff, L., Raveh-Rubin, S., Kaplan-Ashiri, I., Koop, T., and Rudich, Y.: Size-dependent ice nucleation by airborne particles during dust events in the eastern Mediterranean, Atmos. Chem. Phys., 19, 11143–11158, https://doi.org/10.5194/acp-19-11143-2019, 2019.
Seinfeld, J. H., Bretherton, C., Carslaw, K. S., Coe, H., DeMott, P. J., Dunlea, E. J., Feingold, G., Ghan, S., Guenther, A. B., Kahn, R., Kraucunas, I., Kreidenweis, S. M., Molina, M. J., Nenes, A., Penner, J. E., Prather, K. A., Ramanathan, V., Ramaswamy, V., Rasch, P. J., Ravishankara, A. R., Rosenfeld, D., Stephens, G., and Wood, R.: Improving our fundamental understanding of the role of aerosol–cloud interactions in the climate system, P. Natl. Acad. Sci. USA, 113, 5781–5790, https://doi.org/10.1073/pnas.1514043113, 2016.
Shao, Y., Ishizuka, M., Mikami, M., and Leys, J. F.: Parameterization of size-resolved dust emission and validation with measurements, J. Geophys. Res.-Atmos., 116, D08203, https://doi.org/10.1029/2010JD014527, 2011.
Shi, X., Liu, X., and Zhang, K.: Effects of pre-existing ice crystals on cirrus clouds and comparison between different ice nucleation parameterizations with the Community Atmosphere Model (CAM5), Atmos. Chem. Phys., 15, 1503–1520, https://doi.org/10.5194/acp-15-1503-2015, 2015.
Shi, Y. and Liu, X.: Dust radiative effects on climate by glaciating mixed‐phase clouds, Geophys. Res. Lett., 46, 6128–6137, https://doi.org/10.1029/2019GL082504, 2019.
Shi, Y., Liu, X., Wu, M., Zhao, X., Ke, Z., and Brown, H.: Relative importance of high-latitude local and long-range-transported dust for Arctic ice-nucleating particles and impacts on Arctic mixed-phase clouds, Atmos. Chem. Phys., 22, 2909–2935, https://doi.org/10.5194/acp-22-2909-2022, 2022.
Storelvmo, T., Kristjánsson, J. E., Ghan, S. J., Kirkevåg, A., Seland, Ø., and Iversen, T.: Predicting cloud droplet number concentration in Community Atmosphere Model (CAM)-Oslo, J. Geophys. Res.-Atmos., 111, https://doi.org/10.1029/2005JD006300, 2006.
Su, L. and Fung, J. C. H.: Investigating the role of dust in ice nucleation within clouds and further effects on the regional weather system over East Asia – Part 1: model development and validation, Atmos. Chem. Phys., 18, 8707–8725, https://doi.org/10.5194/acp-18-8707-2018, 2018a.
Su, L. and Fung, J. C. H.: Investigating the role of dust in ice nucleation within clouds and further effects on the regional weather system over East Asia – Part 2: modification of the weather system, Atmos. Chem. Phys., 18, 11529–11545, https://doi.org/10.5194/acp-18-11529-2018, 2018b.
Sun, J., Zhang, M., and Liu, T.: Spatial and temporal characteristics of dust storms in China and its surrounding regions, 1960–1999: Relations to source area and climate, J. Geophys. Res.-Atmos., 106, 10325–10333, https://doi.org/10.1029/2000JD900665, 2001.
Tewari, M., Chen, F., Wang, W., Dudhia, J., LeMone, M. A., Mitchell, K., Ek, M., Gayno, G., Wegiel, J., and Cuenca, R. H.: Implementation and verification of the unified Noah land surface model in the WRF model, in: Proceedings of the 20th Conference on Weather Analysis and Forecasting/16th Conference on Numerical Weather Prediction, 84th American Meteorological Society (AMS) Annual Meeting, Seattle, USA, 11–15 January 2004, 2165–2170, 2004.
Textor, C., Schulz, M., Guibert, S., Kinne, S., Balkanski, Y., Bauer, S., Berntsen, T., Berglen, T., Boucher, O., Chin, M., Dentener, F., Diehl, T., Easter, R., Feichter, H., Fillmore, D., Ghan, S., Ginoux, P., Gong, S., Grini, A., Hendricks, J., Horowitz, L., Huang, P., Isaksen, I., Iversen, I., Kloster, S., Koch, D., Kirkevåg, A., Kristjansson, J. E., Krol, M., Lauer, A., Lamarque, J. F., Liu, X., Montanaro, V., Myhre, G., Penner, J., Pitari, G., Reddy, S., Seland, Ø., Stier, P., Takemura, T., and Tie, X.: Analysis and quantification of the diversities of aerosol life cycles within AeroCom, Atmos. Chem. Phys., 6, 1777–1813, https://doi.org/10.5194/acp-6-1777-2006, 2006.
Twomey, S.: Pollution and the planetary albedo, Atmos. Environ., 8, 1251–1256, https://doi.org/10.1016/0004-6981(74)90004-3, 1974.
Vali, G.: Nucleation terminology, B. Am. Meteorol. Soc., 66, 1426–1427, 1985.
Vergara‐Temprado, J., Holden, M. A., Orton, T. R., O'Sullivan, D., Umo, N. S., Browse, J., Reddington, C., Baeza‐Romero, M. T., Jones, J. M., Lea‐Langton, A., Williams, A., Carslaw, K. S., and Murray, B. J.: Is black carbon an unimportant ice‐nucleating particle in mixed‐phase clouds?, J. Geophys. Res.-Atmos., 123, 4273–4283, https://doi.org/10.1002/2017JD027831, 2018.
Villanueva, D., Stengel, M., Hoose, C., Bruno, O., Jeggle, K., Ansmann, A., and Lohmann, U.: Dust-driven droplet freezing explains cloud-top phase in the northern extratropics, Science, 389, 521–525, https://doi.org/10.1126/science.adt5354, 2025.
Wang, J., Xu, X., Henze, D. K., Zeng, J., Ji, Q., Tsay, S., and Huang, J.: Top‐down estimate of dust emissions through integration of MODIS and MISR aerosol retrievals with the GEOS‐Chem adjoint model, Geophys. Res. Lett., 39, 2012GL051136, https://doi.org/10.1029/2012GL051136, 2012.
Weger, M., Heinold, B., Engler, C., Schumann, U., Seifert, A., Fößig, R., Voigt, C., Baars, H., Blahak, U., Borrmann, S., Hoose, C., Kaufmann, S., Krämer, M., Seifert, P., Senf, F., Schneider, J., and Tegen, I.: The impact of mineral dust on cloud formation during the Saharan dust event in April 2014 over Europe, Atmos. Chem. Phys., 18, 17545–17572, https://doi.org/10.5194/acp-18-17545-2018, 2018.
Zaveri, R. A., Easter, R. C., Fast, J. D., and Peters, L. K.: Model for Simulating Aerosol Interactions and Chemistry (MOSAIC), J. Geophys. Res.-Atmos., 113, 2007JD008782, https://doi.org/10.1029/2007JD008782, 2008.
Zeng, Y., Wang, M., Zhao, C., Chen, S., Liu, Z., Huang, X., and Gao, Y.: WRF-Chem v3.9 simulations of the East Asian dust storm in May 2017: modeling sensitivities to dust emission and dry deposition schemes, Geosci. Model Dev., 13, 2125–2147, https://doi.org/10.5194/gmd-13-2125-2020, 2020.
Zeng, Y., Wang, M., Zhao, C., Zhu, Y., Rosenfeld, D., and Huang, K.: Extremely high concentrations of ice particles in East Asian Dust‐Infused Baroclinic Storm (DIBS) cirrus shield: Dominant role of dust ice nucleation effect, J. Geophys. Res.-Atmos., 128, e2022JD038034, https://doi.org/10.1029/2022JD038034, 2023.
Zhang, B., Tsunekawa, A., and Tsubo, M.: Contributions of sandy lands and stony deserts to long-distance dust emission in China and Mongolia during 2000–2006, Global Planet. Change, 60, 487–504, https://doi.org/10.1016/j.gloplacha.2007.06.001, 2008.
Zhang, D., Wang, Z., Kollias, P., Vogelmann, A. M., Yang, K., and Luo, T.: Ice particle production in mid-level stratiform mixed-phase clouds observed with collocated A-Train measurements, Atmos. Chem. Phys., 18, 4317–4327, https://doi.org/10.5194/acp-18-4317-2018, 2018.
Zhang, H., Wang, S., Zhao, X., Wu, Z., Yin, Y., Chen, S., Liu, D., Chen, J., Jiang, H., Shen, J., Gao, D., Yin, D., He, Y., Li, Z., Li, S., Dong, Z., Shrivastava, M., Jiang, J. H., Peng, M., and Zhao, B.: Data for the paper “Simulation of contrasting impacts of dust ice-nucleating particles on the evolution and radiative effects of mixed-phase and ice clouds”, Zenodo [data set], https://doi.org/10.5281/zenodo.19113407, 2026.
Zhang, L.: A size-segregated particle dry deposition scheme for an atmospheric aerosol module, Atmos. Environ., 35, 549–560, https://doi.org/10.1016/S1352-2310(00)00326-5, 2001.
Zhao, B., Wang, Y., Gu, Y., Liou, K.-N., Jiang, J. H., Fan, J., Liu, X., Huang, L., and Yung, Y. L.: Ice nucleation by aerosols from anthropogenic pollution, Nat. Geosci., 12, 602–607, https://doi.org/10.1038/s41561-019-0389-4, 2019.
Zheng, H., Cai, S., Wang, S., Zhao, B., Chang, X., and Hao, J.: Development of a unit-based industrial emission inventory in the Beijing–Tianjin–Hebei region and resulting improvement in air quality modeling, Atmos. Chem. Phys., 19, 3447–3462, https://doi.org/10.5194/acp-19-3447-2019, 2019.
Zhou, C., Penner, J. E., Lin, G., Liu, X., and Wang, M.: What controls the low ice number concentration in the upper troposphere?, Atmos. Chem. Phys., 16, 12411–12424, https://doi.org/10.5194/acp-16-12411-2016, 2016.