
the Creative Commons Attribution 4.0 License.
the Creative Commons Attribution 4.0 License.
 | 28 Aug 2026
Sea surface warming suppresses primary sea spray aerosol number production
Raymond J. Leibensperger III
Justin D. Hamlin
Jena K. Herbst
Charbel Harb
Ke'La A. Kimble
Meinrat O. Andreae
Christopher Lee
Greg Sandstrom
M. Dale Stokes
Grant B. Deane
Sea spray aerosol (SSA) influences climate through direct and indirect interactions with radiation. However, the magnitudes of these interactions remain poorly constrained, in part due to a lack of understanding of the influences of sea surface temperature (SST) on SSA production. There is no agreed-upon dependence of SSA production on SST despite numerous field, laboratory, and modelling investigations. In this study, we describe a simple theoretical framework relating the interfacial processes and contextualizing previous work. Next, we characterize the connection between SST, bubble concentrations, SSA number concentrations, and SSA emission fluxes using measurements in the Scripps Ocean-Atmosphere Research Simulator (SOARS). This isolated ocean-atmosphere interaction system incorporates wind, waves, and SST controls to produce wave breaking under realistic and controlled conditions. Increasing SST from 2 to 23 °C suppressed total subsurface bubble concentrations (between 6.17 and 830 µm) by a factor of 1.5, SSA number concentrations (between 0.008 and 20 µm) by a factor of 3, and SSA number flux by a factor of 3. Importantly, we identify size-resolved differences including a non-monotonic SST dependence of supermicron number and mass emissions. Using these trends, we derive SST-dependent number and mass emission flux correction factors for SSA source functions in climate models. These controlled wind-wave-SST experiments demonstrate that increasing SST overall suppresses SSA production. Resolving this SST dependence is critical, as it directly alters marine aerosol burdens, cloud condensation nuclei, and radiative forcing, and provides a needed constraint missing from current parameterizations.
- Article
(2962 KB) - Full-text XML
-
Supplement
(2496 KB) - BibTeX
- EndNote


Since the 1980s, global surface temperatures have increased at an estimated 0.2 °C per decade, accelerating to 0.35 °C per decade since about 2010 (Foster and Rahmstorf, 2026; Hansen et al., 2006). More than 90 % of this warming is estimated to be absorbed by the oceans, with warming concentrated at the surface (Llovel and Terray, 2016; Willis et al., 2004), altering the ocean-atmosphere interface (OAI) (Resplandy et al., 2019). Aerosols produced at the OAI play an important role in mitigating global warming directly by scattering solar radiation and indirectly by influencing the micro- and macro-physical properties of clouds (Albrecht, 1989; Haywood and Boucher, 2000; IPCC, 2023; Lohmann and Feichter, 2005; Twomey, 1980). With 71 % of Earth's surface covered by oceans, contributions from both natural and anthropogenic marine aerosols are active areas of study (Lewis and Schwartz, 2004; O'Dowd and De Leeuw, 2007; Quinn et al., 2015; Russell et al., 2023).
Sea spray aerosols (SSA) are the most ubiquitous natural marine aerosol, responsible for an estimated mass flux between 3 and 30 Pg yr−1 (Gliß et al., 2021; Grythe et al., 2014; de Leeuw et al., 2011; Lewis and Schwartz, 2004). SSA are produced during wave breaking, where air is entrained beneath the ocean surface to form bubbles. These subsurface bubbles rise and produce surface whitecaps, which emit SSA primarily through film and jet drop production (Bird et al., 2010; Brasz et al., 2018; de Leeuw et al., 2011; Lewis and Schwartz, 2004; Quinn et al., 2015). Additionally, SSA are produced when surface wind speeds exceed between 7 and 11 m s−1, wherein spume drops are ripped directly from the top of wave crests (Andreas et al., 1995; Mehta et al., 2019; Veron et al., 2012), however, this process is not the focus of the current study.
Quantifying the influence of sea surface temperature (SST) on SSA emissions has been the focus of numerous field measurements, laboratory experiments, and first-principles theories, yet no consensus has emerged. The review by Song et al. (2023) and the introductions of Markuszewski et al. (2024) and Salter et al. (2014) provide recent summaries of this literature, and with no significant advances since. A thorough comparison of previous studies (e.g., methodology, size range, and measured quantity) is beyond the scope of this paper; we therefore summarize their main findings in the Supplement (Sect. S1, Table S1). In brief, some studies report a negative correlation between SST and SSA production (Lehahn et al., 2014; Markuszewski et al., 2024; Nielsen and Bilde, 2020; Sellegri et al., 2023; Sofiev et al., 2011), others a positive correlation (Forestieri et al., 2018; Grythe et al., 2014; Hu et al., 2024; Jaeglé et al., 2011; Liu et al., 2021; Ovadnevaite et al., 2014), and still others non-monotonic relationships (Christiansen et al., 2019; Hu et al., 2024; Mårtensson et al., 2003; Saliba et al., 2019; Salter et al., 2014, 2015; Zábori et al., 2012; Zinke et al., 2022). This disagreement reflects more than a divergence in sign of a single response. Changes in SST simultaneously modifies several properties governing bubble bursting, including seawater viscosity, surface tension, and dissolved gas solubility. These properties in turn influence film and jet drop production in size-dependent ways.
The use of different breaking wave proxies in laboratory studies complicates the interpretation of results in previous studies. The importance of accurate SSA generation mechanisms cannot be overstated (Collins et al., 2014; Fuentes et al., 2010; Lewis and Schwartz, 2004; Prather et al., 2013). A fundamental limitation of previous laboratory studies, and a plausible explanation for conflicting results, is the absence of controlled winds. This study uses the Scripps Ocean-Atmosphere Research Simulator (SOARS) to control SST, wave state, and wind speed to characterize SSA emissions at varied SSTs. Previous measurements of particle number size distributions in SOARS as functions of wind speed and wave breaking intensity show good agreement with field and laboratory estimates (Leibensperger III et al., 2026b). While other previous laboratory proxies offer valuable insights into the dependence of SSA production on SST, SSA production from representative wind-wave interactions will alter bubble plumes, and thus SSA emissions. Measurements in SOARS can be used to correct simulated SSA emissions in Earth System Models (ESMs), which typically incorporate a positive correlation with SST, if there is an included SST dependence at all (Grythe et al., 2014; Jaeglé et al., 2011; Song et al., 2023).
This study presents an integrated investigation of the SST dependencies of marine aerosol production through the conceptualization of a common framework (Sect. 3.1), followed by SST-dependent measurements of whitecap fractions and subsurface bubble populations (Sect. 3.2), SSA number concentrations (Sect. 3.3), a comparison of SSA and subsurface bubble concentrations (Sect. 3.4), and SSA number emission fluxes (Sect. 3.5). These findings culminate with temperature-dependent correction factors derived from the first wind-wave controlled SST experiments for direct integration into climate models (Sect. 3.6) and a discussion of the role of temperature hysteresis on SSA production (Sect. 3.7).
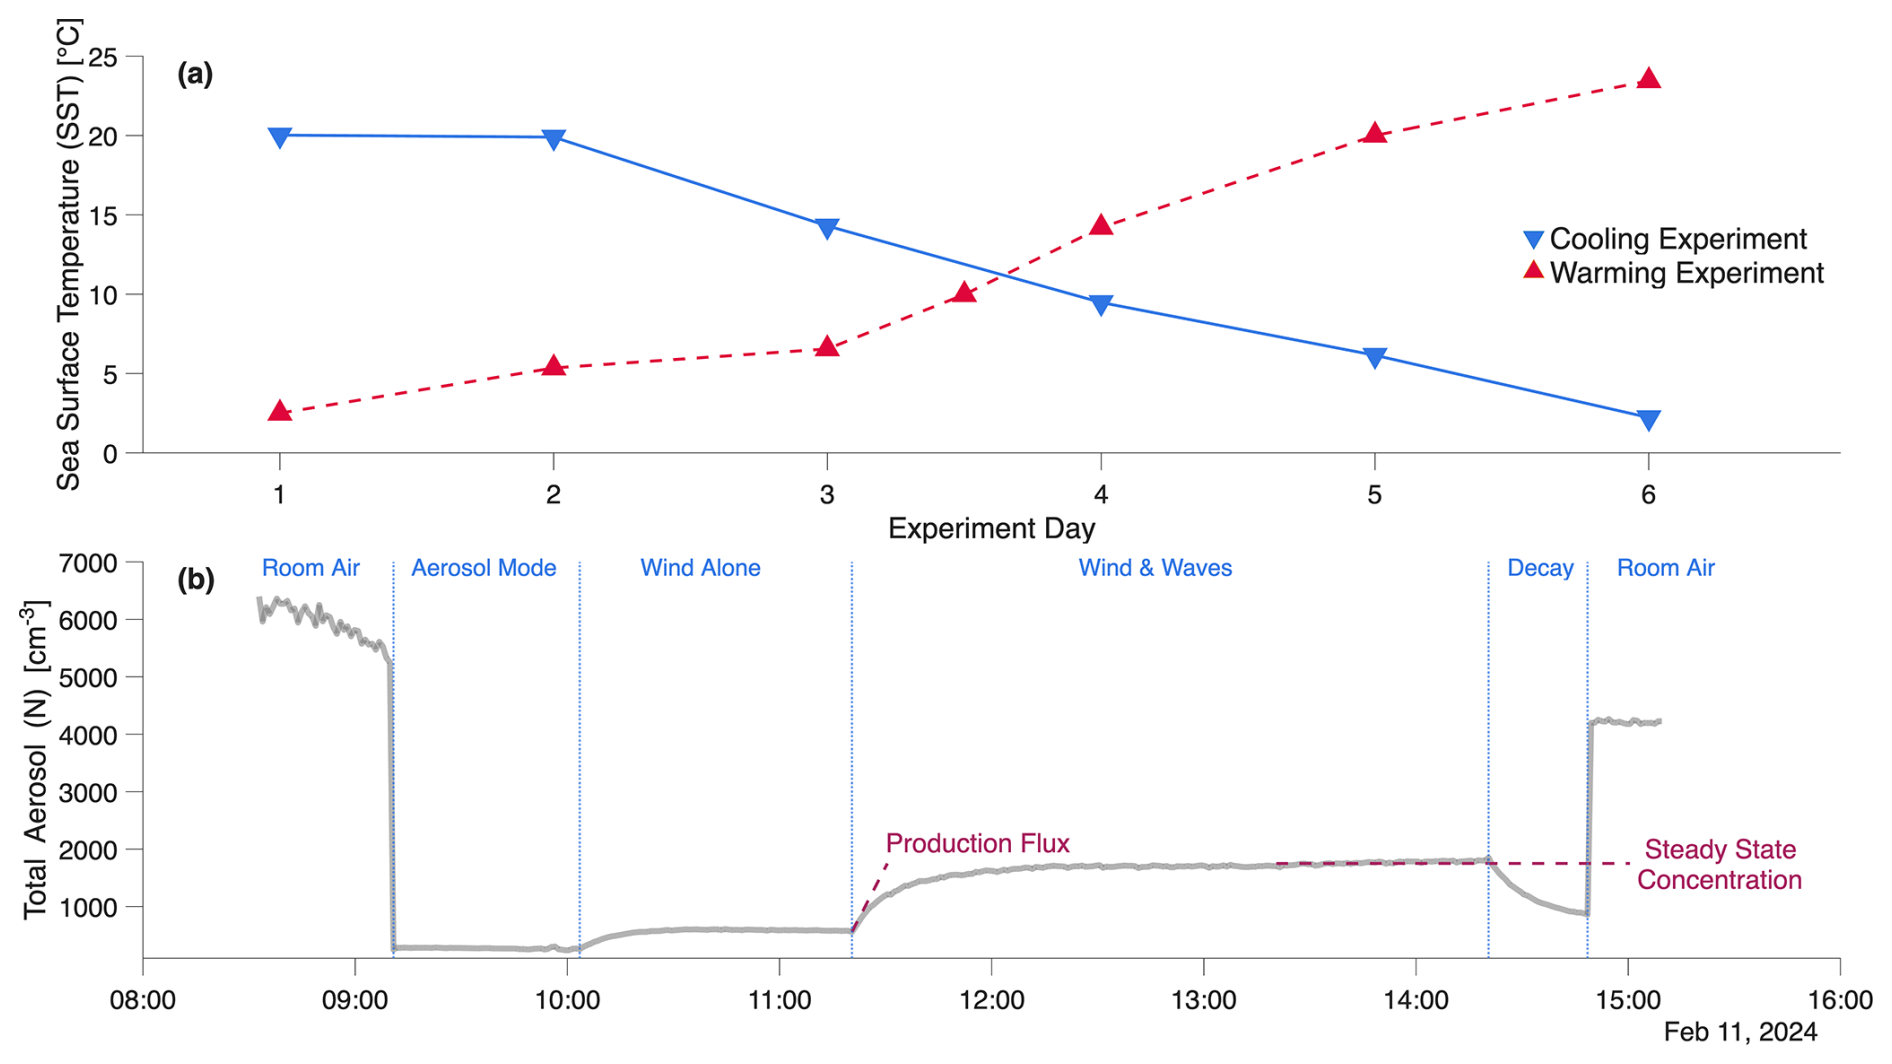
Figure 1Experimental overview. (a) Sea surface temperature for each experimental day and (b) total aerosol number concentrations during a representative experimental day (11 February 2024, cooling experiment day 1), showing the size measurement periods of a daily experiment: Room Air, Aerosol Mode, Wind Alone, Wind & Waves, Decay. Magenta dashed lines indicate the Production Flux (concentration rise following wave onset) and Steady State Concentration (subsequent plateau), from which SSA number fluxes are derived.
2.1 Sea Spray Aerosol Generation in SOARS
The SOARS instrument is located within the Hydraulics Laboratory at the Scripps Institution of Oceanography at the University of California San Diego in La Jolla, CA, USA. SOARS is a combined wave channel (36 m × 2.4 m × 2.4 m) and recirculating wind tunnel with an air-backed paddle at one end generating user-defined wave fields and a partially submerged ramp at the other end to absorb and dissipate wave energy. Two experiments were conducted from 11 February to 1 March 2024 using SOARS to quantify the effects of increasing SSTs on SSA production. In each experiment, water temperatures in SOARS, hereafter referred to as SSTs for simplicity, were controlled across a ∼ 20 °C range (Fig. 1a). The first experiment (“Cooling”), monotonically decreased SST each day, while the second experiment (“Warming”) did the opposite. Both experiments utilized the same seawater, collected from the Ellen Browning Scripps Memorial Pier (La Jolla, CA; 32°52′1′′ N; 117°15′26′′ W). The seawater was filtered through 10 µm mesh filters prior to experimental runs to reduce the influence of biology, pollution, and surface-active chemistry on SSA emissions (Kimble et al., 2026). Once filled, the SOARS water was continuously filtered through 1 µm mesh filters and UV sterilizers (λ=264 nm). SSA was produced by combining a wave field, where every fifth wave crest was a gently spilling breaker along the length of the channel, with a 10 m extrapolated wind speed (U10) of 11 m s−1. This wind speed and wave field pairing was chosen to replicate equilibrium seas not under high winds, with more discussion included in Leibensperger III et al. (2026b).
A representative experimental day of operating conditions is shown in Fig. 1b, broken down into six measurement periods: (1) Room Air, (2) Aerosol Mode, (3) Wind Alone, (4) Wind & Waves, (5) Decay, and (6) Room Air. Representative particle number size distributions (PNSDs) from each period on three days with equivalent SSTs are displayed in Fig. S1 in the Supplement. Room air measurements from the beginning and end of each day characterize background aerosol concentrations in the Hydraulics Laboratory. Aerosol mode, wherein the SOARS headspace is cycled through high efficiency air particulate (HEPA), clean carbon MERV 16, and potassium permanganate filter banks, is operated for ∼ 45 min, removing over 85 % of background particles. Once aerosol concentrations are sufficiently low, U10 winds are set to 11 m s−1 for ∼ 45 min (Wind Alone) to remove particles adhered to channel walls and create a stable headspace before SSA generation. During Wind & Waves, a wave field is generated with a peak wave height of 0.42 m, enabling measurements of SSA concentrations and flux estimates (Sect. 2.3–2.4). The features of the aerosol concentration time series explored in the following sections are annotated by the magenta dashed lines in Fig. 1b. SSTs and salinities (Table S2) are measured during Wind & Waves using a YSI Pro 30 (YSI Inc., Yellow Springs, OH). Following Wind & Waves, waves are stopped to allow for estimates of aerosol loss rates during the Decay period.
2.2 Sea Spray Aerosol Sampling
Primary SSA was sampled through two stainless steel inlets (2.27 m length; 10 mm ID) positioned 25 m downstream of wave generation and angled in the direction of wave breaking at a height of 0.6 m above the water surface (Fig. S2). The two parallel sampling systems had total flow rates of 6.2 and 2.6 L min−1. The sampled SSA was dried (relative humidity < 20 %) by passing sample flows through custom-built silica diffusion dryers to minimize the influence of hygroscopic growth on particle size. The sampling system produces size-dependent particle losses that must be quantified and corrected. The Particle Loss Calculator (PLC), described by von der Weiden et al. (2009), was used to estimate the sampling efficiency for each instrument during Wind & Waves conditions (Fig. S3). Loss mechanisms incorporated include diffusion, sedimentation, and inertial deposition in bends and contractions. Sampling efficiency ranged from ∼ 55 % to 100 % over the size range of 8 to 200 nm. Slight enhancements around 200 nm to 4 µm were observed, consistent with previous SOARS studies (Leibensperger III et al., 2026b; Moore et al., 2025). The wind speeds in SOARS produce sub-isokinetic conditions, leading to enhancement in this size range. Beyond 4 µm, sampling efficiency decreases significantly to 20 % at 10 µm. These corrections were applied to all measurements prior to subsequent analysis.
2.3 Sea Spray Aerosol Measurements
Submicron SSA (D<1 µm) were measured using a Scanning Mobility Particle Sizer model 3938 (SMPS; TSI Inc., Shoreview, MN) and Spider-MAGIC model 800 (SM; Aerosol Dynamics Inc., Berkeley, CA). The SMPS consisted of a 0.071 cm impactor, model 3088 advanced aerosol neutralizer, model 3081A differential mobility analyser (DMA) operated in negative polarity, and a model 3789 condensation particle counter (CPC). Aerosol and sheath flow rates of 0.6 and 3 L min−1 enabled measurements of particles with mobility diameters (Dm) from 0.013 to 0.835 µm every minute, with a scan time of 45 s and a purge time of 15 s. The SM, introduced by Amanatidis et al. (2020, 2021) consisted of a Po-210 radioactive charge conditioner (500 µCi; NRD, Grand Island, NY), Spider DMA operated with alternating up and down dual polarity scans, and a Moderated Aerosol Growth with Internal water Cycling (MAGIC) CPC (Hering et al., 2019). Aerosol and sheath flow rates of 0.3 and 0.9 L min−1 enabled measurements of particles with Dm from 0.008 to 0.42 µm. The SM scan time was approximately 30 s for a unidirectional, single polarity voltage ramp, with a complete scan over both polarities and each voltage ramp direction in about two minutes.
Supermicron SSA (D>1 µm) were measured using aerodynamic and optical measurement techniques. An Aerodynamic Particle Sizer model 3321 (APS; TSI Inc., Shoreview, MN) measured particles with aerodynamic diameters (Da) from 0.52 to 20 µm with a total flow rate of 5 L min−1. An Optical Particle Sizer model 3330 (OPS; TSI Inc., Shoreview, MN) measured particles with optical diameters (Do) from 0.3 to 10 µm with a sample flow rate of 1 L min−1. The APS and OPS were both operated at one-minute resolution.
Particle number size distributions (PNSDs) from the three measurement techniques were converted to dry, physical diameters (Dp,dry) assuming spherical particles. Equations (1) and (2) have been used previously to combine mobility and aerodynamic measurements (Collins et al., 2014; Lewis and Schwartz, 2004; Stokes et al., 2013). Following Leibensperger III et al. (2026b), Dm is assumed to be equal to Dp,dry (Eq. 1) and Da is converted to Dp,dry by estimating the effective density (ρeff) based on relative humidity, assuming a mixture of pure NaCl salt and water following Fig. 7 from Lewis and Schwartz (2004), and a reference density (ρ0) of 1 g cm−3 (Eq. 2). Finally, Do is assumed to be equal to Dp,dry (Eq. 3), as previous measurements of the refractive index of dried SSA (mSSA=1.533) by Liu et al. (2023) were found to be reasonably close to that of the calibration aerosol, polystyrene latex spheres (mPSL=1.588).
Total particle concentrations from 5 nm to 2.5 µm were measured using a MAGIC CPC (Aerosol Dynamic Inc., Berkeley, CA). The MAGIC CPC served as the reference instrument for room air and in-channel number concentrations shown in Fig. 1b. Loss-corrected data from the SMPS and APS were merged using a 2:1 weighting factor favouring the SMPS in the overlapping size range due to low APS counting efficiency below 0.9 µm (Peters and Leith, 2003; Pfeifer et al., 2016). The SM and OPS PNSDs were similarly merged, but with a 1:1 weighting due to a smaller overlapping size range and insufficient data on instrument counting efficiency in this region. Total SSA numbers (N) were estimated by integrating the PNSD. By assuming spherical particles, we also transform the PNSDs into distributions of surface area and volume, similarly estimating total surface area (S) and volume (V) by integrating the respective distributions.
For most of the analysis, measurements were condensed into 5 °C bins covering SSTs from 0 to 25 °C. This amounts to 2 (0–5 °C), 5 (5–10 °C), 2 (10–15 °C), 2 (15–20 °C), and 2 (20–25 °C) experimental runs per temperature bin. Since this process reduces the number of points as a function of SST to n=5, we performed an uncertainty-weighting analysis (see Sect. S4). Applying this weighting factor (Eq. S1) did not dramatically adjust our regressions but increased confidence in our findings (Fig. S4). More information on this analysis and a comparison between the weighted and non-weighted number concentrations can be found in the Supplement. All SST-binned analysis in this study uses the uncertainty-weighting unless otherwise specified, and all following analysis in the main text focuses on measurements from the SMPS and APS covering the size range of 0.01 to 20 µm, while the accompanying analysis of the SM and OPS is included in the Supplement.
2.4 Production Flux Measurements
Estimates of particle number flux distributions (PNFDs) utilized three methods to account for size-dependent influences on SSA production. Certain assumptions are made to simplify the uncharacterized loss mechanisms in SOARS (Leibensperger III et al., 2026b), with all methods assuming a well-mixed reactor and first-order loss rates. Production flux is estimated using Eq. (4) where N is the number concentration at a given aerosol size and time, P is the production flux (# cm−3 min−1), and k is the first-order loss rate (min−1).
First, submicron PNFDs were estimated by applying a linear regression to the SSA number concentration time series during the initial 5 min of Wind & Waves, referred to as the “initial rise” method. This method assumes a negligible loss rate (k=0) based on the sufficiently long residence times of submicron SSA and sufficiently low background aerosol concentrations, maintaining a large signal-to-noise ratio. The efficacy of this method is evaluated in a separate manuscript, but it showed that reducing the 5 min window to 12 s (the travel time of a particle throughout SOARS) yielded changes to submicron emission fluxes within typical daily variability, indicating that the simplified assumptions do not significantly bias the PNFDs.
Second, PNFDs for supermicron SSA between 1 and 4 µm were estimated for each size bin by applying a power law regression fit to the entire time series of SSA number concentrations during Wind & Waves, referred to as the “power-fit” method. This power law fitting allows P and k to each be freely fit according to each size bin. This method relies on the entire Wind & Waves period to estimate production and loss rates but requires a reduction of the number of size bins to maintain high counting statistics during production. Supermicron SSA reach steady-state concentrations quickly, limiting the validity of this approach for larger particles. Estimates from the power-fit method align well with those from the initial rise method but tend to be lower by about 5 %–10 %.
Third, for SSA above 4 µm, steady state was reached within the first minute of sampling due to short residence times. The PNFDs of these particles were estimated assuming that the production flux is equivalent to the product of the steady-state concentration and the loss rate estimated during the Decay period, referred to as the “steady state” method. This is to say the left-hand side of Eq. (4) becomes 0 and N(t) becomes NSteadyState, assumed invariable with time. When loss rates could not be directly quantified due to poor counting statistics, a constant loss rate from the last measured size bin was assumed (k is constant). Size- and SST-dependent loss rates exhibit an asymptotic behaviour above 2 µm (approaching a value of 0.55 min−1) and differences within error between experiments (Fig. S12).
The steady state-derived supermicron fluxes are not inherently equal to the initial rise-derived submicron fluxes, but each method is the best approach for the specified size range given the complexities of the SOARS instrument. The loss rate assumptions are likely underestimates, generally leading to underestimates by each method compared to the true interfacial emission flux. However, when the initial rise and steady state methods are compared to one another, the chosen method in each size range represents an overestimate compared to the other method. That is, the initial rise-derived fluxes are larger than the steady state-derived fluxes for submicron SSA (by up to a factor of about 6) and the steady state-derived fluxes are larger than the initial rise-derived fluxes for supermicron SSA (by up to a factor of about 5) (Fig. S5). This variability is of similar magnitude to daily variability of SSA number concentrations in SOARS (Leibensperger III et al., 2026b), reinforcing the validity of these estimates. Critically, this variability is systematic across SST values, such that relative SST-dependent trends are unaffected. A thorough comparison of the flux approximation methods is the focus of a forthcoming manuscript. In the remainder of the text, we combine the three size-differentiated approaches into a single PNFD covering the entire size range (0.01–20 µm) following Eqs. (5)–(7) where P is converted to units of # m−2 s−1using the headspace volume and water surface area of SOARS:
Additionally, the PNFDs were used to estimate the particle mass flux distributions (PMFDs). The PNFDs were multiplied by the spherical volume of SSA at each size and assumed a constant density of 2.2 g cm−3 (Brock et al., 2019; Wu et al., 2020). This is a reasonable assumption given the water filtration used here to reduce biologic and anthropogenic influences on SSA chemical mixing state. Total number fluxes (FN) and total mass fluxes (FM) are the result of integrating the PNFDs and PMFDs. The PMFDs (along with estimates of S and V) are sensitive to supermicron SSA, which are scarcer than submicron SSA. There are known challenges with sampling supermicron SSA in SOARS, so our estimates likely represent lower limits of these quantities (Leibensperger III et al., 2026b).
2.5 Bubble Measurements
Whitecap fractions (WCF) in SOARS were measured via image analysis of wave breaking. During Wind & Waves, a Nikon D3200 SLR camera (shutter speed 1/500 s, f-stop 5.6, ISO 1600) photographed whitecaps from atop the SOARS lid. Each sequence occurred over 12.5 s, captured 27 images, and was repeated for at least ten breaking events. The field of view, located 11 m downwind of wave generation, was illuminated through the side wall of the channel. Background images of still water were subtracted from whitecap images to eliminate the influence of lighting inconsistencies and image deformation. Whitecaps in the resulting images were identified using a thresholding technique. An average WCF value was computed across breaking events for each temperature. Measurements for SSTs below 6 °C were not possible due to significant fogging of the SOARS lid.
Total subsurface bubble concentrations (n) with radii from 6.17 to 830 µm were measured acoustically. Measurements were based on Vagle and Farmer (1998), employing two submerged transducers. The first emits sound between 4 and 500 kHz during a 3 s interval, while the second receives the attenuated signal. Signal attenuations at several frequencies are inverted into a bubble size distribution using the resonant bubble approximation (Czerski, 2012). The bubble size distribution was then integrated across the size range to estimate total concentrations.
3.1 A Simple Framework of SSA Production
To begin, we present a simple framework to contextualize our measurements and summarize the current understanding of SSA production, using notation that is conserved throughout the remainder of this work. This framework functions as a conceptual interpretation tool, where the equations will not be solved empirically as more measurements or assumptions are necessary for full solutions. This framework also serves to highlight areas for future research where the role of SST in controlling bubble-bursting dynamics is understudied and difficult to constrain across bubble sizes and small-scale processes. This framework is one interpretation to describe the relevant processes and motivate how we approach the problem. Several terms included in the equations below are functions of variables in addition to SST (e.g., salinity, air-water temperature differential, diversity and concentrations of surfactants) but will not be thoroughly described as such. We aim to keep the framework simplified to ensure a consistent view of the SST dependencies of the OAI.
The change in net amount of SSA at a given Dp,dry that enters the atmosphere over a given ocean area (N0, [#SSA, m−2 µm−1]) produced from surface bubbles (ñ, [#bubble m−2 µm−1]) over time is characterized by Eq. (8):
where E is the number of SSA emitted per bubble [#SSA #], B is the burst rate of surface bubbles [s−1], r is the bubble radius [µm], D1 is the deposition rate of SSA [s−1], and t is time [s]. Liu and Yang (2022) include a useful schematic relating changes in SST to potential changes in whitecaps, which is related to the ñ term in Eq. (8). Our framework extends that schematic to include the entire OAI system through a simple mathematical lens. Importantly, the N0 term in Eq. (8) is related to, but distinct from, the aerosol concentration (N) and aerosol flux (FN) measurements discussed in the following sections.
Based on previous work, we expect that E, B, and ñ will vary as a function of SST due to changes in seawater and bubble properties (Nielsen and Bilde, 2020; Sellegri et al., 2023; Song et al., 2023). These properties include: the bubble film drainage (φ), bubble film thickness (η), bubble film brittleness (β), air entrainment (ϵ), kinematic viscosity (ν), surface tension (γ), and the solubility of gases (κ), each of which are functions of temperature (Deike et al., 2022).
The number of SSA ejected per burst bubble (E) is known to be proportional to β while inversely proportional to η, φ, and ν, and can vary by a factor of 58 over an SST range of 0 to 19 °C (Dubitsky et al., 2024; Nielsen and Bilde, 2020; Walls and Bird, 2017):
The number of SSA ejected per bubble is different for film and jet drop production, and thus dependent on Dp,dry of SSA and r of bubbles. With increasing SSTs, jet drop production is likely to decrease while film drop production is likely to increase, leading to aerosol- and bubble-size-dependent shifts to E (Deike et al., 2022). Film drop enhancement is due to increasing η with increasing SSTs, although previous laboratory studies focus on very warm water temperatures (10–77 °C) (Poulain et al., 2018). Future studies should therefore focus on thorough characterization of film and jet drop production across realistic SSTs (0–40 °C).
Surface bubble burst rate (B) is proportional to surface tension and inversely proportional to viscosity (Nielsen and Bilde, 2020; Poulain et al., 2018):
In addition to bursting, surface bubbles can coalesce into rafts wherein neighbouring bubbles may merge, altering the surface bubble size distribution, thereby altering the resulting SSA produced (Néel and Deike, 2021). The surface bubble concentrations (ñ) will vary non-linearly with SST, depending on the indirect effects of water properties, following the relations given in Eqs. (S2)–(S8). Subsurface bubbles also interact with one another, altering their size-dependent concentrations and likely influencing SSA production (Jiang et al., 2024).
The lack of consensus on the SST dependence of SSA production stems in part from the competing physical processes described in Eqs. (8)–(10) and in the supplement (Sect. S5). For example, increasing SST simultaneously enhances bubble burst rates (Eq. 10) and reduces the number of SSA ejected per bubble (Eq. 9), and these opposing effects are functions of bubble size. Without isolating and quantifying each process independently, observations of SSA production will reflect the sum of these competing influences, making it difficult to attribute trends to any single mechanism (Sellegri et al., 2023; Sofieva et al., 2022). Previous mechanistic frameworks of SSA production provide greater detail of the processes summarized here, but lack experimental support for SST effects (Deike et al., 2022). Characterizing the relationship between surface and subsurface bubbles with changing SST is therefore a critical next step toward disentangling these effects.
This framework is a starting point for the following discussion as the processes and typical measurements span different length scales: SSA are microscopic particles (10 nm–50 µm) produced from bubbles (1 µm–10 mm) contained within wave breaking events (0.1–10 m) (Deike, 2022). While we point to the importance of continued research at the smallest scales (e.g., single-bubble bursting experiments), here we focus on the sum of the processes across entire breaking wave events. Breaking waves in SOARS span the width of the channel (2.4 m) and break along most of the length of the channel (approximately 25–30 m). We therefore analyse the aerosols produced over whole breaking events through measurements of surface and subsurface total bubble concentrations, SSA concentrations, and SSA emission flux.
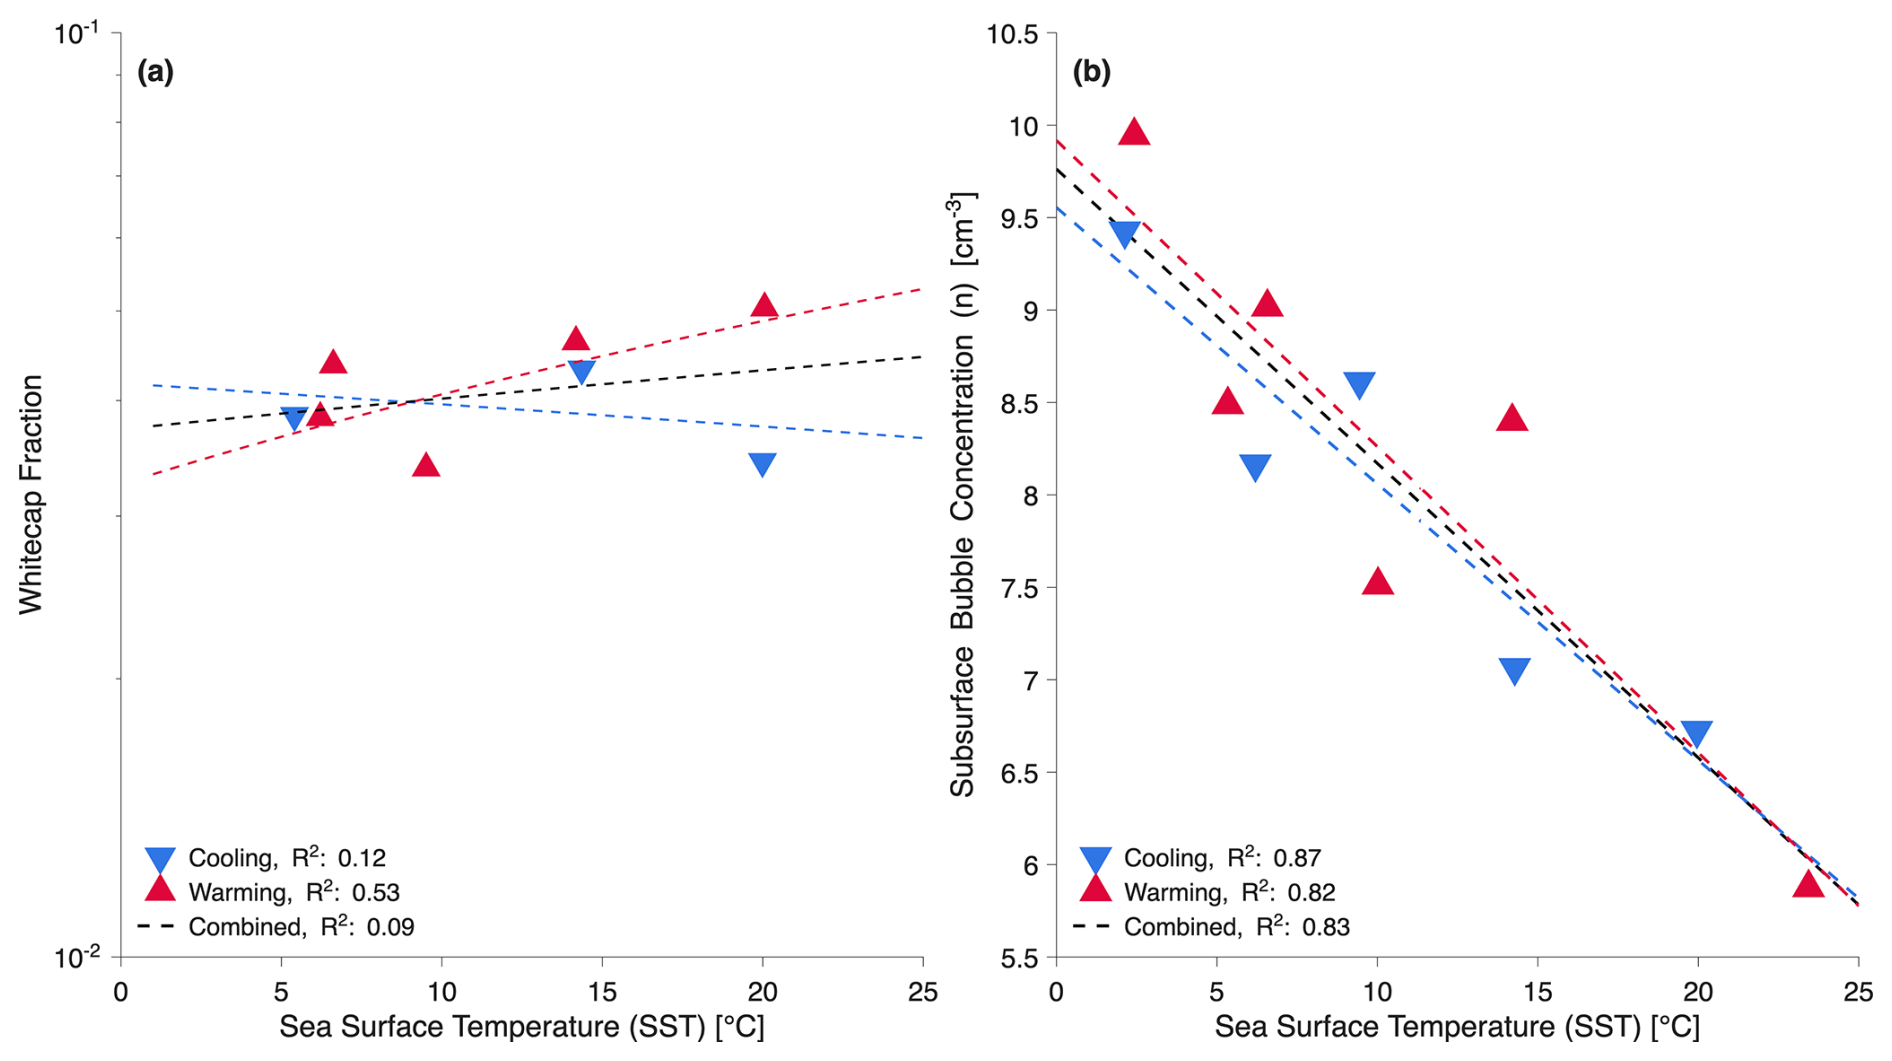
Figure 2Trends in whitecap fraction and subsurface bubble concentrations. (a) Whitecap fraction and (b) subsurface bubble concentrations as a function of SST.
3.2 Surface and Subsurface Bubbles
Whitecap fractions (WCFs) were measured to estimate the effect of changing SST on the surface expression of subsurface bubble plumes at SSTs above 6 °C. The WCFs displayed here relate to the surface bubble concentrations (ñ) in Eqs. (8) and (S2), although the ñ term is explicitly the concentration of surface bubbles, which is a function of bubble radius. Whitecaps consist of layers of bubbles near the surface contributing to the high albedo, the measured quantity, whereas the ñ term focuses on estimates of the top-most layer of bubbles directly contributing to SSA production. In Fig. 2a, different results were obtained during warming and cooling experiments and no clear dependence is seen between WCF and SST (R2≤0.53, p>0.1), which is consistent with previous findings (Jia and Zhao, 2019; Liu and Yang, 2022). On the other hand, a previous laboratory study using plunging waterfalls found an increase in air entrainment and surface foam with increasing SSTs over a similar range (6 to 30 °C) (Callaghan et al., 2014). While these results approximately align with the warming results in Fig. 2a, our laboratory proxy utilizes wind-wave interactions, likely contributing to the differing results during the cooling experiment.
Subsurface bubble concentrations (n, Eqs. S2–S3) provide additional insight into how SST modifies the OAI. Figure 2b shows that n decreased by a factor of 1.5 over our SST range, regardless of whether the SST was increasing or decreasing, and the trend is captured by a linear fit (R2=0.83, p≪0.01). These results show the same trend as the work of Thorpe et al. (1992), who found that n decreased by 50 % for every 10 °C increase in SST over the bubble-size range of 5 to 145 µm. However, our observed decrease in n is lower and may reflect the larger size range measured here (6.17 to 830 µm). Notably, this decrease in subsurface bubble concentrations does not correspond to a clear change in WCF, different from the consistent findings of Callaghan et al. (2014). This suggests that SSA production under wind-wave interactions may be governed by processes occurring beneath the surface (Chu et al., 2025) or by bubbles smaller than 6 µm.
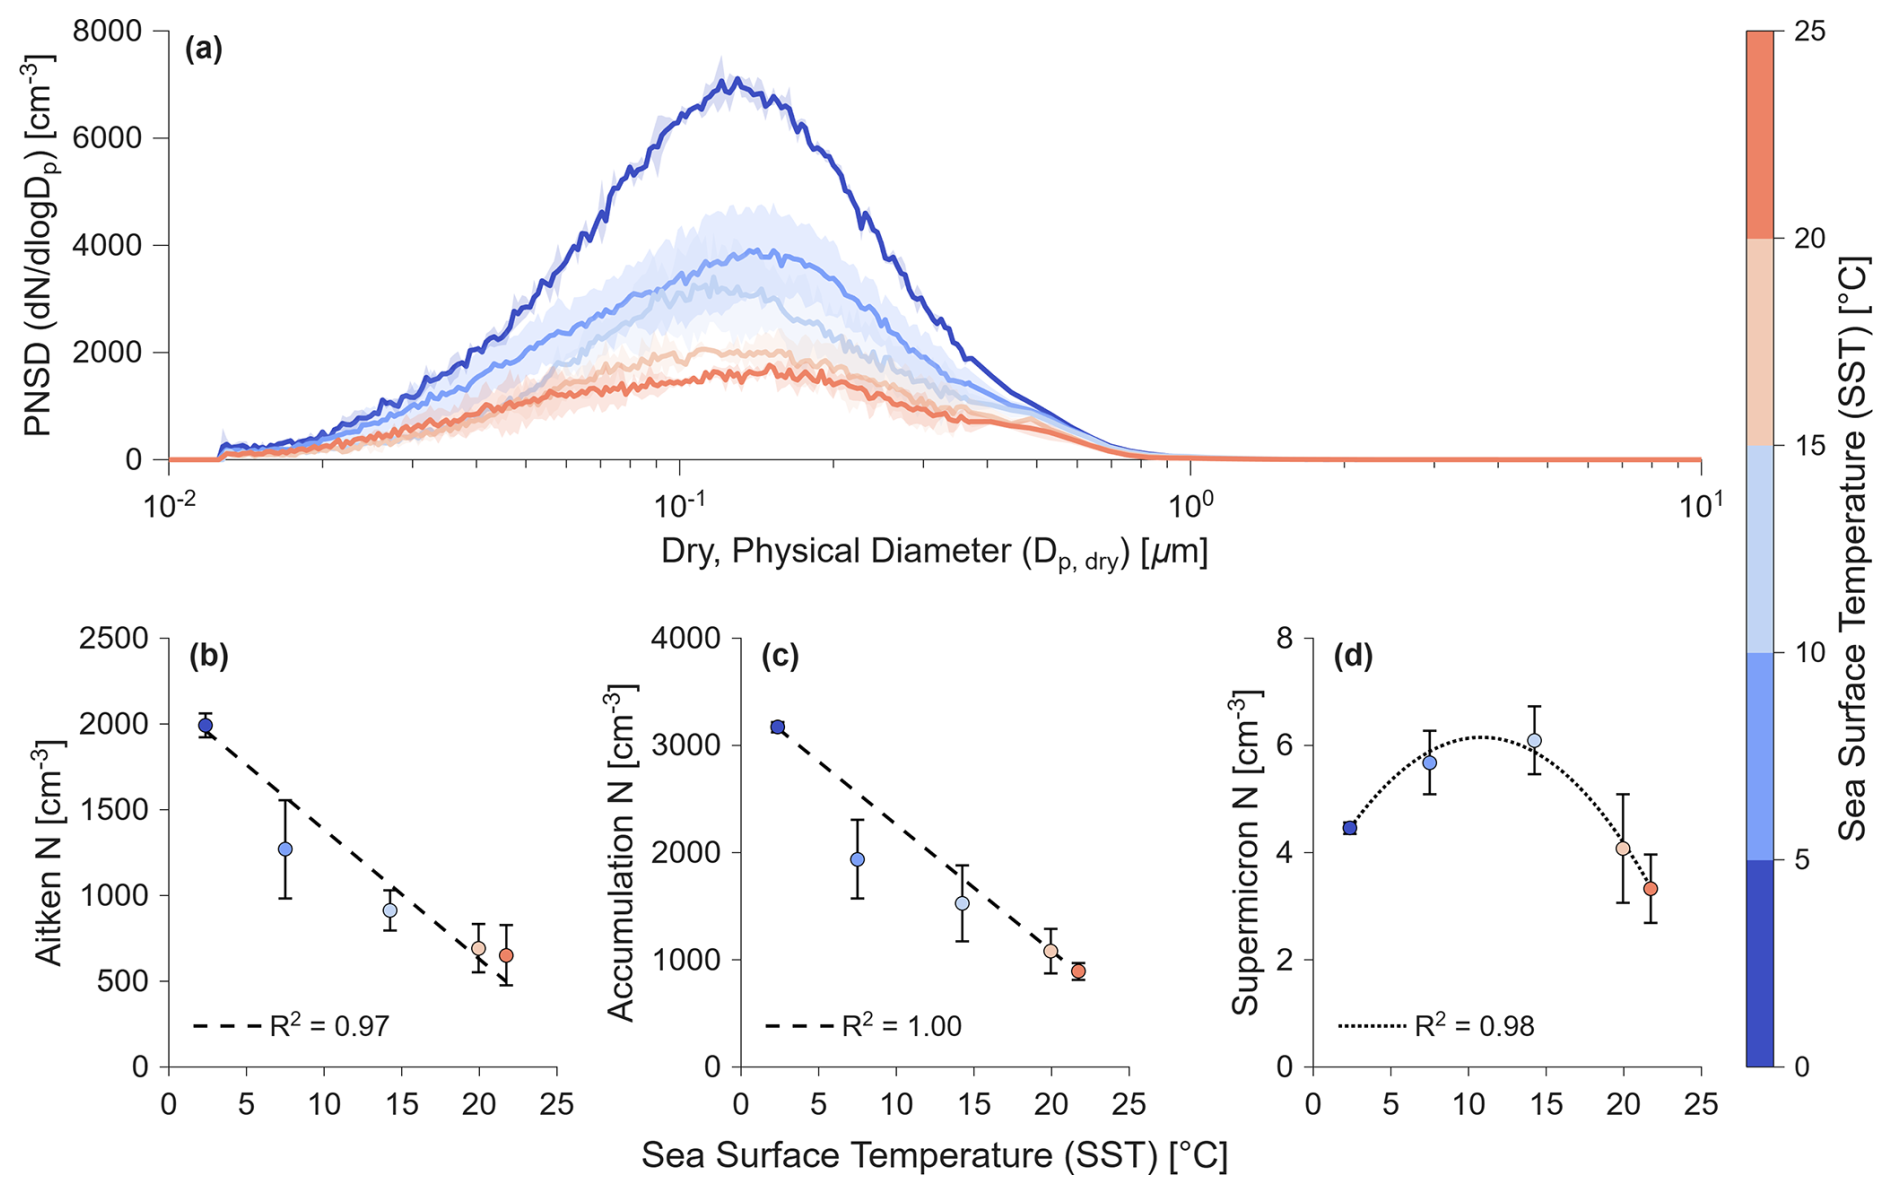
Figure 3SST trends of SST-binned, uncertainty-weighted PNSDs. (a) Mean PNSDs for five SST ranges measured by the SMPS-APS. (b) Total Aitken, (c) accumulation, and (d) supermicron mode number concentrations. The shaded regions in a and error bars in (b)–(d) indicate one standard deviation.
3.3 Particle Number Size Distributions
Mean PNSDs were calculated during the last hour of each Wind & Waves run and binned in 5 °C increments from 0 to 25 °C. Increasing SST from 2 to 23 °C produced a clear suppression of submicron SSA concentrations (Fig. 3), consistent with the diffuser experiments of Christiansen et al. (2019). However, diffuser-generated PNSDs exhibit mode diameters approximately 50 nm smaller than ours, a discrepancy attributable to differing SSA generation mechanisms. In contrast, the plunging jet system of Christiansen et al. (2019) produces mode diameters like ours but yields a U-shaped SST dependence for submicron SSA concentrations. These method-dependent inconsistencies reinforce the critical importance of representative SSA production mechanisms (Collins et al., 2014). By generating SSA through realistic wind-wave interactions, SOARS minimizes the artifacts introduced by other laboratory proxies, lending greater confidence to the monotonic suppression observed here for submicron SSA. These trends are further corroborated by independent PNSD measurements from the SM-OPS system (Fig. S6, Table S3).
Beyond the overall suppression in number concentration, we evaluated whether SST also shifts the shape of the PNSD by examining the temperature dependence of geometric mean diameter (Dg), geometric standard deviation (σg), and mode diameter (Dmode) (Fig. S7). None of these parameters exhibit a clear trend with SST, in contrast to the strong linear decrease observed in total number concentration (N, R2=0.99, p<0.05). This indicates that increasing SST reduces the amount of SSA produced without substantially altering the size distribution at steady state. The potential for SST to modulate the chemical composition and mixing state of emitted SSA, a subtler effect that would not be captured by these bulk size metrics, is the focus of ongoing single particle analysis to be the focus of a forthcoming manuscript.
Integrated number concentrations over three size ranges clarify size-dependent relationships with SST that are not captured by evaluating the complete PNSD. Suppression of SSA with increasing SST for both Aitken ( µm) and accumulation ( µm) modes is well represented by a linear regression (R2≥0.97, p<0.05 Fig. 3b–c). On the other hand, supermicron SSA exhibits a non-linear relationship with SST, which is well represented by a quadratic regression (R2=0.98, p<0.05). These trends were consistent across cooling and warming experiments (Fig. S10) and suggest a mechanistically driven (i.e., film vs. jet drop) size-dependent shift in production. This indicates that increasing SSTs have a complex influence on the resulting SSA and emphasizes the importance of size-resolved measurements. For example, film and jet drop production may have different SST dependencies, causing size-binned N to vary with SST while the shape of the distribution (a consequence of the ratio of total film to jet drop production) remains constant. More work is needed to isolate the SST dependencies of film versus jet drop production. Subtle shifts in supermicron SSA production are not captured when assessments are made on bulk changes to SSA number concentrations. Although supermicron concentrations are limited in SOARS (Leibensperger III et al., 2026b), supermicron N estimates are dominated by SSA between 1–2 µm, where counting statistics and counting efficiency remain high, providing robust results.
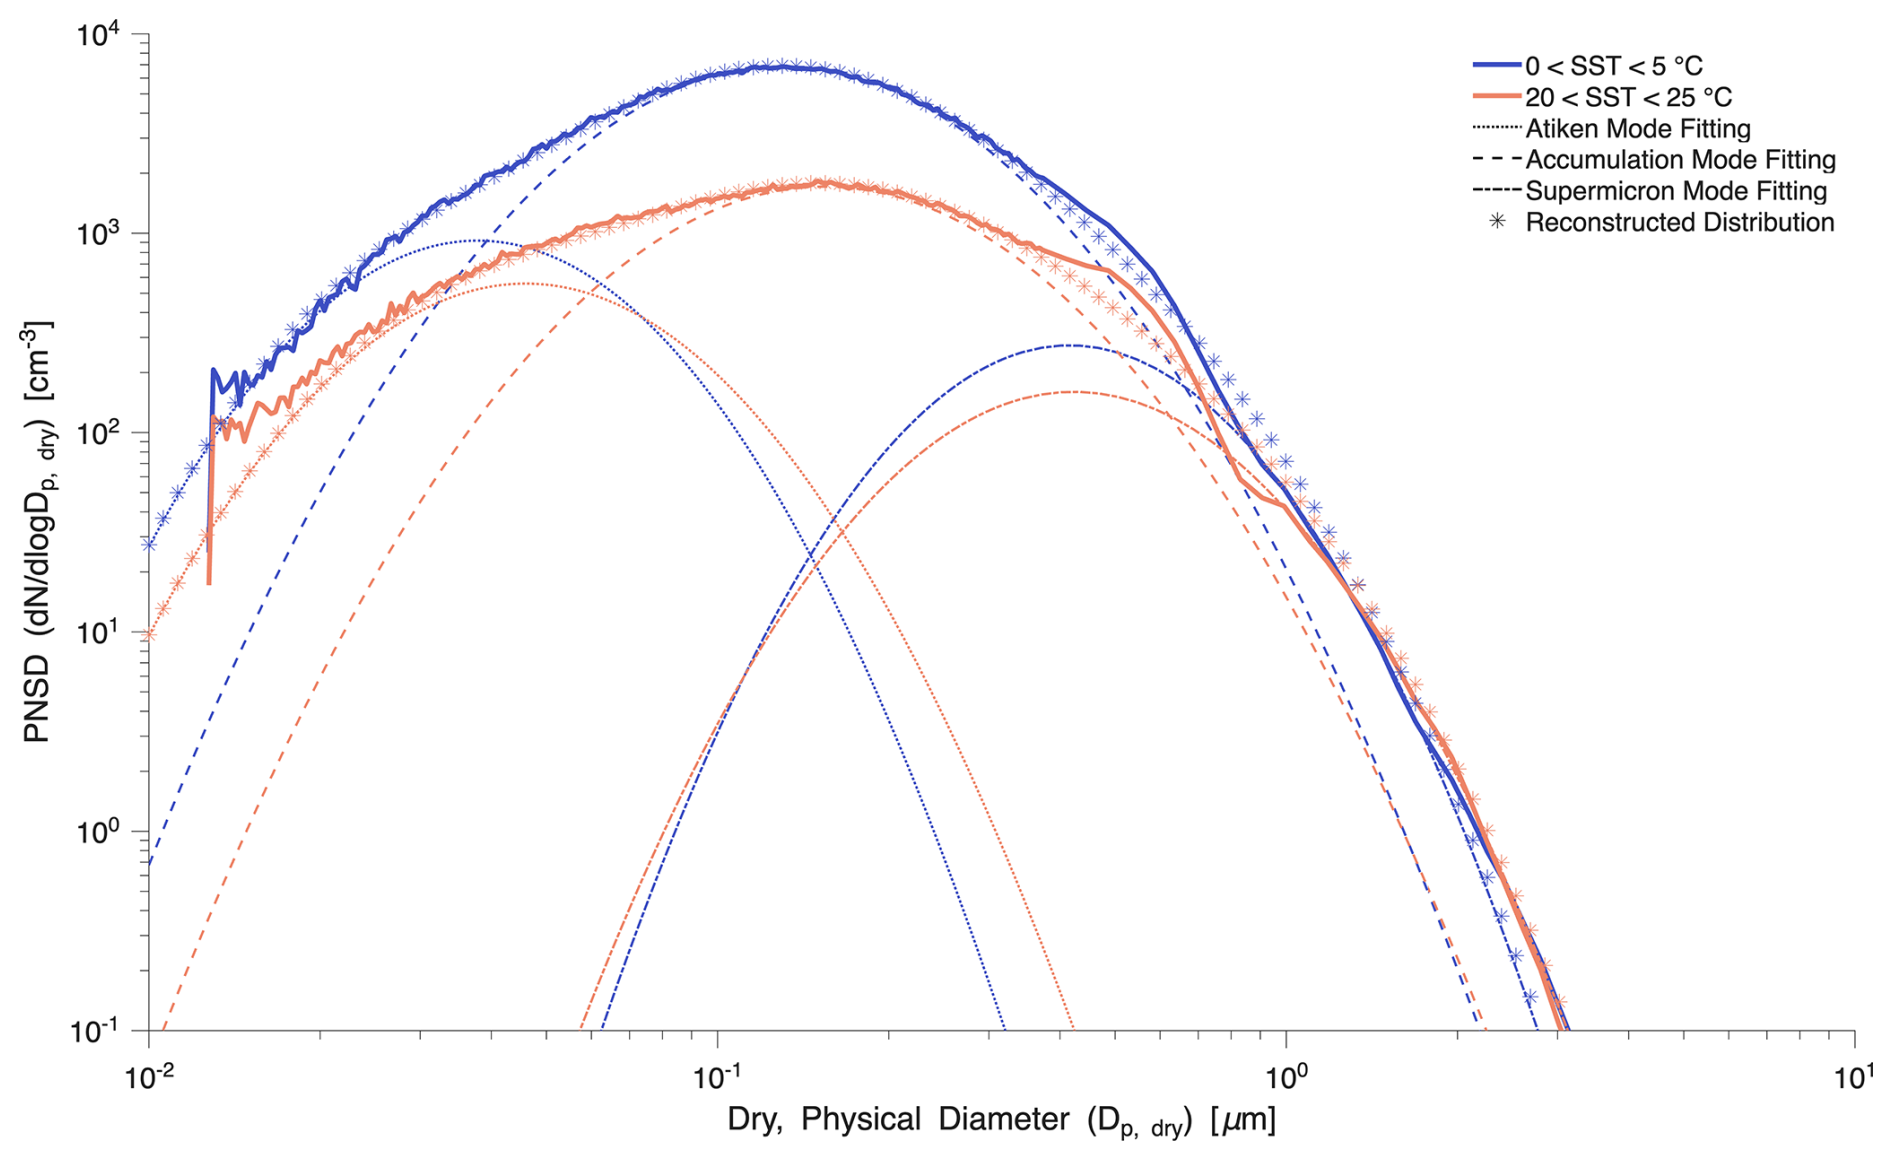
Figure 4Extreme SST-binned mean PNSD modal decomposition. Average PNSD for the coldest and warmest binned SSTs. Each is decomposed into three log-normal modes and reconstructed.
A tri-modal log-normal fit was applied to the coldest and warmest PNSDs to further characterize the changes in the modal distributions as a function of SST (Fig. 4, Table S4). From the lowest to the highest SSTs, the greatest change occurs in the accumulation mode number concentration, which decreases by 75 %. Beyond a decrease in magnitude, each mode experiences increases in Dg and σg. Aitken mode concentrations decrease by 35 %, Dg increases by 22 %, and σg increases by 4 %. The accumulation mode N decreases by 75 %, Dg increases by 18 %, and σg increases by 1 %. The supermicron mode N decreases by 36 %, Dg increases by 2 %, and σg increases by 5 %. The less pronounced changes in Dg and σg again suggest SST primarily influences the number of SSA at steady state rather than the shape of the distribution.
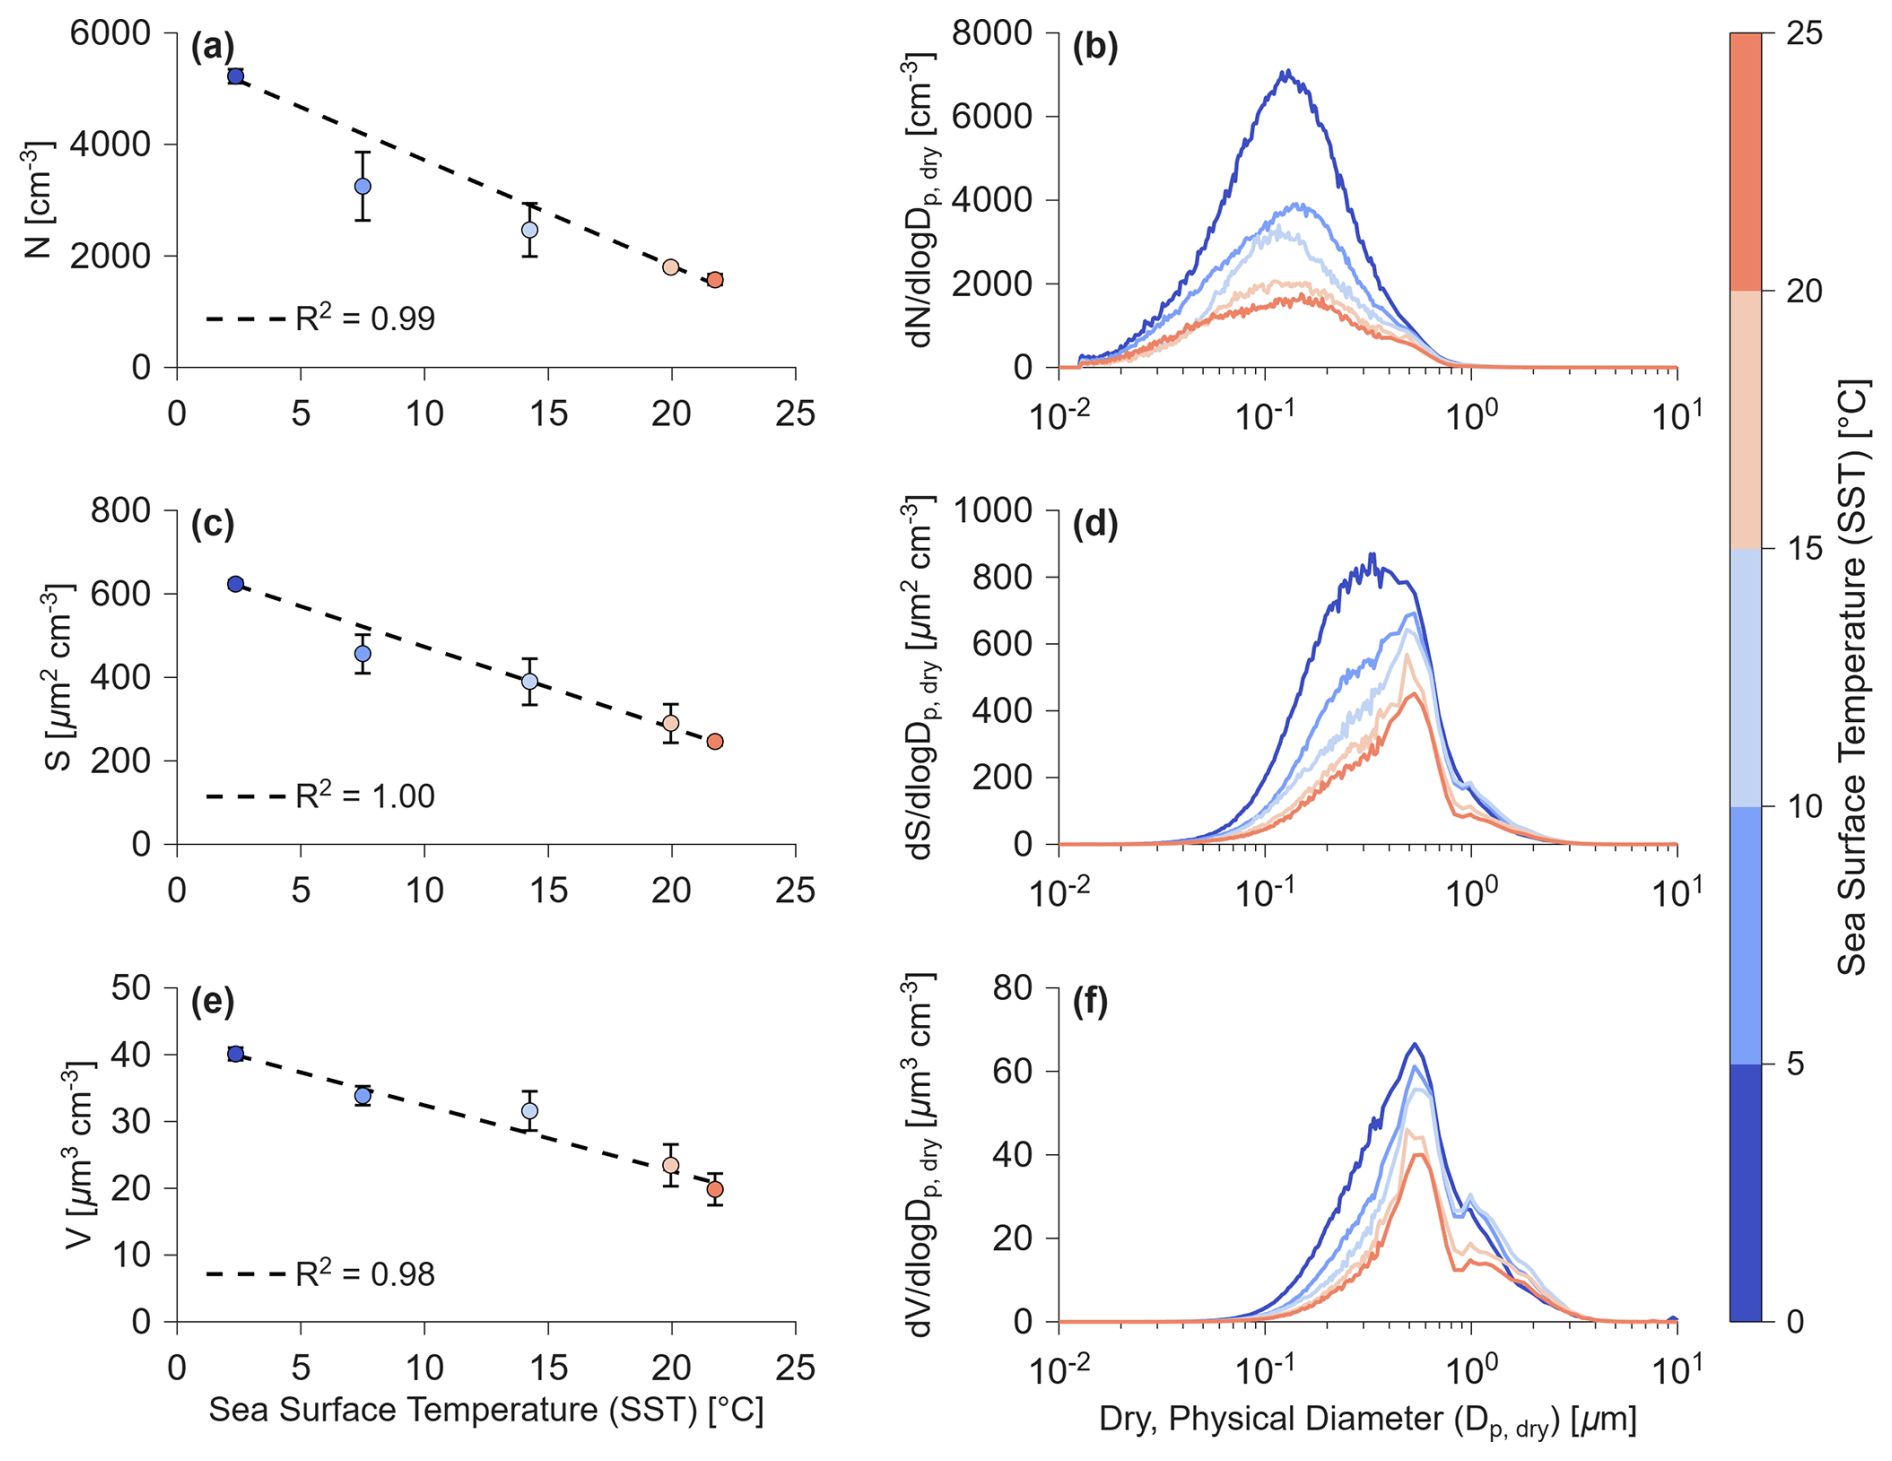
Figure 5Higher order moments of the SST-binned, uncertainty-weighted PNSDs. (a) Total number, (c) surface area, and (e) volume of SSA in SOARS for each temperature range, with a dashed line representing a linear least squares best fit line. (b) Number, (d) surface area, and (f) volume size distribution for each temperature range.
Surface area and volume size distributions were derived from PNSDs, assuming spherical particles, to assess the influence of changing SST on higher-order moments of the size distribution. Figure 5 shows that increasing SST drives a decrease in total SSA number, surface area, and volume by more than 50 %, across the SST range of 2 to 23 °C. As with modal number concentrations, suppression of S and V was observed during both experiments (Fig. S11). At the SST-binned scale, all three moments exhibit strong, negative correlations with SST, which are well represented by linear regressions (R2≥0.98, p<0.05).
The higher-order moments of the size distribution reveal a structural shift that the number distribution alone does not capture (Fig. 5). As SST increases from 2 to 7 °C, the surface area distribution transitions from a broad, log-normal mode centred near 0.3 µm to a sharper mode at 0.55 µm, which then persists across all higher SSTs (Fig. 5d). The volume distribution undergoes a parallel transition, with a secondary mode emerging near 1 µm over the same temperature range (Fig. 5f). Although this secondary mode falls near the SMPS-APS merging point, it also appears in the SM-OPS PNSDs (Fig. S6) where merging occurs at 0.4 µm, confirming it is not an artifact of measurement stitching. These modal shifts are also present in the probability density functions of the number, surface area, and volume of the coldest and warmest SSTs (Fig. S8).
These shifts carry direct implications for climate; particle surface area underpins several modelling parameterizations for ice nucleating particle concentrations (DeMott et al., 2016; Moore et al., 2022; Phillips et al., 2008), so a redistribution of SSA surface area into larger sizes could alter the available sites for ice nucleation and, in turn, the abundance of ice and mixed-phase clouds. Simultaneously, the suppression of SSA volume combined with shifts in mode diameter could reduce direct scattering of solar radiation, potentially enhancing poleward heat transport as described by Kay et al. (2016).
The abruptness of these transitions between 2 and 7 °C, followed by relative stability at higher SSTs, points to a possible physicochemical threshold followed by a gradual scaling with temperature. One potential explanation is the influence of marine gels. Despite water treatment to minimize biological contributions (Sect. 2.1), dissolved organic matter and its gel-phase products can persist. Since marine gels are temperature sensitive, with significant hydrodynamic diameter growth over the SST range covered here (Chang et al., 2022; Verdugo, 2012), they are likely to become most prevalent in the seawater (and therefore enriched in SSA) at the coldest SSTs. Nielsen and Bilde (2020) reported that removing gel-stabilizing divalent cations (Ca2+, Mg2+) from sea salt mixtures produced a similar suppression of particle concentrations as SSTs increased. Another explanation is a shift in physical production mechanisms modulated by SST. Callaghan et al. (2014) reported that temperature had the greatest effect on subsurface bubbles (n) larger than 1 mm, which are expected to produce submicron film drops (de Leeuw et al., 2011). The rapid decay of larger bubbles suggests that bubble rise times at low SSTs are accelerated. Furthermore, Nielsen and Bilde (2020) support the conclusion that the number of SSA produced per bubble is highest at low SSTs. However, no previous laboratory studies have incorporated wind, which significantly influences SSA concentrations (Leibensperger III et al., 2026b). Consequently, these results are expected to be the most representative of open ocean conditions and SOARS represents an opportunity to test these hypotheses in the future.
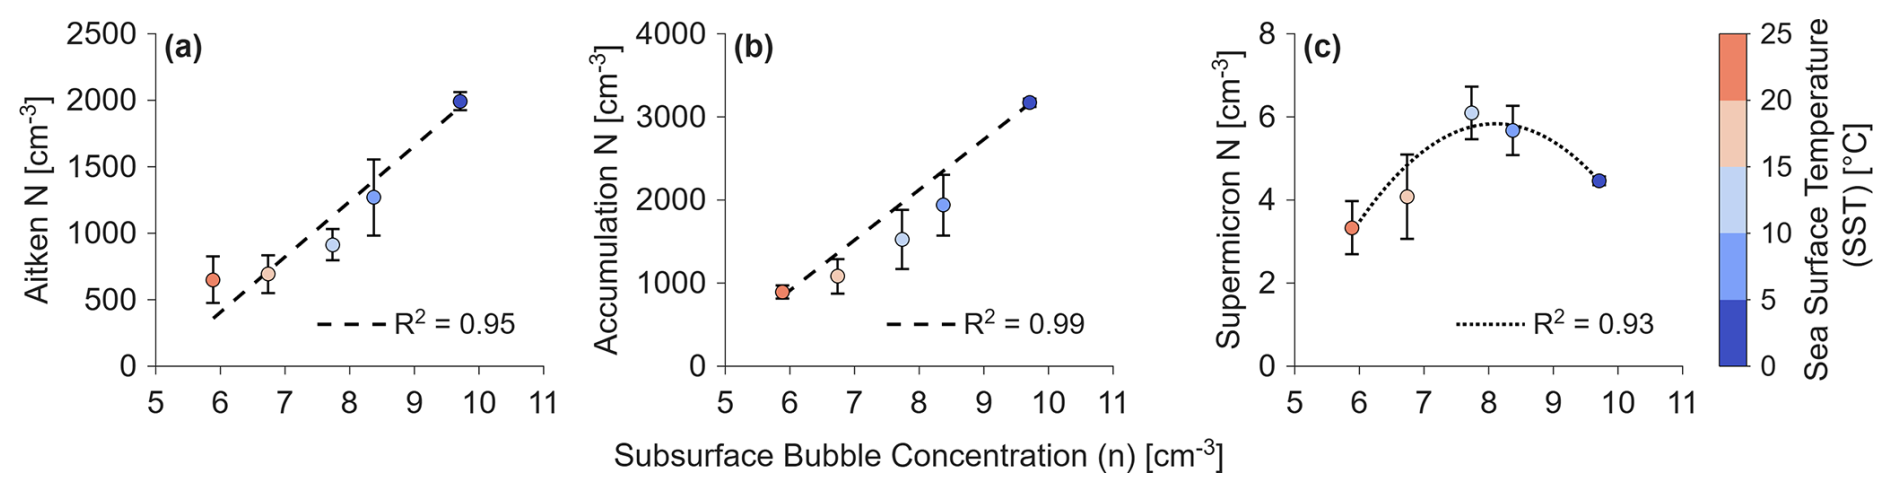
Figure 6Evaluation of the bubble-SSA correlation using SST-binned, uncertainty-weighted SSA concentrations. Comparison of SSA total number (N) to subsurface bubble concentrations (n), separated by SSA mode: (a) Aitken, (b) accumulation, and (c) supermicron. Weighted least squares regression and resulting best fit lines are shown for linear (dashed) and quadratic (dotted) fits.
3.4 Connecting SSA and Bubble Concentrations
We compare SSA number concentrations to subsurface bubble concentrations to contextualize which quantities exhibit similar SST-dependencies (Fig. 6). The sub-millimetre subsurface bubble concentrations (n) are likely to be related to jet droplet production, controlling supermicron SSA production and up to 43 % of submicron SSA production (Wang et al., 2017). However, the highest correlation occurs between the accumulation mode SSA and subsurface bubbles (R2=0.99, p<0.05, Fig. 6b). Supermicron SSA exhibits a quadratic relationship with subsurface bubbles (R2=0.93), but the result is not significant at the 95 % confidence level (p=0.07). More work is needed to understand the non-linear processes connecting changing SSTs to SSA production via size-dependent bubble processes. This analysis provides a cursory look into the temperature-dependent relationship between subsurface bubbles and SSA.
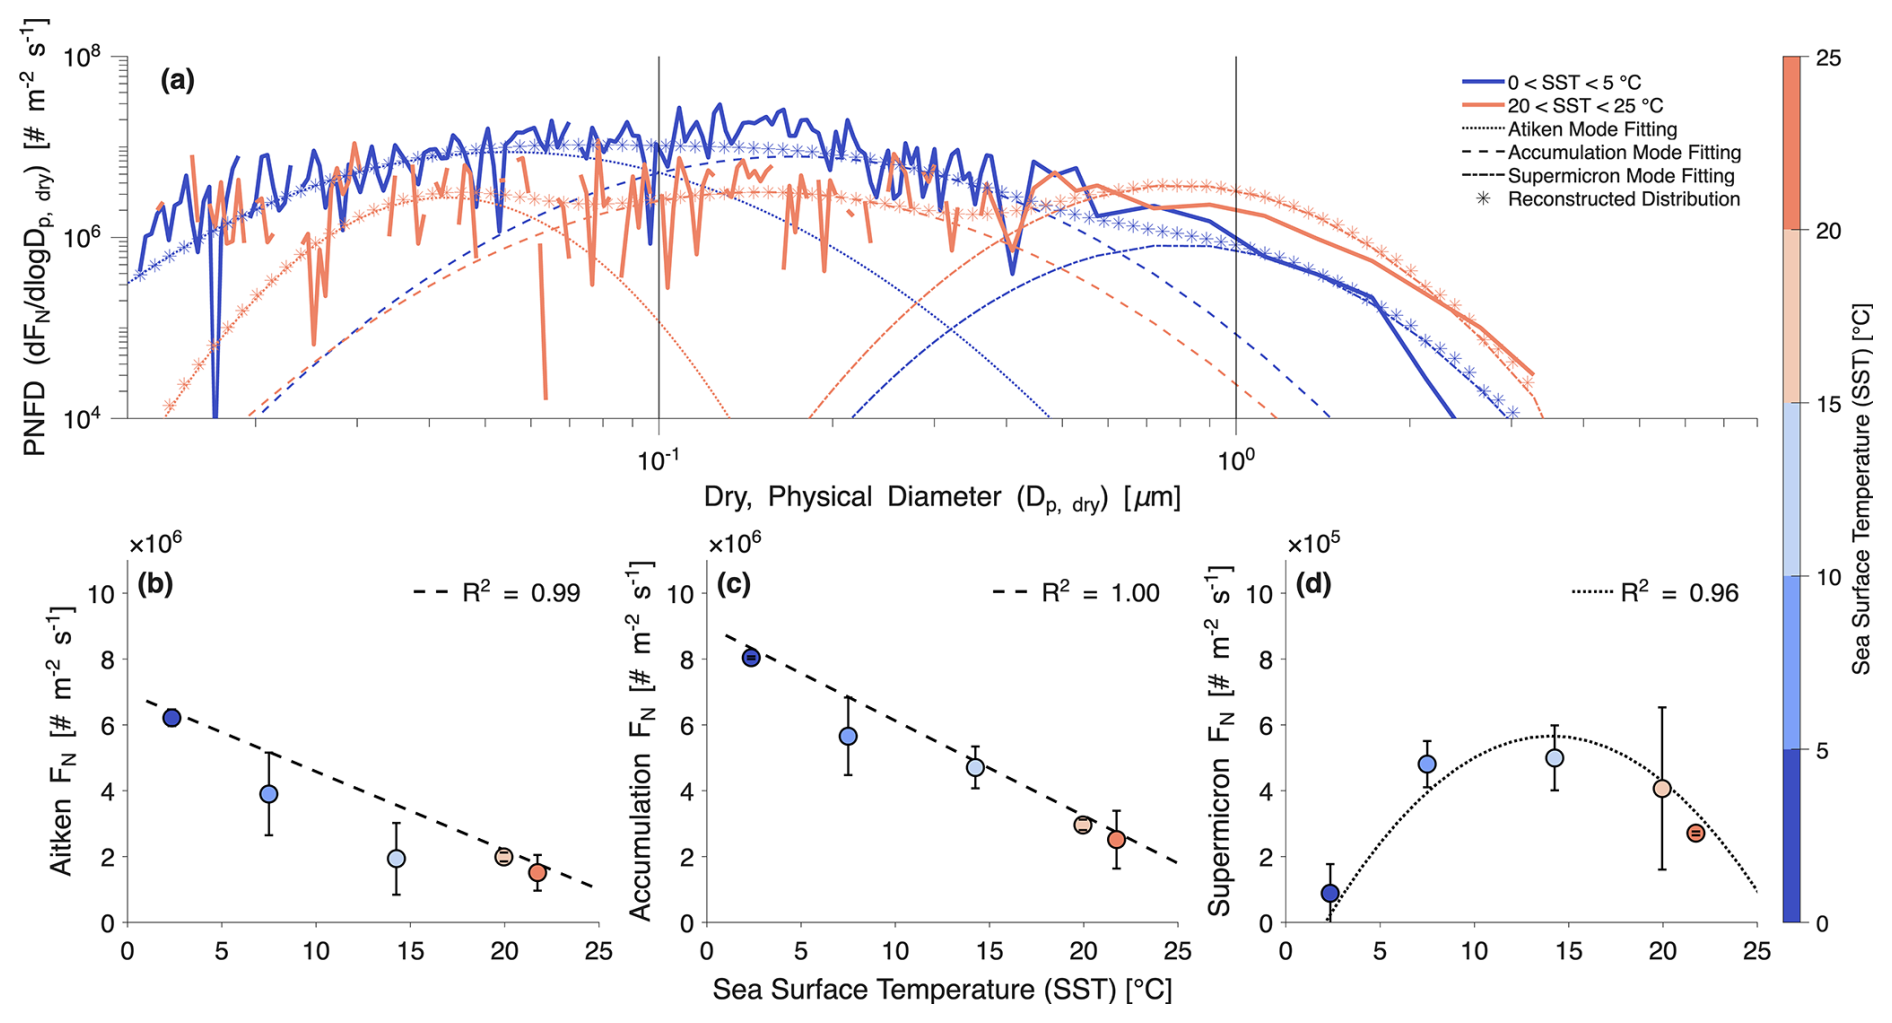
Figure 7Extreme SST-binned mean PNFD modal decomposition and SST-binned, uncertainty-weighted FN trends. (a) Average PNFD for 2 and 23 °C. Each PNFD is decomposed into three log-normal modes and reconstructed. Weighted least squares linear (dashed lines) and quadratic (dotted lines) regressions of total number flux for the (b) Aitken, (c) accumulation, and (d) supermicron modes.
While SSA production has been investigated with various breaking wave analogues in the laboratory (Bowyer et al., 1990; Forestieri et al., 2018; Salter et al., 2014), experiments on SSA production should be conducted with an accompanying emphasis on understanding the dynamics and evolution of the bubble plume, similar to Callaghan et al. (2014). The structure of the subsurface bubble plume is governed by the fluid dynamics within the entire water column, which is dependent on winds and waves (Crawford and Farmer, 1987). The air-side fluid dynamics are also dependent on the method of air entrainment (plunging jet vs. spilling breaker, e.g., Yang et al., 2018), and the spilling breakers in SOARS likely generate dynamic differences from the plunging sheets used previously (Callaghan et al., 2014; Forestieri et al., 2018). The fluid dynamics of each system will vary owing to the system dimensions and presence or absence of wind, influencing the SSA deposition rate, D1 (Eq. 8).
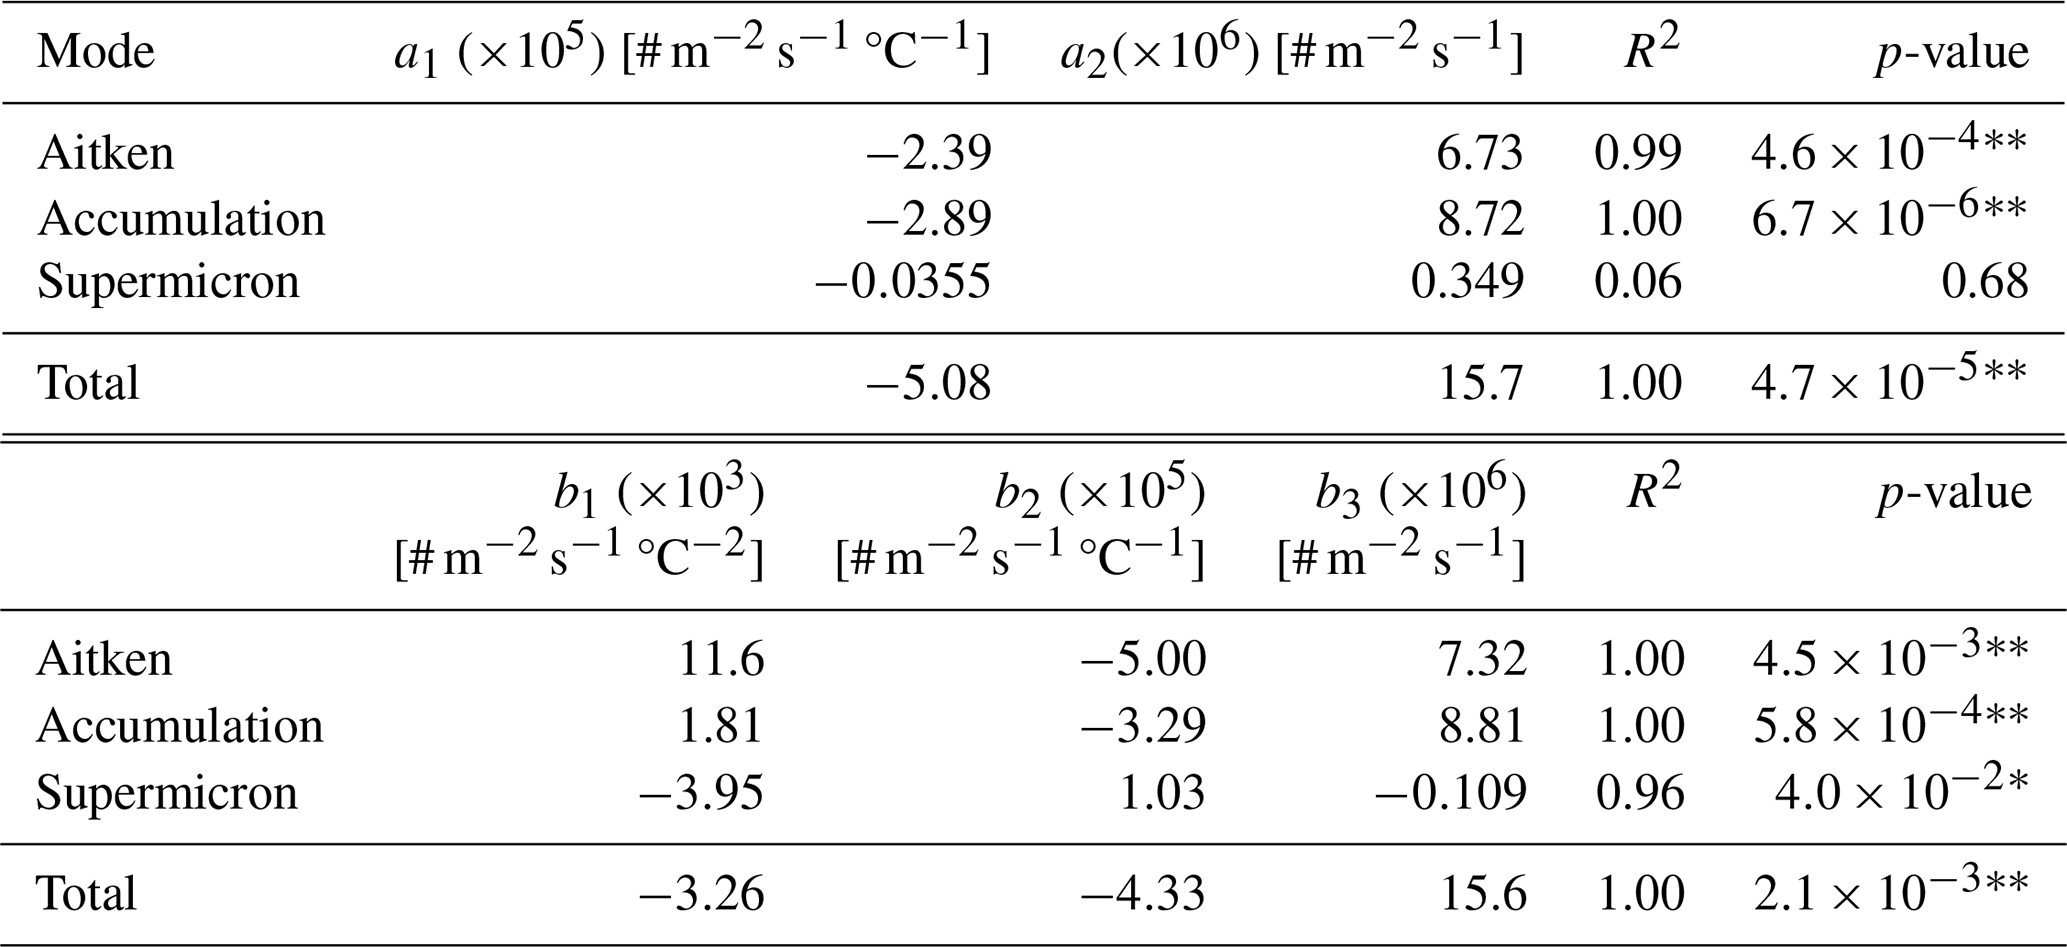
Table 1Least squares regression and coefficients of determination for linear and quadratic fits to total number fluxes. Astricts indicate a statistical significance of p-values exceeding the 95 % (*) and 99 % confidence levels ().
3.5 Particle Number Flux Distributions
Emission fluxes of SSA in SOARS also decrease with increasing SST, but with a striking size-dependence. Size-resolved PNFDs at the lowest and highest SSTs (Fig. 7a) reveal a crossover: SSA smaller than 0.6 µm are emitted at lower rates at high SSTs, while SSA larger than 0.75 µm show the opposite trend. Tri-modal fitting quantifies this divergence, where total number flux (FN) for the Aitken and accumulation modes decreases by 82 % and 58 %, respectively, while supermicron FN increases by more than a factor of three (Table S4). This size-dependent behaviour suggests that the mechanisms governing film drop production (predominantly submicron) and jet drop production (predominantly supermicron) respond differently to changes in SST. Linear regressions capture the Aitken and accumulation mode trends well (R2≥0.99, p≪0.01), while the supermicron mode requires a quadratic fit, consistent with its non-monotonic SST dependence (Table 1, Eqs. 11–12). These regressions were evaluated separately for each experiment and for all measurements combined (Fig. S13) to account for the limited number of temperature bins (n=5).
Aitken and accumulation mode SSA number flux SST dependencies exhibit trends well captured by both linear and quadratic regressions (R2≥0.99, p≪0.01), while the SST dependence of supermicron SSA is only sufficiently captured by a quadratic regression (R2=0.96, p<0.05). SSA number emissions are dominated by submicron SSA (Fig. 7a), so a first-order SST dependency is recommended for computational efficiency during model integration. Further, a monotonically decreasing SST dependence for total SSA number flux agrees with previous estimates (Grythe et al., 2014; Lehahn et al., 2014; Markuszewski et al., 2024). This first-order relationship forms the basis of the temperature-dependent number flux correction factor (CFN), developed in Sect. 3.6 for direct integration into ESMs.
To ensure compatibility with SSA modelling schemes that parameterize emissions by mass and compare to previous measurements of mass fluxes, the PNFDs and FN values are converted to particle mass flux distributions (PMFDs) and total mass flux (FM), assuming spherical particles and a density of 2.2 g cm−3 (Brock et al., 2019; Wu et al., 2020) (Figs. S9, S14). The mass flux results diverge markedly from the number flux results. Because particle mass scales with the cube of diameter, FM is dominated by the largest SSA in each mode – particles whose number emission rates increase with SST (Fig. 7a). As a result, while the Aitken mode PMFD mirrors its PNFD counterpart, both the accumulation and supermicron mode PMFDs exhibit non-monotonic SST dependencies with maxima near 13 °C, resembling the supermicron PNFD behaviour. Note that these PMFD trends differ from the curves in Fig. 5f, which reflect steady-state concentrations rather than emission fluxes.
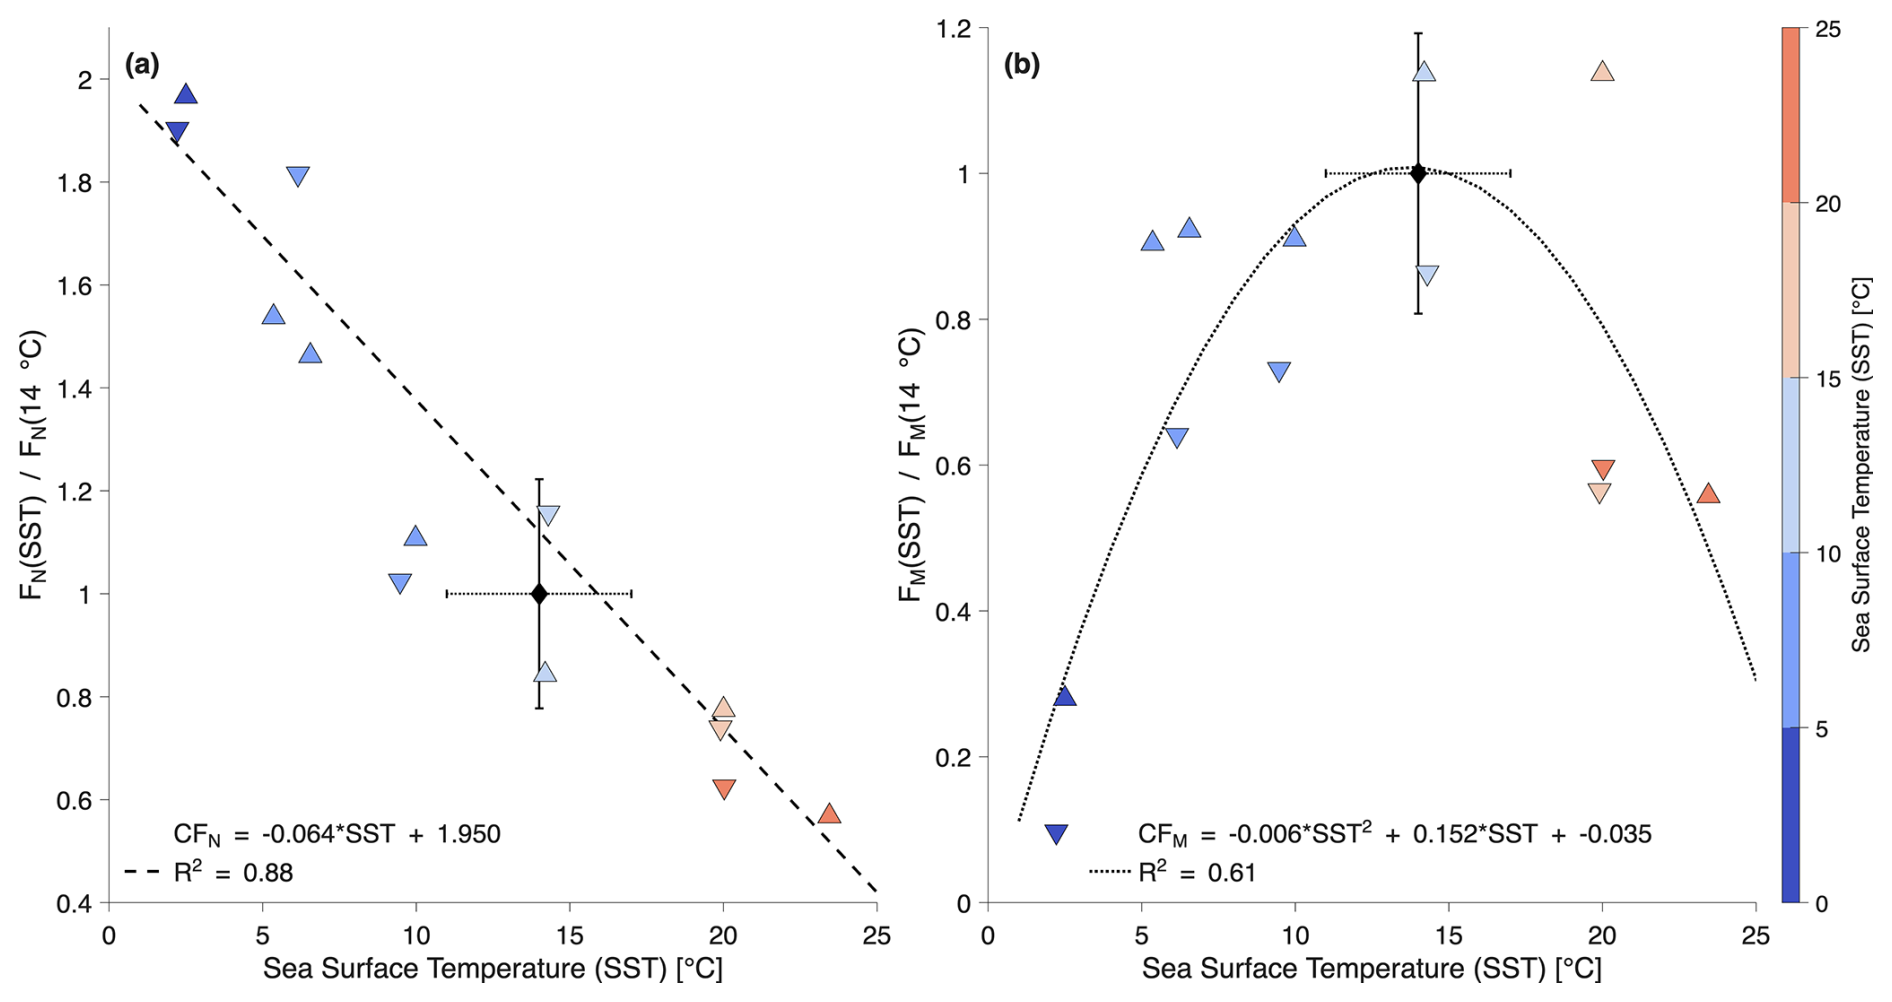
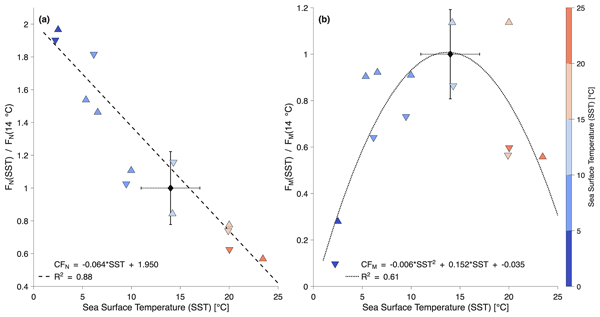
Figure 8Correction factors applied to the complete sets of FN and FM measurements. (a) Total number emission flux (FN) and (b) total mass emission flux (FM) as a function of SST, normalized by the average flux at 14 °C. The black diamond depicts flux at 14 °C, and the vertical error bars represent one standard deviation. The horizontal error bars represent the annual SST range of the coastal seawater sourced for this study.
While a direct comparison of SSA flux estimates from SOARS to literature values is evaluated in a separate publication, it's important to contextualize the SST-dependent flux estimates determined in this work. The FM estimates vary between kg m−2 s−1 at 2 °C to kg m−2 s−1 at 14 °C, corresponding to approximate annual global SSA fluxes of 72–383 Pg yr−1. These values lie within the bounds of previous studies (Grythe et al., 2014), but are greater than most estimates. Therefore, we normalize the SST-dependent fluxes by the estimate at moderate SSTs to capture the SST trends. The opposing SST dependencies of FN and FM – one monotonically decreasing, the other non-monotonic – necessitate separate correction factors for number and mass emissions in models. A temperature-dependent mass flux correction factor (CFM) is developed alongside CFN in Sect. 3.6.
3.6 Correction Factors (CFs) for Model Integration of SST Dependence
The uncertainties of simulated SSA in ESMs can be reduced by incorporating SST-dependent emission correction factors derived from the SOARS total number flux (CFN) and mass flux (CFM) measurements. Critically, these correction factors arise from regressions fit through normalized production fluxes to remove any dependence on absolute emission rates in SOARS, making them applicable to any SSA emission scheme (Fig. 8). FN at each SST is normalized by the average FN at 14±3 °C ( #SSA m−2 s−1), a reference temperature chosen to represent the annual SST range of the local seawater used in this study (Espinosa-Carreón et al., 2001). CFM is generated through a parallel normalization of FM at 14±3 °C ( kg m−2 s−1). CFN and CFM are represented by Eqs. (13) and (14), respectively:
These correction factors are chosen as simple, yet encompassing, representations of the SST dependencies of total FN and FM. They rely on all the FN and FM measurements made across the two experiments and are not binned by SST. The linear CFN shows good correlation (R2=0.88, p≪0.01) and is valid across the SST values ranging from freezing (approximately −1.8 °C) to 30 °C. On the other hand, the quadratic CFM shows adequate correlation (R2=0.61, p<0.01) and is valid for SST values between 0.25 and 25 °C. These validity bounds are determined by when the CFs become negative; however, we advise only adapting them to SSTs between 2 and 25 °C, consistent with the conditions tested here. These CFs mirror the trends of the dominant modes, where FN is dominated by the accumulation mode, and FM is dominated by the supermicron mode. While they do not account for the size-dependent differences highlighted in this work, they represent a first step towards integrating SOARS measurements into ESMs to improve the simulation of SSA.
Incorporating these correction factors into ESMs would substantially alter simulated SSA burdens, consistent with sensitivity analyses in previous work (Grythe et al., 2014; Jaeglé et al., 2011; Ovadnevaite et al., 2014; Sofiev et al., 2011). The magnitude of this impact is underscored by the fact that only half of the emission schemes that currently incorporate an SST dependence predict the correct sign as measured here (Grythe et al., 2014; Mårtensson et al., 2003; Salter et al., 2015). The other emission schemes simulate increasing SSA production with SST. The CFM from SOARS introduces an additional sensitivity at moderate SSTs, where small deviations from approximately 13 °C will lead to large decreases in mass flux, a regime that encompasses much of the global ocean. Because Eqs. (13)–(14) are derived from SSA produced by realistic wind-wave interactions, they represent the most physically grounded, laboratory-based SST correction factors currently available for ESM integration. Once integrated, these CFs would deviate from the currently utilized SST dependencies of Jaeglé et al. (2011) and Sofiev et al. (2011), referred to here by the abbreviations J11 and S11. The CFM of J11 is similar to our CFM for SSTs less than 13 °C. For warmer SSTs, our CFM would drastically decrease mass production, likely decreasing sea salt aerosol optical depth (SSAOD) over equatorial regions. The S11 CFs mimic our findings in the Aitken mode (increasing FN with decreasing SST) but deviate in the accumulation and supermicron modes showing an increase in FN with increasing SSTs. Therefore, replacing the S11 CFs with ours would decrease SSA number concentrations over warm water, likely outside most of the regions they identified for comparison to satellite retrievals of SSAOD.
These CFs are designed so that the SOARS-derived SST relationships can be adopted to emission schemes regardless of whether they are estimating number or mass (volume) flux. However, one limitation of the presented CFs is that they are not mutually consistent when applied to the same emission scheme. That is to say that applying the CFN to an SSA number flux emission scheme and then calculating SSA mass produces a different answer than converting the PNFD to a PMFD and then applying the CFM. This is due to the drastically different relationships of SSA number and SSA mass. These mismatches can be as large as a factor of 8 for SSTs around 2 °C, decrease to a minimum of about 1.05 for SSTs around 18 °C, and increase to about a factor of 3 for the highest SSTs. These differences highlight the variability arising from number versus mass measurements and the importance of retaining quantity consistency (i.e., number, surface area, volume, or mass) between measurements, emission schemes, and correction factors. However, these differences are within typical variability across SSA emission schemes and SST dependencies. Therefore, the CFs improve emission schemes without an SST dependence or with one of the wrong sign; users should apply the CF that matches their emission scheme quantity (number or mass) and not cross-convert.
3.7 Temperature Hysteresis Effects
We also characterize the effect of SST hysteresis (whether the SST dependence is different when SSTs are increasing or decreasing across a common range) on the relationship to SSA production. Section 3.3 discussed the influence of SST on SSA concentrations for SST-binned data, demonstrating a linear relationship between concentrations of Aitken and accumulation mode SSA and a quadratic relationship for supermicron SSA. Figure S10 shows the same analysis for the cooling and warming experiments. Binning data by SST produced an average increase of R2 by 0.1 for linear models and 0.04 for quadratic models and did not alter which regression type produced the best result. Furthermore, all regressions remained statistically significant at the 95 % confidence level. Regressions comparing N, S, and V also showed slight improvement when data was binned compared to cooling and warming experiments independently (Fig. S11).
The loss rates used in the PNFD calculations were similarly separated by each experiment (Fig. S12). To our knowledge, this is the first estimate of the effect of varied SSTs on aerosol loss rates, a process that is best investigated in laboratory studies. The mean loss rate between the experiments and across sizes was found to be 0.30 min−1, with the warming and cooling experiments approaching asymptotes of 0.38 and 0.30 min−1, respectively. The warming experiment exhibits larger loss rates on average (by approximately 20 %–30 %), though the cooling and warming experiments remain within one standard deviation of each other across all sizes. The small variations in loss rates are three to four times smaller than the variations in FN, and are therefore not expected to drive the larger-scale findings of the PNFD analysis and are not explored further here. Future studies should target SST-dependent loss rate variability to better understand the influence on flux and concentration estimates.
The SSA flux analyses (Sect. 3.5) were repeated for the cooling experiment, the warming experiment, and both experiments combined (Figs. S13–S14). Interestingly, the warming experiment exhibited better regression statistics with linear fits for accumulation (R2=0.96, p≪0.01) and total (R2=0.91, p≪0.01) FN compared to the cooling experiment (accumulation: R2=0.84, p<0.05; total: R2=0.87, p<0.05). The supermicron mode quadratic regression exhibited similar R2 values between the experiments (warming: 0.79, cooling: 0.80) accompanied by significant p-values (warming: 0.02, cooling: 0.04). Conversely, for FM, the cooling experiment exhibited better fitting regressions than the warming experiment, with a linear regression fitting the Aitken mode (cooling: R2=0.98, p≪0.01; warming: R2=0.70, p<0.01) and quadratic regressions in the accumulation mode (cooling: R2=0.61, p=0.1; warming: R2=0.46, p>0.1), supermicron mode (cooling: R2=0.99, p≪0.01; warming: R2=0.86, p=0.01), and total SSA mass (cooling: R2=0.97, p<0.01; warming: R2=0.80, p<0.05). While this indicates that temperature hysteresis may influence the strength of the fitted SST dependencies of SSA emission flux, the trends are consistent despite hysteresis. Future work should identify if FN continues to be better correlated under warming SSTs while FM is better correlated under cooling SSTs.
We further evaluate the impact of temperature hysteresis on the CFs described in the previous section by generating linear and quadratic CFs for the cooling and warming experiments individually (Fig. S15). The linear form of CFN remains a statistically significant good fit for both the cooling experiment (R2=0.87, p<0.05) and the warming experiment (R2=0.91, p≪0.01). The quadratic form of CFM similarly remains a good fit and significant for both experiments: R2=0.97, p<0.01 and R2=0.80, p<0.05 for the cooling and warming experiments, respectively. This reaffirms that the functional forms of the CFs in Eqs. (13)–(14) are correct based on all available SOARS data; however, the coefficients of the CFs vary between each experiment and the general CFs in Fig. 8. The similarity of the regression coefficients was evaluated using the Chow test. The p-value of the linear CFN regression was 0.79, indicating that the coefficients were not significantly different between the experiments. On the other hand, the p-value of the quadratic CFM regressions was found to be 0.03, indicating that there were statistically significant differences in the coefficients. Temperature hysteresis may therefore lead to varied mass CFs. However, SST hysteresis is difficult to apply in real world fashions due to variability on timescales of days to weeks and substantial noise in the variability. We therefore recommend the generalized CFM in Eq. (14) as the best approximation to account for the SST dependence of SOARS-derived SSA mass fluxes in models.
This is the first study to generate SSA through wind-wave interactions in controlled laboratory conditions under varied SSTs, using a comprehensive set of measurement techniques to probe the uncertain relationship between SST and SSA production. The results presented here incorporate measurements of whitecap fraction, subsurface bubble concentrations, steady-state SSA concentrations, and SSA emission fluxes to build a robust framework for characterizing the SST dependence of SSA. Wind-driven SSA production leads to SST dependencies inconsistent with previous laboratory studies that replicate wave breaking conditions. This reinforces the importance of producing SSA from wind-wave interactions to clarify the size-resolved, mechanistically driven SST dependencies.
Increasing SST in SOARS from 2 to 23 °C suppresses subsurface bubble concentrations (Fig. 2b), total SSA number concentration (Fig. 3), and total SSA number emission flux (Fig. 7) by factors of approximately 1.5, 3, and 3, respectively. Critically, this general suppression is not size-independent; the shift of the SST dependence of FN between 0.6 and 0.75 µm emphasizes that no single monotonic SST dependence describes SSA production. The size-resolved SST dependencies differed in strength and shape, suggesting the occurrence of a physicochemical or mechanistic shift. Surface area and volume distributions (Fig. 5) showed pronounced shifts while supermicron SSA fluxes and most SSA mass fluxes show non-monotonic SST dependencies sensitive to the SST value. These findings depend on realistic SSA production methods to corroborate previous estimates (Christiansen et al., 2019; Lehahn et al., 2014; Markuszewski et al., 2024; Nielsen and Bilde, 2020; Salter et al., 2014, 2015; Sellegri et al., 2023).
Although there are system-specific considerations for interpreting these measurements, the use of wind-wave interactions to produce SSA are the most representative of conditions outside of SOARS to date (Leibensperger III et al., 2026b). The general suppression of subsurface bubble concentrations, total SSA number concentrations, and total SSA number fluxes with increasing SST is common across experiments, independent of SST hysteresis. Supermicron FN and FM for SSA larger than 0.1 µm are suppressed as SSTs diverge from approximately 13 °C. SST hysteresis can lead to meaningful changes in CFM coefficients, indicating an open area of future research. These results indicate that aerosol number exhibits a stronger dependence on the magnitude of SST than hysteresis, while aerosol mass (and the supermicron mass-containing aerosols) depend on the direction of SST change coupled with the magnitude of the SST.
Subsequent work should pursue three avenues to better understand the temperature dependence of SSA production and the associated impacts. The first avenue should characterize the physicochemical mixing state of SSA at varied SSTs. Changes in mixing state are likely to accompany the shifts in production identified here and will directly depend on water composition. Aerosol composition shifts with temperature may explain the variability from previous studies and partially reconcile differences between laboratory and field estimates of the SST dependence of SSA production.
The second avenue should seek to better characterize the SST-dependent SSA production at the single-bubble level. We hypothesize that changes in the emission rate of SSA per bubble (E) or in subsurface bubble concentrations (n) are the cause of changes in SSA number, with strong dependencies on aerosol and bubble sizes. While the aerosol size-dependent SST trends are well documented here, more focus on the bubble size-dependent SST dependencies of the terms in Eq. (8) is vital for future work. Laboratory experiments focused on the role of SST in determining single-bubble bursting characteristics are currently missing from the literature and represent a knowledge gap that inhibits our understanding of interfacial fluxes. As mentioned in Sect. 3.3., single-bubble experiments can also isolate the SST dependencies of film drop production and jet drop production, which are needed to better understand the mechanistic drivers of the SST dependence of bulk SSA measurements.
The third avenue should focus on improved simulation of the SSA-SST dependence. Simulations should span the scales from direct numerical simulation of single-bubble processes to Earth system modelling using the CFN and CFM described here. Direct numerical simulation of single bubbles and bubble plumes can connect SST-dependencies across scales and improve the framework described in Sect. 3.1. Recent direct numerical simulation of breaking waves emphasizes the need to perform fine-resolution simulations (Yang et al., 2018), where SST-dependent systems should be a primary focus. Incorporation of the SOARS-based CFs could dramatically change simulated SSA production, likely decreasing marine-derived SSAOD over the warmest equatorial water. This change in SSAOD is likely to be even stronger under historical and projected scenarios in which SSTs are likely to change significantly. Improving simulated SSA dependence on SST is critical to understand associated changes in marine aerosol burdens, cloud condensation nuclei concentrations, and radiative forcing estimates.
All data and code needed to recreate these results are stored in the University of California San Diego Library data archive with a publicly accessible DOI (https://doi.org/10.6075/J01V5FXR; Leibensperger III et al., 2026a).
The supplement related to this article is available online at https://doi.org/10.5194/acp-26-12211-2026-supplement.
RJLIII and KAP conceptualized the study; RJLIII, JDH, MOA, and GBD created methodology for data collection and analysis; RJLIII, JDH, GBD, MDS, and GS curated software necessary for collection and analysis; JDH, RJLIII, GBD, and MDS performed data validation; JDH, RJLIII, and GBD performed formal analysis; RJLIII, JDH, JKH, KAK, and CH carried out the investigation; KAP, CL, GBD, MDS, and MOA provided resources; JDH, RJLIII, and JKH curated the data; RJLIII and JDH prepared the manuscript with contributions from all authors; JDH and RJLIII visualized the data; RJLIII, KAK, CH, CL, MDS, GBD, MOA, and KAP supervised the project; RJLIII, CL, GBD, and KAP administered the project; KAP and GBD acquired funding.
The contact author has declared that none of the authors has any competing interests.
Publisher's note: Copernicus Publications remains neutral with regard to jurisdictional claims made in the text, published maps, institutional affiliations, or any other geographical representation in this paper. The authors bear the ultimate responsibility for providing appropriate place names. Views expressed in the text are those of the authors and do not necessarily reflect the views of the publisher.
The authors acknowledge Joseph Mayer, Robert Klidy, and the team at the Marine Science Development Center at Scripps Institution of Oceanography for their dedication to the maintenance and operation of SOARS. The authors acknowledge meaningful conversations with James Bird, Duncan Watson-Parris, and Anne Barkley which helped extend the impact of this work.
This research has been supported by the National Science Foundation (grant nos. OCE-1727039, CHE-1801971, and OCE-1924393).
This paper was edited by Qi Chen and reviewed by two anonymous referees.
Albrecht, B. A.: Aerosols, Cloud Microphysics, and Fractional Cloudiness, Science, 245, 1227–1230, 1989.
Amanatidis, S., Kim, C., Spielman, S. R., Lewis, G. S., Hering, S. V., and Flagan, R. C.: The Spider DMA: A miniature radial differential mobility analyzer, Aerosol Sci. Technol., 54, 175–189, https://doi.org/10.1080/02786826.2019.1626974, 2020.
Amanatidis, S., Huang, Y., Pushpawela, B., Schulze, B. C., Kenseth, C. M., Ward, R. X., Seinfeld, J. H., Hering, S. V., and Flagan, R. C.: Efficacy of a portable, moderate-resolution, fast-scanning differential mobility analyzer for ambient aerosol size distribution measurements, Atmos. Meas. Tech., 14, 4507–4516, https://doi.org/10.5194/amt-14-4507-2021, 2021.
Andreas, E. L., Edson, J. B., Monahan, E. C., Rouault, M. P., and Smith, S. D.: The spray contribution to net evaporation from the sea: A review of recent progress, Bound.-Lay. Meteorol., 72, 3–52, https://doi.org/10.1007/BF00712389, 1995.
Bird, J. C., de Ruiter, R., Courbin, L., and Stone, H. A.: Daughter bubble cascades produced by folding of ruptured thin films, Nature, 465, 759–762, https://doi.org/10.1038/nature09069, 2010.
Bowyer, P. A., Woolf, D. K., and Monahan, E. C.: Temperature dependence of the charge and aerosol production associated with a breaking wave in a whitecap simulation tank, J. Geophys. Res.-Oceans, 95, 5313–5319, https://doi.org/10.1029/JC095iC04p05313, 1990.
Brasz, C. F., Bartlett, C. T., Walls, P. L. L., Flynn, E. G., Yu, Y. E., and Bird, J. C.: Minimum size for the top jet drop from a bursting bubble, Phys. Rev. Fluids, 3, 074001, https://doi.org/10.1103/PhysRevFluids.3.074001, 2018.
Brock, C. A., Williamson, C., Kupc, A., Froyd, K. D., Erdesz, F., Wagner, N., Richardson, M., Schwarz, J. P., Gao, R.-S., Katich, J. M., Campuzano-Jost, P., Nault, B. A., Schroder, J. C., Jimenez, J. L., Weinzierl, B., Dollner, M., Bui, T., and Murphy, D. M.: Aerosol size distributions during the Atmospheric Tomography Mission (ATom): methods, uncertainties, and data products, Atmos. Meas. Tech., 12, 3081–3099, https://doi.org/10.5194/amt-12-3081-2019, 2019.
Callaghan, A. H., Stokes, M. D., and Deane, G. B.: The effect of water temperature on air entrainment, bubble plumes, and surface foam in a laboratory breaking-wave analog, J. Geophys. Res.-Oceans, 119, 7463–7482, https://doi.org/10.1002/2014JC010351, 2014.
Chang, H.-M., Vazquez, C. I., Shiu, R.-F., and Chin, W.-C.: Temperature Effects on Effluent Microgel Formation, Polymers, 14, 4870, https://doi.org/10.3390/polym14224870, 2022.
Christiansen, S., Salter, M. E., Gorokhova, E., Nguyen, Q. T., and Bilde, M.: Sea Spray Aerosol Formation: Laboratory Results on the Role of Air Entrainment, Water Temperature, and Phytoplankton Biomass, Environ. Sci. Technol., 53, 13107–13116, https://doi.org/10.1021/acs.est.9b04078, 2019.
Chu, W., Zhang, R., Jiang, X., Villermaux, E., and Wang, X.: Critical Role of Sea Spray Aerosol Production Pathways in Particulate Transfer Across the Sea-Air Interface, J. Geophys. Res.-Atmos., 130, e2025JD044168, https://doi.org/10.1029/2025JD044168, 2025.
Collins, D. B., Zhao, D. F., Ruppel, M. J., Laskina, O., Grandquist, J. R., Modini, R. L., Stokes, M. D., Russell, L. M., Bertram, T. H., Grassian, V. H., Deane, G. B., and Prather, K. A.: Direct aerosol chemical composition measurements to evaluate the physicochemical differences between controlled sea spray aerosol generation schemes, Atmos. Meas. Tech., 7, 3667–3683, https://doi.org/10.5194/amt-7-3667-2014, 2014.
Crawford, G. B. and Farmer, D. M.: On the spatial distribution of ocean bubbles, J. Geophys. Res.-Oceans, 92, 8231–8243, https://doi.org/10.1029/JC092iC08p08231, 1987.
Czerski, H.: An Inversion of Acoustical Attenuation Measurements to Deduce Bubble Populations, J. Atmos. Oceanic Technol., 29, 1139–1148, https://doi.org/10.1175/JTECH-D-11-00170.1, 2012.
Deike, L.: Mass Transfer at the Ocean-Atmosphere Interface: The Role of Wave Breaking, Droplets, and Bubbles, Annu. Rev. Fluid Mech., 2022, 191–224, https://doi.org/10.1146/annurev-fluid-030121-014132, 2022.
Deike, L., Reichl, B. G., and Paulot, F.: A Mechanistic Sea Spray Generation Function Based on the Sea State and the Physics of Bubble Bursting, AGU Adv., 3, e2022AV000750, https://doi.org/10.1029/2022AV000750, 2022.
de Leeuw, G., Andreas, E. L., Anguelova, M. D., Fairall, C. W., Lewis, E. R., O'Dowd, C., Schulz, M., and Schwartz, S. E.: Production flux of sea spray aerosol, Rev. Geophys., 49, https://doi.org/10.1029/2010RG000349, 2011.
DeMott, P. J., Hill, T. C. J., McCluskey, C. S., Prather, K. A., Collins, D. B., Sullivan, R. C., Ruppel, M. J., Mason, R. H., Irish, V. E., Lee, T., Hwang, C. Y., Rhee, T. S., Snider, J. R., McMeeking, G. R., Dhaniyala, S., Lewis, E. R., Wentzell, J. J. B., Abbatt, J., Lee, C., Sultana, C. M., Ault, A. P., Axson, J. L., Martinez, M. D., Venero, I., Santos-Figueroa, G., Stokes, M. D., Deane, G. B., Mayol-Bracero, O. L., Grassian, V. H., Bertram, T. H., Bertram, A. K., Moffett, B. F., and Franc, G. D.: Sea spray aerosol as a unique source of ice nucleating particles, P. Natl. Acad. Sci. USA, 113, 5797–5803, https://doi.org/10.1073/pnas.1514034112, 2016.
Dubitsky, L., Deane, G. B., Stokes, D. M., and Bird, J. C.: Modeling the Concentration Enhancement and Selectivity of Plastic Particle Transport in Sea Spray Aerosols, J. Geophys. Res.-Oceans, 129, e2023JC020396, https://doi.org/10.1029/2023JC020396, 2024.
Espinosa-Carreón, T. L., Gaxiola-Castro, G., Robles-Pacheco, J. M., and Nájera-Martínez, S.: Temperature, salinity, nutrients and chlorophyll a in coastal waters of the Southern California Bight, Cienc. Mar., 27, 397–422, https://doi.org/10.7773/cm.v27i3.490, 2001.
Forestieri, S. D., Moore, K. A., Martinez Borrero, R., Wang, A., Stokes, M. D., and Cappa, C. D.: Temperature and Composition Dependence of Sea Spray Aerosol Production, Geophys. Res. Lett., 45, 7218–7225, https://doi.org/10.1029/2018GL078193, 2018.
Foster, G. and Rahmstorf, S.: Global Warming Has Accelerated Significantly, Geophys. Res. Lett., 53, e2025GL118804, https://doi.org/10.1029/2025GL118804, 2026.
Fuentes, E., Coe, H., Green, D., de Leeuw, G., and McFiggans, G.: Laboratory-generated primary marine aerosol via bubble-bursting and atomization, Atmos. Meas. Tech., 3, 141–162, https://doi.org/10.5194/amt-3-141-2010, 2010.
Gliß, J., Mortier, A., Schulz, M., Andrews, E., Balkanski, Y., Bauer, S. E., Benedictow, A. M. K., Bian, H., Checa-Garcia, R., Chin, M., Ginoux, P., Griesfeller, J. J., Heckel, A., Kipling, Z., Kirkevåg, A., Kokkola, H., Laj, P., Le Sager, P., Lund, M. T., Lund Myhre, C., Matsui, H., Myhre, G., Neubauer, D., van Noije, T., North, P., Olivié, D. J. L., Rémy, S., Sogacheva, L., Takemura, T., Tsigaridis, K., and Tsyro, S. G.: AeroCom phase III multi-model evaluation of the aerosol life cycle and optical properties using ground- and space-based remote sensing as well as surface in situ observations, Atmos. Chem. Phys., 21, 87–128, https://doi.org/10.5194/acp-21-87-2021, 2021.
Grythe, H., Ström, J., Krejci, R., Quinn, P., and Stohl, A.: A review of sea-spray aerosol source functions using a large global set of sea salt aerosol concentration measurements, Atmos. Chem. Phys., 14, 1277–1297, https://doi.org/10.5194/acp-14-1277-2014, 2014.
Hansen, J., Sato, M., Ruedy, R., Lo, K., Lea, D. W., and Medina-Elizade, M.: Global temperature change, P. Natl. Acad. Sci. USA, 103, 14288–14293, https://doi.org/10.1073/pnas.0606291103, 2006.
Haywood, J. and Boucher, O.: Estimates of the direct and indirect radiative forcing due to tropospheric aerosols: A review, Rev. Geophys., 38, 513–543, https://doi.org/10.1029/1999RG000078, 2000.
Hering, S. V., Lewis, G. S., Spielman, S. R., and Eiguren-Fernandez, A.: A MAGIC concept for self-sustained, water-based, ultrafine particle counting, Aerosol Sci. Technol., 53, 63–72, https://doi.org/10.1080/02786826.2018.1538549, 2019.
Hu, J., Li, J., Tsona Tchinda, N., Song, Y., Xu, M., Li, K., and Du, L.: Underestimated role of sea surface temperature in sea spray aerosol formation and climate effects, npj Clim. Atmos. Sci., 7, 1–12, https://doi.org/10.1038/s41612-024-00823-x, 2024.
Intergovernmental Panel on Climate Change (IPCC) (Ed.): The Earth's Energy Budget, Climate Feedbacks and Climate Sensitivity, in: Climate Change 2021 – The Physical Science Basis: Working Group I Contribution to the Sixth Assessment Report of the Intergovernmental Panel on Climate Change, Cambridge University Press, Cambridge, 923–1054, https://doi.org/10.1017/9781009157896.009, 2023.
Jaeglé, L., Quinn, P. K., Bates, T. S., Alexander, B., and Lin, J.-T.: Global distribution of sea salt aerosols: new constraints from in situ and remote sensing observations, Atmos. Chem. Phys., 11, 3137–3157, https://doi.org/10.5194/acp-11-3137-2011, 2011.
Jia, N. and Zhao, D.: The Influence of Wind Speed and Sea States on Whitecap Coverage, J. Ocean Univ. China, 18, 282–292, https://doi.org/10.1007/s11802-019-3808-7, 2019.
Jiang, X., Rotily, L., Villermaux, E., and Wang, X.: Abyss Aerosols: Drop Production from Underwater Bubble Collisions, Phys. Rev. Lett., 133, 024001, https://doi.org/10.1103/PhysRevLett.133.024001, 2024.
Kay, J. E., Wall, C., Yettella, V., Medeiros, B., Hannay, C., Caldwell, P., and Bitz, C.: Global Climate Impacts of Fixing the Southern Ocean Shortwave Radiation Bias in the Community Earth System Model (CESM), J. Climate, https://doi.org/10.1175/JCLI-D-15-0358.1, 2016.
Kimble, K. A., Leibensperger, R. J. I., Lee, C., Harb, C., Pogue, E. A., Deane, G. B., Stokes, M. D., and Prather, K. A.: Wind-Driven Influence on Submicron Sea Spray Aerosol Chemical Mixing State, ACS EST Air, https://doi.org/10.1021/acsestair.5c00339, 2026.
Lehahn, Y., Koren, I., Rudich, Y., Bidle, K. D., Trainic, M., Flores, J. M., Sharoni, S., and Vardi, A.: Decoupling atmospheric and oceanic factors affecting aerosol loading over a cluster of mesoscale North Atlantic eddies, Geophys. Res. Lett., 41, 4075–4081, https://doi.org/10.1002/2014GL059738, 2014.
Leibensperger III, R. J., Hamlin, J. D., Herbst, J. K., Harb, C., Kimble, K. A., Andreae, M. O., Lee, C., Sandstrom, G., Stokes, M. D., Deane, G. B., and Prather, K. A.: Data from: Sea surface warming suppresses primary sea spray aerosol number production, in: Center for Aerosol Impacts on Chemistry of the Environment (CAICE), UC San Diego Library Digital Collections, [code and data set], https://doi.org/10.6075/J01V5FXR, 2026a.
Leibensperger III, R. J., Deane, G. B., Lee, C., Harb, C., Stokes, M. D., Kimble, K. A., Andreae, M. O., Herbst, J. K., Pham, E., Hamlin, J. D., Sandstrom, G., Pogue, E. A., and Prather, K. A.: Novel Sea Spray Aerosol Measurements Using the Scripps Ocean-Atmosphere Research Simulator (SOARS), J. Geophys. Res.-Atmos., 131, e2025JD044254, https://doi.org/10.1029/2025JD044254, 2026b.
Lewis, E. R. and Schwartz, S. E.: Sea Salt Aerosol Production Mechanisms, Methods, Measurements and Models, Washington DC, ISBN 087590-417-3, 2004.
Liu, H., Pei, X., Zhang, F., Song, Y., Kuang, B., Xu, Z., and Wang, Z.: Relative Humidity Dependence of Growth Factor and Real Refractive Index for Sea Salt/Malonic Acid Internally Mixed Aerosols, J. Geophys. Res.-Atmos., 128, e2022JD037579, https://doi.org/10.1029/2022JD037579, 2023.
Liu, M. and Yang, B.: Evaluation of Sea Surface Temperature-Dependent Whitecap Coverage Parameterizations Using In Situ Data, Ocean Sci. J., 57, 174–185, https://doi.org/10.1007/s12601-022-00060-4, 2022.
Liu, S., Liu, C. C., Froyd, K. D., Schill, G. P., Murphy, D. M., Bui, T. P., Dean-Day, J. M., Weinzierl, B., Dollner, M., Diskin, G. S., Chen, G., and Gao, R. S.: Sea spray aerosol concentration modulated by sea surface temperature, P. Natl. Acad. Sci. USA, 118, 3–8, https://doi.org/10.1073/pnas.2020583118, 2021.
Llovel, W. and Terray, L.: Observed southern upper-ocean warming over 2005–2014 and associated mechanisms, Environ. Res. Lett., 11, 124023, https://doi.org/10.1088/1748-9326/11/12/124023, 2016.
Lohmann, U. and Feichter, J.: Global indirect aerosol effects: a review, Atmos. Chem. Phys., 5, 715–737, https://doi.org/10.5194/acp-5-715-2005, 2005.
Markuszewski, P., Nilsson, E. D., Zinke, J., Mårtensson, E. M., Salter, M., Makuch, P., Kitowska, M., Niedźwiecka-Wróbel, I., Drozdowska, V., Lis, D., Petelski, T., Ferrero, L., and Piskozub, J.: Multi-year gradient measurements of sea spray fluxes over the Baltic Sea and the North Atlantic Ocean, Atmos. Chem. Phys., 24, 11227–11253, https://doi.org/10.5194/acp-24-11227-2024, 2024.
Mårtensson, E. M., Nilsson, E. D., de Leeuw, G., Cohen, L. H., and Hansson, H.-C.: Laboratory simulations and parameterization of the primary marine aerosol production, J. Geophys. Res.-Atmos., 108, https://doi.org/10.1029/2002JD002263, 2003.
Mehta, S., Ortiz-Suslow, D. G., Smith, A. W., and Haus, B. K.: A Laboratory Investigation of Spume Generation in High Winds for Fresh and Seawater, J. Geophys. Res.-Atmos., 124, 11297–11312, https://doi.org/10.1029/2019JD030928, 2019.
Moore, K. A., Alexander, S. P., Humphries, R. S., Jensen, J., Protat, A., Reeves, J. M., Sanchez, K. J., Kreidenweis, S. M., and DeMott, P. J.: Estimation of Sea Spray Aerosol Surface Area Over the Southern Ocean Using Scattering Measurements, J. Geophys. Res.-Atmos., 127, e2022JD037009, https://doi.org/10.1029/2022JD037009, 2022.
Moore, K. A., Hill, T. C. J., Madawala, C. K., Leibensperger III, R. J., Greeney, S., Cappa, C. D., Stokes, M. D., Deane, G. B., Lee, C., Tivanski, A. V., Prather, K. A., and DeMott, P. J.: Wind-driven emission of marine ice-nucleating particles in the Scripps Ocean-Atmosphere Research Simulator (SOARS), Atmos. Chem. Phys., 25, 3131–3159, https://doi.org/10.5194/acp-25-3131-2025, 2025.
Néel, B. and Deike, L.: Collective bursting of free-surface bubbles, and the role of surface contamination, J. Fluid Mech., 917, A46, https://doi.org/10.1017/jfm.2021.272, 2021.
Nielsen, L. S. and Bilde, M.: Exploring controlling factors for sea spray aerosol production: temperature, inorganic ions and organic surfactants, Tellus B, 72, 1–10, https://doi.org/10.1080/16000889.2020.1801305, 2020.
O'Dowd, C. D. and De Leeuw, G.: Marine aerosol production: a review of the current knowledge, Philos. T. R. Soc. A., 365, 1753–1774, https://doi.org/10.1098/rsta.2007.2043, 2007.
Ovadnevaite, J., Manders, A., de Leeuw, G., Ceburnis, D., Monahan, C., Partanen, A.-I., Korhonen, H., and O'Dowd, C. D.: A sea spray aerosol flux parameterization encapsulating wave state, Atmos. Chem. Phys., 14, 1837–1852, https://doi.org/10.5194/acp-14-1837-2014, 2014.
Peters, T. M. and Leith, D.: Concentration measurement and counting efficiency of the aerodynamic particle sizer 3321, J. Aerosol Sci., 34, 627–634, https://doi.org/10.1016/S0021-8502(03)00030-2, 2003.
Pfeifer, S., Müller, T., Weinhold, K., Zikova, N., Martins dos Santos, S., Marinoni, A., Bischof, O. F., Kykal, C., Ries, L., Meinhardt, F., Aalto, P., Mihalopoulos, N., and Wiedensohler, A.: Intercomparison of 15 aerodynamic particle size spectrometers (APS 3321): uncertainties in particle sizing and number size distribution, Atmos. Meas. Tech., 9, 1545–1551, https://doi.org/10.5194/amt-9-1545-2016, 2016.
Phillips, V. T. J., DeMott, P. J., and Andronache, C.: An Empirical Parameterization of Heterogeneous Ice Nucleation for Multiple Chemical Species of Aerosol, J. Atmos. Sci., 65, 2757–2783, https://doi.org/10.1175/2007JAS2546.1, 2008.
Poulain, S., Villermaux, E., and Bourouiba, L.: Ageing and burst of surface bubbles, J. Fluid Mech., 851, 636–671, https://doi.org/10.1017/jfm.2018.471, 2018.
Prather, K. A., Bertram, T. H., Grassian, V. H., Deane, G. B., Stokes, M. D., DeMott, P. J., Aluwihare, L. I., Palenik, B. P., Azam, F., Seinfeld, J. H., Moffet, R. C., Molina, M. J., Cappa, C. D., Geiger, F. M., Roberts, G. C., Russell, L. M., Ault, A. P., Baltrusaitis, J., Collins, D. B., Corrigan, C. E., Cuadra-Rodriguez, L. A., Ebben, C. J., Forestieri, S. D., Guasco, T. L., Hersey, S. P., Kim, M. J., Lambert, W. F., Modini, R. L., Mui, W., Pedler, B. E., Ruppel, M. J., Ryder, O. S., Schoepp, N. G., Sullivan, R. C., and Zhao, D.: Bringing the ocean into the laboratory to probe the chemical complexity of sea spray aerosol, P. Natl. Acad. Sci. USA, 110, 7550–7555, https://doi.org/10.1073/pnas.1300262110, 2013.
Quinn, P. K., Collins, D. B., Grassian, V. H., Prather, K. A., and Bates, T. S.: Chemistry and Related Properties of Freshly Emitted Sea Spray Aerosol, Chem. Rev., 115, 4383–4399, https://doi.org/10.1021/cr500713g, 2015.
Resplandy, L., Keeling, R. F., Eddebbar, Y., Brooks, M., Wang, R., Bopp, L., Long, M. C., Dunne, J. P., Koeve, W., and Oschlies, A.: Quantification of ocean heat uptake from changes in atmospheric O2 and CO2 composition, Sci. Rep., 9, 20244, https://doi.org/10.1038/s41598-019-56490-z, 2019.
Russell, L. M., Moore, R. H., Burrows, S. M., and Quinn, P. K.: Ocean flux of salt, sulfate, and organic components to atmospheric aerosol, Earth-Sci. Rev., 239, 104364, https://doi.org/10.1016/j.earscirev.2023.104364, 2023.
Saliba, G., Chen, C.-L., Lewis, S., Russell, L. M., Rivellini, L.-H., Lee, A. K. Y., Quinn, P. K., Bates, T. S., Haëntjens, N., Boss, E. S., Karp-Boss, L., Baetge, N., Carlson, C. A., and Behrenfeld, M. J.: Factors driving the seasonal and hourly variability of sea-spray aerosol number in the North Atlantic, P. Natl. Acad. Sci. USA, 116, 20309–20314, https://doi.org/10.1073/pnas.1907574116, 2019.
Salter, M. E., Nilsson, E. D., Butcher, A., and Bilde, M.: On the seawater temperature dependence of the sea spray aerosol generated by a continuous plunging jet, J. Geophys. Res.-Atmos., 119, 9052–9072, https://doi.org/10.1002/2013JD021376, 2014.
Salter, M. E., Zieger, P., Acosta Navarro, J. C., Grythe, H., Kirkevåg, A., Rosati, B., Riipinen, I., and Nilsson, E. D.: An empirically derived inorganic sea spray source function incorporating sea surface temperature, Atmos. Chem. Phys., 15, 11047–11066, https://doi.org/10.5194/acp-15-11047-2015, 2015.
Sellegri, K., Barthelmeß, T., Trueblood, J., Cristi, A., Freney, E., Rose, C., Barr, N., Harvey, M., Safi, K., Deppeler, S., Thompson, K., Dillon, W., Engel, A., and Law, C.: Quantified effect of seawater biogeochemistry on the temperature dependence of sea spray aerosol fluxes, Atmos. Chem. Phys., 23, 12949–12964, https://doi.org/10.5194/acp-23-12949-2023, 2023.
Sofiev, M., Soares, J., Prank, M., de Leeuw, G., and Kukkonen, J.: A regional-to-global model of emission and transport of sea salt particles in the atmosphere, J. Geophys. Res.-Atmos., 116, https://doi.org/10.1029/2010JD014713, 2011.
Sofieva, S., Asmi, E., Atanasova, N. S., Heikkinen, A. E., Vidal, E., Duplissy, J., Romantschuk, M., Kouznetsov, R., Kukkonen, J., Bamford, D. H., Hyvärinen, A.-P., and Sofiev, M.: Effects of temperature and salinity on bubble-bursting aerosol formation simulated with a bubble-generating chamber, Atmos. Meas. Tech., 15, 6201–6219, https://doi.org/10.5194/amt-15-6201-2022, 2022.
Song, A., Li, J., Tsona, N. T., and Du, L.: Parameterizations for sea spray aerosol production flux, Appl. Geochem., 157, 105776, https://doi.org/10.1016/j.apgeochem.2023.105776, 2023.
Stokes, M. D., Deane, G. B., Prather, K., Bertram, T. H., Ruppel, M. J., Ryder, O. S., Brady, J. M., and Zhao, D.: A Marine Aerosol Reference Tank system as a breaking wave analogue for the production of foam and sea-spray aerosols, Atmos. Meas. Tech., 6, 1085–1094, https://doi.org/10.5194/amt-6-1085-2013, 2013.
Thorpe, S. A., Bowyer, P., and Woolf, D. K.: Some Factors Affecting the Size Distributions of Oceanic Bubbles, J. Phys. Oceanogr., 22, 382–389, 1992.
Twomey, S.: Cloud nucleation in the atmosphere and influence of nucleus concentration levels in atmospheric physics, J. Phys. Chem., 84, 1459–1463, https://doi.org/10.1021/j100449a006, 1980.
Vagle, S. and Farmer, D. M.: A comparison of four methods for bubble size and void fraction measurements, IEEE J. Ocean. Eng., 23, 211–222, https://doi.org/10.1109/48.701193, 1998.
Verdugo, P.: Marine Microgels, Annu. Rev. Mar. Sci., 4, 375–400, https://doi.org/10.1146/annurev-marine-120709-142759, 2012.
Veron, F., Hopkins, C., Harrison, E. L., and Mueller, J. A.: Sea spray spume droplet production in high wind speeds, Geophys. Res. Lett., 39, https://doi.org/10.1029/2012GL052603, 2012.
von der Weiden, S.-L., Drewnick, F., and Borrmann, S.: Particle Loss Calculator – a new software tool for the assessment of the performance of aerosol inlet systems, Atmos. Meas. Tech., 2, 479–494, https://doi.org/10.5194/amt-2-479-2009, 2009.
Walls, P. L. L. and Bird, J. C.: Enriching particles on a bubble through drainage: Measuring and modeling the concentration of microbial particles in a bubble film at rupture, Elementa: Science of the Anthropocene, 5, 34, https://doi.org/10.1525/elementa.230, 2017.
Wang, X., Deane, G. B., Moore, K. A., Ryder, O. S., Stokes, M. D., Beall, C. M., Collins, D. B., Santander, M. V., Burrows, S. M., Sultana, C. M., and Prather, K. A.: The role of jet and film drops in controlling the mixing state of submicron sea spray aerosol particles, P. Natl. Acad. Sci. USA, 114, 6978–6983, https://doi.org/10.1073/pnas.1702420114, 2017.
Willis, J. K., Roemmich, D., and Cornuelle, B.: Interannual variability in upper ocean heat content, temperature, and thermosteric expansion on global scales, J. Geophys. Res.-Oceans, 109, https://doi.org/10.1029/2003JC002260, 2004.
Wu, T., Zhang, F., Zhang, J., Jie, W., Zhang, Y., Wu, F., Li, L., Yan, J., Liu, X., Lu, X., Tan, H., Zhang, L., Wang, J., and Hu, A.: Beijing Climate Center Earth System Model version 1 (BCC-ESM1): model description and evaluation of aerosol simulations, Geosci. Model Dev., 13, 977–1005, https://doi.org/10.5194/gmd-13-977-2020, 2020.
Yang, Z., Deng, B.-Q., and Shen, L.: Direct numerical simulation of wind turbulence over breaking waves, J. Fluid Mech., 850, 120–155, https://doi.org/10.1017/jfm.2018.466, 2018.
Zábori, J., Matisāns, M., Krejci, R., Nilsson, E. D., and Ström, J.: Artificial primary marine aerosol production: a laboratory study with varying water temperature, salinity, and succinic acid concentration, Atmos. Chem. Phys., 12, 10709–10724, https://doi.org/10.5194/acp-12-10709-2012, 2012.
Zinke, J., Nilsson, E. D., Zieger, P., and Salter, M. E.: The Effect of Seawater Salinity and Seawater Temperature on Sea Salt Aerosol Production, J. Geophys. Res.-Atmos., 127, https://doi.org/10.1029/2021jd036005, 2022.