
the Creative Commons Attribution 4.0 License.
the Creative Commons Attribution 4.0 License.
 | 26 Aug 2026
Seasonal and interannual variability of atmospheric ammonia over Guatemala driven by land use, biomass burning, and meteorological circulation
Pedro Saravia
Katja Trachte
Ammonia (NH3) is a key atmospheric precursor of fine particulate matter, and an indicator of agricultural and biomass burning emissions. In Central America, NH3 variability remains largely unquantified. This study presents the first integrated spatiotemporal assessment of atmospheric NH3 over Guatemala (2015–2023) using concatenated IASI A/B/C observations, combined with fire activity, land cover, and meteorology dataset. Annual NH3 columns remained relatively stable, reflecting a persistent agricultural background with episodic enhancements driven by biomass burning. Significant anomalies occurred in 2016, 2020, and 2023, with 2020 showing the highest annual and monthly NH3. A clear seasonality is observed with maxima in April–May coincided with the regional fire season, followed by a rapid decline after rainy season. The spatial hotspots were consistently detected in northern (Petén–Quiché) and southern (Escuintla) agricultural regions. The most extreme episode in April 2020 recorded 957 active fires over ∼ 1486 km2, largely within the Maya Biosphere Reserve. This episode occurred under elevated temperatures and short-term dry conditions, despite high annual precipitation, demonstrating the importance of seasonal meteorological variability. These results indicate that Guatemala's variability in NH3 total columns reflects a stable agricultural condition with superimposed fire-driven peaks, modulated by climatic anomalies.
- Article
(11404 KB) - Full-text XML
-
Supplement
(1537 KB) - BibTeX
- EndNote


Atmospheric ammonia (NH3) exerts a considerable influence on air quality and ecosystem integrity through its contribution to secondary inorganic aerosol formation and its atmospheric transport, dispersion, and deposition under prevailing meteorological conditions (Zhou et al., 2019). As a reactive nitrogen (Nr) compound, NH3 plays a fundamental role in the global nitrogen cycle and a variety of biogeochemical processes, representing a dominant form of nitrogen present in terrestrial and atmospheric systems (Sutton et al., 2007, 2013; Whitburn et al., 2016). Despite its relatively short atmospheric lifetime ranging from several hours to a few days due to its high deposition efficiency and conversion into particulate ammonium, current surface-based monitoring approaches remain inadequate for providing accurate global emission estimates, often introducing substantial uncertainties (Dammers et al., 2016; Herrera et al., 2022). NH3 is also a key component in atmospheric chemistry and in the coupling of nitrogen and carbon cycles within ecosystems, with broad consequences regarding climate regulation, agricultural sustainability, air quality and public health. NH3 emissions originate from both natural and anthropogenic activities, with the latter contributing the majority of the global NH3 burden. The agricultural sector remains the principal source, accounting for over 81 % of total anthropogenic emissions globally (Van Damme et al., 2021; Wyer et al., 2022), while additional anthropogenic contributions stem from residential combustion, vehicular exhaust, industrial production, and wastewater treatment systems (Abeed et al., 2023; Dragosits et al., 2002; Sutton et al., 2007). Although agriculture particularly using fertilizers and manure remains the dominant source of atmospheric NH3. Nonagricultural sources such as vehicular and industrial emission may be also contribute and are significantly underestimated (Chen et al., 2024; Chen and Wang, 2025; Farren et al., 2020; Gu et al., 2023; Zhou et al., 2017).
In recent decades, satellite remote sensing has significantly advanced the detection of atmospheric NH3, leading to the development of several global NH3 measurement datasets, notably from the Infrared Atmospheric Sounding Interferometers (IASI) instrument. At the same time, global fire inventories and satellite derived products, including the Global Fire Emissions Database (GFED) (Giglio et al., 2006, 2013; van der Werf et al., 2010, 2017), the Global Fire Assimilation System (GFAS) (Remy and Kaiser, 2014) developed by the European Centre for Medium-Range Weather Forecasts (ECMWF), and two fire products from the National Aeronautics and Space Administration (NASA), based on Fire Radiative Power (FRP) measurements, have enable the characterization of biomass burning (Fu et al., 2020; Li et al., 2020; Remy and Kaiser, 2014; Vermote et al., 2009; Wooster et al., 2003).
Central America's climate is significantly shaped by the two oceans it borders, with the vast Pacific Ocean, spanning nearly half the Earth's circumference at the equator, being especially crucial for climate regulation by El Niño brings drier conditions to Guatemala, while La Niña produces more precipitation (Bardales Espinoza et al., 2019) Guatemala's geomorphological attributes and geospatial coordinates inherently facilitate a multitude of microclimatic zones and pronounced climatic heterogeneity, the variability has been amplified in recent years by the nation's persistent susceptibility to extreme meteorological phenomena, including prolonged arid periods and intense tropical cyclones, both of which are intensified by the overarching impacts of anthropogenic climate change (Alfaro Marroquín and Gómez, 2019). Guatemala's climate deviates from the typical four-season delineation observed in the Northern Hemisphere. Instead, it is characterized by two distinct periods: the wet season, spanning from May to October, and the dry season, occurring from November to April (INSIVUMEH, 2018; Orrego León et al., 2021).
Furthermore, these climate condition directly influence and intensify of biomass burning events, particularly during dry season, Guatemala is exposed to a variety of threats, with wildfires being one of the main threats in recent decades (CONRED, 2025). Guatemala has experienced increasing concern from fire-related activities that are strongly tied to agricultural expansion, shifting cultivation, and deforestation. These practices, often used to clear land for crops or grazing, are typically intensified during the dry months, aligning with peak fire activity (Liu et al., 2024b; Monzón-Alvarado et al., 2012). Guatemala consistently reports a high number of fire hotspots (CONRED, 2025), especially in years dominated by El Niño-induced drought conditions (Chuvieco et al., 2019; CONRED, 2025; Giglio et al., 2013). The recurrence of such fires in forested and agro-pastoral zones not only transforms land cover but also releases large quantities of reactive trace gases and aerosols, including atmospheric NH3 into the atmosphere (Andreae, 2019; Pohl et al., 2022; Wyer et al., 2022). Despite this, the role of biomass burning as a driver of NH3 emissions remains underexamined in Central American air quality studies.
Despite the increasing availability of satellite-based datasets for monitoring atmospheric NH3, there remains a significant lack of regional-scale studies in Central America, particularly in Guatemala, where land use dynamics and biomass burning are likely to play an important role in shaping substantially to atmospheric NH3 patterns. Previous research has primarily examined individual drivers, such as meteorological circulation and fire season in Central America (Corona‐Núñez and Campo, 2023; Liu et al., 2024a), or continental scale assessment of NH3 variability (Clarisse et al., 2009; Van Damme et al., 2021; Herrera et al., 2022; Luo et al., 2022; Zhu et al., 2015). However, integrated regional analysis that simultaneously consider concatenated NH3, fire activity, land cover and meteorological variables remain limited.
This study investigates the monthly spatiotemporal dynamics of atmospheric NH3 total column over Guatemala from 2015 to 2023, using three satellite-based observations from IASI onboard of the Meteorological Operational satellite programme (MetOp), MetOp-A, MetOp-B, and MetOp-C, in combination with land cover classification from the Environmental Systems Research Institute (ESRI), fifth-generation global reanalysis (ERA5) meteorological data, fire activity from Moderate Resolution Imaging Spectroradiometer (MODIS-FRP), and vertical profiles global reanalysis of NH3 from Copernicus Atmosphere Monitoring Service (CAMS). The study aims to identify spatial hotspots and the interannual and seasonal variability in NH3. In addition, spatial clustering using k-means algorithm is applied to partition NH3 patterns and explore their heterogeneity, with a particular focus on land cover types and the influence of fire-pixel activity. A case study in 2020 further examines a period of anomalous NH3 of the total column variability in relation to extreme fire events linked to agriculture and meteorological conditions.
2.1 Study location
The Republic of Guatemala, a Central American country situated between latitudes 13.5 to 17.8° N and longitudes 88.2 to 92.2° W. According to the National Institute of Statistics of Guatemala (INE, 2020), the country is administratively divided into 22 departments, which differ in terms of land use, population density, and economic activity. Guatemala encompasses a diverse range of ecological regions, topographical variations, and land use patterns. Its landscape is characterized by a complex zone of agricultural lands, forested highlands, volcanic zones, and rapidly urbanizing areas. Agriculture remains a cornerstone of the Guatemalan economy and landscape with extensive cultivation of crops such as maize, beans, coffee, sugarcane, oil palm, and bananas (FAO, 2019; Hervas, 2019; Lopez-Ridaura et al., 2019). Fertilizer application and livestock farming are particularly prevalent in rural regions. Meanwhile, increasing urbanization and industrialization, especially around Guatemala City and its metropolitan zone, have introduced additional anthropogenic activities, such as vehicular exhaust, industrial activity, and waste treatment processes.
Guatemala experiences a pronounced dry season (typically November to April) and rainy season (May to October) (Alfaro Marroquín and Gómez, 2019; Bardales Espinoza et al., 2019; INSIVUMEH, 2018; Orrego León et al., 2021), which strongly modulate fire activity, atmospheric transport conditions, and deposition processes relevant to NH3 dispersion. Frequent wildfires, especially in the Petén department (northern area of Guatemala) and central highlands during the dry season, contribute further to the atmospheric burden of reactive nitrogen species. Topographically, Guatemala varies from sea level to 3000 m above sea level (a.s.l.) in the central plateau, and with volcanic peaks that reach 4200 m a.s.l. (IGM, 2002). Figure 1 shows the digital elevation model (DEM) of the topographic surface in meters over Guatemala using the European Space Agency (2024).
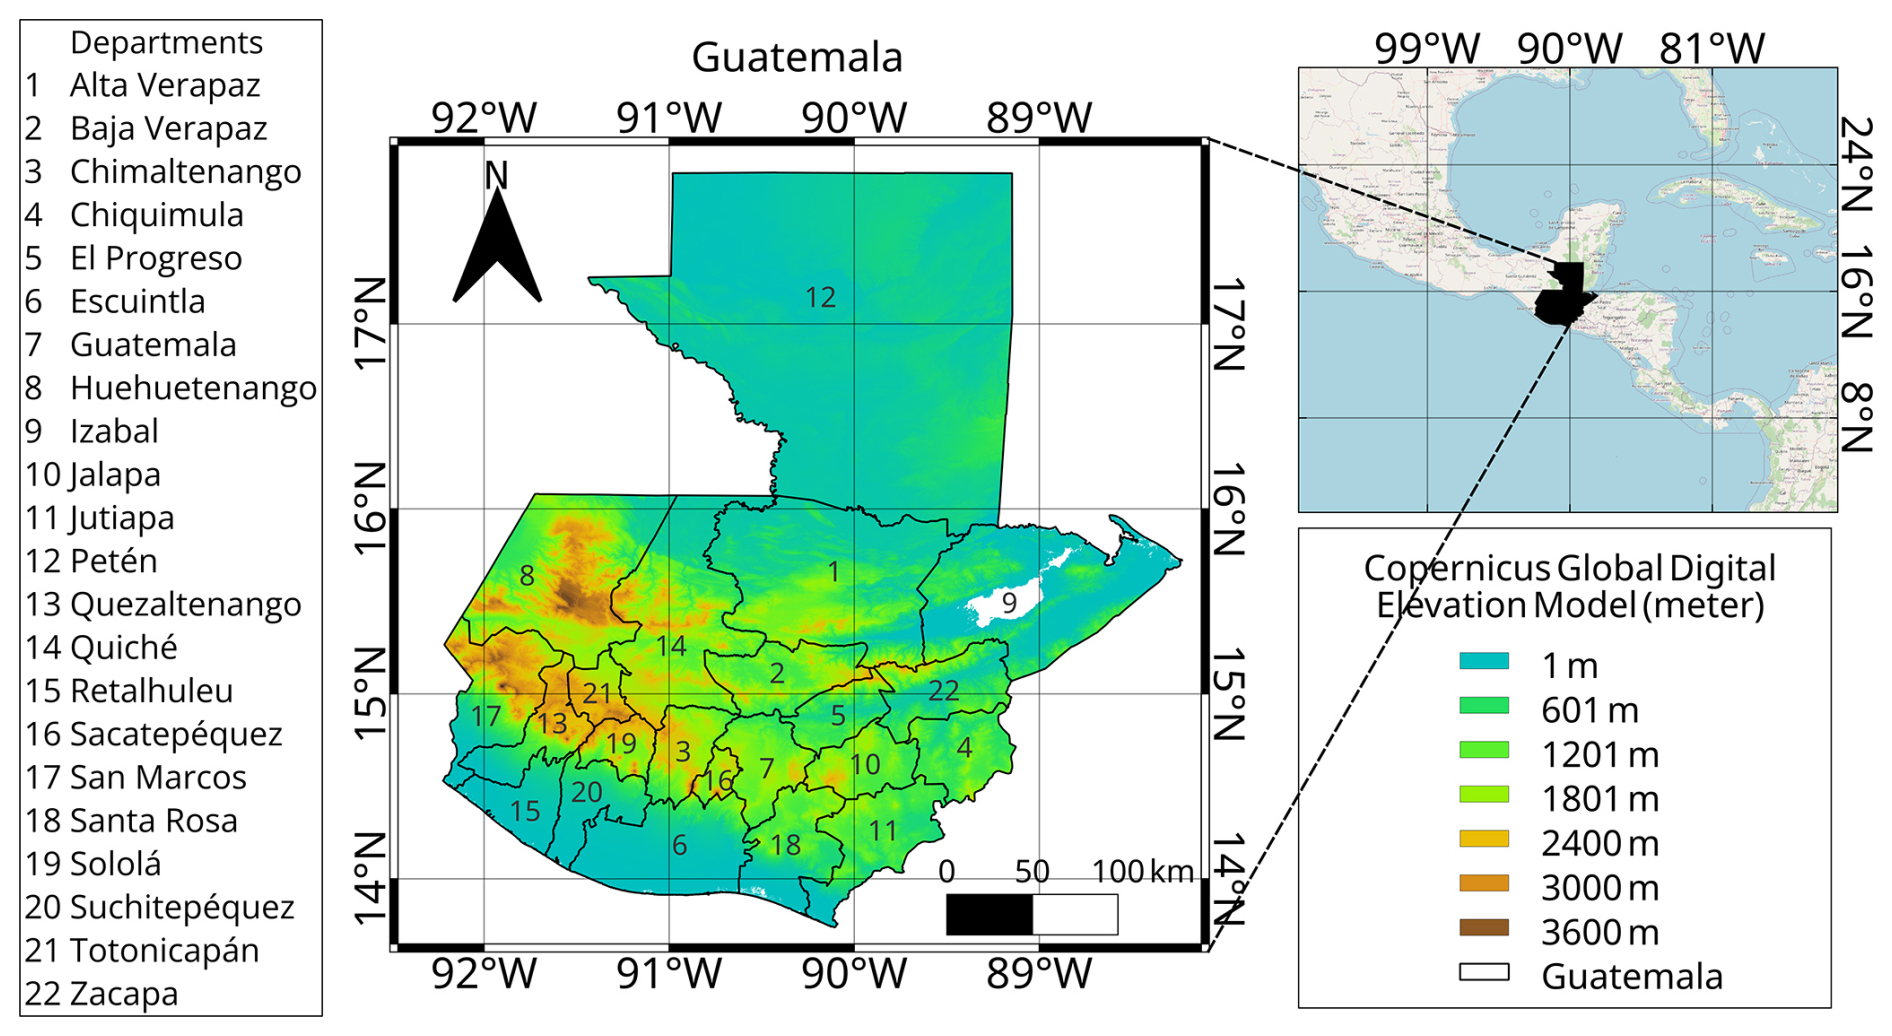
Figure 1Departments of Guatemala and elevation (m) from Copernicus Global Digital Elevation Model.
2.2 IASI NH3 satellite-based
This study applies a multi-step analytical framework to investigate the spatiotemporal variability of satellite-based atmospheric NH3 over Guatemala from 2015 to 2023. The analysis is based on a temporally concatenated monthly NH3 total column Level 3 (L3) observations, from the IASI instrument onboard the MetOp A/B/C satellites launched in 2006, 2012, and 2018, respectively (Clarisse et al., 2009, 2019; Coheur et al., 2009). The concatenation produces the dataset, which serves as the basis for all spatial distributions, time series, climatological analyses, clustering, and correlation, incorporating both morning and night observations for enhanced representativeness and discarded negative values. While IASI-B maintains the spatial resolution of sensors A and C, integrating all three sensors could improve both temporal and spatial coverage, thereby yielding more accurate and robust results. While the study period spans 108 months, the concatenated analysis incorporates a total of 228 sensor months, corresponding of IASI A (January 2015–December 2020), B (January 2015–December 2023), and C (January 2020–December 2023).
IASI works with a cross-track scanning swath approximately 2200 km wide and provides measurements with a nadir pixel diameter of about 12 km. Positioned aboard sun-synchronous polar-orbiting satellites, the instrument enables near-global coverage twice daily during both daytime and nighttime corresponding to local solar overpass times of approximately 09:30 and 21:30, respectively (Clarisse et al., 2010; Van Damme et al., 2017; Whitburn et al., 2017). The NH3 dataset was obtained from version 4 (v4.0.0R) (L3) of the ANNI-NH3 retrieval product (Clarisse et al., 2023), and regridded to a 0.25° × 0.25° spatial resolution. A major enhancement in this version is the incorporation of the vertical column averaging kernel (AK), which is essential for aligning satellite retrievals with chemistry-transport model simulations by mitigating the influence of the priori NH3 vertical profiles applied during retrieval. While spatial patterns remain consistent with previous versions, total column values are approximately 15 %–20 % higher due to improvements in the high-resolution infrared retrieval configuration (HRI). Version 4 offers improved uncertainty characterization and enhanced temporal uniformity of the dataset from 2007 to 2023 (Clarisse et al., 2023). The retrieval algorithm estimates a hyperspectral range index from IASI spectra and converts it into NH3 total column densities using an artificial neural network (Van Damme et al., 2021; Franco et al., 2018; Whitburn et al., 2017). The uncertainty was quantified using the standard error and the relative uncertainty was derived from the distribution of the observation within of each grid cell (Sect. S1).
Additionally, NH3 vertical profiles data were obtained from the ECMWF, Atmospheric Composition Reanalysis 4 (EAC4), produced by the CAMS. This global reanalysis provides NH3 with mass fraction in the air, provided as a mass mixing ratio (kg kg−1), the model is defined by 60 hybrid sigma-pressure levels. It provides a detailed representation of the atmospheric structure, particularly near the surface (∼ 0–100 m) where most emissions occur (Inness et al., 2019). These reanalysis datasets incorporate satellite observations and model simulations to provide globally consistent, spatially and temporally resolved atmospheric composition data (Flemming et al., 2017; Inness et al., 2019). In our study, the CAMS analysis of vertical structure and latitudinal distribution of NH3 during a specific period of interest, rather than for a quantitative comparison with satellite of total column densities.
2.3 Cluster analysis of NH3
An unsupervised clustering approach was applied to classify NH3 total columns field based on their statistical similarity. Clustering is a type of unsupervised machine learning that groups large datasets based on their similarity, allowing for more manageable and interpretable analyses (Ahmad and Dey, 2007; Pham et al., 2005). This analytical approach is particularly beneficial when there is limited or no prior knowledge about the underlying structure of the data (Gašparović et al., 2019). Among clustering methods, the k-means algorithm is one of the most commonly applied and reliable techniques. It partitions data into a predefined number of k clusters by iteratively determining central points, or centroids, for each group (Pham et al., 2005). The algorithm requires the number of clusters to be specified in advance (Ahmad and Dey, 2007; Mahata et al., 2020). The k-means operates using the squared Euclidean distance as its primary metric (Spencer, 2013) which quantifies the separation between two points within a Euclidean space of any dimension (Li et al., 2022). The Euclidean distance between two points, p and q, in a j-dimensional space is mathematically expressed as d(p,q).
The k-means algorithm divides a dataset into k clusters by aiming to minimize the variance within each group (Li et al., 2022). It operates on a set of input samples , where each represents an observation composed of j variables, and m ϵ , with n being the total number of observations. These samples are categorized into k clusters with the goal of minimizing the total intra-cluster variance , as described in Eq. (2):
The notation ∥X−μi∥ represents the squared Euclidean distance between each data point (X) and its assigned cluster centroid μi within a multidimensional Euclidean space (Li et al., 2022). In this study, k-means clustering was utilized to examine the spatiotemporal patterns of NH3 throughout the specified timeframe (Fouilloux, 2018; Pedregosa et al., 2011). To determine the most suitable number of clusters k, the elbow method was employed. This approach assesses the Cluster Sum of Squares (CSS) to identify the point at which the inclusion of additional clusters no longer significantly improves the model performance (Umargono et al., 2019).
2.4 ESRI land cover class map
The ESRI Land Use Land Cover (LULC) 2020 dataset, released in June 2021, was developed using deep learning models trained on more than 5 billion manually labelled pixel samples derived from the European Space Agency's Sentinel-2 satellite imagery with 10 m spatial resolution (Karra et al., 2021), enables land cover mapping at both national and local scales. According to (ESRI, 2021) these training samples were collected from 24 000 image tiles globally, each measuring 510 × 510 pixels, and reflect a wide range of land surface types. The LULC 2020 product is classified into nine classes: Water, Trees, Flooded vegetation, Crops, Built area, Bare ground, Snow/Ice, Clouds, and Rangeland (Karra et al., 2021). In this study, the analysis was restricted to classes related to Water, Trees, Flooded vegetation, Crops, Built area, and Rangeland.
2.5 Meteorological data from ERA-5
Meteorological variables used in this study were obtained from the ERA5 reanalysis (Soci et al., 2024) dataset provided by ECMWF (Hersbach et al., 2020). Originally available at a horizontal resolution of approximately 31 km, the data were resampled to a 0.25° × 0.25° grid and both spatially and temporally to match the IASI NH3 observation times and locations. The selected meteorological parameters were subsequently used in statistical analysis with atmospheric NH3, these variables include 2 m air temperature (t2m), 10 m wind speed (ws), boundary layer height (BLH), relative humidity (RH, derived using 2 m air temperature and dew point temperature), and total precipitation (tp) from the monthly average reanalysis product, representing the twelve monthly precipitation values within each year, and monthly climatology for each calendar month. Pearson correlation matrix coefficient was calculated between monthly meteorological variables means and total column means of NH3, including total fire counts per month, to quantify their linear relationship.
2.6 Fires
Active fire detections were obtained from MODIS Aqua/Terra Thermal Anomalies/Fire Locations product (MOD14/MYD14). Data was accessed via the Fire Information for Resource Management System (FIRMS) Near Real-Time (NRT), collection 6.1 (Giglio et al., 2021a). These data are produced by NASA's Land, Atmosphere Near-real-time Capability for EOS (LANCE) and provide global active fire information at a nominal spatial resolution of 1 km.
MODIS fire detection recognizes thermal anomalies in individual pixels using mid-infrared radiance signals. It assigns each detected fire's geographic location to the center of the corresponding 1 × 1 km2 spatial resolution (Giglio et al., 2003, 2006; Justice et al., 2010). Each detection includes fire location, detection confidence, and FRP. Detection confidence, indicating the likelihood of an active fire in a pixel, is classified as low level: 0 % to <30 %, nominal level: 30 % to <80 %, high level: 80 % to 100 % (Giglio et al., 2016, 2021b, a; Hantson et al., 2013).
To reduce false detections, and ensure strong fire identification, only fire pixels with nominal to high confidence levels ≥70 % were retained for analysis, in accordance with recommendations from previous studies (Giglio et al., 2016, 2021b, a; Hantson et al., 2013). Fire activity was quantified using fire counts, defined as the number of detected fire pixels, which serve as a proxy for fire occurrence and spatiotemporal variability. Monthly fire counts were aggregated for each year to characterize seasonal and interannual variability in fire activity.
FRP served as an indicator of fire intensity with energetic significance providing as an additional filtering. Moreover, it quantifies the rate of radiative energy released from combustion and is directly related to biomass consumption (Wooster et al., 2003). In this study only fire detections with FRP values ≥40 Megawatt (MW) were included, thereby excluding low-intensity or small-scale fires to ensure consistency between temporal statistics and spatial fire distribution.
FRP is derived from MODIS 4 µm radiance measurement using the methodology proposed by Wooster et al. (2003) in Eq. (3):
Apixel is the fire pixel area σ=5.6704 × 10⁻⁸ Wm−2 K−4 is the Stefan–Boltzmann constant, α=3.0 × 10⁻⁹ Wm−2 sr−1 m−1 k−4 is the MODIS empirical constant, τ4 is the atmospheric transmittance at 4 µm, and L4−L4b are radiances at 4 µm of the fire and background pixels, respectively (Wooster et al., 2003).
The burned analysis for this work was obtained by MODIS MCD64A1 Version 6.1 product, which combines observations from both Terra and Aqua platforms to produce a monthly global dataset gridded at 500 m that provides per-pixel burned-area and quality information (Giglio et al., 2018). The MCD64A1 MODIS burned area product integrates surface reflectance data with active fire detections to identify burned pixels based on temporal changes in a burn-sensitive vegetation index derived from shortwave infrared bands (bands 5 and 7) and spatial texture metrics (Dong et al., 2013; Freeborn et al., 2011; Giglio et al., 2003, 2021b; Justice et al., 2010). For each pixel, the product provides the estimated burn date as the ordinal day of the year, as well as quality assurance layers and uncertainty metrics. Pixels identified as unburned, water, or missing data are assigned to distinct flag values (Giglio et al., 2016).
3.1 Annual and seasonal variability of atmospheric NH3
Figure 2 shows the annual variability of NH3 total columns over Guatemala from the period 2015 to 2023, while the corresponding anomalies relative to long-term are presented in Fig. S1. The respective boxplots show the distribution of monthly NH3 values within each year. The annual medians of NH3 remained relative stable, ranging from 3.95 × 10¹⁵ molecules cm−2 in 2021 to 4.66 × 10¹⁵ molecules cm−2 in 2020 (Table S1). In contrast, the standard deviation varied considerably between years, reaching a peak in 2020 of 5.83 × 10¹⁵ molecules cm−2 following by 2016 with 5.26 × 10¹⁵ molecules cm−2and 2023 with 2.88 × 10¹⁵ molecules cm−2.
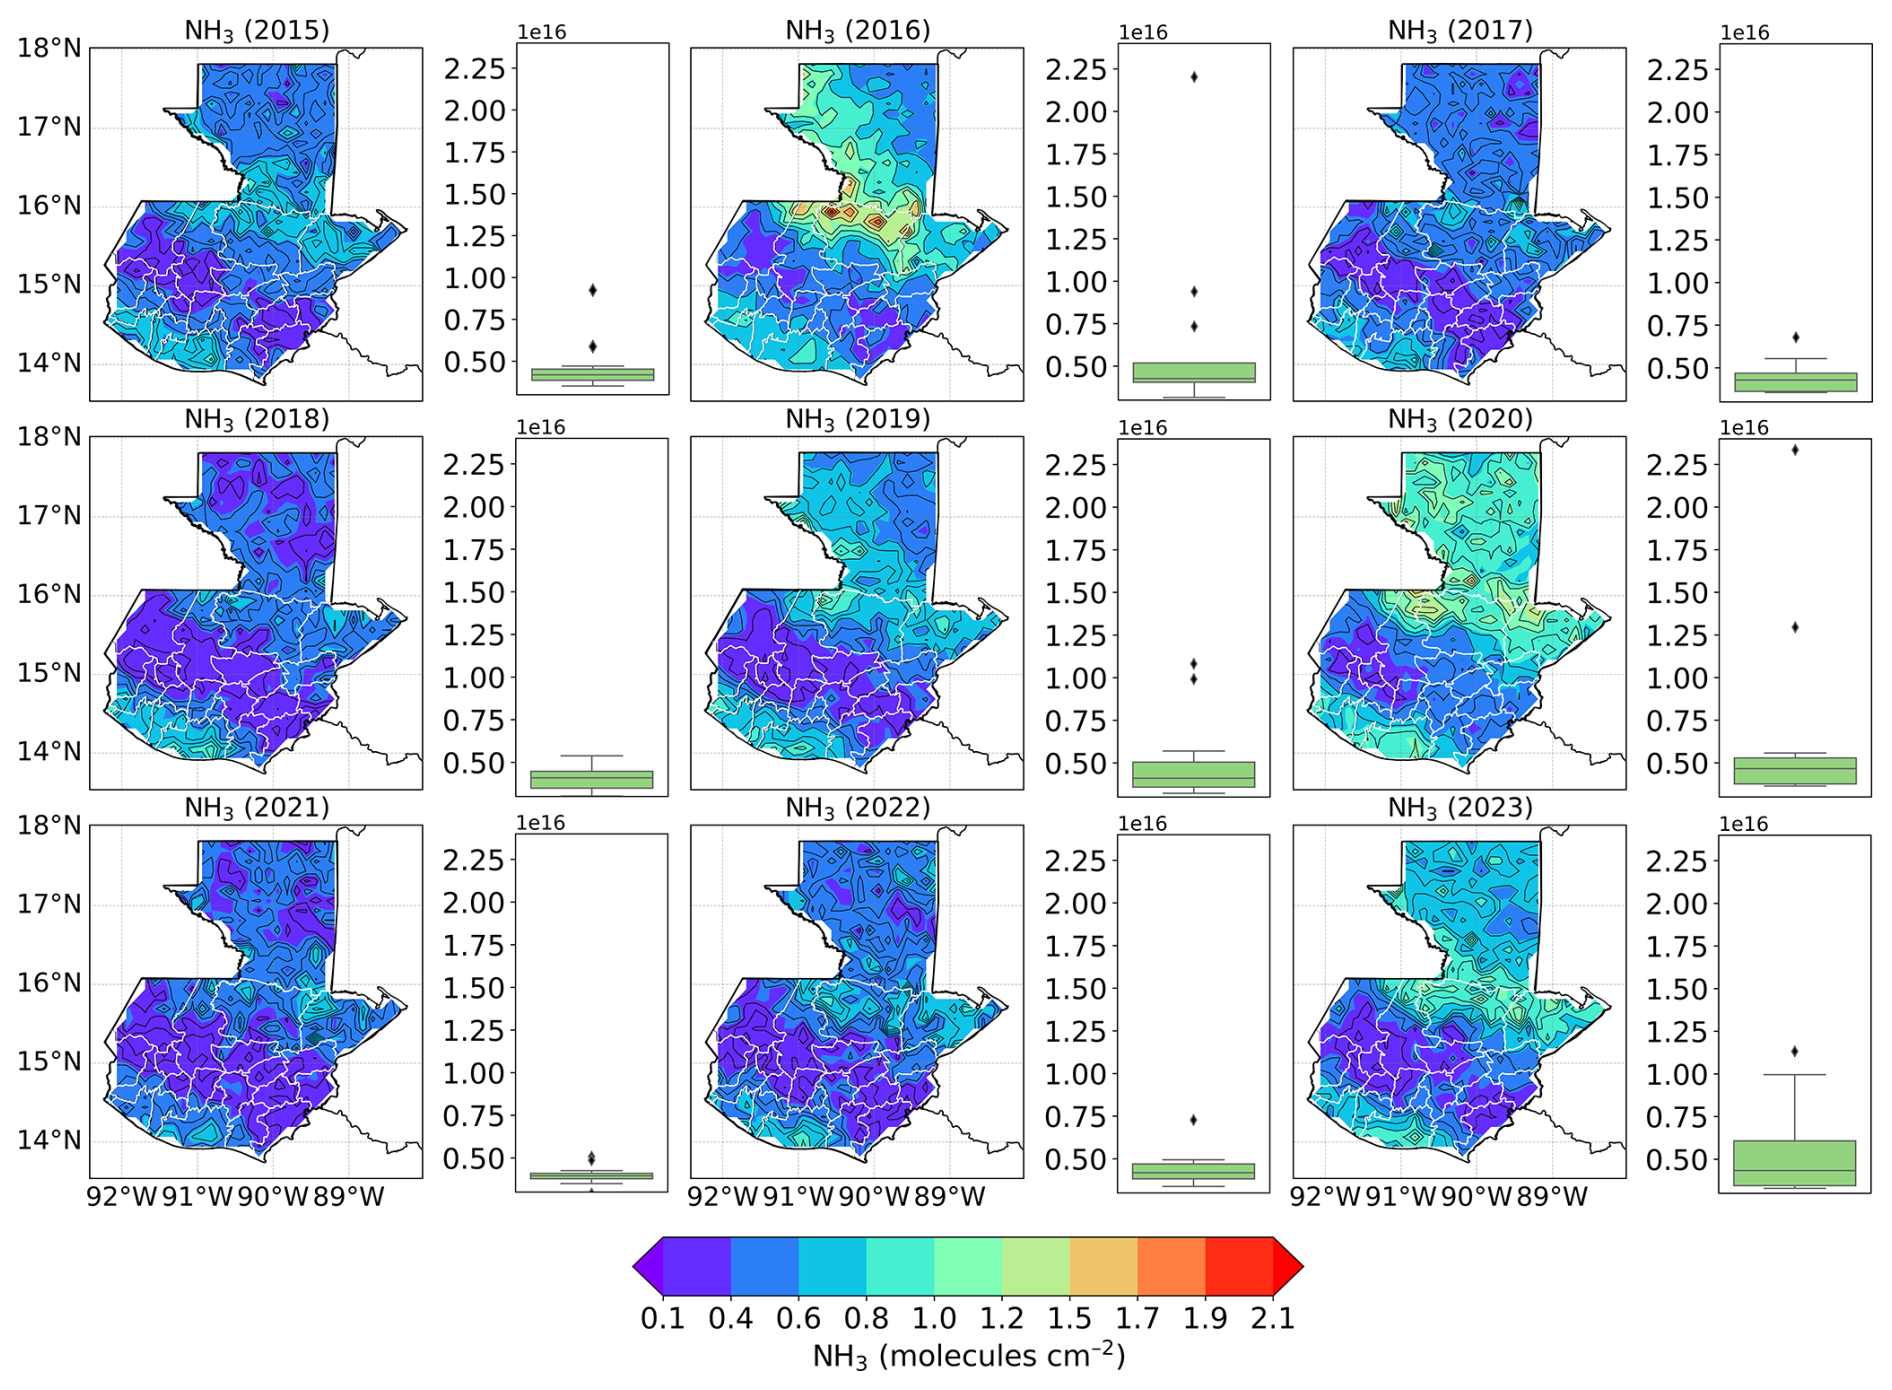
Figure 2Annual means area-wide and boxplot distribution of monthly NH3 total columns within each year (× 1016 molecules cm−2) over Guatemala (2015–2023) from concatenated IASI A, B and C.
The spatial distribution of NH3 exhibited a consistent area-wide pattern characterized by elevated values in specific areas, and the corresponding annual anomalies relative to the long-term (Fig. S2). Frequently hotspots are observed in the northern (Petén), north-central (Quiché, Alta Verapaz, and Izabal), and along the southern coastal department of Escuintla. Conversely, lower annual mean NH3 dominate in the central midlands, including the departments of Totonicapán, Sololá, Chimaltenango, Sacatepéquez, Guatemala, Jalapa, and Jutiapa. Interannual variability in hotspot intensity is evident, with particularly high values over Petén, Alta Verapaz and Quiché in 2016 and more widespread increased NH3 across Petén, Quiché, Alta Verapaz, Izabal and Escuintla in 2020. Notably, 2018 presented lower annual mean NH3 across Guatemala, however, the main spatial distribution of the main hotspots were still evident (Petén, Alta Verapaz, Izabal and Escuintla) showing frequent spatial patterns despite lower annual columns values.
The monthly climatology variability of NH3 total columns is illustrated by boxplots in Fig. 3, showing a distinct seasonal pattern. Monthly medians were lowest in winter, reaching a minimum in February (3.52 × 10¹⁵ molecules cm−2) while January and March also exhibited relative low median values (4.25 × 10¹⁵ molecules cm−2 and 4.00 × 10¹⁵ molecules cm−2), before increasing in the month of April with 7.34 × 10¹⁵ molecules cm−2, and remaining elevated in May with 7.27 × 10¹⁵ molecules cm−2 (Table S2). These months exhibit the largest standard deviation, that shows greatest variability with high NH3. The values started decreasing thereafter in the month of June with a median of 4.83 × 10¹⁵ molecules cm−2. From July through December, the median stabilizes, ranging between 3.58 × 10¹⁵ molecules cm−2 (August) to 4.18 × 10¹⁵ molecules cm−2 (November).
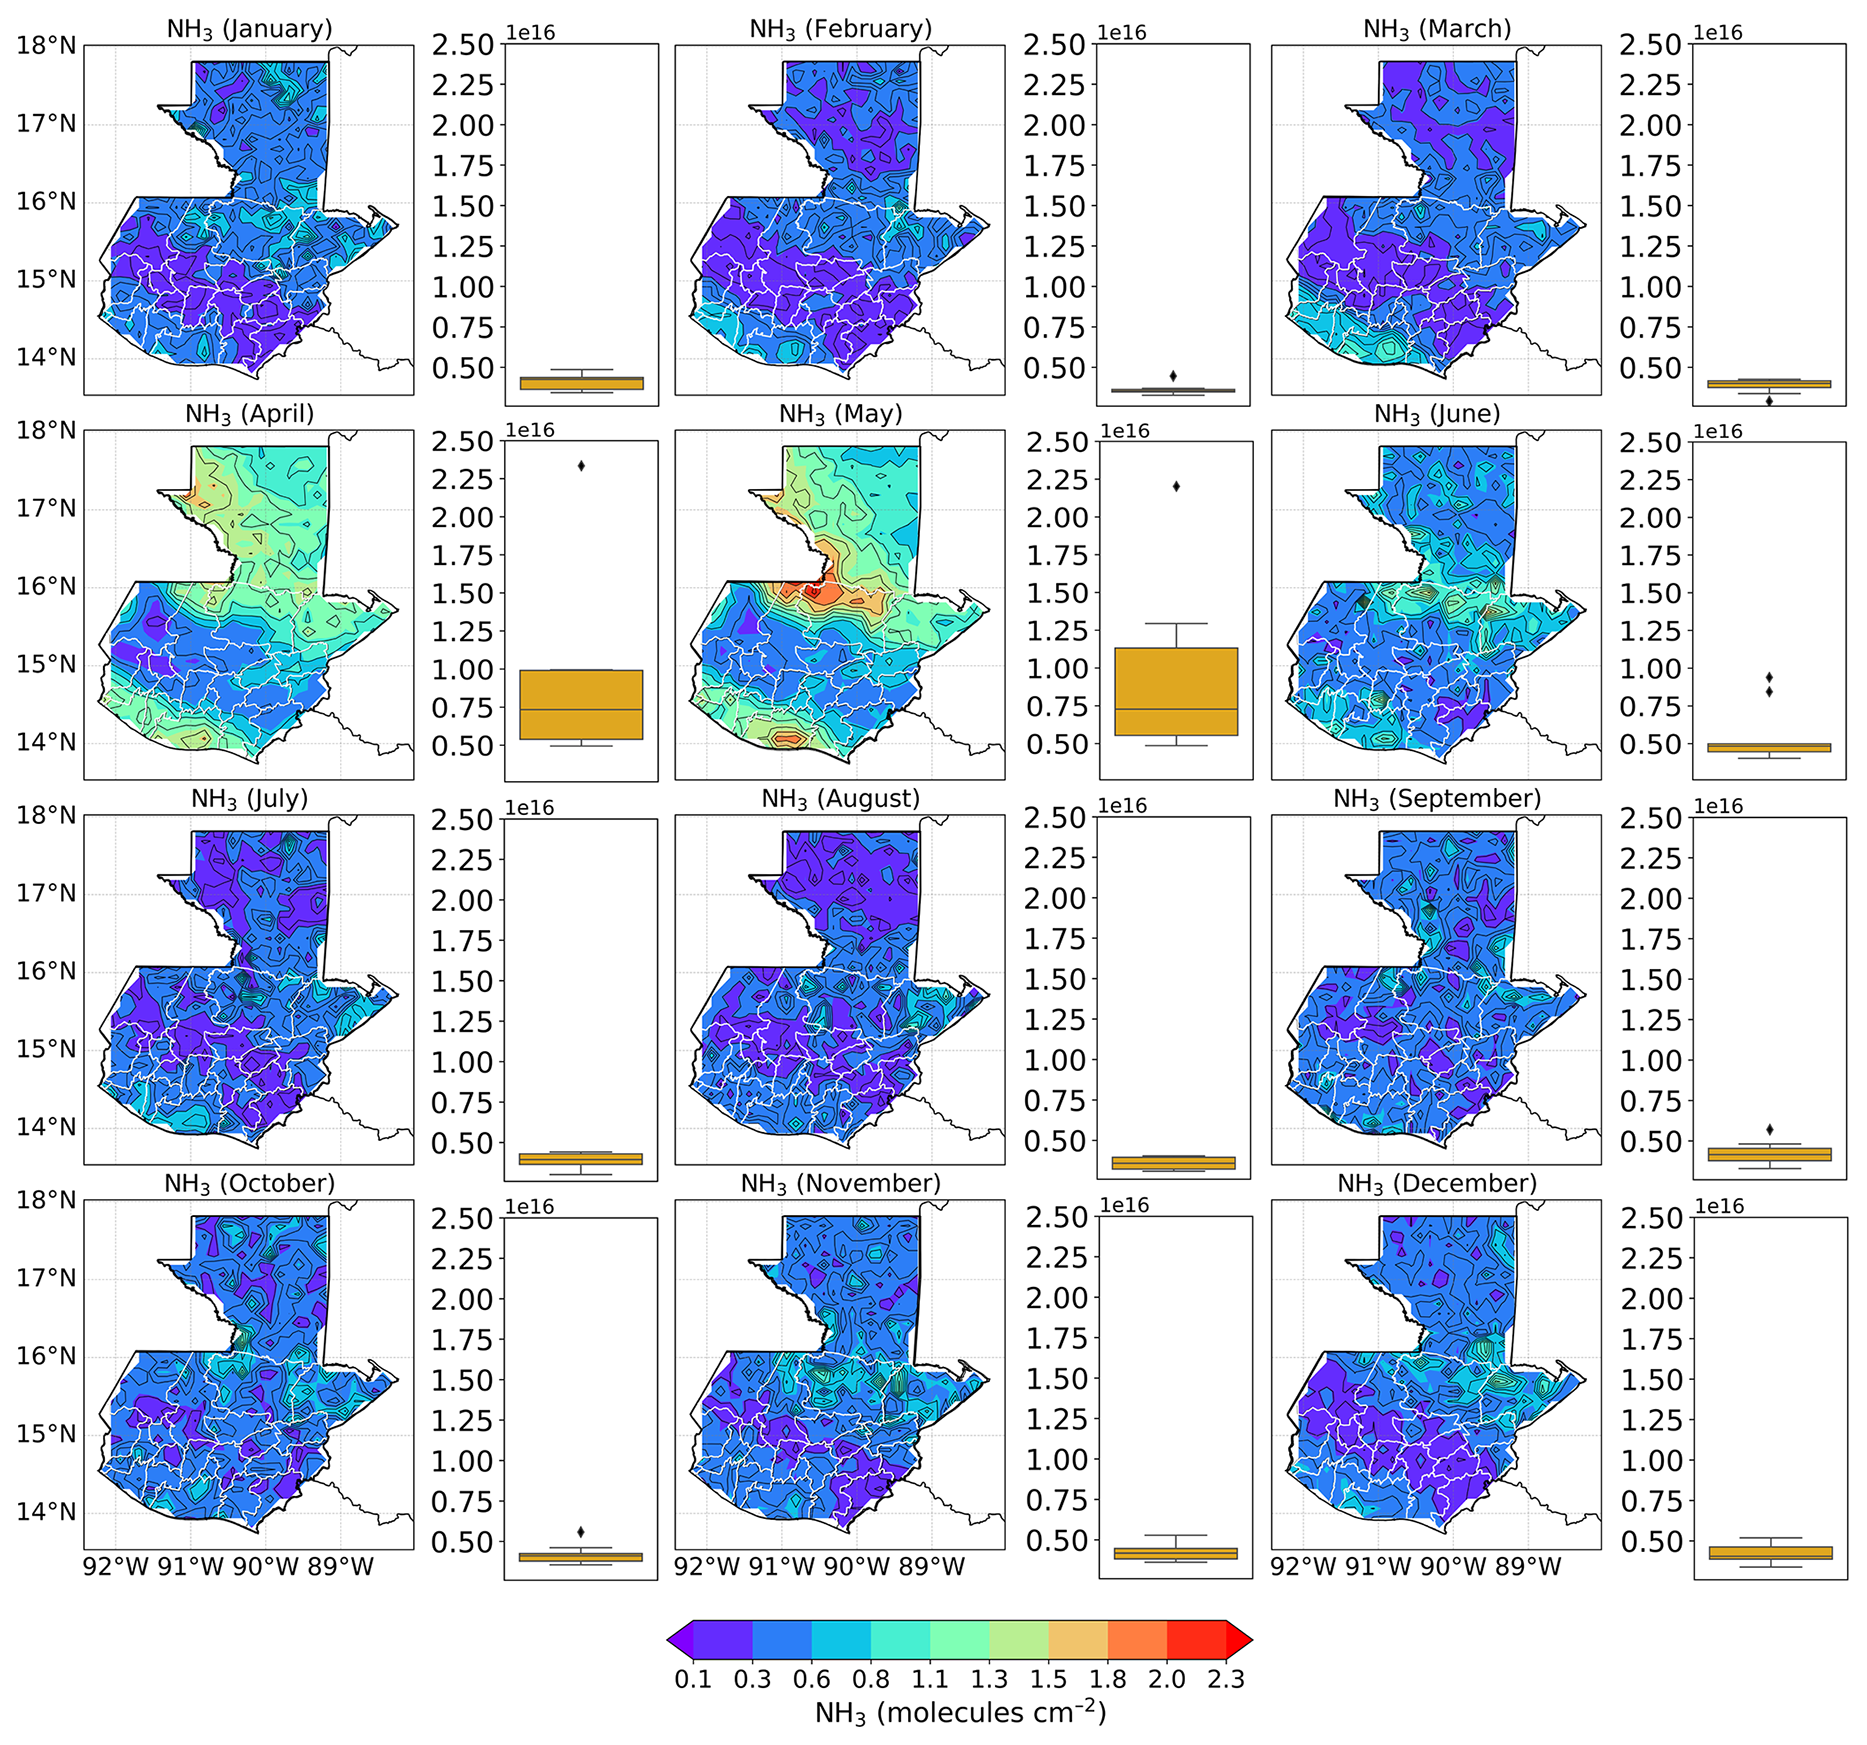
Figure 3Monthly climatology area-wide and boxplot distribution of NH3 total column for each calendar month (× 1016 molecules cm−2) over Guatemala (2015–2023) from concatenated IASI A, B and C.
The spatial distribution of monthly climatology mean NH3 displays the distinct seasonal pattern across Guatemala. From January to March, NH3 remain generally low over most of the country, with only limited area exhibiting elevated columns (Escuintla). A substantial increase in both the total column values and spatial coverage of NH3 is observed in April, with widespread elevated areas particularly in the northern (Petén), north-central (Quiché, Alta Verapaz, and Izabal), and southern coastal area (Retalhuleu, Suchitepéquez, and Escuintla). Specific defined areas with highest values primarily in the departments of Quiché, Alta Verapaz and Escuintla is observed in the month of May. Subsequently, a sharp decline in NH3 is evident across the country from June through December. During these months, the spatial distribution of NH3 is characterized by few hotspots and generally uniform low values in the central midlands (Totonicapán, Sololá, Chimaltenango, Sacatepéquez, Guatemala, Jalapa, and Jutiapa).
3.2 Spatial NH3 and associated land cover
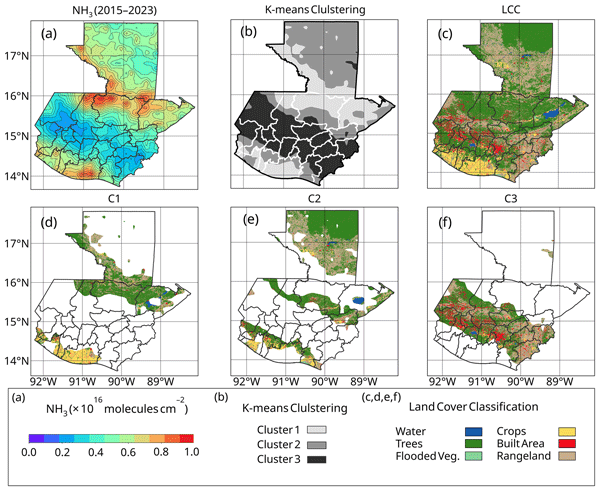
The spatial distribution of NH3 in Guatemala, based on the overall mean for the period 2015–2023, reveals several distinct hotspots areas, most notably in the southern coast (Escuintla), central-northern (Alta Verapaz and Quiché and Izabal), and northern (Petén) (Fig. 4a). Among these, the most prominent hotspot is observed in the central-northern area, which exhibits the highest mean NH3 total column during the study period.
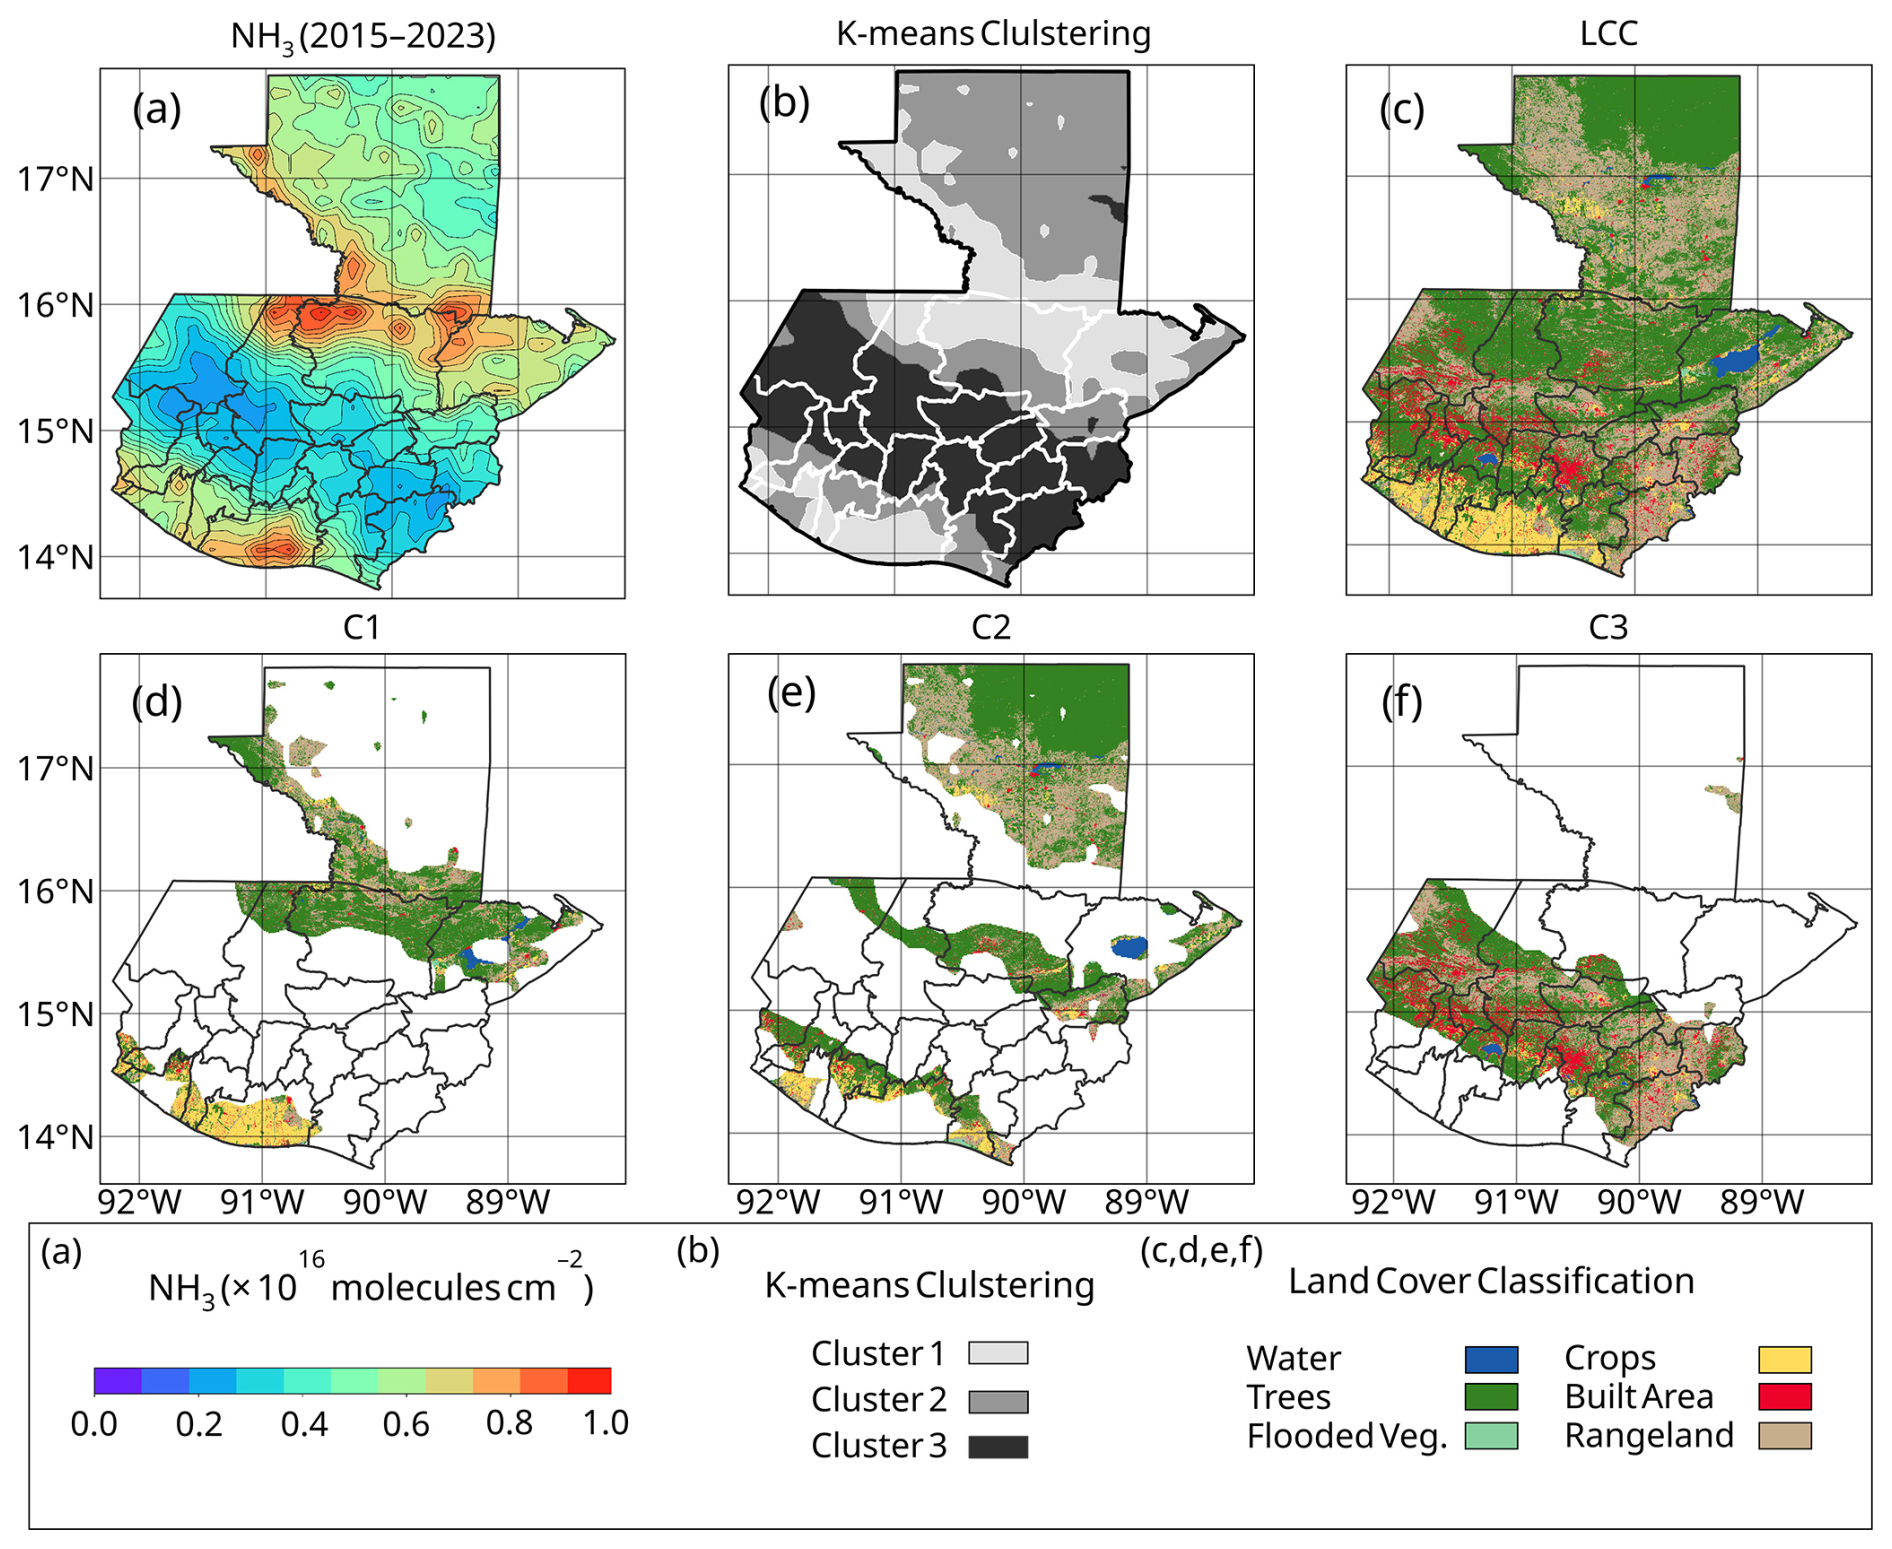
Figure 4(a) Concatenated NH3 total column (× 1016 molecules cm−2) (2015–2023), (b) k-means cluster analysis with Cluster 1 (black color), Cluster 2 (gray color) and Cluster 3 (light gray color). (c) ESRI Land Use Land Cover across Guatemala, categorized into three clusters based on k-means combined with land cover types: water, trees, flooded vegetation, crops, built area, and rangeland, (d) C1 related to cluster 1, (e) C2 to cluster 2, and (f) C3 to cluster 3.
The k-means clustering partitions the country into three emission zones (Fig. 4b), each with distinct land cover profiles when integrated with ESRI data (Fig. 4c). Cluster 1 with smallest area (∼ 28 254 km2) (red) associated to the highest NH3, is located in the northern (Petén), central-north (Quiché, Alta Verapaz, Izabal), and southern regions (Escuintla, Suchitepéquez, Retalhuleu and San Marcos) is dominated by extensive tree cover (53.2 %; 15 024.6 km2), together with rangeland (24.5 %; 6934.2 km2) and cropland (16.7 %; 4710.8 km2), while built-up areas are limited to 3.4 % (948.6 km2) as shown in Fig. 4d. The complete land cover distribution across clusters is provided in Table 1.
Table 1Land cover composition of percentage and area for the different cluster in Guatemala.
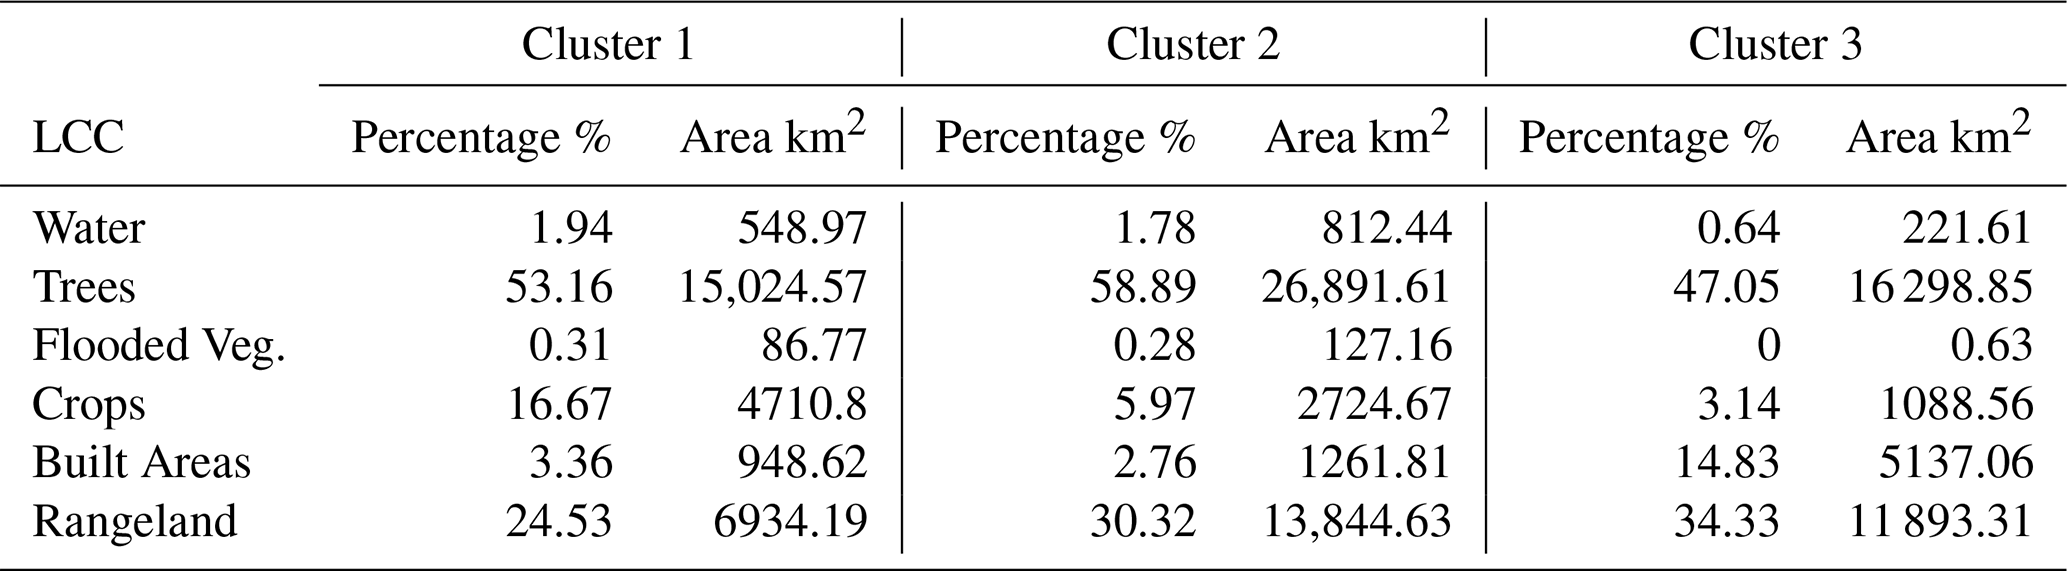
Cluster 2 with a largest extend area around 45 662 km2 (yellow) represents moderate zones forming a transition around Cluster 1 and extending into northern (Petén), north-central (Huehuetenango, Quiché, Alta Verapaz, Santa Rosa, Izabal), and south (Quetzaltenango, Escuintla, Suchitepéquez, Retalhuleu, Santa Rosa, Jutiapa and San Marcos) (Fig. 4e). It is dominated by tree cover (58.9 %; 26 891.6 km2) and rangeland (30.3 %; 13 844.6 km2), with a comparatively small share of cropland (6.0 %; 2724.7 km2). Built-up areas account for 2.8 % (1261.8 km2), slightly larger in absolute terms than in Cluster 1.
The intermediate extent area Cluster 3 with ∼ 34 640 km2 (green), associated with the lowest NH3, covers the central region with departments of Huehuetenango, San Marcos, Totonicapán, Sololá, Chimaltenango, Sacatepéquez, Guatemala, El Progreso, Jalapa, Chiquimula and Jutiapa. This cluster is characterized by high rangeland cover (34.3 %; 11 893.3 km2) and substantial tree cover (47.1 %; 16 298.9 km2), while cropland is minimal (3.1 %; 1088.6 km2) (Fig. 4f). Notably, built-up areas occupy the largest proportion across clusters (14.8 %; 5137.1 km2).
3.3 Meteorology
Figure 5 illustrates the annual variability and monthly climatology of meteorological variables over Guatemala derived from ERA5 reanalysis. Figure 5a, c, exhibits the BLH and precipitation, respectively. The BLH shows fluctuations with the highest median recorded in 2019 (524 m). contrasted by the lowest median observed in 2017 (415 m) which also recorded the minimum value (305 m) (Table S6). Although the annual medians varied moderately, the peak monthly BLH values detected during 2020 (791 m) indicate high intra annual variability during that year. At the monthly scale, April shows the highest BLH (median 671 m), while the lowest occurred in October (median 348 m). Furthermore, the distribution of the twelve-monthly total precipitation values within each year shows that the median monthly precipitation was highest in 2020 (164 mm) and 2022 (142 mm), while the lowest median monthly occurred in 2019 (89 mm). The maximum monthly precipitation values exceeded 840 mm in 2017, 2021, and 2022, reaching an overall maximum of 1283 mm in 2022. The monthly climatology indicates that precipitation increased rapidly from May onward, with median monthly precipitation increasing from 49 mm in April to 135 mm in May, peaking in June (269 mm), before remained elevated through October. Subsequently, precipitation declined during the dry season, with the lowest median climatological precipitation occurred in February (28 mm).
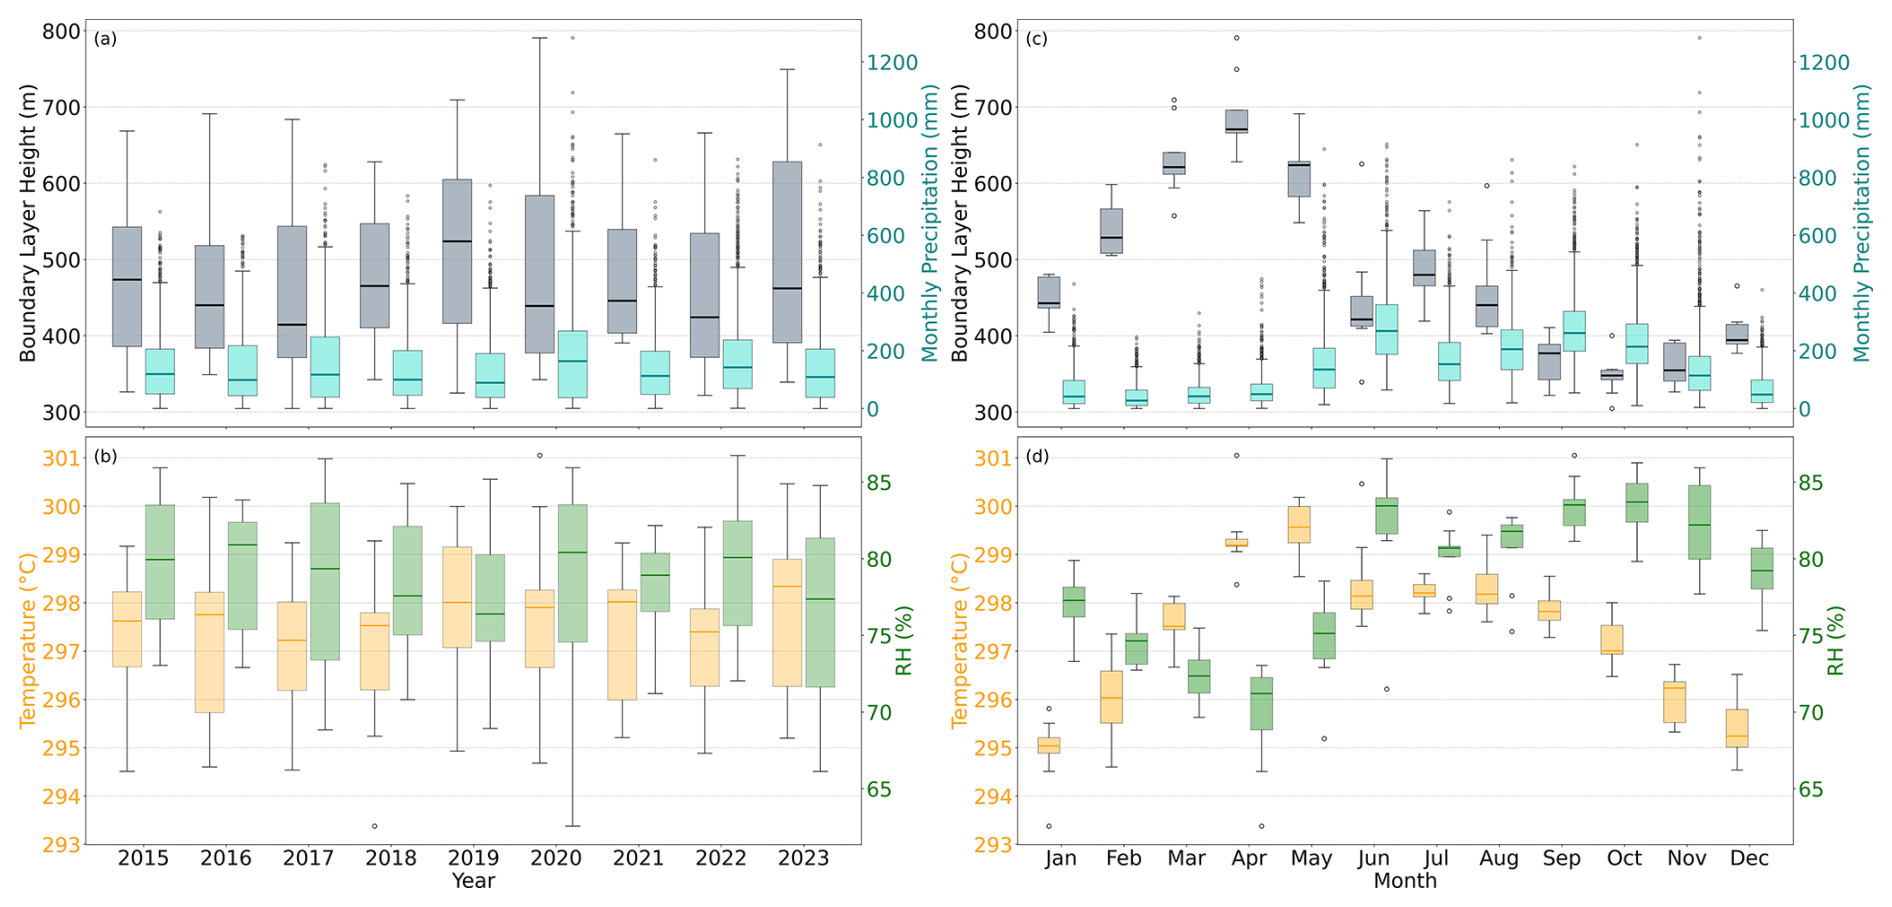
Figure 5Annual distribution of monthly ERA5 meteorological variables and monthly climatology over Guatemala (2015–2023). Annual boxplots represent the distribution of the twelve monthly values within each year, (a) boundary layer height (m) (gray) and monthly precipitation (mm) (turquoise). (b) relative humidity (RH %) (green) and temperature (°C) (yellow). Monthly climatology boxplots represent the distribution of each calendar month across all study years. (c) boundary layer height (m) and monthly precipitation (mm). (d) temperature (°C), and relative humidity (RH, %).
Figure 5b, e presents the air temperature and relative humidity. The highest annual median temperature occurred during the 2023 (22.8 °C), whereas the maximum was detected in 2020 (27.9 °C). The lowest temperature was recorded in 2018 at 20.2 °C. Additionally, the warmest month is May (median 26.4 °C) and the coldest is January (21.9 °C). Relative humidity showed the highest annual median in 2016 (81 %), while the lowest annual median occurred in 2019 (76 %). The minimum value was detected in 2020 with 63 %, which also featured the largest relative humidity values. The years 2017 and 2022 exhibited the maximum values with 87 %. Monthly medians indicated that the lowest relative humidity occurs in April (71 %) and the highest in October (84 %).
3.4 Fires activity and biomass burning patterns
In order to connect the previously described NH3 patterns with biomass-burning, Fig. 6 combines the annual spatial distribution of MODIS active fires detection with the distribution of monthly fire counts in Guatemala during the study period. The fire activity reveals a marked interannual variability. The highest monthly fire count occurred in 2023 (median 59), followed by 2016 (median 50), where the lowest was observed in 2022 (median 19), (Table S4). Fire activity was also relatively low in 2018 (median 28) and 2021 (median 30.5) respectively. Although 2020 had a relatively low median monthly fire count (median 26) it exhibited the largest monthly variability (standard deviation 272) and included the highest monthly fire count during the study period (957). In contrast 2016 and 2017 showed the highest total annual fire counts (1779, 1783), while 2022 had the lowest total (807).
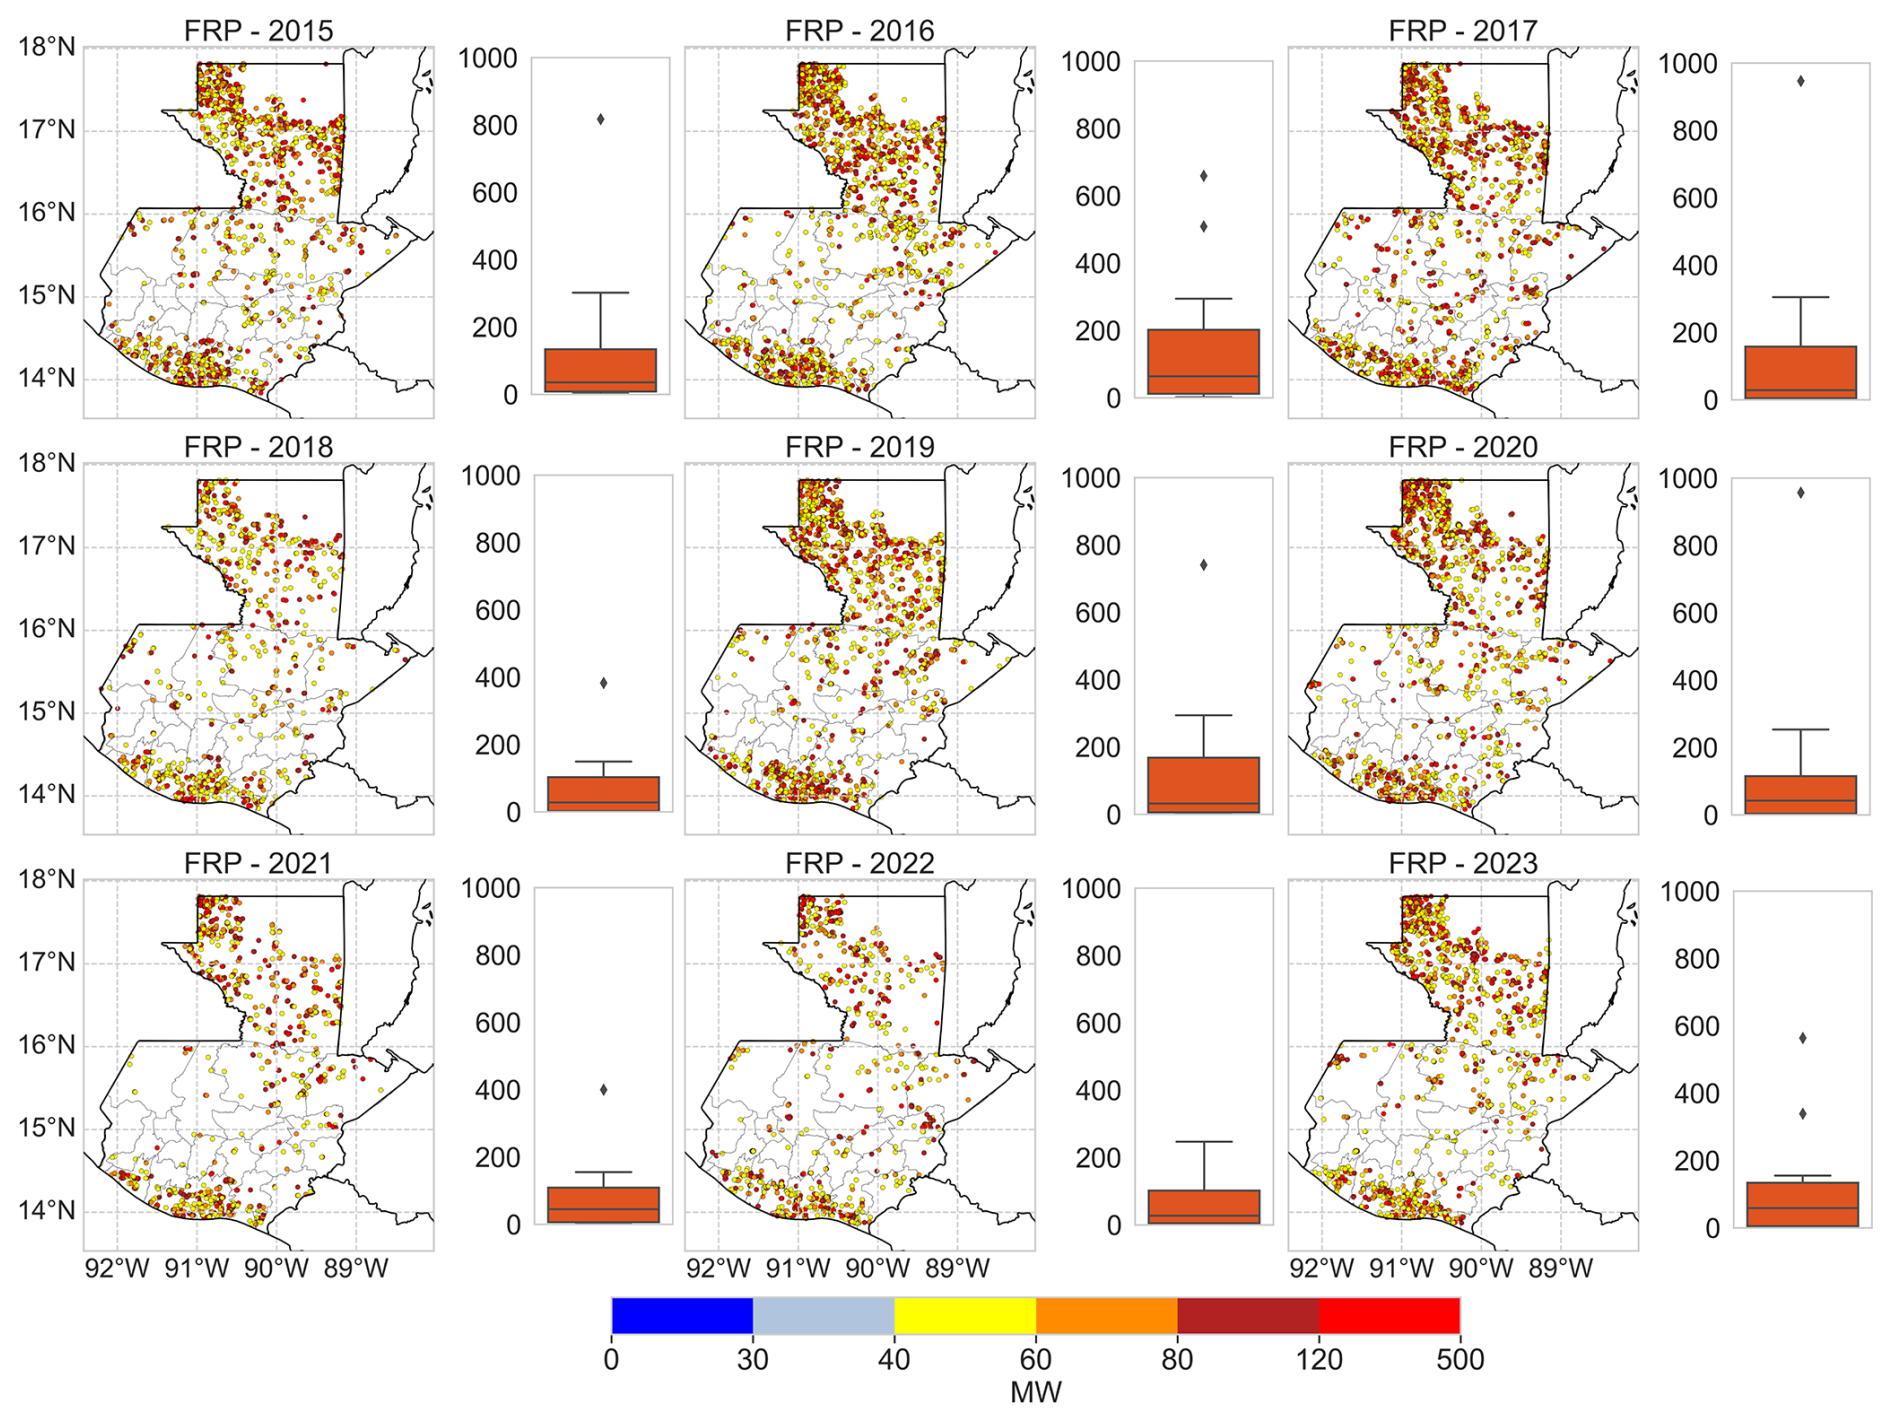
Figure 6Annual spatial distribution of MODIS active-fire detection and distribution of monthly fire counts over Guatemala (2015–2023), Maps show detected fire locations colored according to FRP (MW), filtered by nominal confidence level ≥70 % and FRP ≥40 MW, the boxplots represent the distribution area-wide of monthly fire count within each year.
The spatial distribution of detected fires corresponds with the temporal variability in fire counts, showing pronounced interannual differences in both fire occurrence and spatial heterogeneity. Years with elevated fire occurrence (2016, 2017, 2019, 2020, and 2023), showed widespread spatial extents of fire detections, with recurrent hotspots concentrated primarily in the northern (Petén) and along the southern area (Escuintla, Suchitepéquez, Retalhuleu, and Santa Rosa). In contrast, years of reduced fire activity, including 2018, 2021 and 2022, showed decreased detections, and reduce spatial confined distribution of fires.
The monthly climatology of fire activity in Guatemala is illustrated in Fig. 7. The boxplots show a clear seasonal pattern in detected fires. Fire activity is relatively low at the beginning of the year, with a median of 78 in January, and 105 in February (Table S5). A substantial rise occurs in March (median 211), while April exhibited the highest fire activity (median 659) detected fires and a maximum of 957. Consequently, the month of May demonstrated a decrease of in the number of fires (median 238). Moreover, an observed sharp decline in June (median 15), and the lowest fire activity occurs in September (median 3). Finally, slight increase is observed at the end of the year in December (median 46).
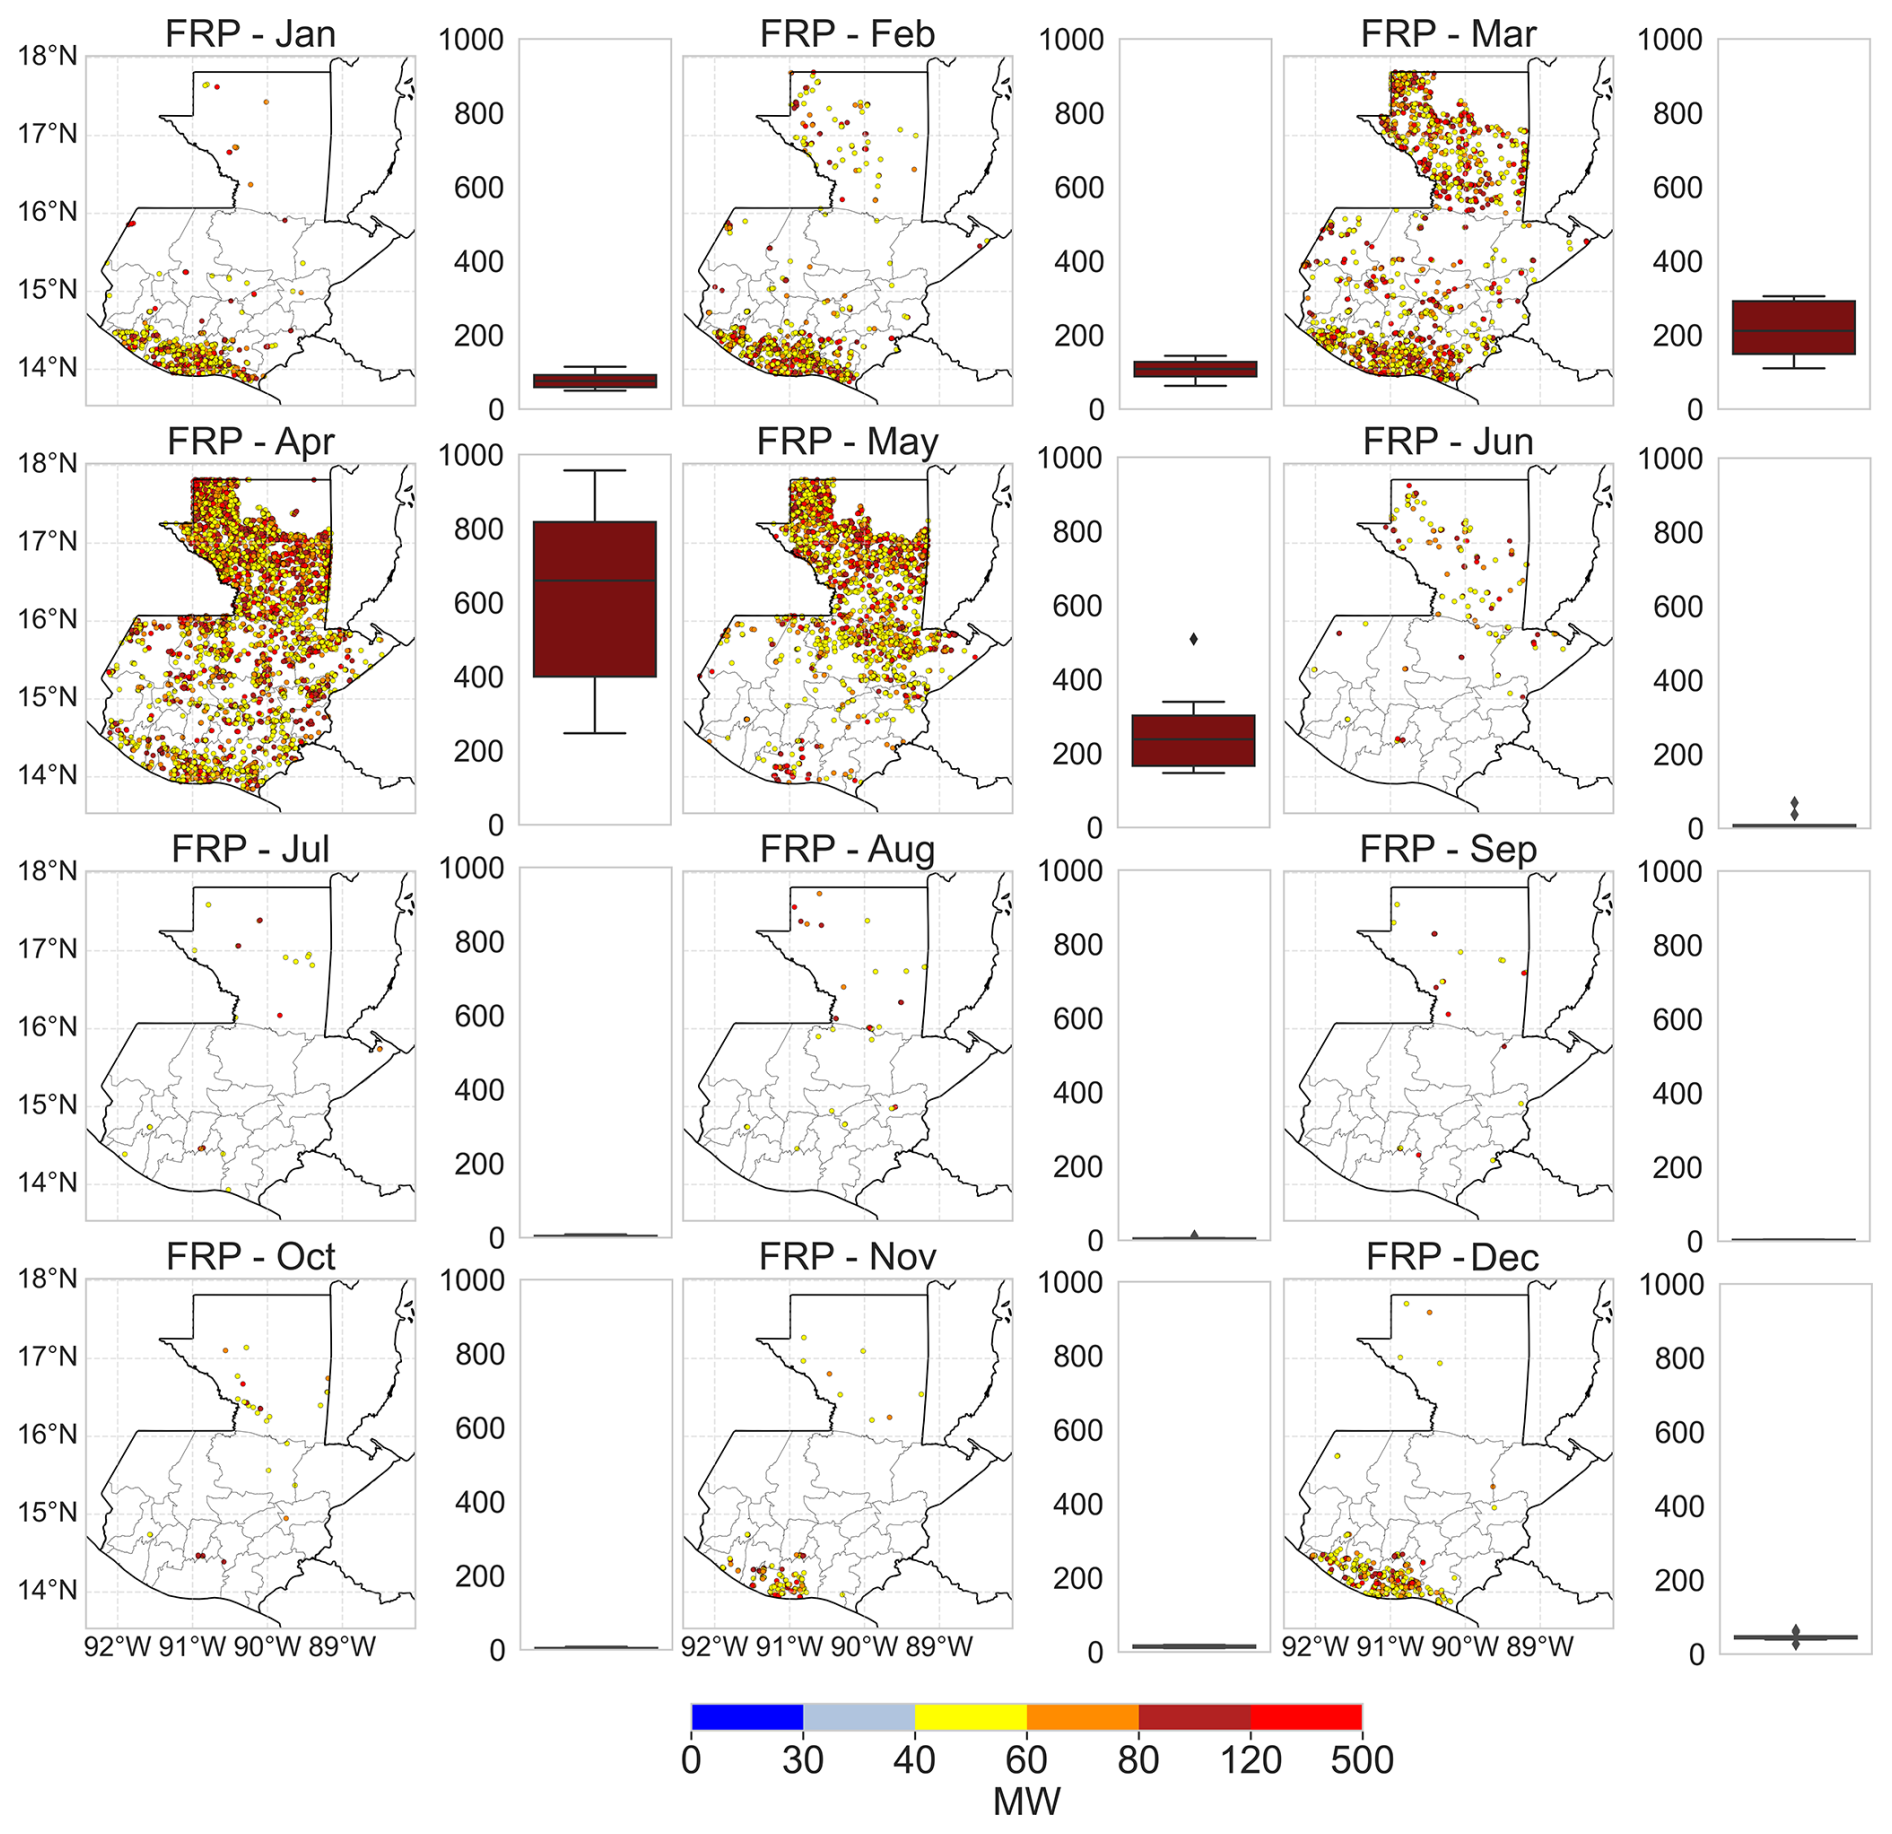
Figure 7Monthly climatology of MODIS active-fire detection and distribution of fires count over Guatemala (2015–2023), Maps show detected fire location for each calendar month, colored according to FRP (MW), fire detection were filtered by nominal confidence level ≥70 % and FRP ≥40 MW, the boxplots represent the distribution area-wide of fire counts for each calendar month across all years.
The spatial distribution of FRP across Guatemala also confirms this seasonal pattern and shows the shifts in fire location and intensity. During the early months of the year, fire activity is concentrated mainly along the southern areas (Escuintla, Suchitepéquez, Retalhuleu, and Santa Rosa). As the fire season advances, the activity shifts northward with central-north (Huehuetenango, Quiché, Alta Verapaz, Santa Rosa, Izabal), and northern (Petén). In November and December, the fire remerged in the southern coast (Escuintla, Suchitepéquez, and Retalhuleu).
4.1 Persistent agricultural sources of NH3 background
The variability of NH3 total columns over Guatemala reflects the interaction between persistent agricultural sources, and episodic biomass burning. Although annual median of NH3 are relatively stable throughout the study period (3.95–4.66 × 10¹⁵ molecules cm−2, Table S1), interannual differences were associated with increases in maximum values and standard deviations in some specific years (2016, 2019, 2020, and 2023) indicating that episodic events were superimposed on a relatively stable background. Across the study period (9 years) annual median of NH3 varied about 18 % where the maximum values and standard deviations increased markedly during nine years with increased fire activity. This indicates that episodic events primarily affected the magnitude and variability of NH3 rather than its background values. These observations suggest that persistent agricultural activities likely maintain the regional NH3 background, whereas biomass burning primarily contributes to short term enhancements specifically during the dry season.
The spatial patterns further support this interpretation. Increased NH3 columns were consistently observed in the departments of Petén, Alta Verapaz, Quiche, Izabal and Escuintla during the study period, including years with relatively low annual NH3, suggesting the presence of continuous NH3 sources rather than isolated episodic events. Land cover analysis indicates that cluster 1, which contains the highest NH3 columns, is characterized by a greater proportion of cropland (16.7 %) while tree cover remains extensive across all clusters. Although rangeland is also abundant, its relatively high proportion in cluster 3 (low NH3) suggests that rangeland alone cannot explain the observed NH3 distribution. Instead, the larger cropland area in cluster 1 suggests a stronger contribution of agricultural activities to elevated NH3 total column. The seasonal timing of these persistent hotspots is also consistent with agricultural practices in Guatemala, where land preparation, shifting cultivation, and biomass burning for crops are concentrated during the dry season (Liu et al., 2024b; Monzón-Alvarado et al., 2012; Ríos and Raga, 2018). These findings are consistent with previous studies showing that agricultural practices dominate global source of atmospheric NH3 (McDuffie et al., 2020; Sutton et al., 2013), and with satellite observations from South Asia (Abeed et al., 2023), and Western Europe (Van Damme et al., 2018). Furthermore, cluster 1 has the smallest spatial extent but the highest NH3 values, demonstrating that NH3 is more strongly associated with localized agricultural land use than the total area occupied. In contrast, the central highlands exhibit low NH3 despite the presence of urban areas (Huehuetenango, Quiché, San Marcos, Sololá, Guatemala, Fig. 4), suggesting that urban emissions play a secondary role at the national scale.
While persistent agricultural activities appear to maintain the NH3 background, the pronounced seasonal cycle demonstrates that additional processes regulate the short-term variability. Monthly NH3 levels reached their highest values during the months of March–April–May (MAM, mean 7.49 × 10¹⁵ molecules cm−2), which coincides with the regional fire season (mean total fire count 3321), and also increases the variability where events of high columns of NH3 appeared. This seasonal increase points to episodic biomass burning and meteorological conditions that modulate NH3 above persistent agricultural background.
4.2 Biomass burning, and meteorological controls on seasonal and interannual NH3 variability
Although persistent agricultural activities likely maintain the background atmospheric NH3 (Sect. 4.1), the seasonal and interannual variability is primarily explained by biomass burning. Monthly NH3 exhibited a strong positive relationship with fire activity (r=0.65, Fig. 8), with the highest values occurring during the fire season (MAM). During this period, mean NH3 columns reached 7.49 × 10¹⁵ molecules cm−2, coinciding with a mean fire count of 3321. Following the onset of the wet season, fire activity declined by approximately 94 % between May and June, accompanied by a 42 % decrease in mean NH3 (9.53 × 10¹⁵ molecules cm−2 to 5.56 × 10¹⁵ molecules cm−2). This indicates that biomass burning is the dominant driver of short-term NH3 enhancements superimposed on the persistent agricultural background.
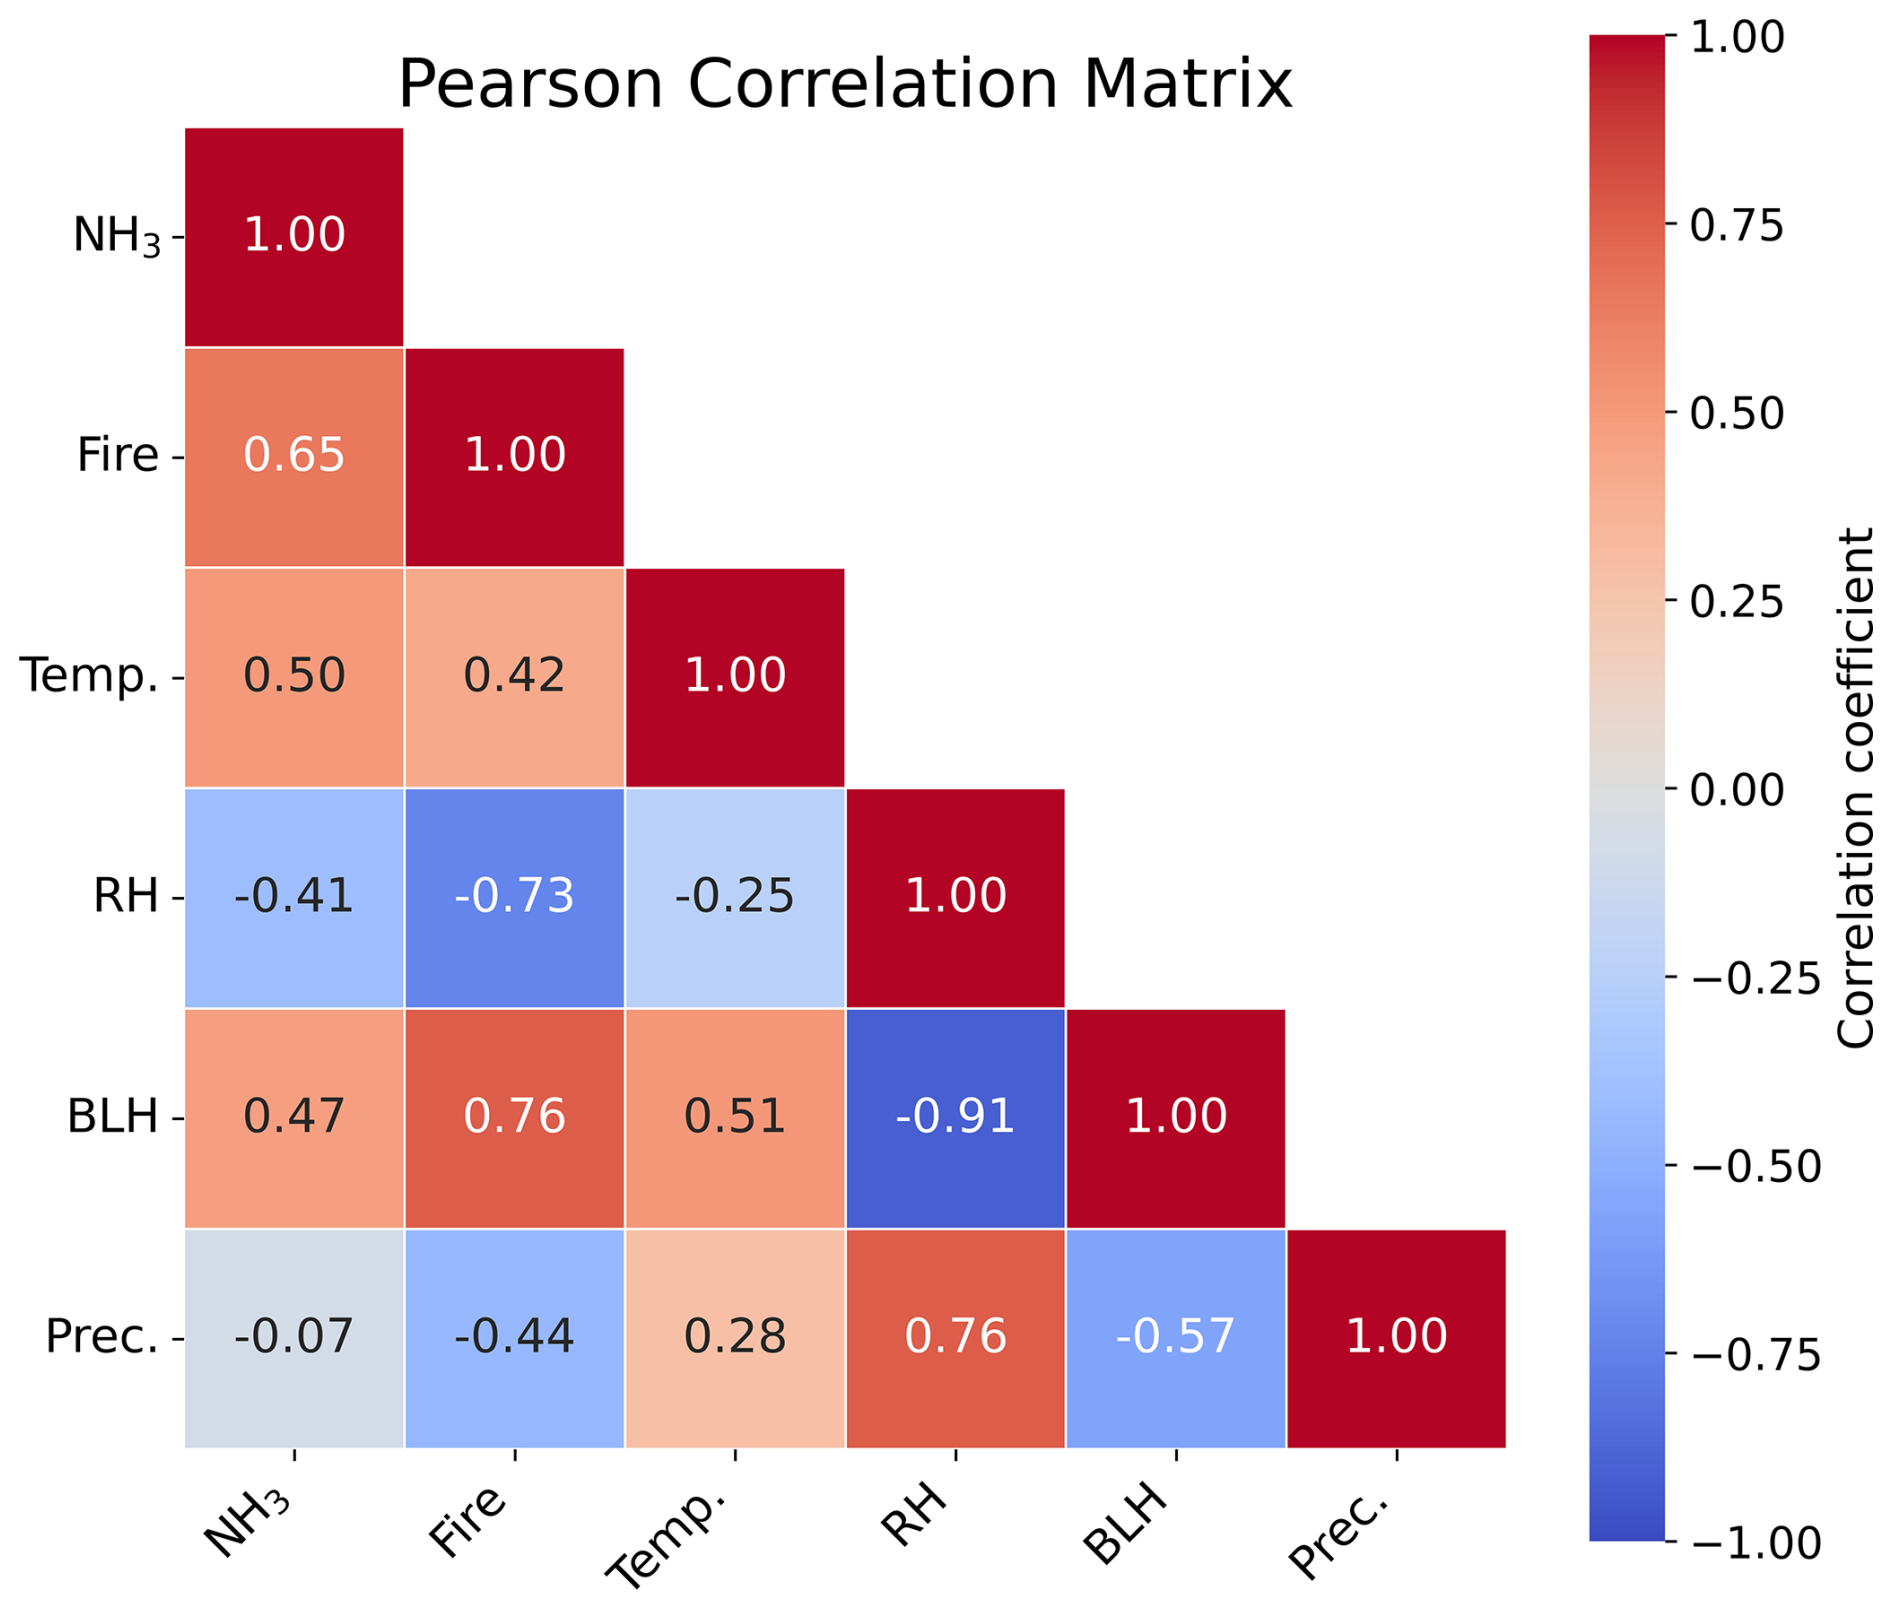
Figure 8Pearson correlation matrix of NH3 and meteorological variables over Guatemala (2015–2023): Fire, temperature (Temp, °C), relative humidity (RH, %), boundary layer height (BLH, m), and monthly total precipitation (Prec, mm).
The spatial distribution of fires further supports this interpretation, with recurrent fire hotspots in northern Guatemala (Petén) and the southern coast (Escuintla). Petén shows the strongest area of fire activity, including the officially designated protected areas that correspond to the large Maya Biosphere reserve (CONAP, 2016). The observed pattern of fire activity is predominantly anthropogenic. Previous studies indicate that most fires globally are human induced (FAO, 2007), and in Central America lighting occurrence is minimal during the dry season (November–April) (Kucieńska et al., 2010) when fire activity is highest. The coincidence between fire occurrence hotspot, cropland regions, and elevated NH3 suggests that agricultural burning and land preparation practices substantially contribute to the seasonal increase of NH3.
Meteorological conditions further modulate the magnitude of biomass burning on atmospheric NH3. Periods with increased fires activity were associated with higher temperature (r=0.42) and BLH (r=0.76), indicating that warmer conditions promote both fire occurrence and vertical distribution of NH3. Although the relationship with monthly precipitation was weak (), the seasonal transition to the rainy period coincided with a substantial reduction in both fire activity and atmospheric NH3, consistent with enhanced wet removal during the we season. Years characterized by extreme temperature conditions (2016, 2020, 2023) from Table S6, were consistent reported by INSIVUMEH (2023). These years occurred during the episode of El Niño Southern Oscillation (ENSO), which modulates temperature and precipitation conditions in the region of Central America (Anderson et al., 2023). Similar patterns were reported for Amazonia, where NH3 emission from biomass burning exhibit strong spatial and temporal variability, with interannual peaks linked to severe droughts and late fire-season activity, highlighting the influence of ENSO events (Anderson et al., 2023; Whitburn et al., 2016). Similarly, in Southeast Asia, particularly Indonesia, widespread human-induced fires for land clearing burned extensive tropical forest and peatlands (Chang et al., 2021; Whitburn et al., 2016).
4.3 April 2020 extreme episode associated with biomass burning and meteorological conditions on NH3
The mechanisms discussed above converged during April 2020, producing the most intense atmospheric NH3 episode observed during the study period. This event provides an illustrative example of how a combination of persistent agricultural activity, biomass burning, and favorable meteorological conditions can produce extreme NH3 levels. This month recorded the highest NH3 total column observed during the study period (2.3 × 10¹⁶ molecules cm−2, Fig. 9), despite occurring shortly after the implementation of COVID-19 lockdown measures in March 2020. Similar increases in atmospheric NH3 during lockdown conditions have been reported in previous studies, which attributed this trend to the persistence of agricultural activities and biomass burning (Evangeliou et al., 2025; Lovarelli et al., 2021; Viatte et al., 2021; Xu et al., 2022). The spatial distribution indicates distinct NH3 hotspots concentrated in the northern (Petén), north-central (Quiché) and southern (Escuintla), with the highest values observed in the department of Petén, reaching up to (6.4 × 10¹⁶ molecules cm−2). Wind vectors were characterized by strong easterly winds (∼ 3 meter per second, m s−1) that dominated the northern region, potentially facilitating the transport of NH3, while central areas of Guatemala experienced moderate to stagnant wind conditions.
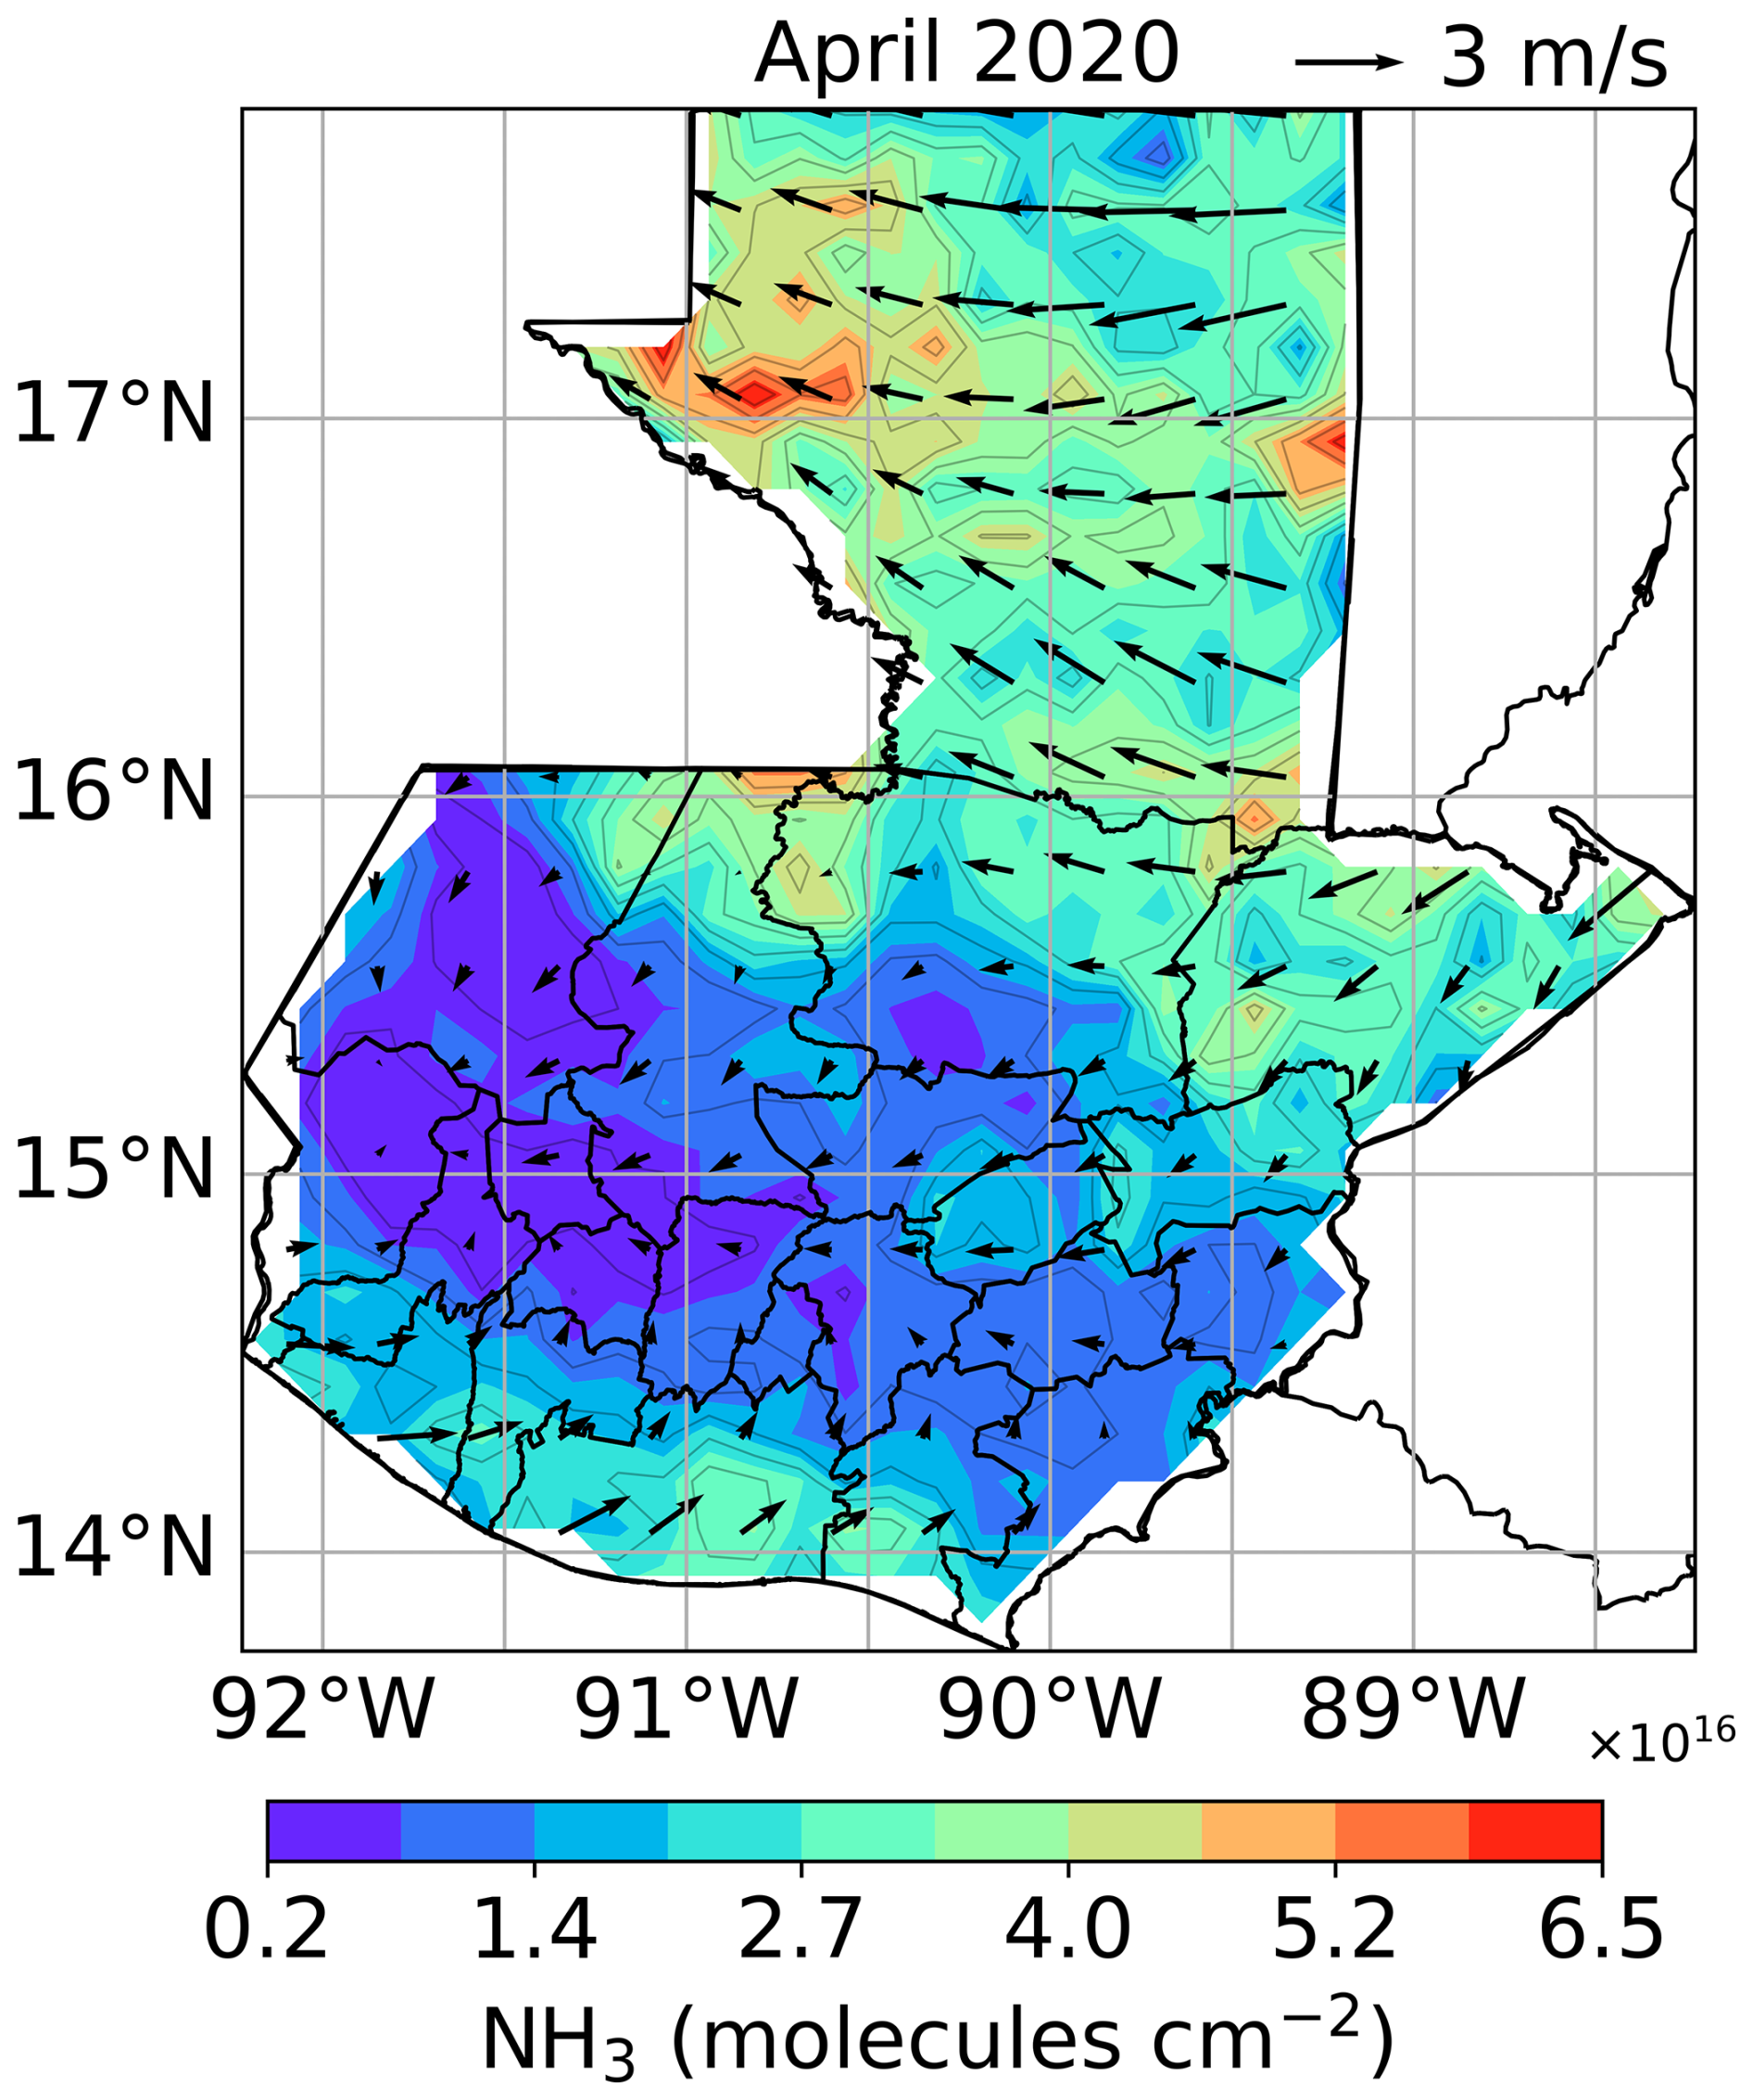
Figure 9Monthly mean area-wide of NH3 total column (× 1016 molecules cm−2) from the concatenated IASI A, B and C, and wind mean vectors from ERA5 over Guatemala (April 2020).
The vertical distribution of atmospheric NH3 further supports the interpretation that the April 2020 event was dominated by near surface NH3 as evidenced by the averaged vertical profiles of the mass mixing ratios (kg kg−1). The zonal cross-section of NH3 shows the highest values below approximately model level 56, located between 14 and 15° N latitude (Fig. 10a). This indicates that the enhanced columns originated primarily within the lower troposphere rather than from long-range transport. This vertical confinement is consistent with the values register from agricultural activities and biomass burning which remained concentrated near the surface during the event. Furthermore, the area average vertical profiles in Fig. 10b demonstrate the exceptional character of the April 2020 episode. Mean NH3 mixing ratios (∼ 1.0 × 10⁻⁹ kg kg−1) exceeded both the spring average (∼ 0.9 × 10⁻⁹ kg kg−1) and the annual 2020 mean (∼ 0.5 × 10⁻⁹ kg kg−1), indicating that the event represented a substantial enhancement beyond normal seasonal conditions rather than typical dry season variability.
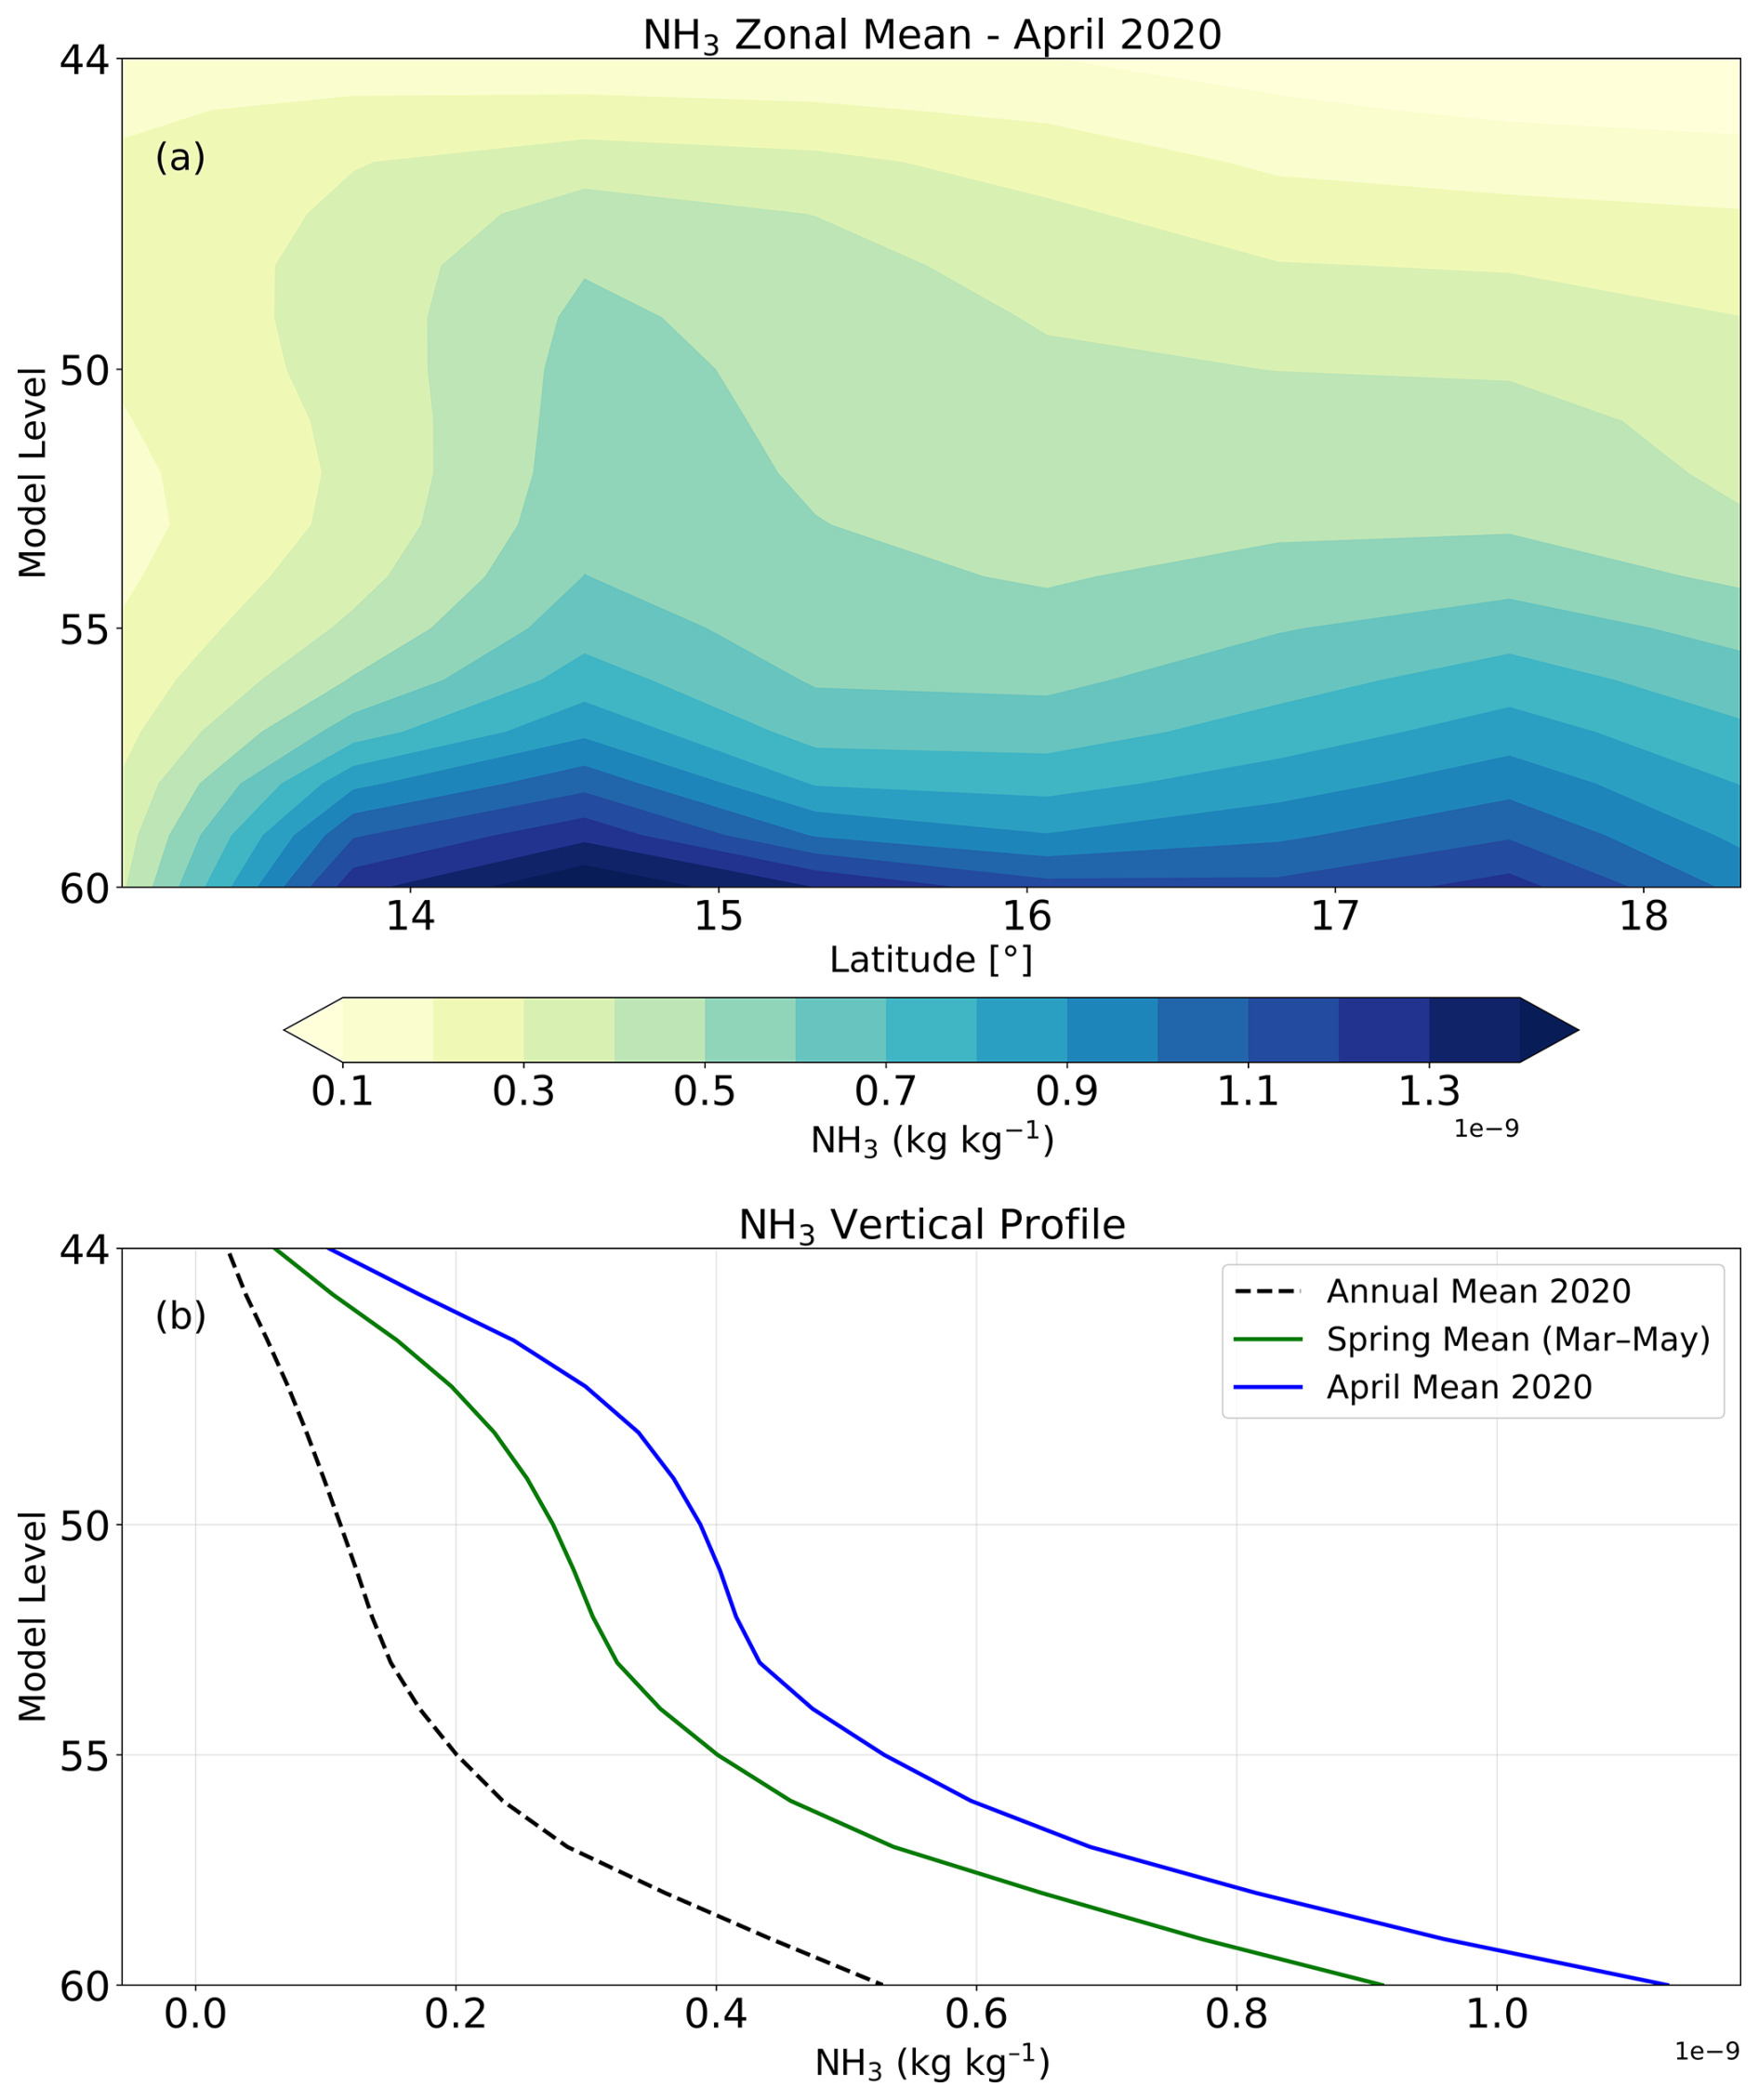
Figure 10(a) zonal mean of NH3 mass mix ratio (kg kg−1) across latitudinal bands (model level 60 to 44) for April 2020 and (b) vertical profile of NH3 mass mix ratio (kg kg−1) for April (blue line), spring (March–May, green line) and annual mean 2020 (black dashed line) over Guatemala from global reanalysis CAMS.
The concurrent fire activity strongly supports biomass burning as the principal driver of this exceptional event. April 2020 recorded the highest monthly number of detected fires across Guatemala throughout the entire study period (957 fires; Figs. 11, S5). Most detections occurred in northern Guatemala (Petén) accounting for 674 active fires (Table S7, Fig. S6), alongside widespread burning across the north-central (Quiché, Alta Verapaz, and Izabal), and southern areas (Escuintla, Santa Rosa, and Jutiapa). The spatial correspondence between fire hotspots, burned areas, and NH3 maxima provides additional evidence that biomass burning substantially amplified atmospheric NH3during this month.
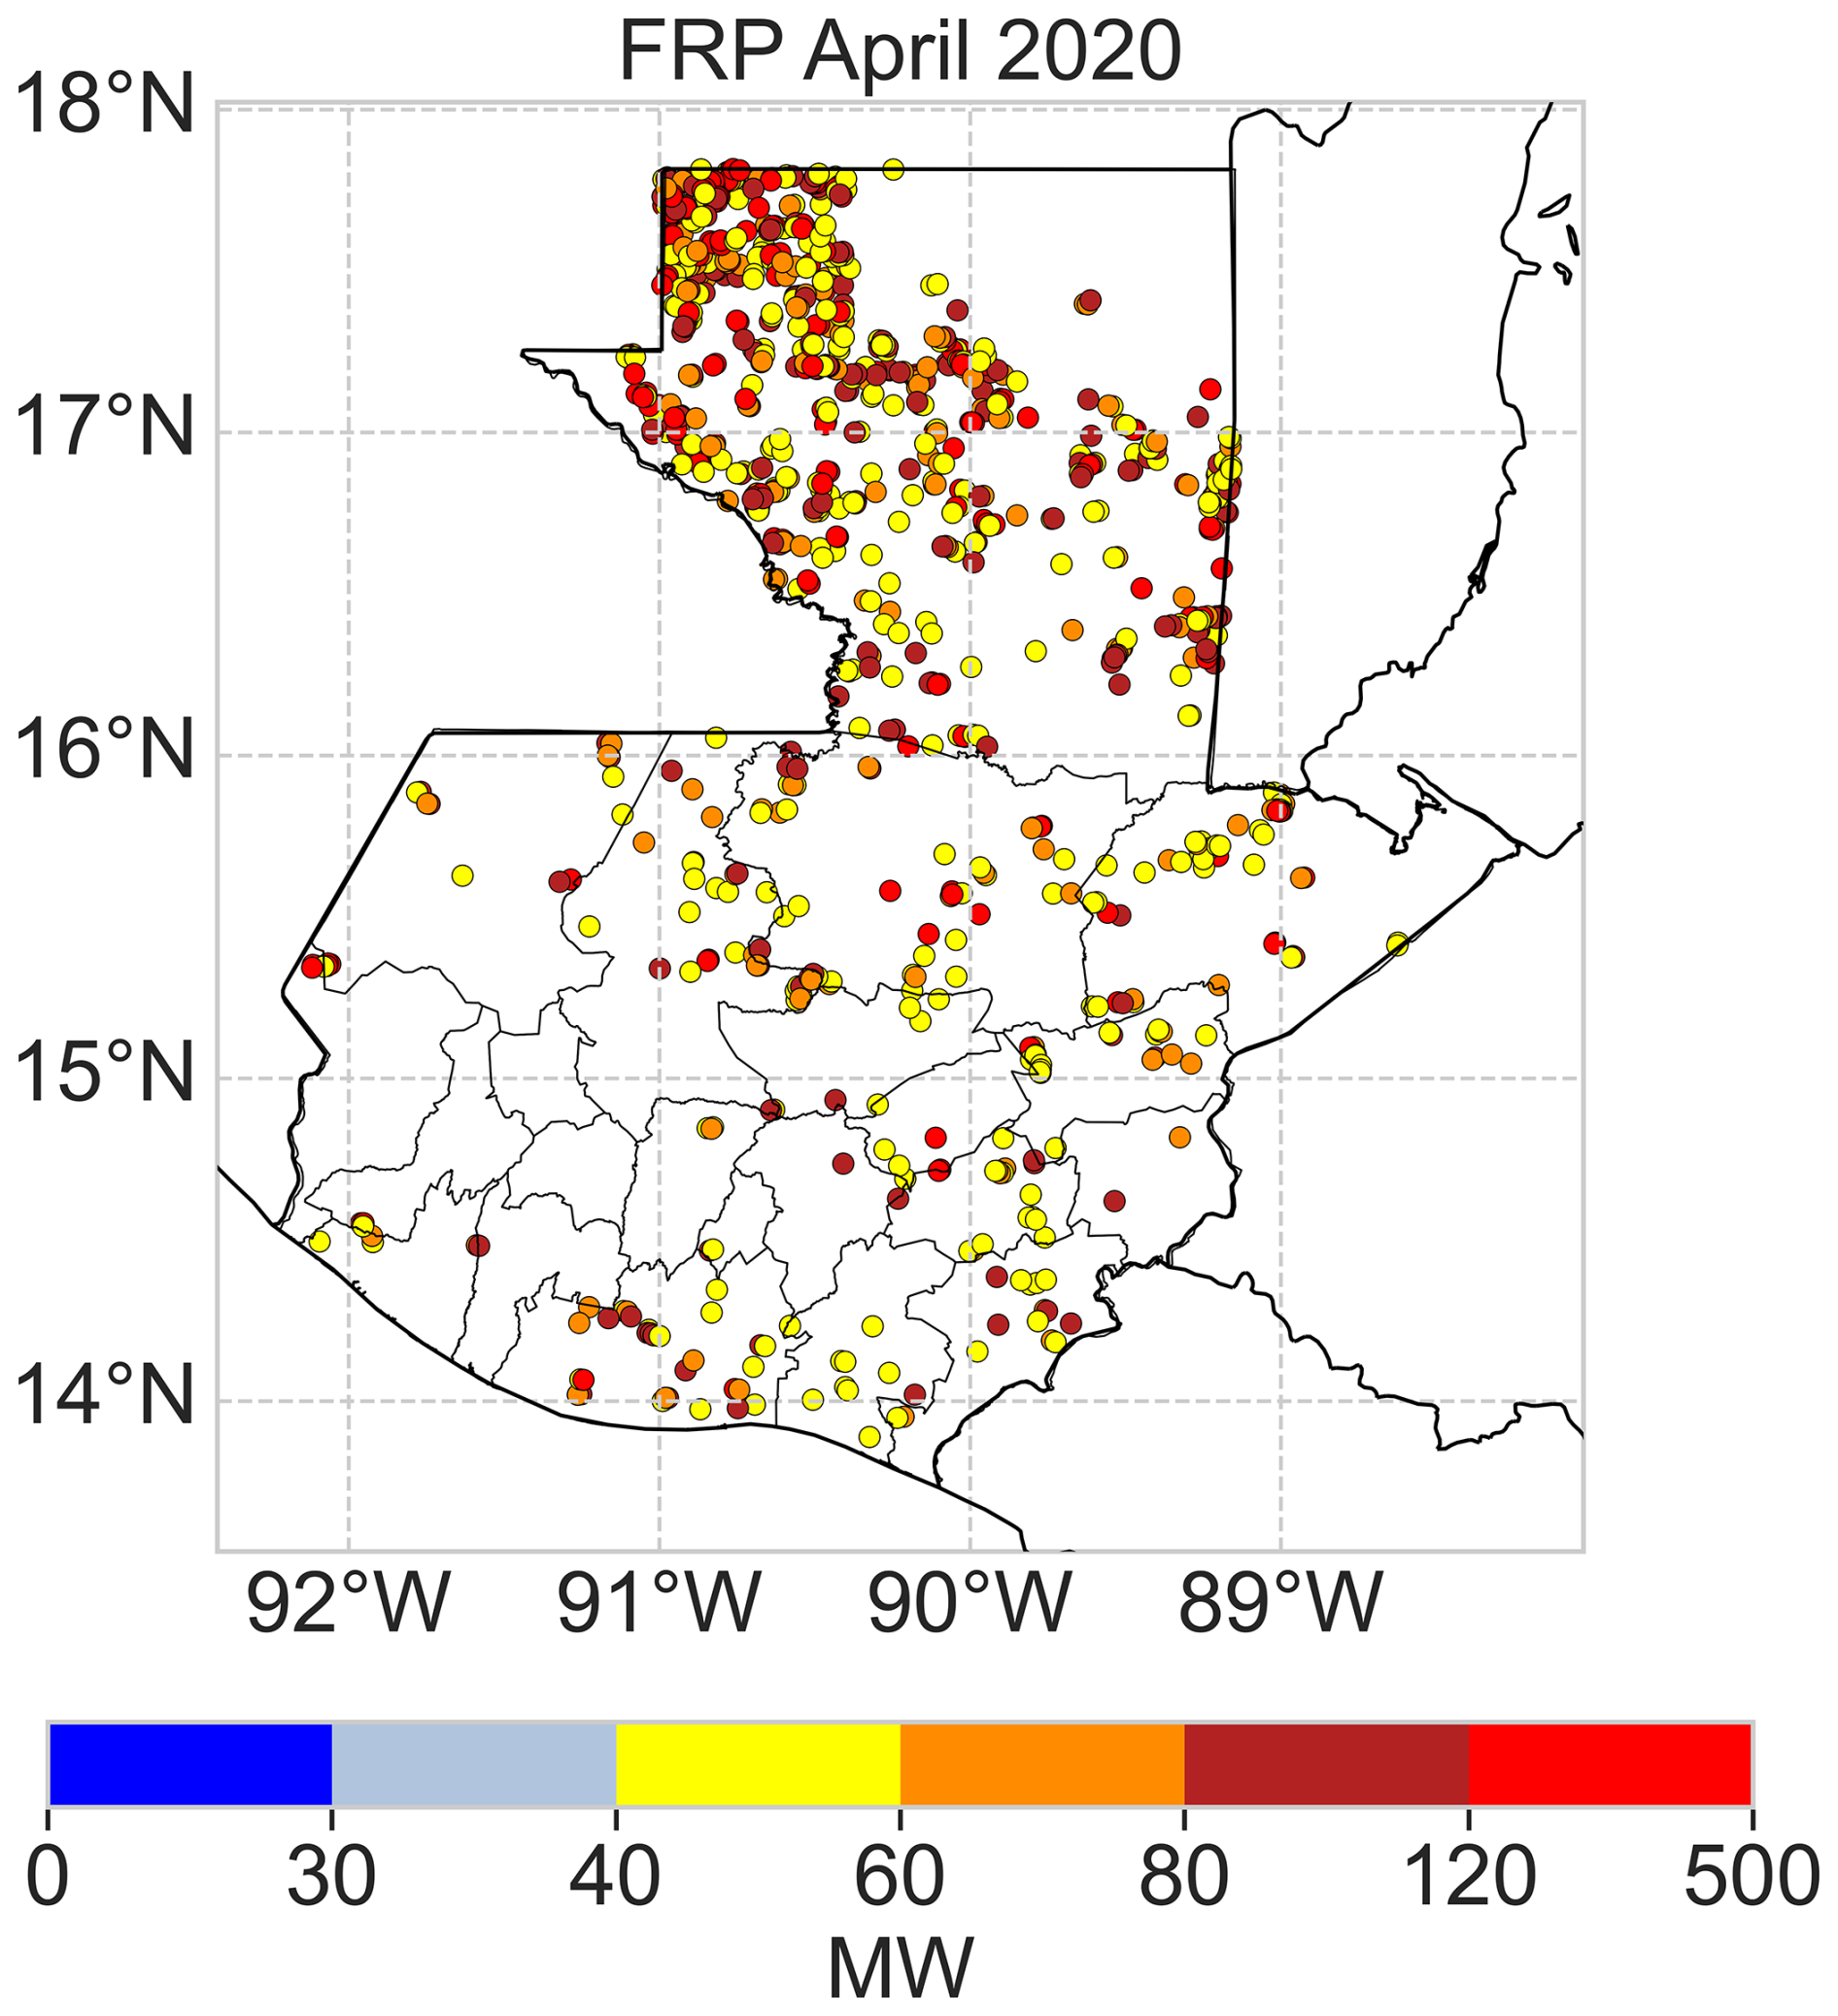
Figure 11April 2020 shows the spatial distribution of area-wide of fires detected over the study period over Guatemala (2015–2023), using MODIS fire detection filtered by nominal confidence level ≥70 % and FRP ≥40 MW.
4.4 Robustness and implications of the concatenated satellite observation of NH3
The concatenated dataset integrated a total of 228 months of observation data across the 108 months of the study period, providing stable timeseries for analyzing NH3 variability over Guatemala. A comparison during the overlapping period shows a strong correlation between sensors, with R2 above 0.9 and regression slopes close to 1 (Fig. S7). This indicates that the inter-sensor differences are relatively small compared to the observed variability over time. Furthermore, the biases represent only a small fraction of the mean NH3 column, supporting the use of a concatenated dataset for long-term analysis. This consistency is further supported by the monthly L3 total column from individual IASI sensors (Fig. S3 and Table S3), aligning with previous time-series studies for the three sensors and demonstrating robustness over 10 different remote regions (Clarisse et al., 2023; Van Damme et al., 2014).
The observation sampling density remains relatively stable over time, ranging from 1.85–2.65 obs. grid cell per month with mean annual pixel counts between 978 and 1492 (Table S10). The year 2020, which exhibits the highest NH3 is associated with a lower observation density (1.97 obs. grid cell per month), indicating that the observed maximum is not driven by increased sampling effort. This is further supported by the absence of a significant relationship between sampling frequency and NH3 levels (R2=0.028, Fig. S8), confirming that the observed variability is not an artefact of sampling bias. Moreover, the standard errors (Table S9) remain small relative to the magnitude of interannual variability. This indicates that the observed differences between years exceed the measurement uncertainty and robustness of the NH3 column patterns. On a seasonal scale, a clear pattern emerges: peak columns coincide with months of high sampling density (MAM), while lower columns during the rainy season occur under a 17 % reduction in observation density, likely due to increased cloud cover. The lower sampling density detected is located over high altitude regions such as Sierra de las Minas (Fig. S9), which is associated with persistent cloud forests (Chaluleu, 2020; Holder, 2003, 2006).
Although topography varies considerably across Guatemala (Fig. 1), the major NH3 hotspots are more closely associated with agricultural land use than with elevation gradients. The observed spatial distribution of NH3 does not simply follow elevation patterns. Elevated NH3 columns are observed over low- and mid-elevation agricultural areas (Petén, Alta Verapaz, Quiché, Izabal and Escuintla). In contrast, some low-elevation areas exhibit relatively low NH3, despite having some of the highest satellite observation densities (Fig. S9). This pattern is consistent with the limited extent of agricultural activities in these specific low-yielding zones, rather than indicating an elevation-related retrieval artifact. These observations indicate that the spatial variability of NH3 primarily reflects differences in total column sources rather than terrain-induced biases.
Finally, the use of the L3 dataset, based on averaging L2 retrievals, ensures that the observations retain the original retrieval signal. Guatemala's tropical location also provides favorable thermal contrast conditions for infrared NH3 retrievals, supporting robust NH3 detection despite a relatively moderate background total column.
This study provides the first long-term spatiotemporal assessment of the concatenated IASI A/B/C atmospheric NH3 total column dataset, utilizing both day and night overpasses over Guatemala from 2015 to 2023. By combining these measurements with MODIS fire detections, land cover maps, and ERA5 meteorological reanalysis data, the analysis revealed a consistent seasonal cycle and marked interannual variability. The highest NH3 levels occurred during the dry season (March–May), followed by a rapid decline associated with the onset of the rainy season. While annual median of the NH3 column remained stable (ranging from 3.95 to 4.66 × 10¹⁵ molecules cm−2), episodic enhancement events, particularly in 2016, 2020 and 2023, produced substantially higher maximum values.
The combined analysis indicates that NH3 variability results from the interaction between persistent agricultural sources and episodic biomass burning under favorable meteorological conditions. Agricultural land use, particularly cropland, appears to maintain a relatively stable NH3 background, whereas biomass burning during the dry season produces pronounced short-term enhancements. These peaks are further influenced by elevated temperatures and changes in boundary layer height, which favor the volatilization and vertical mixing of NH3. The sharp reduction in NH3 following the onset of the rainy season highlights the importance of wet deposition in clearing the atmospheric NH3 over tropical environments.
These findings are consistent with previous satellite studies reporting strong seasonal cycles of the NH3 driven by agricultural activity and biomass burning in Europe, South Asia, and other tropical regions. However, this study extends this understanding to Central America, where long-term satellite assessments of atmospheric NH3 have hitherto been largely unavailable. The integration of multiple IASI sensors demonstrates that long-term, concatenated satellite observations provide a robust characterization of NH3 variability in data-sparse tropical regions.
The study nevertheless has also some limitations. First, satellite retrievals remain affected by cloud cover and surface conditions, particularly in humid tropical and mountainous regions, which can reduce observation density and introduce seasonal biases. In addition, satellite-derived NH3 columns represent atmospheric abundance rather than direct emission fluxes, limiting direct source quantification. Although the integration of multiple datasets provides valuable qualitative insights, further studies combining ground-based observations with chemical transport modeling are required to improve source attribution and process understanding.
Finally, this study demonstrates that long-term satellite observations can successfully distinguish between persistent NH3 background levels and episodic biomass burning enhancements in tropical environments. These results improve our understanding of how agricultural activity, fire dynamics and meteorological variability interact to regulate atmospheric NH3, with important implications for secondary inorganic aerosols formation, nitrogen deposition, and regional atmospheric composition. Consequently, these findings provide a solid foundation for future studies integrating satellite observations, atmospheric chemistry models, and machine learning approaches to better quantify NH3 sources and their implications for air quality, ecosystems and climate.
Monthly atmospheric ammonia column products from the Infrared Atmospheric Sounding Interferometer (IASI A/B/C), versioned Level-3 data cover global grids, AERIS-IASI portal: https://iasi.aeris-data.fr/nh3/ (last access: 18 June 2025). Monthly meteorology variables are provided by the ERA5 reanalysis dataset (https://doi.org/10.24381/cds.f17050d7, Copernicus Climate Change Service, 2023). Active fire detections MODIS-Aqua/Terra from the NASA‐Earth Observing System's Fire Information for Resource Management System (FIRMS) database (https://firms.modaps.eosdis.nasa.gov/, last access: 22 May 2025). Burned area monthly L3 global 500m grid V061 (https://doi.org/10.5067/MODIS/MCD64A1.061, Giglio et al., 2021b). Atmospheric Composition Global Reanalysis 4 (EAC4), produced by the Copernicus Atmosphere Monitoring Service (CAMS) (https://doi.org/10.24381/d58bbf47, Copernicus Atmosphere Monitoring Service, 2020).
The supplement related to this article is available online at https://doi.org/10.5194/acp-26-12111-2026-supplement.
Conceptualization, CS and KT; methodology, CS and KT; formal analysis, CS; investigation, CS and PS; resources, CS and PS; data curation, CS; writing (original draft preparation), CS; writing (review and editing), CS, PS, and KT; visualization, CS; supervision, KT.
The contact author has declared that none of the authors has any competing interests.
Publisher's note: Copernicus Publications remains neutral with regard to jurisdictional claims made in the text, published maps, institutional affiliations, or any other geographical representation in this paper. The authors bear the ultimate responsibility for providing appropriate place names. Views expressed in the text are those of the authors and do not necessarily reflect the views of the publisher.
This paper was edited by Eleanor Browne and reviewed by two anonymous referees.
Abeed, R., Viatte, C., Porter, W. C., Evangeliou, N., Clerbaux, C., Clarisse, L., Van Damme, M., Coheur, P.-F., and Safieddine, S.: A roadmap to estimating agricultural ammonia volatilization over Europe using satellite observations and simulation data, Atmos. Chem. Phys., 23, 12505–12523, https://doi.org/10.5194/acp-23-12505-2023, 2023.
Ahmad, A. and Dey, L.: A k-mean clustering algorithm for mixed numeric and categorical data, Data Knowl. Eng., 63, 503–527, https://doi.org/10.1016/j.datak.2007.03.016, 2007.
Alfaro Marroquín, G. and Gómez, R.: Antecedentes y contexto del cambio climático en Guatemala, in: Primer reporte de evaluación del conocimiento sobre cambio climático en Guatemala, edited by: Castellanos, E. J., Paiz-Estévez, A., Escribá, J., Rosales-Alconero, M., and Santizo, A., Editorial Universitaria UVG, Guatemala, 2–19, https://sgccc.org.gt/wp-content/uploads/2019/07/1RepCCGuaCap1.pdf (last access: 22 May 2025), 2019.
Anderson, T. G., McKinnon, K. A., Pons, D., and Anchukaitis, K. J.: How Exceptional Was the 2015–2019 Central American Drought?, Geophys. Res. Lett., 50, https://doi.org/10.1029/2023GL105391, 2023.
Andreae, M. O.: Emission of trace gases and aerosols from biomass burning – an updated assessment, Atmos. Chem. Phys., 19, 8523–8546, https://doi.org/10.5194/acp-19-8523-2019, 2019.
Bardales Espinoza, W. A., Castañón, C., and Herrera Herrera, J. L.: Clima de Guatemala, tendencias observadas e índices de cambio climático, in: Primer reporte de evaluación del conocimiento sobre cambio climático en Guatemala, vol. 1, edited by: Castellanos, E. J., Paiz-Estévez, A., Escribá J., Rosales-Alconero M., and Santizo A., Editorial Universitaria UVG, Guatemala, 20–39, https://sgccc.org.gt/wp-content/uploads/2019/07/1RepCCGuaCap2.pdf (last access: 18 April 2025), 2019.
Chaluleu, C. A.: Fototrampeo en bosques nubosos y latifoliados de la Reserva de la Biósfera Sierra de las Minas, Revista Mesoamericana de Biodiversidad y Cambio Climático–Yu'am, 4, 44–65, 2020.
Chang, Y., Zhang, Y.-L., Kawichai, S., Wang, Q., Van Damme, M., Clarisse, L., Prapamontol, T., and Lehmann, M. F.: Convergent evidence for the pervasive but limited contribution of biomass burning to atmospheric ammonia in peninsular Southeast Asia, Atmos. Chem. Phys., 21, 7187–7198, https://doi.org/10.5194/acp-21-7187-2021, 2021.
Chen, P. and Wang, Q.: Underestimated industrial ammonia emission in China uncovered by material flow analysis, Environ. Pollut., 368, 125740, https://doi.org/10.1016/j.envpol.2025.125740, 2025.
Chen, P., Wang, Q., Shao, M., and Liu, R.: Significantly underestimated traffic-related ammonia emissions in Chinese megacities: Evidence from satellite observations during COVID-19 lockdowns, Chemosphere, 361, 142497, https://doi.org/10.1016/j.chemosphere.2024.142497, 2024.
Chuvieco, E., Mouillot, F., van der Werf, G. R., San Miguel, J., Tanase, M., Koutsias, N., García, M., Yebra, M., Padilla, M., Gitas, I., Heil, A., Hawbaker, T. J., and Giglio, L.: Historical background and current developments for mapping burned area from satellite Earth observation, Remote Sens. Environ., 225, 45–64, https://doi.org/10.1016/j.rse.2019.02.013, 2019.
Clarisse, L., Clerbaux, C., Dentener, F., Hurtmans, D., and Coheur, P.-F.: Global ammonia distribution derived from infrared satellite observations, Nat. Geosci., 2, 479–483, https://doi.org/10.1038/ngeo551, 2009.
Clarisse, L., Shephard, M. W., Dentener, F., Hurtmans, D., Cady‐Pereira, K., Karagulian, F., Van Damme, M., Clerbaux, C., and Coheur, P.: Satellite monitoring of ammonia: A case study of the San Joaquin Valley, J. Geophys. Res.-Atmos., 115, https://doi.org/10.1029/2009JD013291, 2010.
Clarisse, L., Van Damme, M., Clerbaux, C., and Coheur, P.-F.: Tracking down global NH3 point sources with wind-adjusted superresolution, Atmos. Meas. Tech., 12, 5457–5473, https://doi.org/10.5194/amt-12-5457-2019, 2019.
Clarisse, L., Franco, B., Van Damme, M., Di Gioacchino, T., Hadji-Lazaro, J., Whitburn, S., Noppen, L., Hurtmans, D., Clerbaux, C., and Coheur, P.: The IASI NH3 version 4 product: averaging kernels and improved consistency, Atmos. Meas. Tech., 16, 5009–5028, https://doi.org/10.5194/amt-16-5009-2023, 2023.
Coheur, P.-F., Clarisse, L., Turquety, S., Hurtmans, D., and Clerbaux, C.: IASI measurements of reactive trace species in biomass burning plumes, Atmos. Chem. Phys., 9, 5655–5667, https://doi.org/10.5194/acp-9-5655-2009, 2009.
CONAP: Ley de Áreas Protegidas y su Reglamento, Decreto No. 4-89 y sus Reformas, Decretos No. 18-89, 110-96 y 111-97 del Congreso de la República de Guatemala, 114, https://sip.conap.gob.gt/wp-content/uploads/2022/02/Ley-de-Areas-Protegidas-y-su-Reglamento.-Decreto-4-89.pdf (last access: 2 June 2025), 2016.
CONRED: Protocolo Nacional Temporada de Incendios Forestales y No Forestales, Guatemala, 3–83, https://wp-conred.conred.gob.gt/wp-content/uploads/2025/11/Protocolo-Nacional-Temporada-de-Incendios-Forestales-y-No-Forestales.pdf (last access: 19 April 2025), 2025.
Copernicus Atmosphere Monitoring Service: CAMS global reanalysis (EAC4), Copernicus Atmosphere Monitoring Service (CAMS) Atmosphere Data Store [data set], https://doi.org/10.24381/d58bbf47, 2020.
Copernicus Climate Change Service: ERA5 monthly averaged data on single levels from 1940 to present, Copernicus Climate Change Service (C3S) Climate Data Store (CDS) [data set], https://doi.org/10.24381/cds.f17050d7, 2023.
Corona‐Núñez, R. O. and Campo, J. E.: Climate and socioeconomic drivers of biomass burning and carbon emissions from fires in tropical dry forests: A Pantropical analysis, Glob. Change Biol., 29, 1062–1079, https://doi.org/10.1111/gcb.16516, 2023.
Dammers, E., Palm, M., Van Damme, M., Vigouroux, C., Smale, D., Conway, S., Toon, G. C., Jones, N., Nussbaumer, E., Warneke, T., Petri, C., Clarisse, L., Clerbaux, C., Hermans, C., Lutsch, E., Strong, K., Hannigan, J. W., Nakajima, H., Morino, I., Herrera, B., Stremme, W., Grutter, M., Schaap, M., Wichink Kruit, R. J., Notholt, J., Coheur, P.-F., and Erisman, J. W.: An evaluation of IASI-NH3 with ground-based Fourier transform infrared spectroscopy measurements, Atmos. Chem. Phys., 16, 10351–10368, https://doi.org/10.5194/acp-16-10351-2016, 2016.
Dong, Z. P., Yu, X., Li, X. M., and Dai, J.: Analysis of variation trends and causes of aerosol optical depth in Shaanxi Province using MODIS data, Chinese Sci. Bull., 58, 4486–4496, https://doi.org/10.1007/S11434-013-5991-Z, 2013.
Dragosits, U., Theobald, M. R., Place, C. J., Lord, E., Webb, J., Hill, J., ApSimon, H. M., and Sutton, M. A.: Ammonia emission, deposition and impact assessment at the field scale: a case study of sub-grid spatial variability, Environ. Pollut., 117, 147–158, https://doi.org/10.1016/S0269-7491(01)00147-6, 2002.
ESRI: ESRI: Sentinel-2 2020 Global Land Use/Land Cover (LULC) Map, 12 pp., https://www.esri.com/about/newsroom/wp-content/uploads/2021/08/global.pdf (last access: 9 April 2025), 2021.
European Space Agency: Copernicus Global Digital Elevation Model, European Space Agency [data set], https://doi.org/10.5069/G9028PQB, 2024.
Evangeliou, N., Tichý, O., Svendby Otervik, M., Eckhardt, S., Balkanski, Y., and Hauglustaine, D. A.: Unchanged PM2.5 levels over Europe during COVID-19 were buffered by ammonia, Aerosol Research, 3, 155–174, https://doi.org/10.5194/ar-3-155-2025, 2025.
FAO: Fire Management – Global Assessment 2006, 135 pp., http://www.fao.org/docrep/009/a0969e/a0969e00.htm (last access: 28 September 2025), 2007.
FAO: FAOSTAT. Countries by commodity, https://www.fao.org/faostat/en/ (last access: 5 May 2025), 2019.
Farren, N. J., Davison, J., Rose, R. A., Wagner, R. L., and Carslaw, D. C.: Underestimated Ammonia Emissions from Road Vehicles, Environ. Sci. Technol., 54, 15689–15697, https://doi.org/10.1021/acs.est.0c05839, 2020.
Flemming, J., Benedetti, A., Inness, A., Engelen, R. J., Jones, L., Huijnen, V., Remy, S., Parrington, M., Suttie, M., Bozzo, A., Peuch, V.-H., Akritidis, D., and Katragkou, E.: The CAMS interim Reanalysis of Carbon Monoxide, Ozone and Aerosol for 2003–2015, Atmos. Chem. Phys., 17, 1945–1983, https://doi.org/10.5194/acp-17-1945-2017, 2017.
Fouilloux, A.: annefou/metos_python: Working with Spatio-temporal data in Python (v2018.0.0), Zenodo [code], https://doi.org/10.5281/zenodo.1165281, 2018.
Franco, B., Clarisse, L., Stavrakou, T., Müller, J. ‐F, Van Damme, M., Whitburn, S., Hadji‐Lazaro, J., Hurtmans, D., Taraborrelli, D., Clerbaux, C., and Coheur, P. ‐F: A General Framework for Global Retrievals of Trace Gases From IASI: Application to Methanol, Formic Acid, and PAN, J. Geophys. Res.-Atmos., 123, https://doi.org/10.1029/2018JD029633, 2018.
Freeborn, P. H., Wooster, M. J., and Roberts, G.: Addressing the spatiotemporal sampling design of MODIS to provide estimates of the fire radiative energy emitted from Africa, Remote Sens. Environ., 115, 475–489, https://doi.org/10.1016/j.rse.2010.09.017, 2011.
Fu, Y., Li, R., Wang, X., Bergeron, Y., Valeria, O., Chavardès, R. D., Wang, Y., and Hu, J.: Fire Detection and Fire Radiative Power in Forests and Low-Biomass Lands in Northeast Asia: MODIS versus VIIRS Fire Products, Remote Sens. (Basel)., 12, 2870, https://doi.org/10.3390/rs12182870, 2020.
Gašparović, M., Zrinjski, M., and Gudelj, M.: Automatic cost-effective method for land cover classification (ALCC), Comput. Environ. Urban Syst., 76, 1–10, https://doi.org/10.1016/j.compenvurbsys.2019.03.001, 2019.
Giglio, L., Descloitres, J., Justice, C. O., and Kaufman, Y. J.: An Enhanced Contextual Fire Detection Algorithm for MODIS, Remote Sens. Environ., 87, 273–282, https://doi.org/10.1016/S0034-4257(03)00184-6, 2003.
Giglio, L., van der Werf, G. R., Randerson, J. T., Collatz, G. J., and Kasibhatla, P.: Global estimation of burned area using MODIS active fire observations, Atmos. Chem. Phys., 6, 957–974, https://doi.org/10.5194/acp-6-957-2006, 2006.
Giglio, L., Randerson, J. T., and van der Werf, G. R.: Analysis of daily, monthly, and annual burned area using the fourth‐generation global fire emissions database (GFED4), J. Geophys. Res.-Biogeo., 118, 317–328, https://doi.org/10.1002/jgrg.20042, 2013.
Giglio, L., Schroeder, W., and Justice, C. O.: The collection 6 MODIS active fire detection algorithm and fire products, Remote Sens. Environ., 178, 31–41, https://doi.org/10.1016/j.rse.2016.02.054, 2016.
Giglio, L., Boschetti, L., Roy, D. P., Humber, M. L., and Justice, C. O.: The Collection 6 MODIS burned area mapping algorithm and product, Remote Sens. Environ., 217, 72–85, https://doi.org/10.1016/j.rse.2018.08.005, 2018.
Giglio, L., Schroeder, W., Hall, J. V., and Justice, C. O.: MODIS Collection 6 and Collection 6.1 Active Fire Product User's Guide, https://modis-land.gsfc.nasa.gov/pdf/MODIS_C6_C6.1_Fire_User_Guide_1.0.pdf (last access: 15 May 2025), 2021a.
Giglio, L., Justice, C., Boschetti, L., and Roy, D.: MODIS/Terra+Aqua Burned Area Monthly L3 Global 500m SIN Grid V061, NASA Land Processes Distributed Active Archive Center [data set], https://doi.org/10.5067/MODIS/MCD64A1.061, 2021b.
Gu, C., Wang, S., Zhu, J., Dai, W., Liu, J., Xue, R., Che, X., Lin, Y., Duan, Y., Wenig, M. O., and Zhou, B.: Underestimated ammonia vehicular emissions in metropolitan city revealed by on-road mobile measurement, Environ. Res. Lett., 18, 104040, https://doi.org/10.1088/1748-9326/acf94a, 2023.
Hantson, S., Padilla, M., Corti, D., and Chuvieco, E.: Strengths and weaknesses of MODIS hotspots to characterize global fire occurrence, Remote Sens. Environ., 131, 152–159, https://doi.org/10.1016/j.rse.2012.12.004, 2013.
Herrera, B., Bezanilla, A., Blumenstock, T., Dammers, E., Hase, F., Clarisse, L., Magaldi, A., Rivera, C., Stremme, W., Strong, K., Viatte, C., Van Damme, M., and Grutter, M.: Measurement report: Evolution and distribution of NH3 over Mexico City from ground-based and satellite infrared spectroscopic measurements, Atmos. Chem. Phys., 22, 14119–14132, https://doi.org/10.5194/acp-22-14119-2022, 2022.
Hersbach, H., Bell, B., Berrisford, P., Hirahara, S., Horányi, A., Muñoz‐Sabater, J., Nicolas, J., Peubey, C., Radu, R., Schepers, D., Simmons, A., Soci, C., Abdalla, S., Abellan, X., Balsamo, G., Bechtold, P., Biavati, G., Bidlot, J., Bonavita, M., De Chiara, G., Dahlgren, P., Dee, D., Diamantakis, M., Dragani, R., Flemming, J., Forbes, R., Fuentes, M., Geer, A., Haimberger, L., Healy, S., Hogan, R. J., Hólm, E., Janisková, M., Keeley, S., Laloyaux, P., Lopez, P., Lupu, C., Radnoti, G., de Rosnay, P., Rozum, I., Vamborg, F., Villaume, S., and Thépaut, J.: The ERA5 global reanalysis, Q. J. Roy. Meteor. Society, 146, 1999–2049, https://doi.org/10.1002/qj.3803, 2020.
Hervas, A.: Land, development and contract farming on the Guatemalan oil palm frontier, J. Peasant Stud., 46, 115–141, https://doi.org/10.1080/03066150.2017.1351435, 2019.
Holder, C. D.: Fog precipitation in the Sierra de las Minas Biosphere Reserve, Guatemala, Hydrol. Process., 17, 2001–2010, https://doi.org/10.1002/hyp.1224, 2003.
Holder, C. D.: The hydrological significance of cloud forests in the Sierra de las Minas Biosphere Reserve, Guatemala, Geoforum, 37, 82–93, https://doi.org/10.1016/j.geoforum.2004.06.008, 2006.
IGM: Mapa hipsométrico de la República de Guatemala, Instituto Geográfico Nacional, https://www.ign.es/web/catalogo-cartoteca/resources/html/031123.html (last access: 20 May 2025), 2002
INE: Encuesta Nacional Agropecuaria con enfoque en granos básicos y cultivos permanentes, año agrícola 2019–2020, Instituto Nacional de Estadística, Guatemala, https://www.ine.gob.gt/sistema/uploads/2021/01/22/20210122164213QDinUvuRa9GjopyXaTuNMXc3gd6Jq1Q1.pdf (last access: 12 June 2025), 2020.
Inness, A., Ades, M., Agustí-Panareda, A., Barré, J., Benedictow, A., Blechschmidt, A.-M., Dominguez, J. J., Engelen, R., Eskes, H., Flemming, J., Huijnen, V., Jones, L., Kipling, Z., Massart, S., Parrington, M., Peuch, V.-H., Razinger, M., Remy, S., Schulz, M., and Suttie, M.: The CAMS reanalysis of atmospheric composition, Atmos. Chem. Phys., 19, 3515–3556, https://doi.org/10.5194/acp-19-3515-2019, 2019.
INSIVUMEH: Variabilidad y Cambio Climático en Guatemala, Instituto Nacional de Sismología, Vulcanología, Meteorología e Hidrología, Guatemala, https://insivumeh.gob.gt/seccion-cambio-climatico/ (last access: 10 May 2025), 2018.
INSIVUMEH: Estado del Clima en Guatemala, Instituto Nacional de Sismología, Vulcanología, Meteorología e Hidrología, Guatemala, https://insivumeh.gob.gt/wp-content/uploads/2026/02/Estado_del_clima.pdf (last access: 25 October 2025), 2023.
Justice, C. O., Giglio, L., Roy, D., Boschetti, L., Csiszar, I., Davies, D., Korontzi, S., Schroeder, W., O'Neal, K., and Morisette, J.: MODIS-Derived Global Fire Products, in: Land Remote Sensing and Global Environmental Change. Remote Sensing and Digital Image Processing, vol. 11, edited by: Ramachandran, B., Justice, C., and Abrams, M., Springer, New York, 661–679, https://doi.org/10.1007/978-1-4419-6749-7_29, 2010.
Karra, K., Kontgis, C., Statman-Weil, Z., Mazzariello, J. C., Mathis, M., and Brumby, S. P.: Global land use/land cover with Sentinel 2 and deep learning, in: 2021 IEEE International Geoscience and Remote Sensing Symposium IGARSS, 4704–4707, https://doi.org/10.1109/IGARSS47720.2021.9553499, 2021.
Kucieńska, B., Raga, G. B., and Rodríguez, O.: Cloud-to-ground lightning over Mexico and adjacent oceanic regions: a preliminary climatology using the WWLLN dataset, Ann. Geophys., 28, 2047–2057, https://doi.org/10.5194/angeo-28-2047-2010, 2010.
Li, F., Zhang, X., and Kondragunta, S.: Biomass Burning in Africa: An Investigation of Fire Radiative Power Missed by MODIS Using the 375 m VIIRS Active Fire Product, Remote Sens. (Basel)., 12, 1561, https://doi.org/10.3390/rs12101561, 2020.
Li, J., Hendricks, J., Righi, M., and Beer, C. G.: An aerosol classification scheme for global simulations using the k-means machine learning method, Geosci. Model Dev., 15, 509–533, https://doi.org/10.5194/gmd-15-509-2022, 2022.
Liu, Y., Qian, Y., Rasch, P. J., Zhang, K., Leung, L.-R., Wang, Y., Wang, M., Wang, H., Huang, X., and Yang, X.-Q.: Fire–precipitation interactions amplify the quasi-biennial variability in fires over southern Mexico and Central America, Atmos. Chem. Phys., 24, 3115–3128, https://doi.org/10.5194/acp-24-3115-2024, 2024a.
Liu, Y., Chen, J., Shi, Y., Zheng, W., Shan, T., and Wang, G.: Global Emissions Inventory from Open Biomass Burning (GEIOBB): utilizing Fengyun-3D global fire spot monitoring data, Earth Syst. Sci. Data, 16, 3495–3515, https://doi.org/10.5194/essd-16-3495-2024, 2024b.
Lopez-Ridaura, S., Barba-Escoto, L., Reyna, C., Hellin, J., Gerard, B., and van Wijk, M.: Food security and agriculture in the Western Highlands of Guatemala, Food Secur., 11, 817–833, https://doi.org/10.1007/s12571-019-00940-z, 2019.
Lovarelli, D., Fugazza, D., Costantini, M., Conti, C., Diolaiuti, G., and Guarino, M.: Comparison of ammonia air concentration before and during the spread of COVID-19 in Lombardy (Italy) using ground-based and satellite data, Atmos. Environ., 259, 118534, https://doi.org/10.1016/j.atmosenv.2021.118534, 2021.
Luo, Z., Zhang, Y., Chen, W., Van Damme, M., Coheur, P.-F., and Clarisse, L.: Estimating global ammonia (NH3) emissions based on IASI observations from 2008 to 2018, Atmos. Chem. Phys., 22, 10375–10388, https://doi.org/10.5194/acp-22-10375-2022, 2022.
Mahata, K., Das, R., Das, S., and Sarkar, A.: Land Use Land Cover map segmentation using Remote Sensing: A Case study of Ajoy river watershed, India, Journal of Intelligent Systems, 30, 273–286, https://doi.org/10.1515/jisys-2019-0155, 2020.
McDuffie, E. E., Smith, S. J., O'Rourke, P., Tibrewal, K., Venkataraman, C., Marais, E. A., Zheng, B., Crippa, M., Brauer, M., and Martin, R. V.: A global anthropogenic emission inventory of atmospheric pollutants from sector- and fuel-specific sources (1970–2017): an application of the Community Emissions Data System (CEDS), Earth Syst. Sci. Data, 12, 3413–3442, https://doi.org/10.5194/essd-12-3413-2020, 2020.
Monzón-Alvarado, C., Cortina-Villar, S., Schmook, B., Flamenco-Sandoval, A., Christman, Z., and Arriola, L.: Land-use decision-making after large-scale forest fires: Analyzing fires as a driver of deforestation in Laguna del Tigre National Park, Guatemala, Appl. Geogr., 35, 43–52, https://doi.org/10.1016/j.apgeog.2012.04.008, 2012.
Orrego León, E. O., Hernández Quevedo, M. P., and Gómez Jordán, R. C.: Variabilidad del inicio, final y duración de la época lluviosa en Guatemala y su tendencia, Revista Mesoamericana de Biodiversidad y Cambio Climático–Yu'am, 5, 4–24, 2021.
Pedregosa, F., Varoquaux, G., Gramfort, A., Michel, V., Thirion, B., Grisel, O., and Duchesnay, É.: Scikit-learn: Machine learning in Python, J. Mach. Learn. Res., 12, 2825–2830, 2011.
Pham, D. T., Dimov, S. S., and Nguyen, C. D.: Selection of K in k-means clustering, Proc. Inst. Mech. Eng. C J. Mech. Eng. Sci., 219, 103–119, https://doi.org/10.1243/095440605X8298, 2005.
Pohl, V., Gilmer, A., Hellebust, S., McGovern, E., Cassidy, J., Byers, V., McGillicuddy, E. J., Neeson, F., and O'Connor, D. J.: Ammonia Cycling and Emerging Secondary Aerosols from Arable Agriculture: A European and Irish Perspective, Air, 1, 37–54, https://doi.org/10.3390/air1010003, 2022.
Remy, S. and Kaiser, J. W.: Daily global fire radiative power fields estimation from one or two MODIS instruments, Atmos. Chem. Phys., 14, 13377–13390, https://doi.org/10.5194/acp-14-13377-2014, 2014.
Ríos, B. and Raga, G. B.: Spatio-temporal distribution of burned areas by ecoregions in Mexico and Central America, Int. J. Remote Sens., 39, 949–970, https://doi.org/10.1080/01431161.2017.1392641, 2018.
Soci, C., Hersbach, H., Simmons, A., Poli, P., Bell, B., Berrisford, P., Horányi, A., Muñoz‐Sabater, J., Nicolas, J., Radu, R., Schepers, D., Villaume, S., Haimberger, L., Woollen, J., Buontempo, C., and Thépaut, J.: The ERA5 global reanalysis from 1940 to 2022, Q. J. Roy. Meteor. Soc., 150, 4014–4048, https://doi.org/10.1002/qj.4803, 2024.
Spencer, N. H.: Squared Euclidean Distances, in: Essentials of Multivariate Data Analysis, 95, CRC Press, ISBN 9781466584785, 2013.
Sutton, M. A., Nemitz, E., Erisman, J. W., Beier, C., Bahl, K. B., Cellier, P., de Vries, W., Cotrufo, F., Skiba, U., Di Marco, C., Jones, S., Laville, P., Soussana, J. F., Loubet, B., Twigg, M., Famulari, D., Whitehead, J., Gallagher, M. W., Neftel, A., Flechard, C. R., Herrmann, B., Calanca, P. L., Schjoerring, J. K., Daemmgen, U., Horvath, L., Tang, Y. S., Emmett, B. A., Tietema, A., Peñuelas, J., Kesik, M., Brueggemann, N., Pilegaard, K., Vesala, T., Campbell, C. L., Olesen, J. E., Dragosits, U., Theobald, M. R., Levy, P., Mobbs, D. C., Milne, R., Viovy, N., Vuichard, N., Smith, J. U., Smith, P., Bergamaschi, P., Fowler, D., and Reis, S.: Challenges in quantifying biosphere–atmosphere exchange of nitrogen species, Environ. Pollut., 150, 125–139, https://doi.org/10.1016/j.envpol.2007.04.014, 2007.
Sutton, M. A., Reis, S., Riddick, S. N., Dragosits, U., Nemitz, E., Theobald, M. R., Tang, Y. S., Braban, C. F., Vieno, M., Dore, A. J., Mitchell, R. F., Wanless, S., Daunt, F., Fowler, D., Blackall, T. D., Milford, C., Flechard, C. R., Loubet, B., Massad, R., Cellier, P., Personne, E., Coheur, P. F., Clarisse, L., Van Damme, M., Ngadi, Y., Clerbaux, C., Skjøth, C. A., Geels, C., Hertel, O., Wichink Kruit, R. J., Pinder, R. W., Bash, J. O., Walker, J. T., Simpson, D., Horváth, L., Misselbrook, T. H., Bleeker, A., Dentener, F., and de Vries, W.: Towards a climate-dependent paradigm of ammonia emission and deposition, Philos. T. R. Soc. B, 368, 20130166, https://doi.org/10.1098/rstb.2013.0166, 2013.
Umargono, E., Suseno, J. E., and Vincensius Gunawan, S. K.: K-Means Clustering Optimization using the Elbow Method and Early Centroid Determination Based-on Mean and Median, in: Proceedings of the International Conferences on Information System and Technology, 234–240, https://doi.org/10.5220/0009908402340240, 2019.
Vermote, E., Ellicott, E., Dubovik, O., Lapyonok, T., Chin, M., Giglio, L., and Roberts, G. J.: An approach to estimate global biomass burning emissions of organic and black carbon from MODIS fire radiative power, J. Geophys. Res.-Atmos., 114, https://doi.org/10.1029/2008JD011188, 2009.
Viatte, C., Petit, J.-E., Yamanouchi, S., Van Damme, M., Doucerain, C., Germain-Piaulenne, E., Gros, V., Favez, O., Clarisse, L., Coheur, P.-F., Strong, K., and Clerbaux, C.: Ammonia and PM2.5 Air Pollution in Paris during the 2020 COVID Lockdown, Atmosphere (Basel), 12, 160, https://doi.org/10.3390/atmos12020160, 2021.
Van Damme, M., Clarisse, L., Heald, C. L., Hurtmans, D., Ngadi, Y., Clerbaux, C., Dolman, A. J., Erisman, J. W., and Coheur, P. F.: Global distributions, time series and error characterization of atmospheric ammonia (NH3) from IASI satellite observations, Atmos. Chem. Phys., 14, 2905–2922, https://doi.org/10.5194/acp-14-2905-2014, 2014.
Van Damme, M., Whitburn, S., Clarisse, L., Clerbaux, C., Hurtmans, D., and Coheur, P.-F.: Version 2 of the IASI NH3 neural network retrieval algorithm: near-real-time and reanalysed datasets, Atmos. Meas. Tech., 10, 4905–4914, https://doi.org/10.5194/amt-10-4905-2017, 2017.
Van Damme, M., Clarisse, L., Whitburn, S., Hadji-Lazaro, J., Hurtmans, D., Clerbaux, C., and Coheur, P.-F.: Industrial and agricultural ammonia point sources exposed, Nature, 564, 99–103, https://doi.org/10.1038/s41586-018-0747-1, 2018.
Van Damme, M., Clarisse, L., Franco, B., Sutton, M. A., Erisman, J. W., Wichink Kruit, R., van Zanten, M., Whitburn, S., Hadji-Lazaro, J., Hurtmans, D., Clerbaux, C., and Coheur, P.-F.: Global, regional and national trends of atmospheric ammonia derived from a decadal (2008–2018) satellite record, Environ. Res. Lett., 16, 055017, https://doi.org/10.1088/1748-9326/abd5e0, 2021.
van der Werf, G. R., Randerson, J. T., Giglio, L., Collatz, G. J., Mu, M., Kasibhatla, P. S., Morton, D. C., DeFries, R. S., Jin, Y., and van Leeuwen, T. T.: Global fire emissions and the contribution of deforestation, savanna, forest, agricultural, and peat fires (1997–2009), Atmos. Chem. Phys., 10, 11707–11735, https://doi.org/10.5194/acp-10-11707-2010, 2010.
van der Werf, G. R., Randerson, J. T., Giglio, L., van Leeuwen, T. T., Chen, Y., Rogers, B. M., Mu, M., van Marle, M. J. E., Morton, D. C., Collatz, G. J., Yokelson, R. J., and Kasibhatla, P. S.: Global fire emissions estimates during 1997–2016, Earth Syst. Sci. Data, 9, 697–720, https://doi.org/10.5194/essd-9-697-2017, 2017.
Whitburn, S., Van Damme, M., Clarisse, L., Turquety, S., Clerbaux, C., and Coheur, P.-F.: Doubling of annual ammonia emissions from the peat fires in Indonesia during the 2015 El Niño, Geophys. Res. Lett., 43, 11007–11014, https://doi.org/10.1002/2016GL070620, 2016.
Whitburn, S., Van Damme, M., Clarisse, L., Hurtmans, D., Clerbaux, C., and Coheur, P.-F.: IASI-derived NH3 enhancement ratios relative to CO for the tropical biomass burning regions, Atmos. Chem. Phys., 17, 12239–12252, https://doi.org/10.5194/acp-17-12239-2017, 2017.
Wooster, M., Zhukov, B., and Oertel, D.: Fire radiative energy for quantitative study of biomass burning: derivation from the BIRD experimental satellite and comparison to MODIS fire products, Remote Sens. Environ., 86, 83–107, https://doi.org/10.1016/S0034-4257(03)00070-1, 2003.
Wyer, K. E., Kelleghan, D. B., Blanes-Vidal, V., Schauberger, G., and Curran, T. P.: Ammonia emissions from agriculture and their contribution to fine particulate matter: A review of implications for human health, J. Environ. Manage., 323, 116285, https://doi.org/10.1016/j.jenvman.2022.116285, 2022.
Xu, W., Zhao, Y., Wen, Z., Chang, Y., Pan, Y., Sun, Y., Ma, X., Sha, Z., Li, Z., Kang, J., Liu, L., Tang, A., Wang, K., Zhang, Y., Guo, Y., Zhang, L., Sheng, L., Zhang, X., Gu, B., Song, Y., Van Damme, M., Clarisse, L., Coheur, P.-F., Collett, J. L., Goulding, K., Zhang, F., He, K., and Liu, X.: Increasing importance of ammonia emission abatement in PM2.5 pollution control, Sci. Bull. (Beijing), 67, 1745–1749, https://doi.org/10.1016/j.scib.2022.07.021, 2022.
Zhou, C., Zhou, H., Holsen, T. M., Hopke, P. K., Edgerton, E. S., and Schwab, J. J.: Ambient Ammonia Concentrations Across New York State, J. Geophys. Res.-Atmos., 124, 8287–8302, https://doi.org/10.1029/2019JD030380, 2019.
Zhou, Y., Zhao, Y., Mao, P., Zhang, Q., Zhang, J., Qiu, L., and Yang, Y.: Development of a high-resolution emission inventory and its evaluation and application through air quality modeling for Jiangsu Province, China, Atmos. Chem. Phys., 17, 211–233, https://doi.org/10.5194/acp-17-211-2017, 2017.
Zhu, L., Henze, D. K., Bash, J. O., Cady-Pereira, K. E., Shephard, M. W., Luo, M., and Capps, S. L.: Sources and Impacts of Atmospheric NH3: Current Understanding and Frontiers for Modeling, Measurements, and Remote Sensing in North America, Curr. Pollut. Rep., 1, 95–116, https://doi.org/10.1007/s40726-015-0010-4, 2015.