
the Creative Commons Attribution 4.0 License.
the Creative Commons Attribution 4.0 License.
 | 24 Aug 2026
Radiocarbon in atmospheric CH4 and CO2 at Jungfraujoch in 2019–2024: influence of regional nuclear emissions and current global atmospheric 14CH4 signal
Dylan Geissbühler
Stephan Henne
Ryo Fujita
Heather Graven
Christophe Espic
Matthias Bantle
Negar Haghipour
Franz Conen
Dominik Brunner
Martin Steinbacher
Giulia Zazzeri
Samuel Hammer
Markus Leuenberger
Radiocarbon (14C) is a valuable tracer to determine the relative fossil fractions of emitted carbonaceous greenhouse gases, such as CO2 and CH4. While atmospheric Δ14CO2 measurements have been conducted at multiple sites for several decades, Δ14CH4 measurements remain more limited, mainly due to measurement challenges. In addition, 14CH4 emissions from nuclear power plants (NPPs) can complicate data interpretation. In this study, fortnightly Δ14CH4 and Δ14CO2 measurements at the Swiss High-Altitude Research Station Jungfraujoch (JFJ, about 3500 m a.s.l.) between 2019 and 2024 are presented. Over this period, Δ14CH4 values showed an increase from 350 ± 19 ‰ to 381 ± 13 ‰, while Δ14CO2 values decreased from −2.0 ± 3.8 ‰ to −12.7 ± 2.0 ‰, respectively. The former is related to the slight increase of 14CH4 emissions from the nuclear industry over the last years, while the latter is linked to the continued dilution of the 14CO2 signal due to the release of 14C-devoid CO2 from combustion of fossil fuels. Despite its high elevation, JFJ is still influenced by NPPs operating in Europe. To assess the nuclear 14C contribution to our individual measurements, we use a combination of in situ 222Radon measurements and Lagrangian particle dispersion model convolved with bottom-up inventory of 14C emissions from NPPs. Furthermore, our Δ14CH4 measurements reasonably agree with simulated atmospheric values of Δ14CH4 estimated by a global atmospheric one-box model and an estimation of global nuclear 14CH4 emissions.
- Article
(2902 KB) - Full-text XML
-
Supplement
(1367 KB) - BibTeX
- EndNote


Carbon dioxide (CO2) and methane (CH4) are the two main anthropogenic greenhouse gases (GHGs) responsible for global climate change (IPCC, 2023; WMO, 2025). Since the Industrial Revolution around 1850, their global atmospheric concentrations have been multiplied by about 1.5 and 2.7, respectively, from around 285 to 422.8 ppm in 2024 for CO2 (Etheridge et al., 1996; Lan et al., 2025b) and from around 800 to 1930 ppb in 2024 for CH4 (Lan et al., 2025a; MacFarling Meure et al., 2006). Anthropogenic emissions of CO2 and CH4 (mainly from the energy sector for fossil CO2 and CH4, and agriculture and waste management for biogenic CH4) are responsible for this rise in concentrations and resulting climate change. In the period 2010–2019, CO2 and CH4 were responsible for a global warming of around 0.8 and 0.5 °C, respectively, relative to the period 1850–1900 (IPCC, 2023). To implement effective mitigation measures, the main emission sources of both GHGs have to be better quantified and monitored.
Radiocarbon (14C), a radioactive isotope of carbon with a half-life of 5700 ± 30 years (Kutschera, 2013; Roberts and Southon, 2007), is a valuable tracer to distinguish fossil from modern carbon sources. Naturally produced in the upper atmosphere through the interaction of thermal neutrons with nitrogen, 14C is finally oxidized to 14CO2, which can be integrated into the biosphere via photosynthesis and into the hydrosphere via gas exchange at the water-atmosphere interface (Graven et al., 2020). On the one hand, fossil fuels (e.g. coal, oil, natural gas) that were formed millions of years ago are now devoid of 14C because of its short half-life compared to geological time scales. On the other hand, CO2 and CH4 derived from fresh organic matter contain 14C 12C ratios close to the current atmospheric 14CO2 signature. Atmospheric 14CO2 and 14CH4 measurements are thus valuable proxies to study the different sources of CO2 and CH4 released to the atmosphere.
Atmospheric 14CO2 measurements have a long history. Since the first measurements focused on the documentation of the atmospheric 14CO2 bomb peak in the 1950s–1960s associated with nuclear bomb tests (Levin et al., 1985; Manning et al., 1990; Nydal and Lövseth, 1983; Rafter and Fergusson, 1957), there are now international monitoring programs following the long-term evolution of atmospheric 14CO2 at background sites (e.g., Hammer et al., 2017; Turnbull et al., 2007). Observations at the High-Altitude Research Station Jungfraujoch (JFJ) in Switzerland have been conducted since 1986; there, two-weeks integrated CO2 samples have been collected and further purified and analyzed at the Heidelberg laboratory (Germany) (Levin et al., 2013, 2023). On a more local scale, atmospheric 14CO2 measurements have been used to study CO2 emissions from urban areas to entire countries (Basu et al., 2020; Graven et al., 2018; Levin et al., 2003). Since the bomb peak in the middle of the last century, Δ14CO2 values have been declining by the dilution of the enriched atmospheric 14C signal in both land and ocean carbon sinks and by the emissions of 14C-free fossil fuel CO2, which depletes the atmospheric Δ14CO2 signal (Graven et al., 2024; Oeschger et al., 1975).
Atmospheric measurements of 14CH4 have been more limited than 14CO2 so far. One reason for this is related to the about 200-times lower atmospheric CH4 concentration compared to CO2: while 2–5 L of air are sufficient to analyze 14CO2 (e.g. yielding about 1 mgC from 5 L air at 420 ppm CO2), several tens of liters are required for 14CH4 analysis (e.g. yielding about 50 µgC from 50 L air at 2 ppm CH4). The sampling and analysis of 14CH4 is therefore difficult, and prone to CO2 contamination. Besides this technical consideration, the interpretation of atmospheric 14CH4 measurements may be complicated at study sites that are influenced by nuclear power plants (NPPs) (Eisma et al., 1994, 1995; Levin et al., 1992). Pressurized water reactors (PWRs), which are currently the most widely operated plants (IAEA PRIS, 2025), emit 14C mainly as 14CH4, whereas other reactor types emit 14C mainly as 14CO2 (Vance et al., 1995; Zazzeri et al., 2018). The annual global nuclear 14C emission rate for 2016 has been estimated to about 105 TBq for 14CO2 and about 45 TBq for 14CH4 (Zazzeri et al., 2018). Although 14CO2 emissions are larger, the influence of nuclear 14CH4 emissions on atmospheric 14CH4 is stronger due to the much lower atmospheric CH4 concentration compared to CO2. This also explains why current atmospheric 14C 12C ratios are about 35 % higher for 14CH4 than 14CO2 (Emmenegger et al., 2025a; Gonzalez Moguel et al., 2022).
Despite these challenges, several analysis setups and atmospheric 14CH4 datasets have been reported from ice cores and atmospheric samples. Pioneering atmospheric 14CH4 measurements were reported by Lowe et al. (1988) and Wahlen et al. (1989). In the 1990s, Levin et al. (1992) reported the first sporadic 14CH4 measurements between 1988 and 1991 at JFJ. Eisma et al. (1994, 1995) measured atmospheric 14CH4 values from a tall tower in the Netherlands and highlighted the challenge to interpret 14CH4 measurements, even when using an atmospheric transport model to evaluate the nuclear influence on the measurements. Lassey et al. (2007a, b) compiled more than 200 individual atmospheric 14CH4 measurements from the Northern and Southern Hemispheres between 1986 and 2000 and deduced that about 30 % of the global CH4 source for this period had a fossil origin. Hmiel et al. (2020) used 14CH4 measurements from ice cores to better constrain natural geological (i.e., fossil) CH4 emissions during the preindustrial era. By synthetizing atmospheric CH4 concentration and its major isotopologues (13CH4, CH3D and 14CH4) for 1750–2015, Fujita et al. (2025) estimated 30 % lower global CH4 emissions from the fossil-fuel industry compared to previous isotope-based studies relying mostly on CH4 and 13CH4 without 14C consideration. Another output of their work was an updated inventory of the nuclear 14CH4 emissions between 1960 and 2015 based on nuclear electricity production data.
In recent years, several novel analysis systems and studies for 14CH4 have been reported (Espic et al., 2019; Gonzalez Moguel et al., 2022; Zazzeri et al., 2021, 2023) increasing the analysis capabilities, even in a more field-compatible way (Zazzeri et al., 2025). Despite these new studies, recent background atmospheric 14CH4 values are still missing. At the Laboratory for the Analysis of Radiocarbon with AMS (LARA, University of Bern) (Szidat, 2020), a system exists since 2019 to analyze 14CH4 and 14CO2 from a single atmospheric sample (Espic et al., 2019) and was already used in several studies (Espic et al., 2025; Etiope et al., 2024; Zazzeri et al., 2025). Here, we present atmospheric 14CH4 and 14CO2 measurements conducted at the High-Altitude Research Station Jungfraujoch between 2019 and 2024, discuss their representativeness regarding the nuclear influence in Europe and show their relevance as worldwide background values.
2.1 Jungfraujoch Site and Sampling Strategy
The High-Altitude Research Station Jungfraujoch (stretching from 3455 to 3585 m a.s.l., 46°32′51′′ N, 7°59′7′′ E, JFJ), established in 1931, is located on a mountain ridge in the Swiss Alps. Among others, this station is part of the Global Atmosphere Watch (GAW) network as well as of the Network for the Detection of Atmospheric Composition Change (NDACC). Furthermore, JFJ is labelled as a Class 1 Station of the European-wide Integrated Carbon Observation System (ICOS) Research Infrastructure (Heiskanen et al., 2022) since May 2018 (Yver-Kwok et al., 2021). Because of its high elevation, JFJ is a well-recognized international background station (Leuenberger and Flückiger, 2008). However, it is also intermittently impacted by direct transport from the polluted planetary boundary layer, most frequently during daytime from April to September (Henne et al., 2010).
A fortnightly air sampling program measuring 14CH4 and 14CO2 at JFJ every two weeks started in January 2019. Until March 2023, two morning grab air samples were taken using a membrane pump (N022AN.18, KNF Neuberger AG, Germany) that directly pumped air from the Sphinx terrasse (3580 m a.s.l.) at JFJ into two PE-Al-PE 120 L bags (Tecobag, Tesseraux Spezialverpackungen GmbH, Germany) through a dedicated sampling line (Synflex Decabon 1300 Tubing, OD =6 mm). The sampled air was dried with a magnesium perchlorate dryer (Mg(ClO4)2, ACS reagent, ThermoFisher, USA) to avoid condensation and further reactions between water vapor and other sampled gas species. The sampling duration per bag was commonly between 20 and 55 min depending on the ambient pressure, temperature and the flow resistance during sampling due to the dryer and the long length and small diameter of the sampling line. The morning grab samplings were performed manually and as early as possible in the morning to avoid the influence of the daytime planetary boundary layer; in practice, it commonly occurred between 07:00 and 10:00 UTC (i.e., 08:00 and 12:00 local time, UTC+1/UTC+2), depending on the seasonal train schedule ensuring the public transport up to JFJ.
To increase the reproducibility of the air sampling procedure and its representativeness as a background measurement, an automated air sampling system was developed replacing the manual sampling from 18 April 2023 onwards (Fig. 1). Its development was guided by two principles: (1) air sampling should be restricted to nighttime when the station mostly resides within the free troposphere, allowing for the collection of temporally integrated samples over multiple days; and (2) air sampling should occur as far as possible passively, i.e., without any mechanical pumps in contact with the sampled air, thereby minimizing the risk of contamination from membrane outgassing. The novel Jungfraujoch Air Sampling System (JASS) consisted of a custom-made electropolished steel sampling tank (volum = 260 L, length (L) = 140 cm, outer diameter (OD) = 51 cm, Bechtiger Edelstahl AG, Switzerland) coupled to a sampling box containing a series of valves, all controlled by a home-made control unit including a Raspberry Pi 4B module (Raspberry Pi Ltd, United Kingdom) (Fig. 1). The whole system was installed under the roof of the research station at JFJ, at about 3462 m a.s.l. (Fig. S1 in the Supplement). Its design allows a routine integrated nighttime air sampling procedure lasting 6 h every night (between 00:00 and 06:00 UTC) over 14 d, so integrating 84 h in total. Compared to the initial fortnightly morning grab sampling strategy, integrated sampling gives a more representative air mixture for every two-week period of interest (Fig. S2).
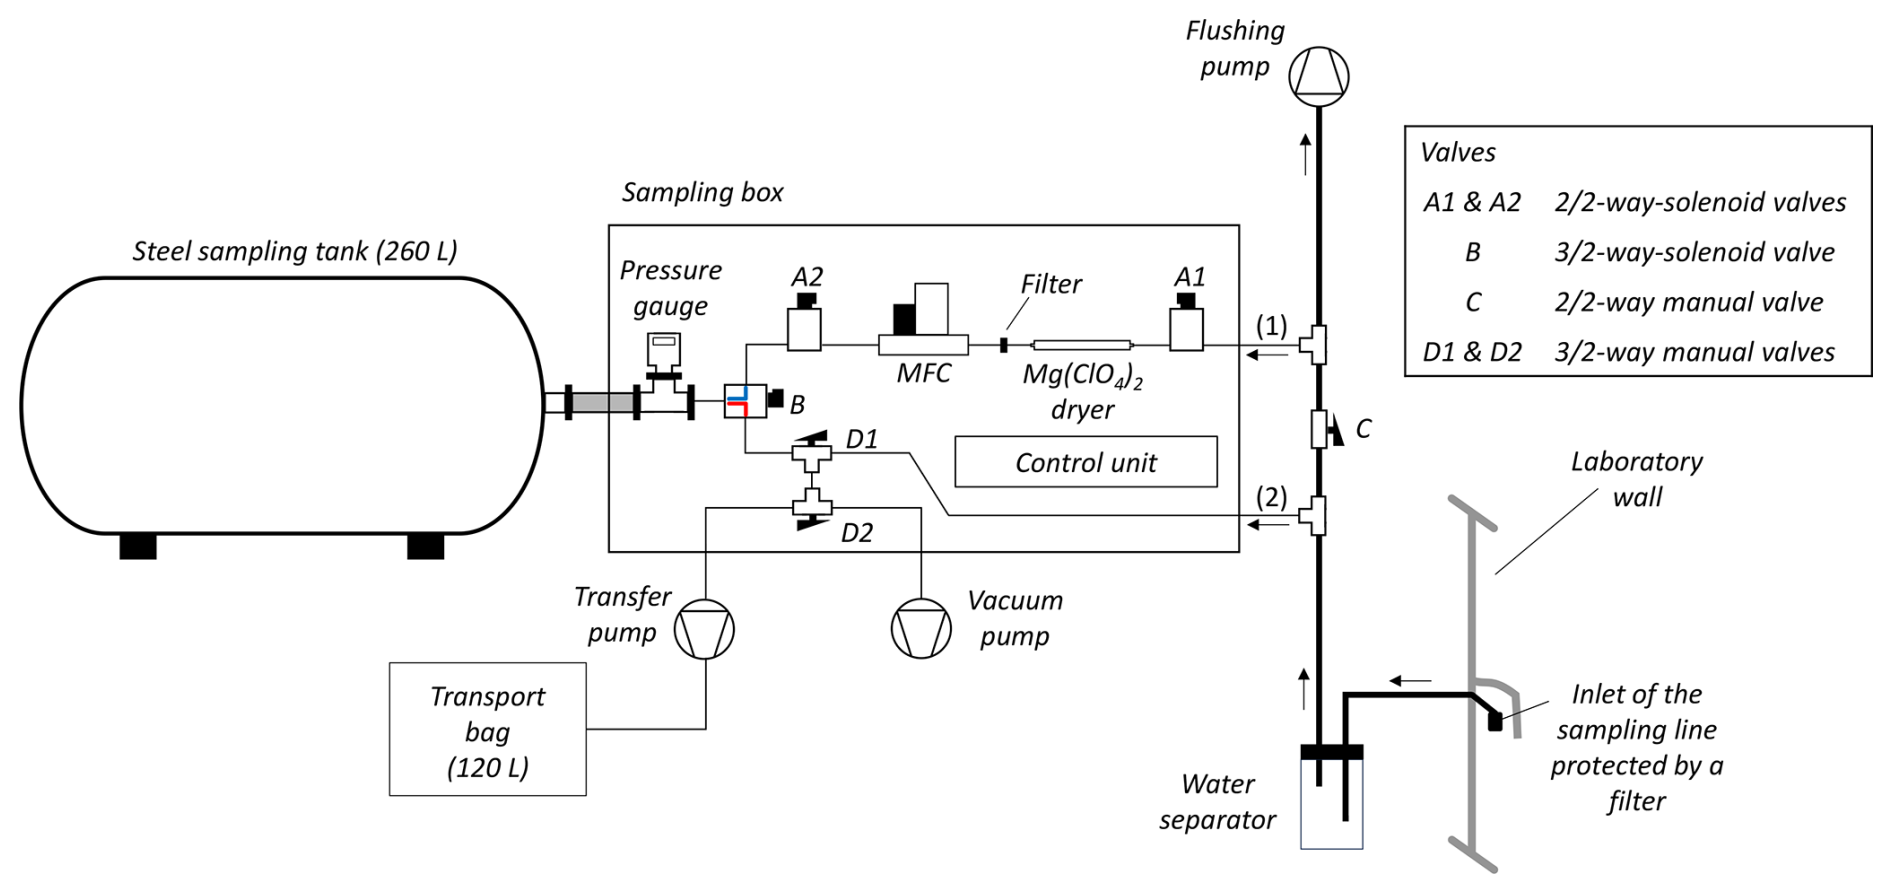
Figure 1Jungfraujoch Air Sampling System (JASS) used for integrated nighttime air sampling over 14 d since 18 April 2023.
The inlet of the sampling line (Synflex Decabon 1300 Tubing, OD = 12 mm, L∼10 m) was protected by a dust filter (Fig. 1). A flushing membrane pump (N022AN.18, KNF Neuberger AG, Germany) continuously conveyed outside air through this sampling line and a water separator to the sampling box. Through two T-pieces (SS-12M0-3, Swagelok, USA) integrated in this sampling line, part of the sampled air could be further directed into the sampling box, either automatically using line (1), or manually using line (2) (Fig. 1). At the beginning of a sampling period, the tank was evacuated using a vacuum pump (MV 2 NT, Vacuubrand GmbH + Co KG, Germany); the end pressure was ≤ 0.7 mbar. During automatic air sampling, the sampling line (1) was open and worked as follows: both 2/2-way solenoid valves A1 and A2 (0330-A-02, Bürkert, Germany) were open and the 3/2-way solenoid valve B (0330-F-02, Bürkert, Germany) was in the position connecting this line with the tank (blue connection, Fig. 1); the mass-flow controller (MFC, F-201DV, Bronkhorst, The Netherlands) between A1 and A2 ensured a controlled air flow into the system and the increasing pressure in the tank was monitored by a pressure gauge (RPT 200 AR, Pfeiffer Vacuum, Germany); in front of the MFC, a Mg(ClO4)2 dryer dried the sampled air and a 0.5 µm filter (SS-4FWS-05, Swagelok, USA) protected the MFC from particulate matter. After 6 h of sampling, both A1 and A2 valves were closed. This sampling procedure was repeated every night. After 14 nighttime samplings, the pressure in the tank reached 600–650 mbar. The mean ambient atmospheric pressure at JFJ was 656 mbar over the period 2019–2024 (Emmenegger et al., 2025d); we configured our passive sampling system in a way where the tank pressure was always lower than ambient pressure, otherwise the passive sampling based on the pressure difference between the tank and the ambient pressure would not work. On-site, the transfer of the sampled air from the tank into a new bag was prepared in this manner: a dedicated transfer pump (N922SPE, KNF Neuberger AG, Germany) was turned on and the manual 3/2-way valve D2 was turned to the left (Fig. 1); the position of the 3/2-way valve D1 stayed by default turned to the left. The Python script running on the Raspberry Pi was then restarted to turn on the vacuum pump and switch the 3/2-way solenoid valve B in the position connecting the tank with the pump line (red connection, Fig. 1). At this stage, the transfer pump was evacuating the tank and after ∼30 s of line flushing, a bag was connected to the line for the transfer of the sampled air. After about one hour, enough air was transferred to the bag for further 14C analyses. It was then closed and disconnected from the transfer pump (tank pressure at around 70–90 mbar). To accelerate the evacuation of the tank and condition it again for the next sampling, the valve D2 was then turned to the right, and the vacuum pump was evacuating the tank. The system was left like this for the rest of the day and, at 23:59 UTC, valve B switched automatically back to its sampling position (blue connection, Fig. 1) (final tank pressure ≤0.7 mbar), the vacuum pump turned off and the whole system was ready to start the next sampling period. The whole sampling system was validated to be leak-tight in our laboratory in Bern before being transferred to JFJ. The low pressure achieved in the tank before each new sampling every two weeks regularly validated the tightness of the sampling system.
2.2 Sample preparation and measurements of Δ14CH4 and Δ14CO2
For both morning grab and integrated nighttime sampling strategies, the air collected in bags was transferred to the LARA laboratory at the University of Bern (Szidat, 2020), where a dedicated extraction line for 14CH4 and 14CO2 analysis was available (see Espic et al., 2019 for details). The extraction was generally done within one week after sampling and most of the time the day after. The typical air volume for one analysis was 60 L. During a preconcentration step, this air was pumped successively through three traps filled either with fiber glass or activated charcoal and cooled down with liquid nitrogen; this allowed us to preserve the whole amount of CH4 contained in the initial 60 L of air by trapping or pumping away the main other gas species, especially nitrogen and oxygen. CO2 was quantitatively trapped in the first trap and could be collected separately (see below). After that, the gas sample volume was about 10 mL, small enough to be run through a gas chromatograph (GC, 7890B, Agilent, USA; ShinCarbon ST 80/100 packed column; thermal conductivity detector, He as carrier gas) to purify the sample. CH4 was isolated quantitatively from the remaining CO and CO2 present in trace quantities due to different elution times in the GC (CO: ∼ 2 min; CH4: ∼ 8 min; CO2: ∼ 13 min). Downstream of the GC, the extracted pure CH4 was converted into CO2 by combustion in a flow oven at 950 °C using copper oxide wires as a catalyst. The CH4-derived CO2 (∼ 60 to 70 µg of carbon, µgC) was transferred into glass ampoules (OD = 4 mm) and sealed for gas radiocarbon measurements. After the CH4 extraction procedure, the CO2 of the sample held in the first trap was recovered by cryogenic transfer into a ∼ 55 mL glass flask. The carbon mass of the recovered CO2 was typically greater than 1 mgC, which was transformed into graphite using an automated graphitization equipment (AGE) (Němec et al., 2010). Concerning the quality control of the 14CH4 extraction system, Espic et al. (2019) reported a cross-contamination of 0.4 ± 0.2 % (n=2) from the previous sample and an extraction yield of 101.2 ± 1.4 (n=13).
Radiocarbon analyses of the gaseous CH4-derived CO2 samples and the graphite CO2 samples were performed either at LARA or at the Laboratory of Ion Beam Physics, ETH Zürich, Switzerland, using the same type of AMS (MIni CArbon DAting System, MICADAS), equipped with a gas ion source (Ruff et al., 2007; Synal et al., 2007). Glass ampoules were cracked in a dedicated gas inlet system (Wacker et al., 2013) and the CH4-derived CO2 was diluted with He to ∼ 5 %, transferred into a syringe, and then fed into the ion source using a constant gas flow. Graphite samples were introduced directly to the MICADAS source. For both types of samples, raw 14C 12C as well as 13C 12C ratios were converted into F14C and δ13C values, respectively, by performing a blank subtraction as well as a standard normalization and correction for isotope fractionation (only for F14C) using 14C-free CO2 (Blank) (F14C =0) and CO2 produced from the primary NIST standard oxalic acid II (OX-II) (SRM 4990C) (F14C =1.34066, δ13C ), respectively. For the gas measurements, standards came from two gas bottles directly attached to the gas inlet system; both mixtures consisted of 5 % CO2 with the F14C value of interest and 95 % He. For the graphite measurements, both standards underwent the same sample preparation as the CO2 samples and were measured with them in the same magazine. Gas samples were commonly measured starting with 2–4 OX-II and 2 Blank standards, then with the samples in chronological sampling order and finishing with 2–4 OX-II and 2 Blank to account for potential drifts. The dataset presented here was built over 40 measurement days in 6 years. Per measurement day, about 24–32 standards and samples, including about 5–8 from JFJ, were measured; the remaining samples came from other sampling sites or further projects. The average standard deviation of all the OX-II standards used for normalization within a single measurement day was ± 0.007 (in F14C) whereas the average single OX-II precision derived from counting statistics was ± 0.010 (n=204). Graphite samples were generally measured in a 39-position magazine containing 3–4 OX-II and 3 Blank samples. The dataset presented here was built over 35 magazines. The average standard deviation of all the OX-II standards used for normalization within a single measurement day was ± 0.0018 (in F14C) whereas the average single OX-II precision derived from counting statistics was ±0.0025 (n=117). The final data evaluation was done using the BATS tool (Wacker et al., 2010). The typical measurement precision is 8 ‰ for 14CH4 and 1.5 ‰ for 14CO2 (see below). Throughout the current work, 14C results are reported using the notation Δ14C, and calculated with age correction as the parameter Δ in Stuiver and Polach (1977).
2.3 Ancillary measurements and datasets
At JFJ, in the framework of the ICOS measurement program, CO2 and CH4 concentrations are measured continuously using cavity ringdown spectroscopy; corresponding hourly average values were used in the present study (Emmenegger et al., 2025b, c). These values were used, among other purposes, to determine the stability of CH4 and CO2 concentrations in the transfer bags between sampling and extraction. CH4 and CO2 concentrations were measured in the remaining sampled air after extraction with a cavity ringdown spectrometer (Picarro G2401, Picarro Inc., USA) calibrated with three gas bottles with known CH4 and CO2 concentrations (1861.2, 1955.9, and 2206.7 ppb for CH4; 379.21, 418.38, and 458.62 ppm for CO2) (Carbagas, Switzerland). Mean differences between concentrations measured after extraction and measured in situ were 1.3 ± 2.8 ppb and 0.7 ± 1 ppm, for CH4 and CO2, respectively (n=13, between January and July 2024).
Furthermore, integrated samples have been collected at JFJ since 1986 to analyze atmospheric Δ14CO2, first started by the University of Heidelberg, now run as part of the ICOS Research Infrastructure (Emmenegger et al., 2025a; Hammer et al., 2017; Levin and Kromer, 2004). The dedicated setup draws ambient air throughout 14 d through a sodium hydroxide solution, in which CO2 is chemically absorbed. We chose the same 14 d schedule for our nighttime sampling as the ICOS schedule to enable a comparison between both datasets. ICOS Δ14CO2values are also reported as Δ values according to Stuiver and Polach (1977). Furthermore, atmospheric Δ14CO2 values from the Mace Head Atmospheric Research Station (MHD, Ireland) are used here for comparison (Hammer and Levin, 2023); due to its location exposed to westerly winds from the North Atlantic Ocean, MHD is often used as European background station.
We also made use of continuous 222Radon (in the following referred as Rn) measurements at JFJ with a two-filter dual loop alpha particle detector, operated by the University of Basel since 2009 (Griffiths et al., 2014) and which is meanwhile part of ICOS (Fig. S1). Rn is emitted from land surfaces into the atmosphere and because of its half-life of 3.8 d, it is a potential tracer of recent land contact. In this study, Rn was used as a proxy to distinguish free tropospheric samples from those originating from the planetary boundary layer (i.e., with recent land contact). To account for variations in ambient temperature and pressure, the raw hourly Rn concentrations (Conen, 2025) were converted into Rn values at STP conditions (i.e., T=0 °C, P=101 325 Pa).
To evaluate the accuracy and stability of our Δ14CH4 and Δ14CO2 measurements over time, regular measurements of a pressurized air bottle (PAB) (Carbagas, Switzerland) considered as an internal standard have been performed since March 2022 in parallel to the measurements of the JFJ samples; this air strictly underwent the same extraction and measurement procedures as the JFJ samples, commonly just before them. A first bottle was measured until end of July 2023 (CH4 = 1997 ± 2 ppb, and CO2 =434.5 ± 0.1 ppm), replaced by a second one in August 2023 (CH4 = 2178 ± 2 ppb, and CO2 = 455.8 ± 0.1 ppm). It should be noted that the Δ14CH4 and Δ14CO2 values of both bottles were a priori unknown and that we used them to evaluate the stability of the values derived from our measurement procedure.
2.4 Atmospheric modeling of nuclear 14C influence at JFJ
One goal of the present study was to evaluate the influence of nuclear 14CH4 and 14CO2 emissions on our atmospheric Δ14CH4 and Δ14CO2 measurements at JFJ. For this purpose, the amount and transport of 14CH4 and 14CO2 molecules from nuclear emissions were simulated using the Lagrangian particle dispersion model FLEXible PARTicle (FLEXPART) (Pisso et al., 2019) in the version adopted for inputs from the numerical weather prediction model COSMO (Henne et al., 2016). Here, we use the COSMO analysis product of the Swiss Federal Office of Meteorology and Climatology (MeteoSwiss), based on high spatial resolution (1 km × 1 km) model simulations and using a local ensemble transform Kalman filter (LETKF) meteorological data assimilation system (Schraff et al., 2016). Meteorological analysis fields from this product were available at 1 h temporal resolution for the Alpine domain (approximately 0–17° E, 42–50° N). The FLEXPART-COSMO model was used in previous atmospheric studies including the verification of the Swiss CH4 emission inventory (Henne et al., 2016), the influence of nuclear 14CO2 emissions on Δ14CO2 at a Swiss tall tower (Berhanu et al., 2017), the analysis of CO2 and δ13CO2 at JFJ (Pieber et al., 2022), and for inverse modeling of halocarbon emissions over Switzerland (Katharopoulos et al., 2023). Here, the model was operated in the same way as in Katharopoulos et al. (2023). In short, 50 000 model particles were released continuously from JFJ for every 3 h interval and traced backwards in time for 4 d or until they reached the domain boundaries. Afterwards, the integration of the particles' path was continued for up to 10 d in a European scale FLEXPART-IFS simulation driven by hourly inputs from the European Centre for Medium-Range Weather Forecasts (ECMWF) HRES operational forecast/analysis product available at 0.1°×0.1° resolution. The residence time of particles below a height of 50 m above model ground is then estimated in 3 h intervals and divided by air density provides so called source sensitivities (or concentration footprints).
Nuclear 14C emissions between 2019 and 2023 from the nuclear power plants (NPPs) located in the modeling area (Fig. S3) were mostly estimated using the compilation of nuclear 14C emissions of Laemmel et al. (2025). The atmospheric transport modeling was performed only for the period 2019–2023, as the input parameters for 2024 were not yet fully available. For most countries (i.e. Bulgaria, the Czech Republic, Romania, Slovakia, Slovenia, Spain, the Netherlands, and the United Kingdom) only annual total 14C emissions for the NPPs were available. For some countries, more detailed information could be used including quarterly 14C emissions from NPPs in France and Germany and monthly emissions for the Swiss NPPs Leibstadt and Gösgen, the Swedish NPPs Forsmark, Oskarshamn, and Ringhals, some NPPs in the United Kingdom and the French nuclear fuel reprocessing plant (NFRP) La Hague. Monthly inorganic and organic 14C emissions from the Hungarian NPP Paks were also available for 2019 in this dataset. In addition to these published values, monthly inorganic and organic 14C emissions for 2020–2023 were kindly made available by the operating company of the NPP Paks for this simulation. Reported emissions from the NPPs located in Belarus, Belgium, Russia, and Ukraine were not available; we estimated the annual 14C emissions for each of these plants by multiplying the annual electricity production (Laemmel and Szidat, 2025) by reactor-specific emission factors (EF) of 0.19, 0.41, and 1.3 TBq GWa−1 (GWa = gigawatt × 1 year) for PWR, VVER (water-cooled water-moderated energy reactor), and LWGR (light water graphite reactor), respectively. EF values for PWR and VVER were derived from the work of Fujita et al. (2025) and EF value for LWGR from the work of Zazzeri et al. (2018).
In a further step, 14CH4 and 14CO2 emissions per NPP were derived, as the reported values were mainly for total 14C. We used data for inorganic and organic 14C emissions that were reported in some countries (e.g., for NPPs in Germany, Hungary, Spain, Sweden, and Swizerland). For other countries we assumed that PWRs and VVERs emit 75 % of the total 14C amount in organic form (so 25 % in inorganic form) and that all the other reactors (e.g. boiling water reactor (BWR), LWGR, and pressurized heavy water reactor (PHWR)) emit 14C entirely in inorganic form, as also was assumed by Fujita et al. (2025). Furthermore, we assumed that the inorganic 14C form is entirely composed of 14CO2 and that 14CH4 represents 72.5 % of the organic 14C form; this last value was derived from the study of Kunz (1985) who analysed the composition of hydrocarbons of gaseous effluents at two PWRs in the USA. They reported values of 68 % and 77 % at the PWR Ginna and PWR Indian Point, respectively. Finally, the annual, quarterly or monthly emission amount of 14CO2 and 14CH4 available for each plant was equally divided into three-hour intervals to compute an emission rate per output step of the FLEXPART transport simulation. FLEXPART-derived source sensitivities, convolved with these emission rates yield 14C mole fractions at the sampling site and a final nuclear correction Δ14CNuc can be calculated assuming a mass balance model for C and 14C (Graven et al., 2019) (See detailed equations in the Supplement).
2.5 Background atmospheric Δ14CH4 modeling
Another goal of the present study was to evaluate the representativeness of our atmospheric Δ14CH4 measurements at JFJ on a global level. For this goal, we compared our data with calculated atmospheric Δ14CH4 values from a one-box model developed by Fujita et al. (2025). In this study, we extended their simulation until 2024 (Fig. S4) by updating their posterior CH4 emission scenarios since 2013 (i.e., average of posterior CEDS, EDGARv5, and EDGARv6 scenarios; see Fujita et al., 2025). The anthropogenic CH4 emissions for 2013–2022 were extended by using EDGARv8 (European Commission Joint Research Centre, 2023). To match the consistency with the posterior anthropogenic biogenic (BIO) and fossil fuel (FF) emissions in Fujita et al. (2025), the mean differences between EDGARv8 and Fujita et al. (2025) were calculated for 2008–2012 (BIO: 2.1 Tg yr−1, FF: 9.8 Tg yr−1) and then added to the values of EDGARv8 after 2013, respectively. For 2023–2024, the emissions of the Shared Socioeconomic Pathways (SSPs) were used. Here, we adopted SSP5-8.5 scenario in 2030 (Gidden et al., 2019) and linearly interpolated it between the EDGARv8 2022 emissions and the 2030 scenario emissions to the years 2023 and 2024. Natural biogenic CH4 emissions were optimized based on the CH4 mass balance equation to keep the consistency between our simulations and observed global mean CH4 mole fractions by NOAA/GML (Lan et al., 2025a). To evaluate the 14C signature of the biospheric CH4 sources, Δ14CO2 values for the time period 2013–2024 were derived from the SSP5-8.5 scenario (Graven et al., 2020). To extend the nuclear 14CH4 emissions beyond 2013, we considered the posterior annual nuclear 14CH4 emissions derived by Fujita et al. (2025). Assuming that only PWRs and VVERs are emitting 14CH4, a mean annual emission factor Φ (GBq GWa−1) was computed by dividing these emissions by the annual total electricity production by PWRs and VVERs derived from the data compilation by Laemmel and Szidat (2025). Considering the years 2008–2012, the mean Φ value was 250 GBq GWa−1, the min Φ value was 243 GBq GWa−1, and the max Φ value was 259 GBq GWa−1. Considering these three Φ values and the annual total electricity production by PWRs and VVERs in 2013–2024 (the value for 2024 was chosen equal to 2023 as the real value was not yet available), three projections of annual nuclear 14CH4 emissions were computed and used as variable input parameter in three different simulations of global atmospheric Δ14CH4 values (Fig. S4g). Posterior geologic emissions, biospheric turnover time, total CH4 lifetime, carbon and hydrogen kinetic isotope effects, and carbon and hydrogen CH4 isotopic signatures for respective sources in Fujita et al. (2025) were repeated by the values in 2012 over 2013–2024.
The simulated Δ14CH4 values were compared to our annual mean Δ14CH4 values at JFJ for 2019–2024 and previously reported measurements from samples (ice cores and/or firn air) of Greenland and Antarctica (Hmiel et al., 2020) and from atmospheric samples (Gonzalez Moguel et al., 2022; Lassey et al., 2007b; Levin et al., 1992; Quay et al., 1999; Sparrow et al., 2018; Townsend-Small et al., 2012; Wahlen et al., 1989). Note that the data in Hmiel et al. (2020) was used in Fujita et al. (2025) as observational constraints. Several other studies were found but not used here because of the large scatter in the reported data (Lowe et al., 1988; Manning et al., 1990) or difficulties in the unit conversion into current radiocarbon parameters (Ehhalt, 1974).
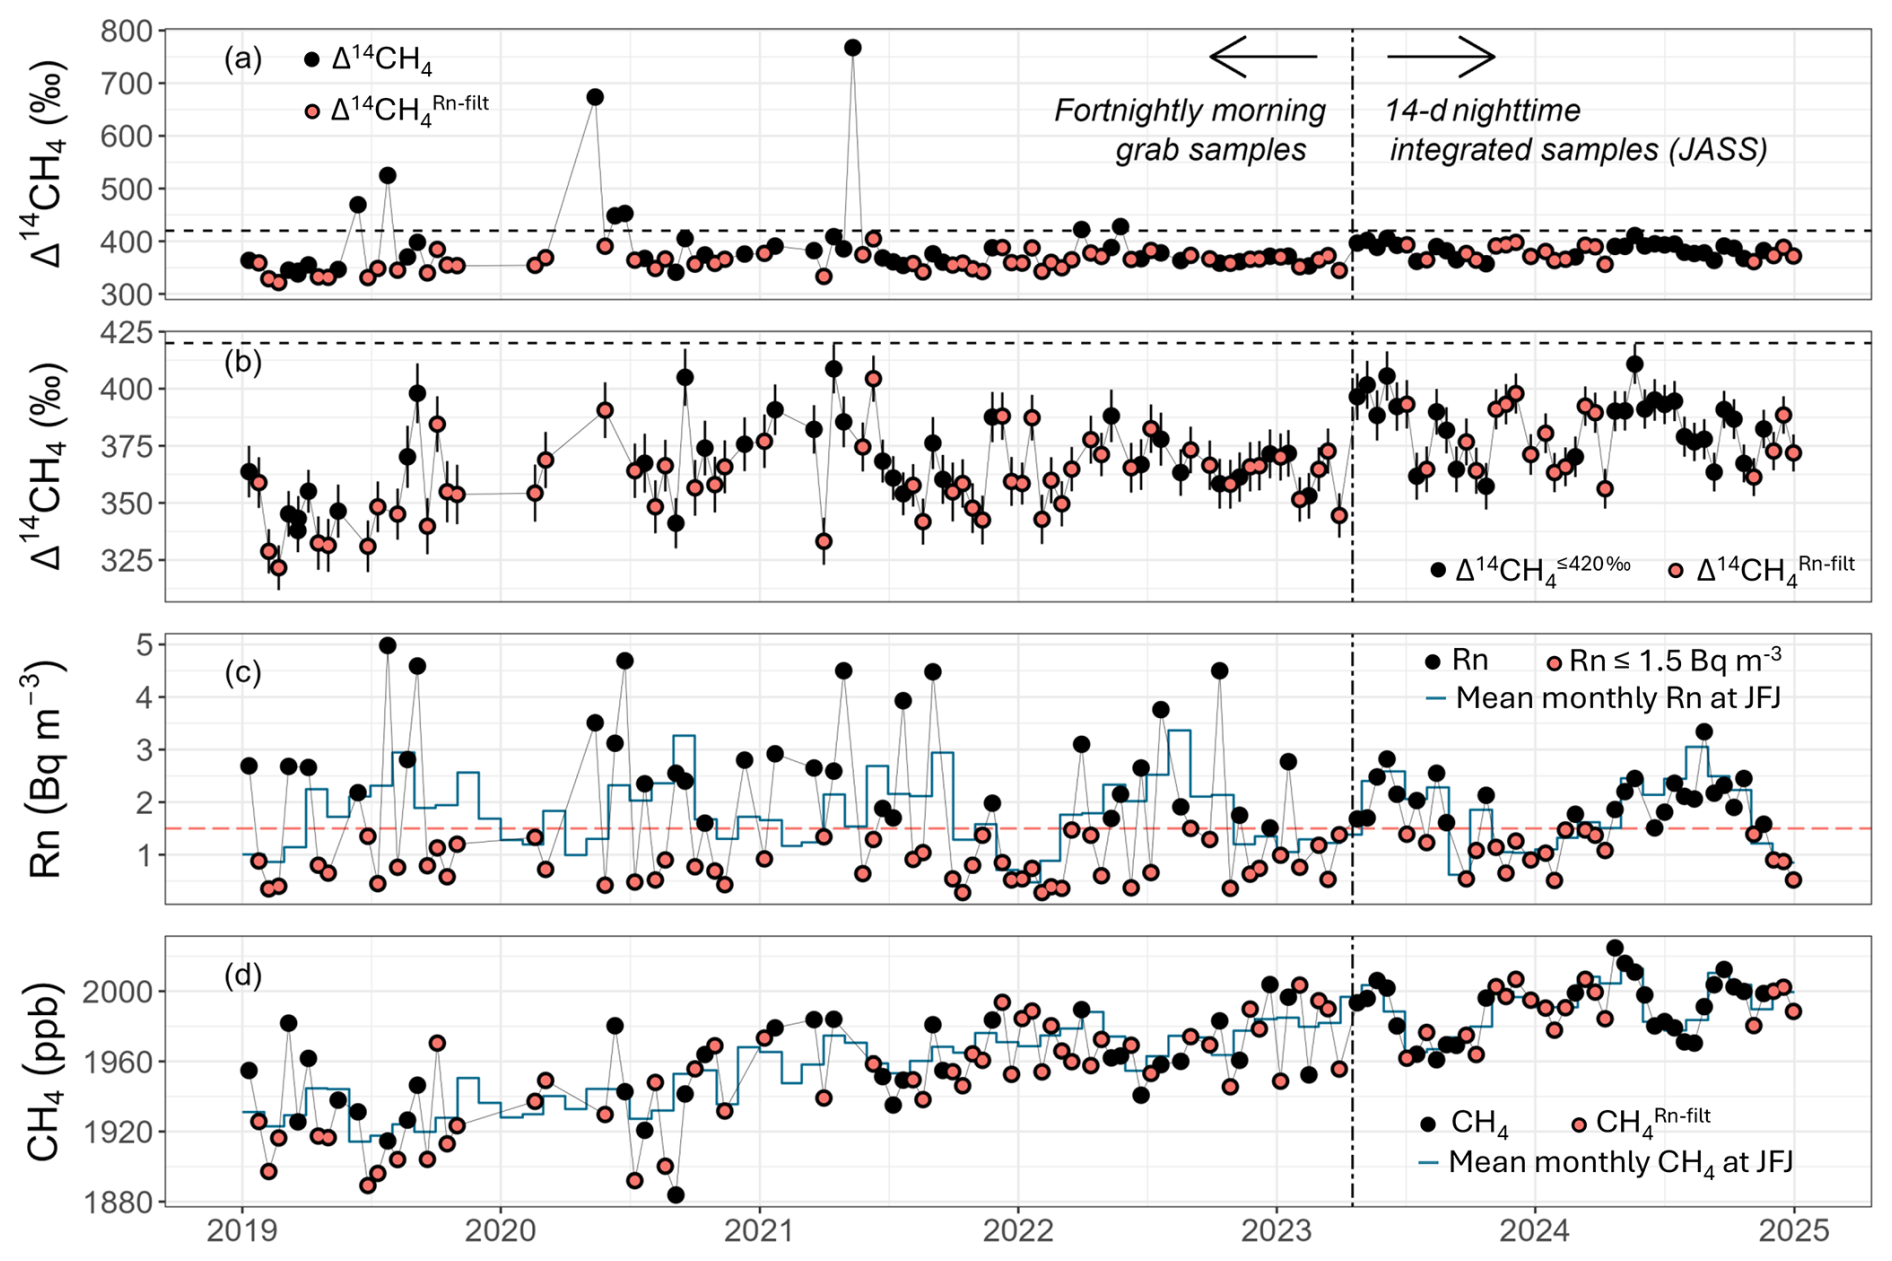
Figure 2(a) All Δ14CH4 values (black points) measured at JFJ since 2019; (b) same Δ14CH4 values excluding the points showing a clear nuclear influence (black points, Δ14CH). (c) Rn and (d) CH4 concentrations corresponding to the sampling periods of the Δ14CH4 measurements. In subplot (b), black error bars show the statistical uncertainty of the individual Δ14CH4 measurements. The vertical black dashed line in all the four subplots on 18 April 2023 represents the beginning of air sampling using the new JASS system. The horizontal dashed line in (a) and (b) is shown for Δ14CH4 =420 ‰, i.e., the chosen threshold for a clear influence of nuclear contamination. The horizontal red dotted line in (c) is shown at 1.5 Bq m−3 Rn, the chosen threshold between free-troposphere conditions and conditions influenced by the planetary boundary layer at JFJ. Red points in all the subplots represent Δ14CH4, Rn, and CH4 values where corresponding Rn values are lower than 1.5 Bq m−3. Blue lines in (c) and (d) correspond to the monthly means measured in situ.
3.1 Δ14CH4 measurements at Jungfraujoch
Δ14CH4 values at JFJ between 2019 and 2024 were between 322 ‰ and 767 ‰ and showed a slightly increasing trend over the last six years (Fig. 2a, b). Some exceptionally high Δ14CH4 values were measured (i.e., on 13 June and 25 July 2019; 13 May, 10 June and 24 June 2020; 12 May 2021) and were attributed to local and strong nuclear 14CH4 releases. Rn values were lower than 5 Bq m−3 over 2019–2024 with generally lower values during winter months compared to summer months (Fig. 2c), which is consistent with a potentially stronger influence of the planetary boundary layer in summer. Annual mean CH4 concentrations increased from 1930 ppb in 2019 to 1996 ppb in 2024 (Fig. 2d). Rn and CH4 concentration data shown here represent the corresponding average values during the sampling intervals.
Reduced scatter in Δ14CH4 values since the installation of the JASS in April 2023 is visible (Fig. 2a, b). Also, hourly Rn and CH4 concentrations averaged over the JASS sampling periods show less amplitude variation after this date. For both parameters, corresponding values are closer to the monthly means measured in situ by the ICOS instruments (blue curves in Fig. 2c, d). The temporal stability of our Δ14CH4 measurements from March 2022 onwards is evaluated using the regular Δ14CH4 measurements of our two internal standard PAB bottles. The standard deviation of the Δ14CH4 value for all 40 CH4 measurements over 15 months for each PAB bottle (so about 80 CH4 measurements in total) is 8 ‰ (Fig. S5a, b), which is lower than the instrumental uncertainty of a single Δ14CH4 measurement (12 ‰) indicating the satisfactory long-term reproducibility of our Δ14CH4 measurements.
For 2019–2024, mean annual atmospheric Δ14CH4 values can be deduced from our fortnightly air sampling program in different ways (Table 1). Firstly, all Δ14CH4 measurements clearly influenced by nuclear contamination were excluded. Choosing a threshold of 420 ‰ (Δ14CH, Figs. 2b and 3) 129 of the 137 measurements initially available are retained (94 %). Over the six years, a slightly increasing Δ14CH tendency rising from 350 ± 19 ‰ in 2019 to 381 ± 13 ‰ in 2024 (i.e., by a rate of ‰ yr−1) is observed (Table 1, Fig. 3).
Secondly, only Δ14CH4 measurements whose corresponding Rn values are lower than 1.5 Bq m−3 STP (Δ14CH) were retained; analyzing the probability density function of more than five years of Rn values at JFJ (November 2015 to December 2020), Conen and Zimmermann (2020) found that air masses with corresponding Rn values below 1.5 Bq m−3 STP belong mostly to the free troposphere (with 77 % confidence). Compared to the first set of mean annual values (n = 129), mean annual Δ14CH4 values are 1 ‰–7 ‰ lower and the total number of points used for these mean values is almost halved (n = 71) (Table 1, Fig. 3). During the period of integrated sampling the observations removed with the Rn threshold are mainly from the summer.
The third processing step additionally corrects for the influence of NPPs by subtracting the nuclear Δ14CH4 signal simulated with FLEXPART-COSMO from the Δ14CH4 measurements at JFJ. Figure 3 shows for each Δ14CH value (red point) the corresponding value corrected for the nuclear influence (Δ14CH) (blue point). Overall, the mean nuclear Δ14CH4 influence is 7 ± 9 ‰ (min = 0 ‰, max = 58 ‰, n = 60).
Table 1Mean annual Δ14CH4 values with standard deviations derived from our fortnightly Δ14CH4 measurements at JFJ between 2019 and 2024 with four different computations. The first column of mean values considers all Δ14CH4 measurements; the second column only considers Δ14CH4 measurements ≤ 420 ‰ (Δ14CH). The third column considers only Δ14CH4 values whose corresponding Rn values are lower than 1.5 Bq m−3 STP (Δ14CH). The fourth column subtracts from each Δ14CH value the modelled nuclear 14CH4 influence (Δ14CH). The numbers in brackets in columns 2–5 represent the number of values per year considered for the annual mean calculation. For 2023, the last sampling period finished early 2024 when no modelled nuclear 14CH4 influence was yet available so that the corresponding Δ14CH4 value was not considered.
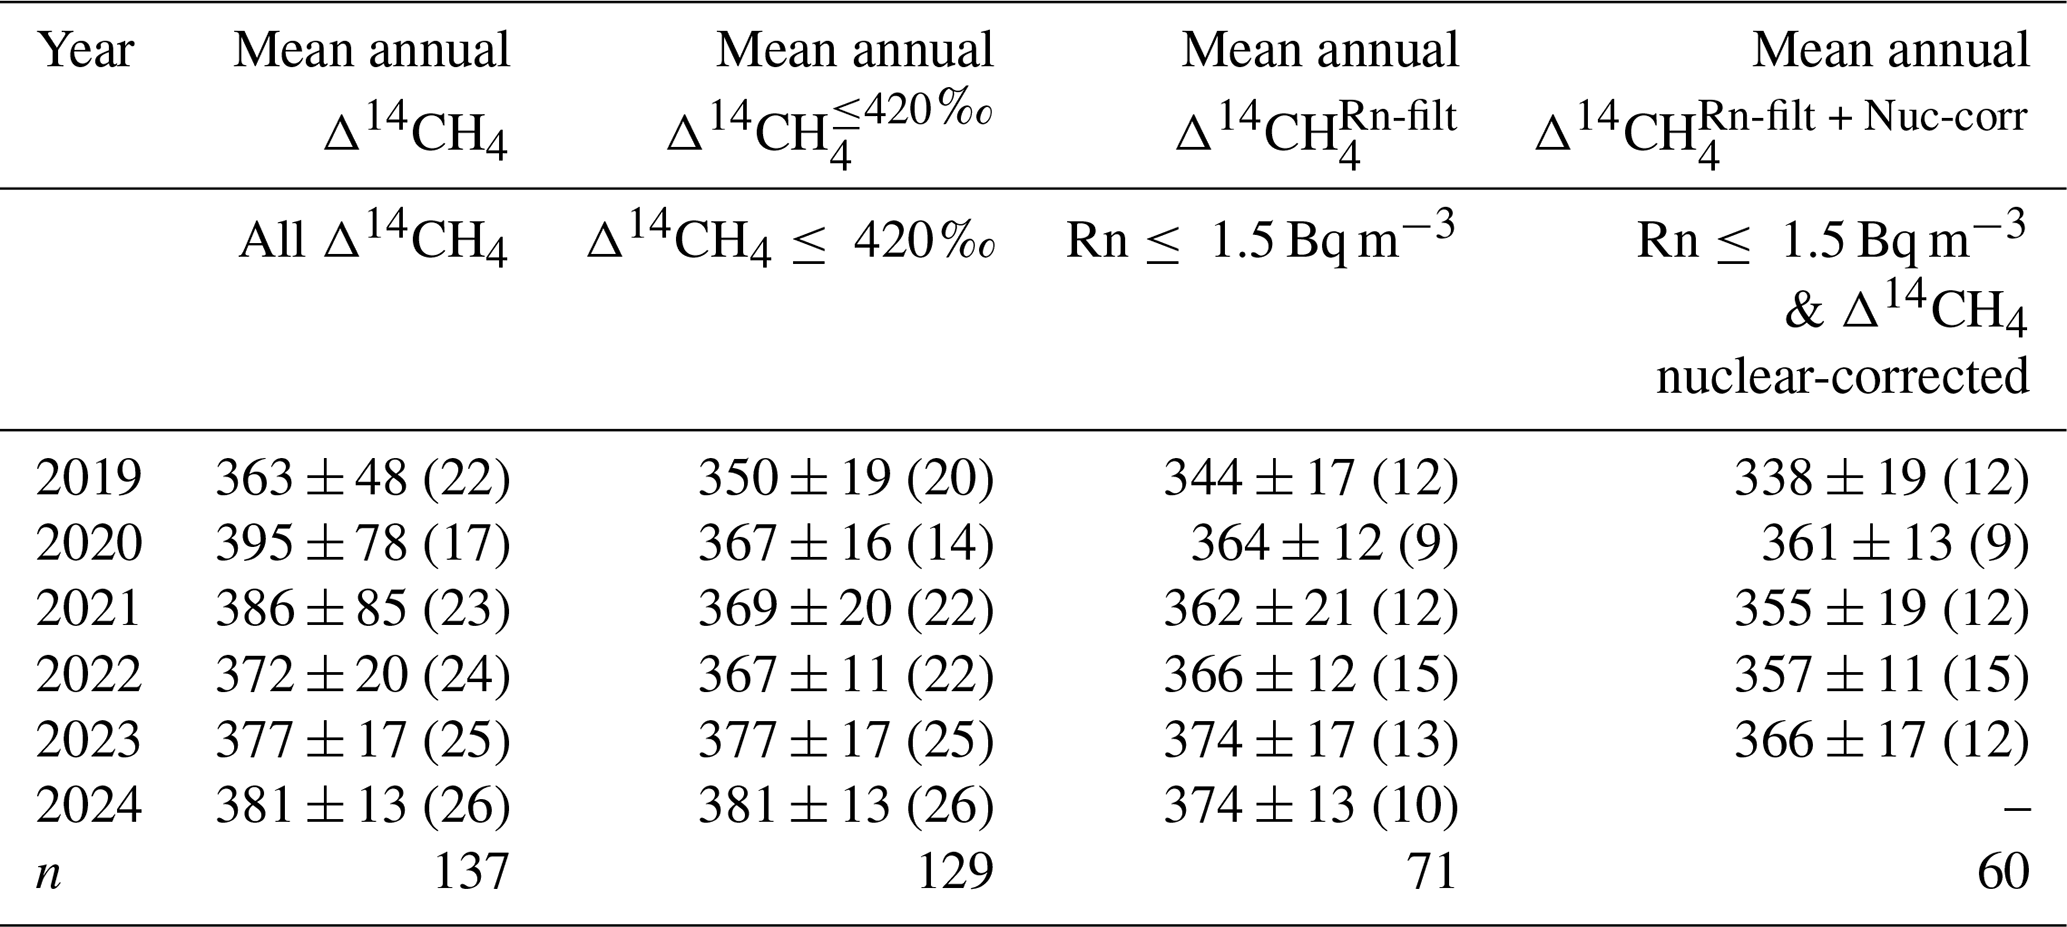
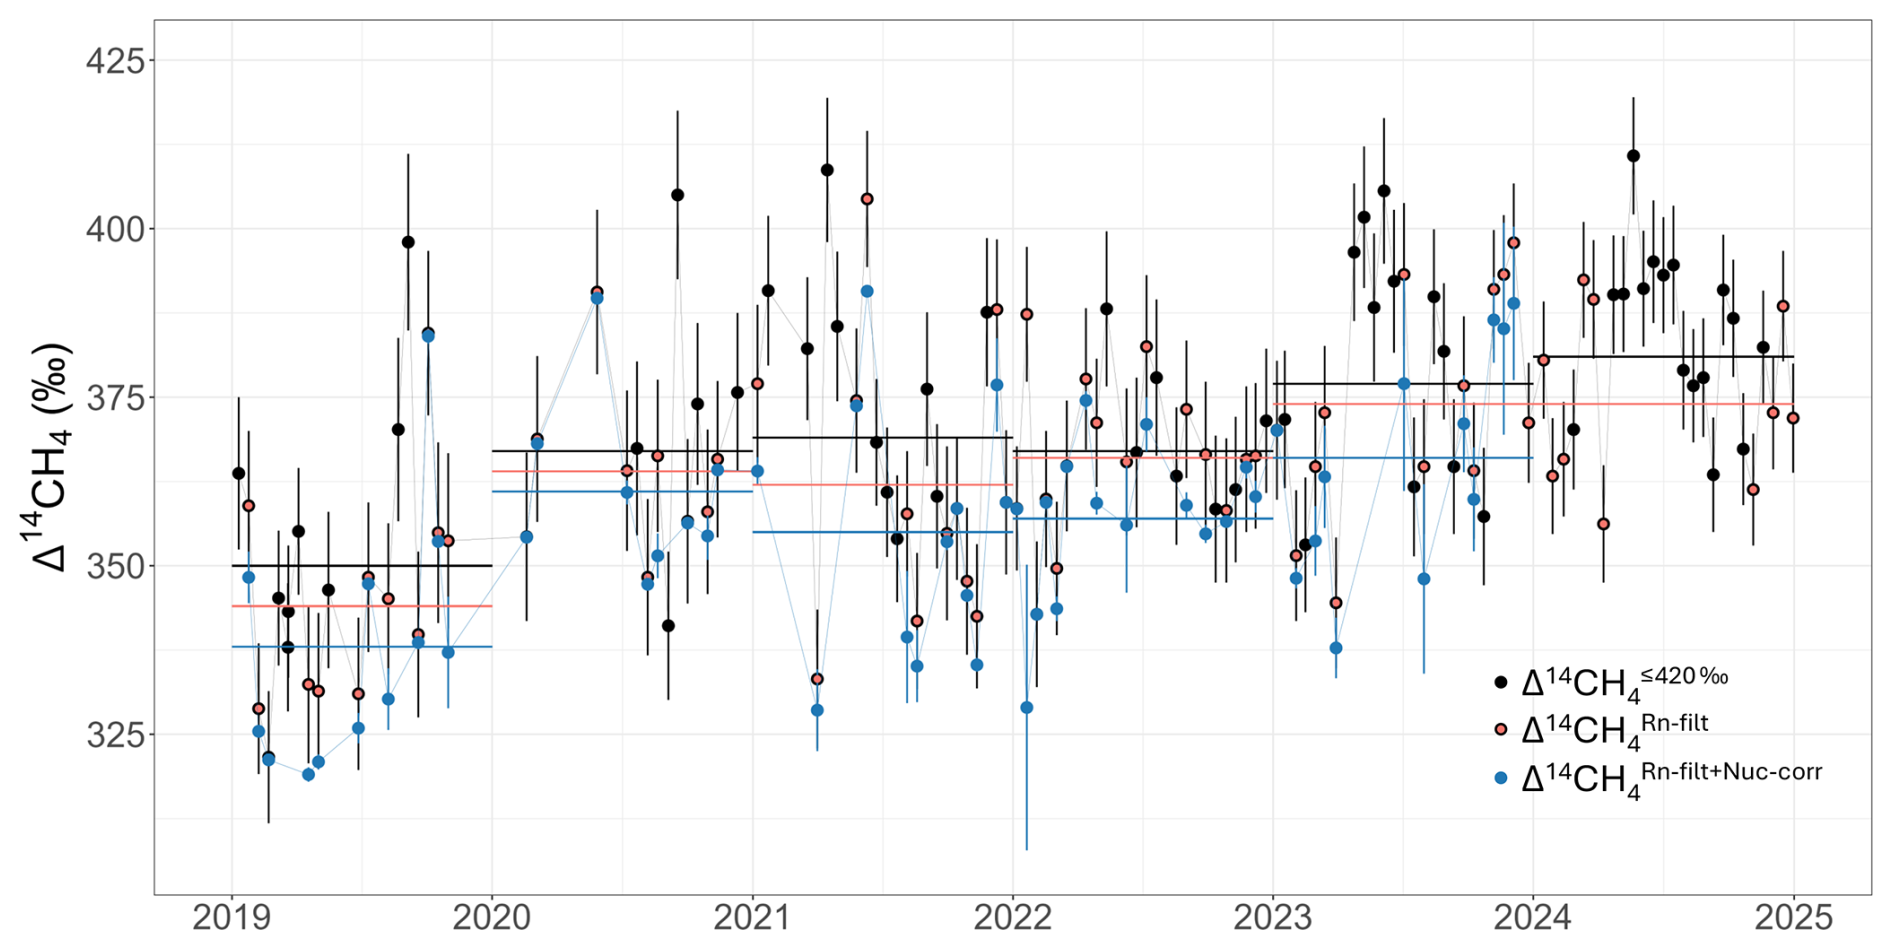
Figure 3Nuclear influence on background Δ14CH4 measurements at JFJ with values ≤ 420 ‰ (Δ14CH) (black points). Red symbols denote points where Rn is lower than 1.5 Bq m−3 STP (Δ14CH) (same as in Fig. 2a, b). Black error bars show the statistical uncertainty of the individual Δ14CH4 measurements. Blue points correspond to the red points after subtraction of the simulated nuclear influence (Δ14CH). Blue error bars represent the standard deviation of the nuclear influence. Horizontal black, red and blue lines show the annual mean values derived from the black (Table 1, Δ14CH), red (Table 1, Δ14CH) and blue points (Table 1, Δ14CH), respectively. Δ14CH values were not available for 2024 due to missing input parameters for the nuclear simulation for this year.
3.2 Comparison with previous observations and simulated global Δ14CH4 signal
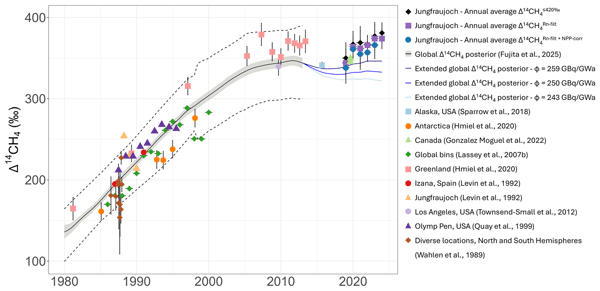
Our annual mean Δ14CH4 values at JFJ are similar to previous observations in the Northern Hemisphere from 2005–2020 (Fig. 4). Direct observations from Los Angeles, Canada and Alaska showed values of 340 ‰–350 ‰, comparable to our JFJ data of 338 ‰–366 ‰ for Δ14CH from 2019–2023 (Fig. 4, Table 1). Firn air observations from Greenland for 2005–2013 were slightly higher, 350 ‰–380 ‰, but still consistent with our data.
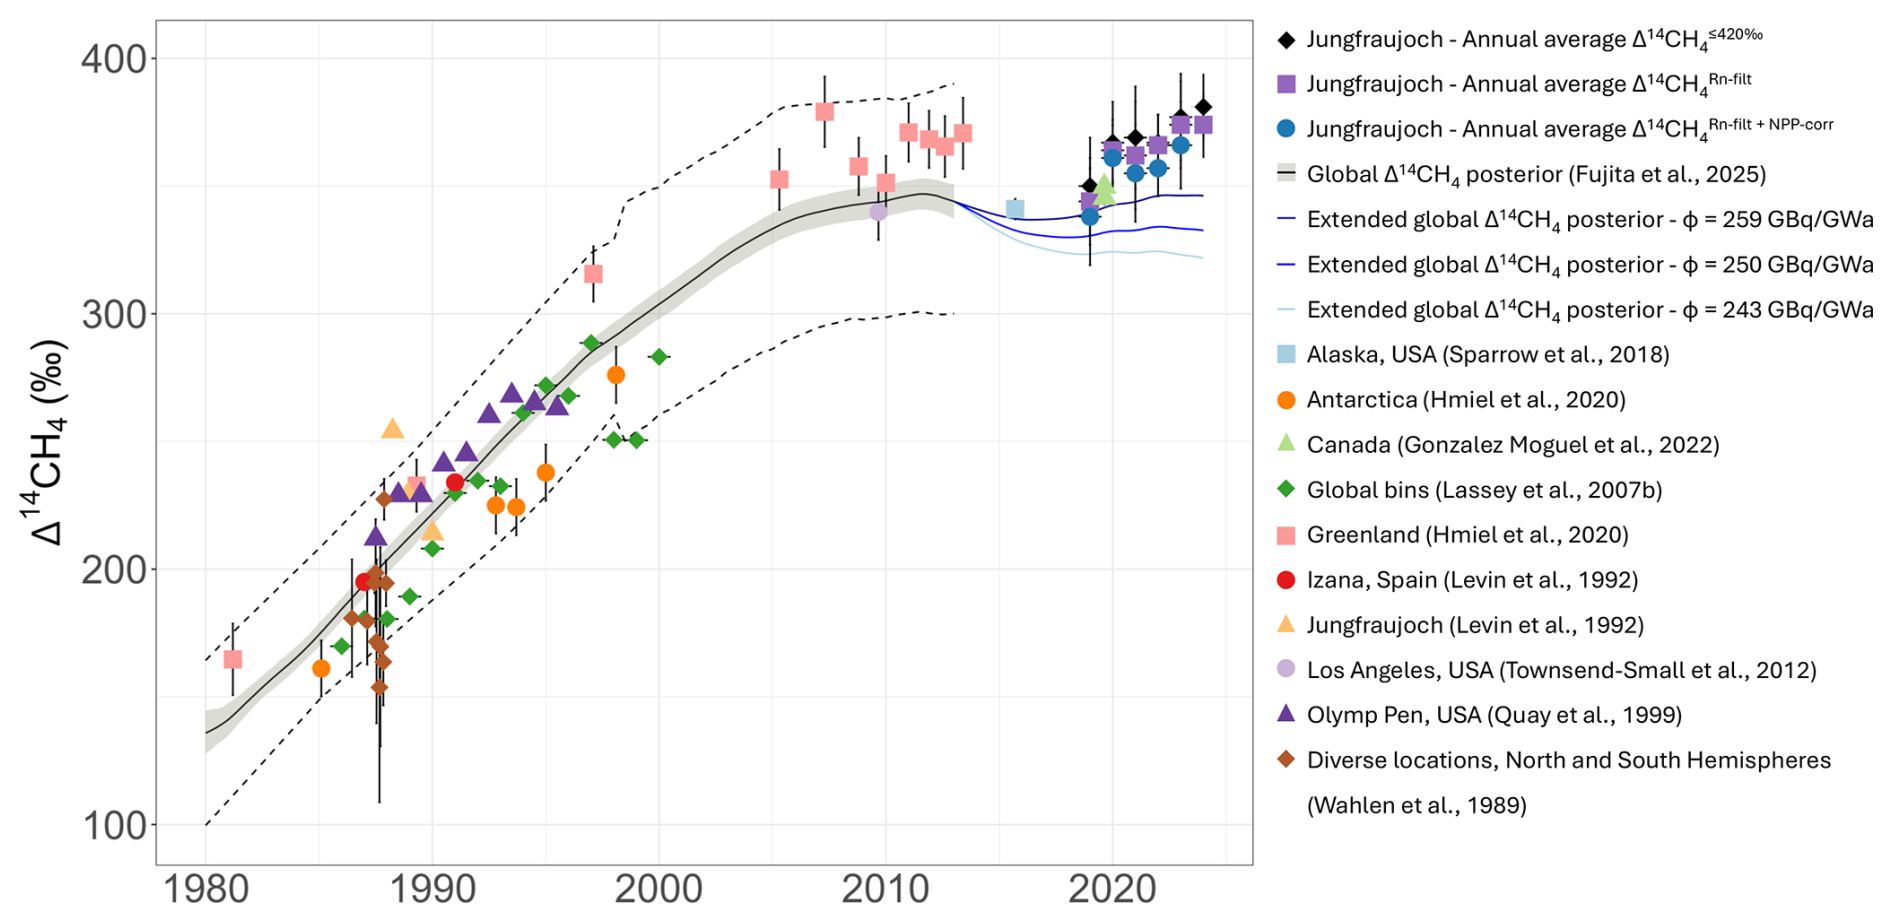
Figure 4Simulated global atmospheric Δ14CH4 signal based on the one-box model of Fujita et al. (2025) extended until 2024 (see Sect. 2.5) with observations from JFJ and other studies, for 1980–2024. The solid black line is the global Δ14CH4 posterior until 2013 from Fujita et al. (2025). The grey area surrounding the line shows a 68 % confidence interval. The dotted black lines denote the global observational target ranges, corresponding to a 99 % confidence interval of the global averages, defined by Fujita et al. (2025). The three blue lines represent the extrapolated global atmospheric Δ14CH4 based on the three emission factor values Φ (see text). Individual points represent atmospheric Δ14CH4 values from atmospheric or ice-core samples. Our annual mean JFJ values between 2019 and 2024 are shown as black diamonds (Δ14CH), purple squares (Δ14CH), and blue circles (Δ14CH).
A rather stable global background Δ14CH4 is simulated for the period 2005–2024, supporting the consistency between the observations over this period. This stable period followed an increase from ∼ 140 ‰ in 1980 to ∼ 350 ‰ in 2005 (see Fig. 4 and Fujita et al., 2025), mainly driven by increasing nuclear 14CH4 emissions since 1970 (Fig. S4h).
All the Northern Hemisphere measurement data is higher than the simulated Δ14CH4 (Fig. 4), which reflects global atmospheric Δ14CH4 accounting for contributions from both hemispheres (Fujita et al., 2025). Due to a lack of data, the current difference between the hemispheres is presently not well-known, but previous data indicate an excess Δ14CH4 in the Northern Hemisphere, which is consistent with stronger nuclear power plant emissions there (Fig. 4). The observational targets from Fujita et al. (2025) were constructed to allow for this hemispheric difference and for uncertainty due to lack of data. The mean offset between the observations in Greenland for 2005–2013 and the simulated global Δ14CH4 value is 22 ± 9 ‰, comparable to the offset between our JFJ observations for 2019–2024 and the global simulation of 0 ‰ to 33 ‰.
The three simulated Δ14CH4 trends from 2013 to 2024 (blue lines in Fig. 4) based on three different emission factors Φ (Sect. 2.5 and Fig. S4g) show a decrease followed by a stabilization (for Φ = 243 GBq GWa−1), or a slight increase (for Φ ≥ 250 GBq GWa−1). The initial decrease was caused by a decrease in nuclear 14CH4 emissions following the Fukushima accident in 2011 (Fig. S4h). Afterwards, the stabilization or slight increase has arisen from nuclear 14CH4 emissions that have increased again in particular after 2017 (Fig. S4h). Our measurement data show a slight positive trend that is reduced after accounting for regional influences from nuclear power plant emissions (Fig. 4, Sect. 3.1). The simulations seem to be more consistent with this slight positive trend from our measurement data using the higher emission factors than the lowest emission factor, where a slight decrease in Δ14CH4 is simulated.
We can also compare with observations at JFJ in 1988–1991 by Levin et al. (1992) (Fig. 4). A large spread in individual measurements of 210 ‰–255 ‰ was found at that time. We also found a large scatter in samples collected in the morning before the installation of integrated nighttime sampling (Fig. 2, Sect. 3.1). The number of operating PWRs worldwide passed from about 240 in 1991 to about 310 in 2024 (Laemmel and Szidat, 2025), suggesting that the influence of nuclear 14CH4 emissions has increased. Overall, the increase from ∼ 230 ‰ in the 1980s to 360 ‰ in the early 2020s is consistent with other data and with the simulated change (Fig. 4).
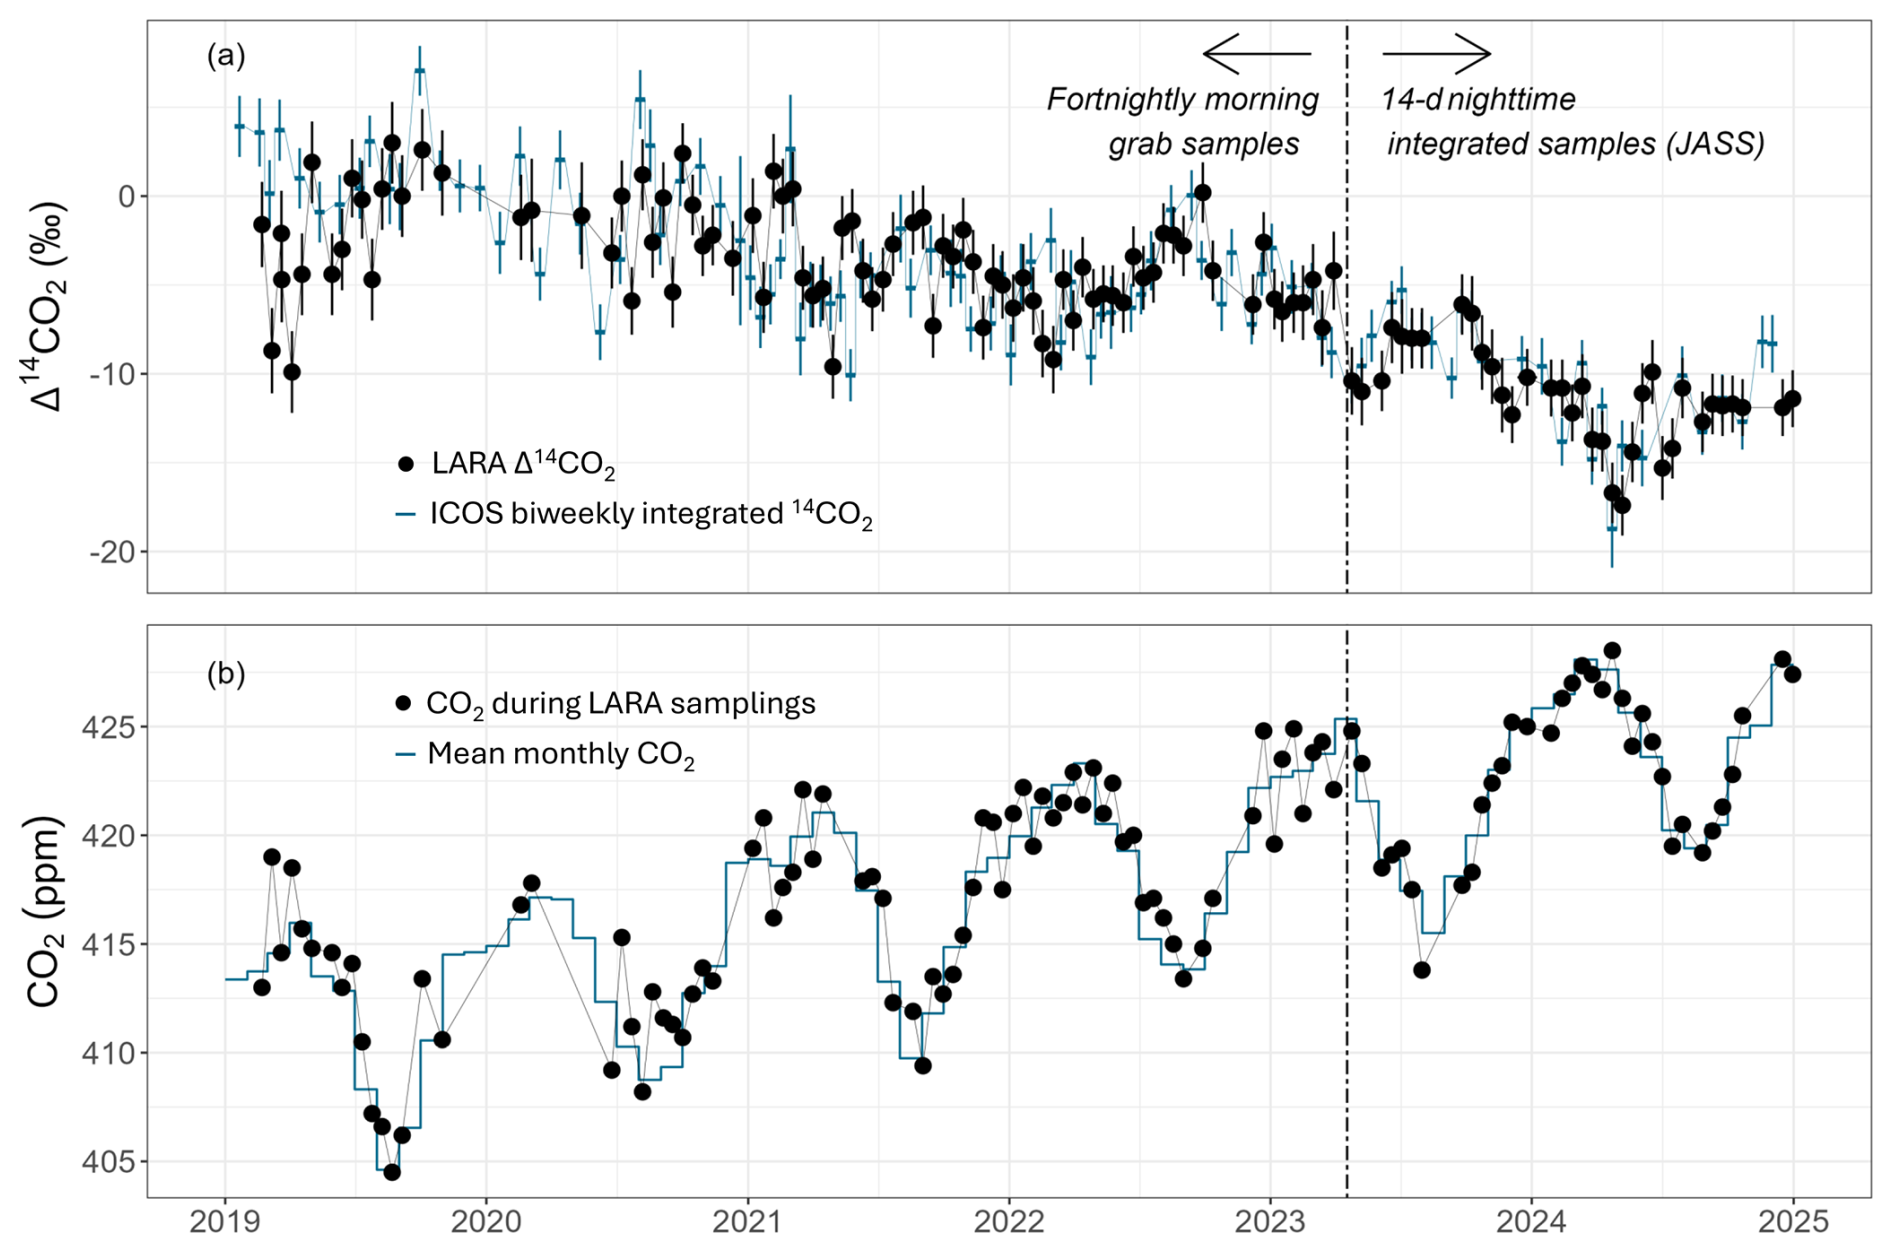
Figure 5(a) In black, Δ14CO2 values measured at JFJ since 2019 and in blue, Δ14CO2 values reported by ICOS. (b) In black, CO2 values related to the sampling periods of our Δ14CO2 measurements and in blue, mean monthly CO2 values measured continuously in situ. The vertical black dashed line in both subplots on 18 April 2023 represents the change in the sampling method, passing from fortnightly morning grab air samples to 14 d nighttime integrated samples with the JASS system.
3.3 Δ14CO2 measurements at Jungfraujoch
Between 2019 and 2024, Δ14CO2 values measured at JFJ ranged from +3 ‰ to −17 ‰, following a decreasing trend over these six years; this trend is mostly due to the emissions of 14C-free fossil fuel CO2 which depletes the global atmospheric Δ14CO2 signal (Fig. 5a). Annual mean CO2 concentrations increased from 411.9 ppm in 2019 to 424.7 ppm in 2024 (Fig. 5b). The standard deviation of the Δ14CO2 value for all 40 CO2 measurements over 15 months for each PAB bottle (so about 80 CO2 measurements in total) is 1.5 ‰ (Fig. S5c, d), which is lower than the instrumental uncertainty of a single Δ14CO2 measurement (2 ‰) indicating the satisfactory long-term reproducibility of our Δ14CO2 measurements.
We compare our annual mean Δ14CO2 and individual Δ14CO2 observations with measurements from ICOS at JFJ (Emmenegger et al., 2025a) in Figs. 5a and 6 and in Table 2. The average trend in Δ14CO2 is similar in both datasets: −2.1 ± 1.9 ‰ yr−1 for our data and −2.8 ± 1.9 ‰ yr−1 for ICOS data. Annual mean values differ by less than 1.5 ‰ except for 2019, when our annual mean Δ14CO2 value was 3.6 ‰ lower than the ICOS annual mean. Larger individual differences are visible especially in the first half of 2019 (Fig. 5a). Both annual mean ICOS Δ14CO2 values for 2019 and 2020 at JFJ are consistent with the equivalent means at the MHD station (Table 2), indicating that the offset in 2019 between our values and the ICOS ones was probably due to a small fossil contamination in our early Δ14CO2 measurements that was remediated during the year.
Table 2Annual mean Δ14CO2 (in units of ‰) with standard deviations at JFJ from this study and from ICOS (Emmenegger et al., 2025a). The third line of the table gives the annual mean Δ14CO2 at Mace Head Atmospheric Research Station (MHD, Ireland). The numbers in brackets represent the number of values per year considered for the annual mean.
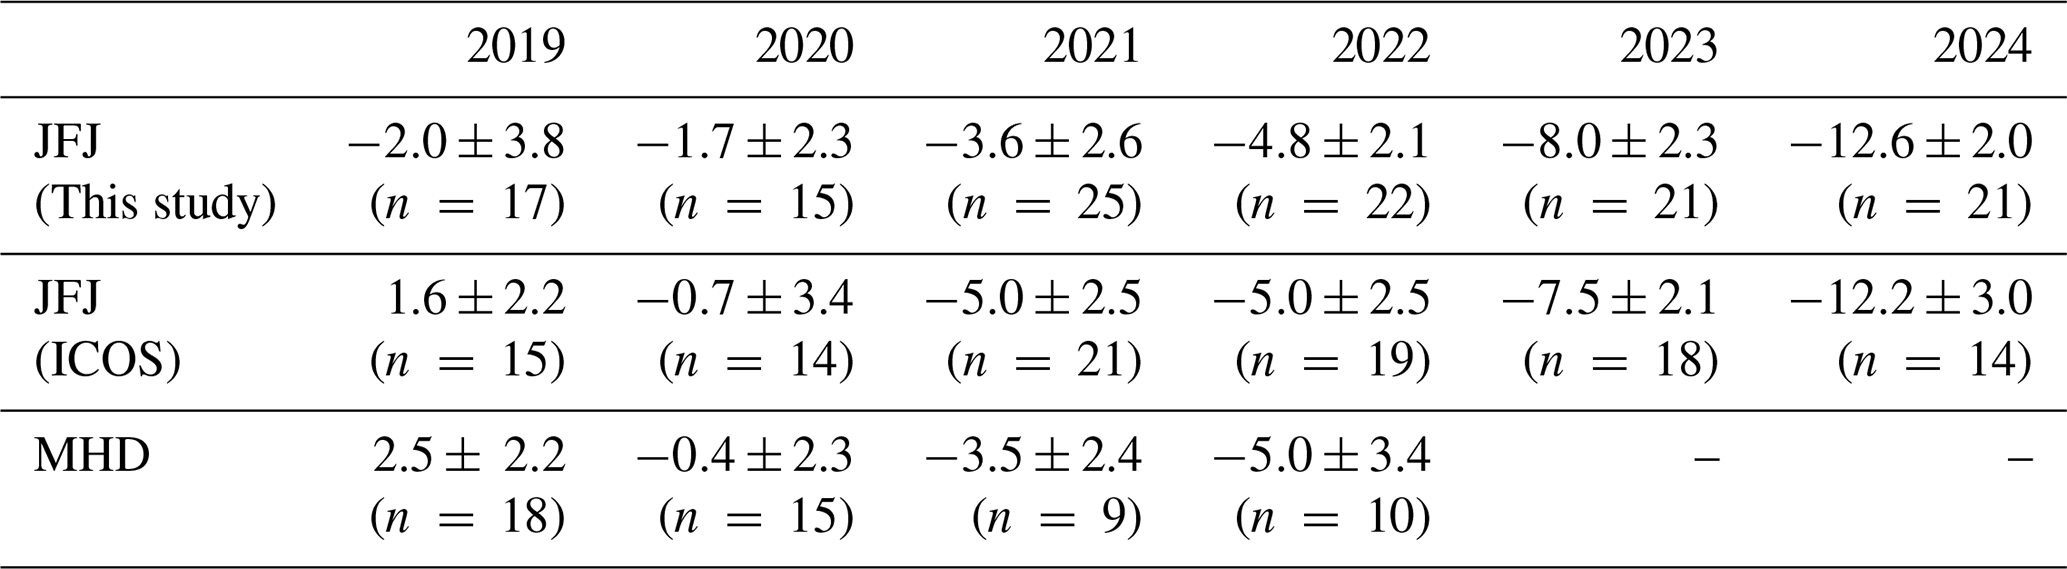
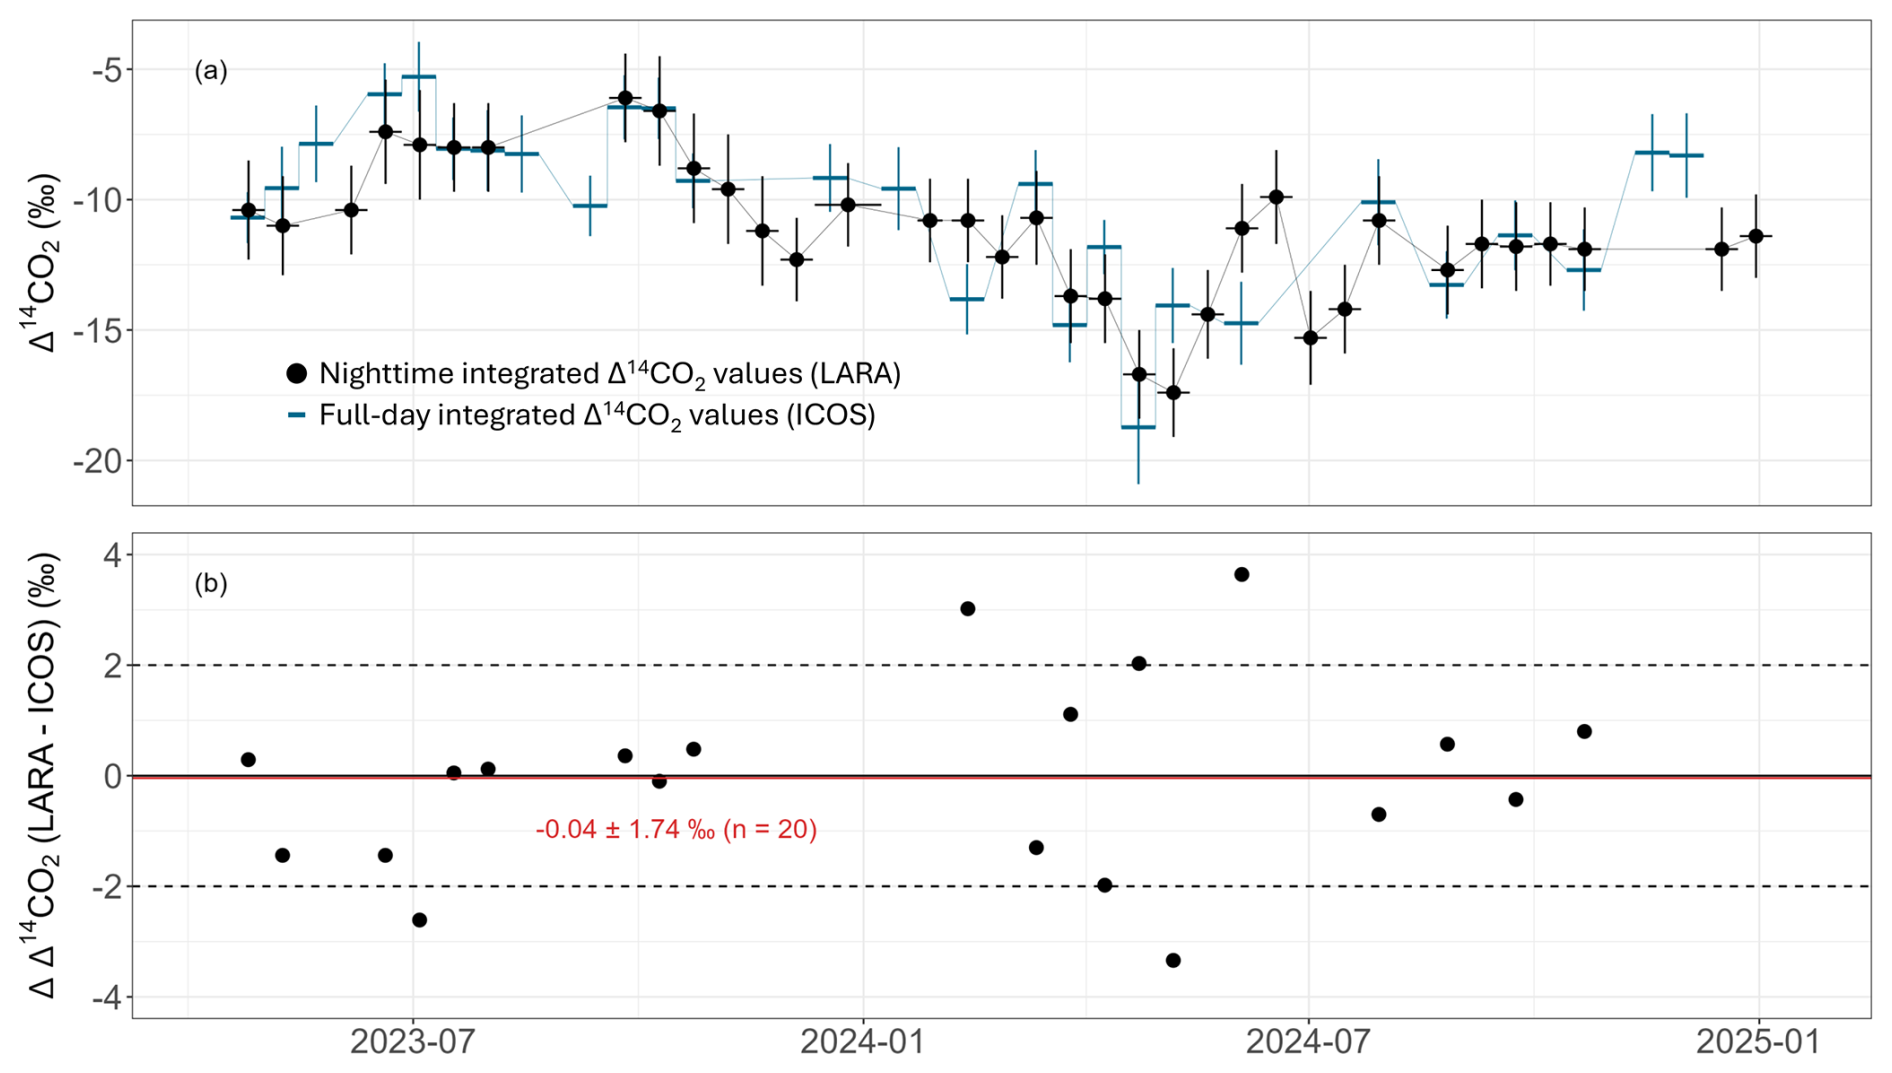
Figure 6(a) Comparison between nighttime-integrated Δ14CO2 values from our LARA program (black points) and all-day-integrated Δ14CO2 values from the ICOS program (blue lines). (b) Difference between LARA and ICOS Δ14CO2 values for simultaneous samples (i.e., ΔΔ14CO2). The solid black line represents the zero line and the typical Δ14CO2 measurement uncertainty of ± 2 ‰ are shown as dotted black lines. The red line shows the mean difference between both datasets of −0.04 ± 1.74 ‰ (n = 20).
After the JASS installation in 2023, a more detailed comparison of Δ14CO2 with ICOS became possible, as we use the same 14 d sampling as the ICOS integrated sodium hydroxide solution sampling (Fig. 6). Over about 20 months the mean difference was −0.04 ± 1.74 ‰ (n = 20) with (insignificantly) lower values in our data. A few large differences up to ± 4 ‰ were observed. We emphasize that even though the fortnightly periods are the same, our JASS sampler integrates only nighttime hours whereas the ICOS sampler integrates all day; moreover, the air inlet of our system is situated about 3 m higher than the one from the ICOS sampler. Therefore, the measurements are not conducted on the exact same air. However, the insignificant mean difference suggests that the different sampling conditions affect the measured Δ14CO2 only marginally.
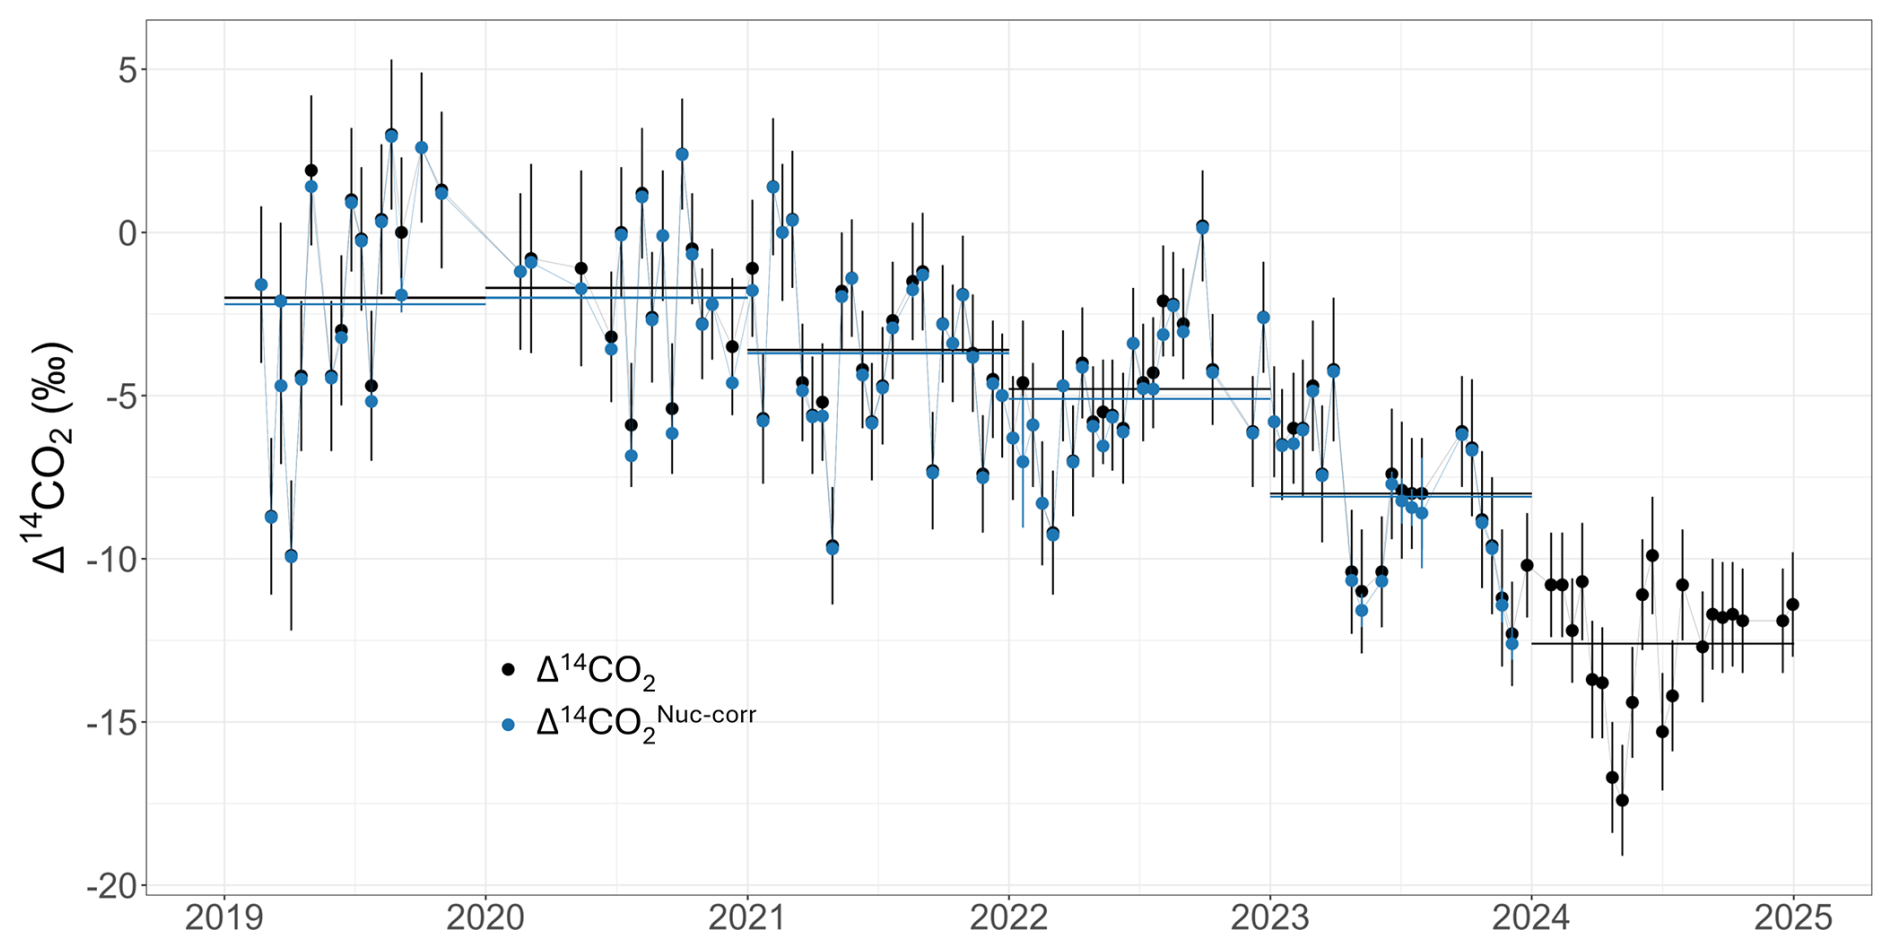
Figure 7Raw Δ14CO2 values measured at JFJ (black points) and corresponding nuclear-corrected Δ14CO values from which the mean nuclear influence was subtracted (blue points). The vertical blue bar around each blue point corresponds to the standard deviation of the nuclear influence over the sampling period. Annual horizontal black lines correspond to the annual mean raw Δ14CO2 value derived from the black points. Annual horizontal blue lines correspond to the annual mean Δ14CO value derived from the blue points. Simulations for 2024 have not been available yet due to missing input parameters for this year.
Similar to the correction we made using the simulated 14CH4 nuclear influence on Δ14CH4 measurements, we also make a correction using the simulated 14CO2 nuclear influence on Δ14CO2 measurements (Fig. 7). The mean nuclear Δ14CO2 influence is 0.2 ± 0.4 ‰ (min = 0 ‰, max = 2.3 ‰). The overall effect of nuclear 14C emissions on atmospheric Δ14CO2 is less than for Δ14CH4, i.e., 0.2 ± 0.4 ‰ compared to 7 ± 9 ‰, respectively. Moreover, nuclear 14CO2 emissions (from BWRs and NFRP) are known to be less sporadic than 14CH4 emissions from PWR reactors (Stenström et al., 1995b), so our atmospheric model based on monthly nuclear 14C releases simulates better nuclear 14CO2 contributions than 14CH4 contributions.
Our Δ14CH4 measurements at JFJ represent the first direct multi-annual time-series of atmospheric measurements in the Northern Hemisphere published within the last 25 years. With the introduction of integrated nighttime sampling, the collected air samples are less likely to show elevated Δ14CH4 values due to sporadic NPP emissions. Four sets of annual Δ14CH4 means for 2019–2024 are reported in Table 1, based on different filtering approaches. The first two columns present annual values based on raw measurements and an upper threshold (Δ14CH4 = 420 ‰) chosen to remove the 6 % highest values measured, respectively. The third column uses simultaneous 222Rn measurements and only considers Δ14CH4 values with a corresponding 222Rn ≤ 1.5 Bq m3. Based on this previous filtered Δ14CH4 dataset, the fourth column further adds a correction of the regional nuclear influence based on atmospheric modeling. From these four sets, the third one is probably the most representative of a well-mixed mid-latitude background site as 222Rn is a well-known proxy to identify origin of air masses, e.g. from the free troposphere. The fourth set, based on 14C nuclear emission inventory, would represent the ideal set but it still so far needs a better knowledge and more high-resolution data of nuclear 14CH4 emissions to be validated. As the measurements at JFJ are consistent with previous measurements and global model simulations, continued observations at JFJ will provide an important constraint on the global background Δ14CH4 trends and the global CH4 budget (Fujita et al., 2025).
The correction for the NPP influence on Δ14CH4 that we apply to the measurements may even be improved with more information on regional nuclear 14C emissions. Our current atmospheric simulation uses monthly constant 14CH4 emission rates to describe the NPP releases in Switzerland and less frequent data for reactors in other countries. However, it is known that radioactive emissions from PWRs are rather sporadic (Stenström et al., 1995b). Espic et al. (2025) collected 18 grab air samples for atmospheric 14CH4 and 14CO2 analyses around the Swiss PWR Gösgen during the first day of its annual revision period in 2019 (sampling duration per bag: 20–75 min) and observed a 14CH4 and 14CO2 release event that lasted only a few hours but included ∼ 8 % of the total annual 14CH4 emissions of that year. Comparing this former study using grab samples to the present study using integrated samples also illustrates the importance of the choice of sampling duration and setup to gain knowledge about two processes with different timescales. Furthermore, Espic et al. (2025) found that the activities of noble gases measured at a 10 min temporal resolution at the PWR stack may be a valuable proxy to identify sporadic 14C releases. A generalized use of this kind of high-frequency data would be beneficial to refine temporal variation in estimates of 14C emissions from NPPs.
The composition of 14C is another important uncertainty for estimates of 14C emissions from NPPs. Here, only PWRs and VVERs were considered to emit organic 14C (e.g., 14CH4); however, small organic 14C emissions have also been reported for other reactor types: up to 7 % for BWRs (Kunz, 1985; Stenström et al., 1995a), 1–4 to 25 %–30 % for PHWRs (Bharath et al., 2022; IAEA, 2004; Joshi et al., 1987; Milton et al., 1995), and up to 30 % for LWGRs (Gaiko et al., 1985; Konstantinov et al., 1989). Organic 14C emissions from these reactor types may be significant as about 13 % of the total nuclear electricity is produced by BWRs (which is the third-most important reactor type after PWRs and VVERs based on nuclear electricity) and the emission factors for PHWRs and LWGRs (1.6 and 1.3 TBq GWa−1, respectively, Zazzeri et al., 2018) are even several times higher than for PWRs and VVERs. LWGR emissions are particularly uncertain, and radiocarbon measurements of tree rings around LWGRs suggested emission factors could be two to four times higher than the assumed value of 1.3 TBq GWa−1 (Juodis et al., 2022; Nazarov et al., 2023). In addition, PWRs themselves exhibit a broad range (i.e., 44 %–95 %) for the organic 14C fraction at PWRs and VVERs. Furthermore, there are only few 40-year old measurements of the speciation of the individual fractions of the organic 14C emissions that may involve (besides 14CH4) relevant portions of e.g. 14C2H6, 14C3H8 and 14C4H10 (Kunz, 1985). More recently, Espic et al. (2025) found for the Swiss PWR Gösgen (see above) that the measured ratio between 14CH4 and 14CO2 emissions and the reported ratio between organic and 14CO2 emissions agreed with each other, implying that almost all the organic emissions are in form of 14CH4. More measurements focusing on the hydrocarbon composition of the organic 14C fraction are needed at PWRs, VVERs and LWGRs.
This work demonstrates that our measurements of Δ14CO2 at JFJ are generally consistent with concurrent measurements from the ICOS program. The installation of the JASS system in 2023 furthermore constitutes an improvement of the long-running ICOS Δ14CO2 measurements at JFJ, since it integrates nighttime periods which mostly are dominated by air from the free troposphere, whereas the ICOS measurements rely on all-day air sampling. Even though the insignificantly low mean difference between ICOS sodium hydroxide-based integrated sampling vs. our JASS system suggests that the different sampling conditions affect the measured Δ14CO2 only marginally (Fig. 6), this observation requires a longer duration for the comparison of both datasets to prove their consistency.
We conducted fortnightly atmospheric Δ14CH4 and Δ14CO2 measurements at the Swiss High-Altitude Research Station Jungfraujoch (about 3500 m a.s.l.) between 2019 and 2024. Initially based on 20–60 min air samples commonly collected in the early morning, a novel air sampling setup automatically collecting ambient air during nighttime was installed in April 2023. Over the six years 2019–2024, Δ14CH4 values at JFJ have shown a slight increase from 350 ± 19 ‰ to 381 ± 13 ‰ (i.e., by a rate of ‰ yr−1) while Δ14CO2 values decreased from −2.0 ± 3.8 ‰ to −12.6 ± 2.0 ‰ (i.e., by a rate of yr−1). Our Δ14CO2 values generally agree well with the integrated Δ14CO2 measurements from the ICOS program. Accounting for nuclear 14CH4 and 14CO2 emissions on the European scale within the atmospheric transport model FLEXPART-COSMO, we simulate the nuclear signal on our individual measurements at JFJ and estimate an average nuclear influence of 7 ± 9 ‰ and 0.2 ± 0.4 ‰ for 222Rn-filtered Δ14CH4 and raw Δ14CO2 values, respectively, which we use to correct the observed data. Our Δ14CH4 data are consistent with an atmospheric one-box model for Δ14CH4 that simulates slightly increasing or decreasing Δ14CH4 over 2013–2024, depending on the strength of nuclear power plant emissions. Our new observations at JFJ will help to refine the global background Δ14CH4 and Δ14CO2 and to constrain CH4 and CO2 sources and sinks.
All raw values presented in this work are available on Zenodo (https://doi.org/10.5281/zenodo.18518086, Laemmel et al., 2026).
The supplement related to this article is available online at https://doi.org/10.5194/acp-26-12019-2026-supplement.
TL: Conceptualization, Data curation, Formal analysis, Investigation, Methodology, Project administration, Software, Validation, Visualization, Writing – original draft, Writing – review and editing. DG: Data curation, Investigation Methodology, Validation, Visualization, Writing – original draft, Writing – review and editing. SH: Investigation Methodology, Software, Validation, Visualization, Writing – original draft, Writing – review and editing. RF: Investigation Methodology, Software, Validation, Visualization, Writing – original draft, Writing – review and editing. HG: Supervision, Writing – original draft, Writing – review and editing. CE: Data curation, Writing – review and editing. MB: Data curation, Writing – review and editing. NH: Investigation, Writing – review and editing. FC: Investigation, Writing – review and editing. DB: Investigation, Writing – review and editing. MS: Investigation, Writing – review and editing. GZ: Investigation, Writing – review and editing. SH: Investigation, Writing – review and editing. ML: Investigation, Writing – review and editing. SS: Conceptualization, Funding acquisition, Project administration, Resources, Supervision, Writing – review and editing.
The contact author has declared that none of the authors has any competing interests.
Publisher's note: Copernicus Publications remains neutral with regard to jurisdictional claims made in the text, published maps, institutional affiliations, or any other geographical representation in this paper. The authors bear the ultimate responsibility for providing appropriate place names. Views expressed in the text are those of the authors and do not necessarily reflect the views of the publisher.
We are grateful to the funding of the SNSF Sinergia funding no. 193770 (Radiocarbon Inventories of Switzerland – RICH: integrated approach to understand the changing carbon cycle) as well as the Dr. Alfred Bretscher Scholarship. We thank Gary Salazar, Franziska Lechleitner and Tiberiu Sava for their assistance during 14C measurements at LARA. We further thank the operating company of the Paks nuclear power plant (MVM Paks Nuclear Power Plant Ltd.) for sharing the corresponding 14C emission values and Mihály Molnár for ensuring the communication with it. We are grateful to the team of the DCBP workshop (especially Sandra Hostettler and Thomas Hübscher) as well as René Schraner for their assistance in designing and building the JASS. We also thank the International Foundation High-Altitude Research Stations Jungfraujoch and Gornergrat for access to Jungfraujoch facilities and the Jungfraujoch's custodians (Joan & Martin Fischer, Christine & Ruedi Käser, Daniela Bissig & Erich Furrer, and Sonja Stöckli & Thomas Furter) for their support on site. We also thank Céline Pascale and Tobias Bühlmann at METAS (Swiss Federal Institute of Metrology) for the use of the Picarro analyzer at METAS. We are grateful to Scott Chambers and his colleagues at Australian Nuclear Science and Technology Organisation (ANSTO) for the ongoing collaboration and support in maintaining the radon detection system. The radon and greenhouse gas concentration observations were financially supported by the Swiss National Science Foundation (SNSF, 20FI20_173691, 20FI20_198227, 20FI-0_229655) as a contribution to the pan-European Integrated Carbon Observation System (ICOS) Research Infrastructure. We thank ICOS for making available a large number of parameters continuously measured at JFJ. We thank the Global Monitoring Laboratory (GML) of the US National Oceanic & Atmospheric Administration (NOAA) for making available global CH4 and CO2 atmospheric levels. We thank Lukas Bäni, René Bleisch and Rolf Bütikofer for their assistance in configurating the remote access of the JASS. We finally thank Vasilii Petrenko and three anonymous referees for their comments that helped improving this manuscript.
This research has been supported by the Schweizerischer Nationalfonds zur Förderung der Wissenschaftlichen Forschung (grant nos. 193770, 20FI20_173691, 20FI20_198227, and 20FI-0_229655).
This paper was edited by Rolf Müller and reviewed by Vasilii Petrenko and three anonymous referees.
Basu, S., Lehman, S. J., Miller, J. B., Andrews, A. E., Sweeney, C., Gurney, K. R., Xu, X., Southon, J., and Tans, P. P.: Estimating US fossil fuel CO2 emissions from measurements of 14C in atmospheric CO2, P. Natl. Acad. Sci. USA, 117, 13300–13307, https://doi.org/10.1073/pnas.1919032117, 2020.
Berhanu, T. A., Szidat, S., Brunner, D., Satar, E., Schanda, R., Nyfeler, P., Battaglia, M., Steinbacher, M., Hammer, S., and Leuenberger, M.: Estimation of the fossil fuel component in atmospheric CO2 based on radiocarbon measurements at the Beromünster tall tower, Switzerland, Atmos. Chem. Phys., 17, 10753–10766, https://doi.org/10.5194/acp-17-10753-2017, 2017.
Bharath, Arya Krishnan, K., D'Souza, R. S., Rashmi Nayak, S., Dileep, B. N., Ravi, P. M., Mangavi, S. S., Salunke, G. S., Veerendra, D., and Karunakara, N.: Carbon-14 emission from the pressurized heavy water reactor nuclear power plant at Kaiga, India, J. Environ. Radioactiv., 255, 107006, https://doi.org/10.1016/j.jenvrad.2022.107006, 2022.
Conen, F.: Radon Monitors Jungfraujoch & Uni Bern Near Realtime Data, https://sievju.org/pl/radon.pl (last access: 19 August 2026), 2025.
Conen, F. and Zimmermann, L.: Separating “free tropospheric conditions” from those “influenced by the planetary boundary layer”, International Foundation HFSJG, https://www.hfsjg.ch/reports/2020/pdf/120_UniBasel_Conen_radon_cf.pdf (last access: 19 August 2026), 2020.
Ehhalt, D. H.: The atmospheric cycle of methane, Tellus, 26, 58–70, https://doi.org/10.1111/j.2153-3490.1974.tb01952.x, 1974.
Eisma, R., Borg, K. van der, de Jong, A. F. M., Kieskamp, W. M., and Veltkamp, A. C.: Measurements of the 14C content of atmospheric methane in The Netherlands to determine the regional emissions of 14CH4, Nucl. Instrum. Meth. B, 92, https://doi.org/10.1016/0168-583X(94)96044-5, 1994.
Eisma, R., Vermeulen, A. T., and Borg, K. V. D.: 14CH4 emissions from nuclear power plants in northwestern Europe, Radiocarbon, 37, https://doi.org/10.1017/S0033822200030952, 1995.
Emmenegger, L., Leuenberger, M., and Steinbacher, M.: ICOS ATC 14C Release analysed by ICOS CRL from Jungfraujoch (6.0 m), 2015-09-21–2024-11-25, ICOS RI, https://hdl.handle.net/11676/AtmTz0jbjTlwKST7jLLrHSHh, 2025a.
Emmenegger, L., Harris, E., Leuenberger, M., and Steinbacher, M.: ICOS ATC CH4 Release from Jungfraujoch (13.9 m), 2016-12-12–2025-03-31, ICOS RI, https://hdl.handle.net/11676/_qRWgJ01HGIxRzpTZjGCWWJF, 2025b.
Emmenegger, L., Harris, E., Leuenberger, M., and Steinbacher, M.: ICOS ATC CO2 Release from Jungfraujoch (13.9 m), 2016-12-12–2025-03-31, ICOS RI, https://hdl.handle.net/11676/4ba-uo4FsoZbxFyfj0S6CaUQ, 2025c.
Emmenegger, L., Harris, E., Leuenberger, M., Steinbacher, M., and Roulet, Y.-A.: ICOS ATC Meteo Release from Jungfraujoch (1.0 m), 2016-12-12–2025-03-31, ICOS RI, https://hdl.handle.net/11676/6XYAzIL0CPWhQmPTAY-Swghh, 2025d.
Espic, C., Liechti, M., Battaglia, M., Paul, D., Röckmann, T., and Szidat, S.: Compound-Specific Radiocarbon Analysis of Atmospheric Methane: A New Preconcentration and Purification Setup, Radiocarbon, 61, 1461–1476, https://doi.org/10.1017/RDC.2019.76, 2019.
Espic, C., Laemmel, T., Henne, S., Purtschert, R., and Szidat, S.: Atmospheric 14CH4, 14CO2 and 37Ar measurements around a Swiss pressurized water reactor during an annual revision period, J. Environ. Radioactiv., 281, 107576, https://doi.org/10.1016/j.jenvrad.2024.107576, 2025.
Etheridge, D. M., Steele, L. P., Langenfelds, R. L., Francey, R. J., Barnola, J. ‐M., and Morgan, V. I.: Natural and anthropogenic changes in atmospheric CO2 over the last 1000 years from air in Antarctic ice and firn, J. Geophys. Res., 101, 4115–4128, https://doi.org/10.1029/95JD03410, 1996.
Etiope, G., Ciotoli, G., Benà, E., Mazzoli, C., Röckmann, T., Sivan, M., Squartini, A., Laemmel, T., Szidat, S., Haghipour, N., and Sassi, R.: Surprising concentrations of hydrogen and non-geological methane and carbon dioxide in the soil, Sci. Total Environ., 948, 174890, https://doi.org/10.1016/j.scitotenv.2024.174890, 2024.
European Commission Joint Research Centre: GHG emissions of all world countries: 2023, Publications Office, LU, https://data.europa.eu/doi/10.2760/953322 (last access: 19 August 2026), 2023.
Fujita, R., Graven, H., Zazzeri, G., Hmiel, B., Petrenko, V. V., Smith, A. M., Michel, S. E., and Morimoto, S.: Global fossil methane emissions constrained by multi-isotopic atmospheric methane histories, J. Geophys. Res.-Atmos., https://doi.org/10.1029/2024JD041266, 2025.
Gaiko, V. B., Korablev, N. A., Solov'ev, E. N., Trosheva, T. I., Shamov, V. P., Umanets, M. P., and Shcherbina, V. G.: Discharge of 14C by nuclear power stations with RBMK-1000 reactors, Atom. Energy, 59, 703–705, https://doi.org/10.1007/BF01122497, 1985.
Gidden, M. J., Riahi, K., Smith, S. J., Fujimori, S., Luderer, G., Kriegler, E., van Vuuren, D. P., van den Berg, M., Feng, L., Klein, D., Calvin, K., Doelman, J. C., Frank, S., Fricko, O., Harmsen, M., Hasegawa, T., Havlik, P., Hilaire, J., Hoesly, R., Horing, J., Popp, A., Stehfest, E., and Takahashi, K.: Global emissions pathways under different socioeconomic scenarios for use in CMIP6: a dataset of harmonized emissions trajectories through the end of the century, Geosci. Model Dev., 12, 1443–1475, https://doi.org/10.5194/gmd-12-1443-2019, 2019.
Gonzalez Moguel, R., Vogel, F., Ars, S., Schaefer, H., Turnbull, J. C., and Douglas, P. M. J.: Using carbon-14 and carbon-13 measurements for source attribution of atmospheric methane in the Athabasca oil sands region, Atmos. Chem. Phys., 22, 2121–2133, https://doi.org/10.5194/acp-22-2121-2022, 2022.
Graven, H., Fischer, M. L., Lueker, T., Jeong, S., Guilderson, T. P., Keeling, R. F., Bambha, R., Brophy, K., Callahan, W., Cui, X., Frankenberg, C., Gurney, K. R., LaFranchi, B. W., Lehman, S. J., Michelsen, H., Miller, J. B., Newman, S., Paplawsky, W., Parazoo, N. C., Sloop, C., and Walker, S. J.: Assessing fossil fuel CO2 emissions in California using atmospheric observations and models, Environ. Res. Lett., 13, 065007, https://doi.org/10.1088/1748-9326/aabd43, 2018.
Graven, H., Hocking, T., and Zazzeri, G.: Detection of Fossil and Biogenic Methane at Regional Scales Using Atmospheric Radiocarbon, Earth's Future, 7, 283–299, https://doi.org/10.1029/2018EF001064, 2019.
Graven, H., Keeling, R. F., and Rogelj, J.: Changes to Carbon Isotopes in Atmospheric CO2 Over the Industrial Era and Into the Future, Global Biogeochem. Cy., 34, e2019GB006170, https://doi.org/10.1029/2019GB006170, 2020.
Graven, H. D., Warren, H., Gibbs, H. K., Khatiwala, S., Koven, C., Lester, J., Levin, I., Spawn-Lee, S. A., and Wieder, W.: Bomb radiocarbon evidence for strong global carbon uptake and turnover in terrestrial vegetation, Science, 384, 1335–1339, https://doi.org/10.1126/science.adl4443, 2024.
Griffiths, A. D., Conen, F., Weingartner, E., Zimmermann, L., Chambers, S. D., Williams, A. G., and Steinbacher, M.: Surface-to-mountaintop transport characterised by radon observations at the Jungfraujoch, Atmos. Chem. Phys., 14, 12763–12779, https://doi.org/10.5194/acp-14-12763-2014, 2014.
Hammer, S. and Levin, I.: CORSO Deliverable 3.1 – Database of existing Δ14CO2 measurements, https://hdl.handle.net/11676/HnpnYFcQljQ-SJer66F-hr-b, 2023.
Hammer, S., Friedrich, R., Kromer, B., Cherkinsky, A., Lehman, S. J., Meijer, H. A. J., Nakamura, T., Palonen, V., Reimer, R. W., Smith, A. M., Southon, J. R., Szidat, S., Turnbull, J., and Uchida, M.: Compatibility of Atmospheric 14CO2 Measurements: Comparing the Heidelberg Low-Level Counting Facility to International Accelerator Mass Spectrometry (AMS) Laboratories, Radiocarbon, 59, 875–883, https://doi.org/10.1017/RDC.2016.62, 2017.
Heiskanen, J., Brümmer, C., Buchmann, N., Calfapietra, C., Chen, H., Gielen, B., Gkritzalis, T., Hammer, S., Hartman, S., Herbst, M., Janssens, I. A., Jordan, A., Juurola, E., Karstens, U., Kasurinen, V., Kruijt, B., Lankreijer, H., Levin, I., Linderson, M.-L., Loustau, D., Merbold, L., Myhre, C. L., Papale, D., Pavelka, M., Pilegaard, K., Ramonet, M., Rebmann, C., Rinne, J., Rivier, L., Saltikoff, E., Sanders, R., Steinbacher, M., Steinhoff, T., Watson, A., Vermeulen, A. T., Vesala, T., Vítková, G., and Kutsch, W.: The Integrated Carbon Observation System in Europe, B. Am. Meteor. Soc., 103, E855–E872, https://doi.org/10.1175/BAMS-D-19-0364.1, 2022.
Henne, S., Brunner, D., Folini, D., Solberg, S., Klausen, J., and Buchmann, B.: Assessment of parameters describing representativeness of air quality in-situ measurement sites, Atmos. Chem. Phys., 10, 3561–3581, https://doi.org/10.5194/acp-10-3561-2010, 2010.
Henne, S., Brunner, D., Oney, B., Leuenberger, M., Eugster, W., Bamberger, I., Meinhardt, F., Steinbacher, M., and Emmenegger, L.: Validation of the Swiss methane emission inventory by atmospheric observations and inverse modelling, Atmos. Chem. Phys., 16, 3683–3710, https://doi.org/10.5194/acp-16-3683-2016, 2016.
Hmiel, B., Petrenko, V. V., Dyonisius, M. N., Buizert, C., Smith, A. M., Place, P. F., Harth, C., Beaudette, R., Hua, Q., Yang, B., Vimont, I., Michel, S. E., Severinghaus, J. P., Etheridge, D., Bromley, T., Schmitt, J., Faïn, X., Weiss, R. F., and Dlugokencky, E.: Preindustrial 14CH4 indicates greater anthropogenic fossil CH4 emissions, Nature, 578, 409–412, https://doi.org/10.1038/s41586-020-1991-8, 2020.
IAEA: Management of Waste Containing Tritium and Carbon-14, Technical Reports Series, 421, https://www.iaea.org/publications/6634/management-of-waste-containing-tritium-and-carbon-14 (last access: 19 August 2026), 2004.
IAEA PRIS: World Statistics, https://pris-stats.iaea.org/ (last access: 19 August 2026), 2025.
IPCC: Climate Change 2021 – The Physical Science Basis: Working Group I Contribution to the Sixth Assessment Report of the Intergovernmental Panel on Climate Change, 1st ed., Cambridge University Press, https://doi.org/10.1017/9781009157896, 2023.
Joshi, M. L., Ramamirtham, B., and Soman, S. D.: Measurement of 14C Emission Rates From a Pressurised Heavy Water Reactor, Health Phys., 52, 787–791, https://doi.org/10.1097/00004032-198706000-00009, 1987.
Juodis, L., Maceika, E., Barisevičiūtė, R., Pabedinskas, A., Ežerinskis, Ž., Šapolaitė, J., Plukis, A., Remeikis, V., and Remeikis, V.: Radiocarbon generation and atmospheric release assessment from nuclear power plant with RBMK type reactors, Nucl. Eng. Des., 394, 111822, https://doi.org/10.1016/j.nucengdes.2022.111822, 2022.
Katharopoulos, I., Rust, D., Vollmer, M. K., Brunner, D., Reimann, S., O'Doherty, S. J., Young, D., Stanley, K. M., Schuck, T., Arduini, J., Emmenegger, L., and Henne, S.: Impact of transport model resolution and a priori assumptions on inverse modeling of Swiss F-gas emissions, Atmos. Chem. Phys., 23, 14159–14186, https://doi.org/10.5194/acp-23-14159-2023, 2023.
Konstantinov, E. A., Korablev, N. A., Solov'ev, E. N., Shamov, V. P., Fedorov, V. L., and Litvinov, A. M.: 14C emission from RBMK-1500 reactors and features determining it, Atom. Energy, 66, 77–79, https://doi.org/10.1007/BF01121081, 1989.
Kunz, C.: Carbon-14 Discharge at Three Light-water Reactors, Health Phys., 49, 25–35, https://doi.org/10.1097/00004032-198507000-00002, 1985.
Kutschera, W.: Applications of accelerator mass spectrometry, Int. J. Mass Spectrom., 349–350, 203–218, https://doi.org/10.1016/j.ijms.2013.05.023, 2013.
Laemmel, T. and Szidat, S.: Compilation of annual nuclear electricity production per reactor from 1954 to 2023, Zenodo, https://doi.org/10.5281/zenodo.14535156, 2025.
Laemmel, T., Knaack, T., Heckel, A., Wenger, A., and Szidat, S.: Compilation of nuclear industry's gaseous radiocarbon emissions from 1950 to 2023, Zenodo, https://doi.org/10.5281/zenodo.15034662, 2025.
Laemmel, T., Geissbühler, D., Henne, S., Fujita, R., Graven, H., Espic, C., Bantle, M., Haghipour, N., Conen, F., Brunner, D., Steinbacher, M., Zazzeri, G., Hammer, S., Leuenberger, M. C., and Szidat, S.: Data: Radiocarbon in atmospheric CH4 and CO2 at Jungfraujoch in 2019–2024: influence of regional nuclear emissions and current global atmospheric 14CH4 signal, Zenodo [data set], https://doi.org/10.5281/zenodo.18518087, 2026.
Lan, X., Thoning, K., and Dlugokencky, E.: Trends in globally-averaged CH4, N2O, and SF6 determined from NOAA Global Monitoring Laboratory measurements, Version 2025-08 (2025-08), NOAA, https://doi.org/10.15138/P8XG-AA10, 2025a.
Lan, X., Tans, P., and Thoning, K.: Trends in globally-averaged CO2 determined from NOAA Global Monitoring Laboratory measurements, Version 2025-08 (2025-08), NOAA, https://doi.org/10.15138/9N0H-ZH07, 2025b.
Lassey, K. R., Etheridge, D. M., Lowe, D. C., Smith, A. M., and Ferretti, D. F.: Centennial evolution of the atmospheric methane budget: what do the carbon isotopes tell us?, Atmos. Chem. Phys., 7, 2119–2139, https://doi.org/10.5194/acp-7-2119-2007, 2007a.
Lassey, K. R., Lowe, D. C., and Smith, A. M.: The atmospheric cycling of radiomethane and the ”fossil fraction” of the methane source, Atmos. Chem. Phys., 7, 2141–2149, https://doi.org/10.5194/acp-7-2141-2007, 2007b.
Leuenberger, M. and Flückiger, E.: Research at Jungfraujoch, Sci. Total Environ., 391, 169–176, https://doi.org/10.1016/j.scitotenv.2007.10.044, 2008.
Levin, I. and Kromer, B.: The Tropospheric 14CO2 Level in Mid-Latitudes of the Northern Hemisphere (1959–2003), Radiocarbon, 46, 1261–1272, https://doi.org/10.1017/S0033822200033130, 2004.
Levin, I., Kromer, B., Schoch-Fischer, H., Bruns, M., Münnich, M., Berdau, D., Vogel, J. C., and Münnich, K. O.: 25 Years of Tropospheric 14C Observations in Central Europe, Radiocarbon, 27, 1–19, https://doi.org/10.1017/S0033822200006895, 1985.
Levin, I., Bösinger, R., Bonani, G., Francey, R. J., Kromer, B., Münnich, K. O., Suter, M., Trivett, N. B. A., and Wölfli, W.: Radiocarbon in Atmospheric Carbon Dioxide and Methane: Global Distribution and Trends, in: Radiocarbon After Four Decades, edited by: Taylor, R. E., Long, A., and Kra, R. S., Springer New York, New York, NY, 503–518, https://doi.org/10.1007/978-1-4757-4249-7_31, 1992.
Levin, I., Kromer, B., Schmidt, M., and Sartorius, H.: A novel approach for independent budgeting of fossil fuel CO2 over Europe by 14CO2 observations, Geophys. Res. Lett., 30, 2003GL018477, https://doi.org/10.1029/2003GL018477, 2003.
Levin, I., Kromer, B., and Hammer, S.: Atmospheric Δ14CO2 trend in Western European background air from 2000 to 2012, Tellus B, 65, 20092, https://doi.org/10.3402/tellusb.v65i0.20092, 2013.
Levin, I., Preunkert, S., Graven, H., Lewis, C., Miller, J. B., Turnbull, J. C., Xu, X., and Hammer, S.: Database of existing 14CO2 measurements – CO2MVS Research on Supplementary Observations (CORSO), European Union, https://www.corso-project.eu/sites/default/files/2023-10/CORSO-D3.1-V1.0.pdf (last access: 19 August 2026), 2023.
Lowe, D. C., Brenninkmeijer, C. A. M., Manning, M. R., Sparks, R., and Wallace, G.: Radiocarbon determination of atmospheric methane at Baring Head, New Zealand, Nature, 332, 522–525, https://doi.org/10.1038/332522a0, 1988.
MacFarling Meure, C., Etheridge, D., Trudinger, C., Steele, P., Langenfelds, R., Van Ommen, T., Smith, A., and Elkins, J.: Law Dome CO2, CH4 and N2O ice core records extended to 2000 years BP, Geophys. Res. Lett., 33, 2006GL026152, https://doi.org/10.1029/2006GL026152, 2006.
Manning, M. R., Lowe, D. C., Melhuish, W. H., Sparks, R. J., Wallace, G., Brenninkmeijer, C. A. M., and McGill, R. C.: The Use of Radiocarbon Measurements in Atmospheric Studies, Radiocarbon, 32, 37–58, https://doi.org/10.1017/S0033822200039941, 1990.
Milton, G. M., Kramer, S. J., Brown, R. M., Repta, C. J. W., King, K. J., and Rao, R. R.: Radiocarbon Dispersion around Canadian Nuclear Facilities, Radiocarbon, 37, 485–496, https://doi.org/10.1017/S0033822200030964, 1995.
Nazarov, E. I., Kruzhalov, A. V., Vasyanovich, M. E., Ekidin, A. A., Pyshkina, M. D., Kukarskikh, V. V., and Parkhomchuk, E. V.: 14C in tree rings in the vicinity of the RBMK reactor nuclear power plant, Radiocarbon, 65, 1343–1350, https://doi.org/10.1017/RDC.2023.125, 2023.
Němec, M., Wacker, L., and Gäggeler, H.: Optimization of the Graphitization Process at Age-1, Radiocarbon, 52, 1380–1393, https://doi.org/10.1017/S0033822200046464, 2010.
Nydal, R. and Lövseth, K.: Tracing bomb 14C in the atmosphere 1962–1980, J. Geophys. Res., 88, 3621–3642, https://doi.org/10.1029/JC088iC06p03621, 1983.
Oeschger, H., Siegenthaler, U., Schotterer, U., and Gugelmann, A.: A box diffusion model to study the carbon dioxide exchange in nature, Tellus, 27, 168–192, https://doi.org/10.1111/j.2153-3490.1975.tb01671.x, 1975.
Pieber, S. M., Tuzson, B., Henne, S., Karstens, U., Gerbig, C., Koch, F.-T., Brunner, D., Steinbacher, M., and Emmenegger, L.: Analysis of regional CO2 contributions at the high Alpine observatory Jungfraujoch by means of atmospheric transport simulations and δ13C, Atmos. Chem. Phys., 22, 10721–10749, https://doi.org/10.5194/acp-22-10721-2022, 2022.
Pisso, I., Sollum, E., Grythe, H., Kristiansen, N. I., Cassiani, M., Eckhardt, S., Arnold, D., Morton, D., Thompson, R. L., Groot Zwaaftink, C. D., Evangeliou, N., Sodemann, H., Haimberger, L., Henne, S., Brunner, D., Burkhart, J. F., Fouilloux, A., Brioude, J., Philipp, A., Seibert, P., and Stohl, A.: The Lagrangian particle dispersion model FLEXPART version 10.4, Geosci. Model Dev., 12, 4955–4997, https://doi.org/10.5194/gmd-12-4955-2019, 2019.
Quay, P., Stutsman, J., Wilbur, D., Snover, A., Dlugokencky, E., and Brown, T.: The isotopic composition of atmospheric methane, Global Biogeochem. Cy., 13, 445–461, https://doi.org/10.1029/1998GB900006, 1999.
Rafter, T. A. and Fergusson, G. J.: “Atom Bomb Effect” – Recent Increase of Carbon-14 Content of the Atmosphere and Biosphere, Science, 126, 557–558, https://doi.org/10.1126/science.126.3273.557, 1957.
Roberts, M. L. and Southon, J. R.: A Preliminary Determination of the Absolute14 C/12 C Ratio of OX-I, Radiocarbon, 49, 441–445, https://doi.org/10.1017/S0033822200042363, 2007.
Ruff, M., Wacker, L., Gäggeler, H. W., Suter, M., Synal, H.-A., and Szidat, S.: A Gas Ion Source for Radiocarbon Measurements at 200 kV, Radiocarbon, 49, 307–314, https://doi.org/10.1017/S0033822200042235, 2007.
Schraff, C., Reich, H., Rhodin, A., Schomburg, A., Stephan, K., Periáñez, A., and Potthast, R.: Kilometre‐scale ensemble data assimilation for the COSMO model (KENDA), Q. J. Roy. Meteor. Soc., 142, 1453–1472, https://doi.org/10.1002/qj.2748, 2016.
Sparrow, K. J., Kessler, J. D., Southon, J. R., Garcia-Tigreros, F., Schreiner, K. M., Ruppel, C. D., Miller, J. B., Lehman, S. J., and Xu, X.: Limited contribution of ancient methane to surface waters of the U.S. Beaufort Sea shelf, Sci. Adv., 4, eaao4842, https://doi.org/10.1126/sciadv.aao4842, 2018.
Stenström, K., Erlandsson, B., Hellborg, R., Wiebert, A., and Skog, G.: 14CO2 and total airborne 14C releases from a PWR and a BWR at Ringhals nuclear power plant measured with accelerator mass spectrometry, Report for project SSI P781.93, Lund, Sweden, 8 pp., https://inis.iaea.org/records/g8vhw-5c986/files/27022036.pdf (last access: 19 August 2026), 1995a.
Stenström, K., Erlandsson, B., Hellborg, R., Wiebert, A., Skog, S., Vesanen, R., Alpsten, M., and Bjurman, B.: A one-year study of the total air-borne 14C effluents from two Swedish light-water reactors, one boiling water- and one pressurized water reactor, J. Radioanal. Nucl. Ch. Ar., 198, 203–213, https://doi.org/10.1007/BF02038258, 1995b.
Stuiver, M. and Polach, H. A.: Discussion Reporting of 14C Data, Radiocarbon, 19, 355–363, https://doi.org/10.1017/S0033822200003672, 1977.
Synal, H.-A., Stocker, M., and Suter, M.: MICADAS: A new compact radiocarbon AMS system, Nucl. Instrum. Meth. B, 259, 7–13, https://doi.org/10.1016/j.nimb.2007.01.138, 2007.
Szidat, S.: 14C Research at the Laboratory for the Analysis of Radiocarbon with AMS (LARA), University of Bern, Chimia, 74, 1010, https://doi.org/10.2533/chimia.2020.1010, 2020.
Townsend-Small, A., Tyler, S. C., Pataki, D. E., Xu, X., and Christensen, L. E.: Isotopic measurements of atmospheric methane in Los Angeles, California, USA: Influence of “fugitive” fossil fuel emissions, J. Geophys. Res.-Atmos., 117, https://doi.org/10.1029/2011JD016826, 2012.
Turnbull, J. C., Lehman, S. J., Miller, J. B., Sparks, R. J., Southon, J. R., and Tans, P. P.: A new high precision 14CO2 time series for North American continental air, J. Geophys. Res., 112, 2006JD008184, https://doi.org/10.1029/2006JD008184, 2007.
Vance, J. N., Cline, J. E., and Robertson, D. E.: Characterization of Carbon-14 generated by the Nuclear Power industry, EPRI, Electric Power Research Institute, Palo Alto, California, Final Report EPRI TR-105715, Project 2724-04, 1995.
Wacker, L., Christl, M., and Synal, H.-A.: Bats: A new tool for AMS data reduction, Nucl. Instrum. Meth. B, 268, 976–979, https://doi.org/10.1016/j.nimb.2009.10.078, 2010.
Wacker, L., Fahrni, S. M., Hajdas, I., Molnar, M., Synal, H.-A., Szidat, S., and Zhang, Y. L.: A versatile gas interface for routine radiocarbon analysis with a gas ion source, Nucl. Instrum. Meth. B, 294, 315–319, https://doi.org/10.1016/j.nimb.2012.02.009, 2013.
Wahlen, M., Tanaka, N., Henry, R., Deck, B., Zeglen, J., Vogel, J. S., Southon, J., Shemesh, A., Fairbanks, R., and Broecker, W.: Carbon-14 in Methane Sources and in Atmospheric Methane: The Contribution from Fossil Carbon, Science, 245, 286–290, https://doi.org/10.1126/science.245.4915.286, 1989.
WMO: The State of Greenhouse Gases in the Atmosphere Based on Global Observations through 2024, WMO, Geneva, https://library.wmo.int/viewer/69654/download?file=GHG-21_en.pdf&type=pdf&navigator=1 (last access: 19 August 2026), 2025.
Yver-Kwok, C., Philippon, C., Bergamaschi, P., Biermann, T., Calzolari, F., Chen, H., Conil, S., Cristofanelli, P., Delmotte, M., Hatakka, J., Heliasz, M., Hermansen, O., Komínková, K., Kubistin, D., Kumps, N., Laurent, O., Laurila, T., Lehner, I., Levula, J., Lindauer, M., Lopez, M., Mammarella, I., Manca, G., Marklund, P., Metzger, J.-M., Mölder, M., Platt, S. M., Ramonet, M., Rivier, L., Scheeren, B., Sha, M. K., Smith, P., Steinbacher, M., Vítková, G., and Wyss, S.: Evaluation and optimization of ICOS atmosphere station data as part of the labeling process, Atmos. Meas. Tech., 14, 89–116, https://doi.org/10.5194/amt-14-89-2021, 2021.
Zazzeri, G., Yeomans, E. A., and Graven, H. D.: Global and Regional Emissions of Radiocarbon from Nuclear Power Plants from 1972 to 2016, Radiocarbon, 60, 1067–1081, https://doi.org/10.1017/RDC.2018.42, 2018.
Zazzeri, G., Xu, X., and Graven, H.: Efficient Sampling of Atmospheric Methane for Radiocarbon Analysis and Quantification of Fossil Methane, Environ. Sci. Technol., 55, 8535–8541, https://doi.org/10.1021/acs.est.0c03300, 2021.
Zazzeri, G., Graven, H., Xu, X., Saboya, E., Blyth, L., Manning, A. J., Chawner, H., Wu, D., and Hammer, S.: Radiocarbon Measurements Reveal Underestimated Fossil CH4 and CO2 Emissions in London, Geophys. Res. Lett., 50, e2023GL103834, https://doi.org/10.1029/2023GL103834, 2023.
Zazzeri, G., Wacker, L., Haghipour, N., Gautschi, P., Laemmel, T., Szidat, S., and Graven, H.: A new portable sampler of atmospheric methane for radiocarbon measurements, Atmos. Meas. Tech., 18, 319–325, https://doi.org/10.5194/amt-18-319-2025, 2025.