
the Creative Commons Attribution 4.0 License.
the Creative Commons Attribution 4.0 License.
 | 20 Aug 2026
New insights into traffic emissions: the role of hydrocarbons and oxygenated organic species in traffic-derived aerosol
Sanna Saarikoski
Minna Aurela
Jarkko V. Niemi
Luis M. F. Barreira
Jussi Hoivala
Hanna Manninen
Topi Rönkkö
Hilkka Timonen
A substantial fraction of submicron particles originates from vehicle emissions in urban environments. This study investigated the chemical characteristics and sources of submicron organic aerosol (OA) at a traffic site in Helsinki, Finland, using four datasets collected in 2018–2024. Measurements were conducted using an Aerodyne Aerosol Mass Spectrometer, and source apportionment was performed using Positive Matrix Factorization.
The results showed that vehicular traffic contributed to several types of OA. Hydrocarbon-like OA (HOA) typically peaked during morning traffic, whereas more oxygenated OA, referred to here as traffic-related OA (TrOA), also peaked in the morning but remained elevated for a longer duration. The mass spectra of TrOA resembled those of HOA and biomass burning OA, however, TrOA had distinct fractions of (at 60), (at 61) and (at 73) in OA. The exact origin of TrOA remains uncertain, however, delayed morning peaks suggest that TrOA is processed in the atmosphere or emitted from modern vehicles, which typically operate later than heavy-duty vehicles. Semi-volatile OOA also appeared to be partially traffic-related, although due to its secondary nature, it was not directly linked to daily traffic patterns.
This study highlights that traffic-associated OA encompasses both hydrocarbons and oxygenated POA and SOA. Relying solely on HOA to estimate traffic POA can result in a 50 % underestimation, as HOA and TrOA often have similar magnitudes. The characteristics of OA linked to vehicular emissions are likely to evolve in future as the vehicle fleet changes.
- Article
(3106 KB) - Full-text XML
-
Supplement
(2424 KB) - BibTeX
- EndNote


A large portion of submicron particulate matter (PM) consists of organic aerosol (OA) that is a complex mixture of numerous organic compounds with diverse chemical and physical properties (Zhang et al., 2007; Daellenbach et al., 2019; Barreira et al., 2021). OA emitted directly from sources without undergoing atmospheric transformation is classified as primary OA (POA). Additionally, certain organic species may be released in the gas phase but rapidly condense onto primary particles or nucleate upon cooling of the exhaust, without significant chemical alteration (Rönkkö et al., 2017). These compounds, together with POA, are commonly referred to as fresh OA. In contrast, secondary OA (SOA) is formed in the atmosphere through the oxidation of gaseous precursors over timescales ranging from hours to days. OA plays a critical role in influencing air quality and climate systems (Kanakidou et al., 2005; Hallquist et al., 2009; An et al., 2019; Sokhi et al., 2022). However, the chemical complexity of OA, along with its internal and external mixing with inorganic species and redox-active trace metals, presents significant challenges in source apportionment, and in understanding its atmospheric transformation and removal processes.
POA, fresh OA, and SOA all originate from anthropogenic and biogenic sources. In urban environments, the primary anthropogenic sources of OA typically include traffic emissions, residential wood burning, industrial activities, cooking, and site-specific sources, such as coffee roastery, coal and solid fuel combustion, cigarette smoke, and the ship industry (Crippa et al., 2014; Carbone et al., 2014; Chen et al., 2022). Biogenic SOA can also constitute a significant portion of total OA during the warm season, driven by increased biogenic emissions due to higher ambient temperatures and sunlight (Ding et al., 2014; Zhang et al., 2018; Daellenbach et al., 2019; Cao et al., 2022). In contrast, POA has been shown to contribute more substantially to OA during the cold season, when combustion-related emissions are usually higher (Budisulistiorini et al., 2016).
In traffic environments, POA typically consists of hydrocarbons originating from fuel combustion, as well as from the leakage of lubricant oil and fuel. Identifying traffic-related SOA is more challenging because the distinct mass spectral features of POA evolve into more generalized SOA spectra during atmospheric aging (Jimenez et al., 2009). Zhu et al. (2021) employed mass spectral similarity analysis and positive matrix factorization (PMF) to construct representative mass spectra of vehicular POA and SOA. These spectra were then used as source constraints in a multilinear engine (ME-2) model to apportion atmospheric OA sources. Using this approach, they attributed 10.5 % of OA to vehicle-related low-oxygenated SOA during winter in Shanghai.
Variations in VOCs emitted by diesel and gasoline vehicles can lead to differences in the chemical properties and formation potential of SOA (Wang et al., 2020). Diesel emissions, in particular, have been identified as a significant contributor to traffic-related SOA. Based on the VOC and intermediate-VOC (iVOC) composition of vehicle exhaust, Gentner et al. (2012) estimated that diesel exhaust is approximately seven times more efficient at forming SOA than gasoline exhaust. Fan et al. (2024) attributed 31 % of total SOA to diesel emissions in Jinan, China, while Gentner et al. (2012) suggested that diesel fuel account for 65 %–90 % of vehicular-derived SOA, depending on regional fuel usage patterns.
SOA formation from traffic emissions has also been investigated in several laboratory studies, which have measured the SOA formation potential from individual vehicles or engines under controlled conditions. The production of SOA is influenced by both vehicle operating conditions and the oxidative environment. For instance, elevated SOA formation has been observed following cold starts (Karjalainen et al., 2016; Simonen et al., 2019; Pieber et al., 2018). However, it has also been shown that oxidation conditions have a greater impact on SOA mass spectra than engine operating conditions (Zhu et al., 2021). In terms of atmospheric oxidative capacity and chemical composition, modelling studies have predicted that reductions in NOx emissions could potentially undermine the effectiveness of stricter gasoline vehicle emissions standards in lowering SOA concentrations in urban areas, such as Los Angeles (Zhao et al., 2017).
Advancements in engine technology and exhaust after-treatment systems have significantly reduced the emissions of POA and SOA precursors from vehicles. Studies have shown that both POA emissions and SOA production factors decrease with stricter emission standards, highlighting the impact of fleet modernization (Zhang et al., 2023a). Notably, the reduction in POA emissions has surpassed that of SOA, emphasizing the importance of controlling organic precursor gases in future cars. For example, gasoline vehicles equipped with a gasoline particulate filter (GPF) emit over 90 % less POA and approximately 80 % less aged OA than similar vehicles without a GPF (Saarikoski et al., 2024). However, the same study also observed substantial variability in POA and SOA emissions among vehicles compliant with the same emission standard (Euro 6d), indicating that vehicle-specific factors still played a role. In the case of diesel vehicles, the use of a diesel oxidation catalyst (DOC) and diesel particulate filter (DPF) has been shown to effectively reduce SOA formation (Chirico et al., 2010; Novakovic et al., 2023; Ghadimi et al., 2023). Moreover, engine and exhaust after-treatment technologies influence the chemical composition of OA. For example, Pirjola et al. (2016) found that OA emitted from diesel-electric hybrid buses equipped with selective catalytic reduction systems exhibited a higher oxygen-to-carbon (O:C) ratio compared to OA from older EURO III and EURO IV diesel buses, which lacked exhaust after-treatment or used only exhaust gas recirculation and DPF systems. OA from these older buses consisted almost entirely of hydrocarbons.
In addition to engine and exhaust after-treatment technologies, fuel composition significantly influences POA and SOA emissions. Aromatic-free gasoline fuel (alkylate) has been shown to reduce POA emissions by approximately 65 % compared to conventional gasoline, although this reduction was primarily observed under cold driving conditions. The mass spectra of POA remained relatively similar between the two fuels (Saarikoski et al., 2024). Replacing gasoline with ethanol also led to a ∼ 35 % reduction in POA emissions and resulted in slightly more oxygenated POA (Timonen et al., 2017). Both alkylate and ethanol fuels had a more pronounced effect on SOA formation potential, reducing SOA by more than 95 % (Timonen et al., 2017; Saarikoski et al., 2024). Regarding diesel fuels, hydrotreated vegetable oil (HVO) diesel has been reported to produce less SOA than conventional petroleum diesel (Karjalainen et al., 2019; Gren et al., 2021). Compressed natural gas (CNG) vehicles typically emit low levels of POA, although the particle size of the exhaust is smaller compared to gasoline and diesel vehicles (Alanen et al., 2015). POA from CNG exhaust is predominantly composed of hydrocarbons (Pirjola et al., 2016; Saarikoski et al., 2024). Despite low POA emissions, CNG vehicles can exhibit remarkable SOA formation, compared to diesel vehicles (Saarikoski et al., 2024; Ghadimi et al., 2023). The source of SOA in CNG exhaust has been attributed primarily to lubricating oil emissions (Ghadimi et al., 2023).
Laboratory measurements may not fully capture real-world POA emissions and SOA formation potential. Simonen et al. (2019) demonstrated that particle number emissions during real-world driving were significantly higher than those measured using a dynamometer. Similarly, Zhang et al. (2024) reported that the SOA formation potential was greater under real-world driving conditions, likely due to high-emission events and differences in the profiles of organic gases compared with those observed in laboratory settings. Driving dynamics, such as high-speed operation, rapid acceleration, and deceleration, have been shown to enhance SOA production. These conditions lead to increased emissions of organic gases from unburned fuel or incomplete combustion, contributing to elevated SOA formation (Zhang et al., 2023a).
Although exhaust emissions are typically the dominant source of traffic-related SOA and POA in submicron particles, their impact is diminishing owing to the modernization of vehicle fleets and the implementation of stricter emission standards. Consequently, non-exhaust emissions, such as those from tire and brake wear, and road dust, are becoming increasingly significant contributors to urban PM (Harrison et al., 2021). In terms of organic content, brake and road dust are primarily composed of elements, whereas tires are largely made of natural rubber, butadiene, and styrene-butadiene rubber (Zhang et al., 2023b), which can contribute to OA in urban air. Tire wear particles are typically found at both submicron and supermicron particle sizes, with size distribution peaks typically observed around 20–200 µm and at 2–10 µm (Giechaskiel et al., 2024). However, the overall contribution of tire-wear particles to PM2.5 or PM10 is generally rather small, estimated to be less than 5 % (Giechaskiel et al., 2024; Martinmäki et al., 2025; Oh et al., 2025).
The aim of this study is to investigate the sources and chemical characteristics of OA in a traffic-influenced urban environment in Helsinki, Finland. Measurements were conducted during four one-month measurement campaigns between 2018 and 2024. OA was measured using an Aerodyne Soot Particle Aerosol Mass Spectrometer (SP-AMS, hereafter referred to as AMS), and its chemically distinct or process-related components were identified using PMF. This study focuses especially on OA types associated with traffic emissions and discusses the challenges in distinguishing them from other OA sources in traffic environments. The findings contribute to a better understanding of urban OA composition and variability and provide valuable insights to air quality authorities and policymakers seeking effective strategies to mitigate the adverse health and environmental impacts of urban particulate matter.
2.1 Measurement site
Measurements were performed at the Helsinki Supersite, an air quality monitoring station operated by the Helsinki Region Environmental Services Authority (HSY). The station was situated at the kerbside of Mäkelänkatu, a major urban street comprising six lanes for motorized traffic, two tram lanes, two rows of trees, and two sidewalks, with a total width of 42 m (Hietikko et al., 2018). Continuous rows of buildings on both sides of the street provide the characteristic of a street canyon. Mäkelänkatu is one of the busiest traffic sites in the Helsinki city center.
Traffic volume was recorded approximately 500 m north of the measurement site on the same street, with daily vehicle count of 30 000–35 000 during the campaigns before the COVID-19 pandemic and 25 000–27 000 during the campaigns after the pandemic (Fig. S1 in the Supplement, statistics from the City of Helsinki). However, the actual number of vehicles passing the measurement site may be up to ∼ 40 % lower than the recorded traffic volume because of the substantial number of vehicles turning onto side streets before reaching the measurement site (Teinilä et al., 2025). The proportion of heavy-duty vehicles was estimated to be approximately 10 %–12 % (Barreira et al., 2021; Teinilä et al., 2025).
Vehicular traffic is a major source of air pollutants at the Helsinki Supersite (Rönkkö et al., 2017; Teinilä et al., 2025). Additionally, a coffee roastery located ∼ 600 m south of the site may occasionally impact OA concentrations (Saarikoski et al., 2023). Local biomass combustion is minimal in the area, which is predominantly composed of apartment and industrial buildings. A significant fraction of OA is also transported to Helsinki from other regions. While long-range transported (LRT) emissions typically consist mainly of inorganic species (Barreira et al., 2021), LRT particles originating from biomass burning can contain substantial fractions of OA (Teinilä et al., 2022; Teinilä et al., 2025).

Four intensive campaigns were conducted at the Supersite (Table 1); two in spring (2018 and 2024), one in late summer to early autumn (2019), and one in winter (2022). Although two campaigns were classified as spring campaigns, the meteorological conditions differed substantially between them. The Spring 2018 campaign was conducted later in the season than the Spring 2024 campaign, and consequently, air temperature was considerably higher during the 2018 campaign. Each campaign lasted for 4–6 weeks. Data from the 2019 campaign have been published by Saarikoski et al. (2023), and the results from the 2022 campaign have been presented by Barreira et al. (2024) and Teinilä et al. (2025). Different from previous publications, the aim of this study was to provide a comprehensive overview of traffic emissions rather than focusing on isolated campaigns. The average chemical composition of PM1 particles (OA, sulfate, nitrate, ammonium, black carbon (BC)), as well as the average temperature and relative humidity, are listed in Table S1 in the Supplement.
2.2 Aerosol Mass Spectrometer
Measurements were conducted using a soot particle aerosol mass spectrometer (SP-AMS; Onasch et al., 2012, Aerodyne Research Inc., Billerica, US). The SP-AMS operated with a typical time resolution of 0.5–2 min, alternating between two modes: mass spectra mode for measuring mass concentrations and particle–time-of-flight (PToF) mode for determining mass size distributions. A default collection efficiency (CE) of 0.5 was applied along with default relative ionization efficiencies (RIEs) for organics, nitrate, sulfate, and ammonium. Both laser and tungsten (thermal) vaporizers were employed in all campaigns, and both vaporizers were on all the time. The vaporizer configuration substantially influences the results obtained with the AMS. In terms of measured concentrations, the use of a laser vaporizer generally yields higher OA mass loadings than a thermal vaporizer (Wang et al., 2020). This is primarily because the laser vaporizer typically exhibits a higher CE, owing to reduced particle bounce compared with the thermal vaporizer (Onasch et al., 2012). In addition, RIEs depend on the vaporizer setup, for example, coatings on BC particles can enhance the RIE of organics when using a laser vaporizer (Willis et al., 2014). The vaporizer type also affects organic mass spectra. Organic species undergo less fragmentation in the laser vaporizer than in the thermal vaporizer, and the use of a laser vaporizer alters the derived elemental ratios of OA, typically resulting in higher hydrogen-to-carbon (H:C) and lower O:C ratios compared with those measured using a thermal vaporizer (Ma et al., 2021).
2.3 Data analysis
PMF analysis was performed using CU AMS PMF tool v2.08D (Ulbrich et al., 2009) for Spring 2018, Summer–Autumn 2019, and Spring 2024 datasets. The Winter 2022 dataset was analyzed using the SoFi Pro software package (version 8.4.0; Canonaco et al., 2013) that employs the multilinear engine (ME-2) as the PMF solver. PMF results for the Summer–Autumn 2019 and Winter 2022 campaigns have been previously published (Saarikoski et al., 2023; Barreira et a., 2024; Teinilä et al., 2025) and therefore are not discussed in detail here. The results from the PMF analysis for the Spring 2018 and Spring 2024 campaigns are presented in the supplementary material, as they have not been published previously.
PMF analysis was conducted separately for each dataset, resulting in differences in the number and mass spectra of the resolved factors. Nevertheless, the common factors identified across all campaigns included hydrocarbon-like OA (HOA), traffic-related OA (TrOA), semi-volatile oxygenated OA (SV-OOA), and low-volatility oxygenated OA (LV-OOA). Additional factors were identified in specific datasets: biomass burning OA (BBOA) and LV-OOA with biomass burning (LV-OOA w/BB) in Winter 2022, coffee roastery OA (CoOA) and LV-OOA-LRT factors in Summer 2019. The Spring 2024 dataset also included an unidentified factor, referred to as “unknown factor”.
It is important to note that the TrOA factor has been labelled differently in previous studies. In Saarikoski et al. (2023), it was referred to as HOA-2 due to its hydrocarbon-rich profile, whereas in Barreira et al. (2024) and Teinilä et al. (2025), it was named TrOOA based on the presence of oxygenated ions in its mass spectrum. In this study, the term TrOA was adopted, as its oxidation state more closely resembles that of POA factors, such as BBOA and CoOA, rather than oxygenated aerosol types, SV-OOA and LV-OOA (oxidation states are discussed later). The term HOA-2 (or oxygenated HOA) was not used, as the origin of TrOA and HOA appears to differ. Mass spectra of all PMF factors are shown in Figs. S2–S5.
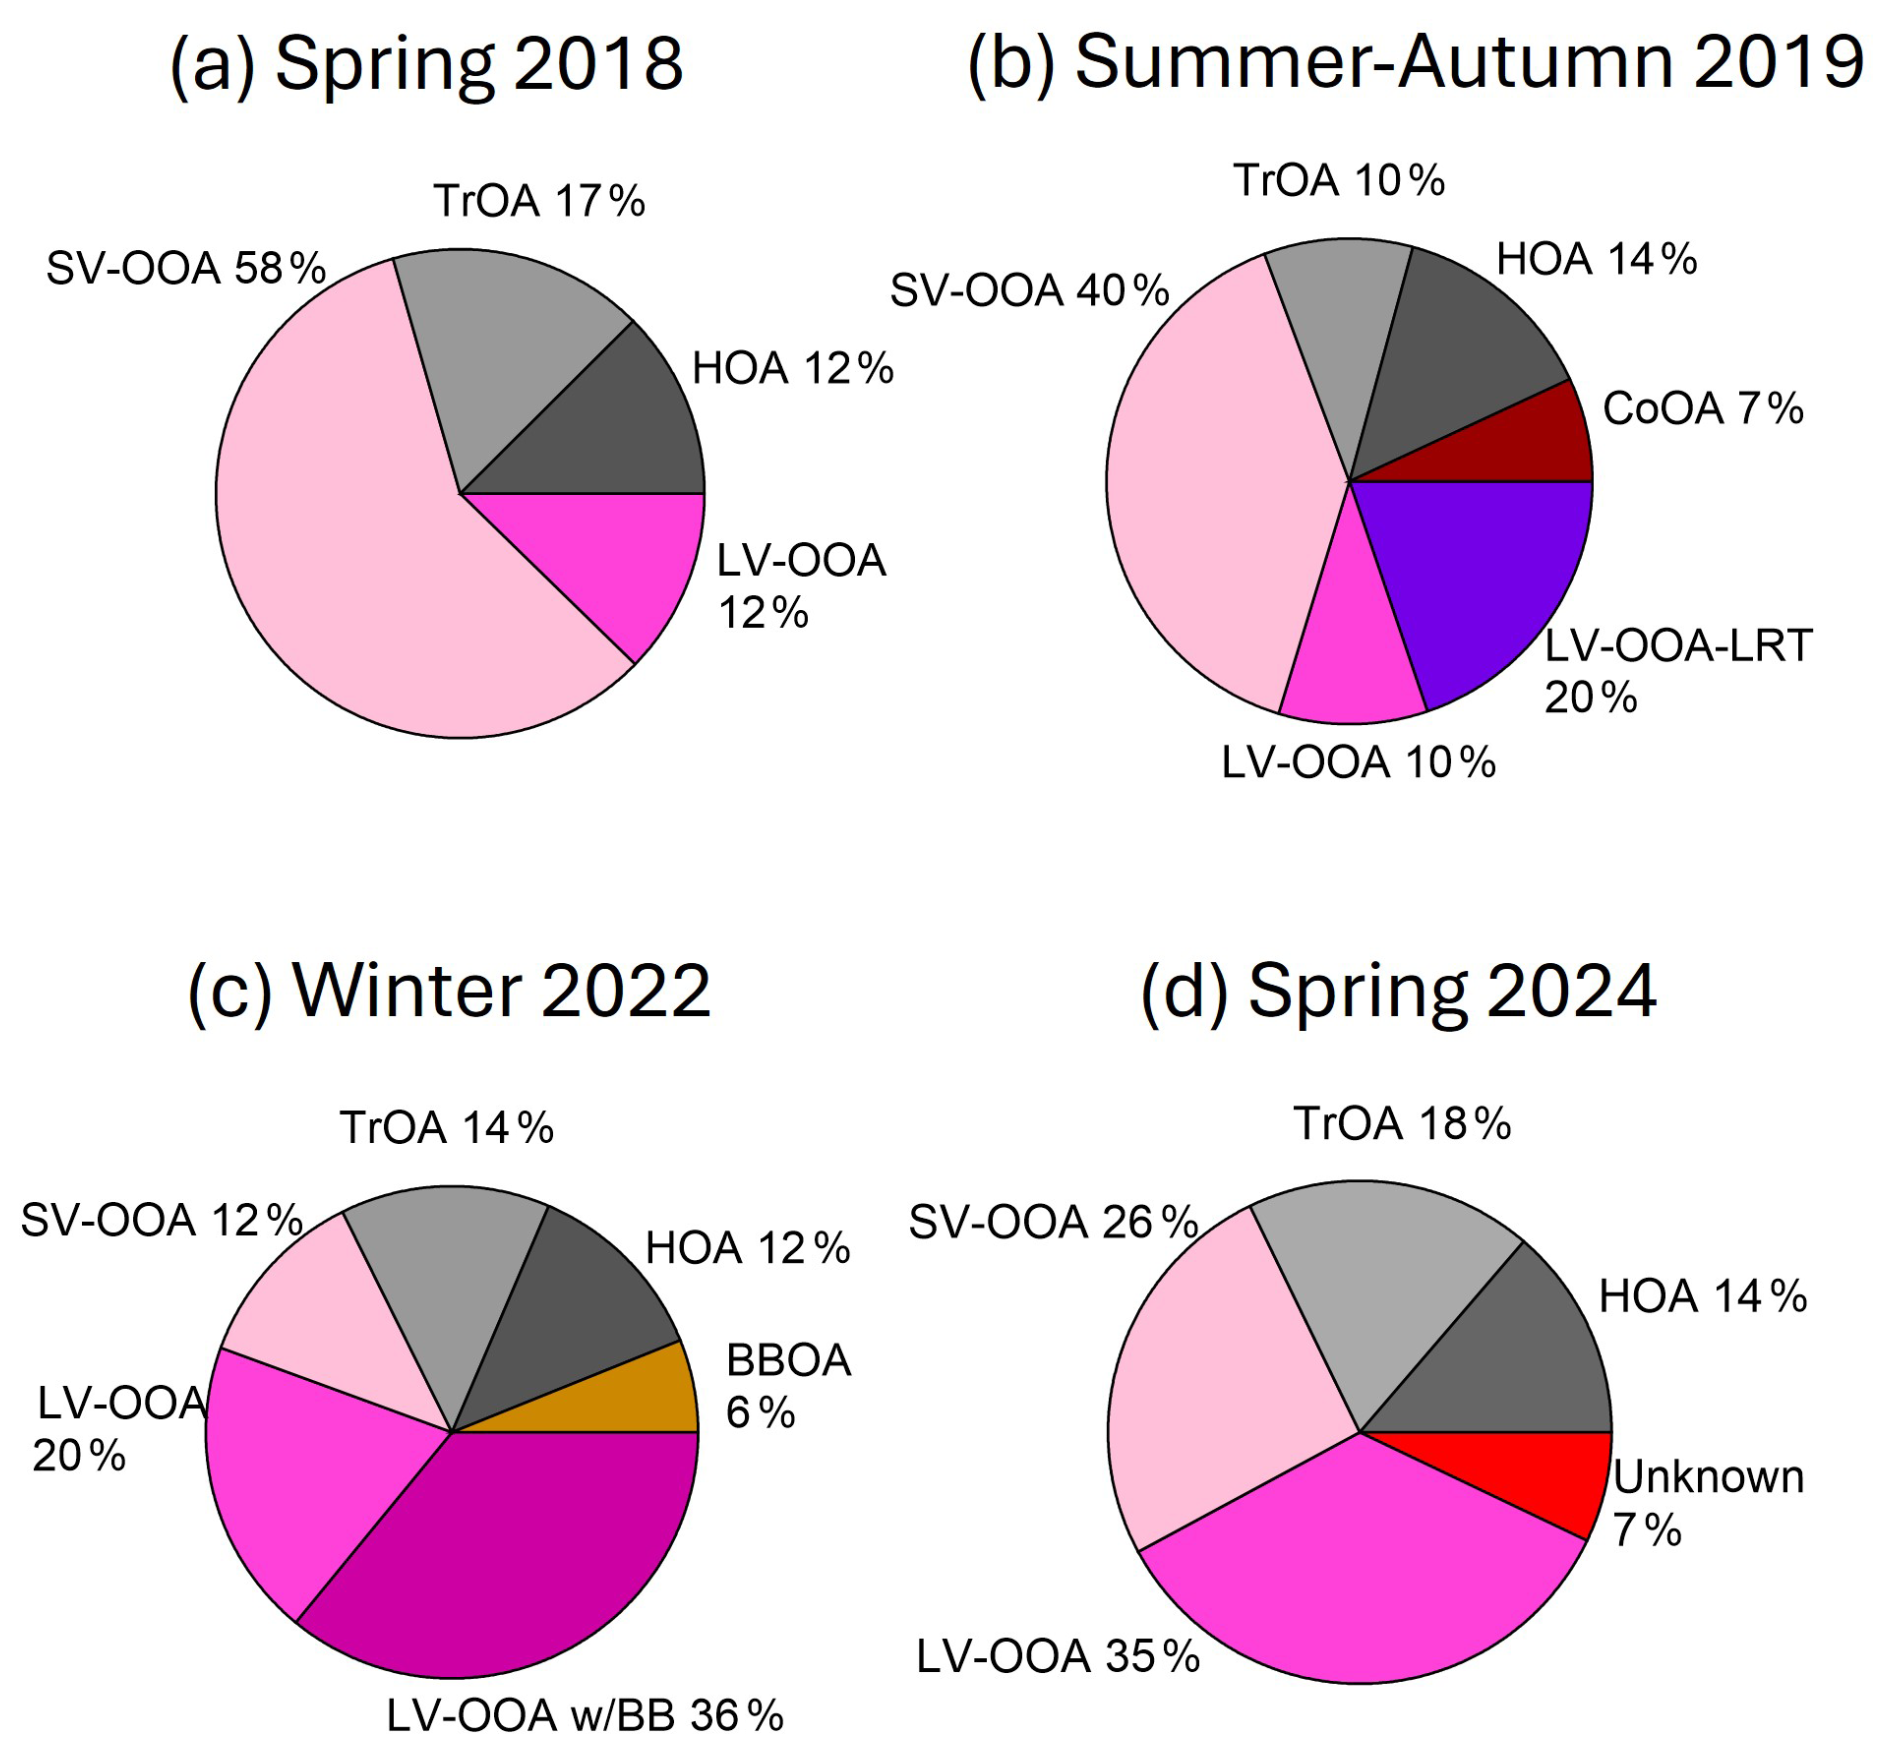
Figure 1The composition of OA during Spring 2018 (a), Summer–Autumn 2019 (b), Winter 2022 (c) and Spring 2024 (d) campaigns.
3.1 Characteristics of OA in traffic environment
Organic aerosol was composed of four to six distinct OA types depending on the campaign (Fig. 1). Primary OA factors, including HOA, TrOA, BBOA and CoOA, contributed 25 %–32 % to total OA. Secondary OA factors, SV-OOA, LV-OOA, LV-OOA-LRT and LV-OOA w/BB, accounted for 61 %–70 % of OA based on the campaign averages. Among the POA factors, TrOA and HOA were clearly linked to traffic emissions, together contributing 24 %–32 % to OA. While SV-OOA is classified as secondary OA, its characteristics suggest a partial association with traffic-related emissions. However, it is likely influenced more by regionally distributed sources and other non-local contributions than by direct local traffic. The detailed characteristics and source attribution of HOA, TrOA and SV-OOA are discussed in the following sections.
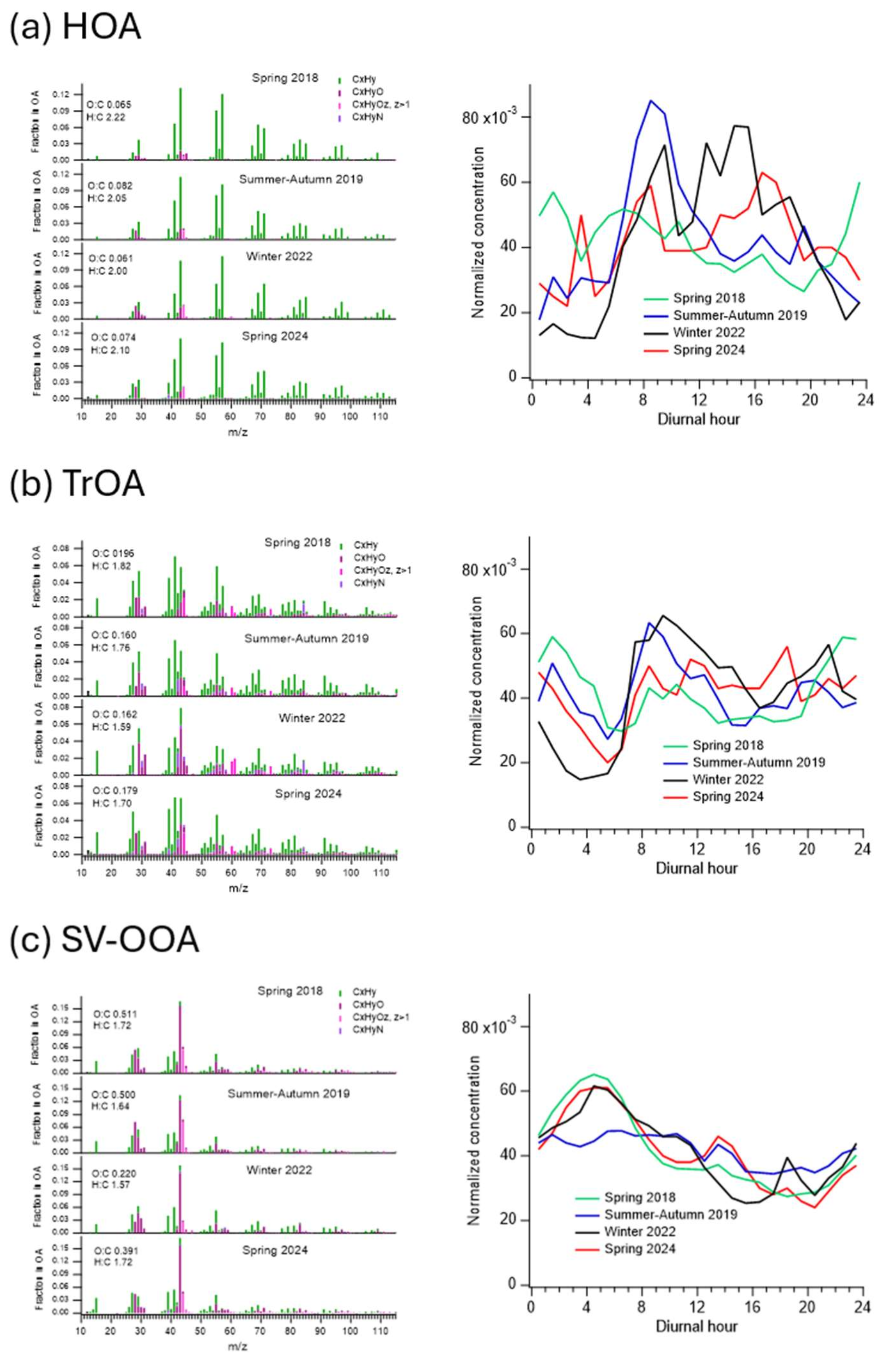
Figure 2Mass spectra and average diurnal patterns of HOA (a), TrOA (b), and SV-OOA (c) from four campaigns. Concentrations in diurnal patterns were normalized to cumulative concentrations over the whole day.
3.1.1 HOA
HOA contributed to 12 %–14 % of total OA across all campaigns (Fig. 1). The mass spectra of HOA were dominated by hydrocarbon ions with prominent signals for (at 41), (at 43), (at 55), (at 57), (at 69) and (at 71) (Fig. 2a), consistent with previous studies (e.g. Ma et al., 2025). The elemental composition of HOA exhibited a low O:C ratio and high H:C ratio. While O:C ratio remained fairly consistent across the campaigns, variations in the H:C ratio were observed (Table S2, Fig. 3), indicating some differences in the hydrocarbon profiles between the campaigns.
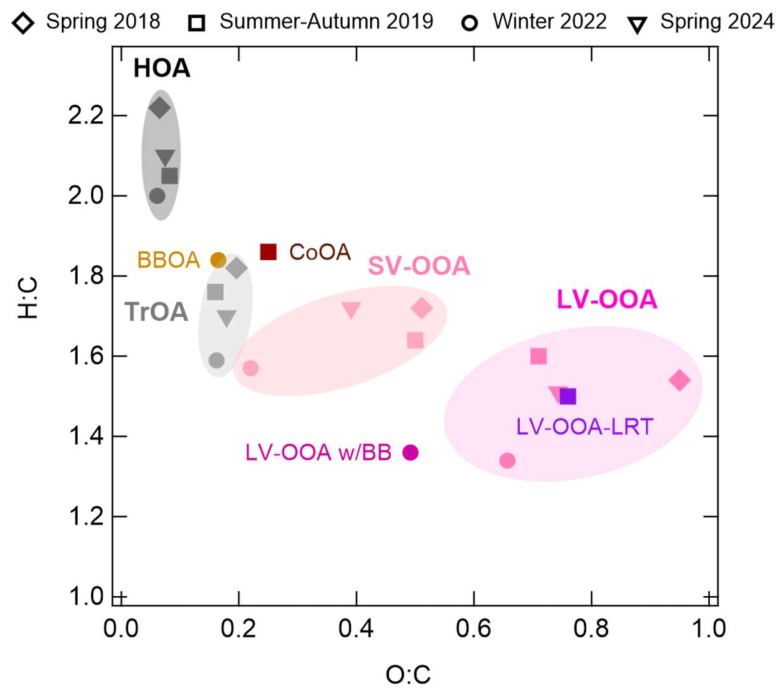
Figure 3Elemental composition (O:C vs. H:C) of PMF factors in four campaigns. Campaigns are denoted by different marker shapes.
HOA concentrations peaked during the morning rush hour (07:00–09:00 LT) in all campaigns, except in Spring 2018 (Fig. 2a), when concentrations remained relatively stable throughout the day. Elevated concentrations were observed during the afternoon/evening rush hour only in Winter 2022 and Spring 2024, with the peak occurring approximately two hours later in Spring 2024 than in Winter 2022. The presence and timing of the afternoon/evening peak are typically influenced by boundary layer dynamics and are more pronounced in winter than in spring and autumn (Barreira et al., 2021). The absence of a distinct diurnal pattern in Spring 2018 may be attributed to occasional meteorological conditions during that campaign, characterized by strong south/southwest airflows and unusually warm temperatures. Daytime maximum temperatures reached up to 25 °C, accompanied by a marked day-to-night temperature variation. Three OA components, HOA, TrOA, and SV-OOA, had higher concentrations at night than during the day, similar to the pattern observed for nitrate, in Spring 2018.
Table 2Average weekday-to-weekend ratio for PMF factors. Only data between 07:00 and 19:00 are included.
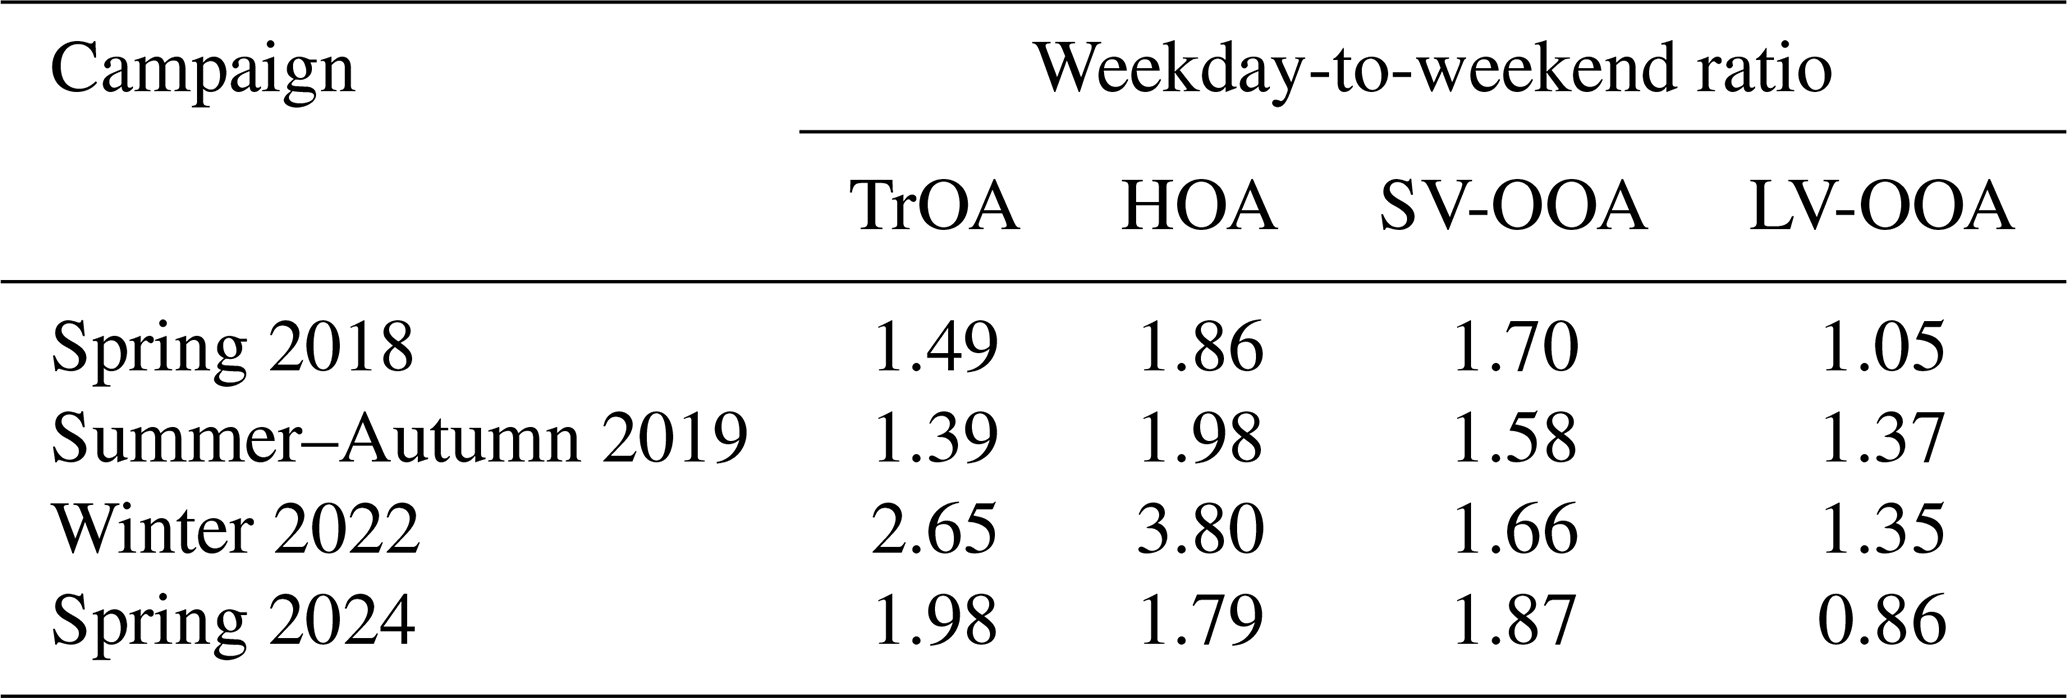
Weekday HOA concentrations were generally higher than those observed on weekends across all campaigns (Fig. S6), with the most pronounced difference occurring during Winter 2022. When calculating the weekday-to-weekend ratio for peak traffic hours (07:00–19:00,LT; Table 2), the ratio changed from 1.9 to 3.8, clearly indicating the influence of traffic on HOA levels. HOA showed moderate correlations with BC and NOx in all campaigns, except Spring 2018, with correlation coefficients (R) ranging from 0.48 to 0.78 (Table S3). In Winter 2022, these correlations strengthened significantly when the LRT pollution episodes were excluded from the dataset. The attribution of HOA to traffic emissions is consistent with findings from previous studies (Chen et al., 2022; Saarikoski et al., 2023).
3.1.2 TrOA
The contribution of TrOA to total OA ranged from 10 % in Summer–Autumn 2019 to 18 % in Spring 2024 (Fig. 1). The mass spectra of TrOA contained both hydrocarbons and oxygenated species (Fig. 2b). Prominent hydrocarbon signals were observed for (at 27), (at 39), , and . Compared to HOA, TrOA had stronger signals for hydrocarbon ions with two fewer hydrogen atoms, suggesting a higher degree of unsaturation and the presence of more double bonds.
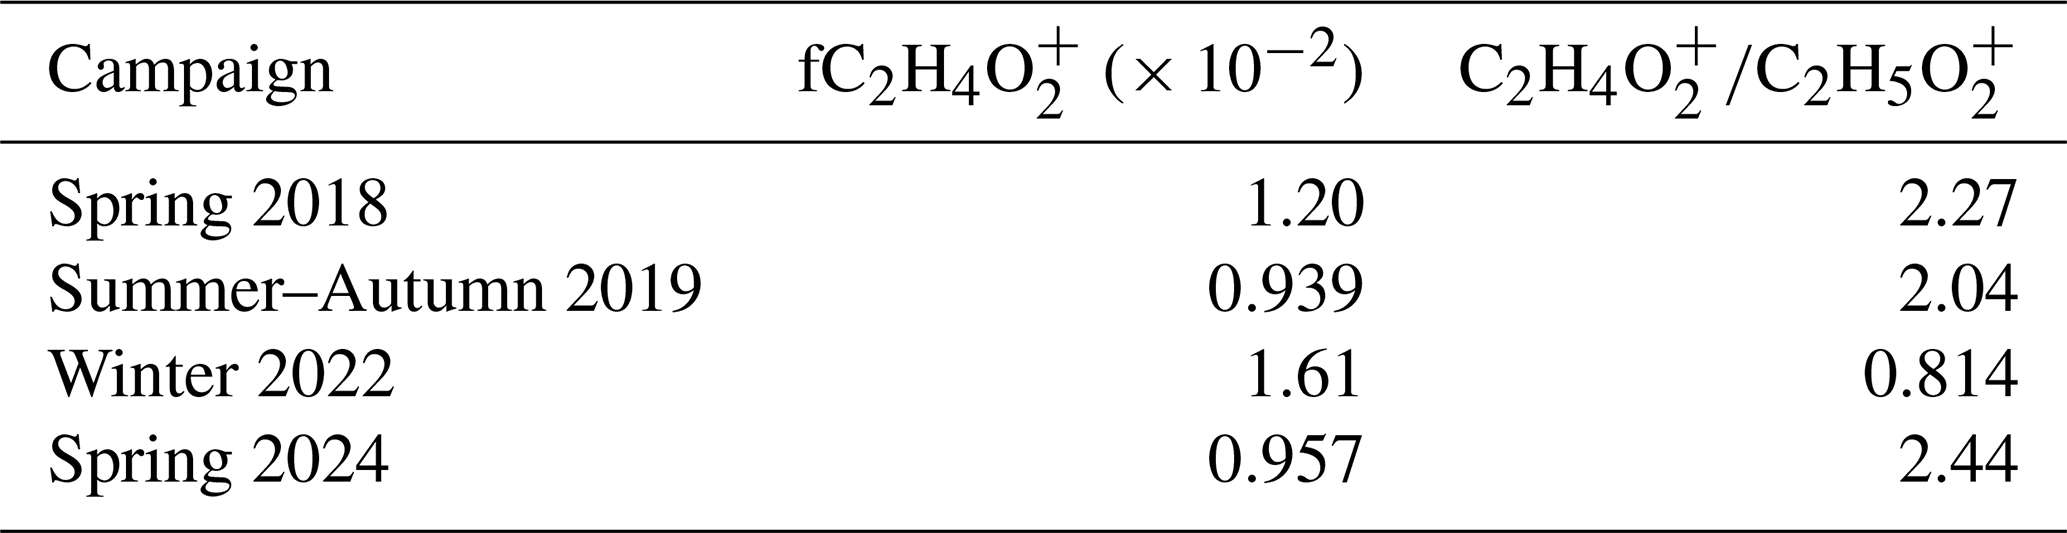
Regarding oxygenated species, TrOA showed notable signals for CHO+ (at 29), C2H3O+ (at 43), (at 44), and C3H3O+ (at 55). Additionally, signals for (at 60), (at 61), and (at 73) were observed. and are typically associated with biomass burning OA (Crippa et al., 2014), however, they are also prominent in the mass spectra of primary biological OA, along with (Vlachou et al., 2019; Schneider-Beltran et al., 2026). The ratio of to ranged from 2.0 to 2.4 in Spring 2018, Summer–Autumn 2019 and Spring 2024, whereas in Winter 2022, was more abundant than (Table 3). A detailed analysis of the correlations between , , and is presented in Sect. 3.2.
Table 3Fraction of () in OA and the ratio of to in TrOA during the four campaigns.
Regarding elemental composition, TrOA exhibited a lower H:C ratio and a higher O:C ratio compared to HOA. The variability between campaigns was more pronounced for H:C than for O:C (Table S2, Fig. 3). Among the PMF factors identified across the four campaigns, TrOA was located close to BBOA and CoOA in terms of O:C, but it had a lower H:C ratio than both of those factors.
The concentration of TrOA showed a distinct morning rush hour peak during Winter 2022 and Summer–Autumn 2019. In contrast, the highest concentrations in Spring 2018 and Spring 2024 occurred at other times of the day, although a minor morning increase was observed in all campaigns (Fig. 2b). Compared with HOA, TrOA peaked at the same time in the morning but remained elevated for several hours longer, whereas HOA exhibited a sharp and short-lived morning peak. An afternoon/evening rush hour peak for TrOA was observed only in Spring 2024. The correlations between TrOA and BC (R = 0.40–0.5) and NOx (R = 0.42–0.57) were relatively low in all datasets (Table S3).
Weekday concentrations of TrOA were consistently higher than weekend levels across all campaigns, although the weekday–weekend difference was smaller for TrOA than for HOA, except in Spring 2024. Notably, LV-OOA, typically considered a regionally distributed OA type, also showed higher concentrations on weekdays than on weekends, except for Spring 2024 campaign. This pattern suggests that overall concentrations may have been slightly elevated on weekdays due to meteorological conditions or LRT emissions. However, given the relatively short duration of each campaign (approximately one month), the uncertainty in the weekday-to-weekend comparison remains substantial.
Saarikoski et al. (2023) hypothesized that TrOA and HOA originated from emissions associated with different vehicle types. This assumption was based on a time series showing a peak in TrOA concentrations during the night between Saturday and Sunday (Fig. S7), a period when the vehicle fleet composition is expected to differ from typical morning traffic, especially with higher prevalence of taxis and fewer heavy-duty vehicles. Previous observations have shown that OA emitted from diesel–electric hybrid and ethanol-fueled buses equipped with exhaust aftertreatment systems contains and ions in their mass spectra (Saarikoski et al., 2017). However, was not detected in emissions from any of these vehicles. In addition to POA, the mass spectra of SOA formed from vehicle emissions may also include , and ions (Timonen et al., 2017).
Harni et al. (2024) applied PMF to analyze particle number size distributions measured at the Helsinki Supersite between February 2015 and June 2019. Their analysis identified five distinct factors, each characterized by unique size distributions and temporal patterns. Three of these factors were attributed to traffic-related sources, whereas one factor, termed secondary combustion aerosol (SCA), showed a strong correlation with 60, as measured with the aerosol chemical speciation monitor. Regarding diurnal variations, SCA exhibited a peak slightly later than the two traffic-related factors (TRA1 and TRA2) and BC. Nevertheless, SCA concentrations increased concurrently with NOx, and, similar to TrOA, remained elevated for a longer duration than NOx.
TrOA appears to resemble the SCA factor identified in the PMF analysis of particle number size distributions. SCA is characterized as a secondary aerosol originating from combustion processes, primarily attributed to biomass combustion. However, the presence of a similar rush hour peak in both 60 and SCA suggests that SCA may also be influenced by other combustion sources, such as vehicle engines. SCA accounted for approximately 4 % of the total particle volume. When its volume size distribution was converted to a mass size distribution, assuming SCA consists solely of OA, its average mass contribution to OA mass was estimated at 7 %. This is slightly lower than the contribution of TrOA observed in this study, which ranged between 10 % and 18 % of OA.
TrOA was also compared with levoglucosan concentrations analyzed from PM1 filters collected during winter 2022 (Fig. S8a; for details on PM1 sampling and analysis, see Teinilä et al., 2025) to investigate its potential association with biomass combustion. No correlation was observed between TrOA and levoglucosan, however, levoglucosan did not correlate with BBOA either. Instead, the strongest correlation was found between levoglucosan and LV-OOA w/BB, with a moderate correlation to LV-OOA, suggesting that levoglucosan was primarily associated with LRT particles during the campaign. The contribution of BBOA to OA during Winter 2022 was relatively small (6 %; Fig. 1), however, BBOA exhibited a pronounced evening maximum around 19:00 LT (Fig. S8b), suggesting a dominant influence from local biomass combustion sources. Similar results were obtained when the concentration of was apportioned among the PMF factors. The analysis showed that was mostly attributed to LV-OOA w/BB (41 %), with smaller contributions from TrOA (24 %), BBOA (18 %), and LV-OOA (13 %) (Fig. S8c). Levoglucosan has also been detected in tire wear particles and tire materials (Alves et al., 2020), challenging its exclusivity as a biomass burning tracer in traffic environments and suggesting that and may also originate from non-exhaust emissions.
It is possible that the vaporization scheme employed in this study (laser + tungsten vaporizer) enhanced the contribution of oxygenated ions in the TrO mass spectra. Elevated signals of , , and have previously been observed for oxygenated organic coatings, including alcohols, dicarboxylic acids, and multifunctional compounds, on BC particles when using the laser vaporizer in the SP-AMS compared with the thermal vaporizer (Ma et al., 2021). Similar effects have been reported in PMF analyses. Rivellini et al. (2020) showed that the laser vaporizer increased the contribution of in total OA and oxygenated OA factors, while Wang et al. (2019) identified a substantial fraction of in BBOA when operating the AMS with a laser vaporizer only. More generally, OOA factors typically exhibit enhanced C2H3O+ signals when measured with a laser vaporizer, whereas CO+ and signals tend to be more prominent when using a thermal vaporizer (Massoli et al., 2015; Lee et al., 2017).
3.1.3 SV-OOA
SV-OOA accounted for the largest fraction of OA in Spring 2018 (58 %) and Summer–Autumn 2019 (40 %) and the smallest in Winter 2022 (12 %). The mass spectra of SV-OOA were dominated by oxygenated ions C2H3O+ and (Fig. 2c). The elemental composition of SV-OOA showed some variability across the datasets in terms of the O:C ratio, whereas the H:C ratio remained relatively stable (Fig. 3). Overall, SV-OOA was more oxygenated than HOA and TrOA, but less oxygenated than LV-OOA.
The concentration of SV-OOA peaked during the early morning hours around 04:00 LT, except during Summer–Autumn 2019, when its concentration was more stable throughout the day (Fig. 2c). This trend is likely due to the semi-volatile nature of SV-OOA, which is observed as smaller concentrations during the day. SV-OOA showed poor correlations with BC and NOx (Table S3).
By comparing weekday and weekend concentrations, SV-OOA was larger during weekdays than weekends, with the difference being smaller than that for HOA but larger than that for TrOA, except in Winter 2022 and Spring 2024 (Table 2). In contrast to HOA and TrOA, SV-OOA may partly reflect secondary organic aerosol formed from vehicle-emitted VOCs and could have a stronger regional component than more locally influenced HOA and TrOA. It should be noted that in addition to traffic, SV-OOA is likely to have other sources, such as biogenic emissions during the growing season (Saarikoski et al., 2023) or processed biomass combustion emissions during cold months (Canonaco et al., 2015).
3.1.4 Mass size-distributions
The mass size distributions of HOA, TrOA, and SV-OOA were examined by calculating the size distributions for unit mass resolution (UMR) values typical for each OA type. 57 was used as a surrogate for HOA, 60 and 61 for TrOA, and 43 and 44 for SV-OOA. However, it should be noted that UMR 's can consist of several high-resolution (HR) ions, and furthermore, the same UMR 's, as well HR ions, can be attributed to several sources. Therefore, the mass size distributions for UMR 's can only be considered indicative for different sources.
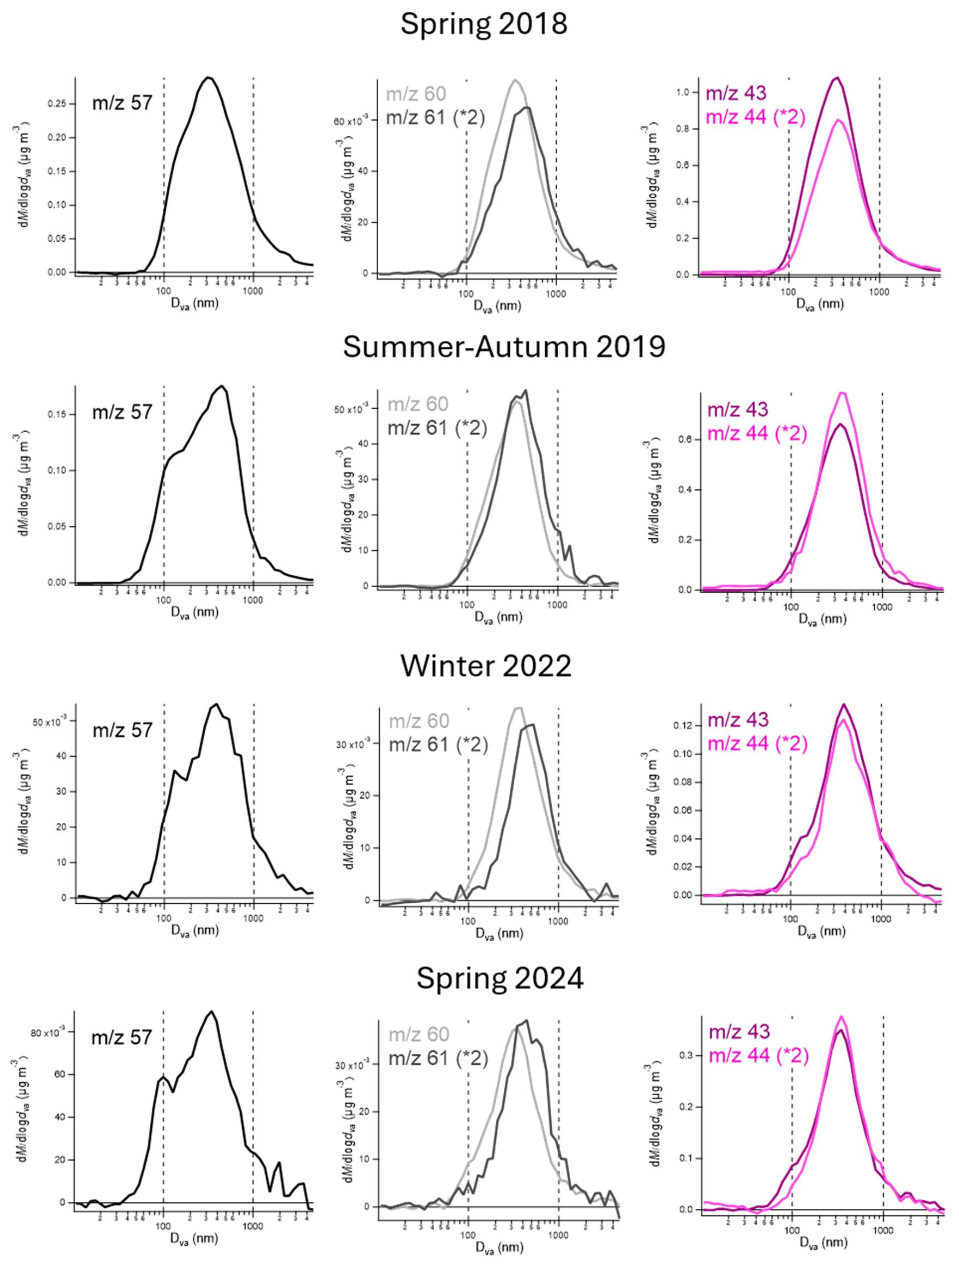
All values exhibited a dominant peak within the accumulation mode size range (Fig. 4). For 57, the main peak occurred at 300–450 nm, with a second, less pronounced peak at smaller size, 100–130 nm, except during Spring 2018, when it appeared only as a small shoulder. The distribution of 57 varied over the course of day, most notably in Winter 2022, when the peak at 100–130 nm was observed during daytime (06:00–18:00 LT), coinciding with peak traffic volumes. At other times, this peak was less evident (Fig. S9).
60 consistently peaked at 340–400 nm in all campaigns. A minor shoulder at 100–130 nm was observed during 06:00–12:00 and 12:00–18:00 LT (Fig. S9), likely due to additional ions beyond , contributing to the shoulder. 61 peaked at a larger size (100–140 nm) than 60, suggesting external mixing and different sources. The difference of accumulation mode maxima between 60 and 61 was greatest in Winter 2022 (∼ 140 nm) and smallest in Summer–Autumn 2019 (∼ 50 nm). In Winter 2022, 60 and 61 were clearly associated with a mixture of traffic and biomass burning -related OA. The difference between the size distributions of 60 and 61 became more pronounced during periods when TrOA contributed a higher fraction of OA suggesting that 61, in particular, was partially related to TrOA (Fig. S10). In contrast, during periods of low TrOA contribution, 60 and 61 peaked at the same particle size, indicating that both ions were predominantly linked to biomass combustion. As already discussed in Sect. 3.1.2, at 60 was mostly associated with LV-OOA w/BB (41 %), with lower contributions from TrOA (24 %), BBOA (18 %), and LV-OOA (13 %) in Winter 2022 (Fig. S8c). However, at 61 was largely attributed to TrOA (48 %) with smaller contributions from LV-OOA (19 %) and LV-OOA w/BBOA (16 %). The size distribution of 61 showed no clear diurnal variation (Fig. S9).
Peaks at 43 and 44 exhibited clear accumulation modes at 350–450 nm, with 43 displaying a slight shoulder at 100–130 nm during Winter 2022 and Spring 2024. This shoulder was most evident between 06:00–12:00 and 12:00–18:00 LT (Fig. S9).
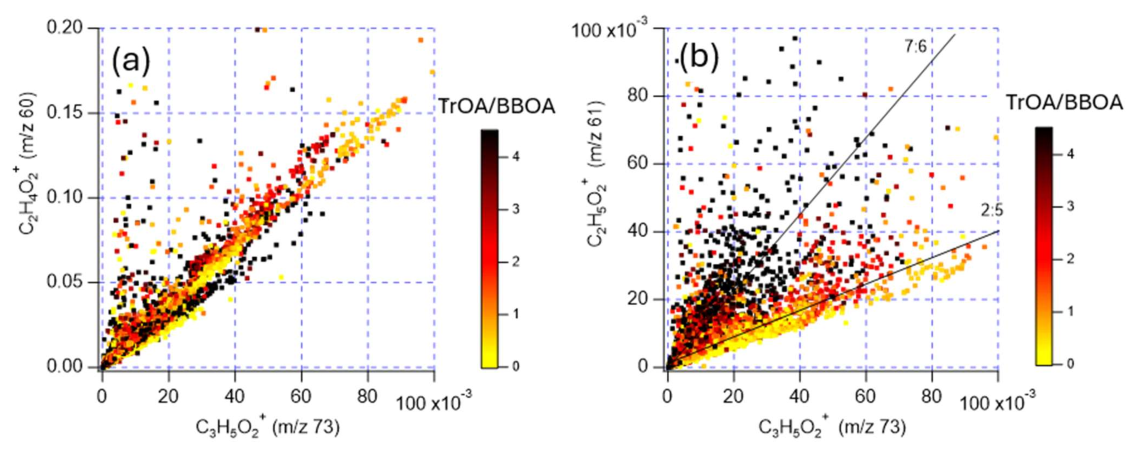
Figure 5Scatter plots of and (a) and and (b) in the Winter 2022 data. The dots are colored according to the ratio of TrOA to BBOA.
3.2 Separating TrOA from BBOA and HOA
This section explores methods for distinguishing TrOA from BBOA and HOA, given that TrOA mass spectra share similarities with those of BBOA and HOA. First, the relationship of ions , , and were investigated. Figure 5 shows the ions for the Winter 2022 data. and exhibited strong correlations across all data points, regardless of the TrOA-to-BBOA ratio. In contrast, the relationship between and showed clear dependency on the TrOA-to-BBOA ratio. When the TrOA-to-BBOA ratio was high (black dots), the ratio was approximately 7:6, whereas it decreased to approximately 2:5 when the ratio was low. The minimum observed ratio was 1:3, indicating that the signal was always at least 33 % of the signal.
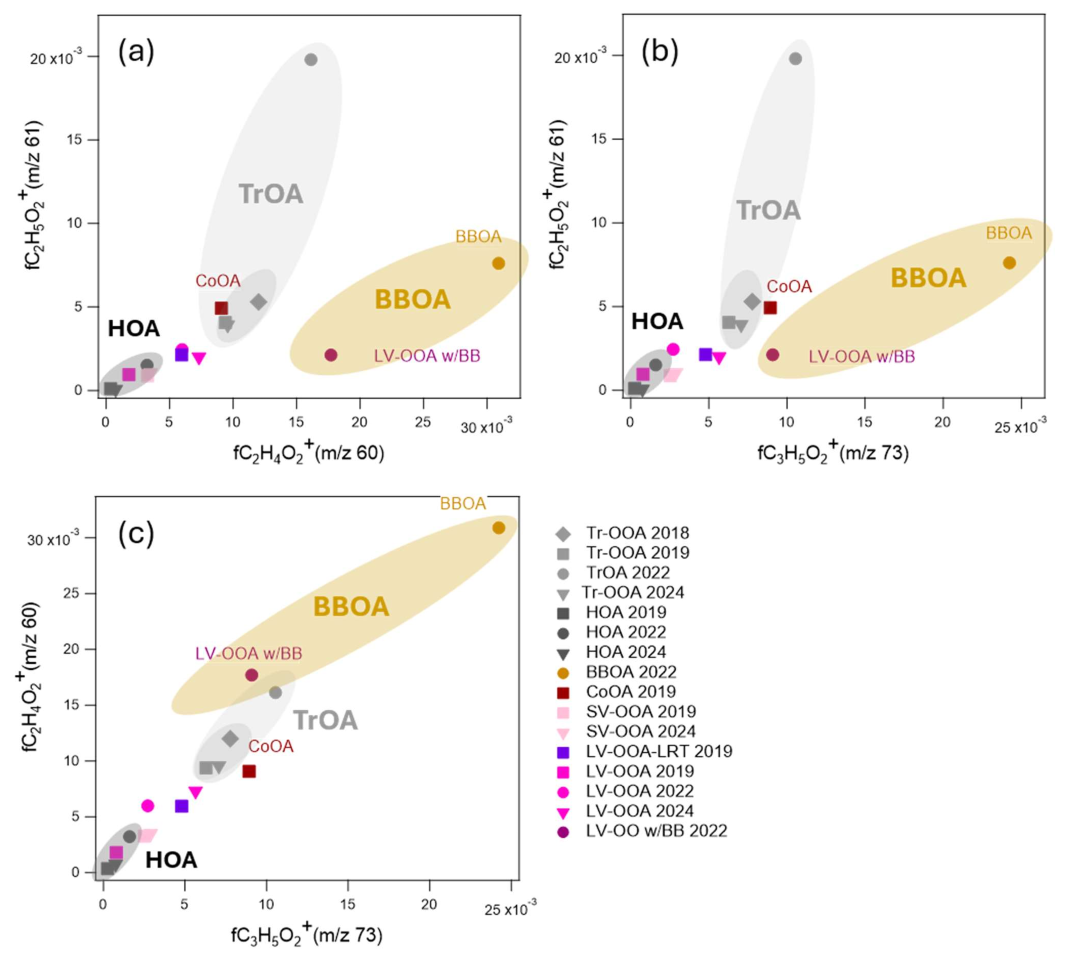
Figure 6Scatter plots of and (a), and (b), and and (c) for the PMF factors during the four campaigns.
The analysis of , , and was extended to the fractions of those ions in OA (, , and ). The fractions were calculated to PMF factors from all datasets, including only those factors that contained all three ions. Figure 6 shows that TrOA differs most clearly from BBOA in the – and – plots, whereas in the – plot TrOA and BBOA appear closer together. Winter 2022 stands out from other datasets because TrOA has much higher values. In addition to biomass burning factors, the coffee roastery factor (CoOA) can be mistaken for TrOA, particularly in the – and – plots, as it is positioned near TrOA. However, CoOA mass spectra contain distinctive nitrogen-containing ions that are absent from other OA factors in Helsinki (see, for example, Saarikoski et al., 2023). Other PMF factors (HOA, SV-OOA and LV-OOA) showed similar and ratios to TrOA (except in Winter 2022), but their absolute ion fractions were much smaller. Similar ion fraction plots have previously been used in AMS studies to separate cooking OA (COA) from HOA sources (Mohr et al., 2012), and to investigate BBOA evaluation in the atmosphere (Cubison et al., 2011).
It was also examined whether TrOA can be distinguished from HOA and BBOA using hydrocarbon patterns. As noted in Sect. 3.1.2, TrOA exhibited larger signals at values two hydrogens lower than those of HOA, indicating a higher degree of unsaturation. This trend is illustrated in Fig. 7, which shows the ratios of hydrocarbon pairs (, , and ; 41/43, 55/57, and 69/71, respectively) for TrOA, HOA, and BBOA (BBOA is shown only for Winter 2022). While HOA generally had the largest absolute ion fractions, TrOA consistently displayed higher ratios than HOA and BBOA across all ion pairs.
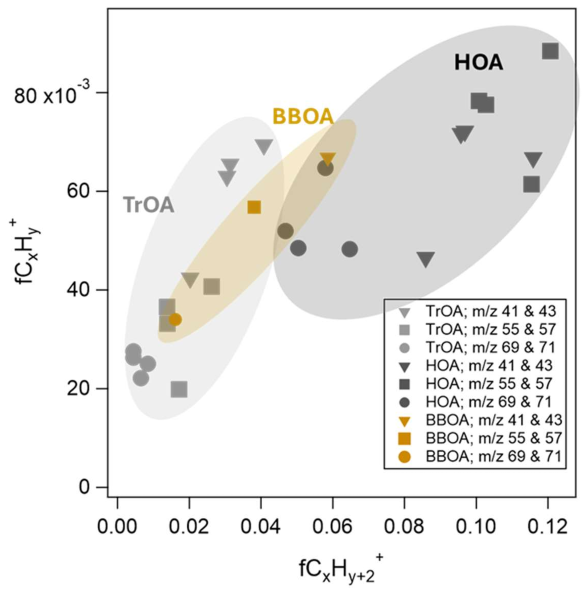
Figure 7Relationship between and for three ion pairs (, , and ). BBOA is shown with only three data points because it was only detected in one campaign (Winter 2022).
The ratio of ( 55/57) has been suggested to be larger for lubricant oil than for diesel fuel (Canagaratna et al., 2004; Saarikoski et al., 2017; Rönkkö et al., 2023). Compared with the ratios for lubricant oil and diesel fuel, TrOA exhibits an even larger / ratio, whereas HOA falls between lubricant oil and diesel fuel, closer to lubricant oil (Fig. S11). Figure S11 also shows this ratio for Euro 6 passenger cars using various fuels (EN580 diesel, HVO, EN228 gasoline, alkylate, CNG) and different exhaust after-treatment systems (see Saarikoski et al., 2024 for details). Gasoline cars with GPF and diesel cars with DPF had ratios similar to those of TrOA, whereas CNG cars and gasoline cars without GPF were closer to HOA. For comparison, was also presented for cooking-related OA (Mohr et al., 2012). COA was located close to TrOA having slightly larger than TrOA (Fig. S11).
These hydrocarbon ratios suggest that TrOA may be associated with modern gasoline and diesel vehicles equipped with efficient exhaust aftertreatment systems. However, none of these vehicles exhibited significant signals for oxygenated ions, , , or , in their mass spectra. This indicates that TrOA is unlikely to be directly emitted by vehicles but may form through rapid atmospheric processing after emission, consistent with the diurnal patterns shown earlier. Furthermore, the high degree of unsaturation in TrOA hydrocarbons suggests that TrOA could undergo oxygenation more rapidly than HOA, which contains more saturated hydrocarbons.
This study investigated the chemical characteristics and sources of submicron OA in a traffic-influenced environment in Helsinki, Finland, using data collected between 2018 and 2024. Source apportionment analysis identified two OA factors attributed to traffic emissions; HOA and TrOA. HOA was composed primarily of hydrocarbons, while TrOA was more oxygenated and showed clear signals for and for , typically associated with biomass combustion. Additionally, TrOA exhibited a pronounced signal for in Winter 2022 data.
The origin of TrOA remained uncertain. TrOA was identified as traffic-related primarily based on its diurnal pattern, which exhibited a distinct morning rush-hour peak in several campaigns and, at least, a smaller morning increase across all campaigns. TrOA concentration stayed elevated for a longer duration than that of HOA during the morning hours, and its mass size distribution peaked at larger particle sizes, suggesting some degree of atmospheric processing. BBOA was detected only during the winter 2022 campaign and showed its highest concentrations in the evening. Overall, biomass combustion is expected to be only a minor source at the measurement site, as there are very few detached houses with fireplaces in the surrounding area.
The pronounced signals of oxygenated ions imply that TrOA contains compounds such as alcohols, carboxylic acids, or multifunctional oxygenated species. However, the use of a laser vaporizer is known to enhance the contribution of these ions compared with the more commonly used thermal vaporizer. This instrumental effect should therefore be considered when interpreting the mass spectra or when comparing them with the spectra obtained using thermal vaporizers. Hydrocarbon ratios in TrOA mass spectra may indicate its source as emissions from modern vehicles equipped with advanced exhaust after-treatment systems, which operate later in the morning than heavy-duty vehicles or diesel buses, on average.
Several previous studies on source apportionment have attributed only HOA to primary traffic emissions. However, this study demonstrated that excluding oxygenated primary OA, such as TrOA, can lead to a significant underestimation (up to 50 %) of total primary OA from traffic, as HOA and TrOA contributed nearly equally to OA. On average, HOA + TrOA accounted for 28 % of OA, increasing to 36 % during morning rush hours (06:00–11:00 LT). It is important to note that TrOA may not be entirely a primary component. Its diurnal pattern and possible atmospheric processing suggest that it could be classified as fresh OA or slightly aged OA.
SV-OOA was also partially associated with traffic emissions as its concentrations were higher on weekdays than on weekends. However, its diurnal trend did not follow traffic volume or other direct traffic-related indicators, implying substantial processing in the atmosphere. Consequently, OA from traffic may still be underestimated, even when HOA and TrOA are included, if a fraction of SV-OOA is traffic-related. SV-OOA may also originate from other sources such as biogenic emissions during the growing season or aged biomass-burning emissions during the colder months.
TrOA differed from BBOA based on the to ratio. Furthermore, TrOA could be separated from HOA using hydrocarbon ion ratios (), as TrOA exhibited fewer saturated hydrocarbon ions than HOA. Other combustion sources may emit OA resembling TrOA in terms of oxygenated ions. For example, a nearby coffee roastery produced OA similar to TrOA in plots, but its distinctive mass spectra in terms of nitrogen-containing organic ions made it easy to separate from TrOA. Cooking-related OA has not been detected in Helsinki, although based on the literature, its mass spectra may share features with TrOA. Primary biological OA has also been shown to have pronounced signals for , , and , but it is assumed to be present mostly in coarse particles.
This study provides a comprehensive view of OA observed in a traffic setting. The results provide novel insights into the sources and size distributions of urban OA, supporting air quality authorities and policymakers in identifying effective strategies to mitigate the health impacts of urban PM. This study also highlights the need to account for both primary and secondary oxygenated OA when evaluating the impact of traffic-related emissions on air quality. As vehicle fleets modernize with new engine technologies and alternative fuels, and the share of non-exhaust emissions may increase, the composition of traffic-derived OA is likely to evolve, requiring ongoing assessment and adaptation of air quality strategies.
Data described in this paper can be accessed on the Zenodo repository under https://doi.org/10.5281/zenodo.21023830 (Saarikoski, 2026).
The supplement related to this article is available online at https://doi.org/10.5194/acp-26-11817-2026-supplement.
SaS, MA and HT design the experiments and had the idea for the analysis. SaS, MA, JVN, LB and JH performed the experiments and data collection. SaS, MA and LB performed the data analysis. SaS, MA, JVN, TR and HT wrote the initial manuscript draft, but all authors participated in the writing process. SaS, JVN, HM, TR, and HT contributed to the acquisition of funding for the study.
The contact author has declared that none of the authors has any competing interests.
Publisher's note: Copernicus Publications remains neutral with regard to jurisdictional claims made in the text, published maps, institutional affiliations, or any other geographical representation in this paper. The authors bear the ultimate responsibility for providing appropriate place names. Views expressed in the text are those of the authors and do not necessarily reflect the views of the publisher.
Katja Moilanen from the City of Helsinki is acknowledged for the traffic count data. The authors used AI-based language editing tools to improve the clarity and grammar of the manuscript. No AI tools were used for data analysis, interpretation, or generating scientific content. The authors take full responsibility for all content, interpretations, and conclusions.
This research has been supported by the Business Finland (grant nos. 7915/31/2022 and 8308/31/2022), the European Horizon 2020 (grant nos. 101096133 and 101036245), and the Research Council of Finland (grant nos. 337552 and 337551).
This paper was edited by Benjamin A. Nault and reviewed by two anonymous referees.
Alanen, J., Saukko, E., Lehtoranta, K., Murtonen, T., Timonen, H., Hillamo, R., Karjalainen, P., Kuuluvainen, H., Harra, J., Keskinen, J., and Rönkkö, T.: The formation and physical properties of the particle emissions from a natural gas engine, Fuel, 162, 155–161, https://doi.org/10.1016/j.fuel.2015.09.003, 2015.
Alves, C. A., Vicente, A. M. P., Calvo, A. I., Baumgardner, D., Amato, F., Querol, X., Pio, C., and Gustafsson, M.: Physical and chemical properties of non-exhaust particles generated from wear between pavements and tyres, Atmos. Environ., 224, 117252, https://doi.org/10.1016/j.atmosenv.2019.117252, 2020.
An, Z., Huang, R.-J., Zhang, R., Tie, X., Li, G., Cao, J., Zhou, W., Shi, Z., Han, Y., Gu, Z., and Ji, Y.: Severe haze in northern China: A synergy of anthropogenic emissions and atmospheric processes, P. Natl. Acad. Sci. USA, 116, 8657–8666, https://doi.org/10.1073/pnas.1900125116, 2019.
Barreira, L. M. F., Helin, A., Aurela, M., Teinilä, K., Friman, M., Kangas, L., Niemi, J. V., Portin, H., Kousa, A., Pirjola, L., Rönkkö, T., Saarikoski, S., and Timonen, H.: In-depth characterization of submicron particulate matter inter-annual variations at a street canyon site in northern Europe, Atmos. Chem. Phys., 21, 6297–6314, https://doi.org/10.5194/acp-21-6297-2021, 2021.
Barreira, L. M. F., Aurela, M., Saarikoski, S., Li, D., Teinilä, K., Virkkula, A., Niemi, J. V., Manninen, H. E., Pirjola, L., Petäjä, T., Rönkkö, T., and Timonen, H.: Characterizing winter-time brown carbon: Insights into chemical and light-absorption properties in residential and traffic environments, Sci. Total Environ., 955, 177089, https://doi.org/10.1016/j.scitotenv.2024.177089, 2024.
Budisulistiorini, S. H., Baumann, K., Edgerton, E. S., Bairai, S. T., Mueller, S., Shaw, S. L., Knipping, E. M., Gold, A., and Surratt, J. D.: Seasonal characterization of submicron aerosol chemical composition and organic aerosol sources in the southeastern United States: Atlanta, Georgia,and Look Rock, Tennessee, Atmos. Chem. Phys., 16, 5171–5189, https://doi.org/10.5194/acp-16-5171-2016, 2016.
Canagaratna, M. R., Jayne, J. T., Ghertner, D. A., Herndon, S., Shi, Q., Jimenez, J. L., Silva, P. J., Williams, P., Lanni, T., Drewnick, F., Demerjian, K. L., Kolb, C. E., and Worsnop, D. R.: Chase Studies of Particulate Emissions from in-use New York City Vehicles, Aerosol Sci. Technol., 38:555–573, https://doi.org/10.1080/02786820490465504, 2004.
Canonaco, F., Crippa, M., Slowik, J. G., Baltensperger, U., and Prévôt, A. S. H.: SoFi, an IGOR-based interface for the efficient use of the generalized multilinear engine (ME-2) for the source apportionment: ME-2 application to aerosol mass spectrometer data, Atmos. Meas. Tech., 6, 3649–3661, https://doi.org/10.5194/amt-6-3649-2013, 2013.
Canonaco, F., Slowik, J. G., Baltensperger, U., and Prévôt, A. S. H.: Seasonal differences in oxygenated organic aerosol composition: implications for emissions sources and factor analysis, Atmos. Chem. Phys., 15, 6993–7002, https://doi.org/10.5194/acp-15-6993-2015, 2015.
Canonaco, F., Tobler, A., Chen, G., Sosedova, Y., Slowik, J. G., Bozzetti, C., Daellenbach, K. R., El Haddad, I., Crippa, M., Huang, R.-J., Furger, M., Baltensperger, U., and Prévôt, A. S. H.: A new method for long-term source apportionment with time-dependent factor profiles and uncertainty assessment using SoFi Pro: application to 1 year of organic aerosol data, Atmos. Meas. Tech., 14, 923–943, https://doi.org/10.5194/amt-14-923-2021, 2021.
Cao, J., Situ, S., Hao, Y., Xie, S., and Li, L.: Enhanced summertime ozone and SOA from biogenic volatile organic compound (BVOC) emissions due to vegetation biomass variability during 1981–2018 in China, Atmos. Chem. Phys., 22, 2351–2364, https://doi.org/10.5194/acp-22-2351-2022, 2022.
Carbone, S., Aurela, M., Saarnio, K., Saarikoski, S., Frey, A., Timonen, H., Sueper, D., Ulbrich, I., Jimenez, J.-L., Kulmala, M., Worsnop D., and Hillamo, R.: Wintertime aerosol chemistry in sub-arctic urban air, Aerosol Sci. Technol., 48, 312–322, https://doi.org/10.1080/02786826.2013.875115, 2014.
Chen, G., Canonaco, F., Tobler, A., Aas, W., Alastuey, A., Allan, J., Atabakhsh, S., Aurela, A., Baltensperger, U., Bougiatioti, A., De Brito, J. F., Ceburnis, D., Chazeau, B., Chebaicheb, H., Daellenbach, K. R., Ehn, M., El Haddad, I., Eleftheriadis, K., Favez, O., Flentje, H., Font, A., Fossum, K., Freney, E., Gini, M., Green, D. C., Heikkinen, L., Herrmann, H., Kalogridis, A.-C., Keernik, H., Lhotka, R., Lin, C., Lunder, C., Maasikmets, M., Manousakas, M. I., Marchand, N., Marin, C., Marmureanu, L., Mihalopoulos, N., Močnik, G., Nęcki, J., O'Dowd, C., Ovadnevaite, J., Peter, T., Petit, J.-E., Pikridas, M., Platt, S. M., Pokorná, P., Poulain, L., Priestman, M., Riffault, V., Rinaldi, M., Róański, K., Schwarz, J., Sciare, J., Simon, L., Skiba, A., Slowik, J. G., Sosedova, Y., Stavroulas, I., Styszko, K., Teinemaa, E., Timonen, H., Tremper, A., Vasilescu, J., Via, M., Vodička, P., Wiedensohler, A., Zografou, O., Minguillón, M. C., and Prévôt., A. S. H.: European aerosol phenomenology – 8: Harmonised source apportionment of organic aerosol using 22 Year-long ACSM/AMS datasets, Environ. Int., 166, https://doi.org/10.1016/j.envint.2022.107325, 2022.
Chirico, R., DeCarlo, P. F., Heringa, M. F., Tritscher, T., Richter, R., Prévôt, A. S. H., Dommen, J., Weingartner, E., Wehrle, G., Gysel, M., Laborde, M., and Baltensperger, U.: Impact of aftertreatment devices on primary emissions and secondary organic aerosol formation potential from in-use diesel vehicles: results from smog chamber experiments, Atmos. Chem. Phys., 10, 11545–11563, https://doi.org/10.5194/acp-10-11545-2010, 2010.
Crippa, M., Canonaco, F., Lanz, V. A., Äijälä, M., Allan, J. D., Carbone, S., Capes, G., Ceburnis, D., Dall'Osto, M., Day, D. A., DeCarlo, P. F., Ehn, M., Eriksson, A., Freney, E., Hildebrandt Ruiz, L., Hillamo, R., Jimenez, J. L., Junninen, H., Kiendler-Scharr, A., Kortelainen, A.-M., Kulmala, M., Laaksonen, A., Mensah, A. A., Mohr, C., Nemitz, E., O'Dowd, C., Ovadnevaite, J., Pandis, S. N., Petäjä, T., Poulain, L., Saarikoski, S., Sellegri, K., Swietlicki, E., Tiitta, P., Worsnop, D. R., Baltensperger, U., and Prévôt, A. S. H.: Organic aerosol components derived from 25 AMS data sets across Europe using a consistent ME-2 based source apportionment approach, Atmos. Chem. Phys., 14, 6159–6176, https://doi.org/10.5194/acp-14-6159-2014, 2014.
Cubison, M. J., Ortega, A. M., Hayes, P. L., Farmer, D. K., Day, D., Lechner, M. J., Brune, W. H., Apel, E., Diskin, G. S., Fisher, J. A., Fuelberg, H. E., Hecobian, A., Knapp, D. J., Mikoviny, T., Riemer, D., Sachse, G. W., Sessions, W., Weber, R. J., Weinheimer, A. J., Wisthaler, A., and Jimenez, J. L.: Effects of aging on organic aerosol from open biomass burning smoke in aircraft and laboratory studies, Atmos. Chem. Phys., 11, 12049–12064, https://doi.org/10.5194/acp-11-12049-2011, 2011.
Daellenbach, K. R., Kourtchev, I., Vogel, A. L., Bruns, E. A., Jiang, J., Petäjä, T., Jaffrezo, J.-L., Aksoyoglu, S., Kalberer, M., Baltensperger, U., El Haddad, I., and Prévôt, A. S. H.: Impact of anthropogenic and biogenic sources on the seasonal variation in the molecular composition of urban organic aerosols: a field and laboratory study using ultra-high-resolution mass spectrometry, Atmos. Chem. Phys., 19, 5973–5991, https://doi.org/10.5194/acp-19-5973-2019, 2019.
Ding, X., He, Q.-F., Shen, R.-Q., Yu, Q.-Q., and Wang, X.-M.: Spatial distributions of secondary organic aerosols from isoprene, monoterpenes,β-caryophyllene, and aromatics over China during summer, J. Geophys. Res.-Atmos., 119, 11877–811891. https://doi.org/10.1002/2014JD021748, 2014.
Fan, L., Yan, X., Du, Q., Zhang, J., Liu, G., Yang, Y., Miao, Y., and Zhang, G.: On the sources of ambient SOA in PM2.5: An integrated analysis over Jinan city of China, Atmos. Pollut. Res., 15, https://doi.org/10.1016/j.apr.2023.102008, 2024.
Gentner, D. R., Isaacman, G., Worton, D. R., Chan, A. W., Dallmann, T. R., Davis, L., Liu, S., Day, D. A., Russell, L. M., Wilson, K. R., Weber, R., Guha, A., Harley, R. A., and Goldstein, A. H.: Elucidating secondary organic aerosol from diesel and gasoline vehicles through detailed characterization of organic carbon emissions, P. Natl. Acad. Sci. USA, 109, 18318–18323, https://doi.org/10.1073/pnas.1212272109, 2012.
Ghadimi, S., Zhu, H., Durbin, T. D., Cocker III, D. R., and Karavalakis, G.: Exceedances of secondary aerosol formation from in-use natural gas heavy-duty vehicles compared to diesel heavy-duty vehicles, Environ. Sci. Technol., 57, 19979–19989, https://doi.org/10.1021/acs.est.3c04880, 2023.
Giechaskiel, B., Grigoratos, T., Mathissen, M., Quik, J., Tromp, P., Gustafsson, M., Franco, V., and Dilara, P.: Contribution of Road Vehicle Tyre Wear to Microplastics and Ambient Air Pollution, Sustainability, 16, 522, https://doi.org/10.3390/su16020522, 2024.
Gren, L., Malmborg, V. B., Falk, J., Markkula, L., Novakovic, M., Shamun, S., Eriksson, A. C., Kristensen, T. B., Svenningsson, B., Tunér, M., Karjalainen, P., and Pagels, J.: Effects of renewable fuel and exhaust aftertreatment on primary and secondary emissions from a modern heavy-duty diesel engine, J. Aerosol Sci., 156, 105781, https://doi.org/10.1016/j.jaerosci.2021.105781, 2021.
Hallquist, M., Wenger, J. C., Baltensperger, U., Rudich, Y., Simpson, D., Claeys, M., Dommen, J., Donahue, N. M., George, C., Goldstein, A. H., Hamilton, J. F., Herrmann, H., Hoffmann, T., Iinuma, Y., Jang, M., Jenkin, M. E., Jimenez, J. L., Kiendler-Scharr, A., Maenhaut, W., McFiggans, G., Mentel, Th. F., Monod, A., Prévôt, A. S. H., Seinfeld, J. H., Surratt, J. D., Szmigielski, R., and Wildt, J.: The formation, properties and impact of secondary organic aerosol: current and emerging issues, Atmos. Chem. Phys., 9, 5155–5236, https://doi.org/10.5194/acp-9-5155-2009, 2009.
Harni, S. D., Aurela, M., Saarikoski, S., Niemi, J. V., Portin, H., Manninen, H., Leinonen, V., Aalto, P., Hopke, P. K., Petäjä, T., Rönkkö, T., and Timonen, H.: Source apportionment of particle number size distribution at the street canyon and urban background sites, Atmos. Chem. Phys., 24, 12143–12160, https://doi.org/10.5194/acp-24-12143-2024, 2024.
Harrison, R. M., Allan, J., Carruthers, D., Heal, M. R., Lewis, A. C., Marner, B., Murrells, T., and Williams, A.: Non-exhaust vehicle emissions of particulate matter and VOC from road traffic: a review, Atmos. Environ., 262, 118592, https://doi.org/10.1016/j.atmosenv.2021.118592, 2021.
Hietikko, R., Kuuluvainen, H., Harrison, R. M., Portin, H., Timonen, H., Niemi, J. V., and Rönkkö, T.: Diurnal variation of nanocluster aerosol concentrations and emission factors in a street canyon, Atmos. Environ., 189, 98–106, https://doi.org/10.1016/j.atmosenv.2018.06.031, 2018.
Jimenez, J. L., Canagaratna, M. R., Donahue, N. M., Prevot, A. S. H., Zhang, Q., Kroll, J. H., DeCarlo, P. F., Allan, J. D., Coe, H., Ng, N. L., Aiken, A. C., Docherty, K. S., Ulbrich, I. M., Grieshop, A. P., Robinson, A. L., Duplissy, J., Smith, J. D., Wilson, K. R., Lanz, V. A., Hueglin, C., Sun, Y. L., Tian, J., Laaksonen, A., Raatikainen, T., Rautiainen, J., Vaattovaara, P., Ehn, M., Kulmala, M., Tomlinson, J. M., Collins, D. R., Cubison, M. J., Dunlea, E. J., Huffman, J. A., Onasch, T. B., Alfarra, M. R., Williams, P. I., Bower, K., Kondo, Y., Schneider, J., Drewnick, F., Borrmann, S., Weimer, S., Demerjian, K., Salcedo, D., Cottrell, L., Griffin, R., Takami, A., Miyoshi, T., Hatakeyama, S., Shimono, A., Sun, J. Y., Zhang, Y. M., Dzepina, K., Kimmel, J. R., Sueper, D., Jayne, J. T., Herndon, S. C., Trimborn, A. M., Williams, L. R., Wood, E. C., Middlebrook, A. M., Kolb, C. E., Baltensperger, U., and Worsnop, D. R.: Evolution of Organic Aerosols in the Atmosphere, Science, 326, 1525–1529, https://doi.org/10.1126/science.1180353, 2009.
Kanakidou, M., Seinfeld, J. H., Pandis, S. N., Barnes, I., Dentener, F. J., Facchini, M. C., Van Dingenen, R., Ervens, B., Nenes, A., Nielsen, C. J., Swietlicki, E., Putaud, J. P., Balkanski, Y., Fuzzi, S., Horth, J., Moortgat, G. K., Winterhalter, R., Myhre, C. E. L., Tsigaridis, K., Vignati, E., Stephanou, E. G., and Wilson, J.: Organic aerosol and global climate modelling: a review, Atmos. Chem. Phys., 5, 1053–1123, https://doi.org/10.5194/acp-5-1053-2005, 2005.
Karjalainen, P., Timonen, H., Saukko, E., Kuuluvainen, H., Saarikoski, S., Aakko-Saksa, P., Murtonen, T., Bloss, M., Dal Maso, M., Simonen, P., Ahlberg, E., Svenningsson, B., Brune, W. H., Hillamo, R., Keskinen, J., and Rönkkö, T.: Time-resolved characterization of primary particle emissions and secondary particle formation from a modern gasoline passenger car, Atmos. Chem. Phys., 16, 8559–8570, https://doi.org/10.5194/acp-16-8559-2016, 2016.
Karjalainen, P., Rönkkö, T., Simonen, P., Ntziachristos, L., Juuti, P., Timonen, H., Teinilä, K., Saarikoski, S., Saveljeff, H., Lauren, M., Happonen, M., Matilainen, P., Maunula, T., Nuottimäki, J., and Keskinen, J.: On the strategies to diminish the emissions of particles and secondary aerosol formation from diesel engines, Environ. Sci. Technol., 53, 10408–10416, https://doi.org/10.1021/acs.est.9b04073, 2019.
Lee, A. K. Y., Chen, C.-L., Liu, J., Price, D. J., Betha, R., Russell, L. M., Zhang, X., and Cappa, C. D.: Formation of secondary organic aerosol coating on black carbon particles near vehicular emissions, Atmos. Chem. Phys., 17, 15055–15067, https://doi.org/10.5194/acp-17-15055-2017, 2017.
Ma, M., Rivellini, L.-H., Cui, Y., Willis, M. D., Wilkie, R., Abbatt, J. P. D., Canagaratna, M. R., Wang, J., Ge, X., and Lee, A. K. Y.: Elemental analysis of oxygenated organic coating on black carbon particles using a soot-particle aerosol mass spectrometer, Atmos. Meas. Tech., 14, 2799–2812, https://doi.org/10.5194/amt-14-2799-2021, 2021.
Ma, M., Rivellini, L.-H., Zong, Y., Kraft, M., Yu, L. E., and Lee, A. K. Y.: Advances in characterization of black carbon particles and their associated coatings using the soot-particle aerosol mass spectrometer in Singapore, a complex city environment, Atmos. Chem. Phys., 25, 8185–8211, https://doi.org/10.5194/acp-25-8185-2025, 2025.
Martinmäki, T., Saarikoski, S., Timonen, H., Niemi, J. V., and Sillanpää, M.: Plastic and rubber polymers in urban PM10 by pyrolysis–gas chromatography–mass spectrometry, Anal. Bioanal. Chem., 417, 3835–3844, https://doi.org/10.1007/s00216-025-05906-z, 2025.
Massoli, P., Onasch, T. B., Cappa, C. D., Nuamaan, I., Hakala, J., Hayden, K., Li, S.-M., Sueper, D. T., Bates, T. S., Quinn, P. K., Jayne, J. T., and Worsnop, D. R.: Characterization of black carbon-containing particles from soot particle aerosol mass spec trometer measurements on the R/V Atlantis during CalNex 2010, J. Geophys. Res.-Atmos., 120, 2575–2593, 2015.
Mohr, C., DeCarlo, P. F., Heringa, M. F., Chirico, R., Slowik, J. G., Richter, R., Reche, C., Alastuey, A., Querol, X., Seco, R., Peñuelas, J., Jiménez, J. L., Crippa, M., Zimmermann, R., Baltensperger, U., and Prévôt, A. S. H.: Identification and quantification of organic aerosol from cooking and other sources in Barcelona using aerosol mass spectrometer data, Atmos. Chem. Phys., 12, 1649–1665, https://doi.org/10.5194/acp-12-1649-2012, 2012.
Novakovic, M., Eriksson, A., Gren, L., Malmborg, V., Shamun, S., Karjalainen, P., Svenningsson, B., Tunér, M., Verhelst, S., and Pagels, J.: Fresh and aged organic aerosol emissions from renewable diesel-like fuels HVO and RME in a heavy-duty compression ignition engine, SAE Technical Paper, 01–0392, SAE Mobilus, https://doi.org/10.4271/2023-01-0392, 2023.
Oh, S.-H., Park, C., Yu, G.-H., Jeon, H., Schauer, J. J., and Bae, M.-S.: Diurnal impacts of tire wear and waste burning on fine particulate matter concentrations in a metropolitan area, Environ. Pollut., 374, https://doi.org/10.1016/j.envpol.2025.126229, 2025.
Onasch, T. B., Trimborn, A., Fortner, E. C., Jayne, J. T., Kok, G. L., Williams, L. R., Davidovits, P., and Worsnop, D. R.: Soot particle aerosol mass spectrometer: Development, validation, and initial application, Aerosol Sci. Technol., 46, 804–817, https://doi.org/10.1080/02786826.2012.663948, 2012.
Pieber, S. M., Kumar, N. K., Klein, F., Comte, P., Bhattu, D., Dommen, J., Bruns, E. A., Kılıç, D., El Haddad, I., Keller, A., Czerwinski, J., Heeb, N., Baltensperger, U., Slowik, J. G., and Prévôt, A. S. H.: Gas-phase composition and secondary organic aerosol formation from standard and particle filter-retrofitted gasoline direct injection vehicles investigated in a batch and flow reactor, Atmos. Chem. Phys., 18, 9929–9954, https://doi.org/10.5194/acp-18-9929-2018, 2018.
Pirjola, L., Dittrich, A., Niemi, J. V., Saarikoski, S., Timonen, H., Kuuluvainen, H., Järvinen, A., Kousa, A., Rönkkö, T., and Hillamo, R.: Physical and chemical characterization of real-world particle number and mass emissions from city buses in Finland, Environ. Sci. Technol., 50, 294–304, https://doi.org/10.1021/acs.est.5b04105, 2016.
Rivellini, L.-H., Adam, M. G., Kasthuriarachchi, N., and Lee, A. K. Y.: Characterization of carbonaceous aerosols in Singapore: insight from black carbon fragments and trace metal ions detected by a soot particle aerosol mass spectrometer, Atmos. Chem. Phys., 20, 5977–5993, https://doi.org/10.5194/acp-20-5977-2020, 2020.
Rönkkö, T., Kuuluvainen, H., Karjalainen, P., Keskinen, J., Hillamo, R., Niemi, J. V., Pirjola, L., Timonen, H. J., Saarikoski, S., Saukko, E., Järvinen, A., Silvennoinen, H., Rostedt, A., Olin, M., Yli-Ojanperä, J., Nousiainen, P., Kousa, A., and Dal Maso, M.: Traffic is a major source of atmospheric nanocluster aerosol, P. Natl. Acad. Sci. USA, 201700830, https://doi.org/10.1073/pnas.1700830114, 2017.
Rönkkö, T., Pirjola, L., Karjalainen, P., Simonen, P., Teinilä, K., Bloss, M., Salo, L., Datta, A., Lale, B., Hooda, R. K., Saarikoski, S., and Timonen, H.: Exhaust particle number and composition for diesel and gasoline passenger cars under transient driving conditions: real-world emissions down to 1.5 nm, Environ. Pollut., 338, 122645, https://doi.org/10.1016/j.envpol.2023.122645, 2023.
Saarikoski, S.: New Insights into Traffic Emissions: The Role of Hydrocarbons and Oxygenated Organic Species in Traffic-Derived Aerosol, Zenodo [data set], https://doi.org/10.5281/zenodo.21023830, 2026.
Saarikoski, S., Timonen, H., Carbone, S., Kuuluvainen, H., Niemi, J. V., Kousa, A., Rönkkö, T., Worsnop, D., Hillamo, R., and Pirjola, L.: Investigating the chemical species in submicron particles emitted by city buses, Aerosol Sci. Technol., 51, 317–329, https://doi.org/10.1080/02786826.2016.1261992, 2017.
Saarikoski, S., Hellén, H., Praplan, A. P., Schallhart, S., Clusius, P., Niemi, J. V., Kousa, A., Tykkä, T., Kouznetsov, R., Aurela, M., Salo, L., Rönkkö, T., Barreira, L. M. F., Pirjola, L., and Timonen, H.: Characterization of volatile organic compounds and submicron organic aerosol in a traffic environment, Atmos. Chem. Phys., 23, 2963–2982, https://doi.org/10.5194/acp-23-2963-2023, 2023.
Saarikoski, S., Järvinen, A., Markkula, L., Aurela, M., Kuittinen, N., Hoivala, J., Barreira, L. M. F., Aakko-Saksa, P., Lepistö, T., Marjanen, P., Timonen, H., Hakkarainen, H., Jalava, P., and Rönkkö, T.: Towards zero pollution vehicles by advanced fuels and exhaust aftertreatment technologies, Environ. Pollut., 347, https://doi.org/10.1016/j.envpol.2024.123665, 2024.
Simonen, P., Kalliokoski, J., Karjalainen, P., Rönkkö, T., Timonen, H., Saarikoski, S., Aurela, M., Bloss, M., Triantafyllopoulos, G., Kontses, A., Amanatidis, S., Dimaratos, A. M., Samaras, Z., and Ntziachristos, L.: Characterization of laboratory and real driving emissions of individual Euro 6 light-duty vehicles – fresh particles and secondary aerosol formation, Environ. Pollut., 255, 113175, https://doi.org/10.1016/j.envpol.2019.113175, 2019.
Schneider-Beltran, K. S., Cui, T., Casotto, R., Lamkaddam, H., Tobler, A., Hao, Y., Khare, P., Manousakas, M., Dada, L., Grange, S. K., Hueglin, C., Uzu, G., Jaffrezo, J.-L., Rausch, J., Jaramillo-Vogel, D., Mohr, C., El-Haddad, I., Slowik, J. G., Prévôt, A. S. H., and Daellenbach, K. R.: Characterization of Coarse Organic Particulate Matter in Urban and Rural Switzerland Using Advanced Offline Mass Spectrometry, Atmosphere, 17, 199. https://doi.org/10.3390/atmos17020199, 2026.
Sokhi, R. S., Moussiopoulos, N., Baklanov, A., Bartzis, J., Coll, I., Finardi, S., Friedrich, R., Geels, C., Grönholm, T., Halenka, T., Ketzel, M., Maragkidou, A., Matthias, V., Moldanova, J., Ntziachristos, L., Schäfer, K., Suppan, P., Tsegas, G., Carmichael, G., Franco, V., Hanna, S., Jalkanen, J.-P., Velders, G. J. M., and Kukkonen, J.: Advances in air quality research – current and emerging challenges, Atmos. Chem. Phys., 22, 4615–4703, https://doi.org/10.5194/acp-22-4615-2022, 2022.
Sun, Y. L., Zhang, Q., Schwab, J. J., Chen, W.-N., Bae, M.-S., Hung, H.-M., Lin, Y.-C., Ng, N. L., Jayne, J., Massoli, P., Williams, L. R., and Demerjian, K. L.: Characterization of near-highway submicron aerosols in New York City with a high-resolution aerosol mass spectrometer, Atmos. Chem. Phys., 12, 2215–2227, https://doi.org/10.5194/acp-12-2215-2012, 2012.
Teinilä, K., Timonen, H., Aurela, M., Kuula, J., Rönkkö, T., Hellèn, H., Loukkola, K., Kousa, A., Niemi, J. V., and Saarikoski, S.: Characterization of particle sources and comparison of different particle metrics in an urban detached housing area, Finland, Atmos. Environ., 272, 118939, https://doi.org/10.1016/j.atmosenv.2022.118939, 2022.
Teinilä, K., Saarikoski, S., Lintusaari, H., Lepistö, T., Marjanen, P., Aurela, M., Hellén, H., Tykkä, T., Lampimäki, M., Lampilahti, J., Barreira, L., Mäkelä, T., Kangas, L., Hatakka, J., Harni, S., Kuula, J., V. Niemi, J., Portin, H., Yli-Ojanperä, J., Niemelä, V., Jäppi, M., Lehtipalo, K., Vanhanen, J., Pirjola, L., Manninen, H. E., Petäjä, T., Rönkkö, T., and Timonen, H.: Measurement report: Wintertime aerosol characterization at an urban traffic site in Helsinki, Finland, Atmos. Chem. Phys., 25, 4907–4928, https://doi.org/10.5194/acp-25-4907-2025, 2025.
Timonen, H., Karjalainen, P., Saukko, E., Saarikoski, S., Aakko-Saksa, P., Simonen, P., Murtonen, T., Dal Maso, M., Kuuluvainen, H., Bloss, M., Ahlberg, E., Svenningsson, B., Pagels, J., Brune, W. H., Keskinen, J., Worsnop, D. R., Hillamo, R., and Rönkkö, T.: Influence of fuel ethanol content on primary emissions and secondary aerosol formation potential for a modern flex-fuel gasoline vehicle, Atmos. Chem. Phys., 17, 5311–5329, https://doi.org/10.5194/acp-17-5311-2017, 2017.
Ulbrich, I. M., Canagaratna, M. R., Zhang, Q., Worsnop, D. R., and Jimenez, J. L.: Interpretation of organic components from Positive Matrix Factorization of aerosol mass spectrometric data, Atmos. Chem. Phys., 9, 2891–2918, https://doi.org/10.5194/acp-9-2891-2009, 2009.
Vlachou, A., Tobler, A., Lamkaddam, H., Canonaco, F., Daellenbach, K. R., Jaffrezo, J.-L., Minguillón, M. C., Maasikmets, M., Teinemaa, E., Baltensperger, U., El Haddad, I., and Prévôt, A. S. H.: Development of a versatile source apportionment analysis based on positive matrix factorization: a case study of the seasonal variation of organic aerosol sources in Estonia, Atmos. Chem. Phys., 19, 7279–7295, https://doi.org/10.5194/acp-19-7279-2019, 2019.
Wang, J., Liu, D., Ge, X., Wu, Y., Shen, F., Chen, M., Zhao, J., Xie, C., Wang, Q., Xu, W., Zhang, J., Hu, J., Allan, J., Joshi, R., Fu, P., Coe, H., and Sun, Y.: Characterization of black carbon-containing fine particles in Beijing during wintertime, Atmos. Chem. Phys., 19, 447–458, https://doi.org/10.5194/acp-19-447-2019, 2019.
Wang, J., Ye, J., Liu, D., Wu, Y., Zhao, J., Xu, W., Xie, C., Shen, F., Zhang, J., Ohno, P. E., Qin, Y., Zhao, X., Martin, S. T., Lee, A. K. Y., Fu, P., Jacob, D. J., Zhang, Q., Sun, Y., Chen, M., and Ge, X.: Characterization of submicron organic particles in Beijing during summertime: comparison between SP-AMS and HR-AMS, Atmos. Chem. Phys., 20, 14091–14102, https://doi.org/10.5194/acp-20-14091-2020, 2020.
Willis, M. D., Lee, A. K. Y., Onasch, T. B., Fortner, E. C., Williams, L. R., Lambe, A. T., Worsnop, D. R., and Abbatt, J. P. D.: Collection efficiency of the soot-particle aerosol mass spectrometer (SP-AMS) for internally mixed particulate black carbon, Atmos. Meas. Tech., 7, 4507–4516, https://doi.org/10.5194/amt-7-4507-2014, 2014.
Zhang, J., Peng, J., Song, A., Lv, Z., Tong, H., Du, Z., Guo, J., Wu, L., Wang, T., Hallquist, M., and Mao, H.Zhang, H., Yee, L. D., Lee, B. H., Curtis, M. P., Worton, D. R., Isaacman-VanWertz, G., Offenberg, J. H., Lewandowski, M., Kleindienst, T. E., Beaver, M. R., Holder, A. L., Lonneman, W. A., Docherty, K. S., Jaoui, M., Pye, H. O. T., Hu, W., Day, D. A., Campuzano-Jost, P., Jimenez, J. L., Guo, H., Weber, R. J., de Gouw, J., Koss, A. R., Edgerton, E. S., Brune, W., Mohr, C., Lopez-Hilfiker, F. D., Lutz, A., Kreisberg, N. M., Spielman, S. R., Hering, S. V., Wilson, K. R., Thornton, J. A., and Goldstein, A. H.: Monoterpenes are the largest source of summertime organic aerosol in the southeastern United States, P. Natl. Acad. Sci. USA, 115, 2038–2043, https://doi.org/10.1073/pnas.1717513115, 2018.
Zhang, J., Peng, J., Song, A., Lv, Z., Tong, H., Du, Z., Guo, J., Wu, L., Wang, T., Hallquist, M., and Mao, H.: Marked impacts of transient conditions on potential secondary organic aerosol production during rapid oxidation of gasoline exhausts, npj Clim. Atmos. Sci. 6, 59, https://doi.org/10.1038/s41612-023-00385-4, 2023a.
Zhang, J., Peng, J., Song, A., Du, Z., Guo, J., Liu, Y., Yang, Y., Wu, L., Wang, T., Song, K., Guo, S., Collins, D., and Mao, H.: Secondary Organic Aerosol Formation Potential from Vehicular Non-tailpipe Emissions under Real-World Driving Conditions, Environ. Sci. Technol., 58, 5419–5429, https://doi.org/10.1021/acs.est.3c06475, 2024.
Zhang, M., Yin, H., Tan, J., Wang, X., Yang, Z., Hao, L., Du, T., Niu, Z., and Ge, Y.: A comprehensive review of tyre wear particles: Formation, measurements, properties, and influencing factors, Atmos. Environ., 297, https://doi.org/10.1016/j.atmosenv.2023.119597, 2023b.
Zhang, Q., Jimenez, J. L., Canagaratna, M. R., Allan, J. D., Coe, H., Ulbrich, I., Alfarra, M. R., Takami, A., Middlebrook, A. M., Sun, Y. L., Dzepina, K., Dunlea, E., Docherty, K., DeCarlo, P. F., Salcedo, D., Onasch, T., Jayne, J. T., Miyoshi, T., Shimono, A., Hatakeyama, S., Takegawa, N., Kondo, Y., Schneider, J., Drewnick, F., Borrmann, S., Weimer, S., Demerjian, K., Williams, P., Bower, K., Bahreini, R., Cottrell, L., Griffin, R. J., Rautiainen, J., Sun, J. Y., Zhang, Y. M., and Worsnop, D. R.: Ubiquity and Dominance of Oxygenated Species in Organic Aerosols in Anthropogenically—Influenced Northern Hemisphere Mid-latitudes, Geophys. Res. Lett., 34, L13801, https://doi.org/10.1029/2007GL029979, 2007.
Zhao, Z., Saleh, R., Saliba, G., Presto, A. A., Gordon, T. D., Drozd, G. T., Goldstein, A. H., Donahue, N. M., and Robinson, A. L.: Reducing secondary organic aerosol formation from gasoline vehicle exhaust, P. Natl. Acad. Sci. USA, 114, 6984–6989, https://doi.org/10.1073/pnas.1620911114, 2017.
Zhu, W., Guo, S., Zhang, Z., Wang, H., Yu, Y., Chen, Z., Shen, R., Tan, R., Song, K., Liu, K., Tang, R., Liu, Y., Lou, S., Li, Y., Zhang, W., Zhang, Z., Shuai, S., Xu, H., Li, S., Chen, Y., Hu, M., Canonaco, F., and Prévôt, A. S. H.: Mass spectral characterization of secondary organic aerosol from urban cooking and vehicular sources, Atmos. Chem. Phys., 21, 15065–15079, https://doi.org/10.5194/acp-21-15065-2021, 2021.