
the Creative Commons Attribution 4.0 License.
the Creative Commons Attribution 4.0 License.
 | 20 Aug 2026
Wet and dry atmospheric deposition of microplastics at urban, suburban, rural and mountainous sites in Switzerland
Narain M. Ashta
Guillaume Crosset-Perrotin
Angélique Moraz
Matthias Philipp
Thomas D. Bucheli
Ralf Kaegi
Christoph Hueglin
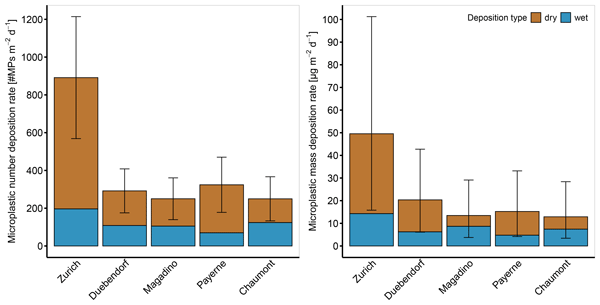
Microplastics (MPs) are environmental contaminants of global concern. Although the relevance of the atmosphere in the transport and distribution of MPs worldwide has been acknowledged, country-scale quantitative data on wet and dry MP deposition rates remain limited. We therefore quantified MPs in wet and dry atmospheric deposition samples collected on a four-weekly basis over a one-year period between May 2024 and May 2025 at one urban (Zurich), one suburban (Duebendorf), two rural (Magadino and Payerne) and one mountainous site (Chaumont) in Switzerland. We used focal plane array μ-Fourier transform infrared spectroscopy to identify MPs in the 20–215 µm size range and included a rigorous assessment of the measurement uncertainties. Particle sizes were converted into masses to obtain mass deposition rates. The number- and mass-based MP deposition rates were highest at the urban site, with respective means of 881 MPs m−2 d−1 [95 % confidence interval (CI): 562–1199] and 53 µg m−2 d−1 [CI: 17–107]. The deposition rates were lower and similar among the remaining sites, ranging from 249 to 331 MPs m−2 d−1 [CI: 140–478] and from 13 to 21 µg m−2 d−1 [CI: 4–46]. Based on the determined deposition rates and land-use statistics, an annual deposition of 219 t or 3.8×10¹⁴ particles was estimated for MPs of the analyzed 20–215 µm size fraction excluding tire wear particles, in regions <2000 m above sea level across Switzerland. Corresponding annual atmospheric inputs of MPs to Swiss agricultural land and surface waters were estimated at 78 and 10 t, respectively.
- Article
(1970 KB) - Full-text XML
-
Supplement
(855 KB) - BibTeX
- EndNote


Microplastics (MPs) are classified as plastic particles <5 mm and >1 µm in size (Hartmann et al., 2019). Due to their persistence, widespread occurrence in the environment, biota and humans, and potential for adverse effects, MPs are considered environmental contaminants of global concern (Abbasi and Turner, 2021b; Cole et al., 2013; Hartmann et al., 2019; Huang et al., 2022; Jenner et al., 2022; Thompson et al., 2024; Wright et al., 2013). Following a precautionary approach, jurisdictions such as the European Union and Switzerland have introduced restrictions on the intentional use of MPs in products (European Commission, 2023; Swiss Federal Council, 2025).
The atmosphere has received increasing attention for its role in the distribution of MPs in the environment (Allen et al., 2019; Brahney et al., 2021; Evangeliou et al., 2020). Atmospheric deposition contributes to the load of MPs in soils and water bodies (Sun et al., 2022; Weber and Bigalke, 2025) and atmospheric transport is key for transferring MPs to remote regions such as mountainous areas and the Arctic (Allen et al., 2019; Brahney et al., 2021; Evangeliou et al., 2020). Several studies have sought to quantify the atmospheric deposition of MPs; however, their sampling and analytical approaches differed substantially, and methodological uncertainties were rarely quantified (Ashta et al., 2026b; Evangelou et al., 2026). Reported deposition rates span several orders of magnitude, ranging from 0 to over 3500 MPs m−2 d−1 (Allen et al., 2019; Brahney et al., 2020; Dris et al., 2016; Evangelou et al., 2026; Sun et al., 2022; Szewc et al., 2021; Wright et al., 2020). To what extent these differences relate to the different methodologies or reflect spatiotemporal variability remains unclear. This challenges the comparison of data reported from different studies, hinders the establishment of current MP concentrations at local, regional and global scales, and hampers the identification of the processes that drive atmospheric deposition.
Experimentally determined atmospheric deposition rates for Switzerland are missing. To address this knowledge gap and gain a better understanding of the role of the atmosphere in the environmental distribution of MPs, we collected wet and dry atmospheric deposition samples on a four-weekly basis over a one-year period at five sites in Switzerland, including one urban, one suburban, two rural and one mountainous site. Based on optical microscopy images and focal plane array μ-Fourier transform infrared spectroscopy (FPA-μ-FTIR), we determined the wet and dry deposition rates at each site following the approach presented by Ashta et al. (2026b). The mass-based deposition rates at different sites, combined with land-use statistics in Switzerland, were used to estimate the total mass of MPs deposited in regions <2000 m above sea level (a.s.l.) across Switzerland. Note: tire wear particles, i.e. rubber emitted from vehicular tires, were excluded from this study; we therefore use the term MPs to refer to microplastics excluding tire wear particles.
2.1 Sample collection
A modified passive wet and dry deposition sampler (Nesa Srl, Italy) described by Ashta et al. (2026b), and as shown in Fig. 1a, was used to separately collect wet and dry deposition samples depending on the status of precipitation. The catchment area for wet deposition was a disk of diameter 23 cm, whereas for dry deposition it was 19 cm, which translated to 0.042 and 0.028 m2, respectively. The opening of each sampler was at a height of 1.5 m above the ground. Samplers were placed at five measurement stations belonging to Switzerland's National Air Pollution Monitoring Network (NABEL) (Hueglin et al., 2024), which included Zurich (urban), Duebendorf (suburban), Magadino (rural), Payerne (rural) and Chaumont (mountainous; elevation: 1136 m a.s.l.) (Fig. 1b). Details about the sampling locations such as coordinates, elevation and brief descriptions of the surroundings of the sampling stations are provided in Sect. S1 of the Supplement. Wet and dry deposition samples were collected every four weeks at each of these sites between May 2024 and May 2025.
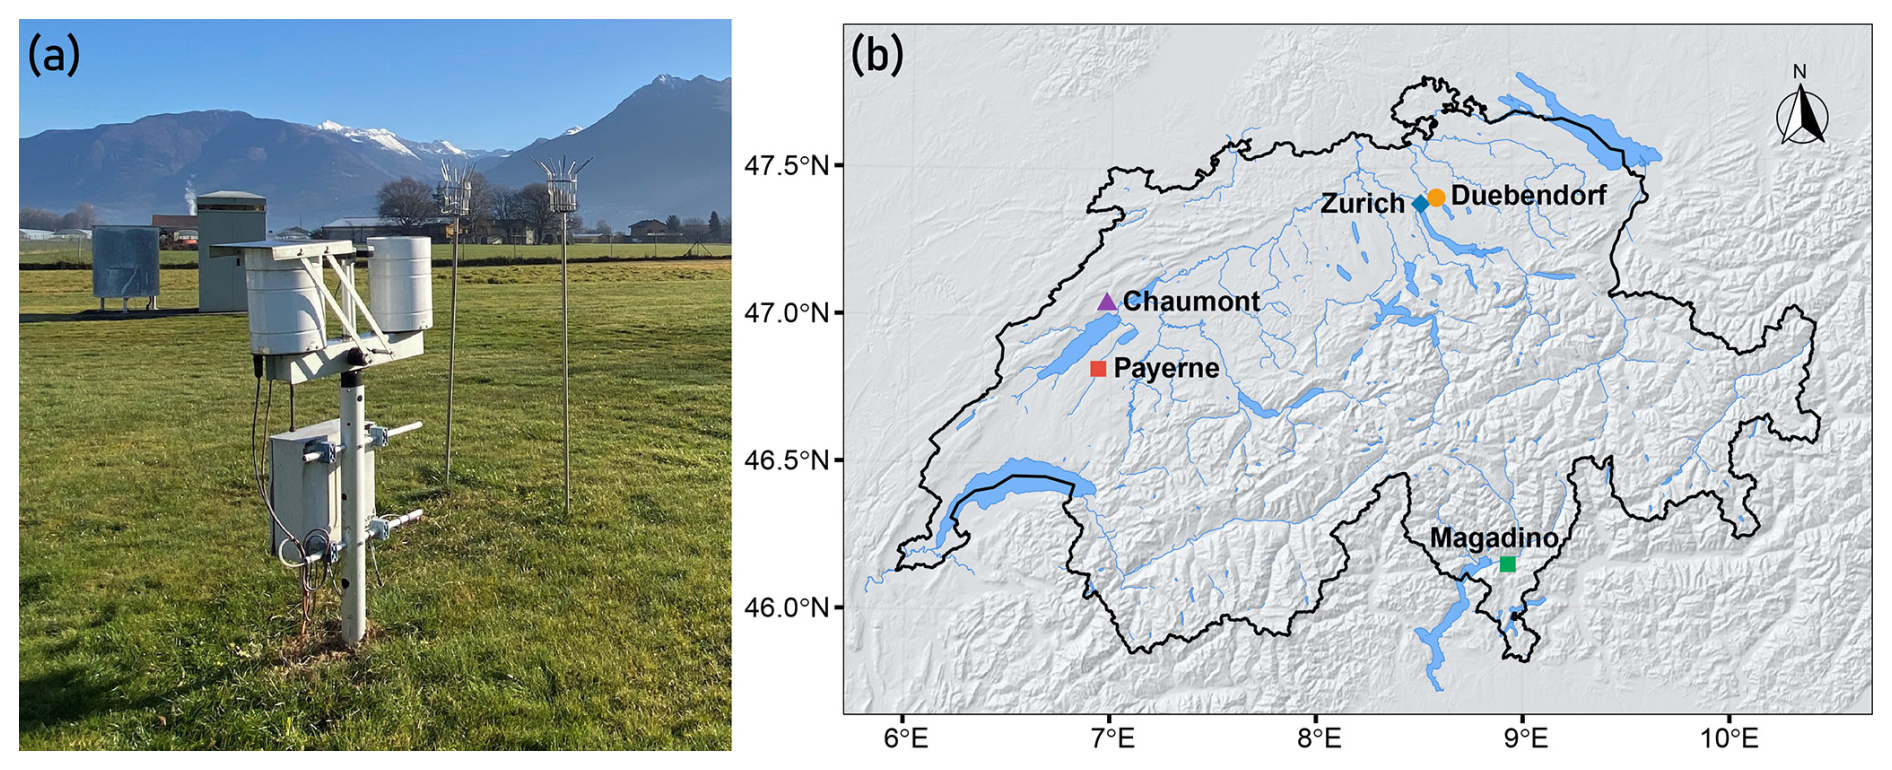
Figure 1(a) Wet and dry atmospheric deposition passive sampler placed at the rural site in Magadino, Switzerland. (b) Map of Switzerland marking the five sampling sites – Zurich (urban), Duebendorf (suburban), Magadino (rural, south of Alps), Payerne (rural, north of Alps) and Chaumont (mountainous; elevation: 1136 m a.s.l.) – where wet and dry atmospheric deposition samples were collected every four weeks between May 2024 and May 2025. Source: OpenStreetMap, distributed under the Open Data Commons Open Database License (ODbL) v1.0 (for further information, please see https://www.openstreetmap.org/copyright/en, last access: 16 August 2026).
2.2 Method to quantify microplastics in wet and dry atmospheric deposition samples
Microplastics in the size range of 20–215 µm were analyzed in wet and dry atmospheric deposition samples following the analytical chain described by Ashta et al. (2026b). Briefly, a known number of red and blue colored polyethylene (PE) spheres (nominal diameter range: 53–63 µm) (Cospheric, USA) were respectively added to the sampling vessels before and after sample collection. These spheres served as surrogate standards used to identify critical steps associated with sample losses along the analytical chain (Ashta et al., 2026b; Philipp et al., 2022). Sample processing steps included a vacuum filtration of collected particles through a cascade of 215 and 15 µm stainless steel meshes to retain particles in the 15–215 µm size range, oxidative digestion using Fenton's reagent to remove natural organic matter, and in rare cases (e.g. after Saharan dust events) density separation using a solution of sodium polytungstate of density 1.6 g mL−1 to remove mineral dust. The remaining particles were deposited onto an aluminium oxide filter and analyzed using optical microscopy and FPA-μ-FTIR spectroscopy. Note: Although the physical lower particle size cutoff is 15 µm based on the smaller mesh size used, the lower particle size limit that can be reliably detected by FPA-μ-FTIR is 20 µm; we therefore report only on MPs > 20 µm.
To chemically identify MPs, experimentally-obtained FTIR spectra were compared to a reference database of FTIR spectra of polymers using Microplastics Finder (Purency, Austria) (Hufnagl et al., 2019, 2022) based on pre-determined thresholds (Ashta et al., 2026b). Based on expert review of the spectra, some polymer types showed remarkable spectral similarities. In particular, PE and ethylene–vinyl acetate copolymer (EVAc) share characteristic ethylene signals, while polyethylene terephthalate (PET) and polybutylene terephthalate (PBT) both contain terephthalate groups, making these pairs difficult to differentiate with standard FTIR libraries. We therefore report the polymer types PET + PBT and PE + EVAc as polymer classes, respectively referred to as PET* and PE*.
Next, the 2D size information of each MP was used to calculate the equivalent ellipsoidal volume based on Simon et al. (2018). Together with the densities of the different polymer types (Table S2), the masses of the MPs were calculated. The number and mass of particles were recovery-corrected based on the recovery of red PE surrogates and blank-corrected based on the average number of MPs found in blanks. Based on these corrected values, number-based deposition rates (NDR) and mass-based deposition rates (MDR) were computed (additional details available in Sect. S2).
2.3 Uncertainty assessment of wet and dry deposition rates
The uncertainty associated with the determined deposition rates was assessed following the framework described by Ashta et al. (2026b). For NDRs, the total expanded uncertainty at a 95 % confidence level UNDR was determined by aggregating the individual components of random uncertainty ui (i=1, …, m) identified along the analytical chain (Table S3). The expanded measurement uncertainty of the mean of n analyzed wet or dry deposition samples (or individual samples if n=1) was calculated as:
For MDRs, the uncertainty budget includes both the random uncertainties UMDR, random (which essentially equals UNDR) and a systematic bias UMDR, systematic associated with particle size-to-mass conversions. This systematic bias was estimated at ±50 %, reflecting potential over- or underestimation during the approximation of 2D particle dimensions to 3D ellipsoidal volumes in the absence of knowledge on the thickness of particles, i.e. the third dimension (Ashta et al., 2026b). To provide a conservative estimate of the confidence intervals of MDRs, the systematic bias was applied to calculate an upper and a lower limit of MDRs according to Eq. (2).
where CIMDR, wet or dry represents the upper and lower bound of the 95 % confidence interval of the determined wet or dry MDR. The combined uncertainty when reporting bulk (wet + dry) deposition Ubulk at a specific site and period was calculated using Eq. (3), where Uwet and Udry represent the respective uncertainties for the wet and dry deposition rates.
Additionally, after the one-year monitoring period of May 2024–May 2025, we further measured duplicates of wet and dry deposition each, collected in two passive wet and dry deposition samplers placed side-by-side (∼1 m apart) at the same site (Duebendorf) over three four-weekly periods between 17 October 2025 and 9 January 2026. This provided uncertainty estimates of deposition rates based on the analyses of true replicates (Table S4).
2.4 Data evaluation and statistical analysis
To assess spatial differences in MP deposition rates across the urban, suburban, rural, and mountainous sites, we employed linear mixed-effects models, where site was treated as a fixed effect and the sampling period was included as a random effect to account for temporal variability and repeated measurements. Differences between sites were identified using pairwise comparisons with Tukey's Honest Significant Difference adjustment to control for Type I error. The Wilcoxon signed-rank test was used to compare paired wet and dry deposition rates (n=65 pairs) across all sampling sites. Spearman's rank correlation analysis was conducted to evaluate the monotonic relationship between four-weekly MDRs or NDRs and parameters such as wind speed, precipitation volume and total aerosol deposition. For all statistical tests, a p-value < 0.05 was considered the threshold for statistical significance. All data processing and statistical computing were performed using R Statistical Software (v4.5.1; R Core Team, 2021).
3.1 Number- and mass-based microplastics deposition rates
Over the one-year period and across the five sampling sites in Switzerland, wet deposition rates based on individual four-weekly samples ranged from not detected (n.d.) to 509 MPs m−2 d−1 in terms of numbers and n.d. to 41 µg m−2 d−1 in terms of mass, whereas dry deposition rates ranged from n.d. to 1388 MPs m−2 d−1 and n.d. to 104 µg m−2 d−1, respectively. Mean deposition rates at each site, including 95 % confidence intervals, are shown in Table 1.
Table 1Mean wet, dry and bulk number-based (NDR) and mass-based (MDR) microplastic deposition rates averaged over n=13 four-weekly sampling periods between May 2024 and May 2025 in Zurich (urban), Duebendorf (suburban), Magadino (rural), Payerne (rural) and Chaumont (mountainous), Switzerland. Corresponding 95 % confidence intervals (CI) are calculated based on random and systematic measurement uncertainties as in Eqs. (1)–(3).
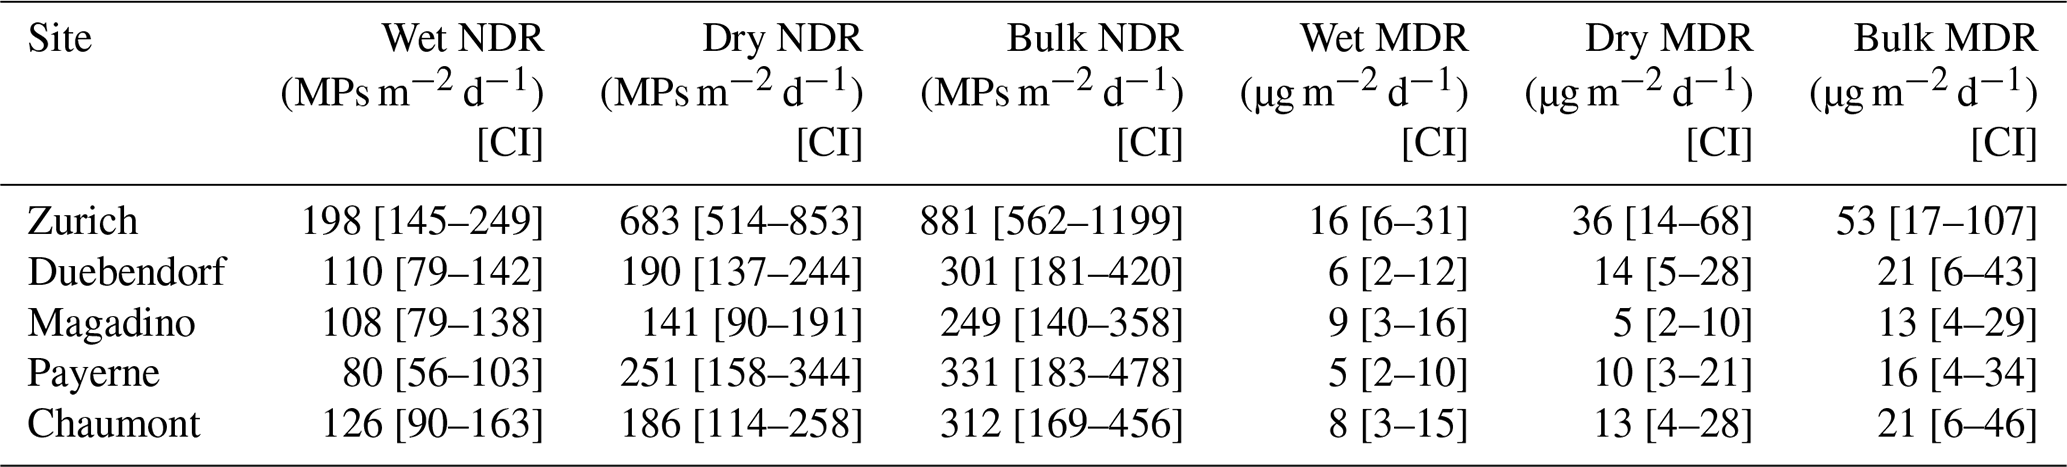
The urban site, Zurich, exhibited the highest number- and mass-based wet and dry deposition rates, which were over 2 times higher than those of the other sampling sites (p<0.01). This suggests that urban areas, which are generally associated with more anthropogenic activity compared to suburban or rural areas, have higher local emissions of MPs to air and consequently higher MP deposition rates in the vicinity. The sampling station in Zurich is adjacent to a popular recreational park, which may further contribute to locally elevated emissions through increased human presence and outdoor activities. To what extent the results from Zurich can be transferred to other cities in Switzerland needs to be explored in further studies.
The suburban site in Duebendorf displayed similar deposition rates as those at the rural (Magadino and Payerne) and mountainous sites (Chaumont). This absence of a gradient going from suburban to rural to mountainous areas aligns closely with the findings of Klein et al. (2023), who reported higher deposition rates at urban sites in Hamburg but lower and similar deposition rates in suburban Hamburg and rural sampling sites in Northern Germany. The trend observed in the present study may have several reasons. First, the random measurement uncertainty of individual samples is in the order of ∼100 % (see Sect. S3), which makes it difficult to resolve subtle differences in the determined deposition rates. Second, our results suggest a ubiquitous atmospheric background level of MPs in Switzerland, irrespective of land-use types. This aligns with studies on the long-range atmospheric transport of MPs, which observe baseline MP concentrations even in remote and high-altitude regions (Allen et al., 2019; Brahney et al., 2021; Evangeliou et al., 2020).
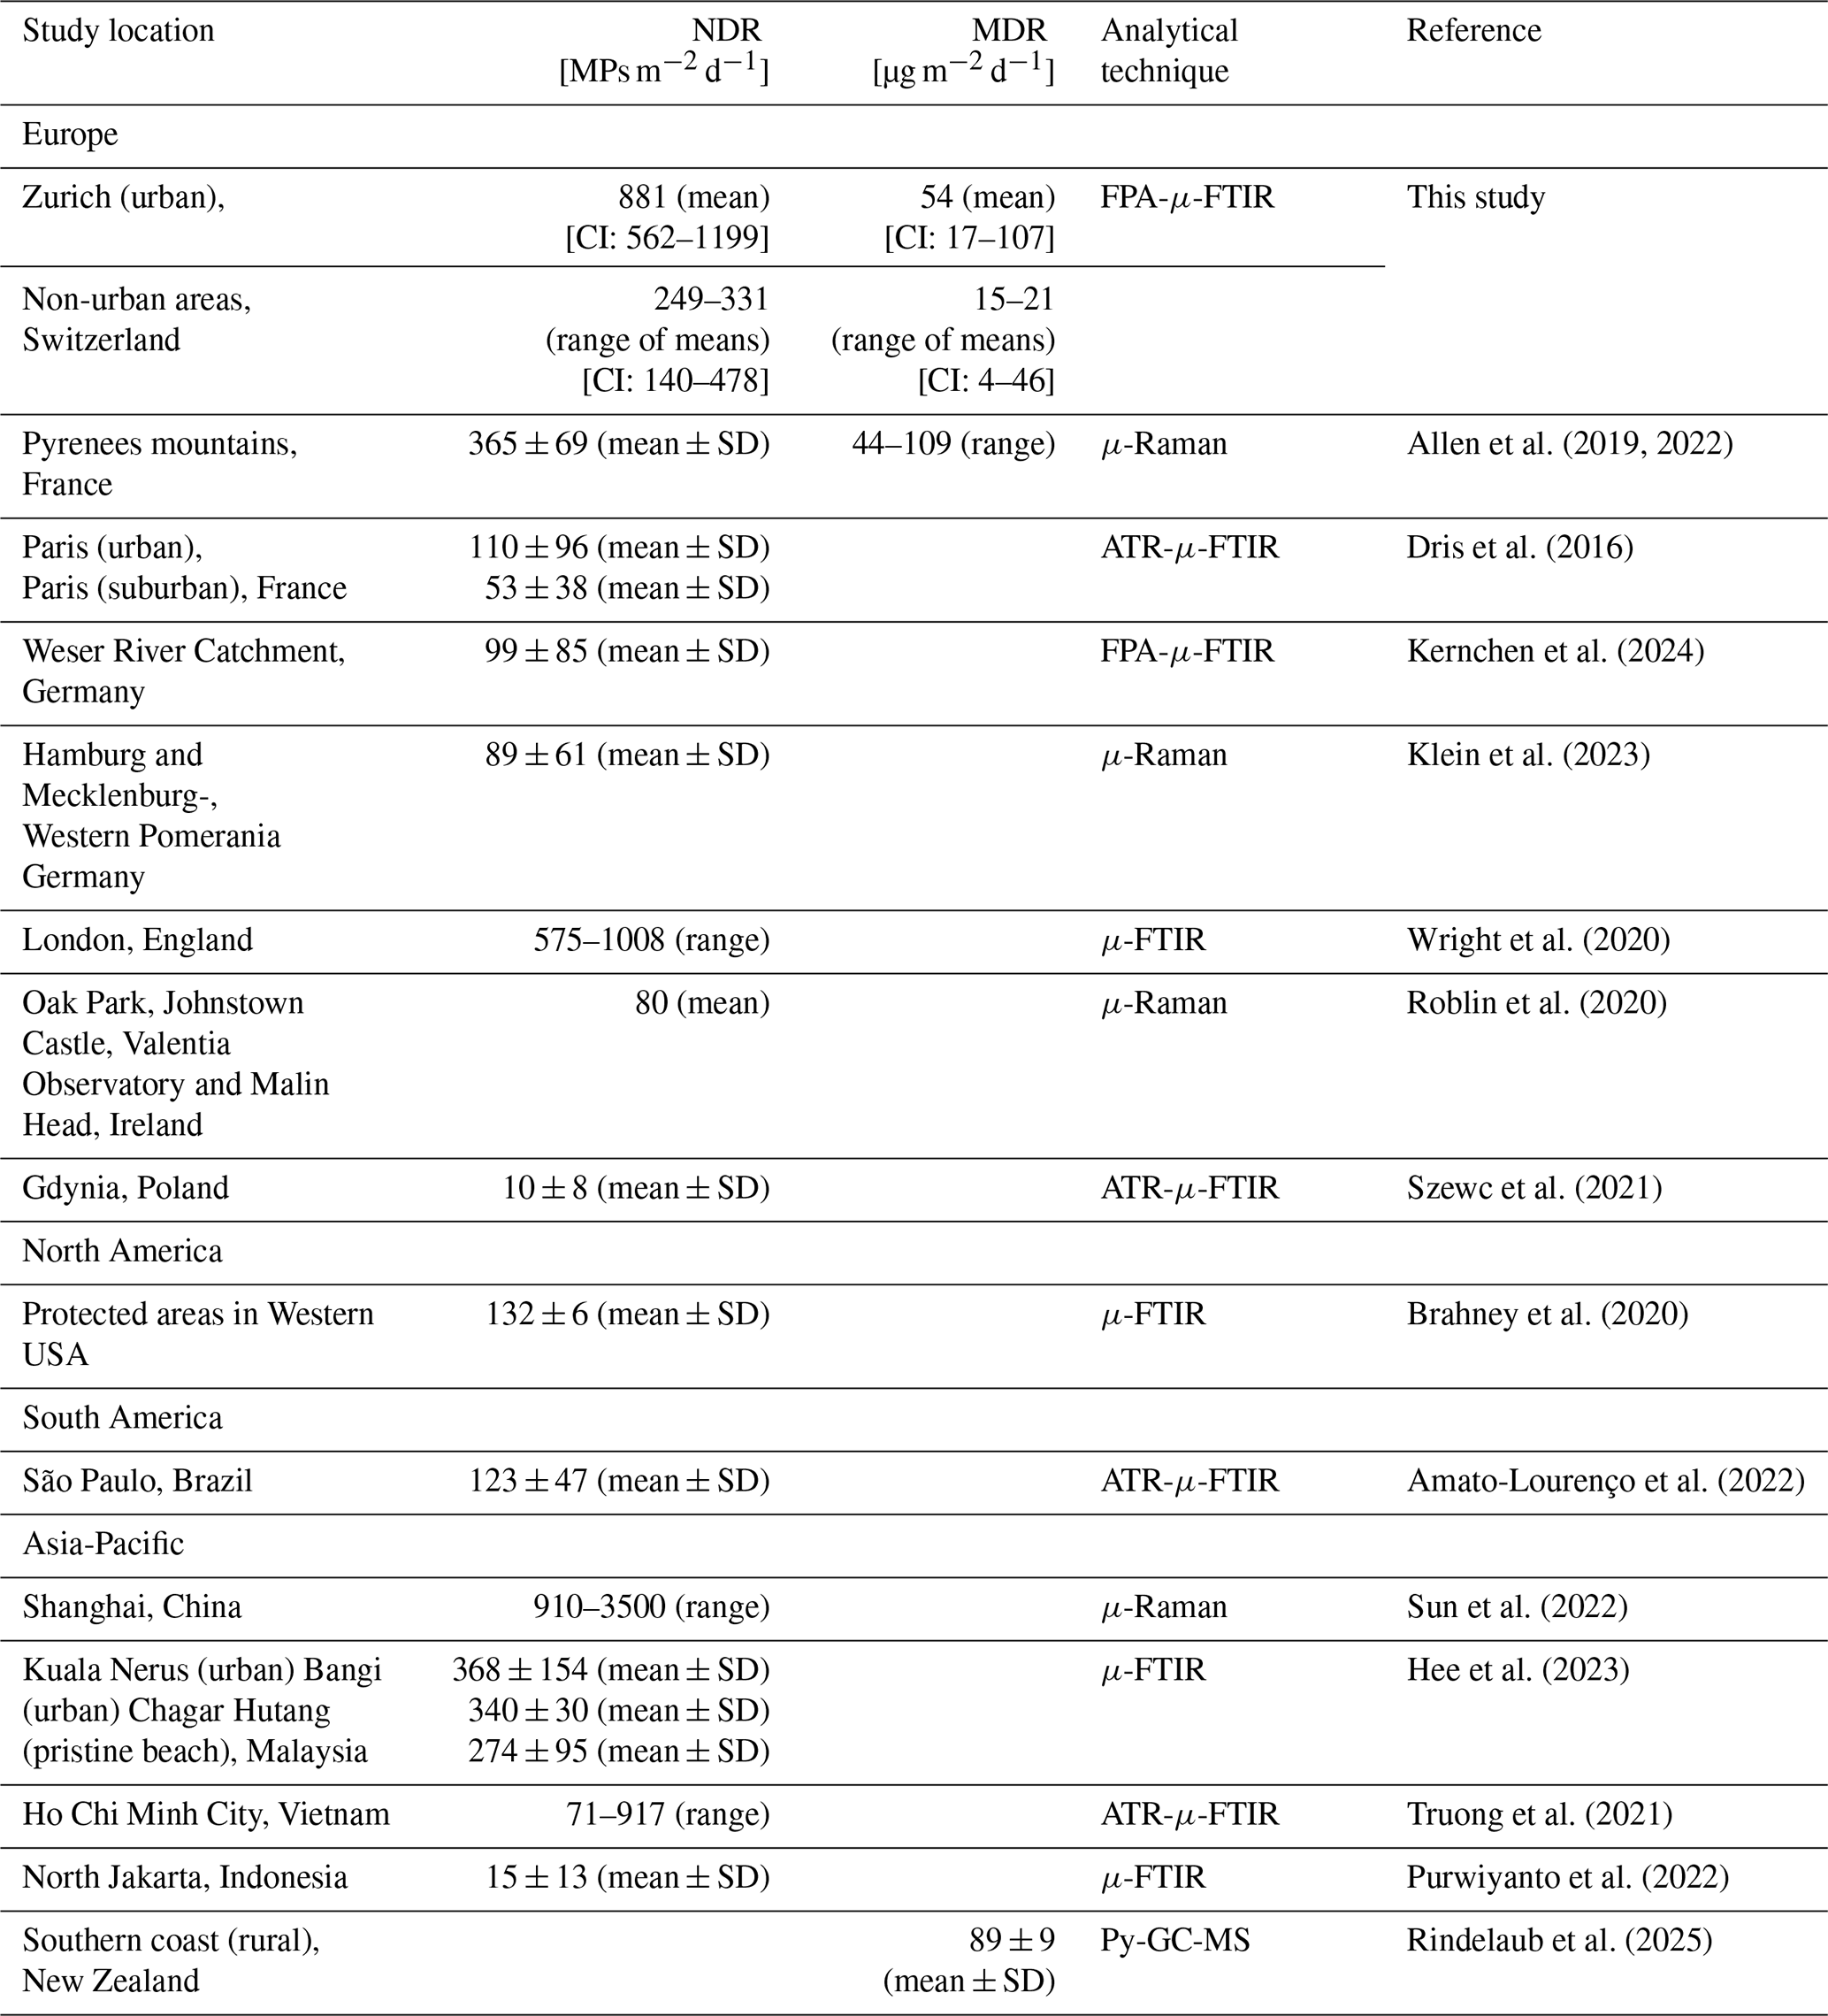
Although direct comparisons with studies from other locations remain challenging due to methodological differences, the MP deposition rates were in line with previous studies (Table 2), and were generally higher than the global median bulk deposition rate of 35 MPs m−2 d−1 determined based on n=1007 values reported in the literature (Evangelou et al., 2026). Compared to cities with similar population densities of ∼4000–5000 inhabitants per km2, the Zurich site's mean (±SD) NDR of 881±240 MPs m−2 d−1 was similar to that of London, England (mean: 771±167 MPs m−2 d−1) (Wright et al., 2020) but lower than that of Shanghai, China (wet: 1100–3500 MPs m−2 d−1, dry: 910–1600 MPs m−2 d−1) (Sun et al., 2022).
Table 2Number-based (NDR) and mass-based (MDR) microplastic deposition rates, including analytical techniques, reported in selected studies worldwide. MPs = microplastics, CI = 95th percentile confidence interval, SD = standard deviation, μ-FTIR = single-point μ-Fourier transform infrared spectroscopy, FPA-μ-FTIR = focal plane array μ-FTIR, ATR-μ-FTIR = attenuated total reflectance μ-FTIR, Py-GC-MS = pyrolysis-gas chromatography-mass spectrometry.
The determined deposition rates mainly reflected site-specific characteristics rather than distinct seasonal patterns (Fig. 2). At the urban site in Zurich, MP deposition rates were similar throughout the year, indicating constant atmospheric MP loads. At the non-urban sites, deposition rates were more variable. Elevated deposition rates at non-urban sites were determined for a few individual months and may reflect either temporal variability or sporadic local events.
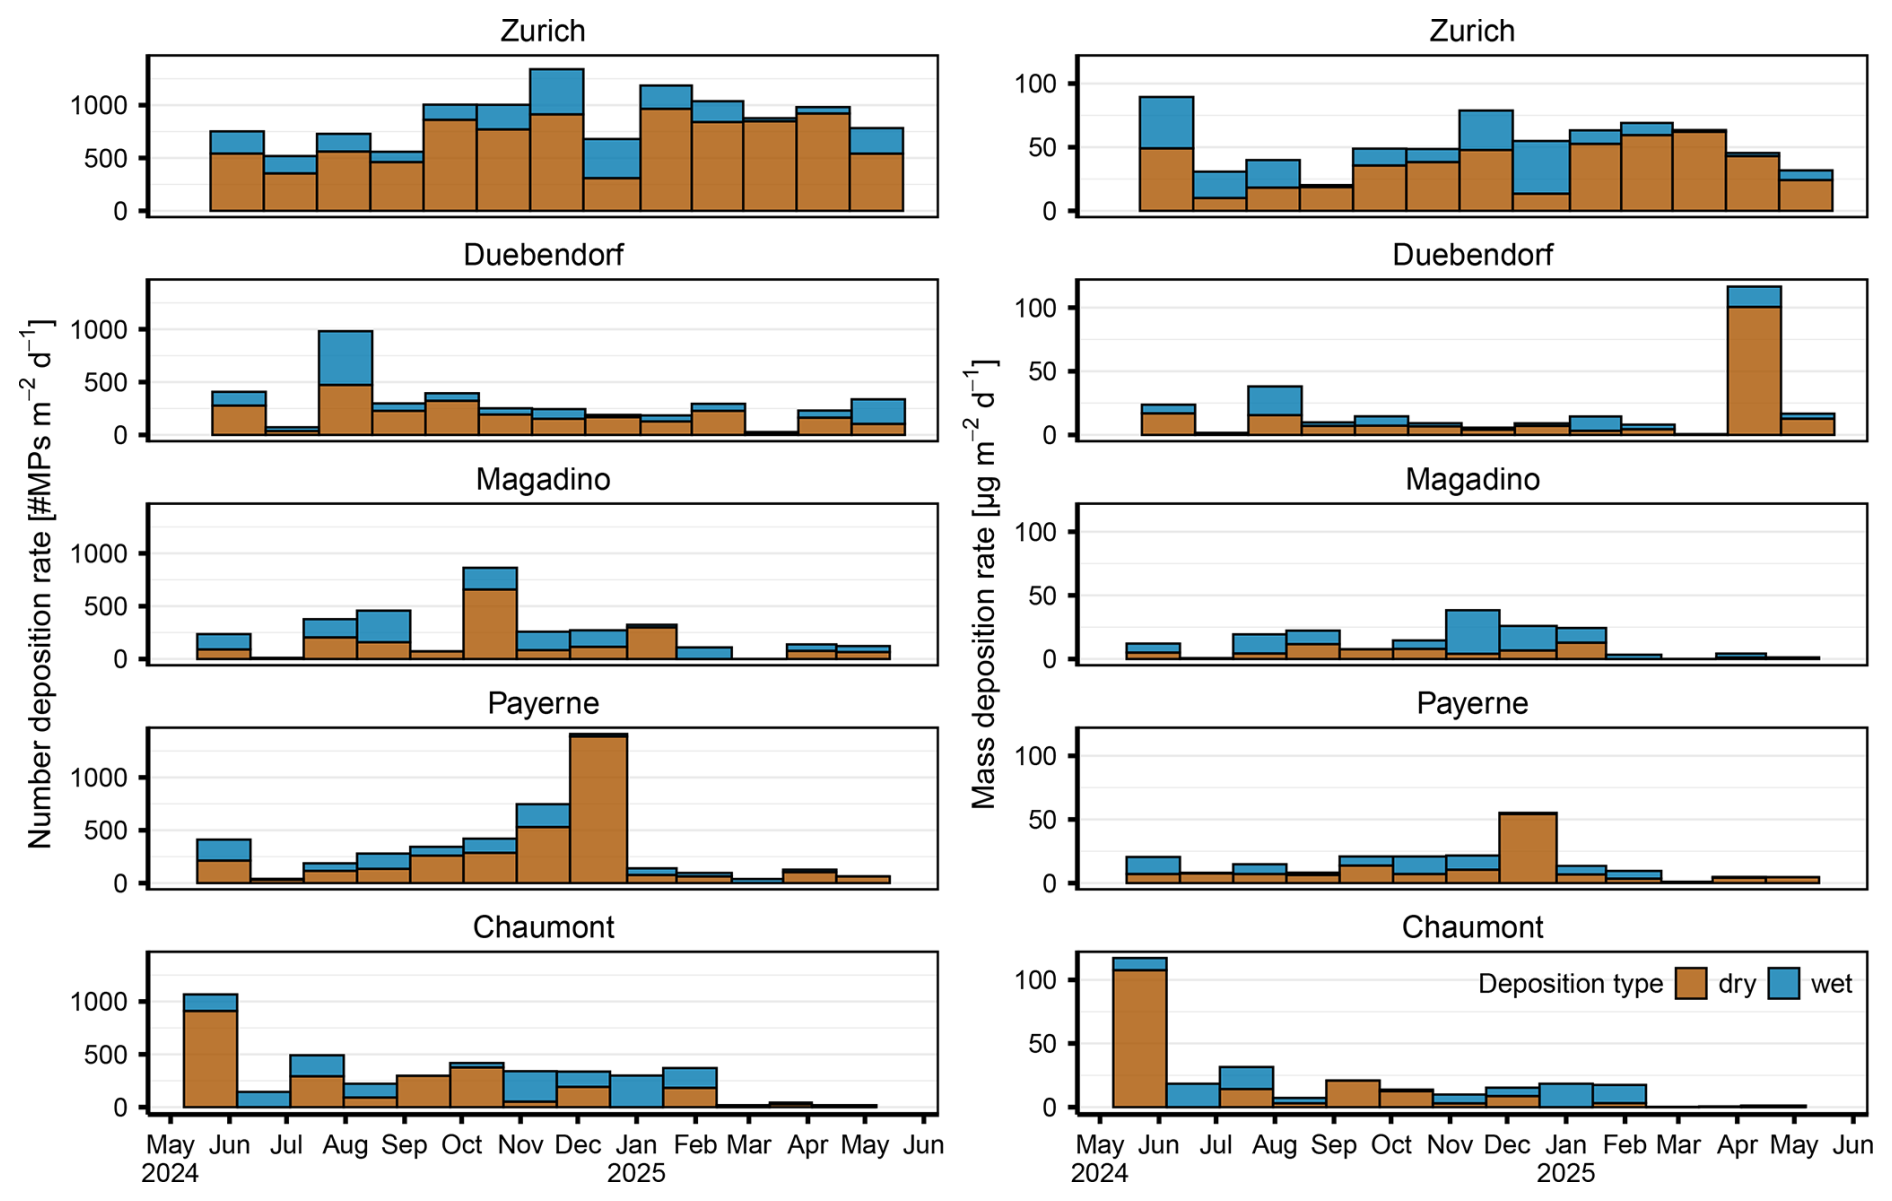
Figure 2Four-weekly number-based (left panels) and mass-based (right panels) wet and dry atmospheric microplastic deposition rates between May 2024 and May 2025 in Zurich (urban), Duebendorf (suburban), Magadino (rural), Payerne (rural) and Chaumont (mountainous), Switzerland.
To put the mass-based MP deposition rates in the context of total suspended particulate matter, four-weekly MP deposition rates were compared to the corresponding rates of total aerosol deposition, which is regularly measured within Switzerland's NABEL network using the Bergerhoff method (Verein Deutscher Ingenieure, 2012). The highest MP-to-aerosol mass ratio was observed in Zurich (1.2 mg g−1 aerosol, or 0.12 % of total aerosol mass), while the lowest value was found in Magadino (0.2 mg g−1 aerosol, or 0.02 % of total aerosol mass) (Table S5). In terms of particle number, the concentrations ranged from 3000 to 20 000 MPs g−1 aerosol. These results indicate that MPs represent a minor, yet quantifiable component of ambient aerosol mass.
3.2 Influence of meteorology on MP deposition rates
Across the five sampling sites, dry deposition rates were generally higher than wet deposition rates and accounted for 61 % of total annual MP mass deposition. However, the overall difference in wet and dry deposition rates was not statistically significant (Wilcoxson signed-rank test, p=0.09). These findings are in agreement with results reported by Brahney et al. (2020), who observed a higher contribution of dry deposition (75 %) to total MP deposition in remote areas in Western USA, as well as those of Abbasi and Turner (2021a), who found dry deposition to dominate (>90 %) annual MP deposition at an urban and mountainous site in Iran. Other studies, however, reported wet deposition as the dominant contributor to total MP deposition (Sun et al., 2022; Szewc et al., 2021). The partitioning between wet and dry deposition likely depends on the climatic conditions of the study locations.
Weak correlations were observed between MP deposition rates and specific meteorological parameters such as wind speed, precipitation and total aerosol deposition (Spearman ) (Table S6), consistent with those reported in previous studies (Adediran et al., 2026; Allen et al., 2019; Cho et al., 2026; Szewc et al., 2021). The poor correlations between meteorological parameters and determined deposition rates in this study may be partly attributed to the low sampling frequency. The four-week sampling period required to obtain sufficient MP counts may mask shorter-term relationships between specific meteorological events and MP deposition rates.
3.3 Polymer type, particle size, mass and shape of MPs detected in wet and dry atmospheric deposition samples
Polymer type: Across all 130 wet and dry atmospheric deposition samples collected during the one-year period, the most frequently detected polymers were PET* (31 %), PE* (26 %) and polypropylene (PP) (21 %) (Fig. 3). Other detected polymers included polystyrene, polymethyl methacrylate, polyurethane, polylactic acid, polyacrylonitrile (PAN), silicone, polyvinyl chloride (PVC), acrylonitrile butadiene styrene, ethylene vinyl alcohol, polyoxymethylene and polyether ether ketone. The polymer composition of atmospheric MPs was largely independent of sampling site or deposition type (Fig. S1).
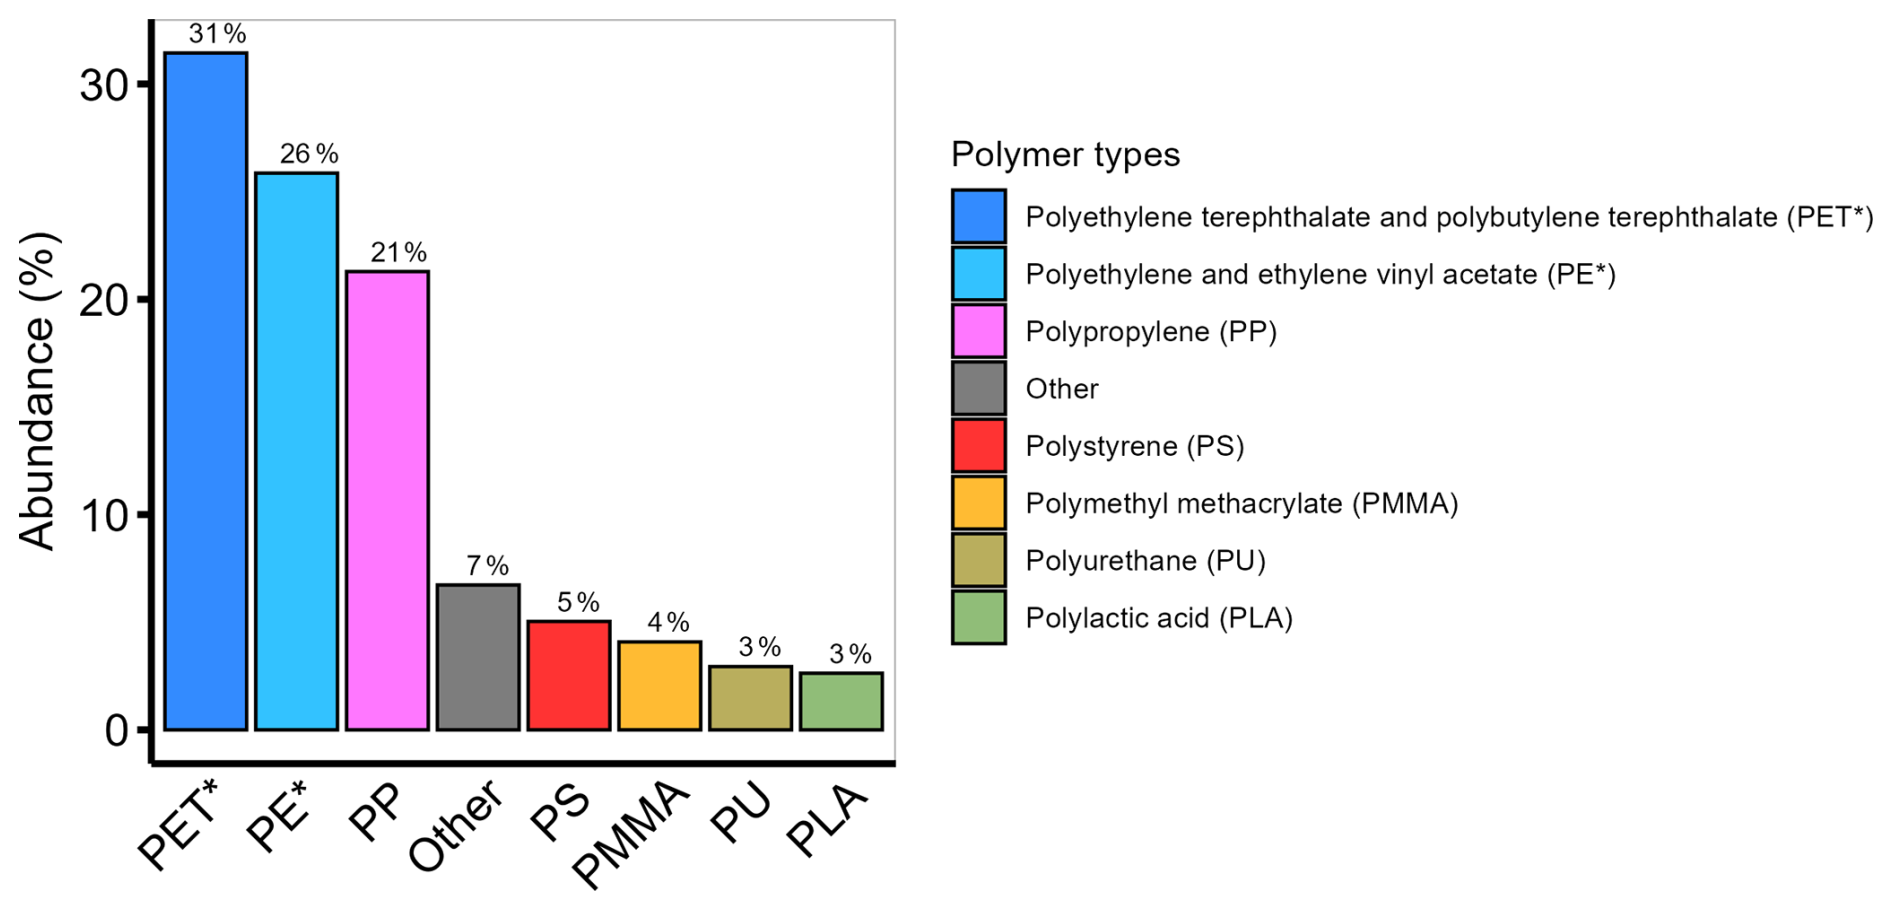
Figure 3Percentage of different polymer types comprising the microplastic particles (n=7150) detected in wet and dry deposition collected between May 2024 and May 2025 in Zurich (urban), Duebendorf (suburban), Magadino (rural), Payerne (rural) and Chaumont (mountainous), Switzerland. The polymer type “other” includes polyacrylonitrile, silicone, polyvinyl chloride, acrylonitrile butadiene styrene, ethylene vinyl alcohol, polyoxymethylene and polyether ether ketone.
The dominance of PET*, PE* and PP in our samples aligns with polymer distributions reported in several European studies on atmospheric deposition, including in countries neighboring Switzerland. In urban Paris, for instance, PET fibers were found to be ubiquitous (Dris et al., 2016), while a dominance of PE* and PET was observed in Northern Germany (Klein et al., 2023; Klein and Fischer, 2019). Furthermore, this composition corresponds reasonably well with the polymer demand in Europe, where PE (29 %) and PP (20 %) represent the largest share of material production (PlasticsEurope, 2022).
A notable divergence appears for PET, which accounts for 8 % of European polymer demand but 31 % of the MPs detected in atmospheric deposition. This may be explained by the uses of PET in different consumer products. For one, PET is the most widely used polymer in polyester textile fibers globally (Geyer et al., 2017). Clothing-related emissions, including shedding during wear and handling, have been recognized as contributors to atmospheric fibers (Dris et al., 2017; Henry et al., 2019). We observed a considerable fraction of PET fibers in our dataset (Fig. S2). Furthermore, PET is used for beverage bottles and packaging materials. These items are frequently littered, undergo fragmentation in the environment, and contribute to secondary MP pollution (United Nations Environment Programme, 2021). Similarly, PVC, despite representing 10 % of European polymer demand, is detected at only 1.5 % in atmospheric samples. This may be explained by the fact that PVC is typically used in long-lifetime applications in buildings (Geyer et al., 2017), and therefore may be less likely fragmented and emitted into ambient air.
Particle size: The particle size distribution including all MPs (n=7150) detected across the five sites is shown in Fig. 4. Particle sizes are reported as equivalent circle diameters (ECD), i.e. the diameter of a circle with an area equaling the area of the 2D projection of the measured particle. The mean and median particle sizes were 39 and 32 µm, respectively. Smaller particles were substantially more abundant, resulting in a right-skewed number size distribution, which is consistent with previous studies on atmospheric MPs (Allen et al., 2019; Chen et al., 2023; Klein and Fischer, 2019; Szewc et al., 2021; Wright et al., 2020) as well as MPs in other environmental compartments (e.g. Kooi et al., 2021).
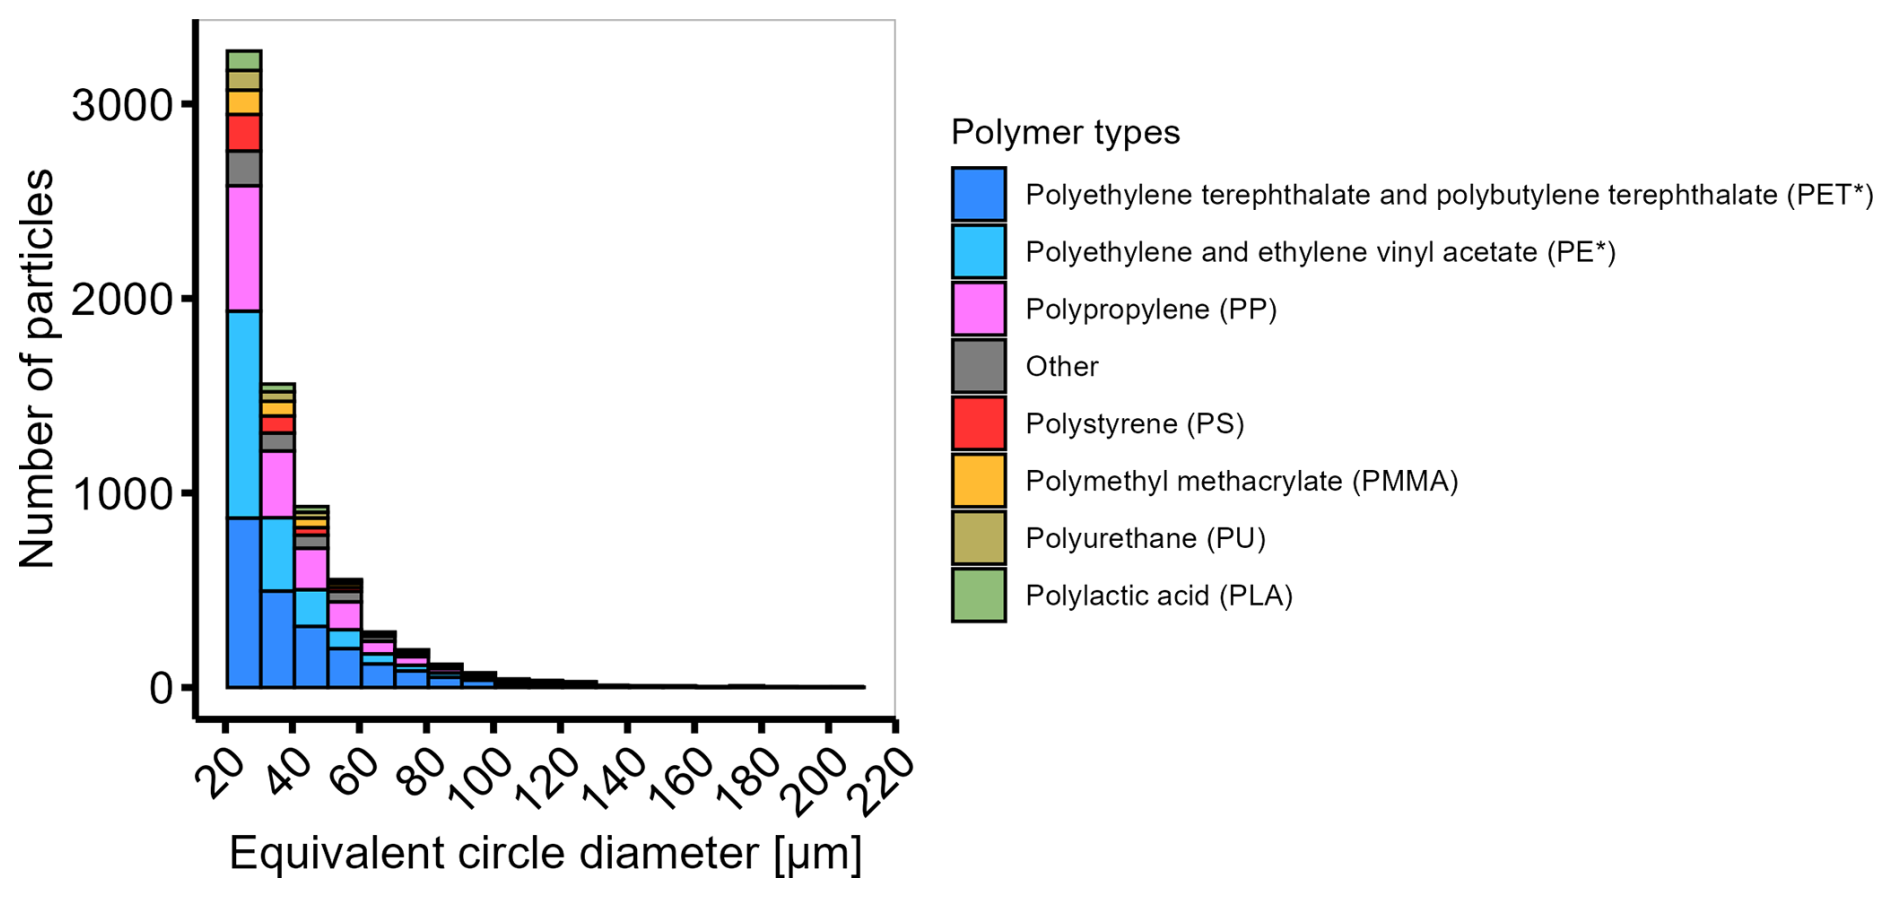
Figure 4Particle number size distribution including polymer types of microplastic particles (n=7150) detected in wet and dry deposition collected between May 2024 and May 2025 in Zurich (urban), Duebendorf (suburban), Magadino (rural), Payerne (rural) and Chaumont (mountainous), Switzerland. The polymer type “other” includes polyacrylonitrile, silicone, polyvinyl chloride, acrylonitrile butadiene styrene, ethylene vinyl alcohol, polyoxymethylene and polyether ether ketone.
The particle number size distribution of MPs in wet and dry deposition (nMP(ECDMP)) at each site was fitted to a power law function, i.e.
with b a constant, and α the exponent that is characteristic for the change in particle numbers with size; α corresponds to the slope on a log-log transformed particle size distribution. Although higher in MP numbers, the size distribution was similar in Zurich compared to the non-urban sites (Fig. 5), as indicated by the slopes (α) of the power law fits. This indicates a small influence of the urban-to-rural spatial gradient on the particle size distribution. The MP number size distributions from wet and dry deposition for each site were also similar (Fig. S2). It is noted, however, that the number size distributions appear to slightly deviate from the power law at the lower and upper size limits. For small particles, this may reflect methodological limitations such as selective losses during sample processing or reduced detection efficiency of FPA-μ-FTIR for particle sizes approaching the method's lower size detection limit of 20 µm. The deviation observed for larger particles may be an artifact related to the low absolute particle numbers, which limits the robustness of the fit in the upper size classes.
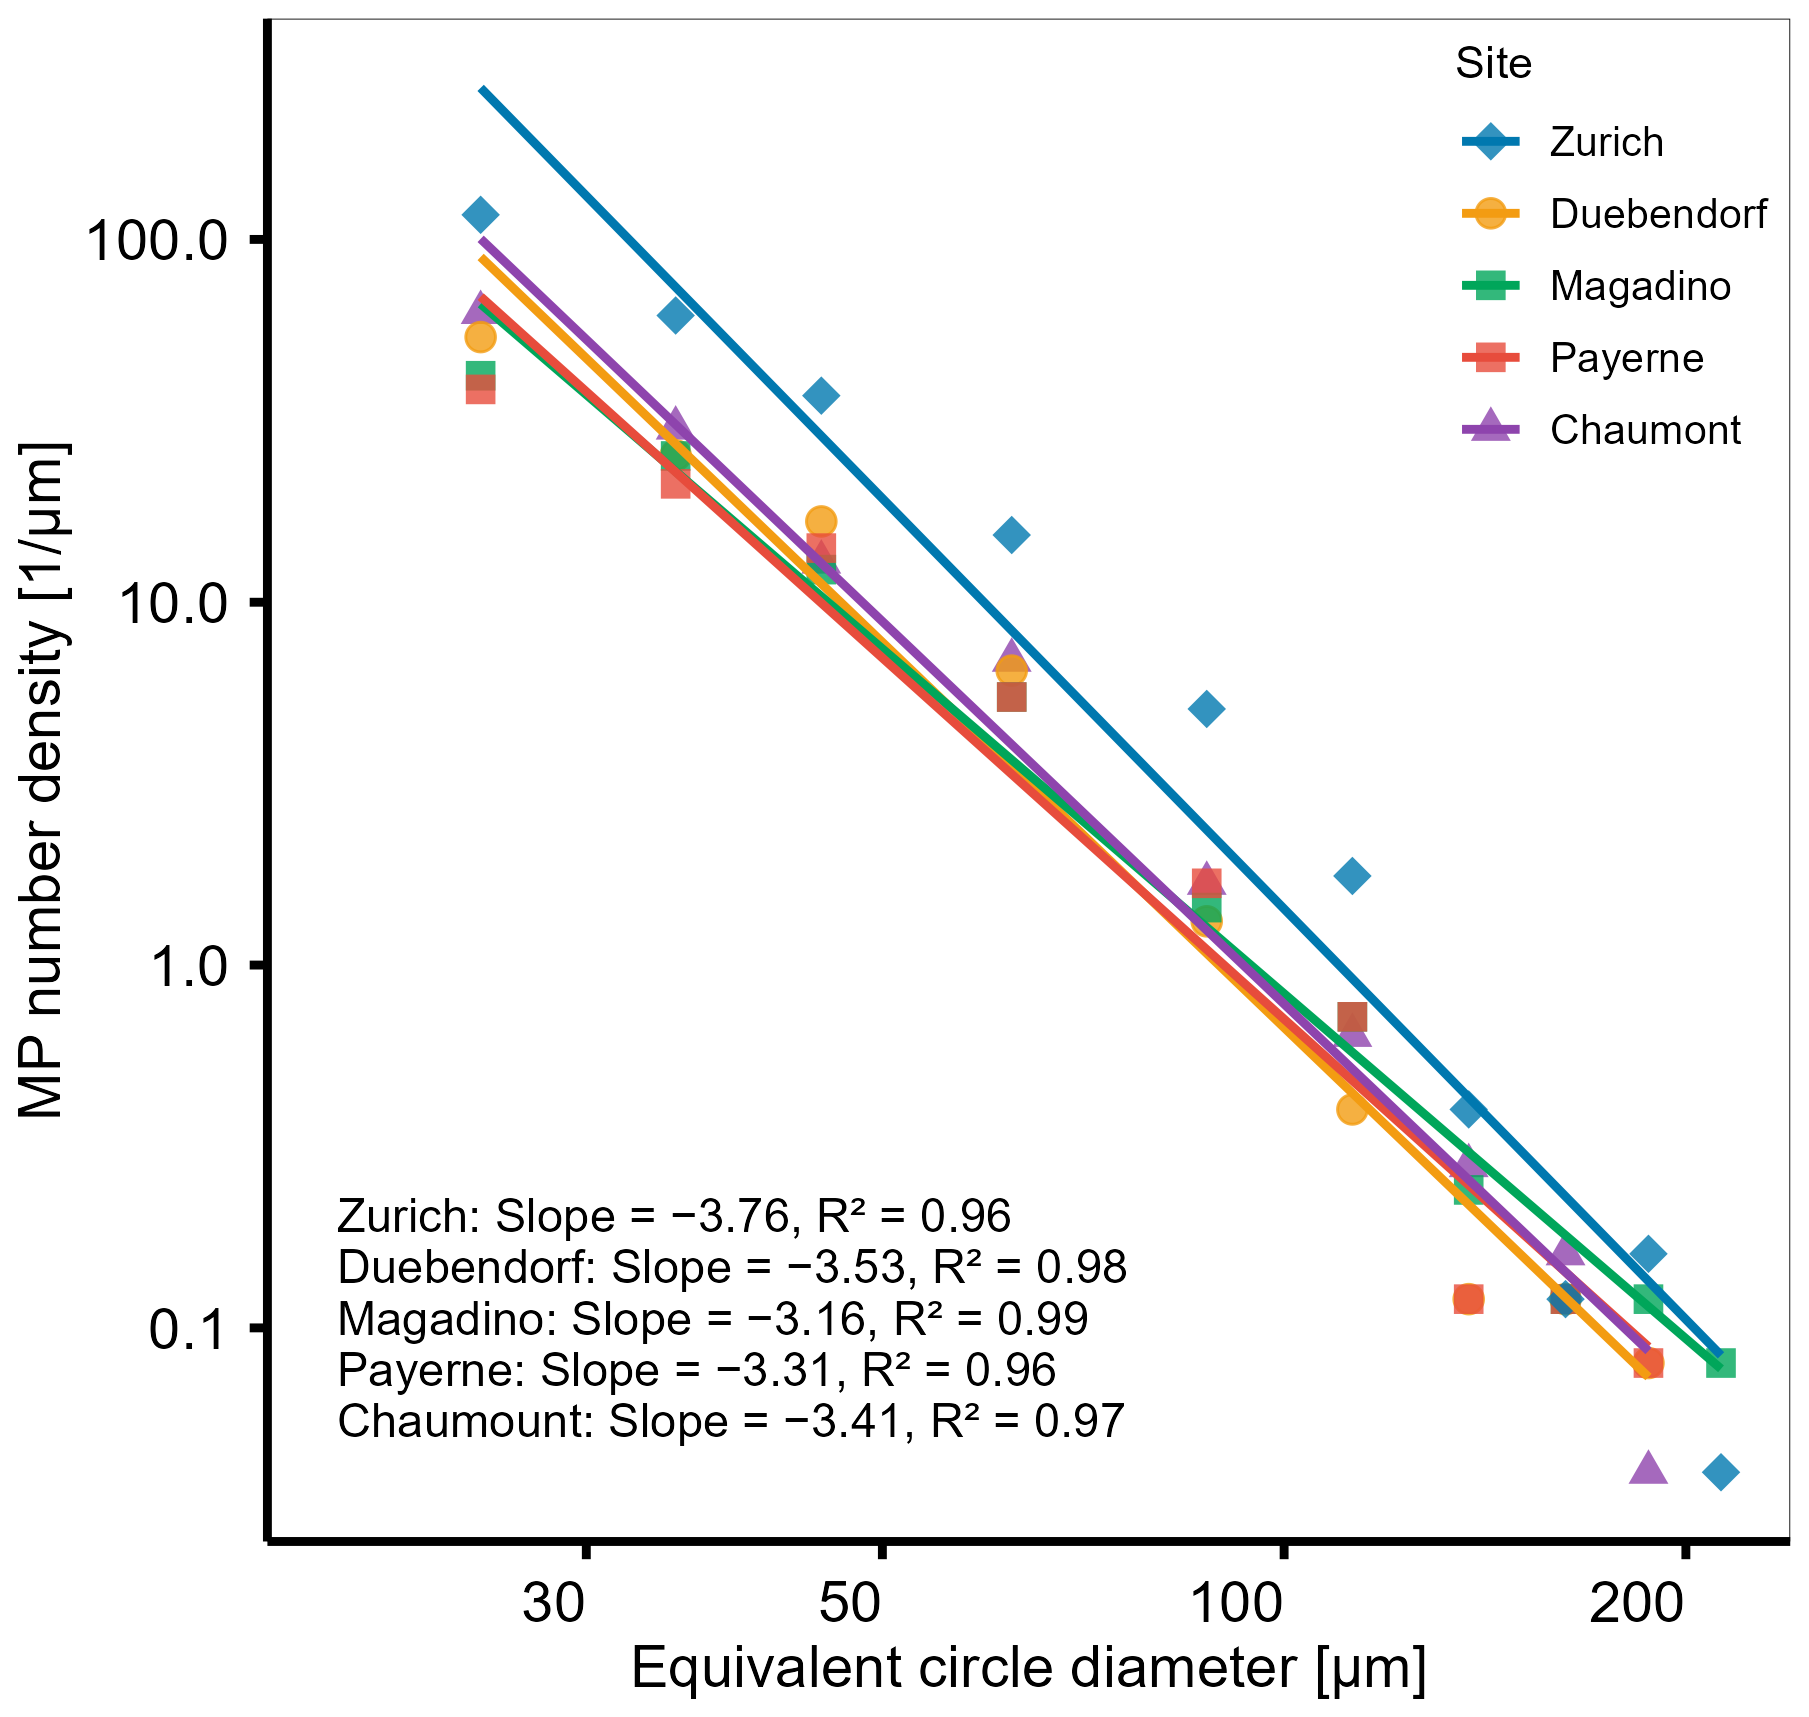
Figure 5Power law function fitted to the particle number size distributions of microplastic particles detected in wet and dry deposition collected between May 2024 and May 2025 in Zurich (urban), Duebendorf (suburban), Magadino (rural), Payerne (rural) and Chaumont (mountainous), Switzerland.
Based on the particle sizes and number-based dry deposition rates listed in Table 1, airborne MP number concentrations were estimated using deposition velocities taken from Emerson et al. (2020). The MP number size distribution in the present study shows a dominance of particles in the smallest size bin (20–30 mm) and a mean particle size of 39 mm. Assuming MP deposition velocities of 0.1 and 0.2 m s−1, which respectively correspond to particles of diameters 20 and 40 µm (Emerson et al., 2020), the mean dry deposition rate of 683 MPs m−2 d−1 measured at the Zurich site corresponds to an airborne MP number concentration of approximately 0.08 to 0.01 MPs m−3. Although the assumed deposition velocities are only a rough estimate and the resulting number concentrations of airborne MPs should be interpreted with caution, the values fall within the interquartile range of 0.002–0.1 MPs m−3 based on n=925 measured airborne MP concentrations reported globally (Evangelou et al., 2026). To put these values into context, but given the limited literature available regarding aerosols larger than 20 µm, we roughly compared our airborne MP concentration estimate of 0.08 MPs m−3 to the concentration of >20 µm sized aerosols of up to 330 particles m−3 observed by Lasher-Trapp and Stachnik (2007). Based on these values, MPs likely represent a minor number fraction of well below 0.1 % of >20 µm sized aerosols.
Particle volume and mass: Particle sizes were converted to equivalent ellipsoid volumes following the approach presented by Simon et al. (2018), which were subsequently converted to mass. The resulting size-volume distribution (Fig. 6) demonstrated the importance of large particles substantially contributing to the total particle volume or mass of MPs despite their low number concentrations. Individual particle masses were found to span 6 orders of magnitude, ranging from 0.6 to 1.8×10⁴ ng, with a mean mass of 62 and a median of 12 ng.
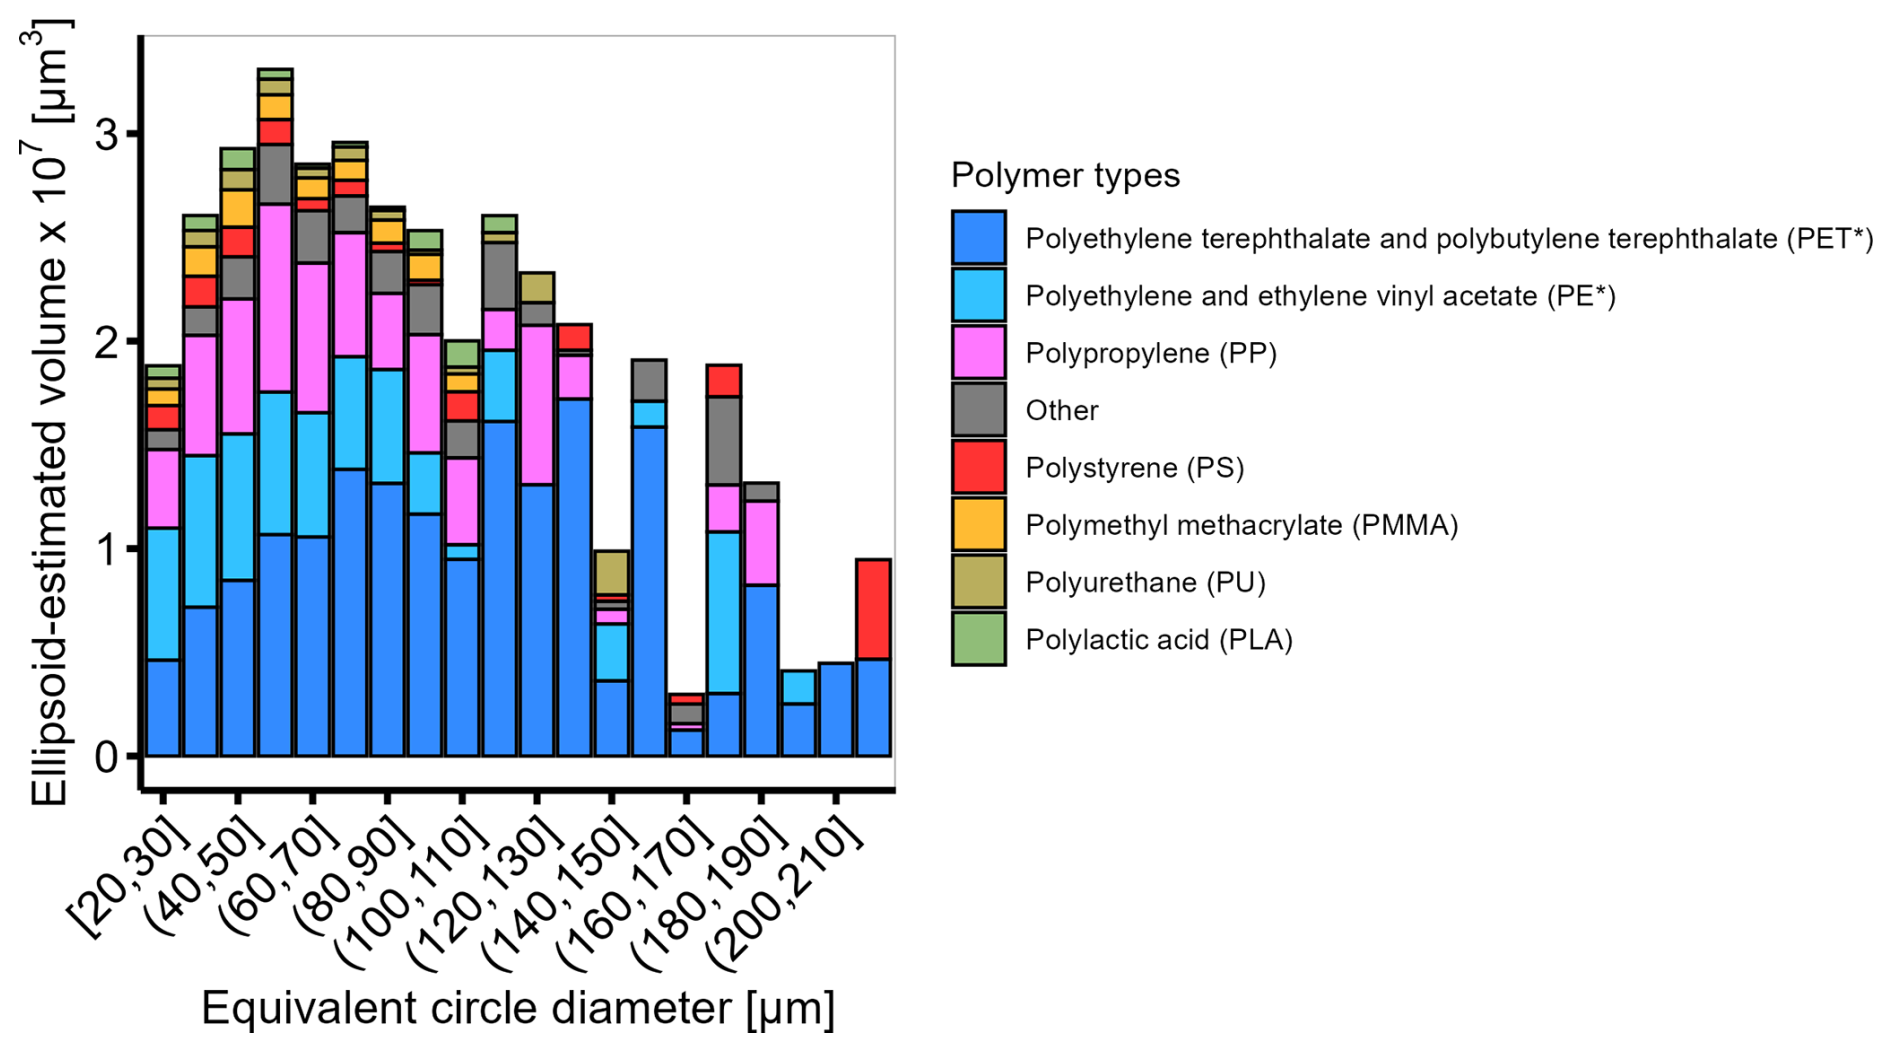
Figure 6Particle volume size distribution including polymer type as estimated based on measured sizes of microplastic particles (n=7150) detected in wet and dry deposition collected between May 2024 and May 2025 in Zurich (urban), Duebendorf (suburban), Magadino (rural), Payerne (rural) and Chaumont (mountainous), Switzerland. The polymer type “other” includes polyacrylonitrile, silicone, polyvinyl chloride, acrylonitrile butadiene styrene, ethylene vinyl alcohol, polyoxymethylene and polyether ether ketone.
Particle shape: Based on 2D projections obtained from FTIR imaging and applying the aspect-ratio criterion of Hartmann et al. (2019), i.e. where a particle with aspect ratio () ≥3 is classified as a fiber, we classified MPs as either fibers or non-fibers. Most MPs detected in atmospheric deposition samples were non-fibers (89 %) (Fig. S3). Notable exceptions were PAN- and PET-type MPs, for which 56 % and 22 % were fibers. These observations are consistent with the widespread use of PAN and PET in textile applications from which fibers are expected to be released under realistic use conditions (Boucher and Friot, 2017; Browne et al., 2011; Carney Almroth et al., 2018; Geyer et al., 2022). Moreover, the findings are similar to those of Wright et al. (2020), who reported PAN and PET to be the most abundant polymer types among the MP fibers detected in atmospheric deposition in the city of London, England.
The dominant MP shapes reported in the literature vary substantially across studies, with some studies reporting higher fractions of non-fibers (e.g. Allen et al., 2019; Klein et al., 2023; Klein and Fischer, 2019; Sun et al., 2022) and others reporting fibers as being more abundant (Abbasi et al., 2022; Brahney et al., 2020; Szewc et al., 2021). However, the latter typically relied on analytical techniques that heavily involved a visual pre-screening of suspected MPs prior to spectral analysis (e.g. attenuated total reflectance μ-FTIR, single-point μ-FTIR, Raman spectroscopy). Such workflows inherently bias the dataset toward fibers because they are easily identifiable by operators during pre-screening, whereas automated and randomized imaging, like the one employed in this study, provide a less morphology-biased assessment. It should be noted, however, that in our automated workflow we had situations where a fiber was detected and counted as two or more non-fibers, rather than as one particle. This may have resulted in a bias toward non-fibers. Therefore, the apparent differences in morphology reported across the literature may reflect methodological discrepancies in particle isolation, detection, and classification, rather than true environmental or geographical variability. This highlights the need for standardized analytics to more accurately compare MP shape across studies.
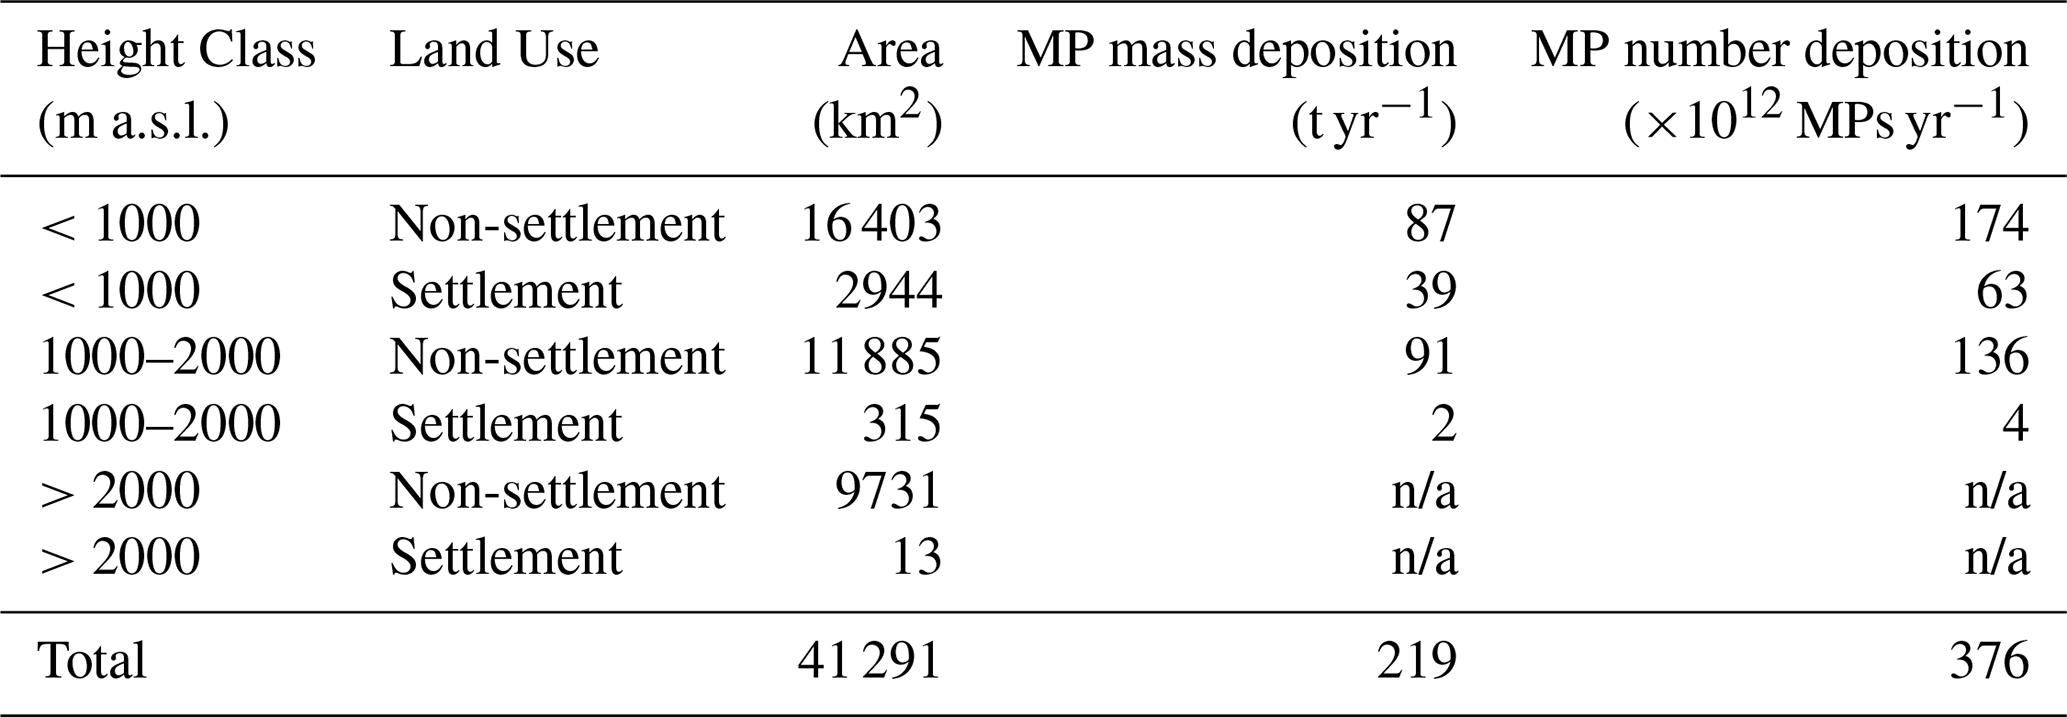
Table 3Total annual mass-based and number-based atmospheric bulk deposition of microplastics (MP) in settlement and non-settlement areas at different altitudes in Switzerland. n/a = not applicable.
3.4 Extrapolation of site-specific MP deposition rates to annual MP deposition across Switzerland
To estimate the nationwide annual atmospheric MP deposition across Switzerland, we combined our measured MP deposition rates with two national geospatial datasets at 100 m resolution: the land-use model NOAS04_17 (Federal Statistical Office, 2025) and the GEOSTAT digital elevation model (Federal Statistical Office, 2014). For each grid cell, the land-use type and elevation were linked, and elevation was grouped into three classes (<1000, 1000–2000, >2000 m). The 17 detailed land-use categories were aggregated into two main classes – settlement and non-settlement – to quantify their relative area within each elevation zone. Atmospheric deposition measurements from the five monitoring sites were then assigned to land-use and elevation classes by assuming that areas below 1000 m receive deposition typical of urban (Zurich, Duebendorf) or rural/agricultural (Magadino, Payerne) stations and mid-elevation zones (1000–2000 m) reflect conditions at the mountainous station (Chaumont). High-elevation areas (>2000 m) were not included in this extrapolation as we did not measure MPs at any site representative of such an area. For each grid cell, the corresponding measured deposition rate (mass- and number-based) was multiplied by its area and scaled to annual totals (Table 3). Summing over all grid cells provided the total mass- and number-based annual atmospheric MP deposition for Switzerland, which were 219 t and 3.8×10¹⁴ particles, respectively. These values represent the first observationally based national-scale estimates for 20–215 µm sized MPs excluding tire wear particles. It should be noted that the estimation was done based on a small number of measurement stations. It is known that atmospheric dry deposition of particles depends on the surface type (Seijo et al., 2025). The downward movement of particles in air occurs under the influence of gravity, buoyancy and surface winds that depend on the characteristics of the surfaces referred to as the surface roughness. The passive samplers were operated under similar conditions, therefore the influence of surface roughness variations on the deposition of MPs is neglected in our estimate. The scientific literature further indicates that airborne particles can in vegetated areas such as forests be trapped by plant surfaces and reach the soil by throughfall and litter fall (Weber and Bigalke, 2025). This process occurs in addition to the direct dry settling of atmospheric particles that is measured in this study using passive samplers.
Based on the more detailed land use information and our determined deposition rates, we estimate that a corresponding 10 t MPs yr−1 are deposited onto Swiss surface water bodies, and 78 t MPs yr−1 are deposited onto agricultural land. The atmospheric inputs to surface waters were compared to the releases of MPs from Swiss wastewater treatment plants (WWTPs) to surface waters determined by Crosset-Perrotin et al. (2026) using a similar analytical pipeline. That study estimated that around 5 t MPs are annually discharged to Swiss surface waters through WWTPs. Atmospheric deposition thus contributes twice as much MP mass to surface waters as WWTPs. This is in line with the findings of Sun et al. (2022), reporting that the quantity of MPs deposited atmospherically in urban Shanghai, China could reach 1.7–12 times of that discharged from treated wastewater. It should further be noted that a fraction of the MPs deposited on land may be transferred to surface waters through wind and/or runoff associated with heavy rain events, suggesting that the inputs of MPs from atmospheric deposition to surface waters may have been underestimated in this study. Nevertheless, this comparison highlights the relevance of the atmosphere as a transport medium that distributes MPs across environmental compartments.
This study assessed the wet and dry atmospheric deposition of MPs over a one-year period at five sites in Switzerland and provided a robust framework for assessing uncertainties associated with determined atmospheric deposition rates. Number- and mass-based MP deposition rates were similar at suburban and rural sites, with means ranging from 249 to 331 MPs m−2 d−1 [CI: 140–478] and from 13 to 21 µg m−2 d−1 [CI: 4–46], respectively. However, the urban site in Zurich exhibited more than double the number- and mass-based deposition rates compared to all other sites, with respective means of 881 MPs m−2 d−1 [CI: 562–1199] and 53 µg m−2 d−1 [CI: 17–107]. These results should be compared to data from other (Swiss) urban centers to assess whether such elevated atmospheric MP concentrations are characteristic for urban centers in general. The determined deposition rates serve as a baseline for long-term trend analyses or exposure assessments.
Microplastics constituted between 0.02 % and 0.12 % of total aerosol deposition by mass. Although a seemingly small fraction, this corresponded to an annual deposition of 219 t for MPs in the 20–215 µm size fraction excluding tire wear particles across regions <2000 m a.s.l. in Switzerland, of which an estimated 10 t deposited directly onto surface waters. Relative to WWTPs, which are estimated to discharge a mass of ∼5 t of corresponding MPs to Swiss surface waters annually, the atmosphere plays an important role in the occurrence of MPs in surface water bodies. Approximately 25 % of Switzerland's surface area consists of alpine regions (>2000 m a.s.l.), which were not covered in this study; future work may consider addressing these high-altitude catchments to understand the MP loads in these pristine environments.
Annual MP mass deposition was dominated by dry deposition (61 %), although the individual contributions of wet and dry deposition varied considerably depending on the sampling period and site. Meteorological parameters showed poor correlations with the MP deposition rates. This may be related to the limited temporal resolution of our individual sampling periods of four weeks. A higher sampling frequency would, however, necessitate modifications in the sampling strategy to collect an equivalent sample mass in a shorter time period. Although this could be achieved by increasing the catchment area, it would likely make sample processing impractical.
This research focused on particles >20 µm due to the constraints of our analytical workflow with FPA-μ-FTIR spectroscopy. Future atmospheric monitoring efforts should seek to include plastic particles in the inhalable fraction (<10 µm), which may be relevant for human (respiratory) health.
Data collected in this study are accessible at https://doi.org/10.5281/zenodo.20230415 (Ashta et al., 2026a). These include (1) sample-specific metadata, including sampling times and locations and (2) microplastic particle data of atmospheric deposition samples and corresponding blanks, including particle dimensions and polymer types.
The supplement related to this article is available online at https://doi.org/10.5194/acp-26-11803-2026-supplement.
NMA, GCP, AM, MP, TDB, RK and CH conceptualized the scientific ideas. NMA processed and analysed all samples. NMA and CH compiled the text and developed figures. All authors contributed to, reviewed and/or edited the text.
The contact author has declared that none of the authors has any competing interests.
Publisher's note: Copernicus Publications remains neutral with regard to jurisdictional claims made in the text, published maps, institutional affiliations, or any other geographical representation in this paper. The authors bear the ultimate responsibility for providing appropriate place names. Views expressed in the text are those of the authors and do not necessarily reflect the views of the publisher.
The authors thank Brian Sinnet for technical assistance in the laboratory. The authors also thank the technicians within the National Air Pollution Monitoring Network – Beat Schwarzenbach, David Schoenenberger, Thomas Bruggisser, Thomas Seitz and Tobias Maurer – for collecting samples. The authors acknowledge the use of AI LLMs (e.g. Copilot, Gemini) in the preparation of this manuscript.
This research has been supported by the Swiss Federal Office for the Environment (grant no. 20.0093.PJ/FB1288506).
This paper was edited by Leiming Zhang and reviewed by three anonymous referees.
Abbasi, S. and Turner, A.: Dry and wet deposition of microplastics in a semi-arid region (Shiraz, Iran), Sci. Total Environ., 786, 147358, https://doi.org/10.1016/j.scitotenv.2021.147358, 2021a.
Abbasi, S. and Turner, A.: Human exposure to microplastics: A study in Iran, J. Hazard. Mater., 403, 123799, https://doi.org/10.1016/j.jhazmat.2020.123799, 2021b.
Abbasi, S., Alirezazadeh, M., Razeghi, N., Rezaei, M., Pourmahmood, H., Dehbandi, R., Mehr, M. R., Ashayeri, S. Y., Oleszczuk, P., and Turner, A.: Microplastics captured by snowfall: A study in Northern Iran, Sci. Total Environ., 822, 153451, https://doi.org/10.1016/j.scitotenv.2022.153451, 2022.
Adediran, G. A., Taylor, V., Howard, A., Whitehead, P. G., and Hughes, J. M. R.: Microplastics in the air: Weather and polymer influences on deposition trends across a rural–urban gradient, Environ. Pollut., 388, 127388, https://doi.org/10.1016/j.envpol.2025.127388, 2026.
Allen, S., Allen, D., Phoenix, V. R., Le Roux, G., Durántez Jiménez, P., Simonneau, A., Binet, S., and Galop, D.: Atmospheric transport and deposition of microplastics in a remote mountain catchment, Nat. Geosci., 12, 339–344, https://doi.org/10.1038/s41561-019-0335-5, 2019.
Allen, S., Materić, D., Allen, D., MacDonald, A., Holzinger, R., Roux, G. L., and Phoenix, V. R.: An early comparison of nano to microplastic mass in a remote catchment's atmospheric deposition, J. Hazard. Mater. Adv., 7, 100104, https://doi.org/10.1016/j.hazadv.2022.100104, 2022.
Amato-Lourenço, L. F., Dos Santos Galvão, L., Wiebeck, H., Carvalho-Oliveira, R., and Mauad, T.: Atmospheric microplastic fallout in outdoor and indoor environments in São Paulo megacity, Sci. Total Environ., 821, 153450, https://doi.org/10.1016/j.scitotenv.2022.153450, 2022.
Ashta, N., Crosset-Perrotin, G., Moraz, A., Philipp, M., Bucheli, T. D., Kaegi, R., and Hueglin, C.: Datasets associated with the manuscript titled “Wet and dry atmospheric deposition of microplastics at urban, suburban, rural and mountainous sites in Switzerland”, Zenodo [data set], https://doi.org/10.5281/zenodo.20230415, 2026a.
Ashta, N. M., Crosset-Perrotin, G., Moraz, A., Stoffel, J., Schilt, U., Ceglie, E., Schoenenberger, D., Philipp, M., Bucheli, T. D., Kaegi, R., and Hueglin, C.: Atmospheric deposition of microplastics: a sampling and analytical method including the associated measurement uncertainties, Atmos. Meas. Tech., 19, 371–388, https://doi.org/10.5194/amt-19-371-2026, 2026b.
Boucher, J. and Friot, D.: Primary microplastics in the oceans: a global evaluation of sources, IUCN, Gland, 1 pp., https://doi.org/10.2305/IUCN.CH.2017.01.en, 2017.
Brahney, J., Hallerud, M., Heim, E., Hahnenberger, M., and Sukumaran, S.: Plastic rain in protected areas of the United States, Science, 368, 1257–1260, https://doi.org/10.1126/science.aaz5819, 2020.
Brahney, J., Mahowald, N., Prank, M., Cornwell, G., Klimont, Z., Matsui, H., and Prather, K. A.: Constraining the atmospheric limb of the plastic cycle, P. Natl. Acad. Sci. USA, 118, e2020719118, https://doi.org/10.1073/pnas.2020719118, 2021.
Browne, M. A., Crump, P., Niven, S. J., Teuten, E., Tonkin, A., Galloway, T., and Thompson, R.: Accumulation of Microplastic on Shorelines Woldwide: Sources and Sinks, Environ. Sci. Technol., 45, 9175–9179, https://doi.org/10.1021/es201811s, 2011.
Carney Almroth, B. M., Åström, L., Roslund, S., Petersson, H., Johansson, M., and Persson, N.-K.: Quantifying shedding of synthetic fibers from textiles; a source of microplastics released into the environment, Environ. Sci. Pollut. Res., 25, 1191–1199, https://doi.org/10.1007/s11356-017-0528-7, 2018.
Chen, Y., Niu, J., Xu, D., Zhang, M., Sun, K., and Gao, B.: Wet Deposition of Globally Transportable Microplastics (<25 µm) Hovering over the Megacity of Beijing, Environ. Sci. Technol., 57, 11152–11162, https://doi.org/10.1021/acs.est.3c03474, 2023.
Cho, Y., Loh, A., Shim, W. J., Han, G. M., Ha, S. Y., and Hong, S. H.: Atmospheric deposition as a pathway for microplastic transport to the marine environment: Temporal variation and environmental factors, Mar. Pollut. Bull., 225, 119189, https://doi.org/10.1016/j.marpolbul.2025.119189, 2026.
Cole, M., Lindeque, P., Fileman, E., Halsband, C., Goodhead, R., Moger, J., and Galloway, T. S.: Microplastic Ingestion by Zooplankton, Environ. Sci. Technol., 47, 6646–6655, https://doi.org/10.1021/es400663f, 2013.
Crosset-Perrotin, G., Ashta, N. M., Moraz, A., Philipp, M., Sander, M., Morgenroth, E., Bucheli, T. D., Hueglin, C., and Kaegi, R.: Estimation of Microplastic Particle Loads Discharged by Swiss Wastewater Treatment Plants, ACS EST Water, https://doi.org/10.1021/acsestwater.6c00366, 2026.
Dris, R., Gasperi, J., Saad, M., Mirande, C., and Tassin, B.: Synthetic fibers in atmospheric fallout: A source of microplastics in the environment?, Mar. Pollut. Bull., 104, 290–293, https://doi.org/10.1016/j.marpolbul.2016.01.006, 2016.
Dris, R., Gasperi, J., Mirande, C., Mandin, C., Guerrouache, M., Langlois, V., and Tassin, B.: A first overview of textile fibers, including microplastics, in indoor and outdoor environments, Environ. Pollut., 221, 453–458, https://doi.org/10.1016/j.envpol.2016.12.013, 2017.
Emerson, E. W., Hodshire, A. L., DeBolt, H. M., Bilsback, K. R., Pierce, J. R., McMeeking, G. R., and Farmer, D. K.: Revisiting particle dry deposition and its role in radiative effect estimates, P. Natl. Acad. Sci. USA, 117, 26076–26082, https://doi.org/10.1073/pnas.2014761117, 2020.
European Commission: Commission Regulation (EU) 2023/2055 of 25 September 2023 amending Annex XVII to Regulation (EC) No. 1907/2006 (REACH) as regards synthetic polymer microparticles, 67–93, https://eur-lex.europa.eu/eli/reg/2023/2055/oj/eng (last access: 16 August 2026), 2023.
Evangeliou, N., Grythe, H., Klimont, Z., Heyes, C., Eckhardt, S., Lopez-Aparicio, S., and Stohl, A.: Atmospheric transport is a major pathway of microplastics to remote regions, Nat. Commun., 11, 3381, https://doi.org/10.1038/s41467-020-17201-9, 2020.
Evangelou, I., Bucci, S., and Stohl, A.: Atmospheric microplastic emissions from land and ocean, Nature, https://doi.org/10.1038/s41586-025-09998-6, 2026.
Federal Statistical Office: Topography, https://www.bfs.admin.ch/bfs/en/home/services/geostat/swiss-federal-statistics-geodata/topography.assetdetail.230215.html (last access: 16 August 2026), 2014.
Federal Statistical Office: Swiss Land Use Statistics, https://www.bfs.admin.ch/bfs/en/home/services/geostat/swiss-federal-statistics-geodata/land-use-cover-suitability/swiss-land-use-statistics.html (last access: 16 August 2026), 2025.
Geyer, R., Jambeck, J. R., and Law, K. L.: Production, use, and fate of all plastics ever made, Sci. Adv., 3, e1700782, https://doi.org/10.1126/sciadv.1700782, 2017.
Geyer, R., Gavigan, J., Jackson, A. M., Saccomanno, V. R., Suh, S., and Gleason, M. G.: Quantity and fate of synthetic microfiber emissions from apparel washing in California and strategies for their reduction, Environ. Pollut., 298, 118835, https://doi.org/10.1016/j.envpol.2022.118835, 2022.
Hartmann, N. B., Hüffer, T., Thompson, R. C., Hassellöv, M., Verschoor, A., Daugaard, A. E., Rist, S., Karlsson, T., Brennholt, N., Cole, M., Herrling, M. P., Hess, M. C., Ivleva, N. P., Lusher, A. L., and Wagner, M.: Are We Speaking the Same Language? Recommendations for a Definition and Categorization Framework for Plastic Debris, Environ. Sci. Technol., 53, 1039–1047, https://doi.org/10.1021/acs.est.8b05297, 2019.
Hee, Y. Y., Hanif, N. M., Weston, K., Latif, M. T., Suratman, S., Rusli, M. U., and Mayes, A. G.: Atmospheric microplastic transport and deposition to urban and pristine tropical locations in Southeast Asia, Sci. Total Environ., 902, 166153, https://doi.org/10.1016/j.scitotenv.2023.166153, 2023.
Henry, B., Laitala, K., and Klepp, I. G.: Microfibres from apparel and home textiles: Prospects for including microplastics in environmental sustainability assessment, Sci. Total Environ., 652, 483–494, https://doi.org/10.1016/j.scitotenv.2018.10.166, 2019.
Huang, S., Huang, X., Bi, R., Guo, Q., Yu, X., Zeng, Q., Huang, Z., Liu, T., Wu, H., Chen, Y., Xu, J., Wu, Y., and Guo, P.: Detection and Analysis of Microplastics in Human Sputum, Environ. Sci. Technol., 56, 2476–2486, https://doi.org/10.1021/acs.est.1c03859, 2022.
Hueglin, C., Buchmann, B., Steinbacher, M., and Emmenegger, L.: The Swiss National Air Pollution Monitoring Network (NABEL) – Bridging Science and Environmental Policy, CHIMIA, 78, 722–727, https://doi.org/10.2533/chimia.2024.722, 2024.
Hufnagl, B., Steiner, D., Renner, E., Löder, M. G. J., Laforsch, C., and Lohninger, H.: A methodology for the fast identification and monitoring of microplastics in environmental samples using random decision forest classifiers, Anal. Methods, 11, 2277–2285, https://doi.org/10.1039/C9AY00252A, 2019.
Hufnagl, B., Stibi, M., Martirosyan, H., Wilczek, U., Möller, J. N., Löder, M. G. J., Laforsch, C., and Lohninger, H.: Computer-Assisted Analysis of Microplastics in Environmental Samples Based on µFTIR Imaging in Combination with Machine Learning, Environ. Sci. Tech. Let., 9, 90–95, https://doi.org/10.1021/acs.estlett.1c00851, 2022.
Jenner, L. C., Rotchell, J. M., Bennett, R. T., Cowen, M., Tentzeris, V., and Sadofsky, L. R.: Detection of microplastics in human lung tissue using µFTIR spectroscopy, Sci. Total Environ., 831, 154907, https://doi.org/10.1016/j.scitotenv.2022.154907, 2022.
Kernchen, S., Schmalz, H., Löder, M. G. J., Georgi, C., Einhorn, A., Greiner, A., Nölscher, A. C., Laforsch, C., and Held, A.: Atmospheric deposition studies of microplastics in Central Germany, Air Qual. Atmos. Hlth., 17, 2247–2261, https://doi.org/10.1007/s11869-024-01571-w, 2024.
Klein, M. and Fischer, E. K.: Microplastic abundance in atmospheric deposition within the Metropolitan area of Hamburg, Germany, Sci. Total Environ., 685, 96–103, https://doi.org/10.1016/j.scitotenv.2019.05.405, 2019.
Klein, M., Bechtel, B., Brecht, T., and Fischer, E. K.: Spatial distribution of atmospheric microplastics in bulk-deposition of urban and rural environments – A one-year follow-up study in northern Germany, Sci. Total Environ., 901, 165923, https://doi.org/10.1016/j.scitotenv.2023.165923, 2023.
Kooi, M., Primpke, S., Mintenig, S. M., Lorenz, C., Gerdts, G., and Koelmans, A. A.: Characterizing the multidimensionality of microplastics across environmental compartments, Water Res., 202, 117429, https://doi.org/10.1016/j.watres.2021.117429, 2021.
Lasher-Trapp, S. and Stachnik, J. P.: Giant and Ultragiant Aerosol Particle Variability over the Eastern Great Lakes Region, J. Appl. Meteorol. Climatol., 46, 651–659, https://doi.org/10.1175/JAM2490.1, 2007.
Philipp, M., Bucheli, T. D., and Kaegi, R.: The use of surrogate standards as a QA/QC tool for routine analysis of microplastics in sewage sludge, Sci. Total Environ., 835, 155485, https://doi.org/10.1016/j.scitotenv.2022.155485, 2022.
PlasticsEurope: Plastics – the Facts 2022, PlasticsEurope, https://plasticseurope.org/knowledge-hub/plastics-the-facts-2022/ (last access: 16 August 2026), 2022.
Purwiyanto, A. I. S., Prartono, T., Riani, E., Naulita, Y., Cordova, M. R., and Koropitan, A. F.: The deposition of atmospheric microplastics in Jakarta-Indonesia: The coastal urban area, Mar. Pollut. Bull., 174, 113195, https://doi.org/10.1016/j.marpolbul.2021.113195, 2022.
R Core Team: R: A language and environment for statistical computing, https://www.r-project.org/ (last access: 17 August 2026), 2021.
Rindelaub, J. D., Salmond, J. A., Fan, W., Miskelly, G. M., Dirks, K. N., Henning, S., Conrath, T., Stratmann, F., and Coulson, G.: Aerosol mass concentrations and dry/wet deposition of atmospheric microplastics at a remote coastal location in New Zealand, Environ. Pollut., 372, 126034, https://doi.org/10.1016/j.envpol.2025.126034, 2025.
Roblin, B., Ryan, M., Vreugdenhil, A., and Aherne, J.: Ambient Atmospheric Deposition of Anthropogenic Microfibers and Microplastics on the Western Periphery of Europe (Ireland), Environ. Sci. Technol., 54, 11100–11108, https://doi.org/10.1021/acs.est.0c04000, 2020.
Seijo, M., Whelan, M. J., Gouin, T., and Praetorius, A.: Particle properties and environmental factors control atmospheric transport and deposition of micro- and nanoplastics, Commun. Earth Environ., 6, 975, https://doi.org/10.1038/s43247-025-02930-w, 2025.
Simon, M., Van Alst, N., and Vollertsen, J.: Quantification of microplastic mass and removal rates at wastewater treatment plants applying Focal Plane Array (FPA)-based Fourier Transform Infrared (FT-IR) imaging, Water Res., 142, 1–9, https://doi.org/10.1016/j.watres.2018.05.019, 2018.
Sun, J., Peng, Z., Zhu, Z.-R., Fu, W., Dai, X., and Ni, B.-J.: The atmospheric microplastics deposition contributes to microplastic pollution in urban waters, Water Res., 225, 119116, https://doi.org/10.1016/j.watres.2022.119116, 2022.
Swiss Federal Council: Ordinance on the Reduction of Risks relating to Chemical Products (Chemical Risk Reduction Ordinance, ORRChem; SR 814.81), Annex 2.9, https://www.fedlex.admin.ch/eli/cc/2005/478/en (last access: 16 August 2026), 2025.
Szewc, K., Graca, B., and Dołęga, A.: Atmospheric deposition of microplastics in the coastal zone: Characteristics and relationship with meteorological factors, Sci. Total Environ., 761, 143272, https://doi.org/10.1016/j.scitotenv.2020.143272, 2021.
Thompson, R. C., Courtene-Jones, W., Boucher, J., Pahl, S., Raubenheimer, K., and Koelmans, A. A.: Twenty years of microplastic pollution research – what have we learned?, Science, 386, eadl2746, https://doi.org/10.1126/science.adl2746, 2024.
Truong, T.-N.-S., Strady, E., Kieu-Le, T.-C., Tran, Q.-V., Le, T.-M.-T., and Thuong, Q.-T.: Microplastic in atmospheric fallouts of a developing Southeast Asian megacity under tropical climate, Chemosphere, 272, 129874, https://doi.org/10.1016/j.chemosphere.2021.129874, 2021.
United Nations Environment Programme: From Pollution to Solution: A global assessment of marine litter and plastic pollution, Nairobi, https://wedocs.unep.org/handle/20.500.11822/36963 (last access: 16 August 2026), 2021.
Verein Deutscher Ingenieure: Measurement of atmospheric depositions – Determination of the dust deposition according to the Bergerhoff method, VDI 4320 Bl. 2 (January 2012), https://www.vdi.de/en/home/vdi-standards/details/vdi-4320-blatt-2-measurement-of-atmospheric-depositions-determination-of-the-dust-deposition-according-to-the-bergerhoff-method (last access: 16 August 2026), 2012.
Weber, C. J. and Bigalke, M.: Forest soils accumulate microplastics through atmospheric deposition, Commun. Earth Environ., 6, 702, https://doi.org/10.1038/s43247-025-02712-4, 2025.
Wright, S. L., Thompson, R. C., and Galloway, T. S.: The physical impacts of microplastics on marine organisms: A review, Environ. Pollut., 178, 483–492, https://doi.org/10.1016/j.envpol.2013.02.031, 2013.
Wright, S. L., Ulke, J., Font, A., Chan, K. L. A., and Kelly, F. J.: Atmospheric microplastic deposition in an urban environment and an evaluation of transport, Environ. Int., 136, 105411, https://doi.org/10.1016/j.envint.2019.105411, 2020.