
the Creative Commons Attribution 4.0 License.
the Creative Commons Attribution 4.0 License.
 | 17 Aug 2026
Spatiotemporal linkage and transmission of urban heat islands in the Yangtze River Delta urban agglomeration: the role of urban heat advection
Jiesheng Xue
Yuanjian Yang
Guoyu Ren
Simone Lolli
Urban heat islands (UHIs) substantially modify the urban thermal environment, yet the contribution of non-local processes such as urban heat advection (UHA) in dense urban agglomerations remains poorly quantified. Using five years of high-density automatic weather station data and Weather Research and Forecasting (WRF) simulations, we investigate how UHA links canopy-layer UHI (CUHI) and boundary-layer UHI (BUHI) across the Suzhou-Wuxi-Changzhou metropolitan area in the Yangtze River Delta, China. UHA exhibits pronounced spatiotemporal variability, systematically transporting heat from upwind to downwind cities along the prevailing winds. Under northwesterly flow, daily-mean UHA intensities increase from negative values in upwind regions to 0.32 °C downstream, with nocturnal UHA during peak hours reaching roughly 0.6 °C. Observations show that nighttime UHA is nonlinearly modulated by wind speed and planetary boundary-layer height (PBLH), with maximum downstream warming under moderate winds and intermediate PBLH, whereas deep daytime convective boundary layers (PBLH ≥ 800 m) dilute urban heat plumes and can reverse UHA to a net cooling effect. WRF experiments further indicate that urbanization in the upstream city of Changzhou enhances CUHII in the adjacent downstream Wuxi by up to about 0.68 °C (8.1 %–60.4 %) and BUHII by up to about 0.40 °C (4.7 %–41.7 %), with detectable canopy-level warming extending beyond 100 km downwind. These results demonstrate that cross-city UHA superposition, strongly regulated by boundary-layer dynamics and thermodynamics, is a key physical process coupling UHIs within urban agglomerations, requiring explicit consideration in regional climate assessments.
- Article
(12783 KB) - Full-text XML
-
Supplement
(2948 KB) - BibTeX
- EndNote


The urban heat island (UHI) is one of the primary characteristics of anthropogenic impacts on local and regional urban climate (Oke et al., 2017). Urban expansion and anthropogenic heat emissions are key drivers of local temperature rise (Chen et al., 2022; Shi et al., 2024). Extensive studies have explored the spatial structure, temporal evolution, and physical mechanisms of UHI at the individual city scale (Oke, 1973; Phelan et al., 2015; Zhang et al., 2024a; Zheng et al., 2024). However, the rapid development of urban agglomerations in recent years and the consequent reduction in inter-city distances have substantially altered the regional thermal environment (Zhou et al., 2018). Considering the interactions between UHIs across adjacent cities is therefore essential for a comprehensive understanding of the spatiotemporal evolution of the thermal environment within urban agglomerations.
The spatial influence extent of the UHI is governed by background meteorological conditions (Lowry, 1977; Stull, 1988). Under quiescent synoptic conditions, UHI-induced local circulation typically exhibits as an “urban thermal dome” structure, characterized by the most pronounced urban-rural thermal differences at the local scale (Oke et al., 2017). When regional background winds prevail, an “urban thermal plume” develops (Stull, 1988), transporting heat, moisture, and pollutants downstream (Brousse et al., 2022; Lowry, 1977; Moustaoui and Georgescu, 2025; Yang et al., 2023; Zhang et al., 2009). Under the background of rapid urbanization, the influence of thermal plumes is further enhanced (Moustaoui and Georgescu, 2025). Early observations indicated that urban thermal plumes could extend 10–15 km downwind (Dirks, 1974; Wong and Dirks, 1978), while recent modelling results show significant heating up to 70 km downwind of the city (Cosgrove and Berkelhammer, 2018). Early observational studies were constrained by sparse measurements and primarily captured near-surface thermal characteristics, whereas recent modelling studies can resolve elevated thermal plumes and diagnose their propagation under a wider range of meteorological conditions. Furthermore, under weak synoptic forcing, local circulations can also modulate the downwind air temperature in urban areas. For instance, sea breezes exert a cooling effect in coastal regions while a warming effect in farther downwind urban areas (Yang et al., 2023). The process of transporting heat to the downwind region of the UHI by horizontal winds is called urban heat advection (UHA); however, few studies have considered how horizontal wind fields alter the urban thermal environment through the advection-driven UHI component, or deemed this effect insignificant (Bassett et al., 2016). Ignoring the influence of UHA may lead to an underestimation of the actual impacts of urban heat on the region.
Current research on UHA primarily utilizes three observational approaches to collect urban temperature: fixed sensors at weather stations (Bassett et al., 2016, 2017), mobile sensors deployed on traverse vehicles (Danzig et al., 2025), and crowdsourced data from crowd weather stations (Kittner et al., 2025). Observations within the urban canopy can effectively capture the two-dimensional spatial patterns and extent of UHI-related UHA, but the paucity of high-quality, high-density urban observation networks constrains UHA studies (Bassett et al., 2016). Modelling methods can complement the spatial and temporal dimensions that observations cannot capture. For example, mesoscale numerical models (Bassett et al., 2019), Lagrange transport models (Cosgrove and Berkelhammer, 2018; Moustaoui and Georgescu, 2025), and urban micrometeorological models (Dinda and Chatterjee, 2022) have been applied to quantify UHA effects across local to mesoscale scales, thereby alleviating the vertical and coverage limitations of surface measurements. Consequently, combining high-resolution observations with mesoscale and urban numerical models has become a key approach for investigating UHA across local to regional scales.
UHA exerts a profound influence on the downwind thermal environment at the urban scale. For example, analyses of observation data show that UHA can affect ambient temperatures by up to 1 °C in rural De Bilt (temperate maritime climate), Netherlands (Brandsma et al., 2003); the downwind warming in Birmingham (temperate maritime climate), UK can reach 1.2 °C and extend beyond 10 km (Bassett et al., 2016); and the downwind temperature rise induced by UHA in Lubbock (semi-arid region), Texas can exceed 4 °C (Danzig et al., 2025). The observational findings are corroborated by numerical simulation results; for example, downwind temperatures can be up to 2.5 °C higher than upwind during a Birmingham heatwave event (Heaviside et al., 2015); and in the Kolkata metropolitan area (tropical monsoon climate), different underlying surfaces (impermeable or permeable) lead to the downwind air temperature difference of approximately 0.95 °C during the day and 1.62 °C at night (Dinda and Chatterjee, 2022). UHA processes are influenced by meteorological conditions and underlying surface characteristics. Generally, the contribution of UHA to ambient temperature rise is most significant under moderate wind speeds, while the UHA effect is weaker under strong mesoscale forcing or calm conditions (Bassett et al., 2016; Kittner et al., 2025). However, current research often lacks consideration of the influence of more boundary layer conditions on UHA processes, such as planetary boundary layer height (PBLH), beyond conventional near-surface meteorological factors. Furthermore, the intensity and spatial extent of UHA are closely related to urban size (Bassett et al., 2019) and UHI intensity (Kittner et al., 2025). They are modulated by the spatial configuration or local climate zones of upwind cities (Bassett et al., 2016; Kittner et al., 2025), as well as by downwind land use types (e.g., downstream lakes can act as heat sinks for UHA and reduce the horizontal transport distance of heat plumes) (Cosgrove and Berkelhammer, 2018). It is noteworthy that even in small urban areas, UHAs can exacerbate air temperatures downwind (Bassett et al., 2017). However, existing UHA studies primarily focus on intra-city heat transport or the impact of isolated cities, neglecting the synergistic transport effects generated by dense heat sources within urban agglomerations. It remains an open question whether the cross-city superposition of UHAs from multiple cities within an urban agglomeration has become a critical physical process coupling the thermal environments of adjacent cities. The extent to which upwind UHAs exacerbate downstream UHI intensity is currently poorly understood.
The Yangtze River Delta (YRD) region in China exhibits a spatial pattern characterized by the clustered development of multiple metropolitan areas. Unlike isolated metropolitan areas, the Suzhou-Wuxi-Changzhou (SuXiChang) agglomeration features a clustered, near-linear alignment of heat sources that aligns with the prevailing monsoon winds, so downstream cities may experience a progressive, additive accumulation of thermal plumes from successive upstream cities. To understand the processes of UHA, the UHI can be vertically delineated into the canopy-layer UHI (CUHI) and the boundary-layer UHI (BUHI) (Oke, 1976). Using high-density automatic weather station observations and WRF-MLUCM simulations over the YRD, we investigate how UHA links UHIs across cities within an urban agglomeration. Specifically, we address: (1) how CUHI and BUHI are coupled along the alignment of urban agglomeration under different prevailing wind directions; (2) how wind speed and PBLH modulate the intensity and diurnal asymmetry of UHA; and (3) to what extent upstream urbanization enhances downstream CUHII and BUHII and over what distances.
2.1 Study area and data
YRD is one of the most densely populated and economically developed regions in China. Driven by rapid population growth and high-speed economic development, the region has experienced extensive urban spatial expansion over recent decades (Shi et al., 2025; Tian et al., 2011). The SuXiChang metropolitan area, consisting of the cities of Suzhou, Wuxi, and Changzhou, is one of the important urban agglomerations within the YRD (Fig. 1a and 1d), located in a subtropical monsoon climate zone. The urbanization process in this region has significantly intensified both the spatial extent and the intensity of UHI (Lu et al., 2018), consequently altering the regional thermal landscape pattern, such as the shrinking of thermal transition zones. As a result, this area is facing severe urban thermal environment risks.
Meteorological observations from automated weather stations, including air temperature, wind speed, and wind direction, were collected and quality-controlled from 2016 to 2020. Stations located within 1 km of large water bodies, or with elevations exceeding 100 m relative to the lowest station, were excluded to ensure environmental representativeness (Yao et al., 2023). Observation stations were further classified into urban and rural categories (Fig. 1b, Table S1), referring to anthropogenic heat flux (AHF) intensity (Fig. 1c) and built-up density (Fig. 1d). Specifically, urban stations (U1–U10) are characterized by densely built-up areas with high AHF intensity (> 5 W m−2 in a four-kilometer buffer zone); whereas rural reference stations were matched according to the same latitudinal zone as the urban areas, featuring low impervious surface coverage and flat topography. Sensitivity tests using alternative rural reference stations located closer to the coast suggest that the potential bias arising from the limited longitudinal spread of the rural stations is small. In addition, the wind directions selected for analysis should be filtered to avoid interference from large urban-derived heat in rural areas. Due to the aggregated development of urban agglomerations, area and station classifications in this study do not strictly adhere to administrative boundaries.
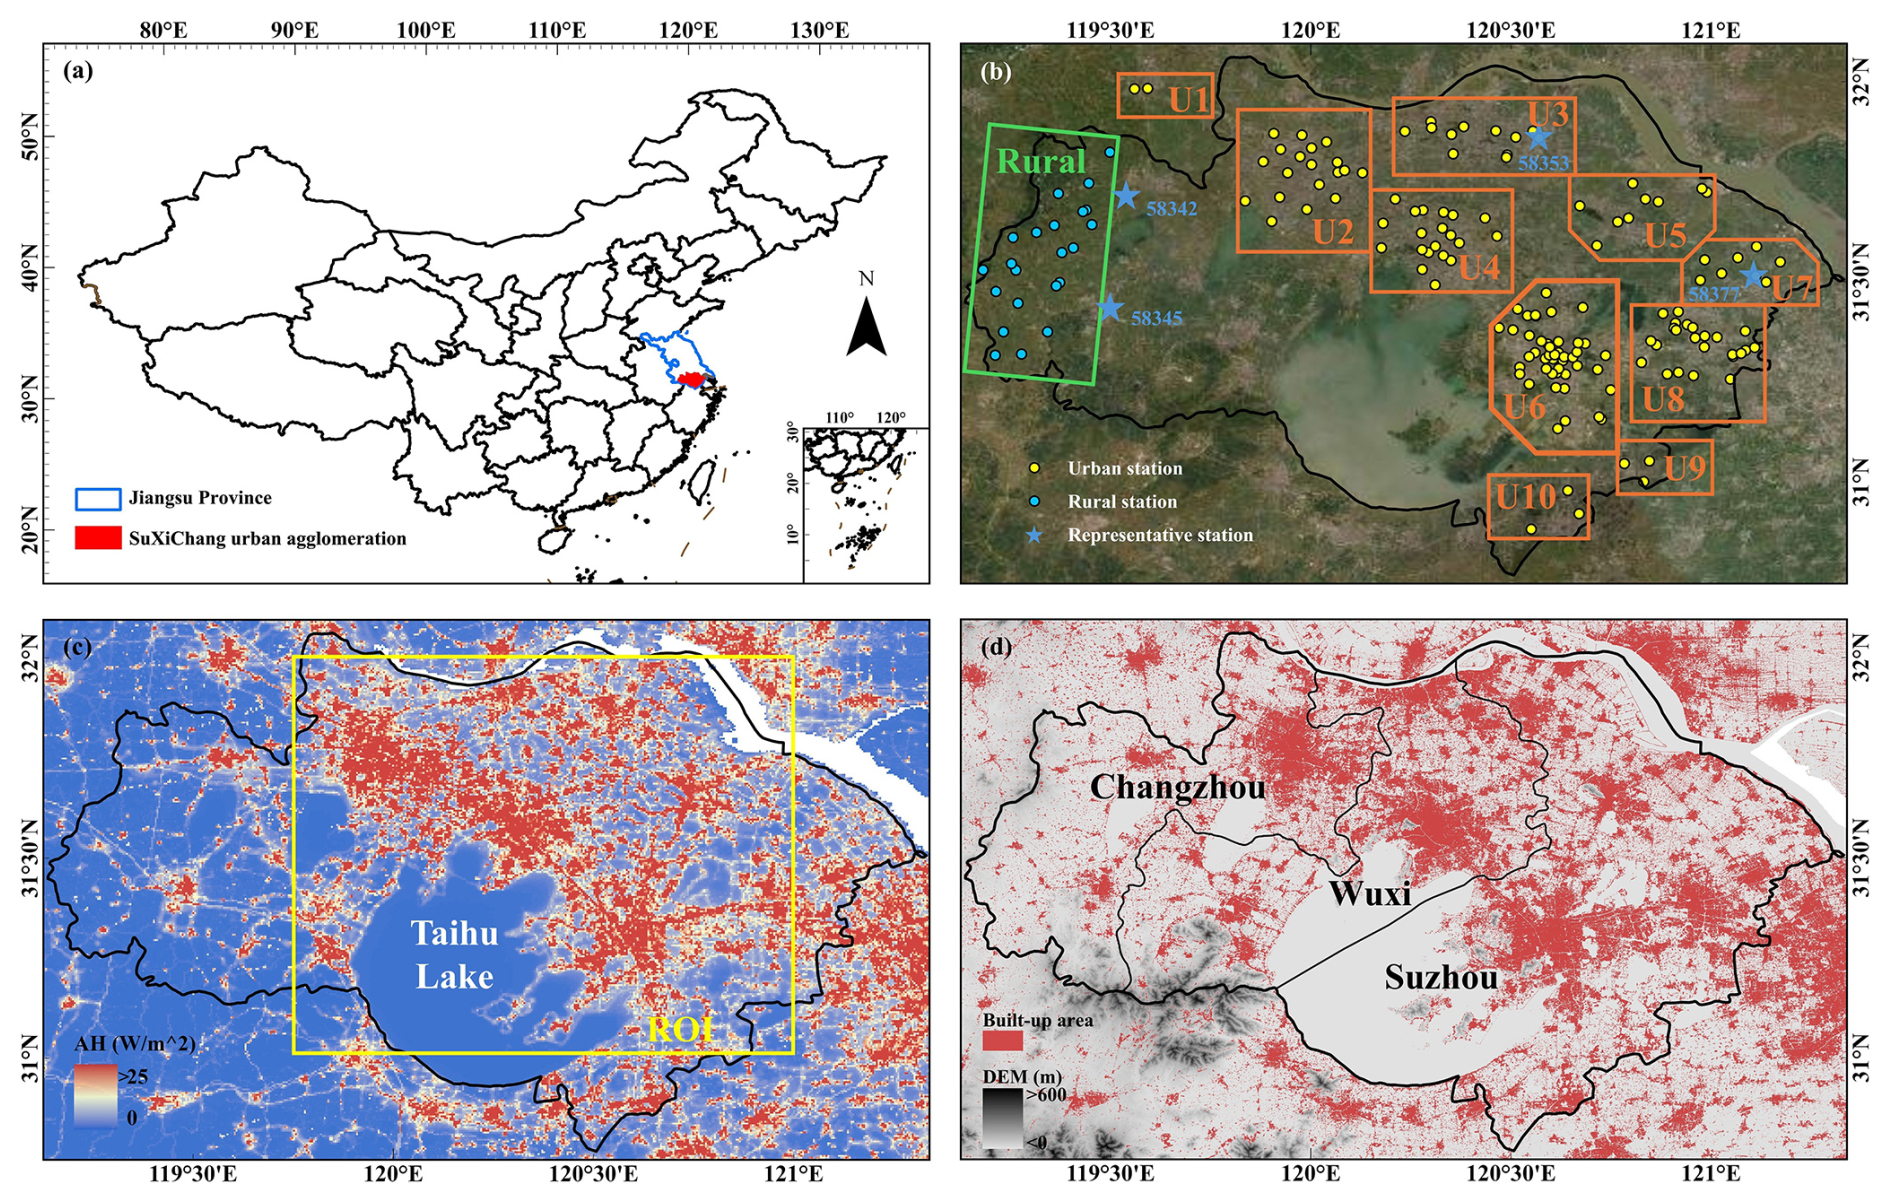
Figure 1(a) Geographic location of the study area in China; (b) locations of the automated weather stations, where the yellow and blue circles represent urban and rural stations, respectively, and blue asterisks indicate representative stations of the regional wind field. (c–d) Spatial distribution of (c) anthropogenic heat flux and (d) built-up areas within the SuXiChang area. The background in (b) is from the Esri World Imagery basemap as of 22 July 2020 (Esri | Powered by Esri). The line in (c) represents the region of interest, and the lines in (d) represent the administrative boundaries of the three cities of Suzhou, Wuxi, and Changzhou.
In addition, PBLH data were obtained from a global continental dataset (Guo et al., 2024), which integrates high-resolution radiosonde measurements, ERA5 reanalysis, and Global Land Data Assimilation System (GLDAS) products through machine learning algorithms. This dataset has a 3-hourly temporal resolution and 0.25°×0.25° horizontal spatial resolution. The mean bias between the dataset and the PBLH recovered from radiosonde observations is −0.9 m, and the root mean square error (RMSE) of the training set and the test set is 243 and 370 m, respectively. The region of interest (ROI) was delineated based on the location of downtown areas of Changzhou, Wuxi, and Suzhou (represented by the U2, U4, and U6 stations, respectively), with a spatial extent of 31–32° N, 119.75–121° E, and covers 86.3 % of the urban meteorological stations included in the analysis (Fig. 1c). Grid data within the ROI were selected and spatially averaged based on prevailing wind direction to represent the PBLH over the core urban agglomeration region.
2.2 Methods
2.2.1 Calculation of CUHI intensity
The CUHI intensity (CUHII) was calculated by comparing air temperatures between urban and rural areas (Oke et al., 2017):
where is the average 2 m temperature of all urban stations in region i (U1–U10) at time t, and is the average 2 m temperature of all rural reference stations at the same time.
2.2.2 Calculation of UHA intensity
Four representative national meteorological stations (58 342, 58 345, 58 353, 58 377) were selected to calculate the regional wind direction and wind speed. These stations are located in relatively open surroundings, where observations are less disturbed by local surface heterogeneity, thereby providing more reliable representations of the regional-scale background wind field (Fig. 1b).
Wind directions of representative stations were categorized into eight sectors with equal intervals of 45° to identify the daily prevailing wind direction. The quantification of UHA intensity was modified based on Bassett et al. (2016), with further consideration given to exclude seasonal signals:
where denotes the CUHII in region i under the prevailing wind direction θ during season s, while CUHIIi(t,s) represents the average CUHII across all wind directions in the same season s.
2.2.3 Model configuration
The spatial features of UHA were evaluated using the Weather Research and Forecasting (WRF) model, version 3.9.1, coupled with a multi-layer urban canopy model (MLUCM). This study utilizes the multi-layer Building Effect Parameterization (BEP) coupled with the Building Energy Model (BEM), and urban canopy parameters were taken from the global 1 km spatially continuous GloUCP dataset (Liao et al., 2025). BEP + BEM can reproduce the intensity and spatiotemporal distribution of UHI (Zhu and Ooka, 2023), and it includes a mature parameterization of the air-conditioning system and of indoor–outdoor heat exchange and accounts for the vertical distribution of AHF (Salamanca et al., 2010). A triple-nested two-way domain configuration was employed, with the innermost domain (d03) encompassing the study area (Fig. 2a). The domains feature horizontal grid dimensions of 102 × 102, 160 × 130, and 286 × 160, with corresponding resolutions of 9, 3, and 1 km, and 36 vertically stretched non-uniform sigma levels. The main physical parameterization schemes adopted in this study include: the Thompson microphysics scheme (Thompson et al., 2008), the MYJ planetary boundary layer scheme (Janjić, 1994), the Goddard shortwave radiation scheme (Chou and Suarez, 1994), the RRTM longwave radiation scheme (Mlawer et al., 1997), the unified Noah land surface model (Tewari et al., 2004), and the Eta Similarity surface layer scheme (Janjić, 1994). For comparison, the results of an additional run using the single-layer urban canopy model (SLUCM) coupled with the YSU PBL scheme (Hong et al., 2006) are presented in the supplementary material. Initial and lateral boundary conditions were derived from the 6-hourly, 0.25° National Centers for Environmental Prediction (NCEP) Final Operational Global Analysis (FNL) data. The simulations in this study were initiated at 08:00 Beijing Standard Time (BST) on 23 December 2017, over a 48 h period, and the first 24 h spin-up period was applied for all simulations.
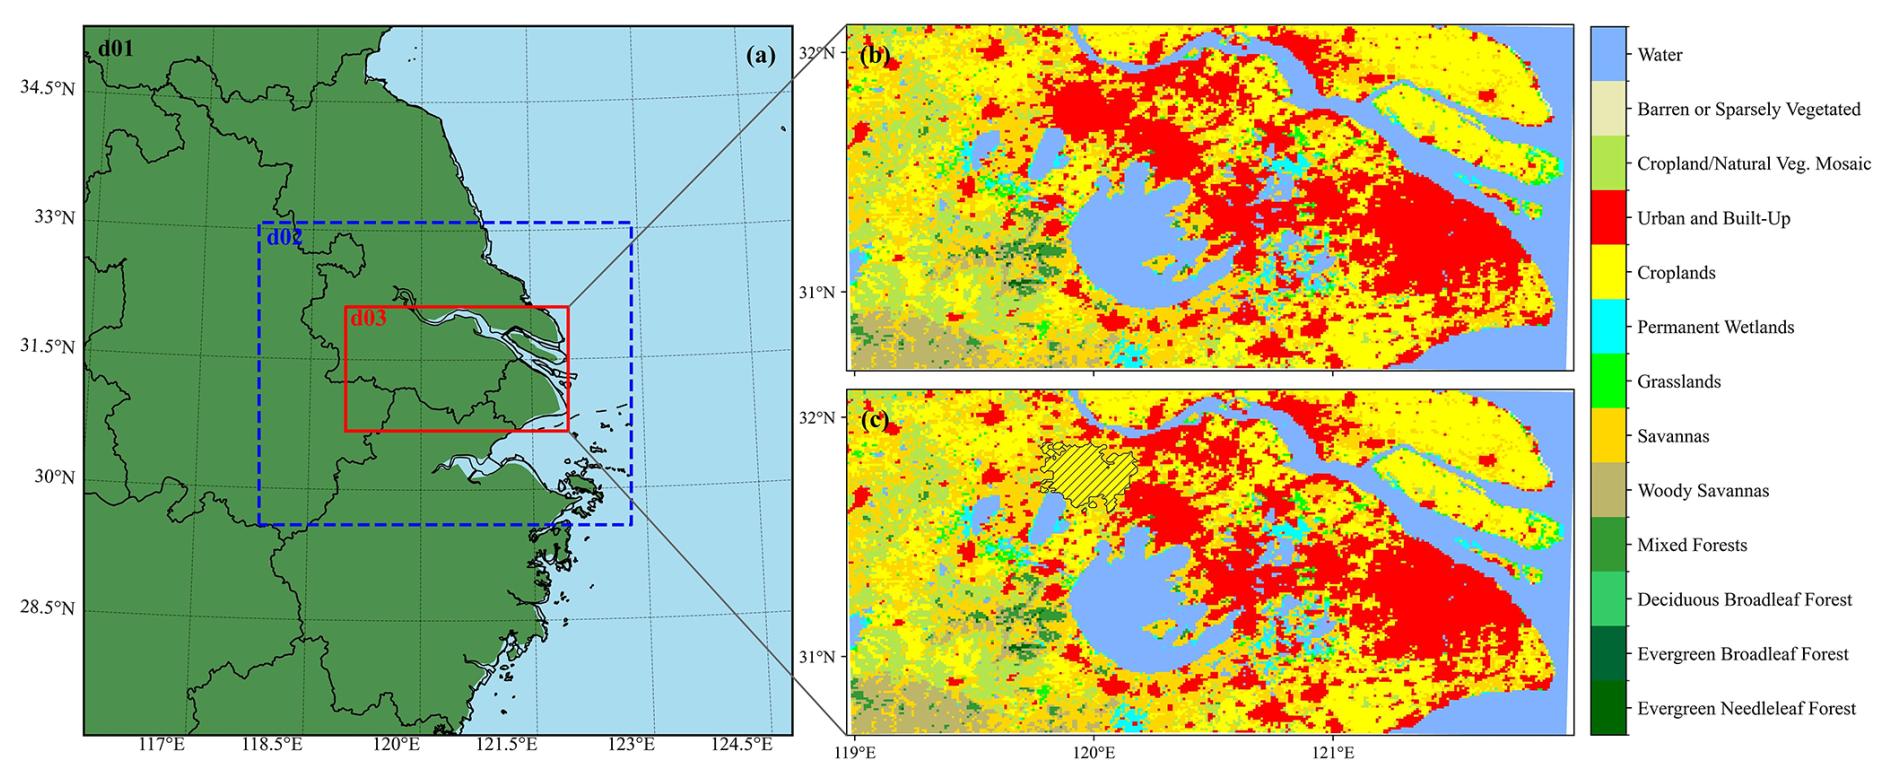
Figure 2(a) The setup of the nested domain over the study area. Land use and land cover within the innermost domain for (b) control simulation and (c) sensitivity experiment. In (c), the solid black lines and diagonal hatching represent the areas where the land use and land cover were modified.
The default land use/land cover (LULC) data within WRF was replaced with the MODIS land cover product (MCD12Q1, Version 6.1), which has a 500 m spatial resolution with better detail (Friedl and Sulla-Menashe, 2022). To quantitatively assess the contribution of the urban landscape to UHA, a sensitivity experiment (EXP) was conducted. In particular, the urban LULC within the downtown area of Changzhou city (represented by U2 stations) was replaced with croplands, while all other model configurations and forcing remained identical to the control simulation (CTRL).
To quantify the differences in the CUHII of downstream cities in the sensitivity experiments, ΔCUHII was calculated:
where CUHIIi,CTRL(t) and CUHIIi,EXP(t) denote the CUHII values in region i derived from the control simulation and the sensitivity experiment, respectively. The criteria for demarcating the rural reference area in the model are given in Supplement Sect. S1. A positive ΔCUHII indicates an increase in the CUHII in downstream cities, and vice versa. In addition, the horizontal temperature advection term in the thermodynamic energy equation was calculated as follows:
where U and V are the horizontal wind components, and T is the air temperature. All variables were taken from the lowest atmospheric layer of the model.
2.2.4 Calculation of BUHI intensity
Owing to the high spatial resolution of numerical simulations, the BUHII can be further calculated. BUHII is defined as the mean potential temperature difference within the PBL between urban and reference rural areas, and its calculation formula is as follows:
where and represent the thickness-weighted mean potential temperature within the boundary layer over urban and rural areas, respectively. Taking the urban area as an example:
where Ni is the number of grid points in the urban region i; for a given grid point j, Ki,j denotes the number of vertical layers from the lowest model level to the PBLH (output by the model); and is the potential temperature at time t at the kth layer of grid point j. denotes the physical thickness of the kth vertical layer, and zstag denotes the height of vertically staggered grid. The calculation method for the rural area is similar:
where Nr is the number of grid points in the rural area r. Similarly, ΔBUHII is employed to quantify the difference in BUHII of downstream cities between the control simulation and sensitivity experiments:
where the subscripts CTRL and EXP denote the control simulation and the sensitivity experiment, respectively.
3.1 Spatiotemporal characteristics of UHA under prevailing wind conditions
Wind conditions play an important role in modulating the intensity and spatial heterogeneity of the UHI (He, 2018; Yang et al., 2023). The regional background wind speed and direction were derived from four representative observation stations (Fig. 3). The prevailing wind directions exhibit pronounced seasonal variation, which is partly governed by the East Asian monsoon system. During summer (June–August), southeast flows prevail under the influence of the Western Pacific subtropical high (Shi et al., 2025; Zong et al., 2021), and the urban thermal plumes are primarily driven by solar heating and the sensible heat flux from engineering materials. Conversely, the frequency of northwest winds increases relatively in winter (December–February), driven by the continental Siberian high (Dai et al., 2025), and anthropogenic heat flux is a key driver of thermal plumes (Varentsov et al., 2018). Spring and autumn serve as transition periods, displaying greater variability in wind direction, and may be influenced by local circulations (e.g., sea breezes and lake breezes) under weak synoptic conditions (Yang et al., 2023). It is noteworthy that the prevailing monsoon direction aligns with the arrangement of the urban agglomerations, both being northwest-southeast (e.g., the urban U1–U2–U4–U6–U9 and U3–U5–U7), and there are no strong heat sources in the upstream or downstream of rural areas along this direction (Fig. 1b). Therefore, the characteristics of UHA under northwest and southeast wind conditions are discussed in detail.
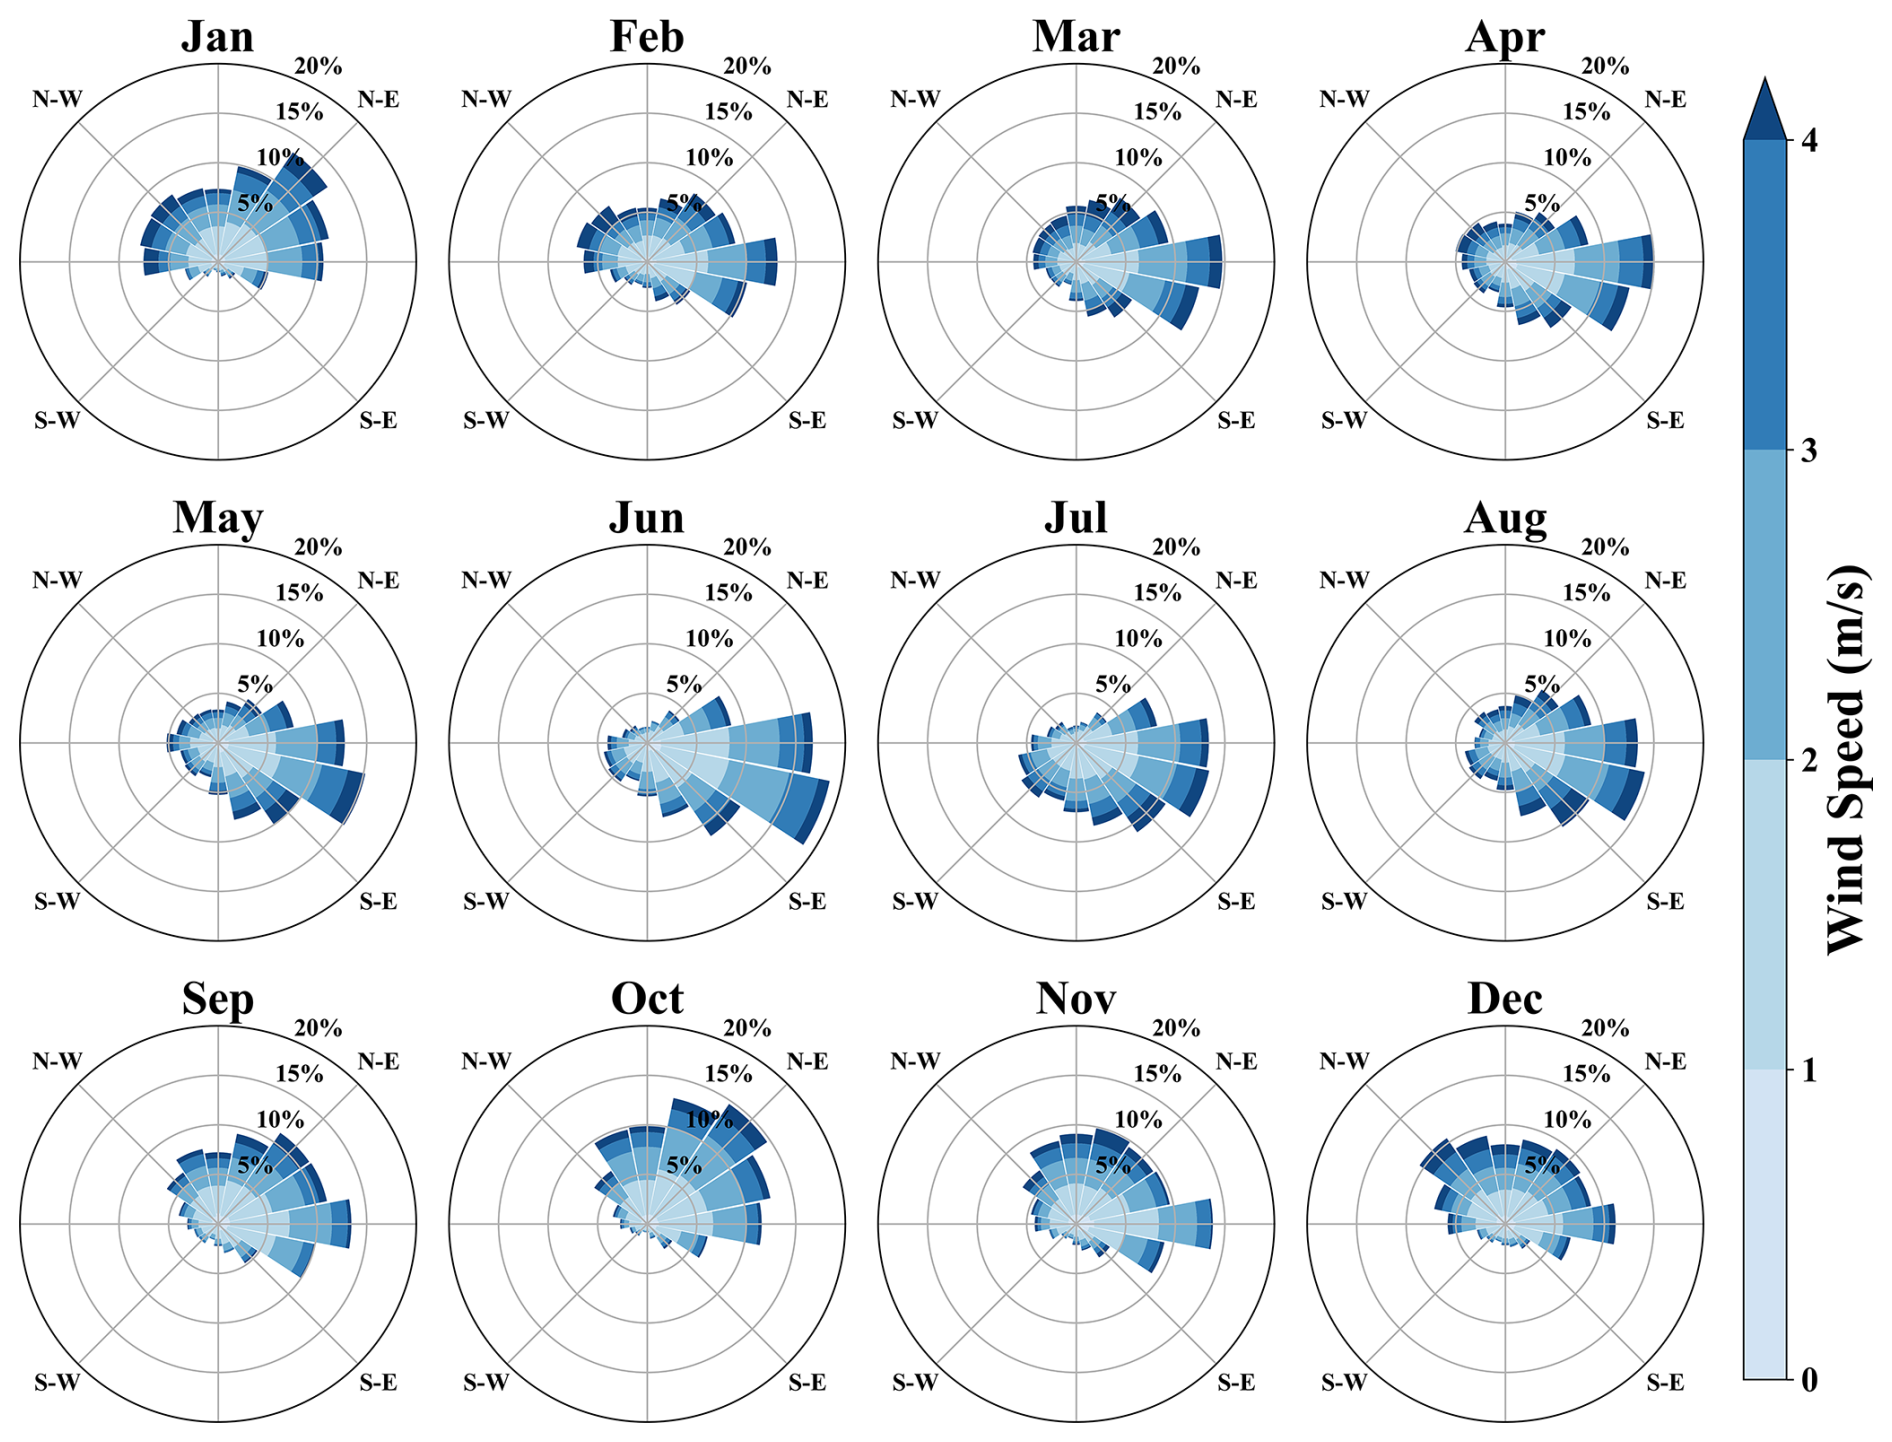
Figure 3Monthly 10 m wind rose diagrams based on hourly wind data at four national meteorological stations.
The spatiotemporal characteristics of CUHI and UHA under northwest wind conditions are shown in Supplement Fig. S1 and Fig. 4. The regionally daily-averaged CUHII ranges from 0.22 to 1.38 °C and generally shows higher intensity at night than during daytime (Fig. S1). For upstream areas, the daily-averaged UHA intensity is negative (e.g., −0.17 °C in region U1, Fig. 4), indicating a mitigation of the CUHI (e.g., U1 exhibits a daytime urban cold island effect, Fig. S1a). Favourable ventilation conditions help reduce the UHI (Zheng et al., 2022), and increasing wind speed usually leads to a decrease in CUHII (Tian et al., 2023). When the wind speed exceeds a critical threshold, the UHI intensity may approach zero (He, 2018). Along the downwind direction, regional UHA intensity changes from negative to positive and progressively strengthens, reaching up to 0.32 °C in the strongest downstream region (Fig. 4). This spatial gradient indicates that heat from multiple urban sources is transported and superposed downstream through advection. In addition, UHA exhibits a distinct diurnal contrast, being generally greater at night than during the day, with the average intensity reaching approximately 0.6 °C during peak hours in some regions. For regions with positive daily-average UHA intensity (red lines in Fig. 4), the mean nocturnal UHA intensity (∼ 0.4 °C) is 319 % higher than its daytime counterpart (∼ 0.1 °C). In summary, under northwest wind conditions, the regional UHA pattern indicates that upstream areas benefit from ventilation-induced CUHI relief, whereas downstream urban zones experience enhanced heat loading, and UHA intensity shows day–night asymmetry.
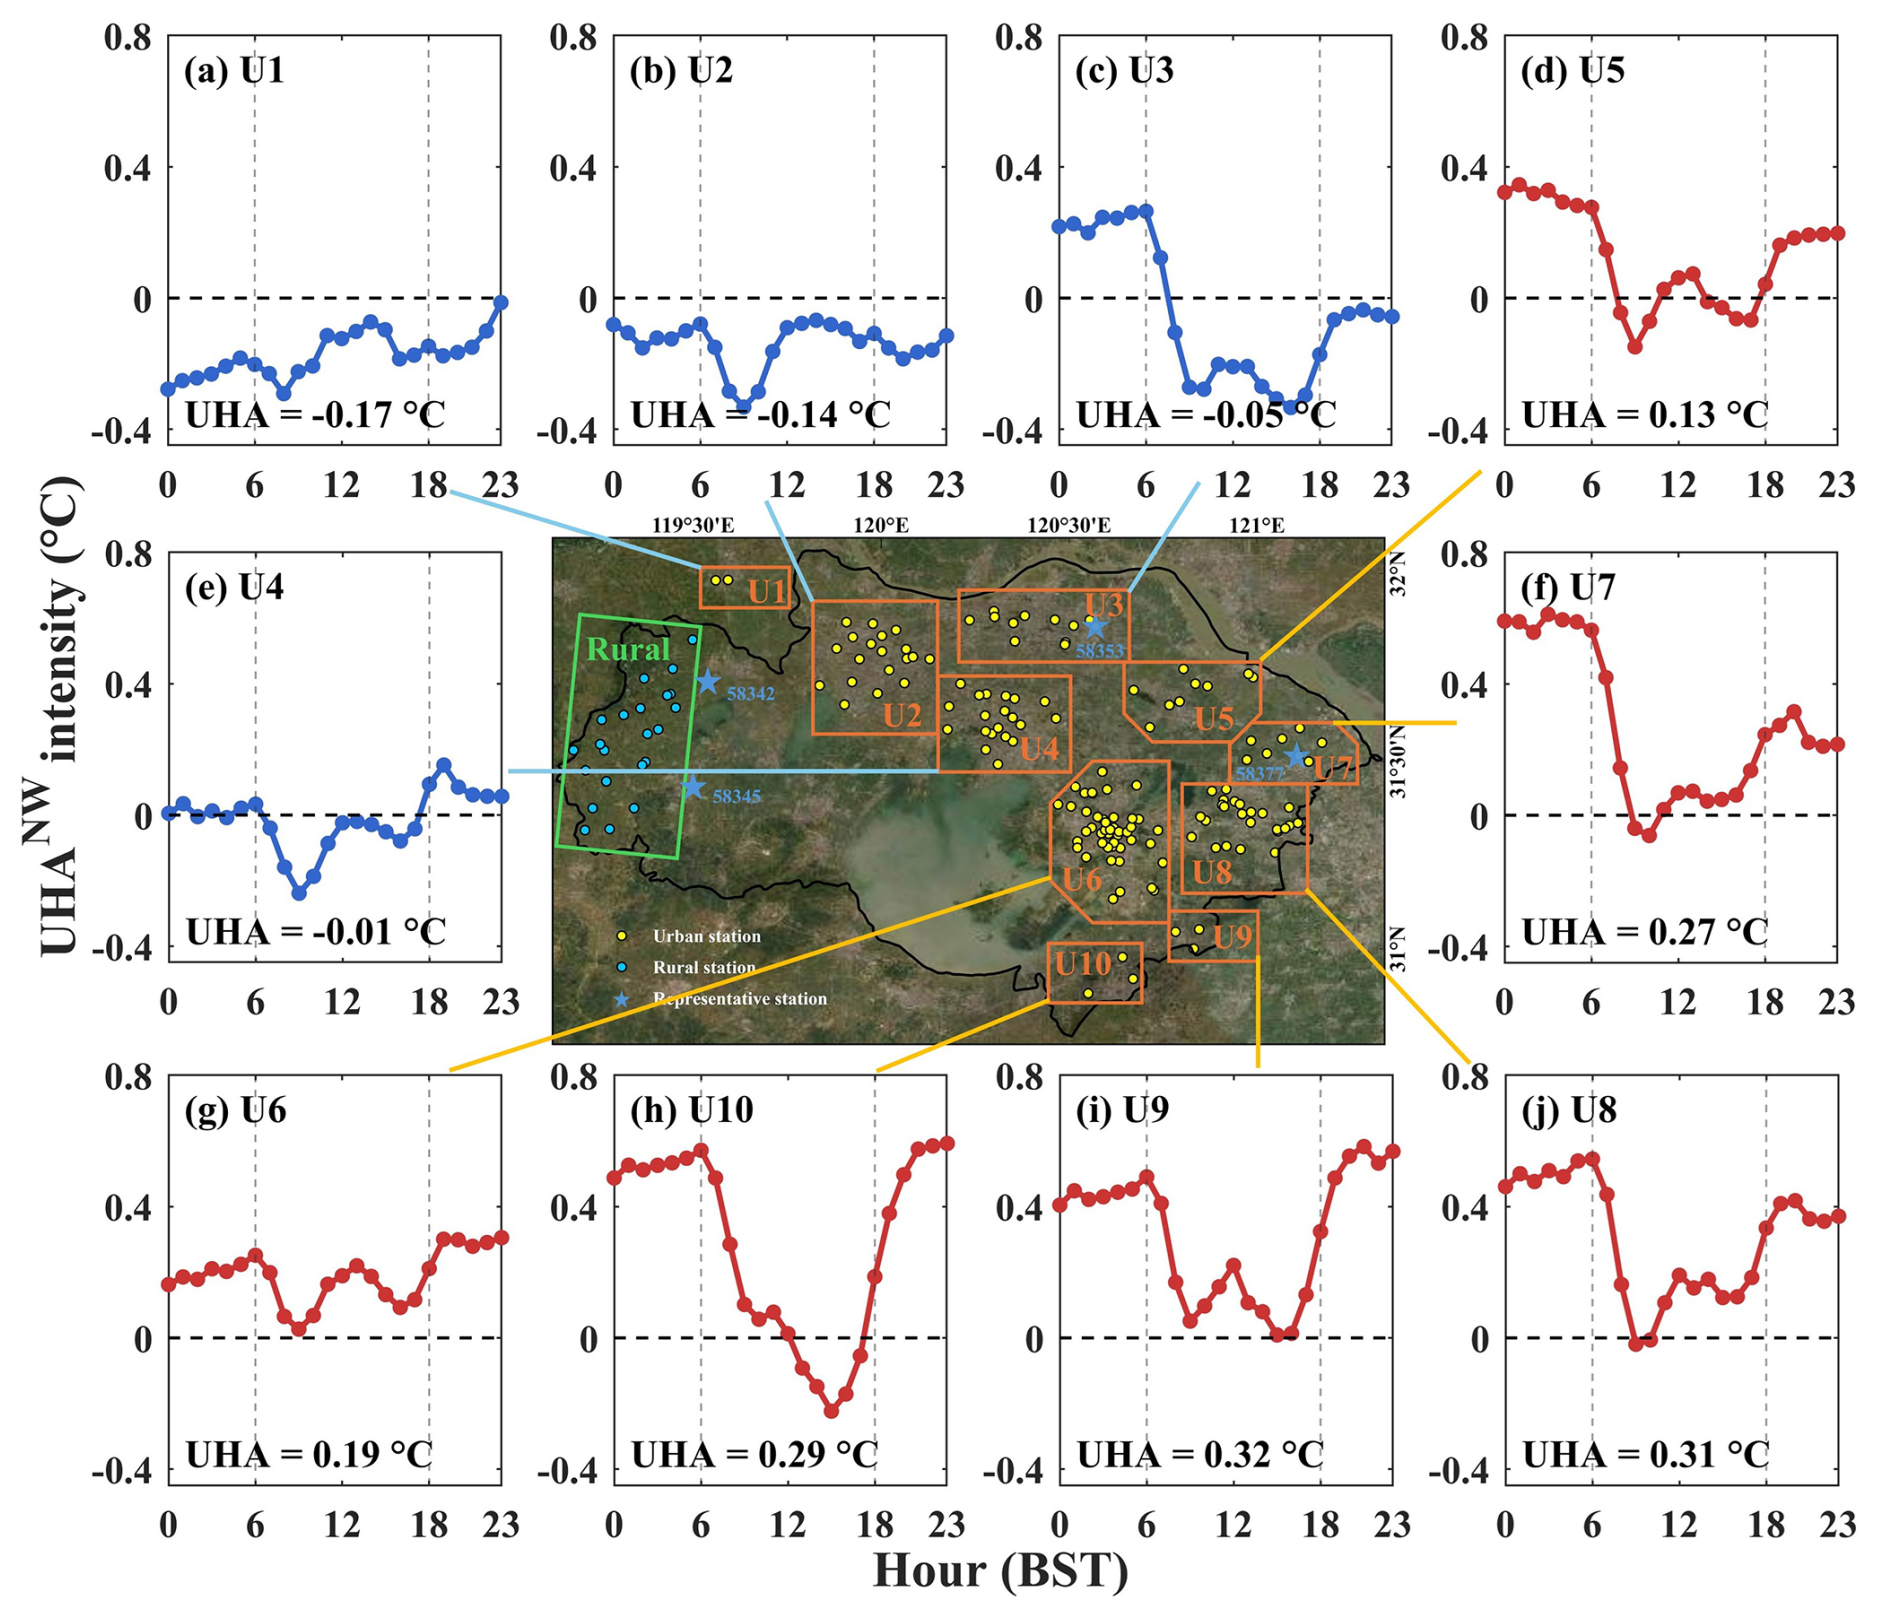
Figure 4Diurnal variation of hourly UHA intensity across different regions under northwest wind conditions (background map source: Esri | Powered by Esri). The numerical values indicate the daily-averaged UHA intensity for each region. Line colours represent the sign of the daily-averaged UHA intensity: red indicates positive values, while blue indicates negative values. Gray vertical lines indicate sunrise/sunset times.
The spatiotemporal characteristics of UHA under southeast and northwest wind conditions exhibit both commonalities and differences. Under southeast wind conditions, a pronounced cooling effect is observed in the upwind region, where the minimum averaged UHA intensity reaches −0.8 °C. Similarly, a distinct spatial gradient exists along the prevailing wind vector, characterized by a progressive increase in UHA toward the downwind region, with the maximum daily-averaged intensity reaching 0.09 °C (Fig. 5). Regions exhibiting a positive daily-averaged UHA (U1–U3) also demonstrate diurnal asymmetry: the mean nocturnal UHA is approximately 0.15 °C, whereas the daytime intensity decreases to −0.05 °C. Notably, CUHII also presents a pattern of higher values at nighttime and lower values during daytime (Fig. S2), consistent with the diurnal variation trend of the UHA (red lines in Figs. 4–5), suggesting that the specific contribution of UHA to the urban thermal environment is frequently obscured in conventional CUHI analysis. Overall, although both wind directions facilitate upwind ventilation and downwind heat accumulation, their net thermal effects differ. Northwest winds mainly exacerbate the CUHI across most regions of the study area, whereas southeast winds exert a more extensive mitigating influence due to the cooling effect of sea breezes (Yang et al., 2023). Consequently, the subsequent sections investigate the driving factors of UHA specifically under northwest wind conditions.
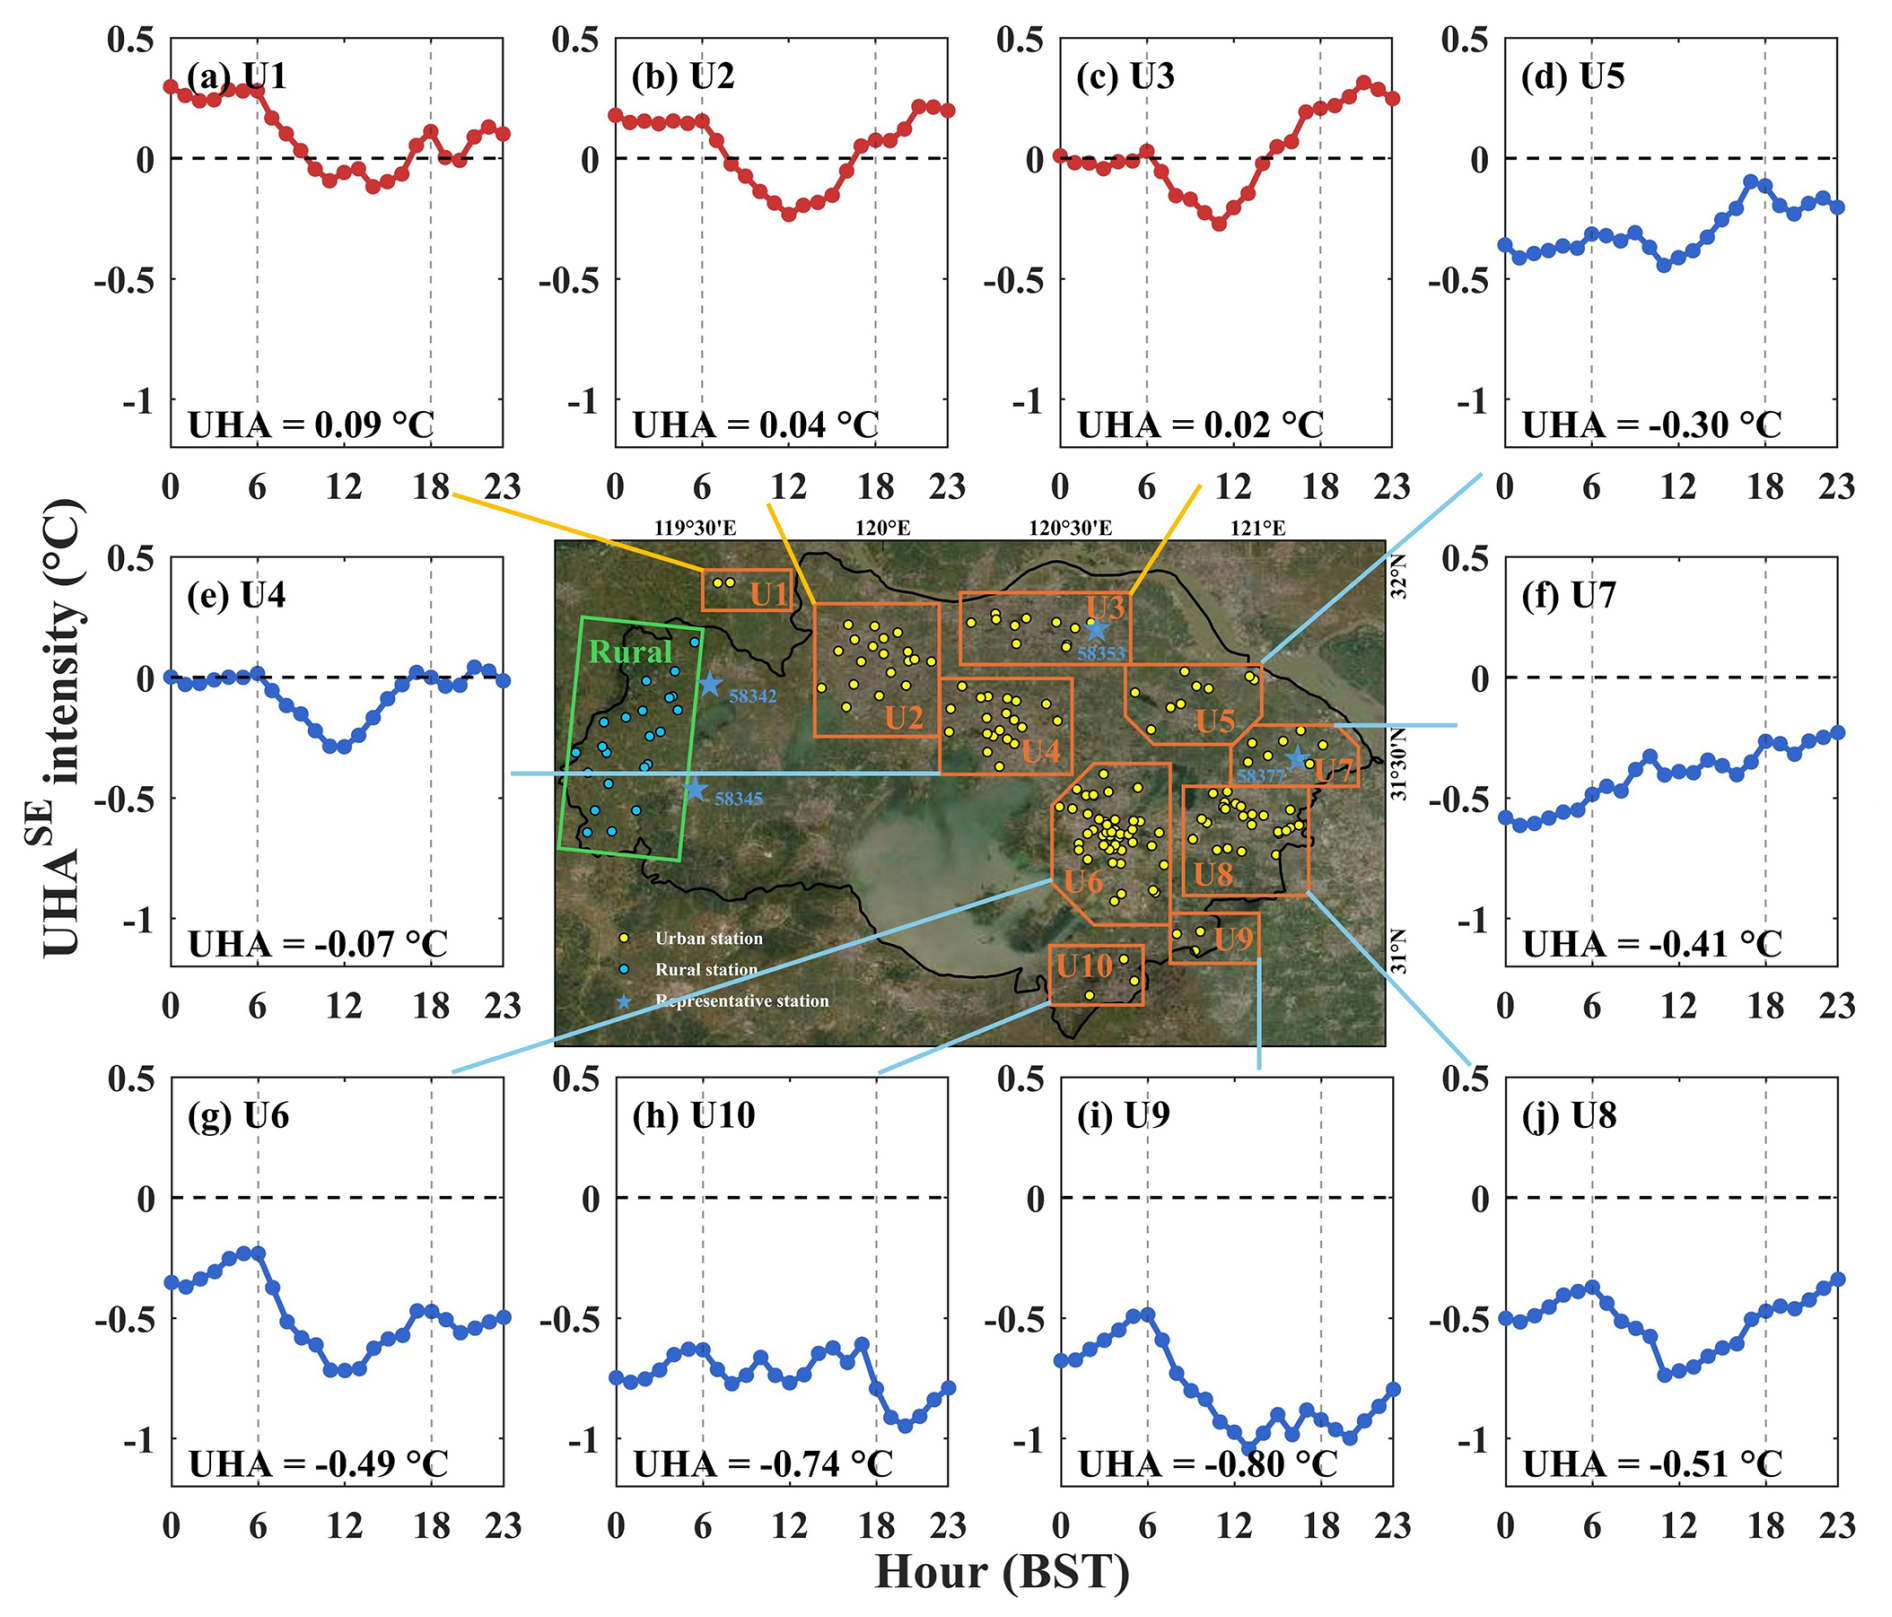
Figure 5Same as Fig. 4, but under southeast wind conditions (background map source: Esri | Powered by Esri).
3.2 Changes in UHA with wind speed and PBLH
UHA intensity is modulated by meteorological conditions. Previous studies have discussed nocturnal UHA in some cities, such as Birmingham (temperate maritime climate) (Bassett et al., 2016) and Lubbock (semi-arid climate) (Danzig et al., 2025), finding that wind speed and direction are important factors influencing UHA. Extending beyond prior nocturnal analyses, this study examines UHA under both daytime and nighttime conditions while incorporating PBLH as an additional parameter. Daytime (typically characterized by unstable boundary layer conditions) was defined as 08:00–19:00 BST, while nighttime (typically characterized by stable boundary layer conditions) spans 20:00–07:00 (Zhang et al., 2023). Screening was conducted according to the following criteria: mean 10 m wind speed < 4 m s−1 and mean PBLH < 1400 m (700 m) for daytime (nighttime) conditions, with 93.13 % (94.48 %) of the samples meeting the requirements. This section discusses the relationships between UHA intensity, wind field, and PBLH under nocturnal and diurnal conditions.
In a stable boundary layer (SBL), the advection term often dominates the surface heat budget (Stull, 1988). Figure 6 presents the nocturnal UHA intensity as a function of wind speed and PBLH across different regions. For the downstream region with a positive mean UHA (red line in Fig. 6), UHA intensity generally increases and then decreases with increasing wind speed and PBLH. At night, in the absence of solar-driven buoyancy flux, mechanical shear generated by wind is the primary source of turbulent kinetic energy (Stull, 1988), and strong shear forces are beneficial to the development of deep SBL (Zilitinkevich et al., 2002). The variation in UHA appears closely linked to boundary layer processes. In a very SBL, characterized by weak winds, low PBLH, intermittent and weak turbulence (Sun et al., 2012; Xue et al., 2025; Zhang et al., 2024b), horizontal heat transport is suppressed and vertical mixing is negligible, limiting the efficiency of UHA transfer. As wind speed and PBLH increase, horizontal advection and turbulence (driven by mechanical shear) strengthen (Mahrt, 2014), and UHA intensity reaches its peak (e.g., in region U7, the mean UHA intensity can reach 0.88 °C in the wind speed range of 2–3 m s−1, see Fig. 6g1). This phenomenon is consistent with observations in Birmingham and Lubbock (Bassett et al., 2016; Danzig et al., 2025). Consequently, the peak impact of nocturnal UHA typically occurs under moderate wind speed conditions, and this pattern may be universal across cities with different climatic backgrounds. When wind speed further increases, and the stable boundary layer transitions to a neutral boundary layer, vertical turbulent exchange intensifies, promoting vertical dilution of urban heat, leading to a decrease in UHA, which may even produce negative values in some regions (e.g., U3–U6; Fig. 6c–f). Furthermore, for upstream regions with negative mean UHA (e.g., U1), UHA intensity decreases with increasing wind speed and PBLH, demonstrating the mitigating effect of ventilation on CUHI. In summary, nocturnal UHA intensity is nonlinearly modulated by wind speed and boundary layer turbulence, with maximum UHA typically occurring under moderate wind and PBLH conditions.
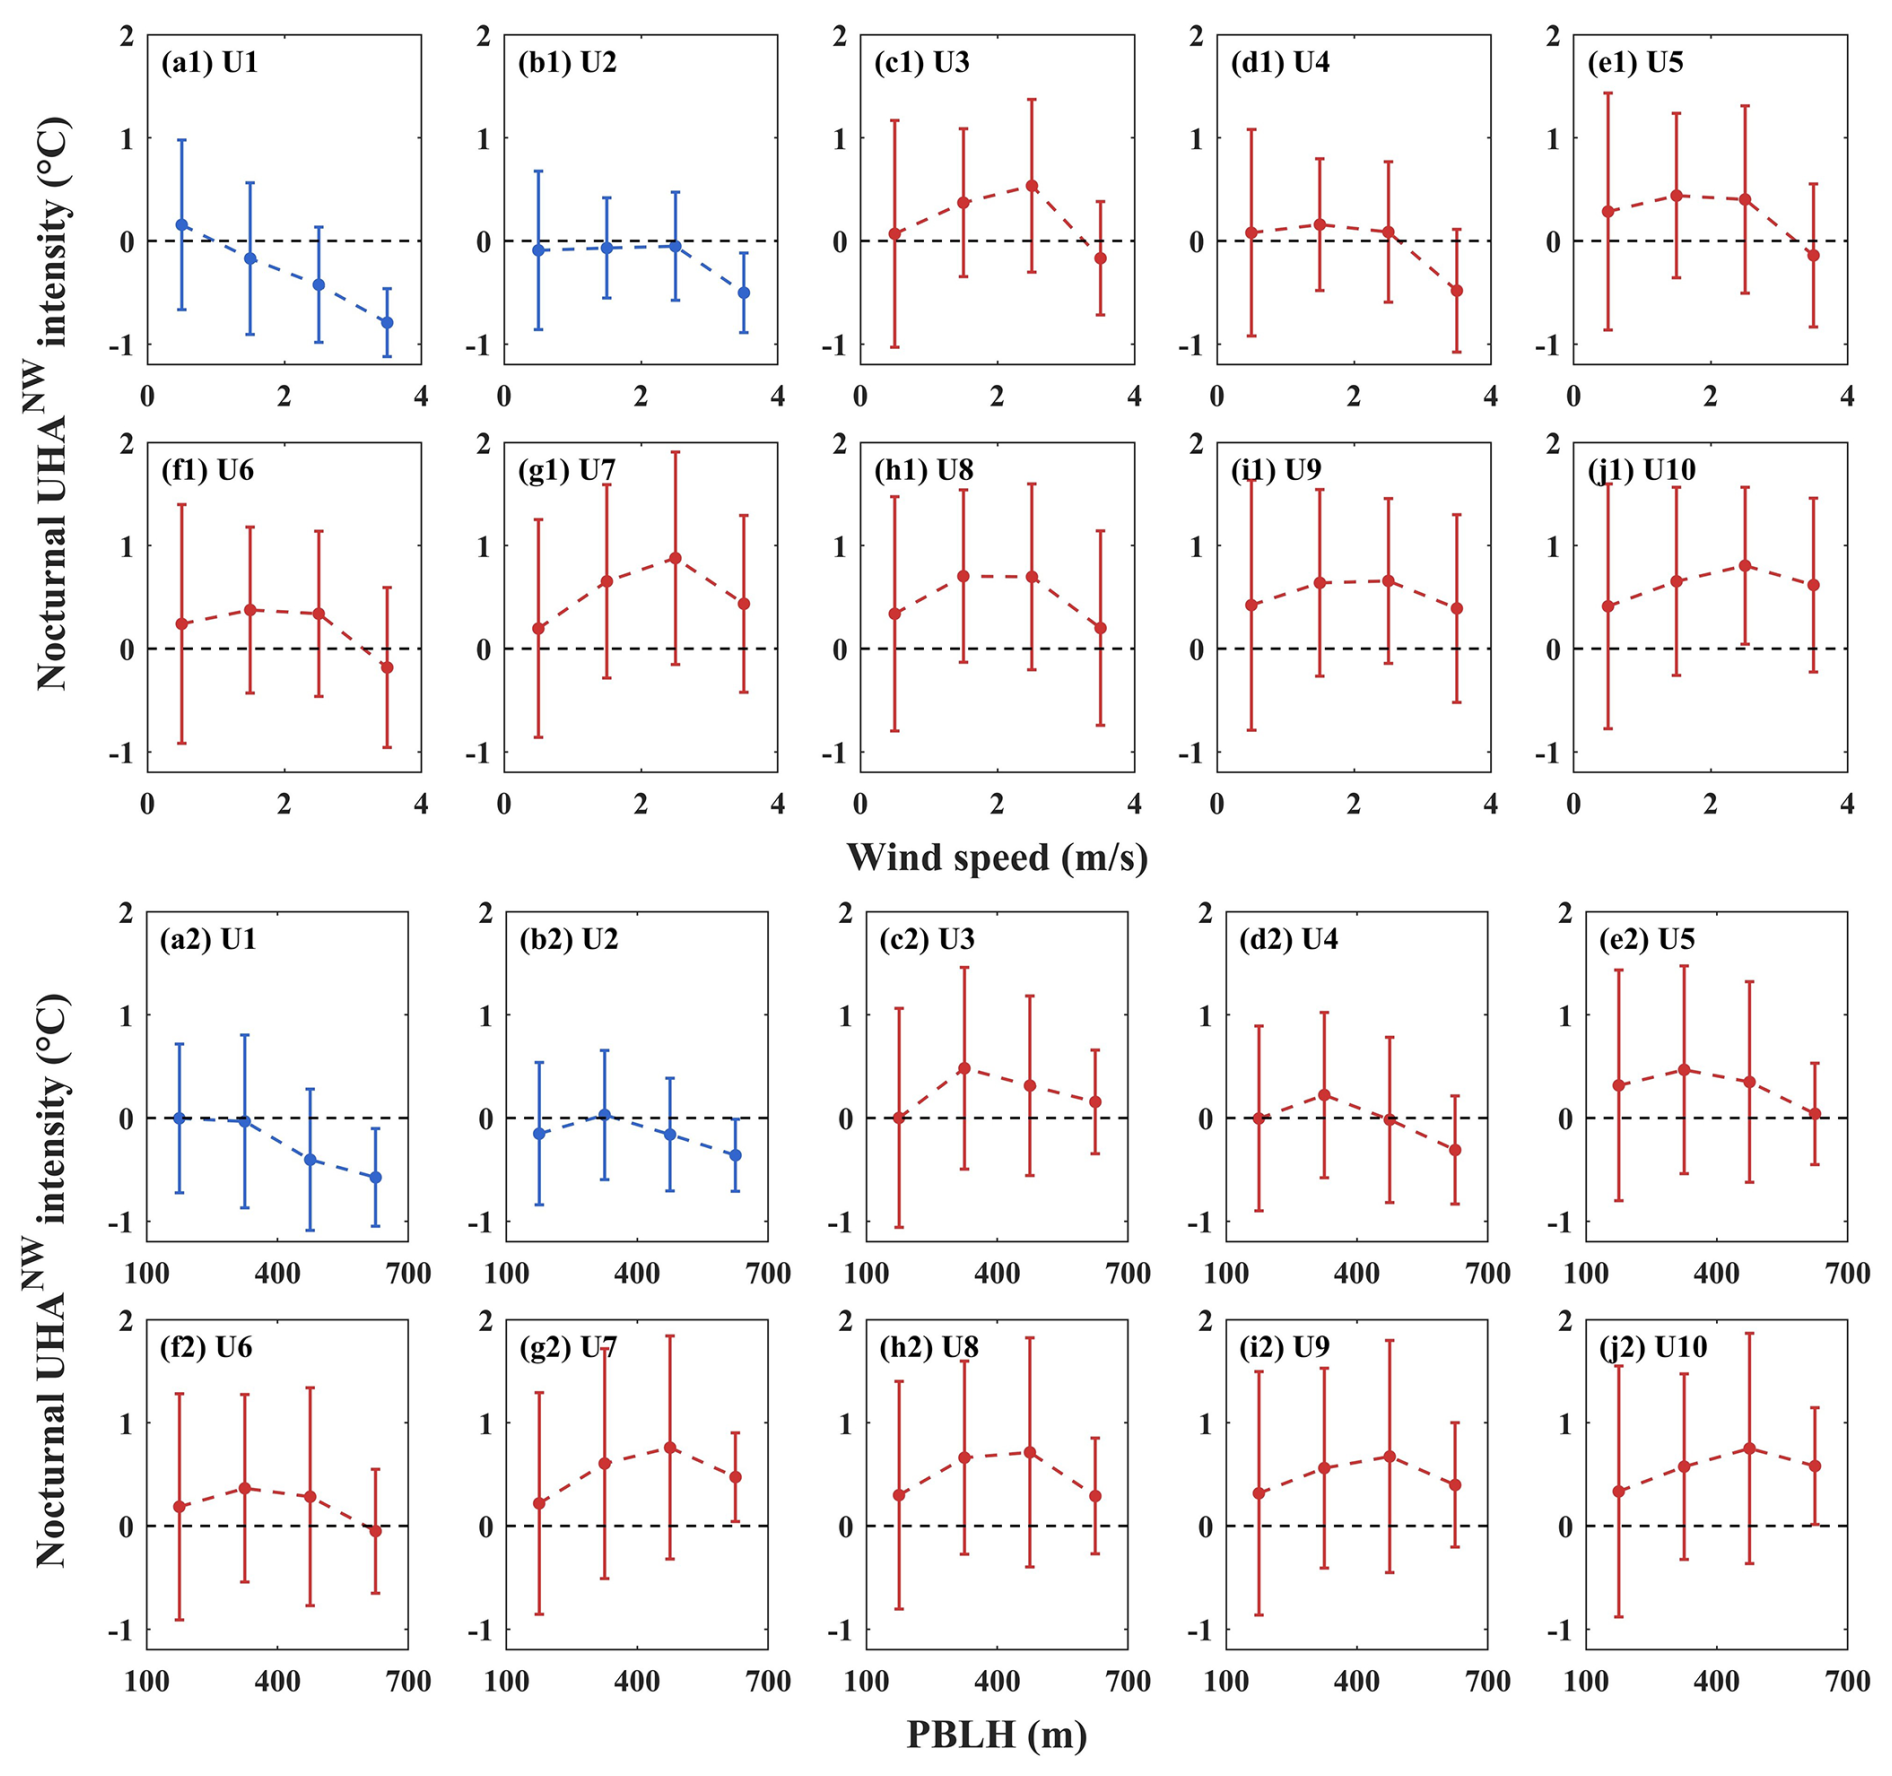
Figure 6Nocturnal averaged UHA intensity as functions of (a1–j1) wind speed and (a2–j2) PBLH across different regions. Line colours represent the sign of the nocturnal averaged UHA intensity: red indicates positive values, while blue indicates negative values. The bars indicate the standard deviation.
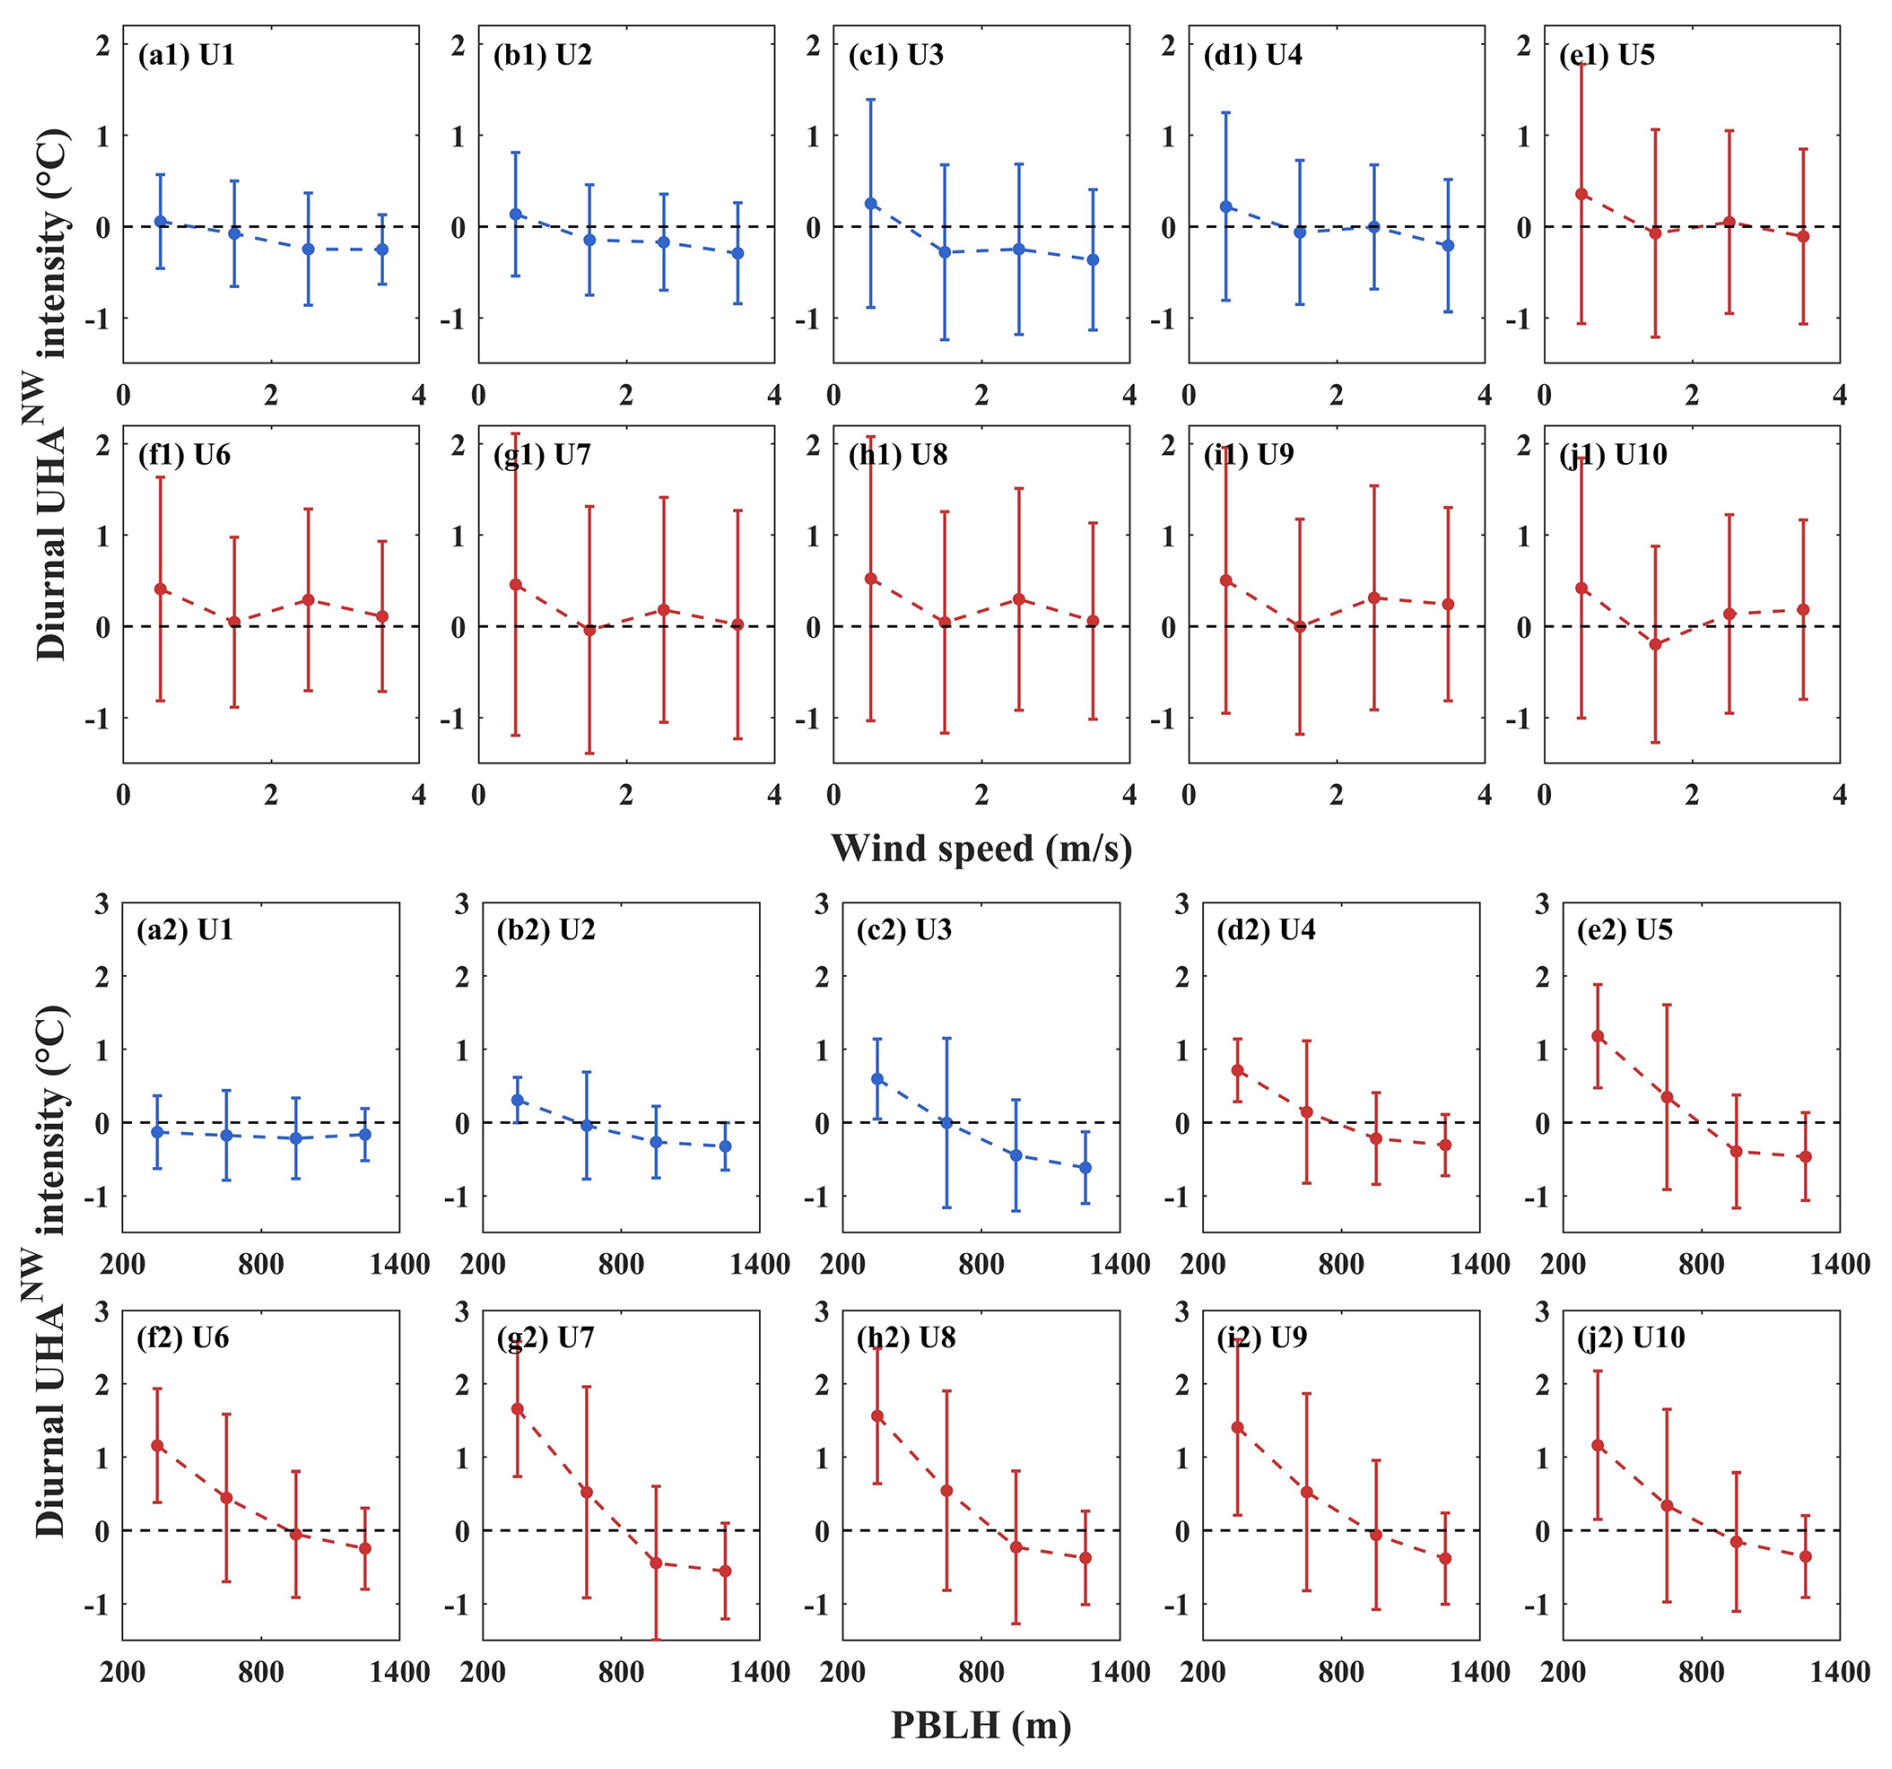
Advection partially contributes to the thermal budget of the convective boundary layer (CBL) (Stull, 1988). Figure 7 illustrates the daytime variation in UHA intensity as a function of wind speed and PBLH. In downwind regions characterized by a positive daytime mean UHA (red lines in Fig. 7), no systematic correlation is observed between wind speed and UHA intensity; overall, UHA intensity was relatively higher under low wind speed conditions. In contrast, UHA exhibits a pronounced negative dependence on PBLH. As PBLH increased, daytime UHA intensity decreased significantly. When PBLH exceeds 800 m, the mean UHA intensity shifts to negative values across all regions, with the lowest intensity at approximately −0.6 °C. In daytime CBL, intense buoyancy-generated turbulence deepens the PBL (Xian et al., 2024) and efficiently redistributes urban heat, which suppresses downstream canopy-level UHA. Therefore, thermally driven turbulent mixing acts as a critical moderating factor for daytime UHA intensity, with peak UHA intensity typically manifesting under low PBLH conditions.
3.3 Sensitivity analysis of UHA using the WRF numerical model
Numerical simulations were employed to investigate UHA characteristics at higher spatial resolution. Sensitivity experiments utilizing modified LULC configurations have become a mature approach for quantifying urban impacts on regional thermal environments (Moustaoui and Georgescu, 2025; Zhao et al., 2021). In the sensitivity experiment, the LULC within the downtown area of Changzhou (U2) was replaced with croplands to isolate approximately the thermal contribution of urbanization to downstream regions (methodology detailed in Sect. 2.2.3), particularly the impact on the downtown areas of Wuxi (U4) and Suzhou (U6). Model performance was evaluated by comparing simulated 2 m air temperature and 10 m wind field of domain 3 against hourly observations from all available meteorological stations within the ROI (Fig. 8). For 2 m air temperature, the RMSE and the Pearson correlation coefficient (R) were 1.80 °C and 0.92 (p<0.001), respectively (Fig. 8a). For 10 m wind field, the RMSE for wind direction and wind speed were 34.77° and 2.62 m s−1, respectively (Fig. 8b). In addition, the RMSE of PBLH between the model and the dataset (Guo et al., 2024) is 262 m. To provide a more comprehensive validation of the model's performance, we calculated additional statistical metrics for the simulation period. For 2 m air temperature, the Mean Absolute Error (MAE) was 1.29 °C, the Mean Bias (MB) was 0.99 °C (indicating a slight warm bias), and the Index of Agreement (IOA) was 0.93. For 10 m wind speed, the MAE was 2.01 m s−1 and the MB was +1.70 m s−1 (reflecting a typical overestimation of wind speed by WRF in urban areas due to simplified canopy drag representations, Yu et al., 2021), with an IOA of 0.71. For the PBLH, the MB compared to the radiosonde-reanalysis merged dataset was −66 m. These quantitative metrics demonstrate that the model captures both the diurnal thermal cycle and the wind-driven transport dynamics with acceptable accuracy, establishing a solid baseline for the sensitivity experiments.
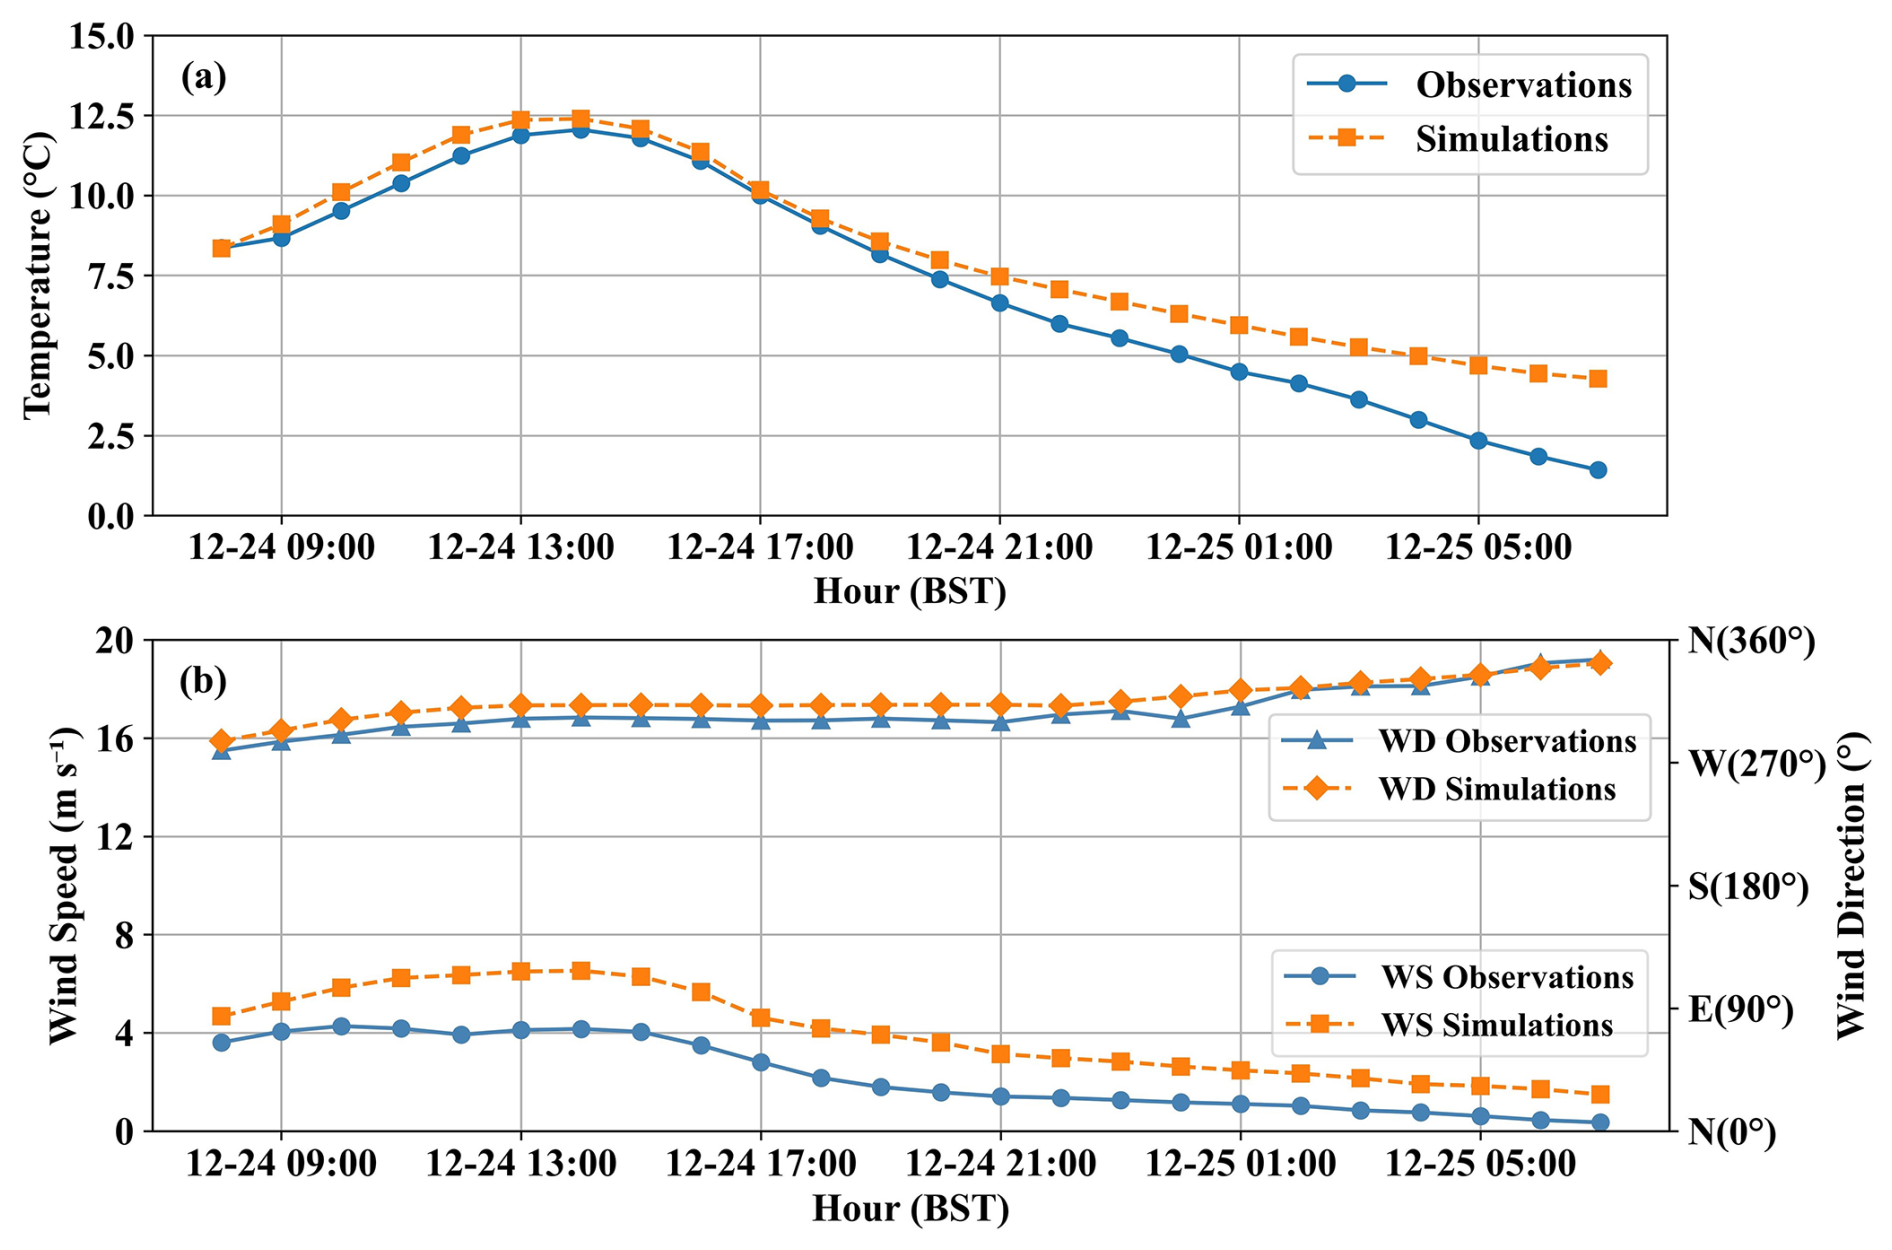
Figure 8Comparison of hourly mean (a) 2 m temperature and (b) 10 m wind speed (below lines) and wind direction (above lines) from WRF simulations (orange lines) and observations (blue lines) within the ROI.
The observation-based UHA intensity was compared with the WRF-simulated horizontal temperature advection. Taking Wuxi (U4), which lies downwind of Changzhou (U2) under the prevailing northwest wind direction, as an example, the observed daily mean CUHII during the simulation period was 2.24 °C (Fig. 9a). The UHA intensity was negative after sunrise, turned positive around midday, and continued to intensify, reaching a maximum of 3.15 °C at night before declining toward the following morning (Fig. 9b). The daily mean UHA intensity was 1.38 °C, indicating that UHA enhances CUHII under the prevailing wind direction. Figure 9c shows the difference in horizontal temperature advection between the control and sensitivity experiments (CTRL minus EXP). This difference also exhibited a broadly similar pattern with higher values at night and lower values during the day, with a nighttime peak of approximately 0.45 K h−1 and a daily mean of 0.18 K h−1 (Fig. 9c). Overall, the UHA intensity and the horizontal temperature advection showed similar diurnal variations.
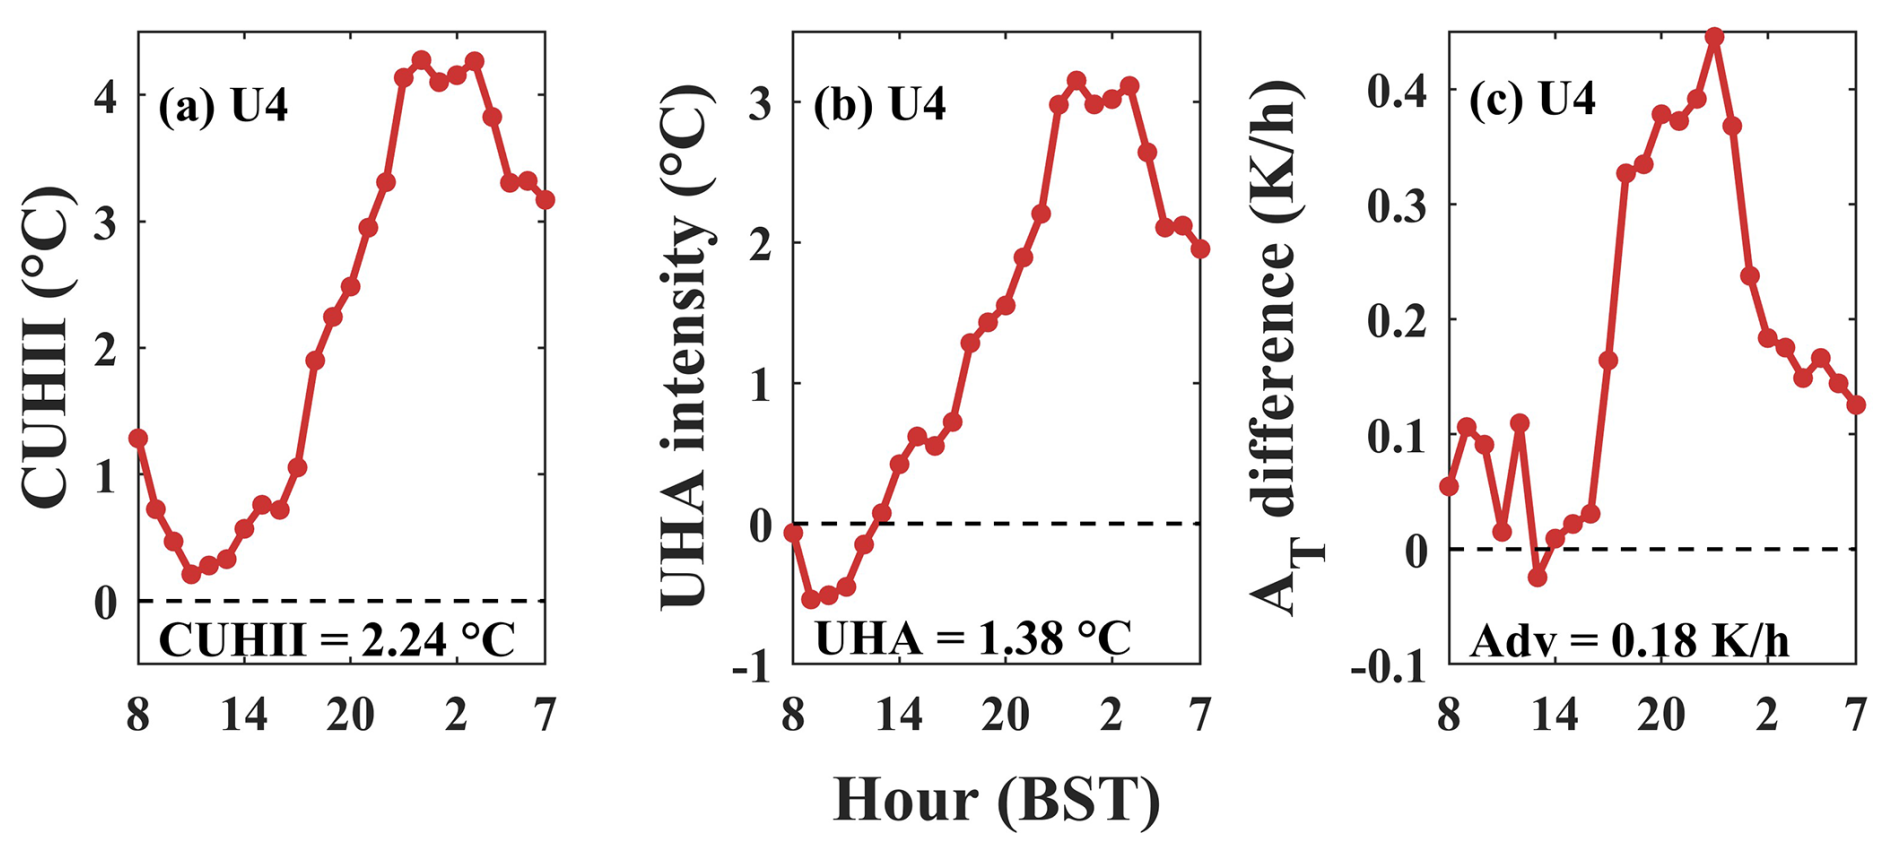
Figure 9Diurnal variation of hourly (a) CUHII, (b) UHA intensity, and (c) horizontal temperature advection difference between the control simulation and the sensitivity experiment (CTRL minus EXP) over Wuxi (U4) during the simulation period. Annotated values indicate the respective daily means.
Figure 10 illustrates the spatial distribution of the 2 m temperature difference between the control and sensitivity simulations (CTRL minus EXP), approximately representing the thermal and dynamic contributions of upstream urbanization in Changzhou to the downstream canopy temperature. During the analysis hours, northwest winds prevailed in domain 3. Influenced by the UHI, Changzhou exhibited a pronounced warming, with positive temperature anomalies of 3.58 and 0.42 °C at 22:00 and 15:00 BST, respectively. This phenomenon arises from the coupled interplay of thermal and dynamic processes. Thermally, urban materials and anthropogenic heat emissions drive a substantial increase in sensible heat flux. Dynamically, the elevated aerodynamic roughness length of the urban canopy suppresses near-surface wind speeds and ventilation (Oke et al., 2017). Both factors together modulate the local positive temperature anomaly and determine its subsequent advection propagation to downstream regions. The simulations show a diurnal variation in the 2 m temperature differences. At night (22:00 BST), lower wind speeds were accompanied by a high UHA intensity but with a limited advective distance, and strong warming was concentrated in the short distance downstream of the city (Fig. 10a). In contrast, daytime conditions (15:00 BST) featured higher wind speeds, which were accompanied by lower UHA intensity but a greater thermal influence distance (Fig. 10b). Under the prevailing northwest winds, the U10 region was also affected by the thermal forcing of Taihu Lake in addition to UHA. During winter, Taihu Lake functions as a daytime heat sink and a nighttime heat source relative to the surrounding environment (Fig. S3). Furthermore, Cosgrove and Berkelhammer (2018) utilized a Lagrangian atmospheric transport model to demonstrate that the Chicago urban thermal plume caused significant heating at 100–200 m above ground level, extending up to 70 km downwind. The sensitivity experiments in this study show that the downstream canopy region was also heated, with the thermal influence beyond 100 km.
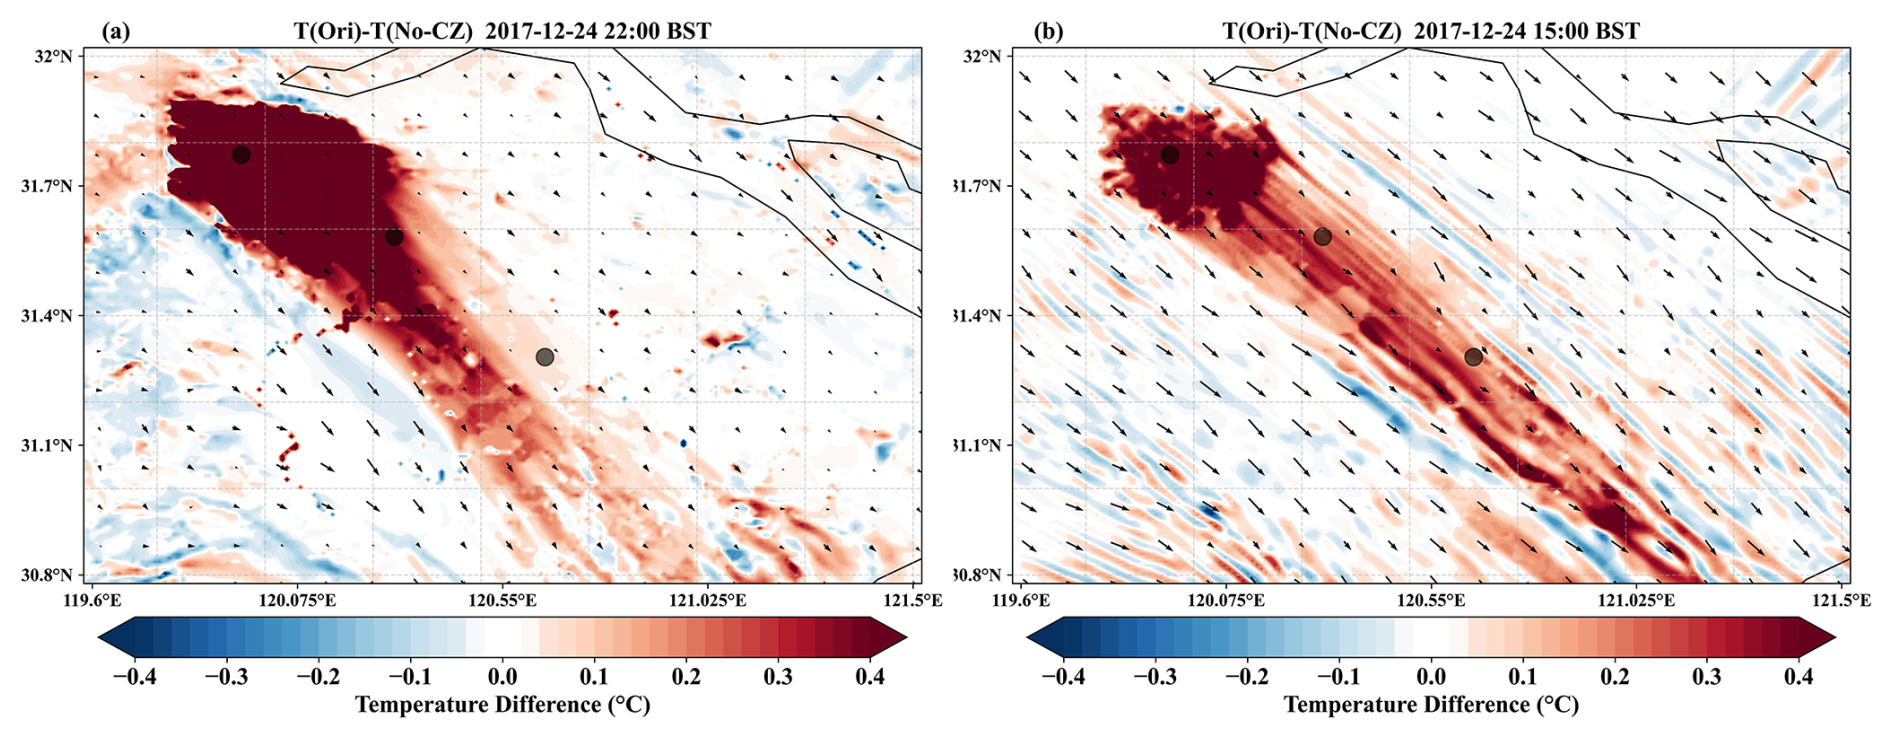
Figure 10Spatial distribution of the 2 m temperature difference between the control simulation and the sensitivity experiment (CTRL minus EXP) at (a) 22:00 BST and (b) 15:00 BST. Vector arrows indicate the 10-meter wind field of the CTRL. The three marked locations from northwest to southeast correspond to downtown areas of Changzhou (U2), Wuxi (U4), and Suzhou (U6), respectively.
Vertical cross-sections of potential temperature and wind vector differences between control and sensitivity experiments were analysed (Fig. 11). The cross-section along a northwest-southeast direction spans approximately 114 km (Fig. 11a), encompassing cities from Changzhou (U2) through Wuxi (U4) to Suzhou (U6). Note that the coordinate rotation was applied to the horizontal wind component u to align it with the cross-section direction, with positive values corresponding to northwest winds. For example, significant negative horizontal wind components within Changzhou's near-surface layer are due to the urban rough surface. At night (22:00 BST), the atmospheric stratification is stable, and updrafts and downdrafts induced by the UHI can be observed over urban areas, particularly in Wuxi (see the CTRL results in Fig. S4b). Thermal plume was suppressed within the near-surface layer, and substantial heat within Changzhou propagated downstream primarily below 100 m, although the PBLH can reach 750 m (Fig. 11b). Following sunrise, solar shortwave radiation enhanced surface heating and buoyancy-driven turbulence (Zhang et al., 2023), elevating PBLH to approximately 1600 m by afternoon (15:00 BST, Fig. S4c). Compared to nighttime conditions, enhanced ventilation and vertical mixing extended thermal influences throughout the entire PBL depth (Fig. 11c), intensifying the BUHI in Wuxi and Suzhou. As the thermal plume propagates, vertical heat redistribution may occur through turbulent mixing in downstream cities. In addition, the updraft in the downstream area is strengthened, and the vertical circulation in Wuxi during the day may be UHA-enhanced UHI circulation (Fig. 11b–c).
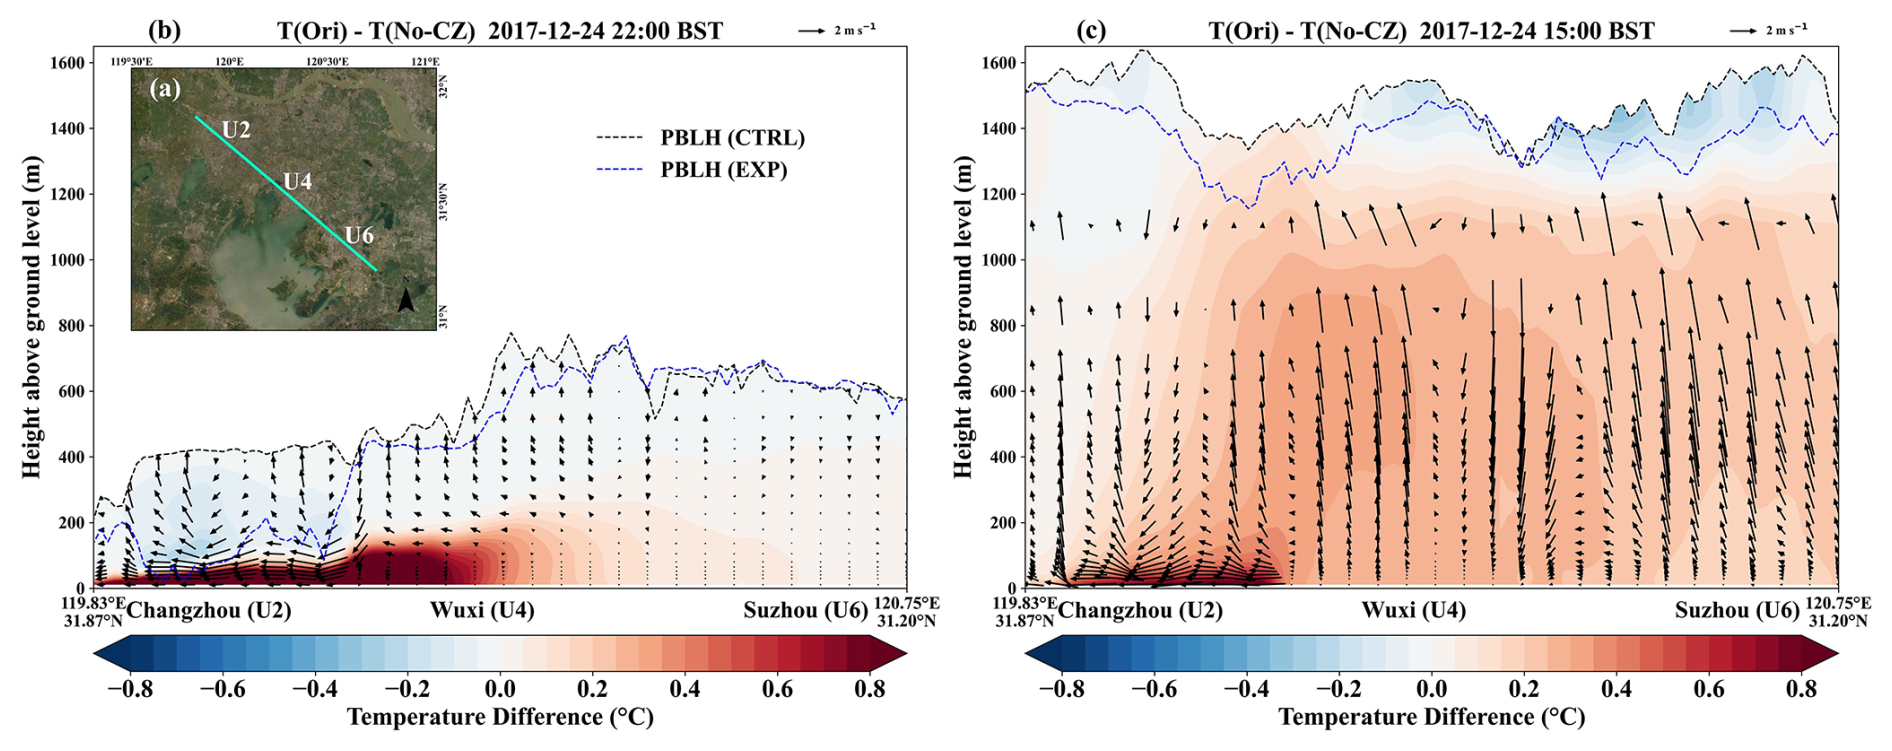
Figure 11(a) Geographical location of the vertical cross-section (background map source: Esri | Powered by Esri). (b, c) Vertical cross-sections of the potential temperature and wind vector differences between the control simulation and the sensitivity experiment (CTRL minus EXP) at (b) 22:00 and (c) 15:00 BST. Wind vectors were synthesized by rotating u (along the transect axis) and scaling ω (ω multiplied by 50). The black and blue solid lines denote the PBLH in the CTRL and EXP simulations, respectively.
The sensitivity experiments quantified UHA contributions from a single upstream city. In reality, taking the downstream city of Suzhou as an example, its UHI is influenced by multiple upstream heat sources, including weak UHA transport from distant Changzhou superimposed upon strong UHA contributions from adjacent Wuxi. When the LULCs in upstream Changzhou and Wuxi are simultaneously replaced with croplands in the sensitivity experiment, enhanced cross-city thermal plume superposition and greater PBLH differences were shown (Fig. S5). These results demonstrate that the intensity and spatial structure of UHA are closely related to diurnal boundary layer evolution.
The CUHII differences of the downstream adjacent city Wuxi (U4) were evaluated between two experimental scenarios. Figures 12a show scatter plots of ΔCUHII and both wind speed and PBLH across different hours. Nighttime conditions exhibited a higher ΔCUHII (with a maximum increase of 0.68 °C), accompanied by lower wind speed and shallower PBLH (Fig. 12a1–a2); while daytime conditions showed a comparatively lower ΔCUHII (with a minimum increase of 0.17 °C), accompanied by higher wind speed and deeper PBLH (Fig. 12a3–a4). The relative increase in CUHII ranged from 8.1 % to 60.4 %, with the large proportional amplifications occurring during the daytime period. Specifically, the average difference between nighttime and daytime is 0.51 °C (14.2 %) and 0.27 °C (18.9 %), respectively. At night, ΔCUHII exhibited a non-linear response to increases in wind speed and PBLH, characterized by an initial amplification followed by a decrease (Fig. 12a1–a2). In contrast, daytime ΔCUHII decreased with increasing PBLH, while its correlation with wind speed remained ambiguous (Fig. 12a3–a4). In summary, these sensitivity experiments provide corroborations for the observational findings, confirming that UHA is regulated by wind speed and PBLH nonlinearly.
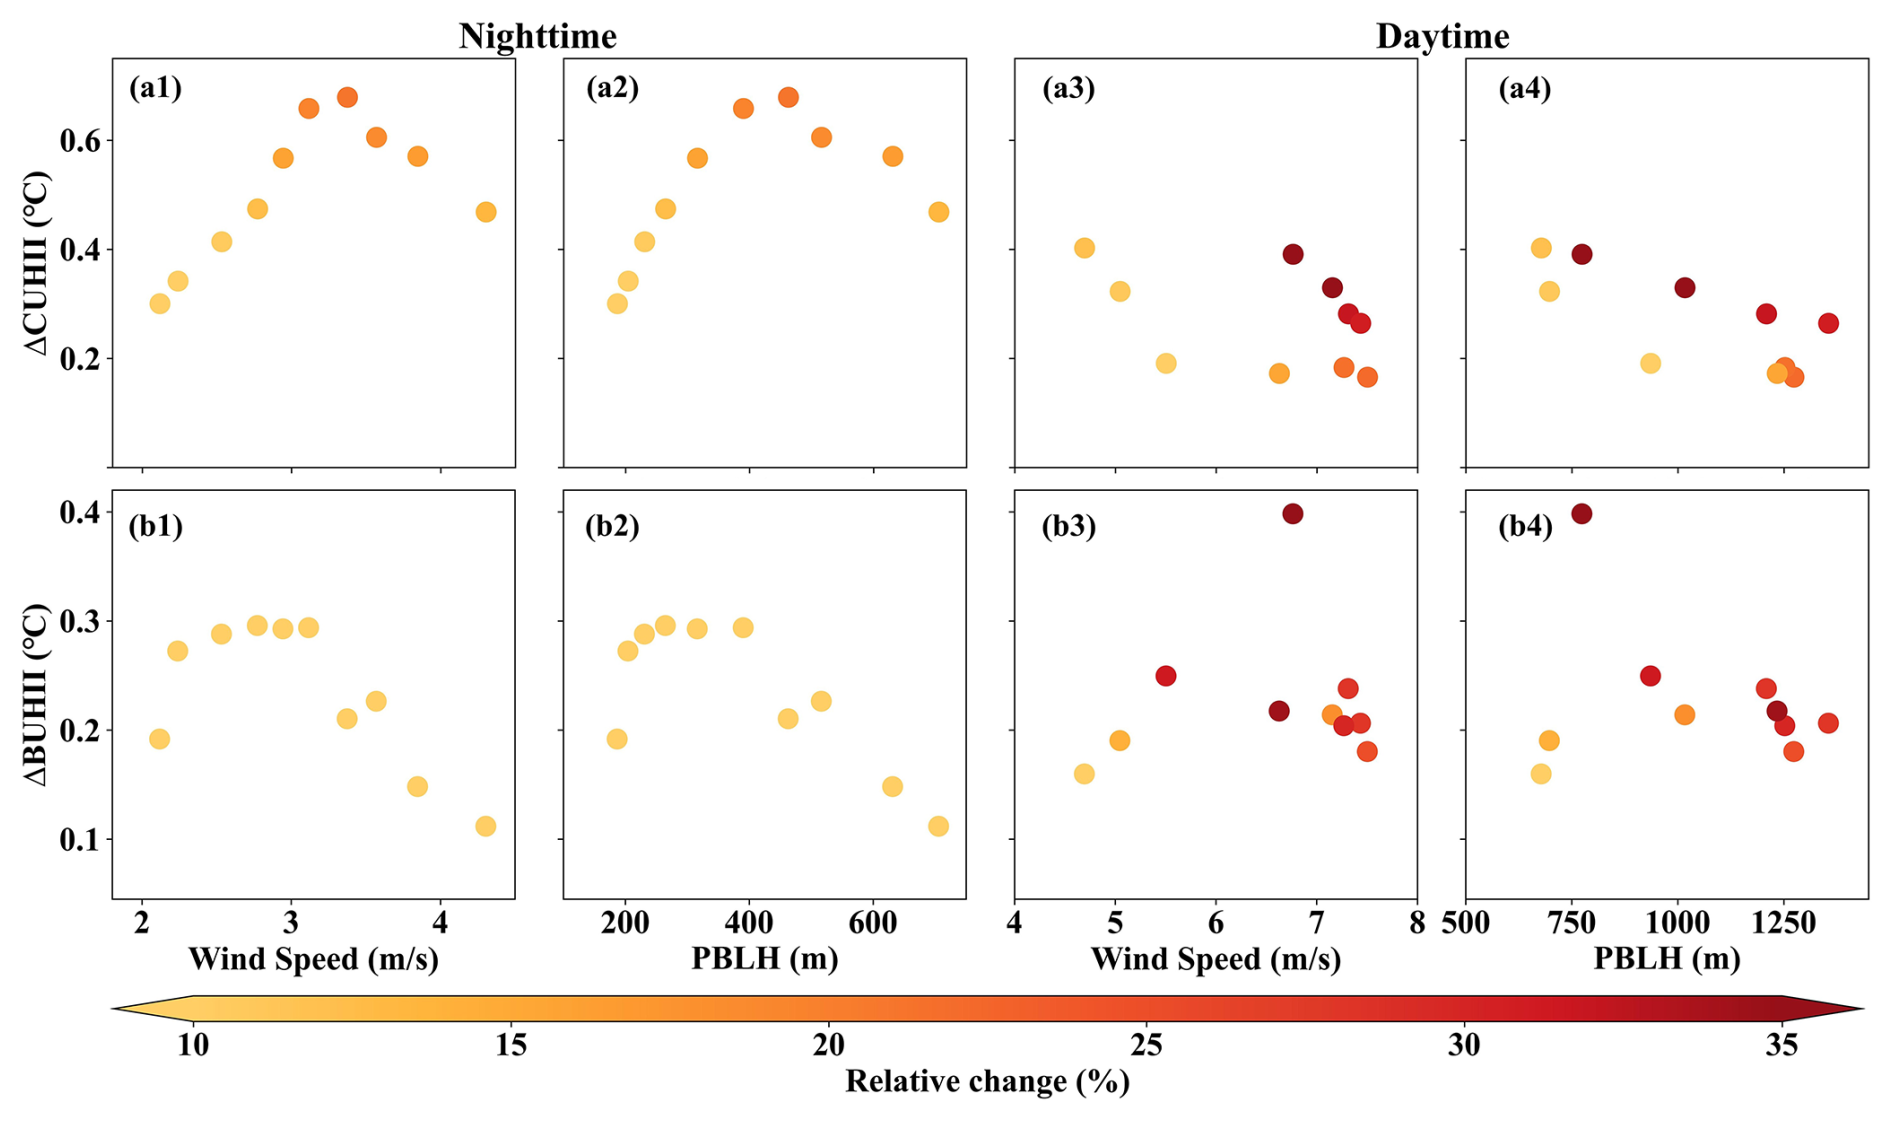
Figure 12Scatter plots between ΔCUHII and (a1, a3) 10 m wind speed, and (a2, a4) PBLH between the control simulation and the sensitivity experiment (CTRL minus EXP) over Wuxi (U4) at (a1–a2) nighttime and (a3–a4) daytime. (b1)–(b4) same as (a1)–(a4), but for ΔBUHII. Colours represent the relative change of CUHII or BUHII. Note that only the moment when the northwest wind prevailed in the ROI was reserved.
UHA also contributed to an increase in BUHII in the downstream city of Wuxi (U4, Fig. 12b1–b4). Specifically, ΔBUHII increased by a maximum of 0.40 °C and a minimum of 0.11 °C, ranging from 4.7 % to 41.7 %. The average difference between nighttime and daytime is 0.23 °C (7.5 %) and 0.23 °C (23.3 %), respectively. It should be noted that uncertainties remain in BUHII due to the schemes of PBL and urban canopy (Zhu and Ooka, 2023). In a supplementary sensitivity test utilizing the YSU PBL scheme (Hong et al., 2006) coupled with the SLUCM urban scheme (Fig. S6), while the absolute change in ΔBUHII remains comparable in magnitude, the relative change of ΔBUHII is larger, and its variation characteristics in response to wind speed and PBLH remain uncertain. Because the numerical simulation covered a limited time period, the potential moderating roles of wind speed and PBLH on BUHI were not further examined.
In addition, the enhancement of downstream UHI (CUHII and BUHII) is primarily contributed to by UHA, though it is not entirely attributable to this mechanism; it is concurrently modulated by other physical processes. For example, advective transport from upstream urban areas can modify local atmospheric conditions (e.g., ambient humidity, stability), which subsequently influence the thermal environment of the downstream city. Furthermore, changes in the underlying surface will also affect local circulation by thermal (e.g., lake-land breeze circulation) and dynamic (e.g., ventilation) effects, which in turn affect wind and temperature in downstream areas. Ultimately, the increase in downstream UHI is a combined result of multiple processes.
In the context of climate change and rapid urbanization, urban impacts on regional climate are increasingly significant. At local to regional scales, these thermal impacts can rival or exceed the greenhouse effect (Cosgrove and Berkelhammer, 2018), intensifying cooling energy demand in summer (Fung et al., 2006) while mitigating heating requirements in winter (Meng et al., 2020). Our results extend previous UHA studies focused on isolated cities by quantifying crosscity superposition of urban heat plumes within a large urban agglomeration and by demonstrating the modulation of this process by wind speed and PBLH using both observations and targeted WRF sensitivity experiments. When background winds are present, UHA propagates heat downstream and strengthens downstream CUHI and BUHI. Particularly with urban agglomeration development and decreasing inter-city distances, spatial clustering of heat sources amplifies regional thermal risks.
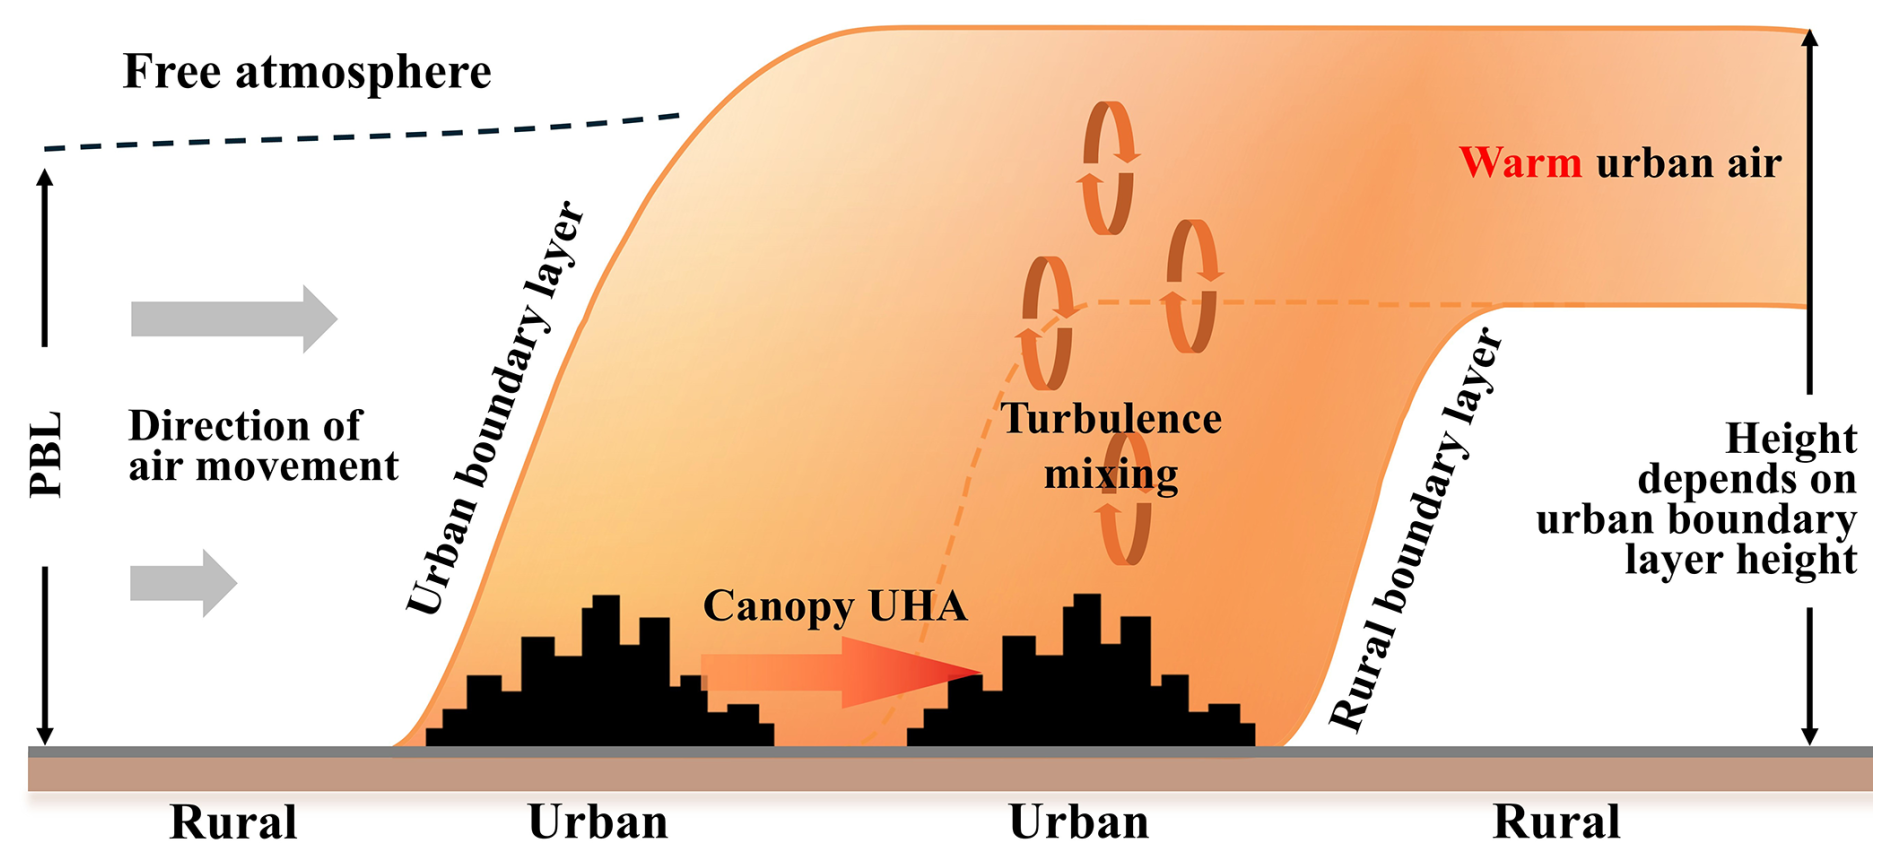
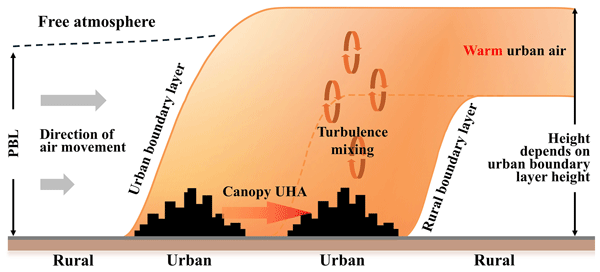
Figure 13Conceptual diagram showing the impact of UHA on downstream UHI within the Yangtze River Delta urban agglomeration. The conceptualization of an urban plume propagating downwind is adapted from Oke (1976). The representation of the plume modification by the downstream surface type is adapted from Cosgrove and Berkelhammer (2018).
Based on observations and numerical simulations, Fig. 13 presents a conceptual diagram of UHA impacts on downwind UHI in the YRD urban agglomeration. Under nocturnal SBL conditions, UHA is confined to a relatively low vertical extent (Cosgrove and Berkelhammer, 2018), with substantial heat propagating downstream primarily within the near-surface layer (orange arrow in Fig. 13). Under these conditions, the amplification of downstream CUHII is greater than that of BUHII. Vertical mixing of shallow PBL and weak turbulence is detrimental to the cooling of the built-up area environment (Haeffelin et al., 2024). Under daytime CBL conditions, buoyancy-driven turbulence is vigorous, UHA impacts can extend throughout the entire PBL depth (Fig. 11c). As urban thermal plumes are transported downstream over long distances within the PBL, they can be vertically mixed with the lower-level air of downstream cities through turbulence (above the downstream city in Fig. 13). Ultimately, thermal plumes from successive cities coalesce and facilitate further heat transport (Fig. 13). However, this study only quantified UHA impacts on CUHII and BUHII in downstream cities, without partitioning contributions from horizontal canopy-level transport versus vertical mixing processes of thermal plume. Additionally, downstream cities receive not only heat but also aerosol inputs from upwind urban sources (Baklanov et al., 2016). These aerosols may modulate the CUHII of downstream cities through radiative forcing (Wang et al., 2020; Xue et al., 2023; Yang et al., 2020), and this feedback process warrants further investigation.
In this study, we combined five years of high-density automatic weather station observations with WRF-MLUCM simulations to quantify how urban heat advection (UHA) links urban heat islands (UHIs) across the Suzhou–Wuxi–Changzhou metropolitan area in the Yangtze River Delta (YRD), China. Our results demonstrate that UHA exhibits pronounced spatiotemporal variability and systematically transports heat from upwind to downwind cities along the prevailing monsoon-related wind directions. Under northwesterly flow, daily-mean UHA intensity changes from negative values in upwind regions to about 0.32 °C in the most affected downstream areas, with nocturnal UHA during peak hours reaching roughly 0.6 °C and exceeding daytime values.
We show that UHA is nonlinearly modulated by wind speed and planetary boundary-layer height (PBLH). At night, when the boundary layer is shallow and stable, maximum downstream warming occurs under moderate wind speeds and intermediate PBLH, with the transported heat confined to a shallow near-surface layer. In contrast, in deep daytime convective boundary layers, vigorous turbulent mixing extends the thermal influence of UHA up to the boundary-layer top and thereby dilutes the urban heat plume at canopy level; when the regional-mean PBLH exceeds 800 m, UHA can even exert a net cooling effect on the downstream CUHI. These findings highlight the central role of boundary-layer dynamics and thermodynamics in regulating the magnitude and sign of UHA within urban agglomerations.
Targeted WRF land-use sensitivity experiments further reveal that upstream urbanization substantially enhances downstream UHI intensity. Urban land cover in Changzhou increases CUHII in the adjacent downstream city of Wuxi by up to about 0.68 °C (8.1 %–60.4 %) and BUHII by up to about 0.40 °C (4.7 %–41.7 %), with detectable canopy-level warming extending beyond 100 km downwind. Taken together, the observations and simulations provide quantitative evidence that cross-city superposition of UHAs is a key physical process coupling UHIs within large urban agglomerations.
These results have several implications for regional climate assessment and heat-risk management. First, neglecting UHA can lead to systematic underestimation of heat exposure in downwind cities, particularly during nocturnal stable conditions. Second, because UHA is strongly constrained by wind direction and PBLH, the realistic representation of boundary-layer processes is essential in regional climate and air-quality models over urban agglomerations. Third, heat-mitigation strategies should consider cross-city coordination along prevailing wind corridors, as local interventions in upwind cities can propagate benefits (or disbenefits) far downstream. Future work should extend the present analysis to other seasons and synoptic regimes, explore compound UHA–pollution events, and assess how projected changes in urbanization and boundary-layer structure may alter the spatial extent and intensity of UHA in rapidly developing urban regions.
The hourly automated weather stations observation data are available upon request from the China Meteorological Data Service Center (http://data.cma.cn/en, last access: 17 March 2026). The anthropogenic heat flux data are available at https://doi.org/10.7910/DVN/VIJFPK (Qian et al., 2024). The built-up area data are accessed at http://irsip.whu.edu.cn/resv2/dataweb.php# (Huang et al., 2021). The planetary boundary layer height data are available at https://doi.org/10.5281/zenodo.6498004 (Guo et al., 2024). Final Operational Global Analysis (FNL) data were derived from the National Centers for Environmental Prediction at https://doi.org/10.5065/D65Q4T4Z. The MODIS land cover product (MCD12Q1, Version 6.1) is available at https://doi.org/10.5067/MODIS/MCD12Q1.061 (Friedl and Sulla-Menashe, 2022). The urban canopy parameters were taken from the global 1 km spatially continuous GloUCP dataset at https://doi.org/10.6084/m9.figshare.27011491 (Liao et al., 2025).
The supplement related to this article is available online at https://doi.org/10.5194/acp-26-11543-2026-supplement.
YY conceptualized the study and designed the experiments. JX wrote the original manuscript and plotted all the figures. JX, GR, and SL assisted in the conceptualization and model development. All the authors contributed to the manuscript preparation, discussion, and writing.
The contact author has declared that none of the authors has any competing interests.
Publisher's note: Copernicus Publications remains neutral with regard to jurisdictional claims made in the text, published maps, institutional affiliations, or any other geographical representation in this paper. The authors bear the ultimate responsibility for providing appropriate place names. Views expressed in the text are those of the authors and do not necessarily reflect the views of the publisher.
We acknowledge the High-Performance Computing Center of Nanjing University of Information Science & Technology for supporting this work. We thank Junfeng Miao, Tao Shi, and Xingxing Ma for valuable comments.
This research has been supported by the National Natural Science Foundation of China (grant no. 42521006) and the Natural Science Foundation of Jiangsu Province, China (grant no. BK20250750).
This paper was edited by Zhanqing Li and reviewed by Jiachuan Yang and two anonymous referees.
Baklanov, A., Molina, L. T., and Gauss, M.: Megacities, air quality and climate, Atmos. Environ., 126, 235–249, https://doi.org/10.1016/j.atmosenv.2015.11.059, 2016.
Bassett, R., Cai, X., Chapman, L., Heaviside, C., Thornes, J. E., Muller, C. L., Young, D. T., and Warren, E. L.: Observations of urban heat island advection from a high‐density monitoring network, Q. J. Roy. Meteorol. Soc., 142, 2434–2441, https://doi.org/10.1002/qj.2836, 2016.
Bassett, R., Cai, X., Chapman, L., Heaviside, C., and Thornes, J. E.: The Effects of Heat Advection on UK Weather and Climate Observations in the Vicinity of Small Urbanized Areas, Bound.-Lay. Meteorol., 165, 181–196, https://doi.org/10.1007/s10546-017-0263-0, 2017.
Bassett, R., Cai, X., Chapman, L., Heaviside, C., and Thornes, J. E.: Semi‐idealized urban heat advection simulations using the Weather Research and Forecasting mesoscale model, Int. J. Climatol., 39, 1345–1358, https://doi.org/10.1002/joc.5885, 2019.
Brandsma, T., Können, G. P., and Wessels, H. R. A.: Empirical estimation of the effect of urban heat advection on the temperature series of De Bilt (The Netherlands), Int. J. Climatol., 23, 829–845, https://doi.org/10.1002/joc.902, 2003.
Brousse, O., Simpson, C., Walker, N., Fenner, D., Meier, F., Taylor, J., and Heaviside, C.: Evidence of horizontal urban heat advection in London using six years of data from a citizen weather station network, Environ. Res. Lett., 17, 044041, https://doi.org/10.1088/1748-9326/ac5c0f, 2022.
Chen, S., Yang, Y., Deng, F., Zhang, Y., Liu, D., Liu, C., and Gao, Z.: A high-resolution monitoring approach of canopy urban heat island using a random forest model and multi-platform observations, Atmos. Meas. Tech., 15, 735–756, https://doi.org/10.5194/amt-15-735-2022, 2022.
Chou, M.-D. and Suarez, M. J.: An efficient thermal infrared radiation parameterization for use in general circulation models, NASA Tech. Memo., 19950009331, https://ntrs.nasa.gov/citations/19950009331 (last access: 23 July 2026), 1994.
Cosgrove, A. and Berkelhammer, M.: Downwind footprint of an urban heat island on air and lake temperatures, npj Clim. Atmos. Sci., 1, 46, https://doi.org/10.1038/s41612-018-0055-3, 2018.
Dai, Y.-L., Sun, B., Zhou, B.-T., Li, H.-X., He, S., Li, F., Huang, Y.-T., and Tang, W.-C.: Intensified extreme cold surges in northern East Asia and the associated changes in atmospheric circulation under climate change, Adv. Clim. Change Res., 16, 960–973, https://doi.org/10.1016/j.accre.2025.07.003, 2025.
Danzig, T. B., Pal, S., Medley, Z., Dhaliwal, H., Hamel, M., Sorensen, M., Das, D., Menon, K. V., Lee, T. R., and Conder, M.: Impact of advection on the urban heat of a small-sized city: The Urban Heat island Experiment Around Lubbock, Texas (U-HEAT), Urban Climate, 64, 102714, https://doi.org/10.1016/j.uclim.2025.102714, 2025.
Dinda, A. and Chatterjee, S.: Assessing the local- impacts of heat advection on urban heat islands in Kolkata Metropolitan Area, Urban Climate, 42, 101139, https://doi.org/10.1016/j.uclim.2022.101139, 2022.
Dirks, R. A.: Urban atmosphere: Warm dry envelope over St. Louis, J. Geophys. Res., 79, 3473–3475, https://doi.org/10.1029/JC079i024p03473, 1974.
Friedl, M. and Sulla-Menashe, D.: MODIS/Terra+Aqua Land Cover Type Yearly L3 Global 500m SIN Grid V061, NASA Land Processes Distributed Active Archive Center [data set], https://doi.org/10.5067/MODIS/MCD12Q1.061, 2022.
Fung, W., Lam, K., Hung, W., Pang, S., and Lee, Y.: Impact of urban temperature on energy consumption of Hong Kong, Energy, 31, 2623–2637, https://doi.org/10.1016/j.energy.2005.12.009, 2006.
Guo, J., Zhang, J., Shao, J., Chen, T., Bai, K., Sun, Y., Li, N., Wu, J., Li, R., Li, J., Guo, Q., Cohen, J. B., Zhai, P., Xu, X., and Hu, F.: A merged continental planetary boundary layer height dataset based on high-resolution radiosonde measurements, ERA5 reanalysis, and GLDAS, Earth Syst. Sci. Data, 16, 1–14, https://doi.org/10.5194/essd-16-1-2024, 2024.
Haeffelin, M., Ribaud, J.-F., Céspedes, J., Dupont, J.-C., Lemonsu, A., Masson, V., Nagel, T., and Kotthaus, S.: Impact of boundary layer stability on urban park cooling effect intensity, Atmos. Chem. Phys., 24, 14101–14122, https://doi.org/10.5194/acp-24-14101-2024, 2024.
He, B.-J.: Potentials of meteorological characteristics and synoptic conditions to mitigate urban heat island effects, Urban Climate, 24, 26–33, https://doi.org/10.1016/j.uclim.2018.01.004, 2018.
Heaviside, C., Cai, X.-M., and Vardoulakis, S.: The effects of horizontal advection on the urban heat island in Birmingham and the West Midlands, United Kingdom during a heatwave, Q. J. Roy. Meteorol. Soc., 141, 1429–1441, https://doi.org/10.1002/qj.2452, 2015.
Hong, S.-Y., Noh, Y., and Dudhia, J.: A New Vertical Diffusion Package with an Explicit Treatment of Entrainment Processes, Mon. Weather Rev., 134, 2318–2341, https://doi.org/10.1175/MWR3199.1, 2006.
Huang, X., Li, J., Yang, J., Zhang, Z., Li, D., and Liu, X.: 30 m global impervious surface area dynamics and urban expansion pattern observed by Landsat satellites: From 1972 to 2019, Sci. China Earth Sci., 64, 1922–1933, https://doi.org/10.1007/s11430-020-9797-9, 2021.
Janjić, Z. I.: The Step-Mountain Eta Coordinate Model: Further Developments of the Convection, Viscous Sublayer, and Turbulence Closure Schemes, Mon. Weather Rev., 122, 927–945, https://doi.org/10.1175/1520-0493(1994)122<0927:TSMECM>2.0.CO;2, 1994.
Kittner, J., Fenner, D., Demuzere, M., and Bechtel, B.: Analysis of nocturnal urban heat advection using crowd weather stations, Q. J. Roy. Meteorol. Soc., 151, e5065, https://doi.org/10.1002/qj.5065, 2025.
Liao, W., Li, Y., Liu, X., Wang, Y., Che, Y., Shao, L., Chen, G., Yuan, H., Zhang, N., and Chen, F.: GloUCP: a global 1 km spatially continuous urban canopy parameters for the WRF model, Earth Syst. Sci. Data, 17, 2535–2551, https://doi.org/10.5194/essd-17-2535-2025, 2025.
Lowry, W. P.: Empirical Estimation of Urban Effects on Climate: A Problem Analysis, J. Appl. Meteorol., 16, 129–135, https://doi.org/10.1175/1520-0450(1977)016<0129:EEOUEO>2.0.CO;2, 1977.
Lu, H., Zhang, M., Sun, W., and Li, W.: Expansion Analysis of Yangtze River Delta Urban Agglomeration Using DMSP/OLS Nighttime Light Imagery for 1993 to 2012, ISPRS Int. J. Geo-Inf., 7, 52, https://doi.org/10.3390/ijgi7020052, 2018.
Mahrt, L.: Stably Stratified Atmospheric Boundary Layers, Ann. Rev. Fluid Mech., 46, 23–45, https://doi.org/10.1146/annurev-fluid-010313-141354, 2014.
Meng, F., Guo, J., Ren, G., Zhang, L., and Zhang, R.: Impact of urban heat island on the variation of heating loads in residential and office buildings in Tianjin, Energ. Buildings, 226, 110357, https://doi.org/10.1016/j.enbuild.2020.110357, 2020.
Mlawer, E. J., Taubman, S. J., Brown, P. D., Iacono, M. J., and Clough, S. A.: Radiative transfer for inhomogeneous atmospheres: RRTM, a validated correlated‐k model for the longwave, J. Geophys. Res., 102, 16663–16682, https://doi.org/10.1029/97JD00237, 1997.
Moustaoui, M. and Georgescu, M.: Winds of Change: The Role of Urban Expansion and Thermal Advection in Driving Phoenix's (AZ) Warming Trends, J. Geophys. Res.-Atmos., 130, e2024JD043166, https://doi.org/10.1029/2024JD043166, 2025.
Oke, T. R.: City size and the urban heat island, Atmos. Environ., 7, 769–779, https://doi.org/10.1016/0004-6981(73)90140-6, 1973.
Oke, T. R.: The distinction between canopy and boundary‐layer urban heat islands, Atmosphere, 14, 268–277, https://doi.org/10.1080/00046973.1976.9648422, 1976.
Oke, T. R., Mills, G., Christen, A., and Voogt, J. A.: Urban Climates, 1st edn., Cambridge University Press, https://doi.org/10.1017/9781139016476, 2017.
Phelan, P. E., Kaloush, K., Miner, M., Golden, J., Phelan, B., Silva, H., and Taylor, R. A.: Urban Heat Island: Mechanisms, Implications, and Possible Remedies, Annu. Rev. Environ. Resour., 40, 285–307, https://doi.org/10.1146/annurev-environ-102014-021155, 2015.
Qian, J., Zhang, L., Schlink, U., Meng, Q., Liu, X., and Janscó, T.: High spatial and temporal resolution multi-source anthropogenic heat estimation for China, Resour. Conserv. Recy., 203, 107451, https://doi.org/10.1016/j.resconrec.2024.107451, 2024.
Salamanca, F., Krpo, A., Martilli, A., and Clappier, A.: A new building energy model coupled with an urban canopy parameterization for urban climate simulations – Part I. formulation, verification, and sensitivity analysis of the model, Theor. Appl. Climatol., 99, 331–344, https://doi.org/10.1007/s00704-009-0142-9, 2010.
Shi, T., Yang, Y., Qi, P., Ren, G., Wen, X., and Gul, C.: Adjustment of the urbanization bias in surface air temperature series based on urban spatial morphologies and using machine learning, Urban Climate, 55, 101991, https://doi.org/10.1016/j.uclim.2024.101991, 2024.
Shi, T., Yang, Y., Zong, L., Guo, M., Qi, P., and Lolli, S.: The modulation of synoptic weather patterns and human activities on the diurnal cycle of the summertime canopy urban heat island in the Yangtze River Delta Urban Agglomeration, China, Atmos. Chem. Phys., 25, 4989–5007, https://doi.org/10.5194/acp-25-4989-2025, 2025.
Stull, R. B. (Ed.): An Introduction to Boundary Layer Meteorology, Springer Netherlands, Dordrecht, https://doi.org/10.1007/978-94-009-3027-8, 1988.
Sun, J., Mahrt, L., Banta, R. M., and Pichugina, Y. L.: Turbulence Regimes and Turbulence Intermittency in the Stable Boundary Layer during CASES-99, J. Atmos. Sci., 69, 338–351, https://doi.org/10.1175/JAS-D-11-082.1, 2012.
Tewari, M., Chen, F., Wang, W., Dudhia, J., LeMone, M. A., Mitchell, K., Ek, M., Gayno, G., Wegiel, J., and Cuenca, R. H.: Implementation and verification of the unified NOAH land surface model in the WRF model, 20th conference on weather analysis and forecasting/16th conference on numerical weather prediction, https://n2t.org/ark:/85065/d7fb523p (last access: 24 July 2026), 2004.
Thompson, G., Field, P. R., Rasmussen, R. M., and Hall, W. D.: Explicit Forecasts of Winter Precipitation Using an Improved Bulk Microphysics Scheme, Part II: Implementation of a New Snow Parameterization, Mon. Weather Rev., 136, 5095–5115, https://doi.org/10.1175/2008MWR2387.1, 2008.
Tian, G., Jiang, J., Yang, Z., and Zhang, Y.: The urban growth, size distribution and spatio-temporal dynamic pattern of the Yangtze River Delta megalopolitan region, China, Ecol. Model., 222, 865–878, https://doi.org/10.1016/j.ecolmodel.2010.09.036, 2011.
Tian, W., Yang, Y., Wang, L., Zong, L., Zhang, Y., and Liu, D.: Role of local climate zones and urban ventilation in canopy urban heat island–heatwave interaction in Nanjing megacity, China, Urban Climate, 49, 101474, https://doi.org/10.1016/j.uclim.2023.101474, 2023.
Varentsov, M., Konstantinov, P., Baklanov, A., Esau, I., Miles, V., and Davy, R.: Anthropogenic and natural drivers of a strong winter urban heat island in a typical Arctic city, Atmos. Chem. Phys., 18, 17573–17587, https://doi.org/10.5194/acp-18-17573-2018, 2018.
Wang, L., Fan, S., Hu, F., Miao, S., Yang, A., Li, Y., Liu, J., Liu, C., Chen, S., Ho, H. C., Duan, Z., Gao, Z., and Yang, Y.: Vertical Gradient Variations in Radiation Budget and Heat Fluxes in the Urban Boundary Layer: A Comparison Study Between Polluted and Clean Air Episodes in Beijing During Winter, J. Geophys. Res.-Atmos., 125, e2020JD032478, https://doi.org/10.1029/2020JD032478, 2020.
Wong, K. K. and Dirks, R. A.: Mesoscale Perturbations on Airflow in the Urban Mixing Layer, J. Appl. Meteor., 17, 677–688, https://doi.org/10.1175/1520-0450(1978)017<0677:MPOAIT>2.0.CO;2, 1978.
Xian, J., Luo, H., Lu, C., Lin, X., Yang, H., and Zhang, N.: Characteristics of the atmospheric boundary layer height: A perspective on turbulent motion, Sci. Total Environ., 919, 170895, https://doi.org/10.1016/j.scitotenv.2024.170895, 2024.
Xue, J., Zong, L., Yang, Y., Bi, X., Zhang, Y., and Zhao, M.: Diurnal and interannual variations of canopy urban heat island (CUHI) effects over a mountain–valley city with a semi-arid climate, Urban Climate, 48, 101425, https://doi.org/10.1016/j.uclim.2023.101425, 2023.
Xue, J., Zhang, L., Wang, L., Baklanov, A., and Yang, Y.: Characteristics and Mechanisms of Non‐Stationary Turbulence in a Megacity Area, Geophys. Res. Lett., 52, e2025GL114978, https://doi.org/10.1029/2025GL114978, 2025.
Yang, Y., Zheng, Z., Yim, S. Y. L., Roth, M., Ren, G., Gao, Z., Wang, T., Li, Q., Shi, C., Ning, G., and Li, Y.: PM 2.5 Pollution Modulates Wintertime Urban Heat Island Intensity in the Beijing‐Tianjin‐Hebei Megalopolis, China, Geophys. Res. Lett., 47, https://doi.org/10.1029/2019GL084288, 2020.
Yang, Y., Guo, M., Wang, L., Zong, L., Liu, D., Zhang, W., Wang, M., Wan, B., and Guo, Y.: Unevenly spatiotemporal distribution of urban excess warming in coastal Shanghai megacity, China: Roles of geophysical environment, ventilation and sea breezes, Build. Environ., 235, 110180, https://doi.org/10.1016/j.buildenv.2023.110180, 2023.
Yao, L., Sailor, D. J., Yang, X., Xu, G., and Zhao, L.: Are water bodies effective for urban heat mitigation? Evidence from field studies of urban lakes in two humid subtropical cities, Build. Environ., 245, 110860, https://doi.org/10.1016/j.buildenv.2023.110860, 2023.
Yu, M., Chen, X., Yang, J., and Miao, S.: A new perspective on evaluating high-resolution urban climate simulation with urban canopy parameters, Urban Climate, 38, 100919, https://doi.org/10.1016/j.uclim.2021.100919, 2021.
Zhang, D., Shou, Y., and Dickerson, R. R.: Upstream urbanization exacerbates urban heat island effects, Geophys. Res. Lett., 36, 2009GL041082, https://doi.org/10.1029/2009GL041082, 2009.
Zhang, L., Zhang, H., Zhang, X., Li, Q., Wu, B., Cai, X., Song, Y., and Zhu, T.: Dissimilarity of Turbulent Transport of Momentum and Heat Under Unstable Conditions Linked to Convective Circulations, J. Geophys. Res.-Atmos., 128, e2022JD037997, https://doi.org/10.1029/2022JD037997, 2023.
Zhang, L., Luo, F., Pan, G., Zhang, W., Ren, G., Zheng, Z., and Yang, Y.: Elucidating the Multi‐Timescale Variability of a Canopy Urban Heat Island by Using the Short‐Time Fourier Transform, Geophys. Res. Lett., 51, e2023GL106221, https://doi.org/10.1029/2023GL106221, 2024a.
Zhang, L., Zhang, H., Cai, X., Song, Y., and Zhang, X.: Characteristics of Turbulence Intermittency, Fine Structure, and Flux Correction in the Taklimakan Desert, J. Atmos. Sci., 81, 459–475, https://doi.org/10.1175/JAS-D-23-0107.1, 2024b.
Zhao, Y., Zhong, L., Ma, Y., Fu, Y., Chen, M., Ma, W., Zhao, C., Huang, Z., and Zhou, K.: WRF/UCM simulations of the impacts of urban expansion and future climate change on atmospheric thermal environment in a Chinese megacity, Climatic Change, 169, 38, https://doi.org/10.1007/s10584-021-03287-7, 2021.
Zheng, Z., Ren, G., Gao, H., and Yang, Y.: Urban ventilation planning and its associated benefits based on numerical experiments: A case study in beijing, China, Build. Environ., 222, 109383, https://doi.org/10.1016/j.buildenv.2022.109383, 2022.
Zheng, Z., Luo, F., Li, N., Gao, H., and Yang, Y.: Impact of Local Climate Zones on the Urban Heat and Dry Islands in Beijing: Spatial Heterogeneity and Relative Contributions, J. Meteorol. Res., 38, 126–137, https://doi.org/10.1007/s13351-024-3081-6, 2024.
Zhou, D., Bonafoni, S., Zhang, L., and Wang, R.: Remote sensing of the urban heat island effect in a highly populated urban agglomeration area in East China, Sci. Total Environ., 628–629, 415–429, https://doi.org/10.1016/j.scitotenv.2018.02.074, 2018.
Zhu, D. and Ooka, R.: WRF-based scenario experiment research on urban heat island: A review, Urban Climate, 49, 101512, https://doi.org/10.1016/j.uclim.2023.101512, 2023.
Zilitinkevich, S., Baklanov, A., Rost, J., Smedman, A., Lykosov, V., and Calanca, P.: Diagnostic and prognostic equations for the depth of the stably stratified Ekman boundary layer, Q. J. Roy. Meteorol. Soc., 128, 25–46, https://doi.org/10.1256/00359000260498770, 2002.
Zong, L., Yang, Y., Gao, M., Wang, H., Wang, P., Zhang, H., Wang, L., Ning, G., Liu, C., Li, Y., and Gao, Z.: Large-scale synoptic drivers of co-occurring summertime ozone and PM2.5 pollution in eastern China, Atmos. Chem. Phys., 21, 9105–9124, https://doi.org/10.5194/acp-21-9105-2021, 2021.