
the Creative Commons Attribution 4.0 License.
the Creative Commons Attribution 4.0 License.
 | 12 Aug 2026
Impacts of secondary ice production on the microphysics and dynamics of deep convective clouds in different environments
Julian Meusel
Behrooz Keshtgar
Gabriella Wallentin
Christian Barthlott
Sachin Patade
Sonali Shete
Thara Prabhakaran
Romain Fievet
Declan Finney
Alan Blyth
Corinna Hoose
This study numerically investigates the impact of secondary ice production (SIP) on cloud microphysical and diabatic properties in continental and marine deep convective clouds (DCCs). Four cases are simulated using the Icosahedral Nonhydrostatic (ICON) model with a 2-moment cloud microphysics scheme at 1.6 km horizontal grid spacing. ICON forms secondary ice via rime splintering, fragmentation during raindrop freezing (RDF), ice-ice collision, and sublimation. A more detailed RDF scheme (Phillips et al., 2018, PHIL18) is implemented and compared to the existing simpler scheme (Sullivan et al., 2018, SULL18).
In the simulated DCCs, SIP processes reproduce observed ice number concentrations, with PHIL18 yielding closer agreement with observations than SULL18. SIP enhances ice numbers by 10–103, decreasing (increasing) supercooled-liquid (ice) mass by 10 %–30 %, leading to sustained upper-level glaciation. Including SIP increases surface precipitation by 4 % in marine DCCs, with no significant change in continental DCCs. SIP enhances longwave absorption in the mixed-phase region and increases (20 % in continental and 40 % in marine DCCs) cloud radiative heating. SIP intensifies latent heating by up to 20 %, reaching 20–40 K d−1 in continental and 80 K d−1 in marine DCCs, from increased depositional growth of ice particles. This enhanced diabatic heating increases buoyancy in the stratiform regions, leading to a 10 % rise in stratiform ascent. In contrast, in convective regions, SIP increases condensate loading, which suppresses buoyancy, leading to similarly weaker convective ascent. These findings highlight the pivotal role of SIP in shaping the microphysical structure and dynamical behavior of deep convection, highlighting the need for its accurate representation in numerical models.
- Article
(9438 KB) - Full-text XML
-
Supplement
(9325 KB) - BibTeX
- EndNote


Clouds play a crucial role in Earth's energy balance by influencing radiative fluxes and latent heating (Lohmann et al., 2016). The latent heat released during cloud formation modifies atmospheric circulation and vertical energy distribution. Clouds influence both incoming shortwave (SW) and outgoing longwave (LW) radiation (Trenberth et al., 2009), affecting atmospheric heating rates at different heights. This interaction of clouds with radiation is quantified as “cloud radiative heating” (CRH), which is the difference between atmospheric radiative heating rates in cloudy and clear-sky conditions, explaining how clouds locally heat or cool the atmosphere. This vertical redistribution of radiative energy depends on cloud properties (Sullivan et al., 2023; Keshtgar et al., 2024).
Deep convective clouds (DCCs) can produce heavy precipitation via convective cores and stratiform regions, while their associated long-lived and extensive, non-precipitating cirrus anvils play a crucial role in the radiation budget (Feng et al., 2011). DCCs range from small individual cells (≤ 1 km) to large (∼ few hundred km) mesoscale convective systems (MCS) and can form in the tropics, subtropics, and midlatitudes (Wilcox et al., 2023). An MCS evolves through three phases: early growth, mature, and dissipation (Houze, 1982). The early growth phase is associated with individual cells that transport the condensate to higher levels and produce intense surface precipitation. In its mature stage, these cells organize into convective cores and a broad stratiform region that produces light precipitation. In the dissipation phase, both of these regions remain surrounded by persistent cirrus anvil clouds. In the tropics, MCSs significantly influence latent heating and radiative forcing (Roca et al., 2017; Wilcox et al., 2023), thereby modifying the thermodynamic structure of the atmosphere (Bouniol et al., 2016).
On a global scale, a significant fraction of surface precipitation is thought to originate from the “ice-crystal” process, yet the dominant pathway varies significantly by region and convective conditions (Lau and Wu, 2003; Field and Heymsfield, 2015; Gupta et al., 2023). The ice-crystal process involves the growth of ice-crystals through vapor deposition, in which water vapor directly deposits onto ice-crystals or through riming, which involves freezing of supercooled cloud droplets and drizzle freeze upon collision with ice-crystals. These processes form larger snowflakes or heavily rimed ice particles (e.g., graupel/hail) that may melt and form cold rain.
The processes governing ice formation in clouds are also crucial for understanding their radiative properties. Ice formation in clouds can occur through (1) the homogeneous nucleation of aqueous aerosol particles (APs) and supercooled cloud droplets, which typically occur above the −38 °C level. In contrast, at mixed-phase levels (between 0 and −38 °C), mostly insoluble APs, known as ice nucleating particles (INPs), initiate ice through (2) heterogeneous ice nucleation (DeMott et al., 2010; Kanji et al., 2017). However, in the mixed-phase region, it is often reported that the measured ice particle number concentration (INC) is about 102–104 times higher than the available active INP number concentration (Sotiropoulou et al., 2020; Lawson et al., 2015; Waman et al., 2022). This discrepancy can be explained by the multiplication processes that involve secondary ice production (SIP) from pre-existing ice (Takahashi et al., 1995; Field et al., 2017; Korolev and Leisner, 2020).
Several SIP processes have been proposed so far (Korolev and Leisner, 2020). For example,
-
Hallett-Mossop rime-splintering process (HM, Hallett and Mossop, 1974)
-
Fragmentation of freezing raindrops or drizzle (RDF) (Johnson and Hallett, 1968; Takahashi and Yamashita, 1977; Phillips et al., 2018; Kleinheins et al., 2021)
-
Fragmentation upon ice-ice collision (IIC) (Vardiman, 1978; Takahashi et al., 1995)
-
Sublimational fragmentation of dendritic snow and graupel (SBF) (Oraltay and Hallett, 1989; Bacon et al., 1998; Deshmukh et al., 2022)
SIP through rime-splintering happens between −3 and −8 °C, and involves ejection of ice splinters when supercooled droplets freeze upon collision with ice particles (Hallett and Mossop, 1974). Previous field observations provide direct evidence for the presence of the HM process across diverse cloud environments. For example, aircraft measurements in convective (Bower et al., 1996) and marine boundary layer (Huang et al., 2021; Järvinen et al., 2022) clouds showed that the measured INCs exceed INPs by several orders of magnitude within the HM regime. Radar measurements of tropical marine cumuli by Lasher-Trapp et al. (2016) also observed INCs consistent with active rime-splintering, supported by radar evidence of graupel presence within the HM regime. Previous modelling studies found that the HM process contributes significantly to the overall INC (e.g., Patade et al., 2016; Lasher-Trapp et al., 2021), especially during the early growth stage of DCCs (Waman et al., 2022; Han et al., 2024). Although a recent laboratory experiment by Seidel et al. (2024) mimicking convective conditions found no clear splinter production through the HM process, its relevance in natural clouds remains uncertain.
Furthermore, IIC describes SIP from a collision between two ice particles (Phillips et al., 2017a; Grzegorczyk et al., 2023; Gautam et al., 2024). Previous modelling studies (Phillips et al., 2017b; Zhao and Liu, 2021; Han et al., 2024; Yang et al., 2024; Patade et al., 2025) suggest that IIC can account for over 60 % of secondary ice in the simulated DCCs, especially in their mature stage (Waman et al., 2022). Two parameterizations are available to represent SIP via IIC in numerical models: (1) a temperature-dependent scheme by Takahashi et al. (1995), and (2) a more extensive parameterization, based on the principle of energy conservation by Phillips et al. (2017b). The rate of IIC depends on the properties of the colliding particles, such as size, shape, density, roughness, temperature, and fall velocity.
SIP via RDF occurs during the freezing of drizzle or raindrops, as evident from laboratory studies by Mason and Maybank (1960) and Keinert et al. (2020). In RDF, the internal pressure from trapped liquid causes the ice shell to break, ejecting secondary ice splinters and liquid splashes that may later freeze. Lawson et al. (2015), using aircraft observations and parcel model simulations of tropical marine convection with warm cloud base (about 17 °C), inferred that RDF dominates SIP between −4 and −15 °C, and may facilitate rapid cloud glaciation. Furthermore, recent modelling studies of DCCs reported that RDF contributes notably to overall SIP (Huang et al., 2021; Patade et al., 2025), particularly as cloud tops reach −10 to −20 °C during early growth stages. Also, Waman et al. (2022) found that while the HM process dominates in clouds with warmer tops (> −10 °C), RDF may become increasingly important as the cloud deepens.
The importance of SBF in DCCs, which occur in unsaturated cloudy air (Korolev and Leisner, 2020), remains uncertain. Previous laboratory experiments (Oraltay and Hallett, 1989; Dong et al., 1994; Bacon et al., 1998) demonstrated fragmentation of sublimating dendrites and rimed particles under relative humidity with respect to ice (RHi) 50 %–90 %. Based on these studies, Deshmukh et al. (2022) developed a theoretical parameterization for SBF during sublimation of dendritic snow and graupel. However, field observations by Korolev and Isaac (2004) suggested that SBF contributes only marginally to SIP, consistent with recent modelling studies by Waman et al. (2022) and Yang et al. (2024) employing the SBF scheme of Deshmukh et al. (2022). Waman et al. (2022) further showed that while SBF forms little ice in convective updraft regions, it can account for the majority of SIP in downdraft and stratiform regions following IIC. Therefore, the applicability of the currently available SBF scheme (Deshmukh et al., 2022) to different natural DCCs remains to be evaluated.
SIP may also occur from INP activation in transient supersaturation around a freezing drop, where the release of latent heat warms the surface of the drop, causing vapor diffusion and local supersaturation (Korolev and Leisner, 2020). Also, rapid temperature changes during riming can cause thermal shocks in ice crystals, leading to fracturing and splintering. However, these processes remain poorly understood and lack parameterizations in current numerical models.
SIP can alter diabatic heating in DCCs through increased growth of ice splinters via deposition and riming, which may strengthen updrafts and modify dynamics (Qu et al., 2022; Grzegorczyk et al., 2025). Recent modelling studies show that SIP can influence cloud dynamics, precipitation production, and radiative properties. Zhao and Liu (2021) reported that on a global scale, SIP increases the net cloud radiative forcing by 1.1 W m−2 annually via microphysical changes. Moreover, in tropical convection, Qu et al. (2022) reported that SIP produces the observed ice mass and number, enhances buoyancy, and prolongs cloud lifetime. In contrast, an idealized simulation by Grzegorczyk et al. (2023) found that SIP may lower the cloud top height without notably altering ice mass and buoyancy. These findings suggest that SIP plays a key role in the microphysics, dynamics, and radiative properties of clouds under different atmospheric conditions.
Hence, SIP may induce positive feedback in DCCs, where increased growth of extra ice particles enhances diabatic heating and updrafts, intensifying convection. This can affect their development, organization, precipitation efficiency, and radiative properties. Yet, its impact on DCCs remains insufficiently well quantified across diverse environmental regimes. Previous studies have largely focused on idealized or isolated cases, leaving gaps in our understanding of how SIP modulates cloud dynamics and radiative effects in both continental and marine DCCs. Therefore, this study aims to investigate the possible impact of SIP on the dynamics, convective intensity, and radiative properties of DCCs, using simulations of three continental and one marine DCCs with the Icosahedral Nonhydrostatic (ICON; Zängl et al., 2015) model in limited area mode (LAM). Section 2 describes the observed DCCs and numerical model setup. Results are presented in Sect. 3, followed by conclusions in Sect. 4. The acronyms and symbols used are defined in Tables A1 and A2, respectively.
The present study focuses on four different campaigns (Table 1) involving DCCs from various locations and periods. These are the three continental cases, including (1) the fourth phase Cloud Aerosol Interaction and Precipitation Enhancement Experiment (CAIPEEX-IV) over Solapur, India, (2) Deep Convective Microphysics Experiment (DCMEX) over Magdalena Mountains, New Mexico, (3) Midlatitude Continental Convective Clouds Experiment (MC3E) over Oklahoma, USA, and one marine deep convection observed during (4) Organized Convection and EarthCARE Studies over the Tropical Atlantic (ORCESTRA). The selection of these cases is based on the intensity of convection, availability of high-quality observations from aircraft, satellite, and ground-based instruments (discussed below), spanning both stratiform and deep convective regions (especially in CAIPEEX, MC3E, and ORCESTRA). As this study aims to assess the impacts of SIP on the microphysical and dynamical properties of DCCs in contrasting environments, the ORCESTRA case (3 September 2024) is selected as the only marine deep convective case, providing a thermodynamic contrast to the three continental cases (CAIPEEX, DCMEX, MC3E).
Table 1Summary of the selected convective cases (continental cases are denoted by a and marine by b), the associated cloud base and top temperatures, convective available potential energy (CAPE) from ICON control runs (Figs. 1–4b), and the instruments used during the campaigns, mounted on aircraft (marked with c), satellite (denoted by d), and Research Vessel (RV) meteor (denoted by e). The particle sampling range used in the present study for the optical probes (Cloud-liquid and ice probes are denoted with f and g respectively) mounted on the aircraft is also shown.

These cases are described in the following section.
2.1 Field Campaigns
2.1.1 CAIPEEX
During CAIPEEX-IV, the Beechcraft B200 aircraft (Fig. 1a) measured aerosol and cloud properties, along with meteorological parameters, between cloud base and −15 °C. The B200 aircraft performed multiple passes near stratus layers with embedded convection (Prabhakaran et al., 2023; Patade et al., 2025). Details of the optical probes mounted on the B200 during CAIPEEX are summarized in Table 1. The cloud droplet probe (CDP) sampled cloud droplet properties, such as cloud droplet number concentration (CDNC) and liquid water content (LWC). The cloud imaging probe (CIP) and precipitation imaging probe (PIP) measured drizzle and ice properties, including INC, whereas ice water content (IWC) is derived using the mass-size relationship from PIP's size distribution (Patade et al., 2025). The CIP was equipped with anti-shatter tips (Korolev et al., 2011), whereas the PIP data were processed following Patade et al. (2025). To minimize biases from artificial shattering (collision with probe tips), only ice particles larger than 400 µm (NI400) from PIP and CIP are used to validate the simulated INC. In CAIPEEX-IV, a dual-polarization, C-band radar (75–76° E, 17–18° N) observed the convective system (Prabhakaran et al., 2023). Concentrations of INP for immersion freezing mode were measured during CAIPEEX-IV using a Spectrometer for Ice Nuclei (SPIN). For validation of simulated active INPs, only SPIN measurements between −14 and −20 °C are considered, as observed water subsaturation at lower temperatures would lead to droplet evaporation (Shete et al., 2026).

Figure 1(a) Flight track of the B200 aircraft, (b) simulated (red line) and B200 observed (black line) vertical profile of the air temperature, simulated dew point temperature (blue line), and LCL (orange circle) at 09:00 UTC on 30 September 2019. In panel (b), the simulated temperature profiles are from the control run (Table 3) of the CAIPEEX case. Also, (c) hydrometeor images by the CIP probe observed at different levels during the CAIPEEX convection.
To minimize biases from artificial shattering, only ice particles larger than 400 µm (NI400) from PIP and CIP are used for model validation.
The case examined here was observed on 30 September 2019 during CAIPEEX-IV over Solapur, primarily involving DCCs. The pre-convective air and dewpoint temperatures from the control run (Sect. 2.2, Table 3) are shown in Fig. 1b. For the CAIPEEX case, the lifting condensation level (LCL) is at 20 °C with tops reaching up to −60 °C (Fig. 1b), with convective available potential energy (CAPE) of 1210 J kg−1 (Table 1).
Figure 1c shows the particle habits at different cloudy levels observed by the CIP during the CAIPEEX campaign. It is seen that, in this post-monsoon convection, the warm levels (> 0 °C) were dominated by drizzles and raindrops of diameters between 0.1 and 0.9 mm. Also, between 0 and −10 °C, the coexistence of both liquid and ice particles was observed, indicating the presence of well-developed, mixed-phase conditions. At −4 °C, ice particles were chiefly needles/columns, plates, and heavily rimed graupels, suggesting possible SIP via rime-splintering. Furthermore, colder levels were highly populated with relatively large (> 0.7 mm in diameter) rimed particles, highlighting the presence of both warm and cold rain processes in such clouds.
2.1.2 DCMEX
The DCMEX was conducted during July–August 2022 over the Magdalena Mountains, New Mexico, USA, by the UK National Environment Research Council to understand the aerosols, microphysics, and dynamics involved in the development of DCCs (Finney et al., 2024). The DCMEX aimed to enhance the understanding of microphysical processes and their representation in climate models, to address uncertainties associated with cloud-radiative effects.

Figure 2As in Fig. 1, but in panel (a) the flight path is for the BAe146 aircraft. In panel (b), observed air temperature (black line) is from the University of Wyoming archive [35.038° N, 106.623° W] at 00:00 UTC on 2 August 2022. The particle habits in panel (c) are from the 2DS probe mounted on the BAe146 aircraft.
The DCMEX case analyzed here was observed on 2 August 2022. On this day, the measurements of aerosols and cloud microphysics were made by the UK's BAe146 aircraft between 15:26 and 20:00 UTC (Fig. 2a). INP spectra for immersion freezing during DCMEX were measured from aerosol samples collected on Teflon and polycarbonate filters aboard the BAe146 aircraft (Daily et al., 2026). The INC was measured by the optical probes mounted on the BAe146 aircraft (Finney et al., 2024), such as the 2-dimensional stereo probe (2DS), cloud particle imager (CPI) probe, CIP15, and CIP100, equipped with anti-shatter tips and corrected for any possible artificial shattering (Field et al., 2006) (Table 1). From CPI, CIP15, and CIP100, only particles larger than 100 µm (NI100) are included to evaluate the simulated INC. Furthermore, the CDP measured CDNC, whereas the Nevzorov hot wire probe was used to measure their LWC and IWC (Finney et al., 2024). Also, the ground-based C-band, dual-polarimetric Shared Mobile Atmospheric Research and Teaching radar, unit 1 (Finney et al., 2024) was deployed at Socorro Airport (34.022° N, 106.898° W), which provided continuous monitoring of cloud evolution before, during, and after the aircraft observations.
For the selected DCMEX case, the simulated LCL is at 5 °C, and the maximum cloud tops are reaching up to −60 °C, whereas the CAPE is 670 J kg−1 (Fig. 2b).
Figure 2c presents the particle habits observed by the 2DS probe at different subzero levels for DCMEX clouds. The warmer levels (−5 and −6 °C) are dominated by large, irregularly shaped particles consistent with rimed ice or frozen drops, mixed with smaller fragments and a few column-like shapes. At the colder level −23 °C, particles are notably smaller, with quasi-spherical shapes likely corresponding to frozen droplets and irregular ice fragments, and a general absence of large pristine habits such as plates or dendrites.
2.1.3 MC3E
The MC3E campaign (Jensen et al., 2016) was conducted from 22 April to 6 June 2011 over the Southern Great Plains, Oklahoma, USA, to study the complex physical processes that drive midlatitude DCCs and associated precipitation. It was jointly organized by the U.S. Department of Energy Atmospheric Radiation Measurements (ARM) and the National Aeronautics and Space Administration's (NASA) Global Precipitation Measurement (GPM) mission.

Figure 3As in Fig. 1, but in panel (a) the flight path is for the Citation aircraft. In panel (b), the observed air temperature (black line) is from the University of Wyoming archive [35.18° N, 97.44° W] at 12:00 UTC on 11 May 2011.
During MC3E, the University of North Dakota Citation aircraft (Table 1) measured the cloud microphysical properties at levels between cloud base (17 °C) and −30 °C (Fig. 3a). Mounted on the Citation aircraft, the high volume precipitation spectrometer version 3 (HVPS-3) and CIP measured the IWC and INC, whereas the CDP measured the LWC and CDNC. During MC3E, the HVPS-3 was equipped with anti-shattering tips (Korolev et al., 2011). The possible bias due to artificial shattering of ice particles is minimized by considering ice concentrations of particles larger than 200 µm (NI200). Additionally, the simulated radar reflectivity is validated against the reflectivity measured by the Ka-band ARM zenith radar (KAZR; Widener et al., 2012). Since INP measurements were not available during MC3E, to validate simulated INPs, the present study uses INP concentrations measured by a continuous flow diffusion chamber (CFDC) over the study region for May 2014 (DeMott et al., 2015).
Here, an MCS observed on 11 May 2011 during the MC3E campaign, characterized by relatively high CAPE (1224 J kg−1), is analyzed. For this MCS, the LCL was at 17 °C and the tops were extending up to −60 °C (Fig. 3b, Table 1).
For the observed MCS during MC3E, Fig. 3c shows the hydrometeor habits from the CIP measurements at different levels. The levels near cloud base (17 °C) were dominated by liquid particles larger than 0.2 mm, indicating the presence of smaller drizzle drops or raindrops. At −5 °C, the co-existence of large aggregates, with rare pristine ice crystals, and supercooled liquid was observed, favoring mixed-phase cloud processes such as riming. The presence of larger aggregates at these levels chiefly suggests stratiform cloud conditions. Also, at colder mixed-phase levels, between −16 and −22 °C, hydrometeors appeared to be more irregular, with dendritic and aggregated particles observed, suggesting vigorous ice crystal growth via aggregation at these levels.
2.1.4 ORCESTRA
The ORCESTRA campaign (Stevens et al., 2026), conducted over the tropical Atlantic (Fig. 4a) from 10 August to 30 September 2024, was led by the Max Planck Institute for Meteorology (MPI-M). Its main objective was to improve the understanding of the mesoscale organization of tropical convection, including its interactions with tropical waves and air–sea processes, and its impacts on climate, the Earth's radiative budget, and tropical cyclogenesis. During ORCESTRA, aircraft and ground-based observations were carried out across the tropical Atlantic Ocean, including regions near Barbados and the Cape Verde Islands (Fig. 4b). These observations are also used to calibrate measurements from the European Space Agency and Japan Aerospace Exploration Agency (JAXA) Cloud Aerosol Radiation Explorer satellite (EarthCARE; Wehr et al., 2023).

Figure 4(a) Geographical location of the entire ORCESTRA campaign (dashed black box). The yellow line in panel (a) shows the track of the research vessel RV Meteor during the BOWTIE campaign, the cyan line indicates the HALO aircraft track, and the red line shows the EarthCARE overpass over the selected ORCESTRA region (solid black box), and “×” shows the Radiosonde location on 3 September 2024. Also shown are the vertical profiles of (b) the simulated (red line) and observed (black line, Wyoming Sonde archive [8.47° N, 29.206° W]) air and simulated dew point temperature (blue line) at 00:00 UTC on 3 September 2024. In panel (b), the orange circle denotes LCL, and the simulated temperature profiles are from the control (Table 3) run of the ORCESTRA case.
The present study analyzes an MCS observed on 3 September 2024, during ORCESTRA (Fig. 4a). The ICON simulated air temperature profile is compared with the corresponding observations for 00:00 UTC on 3 September 2024 (Fig. 4b). For these clouds, the base and top temperatures were at about 23 and −60 °C, respectively, with CAPE of about 1000 J kg−1.
The EarthCARE (Table 1) is a sun-synchronous satellite, launched on 28 May 2024, and is equipped with the cloud profiling radar (CPR; Wehr et al., 2023; Sato et al., 2025). The main aim of EarthCARE is to study the relationships between clouds, aerosols, and radiation, improving our understanding of how they influence Earth's climate and enhancing the accuracy of climate models through these observations.
Cloud properties from the EarthCARE JAXA CPR Level-2A cloud profile product (CPR_CLP_2A, baseline Bb, processor version 1.1) are used to evaluate the ICON simulation for the ORCESTRA case (Fig. 4a). The CPR was jointly developed by JAXA and the National Institute of Information and Communications Technology, Japan, and operates at a high frequency of 94 GHz (Wehr et al., 2023). It is designed to measure cloud properties, moisture content, vertical structure, and motions of hydrometeors. The simulated radar reflectivity is compared with the EarthCARE CPR-observed reflectivity, averaged over 1 km along-track. Radar reflectivity observations from the High Altitude and Long Range (HALO) research aircraft, equipped with the MIRA cloud radar (Ka-band, 35 GHz, nadir-pointing, Ewald et al., 2019; Ewald, 2025), are also used for comparison. The HALO aircraft was operational at 13.9 km, and its flight track was closely collocated with the EarthCARE CPR overpass during 16:05–16:16 UTC on 3 September 2024. Additionally, the simulated surface precipitation is validated against the coincident observations from the GPM satellite measurements, which uses the dual-frequency radar and multi-channel radiometer. Launched in February 2014, the GPM is led by NASA and JAXA and designed to provide global observations of rain and snow.
Also, vertical profiles of LWC and IWC are obtained from Cloudnet retrievals based on cloud radar measurements aboard the Research Vessel Meteor during the Beobachtung von Ozean und Wolken – Das Trans ITCZ Experiment (BOWTIE) campaign (Foth, 2026; Stevens et al., 2026), providing additional observational constraints. Since in-situ INP measurements were unavailable during ORCESTRA, INP concentrations for immersion freezing are obtained from a previous study by (Price et al., 2018), who measured INPs in the marine boundary layer close to the study region (Cape Verde). An EarthCARE overpass coinciding with active deep convection over the tropical Atlantic on the selected day enabled the use of CPR_CLP_2A microphysical retrievals.
2.2 Numerical Model
The present study uses the ICON (Zängl et al., 2015) model to simulate the convective cases (Sect. 2.1). ICON is developed by the German weather service (Deutscher Wetterdienst), in collaboration with the MPI-M, German Climate Computing Center (Deutsches Klimarechenzentrum, DKRZ), Center for Climate Systems Modeling, and Karlsruhe Institute of Technology. The non-hydrostatic dynamical core of ICON solves fully compressible, non-hydrostatic primitive equations (Gassmann and Herzog, 2008) on an unstructured triangular grid and with a C-type staggering based on successive refinement of a spherical icosahedron (Wan et al., 2013), to avoid singularity issues at the poles.
Here, the ICON NWP physics package is used, with a 2-moment bulk microphysics scheme (Seifert and Beheng, 2006) which follows the generalized gamma distribution to describe the particle size distributions (PSD) of hydrometeors. The diameter-mass and fall velocity-mass relationships are parameterized with power laws (Han et al., 2024, Table 1 therein). In the 2-moment microphysics scheme, ICON predicts the mass and number mixing ratios of cloud droplets and ice (“crystal”), snow, graupel, hail, and rain.
ICON uses the ecRad radiation scheme (Hogan and Bozzo, 2018), where SW and LW radiative transfer are governed by the effective radii of cloud liquid and ice crystals. In this study, these effective radii are derived from both their mass mixing ratios and number concentrations, enabling a more consistent coupling between radiation and microphysics.
In ICON, the CCN activation scheme by Segal and Khain (2006) initiates cloud droplets based on aerosol properties (CCN concentration and log-normal size distribution width) and vertical velocity at the cloud base. This scheme uses regression equations and lookup tables derived from a 2000-bin microphysics parcel model, separating clouds into four regimes: maritime, continental, intermediate, and polluted continental. Furthermore, at subzero levels warmer than −38 °C, ICON forms primary (heterogeneous) ice by activating INP through immersion freezing and deposition nucleation (Hande et al., 2015), depending on the temperature and saturation ratio with respect to ice (Si), based on assumptions on aerosol composition and loading. In all simulated DCCs, the immersion freezing mode of Hande et al. (2015) is modified using a temperature-dependent quadratic scaling factor constrained by observed INP concentrations, as discussed in Sect. 3. Also, above the −38 °C level, ICON initiates homogeneous ice through freezing of water droplets (Jeffery and Austin, 1997; Cotton and Field, 2002) and aqueous aerosols. Homogeneous freezing of raindrops is not considered, as raindrops freeze rapidly at warmer levels before reaching the threshold for homogeneous nucleation (Seifert and Beheng, 2006). The heterogeneous raindrop freezing is parameterized following Bigg (1953).
2.2.1 Secondary ice processes implemented in ICON
ICON initiates secondary ice through four ice multiplication processes. These are
-
Hallett-Mossop (HM) process of rime-splintering
In ICON, the rate of splinter formation during riming of supercooled cloud droplets larger than 24 µm, through the HM process, is represented as,Here, Nsec is the number of secondary ice fragments from the HM process, ℵhm is a constant (3.5×10⁸ fragments per kg, Table A2), qrime is the rimed ice mixing ratio, and whm(T) is a temperature-dependent function given by,
-
Fragmentation in raindrop freezing
In the ICON model, SIP is also initiated via RDF, following the parameterization by Sullivan et al. (2018, hereafter SULL18). The SULL18 is a simplified scheme that forms secondary ice during the immersion freezing of raindrops, dependent on the temperature and shattering probability of a freezing raindrop. More details are from SULL18 and Han et al. (2024).To examine how the existing parameterizations of RDF impact ice formation, dynamics, and radiative properties in the simulated clouds, a more detailed parameterization, proposed by Phillips et al. (2018, hereafter PHIL18), is newly implemented in ICON and compared with the predictions of SULL18.
The RDF proposed by PHIL18 forms secondary ice through two different modes. The first mode involves SIP in collisions between supercooled drops (0.05–5 mm diameter (D)) and a less massive ice particle or in immersion freezing of a raindrop. The number of secondary ice fragments (Nsec) from mode 1 is given by,
Here, T is temperature in °C, and the quantities such as ΞRDF, βRDF, ζ, and η are dependent on D, and Ω is a function of T (PHIL18, Sect. 4 and Appendix B therein).
In mode 1, both small and big fragments can be formed, denoted as “S” and “B” respectively, during the freezing of a raindrop. The number of big fragments, added to the graupel category, is given as
And, the number of small fragments, identified as ice-crystals, can be derived as,
In mode 2, secondary ice splinters are initiated via the emission and eventual freezing of splashes formed during the collision between a larger ice particle and a raindrop. The number of fragments (Nsec) from the second mode is given by,
Here, Φ is the probability of any drop fragment in a splash containing ice, which is set to 0.3 following James et al. (2021). And, DE is dimensionless energy defined by,
and, the collision kinetic energy (CKE, K0) is,
where m and mi are the masses of liquid and ice particles, respectively. Table A2 describes the other symbols, and additional details are from PHIL18.
-
Fragmentation in ice-ice collision
Fragment formation during collisions between ice particles is included as a SIP process in ICON following Phillips et al. (2017b). This formulation links SIP in IIC to the CKE available during collision. In ICON, this scheme is applied within the bulk microphysics framework by discretizing each colliding ice particle into emulated bins that follow a gamma size distribution (Han et al., 2024). The fragments from the collision between all possible pairs of bins are added together to obtain the total number of fragments from ice-ice collisions. For a collision between two ice particles, the expected number of secondary ice fragments (Nsec) is given as,Here, K0 is the CKE (Eq. 8) of the colliding ice particles, α is the surface area of the smaller particle, γ is the shape parameter, and C is the asperity-fragility coefficient. For either ice-crystal or snow, γ = 0.5–0.25Ψ, where Ψ is the rime fraction given by Gautam et al. (2024) (Table 2 therein) given by,
Here, D is the mean size of an ice particle, D3=0.3 mm, and D4=2 mm are empirical constants for particle size, Ψ1 is the maximum rime fraction, which is 0.18 for dendritic and 0.3 for non-dendritic crystals. The other symbols are described in Table A2. In ICON, fragments are formed in collisions between ice particles of different or the same habits, except for the crystal-crystal collision. Further details of the physical assumptions and parameter choices are described in Phillips et al. (2017b, Sect. 4 and Table 1 therein) and Han et al. (2024).
-
Fragmentation in sublimation of graupel and dendritic snow
In ICON, an empirical formulation proposed by Deshmukh et al. (2022) is used to represent fragmentation during sublimation of dendritic snow and graupel. According to this formulation, the rate of fragment production during sublimation of dendritic snow is,
and, during sublimation of graupel,
Where d is the diameter of a sublimating particle. Following Waman et al. (2022), only 20 % of secondary ice crystals from SBF are assumed to survive the subsaturated regions in which they form. Further details on the symbols are given in Table A2. Additional details are from Deshmukh et al. (2022).
The fragments formed in these four SIP processes are added to the cloud-ice category, allowing for a possible cascade effect. Also, the contribution to the total ice from homogeneous and heterogeneous nucleation, and the four SIP processes, is estimated using their process rates.
Table 2Summary of simulation and spin-up time of the simulated DCCs.


2.2.2 Experimental Design
In this study, each case (Sect. 2.1) is simulated in the LAM of ICON, with four two-way nested domains (Fig. 5), with the horizontal grid spacing halved from 13 km in the outermost (2500 km × 2500 km) domain to 1.6 km in the innermost (500 km × 500 km) domain. With a 21 km model top, the vertical grid spacing is gradually increased from the surface to the model top using 65 vertical levels. The model integration time step is 10 s. For the simulated DCCs, the initial and lateral boundary conditions (LBCs) are derived from the ECMWF atmospheric reanalysis version 5 (ERA5; Hersbach et al., 2020) data and updated every three hours at the lateral boundaries for the outer domain. These nested domains are coupled online, and the LBCs for the inner domain are derived from the corresponding outer domain. All domains are simulated with the 2-moment microphysics scheme (Seifert and Beheng, 2006). For the inner two domains (3.2 and 1.6 km), shallow convection (Sakradzija et al., 2015) is parameterized, and deep convection is assumed to be explicitly resolved.

Figure 5Outlines of the geographical areas used as domains for the simulated events of convection during (a) CAIPEEX, (b) DCMEX, (c) MC3E, and (d) ORCESTRA. The dashed red and thick cyan lines in panel (d) show the EarthCARE overpass and HALO aircraft track over the study location between 16:06 and 16:10 UTC on 3 September 2024.
Due to their similar aerosol conditions, the simulated CAIPEEX, DCMEX, and MC3E cases are classified as “continental”, while ORCESTRA is categorized as “marine” convection. Table 2 summarizes the details of the simulation time for each convective case. For the continental DCCs, the spin-up time is 3–6 h. No spin-up time is considered for the ORCESTRA simulation, as ICON realistically reproduces the observed convection that was already present at initialization (Fig. 9f).
The control run (Table 3) is performed with four SIP processes (Sect. 2.2.1), with RDF represented using the PHIL18 scheme. Also, to assess the role of SIP on cloud and radiative properties, a sensitivity run (“No SIP” run) is performed in which SIP is turned off and compared with the control run. To examine the influence of the choice of RDF scheme on the simulated cloud properties, another sensitivity run (SULL18 run) is performed in which the PHIL18 scheme is replaced with the SULL18 scheme.
The results discussed in the following sections are from the innermost (1.6 km) domain.
3.1 Model Validation
This section compares the micro- and macrophysical properties of the simulated DCCs (Sect. 2.1) with aircraft (for CAIPEEX, DCMEX, MC3E) and satellite (for ORCESTRA) observations that are temporally and spatially coincident (Fig. S1 in the Supplement).
3.1.1 CAIPEEX
For the simulated CAIPEEX DCCs, Fig. 6a compares the original and scaled Hande et al. (2015) active INP concentration from immersion freezing parameterizations against the measurements from SPIN. The original scheme (gray dashed line) underestimates the observed INP concentrations by about an order of magnitude over the temperature range −14 to −20 °C, while the scaled formulation (solid black line) shows improved agreement with the observations. The scaled scheme is extended beyond the observational range of the SPIN instrument (−14 to −20 °C) using the derived quadratic scale factor, as indicated by the dashed black line in Fig. 6a. Figure 6b compares the cumulative frequency distribution (CDF) of simulated vertical velocity against the corresponding observations from the B200 aircraft. The simulation reasonably reproduces the observed updraft distribution, including the fractions of moderate (w > 1 m s−1) and strong (w > 5 m s−1) updrafts. However, the model underestimates the occurrence and magnitude of observed downdrafts, with maximum downdrafts reaching about 10 m s−1 in the observations but only 1 m s−1 in the control simulation. These weaker simulated downdrafts may partly be due to the limited ability of kilometer-scale simulations to resolve the turbulent structures associated with deep convection (Wang et al., 2022).

Figure 6(a) Observed INP number concentrations from Shete et al. (2026) compared against the original (dashed gray line) Hande et al. (2015) immersion freezing scheme and its scaled version (solid black line) fitted to match the observations. All simulations of CAIPEEX are performed with this scaled version of Hande et al. (2015) INP activation scheme. (b) Cumulative frequency distributions comparing simulated (black line) vertical velocity with collocated B200 aircraft observations (blue line). Conditionally averaged mean profiles (black lines) from the control simulation of the CAIPEEX case, over cloudy convective updrafts (w > 1 m s−1) of the (c) LWC, and (d) CDNC, compared against the coincident CDP observations, and (e) IWC compared with the PIP while in panel (f), filtered NI400 is compared against the corresponding observations from CIP and PIP (for NI400 INC) probes mounted on the B200 aircraft during CAIPEEX. Also, the simulated radar reflectivity from the control run (h) is compared with the corresponding observations (g) from the C-band dual polarization ground-based radar operational during CAIPEEX, averaged over 75–76° E and 17–18° N in both the simulation and the observations. Error bars and shaded regions in panels (c)–(f) denote the standard deviations of the observations and simulations, respectively. Sample sizes are shown next to the observational data points.
Also, Fig. 6c–f shows a comparison of the control simulation (Table 3) with coincident aircraft observations, conditionally averaged over cloudy updrafts (w > 1 m s−1). The simulated LWC (Fig. 6c) is found to agree well with the observations from the CDP, whereas the simulated CDNC is about 80 % lower than the observed values (Fig. 6d), likely because the CCN activation scheme of Segal and Khain (2006) may not represent the high aerosol loadings over the Indian subcontinent. Furthermore, the filtered INC (NI400) observed from CIP and PIP agree with each other to within ±40 % at all sampling levels (Fig. 6f), while the simulated mean NI400 is about 70 % lower than these observations at relatively weaker updrafts (w > 1 m s−1, Fig. 6f). In regions of higher convective updrafts (w > 2 and > 4 m s−1), this agreement improves further (Fig. S4). The same agreement is reported between the simulated and observed IWC (Fig. 6e).
As shown in the contoured frequency by altitude diagrams (CFADs), the simulated radar reflectivity (Fig. 6h) shows the general vertical structure of CAIPEEX clouds as observed by the C-band radar (Fig. 6g). The observed reflectivity shows a distinct bright band at about 5 km with a maximum reflectivity exceeding 25 dBZ. Although the simulation underestimates the high reflectivity values below 6 km, it adequately reproduces the overall shape and vertical distribution of reflectivity, with both showing cloud tops at similar altitudes (16 km). The median profiles show that both simulated and observed reflectivities decrease with height above the melting level (5 km), the simulated convection exhibits slightly weaker reflectivity, chiefly at higher (> 6 km) altitudes, suggesting possible differences in ice-phase processes.
Also, the simulated reflectivity distribution above the freezing level in Fig. 6h is broader than observed. This can be partly attributed to C-band signal attenuation in convective cores and mixed-phase regions (Tian and Srivastava, 1997), and limitations of the bulk microphysics scheme in representing the ice particle size distribution at these levels (Ori et al., 2020).
3.1.2 DCMEX
For the simulated DCMEX convection, the scaled Hande et al. (2015) immersion freezing scheme shows improved agreement with the observed (Sect. 2.1.2) INP concentrations (Fig. 7a). The CDF of vertical velocity (Fig 7b) shows that the BAe146 aircraft chiefly sampled the stratiform regions of the DCMEX convection, whereas ICON simulates relatively stronger convection while still reproducing the observed fraction of strong updrafts (w > 5 m s−1).

Figure 7As in Fig. 6 but for DCMEX case observed on 2 August 2022. During DCMEX, the LWC, IWC, and CDNC were measured by the Nevzorov and CDP probes, respectively, mounted on the BAe146 aircraft. In panel (a), INPs were measured by Teflon and polycarbonate filters aboard the BAe-146 FAAM aircraft (Daily et al., 2026). In panel (f), the black line indicates the mean INC for particles larger than 100 µm from the control simulation, and particles exceeding 0.1 mm from the CPI (green circles), CIP15 (blue squares), and CIP100 (brown asterisks) probes are shown, whereas 2DS (yellow diamonds) includes all particles. The radar observations are from the C-band, dual polarization, Shared Mobile Atmospheric Research and Teaching ground-based Doppler radar, unit 1, operational during DCMEX.
Figure 7c–f compares the results from the control simulation of DCMEX DCCs on 2 August 2022 with BAe146 aircraft observations, focusing on the cloudy updraft regions (w > 1 m s−1). The model simulates the magnitude of observed cloud-liquid (LWC, CDNC) properties at levels between the cloud base (5 °C) and −10 °C (Fig. 7c, d). However, at colder levels (< −10 °C), limited sampling size (< 10) of the CDP results in larger model-observation discrepancies (> 50 %).
Also, at such cold levels, the simulated IWC is about an order of magnitude higher than observed by the Nevzorov probe (Fig. 7e), whereas the means differ by less than 50 % at warmer subzero levels (> −10 °C). At these levels, simulated and observed NI100 are in the same orders of magnitude. At colder levels (< −10 °C) in the convective updrafts, the simulated NI100 is about 1–2 orders of magnitude higher than the observations from different optical probes (Fig. 7f). This discrepancy persists in regions of higher convective updrafts (Fig. S4), and may reflect both ICON overestimating INC at these colder levels, and significant spatial variability in observed INC due to localized evolution of individual convective turrets, making it challenging to evaluate model performance against the observed ice properties.
In different stratiform regions (Figs. S2, S4), ICON generally reproduces the measured microphysical properties within observational uncertainty. However, discrepancies among the observed NI100 and INP indicate considerable uncertainty in the observed ice concentrations, particularly at levels above −15 °C, which complicates accurate evaluation of simulated INCs (Fig. S2d).
The CFAD (Fig. 7g, h) shows that the distribution of the simulated radar reflectivity agrees well with the observations from the dual-polarimetric, C-band Doppler radar, with both showing a similar cloud-top altitude of about 16 km. The maximum radar reflectivity is up to 40 dBZ, both in the simulation and observation.
3.1.3 MC3E
For the simulated MCS observed on 11 May 2011 during MC3E, the scaled Hande et al. (2015) scheme for immersion freezing mode agrees with the observed (Sect. 2.1.3) INP concentrations (Fig. 8a). Also, as evident from Fig.8b, the Citation aircraft primarily sampled the stratiform regions of the observed MCS, with ICON showing a lower fraction (∼ 10 %) of moderate updrafts (w > 1 m s−1) but relatively higher fraction of stronger updrafts (w > 5 m s−1).

Figure 8As in Fig. 6 but for MC3E case observed on 11 May 2011. In panel (a), INP observations (DeMott et al., 2015; Waman et al., 2022) are from the same month but a different year (2014). During MC3E, the LWC and CDNC were measured by the CDP probes mounted on the Citation aircraft. In panel (f), the black line represents mean NI200 from the control simulation and from both the CIP and HVPS-v3 probes. The radar observations are from the Ka-band zenith radar (97.485° W, 36.605° N) operational during MC3E.
Figure 8c–f presents a comparison between the simulated cloud-liquid and ice properties and those measured by the Citation aircraft, in the cloudy updraft regions (w > 1 m s−1). The simulated and observed properties of cloud-liquid (LWC and CDNC) are in the same order of magnitude, with the simulation consistently exhibiting slightly higher values than those measured (Fig. 8c, d). Also, the simulated IWC and NI200 are compared with the corresponding observations from HVPS-v3 and CIP (Fig. 8e, f). The simulated IWC and NI200 at observational levels, with NI200 reaching 10 L−1, are comparable in magnitude to HPVS-v3 and CIP measurements across different convective cloudy updraft conditions (Fig. S4j–l).
In the control simulation of MC3E, the simulated reflectivity agrees well with the observation from the Ka-band Zenith radar, as evident in Fig. 8g, h. The model adequately predicts the overall frequency distribution and the vertical extent of the observed reflectivity. In addition, the maximum reflectivity is located below the freezing level (4.5 km), both in observation (25 dBZ) and simulation (> 40 dBZ), and the reflectivity values decrease with altitude. However, the higher simulated reflectivity relative to KAZR observations can be partly attributed to Ka-band signal attenuation in heavy precipitation (Chandra et al., 2015) and the single-column sampling limitation of the vertically-pointing KAZR, whose observations are restricted to clouds passing through its narrow vertical sampling volume.
3.1.4 ORCESTRA
For the ORCESTRA case, the immersion freezing parameterization of Hande et al. (2015) is compared and scaled against marine INP observations of Price et al. (2018) (Sect. 2.1.4, Fig. 9a). The CDF of vertical velocity (Fig. 9b) indicates that ICON underestimates the frequency of both moderate (w > 1 m s−1) and stronger (w > 5 m s−1) updrafts, with simulated moderate updraft fraction of only 0.3 % compared to observations (23 %, Fig. 9b). This discrepancy can be attributed to both weaker simulated convection in this marine case and the limitations of CPR Doppler retrieval of vertical motion in precipitating clouds (Kim et al., 2025). The observed microphysical and radar properties are derived from the CPR onboard the EarthCARE satellite, the airborne HALO-MIRA cloud radar, and shipborne measurements from the RV Meteor during the BOWTIE campaign (Sect. 2.1, Fig. 9c–e, g–h). The simulated surface precipitation is validated against GPM measurements (Fig. 9f).

Figure 9(a) Observed INP number concentrations from Price et al. (2018) compared against the original (dashed gray line) Hande et al. (2015) immersion freezing scheme and its scaled version (solid black line) fitted to match the observations. (b) CDF comparing the simulated (black line) vertical velocity against the collocated observations from EarthCARE-CPR (blue line). Comparison of the simulated mean properties (black lines), such as (c) LWC, (d) total IWC, with coincident observations from EarthCARE CPR (yellow squares) and Cloudnet radar retrievals from the BOWTIE campaign (blue circles). In panel (e), the total INC is compared with the coincident observations from EarthCARE CPR (yellow squares). Also, (f) the simulated domain-averaged surface precipitation rate (solid black line) is compared with the corresponding observations from the GPM (solid blue line). Furthermore, the contoured frequency by altitude diagram (CFAD) of radar reflectivity of the (g) EarthCARE-CPR is compared with the (h) HALO-MIRA Ka-band radar, and (i) control simulation of ORCESTRA for the period between 16:04 and 16:16 UTC. In panels (c)–(e), observational sample sizes in each temperature (for EarthCARE-CPR, marked in yellow) and altitude (RV-Meteor, marked in blue) bins are shown next to the observational data points. The simulated properties in panels (b)–(f) and (g)–(i) are plotted corresponding to the region of EarthCARE, HALO-MIRA, and RV Meteor pass, as shown in Fig. 4a.
From these profiles, it is evident that ICON predicts the observed vertical distribution of the LWC (Fig. 9c) and total IWC (Fig. 9d) with reasonable accuracy. Also, the simulated total INC agrees well with the CPR observations at most altitudes (Fig. 9e). However, between −20 and −40 °C levels, ICON predicts the total INC that is up to two orders of magnitude higher than that from the CPR. This discrepancy is likely due to ICON overpredicting INC at these levels as well as the limited sensitivity of the CPR to large concentrations of small ice particles, which, despite being numerous, contribute little to radar reflectivity. This results in an underestimation by CPR of the total INC in cloudy regions dominated by small ice crystals.
Furthermore, Fig. 9f shows a good agreement between the temporal evolution of the domain-averaged surface precipitation between the simulation and the GPM observation. ICON adequately captures the observed peak and decrease in precipitation with time, with generally higher precipitation than the corresponding observation. This is attributed to the fact that at such a higher spatial resolution (1.6 km) than GPM (10 km), ICON captures intense convective cores that may produce larger and more localized precipitation maxima (Fig. S5d–e).
For this marine convection, Fig. 9g–i shows a CFAD comparison of radar reflectivity from the control simulation (Fig. 9i), EarthCARE-CPR (W-band, Fig. 9g), and the airborne HALO-MIRA cloud radar (Ka-band, Fig. 9h) between 16:05–16:16 UTC. The simulated reflectivity distribution agrees well with HALO-MIRA, with both exhibiting pronounced convective features and median values of about 10 dBZ at most vertical levels. In contrast, EarthCARE-CPR shows a larger occurrence of weak echoes and relatively lower median reflectivity. Although a direct quantitative comparison is not feasible due to differences in radar frequency and attenuation characteristics, the CPR CFAD is consistently shifted toward weaker reflectivity than those of both simulation and HALO-MIRA. This may be attributed to stronger attenuation of the W-band signal in heavy precipitation (Sasikumar et al., 2026). This is particularly evident below 4 km, where HALO-MIRA detects substantially higher echoes (exceeding 20 dBZ) associated with precipitation, while the EarthCARE-CPR signal is highly attenuated at these levels. As a result, while the simulation and HALO-MIRA exhibit convective features of the selected ORCESTRA convection, the EarthCARE-CPR emphasizes the broader stratiform structure.
In summary, including different SIP processes in the simulated DCCs improves the agreement between simulated and observed properties. Also, in their mixed-phase regions (0 and −38 °C), the combination of various SIP processes (Sect. 2.2.1) allows ICON to simulate the observed INC, which cannot be explained by heterogeneous ice nucleation alone in these DCCs (Figs. S3, S4).
3.2 Microphysical analyses of the control runs
In Fig. 10, the process rates of INCs from the primary (heterogeneous) ice and from various SIP processes are analyzed from the control runs of the simulated DCCs.

Figure 10Profiles of the number process rates of various SIP processes, such as fragmentation in raindrop freezing (RDF, brown lines), Hallett-Mossop rime-splintering (HM, blue lines), ice-ice collision (IIC, black lines), and sublimation (SBF, yellow lines), averaged cloudy grid points for the control simulations of the DCCs, such as (a) CAIPEEX, (b) DCMEX, (c) MC3E, and (d) ORCESTRA. Also shown is the process rate for heterogeneously nucleated ice (Primary ice, green lines). Process rates represent time-integrated values over the simulation period.
In the mixed-phase region of these DCCs, SIP in HM and RDF dominates ice formation at levels warmer than −10 °C, whereas at colder levels IIC dominates the overall ice formation (Fig. 10). Primary ice contributes least to the total ice, especially at levels warmer than −20 °C. Also, in all simulated clouds, it is seen that each SIP process exhibits a peak at different levels. For example, IIC peaks at much colder levels (−25 °C), forming about 99 % of the total secondary ice there. Furthermore, RDF peaks at relatively warmer temperatures, at −3 °C (in CAIPEEX, DCMEX, and ORCESTRA) and around −5 °C (in MC3E), forming over 80 % of the total secondary ice at these warmer subzero levels. It is further reported that the contribution of RDF to total SIP varies with the scheme used.
The HM process is found to peak at much warmer levels (between −5 and −8 °C), contributing over 70 % to the total secondary ice at these levels. Moreover, SBF produces ice splinters at a quasi-steady rate at all subzero levels, forming less than 1 % of the total secondary ice. Hence, depending on their contribution to the total secondary ice, IIC can be ranked as the first, the HM process as the second, RDF as the third, and SBF as the fourth most important SIP process, as also reported by Waman et al. (2022).
3.3 Impact of SIP on microphysics, precipitation and dynamics of DCCs
To assess the role of ice multiplication (Sect. 2.2.1) in modulating the microphysical, dynamical, and radiative properties of the simulated DCCs, a sensitivity test was performed. This involved modifying the control run to create a perturbation simulation (“No SIP” run), in which all SIP processes are excluded, which is then compared with the control run.
Impact of SIP on microphysical properties
For the simulated CAIPEEX convection, Fig. 11 illustrates the time-height evolution of the simulated microphysical properties (LWC, total IWC, and INC) in the control and No SIP simulations. Additionally, corresponding changes due to SIP (control minus No SIP) are also shown in the same figures. In the mixed-phase region of these DCCs, supercooled liquid is 20 %–40 % higher without SIP than with it, chiefly due to decreased depositional growth of ice crystals there (Fig. 11a–c). In contrast, in the mixed-phase levels in this monsoon convection, excluding SIP causes a 20 % and 70 % decrease in the total IWC and INC, respectively, compared to those with SIP (Fig. 11d–i).
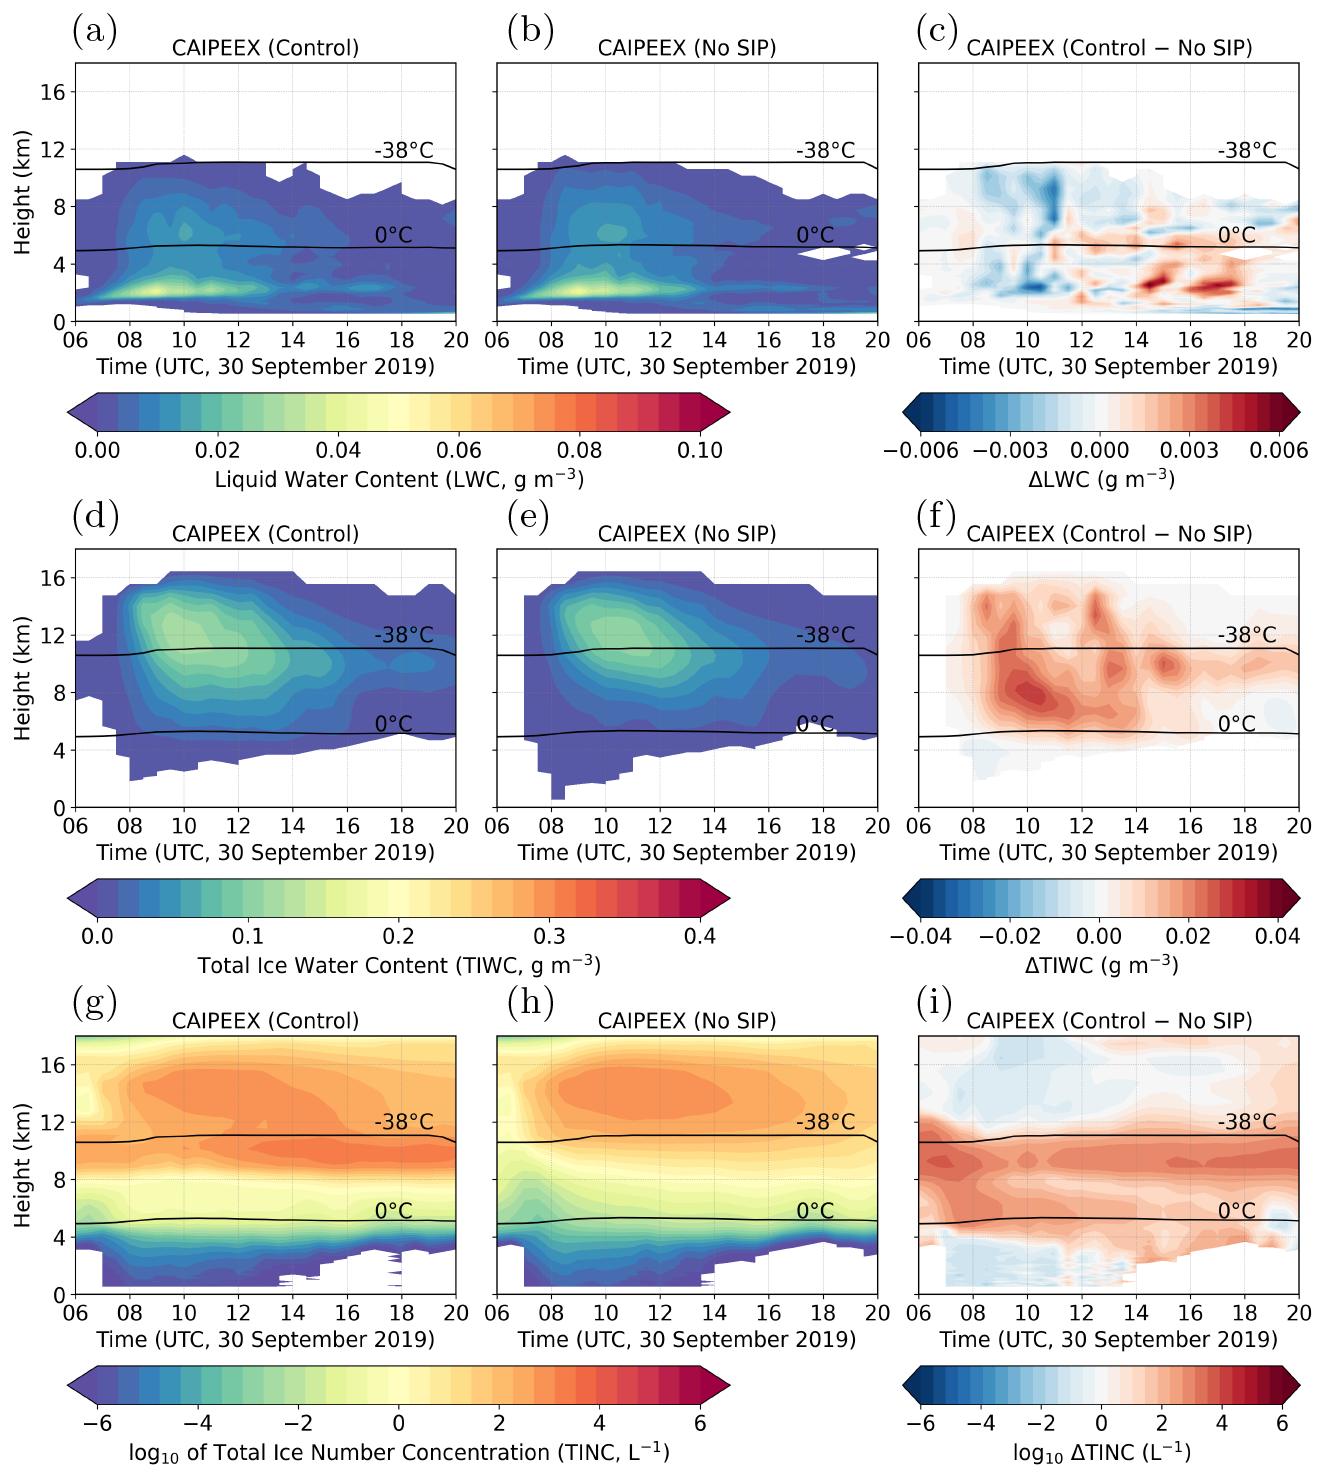
Figure 11Domain averaged time-height profiles of the (a) LWC, (d) total IWC, and (g) total INC from the control simulation of CAIPEEX convection. The same information is shown from the No SIP run in panels (b), (d), (h). Furthermore, the change (control minus No SIP) in LWC, total IWC, and total INC is shown in panels (c), (f), and (i), respectively. Also, in these plots, the freezing and −38 °C levels are denoted by the horizontal black and gray lines. In panel (i), the color bar scale is plotted as , where Δ denotes change.
In the lower mixed-phase region (> −10 °C) of the simulated DCMEX clouds, the absence of SIP causes about a 20 % increase in the supercooled liquid mass, whereas it increases by up to 10 % at higher levels (Fig. 12a–c). Without SIP, the total ice mass reduces by about 30 % in the mixed-phase region (Fig. 12d–f). Furthermore, at these levels, SIP produces as high as 103 L−1 INCs over a broad vertical extent (4 to 16 km) and a prolonged period (18:00–23:00 UTC, Fig. 12g–h). In contrast, without SIP, the maximum INC is 50 L−1, primarily at levels of homogeneous freezing, with a more confined vertical extent and a relatively shorter duration of enhancement.

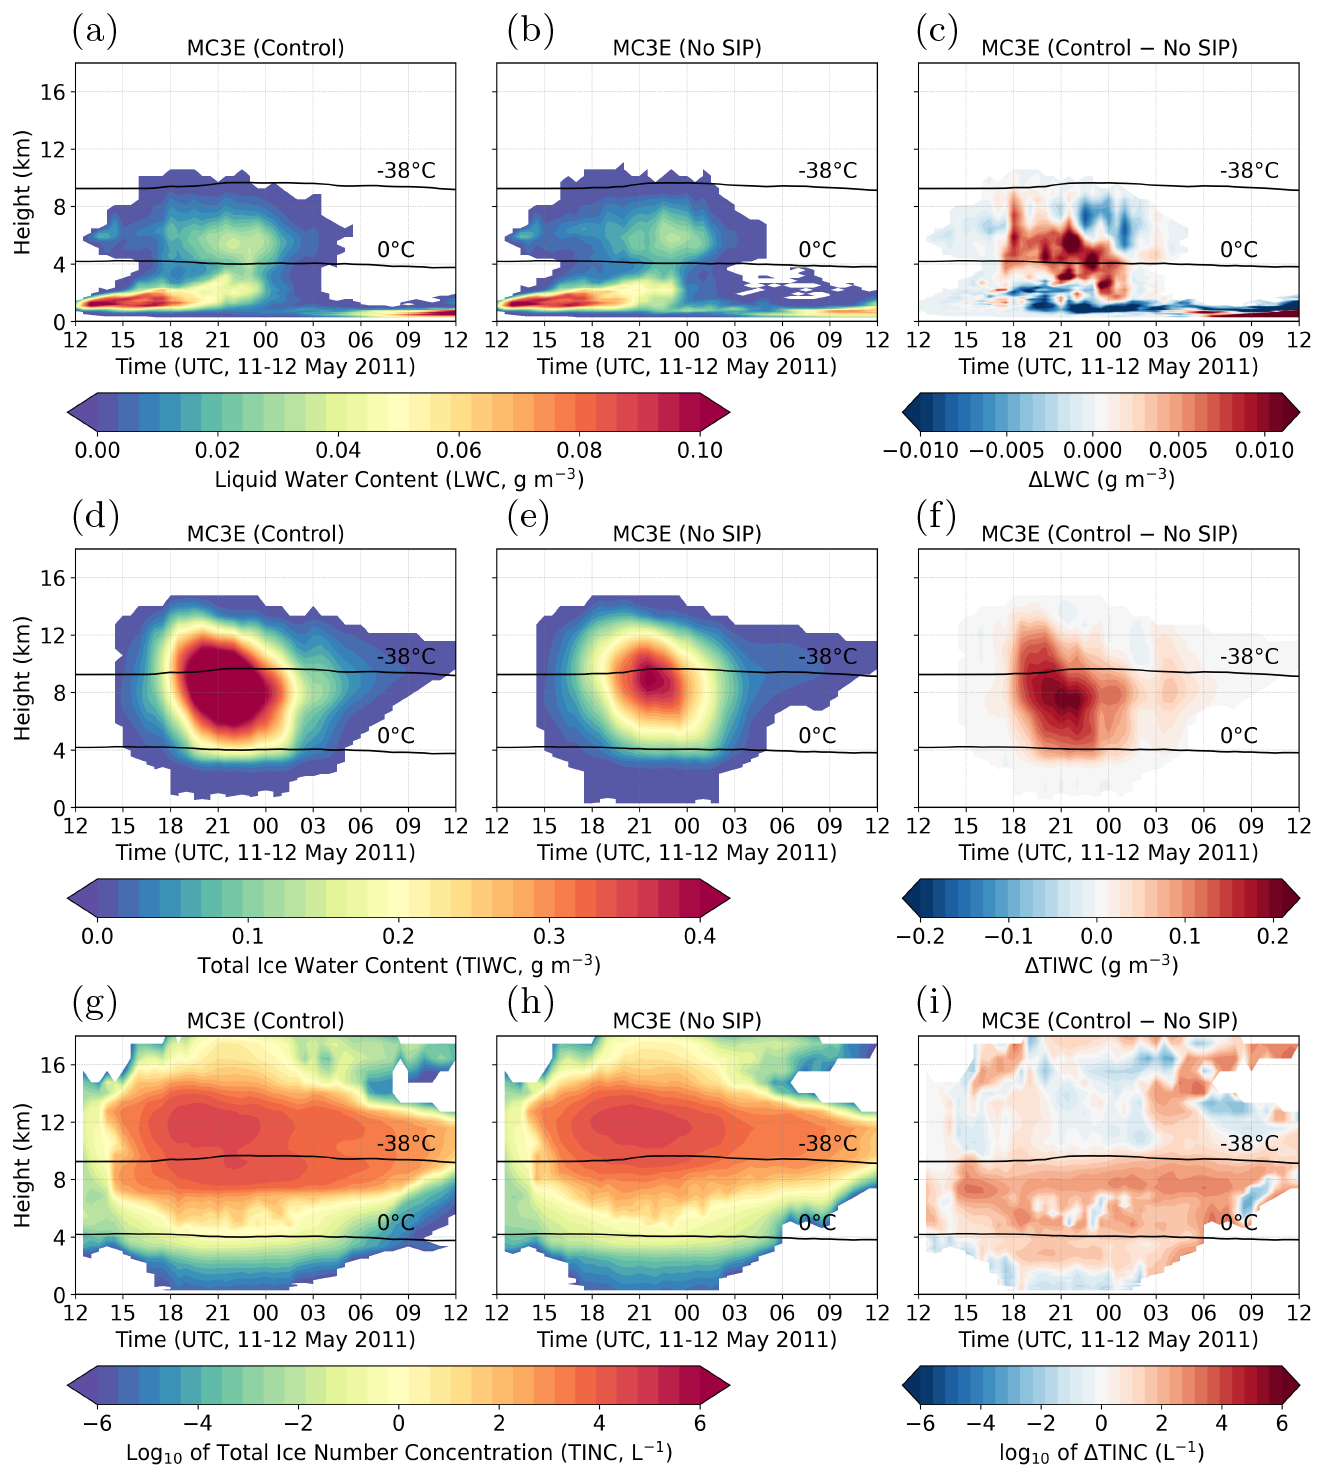
In an MCS during MC3E, the exclusion of SIP substantially alters the simulated microphysical structure. In the mixed-phase regions of this MCS, excluding SIP causes over 20 % decrease in the supercooled liquid mass than with SIP, whereas the total ice mass decreases by the same factor, especially in the mixed-phase region (Fig. 13d–f). Additionally, in these DCCs, INC extends vertically from near the freezing level to 16 km, with about 3 orders of magnitude less INC in the mixed-phase region without SIP than with it (Fig. 13g–i). Also, the exclusion of SIP from MC3E exhibits reduced vertical spread as well as temporal extent of these clouds. Hence, in these clouds, sustained glaciation facilitated by SIP forms a broad and long-lived anvil structure.
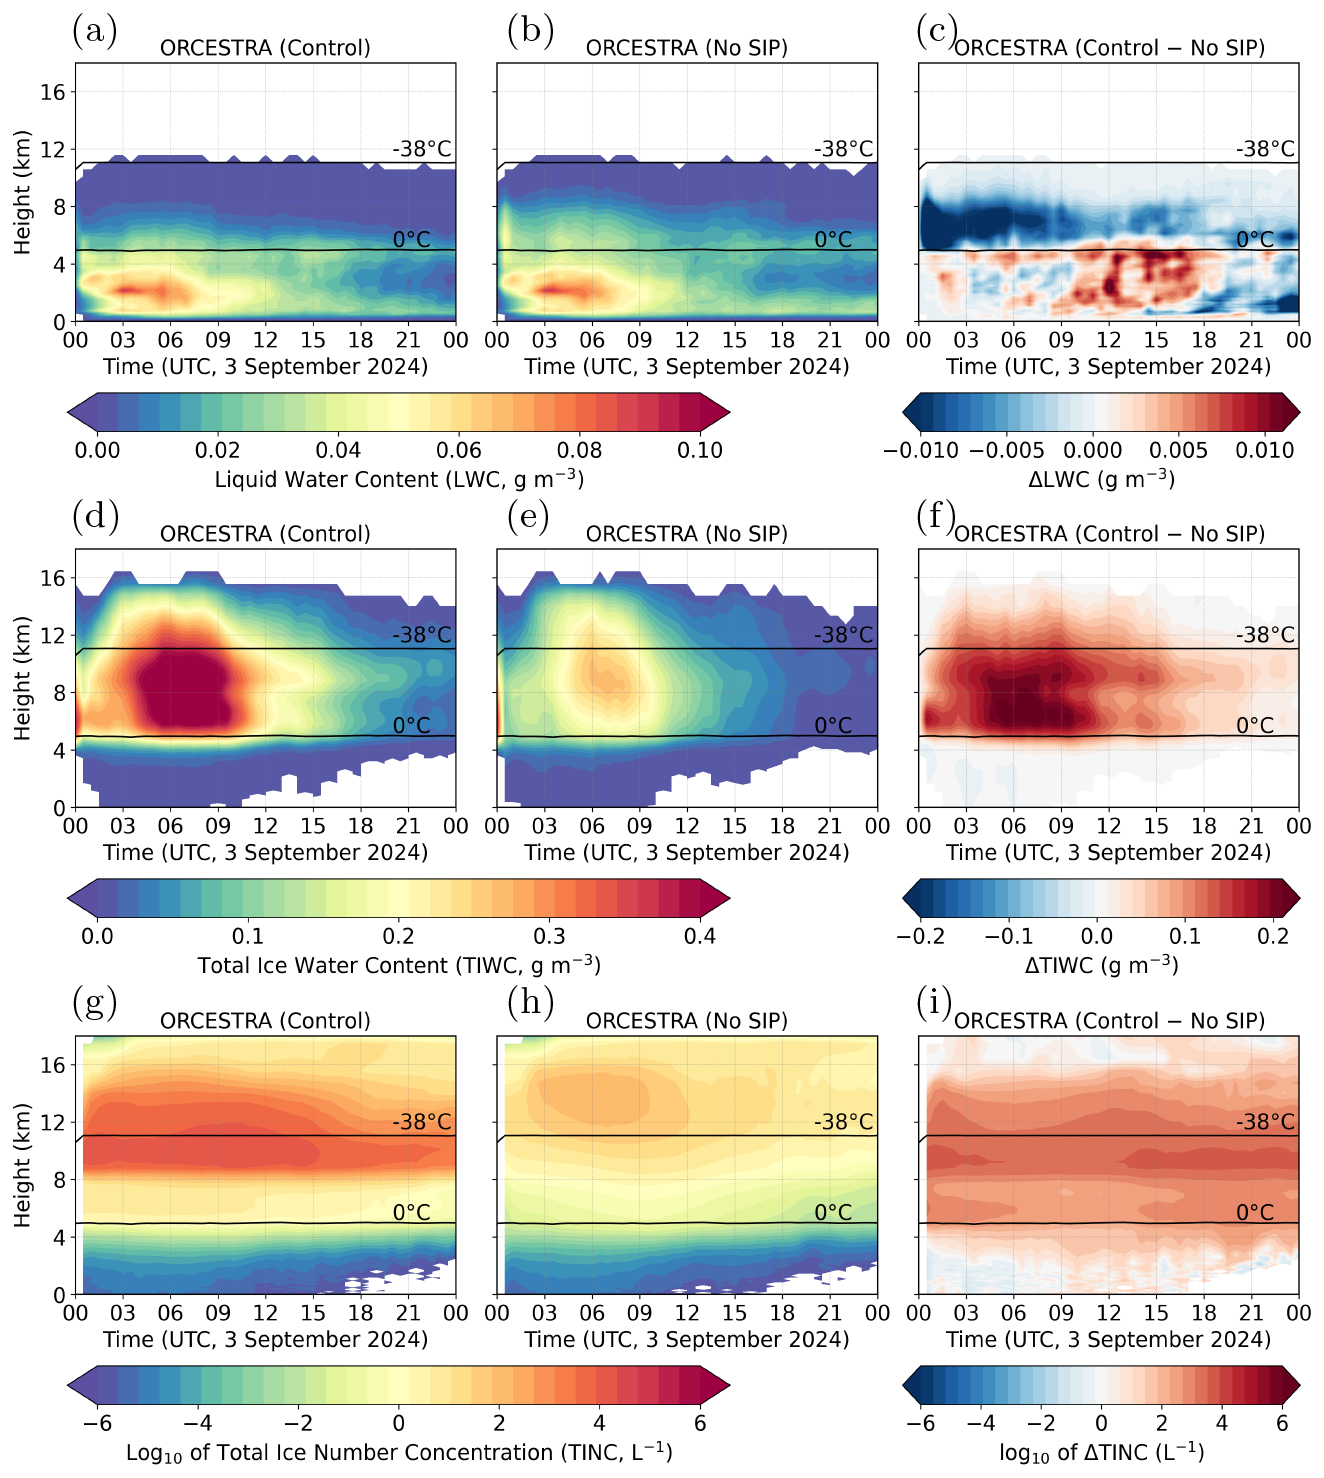
In the marine DCCs of ORCESTRA, excluding SIP shows over 20 % more supercooled liquid above 5 km, while it decreases with a similar fraction below it Fig. 14a–c. Also, the absence of SIP in this marine convection exhibits a substantial change in the distribution and magnitude of the total IWC (Fig. 14d–f) and INC (Fig. 14g–i). In the mixed-phase region, without SIP, the total IWC is about 50 % lower, mainly due to reduced depositional growth of ice particles than in the control run. At these levels, excluding SIP suppresses INC by a factor of 102–103. The presence of SIP sustains the overall ice mass over time and altitude in the control run, which would otherwise rapidly diminish after the convective peak (03:00–09:00 UTC). This can be attributed to continuous multiplication of ice via various SIP processes (Sect. 2.2) throughout the life cycle of this marine convection, which sustains IWC and INC through depositional growth.
In summary, SIP significantly affects the microphysical evolution of the simulated DCCs by promoting upper-level glaciation, which extends cloud lifetime and enhances both temporal longevity and spatial structure. In all simulated DCCs, excluding SIP leads to a 20 % reduction in ice mass, a corresponding increase in liquid mass, and a more than tenfold decrease in ice particle numbers. This effect is most pronounced in MC3E, with up to 50 % decrease (increase) in ice (liquid) mass without SIP than with it. These microphysical changes are hypothesized to influence the macrophysical and dynamical properties of these DCCs, as discussed in the following sections.
3.4 Impact of SIP on surface precipitation
In this section, the impact of SIP on the accumulated surface precipitation is discussed for the simulated DCCs.
Figure 15 illustrates domain-averaged surface accumulated precipitation in the control runs (black bars) of the simulated DCCs. It is reported that the amount of precipitation differs greatly among these clouds, with ORCESTRA representing intense tropical marine convection and producing the highest (43.6 mm) precipitation. In addition, MC3E forms 6.8 mm of surface precipitation, while CAIPEEX and DCMEX show more suppressed convective (< 4 mm) conditions.
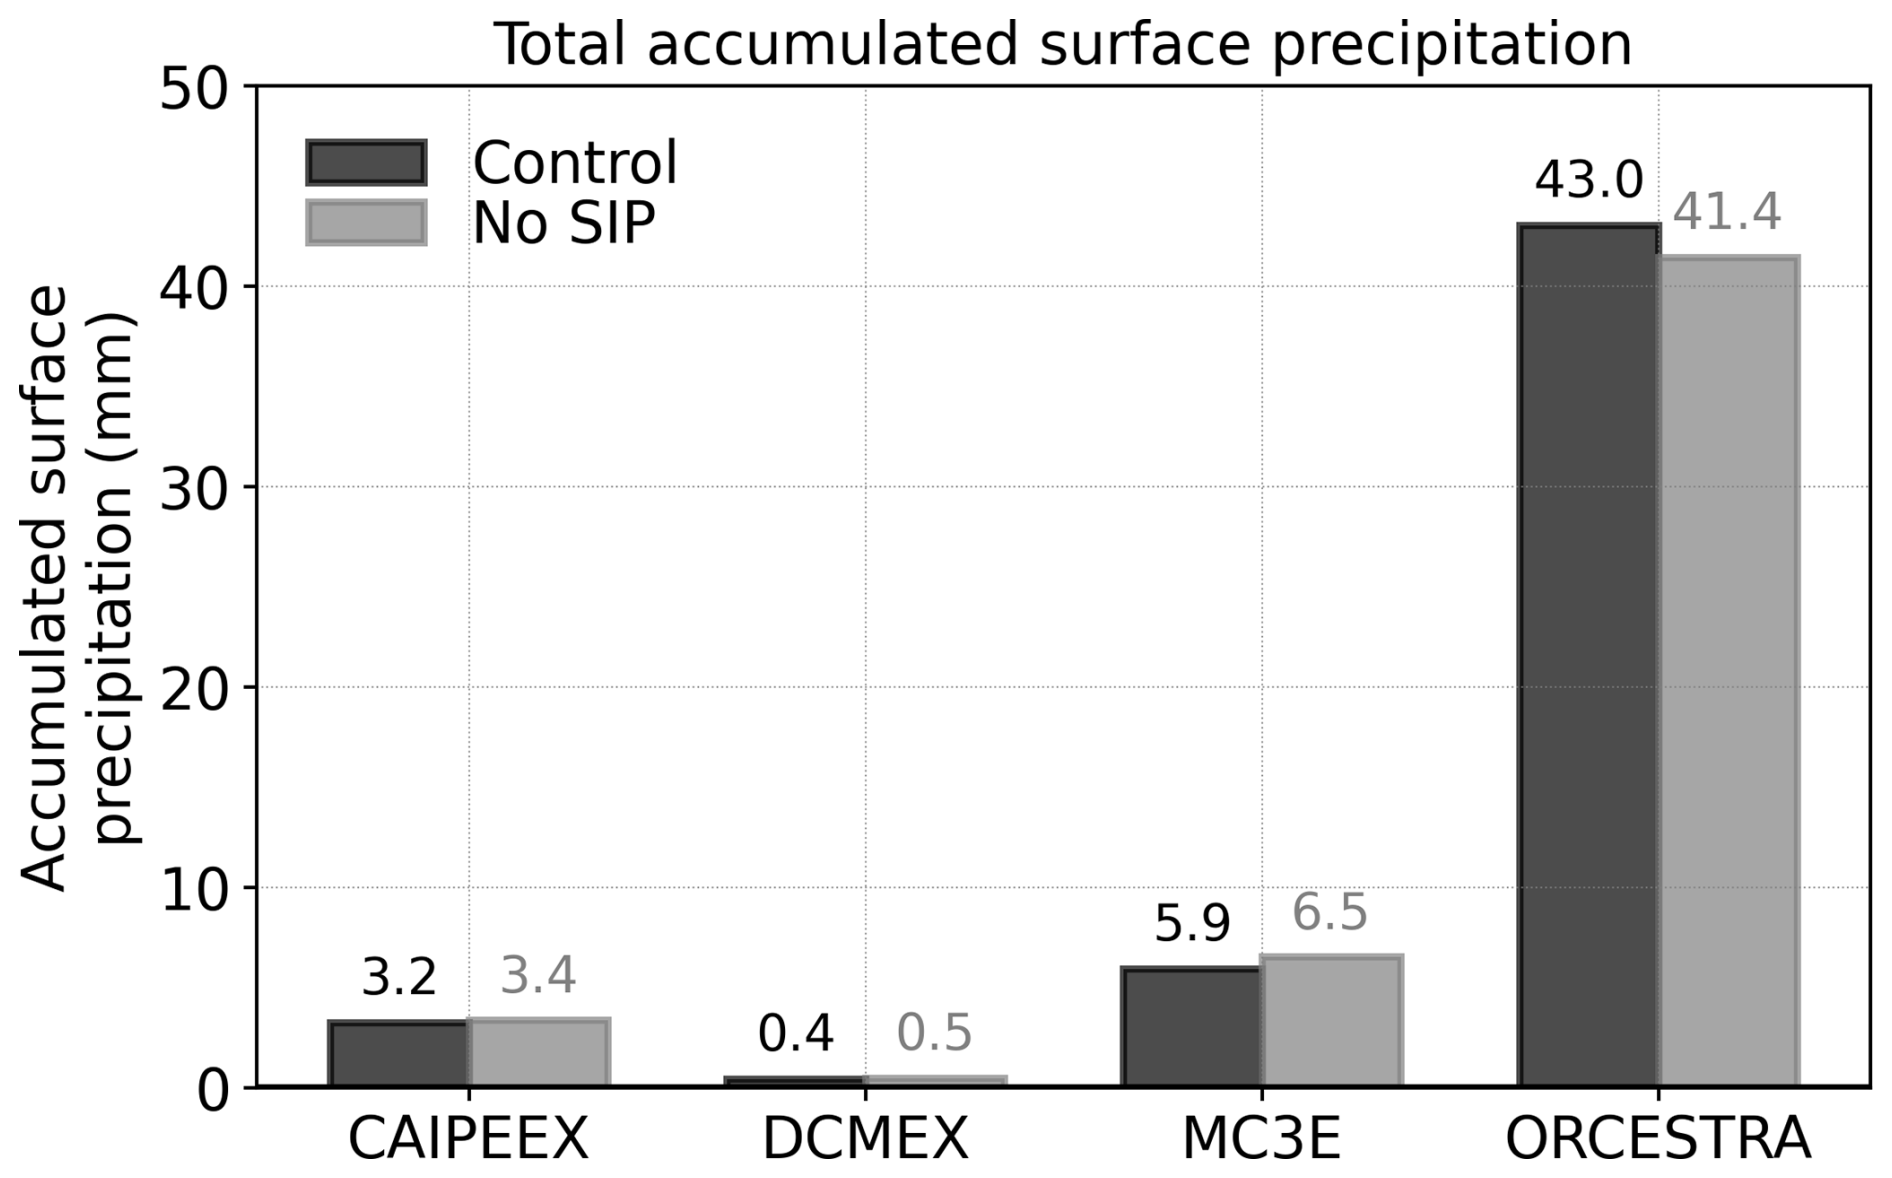
Figure 15Total accumulated surface precipitation from the control (black bars) and No SIP (gray bars) simulations of CAIPEEX, DCMEX, MC3E, and ORCESTRA clouds.
Furthermore, in these DCCs, the impact of excluding SIP on the simulated surface precipitation is shown in Fig. 15 (gray bars). In short-lived, weakly precipitating (< 1 mm h−1) DCCs of CAIPEEX (Patade et al., 2025) and DCMEX (Wu et al., 2025), excluding SIP causes a negligible change in the surface precipitation, due to relatively weaker SIP activity. In contrast, in long-lived MCSs of MC3E and ORCESTRA, the exclusion of SIP reduces the surface precipitation by 1 %–4 %, mainly due to reduced ice-crystal growth via deposition and riming.
3.5 Impact of SIP on cloud dynamics
This section discusses dynamical properties, such as latent heating, CRH, mean vertical velocity, and cloud top altitude, from the control simulations of the DCCs. In addition, the sensitivity of these dynamical properties to SIP in the simulated DCCs is analyzed.

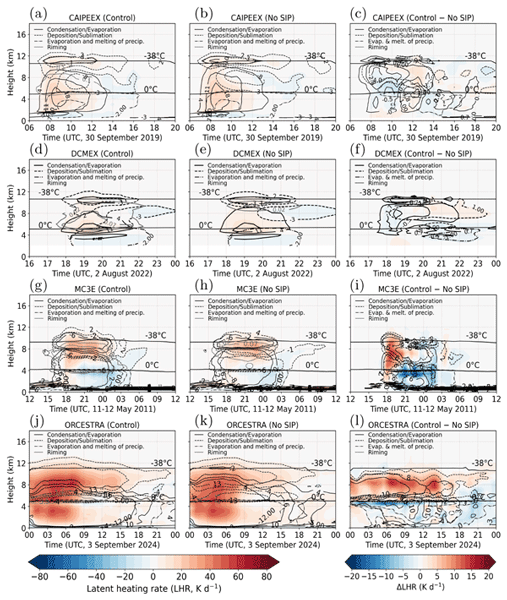
Figure 16Domain-averaged time-height profiles of the total latent heating in the (a) control and (b) No SIP simulations of the CAIPEEX clouds. Also, the change in latent heating from the exclusion of SIP (Control minus No SIP) for the CAIPEEX case is shown in panel (c). The contour lines in panels (a), (b), (c) show the contribution to the latent heating from major microphysical processes, such as condensation/evaporation (positive/negative values shown in solid black lines), deposition/sublimation (positive/negative values shown in dashed black lines), riming (dashed-dot black lines), and evaporation and melting of precipitation (solid gray lines). In panel (c), only major processes, such as Condensation/Evaporation, Deposition/Sublimation, and Evaporation and melting of precipitation, are shown. The other processes, such as rain freezing, homogeneous and heterogeneous nucleation, are not shown as they contribute little (< 2 %) to the overall latent heating. The same information is shown for the simulated (d, e, f) DCMEX, (g, h, i) MC3E, and (j, k, l) ORCESTRA clouds in their control and No SIP runs.
Figure 16 (left panel) illustrates the evolution of latent heating in the control runs of the simulated storm. The contour lines in Fig. 16 represent key microphysical processes contributing to total latent heating: condensation or evaporation (solid black line), vapor deposition (dashed black line), riming of cloud-liquid and rain (solid gray line), and evaporation and melting of precipitating hydrometeors (dash-dotted black line). This temporal evolution of latent heating reflects the life cycle of simulated DCCs, from initiation and growth to dissipation (Sect. 1), characterized by strong latent heating and cooling, respectively.
The simulated latent heating reveals strong variability in intensity and vertical extent across the simulated clouds. As convection intensifies in the control runs of CAIPEEX (between 07:00 and 12:00 UTC, Fig. 16a) and DCMEX (between 17:00 and 20:00 UTC, Fig. 16d), a pronounced heating core develops between 1–12 km, peaking at 30 K d−1 (in CAIPEEX) and 20 K d−1 (in DCMEX). In these DCCs, this heating is primarily driven by the heat release in droplet activation (1–2 km, not shown here), condensation (2–12 km), and depositional growth of ice-crystals (9–12 km), and further supported by riming at mid-levels. After 12:00 UTC in CAIPEEX and 20:00 UTC in DCMEX, the heating weakens and contracts, and regions of cooling, driven by evaporation and melting, become more prominent, reaching up to −10 K d−1 below the freezing level.
Similarly, in its control run (Fig. 16g), MC3E convection exhibits vertically extensive and persistent latent heating, peaking at 40 K d−1 above 7 km between 18:00–23:00 UTC on 11 May 2011. During its developing phase (15:00–17:00 UTC), heating extends from the surface to 10 km, chiefly from nucleation and condensation (up to 8 K d−1). In its mature phase (17:00–23:00 UTC), the heating further strengthens to 50 K d−1 at 7 km, driven by condensation in the lower troposphere, and riming and deposition aloft (Fig. 16g). Notably, the anvil region (> 10 km) shows sustained heating from the depositional growth of ice-crystals. After 23:00 UTC, as the system transitions to a stratiform regime, upper tropospheric heating weakens and spreads horizontally due to reduced deposition, while cooling due to evaporation and melting intensifies below the freezing level, indicating downdrafts and weakening convection.
In contrast, among the simulated DCCs, marine convection of ORCESTRA exhibits the strongest (> 50 K d−1, Fig. 16j) and most sustained diabatic heating. This is chiefly because, in such marine clouds, higher moisture facilitates condensation, which causes up to 80 K d−1 heat release at 3 km, between 03:00–08:00 UTC. Above the 6 km level, depositional growth of ice crystals dominates overall diabatic heating, with a sustained peak of 80 K d−1 between 04:00–08:00 UTC. In the mixed-phase region of ORCESTRA, riming (8 K d−1) contributes up to 10 % to total latent heating.
In the marine convection of ORCESTRA, abundant moisture below cloud base limits cooling due to evaporation and melting, as a shallow subsaturated layer allows precipitation to fall into already humid air. Consequently, evaporation and melting produce weaker cooling than in drier continental environments (Fig. 16a–i). This likely weakens downdrafts and favors ascending convective turrets, enhancing vertical transport of heat and moisture. Overall, the presence of extra moisture in these marine DCCs boosts latent heating and enables a more vertically extensive, organized convective system.
The level of peak latent heating also differs between continental and marine DCCs. In the investigated continental cases, mean diabatic heating peaks at colder temperatures (< −38 °C) compared to the marine case (ORCESTRA), where it peaks at significantly warmer temperatures (< −20 °C) (Fig. S6). This difference is primarily due to contrasting microphysical processes driven by aerosol conditions. Continental DCCs, characterized by higher aerosol loading, form numerous small droplets that remain supercooled at colder (< −38 °C) levels, where they freeze homogeneously and subsequently grow by vapor deposition. Conversely, marine DCCs with lower aerosol concentrations and higher moisture availability produce fewer, larger droplets that promote glaciation via enhanced collision-coalescence and subsequent raindrop/drizzle freezing. The growth of these frozen hydrometeors through riming and vapor deposition causes latent heating to peak at relatively warmer subzero levels (−20 °C).
Figure 16b, e, h, k shows diabatic heating profiles from No SIP runs of the simulated DCCs. In the mixed-phase regions of continental DCCs, the exclusion of SIP reduces latent heating, mainly during the early growth phase, by over 10 % in CAIPEEX and DCMEX, and up to 50 % in MC3E. Notably, in these regions, latent heating from deposition is weaker than the cooling from sublimation, both with and without SIP (Fig. S6a–f), especially during the mature and decay phases (Fig. 16a–i). However, without SIP, sublimation is more pronounced due to fewer ice particles, which reduces the surface area available for vapor deposition, than with SIP. Additionally, at these levels, the absence of SIP increases diabatic heating from condensation by 10 % compared to with SIP, as more moisture remains available to condense into supercooled liquid (Fig. 16b, e, h). Also, in continental DCCs, excluding SIP has little effect on latent heat release during riming.
Below freezing levels in these continental DCCs, excluding SIP leads to a small (5 %) increase in overall latent heating, mainly due to enhanced evaporation and melting of precipitation compared to with SIP. In contrast, at −40 °C in these continental clouds, excluding SIP increases total latent heating by up to 10 %, mainly due to enhanced vapor deposition (Figs. 16 and S6a–f). This is mainly because, without SIP, homogeneously formed ice crystals tend to grow larger and more efficiently via vapor deposition, releasing more latent heat than with SIP.
In contrast, in the developing and mature phases (00:00–09:00 UTC) of ORCESTRA marine DCCs (Fig. 16j, k), excluding SIP results in up to 15 % lower latent heating (Fig. 16l) compared to the control run, chiefly in the mixed-phase region. This decrease is due to a 70 % reduction in depositional growth of ice particles, as fewer INC form without SIP (Figs. 16l and S6g, h). However, at these levels, latent heating from condensation doubles when SIP is excluded, as more moisture is available instead of being consumed by ice-crystal growth.
In ORCESTRA, excluding SIP increases supercooled liquid availability above 7 km (Fig. 14a), enhancing ice growth via riming and resulting in about 20 % more diabatic heating. Also, below the freezing level in this marine convection, the exclusion of SIP causes little change (±1 %) in total latent heating, as evaporation of precipitating hydrometeors is minimal in the saturated environment.
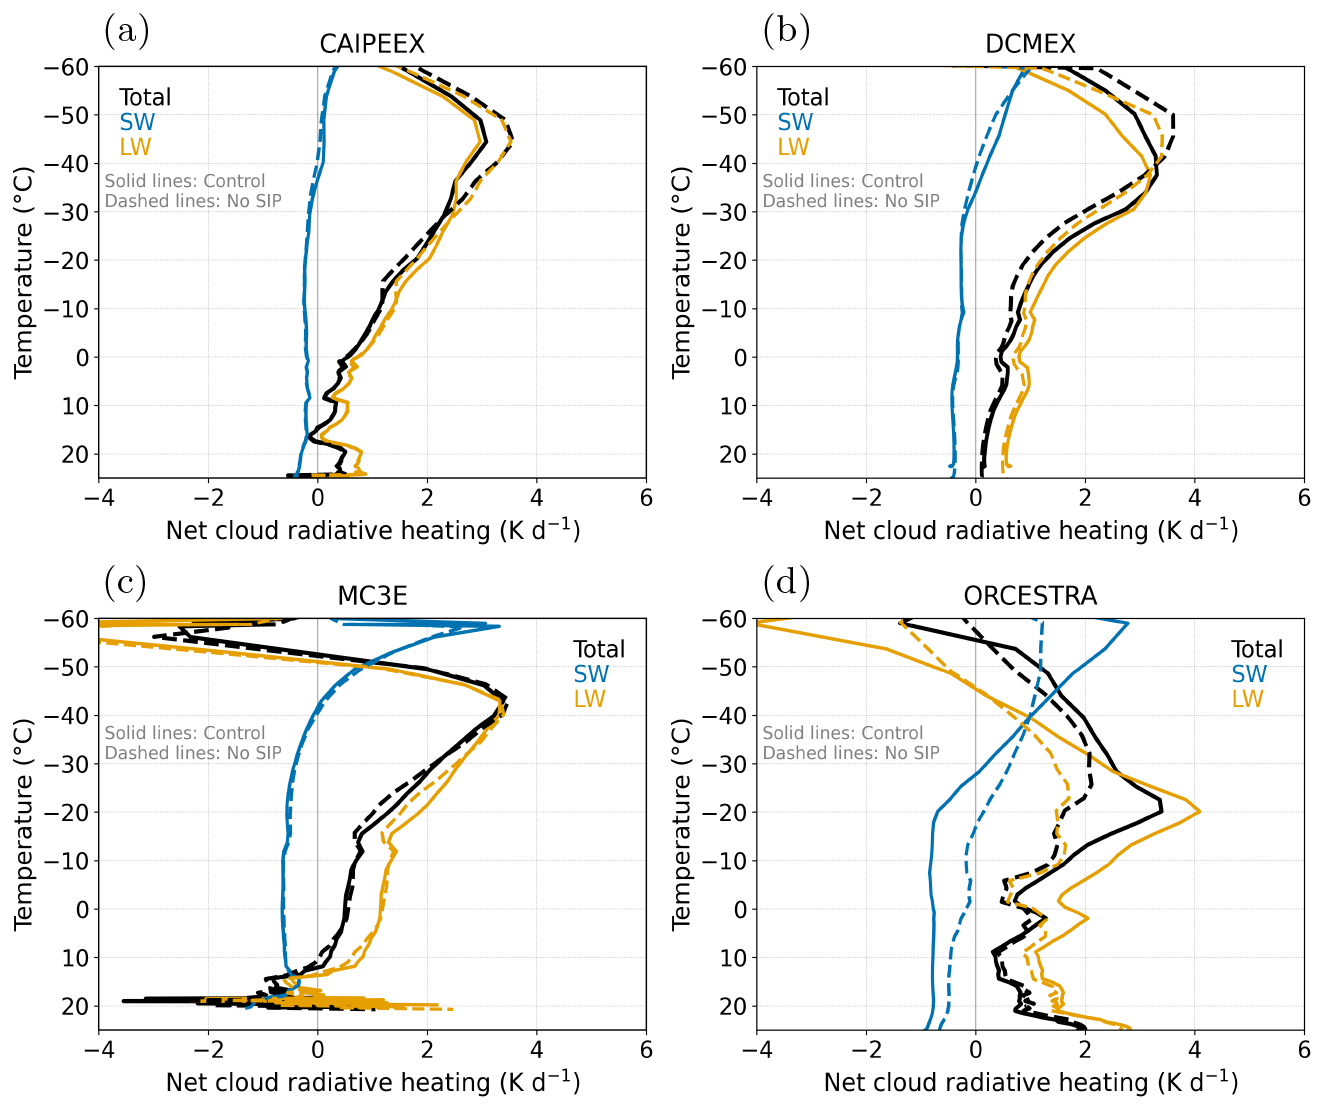
Figure 17Simulated domain-averaged net cloud radiative heating (CRH, K d−1, black lines) from the control (solid lines) and No SIP (dashed lines) simulations of (a) CAIPEEX, (b) DCMEX, (c) MC3E, and (d) ORCESTRA clouds. Also shown are the SW (blue lines) and LW (yellow lines) components of CRH.
Figure 17 illustrates the vertical profiles of mean CRH from the control runs (solid black line) of DCCs. The maximum CRH reaches up to 3 K d−1 at −40 °C in the continental DCCs (CAIPEEX, DCMEX, MC3E), and at −20 °C in the marine case (ORCESTRA), coinciding with the respective peaks in latent heating (Fig. S6) due to the contrasting microphysical processes described above.
The impact of SIP on CRH is assessed in Fig. 17 by comparing the control simulation with the No SIP run dashed lines. In the mixed-phase region (0 to −38 °C), excluding SIP reduces CRH by up to 10 % in continental DCCs and 50 % in marine DCCs. This reduction is primarily attributed to lower INC (Figs. 11–14) at these levels in the absence of SIP, which weakens CRH through reduced depositional growth of ice particles (by up to 20 %), thereby lowering the diabatic heating associated with the ice phase.
SIP exclusion exhibits the most pronounced impact on LW CRH (Fig. 17), which decreases by up to 15 % (in continental DCCs) and 50 % (in marine DCCs) due to reduced absorption of outgoing LW radiation. In continental DCCs, excluding SIP causes minimal change (< 5 %) in SW CRH. In contrast, excluding SIP from ORCESTRA marine DCCs exhibits enhanced SW radiative warming (from strong cooling to weak warming), primarily due to increased incoming SW radiation through the cloud column. This is because of a significant reduction in INC (by a factor of 103, Fig. S3d), which causes optically thinner mixed-phase clouds, thereby allowing more SW radiation to reach and be absorbed at lower levels.

Figure 18Domain-averaged profiles of the buoyancy (left panel), stratiform (0 < w < 1 m s−1, middle panel) and convective (w > 1 m s−1, right panel) ascents during convective periods from the control (black lines) and No SIP (gray lines) of the DCCs during (a–c) CAIPEEX, (d–f) DCMEX, (g–i) MC3E, and (j–l) ORCESTRA. In the left panel, the thick and thin lines denote buoyancy in convective and stratiform ascents, respectively.
To quantify the impact of SIP on vertical motions, buoyancy is computed as , where is the virtual potential temperature, θv,mean is its horizontal domain mean, qv, qt are the vapor and total condensate mixing ratios, and g is the gravitational acceleration. Excluding SIP in the simulated DCCs exhibits notable changes in buoyancy (Fig. 18, left panel), which in turn influences both stratiform (0 < w < 1 m s−1) and convective (w > 1 m s−1) ascent Fig. 18 (middle and right panels), thereby modulating the convective strength. At levels colder than −10 °C in all simulated cases, excluding SIP systematically reduces the 90th percentile stratiform ascent (Fig. 18, middle panel), with reductions of 5 % in CAIPEEX and DCMEX, and up to 30 % in MC3E and ORCESTRA. This is attributed to reduced latent heating in the absence of SIP (Fig. 16), which lowers the net positive buoyancy, suppressing stratiform ascent.
In contrast, in strong convective regions (w > 1 m s−1) (Fig. 18, right panel), excluding SIP reduces glaciation and total condensate loading in the mixed-phase regions (0 to −20 °C). Although this reduces latent heating (Fig. 16), the associated decrease in suspended condensate lowers the downward drag sufficiently to produce a net increase in buoyancy without SIP (Fig. 18, left panel), thereby enhancing convective ascent by over 20 %.
In DCCs of ORCESTRA, excluding SIP produces a vertically varying response in convective ascent (Fig. 18l). At warmer subzero levels (> −20 °C), where latent heating reduction dominates, convective ascent reduces by 20 %. In contrast, at colder levels, a 20 % increase in convective ascent is attributed to elevated buoyancy due to reduced condensate loading (Fig. 18j).
Unlike the other cases, excluding SIP in CAIPEEX reduces convective ascent by up to 10 % in their mixed-phase region (Fig. 18c), driven by reduced buoyancy in convective regions (Fig. 18a). This suggests that in this relatively less intense CAIPEEX convection, the latent heating reduction from excluding SIP dominates over the condensate loading effect, resulting in weaker convective updrafts.

Figure 19Time series of the cloud top height in the control (black lines) and No SIP (gray lines) simulations of (a) CAIPEEX, (b) DCMEX, (c) MC3E, and (d) ORCESTRA DCCs. The same information is shown for (c, d) DCMEX, (e, f) MC3E, and (g, h) ORCESTRA clouds. The cloud top height at each grid cell is defined as the highest level where total water content exceeds 10−2 g m−3 following Grzegorczyk et al. (2025).
The impact of SIP on the domain-mean cloud top height (CTH) for all simulated cases is shown in Fig. 19. In the continental cases (CAIPEEX, DCMEX, MC3E), excluding SIP shows a negligible impact on CTH, with differences of less than 0.5 km throughout the simulations. In contrast, when SIP is excluded from the marine ORCESTRA case, a pronounced reduction in CTH is seen. During the active convective stage, both control and No SIP simulations reach a similar peak CTH of 15 km, but from the mature stage onward, excluding SIP leads to a progressive reduction in CTH, reaching about 4 km lower CTH than the control by the end of the simulation. This is consistent with decreased latent heating without SIP, which weakens stratiform ascent and cloud depth in the marine environment, where cloud growth is more sensitive to ice-crystal processes than in the continental cases, as discussed in Sect. 3.3 and 3.5. In contrast to Grzegorczyk et al. (2025), who reported higher CTH when SIP was excluded, the present study finds a negligible impact on CTH in continental DCCs but a larger reduction (up to 4 km) in the marine ORCESTRA case when SIP is excluded.
3.6 Comparison of SIP parameterizations for raindrop shattering
In the control runs (Table 3), SIP during fragmentation in RDF is represented using the PHIL18 parameterization. To assess the impact of the choice of SIP parameterization of RDF fragmentation on the simulated cloud properties, these convective cases are simulated with the SULL18 scheme (Sect. 2.2.1, SULL18 run) and compared with their corresponding control PHIL18 runs.

Figure 20Profiles of the means of the domain-averaged total INCs from the control (which include PHIL18 RDF, blue lines), SULL18 RDF (yellow lines), and No SIP (gray lines) runs in the (a) CAIPEEX, (c) DCMEX, (e) MC3E, and (g) ORCESTRA clouds. Also, the domain-averaged (b, d, f, h) latent heating rate in the control (“PHIL18 RDF”), SULL18 RDF, and No SIP runs are shown for the simulated clouds.
Figure 20 shows the domain-averaged total INC simulated in the control (blue line), SULL18 (orange line), and No SIP (gray line) runs. The process rate analysis (Fig. S8) reveals that RDF from PHIL18 and SULL18 contributes approximately 80 % and 1 % to the total secondary ice, respectively, at levels warmer than −10 °C. At these levels, SULL18 forms approximately 1.5 times lower overall INCs across all simulated DCCs (Fig. 20a, c, e, g), with mean INCs in convective updrafts about 10 times lower than those formed by PHIL18 (Fig. S3). PHIL18 also exhibits closer agreement with the observed INCs (Fig. S3). This difference is because PHIL18 forms secondary ice splinters during both immersion freezing of raindrops and collisions between raindrops and ice particles. In comparison, SULL18 only considers SIP during immersion freezing of raindrops.
In the mixed-phase region of these DCCs, relatively lower INC in SULL18 dampens depositional growth (not shown) and results in 2 %–5 % less diabatic heating than the PHIL18 (Fig. 20h, k). This decreased diabatic heating with SULL18 weakens buoyancy, which leads to a decrease in vertical motion compared to PHIL18 (Fig. S8).
In summary, the choice of the RDF scheme has a more pronounced impact on INC at warmer subzero temperatures, whereas its influence on the simulated dynamical properties of these DCCs remains moderate. This highlights the sensitivity of simulated SIP through RDF to the choice of scheme. This may remain true for parameterizations of other SIP processes.
This study assesses the impact of SIP on the microphysics and dynamics of DCCs by simulating four contrasting cloud cases with the ICON model. These include three aircraft-observed continental cases, observed in (i) CAIPEEX over India on 30 September 2019, (ii) DCMEX over New Mexico on 2 August 2022, (iii) MC3E over Oklahoma on 11 May 2011, and (iv) marine convection on 3 September 2024 during ORCESTRA over the tropical Atlantic region, observed by the EarthCARE satellite and research vessel RV Meteor. For all simulated DCCs, the simulated microphysical properties (LWC, CDNC, IWC, INC) and radar reflectivity are adequately validated against coincident observations. A SIP treatment of RDF proposed by PHIL18 is newly implemented in ICON and compared to the existing scheme of SULL18.
In the simulated DCCs, SIP from IIC accounts for over 90 % of secondary ice, dominating overall INC in their mixed-phase regions (Fig. 10). In addition, the HM and RDF processes contribute to over 70 % in the lower mixed-phase region, while SBF contributes less than 2 % to total secondary ice. Two factors may explain this minimal contribution of SBF to total INC in these DCCs: parameterization uncertainties in the Deshmukh et al. (2022) formulation, or the physical limitation that most fragments from SBF sublimate before reaching supersaturated regions where fragment growth can occur (Korolev and Leisner, 2020).
The findings of the present study are;
-
In the simulated continental DCCs of CAIPEEX, DCMEX, and MC3E, the impact of SIP on microphysical properties varies in the range of simulated clouds. In their mixed-phase regions, without SIP, the supercooled liquid mass increases by 20 %–40 % due to enhanced condensation of vapor. In contrast, in a relatively saturated environment of marine DCCs of ORCESTRA, excluding SIP forms about 20 % more supercooled liquid at subzero levels. Also, in the mixed-phase region of these DCCs, the absence of SIP causes a decrease in the IWC (INC) by 10 %–30 % (10–103 L−1) compared to with SIP.
-
Furthermore, the sensitivity of the surface precipitation to SIP is found to depend closely on the convective intensity and longevity. In continental DCCs of CAIPEEX, DCMEX and MC3E, prohibiting SIP predicts no significant change in the accumulated surface precipitation, whereas it decreases by about 4 % in long-lived marine convection of ORCESTRA.
-
In the simulated DCCs, excluding SIP reduces total latent heating by 10 %–20 %, consistent with Qu et al. (2022) and Grzegorczyk et al. (2025), with the magnitude depending on convection intensity and duration. The reduction arises primarily from weakened ice-crystal growth by vapor deposition, leading to suppressed depositional heating and enhanced sublimational cooling in the mixed-phase region. These effects are modest (20 %) in short-lived, weakly precipitating systems (CAIPEEX, DCMEX) but can reach up to 50 % in sustained, moderately to strongly precipitating DCCs (MC3E, ORCESTRA). At the mixed-phase levels, enhanced vapor condensation partly offsets the cooling, indicating that the absence of SIP inhibits ice-phase processes and promotes the warm-rain pathway.
-
Excluding SIP from the simulated DCCs causes about a 15 %–50 % decrease in the net CRH, mainly through LW CRH (20 %–50 % decrease without SIP). This can be attributed to reduced absorption of outgoing LW radiation due to fewer ice particle mass and number in the absence of SIP.
-
This study also found that excluding SIP weakens (strengthens) stratiform (convective) ascent across all simulated DCCs. A 5 %–20 % increase in stratiform ascent without SIP is driven by reduced latent heating and buoyancy in those regions. In convective regions, however, the response is more complex. Although latent heating and CRH are reduced without SIP, the accompanying decrease in condensate loading sufficiently reduces downward drag, resulting in stronger convective ascent than with SIP.
-
In continental DCCs, prohibiting SIP found a modest (< 5 %) increase in CTH. In contrast, the marine ORCESTRA case exhibits a substantial reduction (by up to 3 km) in CTH during the mature stage when SIP is disabled. This remains consistent with reduced diabatic heating, which weakens stratiform ascent and limits cloud deepening. The lower cloud tops also likely contribute to the reduced LW CRH, as warmer cloud tops emit more longwave radiation to space. However, without SIP, the larger reduction in CTH in this marine convection suggests that the response may not be attributed to the absence of SIP alone, and may also reflect case-specific dynamical influences.
-
In all simulated DCCs, the PHIL18 and SULL18 RDF schemes produce similar dynamical properties despite PHIL18 generating higher INCs at temperatures warmer than −10 °C. PHIL18 also shows closer agreement with collocated INC observations when combined with other SIP processes.
-
This study further confirms the negligible impact of SIP in SBF on overall INC in a range of simulated DCCs, consistent with the findings of Waman et al. (2022) and Yang et al. (2024).
To conclude, this study reveals that SIP impact varies greatly among DCCs in different environmental conditions and convective strengths. By constraining SIP effects across four DCCs under different environments (from continental to marine), this study demonstrates that the magnitude of SIP influence on microphysics, dynamics, and diabatic properties systematically scales with convective evolution, intensity, and longevity, ranging from negligible effects in weak, short-lived systems to pronounced impacts in vigorous, long-lived DCCs. The exclusion of SIP leads to a substantial decrease in both temporal and vertical extent of convection in the MC3E and ORCESTRA clouds, chiefly due to reduced glaciation in their mixed-phase regions, as also reported by Qu et al. (2022).
This study further confirms the critical role of various SIP processes in numerical models to accurately simulate the observed INC in natural DCCs (Fig. S2). It should be noted that uncertainties remain in existing SIP schemes (Seidel et al., 2024; Korolev and Leisner, 2020), which can significantly limit their accuracy and efficiency. These uncertainties are primarily from factors such as variability in cloud conditions, irregular particle habits in natural clouds, the nonlinear nature of microphysical processes, and various model assumptions and simplifications. Consequently, these challenges may hinder the realistic representation of these processes in numerical models, which underscores the need for additional observational and experimental studies to increase their fidelity.


The present study used the October 2024 release of the ICON model, which is available at: https://gitlab.dkrz.de/icon/icon-model.git (last access: 11 June 2026). The raw simulation outputs have been archived on the high-performance storage system at the DKRZ. The post-processed ICON simulation outputs and related analysis codes can be accessed at: https://doi.org/10.5281/zenodo.21826426 (Waman et al., 2026).
The aircraft/radar data for the CAIPEEX case is available on request. The EarthCARE data for ORCESTRA is available at https://gportal.jaxa.jp/gpr/user/regist1?lang=en (last access: 2 June 2026). The DCMEX data can be accessed through https://data.ceda.ac.uk/badc/dcmex/data (last access: 5 June 2026), and MC3E at https://www.earthdata.nasa.gov/data/projects/mc3e/data-access-tools (last access: 22 April 2026). The Radiosonde data for the simulated cases is obtained from https://weather.uwyo.edu/upperair/sounding.shtml (last access: 4 June 2026). Bathymetric/topographic data were obtained from the General Bathymetric Chart of the Oceans grid (https://doi.org/10.5285/37c52e96-24ea-67ce-e063-7086abc05f29, GEBCO, 2025).
The supplement related to this article is available online at https://doi.org/10.5194/acp-26-11371-2026-supplement.
DW and CH conceptualized the study. DW, JM, and GW implemented the SIP processes in ICON. BK and CB were involved in the ICON setup and experiment design, and BK further offered guidance for the analysis of the simulations. TP made the observational data for CAIPEEX available, while DF and AB provided data for DCMEX. SS and SP helped in processing CAIPEEX aircraft and radar data. RF offered guidance on the EarthCARE data. DW conducted the simulations and analysis, and wrote the manuscript with input from all co-authors. CH supervised the project and secured funding.
The contact author has declared that none of the authors has any competing interests.
Publisher's note: Copernicus Publications remains neutral with regard to jurisdictional claims made in the text, published maps, institutional affiliations, or any other geographical representation in this paper. The authors bear the ultimate responsibility for providing appropriate place names. Views expressed in the text are those of the authors and do not necessarily reflect the views of the publisher.
This work was funded through the project WarmWorld (Grant 01LK2202C) of the German Federal Ministry of Research, Technology and Space. This work used resources of the Deutsches Klimarechenzentrum (DKRZ) granted by its Scientific Steering Committee (WLA) under project ID bk1341. CH and GW acknowledge funding through the Horizon Europe Cluster 5 project CleanCloud (Grant no. 101137639). The authors thank Sagar Pokale, Soumya Samanta, David Dufton, and Aaron Bansemer for their advice on the use of ground-based radar, flight, and satellite data. The authors thank the Indian Institute of Tropical Meteorology, Pune, and the Ministry of Earth Sciences, Government of India, for making the CAIPEEX data available for this study. The authors thank the two anonymous reviewers and the editor Prof. Ivy Tan for their constructive and insightful comments, which have helped improve the quality and clarity of the manuscript. During the writing process, large language models (ChatGPT, Grammarly, Claude) were used to detect and correct grammatical mistakes.
This research has been supported by the Bundesministerium für Forschung und Technologie (grant no. 01LK2202C) and the European Commission, Horizon Europe Cluster 5, CleanCloud (grant no. 101137639).
The article processing charges for this open-access publication were covered by the Karlsruhe Institute of Technology (KIT).
This paper was edited by Ivy Tan and reviewed by two anonymous referees.
Bacon, N., Swanson, B., Baker, M., and Davis, E.: Breakup of levitated frost particles, Atmos. Res., 103, 13763–13775, https://doi.org/10.1029/98JD01162, 1998. a, b
Bigg, E. K.: The formation of atmospheric ice crystals by the freezing of droplets, Q. J. Roy. Meteor. Soc., 79, 510–519, https://doi.org/10.1002/qj.49707934207, 1953. a
Bouniol, D., Roca, R., Fiolleau, T., and Poan, D. E.: Macrophysical, microphysical, and radiative properties of tropical mesoscale convective systems over their life cycle, J. Climate, 29, 3353–3371, https://doi.org/10.1175/JCLI-D-15-0551.1, 2016. a
Bower, K. N., Moss, S., Johnson, D., Choularton, T., Latham, J., Brown, P., Blyth, A., and Cardwell, J.: A parametrization of the ice water content observed in frontal and convective clouds, Q. J. Roy. Meteor. Soc., 122, 1815–1844, 1996. a
Chandra, A., Zhang, C., Kollias, P., Matrosov, S., and Szyrmer, W.: Automated rain rate estimates using the Ka-band ARM zenith radar (KAZR), Atmos. Meas. Tech., 8, 3685–3699, https://doi.org/10.5194/amt-8-3685-2015, 2015. a
Cotton, R. J. and Field, P. R.: Ice nucleation characteristics of an isolated wave cloud, Q. J. Roy. Meteor. Soc., 128, 2417–2437, https://doi.org/10.1256/qj.01.150, 2002. a
Daily, M. I., Robinson, J., Finney, D. L., Raif, E. N., McQuaid, J. B., Sanchez‐Marroquin, A., Hu, K., Lloyd, G., Flynn, M., Field, P. R., and Bower, K. N.: Ice‐nucleating particle and cloud ice crystal concentrations associated with developing summertime deep convective clouds in south‐western USA, J. Geophys. Res.-Atmos. 131, e2024JD043236, https://doi.org/10.1029/2024JD043236, 2026. a, b
DeMott, P., Prenni, A., Liu, X., Kreidenweis, S., Petters, M., Twohy, C., Richardson, M., Eidhammer, T., and Rogers, D.: Predicting global atmospheric ice nuclei distributions and their impacts on climate, P. Natl. Acad. Sci. USA, 107, 11217–11222, https://doi.org/10.1073/pnas.0910818107, 2010. a
DeMott, P. J., Suski, K. J., Hill, T. C. J., and Levin, E. J. T.: Southern Great Plains Ice Nuclei Characterization Experiment Final Campaign Summary (No. DOE/SC-ARM-15-012), DOE Office of Science Atmospheric Radiation Measurement (ARM) Program (United States), https://www.arm.gov/publications/programdocs/doe-sc-arm-15-012.pdf (last access: 25 May 2026), 2015. a, b
Deshmukh, A., Phillips, V. T. J., Bansemer, A., Patade, S., and Waman, D.: New empirical formulation for the sublimational breakup of graupel and dendritic snow, J. Atmos. Sci., 79, 317–336, https://doi.org/10.1175/JAS-D-20-0275.1, 2022. a, b, c, d, e, f, g, h, i, j, k
Dong, Y. Y., Oraltay, R. G., and Hallett, J.: Ice particle generation during evaporation, Atmos. Res., 32, 45–53, https://doi.org/10.1016/0169-8095(94)90050-7, 1994. a, b
Ewald, F.: MIRA Cloud Radar Moments from the HALO Microwave Package (Level 2), ORCESTRA campaign dataset, ORCESTRA data repository [data set], https://browser.orcestra-campaign.org/#/ds/ipfs://bafybeifxtmq5mpn7vwiiwl4vlpoil7rgm2tnhmkeyqsyudleqegxzvwl3a (last access: 2 June 2026), 2025. a
Ewald, F., Groß, S., Hagen, M., Hirsch, L., Delanoë, J., and Bauer-Pfundstein, M.: Calibration of a 35 GHz airborne cloud radar: lessons learned and intercomparisons with 94 GHz cloud radars, Atmos. Meas. Tech., 12, 1815–1839, https://doi.org/10.5194/amt-12-1815-2019, 2019. a
Feng, Z., Dong, X., Xi, B., Schumacher, C., Minnis, P., and Khaiyer, M.: Top‐of‐atmosphere radiation budget of convective core/stratiform rain and anvil clouds from deep convective systems, J. Geophys. Res., 116, https://doi.org/10.1029/2011JD016451, 2011. a
Field, P. R. and Heymsfield, A. J.: Importance of snow to global precipitation, Geophys. Res. Lett., 42, 9512–9520, https://doi.org/10.1002/2015GL065497, 2015. a
Field, P. R., Heymsfield, A. J., and Bansemer, A.: Shattering and particle interarrival times measured by optical array probes in ice clouds, J. Atmos. Ocean. Tech., 23, 1357–1371, https://doi.org/10.1175/JTECH1922.1, 2006. a
Field, P. R., Lawson, R. P., Brown, P. R., Lloyd, G., Westbrook, C., Moisseev, D., Miltenberger, A., Nenes, A., Blyth, A., Choularton, T., and Connolly, P.: Secondary ice production: Current state of the science and recommendations for the future, Meteor. Mon., 58, 7.1–7.20, https://doi.org/10.1175/AMSMONOGRAPHS-D-16-0014.1, 2017. a
Finney, D. L., Blyth, A. M., Gallagher, M., Wu, H., Nott, G. J., Biggerstaff, M. I., Sonnenfeld, R. G., Daily, M., Walker, D., Dufton, D., Bower, K., Böing, S., Choularton, T., Crosier, J., Groves, J., Field, P. R., Coe, H., Murray, B. J., Lloyd, G., Marsden, N. A., Flynn, M., Hu, K., Thamban, N. M., Williams, P. I., Connolly, P. J., McQuaid, J. B., Robinson, J., Cui, Z., Burton, R. R., Carrie, G., Moore, R., Abel, S. J., Tiddeman, D., and Aulich, G.: Deep Convective Microphysics Experiment (DCMEX) coordinated aircraft and ground observations: microphysics, aerosol, and dynamics during cumulonimbus development, Earth Syst. Sci. Data, 16, 2141–2163, https://doi.org/10.5194/essd-16-2141-2024, 2024. a, b, c, d
Foth, A.: Cloud radar and Cloudnet on RV Meteor during BOWTIE, ORCESTRA data repository [data set], https://doi.org/10.82246/bafybeidtfyua2vmmr pnhbl6nj57x2ynowaceghdapyetc6lnrpjii2tlli, 2026. a
Gassmann, A. and Herzog, H. J.: Towards a consistent numerical compressible non-hydrostatic model using generalized Hamiltonian tools, Q. J. Roy. Meteor. Soc., 134, 1597–1613, https://doi.org/10.1002/qj.297, 2008. a
Gautam, M., Waman, D., Patade, S., Deshmukh, A., Phillips, V., Jackowicz-Korczynski, M., Paul, F. P., Smith, P., and Bansemer, A.: Fragmentation in Collisions of Snow with Graupel/Hail: New Formulation from Field Observations, J. Atmos. Sci., 81, 2149–2164, 2024. a, b
GEBCO Compilation Group: GEBCO 2025 Grid, GEBCO, https://doi.org/10.5285/37c52e96-24ea-67ce-e063-7086abc05f29, 2025. a
Grzegorczyk, P., Yadav, S., Zanger, F., Theis, A., Mitra, S. K., Borrmann, S., and Szakáll, M.: Fragmentation of ice particles: laboratory experiments on graupel–graupel and graupel–snowflake collisions, Atmos. Chem. Phys., 23, 13505–13521, https://doi.org/10.5194/acp-23-13505-2023, 2023. a, b
Grzegorczyk, P., Wobrock, W., Canzi, A., Niquet, L., Tridon, F., and Planche, C.: Investigating secondary ice production in a deep convective cloud with a 3D bin microphysics model: Part II-Effects on the cloud formation and development, Atmos. Res., 314, 107797, https://doi.org/10.1016/j.atmosres.2024.107797, 2025. a, b, c, d
Gupta, A. K., Deshmukh, A., Waman, D., Patade, S., Jadav, A., Phillips, V. T. J., Bansemer, A., Martins, J. A., and Goncalves, F. L. T.: The microphysics of the warm-rain and ice crystal processes of precipitation in simulated continental convective storms, Commun. Earth Environ., 4, https://doi.org/10.1038/s43247-023-00884-5, 2023. a
Hallett, J. and Mossop, S.: Production of secondary ice particles during the riming process, Nature, 249, 26–28, https://doi.org/10.1038/249026a0, 1974. a, b
Han, C., Hoose, C., and Durlich, V.: Secondary ice production in simulated deep convective clouds: a sensitivity study, J. Atmos. Sci., 81, 5, https://doi.org/10.1175/JAS-D-23-0156.1, 2024. a, b, c, d, e, f
Hande, L. B., Engler, C., Hoose, C., and Tegen, I.: Seasonal variability of Saharan desert dust and ice nucleating particles over Europe, Atmos. Chem. Phys., 15, 4389–4397, https://doi.org/10.5194/acp-15-4389-2015, 2015. a, b, c, d, e, f, g, h, i
Hersbach, H., Bell, B., Berrisford, P., Hirahara, S., Horányi, A., Muñoz-Sabater, J., Nicolas, J., Peubey, C., Radu, R., Schepers, D., Simmons, A., Soci, C., Abdalla, S., Abellan, X., Balsamo, G., Bechtold, P., Biavati, G., Bidlot, J., Bonavita, M., De Chiara, G., Dahlgren, P., Dee, D., Diamantakis, M., Dragani, R., Flemming, J., Forbes, R., Fuentes, M., Geer, A., Haimberger, L., Healy, S., Hogan, R. J., Hólm, E., Janisková, M., Keeley, S., Laloyaux, P., Lopez, P., Lupu, C., Radnoti, G., de Rosnay, P., Rozum, I., Vamborg, F., Villaume, S., and Thépaut, J.-N.: The ERA5 global reanalysis, Q. J. Roy. Meteor. Soc., 146, 1999–2049, https://doi.org/10.1002/qj.3803, 2020. a
Hogan, R. and Bozzo, A.: A Flexible and Efficient Radiation Scheme for the ECMWF Model, P. Natl. Acad. Sci. USA, 10, 1990–2008, https://doi.org/10.1029/2018MS001364, 2018. a
Houze, R. A. J.: Cloud clusters and large-scale vertical motions in the tropics, J. Meteorol. Soc. Jpn., 60, 396–410, https://doi.org/10.2151/jmsj1965.60.1_396, 1982. a
Huang, Y., Wu, W., McFarquhar, G. M., Wang, X., Morrison, H., Ryzhkov, A., Hu, Y., Wolde, M., Nguyen, C., Schwarzenboeck, A., Milbrandt, J., Korolev, A. V., and Heckman, I.: Microphysical processes producing high ice water contents (HIWCs) in tropical convective clouds during the HAIC-HIWC field campaign: evaluation of simulations using bulk microphysical schemes, Atmos. Chem. Phys., 21, 6919–6944, https://doi.org/10.5194/acp-21-6919-2021, 2021. a, b
James, R. L., Phillips, V. T. J., and Connolly, P. J.: Secondary ice production during the break-up of freezing water drops on impact with ice particles, Atmos. Chem. Phys., 21, 18519–18530, https://doi.org/10.5194/acp-21-18519-2021, 2021. a
Järvinen, E., McCluskey, C. S., Waitz, F., Schnaiter, M., Bansemer, A., Bardeen, C. G., Gettelman, A., Heymsfield, A., Stith, J. L., Wu, W., D'Alessandro, J. J., McFarquhar, G. M., Diao, M., Finlon, J. A., Hill, T. C. J., Levin, E. J. T., Moore, K. A., and DeMott, P. J.: Evidence for secondary ice production in Southern Ocean maritime boundary layer clouds, J. Geophys. Res.-Atmos., 127, e2021JD036411, https://doi.org/10.1029/2021JD036411, 2022. a
Jeffery, C. A. and Austin, P. H.: Homogeneous nucleation of supercooled water: Results from a new equation of state, Q. J. Roy. Meteor. Soc., 102, 25269–25279, https://doi.org/10.1029/97JD02243, 1997. a
Jensen, M. P., Petersen, W. A., Bansemer, A., Bharadwaj, N., Carey, L. D., Cecil, D. J., Collis, S. M., Del Genio, A. D., Dolan, B., Gerlach, J., Giangrande, S. E., Heymsfield, A., Heymsfield, G., Kollias, P., Lang, T. J., Nesbitt, S. W., Neumann, A., Poellot, M., Rutledge, S. A., Schwaller, M., Tokay, A., Williams, C. R., Wolff, D. B., Xie, S., and Zipser, E. J.: The Midlatitude Continental Convective Clouds Experiment (MC3E), B. Am. Meteorol. Soc., 97, 1667–1686, https://doi.org/10.1175/BAMS-D-14-00228.1, 2016. a
Johnson, D. and Hallett, J.: Freezing and shattering of supercooled water drops, Q. J. Roy. Meteor. Soc., 94, 468–482, 1968. a
Kanji, Z., Ladino, L., Wex, H., Boose, Y., Burkert-Kohn, M., Cziczo, D., and Krämer, M.: Overview of ice nucleating particles, Meteorol. Monogr., 58, 1.1–1.33, https://doi.org/10.1175/AMSMONOGRAPHS-D-16-0006.1, 2017. a
Keinert, A., Spannagel, D., Leisner, T., and Kiselev, A.: Secondary ice production upon freezing of freely falling drizzle droplets, J. Atmos. Sci., 77, 2959–2967, https://doi.org/10.1175/JAS-D-20-0081.1, 2020. a
Keshtgar, B., Voigt, A., Mayer, B., and Hoose, C.: Uncertainties in cloud-radiative heating within an idealized extratropical cyclone, Atmos. Chem. Phys., 24, 4751–4769, https://doi.org/10.5194/acp-24-4751-2024, 2024. a
Kim, J., Kollias, P., Puigdomènech Treserras, B., Battaglia, A., and Tan, I.: Evaluation of the EarthCARE Cloud Profiling Radar (CPR) Doppler velocity measurements using surface-based observations, Atmos. Chem. Phys., 25, 15389–15402, https://doi.org/10.5194/acp-25-15389-2025, 2025. a
Kleinheins, J., Kiselev, A., Keinert, A., Kind, M., and Leisner, T.: Thermal Imaging of Freezing Drizzle Droplets: Pressure Release Events as a Source of Secondary Ice Particles, J. Atmos. Sci., 78, 1703–1713, https://doi.org/10.1175/JAS-D-20-0323.1, 2021. a
Korolev, A. and Isaac, G. A.: Observations of sublimating ice particles in clouds, in: Proceedings of the 14th International Conference on clouds and precipitation, 19–23 July, Bologna, Italy, 808–811, 2004. a
Korolev, A. and Leisner, T.: Review of experimental studies of secondary ice production, Atmos. Chem. Phys., 20, 11767–11797, https://doi.org/10.5194/acp-20-11767-2020, 2020. a, b, c, d, e, f
Korolev, A. V., Emery, E. F., Strapp, W., Cober, S. G., Issac, G. A., Wasley, E., and Marcotte, D.: Small Ice Particles in Tropospheric Clouds: Fact or Artifact?, B. Am. Meteorol. Soc.,, 92, 967–973, https://doi.org/10.1175/2010BAMS3141.1, 2011. a, b
Lasher-Trapp, S., Leon, D. C., DeMott, P. J., Villanueva-Birriel, C. M., Johnson, A. V., Moser, D. H., Tully, C. S., and Wu, W.: A multisensor investigation of rime splintering in tropical maritime cumuli, J. Atmos. Sci., 73, 2547–2564, 2016. a
Lasher-Trapp, S., Scott, E. L., Järvinen, M., Schnaiter, F., Waitz, P. J., DeMott, P. J., McCluskey, C. S., and Hill, T. C. J.: Observations and Modeling of Rime Splintering in Southern Ocean Cumuli, J. Geophys. Res., 126, https://doi.org/10.1029/2021JD035479, 2021. a
Lau, K. M. and Wu, H. T.: Warm rain processes over tropical oceans and climate implications, Geophys. Res. Lett., 30, 7.3–7.5, https://doi.org/10.1029/2003GL018567, 2003. a
Lawson, P., Woods, S., and Morisson, H.: The Microphysics of Ice and Precipitation Development in Tropical Cumulus Clouds, J. Atmos. Sci., 72, 2429–2445, https://doi.org/10.1175/JAS-D-14-0274.1, 2015. a, b
Lohmann, U., Lüönd, F., and Mahrt, F.: An introduction to clouds: From the microscale to climate, Cambridge University Press, ISBN 978-1-107-01822-8, 2016. a
Mason, B. J. and Maybank, J.: The fragmentation and electrification of freezing water drops, Q. J. Roy. Meteor. Soc., 86, 1703–1713, https://doi.org/10.1002/qj.49708636806, 1960. a
Oraltay, R. G. and Hallett, J.: Evaporation and melting of ice crystals: A laboratory study, Atmos. Res., 24, 169–189, https://doi.org/10.1016/0169-8095(89)90044-6, 1989. a, b
Ori, D., Schemann, V., Karrer, M., Dias Neto, J., von Terzi, L., Seifert, A., and Kneifel, S.: Evaluation of ice particle growth in ICON using statistics of multi-frequency Doppler cloud radar observations, Q. J. Roy. Meteor. Soc., 146, 3830–3849, 2020. a
Patade, S., Shete, S., Malap, N., Kulkarni, G., and Prabha, T. V.: Observational and simulated cloud microphysical features of rain formation in the mixed phase clouds observed during CAIPEEX, Atmos. Res., 169, 32–45, https://doi.org/10.1016/j.atmosres.2015.09.018, 2016. a
Patade, S., Kulkarni, G., Patade, S. Waman, D., Sotiropoulou, G., Samanta, S., and Malap, N.: Importance of secondary ice production in mixed-phase monsoon clouds over the Indian subcontinent, Atmos. Res., 315, 107890, https://doi.org/10.1016/j.atmosres.2024.107890, 2025. a, b, c, d, e, f
Phillips, V. T. J., Yano, J. J., Formenton, M., Ilotoviz, E., Kanawade, V., Kudzotsa, I., Sun, J., Bansemer, A., Detwiler, A. G., Khain, A., and Tessendorf, S.: Ice multiplication by breakup in ice–ice collisions. Part II: Numerical simulations, J. Atmos. Sci., 74, 2789–2811, https://doi.org/10.1175/JAS-D-16-0223.1, 2017a. a
Phillips, V. T. J., Yano, J. J., and Khain, A.: Ice multiplication by breakup in ice–ice collisions. Part I: Theoretical formulation, J. Atmos. Sci., 74, 1705–1719, https://doi.org/10.1175/JAS-D-16-0224.1, 2017b. a, b, c, d
Phillips, V. T. J., Patade, S., Gutierrez, J., and Bansemer, A.: Secondary ice production by fragmentation of freezing drops: Formulation and theory Possible High Ice Particle Production during Graupel–Graupel Collisions, J. Atmos. Sci., 75, 3031–3070, https://doi.org/10.1175/JAS-D-17-0190.1, 2018. a, b, c, d
Prabhakaran, T., Murugavel, P., Konwar, M., Malap, N., Gayatri, K., Dixit, S., Samanta, S., Chowdhuri, S., Bera, S., Varghese, M., Rao, J., Sandeep, J., Safai, P. D., Sahai, A. K., Axisa, D., Karipot, A., Baumgardner, D., Werden, B., Fortner, E., Hibert, K., Nair, S., Bankar, S., Gurnule, D., Todekar, K., Jose, J., Jayachandran, V., Soyam, P. S., Gupta, A., Choudhary, H., Aravindhavel, Kantipudi, S. B., Pradeepkumar, P., Krishnan, R., Nandakumar, K., DeCarlo, P. F., Worsnop, D., Bhat, G. S., Rajeevan, M., and Nanjundiah, R.: CAIPEEX: Indian Cloud Seeding Scientific Experiment, B. Am. Meterol. Soc., 104, E2095–E2120, https://doi.org/10.1175/BAMS-D-21-0291.1, 2023. a, b
Price, H. C., Baustian, K. J., McQuaid, J. B., Blyth, A., Bower, K. N., Choularton, T., Cotton, R. J., Cui, Z., Field, P. R., Gallagher, M., Hawker, R., Merrington, A., Miltenberger, A., Neely III, R. R., Parker, S. T., Rosenberg, P. D., Taylor, J. W., Trembath, J., Vergara-Temprado, J., Whale, T. F., Wilson, T. W., Young, G., and Murray, B. J.: Atmospheric ice-nucleating particles in the dusty tropical Atlantic, J. Geophys. Res.-Atmos., 123, 2175–2193, 2018. a, b, c
Qu, Z., Korolev, A., Milbrandt, J. A., Heckman, I., Huang, Y., McFarquhar, G. M., Morrison, H., Wolde, M., and Nguyen, C.: The impacts of secondary ice production on microphysics and dynamics in tropical convection, Atmos. Chem. Phys., 22, 12287–12310, https://doi.org/10.5194/acp-22-12287-2022, 2022. a, b, c, d
Roca, R., Fiolleau, T., and Bouniol, D.: A simple model of the life cycle of mesoscale convective systems cloud shield in the tropics, J. Climate, 30, 4283–4298, https://doi.org/10.1175/JCLI-D-16-0556.1, 2017. a
Sakradzija, M., Seifert, A., and Heus, T.: Fluctuations in a quasi-stationary shallow cumulus cloud ensemble, Nonlin. Processes Geophys., 22, 65–85, https://doi.org/10.5194/npg-22-65-2015, 2015. a
Sasikumar, S., Battaglia, A., Puigdomènech Treserras, B., and Kollias, P.: The estimation of path integrated attenuation for the EarthCARE cloud profiling radar, Atmos. Meas. Tech., 19, 2313–2328, https://doi.org/10.5194/amt-19-2313-2026, 2026. a
Sato, K., Okamoto, H., Nishizawa, T., Jin, Y., Nakajima, T. Y., Wang, M., Satoh, M., Roh, W., Ishimoto, H., and Kudo, R.: JAXA Level 2 cloud and precipitation microphysics retrievals based on EarthCARE radar, lidar, and imager: the CPR_CLP, AC_CLP, and ACM_CLP products, Atmos. Meas. Tech., 18, 1325–1338, https://doi.org/10.5194/amt-18-1325-2025, 2025. a
Segal, Y. and Khain, A.: Dependence of droplet concentration on aerosol conditions in different cloud types: Application to droplet concentration parameterization of aerosol conditions, J. Geophys. Res., 111, 1–11, https://doi.org/10.1029/2005JD006561, 2006. a, b
Seidel, J. S., Kiselev, A. A., Keinert, A., Stratmann, F., Leisner, T., and Hartmann, S.: Secondary ice production – no evidence of efficient rime-splintering mechanism, Atmos. Chem. Phys., 24, 5247–5263, https://doi.org/10.5194/acp-24-5247-2024, 2024. a, b
Seifert, A. and Beheng, K. D.: A two-moment cloud microphysics parameterization for mixed-phase clouds. Part 1: Model description, Meteor. Atmos. Phys., 92, 45–66, https://doi.org/10.1007/s00703-005-0112-4, 2006. a, b, c
Shete, S., Patade, S., Malap, N., Bankar, S., Jaykumar, S., Baumgardner, D., Axisa, D., Murugavel, P., and Prabhakaran, T.: Observations and simulations of immersion freezing INPs and their impact on cloud properties over the rain shadow region of India, Atmos. Res., 109056, https://doi.org/10.1016/j.atmosres.2026.109056, 2026. a, b
Sotiropoulou, G., Sullivan, S., Savre, J., Lloyd, G., Lachlan-Cope, T., Ekman, A. M. L., and Nenes, A.: The impact of secondary ice production on Arctic stratocumulus, Atmos. Chem. Phys., 20, 1301–1316, https://doi.org/10.5194/acp-20-1301-2020, 2020. a
Stevens, B., Bony, S., Gross, S., Klocke, D., Windmiller, J. M., Wing, A. A., von Bismarck, J., Brito, E., David, R. O., Delanoë, J., Farrell, D., and Wu, Y.: Orcestra: Organized convection and earthcare studies over the tropical Atlantic, Tellus, 79, https://doi.org/10.16993/tellus.4123, 2026. a, b
Sullivan, S., Keshtgar, B., Albern, N., Bala, E., Braun, C., Choudhary, A., Hörner, J., Lentink, H., Papavasileiou, G., and Voigt, A.: How does cloud-radiative heating over the North Atlantic change with grid spacing, convective parameterization, and microphysics scheme in ICON version 2.1.00?, Geosci. Model Dev., 16, 3535–3551, https://doi.org/10.5194/gmd-16-3535-2023, 2023. a
Sullivan, S. C., Barthlott, C., Crosier, J., Zhukov, I., Nenes, A., and Hoose, C.: The effect of secondary ice production parameterization on the simulation of a cold frontal rainband, Atmos. Chem. Phys., 18, 16461–16480, https://doi.org/10.5194/acp-18-16461-2018, 2018. a, b, c
Takahashi, C. and Yamashita, A.: Production of ice splinters by the freezing of water drops in free fall, J. Meteorol. Soc. Jpn. II, 55, 139–141, 1977. a
Takahashi, T., Nagao, Y., and Kushiyama, Y.: Possible High Ice Particle Production during Graupel–Graupel Collisions, J. Atmos. Sci., 52, 4523–4527, https://doi.org/10.1175/1520-0469(1995)052<4523:PHIPPD>2.0.CO;2, 1995. a, b, c
Tian, L. and Srivastava, R.: Measurement of attenuation at C band in a convective storm by a dual-radar method, J. Atmos. Ocean. Tech., 14, 184–196, 1997. a
Trenberth, K. E., Fasullo, J. T., and Kiehl, J.: Earth's global energy budget, B. Am. Meteorol. Soc., 90, 311–324, https://doi.org/10.1175/2008BAMS2634.1, 2009. a
Vardiman, L.: The generation of secondary ice particles in clouds by crystal–crystal collision, J. Atmos. Sci., 35, 2168–2180, https://doi.org/10.1175/1520-0469(1978)035<2168:TGOSIP>2.0.CO;2, 1978. a
Waman, D., Patade, S., Jadav, A., Deshmukh, A., Gupta, A., Phillips, V. T. J., Bansemer, A., and DeMott, P. J.: Dependencies of Four Mechanisms of Secondary Ice Production on Cloud-Top Temperature in a Continental Convective Storm, J. Atmos. Sci., 79, 3375–3404, https://doi.org/10.1175/JAS-D-21-0278.1, 2022. a, b, c, d, e, f, g, h, i, j
Waman, D., Meusel, J., Keshtgar, B., Wallentin, G., Barthlott, C., Patade, S., Prabhakaran, T., Fiévet, R., Finney, D., Blyth, A., and Hoose, C.: Datasets for Impacts of Secondary Ice Production on the Microphysics and Dynamics of Deep Convective Clouds in Different Environments, Zenodo [data set], https://doi.org/10.5281/zenodo.21826426, 2026. a
Wan, H., Giorgetta, M. A., Zängl, G., Restelli, M., Majewski, D., Bonaventura, L., Fröhlich, K., Reinert, D., Rípodas, P., Kornblueh, L., and Förstner, J.: The ICON-1.2 hydrostatic atmospheric dynamical core on triangular grids – Part 1: Formulation and performance of the baseline version, Geosci. Model Dev., 6, 735–763, https://doi.org/10.5194/gmd-6-735-2013, 2013. a
Wang, D., Prein, A. F., Giangrande, S. E., Ramos-Valle, A., Ge, M., and Jensen, M. P.: Convective updraft and downdraft characteristics of continental mesoscale convective systems in the model gray zone, J. Geophys. Res.-Atmos., 127, e2022JD036746, https://doi.org/10.1029/2022JD036746, 2022. a
Wehr, T., Kubota, T., Tzeremes, G., Wallace, K., Nakatsuka, H., Ohno, Y., Koopman, R., Rusli, S., Kikuchi, M., Eisinger, M., Tanaka, T., Taga, M., Deghaye, P., Tomita, E., and Bernaerts, D.: The EarthCARE mission – science and system overview, Atmos. Meas. Tech., 16, 3581–3608, https://doi.org/10.5194/amt-16-3581-2023, 2023. a, b, c
Widener, K. B., Bharadwaj, N., and Johnson, K.: Ka-Band ARM Zenith Radar (KAZR) Instrument handbook, ARM-TR-106, DOE Office of Science, Office of Biological and Environmental Research, United States, https://doi.org/10.2172/1035855, 2012. a
Wilcox, E. M., Yuan, T., and Song, H.: Deep convective cloud system size and structure across the global tropics and subtropics, Atmos. Meas. Tech., 16, 5387–5401, https://doi.org/10.5194/amt-16-5387-2023, 2023. a, b
Wu, H., Marsden, N., Connolly, P., Flynn, M., Williams, P. I., Finney, D., Hu, K., Nott, G. J., Thamban, N. M., Bower, K., Blyth, A., Gallagher, M., and Coe, H.: The role of aerosols and meteorological conditions in shaping cloud droplet development in New Mexico summer deep-convective systems, Atmos. Chem. Phys., 25, 18409–18429, https://doi.org/10.5194/acp-25-18409-2025, 2025. a
Yang, J., Huang, S., Yang, T., Zhang, Q., Deng, Y., and Liu, Y.: Impact of ice multiplication on the cloud electrification of a cold-season thunderstorm: a numerical case study, Atmos. Chem. Phys., 24, 5989–6010, https://doi.org/10.5194/acp-24-5989-2024, 2024. a, b, c
Zängl, G., Reinert, D., Ripodas, P., and Baldauf, M.: The ICON (ICOsahedral Nonhydrostatic) modelling framework of DWD and MPI-M: Description of the nonhydrostatic dynamical core, Q. J. Roy. Meteor. Soc., 141, 563–579, https://doi.org/10.1002/qj.2378, 2015. a, b
Zhao, X. and Liu, X.: Global importance of secondary ice production, Geophys. Res. Lett., 48, e2021GL092581, https://doi.org/10.1029/2021GL092581, 2021. a, b