
the Creative Commons Attribution 4.0 License.
the Creative Commons Attribution 4.0 License.
 | 06 Aug 2026
Cross-regional NO2 transport over the Tibetan Plateau (2005–2024): bidirectional flux dynamics, seasonal drivers, and environmental implications
Zhenda Sun
Hao Yin
Zhongfeng Pan
Chongyang Li
Ke Liu
Yu Yang
Tropospheric NO2 over the Tibetan Plateau (TP) reflects the combined influence of local emissions and long-range transport. We characterize the spatiotemporal variability of tropospheric NO2 columns, surface concentrations, and transport boundary fluxes during 2005–2024 by integrating OMI and TROPOMI satellite data, ground-based observations, and flux diagnostics based on a closed-loop integral method. The TP exhibits a pronounced spatial gradient in tropospheric NO2 columns, with overall levels substantially lower than those over South Asia. During the study period, NO2 in urban areas of the plateau increased, with the most pronounced rises observed in Lhasa and Chamdo. Flux analysis reveal that tropospheric NO2 transport across the TP displays a mirrored bidirectional flux structure, with the southwestern region dominated by external influx and the northeastern region by internal efflux. Compared with the southwestern boundary, the northeastern boundary exhibits higher net flux, and the rates of increase in both internal efflux and external influx are also greater. Random forest (RF) modeling combined with SHapley Additive exPlanations (SHAP) analysis further reveals a clear hierarchy among the drivers of cross-boundary NO2 transport at the southwestern boundary: meridional wind (v) dominates, followed by zonal wind (u), with temperature (T) contributing little. The primary effects are concentrated in the mid-to-upper troposphere (250–450 hPa), and v and u exhibit seasonal changes in their contribution directions, highlighting the vertically stratified and seasonally modulated control of circulation on pollutant transport across the plateau boundary. Overall, this study emphasizes the important role of the TP in cross-regional nitrogen oxide transport and provides a basis for understanding its potential impacts on regional atmospheric composition and environmental processes
- Article
(5481 KB) - Full-text XML
-
Supplement
(38685 KB) - BibTeX
- EndNote


Nitrogen dioxide (NO2) is a core component of nitrogen oxides () and one of the most widely concerned atmospheric pollutants globally (Han et al., 2020; Albertin et al., 2024). NO2 is a short-lived photochemical gas with highly efficient and complex reaction chains (De Foy et al., 2015; Liu and Shi, 2021). It can irritate the respiratory tract and increase the risk of asthma, cardiovascular diseases, and other conditions; therefore, it has been classified by the World Health Organization as a major environmental health hazard (Erickson et al., 2020; World Health Organization, 2021, 2024). In atmospheric chemistry, NO2 serves both as a precursor of ozone (O3) and secondary particulate matter (PM2.5), and as a key species in hydroxyl radical (OH) cycling, thereby profoundly influencing atmospheric oxidizing capacity and regional air quality (Atkinson, 2000; Lu et al., 2019a). Its emission, transformation, and transport processes are closely linked to the active nitrogen cycle, making it an important entry point for understanding human perturbations to biogeochemical cycles. Major sources include fossil fuel combustion, biomass burning, and certain agricultural and soil processes (Barten et al., 2020; Chi et al., 2021). NO2 and its precursors can also undergo long-range regional and transboundary transport, indirectly affecting air quality and human health in distant regions (Ma et al., 2019; Qi et al., 2023).
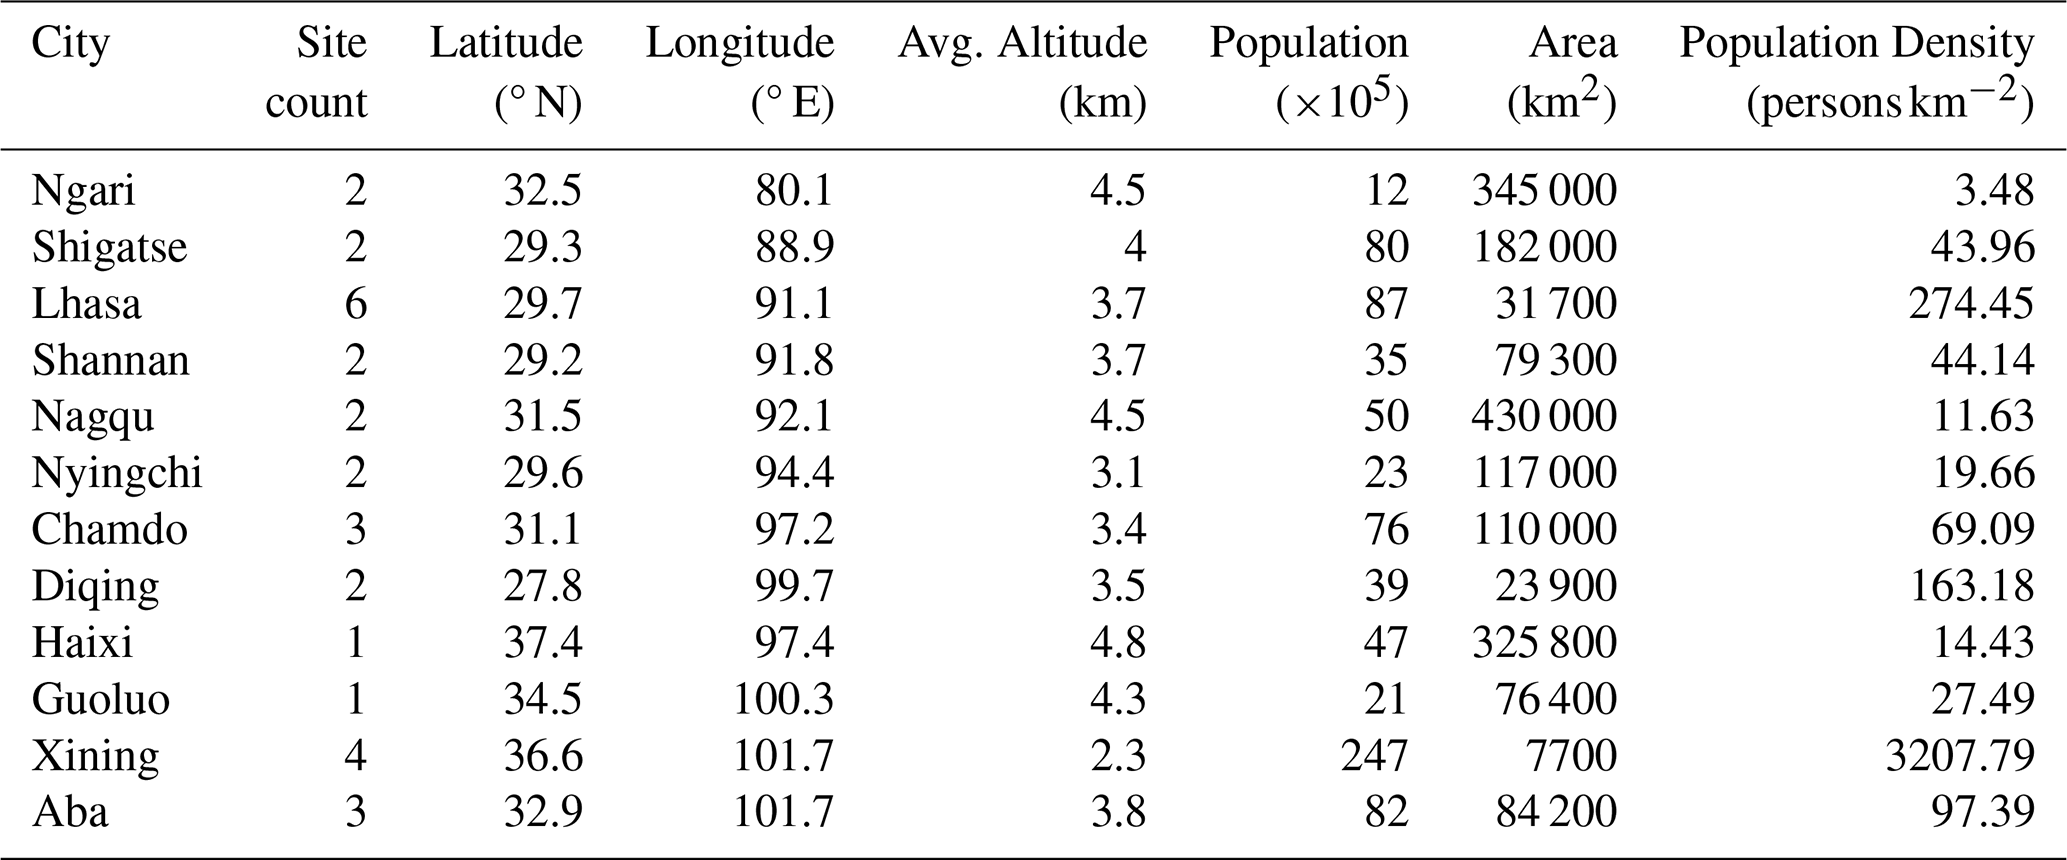
As the “Roof of the World”, the Tibetan Plateau (TP) has an average elevation exceeding 3000 m, and its harsh climate and complex geographic conditions severely constrain the construction and operation of ground-based observational networks (Şerban et al., 2024; Yu et al., 2025). According to the latest deployment by the China National Environmental Monitoring Center (CNEMC, http://www.cnemc.cn/en/, last access: 4 November 2025), only a few dozen monitoring sites are currently operated in TP. Taking Tibet as an example, six sites are located in Lhasa, with only two in each of the other cities, primarily distributed across urban areas, universities, and hospitals (see Fig. 1 and Table 1). Although some research teams have locally added monitoring sites, the limited spatial coverage and site density still result in substantial constraints on systematic assessment of the atmospheric environment over the TP. Previous studies largely relied on the limited ground-based monitoring or field sampling to analyze regional pollutants (Cong et al., 2015; Nieberding et al., 2020; Cheng et al., 2021). In recent years, the development of satellite observations (such as OMI and TROPOMI) and reanalysis models has provided reliable data support for studies of the global-scale distribution and cross-regional transport of atmospheric pollutants, significantly complementing the limitations of ground observations. These datasets have been increasingly used to investigate the spatiotemporal variability of pollutants over the TP and surrounding regions, and to assess their transport processes in combination with ground observations and model simulations (Wei et al., 2022; Pan et al., 2024).
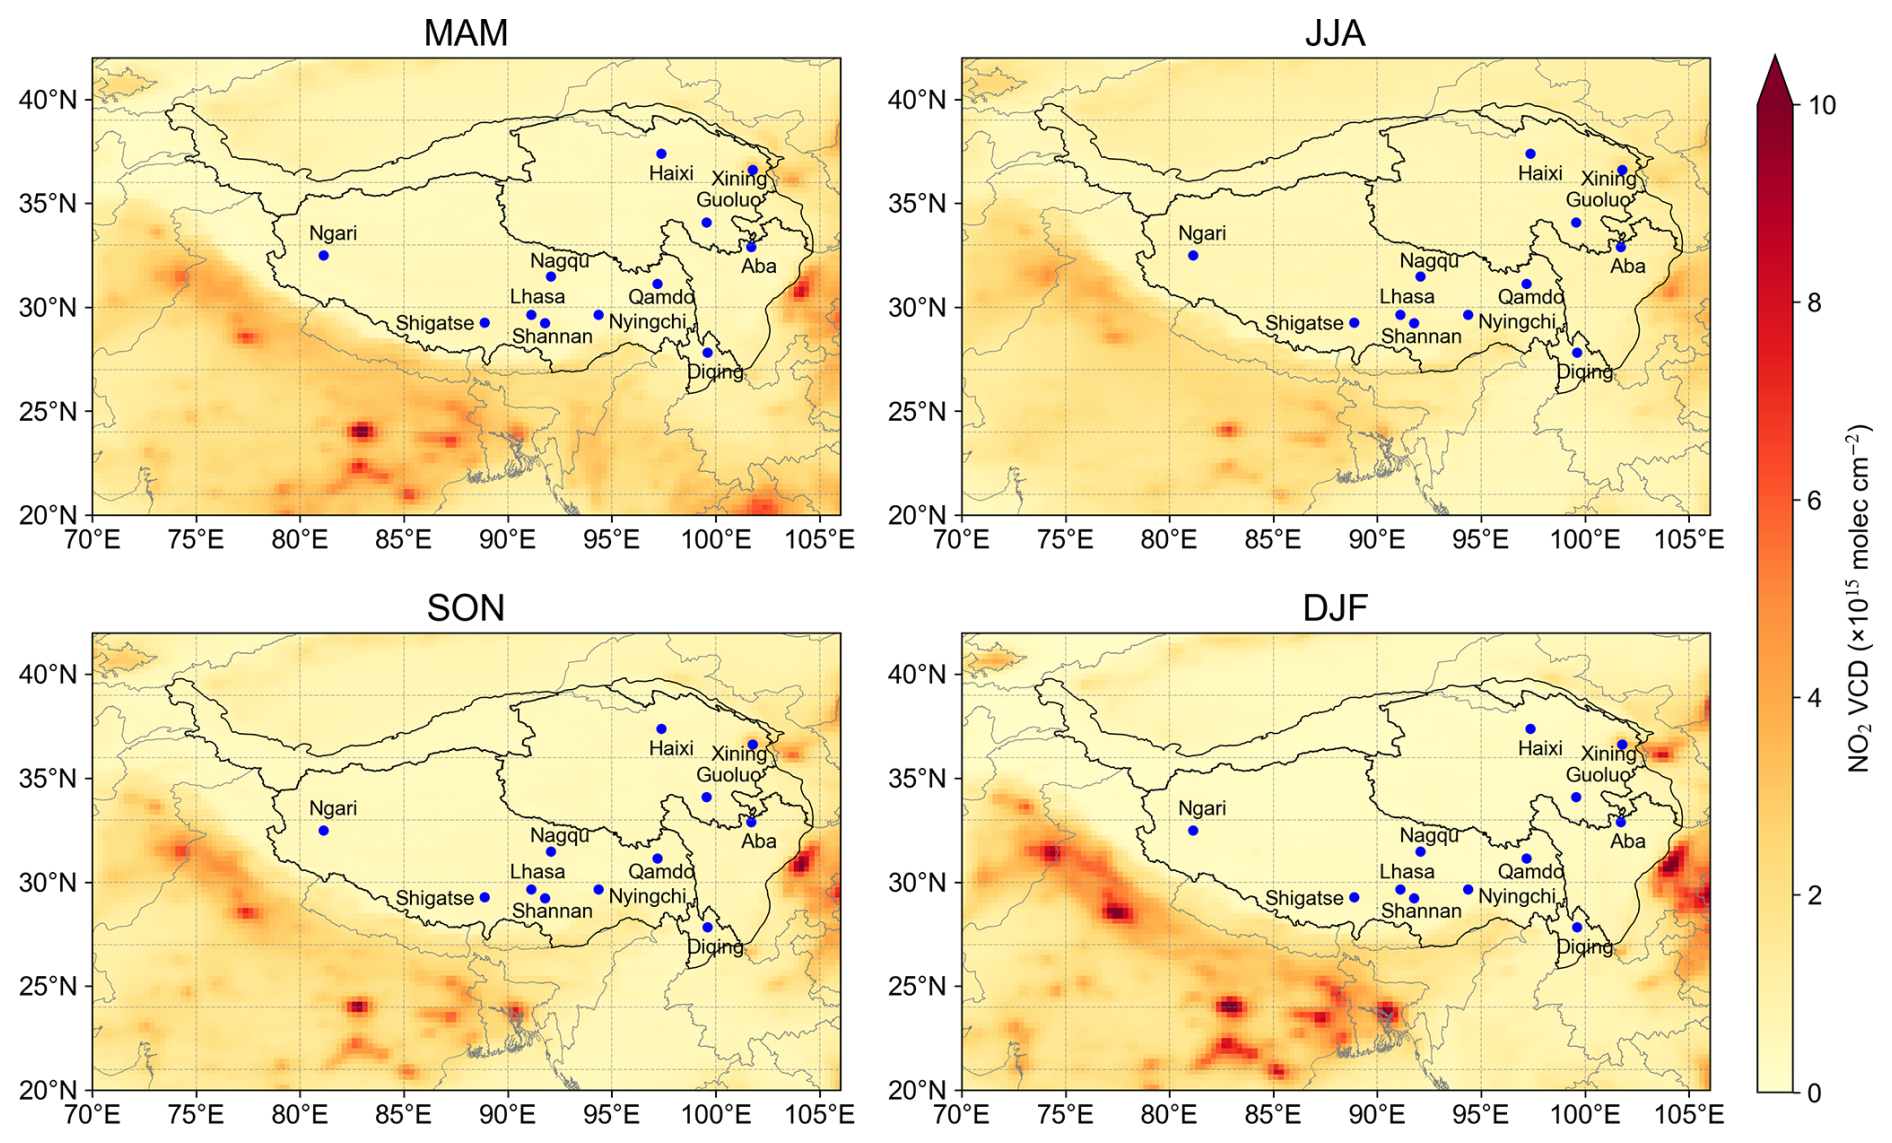
Figure 1Seasonal mean NO2 VCD for the TP (2005–2024), including representative cities within the plateau and adjacent areas, derived from OMI observations.
Table 1Geographical, demographic, and monitoring site information for major cities on the Tibetan Plateau. Population statistics are based on the 2020 nationwide population census issued by the National Bureau of Statistics of China.
Recent studies suggest that the region's low NO2 background levels do not necessarily reflect a pristine state, but instead arise from the combined influence of relatively low local emissions and regional-scale transport, highlighting the sensitivity of the TP to both local activities and large-scale circulation (Wang et al., 2024; Cheng et al., 2023; Zhang et al., 2025). Overall, local emissions across the TP are generally low, particularly in its western and northern sectors where populations and industrial activities are minimal. In contrast, cities such as Lhasa, Chamdo, and Shigatse exhibit discernible anthropogenic signals linked to economic development, traffic growth, winter heating, and seasonally intensified tourism (Duo et al., 2018; Jiang et al., 2023). Yet the more consequential driver of atmospheric variability is the unique position of TP at the intersection of South Asian monsoon flows and mid-latitude westerlies. These large-scale circulations can transport substantial amounts of NOx from surrounding source regions to the high terrain, influencing the regional oxidizing environment and enhancing nitrogen deposition (Liu et al., 2015; Wang et al., 2020). Such enhanced nitrogen inputs have broader implications beyond atmospheric chemistry. They may alter the biogeochemical functioning of high-elevation ecosystems by accelerating soil acidification, disrupting nutrient stoichiometry, and shifting the carbon–nitrogen balance in alpine grasslands and wetlands that are typically nitrogen-limited (Zong et al., 2016; Chen et al., 2025). Perturbations to the oxidizing capacity of the overlying atmosphere also modulate photochemical pathways and secondary aerosol formation, with potential consequences for radiative balance and cryosphere processes such as snow albedo (Li et al., 2021; Usha et al., 2022). In parallel, growing epidemiological evidence links NO2 exposure to adverse health outcomes, reinforcing the importance of understanding its spatial and temporal variability (Kasdagli et al., 2024; Sell et al., 2025). Collectively, these lines of evidence suggest that characterizing NO2 over the TP is central not only to constraining regional atmospheric chemistry and transboundary transport, but also to assessing ecosystem resilience and human–environmental vulnerability in this climatically sensitive region.
Based on previous studies quantifying CO transboundary fluxes using the closed-loop integration method, the TP exhibited the characteristics of unidirectional accumulation the eastward transport (Sun et al., 2025). If NO2 exhibits similar characteristics, its accumulation and potential export would extend its environmental impacts beyond the local scale, implying that the TP may play a more active and complex role in transboundary pollution transport than previously expected. Therefore, studying NO2 over the TP is critical not only for understanding regional air quality and ecological effects but also for revealing how large-scale circulation shapes the spatial patterns of pollutant transport. This unique geographical and dynamical context makes the region a key hub linking South Asia emissions with the East Asian atmosphere. To investigate this, we applied the same quantitative framework previously used for CO fluxes, combining the closed-loop integration method with trend regression models to estimate NO2 transport fluxes over the TP. Using OMI satellite-retrieved NO2 products from 2005–2024, along with ERA5 and GEOS-CF data, we constructed a long-term time series of NO2 transport fluxes, analyzing transboundary inputs, potential export, and altitude-dependent wind effects, while emphasizing the role of circulation at different atmospheric levels in shaping transport pathways.
2.1 Dataset description
The Ozone Monitoring Instrument (OMI) is a nadir-viewing spectrometer onboard NASA's Aura satellite, launched in July 2004, designed to measure backscattered solar radiation in the ultraviolet–visible spectral range (270–500 nm). The nadir spatial resolution of the observations is 13 km × 24 km, with an overpass time of approximately 13:45 local time (Levelt et al., 2006). This study employs the Level-3 OMNO2d dataset (NO2 cloud-screened total column and tropospheric column, version 3) at a resolution of 0.25° × 0.25°, covering the period from 2005–2024. The product groups and averages high-quality pixel-level retrievals onto fixed grids, retaining only observations with cloud fraction below 30 % to ensure retrieval accuracy. Since 2007, OMI has been affected by the “row anomaly”, which intensified after 2010, resulting in substantial pixel loss (Lamsal et al., 2021). To mitigate sampling bias and enhance spatiotemporal representativeness, the quality-assured retrievals were aggregated into monthly means on a 0.25°×0.25° grid, thereby reducing retrieval noise and improving the temporal continuity of the dataset.
The TROPOspheric Monitoring Instrument (TROPOMI), launched aboard the European Space Agency's Sentinel-5P satellite in October 2017, employs a push-broom imaging technique to capture sunlight scattered by the Earth's atmosphere across four spectral ranges: ultraviolet (UV), ultraviolet–visible (UV–VIS), near-infrared (NIR), and shortwave infrared (SWIR). The instrument provides near-daily global coverage with a native spatial resolution of approximately 3.5 km×5.5 km and a local overpass time around 13:30 LT. Tropospheric NO2 column densities are retrieved from solar backscattered radiance within the 405–465 nm interval of the UV–VIS band. In this study, the data were regridded onto a 0.25°×0.25° grid, and only retrievals with a quality assurance (qa_value) greater than 0.75 were retained to ensure accuracy. Considering the substantial improvements in retrieval algorithms and calibration after the early operation phase, TROPOMI data from 2019–2024 are used. Product version 2.2.0 was used for 2019–2023, and version 2.4.0 was used for 2024.
Meteorological fields were obtained from the ERA5 global reanalysis dataset produced by the European Centre for Medium-Range Weather Forecasts (ECMWF) under the Copernicus Climate Change Service (Hersbach et al., 2020). ERA5 provides hourly data at a horizontal resolution of 0.25°×0.25° with comprehensive vertical coverage across multiple atmospheric pressure levels. In this study, hourly pressure-level data from 2005–2024 were extracted and temporally matched to the overpass time of the OMI satellite (∼ 13:30 LT). The selected variables include zonal (u) and meridional (v) wind components, vertical velocity (w), and temperature (T). In addition, GEOS-CF products provided by NASA GMAO were used to characterize the vertical distribution of NO2. This dataset provides global three-dimensional atmospheric composition fields, including NO2 (Keller et al., 2021b).
NOx emission data are derived from the EDGAR v8.1 annual inventory, which is maintained by the Joint Research Centre (JRC) of the European Commission. The database is constructed on the basis of international statistical information and national emission inventory compilation rules. Following international guidelines for greenhouse gas inventories and pollutant emission accounting methodologies, it provides a systematic integration and annual estimation of global anthropogenic emission sources (Madrazo et al., 2018; Crippa et al., 2024). As one of the most widely used anthropogenic emission inventories worldwide, EDGAR offers long-term, continuous, and comparable emission estimates for multiple atmospheric pollutants. In addition to NOx, its coverage also includes carbon monoxide (CO), non-methane volatile organic compounds (NMVOC), ammonia (NH3), sulfur dioxide (SO2), and black carbon (BC), with emission sources spanning the energy, industry, agriculture, transportation, and biomass burning sectors (Upadhyay et al., 2020). The dataset has a spatial resolution of 0.1°×0.1°, enabling analyses of atmospheric pollution evolution at the regional scale. In this study, annual NOx emission data for the period 2005–2024 are selected, with a particular focus on emission changes in South Asia and the TP.
2.2 Methodology
Figure 2 presents a schematic overview of the analytical workflow, which encompasses the calculation of transport fluxes, the correction of ERA5 wind fields, and a diagnostic analysis using a Random Forest (RF) model to assess how circulation variations at different altitudes regulate NO2 transport into the TP. Details of the RF model configuration and interpretation are provided in a dedicated section below. The closed-loop integral method for flux computation (schematically illustrated in Fig. S1 in the Supplement), the regression model for trend analysis, and the procedures for wind-field correction and uncertainty assessment follow the framework established in our previous study on CO transport over the TP (Sun et al., 2025), with details provided in the Supplement. Fluxes calculated over Tibet, representing the core areas of TP, provide representative insights into plateau-scale NO2 transport.
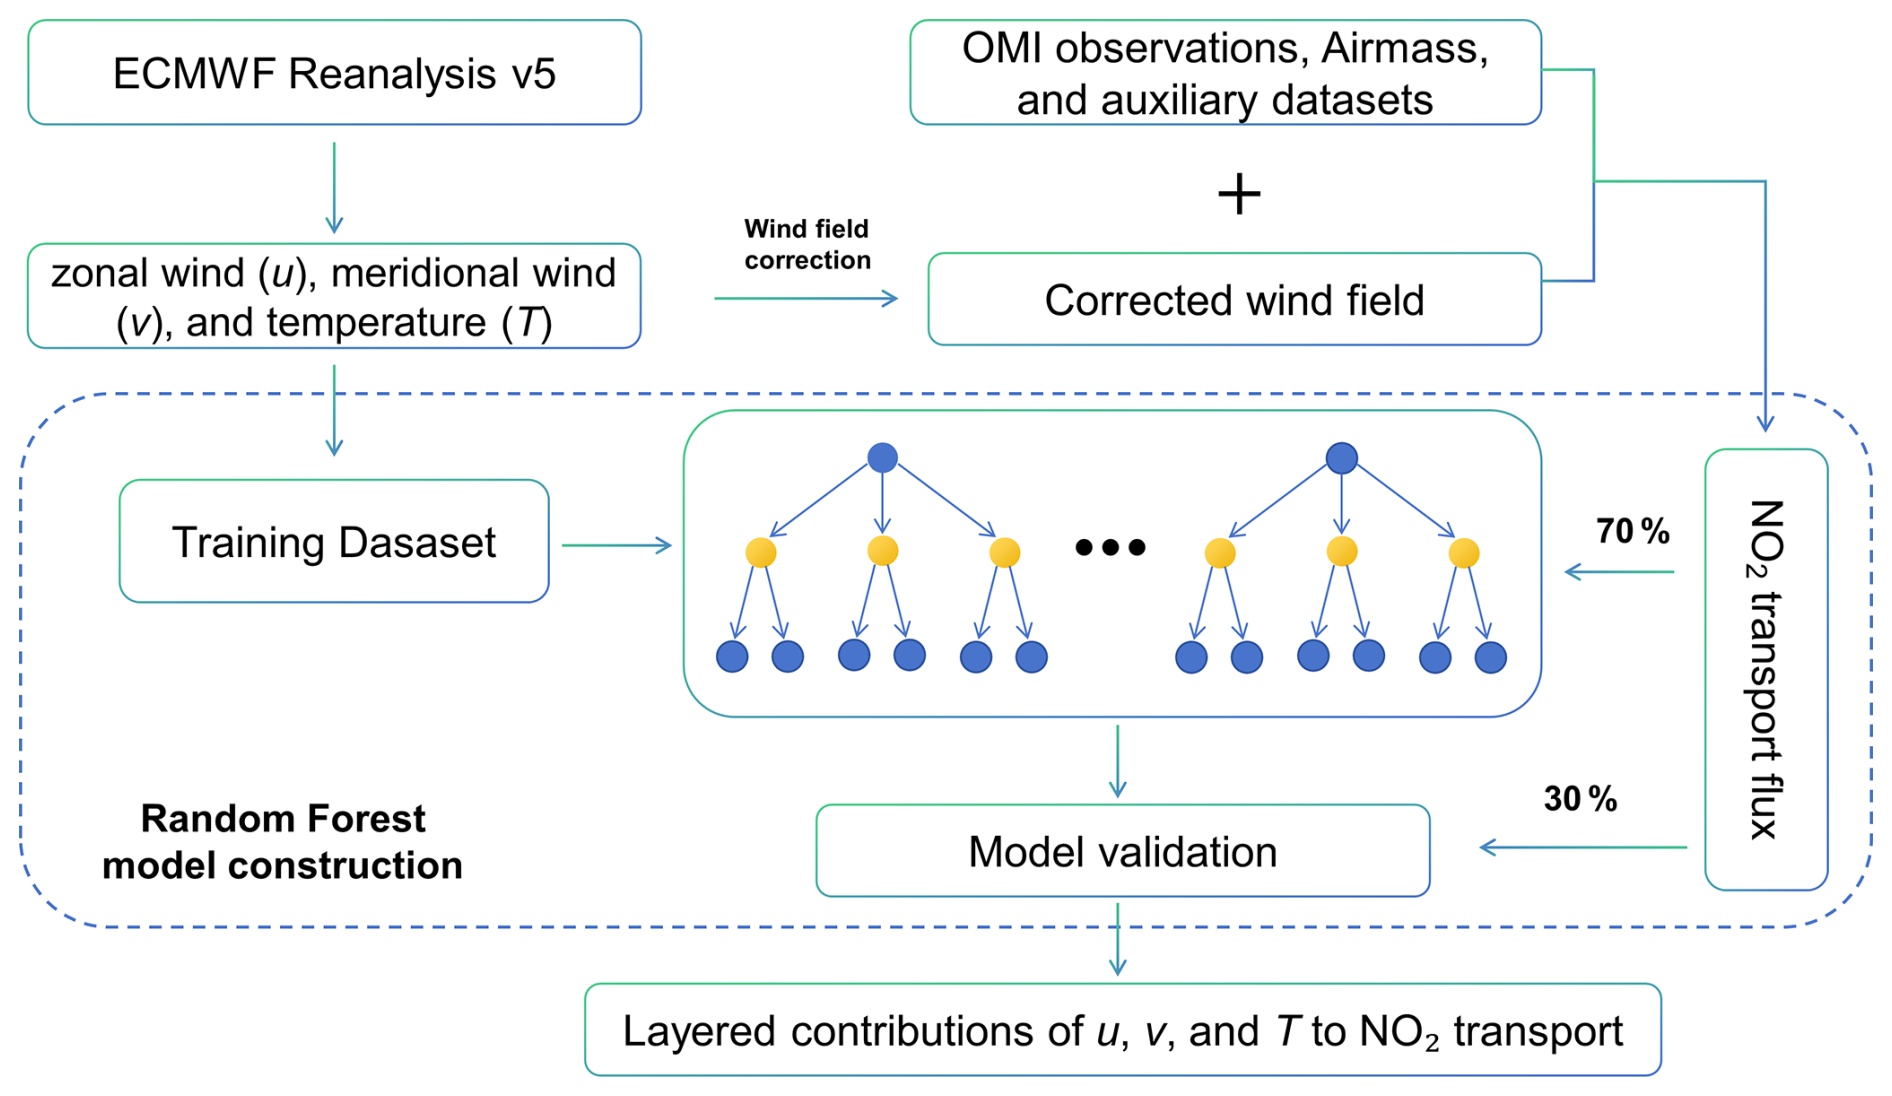
Figure 2Schematic framework illustrating the computation of NO2 transport fluxes, wind-field correction, and Random Forest–based diagnostic analysis.
2.2.1 Random Forest model
The transport processes from South Asia constitute the major external input pathway of boundary-layer NO2 and its precursors to the TP. This cross-border transport exhibits significant differences across pressure levels, with mid-to-upper tropospheric winds potentially playing a key role in long-range transport. To further assess the influence of u and v wind components at different pressure levels on NO2 transport fluxes over the TP, we employed a RF model, a robust non-linear ensemble learning method capable of capturing complex interactions among multilayer meteorological predictors (Breiman, 2001). RF has previously been used successfully in air quality and long-range transport studies to quantify the contributions of multiple atmospheric drivers (Kaminska, 2019; Yin et al., 2022; Wu et al., 2023). Here, the predictor variables used in this study were derived from the ERA5 reanalysis and included daily mean u and v winds and T within the 150–1000 hPa pressure range. A total of 22 pressure levels were considered, with a vertical resolution of 50 hPa between 150 and 900 and 25 hPa between 900 and 1000 hPa. Given the high elevation of the TP, pressure levels below the surface were excluded, and only atmospheric layers above the surface pressure were retained for model training. T was also included as a predictor variable because it may influence the atmospheric lifetime of NO2 by affecting photochemical reaction rates and chemical loss processes. The target variable was the NO2 transport flux across the southwestern boundary of the TP during the same period. To ensure strict temporal consistency, all meteorological variables and flux data were temporally aligned prior to model training.
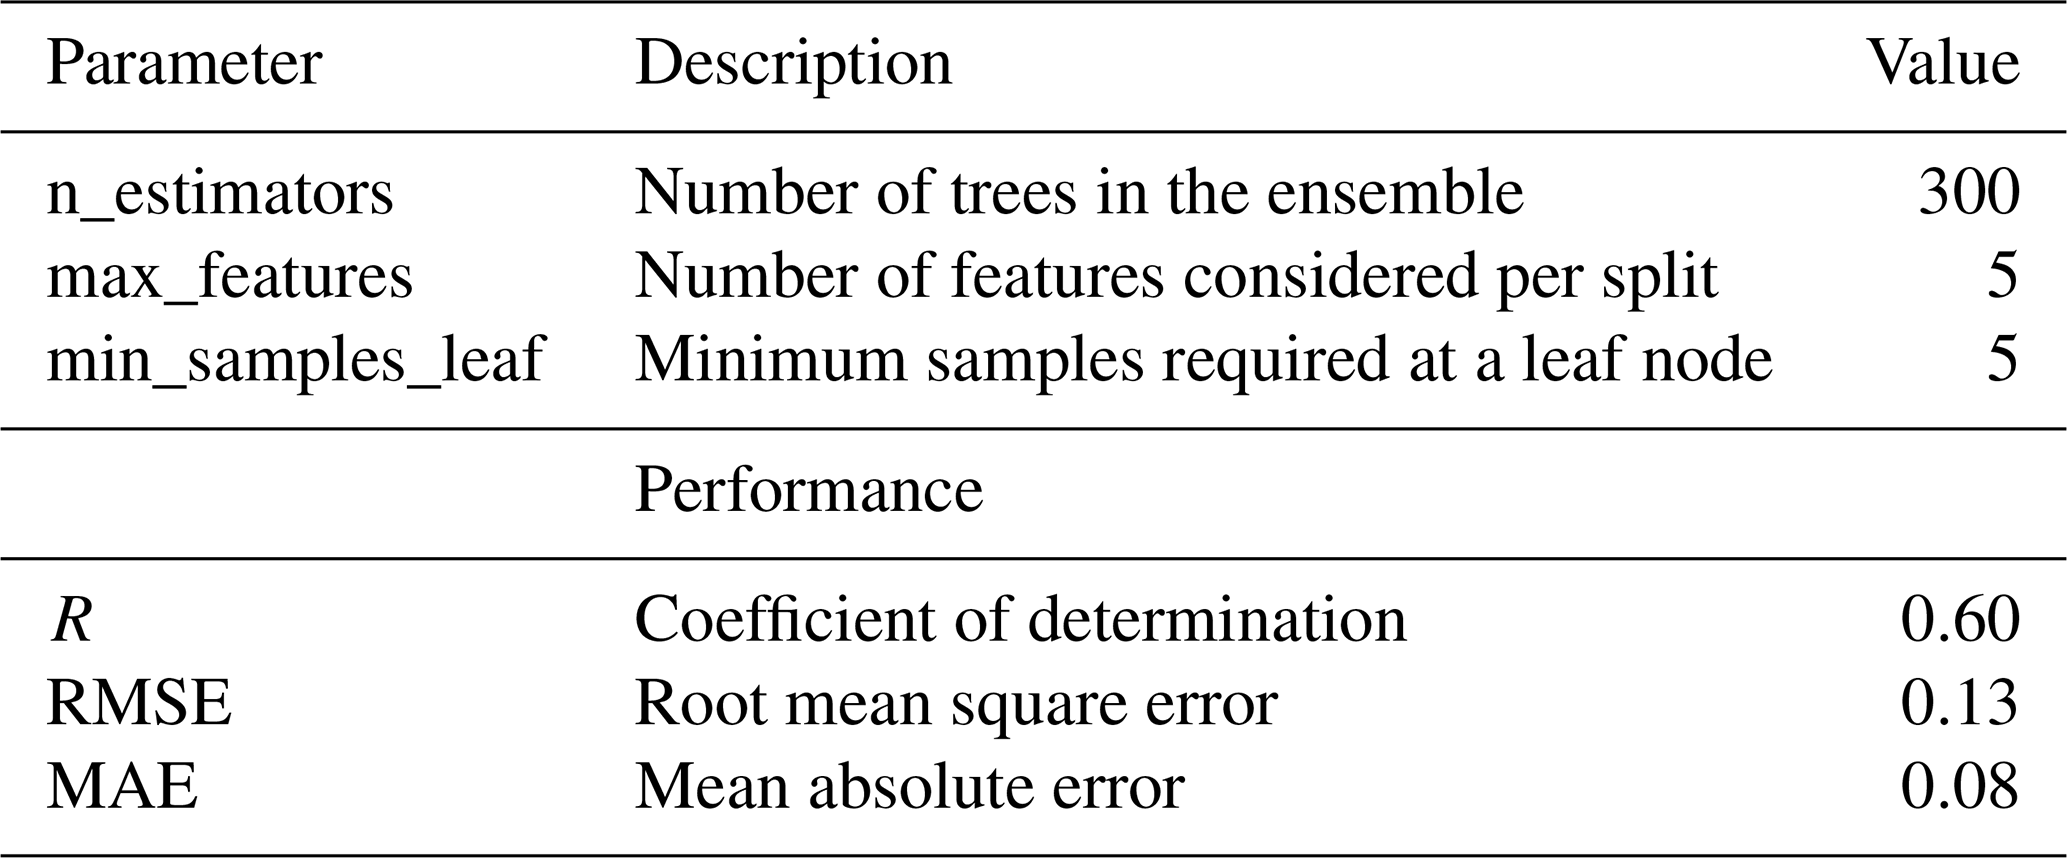
The RF model consists of hundreds of independent regression trees, built using the bagging strategy that randomly resamples both samples and features to generate sub-models, while selecting the optimal splitting variable at each node. This ensemble approach effectively reduces variance and mitigates overfitting (Breiman, 2001). To avoid temporal information leakage, the dataset was divided chronologically into a training set (70 %) and a test set (30 %); the former was used for model fitting, whereas the latter was used for independent validation on unseen data. The selection of hyperparameters followed existing studies and was systematically optimized using the GridSearchCV algorithm based on five-fold cross-validation (Vu et al., 2019; Shi et al., 2021). The tuning parameters included the number of base learners (n_estimators), maximum tree depth (max_depth), minimum number of samples required at leaf nodes (min_samples_leaf), and the number of features considered at each split (max_features). The optimized hyperparameters and corresponding model performance metrics are summarized in Table 2.
Table 2Model parameters and performance metrics of the RF model for NO2 transport flux.
On this basis, we employed the SHapely Additive exPlanations (SHAP) method to interpret the contribution of the predictor variables. SHAP, grounded in the Shapley value principle from cooperative game theory, enables quantification of the marginal impact of individual features on prediction outcomes within a nonlinear model framework and reveals how different atmospheric variables operate under varying temporal and spatial conditions (Lundberg and Lee, 2017). Unlike global feature importance metrics, SHAP values decompose each individual prediction, allowing identification of primary driving factors as well as interactions between features (Lundberg et al., 2020; Keller et al., 2021a). Accordingly, SHAP provides an interpretable and quantitative basis for the dynamical regulation of cross-regional transport, enabling intuitive visualization of the enhancing or weakening effects of different predictors on NO2 flux predictions.
2.2.2 Back-trajectories and potential source contribution function (PSCF)
Backward trajectories of near-surface air masses were simulated for seven prefecture-level cities on the TP to investigate potential source regions. To provide a representative analysis, we focused on a 5-year period (2018–2023) for trajectory simulations. Trajectories were examined for two dominant circulation regimes, the summer monsoon (June–September) and the winter westerly (December–April), traced backward for 48 h at hourly intervals using GDAS1 (1°×1°) meteorological data. The Potential Source Contribution Function (PSCF) was then applied to identify potential source regions contributing to high pollutant concentrations at receptor sites. For each trajectory, the residence time within each grid cell was calculated. ni,j denotes the total residence time of all trajectories in grid cell (i,j), while mi,j represents the residence time corresponding to pollutant concentrations exceeding the 75th percentile. The PSCF value is defined as:
which quantifies the conditional probability that air parcels passing through grid cell (i,j) are associated with high concentrations at the receptor (Perrone et al., 2018).
To reduce uncertainty in cells with low residence times, an empirical weighting function was applied following previous work (Polissar et al., 2001; Vratolis et al., 2023). Weighting factors of 0.25, 0.5, and 0.75 were assigned to cells with total residence times below the 25th, 50th, and 75th percentiles, respectively, thereby enhancing the statistical robustness of the PSCF results.
3.1 Variability of NO2 flux over the TP
Based on the method described in Sect. 2, the seasonal cumulative net flux of NO2 over the TP loop region was estimated for 2005–2024 and divided into four seasons: pre-monsoon (March–May), monsoon (June–September), post-monsoon (October–November), and winter (December–February). The corresponding gridded distributions are shown in Fig. 3. Overall, the spatial structure of boundary fluxes over the TP exhibits strong stability across seasons: the southwestern segment acts as the primary net influx region, whereas the northeastern segment consistently maintains a net efflux pattern, revealing clear spatial differentiation. The enhancement of fluxes over the southwestern segment is most pronounced during the monsoon season, indicating that cross-boundary transport is significantly strengthened by the monsoon circulation. This enhancement is manifested not only in increased flux magnitudes but also in a reorganization of the spatial structure: some boundary grid cells transition from net efflux in the non-monsoon period to net influx during the monsoon season, thereby forming a more continuous influx structure. In contrast, the northeastern segment shows greater seasonal stability in flux direction, consistently maintaining a net efflux pattern, with flux magnitudes increasing during certain seasons.
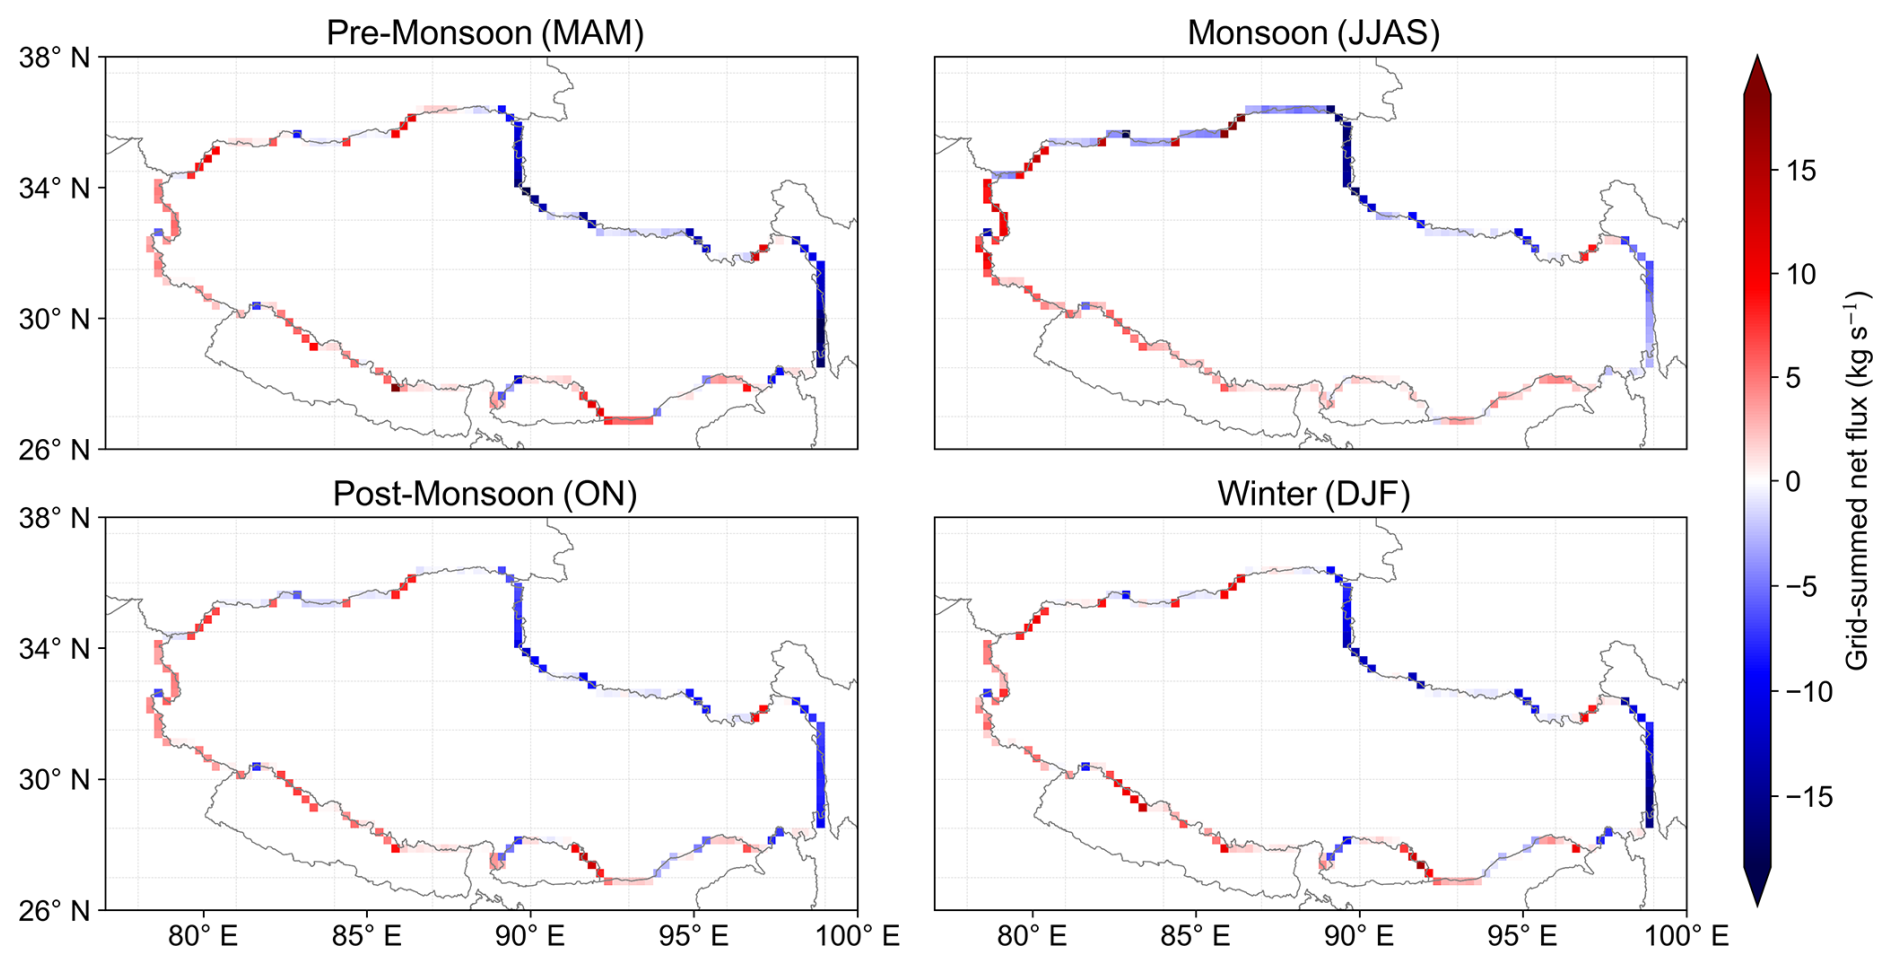
Figure 3Seasonal summed NO2 fluxes for each grid cell from 2005–2024, divided into four periods: pre-monsoon, monsoon, post-monsoon, and winter. Red indicates external influx, while blue represents internal efflux within TP. Positive and negative values denote influx and efflux, respectively, with color intensity reflecting flux magnitude.
Figure 4 shows the multi-year monthly variations in external influx and internal efflux of NO2 over the TP as a whole and over its southwestern and northeastern segments during 2005–2024. Overall, the external influx and internal efflux over the TP exhibit similar seasonal variations: both gradually decrease from spring onward, reach a minimum in July–August, and subsequently increase, peaking in October. The multi-year mean net flux is , indicating that the TP as a whole is in a weak net efflux state, with more pronounced efflux during winter. Clear differences are evident at the regional scale: the southwestern segment shows a multi-year mean net flux of 42.24 kg s−1, indicating a significant net influx, whereas the northeastern segment shows a multi-year mean net flux of and continuously functions as the dominant efflux pathway. Trend analysis (Fig. 5) indicates that during 2005–2024 both external influx and internal efflux over the TP as a whole and over its two boundary segments show significant increasing trends (p<0.01, ). However, the growth structures differ substantially between boundary segments. Over the TP as a whole, the growth rate of internal efflux () is slightly higher than that of external influx (), suggesting a strengthening of the net efflux tendency. In the southwestern segment, flux growth is primarily driven by enhanced external influx (), whereas the northeastern segment exhibits a more pronounced increase in internal efflux ().
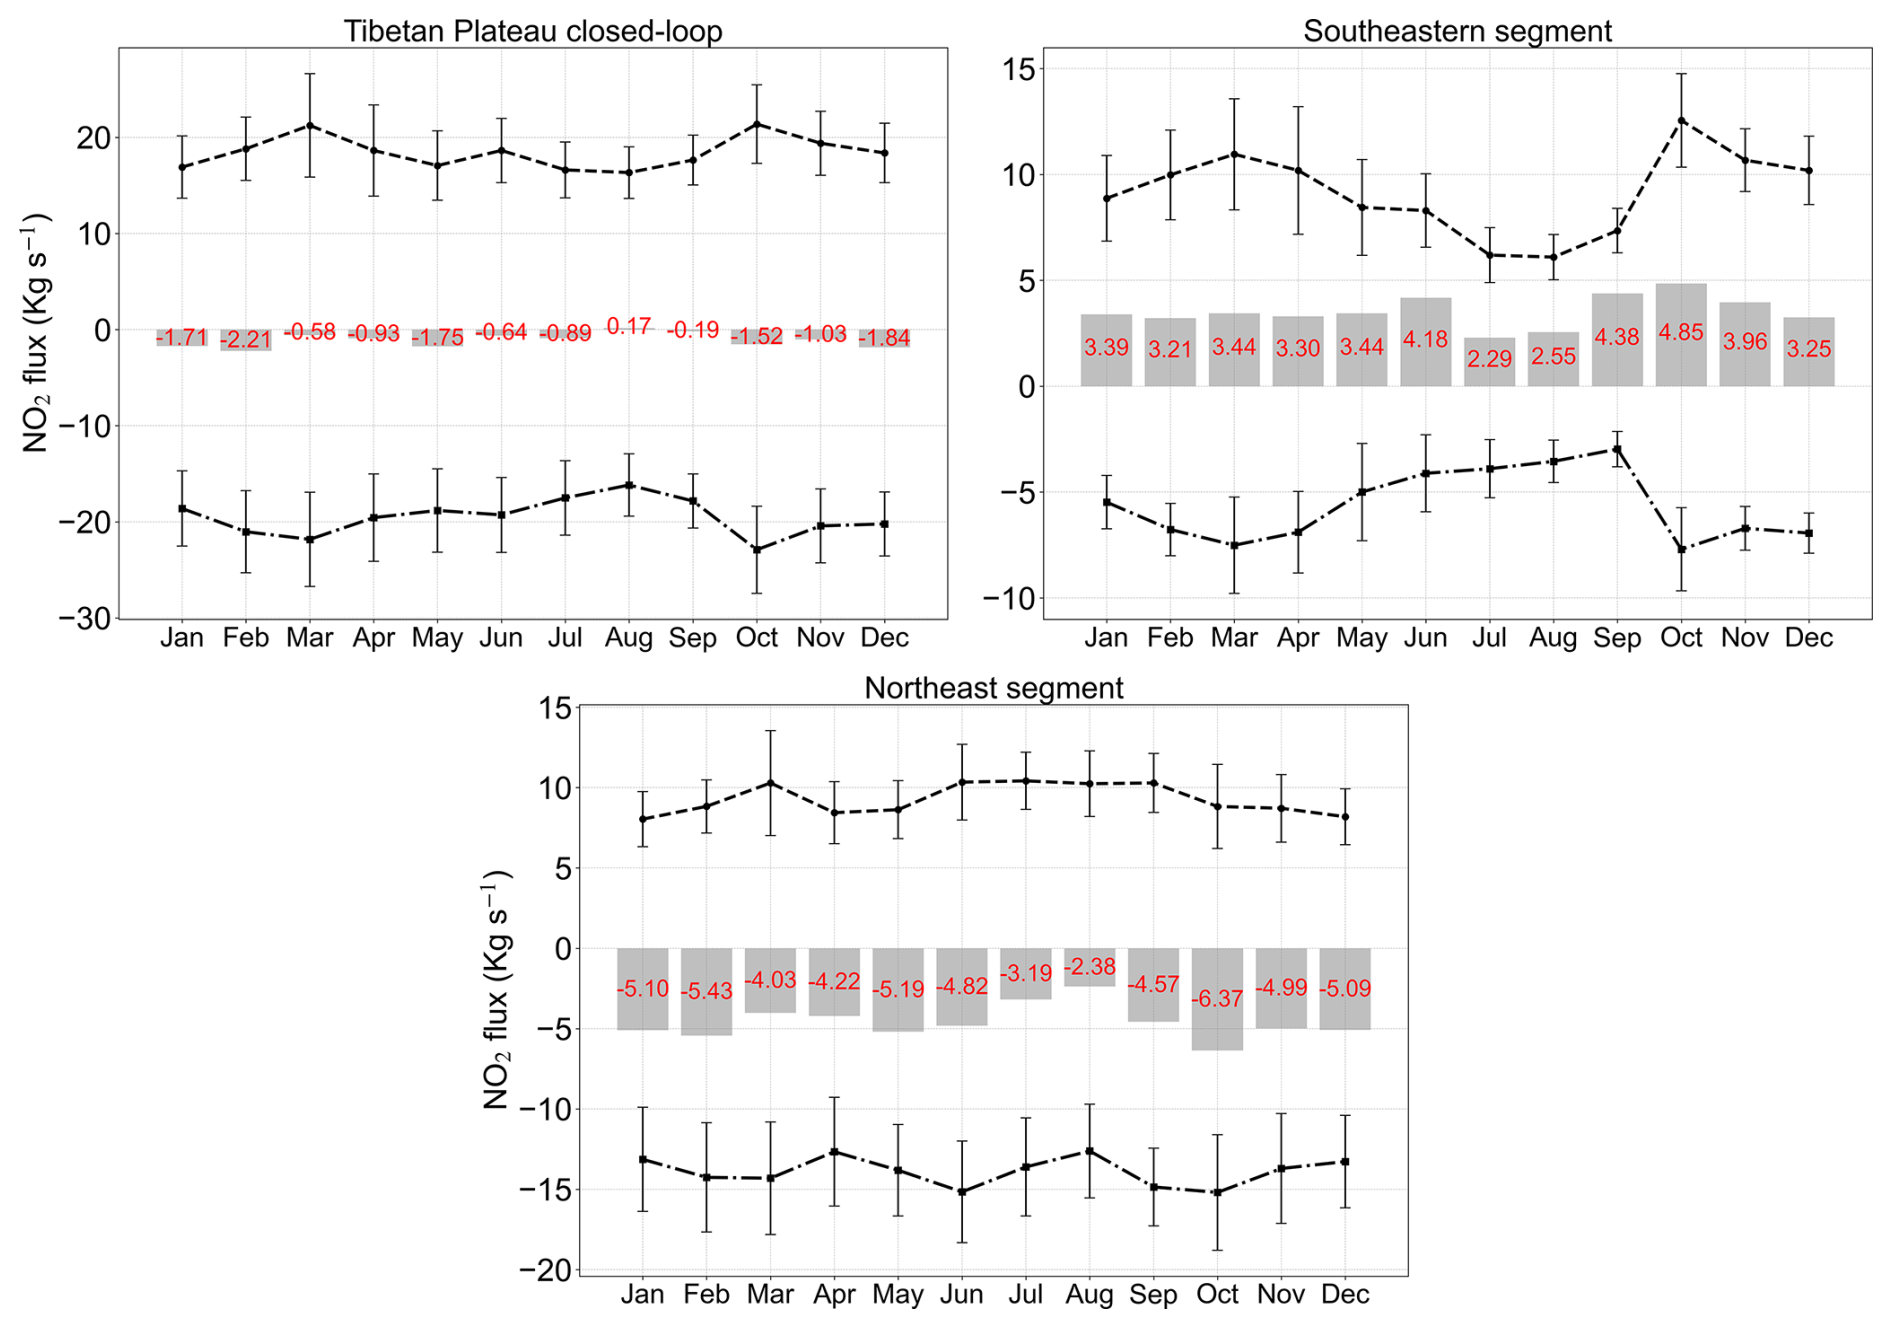
Figure 4Monthly NOx fluxes (±1σ) for external influx and internal efflux across the southwestern, northeastern, and enclosed boundary segments of the TP during 2005–2024. Gray bars indicate the net flux, with red numbers denoting the net flux values.
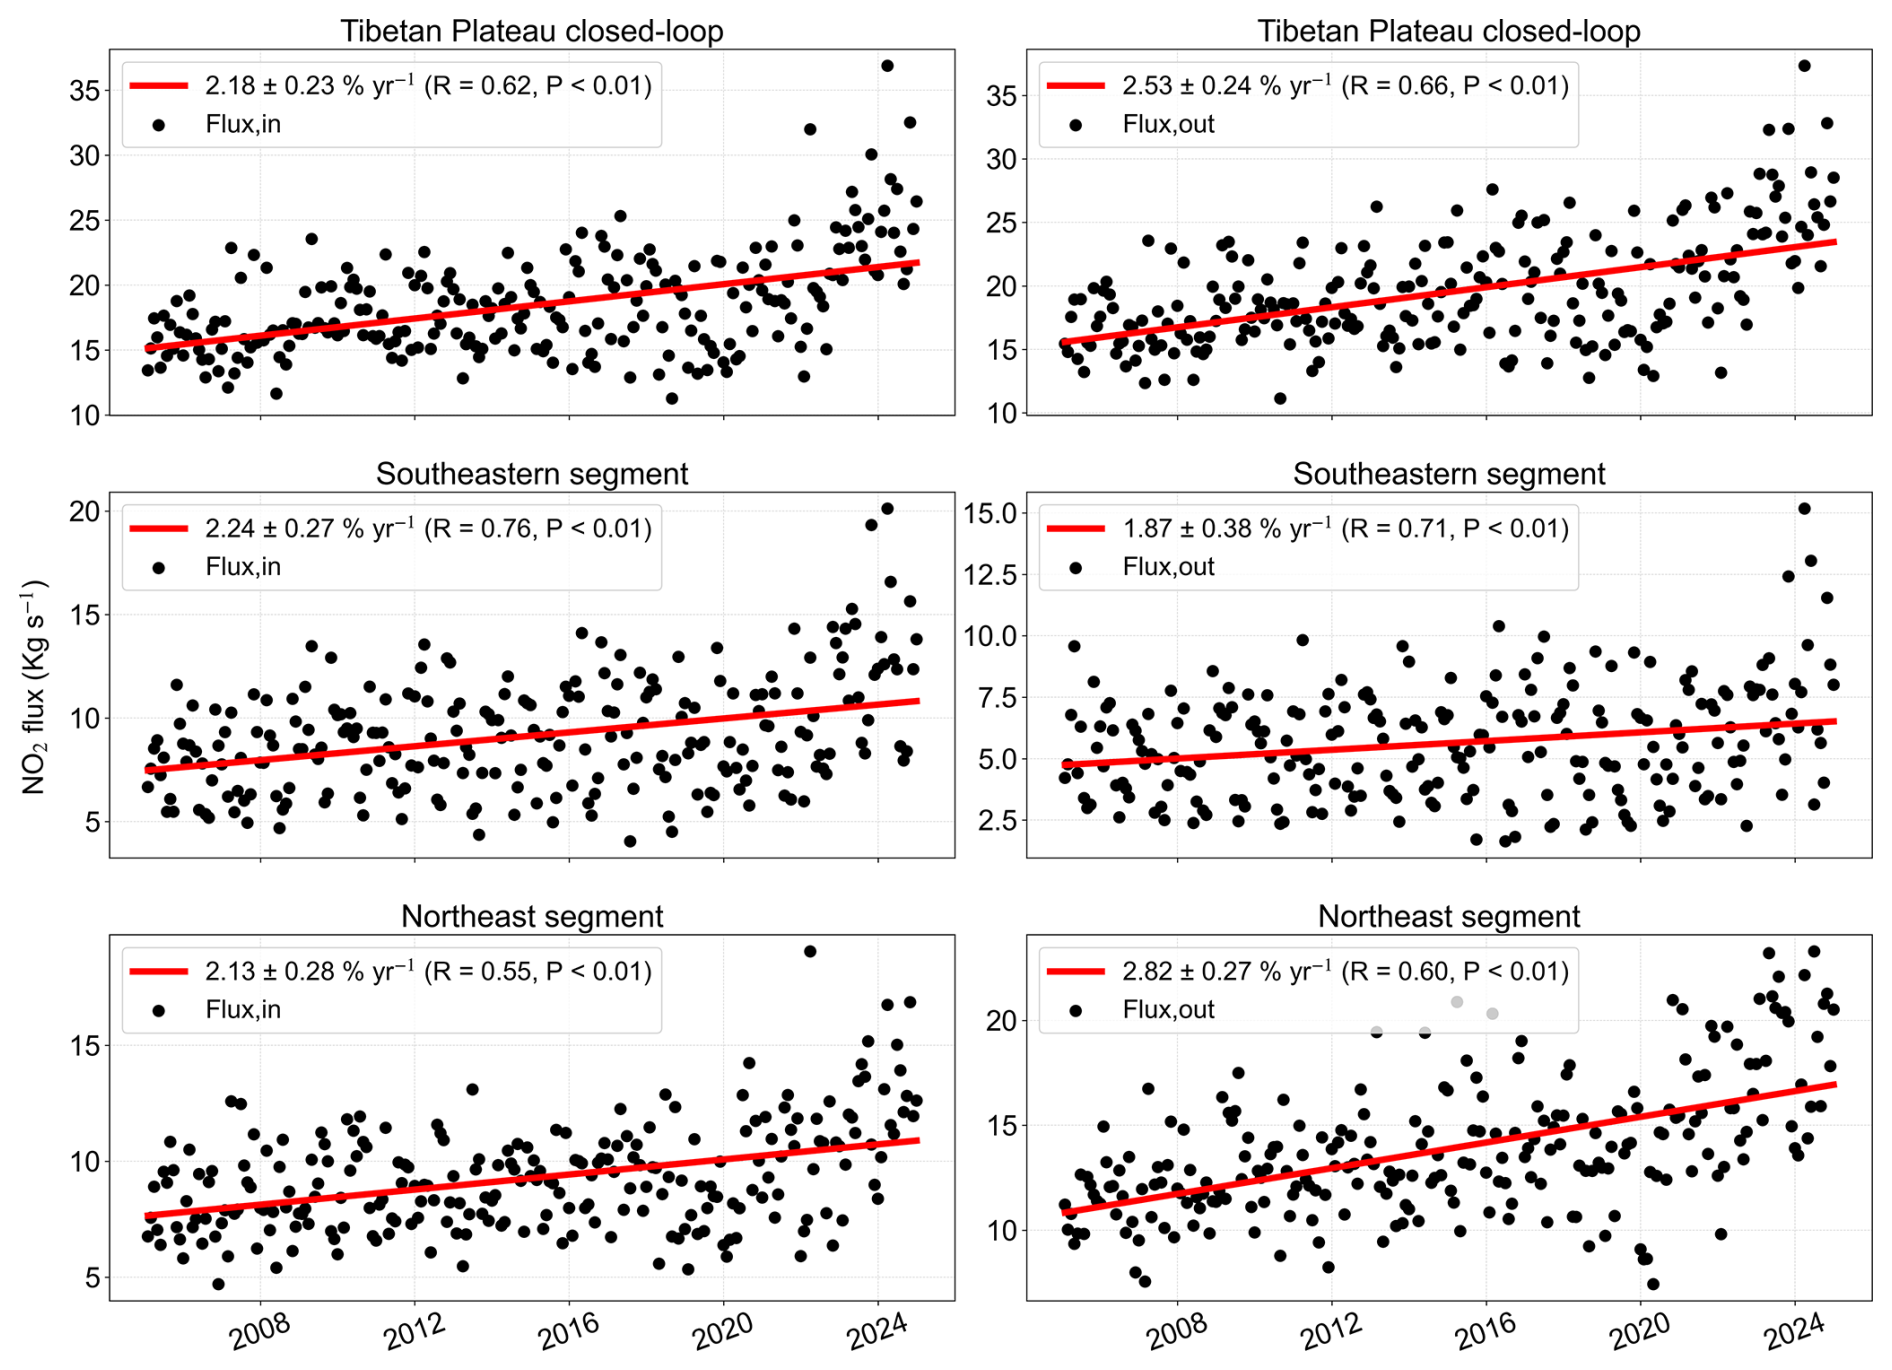
Figure 5Interannual evolution of NO2 influxes and effluxes across the closed-loop, southwestern, and northeastern boundaries of the plateau (2005–2024), based on biweekly means. Black points represent NO2 fluxes, and the red line denotes the long-term trend fitted using a trend model.
Taken together, the seasonal structures and long-term trends indicate that the evolution of boundary NO2 fluxes over the TP exhibits a structurally differentiated pattern, reflecting the coupled response of regional emission changes and large-scale circulation modulation. The net efflux characteristic reflects the combined influence of regional source–sink structures and dynamical transport processes. Enhanced internal NOx emissions and secondary chemical production increase the regional NO2 burden. Although photochemical transformation and deposition processes continuously contribute to removal, their integrated removal strength may not fully offset the contribution from internal sources. In addition, the relatively limited chemical lifetime of NO2 may allow chemical transformation and dynamical transport to become coupled on comparable timescales, thereby influencing the budget structure of boundary fluxes. In terms of regional differences, the southwestern segment serves as a key pathway for air masses entering the TP from South Asia. Meteorological conditions there are more favorable for transporting air masses into the interior of the plateau. The growth in fluxes over this region is consistent with changes in NOx emissions in South Asia and their long-term influence on cross-boundary transport intensity (Kurokawa and Ohara, 2020; Ding et al., 2022), resulting in flux changes that are mainly expressed as amplification at the influx side, while growth on the efflux side remains relatively moderate. By contrast, the northeastern segment exhibits a larger increase in internal efflux, suggesting that it may be more sensitive to changes in emissions within the TP. As an important dynamical transition zone between the high-elevation core of the plateau and the lower-elevation regions to the east, this region is controlled by the mid-latitude westerlies and its transport structure shows a strong downstream orientation. When internal NO2 levels increase, the strengthened westerly flow may enhance advective transport, thereby increasing efflux toward downstream regions. These differences indicate that flux variations along different TP boundary segments are not driven by a single emission or dynamical factor, but rather represent the combined outcome of emission evolution, chemical processes, and circulation structure acting in concert.
3.2 Potential source regions and transport pathways
The NO2 potential source regions and the 48 h backward-trajectory clusters for seven TP cities during the summer monsoon (June–August) and the winter westerly period (December–February) from 2018–2022 are shown in Figs. 6 and S2–S3. It reveals the pronounced differences in pollutant transport pathways and source region characteristics under these two typical circulation regimes, as well as the distinct seasonal responses of individual cities. Overall, cross-border inputs of atmospheric pollutants to the TP are primarily governed by the alternating influences of the summer monsoon and winter westerlies, with source regions and transport pathways exhibiting significant seasonal variability (Qian et al., 2011; Dong et al., 2023). PSCF results indicate that potential source regions for TP cities are mainly located in northern South Asia, while during seasonal transitions, areas controlled by the westerly belt, including Central Asia and its surroundings, also emerge as important input sources.
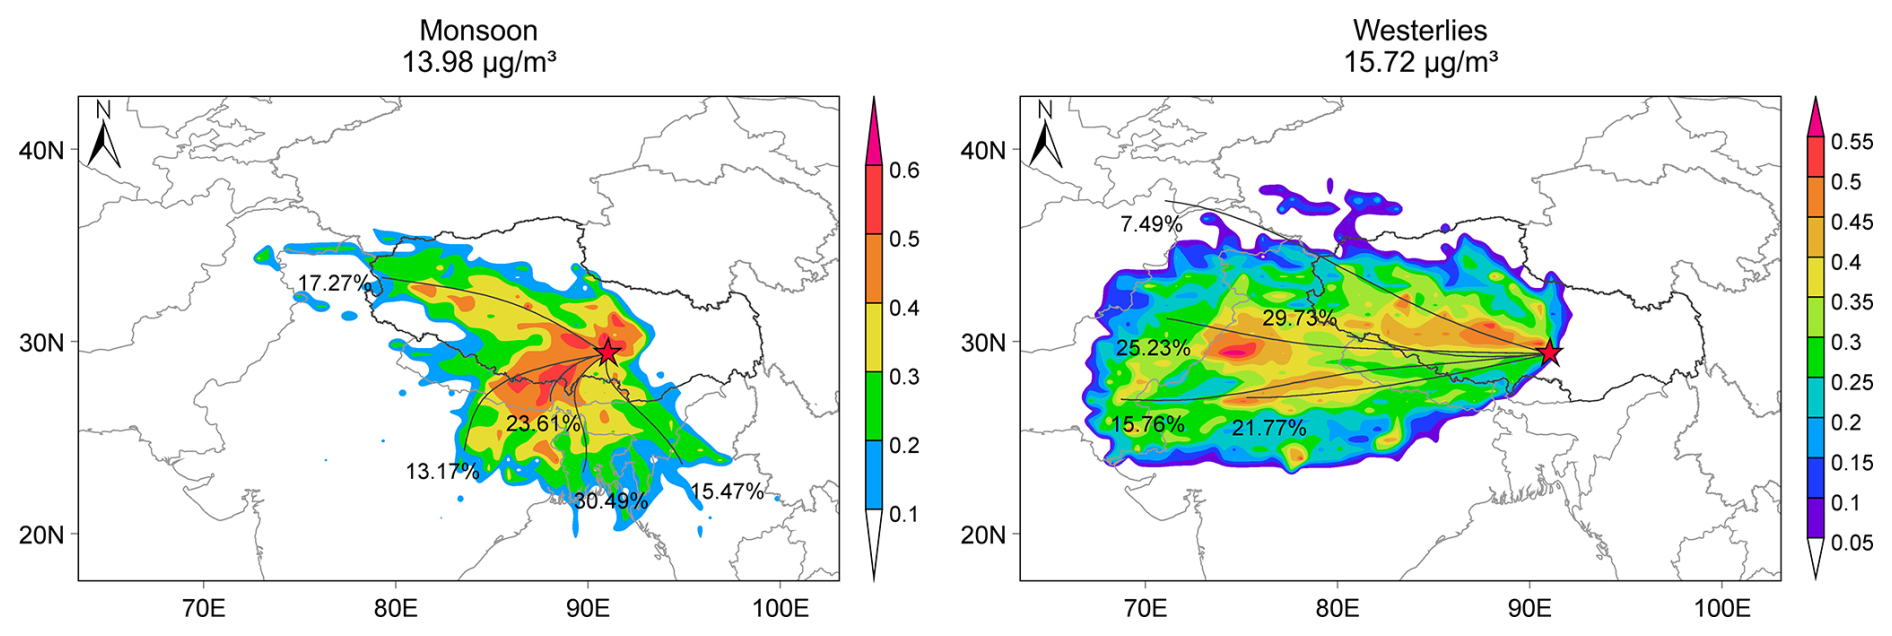
Figure 6PSCF-derived potential source regions and clustered back trajectories for Lhasa, categorized into the monsoon and westerly periods.
During the summer monsoon-dominated period, PSCF results show that cities along the southeastern margin of the TP are particularly sensitive to South Asian inputs, with source regions exhibiting high PSCF values concentrated in northern South Asia, including Nepal, northern India, and the northern Bay of Bengal. Driven by prevailing monsoon flows, pollutants are transported across the Himalayas into the southeastern TP. Cities such as Nyingchi, Shannan, and Lhasa display pronounced regions with high PSCF values, associated with South Asian inputs, with 23.61 % of air mass trajectories arriving in Lhasa originating from these regions; Nyingchi and Shannan similarly exhibit notable South Asian input signatures. Overall, pollutant inputs during the summer monsoon are characterized by shorter pathways and concentrated intensity, suggesting relatively strong source contributions to southeastern margin cities.
In contrast, during the winter westerly period, potential source regions shift markedly to the north and west, with high PSCF values mainly distributed over the Tarim Basin, the Central Asian industrial corridor, and the Iranian Plateau. Under the control of the westerly belt, pollutants can be transported over long distances from Central Asia and surrounding areas to the TP, forming a west-to-east input channel traversing Central Asia to the TP. These pathways are longer, more spatially diffuse, and capable of sustaining long-range transport, reflecting the well-established role of winter westerlies in distributing pollutants across continental-scale distances. Northwestern cities such as Ngari and Shigatse display high PSCF values over a broad, dispersed region, consistent with their exposure to the westerly transport system. Their source areas extend far into Central Asia, and the associated trajectories are markedly longer compared to the summer monsoon period. Conversely, southeastern cities (e.g., Nyingchi and Chamdo) show weaker wintertime connectivity to external sources, reflecting the decline of monsoonal external influx and the shielding effect of complex topography.
These contrasting seasonal signatures indicate that while monsoonal flows provide a direct and efficient conduit for South Asian pollutants into the southeastern TP, the winter westerlies expand the geographical footprint of contributing regions and enhance the potential for long-range transport into the northern and western TP (Sun et al., 2021; Kong et al., 2023; Huang et al., 2023). The unique position of TP at the interface between the monsoon and westerly systems therefore shapes a dual-source, dual-pathway transport structure, positioning the TP as a convergence and transition zone within the broader Eurasian atmospheric circulation. This distinct setting underscores the pivotal role over TP as both a receptor of cross-border pollution and a key node in the global atmospheric transport network.
3.3 Local emissions and regional transport of NO2 over the TP
Over the past 2 decades (2005–2024), we divided the NO2 column records into four consecutive 5-year groups, with the corresponding changes shown in Figs. 7 and S4. Across these intervals, tropospheric NO2 columns over South Asia and the TP have exhibited distinctly different spatiotemporal evolution patterns, which may be partly influenced by changes in emission structures and interregional transport (Figs. 8 and S5). In South Asia, NO2 levels have been persistently elevated, with the Indo-Gangetic Plain constituting the dominant hotspot. During the mid-2000s, enhancements were largely confined to Delhi, Punjab, Haryana, and Uttar Pradesh, but subsequent phases of rapid industrialization and vehicle expansion extended the high-pollution belt across eastern provinces such as Jharkhand, Chhattisgarh, and Odisha (Kurokawa and Ohara, 2020; Ding et al., 2022). By 2015–2019, limited city-level measures such as vehicle restrictions in Delhi, temporary plant shutdowns, and the promotion of compressed natural gas proved insufficient to offset rapid urban and industrial growth, resulting in further spatial expansion of NO2 hotspots (Choudhary et al., 2021). Only after the launch of the National Clean Air Program in 2019 did high-value regions in the upper Indo-Gangetic Plain show signs of contraction, although industrial states in the east continued to rise, highlighting the uneven effectiveness of interventions (Ganguly et al., 2020; Gopikrishnan and Kuttippurath, 2024; Guttikunda et al., 2025).
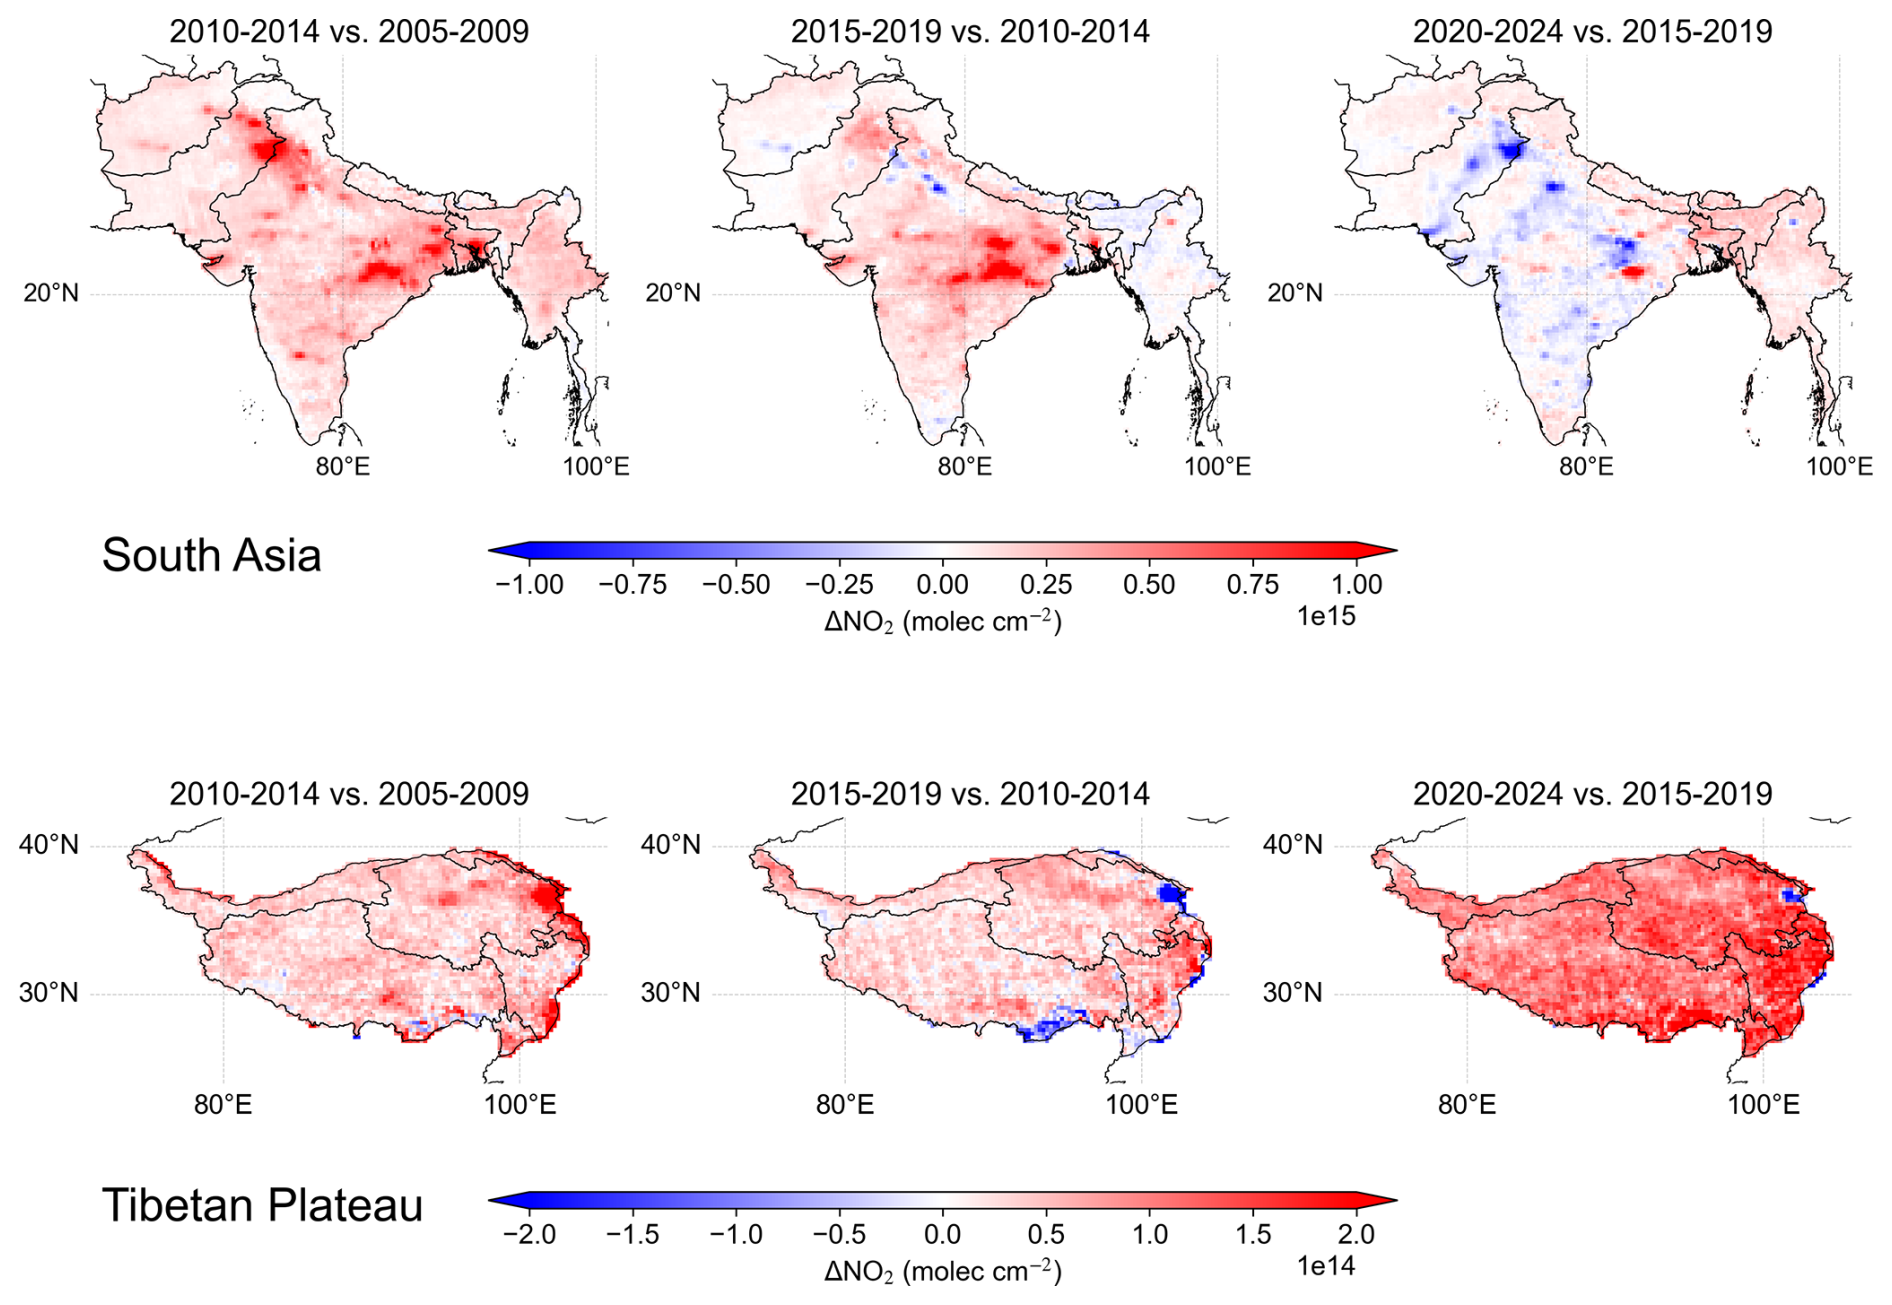
Figure 7Five-year grouped changes in NO2 column concentrations over South Asia and the TP from 2005–2024.
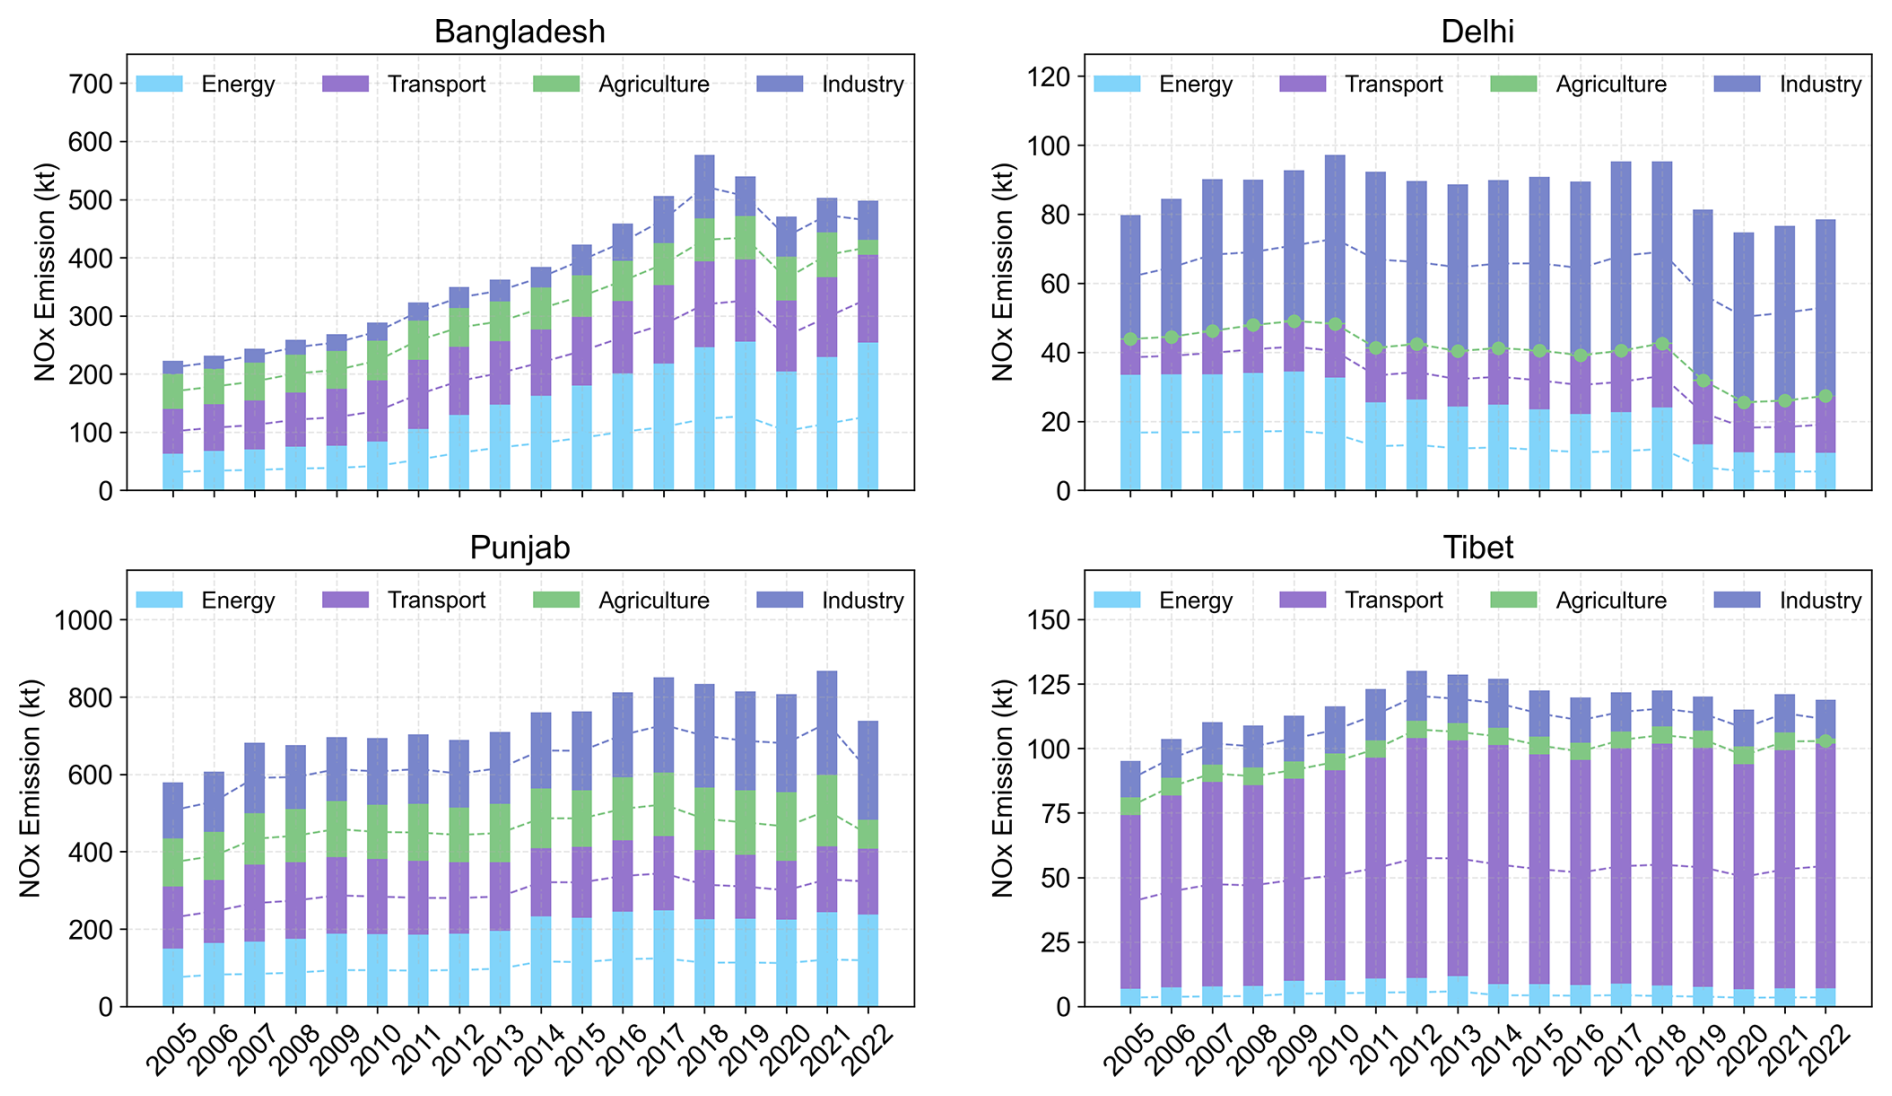
Figure 8Annual NOx emissions by sector (energy, transport, agriculture, and industry) across Bangladesh, Delhi, Punjab (Pakistan), and Tibet, derived from EDGAR and aggregated over all pixels within administrative boundaries.
In contrast, the TP, despite being one of the cleanest regions over Asia, has experienced a steady rise in NO2 over the same period. Since 2005, cities along the southern margin of the TP such as Lhasa, Shannan and Shigatse have experienced the most pronounced increases, with Lhasa developing a relatively stable high-concentration belt during 2015–2019. Although the growth in local emissions indeed constitutes the primary source of the NO2 increase over the TP, the rapid rise in traffic volume, large-scale tourism activities (including the operation of numerous sightseeing buses), wintertime coal heating, and energy-intensive urban expansion have jointly elevated local NOx emissions, especially during periods of rapid increases in vehicle ownership and construction activity (Cheng et al., 2018). The EDGAR emissions inventory corroborates this pattern, indicating that the transportation sector has become the dominant source of NO2 emissions on the TP, exceeding contributions from the energy and industrial sectors and thereby establishing a structural basis for the long-term accumulation of NO2. However, even after fully accounting for these local emission increases, cross-border transport from South Asia and surrounding regions still constitutes an important and persistent external driving factor.
The juxtaposition of these trends highlights a fundamental asymmetry. South Asia functions as a high-emission source region shaped by industrial cycles and uneven mitigation, whereas the TP remains a low-background but highly sensitive receptor. Temporal comparisons underscore this contrast: periods of South Asian expansion in the 2010s coincided with accelerated NO2 growth along the southern slopes over TP. This linkage arises from the combined influence of large-scale circulation and local structural factors. Seasonal transport associated with monsoonal flow and westerlies provides sustained external inputs, which interact with emissions from heating, transport, and expanding urban activities to amplify NO2 accumulation in key valleys and basins. In Lhasa, for example, infrastructure expansion and rapid vehicle growth associated with China's Western Development Strategy created localized pollution hotspots that were further enhanced by transboundary external influx (Tang et al., 2022). Consequently, even modest local emissions may be magnified within a receptor environment strongly modulated by regional transport. Policy divergence further accentuates this contrast. In India, mitigation efforts remain fragmented and city-focused, producing spatially heterogeneous outcomes and enabling emissions to shift from heavily regulated cores to peripheral industrial states. By contrast, systematic framework over China under the “13th Five-Year Plan” implemented coordinated measures across energy, industry, and transport, including clean heating promotion, power sector optimization, and electric vehicle deployment (NDRC, 2016). On the TP, these measures have begun to displace coal with electricity and reduce near-surface emissions in cities such as Lhasa and Shigatse. Nevertheless, the transition remains incomplete: grid integration of hydropower and solar is limited by terrain and infrastructure constraints, and many remote settlements remain dependent on coal or biomass, preserving a fossil-fuel baseline that slows the transition toward sustained NO2 reductions (Xing et al., 2024).
3.4 Wind Layer Regulation of NO2 Transport
We used a random forest regression model combined with SHAP analysis to quantify the effects of meteorological variables at different altitude levels on cross-boundary NO2 transport (Figs. 9 and S6–S7). Higher SHAP values indicate stronger positive contributions of the corresponding variables and altitude levels to the predicted NO2 flux.
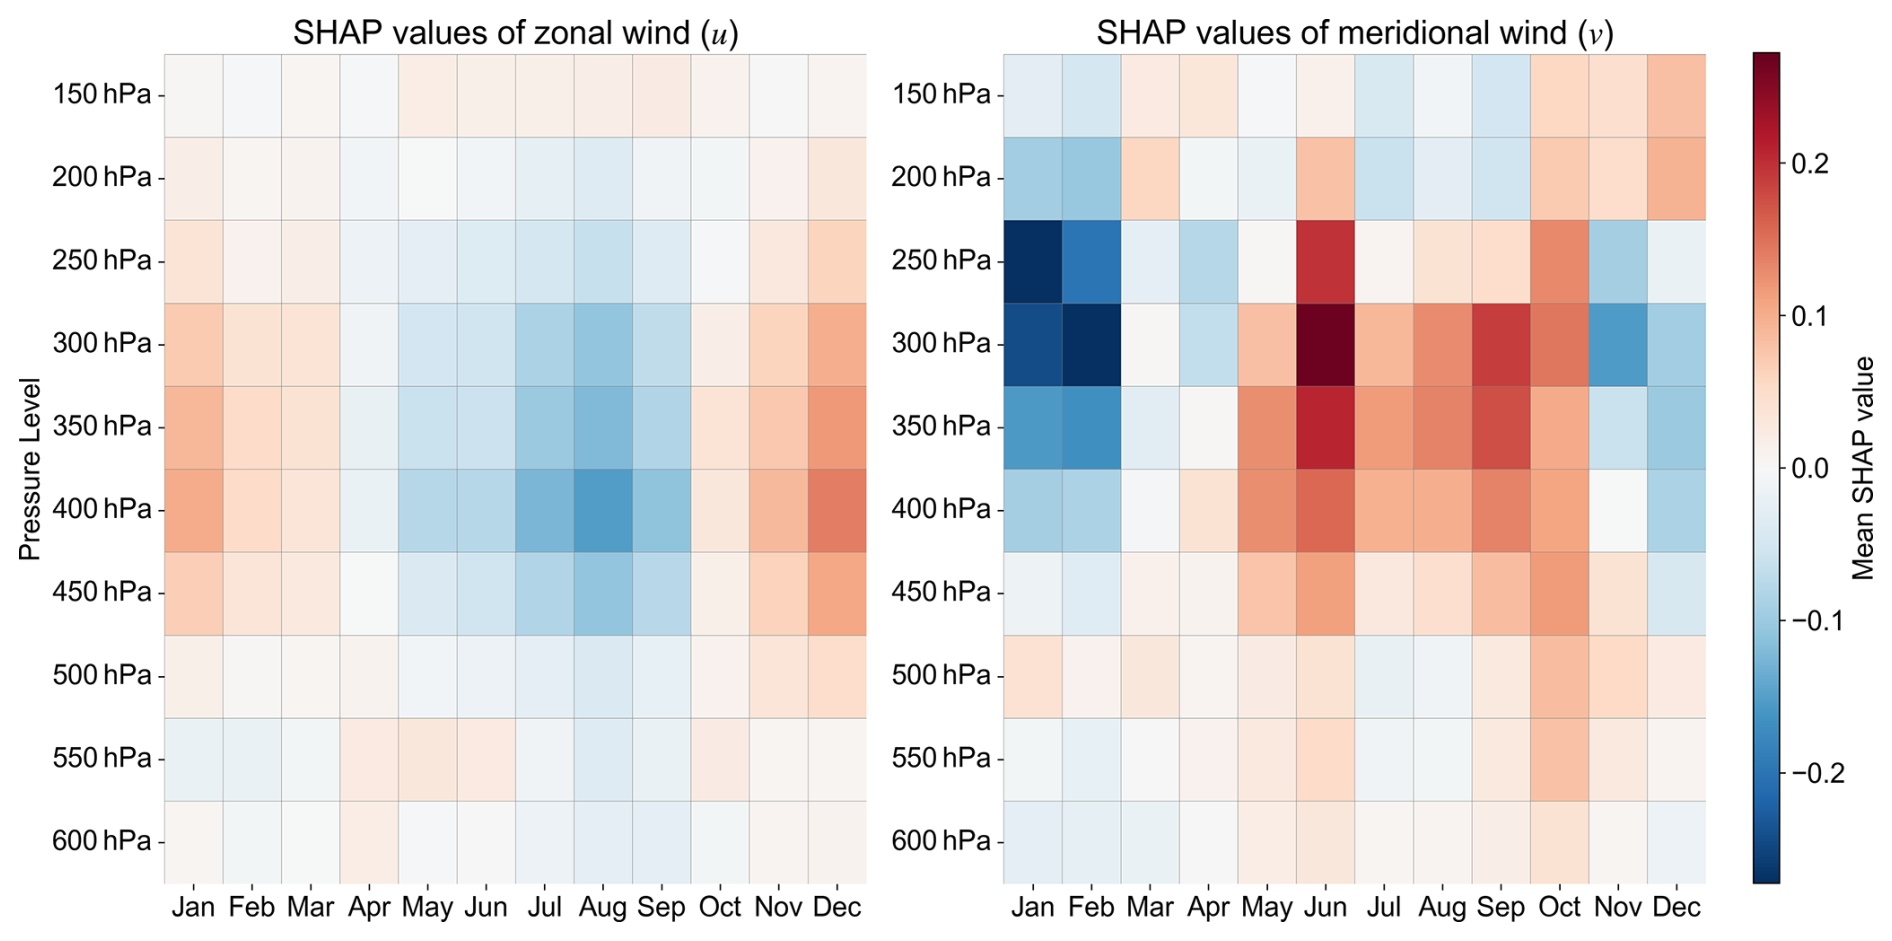
Figure 9SHAP-based contributions of zonal (u) and meridional (v) wind components (150–600 hPa) to NO2 transport flux variations across the southwestern TP boundary, with red and blue indicating positive and negative contributions, respectively.
Based on these results, analysis of the southwestern boundary of the TP reveals a clear dynamical hierarchy controlling cross-boundary NO2 transport. Among all predictors, v emerges as the dominant driver, followed by u, whereas the contribution of T remains comparatively small. The highest SHAP contributions of v are concentrated within the 250–450 hPa layer in the middle-to-upper troposphere, exhibiting positive contributions during May–October and predominantly negative contributions in winter. This pronounced vertical structure indicates that the RF–SHAP framework, under a fully data-driven setting, identifies the middle-to-upper troposphere as the key dynamical layer regulating cross-boundary transport. Meanwhile, u also shows notable contributions within the 300–450 hPa range, with positive contributions mainly occurring during November–March and negative contributions during May–September. Together, these patterns highlight the critical role of middle-to-upper tropospheric circulation in modulating long-range pollutant transport across the Plateau boundary.
Notably, the altitude range identified by the SHAP analysis closely corresponds to the well-known transport pathway associated with the South Asian monsoon circulation. During the summer monsoon season, pollutants are first transported northward in the lower troposphere along the monsoon flow toward the southern slopes of the Himalayas, and are subsequently lifted rapidly to the Plateau by strong convection and orographic forcing. After reaching the middle-to-upper troposphere, the Asian Monsoon Anticyclone and its peripheral circulation enhance meridional airflow, thereby facilitating the cross-barrier transport of pollutants across the southern margin of the Plateau and further into the interior regions. The consistency between the data-driven SHAP attribution and the established monsoon transport pathway provides independent evidence that meridional circulation in the middle-to-upper troposphere plays a dominant role in summer cross-boundary pollutant transport. Seasonal changes in large-scale circulation further modulate this transport regime. With the establishment of the South Asian summer monsoon, the subtropical westerly jet shifts northward and convective vertical transport intensifies (Sheng et al., 2024; Sun et al., 2021; Chen et al., 2022), which may alter upper- and mid-level wind structures, modify the strength and stability of the westerly jet, and thereby influence both vertical uplift from the boundary layer and horizontal transport of pollutants across the TP. In contrast, during winter the subtropical jet intensifies and shifts southward, maintaining stronger mid-tropospheric westerlies over the Plateau.
In contrast, T exhibits relatively small SHAP values across most altitude levels, indicating a weaker direct contribution to cross-boundary NO2 flux compared with dynamical factors. This result suggests that under dynamically dominated transport conditions, the sensitivity of NO2 flux to T is reduced; however, this does not imply that the role of T in chemical processes can be neglected, and it may be associated with the coupled interaction between dynamical transport and chemical processes in the middle and upper troposphere. The atmospheric lifetime of NO2 is sensitive to environmental conditions, with effective lifetimes often on the order of a few hours in the planetary boundary layer, whereas it can be extended to several days in the free troposphere (Ehhalt et al., 1992; Beirle et al., 2011; Zien et al., 2014). In the upper troposphere, reduced radical concentrations increase its residence time (approximately 2–4 d), while stronger winds facilitate longer-distance transport, thereby improving the efficiency of interregional transport. Moreover, the topography of the TP facilitates the vertical movement of pollution air masses into the upper troposphere, thereby promoting the long-range transport of pollutants. During this process, a fraction of NO2 can be converted into reservoir species (e.g., peroxyacetyl nitrate, PAN) and subsequently re-released during subsidence, thereby modulating the spatial distribution of NOx (Zien et al., 2014). In addition, previous modeling studies indicate that background PAN concentrations are elevated in the adjoining TP–South Asia region (Lu et al., 2019b).
4.1 Uncertainty analysis
4.1.1 Uncertainties in satellite-derived NO2 column retrievals
The satellite retrieval of NO2 column concentrations is intrinsically affected by multiple sources of uncertainty, primarily including spectral fitting errors, biases in the assumed a priori vertical profile, errors in the calculation of the air mass factor (AMF), and variations in viewing geometry. Retrieval algorithms typically rely on assumed atmospheric state parameters and vertical NO2 distributions; when these a priori conditions deviate from actual atmospheric conditions, systematic errors are introduced into the calculation of scattering weights and optical thickness. In addition, uncertainties in surface albedo and cloud parameters can alter the effective viewing geometry, forming a “coupled” error chain (Boersma et al., 2018; Van Geffen et al., 2022), which is particularly pronounced in low-loading or low-albedo regions, where small deviations in weak spectral signals or small AMFs can be significantly amplified.
The structural characteristics of uncertainty differ substantially among satellite products. Early OMI products were constrained by lower signal-to-noise ratios and coarser spatial resolution, with overall errors mainly governed by AMF assumptions and instrumental noise. Furthermore, the “row anomaly” and striping effects degraded both temporal continuity and spatial consistency (Boersma et al., 2018). Previous studies reported that the total uncertainty of single-pixel OMI NO2 retrievals was approximately 35 %–45 %, whereas the uncertainty of TROPOMI retrievals is expected to be smaller owing to its higher signal-to-noise ratio and improved retrieval algorithms (Van Geffen et al., 2020; Verhoelst et al., 2021).
Ground-based Differential Optical Absorption Spectroscopy (DOAS) and Pandora validation results indicate that OMI generally underestimates tropospheric NO2 column concentrations, with biases more pronounced in polluted or high-loading regions, averaging around 20 %–30 % (Bucsela et al., 2013; Lamsal et al., 2021). In comparison, TROPOMI, benefiting from improved instrument performance, higher spatial resolution, and optimized retrieval algorithms, exhibits lower random noise and reduced retrieval uncertainty, with total uncertainty expected to be lower than the 35 %–45 % level reported for OMI (Boersma et al., 2018; Verhoelst et al., 2021), though still constrained by systematic errors stemming from a priori profiles and atmospheric state parameters. This comparison reveals the “dual nature” of retrieval errors: random noise can be reduced, whereas structural biases related to retrieval assumptions and atmospheric representation remain difficult to fully eliminate.
In high-elevation regions such as the TP, these uncertainties are further amplified. On one hand, the extremely low NO2 background concentrations reduce the signal-to-noise ratio in spectral fitting; on the other, complex topography and frequent cloud interference affect effective viewing conditions, leading to uncertainties in vertical sensitivity. These factors not only affects local quantitative accuracy but also increases the sensitivity of flux estimates to input uncertainties. Overall, the uncertainties in NO2 column retrievals can be categorized into three types: (1) systematic biases, which arise from errors in a priori assumptions or atmospheric state parameters; (2) random noise, which is driven by spectral signal-to-noise ratio and meteorological disturbances; and (3) structural discontinuities, which result from variations in viewing geometry and sensor characteristics.
The identification and control of these uncertainties are essential for ensuring the robustness, physical consistency, and interpretability of flux estimations across spatial scales. This approach enables the study to reveal the structural features and driving mechanisms of cross-border transport under a controlled uncertainty framework.
4.1.2 Uncertainties in wind field correction
In the Closed-Loop Integral approach, the uncertainty of the wind field is one of the key factors influencing flux estimation. Because both trace gas concentrations and wind speed exhibit significant vertical gradients, their coupling effects may either amplify or attenuate the resulting flux. Directly integrating layer-by-layer wind speed can lead to weighting imbalance: upper layers with higher wind speeds but lower concentrations tend to cause overestimation, whereas lower layers with higher concentrations but smaller wind speeds may be underestimated. This “inter-layer weighting imbalance” represents one of the main sources of vertical structural error. Previous studies have indicated that uncertainty in the wind field, particularly in the vertical wind profile, is among the dominant error sources in satellite-driven flux or emission inversions. Inaccuracies in wind speed and direction, pronounced vertical gradients of wind velocity, and errors in plume or aerosol layer height can each cause the inversion results to deviate from the true values by several to tens of percent, depending on the method, region, and data quality. For instance, in mobile DOAS and point-source flux sensitivity studies, wind field uncertainty has been shown to increase flux errors by approximately 7 %–50 % (depending on wind-field resolution and measurement configuration). Both observational and modeling studies demonstrate that when only coarse or unrepresentative wind profiles are used, the uncertainty in flux estimates can reach several tens of percent (Wu et al., 2017; Huang et al., 2020a, b). Moreover, satellite-based plume and fire studies have shown that interpolation and error in wind speed/direction and injection height can significantly affect lifetime and emission estimates; aerosol and AMF treatments can also introduce additional impacts on the order of 10 %–25 %, suggesting that different error sources contribute comparably to the total uncertainty (Griffin et al., 2021). Based on literature synthesis and sensitivity analyses, if vertical wind structures and sampling heights are not properly treated, the uncertainty of flux estimation generally falls within the range of about 10 %–30 % (though it may vary by case).
To mitigate such errors, this study applies a physically constrained weighting scheme based on air-mass distribution and the vertical profile of NO2 concentration derived from GEOS-CF to recalibrate the wind field, thereby constructing a more representative effective wind field. This scheme suppresses spurious contributions from high-altitude, low-density regions while enhancing the dynamical weighting of boundary-layer air masses with high concentrations, making the flux estimates more consistent with the actual transport structure. After correction, the mean wind-direction deviation is 15.11°, the average wind-speed adjustment is 3.53 m s−1, and the flux uncertainty is controlled at approximately 26.71 %, with detailed numerical results provided in Table S1 in the Supplement. Overall, the uncertainty of the vertical wind-field structure constitutes a non-negligible error source in closed-loop integral flux estimation, whereas the physically constrained weighted correction effectively reduces systematic bias and enhances the robustness and physical consistency of regional transport diagnostics without altering the observational constraints.
4.1.3 Uncertainty associated with the chemical lifetime of NO2
The chemical lifetime of NO2 introduces an additional source of uncertainty that should be considered when interpreting cross-boundary transport phenomenon. Because NO2 may undergo chemical loss during transport, the NO2 columns observed over the TP may reflect the combine effects of dynamical transport and chemical transformation along the transport pathway. This uncertainty may mainly affect the estimated magnitude of the transport signal, particularly during seasons with strong photochemical activity or along longer transport pathways. By comparison, relatively persistent features, such as transport pathways and seasonal variations, are generally more closely controlled by the background large-scale circulation. Therefore, the influence of NO2 chemical lifetime is more appropriately considered as an uncertainty in the interpretation of transport intensity, together with satellite retrieval errors, vertical profile representation, and uncertainties in wind fields. Future studies that incorporate the constraints on the chemical lifetime and employ chemistry-transport modeling would help further assess the relative roles of dynamical transport and chemical transformation.
4.2 Implication
The Asian summer monsoon and the mid-latitude westerly circulation jointly control the transport of pollutants and water vapor over the TP. Specifically, the Asian summer monsoon lifts near-surface pollutants to the upper troposphere through intense convection and anticyclonic circulation, facilitating their subsequent dispersion into the lower stratosphere of the Northern Hemisphere and thereby influencing large-scale atmospheric composition. Meanwhile, the mid-latitude westerly circulation, with its persistent zonal transport capability, drives an efficient influx of pollutants from Central and East Asia into the TP and its downwind regions (Huang et al., 2023). These seasonal atmospheric circulations collectively dominate the pollutant transport pathways around the TP and establish a critical linkage between regional air quality and global climate feedbacks.
Cross-regional NO2 transport over the TP highlights the Plateau as a key region for the redistribution of NOx. The coupling between orographic uplift and mid- to upper-tropospheric circulation enables pollutants to be efficiently transported across regions within the mid-troposphere and redistributed among different areas. For the analysies of flux structure, backward trajectory calculations, and potential source region identification indicate that the inflow at the southwestern boundary is closely associated with pollutant transport from South Asian, reflecting that external transport from South Asia serves as an important upstream source for this region. Meanwhile, the northeastern boundary exhibits an outflow toward downstream regions. The attribution results based on machine learning model further reveal that mid-tropospheric wind plays a dominant role in cross-boundary fluxes, suggesting that a substantial fraction of pollutant transport occurs above the planetary boundary layer and is realized through mid-level circulation, enabling long-range transport and regional redistribution (Figs. S8–S12), with potential implications for regional atmospheric chemical composition.
This transport mechanism may also help explain the apparent discrepancy between surface measurements and column NO2 trends over the TP. The detailed analyses of surface and tropospheric column NO2 concentrations over the TP are provided in Sects. S2 and S3 in the Supplement. Although ground-based observations generally indicate declining near-surface NO2 concentrations, satellite observations show a persistent increase in tropospheric NO2 column concentrations. This divergence may partly reflect enhanced inflow of pollutants through mid-tropospheric circulation, increasing the NOx burden in the free troposphere. Additionally, differences in spatial and temporal resolution between ground-based and satellite measurements may contribute to this discrepancy. The accumulation of pollutants in the free troposphere may have broader environmental implications (Finlayson-Pitts and Pitts, 1997). Such accumulation may also influence chemical processes and background composition within the free troposphere itself (Stroud et al., 2003; Stockwell et al., 2011; Shah et al., 2023). These effects are not necessarily confined to the free troposphere. Although much of this transport occurs above the planetary boundary layer, dynamical processes may provide favorable conditions for the downward transport of NOx into the lower troposphere (Fig. S13). Such processes may affect high-altitude ecosystems such as alpine meadows and wetlands, which are typically nitrogen-limited and particularly sensitive to external nitrogen inputs, potentially leading to soil acidification and nutrient imbalance (Zong et al., 2016; Chen et al., 2025). In addition, the long-range transport of NO2 may influence regional atmospheric chemistry. Recent studies have reported increasing surface ozone concentrations in several cities across the TP, a trend closely associated with changes in NOx emissions (Xu et al., 2025). Although the direct long-range transport of ozone itself generally contributes only modestly to local ozone levels, the transport of NO2 can supply additional precursors for tropospheric ozone production and potentially alter regional NOx–VOC chemical sensitivity, thereby increasing the risk of ozone-related ecological impacts (Ma et al., 2022; Yin et al., 2023; Hu et al., 2024; Zuo et al., 2025). Under the characteristic conditions of high-altitude regions, including strong solar radiation and relatively low background pollution, such changes in precursor availability may further enhance photochemical ozone formation.
Overall, these results indicate that assessing atmospheric NOx loading over the TP requires consideration not only of surface concentration changes but also of the accumulation of pollutants in the free troposphere driven by cross-regional transport and their potential downward mixing. Integrating flux-based transport diagnostics with satellite column observations helps provide a more comprehensive understanding of pollutant redistribution mechanisms in complex high-altitude environments and offers a new framework for evaluating regional NOx loading. To further improve the accuracy of these assessments, it is essential to strengthen vertical profile observations in the plateau and surrounding regions, which can be achieved through tools such as sounding balloons, drones, and lidar. Additionally, relying solely on ground-based monitoring may underestimate the total risk of NOx deposition, making it crucial to incorporate free tropospheric NO2 measurements into the assessment framework. Finally, the findings emphasize the importance of cross-border pollution management and cooperation, particularly in understanding and addressing the transport pathways of pollutants from South Asia to the TP, providing valuable insights for regional cooperative governance.
This study comprehensively integrates multi-satellite remote sensing data, reanalysis-driven flux diagnostics, and machine learning attribution methods to systematically assess NO2 variability and cross-boundary fluxes over the TP from 2005–2024. The results indicate that the TP, long considered a pristine background region, is increasingly influenced by a combination of cross-boundary inputs from South Asia and local emissions. Flux analysis shows that the southwestern boundary exhibits persistent net influx from South Asia, whereas the northeastern boundary is characterized by net efflux, forming a mirror-like bidirectional transport structure. Meanwhile, the growth rates of fluxes on both sides exhibit opposite trends, indicating a reduction in net flux asymmetry. Further SHAP attribution results reveal that v is the primary dynamic driver controlling cross-boundary NO2 transport at the southwestern boundary, followed by u, with both exhibiting opposing driving effects across seasons. These findings highlight the dynamic regulatory role of the TP in regional NO2 transport.
Although surface NO2 concentrations in TP cities have declined since 2015, tropospheric NO2 column densities have continued to increase. This discrepancy reflects changes in local emission patterns combined with the superimposed effects of long-range transport. The combined action of large-scale circulations has gradually rendered the TP a receptor and redistribution hub for pollutants within the Southeast Asian atmospheric system. These findings deepen our understanding of the TP, revealing that it is no longer merely a passive background region. This transformation has important implications for regional air quality management, as emission reductions in a single region may not directly translate into simultaneous improvements in downwind areas or across different atmospheric layers. The role of the TP in linking continental-scale NOx transport further underscores its significance in the global nitrogen cycle. However, in situ observations over the TP remain limited, and the scarcity of ground measurements constrains independent observational support while highlighting the need for high-resolution local monitoring to better capture the spatial heterogeneity of NO2. Future integration of ground-based observations with multi-source remote sensing will facilitate a more quantitative assessment of seasonal and local emission impacts, thereby providing stronger empirical grounding for understanding the nitrogen cycle and guiding air quality management over the TP.
The OMI NO2 dataset of this study is available for download at https://disc.gsfc.nasa.gov/ (last access: 16 June 2025). The TROPOMI NO2 dataset of this study is available for download at https://scihub.copernicus.eu/ (last access: 16 June 2025). ERA5 hourly wind data are available download at https://doi.org/10.24381/cds.bd0915c6 (Copernicus Climate Change Service, Climate Data Store, 2023). GEOS-CF dataset are available for download at https://gmao.gsfc.nasa.gov/gmao-products/geos-cf/ (last accessed: 12 April 2024). The EDGAR NO2 emission inventory is available at https://edgar.jrc.ec.europa.eu/ (last access: 31 January 2025).
The supplement related to this article is available online at https://doi.org/10.5194/acp-26-11027-2026-supplement.
ZS prepared the manuscript and co-designed the study with HY. YS supervised and revised the manuscript. KL, ZP, ChoL, YY and CheL provided constructive comments.
The contact author has declared that none of the authors has any competing interests.
Publisher's note: Copernicus Publications remains neutral with regard to jurisdictional claims made in the text, published maps, institutional affiliations, or any other geographical representation in this paper. The authors bear the ultimate responsibility for providing appropriate place names. Views expressed in the text are those of the authors and do not necessarily reflect the views of the publisher.
We thank the NASA Global Modeling and Assimilation Office (GMAO) for providing the GEOS-CF simulations, and the Copernicus Climate Change Service (C3S) for providing the ERA5 reanalysis data. We acknowledge NOAA for the GEOS-FP meteorological files. Additionally, we thank the European Space Agency (ESA) for providing the Sentinel-5P TROPOMI NO2 data, and NASA for providing the OMI NO2 data. We also acknowledge the Joint Research Centre (JRC) for providing the EDGAR v8.1 annual emissions inventory.
This work is jointly supported by the National Science Fund for Excellent Young Scholars (no. 62322514), Anhui Science Fund for Distinguished Young Scholars (no. 2308085J25) and National Key Research and Development Program of China (no. 2023YFC3709502).
This paper was edited by Andreas Richter and reviewed by two anonymous referees.
Albertin, S., Savarino, J., Bekki, S., Barbero, A., Grilli, R., Fournier, Q., Ventrillard, I., Caillon, N., and Law, K.: Diurnal variations in oxygen and nitrogen isotopes of atmospheric nitrogen dioxide and nitrate: implications for tracing NOx oxidation pathways and emission sources, Atmos. Chem. Phys., 24, 1361–1388, https://doi.org/10.5194/acp-24-1361-2024, 2024.
Atkinson, R.: Atmospheric chemistry of VOCs and NOx, Atmos. Environ., 34, 2063–2101, https://doi.org/10.1016/s1352-2310(99)00460-4, 2000.
Barten, J. G. M., Ganzeveld, L. N., Visser, A. J., Jiménez, R., and Krol, M. C.: Evaluation of nitrogen oxides (NOx) sources and sinks and ozone production in Colombia and surrounding areas, Atmos. Chem. Phys., 20, 9441–9458, https://doi.org/10.5194/acp-20-9441-2020, 2020.
Beirle, S., Boersma, K. F., Platt, U., Lawrence, M. G., and Wagner, T.: Megacity emissions and lifetimes of nitrogen oxides probed from space, Science, 333, 1737–1739, https://doi.org/10.1126/science.1207824, 2011.
Boersma, K. F., Eskes, H. J., Richter, A., De Smedt, I., Lorente, A., Beirle, S., van Geffen, J. H. G. M., Zara, M., Peters, E., Van Roozendael, M., Wagner, T., Maasakkers, J. D., van der A, R. J., Nightingale, J., De Rudder, A., Irie, H., Pinardi, G., Lambert, J.-C., and Compernolle, S. C.: Improving algorithms and uncertainty estimates for satellite NO2 retrievals: results from the quality assurance for the essential climate variables (QA4ECV) project, Atmos. Meas. Tech., 11, 6651–6678, https://doi.org/10.5194/amt-11-6651-2018, 2018.
Breiman, L.: Random Forests, Mach. Learn., 45, 5–32, https://doi.org/10.1023/a:1010933404324, 2001.
Bucsela, E. J., Krotkov, N. A., Celarier, E. A., Lamsal, L. N., Swartz, W. H., Bhartia, P. K., Boersma, K. F., Veefkind, J. P., Gleason, J. F., and Pickering, K. E.: A new stratospheric and tropospheric NO2 retrieval algorithm for nadir-viewing satellite instruments: applications to OMI, Atmos. Meas. Tech., 6, 2607–2626, https://doi.org/10.5194/amt-6-2607-2013, 2013.
Chen, X., Leung, L. R., Feng, Z., and Song, F.: Crucial Role of Mesoscale Convective Systems in the Vertical Mass, Water, and Energy Transports of the South Asian Summer Monsoon, J. Climate, 35, 91–108, https://doi.org/10.1175/JCLI-D-21-0124.1, 2022.
Chen, X., Shi, P., Yu, J., Hou, G., Zong, N., and Hei, H.: Nitrogen Enrichment Reshapes Contrasting Microbial Networks in Northern Tibetan Alpine Meadow vs. Steppe, Plants (Basel), 14, https://doi.org/10.3390/plants14172803, 2025.
Cheng, G., Zhao, S., and Huang, D.: Understanding the Effects of Improving Transportation on Pilgrim Travel Behavior: Evidence from the Lhasa, Tibet, China, Sustainability, 10, https://doi.org/10.3390/su10103528, 2018.
Cheng, S., Pu, G., Ma, J., Hong, H., Du, J., Yudron, T., and Wagner, T.: Retrieval of Tropospheric NO2 Vertical Column Densities from Ground-Based MAX-DOAS Measurements in Lhasa, a City on the Tibetan Plateau, Remote Sens.-Basel, 15, https://doi.org/10.3390/rs15194689, 2023.
Cheng, S., Ma, J., Zheng, X., Gu, M., Donner, S., Dörner, S., Zhang, W., Du, J., Li, X., Liang, Z., Lv, J., and Wagner, T.: Retrieval of O3, NO2, BrO and OClO Columns from Ground-Based Zenith Scattered Light DOAS Measurements in Summer and Autumn over the Northern Tibetan Plateau, Remote Sens.-Basel, 13, https://doi.org/10.3390/rs13214242, 2021.
Chi, Y. L., Fan, M., Zhao, C. F., Sun, L., Yang, Y. K., Yang, X. C., and Tao, J. H.: Ground-level NO2 concentration estimation based on OMI tropospheric NO2 and its spatiotemporal characteristics in typical regions of China, Atmos. Res., 264, 105821, ARTN 105821, https://doi.org/10.1016/j.atmosres.2021.105821, 2021.
Choudhary, A., Kumar, P., Shukla, A., and Joshi, P. K.: Urban mobility associated ambient air quality and policies for environmental implications, in: Air pollution and its complications: From the regional to the global scale, Springer, 163–175, https://doi.org/10.1007/978-3-030-70509-1_10, 2021.
Cong, Z., Kang, S., Kawamura, K., Liu, B., Wan, X., Wang, Z., Gao, S., and Fu, P.: Carbonaceous aerosols on the south edge of the Tibetan Plateau: concentrations, seasonality and sources, Atmos. Chem. Phys., 15, 1573–1584, https://doi.org/10.5194/acp-15-1573-2015, 2015.
Copernicus Climate Change Service, Climate Data Store: ERA5 hourly data on pressure levels from 1940 to present, Copernicus Climate Change Service (C3S) Climate Data Store (CDS) [data set], https://doi.org/10.24381/cds.bd0915c6, 2023.
Crippa, M., Guizzardi, D., Pagani, F., Schiavina, M., Melchiorri, M., Pisoni, E., Graziosi, F., Muntean, M., Maes, J., Dijkstra, L., Van Damme, M., Clarisse, L., and Coheur, P.: Insights into the spatial distribution of global, national, and subnational greenhouse gas emissions in the Emissions Database for Global Atmospheric Research (EDGAR v8.0), Earth Syst. Sci. Data, 16, 2811–2830, https://doi.org/10.5194/essd-16-2811-2024, 2024.
de Foy, B., Lu, Z., Streets, D. G., Lamsal, L. N., and Duncan, B. N.: Estimates of power plant NOx emissions and lifetimes from OMI NO2 satellite retrievals, Atmos. Environ., 116, 1–11, https://doi.org/10.1016/j.atmosenv.2015.05.056, 2015.
Ding, J., van der A, R., Mijling, B., de Laat, J., Eskes, H., and Boersma, K. F.: NOx emissions in India derived from OMI satellite observations, Atmos. Environ., X, 14, https://doi.org/10.1016/j.aeaoa.2022.100174, 2022.
Dong, X., Liu, Y., Yan, X., Wang, Y., Tan, Z., Luo, M., Li, D., Wang, Y., and Tang, S.: Compound impacts of South Asian summer monsoon and westerlies on summer precipitation over Tibetan Plateau, Clim. Dynam., 62, 3067–3087, https://doi.org/10.1007/s00382-023-07051-8, 2023.
Duo, B., Cui, L., Wang, Z., Li, R., Zhang, L., Fu, H., Chen, J., Zhang, H., and Qiong, A.: Observations of atmospheric pollutants at Lhasa during 2014–2015: Pollution status and the influence of meteorological factors, J. Environ. Sci.-China, 63, 28–42, https://doi.org/10.1016/j.jes.2017.03.010, 2018.
Ehhalt, D. H., Rohrer, F., and Wahner, A.: Sources and distribution of NOx in the upper troposphere at northern mid-latitudes, J. Geophys. Res.-Atmos., 97, 3725–3738, https://doi.org/10.1029/91jd03081, 1992.
Erickson, L. E., Newmark, G. L., Higgins, M. J., and Wang, Z.: Nitrogen oxides and ozone in urban air: A review of 50 plus years of progress, Environ. Prog. Sustain., 39, https://doi.org/10.1002/ep.13484, 2020.
Finlayson-Pitts, B. J. and Pitts, J. N., Jr.: Tropospheric air pollution: ozone, airborne toxics, polycyclic aromatic hydrocarbons, and particles, Science, 276, 1045–1052, https://doi.org/10.1126/science.276.5315.1045, 1997.
Ganguly, T., Selvaraj, K. L., and Guttikunda, S. K.: National Clean Air Programme (NCAP) for Indian cities: Review and outlook of clean air action plans, Atmos. Environ., X, 8, https://doi.org/10.1016/j.aeaoa.2020.100096, 2020.
Gopikrishnan, G. S. and Kuttippurath, J.: Four years of National Clean Air Programme (NCAP) in Indian cities: Assessment of the impact on surface ozone during the period 2018–2022, Sustain. Cities Soc., 101, https://doi.org/10.1016/j.scs.2024.105207, 2024.
Griffin, D., McLinden, C. A., Dammers, E., Adams, C., Stockwell, C. E., Warneke, C., Bourgeois, I., Peischl, J., Ryerson, T. B., Zarzana, K. J., Rowe, J. P., Volkamer, R., Knote, C., Kille, N., Koenig, T. K., Lee, C. F., Rollins, D., Rickly, P. S., Chen, J., Fehr, L., Bourassa, A., Degenstein, D., Hayden, K., Mihele, C., Wren, S. N., Liggio, J., Akingunola, A., and Makar, P.: Biomass burning nitrogen dioxide emissions derived from space with TROPOMI: methodology and validation, Atmos. Meas. Tech., 14, 7929–7957, https://doi.org/10.5194/amt-14-7929-2021, 2021.
Guttikunda, S. K., Dammalapati, S. K., and Pradhan, G.: Assessing air quality during India's National Clean Air Programme (NCAP): 2019–2023, Atmos. Environ., 343, https://doi.org/10.1016/j.atmosenv.2024.120974, 2025.
Han, K., Kim, H., and Song, C.: An Estimation of Top-Down NOx Emissions from OMI Sensor Over East Asia, Remote Sens.-Basel, 12, https://doi.org/10.3390/rs12122004, 2020.
Hersbach, H., Bell, B., Berrisford, P., Hirahara, S., Horányi, A., Muñoz-Sabater, J., Nicolas, J., Peubey, C., Radu, R., Schepers, D., Simmons, A., Soci, C., Abdalla, S., Abellan, X., Balsamo, G., Bechtold, P., Biavati, G., Bidlot, J., Bonavita, M., De Chiara, G., Dahlgren, P., Dee, D., Diamantakis, M., Dragani, R., Flemming, J., Forbes, R., Fuentes, M., Geer, A., Haimberger, L., Healy, S., Hogan, R. J., Hólm, E., Janisková, M., Keeley, S., Laloyaux, P., Lopez, P., Lupu, C., Radnoti, G., de Rosnay, P., Rozum, I., Vamborg, F., Villaume, S., and Thépaut, J. N.: The ERA5 global reanalysis, Q. J. R. Meteorol. Soc., 146, 1999–2049, https://doi.org/10.1002/qj.3803, 2020.
Hu, Y., Yu, H., Kang, S., Yang, J., Chen, X., Yin, X., and Chen, P.: Modeling the transport of PM10, PM2.5, and O3 from South Asia to the Tibetan Plateau, Atmos. Res., 303, https://doi.org/10.1016/j.atmosres.2024.107323, 2024.
Huang, J., Zhou, X., Wu, G., Xu, X., Zhao, Q., Liu, Y., Duan, A., Xie, Y., Ma, Y., Zhao, P., Yang, S., Yang, K., Yang, H., Bian, J., Fu, Y., Ge, J., Liu, Y., Wu, Q., Yu, H., Wang, B., Bao, Q., and Qie, K.: Global Climate Impacts of Land-Surface and Atmospheric Processes Over the Tibetan Plateau, Rev. Geophys., 61, https://doi.org/10.1029/2022rg000771, 2023.
Huang, Y., Li, A., Xie, P., Hu, Z., Xu, J., Fang, X., Ren, H., Li, X., and Dang, B.: NOx Emission Flux Measurements with Multiple Mobile-DOAS Instruments in Beijing, Remote Sens.-Basel, 12, https://doi.org/10.3390/rs12162527, 2020a.
Huang, Y., Li, A., Wagner, T., Wang, Y., Hu, Z., Xie, P., Xu, J., Ren, H., Remmers, J., Fang, X., and Dang, B.: The quantification of NOx and SO2 point source emission flux errors of mobile differential optical absorption spectroscopy on the basis of the Gaussian dispersion model: a simulation study, Atmos. Meas. Tech., 13, 6025–6051, https://doi.org/10.5194/amt-13-6025-2020, 2020b.
Jiang, K., Xing, R., Luo, Z., Li, J., Men, Y., Shen, H., Shen, G., and Tao, S.: Trends in air pollutants emissions in the Qinghai-Tibet Plateau and its surrounding areas under different socioeconomic scenarios, Sci. Total Environ., 899, 165745, https://doi.org/10.1016/j.scitotenv.2023.165745, 2023.
Kaminska, J. A.: A random forest partition model for predicting NO(2) concentrations from traffic flow and meteorological conditions, Sci. Total Environ., 651, 475–483, https://doi.org/10.1016/j.scitotenv.2018.09.196, 2019.
Kasdagli, M. I., Orellano, P., Perez Velasco, R., and Samoli, E.: Long-Term Exposure to Nitrogen Dioxide and Ozone and Mortality: Update of the WHO Air Quality Guidelines Systematic Review and Meta-Analysis, Int. J. Public Health, 69, 1607676, https://doi.org/10.3389/ijph.2024.1607676, 2024.
Keller, C. A., Evans, M. J., Knowland, K. E., Hasenkopf, C. A., Modekurty, S., Lucchesi, R. A., Oda, T., Franca, B. B., Mandarino, F. C., Díaz Suárez, M. V., Ryan, R. G., Fakes, L. H., and Pawson, S.: Global impact of COVID-19 restrictions on the surface concentrations of nitrogen dioxide and ozone, Atmos. Chem. Phys., 21, 3555–3592, https://doi.org/10.5194/acp-21-3555-2021, 2021a.
Keller, C. A., Knowland, K. E., Duncan, B. N., Liu, J., Anderson, D. C., Das, S., Lucchesi, R. A., Lundgren, E. W., Nicely, J. M., Nielsen, E., Ott, L. E., Saunders, E., Strode, S. A., Wales, P. A., Jacob, D. J., and Pawson, S.: Description of the NASA GEOS Composition Forecast Modeling System GEOS-CF v1.0, J. Adv. Model. Earth Sy., 13, e2020MS002413, https://doi.org/10.1029/2020MS002413, 2021b.
Kong, H., Lin, J., Zhang, Y., Li, C., Xu, C., Shen, L., Liu, X., Yang, K., Su, H., and Xu, W.: High natural nitric oxide emissions from lakes on Tibetan Plateau under rapid warming, Nat. Geosci., 16, 474–477, https://doi.org/10.1038/s41561-023-01200-8, 2023.
Kurokawa, J. and Ohara, T.: Long-term historical trends in air pollutant emissions in Asia: Regional Emission inventory in ASia (REAS) version 3, Atmos. Chem. Phys., 20, 12761–12793, https://doi.org/10.5194/acp-20-12761-2020, 2020.
Lamsal, L. N., Krotkov, N. A., Vasilkov, A., Marchenko, S., Qin, W., Yang, E.-S., Fasnacht, Z., Joiner, J., Choi, S., Haffner, D., Swartz, W. H., Fisher, B., and Bucsela, E.: Ozone Monitoring Instrument (OMI) Aura nitrogen dioxide standard product version 4.0 with improved surface and cloud treatments, Atmos. Meas. Tech., 14, 455–479, https://doi.org/10.5194/amt-14-455-2021, 2021.
Levelt, P. F., van den Oord, G. H. J., Dobber, M. R., Malkki, A., Huib, V., Johan de, V., Stammes, P., Lundell, J. O. V., and Saari, H.: The ozone monitoring instrument, IEEE T. Geosci. Remote, 44, 1093–1101, https://doi.org/10.1109/tgrs.2006.872333, 2006.
Li, C., Yan, F., Kang, S., Yan, C., Hu, Z., Chen, P., Gao, S., Zhang, C., He, C., Kaspari, S., and Stubbins, A.: Carbonaceous matter in the atmosphere and glaciers of the Himalayas and the Tibetan plateau: An investigative review, Environ. Int., 146, 106281, https://doi.org/10.1016/j.envint.2020.106281, 2021.
Liu, C. and Shi, K.: A review on methodology in O(3)–NOx–VOC sensitivity study, Environ. Pollut., 291, 118249, https://doi.org/10.1016/j.envpol.2021.118249, 2021.
Liu, Y. W., Xu-Ri, Wang, Y. S., Pan, Y. P., and Piao, S. L.: Wet deposition of atmospheric inorganic nitrogen at five remote sites in the Tibetan Plateau, Atmos. Chem. Phys., 15, 11683–11700, https://doi.org/10.5194/acp-15-11683-2015, 2015.
Lu, X., Zhang, L., and Shen, L.: Meteorology and Climate Influences on Tropospheric Ozone: a Review of Natural Sources, Chemistry, and Transport Patterns, Curr. Pollut. Rep., 5, 238–260, https://doi.org/10.1007/s40726-019-00118-3, 2019a.
Lu, X., Zhang, L., Chen, Y., Zhou, M., Zheng, B., Li, K., Liu, Y., Lin, J., Fu, T.-M., and Zhang, Q.: Exploring 2016–2017 surface ozone pollution over China: source contributions and meteorological influences, Atmos. Chem. Phys., 19, 8339–8361, https://doi.org/10.5194/acp-19-8339-2019, 2019b.
Lundberg, S. M. and Lee, S. I.: A Unified Approach to Interpreting Model Predictions, Adv. Neur. In., 30, https://doi.org/10.48550/arXiv.1705.07874, 2017.
Lundberg, S. M., Erion, G., Chen, H., DeGrave, A., Prutkin, J. M., Nair, B., Katz, R., Himmelfarb, J., Bansal, N., and Lee, S. I.: From Local Explanations to Global Understanding with Explainable AI for Trees, Nat. Mach. Intell., 2, 56–67, https://doi.org/10.1038/s42256-019-0138-9, 2020.
Ma, J., Zhou, X., Xu, X., Xu, X., Gromov, S., and Lelieveld, J.: Ozone and aerosols over the Tibetan Plateau, in: Asian Atmospheric Pollution, edited by: Singh, R. P., Elsevier, 287–302, https://doi.org/10.1016/B978-0-12-816693-2.00008-1, 2022.
Ma, T., Duan, F. K., He, K. B., Qin, Y., Tong, D., Geng, G. N., Liu, X. Y., Li, H., Yang, S., Ye, S. Q., Xu, B. Y., Zhang, Q., and Ma, Y. L.: Air pollution characteristics and their relationship with emissions and meteorology in the Yangtze River Delta region during 2014–2016, J. Environ. Sci., 83, 8–20, https://doi.org/10.1016/j.jes.2019.02.031, 2019.
Madrazo, J., Clappier, A., Belalcazar, L. C., Cuesta, O., Contreras, H., and Golay, F.: Screening differences between a local inventory and the Emissions Database for Global Atmospheric Research (EDGAR), Sci. Total Environ., 631–632, 934–941, https://doi.org/10.1016/j.scitotenv.2018.03.094, 2018.
NDRC: The 13th Five-year Plan for Economic and Social Development of the People's Republic of China (2016–2020), Central Compilation & Translation Press, https://en.ndrc.gov.cn/policies/202105/P020210527785800103339.pdf (last access: 20 July 2026), 2016.
Nieberding, F., Wille, C., Fratini, G., Asmussen, M. O., Wang, Y., Ma, Y., and Sachs, T.: A long-term (2005–2019) eddy covariance data set of CO2 and H2O fluxes from the Tibetan alpine steppe, Earth Syst. Sci. Data, 12, 2705–2724, https://doi.org/10.5194/essd-12-2705-2020, 2020.
Pan, H., Huang, J., Li, J., Huang, Z., Wang, M., Mamtimin, A., Huo, W., Yang, F., Zhou, T., and Kumar, K. R.: The Tibetan Plateau space-based tropospheric aerosol climatology: 2007–2020, Earth Syst. Sci. Data, 16, 1185–1207, https://doi.org/10.5194/essd-16-1185-2024, 2024.
Perrone, M. G., Vratolis, S., Georgieva, E., Torok, S., Sega, K., Veleva, B., Osan, J., Beslic, I., Kertesz, Z., Pernigotti, D., Eleftheriadis, K., and Belis, C. A.: Sources and geographic origin of particulate matter in urban areas of the Danube macro-region: The cases of Zagreb (Croatia), Budapest (Hungary) and Sofia (Bulgaria), Sci. Total Environ., 619–620, 1515–1529, https://doi.org/10.1016/j.scitotenv.2017.11.092, 2018.
Polissar, A. V., Hopke, P. K., and Harris, J. M.: Source regions for atmospheric aerosol measured at Barrow, Alaska, Environ. Sci. Technol., 35, 4214–4226, https://doi.org/10.1021/es0107529, 2001.
Qi, H., Duan, W., Cheng, S., Huang, Z., and Hou, X.: Spatial clustering and spillover pathways analysis of O3, NO2, and CO in eastern China during 2017–2021, Sci. Total Environ., 904, 166814, https://doi.org/10.1016/j.scitotenv.2023.166814, 2023.
Qian, Y., Flanner, M. G., Leung, L. R., and Wang, W.: Sensitivity studies on the impacts of Tibetan Plateau snowpack pollution on the Asian hydrological cycle and monsoon climate, Atmos. Chem. Phys., 11, 1929–1948, https://doi.org/10.5194/acp-11-1929-2011, 2011.
Sell, P., Plass, D., Kienzler, S., and Zeeb, H.: Environmental burden of disease resulting from long-term nitrogen dioxide exposure in Germany, BMC Public Health, 25, 79, https://doi.org/10.1186/s12889-024-21200-6, 2025.
Şerban, R.-D., Jin, H., Şerban, M., Bertoldi, G., Luo, D., Wang, Q., Ma, Q., He, R., Jin, X., Li, X., Tang, J., and Wang, H.: An observational network of ground surface temperature under different land-cover types on the northeastern Qinghai–Tibet Plateau, Earth Syst. Sci. Data, 16, 1425–1446, https://doi.org/10.5194/essd-16-1425-2024, 2024.
Shah, V., Jacob, D. J., Dang, R., Lamsal, L. N., Strode, S. A., Steenrod, S. D., Boersma, K. F., Eastham, S. D., Fritz, T. M., Thompson, C., Peischl, J., Bourgeois, I., Pollack, I. B., Nault, B. A., Cohen, R. C., Campuzano-Jost, P., Jimenez, J. L., Andersen, S. T., Carpenter, L. J., Sherwen, T., and Evans, M. J.: Nitrogen oxides in the free troposphere: implications for tropospheric oxidants and the interpretation of satellite NO2 measurements, Atmos. Chem. Phys., 23, 1227–1257, https://doi.org/10.5194/acp-23-1227-2023, 2023.
Sheng, C., Wu, G., Liu, Y., and He, B.: Roles of Thermal Forced and Eddy-Driven Effects in the Northward Shifting of the Subtropical Westerly Jet Under Recent Climate Change, J. Geophys. Res.-Atmos., 129, https://doi.org/10.1029/2023jd039937, 2024.
Shi, Z., Song, C., Liu, B., Lu, G., Xu, J., Van Vu, T., Elliott, R. J. R., Li, W., Bloss, W. J., and Harrison, R. M.: Abrupt but smaller than expected changes in surface air quality attributable to COVID-19 lockdowns, Sci. Adv., 7, https://doi.org/10.1126/sciadv.abd6696, 2021.
Stockwell, W. R., Lawson, C. V., Saunders, E., and Goliff, W. S.: A Review of Tropospheric Atmospheric Chemistry and Gas-Phase Chemical Mechanisms for Air Quality Modeling, Atmosphere, 3, 1–32, https://doi.org/10.3390/atmos3010001, 2011.
Stroud, C., Madronich, S., Atlas, E., Ridley, B., Flocke, F., Weinheimer, A., Talbot, B., Fried, A., Wert, B., Shetter, R., Lefer, B., Coffey, M., Heikes, B., and Blake, D.: Photochemistry in the arctic free troposphere: NOx budget and the role of odd nitrogen reservoir recycling, Atmos. Environ., 37, 3351–3364, https://doi.org/10.1016/s1352-2310(03)00353-4, 2003.
Sun, Y., Yin, H., Cheng, Y., Zhang, Q., Zheng, B., Notholt, J., Lu, X., Liu, C., Tian, Y., and Liu, J.: Quantifying variability, source, and transport of CO in the urban areas over the Himalayas and Tibetan Plateau, Atmos. Chem. Phys., 21, 9201–9222, https://doi.org/10.5194/acp-21-9201-2021, 2021.
Sun, Z., Yin, H., Pan, Z., Li, C., Lu, X., Liu, K., Sun, Y., and Liu, C.: Quantifying transboundary transport flux of CO over the Tibetan Plateau: variabilities and drivers, Atmos. Chem. Phys., 25, 6823–6842, https://doi.org/10.5194/acp-25-6823-2025, 2025.
Tang, G., Yao, D., Kang, Y., Liu, Y., Liu, Y., Wang, Y., Bai, Z., Sun, J., Cong, Z., Xin, J., Liu, Z., Zhu, Z., Geng, Y., Wang, L., Li, T., Li, X., Bian, J., and Wang, Y.: The urgent need to control volatile organic compound pollution over the Qinghai-Tibet Plateau, iScience, 25, https://doi.org/10.1016/j.isci.2022.105688, 2022.
Upadhyay, A., Dey, S., and Goyal, P.: A comparative assessment of regional representativeness of EDGAR and ECLIPSE emission inventories for air quality studies in India, Atmos. Environ., 223, 117182, https://doi.org/10.1016/j.atmosenv.2019.117182, 2020.
Usha, K. H., Nair, V. S., and Babu, S. S.: Deciphering the Role of Aerosol-Induced Snow Albedo Feedback on Dust Emission Over the Tibetan Plateau, J. Geophys. Res.-Atmos., 127, https://doi.org/10.1029/2021jd036384, 2022.
van Geffen, J., Boersma, K. F., Eskes, H., Sneep, M., ter Linden, M., Zara, M., and Veefkind, J. P.: S5P TROPOMI NO2 slant column retrieval: method, stability, uncertainties and comparisons with OMI, Atmos. Meas. Tech., 13, 1315–1335, https://doi.org/10.5194/amt-13-1315-2020, 2020.
van Geffen, J., Eskes, H., Compernolle, S., Pinardi, G., Verhoelst, T., Lambert, J.-C., Sneep, M., ter Linden, M., Ludewig, A., Boersma, K. F., and Veefkind, J. P.: Sentinel-5P TROPOMI NO2 retrieval: impact of version v2.2 improvements and comparisons with OMI and ground-based data, Atmos. Meas. Tech., 15, 2037–2060, https://doi.org/10.5194/amt-15-2037-2022, 2022.
Verhoelst, T., Compernolle, S., Pinardi, G., Lambert, J.-C., Eskes, H. J., Eichmann, K.-U., Fjæraa, A. M., Granville, J., Niemeijer, S., Cede, A., Tiefengraber, M., Hendrick, F., Pazmiño, A., Bais, A., Bazureau, A., Boersma, K. F., Bognar, K., Dehn, A., Donner, S., Elokhov, A., Gebetsberger, M., Goutail, F., Grutter de la Mora, M., Gruzdev, A., Gratsea, M., Hansen, G. H., Irie, H., Jepsen, N., Kanaya, Y., Karagkiozidis, D., Kivi, R., Kreher, K., Levelt, P. F., Liu, C., Müller, M., Navarro Comas, M., Piters, A. J. M., Pommereau, J.-P., Portafaix, T., Prados-Roman, C., Puentedura, O., Querel, R., Remmers, J., Richter, A., Rimmer, J., Rivera Cárdenas, C., Saavedra de Miguel, L., Sinyakov, V. P., Stremme, W., Strong, K., Van Roozendael, M., Veefkind, J. P., Wagner, T., Wittrock, F., Yela González, M., and Zehner, C.: Ground-based validation of the Copernicus Sentinel-5P TROPOMI NO2 measurements with the NDACC ZSL-DOAS, MAX-DOAS and Pandonia global networks, Atmos. Meas. Tech., 14, 481–510, https://doi.org/10.5194/amt-14-481-2021, 2021.
Vratolis, S., Diapouli, E., Manousakas, M. I., Almeida, S. M., Beslic, I., Kertesz, Z., Samek, L., and Eleftheriadis, K.: A new method for the quantification of ambient particulate-matter emission fluxes, Atmos. Chem. Phys., 23, 6941–6961, https://doi.org/10.5194/acp-23-6941-2023, 2023.
Vu, T. V., Shi, Z., Cheng, J., Zhang, Q., He, K., Wang, S., and Harrison, R. M.: Assessing the impact of clean air action on air quality trends in Beijing using a machine learning technique, Atmos. Chem. Phys., 19, 11303–11314, https://doi.org/10.5194/acp-19-11303-2019, 2019.
Wang, M., Wang, Q., Ho, S. S. H., Tian, J., Zhang, Y., Lee, S., and Cao, J.: Dominant influence of biomass combustion and cross-border transport on nitrogen-containing organic compound levels in the southeastern Tibetan Plateau, Atmos. Chem. Phys., 24, 11175–11189, https://doi.org/10.5194/acp-24-11175-2024, 2024.
Wang, W., Guan, L., Wen, Z., Ma, X., Fang, J., and Liu, X.: Atmospheric Nitrogen Deposition to a Southeast Tibetan Forest Ecosystem, Atmosphere, 11, https://doi.org/10.3390/atmos11121331, 2020.
Wei, J., Liu, S., Li, Z., Liu, C., Qin, K., Liu, X., Pinker, R. T., Dickerson, R. R., Lin, J., Boersma, K. F., Sun, L., Li, R., Xue, W., Cui, Y., Zhang, C., and Wang, J.: Ground-Level NO(2) Surveillance from Space Across China for High Resolution Using Interpretable Spatiotemporally Weighted Artificial Intelligence, Environ. Sci. Technol., 56, 9988–9998, https://doi.org/10.1021/acs.est.2c03834, 2022.
World Health Organization: WHO global air quality guidelines: particulate matter (PM2.5 and PM10), ozone, nitrogen dioxide, sulfur dioxide and carbon monoxide, World Health Organization, Geneva, ISBN 978-92-4-003422-8, https://www.who.int/publications/i/item/9789240034228 (last access: 4 November 2025), 2021.
World Health Organization: Ambient (outdoor) air pollution, https://www.who.int/news-room/fact-sheets/detail/ambient-(out door)-air-quality-and-health (last access: 4 November 2025), 2024.
Wu, F., Li, A., Xie, P., Chen, H., Hu, Z., Zhang, Q., Liu, J., and Liu, W.: Emission Flux Measurement Error with a Mobile DOAS System and Application to NOx Flux Observations, Sensors, 17, https://doi.org/10.3390/s17020231, 2017.
Wu, Y., Liu, H., Liu, S., and Lou, C.: Estimate of near-surface NO(2) concentrations in Fenwei Plain, China, based on TROPOMI data and random forest model, Environ. Monit. Assess., 195, 1379, https://doi.org/10.1007/s10661-023-11993-1, 2023.
Xing, R., Li, Y., Luo, Z., Xiong, R., Liu, J., Jiang, K., Men, Y., Shen, H., Shen, G., and Tao, S.: Household energy use and barriers in clean transition in the Tibetan Plateau, Resour. Environ. Sustain., 18, https://doi.org/10.1016/j.resenv.2024.100178, 2024.
Xu, C., Lin, J., Kong, H., Jin, J., Chen, L., and Xu, X.: Rapid increases in ozone concentrations over the Tibetan Plateau caused by local and non-local factors, Atmos. Chem. Phys., 25, 9545–9560, https://doi.org/10.5194/acp-25-9545-2025, 2025.
Yin, H., Sun, Y., Notholt, J., Palm, M., Ye, C., and Liu, C.: Quantifying the drivers of surface ozone anomalies in the urban areas over the Qinghai-Tibet Plateau, Atmos. Chem. Phys., 22, 14401–14419, https://doi.org/10.5194/acp-22-14401-2022, 2022.
Yin, X., Rupakheti, D., Zhang, G., Luo, J., Kang, S., de Foy, B., Yang, J., Ji, Z., Cong, Z., Rupakheti, M., Li, P., Hu, Y., and Zhang, Q.: Surface ozone over the Tibetan Plateau controlled by stratospheric intrusion, Atmos. Chem. Phys., 23, 10137–10143, https://doi.org/10.5194/acp-23-10137-2023, 2023.
Yu, H., Lu, F., Hu, Z., Ma, Y., Li, M., Gu, L., Sun, F., Wang, S., Ma, W., Xie, Z., Sun, G., Huang, F., Yang, Y., Fu, C., Guo, R., Qin, Y., Wang, G., Wu, D., and Luo, H.: A Comprehensive Climate and Environment Observation Network over the central Tibetan Plateau, B. Am. Meteorol. Soc., https://doi.org/10.1175/bams-d-24-0074.1, 2025.
Zhang, X., Ye, C., Kim, J., Lee, H., Park, J., Jung, Y., Hong, H., Fu, W., Li, X., Chen, Y., Wu, X., Li, Y., Li, J., Zhang, P., Yan, Z., Zhang, J., Liu, S., and Zhu, L.: Tropospheric NO2 Column over Tibet Plateau According to Geostationary Environment Monitoring Spectrometer: Spatial, Seasonal, and Diurnal Variations, Remote Sens.-Basel, 17, https://doi.org/10.3390/rs17101690, 2025.
Zien, A. W., Richter, A., Hilboll, A., Blechschmidt, A.-M., and Burrows, J. P.: Systematic analysis of tropospheric NO2 long-range transport events detected in GOME-2 satellite data, Atmos. Chem. Phys., 14, 7367–7396, https://doi.org/10.5194/acp-14-7367-2014, 2014.
Zong, N., Shi, P., Song, M., Zhang, X., Jiang, J., and Chai, X.: Nitrogen Critical Loads for an Alpine Meadow Ecosystem on the Tibetan Plateau, Environ. Manage., 57, 531–542, https://doi.org/10.1007/s00267-015-0626-6, 2016.
Zuo, Y., Hou, J., Chi, Y., Liu, S., and Dong, W.: Unraveling the complex drivers of ozone pollution in high-altitude urban areas: Insights from source apportionment and spatiotemporal variations, Atmos. Pollut. Res., https://doi.org/10.1016/j.apr.2025.102700, 2025.