the Creative Commons Attribution 4.0 License.
the Creative Commons Attribution 4.0 License.
 | 22 Jan 2026
Driving factors of oxalic acid and enhanced role of gas-phase oxidation under cleaner conditions: insights from 2007–2018 field observations in the Pearl River Delta
Yunfeng He
Quanfu He
Yuqing Zhang
Metin Baykara
Duohong Chen
Tao Zhang
Kong Yang
Junqi Wang
Qian Cheng
Hao Jiang
Zirui Wang
Ping Liu
Xinming Wang
Michael Boy
Secondary organic aerosol (SOA) is a dominant constituent of fine particulate matter, exerting significant impacts on both climate and human health. Oxalic acid (C2), a key end-product formed from the oxidation of volatile organic compounds, can provide insights into the formation mechanism of SOA. Thus, long-term measurements of C2 and related compounds help understand the changes in SOA formation with decreasing pollutant levels. In this study, C2 and its homologs, along with five primary anthropogenic source markers and three SOA markers, were measured in the Pearl River Delta (PRD) during 2007–2018. The concentrations of C2 did not exhibit significant downward trends, despite substantial reductions in anthropogenic emissions, such as biomass burning (−11 % yr−1), vehicle emissions (−17 % yr−1), and cooking emissions (−7 % yr−1). Correlation analysis revealed that aerosol liquid water content (ALWC) and Ox (O3 + NO2) were the main drivers of C2 variations. Moreover, the relative contribution of biogenic SOA increased under cleaner conditions. A machine learning model was applied to quantify the impacts of changes in anthropogenic precursor emissions, biogenic precursor emissions, aqueous-phase oxidation processes, and gas-phase oxidation processes on C2 variability. As pollution levels declined, the impacts of gas-phase oxidation increased from 37 % to 55 %, whereas that of aqueous-phase oxidation declined from 42 % to 30 %. This shift indicated a transition from aqueous-phase to gas-phase pathways in C2 and SOA formation. Our findings highlight the increasing importance of gas-phase oxidation under low-pollution conditions and underscore the need for effective ozone control strategies to further reduce SOA in the future.
- Article
(2717 KB) - Full-text XML
-
Supplement
(1066 KB) - BibTeX
- EndNote


Low molecular weight dicarboxylic acids (DCA) represent one of the most abundant classes of organic compounds in aerosols and are ubiquitously distributed in the lower troposphere (Kawamura and Bikkina, 2016). In urban areas, DCA and related compounds (e.g., glyoxal (Gly), methylglyoxal (mGly), glyoxylic acid (ωC2), and pyruvic acid (Pyr)) account for 0.2 %–6 % of total carbon in aerosols (Kawamura and Ikushima, 1993; Kawamura and Watanabe, 2004), while this proportion could rise to 16 % in remote marine (Kawamura and Sakaguchi, 1999; Wang et al., 2006). Due to their high solubility and hygroscopicity (Bilde et al., 2015), DCA can promote aerosol hygroscopic growth and facilitate the activation of cloud condensation nuclei (CCN). Thus, they play a crucial role in the Earth's climate and radiative forcing by scattering solar radiation and forming clouds (Kawamura et al., 2013a; Meng et al., 2018; 2023).
Previous studies have suggested that DCA can be directly emitted from biogenic sources (Rinaldi et al., 2011), fossil fuel combustion (Kawamura and Kaplan, 1987), biomass burning (Kawamura et al., 2013b; Cao et al., 2017), waste incineration (Jung et al., 2010), and cooking (He et al., 2004). However, increasing evidence has demonstrated that most DCA are generated through photochemical oxidation of volatile organic compounds (VOCs), such as olefins (Bikkina et al., 2021), cyclic alkanes (Kawamura and Usukura, 1993), and unsaturated fatty acids (Kawamura et al., 1996), followed by partitioning into wet aerosols. Therefore, DCA have been widely used as SOA indicators to investigate the secondary reactions and aging processes of VOCs in the atmosphere (Kawamura and Bikkina, 2016; Meng et al., 2023). As a key end-product of numerous formation pathways in aerosols, oxalic acid (C2) is the most abundant compound among DCA homologs (58 %–89 %) (Ho et al., 2007; Xu et al., 2023). Extremely high concentrations of C2 (∼ 1000 ng m−3) have been observed in polluted areas (Poore, 2000; Wang et al., 2012; Xu et al., 2023), suggesting fast photochemical oxidation of organic precursors. Thus, a growing number of studies have focused on identifying the sources and elucidating the formation mechanism of C2 over the past decades.
Previous studies have shown that the concentrations of DCA and C2 in urban areas are generally higher than those in coastal, mountain, and marine areas (Table S1 in the Supplement). The elevated concentrations have been attributed to higher emissions of organic precursors in urban environments with intensive human activities. However, an unexpected increase in C2 was reported during the COVID-19 period (Meng et al., 2023), a period characterized by a dramatic reduction in anthropogenic emissions. They identified higher oxidant levels and stronger solar radiation as drivers of this C2 enhancement. These findings indicate that effective mitigation of C2 and SOA requires the simultaneous control of both anthropogenic emissions and atmospheric oxidants. As anthropogenic emissions decline, the relative contributions of biogenic source to C2 are expected to increase. For example, Xu et al. (2022) found that biogenic sources accounted for only 22 % of C2 in continental outflows characterized by high anthropogenic emissions. In contrast, this proportion increased to 61 % in oceanic air masses with minimal anthropogenic influence. In addition, relatively low anthropogenic emissions and enhanced biogenic activity in summer led to a higher non-fossil contribution to C2 (46 %) compared to that in winter (33 %) (Xu et al., 2023).
Numerous studies have reported strong correlations between C2 and sulfate across diverse regions, including East Asia (Yu et al., 2005; Wang et al., 2017; Zhang et al., 2022a; Meng et al., 2023), the USA (Hilario et al., 2021), the Pacific and Atlantic Oceans (Hilario et al., 2021), the Bay of Bengal (Bikkina et al., 2017) and Mongolia (Jung et al., 2010). This widespread correlation suggests that C2 and sulfate may share common formation pathways across different atmospheric environments. Assuming that sulfate primarily originates from aqueous-phase processing, C2 has been considered a secondary product formed via aqueous reactions (Yu et al., 2005; Hilario et al., 2021). However, recent research found that gas-phase oxidation also played an important role in C2 formation. For instance, Ding et al. (2021) observed a strong correlation between C2 and ozone (O3) but not with sulfate during a haze event in the Yangtze River Delta, indicating C2 was mainly produced via gas-phase oxidation. During COVID-19, lower aerosol liquid water content (ALWC) and elevated O3 shifted the dominant formation pathway of C2 from aqueous-phase oxidation of ωC2 and Pyr to gas-phase photochemical decomposition of longer-chain DCA (malonic (C3) and succinic (C4)). As a result, the contribution of gas-phase oxidation increased from 12.3 % to 50.5 % (Meng et al., 2023). In addition, Xu et al. (2023) found that the gas-phase photochemical aging dominated the formation of C2 at five emission hotspots in China during summer, when pollutant levels were relatively low and solar radiation and oxidant concentrations were high. Recently, a laboratory experiment also proposed new reaction schemes for high levels of C2 via gas-phase chemical reactions with O3 and hydroxyl radicals, which could explain the high levels of C2 in the free troposphere (Bikkina et al., 2021). Despite these findings, the formation mechanism of C2 under different pollution conditions remains incompletely understood and requires further investigation.
Over the past decades, the implementation of stringent air pollution control policies has led to a significant improvement in air quality across the PRD region (Bian et al., 2019; Geng et al., 2019; Zhang et al., 2019; Yan et al., 2020). Although VOC emissions increased during this period (Bian et al., 2019; Guo et al., 2024), a reduction in SOA was observed (Yan et al., 2020), which was likely related to the changes in ALWC and atmospheric oxidation capacity. Long-term measurements of DCA can provide critical insights into the SOA formation processes from high-pollution to low-pollution conditions. However, until now, such measurements remain scarce in the PRD. In this study, we conducted long-term measurements of aliphatic DCA (C2, C4–C10), primary anthropogenic source markers, as well as SOA markers at a background station in the PRD during 2007–2018. Based on annual trends and correlation analysis, the driving factors of C2 were identified. Then, a machine learning model was applied to quantify the impacts of anthropogenic precursor emissions, biogenic precursor emissions, aqueous-phase oxidation processes, and gas-phase oxidation processes on C2 variability. Our results highlight an enhanced role of gas-phase oxidation in C2 formation under cleaner conditions.
2.1 Field sampling
Particulate matter with aerodynamic diameter less than 2.5 µm (PM2.5) samples were collected on the rooftop of a five-storey building (approximately 30 m above the ground) in the campus of a middle school at Wanqingsha (WQS; 22.42° N, 113.32° E). The sampling site is in a small town in Guangzhou, which is located in the center of the PRD region (Fig. S1 in the Supplement). The influence of local anthropogenic emissions on this site was limited due to the low traffic and less industrial emissions from surrounding areas. During the summertime, southwesterly winds bring clean and moist air masses from the ocean. In contrast, northerly winds transport polluted and dry air masses from urban clusters during fall and winter. This makes WQS an ideal background station for investigating regional air pollution.
PM2.5 samples were collected using prebaked (450°, 4 h) quartz filters (20.3 cm × 25.4 cm, QMA, Whatman, UK). Each sample lasted for 24 h using a high-volume air sampler (HVPM2.5, Tisch Environmental Inc., USA) at an airflow rate of 1.1 m3 min−1. Field blank samples were also collected by placing the blank filter on the sampler for 10 min without turning on the sampler. In this study, a total of 462 PM2.5 samples were collected mostly during the wintertime (October, November, and December of each year) from 2007 to 2018. The detailed information about sampling can be found in Table S2 in the Supplement. After the collection, each filter was wrapped in an aluminum foil, zipped in Teflon bags, and stored in a freezer (−20 °C) prior to analysis. The samples were analyzed within several months after collecting. Resch et al. (2023) reported that ambient aerosol samples stored at −20 °C for more than one month largely retained their molecular profiles. In addition, this study demonstrates that low molecular weight carboxylic acids are more stable than high molecular weight carboxylic acids during storage. Thus, the aliphatic DCA measured in this study are expected to remain largely stable during storage.
Gaseous pollutant data (e.g., NO2 and O3) and meteorological parameters (e.g., temperature, relative humidity) were obtained from an air quality monitoring station operated at WQS. The station was under maintenance during 2012–2013, therefore data for this period are unavailable. The surface net solar radiation (SR) and boundary layer height (BLH) data used in this study were obtained from the ERA5 reanalysis dataset provided by the European Centre for Medium-Range Weather Forecasts (ECMWF) via the Copernicus Climate Data Store (CDS, https://cds.climate.copernicus.eu/datasets/, last access: 5 December 2025). The concentrations of PM2.5 and its main components, as well as ALWC and pH, can be found in our previous study (He et al., 2025).
2.2 Chemical analysis
For analysis of oxalate (C2), a punch (5.06 cm2) of the filter was extracted twice with 10 mL ultrapure Milli–Q water (18.2 MΩcm/25 °C) each for 15 min using an ultrasonic ice–water bath. The total water extracts (20 mL) were filtered through a 0.22 µm pore size filter and then stored in a pre-cleaned HDPE bottle. An ion-chromatography system (Metrohm, 883 Basic IC plus) was used to identify oxalate.
For organic tracers, a quarter of the filter was cut into small pieces and then mixed with 400 µL isotope-labeled internal standards, which included hexadecane-D34, tetracosane-D50, triacontane-D62, naphthalene-D8, acenaphthene-D10, phenanthrene-D10, chrysene-D12, perylene-D12, C27aaa(20R)-cholestane-D4, lauric acid-D23, hexadecanoic acid-D31, docosanoic acid-D43, levoglucosan-13C6, and phthalic acid 3,4,5,6-D4. Samples were sonicated in an ice-water bath using mixed solvents, twice with a 1:1 () dichloromethane (DCM)/hexane solution, followed by twice with a 1:1 () DCM/methanol solution. The extraction solutions of each sample were combined, filtered, and concentrated to ∼ 2 mL, and then split into two parts for silylation and methylation, respectively. All derivatized solutions were analyzed by an Agilent gas chromatography-mass spectrometry (GC/MS, 7890/5975C) in the scan mode with an HP-5MS capillary column (30 m × 0.25 mm × 0.25 µm). The detailed information about sample treatment and GC-MS analysis was described by previous studies (Ding et al., 2012, 2014). In this study, we measured 9 dicarboxylic acids (succinic acid, glutaric acid, adipic acid, pimelic acid, suberic acid, azelaic acid, sebacic acid, phthalic acid, terephthalic acid), 5 hopanes (17α(H)-22,29,30-trisnorhopane, 17α(H),21β(H)-30-norhopane, 17α(H),21β(H)-30-hopane, 17α(H),21β(H)-22R-homohopane, and 17α(H),21β(H)-22S-homohopane), levoglucosan, octadecanoic acid, picene, 2,3-dihydroxy-4-oxopentanioic acid (DHOPA), and malic acid. Table S3 in the Supplement shows detailed information about target compounds and their internal standards. Due to the lack of a commercial standard, DHOPA was quantified using an isomer surrogate, citramalic acid. The analytical procedure of DHOPA is described elsewhere (Ding et al., 2017).
2.3 Quality assurance/quality control
We analyzed the field blanks and found that oxalate, succinic acid, octadecanoic acid, phthalic acid, and terephthalic acid were detected in trace amounts. Thus, the data reported in this study were corrected by corresponding field blanks. We also analyzed the spiked samples (n=7) to test the recoveries of analytical procedures. The results indicated that the recoveries were 95 %–103 % for oxalate, 100 %–121 % for levoglucosan, 66 %–118 % for dicarboxylic acid and octadecanoic acid, 89 %–113 % for hopanes, 76 %–97 % for picene, 88 %–94 % for citramalic acid. The method detection limits (MDLs) were 0.04 µg m−3 for oxalate, 6.7–40.5 ng m−3 for dicarboxylic acids, 0.07 ng m−3 for levoglucosan, 0.010–0.017 ng m−3 for hopanes, 0.18 ng m−3 for octadecanoic acid, 0.11 ng m−3 for picene, and 0.11 ng m−3 for citramalic acid.
Examining long-term trends of molecular markers is inherently challenging, as even minor changes in sampling or analytical protocols may introduce discontinuities. Consequently, it was necessary to assess the stability of both the sampling procedures and the analytical system over the entire study period. Table S4 in the Supplement presents the response factors (RFs) of all measured species derived from the annual calibration curves. The RF values remained highly consistent across years, indicating that neither instrument sensitivity nor analytical performance experienced significant drift during the measurement period.
Before data analysis, all data were manually inspected and the outliers (i.e., ) were removed to rule out the influence of extreme concentrations on the overall trends. The change rates were calculated using the slopes derived from Theil–Sen regression and evaluated for statistical significance via the non-parametric Mann–Kendall test, providing a robust and reliable assessment of temporal variations.
2.4 Evaluate the impacts of various factors to oxalic acid variation by the machine learning model
Extreme Gradient Boosting (XGBoost), an advanced ensemble machine learning method based on gradient boosting decision trees, is known for its high computational efficiency, robust predictive performance (Chen et al., 2016) and thus has been applied in air pollutant research recently (Hou et al., 2022; Peng et al., 2023; Liu et al., 2025). In this study, XGBoost was employed to assess the impacts of various factors to oxalic acid variation. The implementation and Python package of XGBoost algorithm are publicly available online (https://github.com/dmlc/xgboost, last access: 5 December 2025). A total of 14 variables were used as input features to train the model, including levoglucosan, hopanes, octadecanoic acid, picene, terephthalic acid (tPh), Ox, photolysis frequencies of O3 (JO1D) and NO2 (JNO2), ALWC, pH, sulfate (), temperature (Temp), solar radiation (SR), and relative humidity (RH). To avoid redundant and confounding explanations, the secondary organic molecular markers, such as DHOPA, phthalic acid (Ph), and malic acid, were excluded in the model training. They are influenced by VOC emissions and secondary oxidation processes, which are already represented by the factors mentioned above. Our results showed that there were great agreements between the observations and simulations for C2 and other DCA (Fig. S2 in the Supplement), which indicated the model predictions were reliable.
To further explain the results of XGBoost, Python package of SHapley Additive ExPlanation (SHAP), a game theory-based approach proposed by Lundberg and Lee (2017), was used in this study (https://github.com/slundberg/shap, last access: 5 December 2025). The SHAP approach can quantify the impact of each feature to the model output while also accounting for the complex interdependencies among features. Thus, this approach provides deeper insights into the key drivers of oxalic acid formation. The fundamental principle of SHAP is to fairly allocate the prediction output among all input features by evaluating their marginal contributions across all possible feature subsets. For a given prediction f(xi) generated by the model, the SHAP decomposes the prediction into the sum of feature attributions (SHAP values) and a baseline expectation (Eq. 1):
where ∅j(f,xi) is the SHAP value representing the impact of variable j on the prediction of the model for input xi. The base value, , is the expected value of the model output over the data set. More details about this approach can be found in previous literature (Lundberg and Lee, 2017; Hou et al., 2022).
SHAP value represents the impact of a unit change in an individual variable on the predicted C2 concentration, while holding all other variables constant. The sign of the SHAP value reflects the direction of the feature's effect on the target variable, while its magnitude quantifies the strength of that effect. For example, a positive (negative) SHAP value indicates that the change in a given feature increases (decreases) the predicted value relative to the model's baseline. The mean absolute SHAP (|SHAP|) values can remove the influence of directional effects that may cancel each other out when averaged, thereby providing a more robust measure of each feature's net contribution to model output. Using |SHAP| values facilitates a comprehensive ranking of feature importance based solely on contribution intensity, regardless of whether the effect is positive or negative. We further calculated the impact factor (IF) to evaluate the impact of individual factor (i) to oxalic acid variation as Eq. (2), where N is the number of samples:
3.1 Annual trends of the molecular tracers and aliphatic DCA in the PRD
Annual variations in the organic molecular markers, aliphatic DCA and meteorological parameters are summarized in Table S5 in the Supplement and presented in Fig. 1. Five molecular markers representing different primary sources were analyzed in this study, including levoglucosan, hopanes, octadecanoic acid, picene, and terephthalic acid. These compounds are commonly used as tracers for biomass burning (Giannoni et al., 2012), vehicle emissions (Riddle et al., 2007), cooking (Zhao et al., 2007), coal combustion (Yu et al., 2020), and waste incineration (Simoneit et al., 2005), respectively. Between 2007 and 2018, the concentrations of levoglucosan, hopanes and octadecanoic acid exhibited significant declining trends (−11 % yr−1, −17 % yr−1, and −7 % yr−1, respectively; p < 0.01). In contrast, no clear trends were observed for picene and terephthalic acid, suggesting that control measures targeting biomass burning, vehicle emissions, and cooking were effective, while those for coal combustion and waste incineration may have been less effective or less implemented. Phthalic acid has been identified as a SOA tracer derived from naphthalene (Kleindienst et al., 2012), while DHOPA is a tracer for SOA formed from aromatic hydrocarbons (Ding et al., 2017). Due to the substantial anthropogenic sources of naphthalene and aromatic hydrocarbons, phthalic acid and DHOPA can be used as anthropogenic SOA (ASOA) markers. Malic acid is a typical secondary product formed through photooxidation of both anthropogenic and biogenic VOCs (AVOCs and BVOCs). However, a recent study estimated that malic acid produced through the oxidation of BVOCs (α-pinene and isoprene) was higher than that formed by AVOCs (toluene and naphthalene) (Sato et al., 2021). In addition, malic acid was also found to be strongly correlated with monoterpene tracers (R2 = 0.87–0.95) in field measurements (Hu and Yu, 2013; Cheng et al., 2021). Given high BVOC emissions (Wang et al., 2021a) in the PRD region, large amount of malic acid was likely produced from biogenic precursors in this study, especially monoterpenes. Thus, we used malic acid to reflect the variations of SOA (BSOA). Although phthalic acid, DHOPA, and malic acid decreased from 51.9 ± 14.9, 1.85 ± 1.35, and 24.2 ± 19.4 ng m−3 to 16.7 ± 5.7, 1.05 ± 0.88, 5.9 ± 4.9 ng m−3, respectively, their declining trends were not statistically significant (p > 0.05). This indicated that the influence of reductions in emissions of anthropogenic organic precursors on SOA was limited.
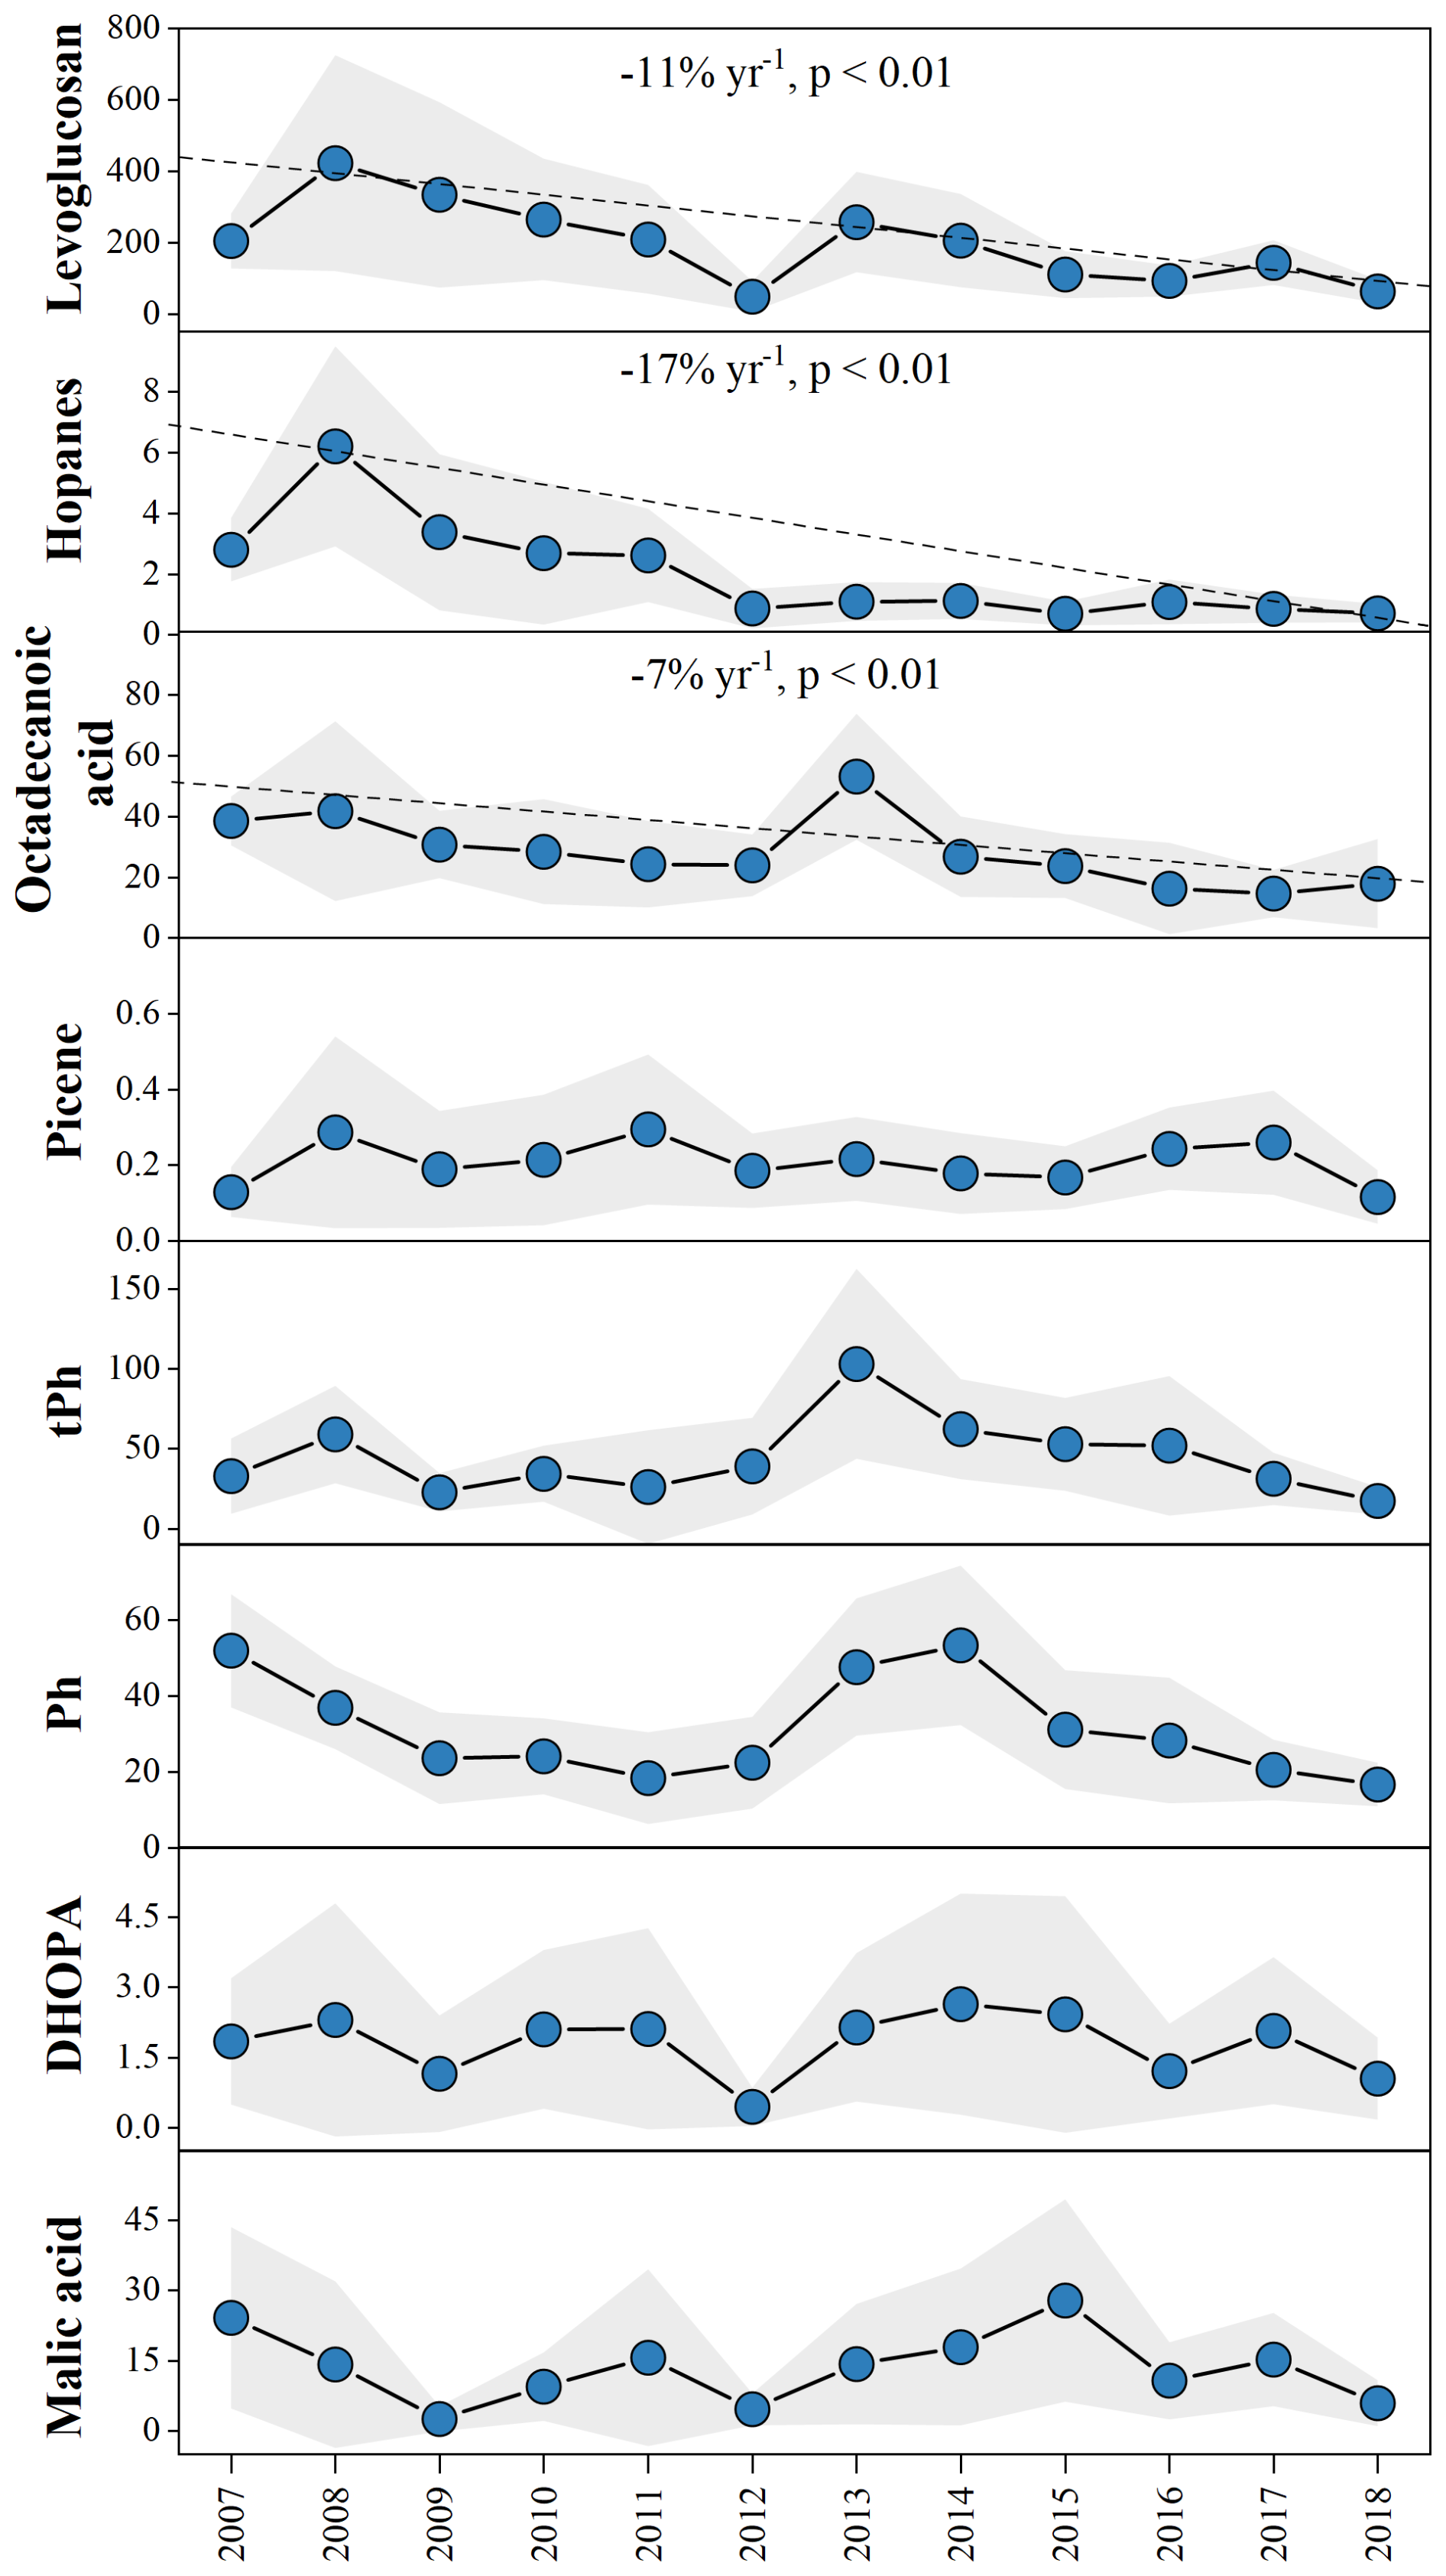
Figure 1Annual variations in different molecular markers (ng m−3) in the PRD during 2007 to 2018. The shaded area represents the 95 % prediction band.
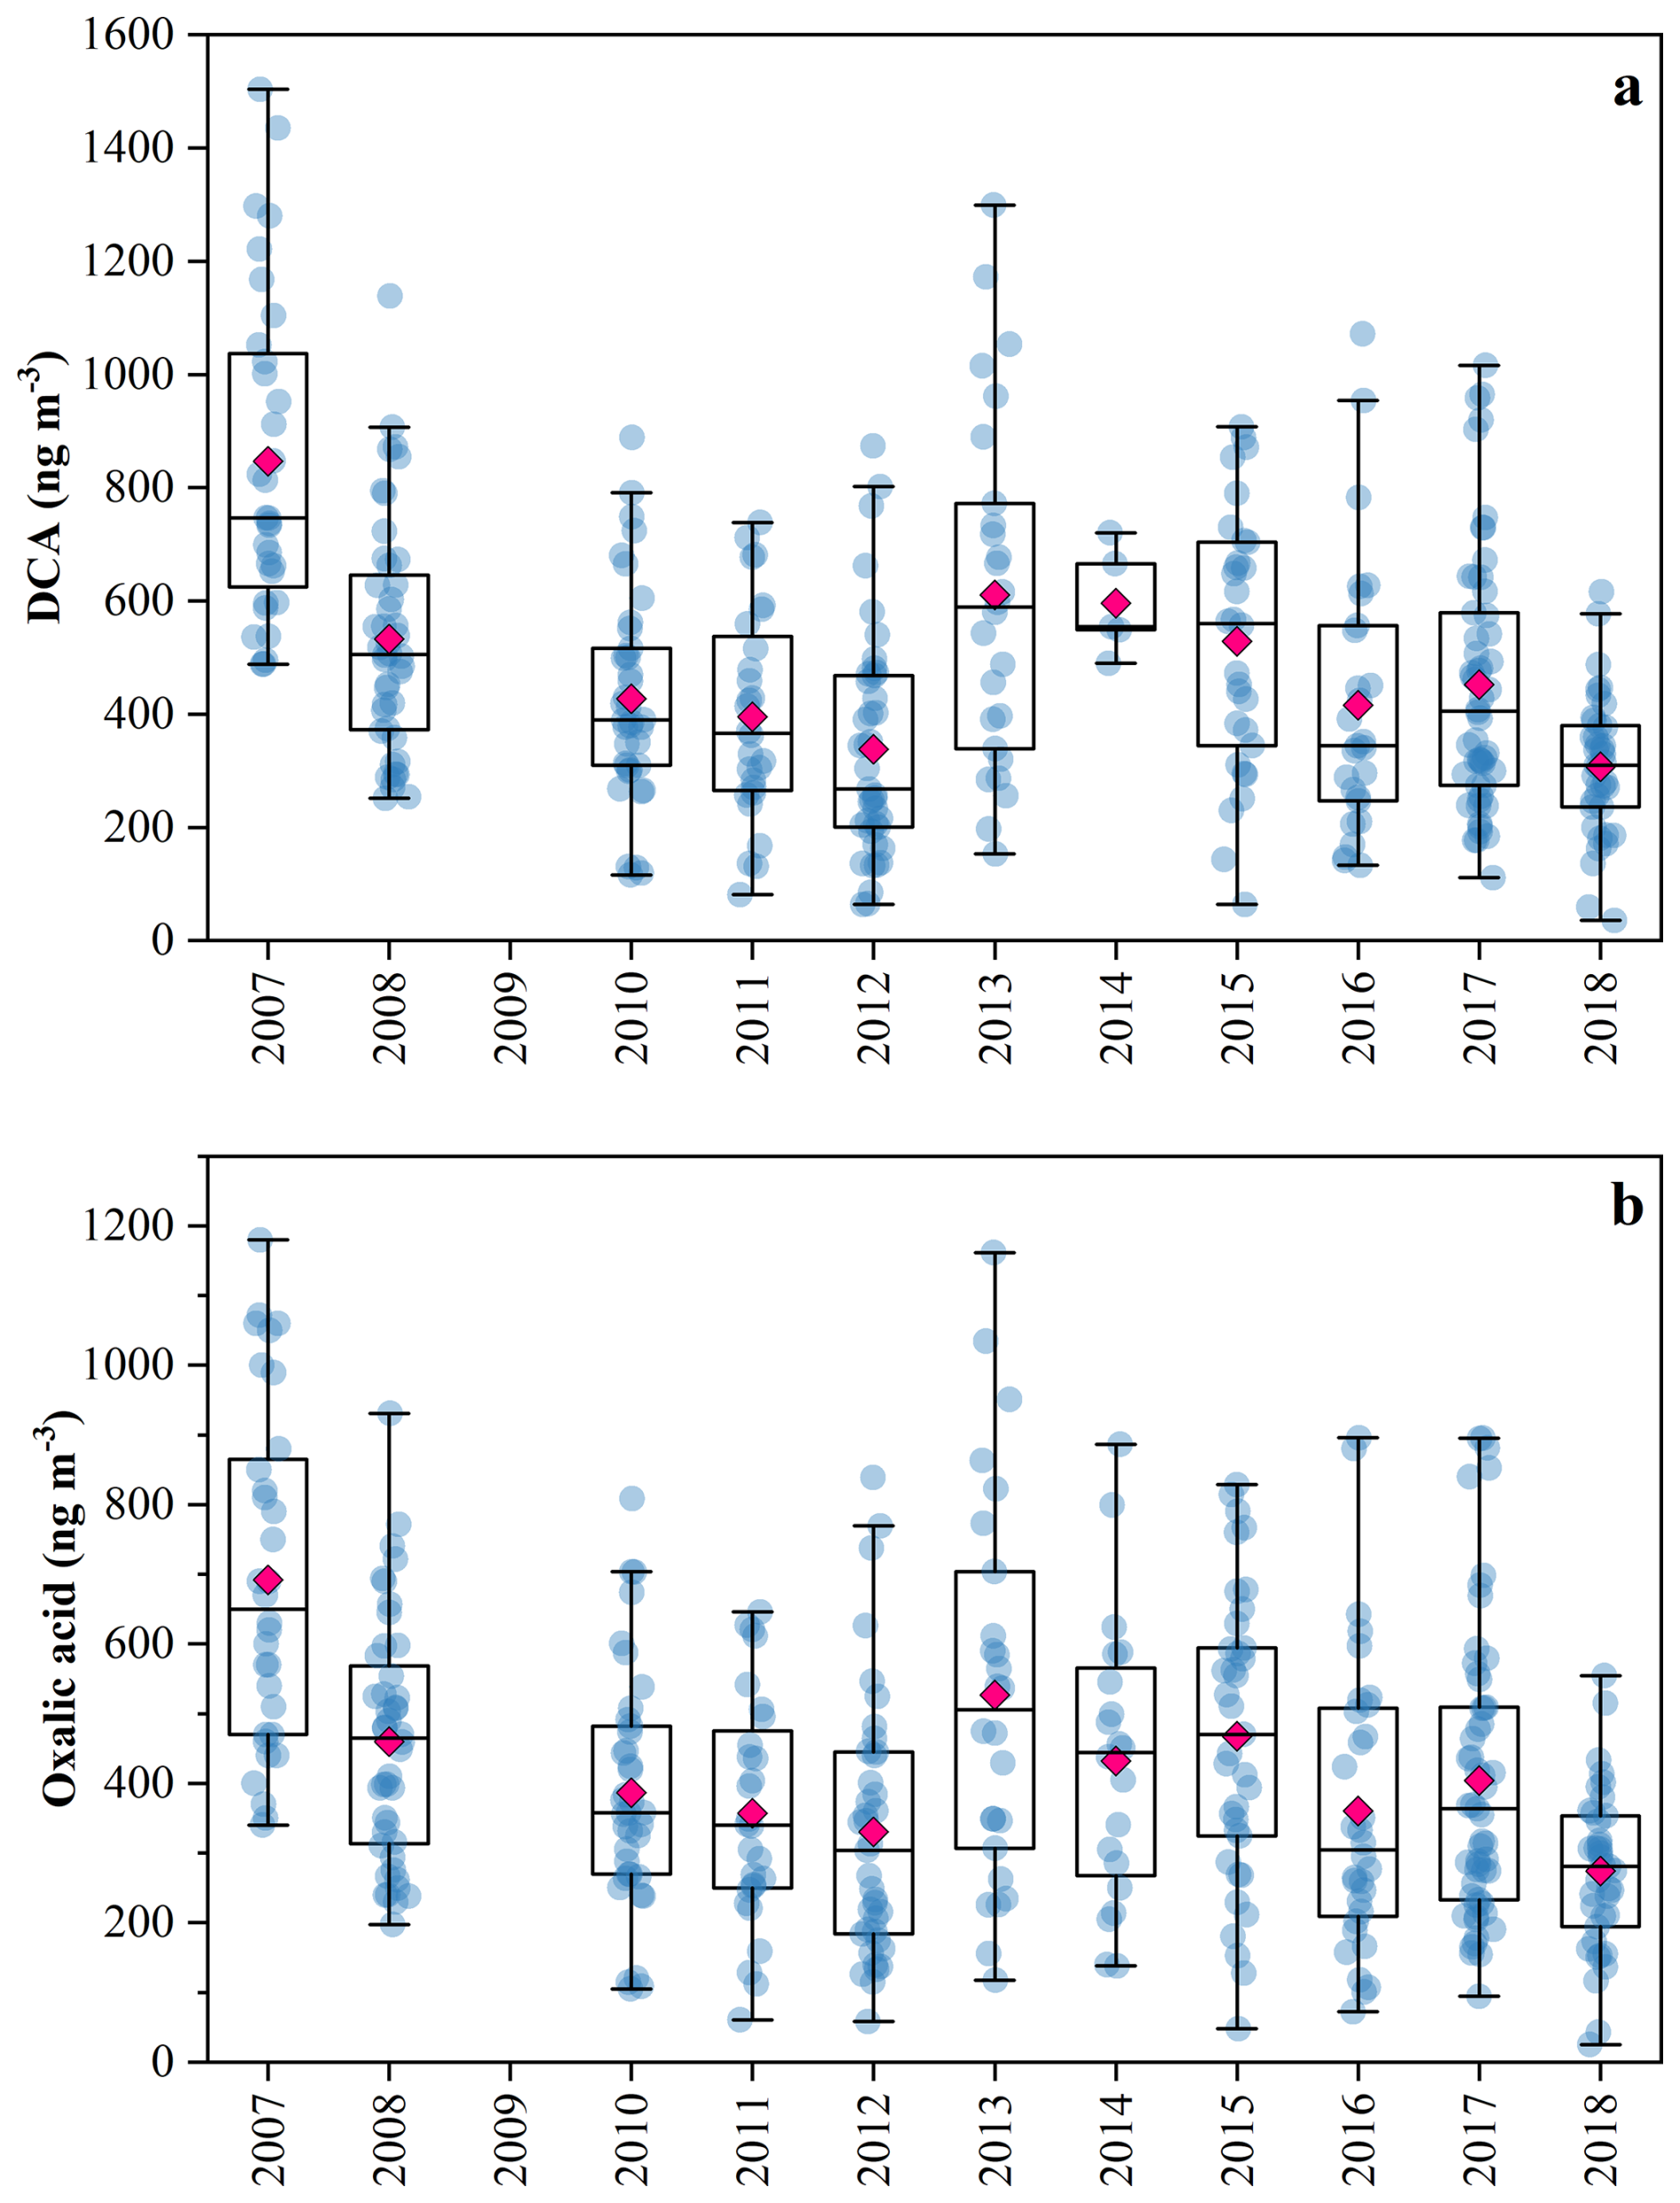
Figure 2(a) Annual variations in aliphatic DCA. (b) Annual variations in oxalic acid. Due to the absence of aliphatic DCA and oxalic acid measurements in 2009, their concentrations for that year are not presented.
Aliphatic DCA, a group of typical SOA molecular markers (Kawamura and Bikkina, 2016), were analyzed to further investigate the changes in SOA formation under decreasing pollutant levels. Although their concentrations in 2007 (864 ± 283 ng m−3) were much higher than those in 2018 (307 ± 122 ng m−3) (Fig. 2a), this downward trend was not statistically significant (p > 0.05), which was similar to the trends of other SOA markers. Unexpectedly, a rebound in the concentrations of molecular markers and aliphatic DCA was observed in 2013, which was also observed in PM2.5 and its major component (He et al., 2025). This rebound was unlikely driven by meteorological variability, as inter-annual differences in key meteorological parameters were relatively small (Table S5). Similarly, another study covering multiple stations across the PRD also reported a post-2013 increase in PM2.5 (Yan et al., 2020), supporting that the rebound was not attributable to newly emerging pollution sources near our sampling site. Unfortunately, until now, the underlying cause of this rebound remained unclear.
C2 was the most abundant compound among aliphatic DCA, accounting for 80 %–91 %, followed by C4 (4 %–13 %), and C9 (1 %–4 %). Therefore, the overall trend of aliphatic DCA was primarily driven by C2 (Fig. 2b), and subsequent discussions will focus on C2. Its concentration declined from 692 ± 243 (2007) to 274 ± 114 (2018), but did not exhibit a clear trend (p > 0.05). Carbon monoxide (CO) can be used as a normalization tracer to assess the influence of atmospheric dilution. As shown in Fig. S3 in the Supplement, the temporal trends of DCA and C2 normalized by CO are consistent with their original trends, indicating that atmospheric dilution had a limited influence on their observed variations. To further explore the changes of SOA formation under different pollution conditions, our samples were divided into five categories according to interim targets recommended by the Worle Health Organization (WHO) in 2021 (World Health Organization, 2021): IT0 ( PM2.5 > 75 µg m−3), IT1 (75 µg m−3 > PM2.5 > 50 µg m−3), IT2 (50 µg m−3 > PM2.5 > 37.5 µg m−3), IT3 (37.5 µg m−3 > PM2.5 > 25 µg m−3), and IT4 (PM2.5 < 25 µg m−3). We found that the molecular markers and C2 decreased significantly (p < 0.01) from IT0 to IT4 (Table S6 in the Supplement). However, the ratio of C2 to PM2.5 () increased from 6.8 × 10⁻³ to 10.3 × 10⁻³ (p < 0.01, Fig. S4 in the Supplement), suggesting that the relative importance of SOA increased as pollution levels decreased.
3.2 Sources and driving factors of oxalic acid
The ratio of C2 to C4 () has been used as an indicator for the aging degree of DCA and C2 (Bikkina et al., 2015; Bikkina et al., 2017; Zhao et al., 2020; Meng et al., 2023), because the photochemical degradation of C4 can lead to C3, and C3 can be photochemically oxidized into C2 via intermediates (Kawamura and Bikkina, 2016). In this study, (21.9 ± 18.0) was significantly higher than those reported for primary sources, such as fossil fuel emission (4.1) (Kawamura and Kaplan, 1987) and biomass burning (1.6) (Cao et al., 2017). This indicated that C2 was highly aged and mainly formed through secondary processes rather than being directly emitted from primary sources in this study. The ratio was comparable to those observed at a rural site of the PRD (15.4–21.0) (Xu et al., 2022), but substantially higher than those reported in urban areas of North China, such as Jinan (8.4 ± 3.4) (Meng et al., 2023), Tianjin (4.5–6.1) (Pavuluri et al., 2021), Xi'an (4.6–8.0) (Wang et al., 2012), and Beijing (4.7–8.6) (Zhao et al., 2018). This was likely related to elevated temperature (above 20 °C), solar radiation (95.3–161.3 W m−2), and relative humidity (∼ 60 %) in the PRD (Table S5), which led to a higher degree of aerosol aging.
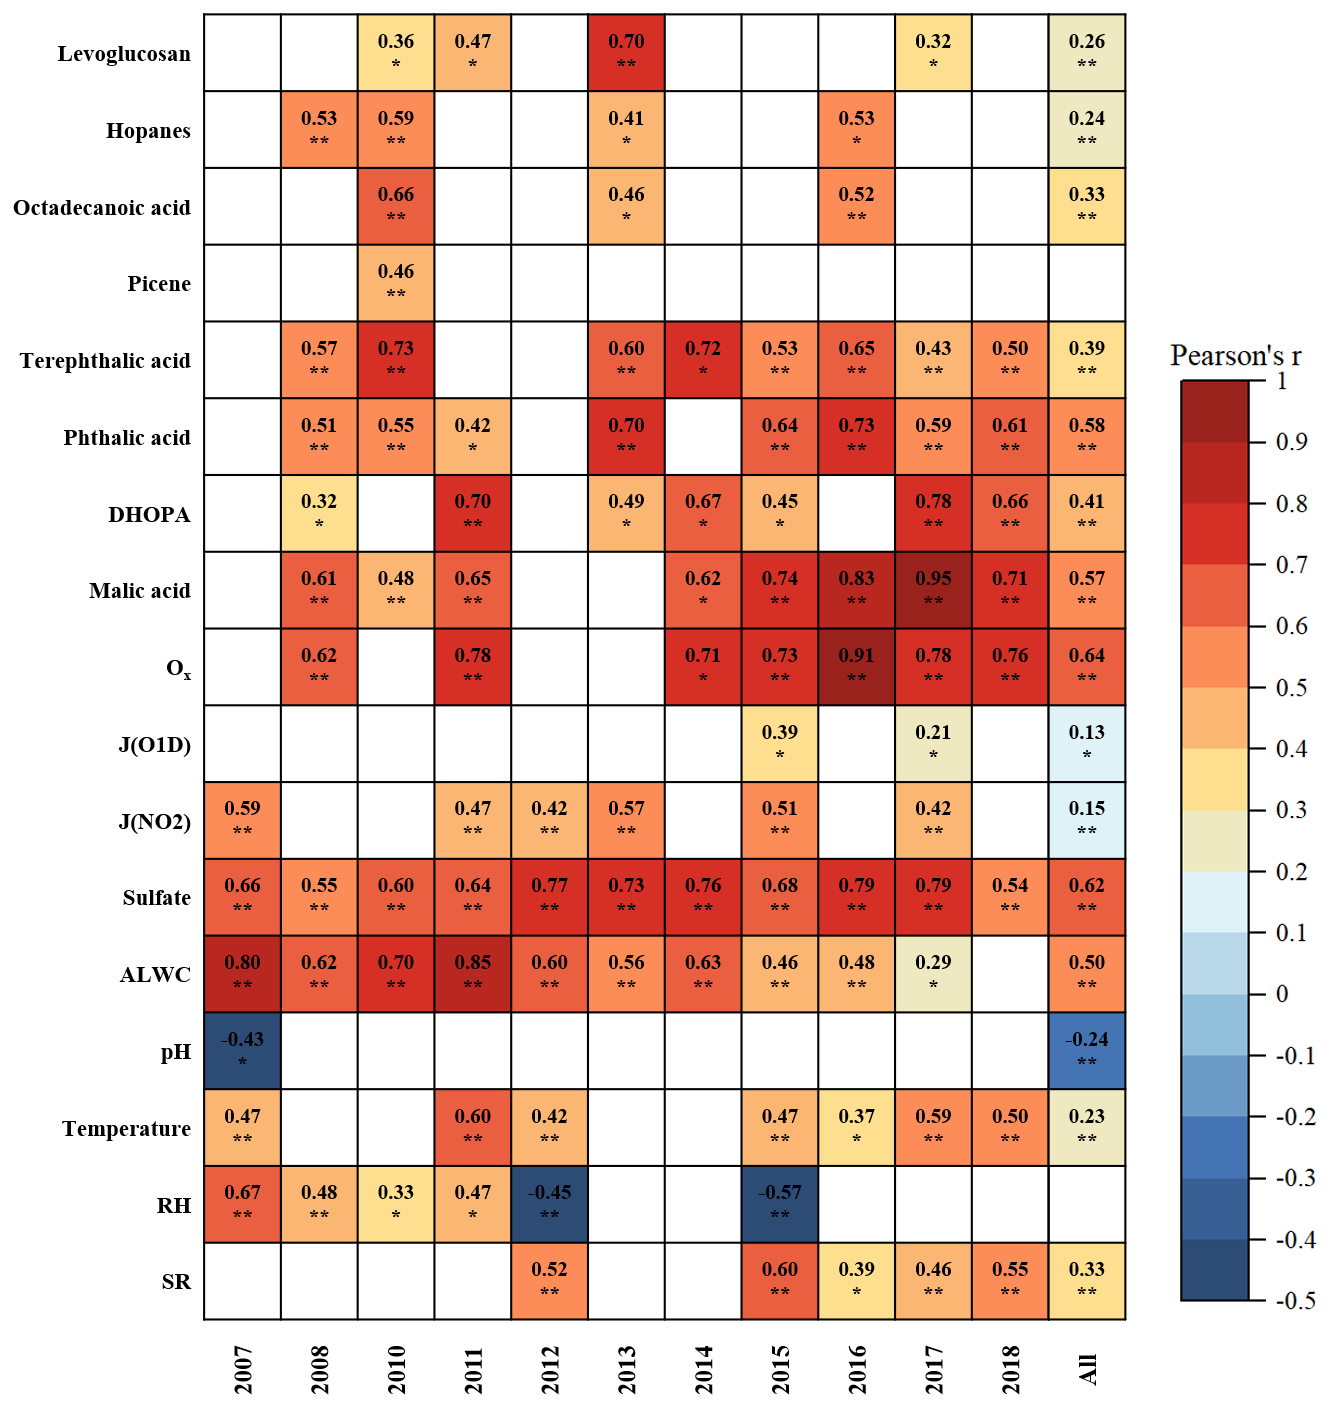
Figure 3Correlations between C2 and primary anthropogenic source markers, SOA markers, indicators for gas- and aqueous-phase oxidation, as well as meteorological parameters. Blank cells indicate no significant correlations. One asterisk, two asterisks denote p value < 0.05, 0.01, respectively. Due to the unavailability of Ox data in 2012 and 2013, correlation analysis was not conducted for these 2 years.
The results of correlation analysis are presented in Fig. 3. The correlation coefficients between C2 and SOA tracers (phthalic acid, DHOPA, and malic acid) were relatively higher (r = 0.58, 0.41, and 0.57, respectively; p < 0.01), further supporting that C2 was primarily formed via secondary oxidation processes. Meng et al. (2023) reported an unexpected enhancement of C2 during the COVID-19 pandemic, when anthropogenic emissions were substantially reduced. This reflected limited influence of reductions in anthropogenic organic precursors on formation of C2. Similarly, we found that anthropogenic emissions experienced substantial reductions during our campaign period (discussed in Sect. 3.1), while C2 did not show a corresponding significant decreasing trend. Although strong correlations between C2 and primary anthropogenic source markers were observed in certain individual years, the correlations remained weak across the entire dataset. These findings implied that the changes in anthropogenic emissions were not the driving factors for C2 formation in this study. Because our field measurements were conducted in the same season each year (from October to December), the inter-annual differences in meteorological conditions were small. This resulted in consistently weak correlations observed between C2 and meteorological parameters such as temperature, SR, and RH. Therefore, we concluded that the changes in meteorology were too small to be the driving factors for C2 formation.
Notably, the correlations between C2 and malic acid strengthened progressively with the reductions in anthropogenic emissions (from 2007 to 2018). This trend became more apparent when the data were categorized by pollution levels, with the correlation coefficients increased from 0.33 (IT0) to 0.72 (IT4) (Table S7 in the Supplement). As discussed previously, malic acid can be produced by photooxidation of both anthropogenic and biogenic precursors. However, no corresponding increasing trends were observed in the correlations between C2 and ASOA tracers (Ph and DHOPA), supporting that anthropogenic precursors were not the dominant source of malic acid in this study. Thus, these results indicated that the relative contributions of biogenic sources to SOA become more important under cleaner conditions.
ALWC not only regulates the gas-particle partitioning of semi-volatile VOCs and their reaction rates by acting as a medium (Nenes et al., 2021), but also serves as a nucleophile that participates in reactive uptake of SOA intermedium (Zhang et al., 2022b). Aerosol pH plays a crucial role in governing acid-catalyzed reactions during aqueous-phase processing (Cooke et al., 2024). In addition, sulfate is also an important secondary product formed through aqueous oxidation (Liu et al., 2021). Ox, a proxy of atmospheric oxidants, facilitates secondary photochemical oxidation of VOCs. J(O1D) and J(NO2) represent photolysis frequencies of O3 and NO2 (Ehhalt and Rohrer, 2000). Accordingly, ALWC, pH, and sulfate were employed as indicators for aqueous-phase oxidation , while Ox, J(O1D), and J(NO2) were used as indicators for gas-phase oxidation. In this study, C2 showed strong correlations with ALWC (r = 0.50, p < 0.01), sulfate (r = 0.62, p < 0.01), and Ox (r = 0.64, p < 0.01) across the whole datasets, suggesting secondary oxidation processes were the dominant drivers of C2 variability between 2007 and 2018.
3.3 Gas-phase and aqueous-phase pathways of oxalic acid formation
Atmospheric oxidation of VOCs, such as aromatics, isoprene, and monoterpenes, with ozone and/or hydroxyl radicals produces semi-volatile gaseous organic precursors (e.g., mGly and Gly). These α-dicarbonyls partition into ALWC-enriched aerosols and the subsequent aqueous-phase reactions produce Pyr and ωC2, which are further oxidized to form C2 (Ervens et al., 2008; Bikkina et al., 2017). In addition, several studies have also demonstrated that C2 can be formed through the photochemical degradation of longer-chain DCA (e.g., C3 and C4) in the gas phase (Kawamura and Bikkina, 2016; Zhao et al., 2020; Meng et al., 2023). Due to the reductions in sulfate and nitrate (the highly hygroscopic compounds in PM2.5), ALWC experienced a fast downward trend between 2007 and 2012 (Table S5, Fig. S5 in the Supplement). This hindered the partitioning of semi-volatile gaseous organic precursors from the gas phase into the aqueous phase, thereby slowing the aqueous-phase production of C2. As a result, an obvious decline in C2 concentrations was observed during 2007–2012 (Fig. 2). Because ALWC exhibited minor fluctuations between 2013 and 2018, the influence of aqueous-phase pathway on C2 became weaker.
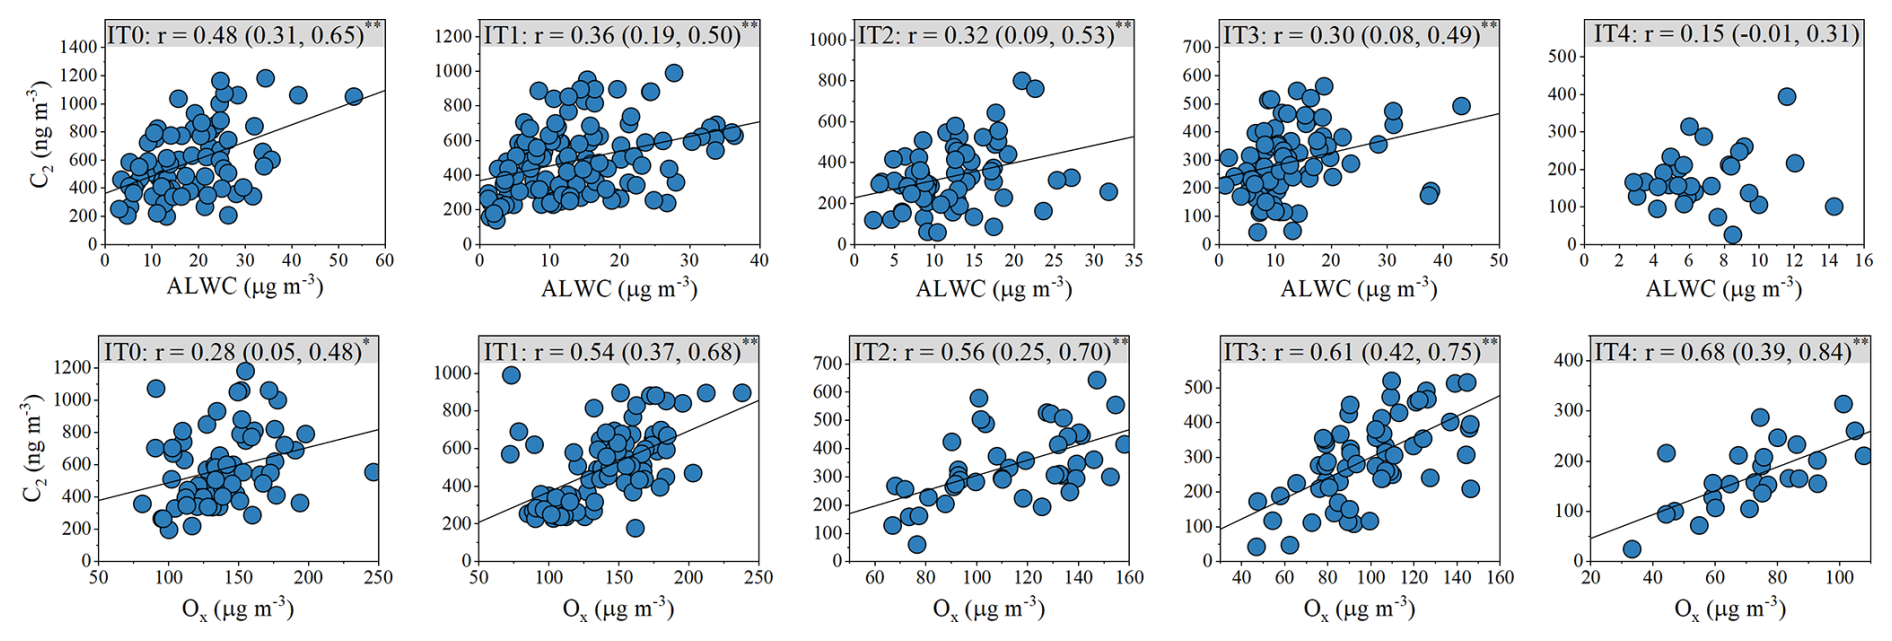
Figure 4The correlation between C2 and ALWC, as well as Ox. The values in brackets indicate the 95 % confidence intervals (CIs) of the correlation coefficients. One, two asterisks denote p values less than 0.05, 0.01, respectively. With decreasing pollution levels, the correlation between C2 and ALWC weakens, whereas that between C2 and Ox strengthens.
As presented in Fig. 3, the correlations between C2 and ALWC weakened, whereas that between C2 and Ox strengthened from 2007 to 2018. It is noteworthy that no significant correlations were observed between C2 and Ox in 2007 and 2010, when ALWC concentrations were high. In contrast, a strong correlation (r = 0.62, p < 0.01) emerged in 2008, coinciding with a sharp decrease in ALWC (Fig. S5). This suggested that the gas-phase formation pathway of C2 might be enhanced when ALWC was low. The pattern became more pronounced with decreasing pollution levels (Fig. 4). From IT0 to IT4, ALWC decreased from 20.9 ± 11.0 to 7.2 ± 3.0 µg m−3 (Table S6). The Pearson's r values between C2 and ALWC dropped from 0.48 to 0.15, whereas that between C2 and Ox increased from 0.28 to 0.68. The opposite trends implied the roles of gas-phase and aqueous-phase oxidation in C2 formation might change. However, the precision and stability of Pearson's r values are strongly influenced by sample size when the variations appear small or when sample sizes differ among groups. Therefore, the differences in Pearson's r values do not necessarily imply statistically significant changes, especially when they are very close (IT1–IT4). To assess the statistical significance of these differences, we compared correlation coefficients between groups using the method described in Sect. S1 in the Supplement. As shown in Tables S8 and S9 in the Supplement, significant differences in the C2-Ox correlation were observed only between IT0 and the other pollution levels. For the C2-ALWC correlation, a significant difference was found only between IT0 and IT4. Given that IT1–IT4 represents a continuous evolution of atmospheric conditions, rather than discrete and independent regimes, large differences in correlation coefficients among these categories are not expected. Although the correlation between C2 and sulfate was strong, it did not show the similar trends as that between C2 and ALWC. In contrast, the correlations between C2 and primary anthropogenic markers remained generally weak across all pollution categories (Table S7), indicating that changes in anthropogenic emissions exert only limited influence on C2 variations. Therefore, the significant and opposite changes in correlations of C2 with Ox and ALWC between high pollution level (IT0) and low pollution level (IT4) suggested a shift in the dominant C2 formation pathway from aqueous-phase oxidation to gas-phase photochemical oxidation under lower pollution conditions.
The Pearson correlation coefficients reflect the strength of linear associations but do not directly represent the quantitative contribution of each factor. Thus, the lower Pearson's r values between C2 and ALWC than those between C2 and Ox under IT1-IT4 do not necessarily imply a smaller impact of aqueous-phase pathways compared with gas-phase pathways. Here, correlation analysis is used primarily to identify potential drivers and their changing patterns, while a machine learning model is further applied to quantify their impacts to C2 variations.
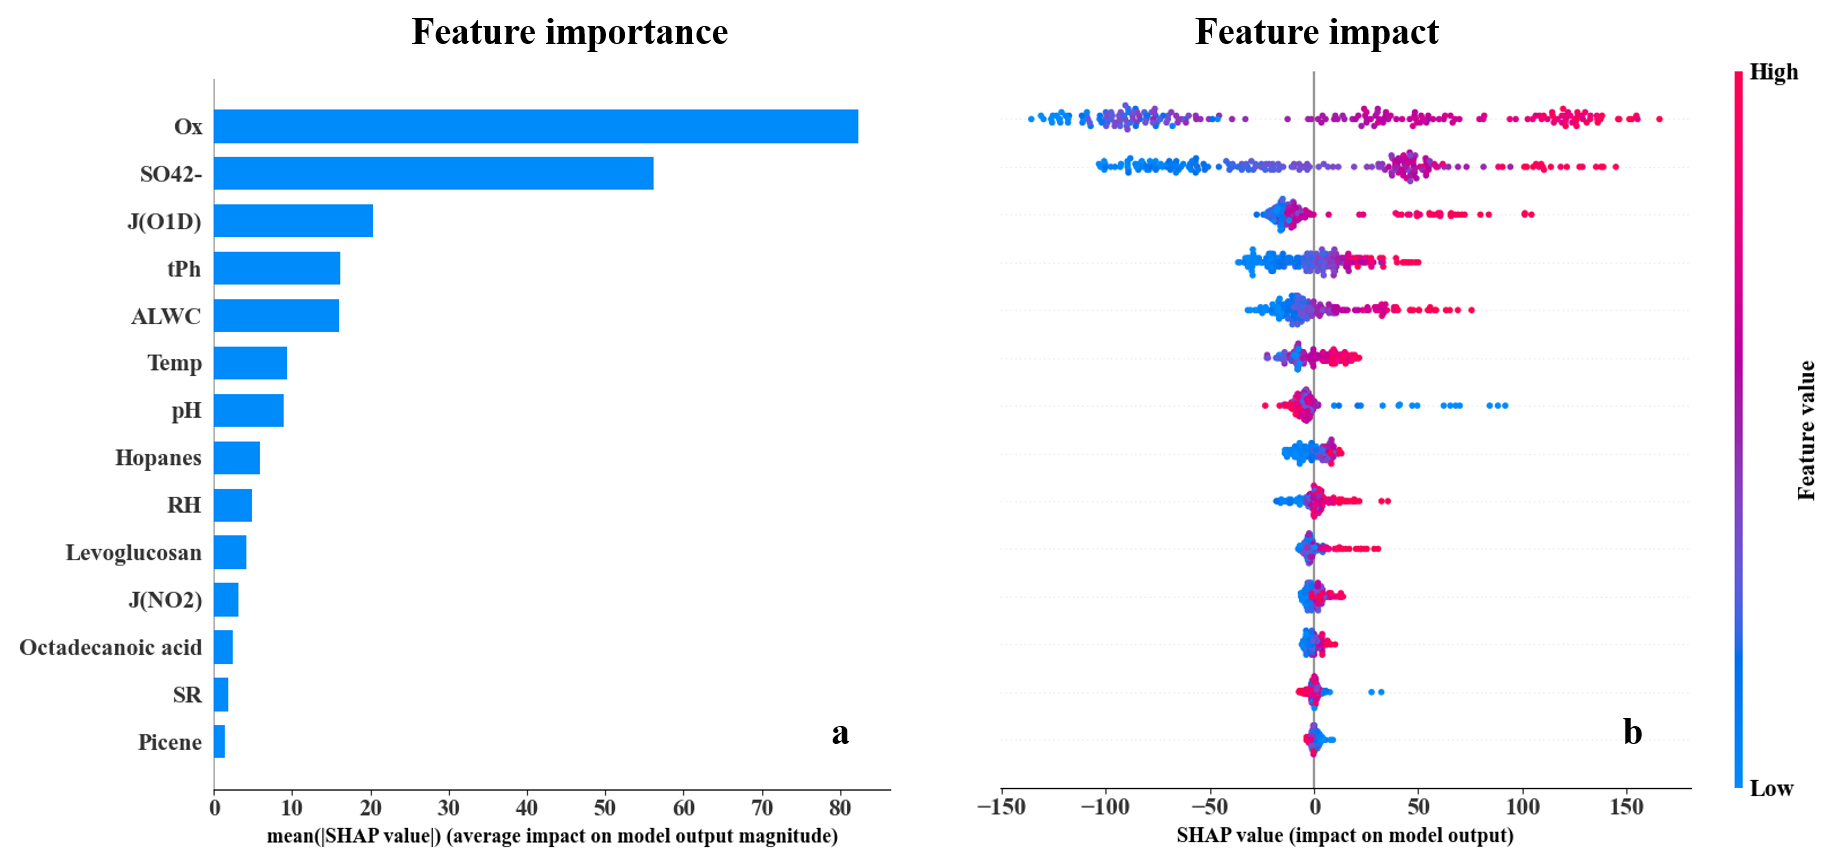
Figure 5(a) Bar plot of the mean |SHAP| values representing the overall importance of each feature in predicting C2 concentrations. (b) Beeswarm plot of individual SHAP values for each feature across all samples. Red (blue) represents high (low) value in each feature. Positive (negative) SHAP values indicate that the feature contributes to an increase (decrease) in the C2 prediction.
3.4 Evaluate the impacts of different factors on oxalic acid formation
We identified ALWC and Ox as the dominant drivers for C2 variation based on annual variations and linear correlation analysis. Although pH has been suggested to play an important role in heterogeneous uptake and acid-catalyzed reactions (Xu et al., 2016; Cooke et al., 2024), it did not exhibit a strong correlation with C2 (r = −0.24, p < 0.01). This was likely due to their non-linear relationship. In addition, correlation analysis is unable to quantify the influences of changes in each factor. Hence, we used a machine learning model to further evaluate the impacts of changes in individual factor on C2 variation during our study period. The details about the model used in this study can be seen in Sect. 2.4 and elsewhere (Chen et al., 2016; Lundberg and Lee, 2017).
The rationality for selecting the variables used to train the model need to be clarified to ensure the reliability of the results. Levoglucosan, hopanes, octadecanoic acid, picene, and tPh serve as source-specific molecular markers for biomass burning, vehicle emission, cooking, coal combustion, and waste incineration, respectively. These species are used to represent changes in AVOC emissions. As two of the most important BVOCs globally, isoprene emission is highly dependent on temperature and solar radiation, while monoterpenes emission is sensitive to temperature (Guenther et al., 1993). Their emissions rate can be estimated using Eqs. (3)–(5) and Eq. (6), respectively:
where Ei is isoprene emission rate at a temperature T (K) and photosynthetically active radiation (PAR) flux L (), Is is isoprene emission rate at a standard temperature TS and a standard PAR flux (1000 ). α = 0.0027 and cL1 = 1.066 are empirical coefficients determined by measurements. L can be calculated as multiplying solar radiation (W m−2) by photon flux efficacy (1.86 µmol J−1). R is a constant −8.314 , and cT1 = 95 000 J mol−1, cT2 = 230 000 J mol−1, and TM = 314 K are empirical coefficients estimated by measurements.
where Em is monoterpenes emission rate at temperature T (K), Ms is monoterpenes emission rate at a standard temperature TS, β (K−1) is an empirical coefficient ranging from 0.057 to 0.144 K−1. In addition, inadequate moisture can have significantly decreased stomatal conductance and photosynthesis (Guenther et al., 2006). Therefore, temperature, solar radiation, and RH are important factors determining BVOC emissions. As discussed previously, Ox, J(O1D), and J(NO2) can be employed as indicators of gas-phase oxidation, while ALWC, pH, and sulfate are used as indicators of aqueous-phase processes. To avoid redundant and confounding explanations, the secondary organic molecular markers, such as DHOPA, Ph, and malic acid, were excluded from the model training. These species are influenced by both VOC emissions and secondary oxidation processes, which are already represented by the factors mentioned above.
The feature importance is presented in Fig. 5a. Ox, sulfate, and J(O1D), which represent secondary oxidation processes, exhibited the three highest |SHAP| values, indicating their dominant impacts on C2 variation. Although pH and ALWC exhibited relatively high feature importance among all variables, their |SHAP| values were lower than sulfate. This is because pH and ALWC in this study was calculated by a thermodynamic equilibrium model, ISORROPIA II (Nenes et al., 1998), in which sulfate plays a crucial role and partly reflects variations in both pH and ALWC. In contrast, the feature importance of anthropogenic emission markers and meteorological parameters were relatively lower, suggesting that the impacts of AVOC and BVOC emissions were smaller compared to that of secondary processes. As shown in Fig. 5b, Ox, sulfate, and J(O1D) exhibited obviously positive correlations with their SHAP values, indicating that higher values of these variables contributed to increases in C2 concentrations. However, pH showed a negative correlation with its SHAP values, suggesting that lower pH levels were associated with higher C2 concentrations. Notably, the influence of extremely low pH on C2 formation appeared to be more pronounced.
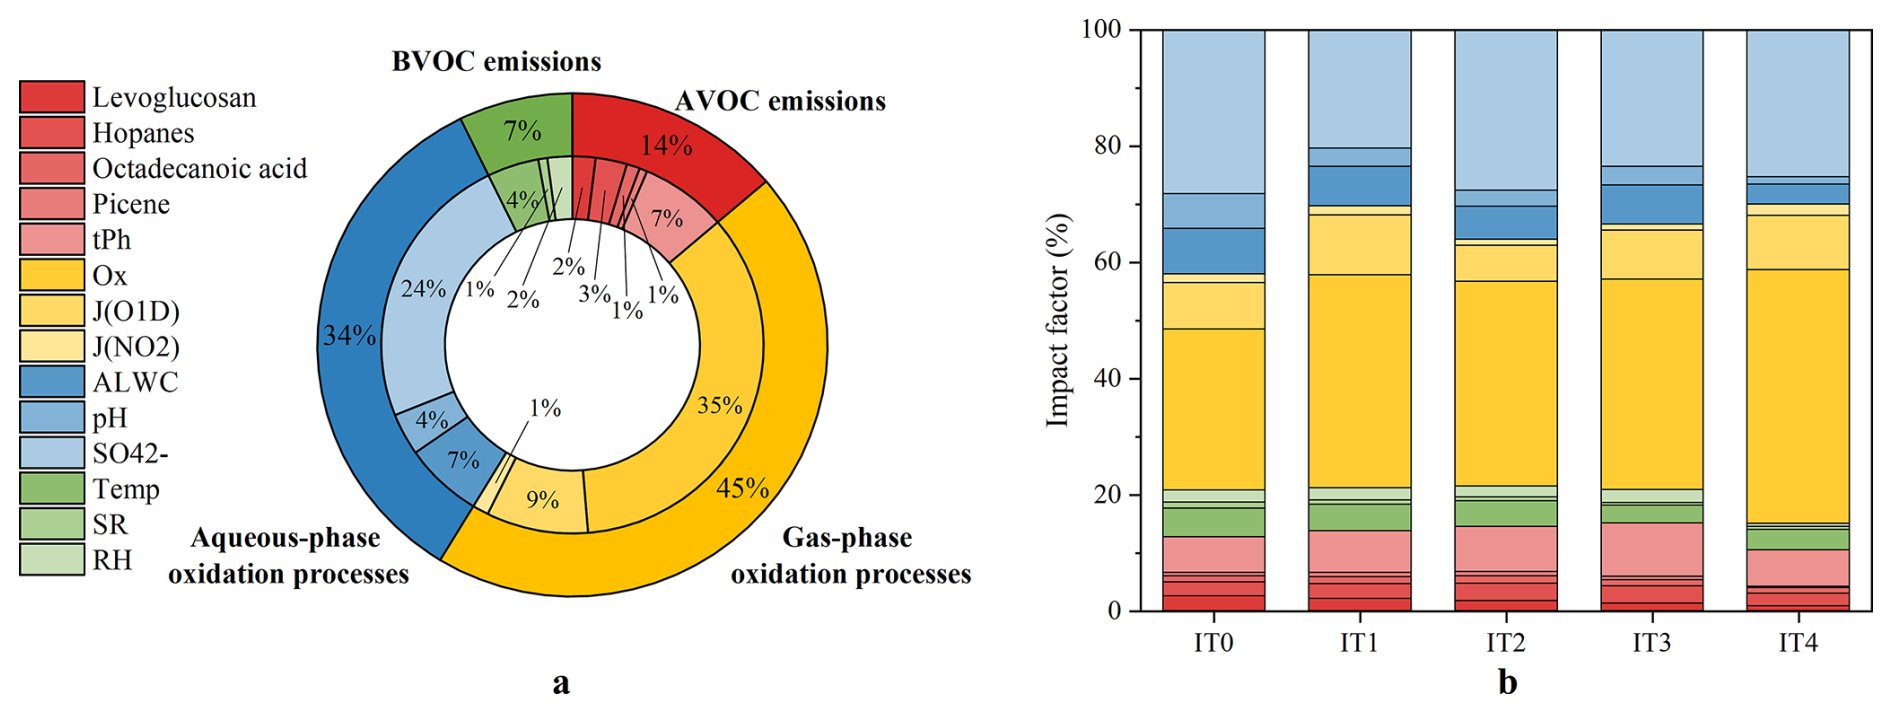
Figure 6(a) Impacts of changes in each variable on C2 variation during the whole study period. (b) Impact factor of individual variable under different pollution conditions.
To further quantify the impacts of changes in all factors on C2, IF (discussed in Sect. 2.4) was calculated and presented in Fig. 6. Ox accounted for the highest IF (35 %), followed by sulfate (24 %) and J(O1D) (9 %). All factors were classified into four groups according to their representativeness mentioned before: (1) AVOC emissions (levoglucosan, hopanes, octadecanoic acid, picene, and tPh); (2) BVOC emissions (Temp, SR, and RH); (3) gas-phase oxidation pathways (Ox, J(O1D), and J(NO2)); (4) aqueous-phase oxidation pathways (ALWC, pH, and sulfate). Due to the minor fluctuations of meteorological conditions in each year, the impacts of changes in BVOC emissions on C2 were small (7 %). Although AVOC emissions showed an obvious decreasing trend over the study period, the impacts of these changes (14 %) were significantly lower than that of gas-phase oxidation processes (45 %) and aqueous-phase oxidation processes (34 %). The results were consistent with correlation analysis, underscoring the dominant role of secondary oxidation processes in C2 formation.
The IF values for each variable are presented in Table S10 in the Supplement. From IT0 to IT4, IF values for gas-phase oxidation processes increased from 37 % to 55 %, whereas those for aqueous-phase oxidation processes decreased from 42 % to 30 % (Fig. 6b). Meanwhile, IF values for AVOC (10 %–15 %) and BVOC emissions (5 %–8 %) remained at a low and stable level. These findings indicated that the gas-phase oxidation pathway became increasingly important as pollution levels decreased. A possible explanation is that under cleaner conditions, lower ALWC levels would suppress the partitioning of semi-volatile C2 precursors (e.g., Gly and mGly) from the gas-phase into the particle-phase (Hu et al., 2022). In addition, less ALWC participates in heterogeneous reactions of SOA intermedium as a nucleophile. Thus, their aqueous-phase pathway was hindered, and more C2 was formed via photochemical degradation of longer-chain DCA (Kawamura and Bikkina, 2016; Meng et al., 2023). This indicated the growing importance of gas-phase oxidation processes in the formation of C2 and SOA under cleaner conditions. Although Ox did not exhibit a clear trend at our measurement station, Cao et al. (2024) reported a rapid increase in O3 concentration across the PRD region over the past decade. This may promote SOA formation through enhanced gas-phase oxidation pathways. Therefore, coordinated control of VOCs and NOx should be emphasized (Wang et al., 2021b) in the future to reduce ozone pollution and further mitigate SOA formation.
In this study, long-term measurements were conducted at a regional background site in the PRD region during 2007–2018. Primary and secondary molecular markers were measured, including five primary anthropogenic source molecular markers (levoglucosan, hopanes, octadecanoic acid, picene, and terephthalic acid), three SOA markers (phthalic acid, DHOPA, and malic acid), and a group of general SOA indicators (aliphatic DCA). C2, the most abundant compound among aliphatic DCA, was investigated to identify the key drivers for SOA variability. Previous studies have attributed elevated C2 to higher emissions of its organic precursors (Cao et al., 2017; Ding et al., 2021; Yu et al., 2021) and emphasized the dominance of aqueous-phase pathways in C2 formation (Yu et al., 2005; Hilario et al., 2021). However, our results showed that reductions in anthropogenic organic precursors had a limited influence on C2 formation. In addition, we found a growing importance of gas-phase oxidation to C2 and SOA formation under cleaner conditions.
Between 2007 and 2018, C2 and other SOA molecular markers did not show clear trends, despite substantial reductions in anthropogenic emissions, such as biomass burning (−11 % yr−1), vehicle emissions (−17 % yr−1), and cooking emissions (−7 % yr−1). Correlation analysis revealed that ALWC and Ox were the dominant drivers for C2 variations. In addition, the correlation between malic acid and C2 became stronger from high to low pollution conditions (from IT0 to IT4), underscoring an increasing relative contribution of BSOA in SOA. We applied a machine learning model to further quantify the impacts of changes in AVOC emissions, BVOC emissions, aqueous-phase oxidation processes, and gas-phase oxidation processes. The model results showed that, although AVOC emissions showed an obvious decreasing trend over the study period, the impacts of these changes (14 %) were significantly lower than that of gas-phase oxidation processes (45 %) and aqueous-phase oxidation processes (34 %). With decreasing pollutant levels, the impacts of gas-phase oxidation processes increased from 37 % to 55 %, whereas that of aqueous-phase oxidation processes declined from 42 % to 30 %. This probably resulted from the low ALWC hindered partitioning of semi-volatile precursors (e.g., Gly and mGly) from gas phase to particle phase, thereby suppressing their aqueous-phase reactions and enhancing the gas-phase photochemical degradation of longer-chain DCA (e.g., C3 and C4). Meanwhile, the impacts of changes in AVOC (10 %–15 %) and BVOC emissions (5 %–8 %) were minor. Our results provide critical insights that improve the accuracy of atmospheric modeling of C2, advance understanding of SOA formation mechanisms under different pollution levels, and support the formulation of more targeted pollution mitigation strategies in the future. Meanwhile, we acknowledge there are several limitations in this study. First, our measurements were mainly conducted in wintertime, which may not represent summertime conditions when photochemical activity is higher. Second, there are other factors influencing the formation of aqueous-phase products other than pH and ALWC, similar to gas-phase products. However, due to unavailability of related data in this study, such as transition metals and hydroxyl radical in aqueous phase, we were unable to quantify their impacts on variations of C2, which may introduce uncertainties.
The continuous increase of O3 over the past decade in the PRD poses a growing challenge to further improvements in particulate pollution. As gas-phase oxidation processes become more important in SOA formation under a cleaner environment, coordinated control of both NOx and VOCs is essential for mitigating O3 pollution and achieving further reductions in SOA in the PRD region.
The experimental data in this study are available upon request to the corresponding author by email.
The supplement related to this article is available online at https://doi.org/10.5194/acp-26-1093-2026-supplement.
XD conceived the project and designed the study. YH performed the data analysis and wrote the paper. YZ, MB, DC, TZ, KY, JW, QC, and HJ arranged the sample collection and assisted with the data analysis. ZW and PL analyzed the samples. XD, QH, XW, and MB performed the data interpretation and edited the paper. All authors contributed to the development of the final paper.
At least one of the (co-)authors is a member of the editorial board of Atmospheric Chemistry and Physics. The peer-review process was guided by an independent editor, and the authors also have no other competing interests to declare.
Publisher's note: Copernicus Publications remains neutral with regard to jurisdictional claims made in the text, published maps, institutional affiliations, or any other geographical representation in this paper. The authors bear the ultimate responsibility for providing appropriate place names. Views expressed in the text are those of the authors and do not necessarily reflect the views of the publisher.
We thank the National Natural Science Foundation of China and the Guangdong Foundation for Program of Science and Technology Research for funding this research. We also gratefully acknowledge the City of Lahti for its financial support.
This research was funded by the National Natural Science Foundation of China (grant nos. 42321003 and 42177090), Guangdong Foundation for Program of Science and Technology Research (grant nos. 2023B0303000007, 2023B1212060049, and 2024A1515011181).
This paper was edited by Qi Chen and reviewed by two anonymous referees.
Bian, Y., Huang, Z., Ou, J., Zhong, Z., Xu, Y., Zhang, Z., Xiao, X., Ye, X., Wu, Y., Yin, X., Li, C., Chen, L., Shao, M., and Zheng, J.: Evolution of anthropogenic air pollutant emissions in Guangdong Province, China, from 2006 to 2015, Atmos. Chem. Phys., 19, 11701–11719, https://doi.org/10.5194/acp-19-11701-2019, 2019.
Bikkina, S., Kawamura, K., Imanishi, K., Boreddy, S. K. R., and Nojiri, Y.: Seasonal and longitudinal distributions of atmospheric water-soluble dicarboxylic acids, oxocarboxylic acids, and α-dicarbonyls over the North Pacific, Journal of Geophysical Research-Atmospheres, 120, 5191–5213, https://doi.org/10.1002/2014JD022972, 2015.
Bikkina, S., Kawamura, K., and Sarin, M.: Secondary Organic Aerosol Formation over Coastal Ocean: Inferences from Atmospheric Water-Soluble Low Molecular Weight Organic Compounds, Environ. Sci. Technol., 51, 4347–4357, https://doi.org/10.1021/acs.est.6b05986, 2017.
Bikkina, S., Kawamura, K., Sakamoto, Y., and Hirokawa, J.: Low molecular weight dicarboxylic acids, oxocarboxylic acids and α-dicarbonyls as ozonolysis products of isoprene: Implication for the gaseous-phase formation of secondary organic aerosols, Sci. Total Environ., 769, 144472, https://doi.org/10.1016/j.scitotenv.2020.144472, 2021.
Bilde, M., Barsanti, K., Booth, M., Cappa, C. D., Donahue, N. M., Emanuelsson, E. U., McFiggans, G., Krieger, U. K., Marcolli, C., Topping, D., Ziemann, P., Barley, M., Clegg, S., Dennis-Smither, B., Hallquist, M., Hallquist, Å. M., Khlystov, A., Kulmala, M., Mogensen, D., Percival, C. J., Pope, F., Reid, J. P., Ribeiro da Silva, M. A. V., Rosenoern, T., Salo, K., Soonsin, V. P., Yli-Juuti, T., Prisle, N. L., Pagels, J., Rarey, J., Zardini, A. A., and Riipinen, I.: Saturation Vapor Pressures and Transition Enthalpies of Low-Volatility Organic Molecules of Atmospheric Relevance: From Dicarboxylic Acids to Complex Mixtures, Chem. Rev., 115, 4115–4156, https://doi.org/10.1021/cr5005502, 2015.
Cao, F., Zhang, S.-C., Kawamura, K., Liu, X., Yang, C., Xu, Z., Fan, M., Zhang, W., Bao, M., Chang, Y., Song, W., Liu, S., Lee, X., Li, J., Zhang, G., and Zhang, Y.-L.: Chemical characteristics of dicarboxylic acids and related organic compounds in PM2.5 during biomass-burning and non-biomass-burning seasons at a rural site of Northeast China, Environ. Pollut., 231, 654–662, https://doi.org/10.1016/j.envpol.2017.08.045, 2017.
Cao, T., Wang, H., Chen, X., Li, L., Lu, X., Lu, K., and Fan, S.: Rapid increase in spring ozone in the Pearl River Delta, China during 2013–2022, npj Clim. Atmos. Sci., 7, 309, https://doi.org/10.1038/s41612-024-00847-3, 2024.
Chen, T. Q., Guestrin, C., and Assoc Comp, M.: XGBoost: A Scalable Tree Boosting System, in: 22nd ACM SIGKDD International Conference on Knowledge Discovery and Data Mining (KDD), San Francisco, CA, 13–17 August, WOS:000485529800092, 785–794, https://doi.org/10.1145/2939672.2939785, 2016.
Cheng, Y., Ma, Y., and Hu, D.: Tracer-based source apportioning of atmospheric organic carbon and the influence of anthropogenic emissions on secondary organic aerosol formation in Hong Kong, Atmos. Chem. Phys., 21, 10589–10608, https://doi.org/10.5194/acp-21-10589-2021, 2021.
Cooke, M. E., Armstrong, N. C., Fankhauser, A. M., Chen, Y., Lei, Z., Zhang, Y., Ledsky, I. R., Turpin, B. J., Zhang, Z., Gold, A., McNeill, V. F., Surratt, J. D., and Ault, A. P.: Decreases in Epoxide-Driven Secondary Organic Aerosol Production under Highly Acidic Conditions: The Importance of Acid–Base Equilibria, Environ. Sci. Technol., 58, 10675–10684, https://doi.org/10.1021/acs.est.3c10851, 2024.
Ding, X., Wang, X.-M., Gao, B., Fu, X.-X., He, Q.-F., Zhao, X.-Y., Yu, J.-Z., and Zheng, M.: Tracer-based estimation of secondary organic carbon in the Pearl River Delta, south China, Journal of Geophysical Research-Atmospheres, 117, https://doi.org/10.1029/2011JD016596, 2012.
Ding, X., He, Q. F., Shen, R. Q., Yu, Q. Q., and Wang, X. M.: Spatial distributions of secondary organic aerosols from isoprene, monoterpenes, beta-caryophyllene, and aromatics over China during summer, Journal of Geophysical Research-Atmospheres, 119, 11877–11891, https://doi.org/10.1002/2014jd021748, 2014.
Ding, X., Zhang, Y. Q., He, Q. F., Yu, Q. Q., Wang, J. Q., Shen, R. Q., Song, W., Wang, Y. S., and Wang, X. M.: Significant Increase of Aromatics-Derived Secondary Organic Aerosol during Fall to Winter in China, Environ. Sci. Technol., 51, 7432–7441, https://doi.org/10.1021/acs.est.6b06408, 2017.
Ding, Z., Du, W., Wu, C., Cheng, C., Meng, J., Li, D., Ho, K., Zhang, L., and Wang, G.: Summertime atmospheric dicarboxylic acids and related SOA in the background region of Yangtze River Delta, China: Implications for heterogeneous reaction of oxalic acid with sea salts, Sci. Total Environ., 757, 143741, https://doi.org/10.1016/j.scitotenv.2020.143741, 2021.
Ehhalt, D. H. and Rohrer, F.: Dependence of the OH concentration on solar UV, Journal of Geophysical Research-Atmospheres, 105, 3565–3571, https://doi.org/10.1029/1999jd901070, 2000.
Ervens, B., Carlton, A. G., Turpin, B. J., Altieri, K. E., Kreidenweis, S. M., and Feingold, G.: Secondary organic aerosol yields from cloud-processing of isoprene oxidation products, Geophys. Res. Lett., 35, https://doi.org/10.1029/2007GL031828, 2008.
Geng, G. N., Xiao, Q. Y., Zheng, Y. X., Tong, D., Zhang, Y. X., Zhang, X. Y., Zhang, Q., He, K. B., and Liu, Y.: Impact of China's Air Pollution Prevention and Control Action Plan on PM2.5 chemical composition over eastern China, Science China-Earth Sciences, 62, 1872–1884, https://doi.org/10.1007/s11430-018-9353-x, 2019.
Giannoni, M., Martellini, T., Del Bubba, M., Gambaro, A., Zangrando, R., Chiari, M., Lepri, L., and Cincinelli, A.: The use of levoglucosan for tracing biomass burning in PM2.5 samples in Tuscany (Italy), Environ. Pollut., 167, 7–15, https://doi.org/10.1016/j.envpol.2012.03.016, 2012.
Guenther, A., Karl, T., Harley, P., Wiedinmyer, C., Palmer, P. I., and Geron, C.: Estimates of global terrestrial isoprene emissions using MEGAN (Model of Emissions of Gases and Aerosols from Nature), Atmos. Chem. Phys., 6, 3181–3210, https://doi.org/10.5194/acp-6-3181-2006, 2006.
Guenther, A. B., Zimmerman, P. R., Harley, P. C., Monson, R. K., and Fall, R.: Isoprene and monoterpene emission rate variability: Model evaluations and sensitivity analyses, Journal of Geophysical Research-Atmospheres, 98, 12609–12617, https://doi.org/10.1029/93JD00527, 1993.
Guo, Q., Wang, Y., Zheng, J., Zhu, M., Sha, Q. e., and Huang, Z.: Temporal evolution of speciated volatile organic compound (VOC) emissions from solvent use sources in the Pearl River Delta Region, China (2006–2019), Sci. Total Environ., 933, 172888, https://doi.org/10.1016/j.scitotenv.2024.172888, 2024.
He, L.-Y., Hu, M., Huang, X.-F., Yu, B.-D., Zhang, Y.-H., and Liu, D.-Q.: Measurement of emissions of fine particulate organic matter from Chinese cooking, Atmos. Environ., 38, 6557–6564, https://doi.org/10.1016/j.atmosenv.2004.08.034, 2004.
He, Y., Ding, X., He, Q., Zhang, Y., Chen, D., Zhang, T., Yang, K., Wang, J., Cheng, Q., Jiang, H., Wang, Z., Liu, P., Wang, X., and Boy, M.: Long-term Trends in PM2.5 Chemical Composition and Its Impact on Aerosol Properties: Field Observations from 2007 to 2020 in Pearl River Delta, South China, Atmos. Chem. Phys., 25, 13729–13745, https://doi.org/10.5194/acp-25-13729-2025, 2025.
Hilario, M. R. A., Crosbie, E., Bañaga, P. A., Betito, G., Braun, R. A., Cambaliza, M. O., Corral, A. F., Cruz, M. T., Dibb, J. E., Lorenzo, G. R., MacDonald, A. B., Robinson, C. E., Shook, M. A., Simpas, J. B., Stahl, C., Winstead, E., Ziemba, L. D., and Sorooshian, A.: Particulate Oxalate-To-Sulfate Ratio as an Aqueous Processing Marker: Similarity Across Field Campaigns and Limitations, Geophys. Res. Lett., 48, e2021GL096520, https://doi.org/10.1029/2021GL096520, 2021.
Ho, K. F., Cao, J. J., Lee, S. C., Kawamura, K., Zhang, R. J., Chow, J. C., and Watson, J. G.: Dicarboxylic acids, ketocarboxylic acids, and dicarbonyls in the urban atmosphere of China, Journal of Geophysical Research-Atmospheres, 112, https://doi.org/10.1029/2006JD008011, 2007.
Hou, L. L., Dai, Q. L., Song, C. B., Liu, B. W., Guo, F. Z., Dai, T. J., Li, L. X., Liu, B. S., Bi, X. H., Zhang, Y. F., and Feng, Y. C.: Revealing Drivers of Haze Pollution by Explainable Machine Learning, Environ. Sci. Technol. Lett., 9, 112–119, https://doi.org/10.1021/acs.estlett.1c00865, 2022.
Hu, D. and Yu, J. Z.: Secondary organic aerosol tracers and malic acid in Hong Kong: seasonal trends and origins, Environ. Chem., 10, 381–394, https://doi.org/10.1071/en13104, 2013.
Hu, J., Chen, Z., Qin, X., and Dong, P.: Reversible and irreversible gas–particle partitioning of dicarbonyl compounds observed in the real atmosphere, Atmos. Chem. Phys., 22, 6971–6987, https://doi.org/10.5194/acp-22-6971-2022, 2022.
Jung, J., Tsatsral, B., Kim, Y. J., and Kawamura, K.: Organic and inorganic aerosol compositions in Ulaanbaatar, Mongolia, during the cold winter of 2007 to 2008: Dicarboxylic acids, ketocarboxylic acids, and α-dicarbonyls, Journal of Geophysical Research-Atmospheres, 115, https://doi.org/10.1029/2010JD014339, 2010.
Kawamura, K. and Bikkina, S.: A review of dicarboxylic acids and related compounds in atmospheric aerosols: Molecular distributions, sources and transformation, Atmos. Res., 170, 140–160, https://doi.org/10.1016/j.atmosres.2015.11.018, 2016.
Kawamura, K. and Ikushima, K.: Seasonal changes in the distribution of dicarboxylic acids in the urban atmosphere, Environ. Sci. Technol., 27, 2227–2235, https://doi.org/10.1021/es00047a033, 1993.
Kawamura, K. and Kaplan, I. R.: Motor exhaust emissions as a primary source for dicarboxylic acids in Los Angeles ambient air, Environ. Sci. Technol., 21, 105–110, https://doi.org/10.1021/es00155a014, 1987.
Kawamura, K. and Sakaguchi, F.: Molecular distributions of water soluble dicarboxylic acids in marine aerosols over the Pacific Ocean including tropics, Journal of Geophysical Research-Atmospheres, 104, 3501–3509, https://doi.org/10.1029/1998JD100041, 1999.
Kawamura, K. and Usukura, K.: Distributions of low molecular weight dicarboxylic acids in the North Pacific aerosol samples, J. Oceanogr., 49, 271–283, https://doi.org/10.1007/BF02269565, 1993.
Kawamura, K. and Watanabe, T.: Determination of Stable Carbon Isotopic Compositions of Low Molecular Weight Dicarboxylic Acids and Ketocarboxylic Acids in Atmospheric Aerosol and Snow Samples, Anal. Chem., 76, 5762–5768, https://doi.org/10.1021/ac049491m, 2004.
Kawamura, K., Sempéré, R., Imai, Y., Fujii, Y., and Hayashi, M.: Water soluble dicarboxylic acids and related compounds in Antarctic aerosols, Journal of Geophysical Research-Atmospheres, 101, 18721–18728, https://doi.org/10.1029/96JD01541, 1996.
Kawamura, K., Okuzawa, K., Aggarwal, S. G., Irie, H., Kanaya, Y., and Wang, Z.: Determination of gaseous and particulate carbonyls (glycolaldehyde, hydroxyacetone, glyoxal, methylglyoxal, nonanal and decanal) in the atmosphere at Mt. Tai, Atmos. Chem. Phys., 13, 5369–5380, https://doi.org/10.5194/acp-13-5369-2013, 2013a.
Kawamura, K., Tachibana, E., Okuzawa, K., Aggarwal, S. G., Kanaya, Y., and Wang, Z. F.: High abundances of water-soluble dicarboxylic acids, ketocarboxylic acids and α-dicarbonyls in the mountaintop aerosols over the North China Plain during wheat burning season, Atmos. Chem. Phys., 13, 8285–8302, https://doi.org/10.5194/acp-13-8285-2013, 2013b.
Kleindienst, T. E., Jaoui, M., Lewandowski, M., Offenberg, J. H., and Docherty, K. S.: The formation of SOA and chemical tracer compounds from the photooxidation of naphthalene and its methyl analogs in the presence and absence of nitrogen oxides, Atmos. Chem. Phys., 12, 8711–8726, https://doi.org/10.5194/acp-12-8711-2012, 2012.
Liu, J., Chen, M., Chu, B., Chen, T., Ma, Q., Wang, Y., Zhang, P., Li, H., Zhao, B., Xie, R., Huang, Q., Wang, S., and He, H.: Assessing the Significance of Regional Transport in Ozone Pollution through Machine Learning: A Case Study of Hainan Island, ACS ES&T Air, 2, 416–425, https://doi.org/10.1021/acsestair.4c00297, 2025.
Liu, T. Y., Chan, A. W. H., and Abbatt, J. P. D.: Multiphase Oxidation of Sulfur Dioxide in Aerosol Particles: Implications for Sulfate Formation in Polluted Environments, Environ. Sci. Technol., 55, 4227–4242, https://doi.org/10.1021/acs.est.0c06496, 2021.
Lundberg, S. M. and Lee, S. I.: A Unified Approach to Interpreting Model Predictions, 31st Annual Conference on Neural Information Processing Systems (NIPS), Long Beach, CA, 4–9 December, https://doi.org/10.5555/3295222.3295230, 2017.
Meng, J., Wang, G., Hou, Z., Liu, X., Wei, B., Wu, C., Cao, C., Wang, J., Li, J., Cao, J., Zhang, E., Dong, J., Liu, J., Ge, S., and Xie, Y.: Molecular distribution and stable carbon isotopic compositions of dicarboxylic acids and related SOA from biogenic sources in the summertime atmosphere of Mt. Tai in the North China Plain, Atmos. Chem. Phys., 18, 15069–15086, https://doi.org/10.5194/acp-18-15069-2018, 2018.
Meng, J., Wang, Y., Li, Y., Huang, T., Wang, Z., Wang, Y., Chen, M., Hou, Z., Zhou, H., Lu, K., Kawamura, K., and Fu, P.: Measurement Report: Investigation on the sources and formation processes of dicarboxylic acids and related species in urban aerosols before and during the COVID-19 lockdown in Jinan, East China, Atmos. Chem. Phys., 23, 14481–14503, https://doi.org/10.5194/acp-23-14481-2023, 2023.
Nenes, A., Pandis, S. N., and Pilinis, C.: ISORROPIA: A New Thermodynamic Equilibrium Model for Multiphase Multicomponent Inorganic Aerosols, Aquat. Geochem., 4, 123–152, https://doi.org/10.1023/A:1009604003981, 1998.
Nenes, A., Pandis, S. N., Kanakidou, M., Russell, A. G., Song, S., Vasilakos, P., and Weber, R. J.: Aerosol acidity and liquid water content regulate the dry deposition of inorganic reactive nitrogen, Atmos. Chem. Phys., 21, 6023–6033, https://doi.org/10.5194/acp-21-6023-2021, 2021.
Pavuluri, C. M., Wang, S., Fu, P. Q., Zhao, W., Xu, Z., and Liu, C.-Q.: Molecular Distributions of Diacids, Oxoacids, and α-Dicarbonyls in Summer- and Winter-Time Fine Aerosols From Tianjin, North China: Emissions From Combustion Sources and Aqueous Phase Secondary Formation, Journal of Geophysical Research-Atmospheres, 126, e2020JD032961, https://doi.org/10.1029/2020JD032961, 2021.
Peng, X., Xie, T.-T., Tang, M.-X., Cheng, Y., Peng, Y., Wei, F.-H., Cao, L.-M., Yu, K., Du, K., He, L.-Y., and Huang, X.-F.: Critical Role of Secondary Organic Aerosol in Urban Atmospheric Visibility Improvement Identified by Machine Learning, Environ. Sci. Technol. Lett., 10, 976–982, https://doi.org/10.1021/acs.estlett.3c00084, 2023.
Poore, M. W.: Oxalic Acid in PM2.5 Particulate Matter in California, Journal of the Air & Waste Management Association, 50, 1874–1875, https://doi.org/10.1080/10473289.2000.10464226, 2000.
Resch, J., Wolfer, K., Barth, A., and Kalberer, M.: Effects of storage conditions on the molecular-level composition of organic aerosol particles, Atmos. Chem. Phys., 23, 9161–9171, https://doi.org/10.5194/acp-23-9161-2023, 2023.
Riddle, S. G., Robert, M. A., Jakober, C. A., Hannigan, M. P., and Kleeman, M. J.: Size Distribution of Trace Organic Species Emitted from Light-Duty Gasoline Vehicles, Environ. Sci. Technol., 41, 7464–7471, https://doi.org/10.1021/es070153n, 2007.
Rinaldi, M., Decesari, S., Carbone, C., Finessi, E., Fuzzi, S., Ceburnis, D., O'Dowd, C. D., Sciare, J., Burrows, J. P., Vrekoussis, M., Ervens, B., Tsigaridis, K., and Facchini, M. C.: Evidence of a natural marine source of oxalic acid and a possible link to glyoxal, Journal of Geophysical Research-Atmospheres, 116, https://doi.org/10.1029/2011JD015659, 2011.
Sato, K., Ikemori, F., Ramasamy, S., Fushimi, A., Kumagai, K., Iijima, A., and Morino, Y.: Four- and Five-Carbon Dicarboxylic Acids Present in Secondary Organic Aerosol Produced from Anthropogenic and Biogenic Volatile Organic Compounds, Atmosphere, 12, 1703, https://doi.org/10.3390/atmos12121703, 2021.
Simoneit, B. R. T., Medeiros, P. M., and Didyk, B. M.: Combustion Products of Plastics as Indicators for Refuse Burning in the Atmosphere, Environ. Sci. Technol., 39, 6961–6970, https://doi.org/10.1021/es050767x, 2005.
Wang, G., Kawamura, K., Cheng, C., Li, J., Cao, J., Zhang, R., Zhang, T., Liu, S., and Zhao, Z.: Molecular Distribution and Stable Carbon Isotopic Composition of Dicarboxylic Acids, Ketocarboxylic Acids, and α-Dicarbonyls in Size-Resolved Atmospheric Particles From Xi'an City, China, Environ. Sci. Technol., 46, 4783–4791, https://doi.org/10.1021/es204322c, 2012.
Wang, H., Kawamura, K., and Yamazaki, K.: Water-Soluble dicarboxylic acids, ketoacids and dicarbonyls in the atmospheric aerosols over the southern ocean and western pacific ocean, J. Atmos. Chem., 53, 43–61, https://doi.org/10.1007/s10874-006-1479-4, 2006.
Wang, H., Wu, Q., Guenther, A. B., Yang, X., Wang, L., Xiao, T., Li, J., Feng, J., Xu, Q., and Cheng, H.: A long-term estimation of biogenic volatile organic compound (BVOC) emission in China from 2001–2016: the roles of land cover change and climate variability, Atmos. Chem. Phys., 21, 4825–4848, https://doi.org/10.5194/acp-21-4825-2021, 2021a.
Wang, J., Wang, G., Gao, J., Wang, H., Ren, Y., Li, J., Zhou, B., Wu, C., Zhang, L., Wang, S., and Chai, F.: Concentrations and stable carbon isotope compositions of oxalic acid and related SOA in Beijing before, during, and after the 2014 APEC, Atmos. Chem. Phys., 17, 981–992, https://doi.org/10.5194/acp-17-981-2017, 2017.
Wang, N., Xu, J. W., Pei, C. L., Tang, R., Zhou, D. R., Chen, Y. N., Li, M., Deng, X. J., Deng, T., Huang, X., and Ding, A. J.: Air Quality During COVID-19 Lockdown in the Yangtze River Delta and the Pearl River Delta: Two Different Responsive Mechanisms to Emission Reductions in China, Environ. Sci. Technol., 55, 5721–5730, https://doi.org/10.1021/acs.est.0c08383, 2021b.
World Health Organization: WHO Global Air Quality Guidelines in 2021, WHO European Centre for Environment and Health, https://www.who.int/news-room/questions-and-answers/item/who-global-air-quality-guidelines, (last access: 17 June 2024), 2021.
Xu, B., Zhang, G., Gustafsson, Ö., Kawamura, K., Li, J., Andersson, A., Bikkina, S., Kunwar, B., Pokhrel, A., Zhong, G., Zhao, S., Li, J., Huang, C., Cheng, Z., Zhu, S., Peng, P., and Sheng, G.: Large contribution of fossil-derived components to aqueous secondary organic aerosols in China, Nat. Commun., 13, 5115, https://doi.org/10.1038/s41467-022-32863-3, 2022.
Xu, B., Tang, J., Tang, T., Zhao, S., Zhong, G., Zhu, S., Li, J., and Zhang, G.: Fates of secondary organic aerosols in the atmosphere identified from compound-specific dual-carbon isotope analysis of oxalic acid, Atmos. Chem. Phys., 23, 1565–1578, https://doi.org/10.5194/acp-23-1565-2023, 2023.
Xu, L., Middlebrook, A. M., Liao, J., de Gouw, J. A., Guo, H., Weber, R. J., Nenes, A., Lopez-Hilfiker, F. D., Lee, B. H., Thornton, J. A., Brock, C. A., Neuman, J. A., Nowak, J. B., Pollack, I. B., Welti, A., Graus, M., Warneke, C., and Ng, N. L.: Enhanced formation of isoprene-derived organic aerosol in sulfur-rich power plant plumes during Southeast Nexus, Journal of Geophysical Research-Atmospheres, 121, 11,137-111,153, https://doi.org/10.1002/2016JD025156, 2016.
Yan, F. H., Chen, W. H., Jia, S. G., Zhong, B. Q., Yang, L. M., Mao, J. Y., Chang, M., Shao, M., Yuan, B., Situ, S., Wang, X. M., Chen, D. H., and Wang, X. M.: Stabilization for the secondary species contribution to PM2.5 in the Pearl River Delta (PRD) over the past decade, China: A meta-analysis, Atmos. Environ., 242, https://doi.org/10.1016/j.atmosenv.2020.117817, 2020.
Yu, J. Z., Huang, X.-F., Xu, J., and Hu, M.: When Aerosol Sulfate Goes Up, So Does Oxalate: Implication for the Formation Mechanisms of Oxalate, Environ. Sci. Technol., 39, 128–133, https://doi.org/10.1021/es049559f, 2005.
Yu, Q., Ding, X., He, Q., Yang, W., Zhu, M., Li, S., Zhang, R., Shen, R., Zhang, Y., Bi, X., Wang, Y., Peng, P., and Wang, X.: Nationwide increase of polycyclic aromatic hydrocarbons in ultrafine particles during winter over China revealed by size-segregated measurements, Atmos. Chem. Phys., 20, 14581–14595, https://doi.org/10.5194/acp-20-14581-2020, 2020.
Yu, Q., Chen, J., Cheng, S., Qin, W., Zhang, Y., Sun, Y., and Ahmad, M.: Seasonal variation of dicarboxylic acids in PM2.5 in Beijing: Implications for the formation and aging processes of secondary organic aerosols, Sci. Total Environ., 763, 142964, https://doi.org/10.1016/j.scitotenv.2020.142964, 2021.
Zhang, N., Fan, F., Feng, Y., Hu, M., Fu, Q., Chen, J., Wang, S., and Feng, J.: Insight into Source and Evolution of Oxalic Acid: Characterization of Particulate Organic Diacids in a Mega-City, Shanghai from 2008 to 2020, Atmosphere, 13, 1347, https://doi.org/10.3390/atmos13091347, 2022a.
Zhang, Q., Zheng, Y. X., Tong, D., Shao, M., Wang, S. X., Zhang, Y. H., Xu, X. D., Wang, J. N., He, H., Liu, W. Q., Ding, Y. H., Lei, Y., Li, J. H., Wang, Z. F., Zhang, X. Y., Wang, Y. S., Cheng, J., Liu, Y., Shi, Q. R., Yan, L., Geng, G. N., Hong, C. P., Li, M., Liu, F., Zheng, B., Cao, J. J., Ding, A. J., Gao, J., Fu, Q. Y., Huo, J. T., Liu, B. X., Liu, Z. R., Yang, F. M., He, K. B., and Hao, J. M.: Drivers of improved PM2.5 air quality in China from 2013 to 2017, P. Natl. Acad. Sci. USA, 116, 24463–24469, https://doi.org/10.1073/pnas.1907956116, 2019.
Zhang, Y.-Q., Ding, X., He, Q.-F., Wen, T.-X., Wang, J.-Q., Yang, K., Jiang, H., Cheng, Q., Liu, P., Wang, Z.-R., He, Y.-F., Hu, W.-W., Wang, Q.-Y., Xin, J.-Y., Wang, Y.-S., and Wang, X.-M.: Observational Insights into Isoprene Secondary Organic Aerosol Formation through the Epoxide Pathway at Three Urban Sites from Northern to Southern China, Environ. Sci. Technol., 56, 4795–4805, https://doi.org/10.1021/acs.est.1c06974, 2022b.
Zhao, W., Kawamura, K., Yue, S., Wei, L., Ren, H., Yan, Y., Kang, M., Li, L., Ren, L., Lai, S., Li, J., Sun, Y., Wang, Z., and Fu, P.: Molecular distribution and compound-specific stable carbon isotopic composition of dicarboxylic acids, oxocarboxylic acids and α-dicarbonyls in PM2.5 from Beijing, China, Atmos. Chem. Phys., 18, 2749–2767, https://doi.org/10.5194/acp-18-2749-2018, 2018.
Zhao, W., Ren, H., Kawamura, K., Du, H., Chen, X., Yue, S., Xie, Q., Wei, L., Li, P., Zeng, X., Kong, S., Sun, Y., Wang, Z., and Fu, P.: Vertical distribution of particle-phase dicarboxylic acids, oxoacids and α-dicarbonyls in the urban boundary layer based on the 325 m tower in Beijing, Atmos. Chem. Phys., 20, 10331–10350, https://doi.org/10.5194/acp-20-10331-2020, 2020.
Zhao, Y., Hu, M., Slanina, S., and Zhang, Y.: Chemical Compositions of Fine Particulate Organic Matter Emitted from Chinese Cooking, Environ. Sci. Technol., 41, 99–105, https://doi.org/10.1021/es0614518, 2007.