
the Creative Commons Attribution 4.0 License.
the Creative Commons Attribution 4.0 License.
 | 05 Aug 2026
Global modeling of ice nucleating particles of multiple aerosol species and associated cloud radiative effects
Kei Kawai

Zhaoyi Ren
A subset of aerosol species act as ice nucleating particles (INPs) in mixed-phase clouds, where they influence cloud distributions and lifetimes and thus Earth's radiative balance through aerosol-cloud interactions. However, few modeling studies have simultaneously considered multiple aerosol species as INPs, and the radiative effects associated with INPs remain poorly constrained. This study uses a global climate-aerosol model to evaluate the number concentrations, spatial distributions, and cloud radiative effects of INPs from multiple aerosol species, including dust, bioaerosols, marine organic aerosol (MOA), and black carbon. The model reproduces global INP observations more accurately when multiple INP sources are included compared to simulations that consider dust INPs alone. Dust accounts for 97 % of the global mean INP number concentration in clouds because of its large atmospheric abundance. However, bioaerosols – particularly bacteria with high ice nucleating ability at relatively warm temperatures (> −10 °C) – dominate INPs in the middle troposphere at low latitudes and in the lower troposphere at mid-latitudes in the Northern Hemisphere. MOA dominates INPs in the middle and lower troposphere at middle and high latitudes in the Southern Hemisphere, where concentrations of other INP-active aerosols are low. Incorporating observational constraints on the temperature dependence of INPs increases the global mean cloud radiative effect of total INPs from +0.071 to +0.19 W m−2. These findings underscore the importance of including INPs from multiple aerosol species in climate models for better understanding of aerosol-cloud interactions via INPs.
- Article
(4799 KB) - Full-text XML
-
Supplement
(1828 KB) - BibTeX
- EndNote


Ice nucleating particles (INPs) play a critical role in the microphysics of mixed-phase clouds, which consist of supercooled water droplets and ice crystals, by initiating formation of ice crystals at subzero temperatures (approximately −37 to 0 °C) (Kanji et al., 2017). Once ice crystals form, water droplets evaporate and transfer water vapor to the growing ice crystals via the Wegener-Bergeron-Findeisen process (Korolev, 2007), altering the phase balance within the cloud. This shift toward the ice phase can decrease cloud water content and promote formation of precipitation and removal of condensate because ice crystals generally fall faster than liquid droplets (Mitchell et al., 2008; Eidhammer et al., 2017). Because this process can reduce cloud lifetime and cloud fraction, it can influence Earth's radiative balance through aerosol-cloud interactions (Shi and Liu, 2019; Storelvmo, 2017). In addition, differences in the temperature-dependent ice nucleating properties of INPs can lead to substantial variations in cloud microphysical processes and their associated climatic impacts (Imura and Suzuki, 2025). Despite their importance, the radiative effects of aerosol-cloud interactions via INPs remain highly uncertain, primarily because of the complex and diverse nature of INP sources and their interactions with clouds (Murray et al., 2021).
Some aerosol species act as INPs in mixed-phase clouds, facilitating ice crystal formation at different subzero temperatures and across various spatial distributions (Kanji et al., 2017; Murray et al., 2012). Mineral dust emitted from arid and semi-arid regions such as the Sahara and Gobi deserts is recognized as one of the most important sources of INPs because of its atmospheric abundance and high ice nucleating ability at temperatures colder than approximately −15 °C (Atkinson et al., 2013; DeMott et al., 2015). Recent studies have also shown that Arctic dust that originates from snow- and vegetation-free surfaces in the Arctic region has significantly higher ice nucleating ability than desert dust, especially at temperatures warmer than −20 °C (Tobo et al., 2019), and it plays a dominant role in dust INPs in the lower troposphere of the Arctic during summer and fall (Kawai et al., 2023; Matsui et al., 2024).
Bioaerosols (or primary biological aerosol particles), including bacteria, fungal spores, and pollen, are another important source of INPs. In particular, some bacterial species such as Pseudomonas syringae nucleate ice crystals efficiently at relatively warm subzero temperatures (> −10 °C) (Diehl and Mitra, 2015; Hummel et al., 2018). Marine organic aerosol (MOA), produced through oceanic biological processes and bubble-bursting mechanisms, serves as an additional source of INPs, particularly in remote marine and polar regions (Burrows et al., 2013; Wilson et al., 2015). Black carbon (BC), a product of incomplete combustion, has also been identified as a potential source of INPs, although its ice nucleating ability is lower than that of other aerosol species (Bond et al., 2013; Kanji et al., 2017; Righi et al., 2025). Despite the diversity of INP sources, few modeling studies have simultaneously considered multiple aerosol species as INPs, and their combined cloud radiative effects (CREs) remain poorly understood. In a recent modeling study by Chatziparaschos et al. (2025), multiple aerosol species were considered as INPs, but their CREs were not quantified. To improve our understanding of aerosol-cloud interactions, which contribute to one of the largest sources of uncertainty in climate change projections, it is necessary to develop global climate models that incorporate diverse sources of INPs and evaluate their relative contributions to concentrations of INPs and their associated CREs on a global scale.
In this study, we evaluate the contributions of various species of aerosols (dust, bioaerosols, MOA, and BC) to global and regional INP number concentrations and their CREs via INPs using a global climate-aerosol model. We also estimate the range of CREs of all aerosol species via INPs by incorporating a new observational constraint on ice nucleating ability. The findings highlight the importance of accounting for multiple INP sources in global climate models to reduce uncertainties in estimating concentrations of INPs and their CREs and to improve our understanding of aerosol-cloud interactions.
2.1 Global climate-aerosol model
We used the Community Atmosphere Model (CAM) version 5 (Neale et al., 2012; Lamarque et al., 2012) with the Aerosol Two-dimensional bin module for foRmation and Aging Simulation (ATRAS) version 2 (Matsui, 2017; Matsui and Mahowald, 2017), and the Community Land Model (CLM) version 4 (Oleson et al., 2010) within the framework of the Community Earth System Model (CESM) version 1.2.0 (Hurrell et al., 2013). The CAM-ATRAS model considers seven aerosol species (dust, sea salt, black carbon, sulfate, nitrate, ammonium, and organic aerosol) along with the bioaerosols and MOA added for this study. Aerosol particles with dry diameters ranging from 1 nm to 10 µm are represented across 12 size bins, except for bioaerosols and MOA. The model simulates key aerosol processes, including emissions; new particle formation; condensation of sulfate, nitrate, and organic aerosols; coagulation; aqueous-phase chemistry; dry and wet deposition; cloud activation; and aerosol-radiation and aerosol-cloud interactions.
We employed a sectional approach to explicitly represent aerosol size distributions and microphysical processes, enabling accurate simulations of aerosol mass and number concentrations. The extensive evaluation of the model against various aerosol observations in our previous studies has demonstrated its reliability in reproducing aerosol concentrations, size distributions, and optical properties (Kawai et al., 2021a, b, 2023; Kawai and Matsui, 2025; Liu et al., 2022, 2024a, b; Matsui and Mahowald, 2017; Matsui et al., 2018a, b, 2024). The use of the detailed aerosol scheme has substantially improved the model's ability to reproduce long-range aerosol transport to remote regions, as well as aerosol mass and number concentrations in those regions (Liu and Matsui, 2021, 2022). Such accuracy is essential for this study because INP number concentrations depend strongly on aerosol mass and number concentrations. The sectional approach therefore helps to reduce uncertainties in aerosol representations and to improve the reliability of estimates of INPs and their impacts on clouds and radiation.
In this study, the model considers dust (Arctic and non-Arctic dust), bioaerosols (bacteria, fungal spores, and pollen), MOA, and BC (from biomass burning) as INPs (Table 1; Fig. 1). The emissions and ice nucleating abilities of each species are described below (Sect. 2.1.1–2.1.4). Using the ice nucleating abilities of each species, the INP number concentrations of each species are calculated online as a function of air temperature (between −37 and −5 °C) and the mass or number concentrations of each species (both interstitial-phase and cloud-phase) in the presence of liquid water droplets. In this study, we report the number concentrations of INPs within clouds, which we equate to the grid-mean INP number concentrations multiplied by the fractions of stratus clouds. This calculation is consistent with the CAM5 cloud microphysics scheme (Gettelman et al., 2010; Morrison and Gettelman, 2008). In other words, INPs are defined as aerosol particles that can initiate ice formation under given thermodynamic conditions. The INP number concentration of each species is calculated by multiplying the mass or number concentration of each species by the activated fraction derived from its temperature-dependent ice nucleating ability. Therefore, not all aerosol particles act as INPs, and only a fraction of particles become active as INPs depending on temperature.
Table 1Aerosol species and types acting as INPs in this study, and data sources for their emissions and ice nucleating abilities.
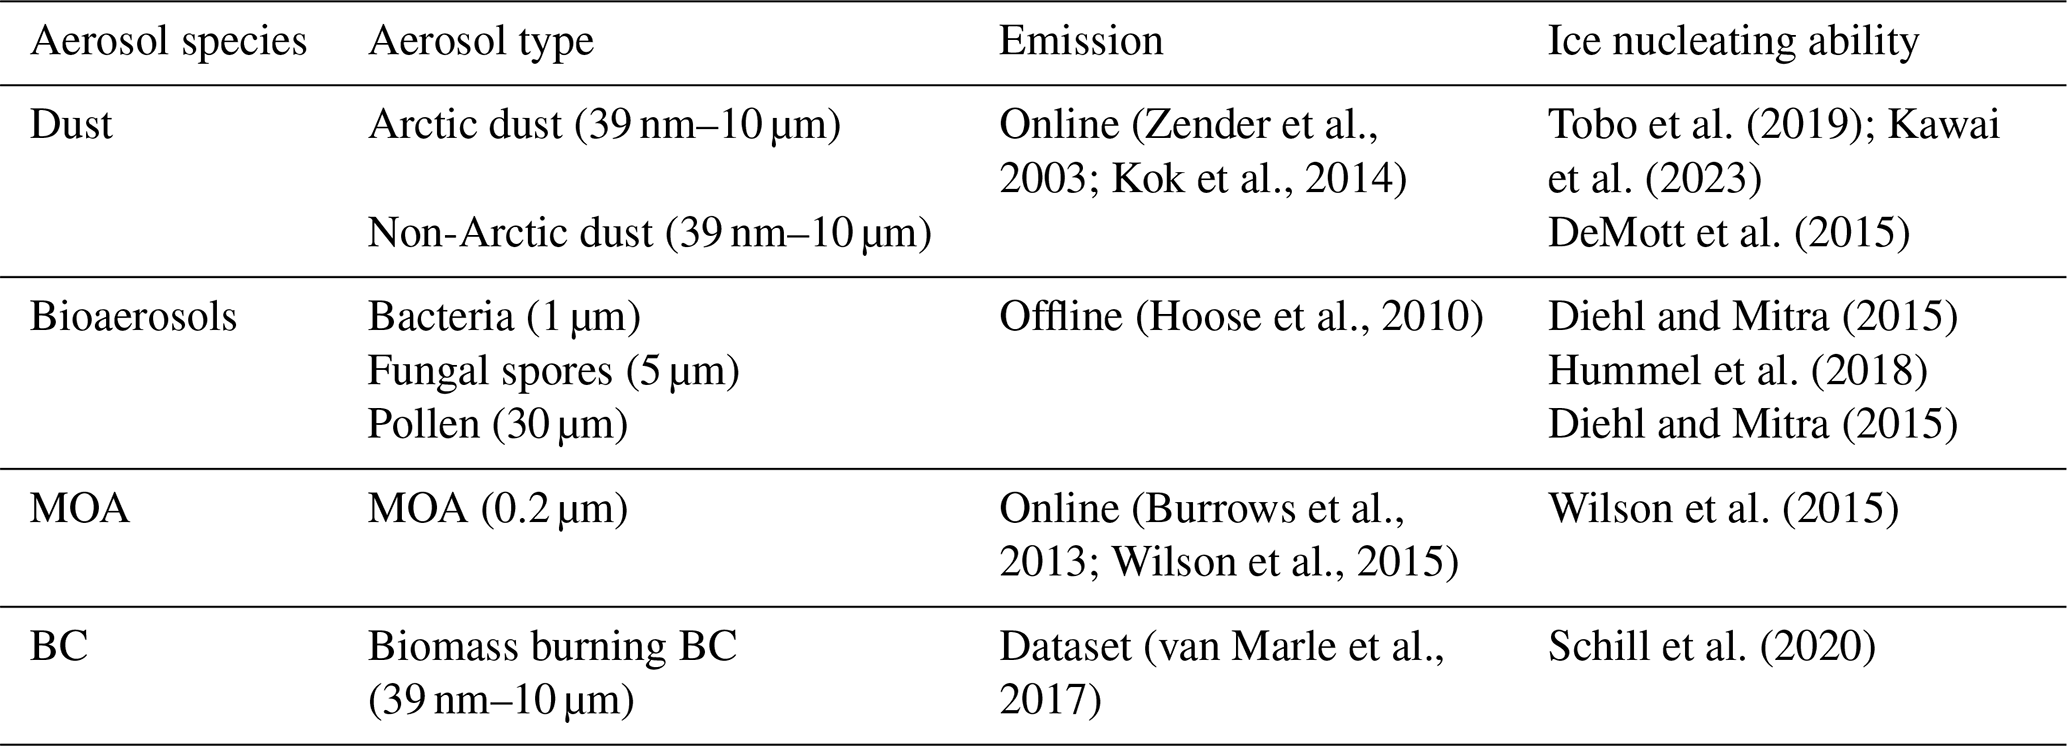
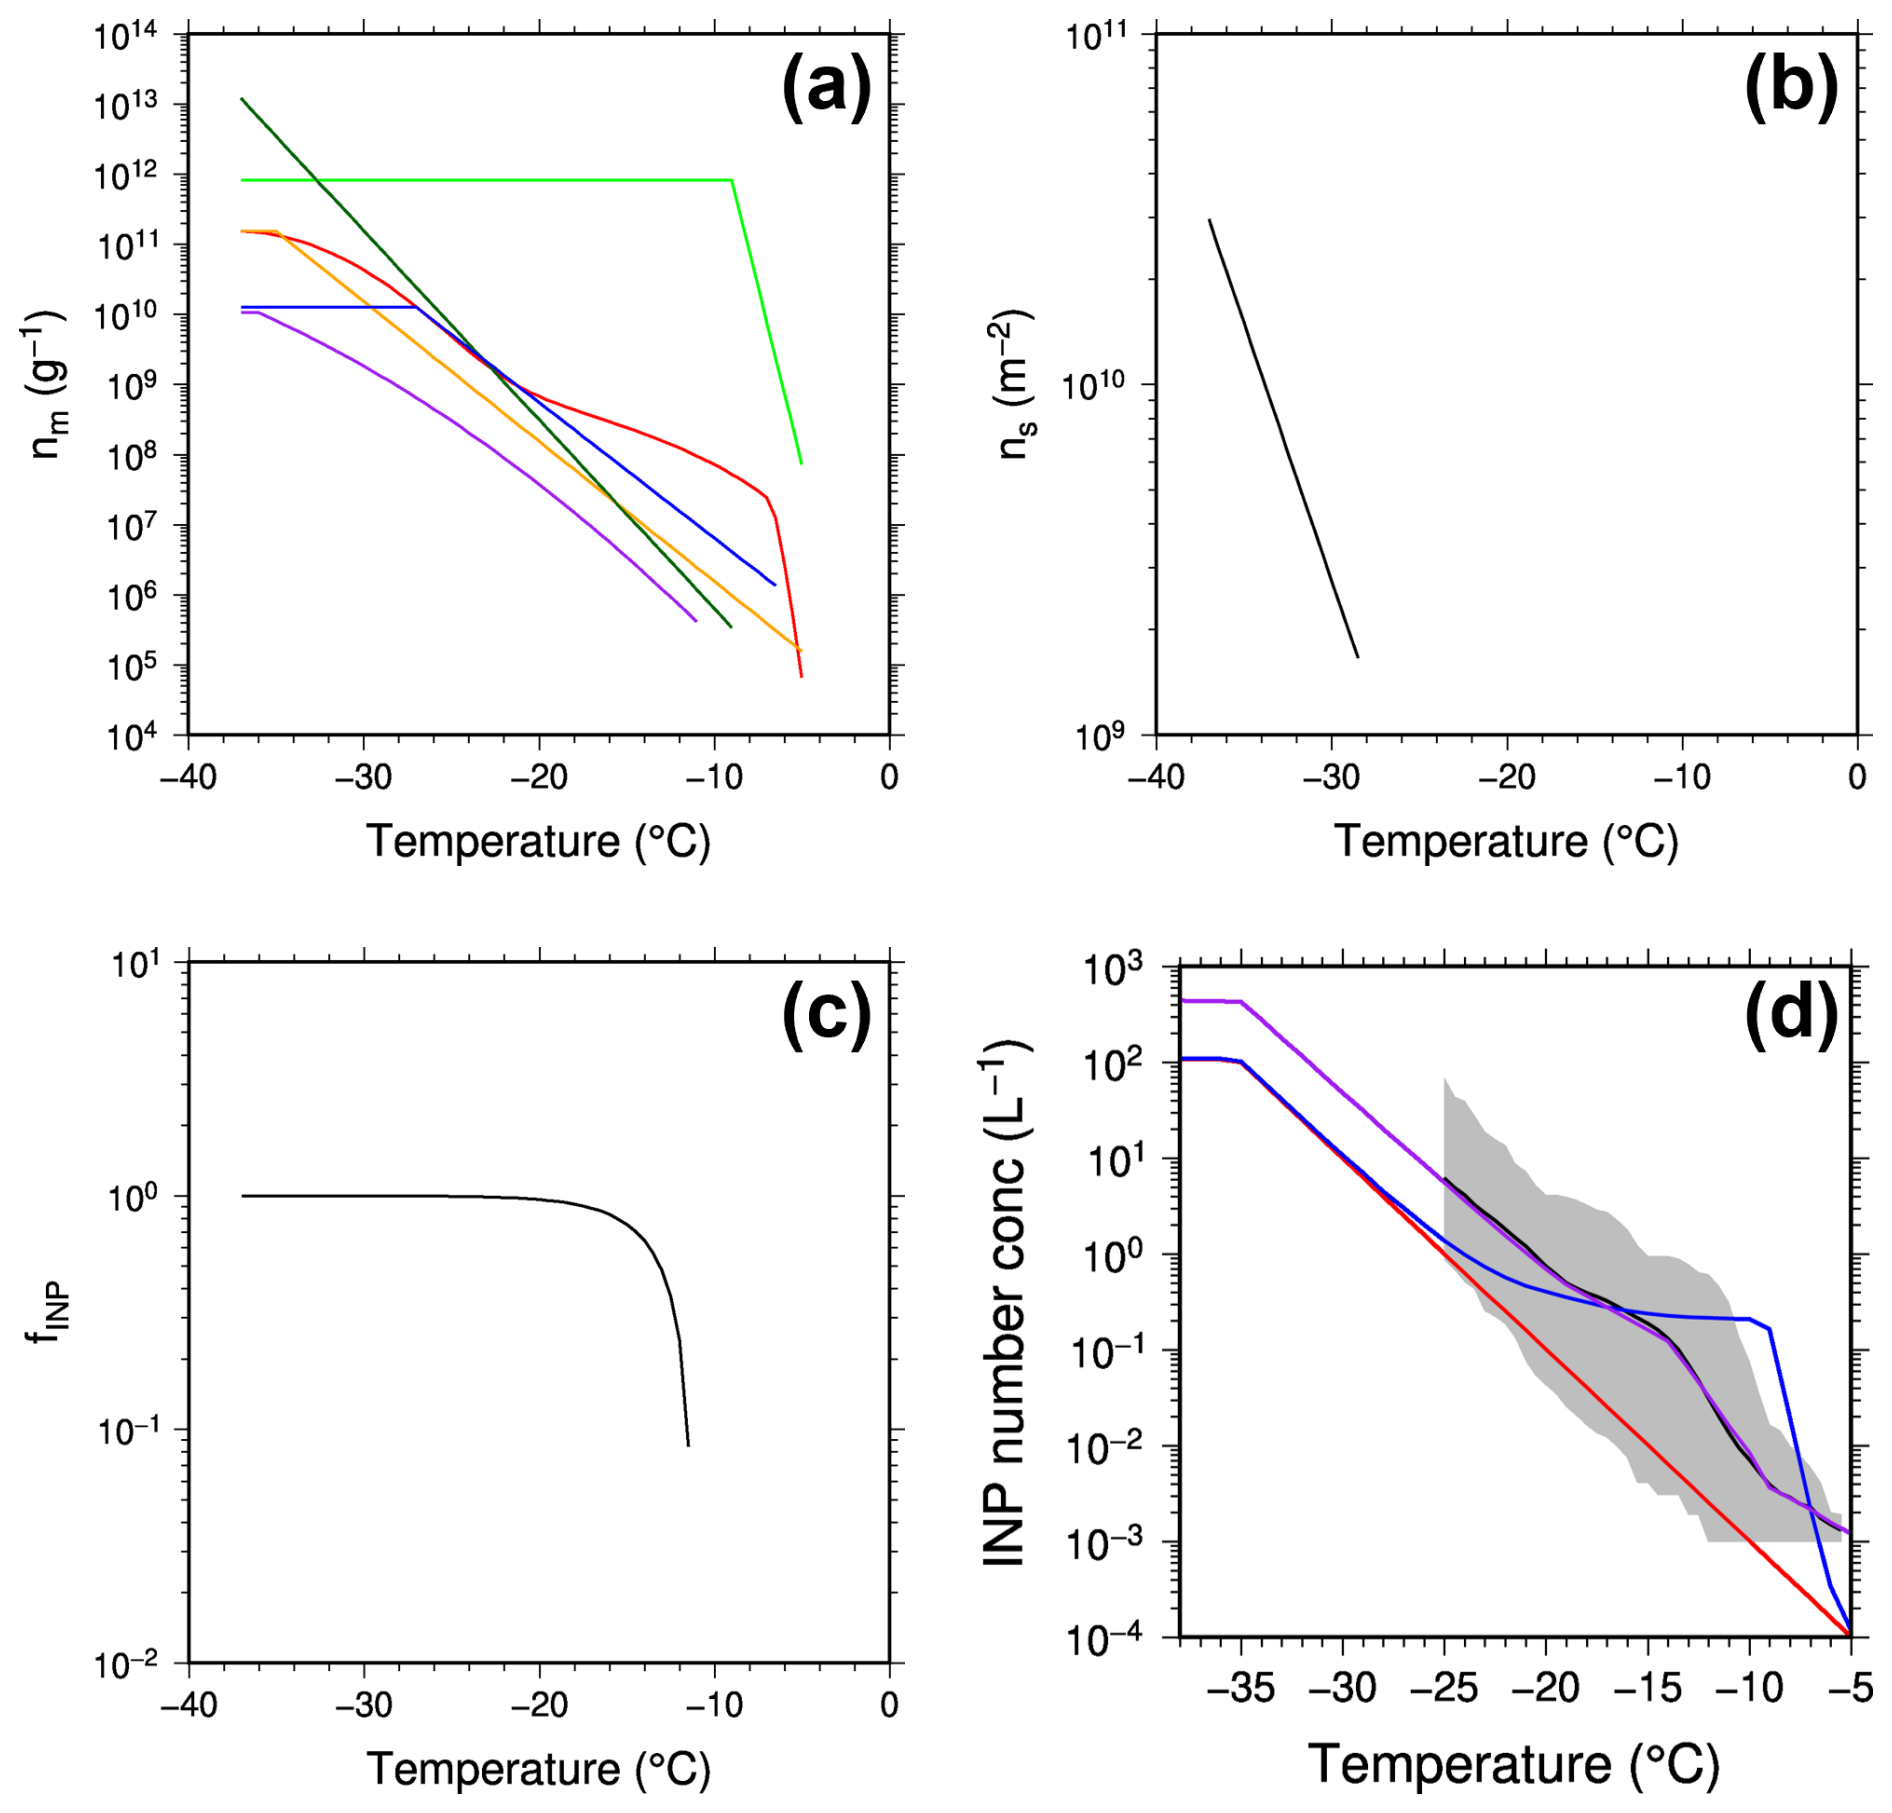
Figure 1Ice nucleating abilities of aerosol species and types acting as INPs in this study. (a) The red, orange, light green, green, blue, and purple lines represent the ice nucleation active site density per unit mass (nm) of Arctic dust, non-Arctic dust, bacteria, pollen, MOA, and biomass burning BC, respectively. The nm of non-Arctic dust and MOA were derived using the size distributions of their emitted particles assumed in our model. (b) The ice nucleation active site density per unit surface area (ns) of Cladosporium sp. fungal spores. (c) The activated fraction of Mortierella alpina fungal spores. (d) Annual mean INP number concentrations as a function of freezing temperature observed at Tokyo Skytree, Japan, from August 2016 to July 2017 (Tobo et al., 2020) (black) and simulated for the corresponding location and period for dust only (red) and for all INP sources in the Base simulation (blue) and the observationally constrained simulation (purple). The gray shading indicates the range of observed INP number concentrations.
INP parameterizations typically describe the temperature dependence of nm or ns (the ice nucleation active site density per unit mass or surface area, respectively). In this study, INP number concentrations are calculated using this temperature-dependent information together with the aerosol mass and number concentrations for each size bin simulated by the model.
In the cloud microphysics scheme, both water droplets and ice crystals are prognostically treated in terms of their number concentrations and mixing ratios (Neale et al., 2012). There are some ice formation pathways considered in the scheme (e.g., homogeneous freezing, immersion and condensation freezing, contact freezing, and secondary ice production), which change the number concentrations and mixing ratios of water droplets and ice crystals. The INP number concentration derived from the aerosol scheme contributes to the formation of ice crystals by increasing the number concentration of ice crystals. When the available INPs exceed the existing ice crystal number concentration, the model increases the ice crystal number concentration toward the INP number concentration. Once ice crystals form, water droplets evaporate and transfer water vapor to the growing ice crystals via the Wegener-Bergeron-Findeisen process (Korolev, 2007). Through these interactions, aerosol properties represented by the sectional scheme influence cloud microphysics and subsequent cloud evolution.
2.1.1 Dust
Dust emission fluxes are calculated online based on wind speed and land surface conditions, including soil moisture, vegetation, and snow cover, following the schemes of Zender et al. (2003) and Kok et al. (2014). The size distribution of emitted dust particles is based on Kok (2011). Dust emitted north and south of 60° N is defined as Arctic dust and non-Arctic dust, respectively. Transport, deposition, and ice nucleation processes for Arctic and non-Arctic dust are calculated independently using separate tracers (Kawai et al., 2023).
The ice nucleating abilities of Arctic and non-Arctic dust for immersion and condensation freezing are parameterized following Tobo et al. (2019) and DeMott et al. (2015), respectively (Fig. 1a). Observations by Tobo et al. (2019) have demonstrated that Arctic dust has significantly higher ice nucleating ability than desert dust, particularly at temperatures warmer than −20 °C (see Kawai et al. (2023) for the equation). DeMott et al. (2015) have measured the ice nucleating ability of desert dust using field sampling and aircraft observations of Saharan and Asian dust. The total dust INP number concentrations are equated to the sum of Arctic and non-Arctic dust INP number concentrations.
The model has been demonstrated to reasonably reproduce global satellite dust observations (Kawai et al., 2023), surface dust observations across various regions (Kawai et al., 2021a; Matsui and Mahowald, 2017; Matsui et al., 2024), ice-core dust deposition observations in the Arctic (Matsui et al., 2024), PM10 observations in East Asia, and INP observations in Tokyo (Kawai et al., 2021b) and the Arctic (Kawai et al., 2023).
2.1.2 Bioaerosols
The model in this study newly incorporates three types of bioaerosols: bacteria, fungal spores, and pollen. Their emission fluxes are calculated based on terrestrial vegetation and meteorological conditions following the scheme of Hoose et al. (2010). Bioaerosol emission fluxes for the year 2010 are calculated in this study and provided as input to the model. The sizes of emitted particles are assumed to be 1 µm for bacteria, 5 µm for fungal spores, and 30 µm for pollen.
The temperature-dependent ice nucleating abilities of 4 % of bacteria (Pseudomonas syringae) and 100 % of pollen (tree pollen) are based on Diehl and Mitra (2015) (Fig. 1a). We assumed that 29 % of Cladosporium sp. fungal spores and 8 % of Mortierella alpina fungal spores act as INPs with temperature dependence following Hummel et al. (2018) (Fig. 1b and c). The bioaerosol INP number concentrations are equated to the sum of the INP number concentrations of bacteria, fungal spores, and pollen.
2.1.3 MOA
The model also newly incorporates MOA in this study, and its emission fluxes are calculated based on oceanic biogeochemistry and sea salt emission following the methods of Burrows et al. (2013) and Wilson et al. (2015). Climatological monthly data of particulate organic carbon concentrations in seawater, retrieved from the Moderate Resolution Imaging Spectroradiometer (MODIS) onboard the Aqua satellite during 2002–2023, are used for the calculation. Missing values at high latitudes (about > 45° in winter and > 80° in summer) are imputed using the average north of 30° N for the Northern Hemisphere and south of 30° S for the Southern Hemisphere. The emitted MOA particles are assumed to have a diameter of 0.2 µm (Burrows et al., 2013). The ice nucleating ability of MOA is parameterized as a function of air temperature and organic content based on Wilson et al. (2015) (Fig. 1a).
2.1.4 BC
The model considers two types of BC sources: anthropogenic and biomass burning emissions. BC emission data are provided from the Coupled Model Intercomparison Project phase 6 (CMIP6) emission dataset for the year 2010 (Hoesly et al., 2018; van Marle et al., 2017). BC emissions are assumed to have number median diameters of 70 nm for anthropogenic sources and 100 nm for biofuel and biomass burning sources, with a geometric standard deviation of 1.8 (Matsui et al., 2022). The ice nucleating ability of biomass burning BC is based on the parameterization of Schill et al. (2020) (Fig. 1a). Because anthropogenic BC does not act efficiently as INPs (Kanji et al., 2017; Righi et al., 2025), this study does not consider its contribution as INPs.
2.2 Base simulation
We conducted the Base simulation for 11 years (2009–2019) using a horizontal resolution of 1.9°×2.5° and 30 vertical layers extending from the surface to an altitude of approximately 40 km. Monthly sea surface temperature and sea ice concentration data were prescribed from Hurrell et al. (2008). The first year of the simulation (2009) was treated as model spin-up, and the last 10 years (2010–2019) were used for analysis. Temperature and horizontal wind fields in the free troposphere (< 800 hPa) were nudged to the Modern-Era Retrospective analysis for Research and Applications version 2 (MERRA2) dataset. The CMIP6 dataset for the year 2010 (Hoesly et al., 2018; van Marle et al., 2017) was used for anthropogenic and biomass burning emissions of aerosols and their precursors. Dust and sea salt emissions were calculated online within the model (Kok et al., 2014; Mårtensson et al., 2003).
2.3 Observationally constrained simulation
A sensitivity simulation (the observationally constrained simulation) was conducted in which the ice nucleating ability of bacteria was adjusted to match the temperature dependence of the annual mean INP number concentrations observed in Tokyo from August 2016 to July 2017 (Tobo et al., 2020) (Fig. 1d). The ice nucleating ability of bacteria used in the Base simulation was multiplied by a scaling factor of 103.2 at °C, 100.2 at −19 °C, 10−0.3 at −14 °C, 10−1.8 at −9 °C, and 101.8 at −5 °C, with a lognormal interpolation between these temperatures. In Sect. 3.4, this simulation is used to estimate the CREs of total INPs and thus to provide a range of CRE estimates when compared to the Base simulation. For simplicity, the ice nucleating ability of bacteria was adjusted to align with the observations in this simulation, but this adjustment does not imply that the ice nucleating ability of bacteria is the only source of uncertainty. This adjustment includes uncertainties related to the spatial distributions and ice nucleating abilities of all aerosol species as well as the potential influence of unknown INP sources.
2.4 CREs via INPs
We also conducted sensitivity simulations in which the number concentrations of dust, bioaerosol, or total INPs were increased by a factor of 10 to investigate their CREs. The CREs via INPs were calculated as the difference in cloud radiative forcing between the 10-fold and 1-fold simulations. Cloud radiative forcing was computed as the difference in radiative fluxes at the top of the atmosphere between all-sky and clear-sky conditions (Ramanathan et al., 1989). The 10-fold sensitivity simulations were performed to account for current uncertainties in the ice nucleating abilities of the aerosol species and to obtain a high signal-to-noise ratio (Kawai et al., 2021b, 2023; Shi and Liu, 2019). The estimated CREs can therefore be interpreted as values close to the upper limit of the CREs via INPs.
We further estimated the scaled net CREs corresponding to the presence of INPs (1-fold–0-fold) by fitting the simulated net (shortwave + longwave) CREs for 1–50-fold dust INPs relative to 0-fold dust INPs using a power-law function of y=axb (Fig. 2). The best-fit parameters were a= 0.0576 and b= 0.640, yielding a scaling factor of 0.297 to convert the CREs estimated from the 10-fold–1-fold simulations to those corresponding to the 1-fold–0-fold differences. This fitting approach provides a higher signal-to-noise ratio for the purpose of estimating the INP-induced CREs than simply taking the difference between the 1-fold and 0-fold simulations.
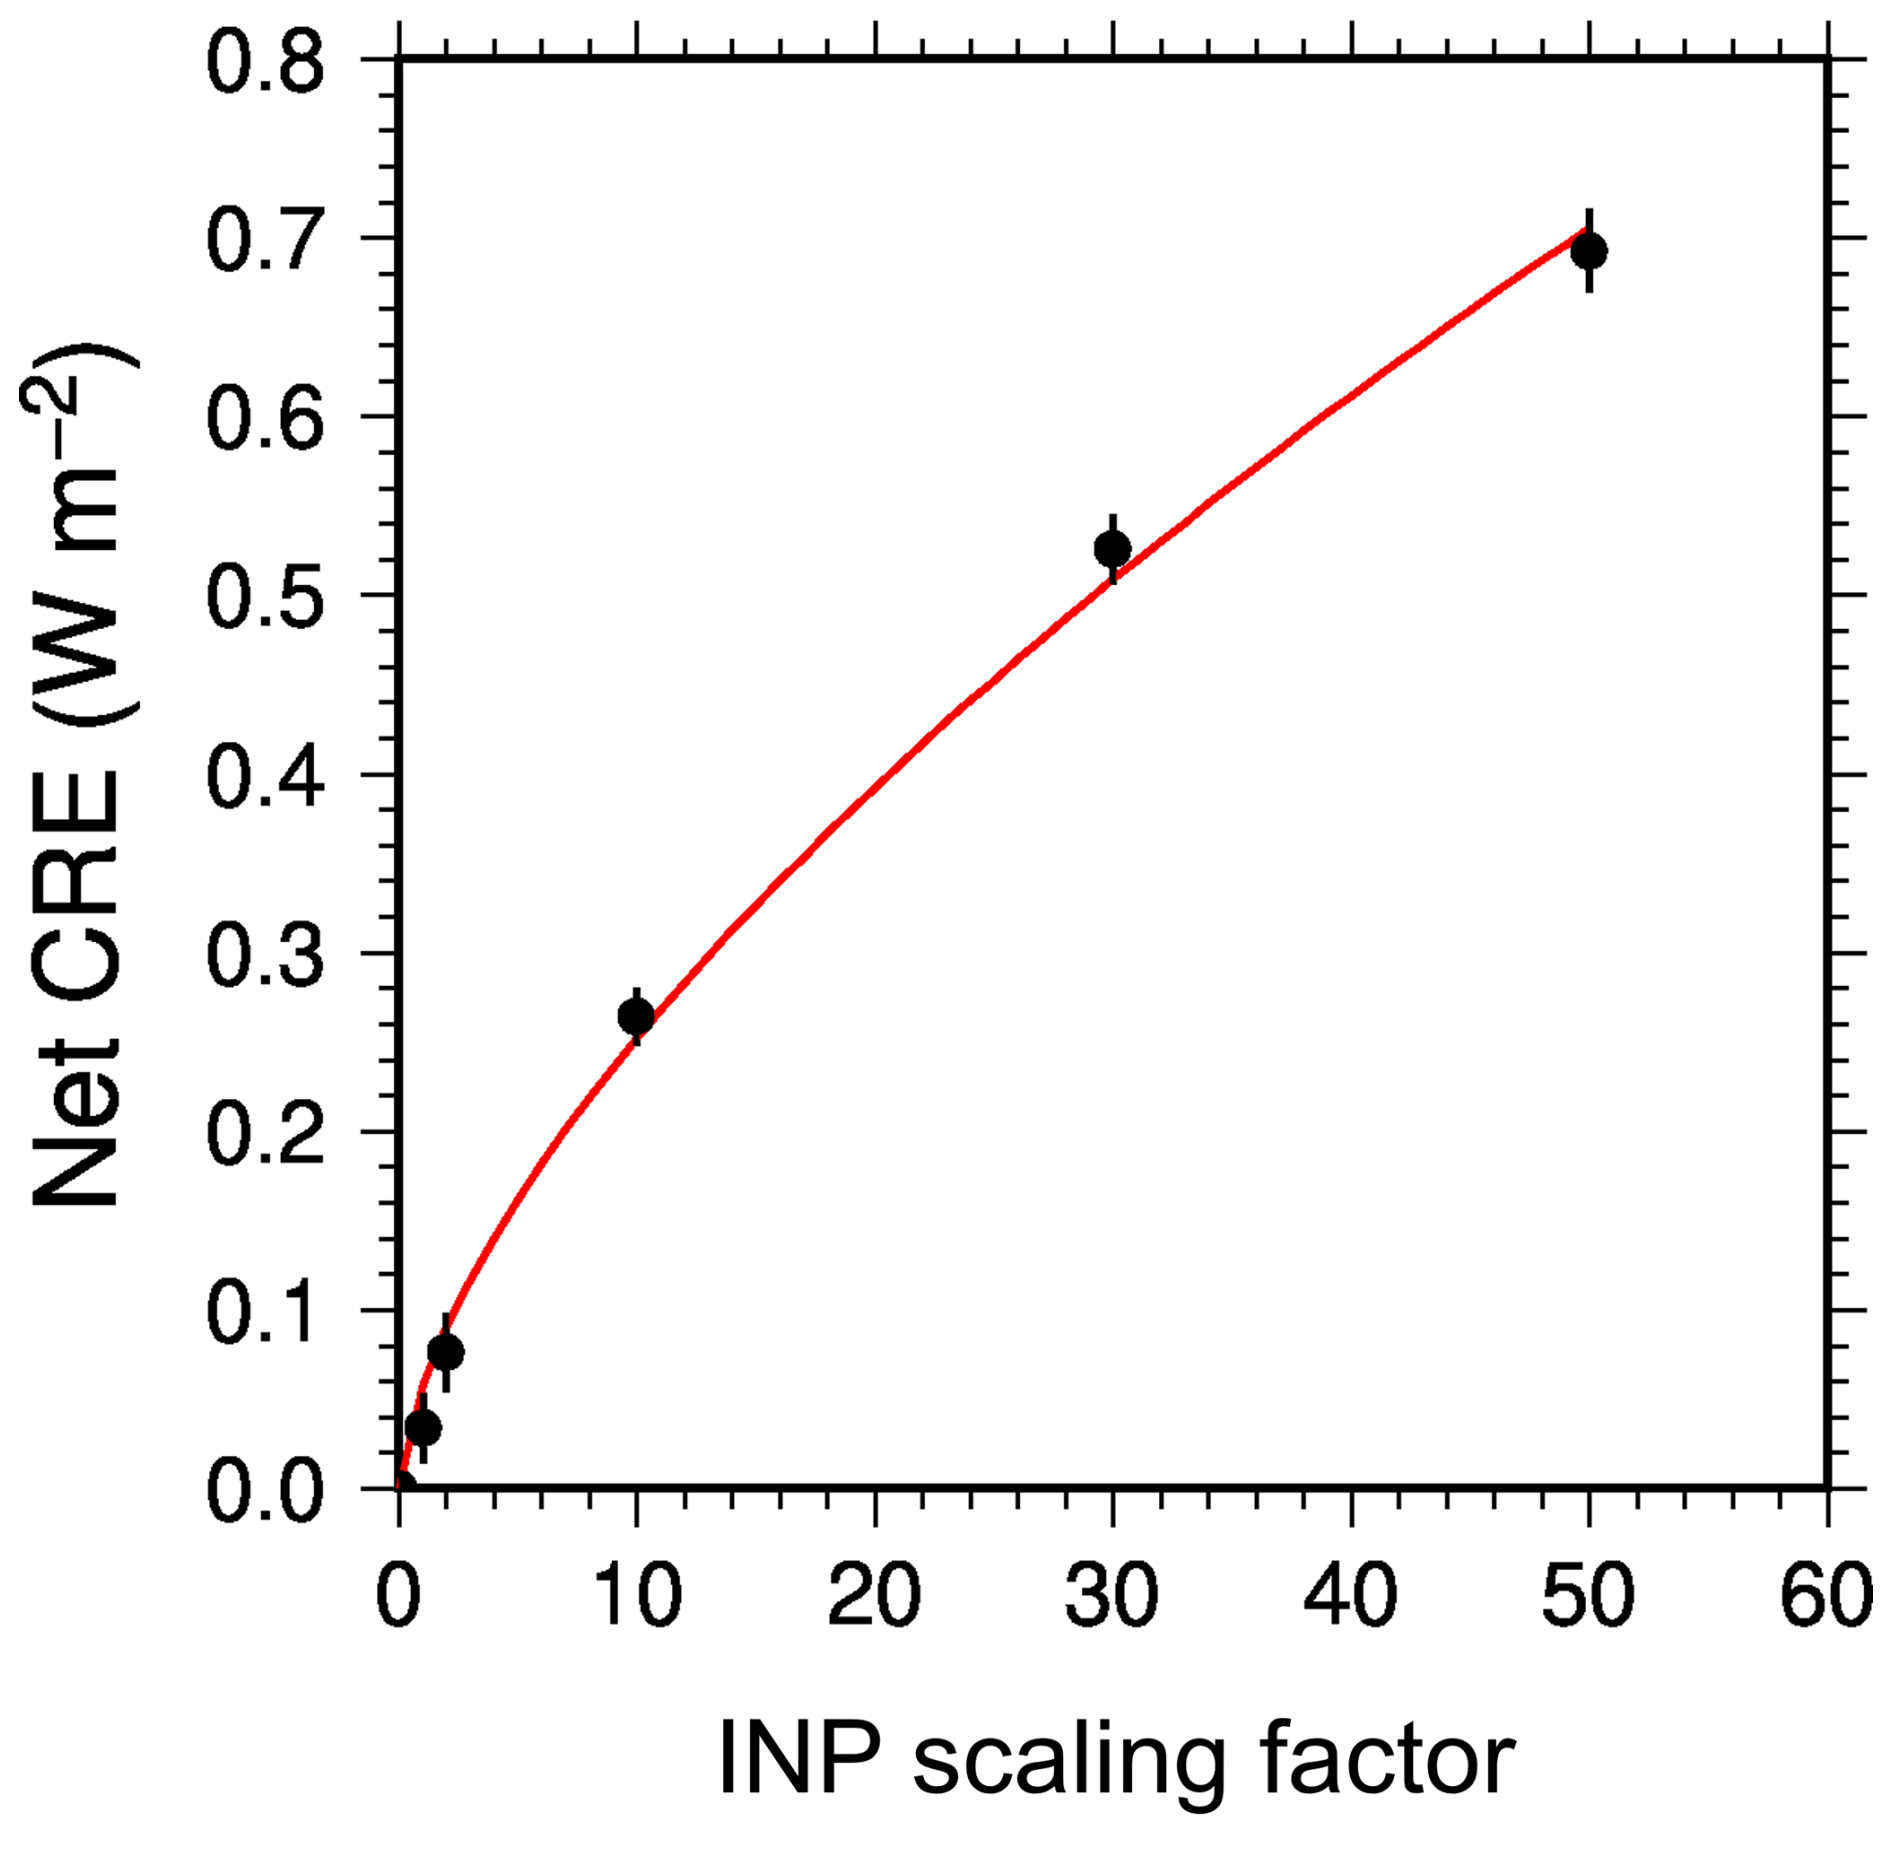
Figure 2Relationship between INP scaling factors and net CREs via dust INPs estimated from the 1-, 2-, 10-, 30-, and 50-fold simulations – 0-fold simulation. Dots and bars indicate the 10-year means and standard deviations of annual mean CREs. The red line represents the fitted power-law function (y=axb) used to infer the CREs corresponding to the 1-fold–0-fold simulations.
2.5 Observational data
To evaluate simulated aerosol and INP concentrations, bioaerosol observations in the Amazon (Patade et al., 2021) and global INP observations (Hu et al., 2023; Mason et al., 2016; Tobo et al., 2019, 2020) were used. For comparisons with the INP observations, simulated INP number concentrations and their temperature dependence were calculated offline using observed temperatures and simulated daily mean aerosol concentrations during each observation period. Stratus cloud fractions (Sect. 2.1.1) were not considered in these offline INP calculations.
3.1 Comparisons with INP observations
We compare our model estimates with INP observations from various locations worldwide (Fig. 3; Table S1 in the Supplement). When the model considers only dust as the source of INPs (red in Fig. 3a–d), it underestimates the observed INP number concentrations by 1–4 orders of magnitude in China, Canada, France, and the Arctic. However, the model has a better agreement with the observations when bioaerosols, MOA, and BC are incorporated as additional sources of INPs (green and blue in Fig. 3a–d). For the observations in China (−15 and −8 °C), Canada, and France, bioaerosols account for the largest fraction of total INPs in the model estimates (Fig. 3e–g), whereas MOA accounts for the largest fraction for the Arctic observations in March (−25 and −20 °C) (Fig. 3h). The model performance therefore improves markedly in regions where bioaerosols and MOA contribute notably to the total INPs and where dust alone cannot explain the INP observations. For the observations in China, the contributions of MOA to total INPs are very small because MOA is not efficiently transported into the continental interior because of the prevailing wind fields (Fig. S1 in the Supplement) and the dust concentrations are high because of the proximity of a dust source region (i.e., the Gobi Desert) (Fig. S2).
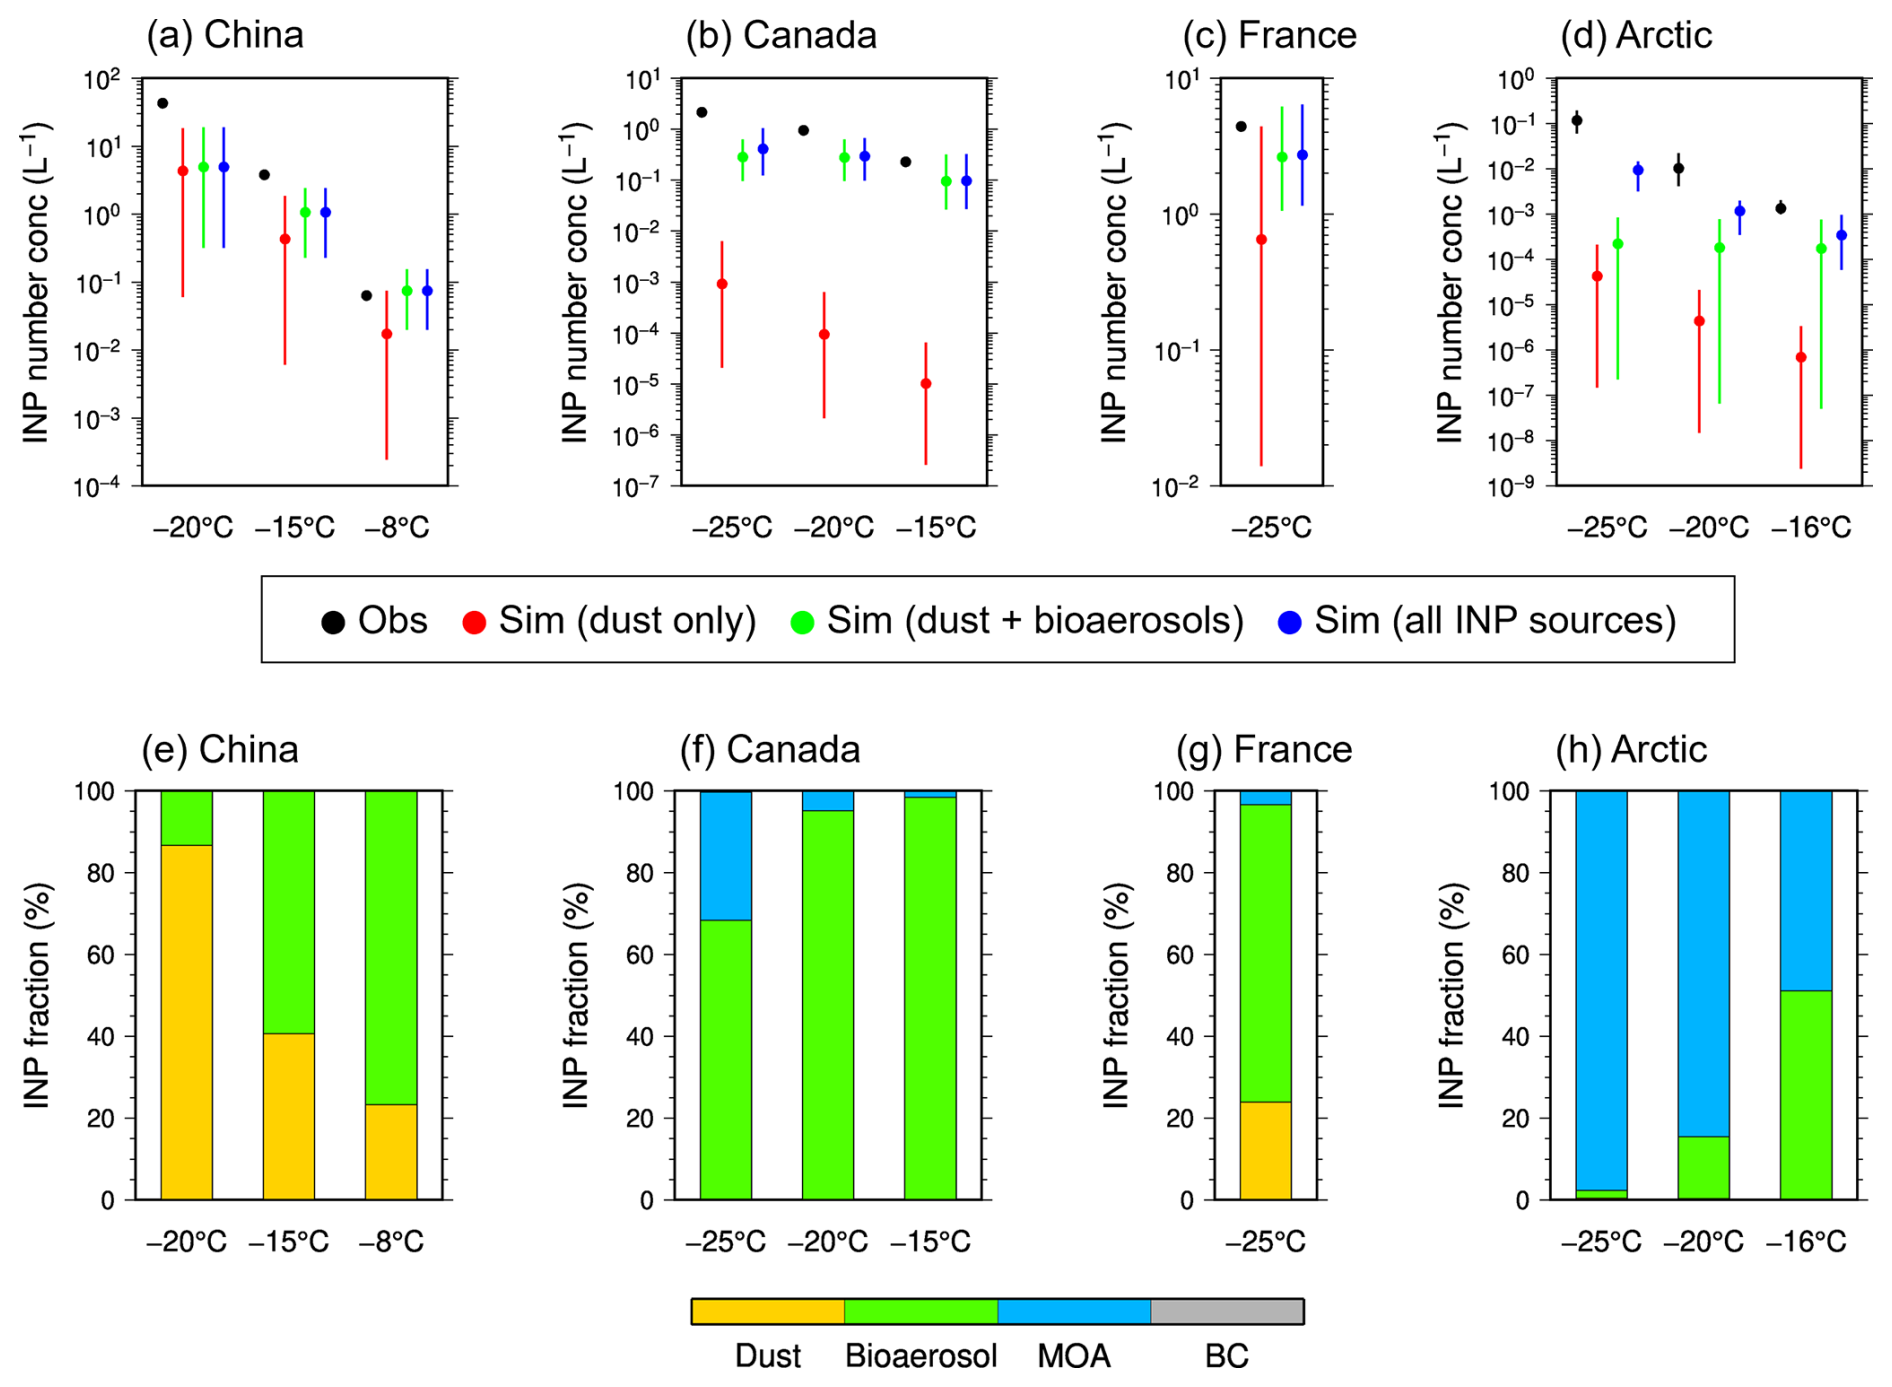
Figure 3(a–d) INP number concentrations observed at (a) Beijing, China (Hu et al., 2023); (b) Vancouver Island, Canada; (c) Saclay, France (Mason et al., 2016); and (d) Svalbard, Arctic (March 2017) (Tobo et al., 2019) at different freezing temperatures (black), and those simulated for the corresponding locations and periods for dust only (red), dust + bioaerosols (green), and all INP sources (blue). Dots and bars represent the averages and ranges (where available) during the observation periods, respectively. (e–h) Fractions of dust (orange), bioaerosols (green), MOA (blue), and BC (gray) in the simulated total INP number concentrations for each location.
We next compare the model estimates with the year-round INP observations in Tokyo (Tobo et al., 2020) (Fig. 4). When only dust is considered as the source of INPs in the model (red in Fig. 4), the model reproduces the observations reasonably well during spring and fall, when dust particles are transported from the Gobi and Taklamakan Deserts. However, during summer and winter, the model underestimates the observed INP number concentrations by 2–3 orders of magnitude. In contrast, when bioaerosols, MOA, and BC are added as INP sources (green and blue in Fig. 4), the model successfully reproduces the observations at −15 and −20 °C throughout the year. At −25 °C, the model still underestimates the observations by about one order of magnitude during summer and winter. This discrepancy might be attributable to uncertainties in dust emission and transport or to unknown local sources of INPs (e.g., local soil dust). These results demonstrate that including multiple INP sources improves the model performance, particularly in seasons when dust alone cannot explain the observed INP concentrations.
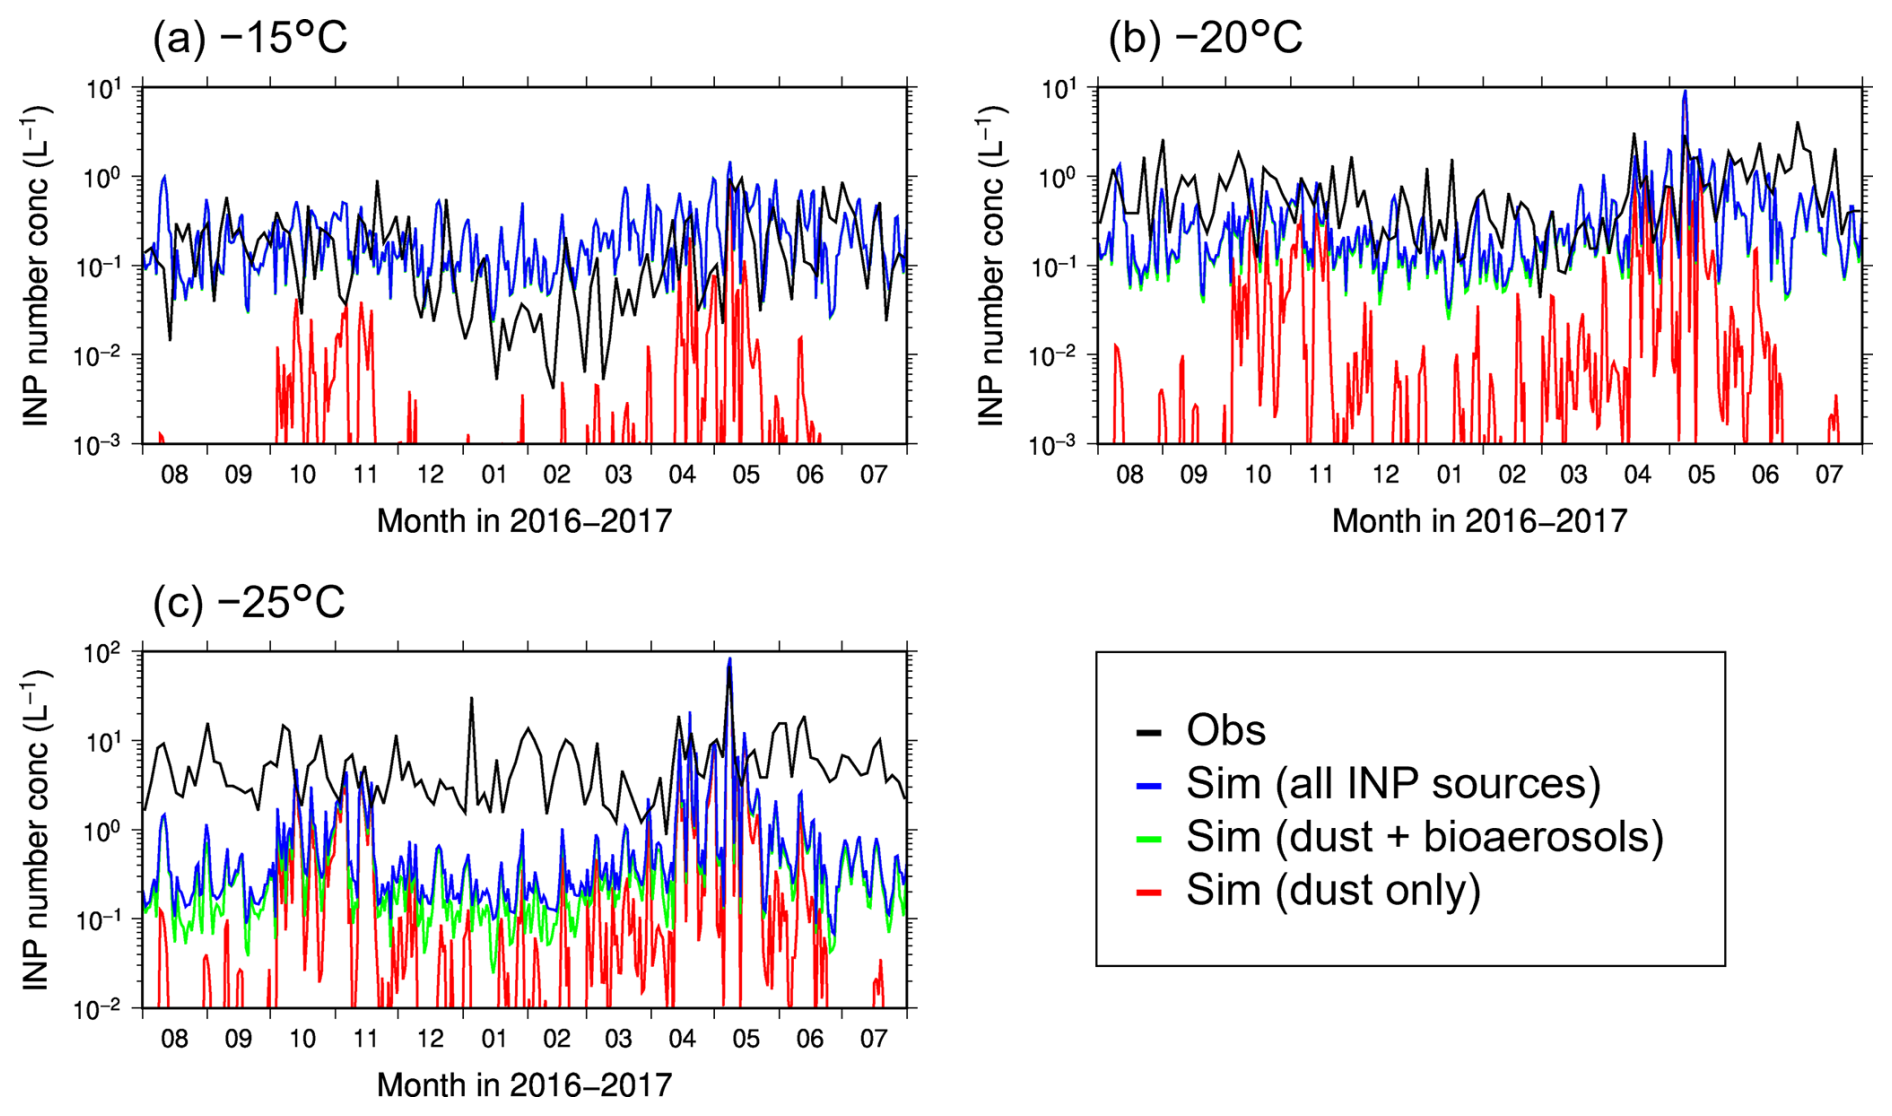
Figure 4INP number concentrations observed at Tokyo Skytree, Japan, throughout the year (three-day mean) at freezing temperatures of (a) −15 °C, (b) −20 °C, and (c) −25 °C (Tobo et al., 2020) (black), and those simulated for the corresponding location and period (daily mean) for dust only (red), dust + bioaerosols (green), and all INP sources (blue).
The model reasonably well reproduces bioaerosol number concentrations observed in the Amazon rainforest, where bioaerosols are the dominant aerosols (Patade et al., 2021) (Fig. S3). Although the model underestimates the number concentrations of bacteria by more than one order of magnitude, it reproduces the observed number concentrations of fungal spores and pollen within one order of magnitude.
3.2 Global mean INP number concentrations
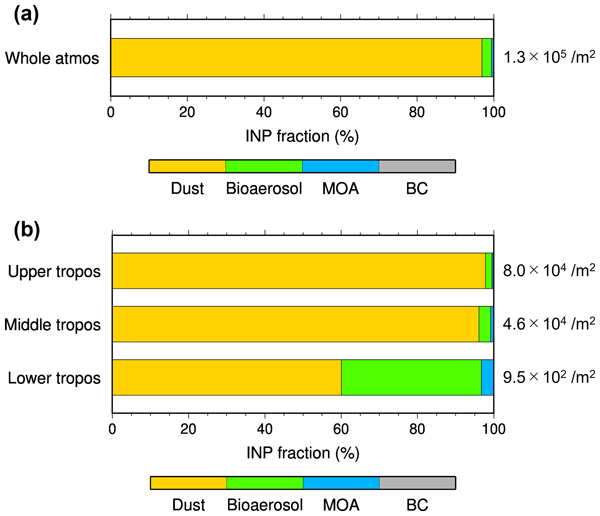
We estimate the contribution of each aerosol species to the global mean INP number concentrations in clouds (Fig. 5; Table S2). In the whole atmosphere, dust accounts for the largest fraction of total INPs (97 %), followed by bioaerosols (2.4 %), MOA (0.52 %), and BC (0.11 %) (Fig. 5a). In the estimates of Hoose et al. (2010) (PBAP-MAX), dust also accounts for the largest fraction of total INPs (87 %), but the fraction of BC (12 %) is larger than that of bioaerosols (0.6 %). This discrepancy is probably due to differences in the simulation periods and the ice nucleating abilities of BC used in the models.
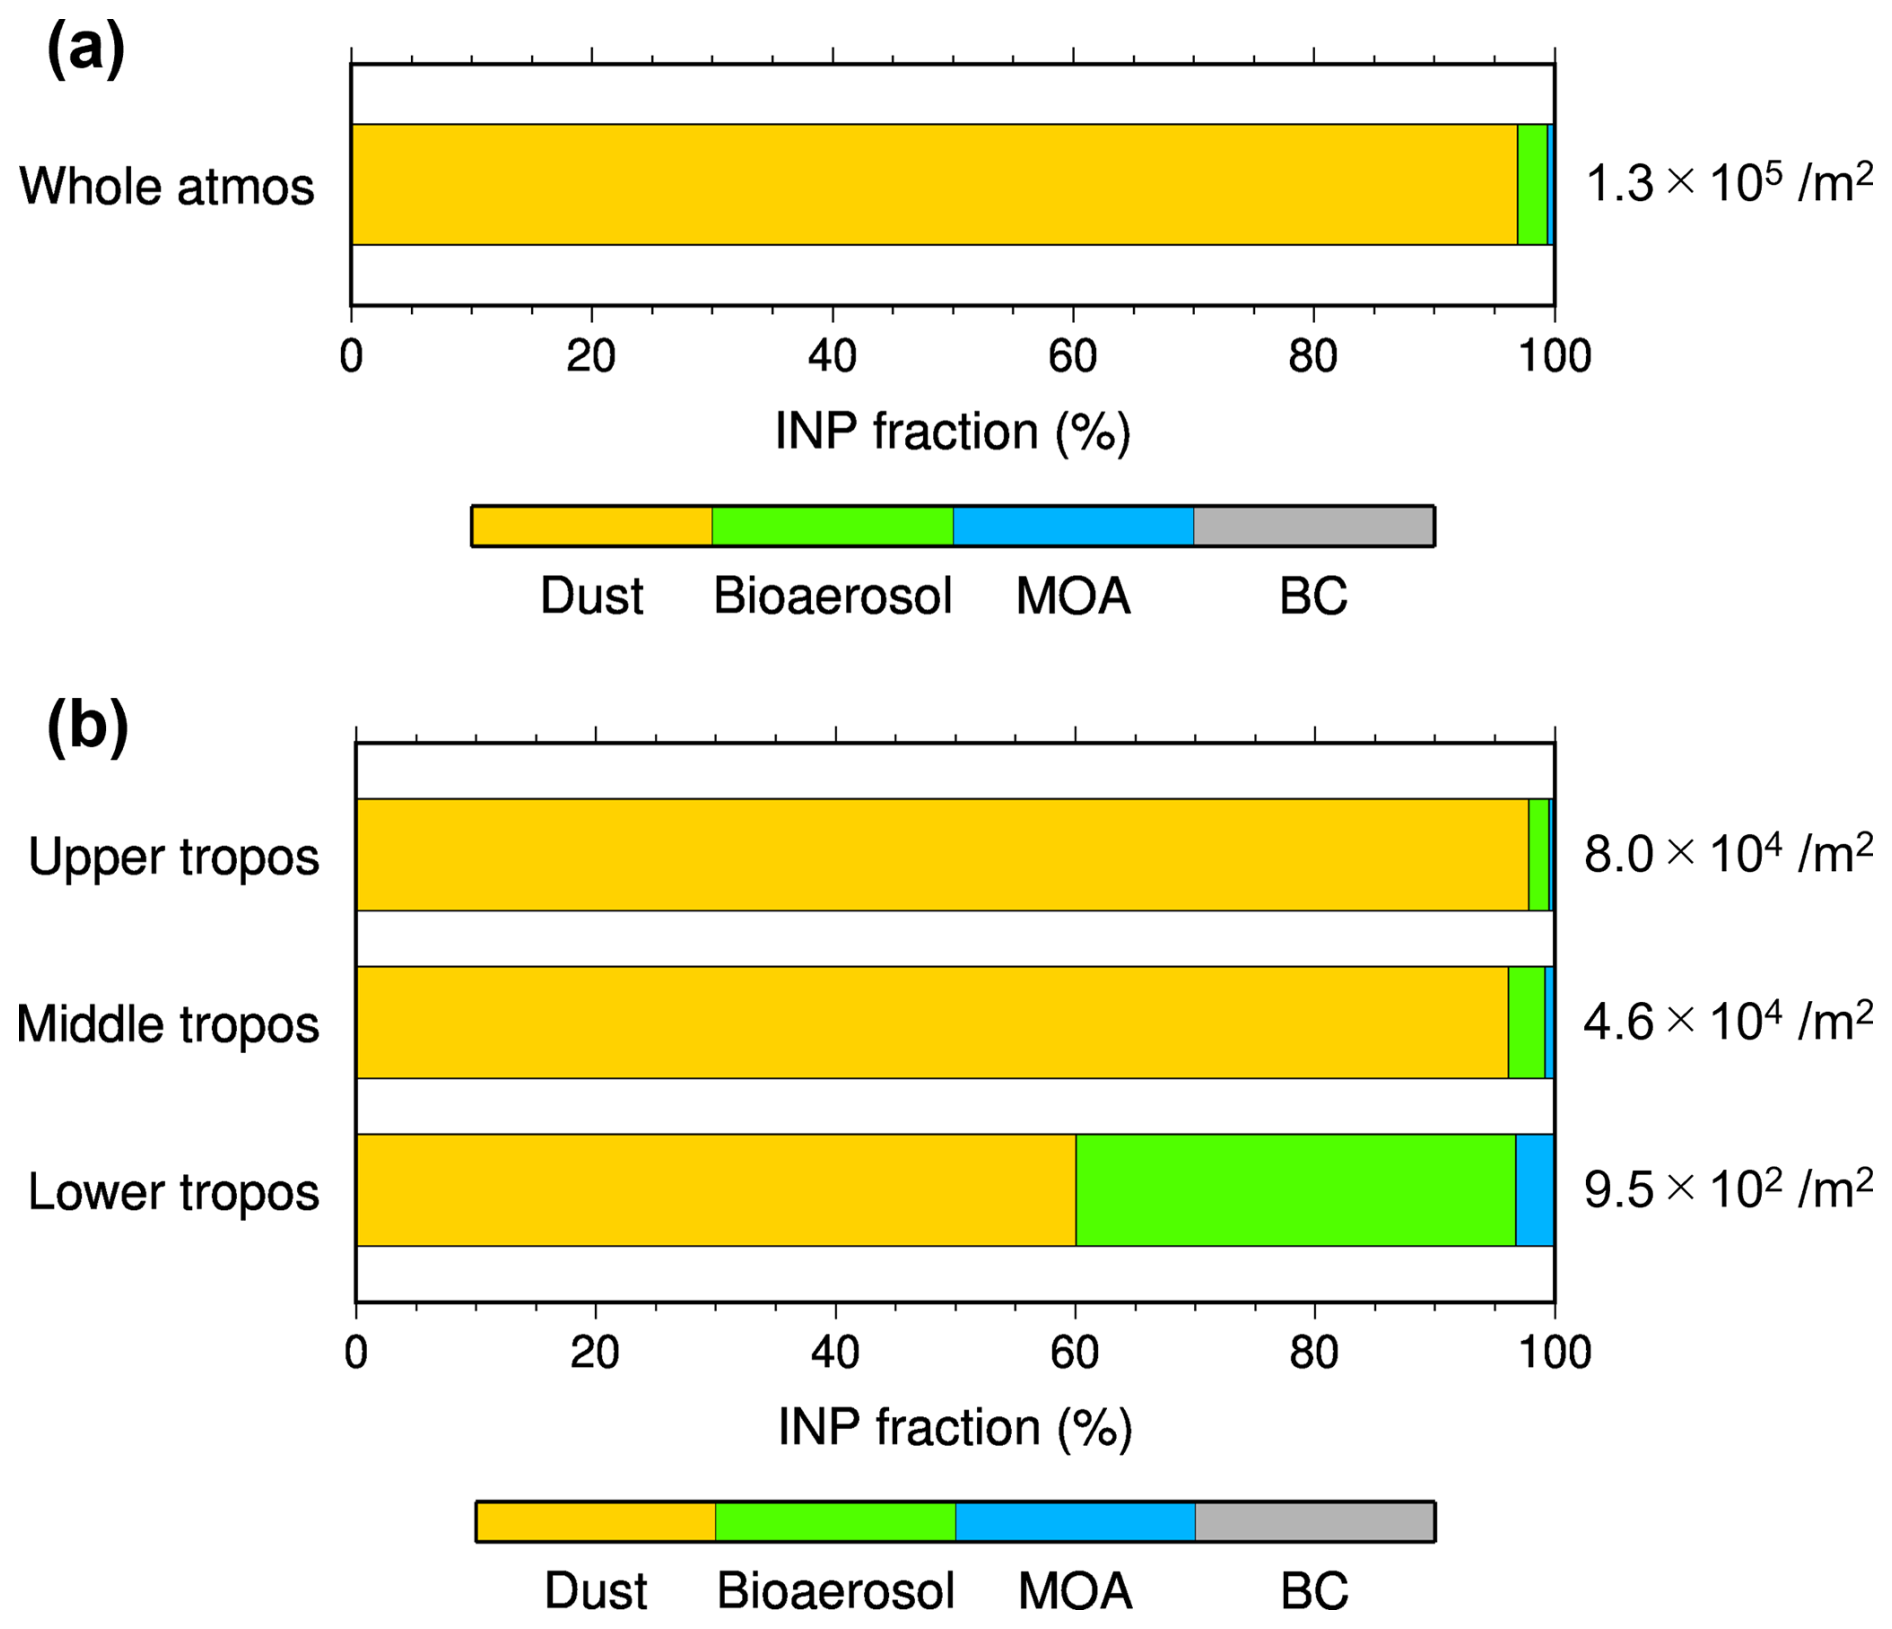
Figure 5Fractions of dust (yellow), bioaerosols (green), MOA (blue), and BC (gray) in the annual and global mean vertically integrated total INP number concentrations (shown on the right) in (a) the whole atmosphere (2–1000 hPa) and (b) the upper (100–400 hPa), middle (400–700 hPa), and lower troposphere (700–1000 hPa).
We estimate the global mean INP number concentration per unit mass concentration for each aerosol species (Table S3), which represents their efficiency in acting as INPs. The INP-to-mass ratio is highest for MOA (8.8×10⁶ g−1) and lowest for BC (6.7×10⁵ g−1). Dust and bioaerosols have similar INP-to-mass ratios (2.0×10⁶ g−1 and 2.4×10⁶ g−1, respectively), suggesting that their efficiencies are comparable as INPs. This result suggests that dust contributes the most to total INPs, primarily because it has the highest mass concentration.
In the upper and middle troposphere, dust accounts for more than 90 % of the total INP number concentrations (Fig. 5b), primarily because of its high ice nucleating ability at lower temperatures. In the lower troposphere, dust also contributes the largest fraction (60 %), though this fraction is smaller than its contribution in the upper and middle troposphere. The fraction of bioaerosols is markedly higher in the lower troposphere (37 %) than in the upper (1.7 %) and middle troposphere (3.1 %) because bioaerosols, particularly bacteria, exhibit high ice nucleating abilities at higher temperatures. However, the total INP number concentration is smaller in the lower troposphere than in the upper and middle troposphere (Fig. 5b) mainly because of the exponentially higher ice nucleating abilities of aerosol species at lower temperatures. The fraction of bioaerosols in the whole atmosphere is therefore small (Fig. 5a). These results indicate that although dust is the dominant source of INPs throughout the atmosphere, bioaerosols also play an important role in the lower troposphere.
3.3 Global distributions of INPs
The global distribution of INPs from each aerosol species is determined by the ice nucleating ability and concentrations of the aerosol species along with ambient temperature and cloud water content. Each aerosol species is distributed over its source regions and their respective downwind areas (Fig. S1). The INPs from dust are distributed over the dust source regions, which are located on all continents except Antarctica (Fig. S2), and their downwind regions (Fig. 6a). The INPs from bioaerosols are primarily distributed over terrestrial regions globally, except Antarctica and Greenland (Fig. 6b). Among the bioaerosol types, bacteria contribute the largest fraction of the global mean bioaerosol INP number concentration (Fig. S4). The INPs from MOA are distributed primarily over the North Atlantic to the Arctic Ocean, the North Pacific, and the Southern Ocean (Fig. 6c). The INPs from BC (from biomass burning) are abundant over South America (Fig. 6d).
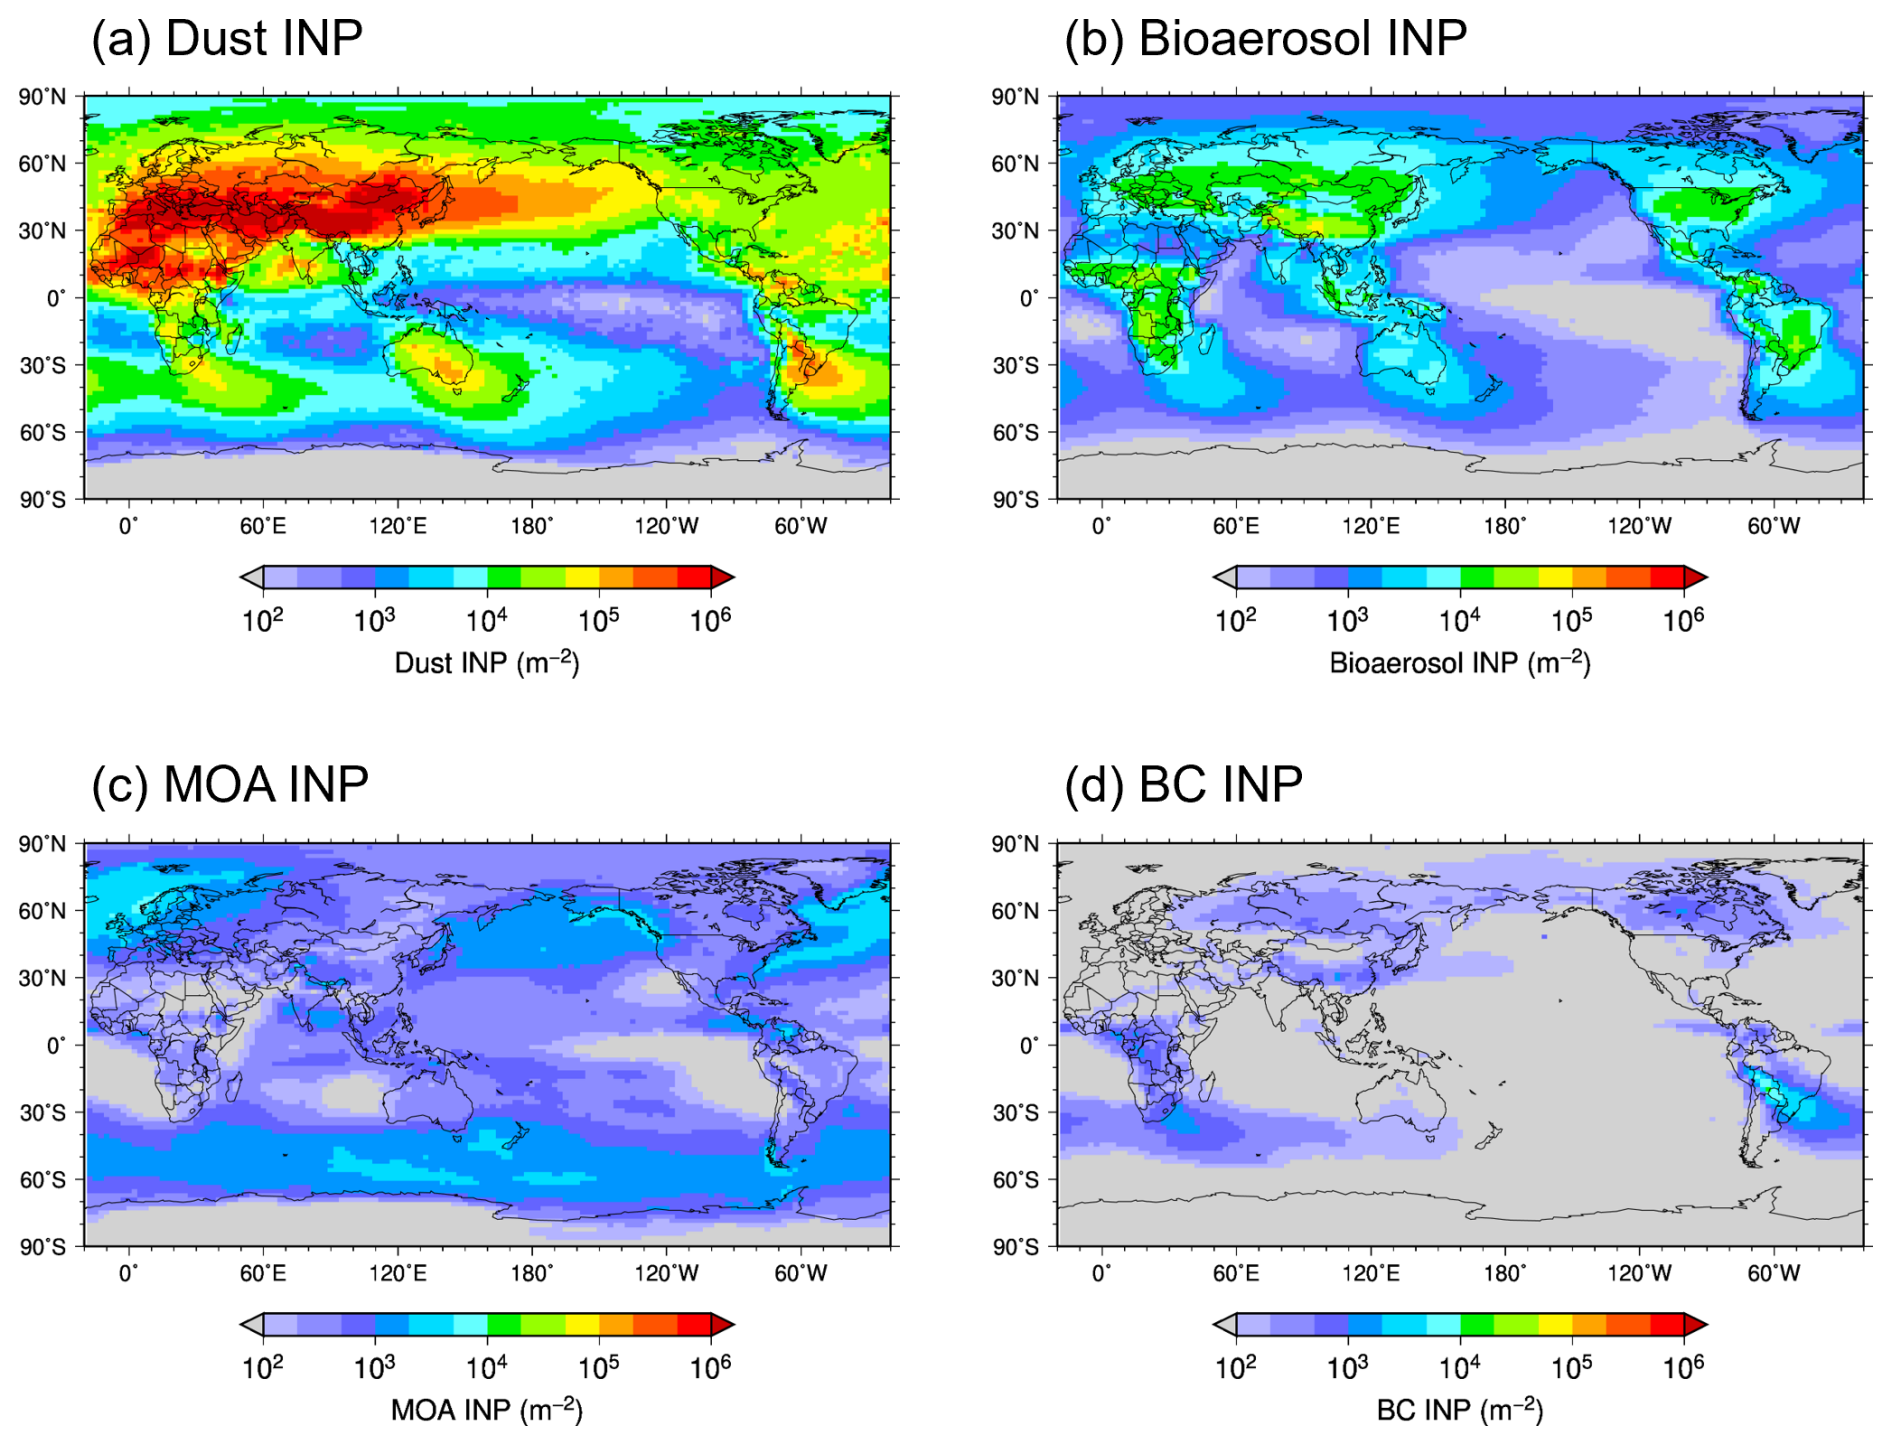
Figure 6Annual mean vertically integrated INP number concentrations of (a) dust, (b) bioaerosols, (c) MOA, and (d) BC.
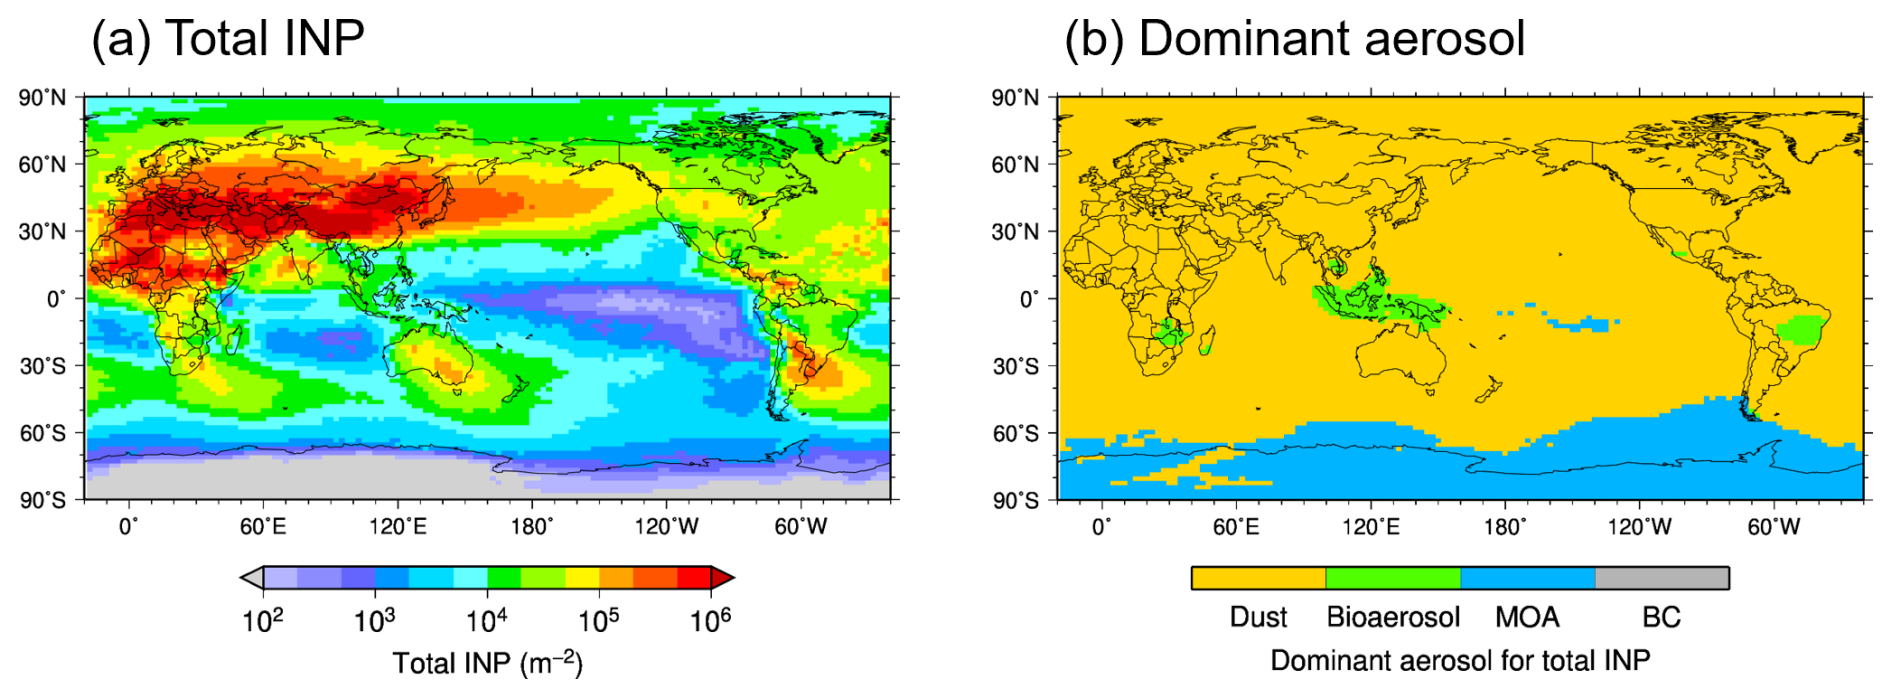
Figure 7(a) Annual mean vertically integrated INP number concentrations of all aerosol species (total INPs). (b) Dominant aerosol species contributing the largest fraction of the total INP number concentration in each grid.
We investigate the dominant aerosol species contributing the largest fraction of the vertically integrated total INP number concentration in each grid (Fig. 7). Around Antarctica, MOA accounts for the largest fraction of total INPs, likely because the MOA source region (Southern Ocean) is closer to Antarctica than the dust source regions (Australia, South America, and southern Africa). In Southeast Asia and central Brazil, bioaerosols account for the largest fraction of total INPs. Over the other extensive regions, dust is the dominant contributor to total INPs.
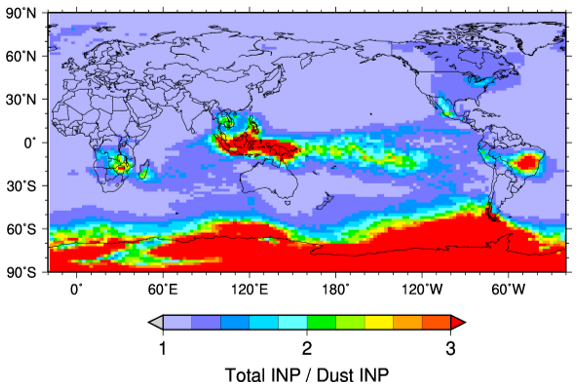
Figure 8Ratio of the annual mean vertically integrated INP number concentrations of all aerosol species (Fig. 7a) and dust (Fig. 6a).
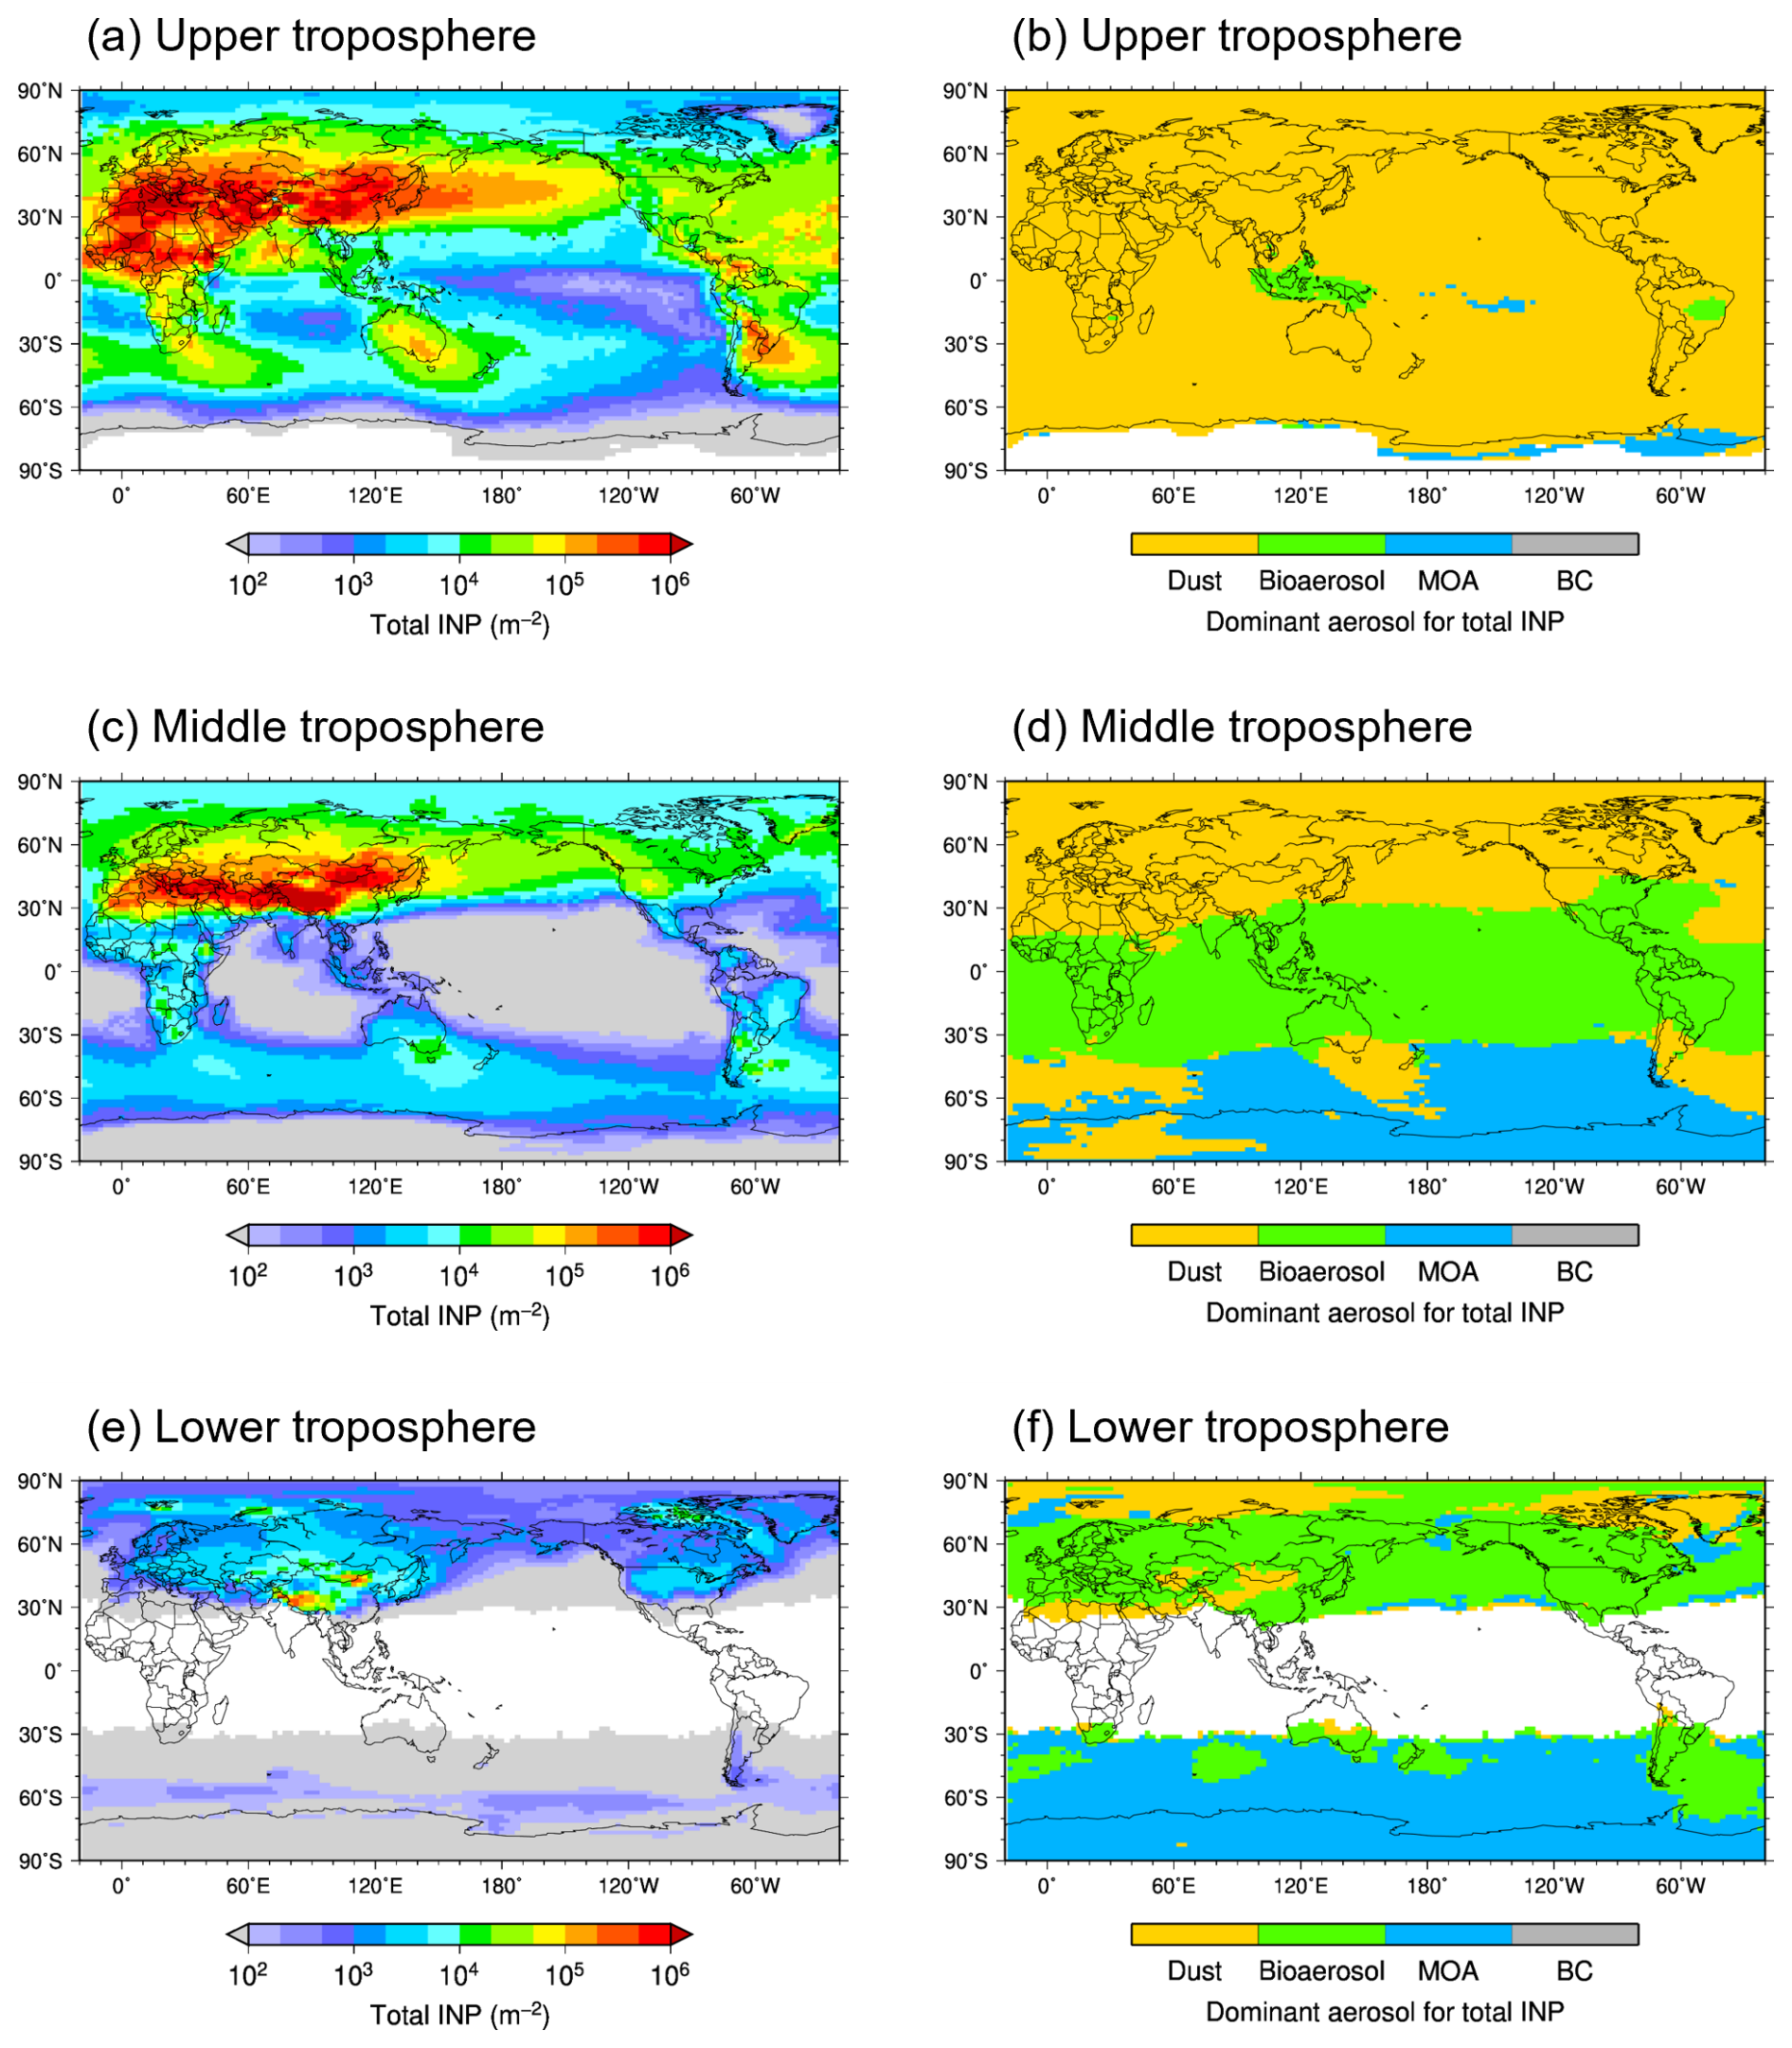
Figure 9(a, c, e) Annual mean vertically integrated total INP number concentrations and (b, d, f) dominant aerosol species contributing the largest fraction of total INPs in (a, b) the upper, (c, d) middle, and (e, f) lower troposphere (same pressure levels as Fig. 5).
A comparison of INP number concentrations derived from dust only and from all aerosol species shows that including non-dust INP sources increases INP number concentrations by more than threefold in Antarctica, the Southern Ocean, Southeast Asia, South Africa, and Brazil (Fig. 8). These regions correspond to areas where bioaerosols or MOA dominate total INPs (Fig. 7b). These findings highlight the importance of considering bioaerosols and MOA as sources of INPs to accurately estimate INP number concentrations in these regions.
Next, we analyze the dominant aerosol species that contribute the largest fractions of the total INP number concentrations in the upper, middle, and lower troposphere (Fig. 9). In the upper troposphere, dust is the dominant contributor across most regions globally (Fig. 9b). In the middle troposphere, dust dominates the total INPs in the middle and high latitudes of the Northern Hemisphere, bioaerosols dominate the low latitudes of both hemispheres, and MOA dominates the middle and high latitudes of the Southern Hemisphere (Fig. 9d). Although these regions are comparable in size, the contributions of bioaerosols and MOA to the global mean total INP number concentration in the middle troposphere are much smaller than that of dust (Fig. 5b) because the INP number concentrations in regions dominated by bioaerosols and MOA are several orders of magnitude lower than those in dust-dominated regions (Fig. 9c). In the lower troposphere, aerosols generally do not act as INPs at low latitudes because of the high temperatures (>−5 °C) (Fig. 9e). In this layer, bioaerosols and dust dominate total INPs in the Northern Hemisphere, whereas MOA and bioaerosols are dominant in the Southern Hemisphere (Fig. 9f).
INPs from bioaerosols or MOA are dominant on a seasonal basis in some regions where dust INPs are dominant on an annual average (Fig. S5). For example, in the middle troposphere, bioaerosols dominate total INPs over northern Eurasia in summer, and MOA dominates over the North Atlantic in fall and winter. In the lower troposphere over the Arctic, bioaerosol INPs are dominant in spring and MOA INPs are dominant in winter.
3.4 CREs via INPs
The CREs of dust and bioaerosol INPs are estimated from the differences between the 10-fold and 1-fold INP simulations (Sect. 2.4) (the Base simulation in Table 2). Both dust and bioaerosols have positive shortwave CREs via INPs (+0.074 and +0.027 W m−2, respectively). These positive values likely result from two main factors: (1) because INPs increase the number of ice crystals (with larger diameters) and reduce the number of water droplets (with smaller diameters) through the Wegener–Bergeron–Findeisen process (Table S4), they lower the cloud albedo; and (2) because the increase in the number of ice crystals is smaller than the decrease in the number of water droplets because of precipitation, there is an overall decrease in cloud optical thickness. The shortwave CRE of dust via INPs is approximately 2.8 times that of bioaerosols. The longwave CRE of dust via INPs is also positive (+0.16 W m−2), likely because the increased number of ice crystals at high altitudes emit less longwave radiation. In contrast, the longwave CRE of bioaerosols is negligible (−0.015 W m−2). Consequently, the net (shortwave + longwave) CRE of dust via INPs (+0.23 W m−2) is about 19 times greater than that of bioaerosols (+0.012 W m−2).
Table 2Annual and global mean cloud radiative effects (CREs) of dust, bioaerosols, and all aerosol species via INPs at the top of the atmosphere (W m−2) for the Base and observationally constrained simulations, estimated from the 10-fold–1-fold simulations. The values represent the averages and standard deviations of annual mean CREs for 10 years. The scaled net CREs corresponding to the 1-fold–0-fold INPs differences were estimated by fitting the simulated net CREs for 1–50-fold dust INPs relative to 0-fold dust INPs using a power-law function of y=axb (Fig. 2) (Sect. 2.4).
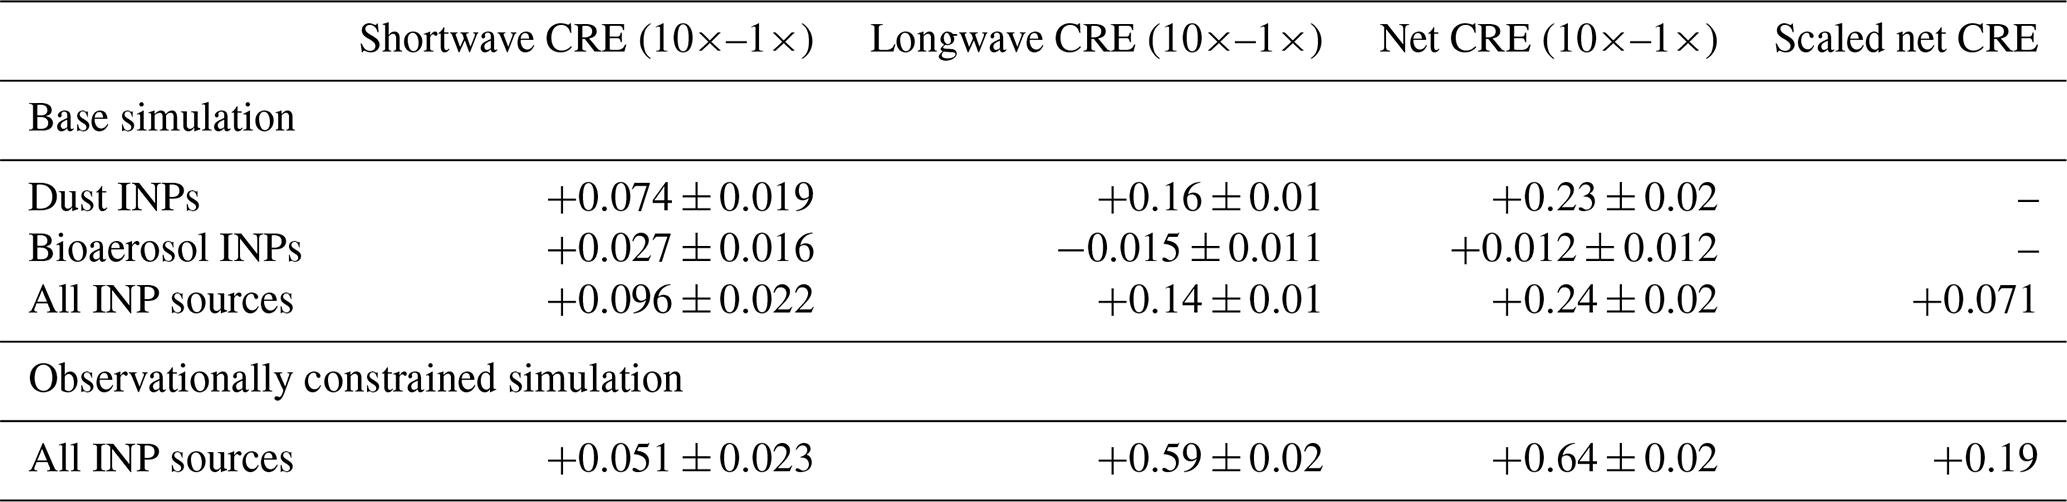
Although the CREs of bioaerosol-derived INPs are small and subject to substantial uncertainty, the ratio of the CREs of bioaerosols to those of dust via INPs (36 %, −9.4 %, and 5.2 % for shortwave, longwave, and net CREs, respectively; Table 2) is considerably higher than the global mean ratio of bioaerosols to dust INP number concentrations (2.5 %; Fig. 5a). This discrepancy may be attributed to differences in the sensitivity of CREs to INP number concentration in regions where either bioaerosols or dust are dominant. The sensitivity appears to be higher for bioaerosols than for dust, suggesting that even a small number of bioaerosol-derived INPs might efficiently form ice crystals. This difference in sensitivity might be related to the fact that, at temperatures where bioaerosols dominate INP activity (warmer than approximately −10 °C), mixed-phase clouds typically contain relatively few ice crystals and abundant supercooled water droplets. Under such conditions, an increase in INPs could efficiently enhance ice formation and promote the conversion of water droplets to ice crystals, leading to a stronger impact on cloud properties.
The CRE of all aerosol species via INPs in the Base simulation (0.24 W m−2) is approximately equal to the sum of the CREs of dust and bioaerosols via INPs (Table 2). This result highlights the crucial roles of dust and bioaerosols in determining the radiative effects of aerosol-cloud interactions via INPs in mixed-phase clouds, with dust making a markedly larger contribution than bioaerosols.
We also estimate the CREs of all aerosol species via INPs when the ice nucleating ability of bacteria is constrained by the year-round INP observations in Tokyo (Sect. 2.3). The observationally constrained simulation reasonably reproduces the temperature dependence of the INP number concentrations observed in Tokyo in each month (Fig. S6) and the global INP observations in China, Canada, and the Arctic, although it overestimates the INP number concentration observed in France by an order of magnitude (Fig. S7). The shortwave and longwave CREs of all INP sources estimated by the observationally constrained simulation are +0.051 and +0.59 W m−2, respectively (Table 2). As a result, the estimated net CRE (+0.64 W m−2) is 2.7 times that of the Base simulation (+0.24 W m−2). The net CREs scaled to the 1-fold–0-fold differences (Sect. 2.4) are estimated to be +0.071 W m−2 for the Base simulation and +0.19 W m−2 for the observationally constrained simulation (Table 2). Although we constrain the ice nucleating ability of bacteria to the INP observations in Tokyo, the differences in CREs between the Base and observationally constrained simulations may reflect uncertainties in various factors, including not only the emission and ice nucleating ability of bacteria, but also INPs from other aerosol species and unknown sources. Further investigations of these factors are required to reduce uncertainties in estimation of INPs and their radiative effects through aerosol-cloud interactions.
This study evaluated the number concentrations, spatial distributions, and CREs of INPs from multiple aerosol species (dust, bioaerosols, MOA, and BC) using the global climate-aerosol model CAM-ATRAS. By incorporating bioaerosols and MOA as INP sources, the model reproduces INP observations worldwide more accurately than a simulation considering only dust as INPs. The global mean INP number concentration is dominated by dust (97 %) because of its larger atmospheric mass burden. However, bioaerosols and MOA are the major contributors in specific regions: bioaerosols dominate in the middle troposphere at low latitudes and in the lower troposphere at mid-latitudes in the Northern Hemisphere, whereas MOA dominates in the middle and lower troposphere at mid- and high latitudes in the Southern Hemisphere. The inclusion of bioaerosols and MOA increases INP number concentrations by more than threefold in Antarctica, the Southern Ocean, Southeast Asia, South Africa, and Brazil, underscoring the regional importance of bioaerosols and MOA in aerosol-cloud interactions via INPs.
The global mean net (shortwave + longwave) CREs (10×–1×) via INPs from dust and bioaerosols are +0.23 and +0.012 W m−2, respectively. The sensitivity of CREs to INP number concentrations (i.e., CRE per unit INP number) appears to be higher for bioaerosols than for dust, likely because mixed-phase clouds at temperatures where bioaerosols dominate INP activity tend to contain fewer total INPs, more water droplets, and fewer ice crystals. When the temperature dependence of INP activity is constrained using year-round INP observations in Tokyo, the scaled net CRE (1×–0×) via INPs from all aerosol species increases from +0.071 W m−2 in the Base simulation to +0.19 W m−2 in the observation-constrained simulation. These results highlight the importance of including INPs from multiple aerosol species and representing realistic INP number concentrations in model simulations to better understand aerosol-cloud interactions. Long-term global observations of aerosols and INPs are essential for constraining climate models and reducing uncertainties in the estimation of INPs and their radiative effects.
In this study, we assumed that a small fraction of atmospheric bacteria – specifically Pseudomonas syringae – acts as efficient INPs, based on a previous study (Hummel et al., 2018). However, future research should aim to estimate the global surface distribution of such bacterial species using observational data and incorporate this distribution into models to improve emission flux estimates. Considering the interannual variability of bioaerosol and MOA emissions is essential for assessing long-term changes in total INP concentrations and the CREs of aerosol-cloud interactions via INPs.
Data used in Figs. 1–9 are available at https://doi.org/10.5281/zenodo.21153025 (Kawai et al., 2026).
The supplement related to this article is available online at https://doi.org/10.5194/acp-26-10893-2026-supplement.
KK and HM conceived and designed the research. KK and ZR performed model simulations and data analysis. KK wrote the manuscript. KK and HM interpreted data, discussed their implications, and contributed to the manuscript.
The contact author has declared that none of the authors has any competing interests.
Publisher's note: Copernicus Publications remains neutral with regard to jurisdictional claims made in the text, published maps, institutional affiliations, or any other geographical representation in this paper. The authors bear the ultimate responsibility for providing appropriate place names. Views expressed in the text are those of the authors and do not necessarily reflect the views of the publisher.
We thank Yutaka Tobo (National Institute of Polar Research, Japan) for providing INP observation data. This work was partly achieved through the use of large-scale computer systems at D3 Center, The University of Osaka.
This research was supported by the Ministry of Education, Culture, Sports, Science, and Technology (MEXT) and the Japan Society for the Promotion of Science (JSPS) through KAKENHI Grants (JP22H03722, JP23H00515, JP23H00523, JP23K18519, JP23K24976, JP24H02225, JP26K00780, and JP26K03065); the MEXT Arctic Challenge for Sustainability II (ArCS II; JPMXD1420318865) and 3 (ArCS-3; JPMXD1720251001) Projects; the Environment Research and Technology Development Fund 2-2301 (JPMEERF20232001) and 2-2602 (JPMEERF20262002) of the Environmental Restoration and Conservation Agency; the Joint Research Program of the Arid Land Research Center, Tottori University (05C2001); and National Institute of Polar Research (NIPR) through Special Collaboration Project (B25-02).
This paper was edited by Jianzhong Ma and reviewed by three anonymous referees.
Atkinson, J. D., Murray, B. J., Woodhouse, M. T., Whale, T. F., Baustian, K. J., Carslaw, K. S., Dobbie, S., O'Sullivan, D., and Malkin, T. L.: The importance of feldspar for ice nucleation by mineral dust in mixed-phase clouds, Nature, 498, 355–358, https://doi.org/10.1038/nature12278, 2013.
Bond, T. C., Doherty, S. J., Fahey, D. W., Forster, P. M., Berntsen, T., DeAngelo, B. J., Flanner, M. G., Ghan, S., Kärcher, B., Koch, D., Kinne, S., Kondo, Y., Quinn, P. K., Sarofim, M. C., Schultz, M. G., Schulz, M., Venkataraman, C., Zhang, H., Zhang, S., Bellouin, N., Guttikunda, S. K., Hopke, P. K., Jacobson, M. Z., Kaiser, J. W., Klimont, Z., Lohmann, U., Schwarz, J. P., Shindell, D., Storelvmo, T., Warren, S. G., and Zender, C. S.: Bounding the role of black carbon in the climate system: A scientific assessment, J. Geophys. Res.-Atmos., 118, 5380–5552, https://doi.org/10.1002/jgrd.50171, 2013.
Burrows, S. M., Hoose, C., Pöschl, U., and Lawrence, M. G.: Ice nuclei in marine air: biogenic particles or dust?, Atmos. Chem. Phys., 13, 245–267, https://doi.org/10.5194/acp-13-245-2013, 2013.
Chatziparaschos, M., Myriokefalitakis, S., Kalivitis, N., Daskalakis, N., Nenes, A., Gonçalves Ageitos, M., Costa-Surós, M., Pérez García-Pando, C., Vrekoussis, M., and Kanakidou, M.: Assessing the global contribution of marine aerosols, terrestrial bioaerosols, and desert dust to ice-nucleating particle concentrations, Atmos. Chem. Phys., 25, 9085–9111, https://doi.org/10.5194/acp-25-9085-2025, 2025.
DeMott, P. J., Prenni, A. J., McMeeking, G. R., Sullivan, R. C., Petters, M. D., Tobo, Y., Niemand, M., Möhler, O., Snider, J. R., Wang, Z., and Kreidenweis, S. M.: Integrating laboratory and field data to quantify the immersion freezing ice nucleation activity of mineral dust particles, Atmos. Chem. Phys., 15, 393–409, https://doi.org/10.5194/acp-15-393-2015, 2015.
Diehl, K. and Mitra, S. K.: New particle-dependent parameterizations of heterogeneous freezing processes: sensitivity studies of convective clouds with an air parcel model, Atmos. Chem. Phys., 15, 12741–12763, https://doi.org/10.5194/acp-15-12741-2015, 2015.
Eidhammer, T., Morrison, H., Mitchell, D., Gettelman, A., and Erfani, E.: Improvements in Global Climate Model Microphysics Using a Consistent Representation of Ice Particle Properties, J. Climate, 30, 609–629, https://doi.org/10.1175/JCLI-D-16-0050.1, 2017.
Gettelman, A., Liu, X., Ghan, S. J., Morrison, H., Park, S., Conley, A. J., Klein, S. A., Boyle, J., Mitchell, D. L., and Li, J.-L. F.: Global simulations of ice nucleation and ice supersaturation with an improved cloud scheme in the Community Atmosphere Model, J. Geophys. Res.-Atmos., 115, D18216, https://doi.org/10.1029/2009JD013797, 2010.
Hoesly, R. M., Smith, S. J., Feng, L., Klimont, Z., Janssens-Maenhout, G., Pitkanen, T., Seibert, J. J., Vu, L., Andres, R. J., Bolt, R. M., Bond, T. C., Dawidowski, L., Kholod, N., Kurokawa, J.-I., Li, M., Liu, L., Lu, Z., Moura, M. C. P., O'Rourke, P. R., and Zhang, Q.: Historical (1750–2014) anthropogenic emissions of reactive gases and aerosols from the Community Emissions Data System (CEDS), Geosci. Model Dev., 11, 369–408, https://doi.org/10.5194/gmd-11-369-2018, 2018.
Hoose, C., Kristjánsson, J. E., Chen, J.-P., and Hazra, A.: A Classical-Theory-Based Parameterization of Heterogeneous Ice Nucleation by Mineral Dust, Soot, and Biological Particles in a Global Climate Model, J. Atmos. Sci., 67, 2483–2503, https://doi.org/10.1175/2010JAS3425.1, 2010.
Hu, Y., Tian, P., Huang, M., Bi, K., Schneider, J., Umo, N. S., Ullmerich, N., Höhler, K., Jing, X., Xue, H., Ding, D., Liu, Y., Leisner, T., and Möhler, O.: Characteristics of ice-nucleating particles in Beijing during spring: A comparison study of measurements between the suburban and a nearby mountain area, Atmos. Environ., 293, 119451, https://doi.org/10.1016/j.atmosenv.2022.119451, 2023.
Hummel, M., Hoose, C., Pummer, B., Schaupp, C., Fröhlich-Nowoisky, J., and Möhler, O.: Simulating the influence of primary biological aerosol particles on clouds by heterogeneous ice nucleation, Atmos. Chem. Phys., 18, 15437–15450, https://doi.org/10.5194/acp-18-15437-2018, 2018.
Hurrell, J. W., Hack, J. J., Shea, D., Caron, J. M., and Rosinski, J.: A New Sea Surface Temperature and Sea Ice Boundary Dataset for the Community Atmosphere Model, J. Climate, 21, 5145–5153, https://doi.org/10.1175/2008JCLI2292.1, 2008.
Hurrell, J. W., Holland, M. M., Gent, P. R., Ghan, S., Kay, J. E., Kushner, P. J., Lamarque, J.-F., Large, W. G., Lawrence, D., Lindsay, K., Lipscomb, W. H., Long, M. C., Mahowald, N., Marsh, D. R., Neale, R. B., Rasch, P., Vavrus, S., Vertenstein, M., Bader, D., Collins, W. D., Hack, J. J., Kiehl, J., and Marshall, S.: The Community Earth System Model: A Framework for Collaborative Research, B. Am. Meteorol. Soc., 94, 1339–1360, https://doi.org/10.1175/BAMS-D-12-00121.1, 2013.
Imura, Y. and Suzuki, K.: Evaluation of Climatic Impacts of Ice-Nucleating Particles through Precipitation Process with a GCM, J. Climate, 38, 2659–2677, https://doi.org/10.1175/JCLI-D-24-0335.1, 2025.
Kanji, Z. A., Ladino, L. A., Wex, H., Boose, Y., Burkert-Kohn, M., Cziczo, D. J., and Krämer, M.: Overview of Ice Nucleating Particles, Meteor. Mon., 58, 1.1–1.33, https://doi.org/10.1175/AMSMONOGRAPHS-D-16-0006.1, 2017.
Kawai, K., Matsui, H., Kimura, R., and Shinoda, M.: High Sensitivity of Asian Dust Emission, Transport, and Climate Impacts to Threshold Friction Velocity, SOLA, 17, 239–245, https://doi.org/10.2151/sola.2021-042, 2021a.
Kawai, K., Matsui, H., and Tobo, Y.: High Potential of Asian Dust to Act as Ice Nucleating Particles in Mixed-Phase Clouds Simulated With a Global Aerosol-Climate Model, J. Geophys. Res.-Atmos., 126, e2020JD034263, https://doi.org/10.1029/2020JD034263, 2021b.
Kawai, K., Matsui, H., and Tobo, Y.: Dominant Role of Arctic Dust With High Ice Nucleating Ability in the Arctic Lower Troposphere, Geophys. Res. Lett., 50, e2022GL102470, https://doi.org/10.1029/2022GL102470, 2023.
Kawai, K. and Matsui, H.: Contributions of Dust Source Regions to Ice Nucleating Particles in Mixed-Phase Clouds Simulated with a Global Climate–Aerosol Model, J. Climate, 38, 4925–4939, https://doi.org/10.1175/JCLI-D-24-0696.1, 2025.
Kawai, K., Ren, Z., and Matsui, H.: Supporting datasets used in the paper entitled “Global Modeling of Ice Nucleating Particles of Multiple Aerosol Species and Associated Cloud Radiative Effects”, Zenodo [data set], https://doi.org/10.5281/zenodo.21153025, 2026.
Kok, J. F.: A scaling theory for the size distribution of emitted dust aerosols suggests climate models underestimate the size of the global dust cycle, P. Natl. Acad. Sci. USA, 108, 1016–1021, https://doi.org/10.1073/pnas.1014798108, 2011.
Kok, J. F., Mahowald, N. M., Fratini, G., Gillies, J. A., Ishizuka, M., Leys, J. F., Mikami, M., Park, M.-S., Park, S.-U., Van Pelt, R. S., and Zobeck, T. M.: An improved dust emission model – Part 1: Model description and comparison against measurements, Atmos. Chem. Phys., 14, 13023–13041, https://doi.org/10.5194/acp-14-13023-2014, 2014.
Korolev, A.: Limitations of the Wegener–Bergeron–Findeisen Mechanism in the Evolution of Mixed-Phase Clouds, J. Atmos. Sci., 64, 3372–3375, https://doi.org/10.1175/JAS4035.1, 2007.
Lamarque, J.-F., Emmons, L. K., Hess, P. G., Kinnison, D. E., Tilmes, S., Vitt, F., Heald, C. L., Holland, E. A., Lauritzen, P. H., Neu, J., Orlando, J. J., Rasch, P. J., and Tyndall, G. K.: CAM-chem: description and evaluation of interactive atmospheric chemistry in the Community Earth System Model, Geosci. Model Dev., 5, 369–411, https://doi.org/10.5194/gmd-5-369-2012, 2012.
Liu, M. and Matsui, H.: Improved simulations of global black carbon distributions by modifying wet scavenging processes in convective and mixed-phase clouds, J. Geophys. Res.-Atmos., 126, e2020JD033890, https://doi.org/10.1029/2020JD033890, 2021.
Liu, M. and Matsui, H.: Secondary organic aerosol formation regulates cloud condensation nuclei in the global remote troposphere, Geophys. Res. Lett., 49, e2022GL100543, https://doi.org/10.1029/2022GL100543, 2022.
Liu, M., Matsui, H., Hamilton, D. S., Lamb, K. D., Rathod, S. D., Schwarz, J. P., and Mahowald, N. M.: The underappreciated role of anthropogenic sources in atmospheric soluble iron flux to the Southern Ocean, npj Clim. Atmos. Sci., 5, 28, https://doi.org/10.1038/s41612-022-00250-w, 2022.
Liu, M., Matsui, H., Hamilton, D. S., Rathod, S. D., Lamb, K. D., and Mahowald, N. M.: Representation of iron aerosol size distributions of anthropogenic emissions is critical in evaluating atmospheric soluble iron input to the ocean, Atmos. Chem. Phys., 24, 13115–13127, https://doi.org/10.5194/acp-24-13115-2024, 2024a.
Liu, M., Song, Y., Matsui, H., Shang, F., Kang, L., Cai, X., Zhang, H., and Zhu, T.: Enhanced atmospheric oxidation toward carbon neutrality reduces methane's climate forcing, Nat. Commun., 15, 3148, https://doi.org/10.1038/s41467-024-47436-9, 2024b.
Mårtensson, E. M., Nilsson, E. D., de Leeuw, G., Cohen, L. H., and Hansson, H.-C.: Laboratory simulations and parameterization of the primary marine aerosol production, J. Geophys. Res.-Atmos., 108, 4297, https://doi.org/10.1029/2002JD002263, 2003.
Mason, R. H., Si, M., Chou, C., Irish, V. E., Dickie, R., Elizondo, P., Wong, R., Brintnell, M., Elsasser, M., Lassar, W. M., Pierce, K. M., Leaitch, W. R., MacDonald, A. M., Platt, A., Toom-Sauntry, D., Sarda-Estève, R., Schiller, C. L., Suski, K. J., Hill, T. C. J., Abbatt, J. P. D., Huffman, J. A., DeMott, P. J., and Bertram, A. K.: Size-resolved measurements of ice-nucleating particles at six locations in North America and one in Europe, Atmos. Chem. Phys., 16, 1637–1651, https://doi.org/10.5194/acp-16-1637-2016, 2016.
Matsui, H.: Development of a global aerosol model using a two-dimensional sectional method: 1. Model design, J. Adv. Model Earth Sy., 9, 1921–1947, https://doi.org/10.1002/2017MS000936, 2017.
Matsui, H. and Mahowald, N. M.: Development of a global aerosol model using a two-dimensional sectional method: 2. Evaluation and sensitivity simulations, J. Adv. Model Earth Sy., 9, 1887–1920, https://doi.org/10.1002/2017MS000937, 2017.
Matsui, H., Hamilton, D. S., and Mahowald, N. M.: Black carbon radiative effects highly sensitive to emitted particle size when resolving mixing-state diversity, Nat. Commun., 9, 3446, https://doi.org/10.1038/s41467-018-05635-1, 2018a.
Matsui, H., Mahowald, N. M., Moteki, N., Hamilton, D. S., Ohata, S., Yoshida, A., Koike, M., Scanza, R. A., and Flanner, M. G.: Anthropogenic combustion iron as a complex climate forcer, Nat. Commun., 9, 1593, https://doi.org/10.1038/s41467-018-03997-0, 2018b.
Matsui, H., Mori, T., Ohata, S., Moteki, N., Oshima, N., Goto-Azuma, K., Koike, M., and Kondo, Y.: Contrasting source contributions of Arctic black carbon to atmospheric concentrations, deposition flux, and atmospheric and snow radiative effects, Atmos. Chem. Phys., 22, 8989–9009, https://doi.org/10.5194/acp-22-8989-2022, 2022.
Matsui, H., Kawai, K., Tobo, Y., Iizuka, Y., and Matoba, S.: Increasing Arctic dust suppresses the reduction of ice nucleation in the Arctic lower troposphere by warming, npj Clim. Atmos. Sci., 7, 266, https://doi.org/10.1038/s41612-024-00811-1, 2024.
Mitchell, D. L., Rasch, P., Ivanova, D., McFarquhar, G., and Nousiainen, T.: Impact of small ice crystal assumptions on ice sedimentation rates in cirrus clouds and GCM simulations, Geophys. Res. Lett., 35, L09806, https://doi.org/10.1029/2008GL033552, 2008.
Morrison, H. and Gettelman A.: A New Two-Moment Bulk Stratiform Cloud Microphysics Scheme in the Community Atmosphere Model, Version 3 (CAM3). Part I: Description and Numerical Tests, J. Climate, 21, 3642–3659, https://doi.org/10.1175/2008JCLI2105.1, 2008.
Murray, B. J., O'Sullivan, D., Atkinson, J. D., and Webb, M. E.: Ice nucleation by particles immersed in supercooled cloud droplets, Chem. Soc. Rev., 41, 6519–6554, https://doi.org/10.1039/C2CS35200A, 2012.
Murray, B. J., Carslaw, K. S., and Field, P. R.: Opinion: Cloud-phase climate feedback and the importance of ice-nucleating particles, Atmos. Chem. Phys., 21, 665–679, https://doi.org/10.5194/acp-21-665-2021, 2021.
Neale, R. B., Gettelman, A., Park, S., Chen, C.-C., Lauritzen, P. H., Williamson, D. L., Conley, A. J., Kinnison, D., Marsh, D., Smith, A. K., Vitt, F., Garcia, R., Lamarque, J.-F., Mills, M., Tilmes, S., Morrison, H., Cameron-Smith, P., Collins, W. D., Iacono, M. J., Easter, R. C., Liu, X., Ghan, S. J., Rasch, P. J., and Taylor, M. A.: Description of the NCAR Community Atmosphere Model (CAM 5.0) (NCAR/TN-486+STR), Boulder, CO, National Center for Atmospheric Research, https://doi.org/10.5065/wgtk-4g06, 2012.
Oleson, K. W., Lawrence, D. M., Bonan, G. B., Flanner, M. G., Kluzek, E., Lawrence, P. J., Levis, S., Swenson, S. C., Thornton, P. E., Dai, A., Decker, M., Dickinson, R., Feddema, J., Heald, C. L., Hoffman, F., Lamarque, J.-F., Mahowald, N., Niu, G.-Y., Qian, T., Randerson, J., Running, S., Sakaguchi, K., Slater, A., Stöckli, R., Wang, A., Yang, Z.-L., Zeng, X., and Zeng, X.: Technical Description of version 4.0 of the Community Land Model (CLM) (NCAR/TN-478+STR), Boulder, CO, National Center for Atmospheric Research, https://doi.org/10.5065/D6FB50WZ, 2010.
Patade, S., Phillips, V. T. J., Amato, P., Bingemer, H. G., Burrows, S. M., DeMott, P. J., Goncalves, F. L. T., Knopf, D. A., Morris, C. E., Alwmark, C., Artaxo, P., Pöhlker, C., Schrod, J., and Weber, B.: Empirical Formulation for Multiple Groups of Primary Biological Ice Nucleating Particles from Field Observations over Amazonia, J. Atmos. Sci., 78, 2195–2220, https://doi.org/10.1175/JAS-D-20-0096.1, 2021.
Ramanathan, V., Cess, R. D., Harrison, E. F., Minnis, P., Barkstrom, B. R., Ahmad, E., and Hartmann, D.: Cloud-Radiative Forcing and Climate: Results from the Earth Radiation Budget Experiment, Science, 243, 57–63, https://doi.org/10.1126/science.243.4887.57, 1989.
Righi, M., Testa, B., Beer, C. G., Hendricks, J., and Kanji, Z. A.: Aviation soot interactions with natural cirrus clouds are unlikely to have a significant impact on global climate, Atmos. Chem. Phys., 25, 18341–18353, https://doi.org/10.5194/acp-25-18341-2025, 2025.
Schill, G. P., DeMott, P. J., Emerson, E. W., Rauker, A. M. C., Kodros, J. K., Suski, K. J., Hill, T. C. J., Levin, E. J. T., Pierce, J. R., Farmer, D. K., and Kreidenweis, S. M.: The contribution of black carbon to global ice nucleating particle concentrations relevant to mixed-phase clouds, P. Natl. Acad. Sci. USA, 117, 22705–22711, https://doi.org/10.1073/pnas.2001674117, 2020.
Shi, Y. and Liu, X.: Dust Radiative Effects on Climate by Glaciating Mixed-Phase Clouds, Geophys. Res. Lett., 46, 6128–6137, https://doi.org/10.1029/2019GL082504, 2019.
Storelvmo, T.: Aerosol Effects on Climate via Mixed-Phase and Ice Clouds, Annu. Rev. Earth Pl. Sc., 45, 199–222, https://doi.org/10.1146/annurev-earth-060115-012240, 2017.
Tobo, Y., Adachi, K., DeMott, P. J., Hill, T. C. J., Hamilton, D. S., Mahowald, N. M., Nagatsuka, N., Ohata, S., Uetake, J., Kondo, Y., and Koike, M.: Glacially sourced dust as a potentially significant source of ice nucleating particles, Nat. Geosci., 12, 253–258, https://doi.org/10.1038/s41561-019-0314-x, 2019.
Tobo, Y., Uetake, J., Matsui, H., Moteki, N., Uji, Y., Iwamoto, Y., Miura, K., and Misumi, R.: Seasonal Trends of Atmospheric Ice Nucleating Particles Over Tokyo, J. Geophys. Res.-Atmos., 125, e2020JD033658, https://doi.org/10.1029/2020JD033658, 2020.
van Marle, M. J. E., Kloster, S., Magi, B. I., Marlon, J. R., Daniau, A.-L., Field, R. D., Arneth, A., Forrest, M., Hantson, S., Kehrwald, N. M., Knorr, W., Lasslop, G., Li, F., Mangeon, S., Yue, C., Kaiser, J. W., and van der Werf, G. R.: Historic global biomass burning emissions for CMIP6 (BB4CMIP) based on merging satellite observations with proxies and fire models (1750–2015), Geosci. Model Dev., 10, 3329–3357, https://doi.org/10.5194/gmd-10-3329-2017, 2017.
Wilson, T. W., Ladino, L. A., Alpert, P. A., Breckels, M. N., Brooks, I. M., Browse, J., Burrows, S. M., Carslaw, K. S., Huffman, J. A., Judd, C., Kilthau, W. P., Mason, R. H., McFiggans, G., Miller, L. A., Nájera, J. J., Polishchuk, E., Rae, S., Schiller, C. L., Si, M., Temprado, J. V., Whale, T. F., Wong, J. P. S., Wurl, O., Yakobi-Hancock, J. D., Abbatt, J. P. D., Aller, J. Y., Bertram, A. K., Knopf, D. A., and Murray, B. J.: A marine biogenic source of atmospheric ice-nucleating particles, Nature, 525, 234–238, https://doi.org/10.1038/nature14986, 2015.
Zender, C. S., Bian, H., and Newman, D.: Mineral Dust Entrainment and Deposition (DEAD) model: Description and 1990s dust climatology, J. Geophys. Res.-Atmos., 108, 4416, https://doi.org/10.1029/2002JD002775, 2003.