
the Creative Commons Attribution 4.0 License.
the Creative Commons Attribution 4.0 License.
 | 05 Aug 2026
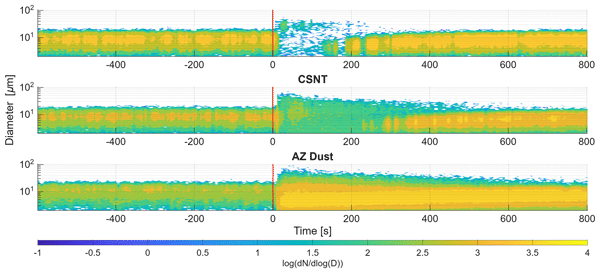
Response of a liquid water cloud to in situ hygroscopic seeding
James Simmons
Jesse Anderson
Corey Bois
Hamed Fahandezh Sadi
Kadja Flore Gali
Suryadev Pratap Singh
Andrei Vakhtin
Kurt Hibert
Bruce Boe
Youssef Wehbe
Steve Krueger
Raymond A. Shaw

Precipitation enhancement may augment water resources, yet questions still remain as to the effectiveness of current cloud seeding strategies. One such strategy, hygroscopic seeding, is designed to accelerate collision-coalescence and eventually precipitation by creating a large droplet tail in the size distribution. In the traditional approach, particles are released at cloud base, typically through burning a flare. The effect of directly injecting a hygroscopic powder into a preexisting cloud has not been experimentally tested in controlled conditions. We performed experiments in the Michigan Tech Pi Chamber to determine how a steady-state liquid water cloud responds to injection of hygroscopic powders. Three materials were tested: jet-milled NaCl, a newly developed NaCl-TiO2 core-shell material, and Arizona test dust as a non-hygroscopic control. Injection of the powders produced a local increase in liquid water content and stimulated formation of droplets up to 60 µm in diameter. Analysis of relevant timescales indicates that NaCl particles with dry diameters between 4 and 25 µm would be suitable for this application. These results demonstrate that in-cloud hygroscopic seeding can successfully generate large droplets that could accelerate warm rain processes, which supports reconsideration of in-cloud injection as a viable precipitation enhancement strategy alongside traditional cloud-base release, particularly for warm clouds in arid and semi-arid environments.
- Article
(5363 KB) - Full-text XML
- BibTeX
- EndNote


The modern era of precipitation enhancement began with Schaefer (1946), Vonnegut (1947), and Langmuir (1948)'s investigations of the effect of artificial sublimation nuclei. Glaciogenic cloud seeding relies on the scarcity of naturally occurring ice nucleating particles, and on the difference in vapor pressure over liquid water and ice at the same temperature. A few artificial nuclei introduced into a cloud can trigger ice formation, leading to a cascade of events that result in precipitation from a cloud that would not have rained or snowed in the absence of the intervention. For a more complete overview of cloud seeding, see Wehbe et al. (2023), Bruintjes et al. (2012), or Flossmann et al. (2019).
Though most precipitation over the continents in the mid-latitudes involves ice (Mülmenstädt et al., 2015), rain does result from warm phase processes as well. Accelerating those processes is the basis for hygroscopic seeding, wherein relatively large condensation nuclei are introduced into a cloud to jump-start the collision-coalescence process by creating large droplets (Cooper et al., 1997). Initial hygroscopic seeding experiments were conducted using table salt, milled to a nominal size of five micrometers in diameter, though problems with caking were reported (Biswas and Dennis, 1971). (Caking is the formation of clumps caused by moisture absorption, which hinders the dispersal of fine particles.) Hygroscopic flares were developed to surmount those difficulties. They were designed to produce large particles of calcium chloride, but also released large quantities of smaller potassium chloride particles as part of the combustion process (Mather et al., 1997). In randomized tests, both methods were shown to be successful in enhancing rainfall, as judged through radar returns. Subsequent work has established that milled salt might be more effective if the problems with dispersal (caking) can be overcome (Drofa et al., 2010).
In a typical hygroscopic seeding operation, the material of interest is dispersed in an updraft below cloud base. One of the primary conceptual models of hygroscopic seeding, the competition effect, relies on large hydrophilic particles at cloud base to depress the peak supersaturation, resulting in fewer, larger droplets (Rosenfeld et al., 2010; Cooper et al., 1997). There are experiments, however, where hygroscopic material was dispersed directly into a cloud (Ghate et al., 2007; Konwar et al., 2024; Wang et al., 2019). For example, Ghate et al. (2007) used in-cloud seeding via hygroscopic flares in stratocumulus as a way to test hypotheses on aerosol-cloud interactions. They found an initial increase in small cloud droplets, presumably from the smaller potassium chloride particles typical of the Ice Crystal Engineering flares they used (Bruintjes et al., 2012). Later interception of the flare plume within the cloud showed larger droplets had been enhanced. Though cloud-base hygroscopic seeding remains the dominant paradigm in many programs due to flight safety, logistics, and regulatory considerations, modeling efforts have indicated that in-cloud seeding may be more effective than below cloud (Lin et al., 2023).
Laboratory studies of glaciogenic cloud seeding have a robust history, going back to Schaefer's original work, as noted above. Subsequent studies have primarily focused on the efficacy of silver iodide as an ice nucleating particle (see Chen et al., 2024 and references therein). There have been far fewer laboratory studies of hygroscopic seeding. Drofa et al. (2010) and Kim et al. (2025) are two notable examples. Here, we present results from laboratory studies of the effect of milled salt, an NaCl-TiO2 core-shell material (Tai et al., 2017), and mineral dust on pre-existing, steady-state clouds in the Michigan Tech Pi Chamber (Chang et al., 2016).
Experiments were conducted in the Pi Cloud Chamber, which produces mixing clouds by a temperature gradient between two plates separated by 1 m (Chang et al., 2016). In these experiments, the temperature gradient was 15 °C, with the bottom panel at 27.5 °C, the top panel at 12.5 °C, and the walls at the average temperature of 20 °C. The 20 °C average temperature is warmer than typical operational hygroscopic seeding conditions (≈ 10–15 °C), and extrapolation to field conditions are interpreted accordingly. A steady state cloud, referred to from here on as the “baseline” cloud, was first established by the injection of 130 nm dry diameter NaCl particles. Baseline NaCl aerosol was generated by creating a polydisperse distribution from solution using a TSI 3076 constant output atomizer, drying in a Nafion dryer, and finally size selecting using a differential mobility analyzer (TSI 308100). The baseline aerosols were diluted to a concentration of 105 cm−3 and injected into the chamber at a rate of 2 liters per minute (L min−1). The injection aerosol concentration and flow rate together equate to an injection of approximately 1 cm−3 s−1 when mixed into the full volume of the chamber. After the injection of baseline aerosols began, sufficient time was allowed for the chamber to reach steady-state conditions, in which cloud droplet removal by settling balances cloud droplet formation by activation (Chandrakar et al., 2016).
Cloud droplet size distributions (DSDs) for the baseline cloud, as well as DSDs for the following experiments, were measured using a Welas Digital 2000 optical particle counter and a Mesa Photonics Cloud Droplet Measuring System (CDMS), version 2. Both counters derive sizing information from the scattered light of particles passing through the sensing volume. This scattering signal is inverted to a size based on an assumption of sphericity and refractive index. Because of this, there are inherent uncertainties in the size distributions immediately after dispersing dry salt and dust into the chamber. Neither material is spherical in the dry state, and of course, neither has the refractive index of water.
The sonic virtual temperature was measured using a high-speed sonic temperature sensor (Applied Technologies, Inc.). This sensor works in the same way as a sonic anemometer and derives the sonic virtual temperature from the speed of sound in air. The bulk temperature was measured using a 100 Ω ± 0.12 %, thin film platinum resistance thermometer. Both the sonic virtual temperature and bulk temperature measurements were co-located and sampled at a rate of 1 Hz.
With the baseline cloud established, a test aerosol could then be injected into the chamber. Test aerosols included a recently developed seeding powder composed of NaCl with a TiO2 shell (core-shell nanomaterial, CSNT) and jet-milled NaCl, both provided by the United Arab Emirate’s Rain Enhancement Program. The jet milled salt was intended to match the size distribution of the CSNT powder and serve as a reference for its performance as a cloud seeding agent. Ultrafine Arizona test dust (Powder Technology Inc.) was also used as a non-hygroscopic reference.
Because the milled salt is hygroscopic and prone to caking as it absorbs trace amounts of moisture, each sample was baked in a tube furnace for a minimum of 8 h at 400 °C and periodically shaken in a test tube shaker to break up the largest clumps. Dry size distributions of the powders, dispersed into the chamber using the method described below, indicate that this process was successful in returning a portion of the NaCl to its original state. However, the distributions also show that a portion of the NaCl powder was present as large particles which quickly settled out of the chamber. No caking was observed in the CSNT powder, despite its being packed and shipped in the same manner as the milled NaCl, and it was deemed that baking would be unnecessary. Therefore, the CSNT injection cases discussed here were conducted with unbaked CSNT powder. The testing masses for milled NaCl and CSNT powder were chosen based on preliminary testing in dry conditions with the goal of injecting the same concentration of particles in each case. Due to caking, it was necessary to inject 1 g of NaCl powder to match the injected concentration from 0.2 g of CSNT. Further details of the powders' appearance and the dry size distributions are given in Appendix A.
To preserve the core/shell structure of the CSNT and to minimize sintering and caking in the milled salt, the powders were kept dry up to the moment they were injected into the chamber. This was achieved by loading a measured quantity of powder into a latex balloon for each test. The latex balloons were then connected to a compressed air line and lowered into the chamber, and popped by a burst of compressed air, dispersing the powder into the chamber. Tests were conducted with empty balloons (i.e. no powder) to confirm that the entrainment of dry air from the air used to burst the balloon had minimal impact on the existing cloud. No change in the DSD or droplet concentration as measured by the Welas was observed after the bursting of empty balloons. Tests with Arizona test dust were also conducted using the burst balloon method.
3.1 Milled NaCl
The results of injecting 1 g of NaCl powder into a steady-state cloud in the chamber are shown in the top panel of Fig. 1. Large droplets up to 60 µm diameter are measured immediately after injection; these droplets rapidly sediment out of the chamber. At the same time, the baseline cloud droplet concentration nearly vanishes, as is seen with the clear notch in droplet DSDs. 5 min after injection, the large-droplet tail in the distribution has disappeared due to gravitational settling, and a mode has developed at around 4–5 µm. 10 min after injection, the cloud DSD has nearly regained the same shape as the baseline cloud, only with a higher droplet concentration. The higher droplet concentration recorded after the test is a result of continuous injection of the 130 nm NaCl aerosol upon which the baseline cloud forms. During the dissipation of the cloud after the milled salt injection, this reservoir of aerosol builds up, leading to the increased concentration as the cloud returns to baseline.
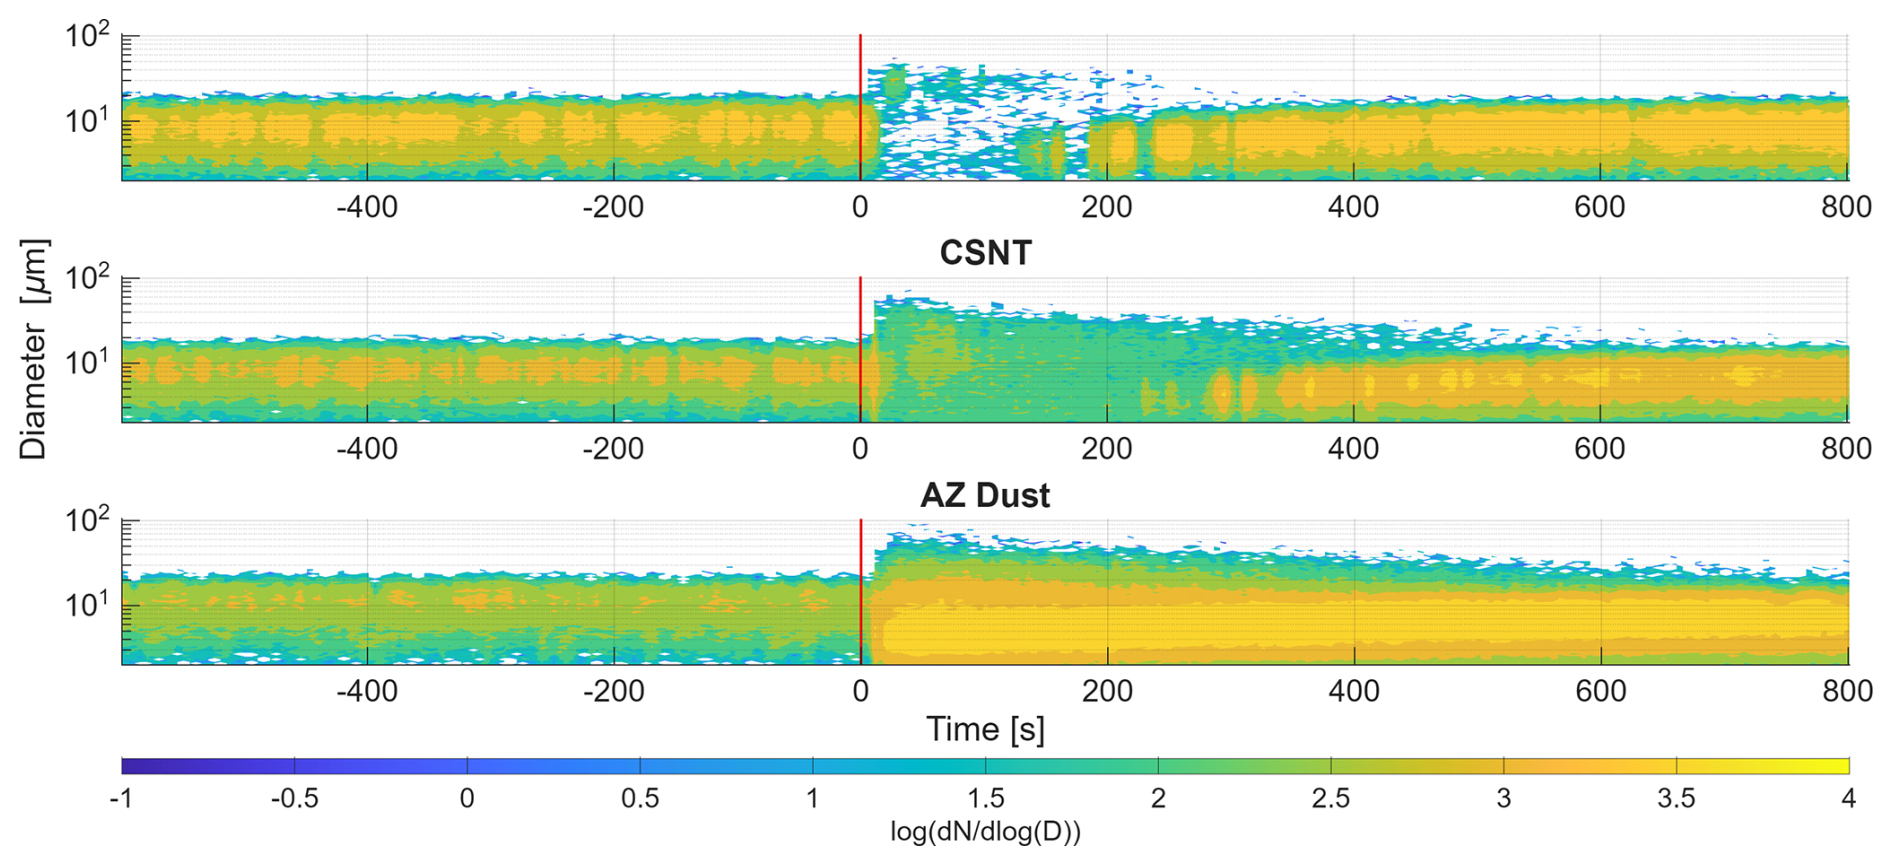
Figure 1Results of injection of 1 g of milled NaCl (top panel), 0.2 g of the CSNT material (middle panel), and 1 g of Arizona test dust (bottom panel) into a pre-existing cloud in the chamber. Clouds are in steady-state for more than 10 min before the test material is injected, shown by the vertical red line. Distributions are plotted as . The total number concentration and select droplet size distributions from these tests are shown in Figs. B2 and B3. The corresponding distributions for the milled salt and the CSNT as measured by the CDMS-2 are shown in Fig. B1.
The data presented in Fig. 1 is taken using the Welas optical particle counter. As noted in Sect. 2, we also used a CDMS-2 particle counter, which was placed inside the chamber. (The Welas samples through a tube projecting into the chamber.) Distributions from the CDMS-2 are shown in Appendix B. Data from the two instruments are consistent. Appendix B also shows a plot of the time series of total concentration (Fig. B2) and cloud droplet size distributions from times before, during and after powder injection for the three types of tests (Fig. B3).
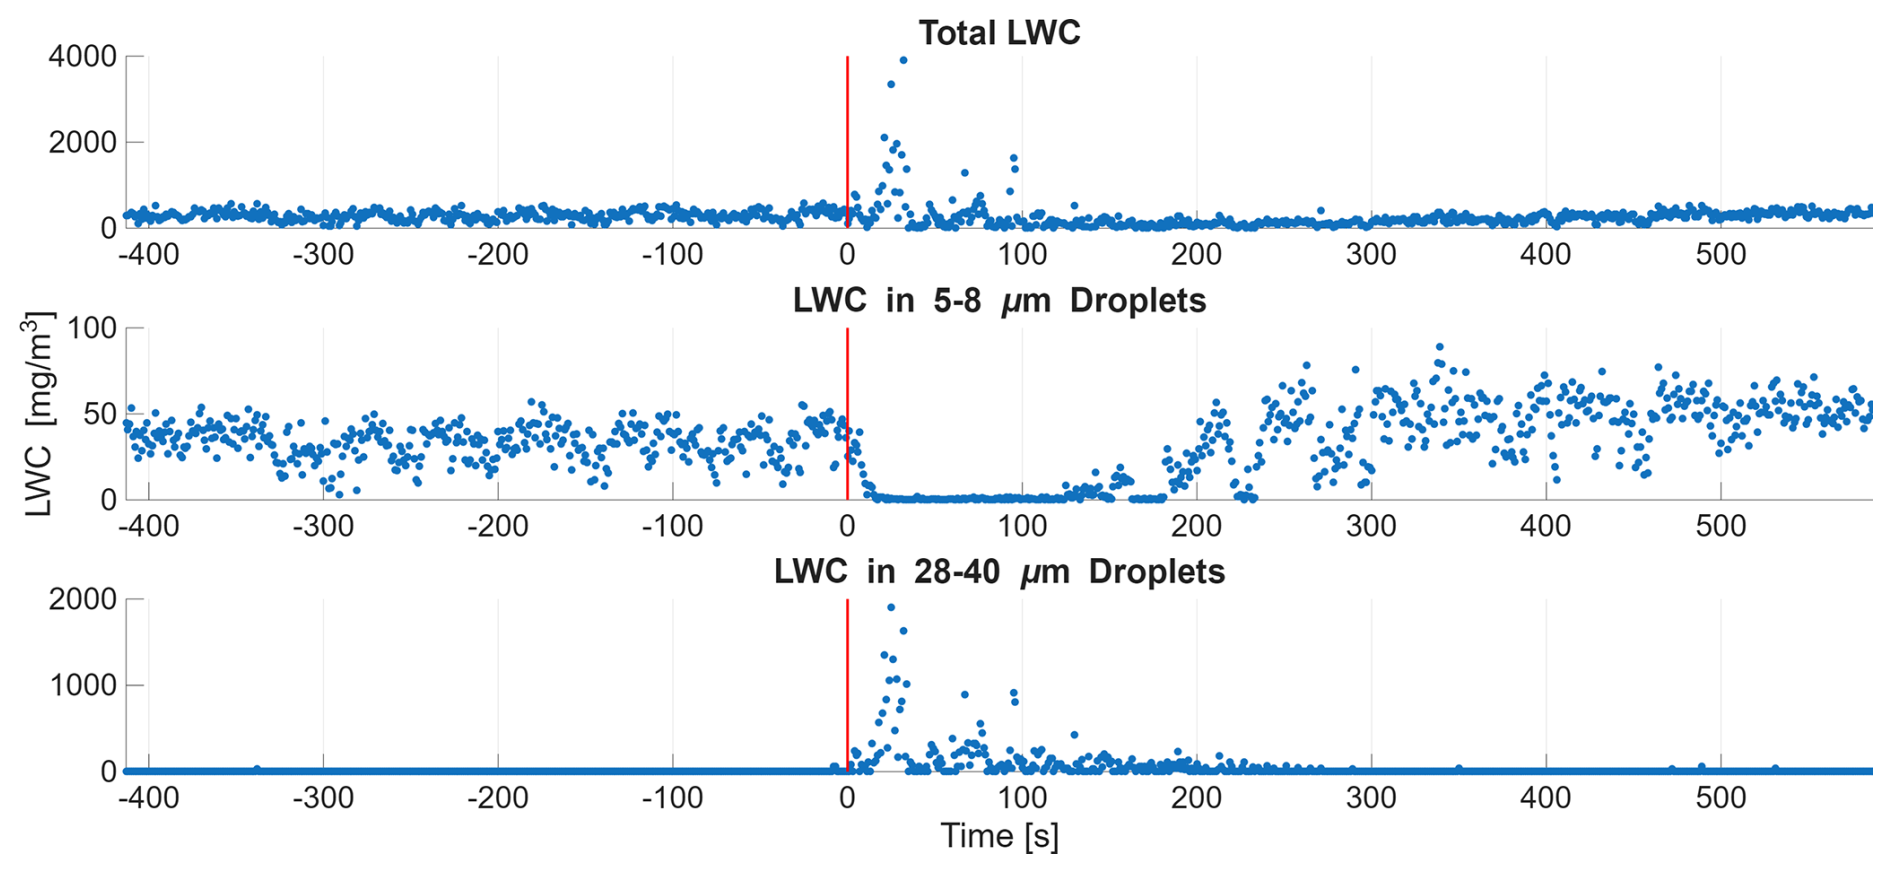
Figure 2Time series of liquid water content with injection of 1 g milled NaCl (vertical red line). After a brief spike, the total LWC (top panel) drops to well below baseline values before recovering in the next several minutes. In the first minute after injection, LWC from the baseline cloud mode (5–8 µm, middle panel) drops to near zero before recovering to above baseline values over the following few minutes. LWC from large droplets (28–40 µm, bottom panel) spikes, after which it diminishes to zero as the larger droplets settle out of the chamber.
Total liquid water content (LWC), shown in the top panel of Fig. 2, is calculated from the volumes of droplets measured by the Welas, integrated over each distribution. Upon injection of the milled salt, LWC spikes before dropping to near zero. Closer inspection of the LWC contributed by droplets in the 5–8 µm size range in Fig. 2 (middle panel) reveals dissipation of the baseline cloud, whereas the LWC from larger droplets (bottom panel, 28–40 µm in Fig. 2), shows a dramatic increase before slowly declining over several minutes.
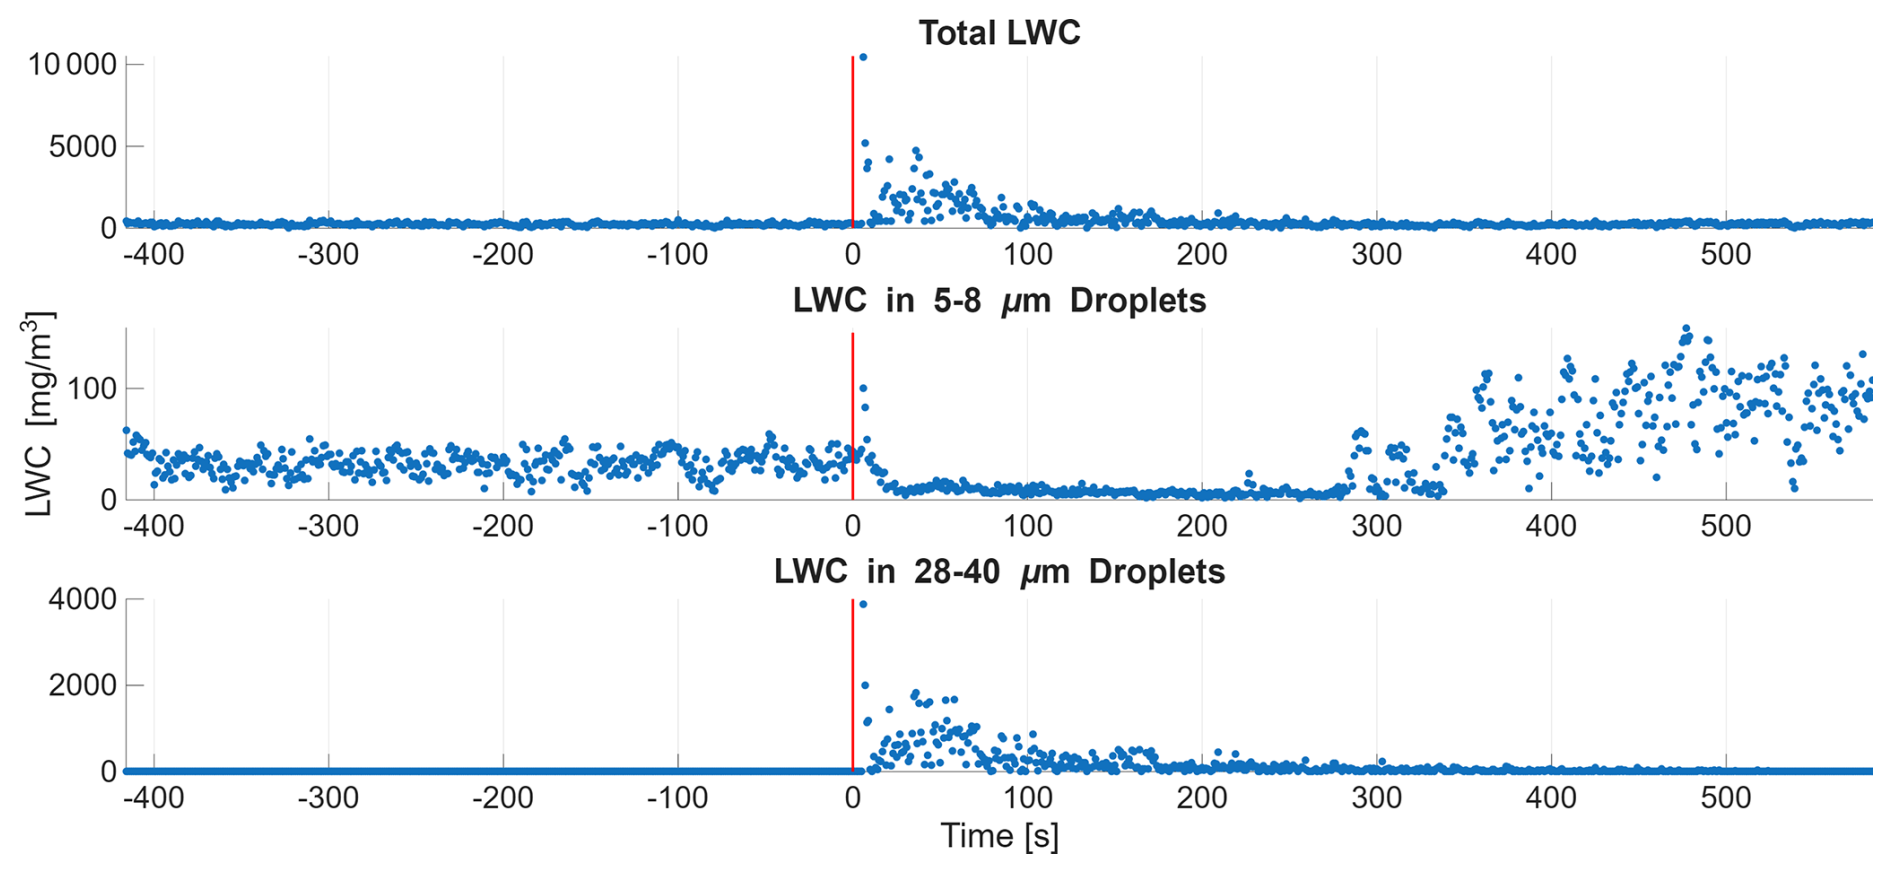
Figure 3Time series of LWC with injection of 0.2 g CSNT. Injection is shown by the vertical red line as in previous figures. After a brief spike, the total LWC drops to well below baseline values before recovering in the next several minutes. LWC from the baseline cloud mode (5–8 µm, middle panel) drops to near zero before recovering to above baseline values over the following few minutes. LWC from large droplets (28–40 µm, bottom panel) spikes, after which it diminishes to zero as the droplets settle out of the chamber.
Note that the distributions are sampled from a point which is relatively close to where the balloon burst releases the powders. The data shown in Figs. 2 and 3 are the 1 Hz data which exhibit significant variability as the dry powder mixes into the existing cloud. There is undoubtedly spatial heterogeneity in the LWC as well as the temporal variability shown in the figures. This is especially true as the LWC is dominated by larger, more rare, droplets in the sample, so the signal is inherently noisy. The absolute magnitude of the measured LWC also has intrinsic uncertainty in the seconds after dispersal of the powder as the scattering signal may be from dry or only partially deliquesced particles as the powder mixes into the chamber.
3.2 NaCl-TiO2 core-shell nanomaterial
Results from the injection of 0.2 g CSNT are shown in the middle panel of Fig. 1 and in Fig. 3. The middle panel of Fig. 1 is a time series of DSDs similar to the results for the milled salt, described above. As with the NaCl, a spike of large droplets can be seen immediately after the injection of seeding powder. In this case, the baseline cloud droplet mode is diminished, but does not disappear as dramatically as in the NaCl case. 1 min after the injection of CSNT, the baseline cloud droplet mode is significantly reduced, though some of the smallest droplets and large haze persist. 5 min after injection, the larger droplets have sedimented out and a mode of 4–7 µm diameter droplets has re-appeared. Finally, 10 min after injection of CSNT seeding powder, the DSD has nearly regained the same shape as the baseline cloud, albeit with a higher total droplet concentration, as in the NaCl case.
Total LWC for the CSNT case is shown in the top panel of Fig. 3. An increase is apparent immediately after injection of the powder, before decaying to baseline values after a few minutes. Figure 3 also shows the LWC in the 5–8 µm size range (middle panel), which exhibits a drop followed by a recovery to above baseline levels, similar to the response seen in the NaCl case. Finally LWC in the 28–40 µm droplet size range (bottom panel of the figure) shows an initial, significant increase followed by a steady decay back toward zero.
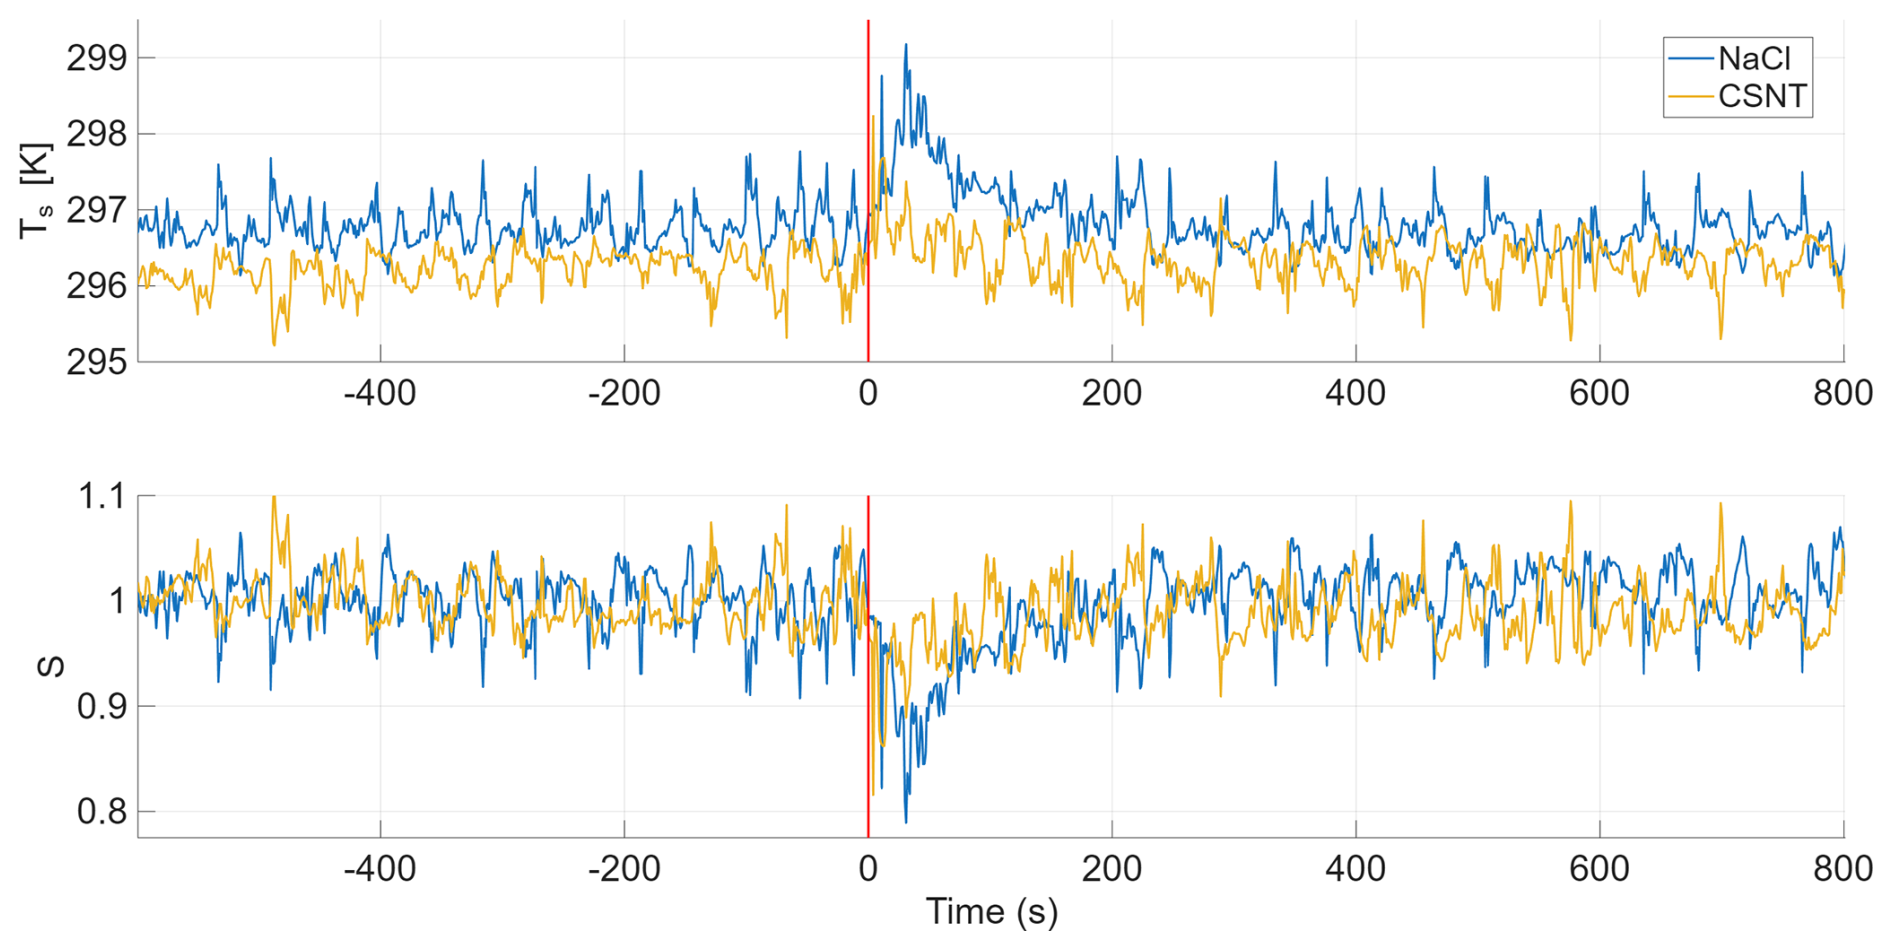
Figure 4Time series of the sonic virtual temperature (top), and the saturation ratio (bottom) for an injection of 1 g NaCl (blue) and 0.2 g of CSNT (orange). The NaCl and CSNT were introduced into the chamber at t=0, marked by the vertical red line. The periodicity apparent in the time series is a result of the large scale circulation in the chamber (Anderson et al., 2021). All three time series indicate that the injected salt absorbs water from the vapor phase.
The results in Figs. 2 and 3 imply that dispersal of the dry material into the cloud will temporarily reduce the vapor concentration in the volume, as the salt deliquesces, potentially evaporating the existing cloud. This is analogous to the well known Wegener-Bergeron-Findeisen process, which can result in the growth of ice at the expense of liquid because of the difference in the vapor pressures of the two phases at the same temperature. In this case, the difference in vapor pressure is not due to a difference in phase, but to a marked difference in salinity. Evidence for this can be seen in the sonic virtual temperature, Ts, which can be expressed as
where qv is the vapor concentration and T is the ambient temperature. When salt or CSNT is introduced into the chamber, Ts will increase due to the release of latent heat. Shortly after injections of 1 g NaCl (blue) and 0.2 g CSNT (orange), shown in the top panel of Fig. 4, Ts increases by approximately 2°. If we assume the change in Ts is due to the release of latent heat during condensation, then
where Cp is the heat capacity of air, and Lv is the latent heat of vaporization of water. Because we have co-located measurements of T and Ts, we can use Eqs. (1) and (2) to derive the water vapor concentration and saturation ratio, S, provided we assume for the 5 min before each injection. The derived time series of S during balloon bursts of both NaCl and CSNT is shown in the bottom panel of Fig. 4. In both cases, after the powders were introduced into the chamber, S decreases well below saturation before relaxing back to the steady state value. Notably, in both cases S reaches a minimum of around 0.8, approaching the deliquescence relative humidity of NaCl (Greenspan, 1977). The vapor concentration and saturation ratio relax back to their previous value, not a new equilibrium corresponding to the deliquescence saturation ratio, because the seeded droplets fall out of the volume and the flux from the boundaries replenishes the lost vapor.
3.3 Tests with a non-hygroscopic material
To verify that the dramatic effects from injecting the salt and CSNT were due to to the hygroscopicity of the material, and not merely the size, we also injected Arizona test dust, shown in the bottom panel of Fig. 1. The time series shows that after injection of 1 g of dust, rather than causing the baseline cloud to dissipate, the baseline cloud mode is enhanced. Some larger droplets are seen in the minutes after injection as some of the larger dust particles are expected to activate in a supersaturated environment. 1 min after injection, the overall concentration has increased with no dissipation in the baseline cloud. 5 min after injection, the distribution has shifted slightly to larger sizes, due to activation of some dust particles, and 10 min after injection, the distribution maintains the same shape with reduced concentration as the dust begins to sediment out.
The bottom panel of Fig. 1 does indicate that the LWC of the cloud increases after injection of dust. (LWC is not shown as a separate figure for these tests.) The larger particles detected (diameters greater than 30 µm) are a combination of the dry dust dispersed into the volume and droplets which activated on the dust. Unlike tests with the salt and CSNT, tests with the dust also show that the mode of smaller cloud droplets (diameters of 5 to 8 µm) is enhanced as droplets activate on the smaller dust particles in the volume. Here, the increase in LWC is a consequence of the increased concentration resulting from two factors: condensation on the additional seeding particles, and a shift of the droplet mode to smaller sizes, thereby decreasing the average removal rate of cloud droplets.
The primary goal of hygroscopic cloud seeding for precipitation enhancement is to broaden the droplet size distribution, preferably in the large droplet tail, thus promoting collision-coalescence. The results above indicate that injection of a sufficient amount of hygroscopic seeding powder into a pre-existing cloud does result in creation of large droplets, but those droplets are not solely the redistribution of existing liquid water onto fewer, larger droplets. The powder stimulates an initial increase in the liquid water content by absorbing water from the vapor phase as it deliquesces and grows. The large droplets that are created fall out of the volume quickly. This leads to the following questions.
-
How much powder should be dispersed to produce this effect?
-
What size should the powder be?
Our discussion here is focused toward an understanding of the processes in our experimental system, but the results should be applicable to seeding clouds in the atmosphere with a hygroscopic powder as well. We start with the relevant time scales for the problem. The first time scale to consider is the time required for mixing the dry air containing the powder with the cloudy air into which it is dispersed. As noted in Sect. 2, we dispersed the powder using a balloon burst, which mixed the powder and cloudy air quickly. Visually, the balloon inflated with approximately five liters of dry air before bursting. Unless the individual grains of the powder are excessively large, they will typically persist in the volume in which they are dispersed long enough to mix with the cloudy, humid air and deliquesce. The deliquescence time scale is less than a millisecond (Bahadur and Russell, 2008), and is not considered further here.
For seeding to be effective, the hydrated salt must be larger than the droplets in the existing cloud, which ensures that they will fall relative to the existing cloud and act as collectors in collision-coalescence. However, the salt must persist in the volume long enough to take up the available water.
Expressed in terms of time scales, this is
Here, τphase is the phase relaxation time for the dispersed powder, which is a characteristic time for the vapor field to relax to a new equilibrium when the dry powder is dispersed into it. τfall,powder is the characteristic residence time of the hydrated salt in the volume, and can be expressed as where H is a characteristic dimension of the volume and vt is the terminal fall speed. τfall,cloud is the characteristic residence time of the existing cloud droplets in the volume.
The characteristic residence time for the powder in the volume is given by
where η is the viscosity of air, ρl is the density of the liquid, and g is the acceleration due to gravity. We assume that the hydrated salt is still in the regime where the Stokes fall speed is applicable. The factor G in the denominator is the hygroscopic growth factor, which describes the increase in size upon taking up water (Swietlicki et al., 2008). Ds is the dry diameter of the salt, so that GDs is the diameter of the resulting solution droplet. Note that G is a function of the saturation ratio; G for NaCl at deliquescence is 2.28 (Zieger et al., 2017).
The residence time for the cloud droplets in the volume is given by an expression identical to Eq. (4) with (GDs)2 replaced by , the diameter of the cloud droplets in the volume. Imposing the requirement that the hydrated powder have a shorter residence time than the cloud leads immediately to the unsurprising conclusion that the hydrated powder should be larger than the mean size of the cloud droplets in the volume. This leads to the desired differential fall speed and a higher likelihood of collision-coalescence. If NaCl is dispersed into a cloud with a mean droplet diameter of 10 µm, the salt grains should have diameters greater than 4 µm.
The lower size limit is set by the requirement that the hydrated powder fall relative to the cloud droplets. The upper size limit can be derived by requiring that the dispersed powder persist in the dispersal volume long enough to take up the available water vapor.
Equating the time scale for the powder in the volume and the powder's phase relaxation time is
where D′ is a diffusion coefficient which incorporates the effects of the transport of heat and vapor and Ns is the number concentration of the dispersed powder.
This equation can be solved for GDs.
However, Ns can be eliminated from Eq. (6) by imposing the further requirement that enough powder be dispersed to reduce the saturation ratio in the volume to the powder's deliquescence point. The mass of vapor then converted to liquid is
where RHdel is the deliquescence relative humidity and qs,T is the saturation vapor density of the cloud. The corresponding liquid water is
The difference in the density of water and the saturated solution is neglected in Eq. (8). We have also neglected the contribution of the mass of the dry powder, and have assumed that the saturation vapor density is much greater than the liquid water content of the cloud, which is typically true.
Combining Eqs. (6), (7), and (8) leads to an expression for the critical hydrated diameter
Particles larger than this value will not persist in the dispersal volume long enough to come into equilibrium with the vapor field. Using the saturation vapor density for 20 °C (the temperature of the chamber in the tests shown above), and the deliquescence of NaCl, GDs≈80 µm. For atmospheric dispersal, temperatures are more likely to be in the range of 10 to 0 °C where the critical diameters of the hydrated powder are reduced to approximately 70 and 60 µm respectively. These results show that, for example, milled NaCl with a dry diameter of 25 µm will be an effective hygroscopic seeding agent for dry powder dispersal.
Experiments in the Pi Chamber demonstrate that direct, in-situ seeding of both milled NaCl and NaCl-TiO2 powders can effectively stimulate growth of a large droplet tail and an increase in the local liquid water content in warm clouds. The observed vapor depletion effect aligns with simulations and fog dispersal experiments by Khain et al. (2023), who demonstrated that large salt solution droplets can locally modify the vapor field. Our work extends these findings by showing that dry powder dispersal produces similar effects, complementing earlier investigations by Houghton and Radford (1938). However, care must be taken to prevent sintering of the salt grains in the bulk material, as such caking can significantly reduce effectiveness of the powder dispersal.
While these chamber experiments capture the microphysical response under controlled conditions, they do not fully represent atmospheric cloud dynamics at the spatial and temporal scales of realistic precipitation development. Future work should combine controlled laboratory studies with parcel and large-eddy simulations to map these observed microphysical responses onto realistic cloud lifecycles, quantify the required seeding rates and injection heights, and assess the domain of applicability across different cloud regimes. Because of the limitations of the optical particle counters used in this study, our reported liquid water contents are uncertain, especially in the moments directly after injection of the powders. For future investigations, adapting a hot-wire probe for use in the chamber is a promising avenue for verifying LWC without the ambiguity introduced from optical methods, since the hot-wire would not respond to a dry powder. Overall, our findings suggest that hygroscopic seeding with dry powders warrants reconsideration as an operational precipitation enhancement strategy. The demonstrated mechanism of vapor depletion through rapid deliquescence offers a pathway to accelerate droplet growth beyond classical condensational growth timescales, potentially triggering earlier onset of warm rain processes. This has implications for both operational weather modification programs and fundamental understanding of how aerosol perturbations can alter warm cloud microphysics and precipitation efficiency.
As noted in Sects. 1 and 2, hygroscopic powders, by their nature, are prone to absorbing moisture from the environment, causing the individual grains to sinter together. These larger grains simply fall out of the atmosphere too quickly to achieve the desired ends of sparking a runaway collision-coalescence process in the cloud. In the Pi Chamber, such caked or clumped material would fall out in less than a second.
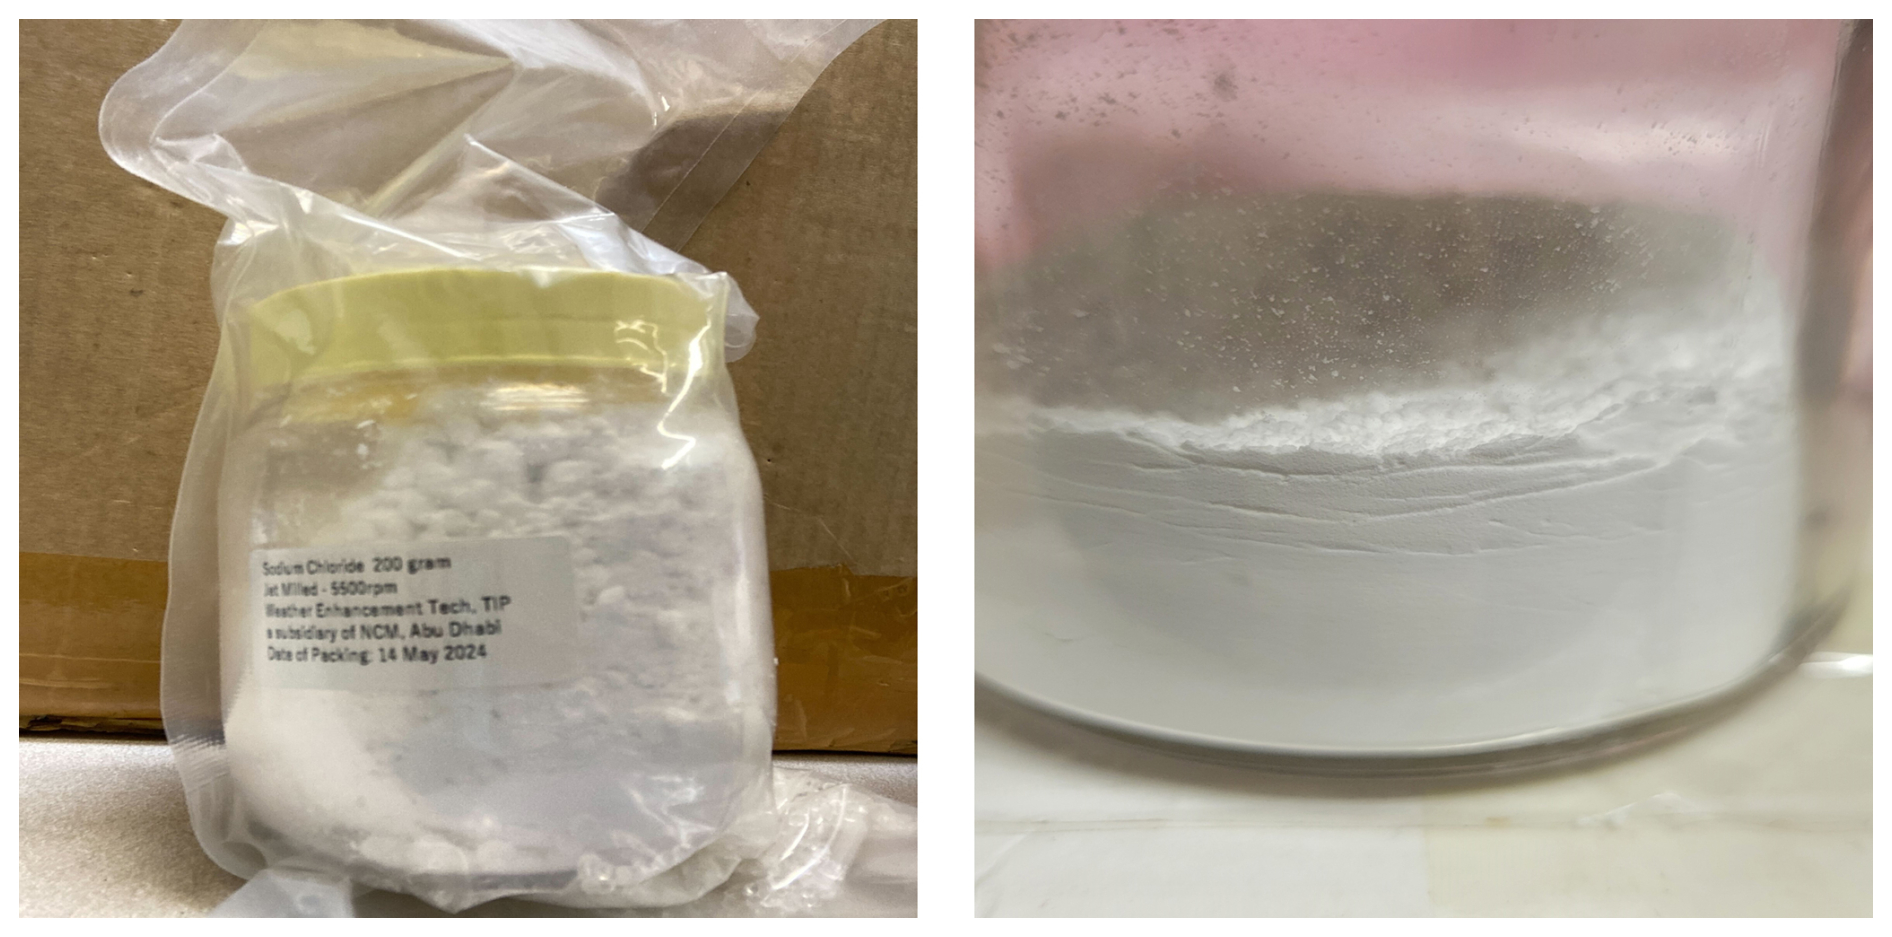
Figure A1Pictures of samples of the jet-milled salt (left panel) and CSNT (right panel) provided by the UAE Rain Enhancement Program.
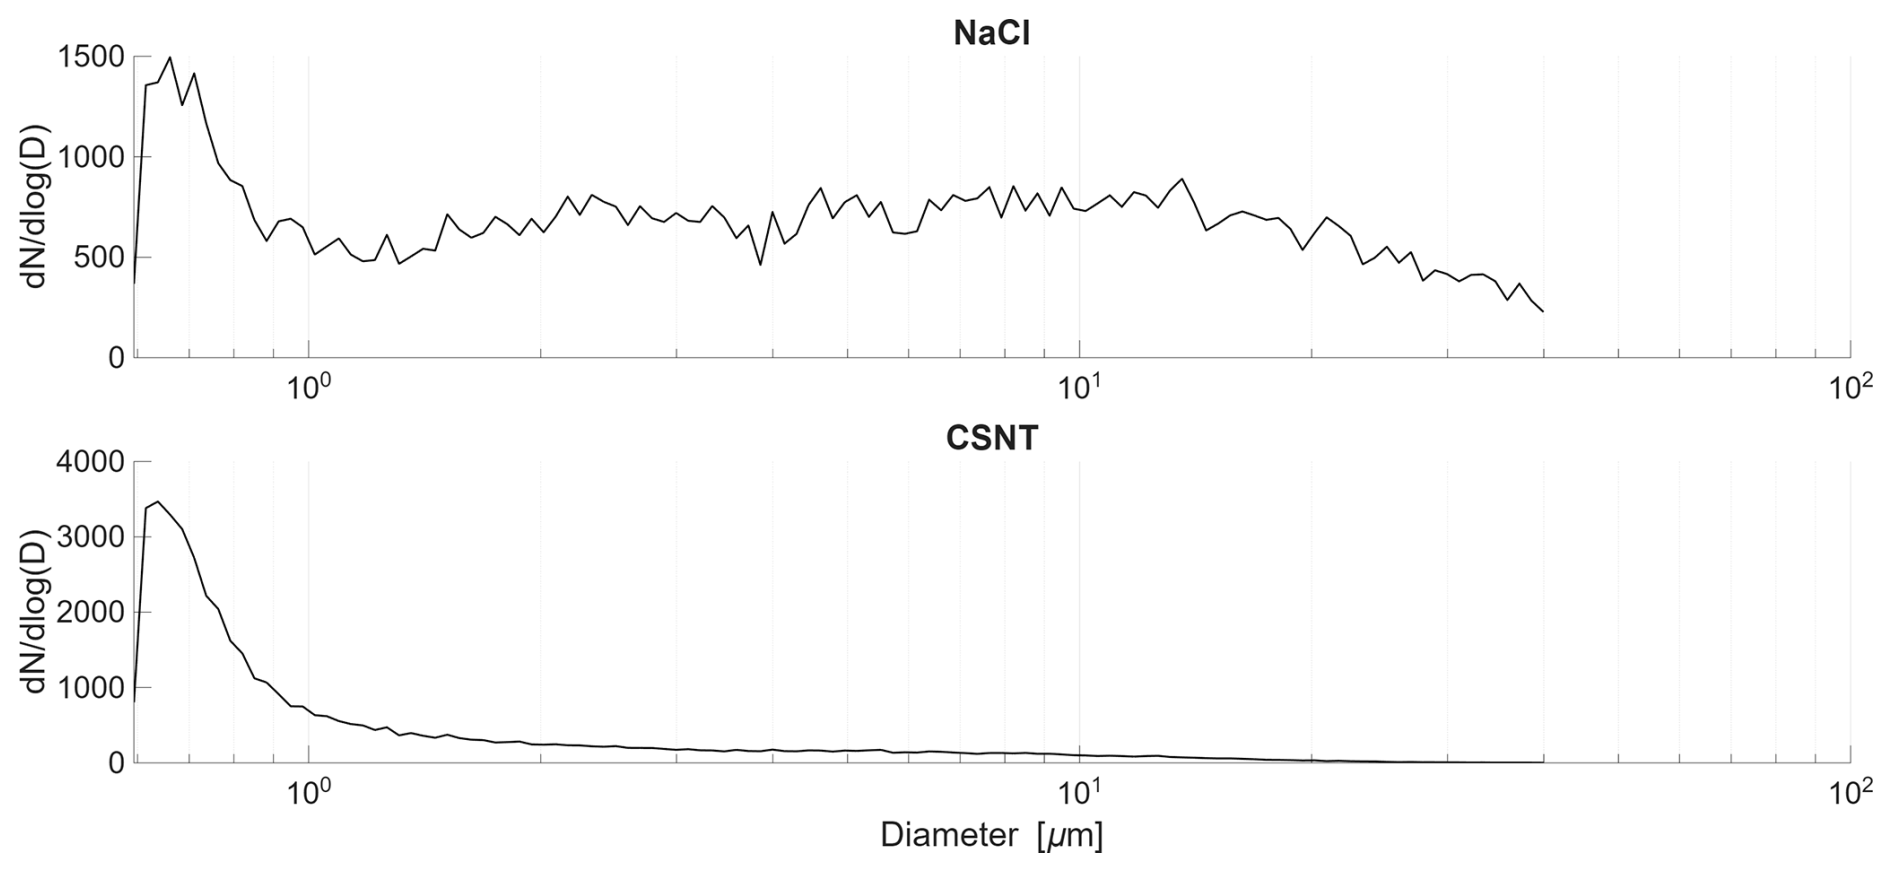
Figure A2Dry size distributions of NaCl and CSNT powder taken after injection by balloon burst into a dry Pi Chamber. Note the vertical scales are different in the two panels. The sharp drop in concentration at the smallest diameters reflects the limits of measurement for the Welas.
Upon receipt of the material from the UAE Rain Enhancement Program, visual observation was enough to verify that the milled salt had, indeed, caked. Figure A1 shows the milled salt (left) and CSNT (right) before further treatment to break up the clumps of salt visible in the sample of the salt. To address the issue in the salt, we baked it at 400 °C for at least 8 h, agitating the container periodically to break up the largest clumps. This procedure did improve dispersal. Nonetheless, we still saw that some large clumps of salt immediately fell out when we dispersed it in the chamber. We did not observe the clumping and caking issue with the CSNT.
The dry size distributions of the NaCl and the CSNT material are shown in Fig. A2. The powders were dispersed in a dry chamber, with a temperature difference between the plates to ensure convective mixing of the volume. Dispersal was accomplished using a balloon burst. Sub-micrometer particles dominate both distributions by number, but there are significant numbers of particles in the 5 to 30 µm diameter range as well.
Droplet size distributions from the CDMS-2 are shown in Fig. B1. As noted in the text, the CDMS-2 was in the chamber during the tests. The data from the CDMS-2 and the Welas optical particle counter are broadly consistent.
Figure B2 is a plot of the time series of total concentration for the experiments discussed in the Results.
Figure B3 is a plot of select droplet size distributions from Fig. 1.
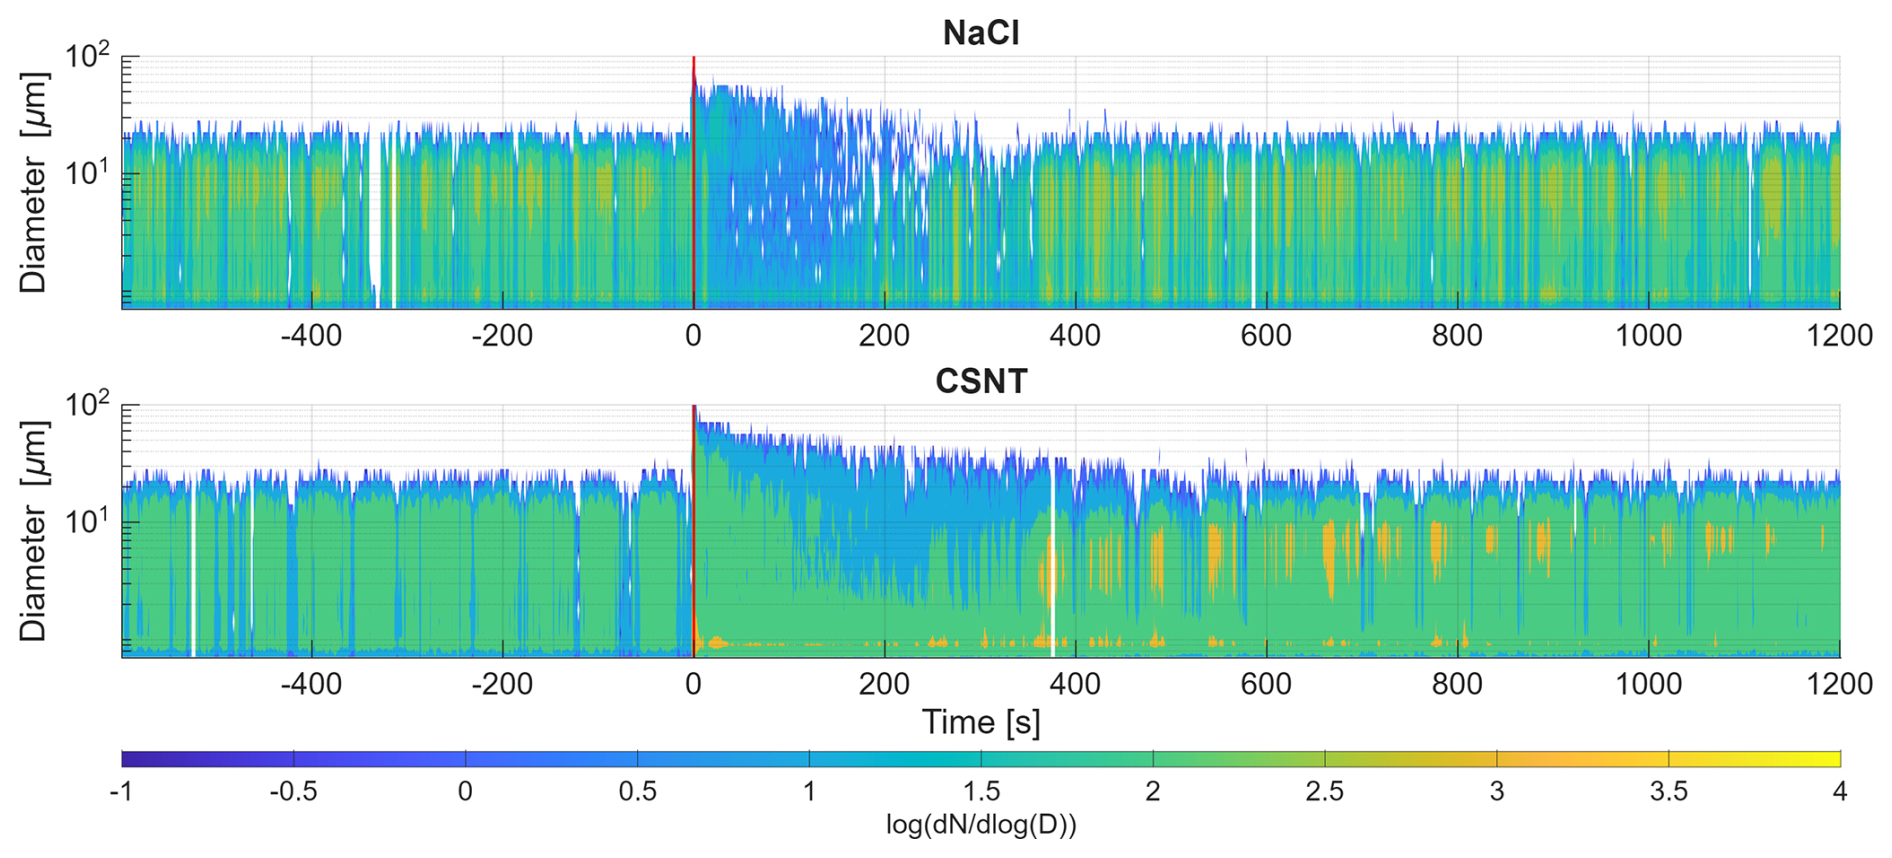
Figure B1Time series of droplet size distributions measured by the CDMS-2 for the NaCl and CSNT injection cases. Plotted distributions are .
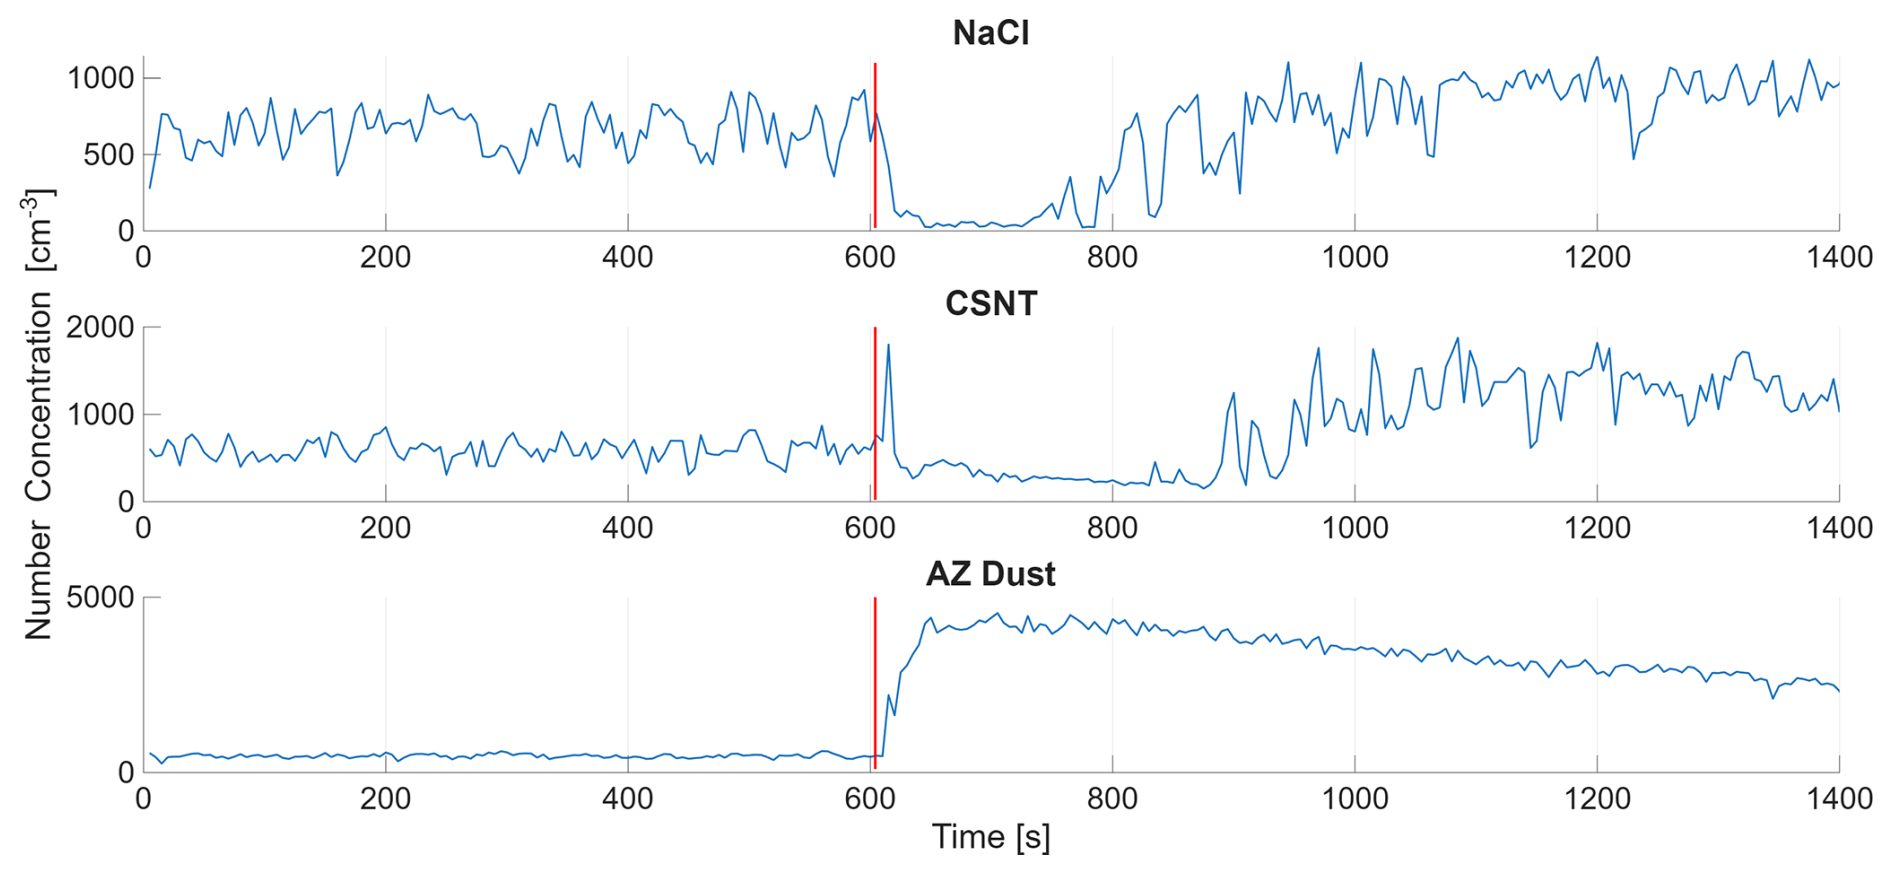
Figure B2Time series of total cloud droplet number concentrations for the NaCl, CSNT, and AZ dust injection cases, calculated by integrating the DSDs in Fig. 1.
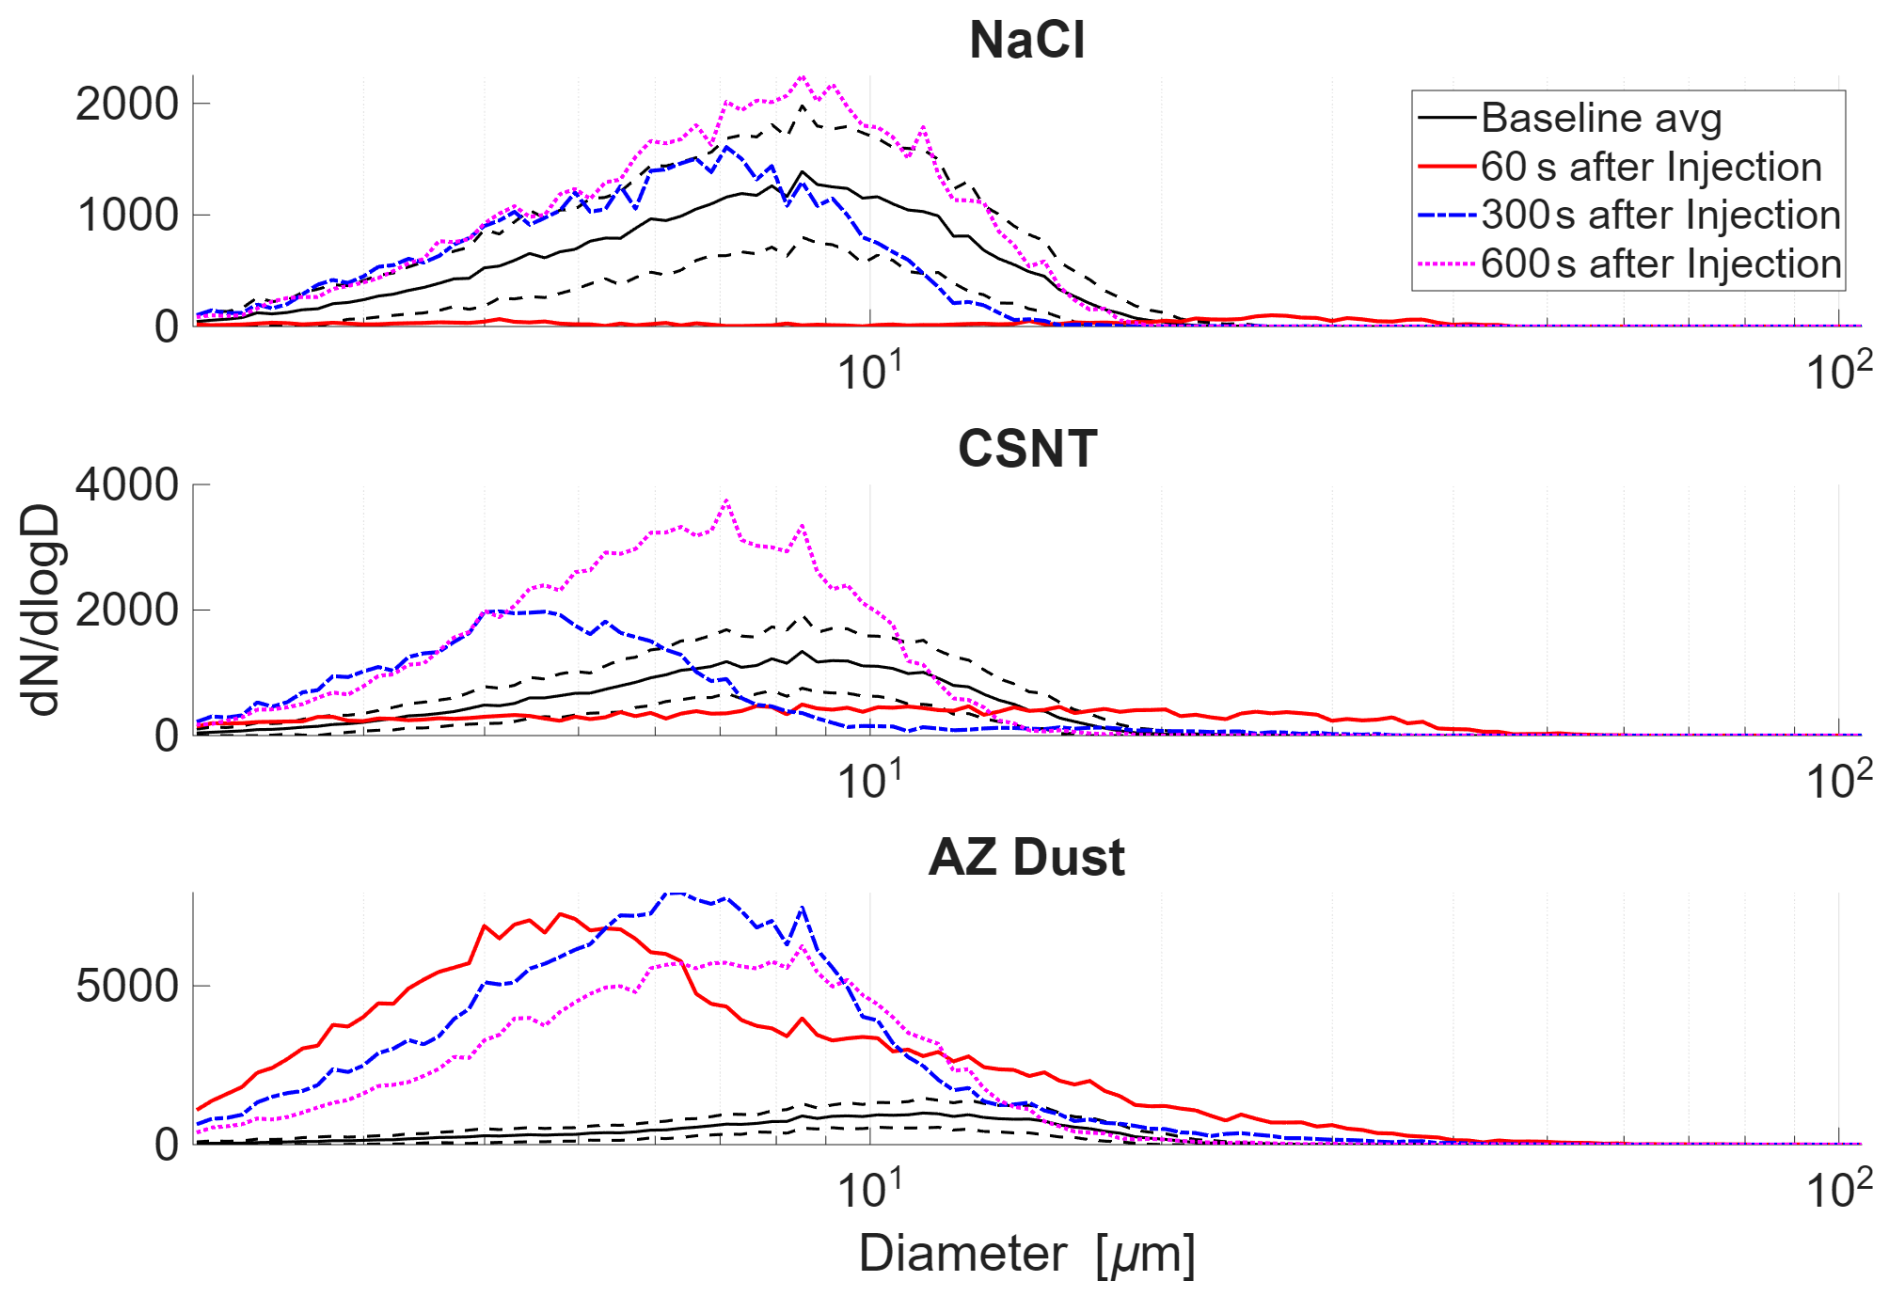
Figure B3Selected DSDs for the NaCl, CSNT, and Arizona test dust cases taken from Fig. 1. DSDs are calculated as a 30 s average at 1 min (Red), 5 min (Blue), and 10 min (Pink) after each injection. The baseline DSD (Black) is averaged over the first 5 min of each measurement before injection and includes ±1 standard deviation in each bin (dashed black).
The data needed used in the analysis here is available through https://digitalcommons.mtu.edu/all-datasets/67/ (Simmons, 2026).
J.S., R.A.S., and W.C. conceived the experiments. J.S., J.A., H.F.S., K.F.G., S.S., A.V., and K.H. carried out the experiments. J.S., J.A., H.F.S., and A.V. analyzed the data. All authors discussed and interpreted the results. J.S., J.A., A.V., R.A.S., and W.C. wrote the paper. All authors discussed and edited the manuscript.
The contact author has declared that none of the authors has any competing interests.
Publisher's note: Copernicus Publications remains neutral with regard to jurisdictional claims made in the text, published maps, institutional affiliations, or any other geographical representation in this paper. The authors bear the ultimate responsibility for providing appropriate place names. Views expressed in the text are those of the authors and do not necessarily reflect the views of the publisher.
Comments and suggestions from the UAEREP advisory board as well as from two anonymous reviewers are appreciated.
This material is based on work supported by the National Center of Meteorology, Abu Dhabi, UAE under the UAE Research Program for Rain Enhancement Science (UAEREP). J.S. was supported in the summer of 2025 through a fellowship from the Michigan Space Grant Consortium.
This paper was edited by Sara Lance and reviewed by two anonymous referees.
Anderson, J. C., Thomas, S., Prabhakaran, P., Shaw, R. A., and Cantrell, W.: Effects of the large-scale circulation on temperature and water vapor distributions in the Π Chamber, Atmos. Meas. Tech., 14, 5473–5485, https://doi.org/10.5194/amt-14-5473-2021, 2021. a
Bahadur, R. and Russell, L. M.: Water uptake coefficients and deliquescence of NaCl nanoparticles at atmospheric relative humidities from molecular dynamics simulations, J. Chem. Phys., 129, https://doi.org/10.1063/1.2971040, 2008. a
Biswas, K. R. and Dennis, A. S.: Formation of a Rain Shower by Salt Seeding, J. Appl. Meteorol., 10, 780–784, https://doi.org/10.1175/1520-0450(1971)010<0780:FOARSB>2.0.CO;2, 1971. a
Bruintjes, R. T., Salazar, V., Semeniuk, T. A., Buseck, P., Breed, D. W., and Gunkelman, J.: Evaluation of Hygroscopic Cloud Seeding Flares, Journal of Weather Modification, 44, https://journalofweathermodification.scholasticahq.com/article/133112.pdf (last access: 3 August 2026), 2012. a, b
Chandrakar, K., Cantrell, W., Chang, K., Ciochetto, D., Niedermeier, D., Ovchinnikov, M., Shaw, R. A., and Yang, F.: Aerosol indirect effect from turbulence-induced broadening of cloud-droplet size distributions, P. Natl. Acad. Sci. USA, 113, 14243–14248, 2016. a
Chang, K., Bench, J., Brege, M., Cantrell, W., Chandrakar, K., Ciochetto, D., Mazzoleni, C., Mazzoleni, L. R., Niedermeier, D., and Shaw, R. A.: A laboratory facility to study gas-aerosol-cloud interactions in a turbulent environment: The Π Chamber, B. Am. Meteorol. Soc., 97, 2343–2358, 2016. a, b
Chen, J., Rösch, C., Rösch, M., Shilin, A., and Kanji, Z. A.: Critical size of silver iodide containing glaciogenic cloud seeding particles, Geophys. Res. Lett., 51, e2023GL106680, https://doi.org/10.1029/2023GL106680, 2024. a
Cooper, W. A., Bruintjes, R. T., and Mather, G. K.: Calculations Pertaining to Hygroscopic Seeding with Flares, J. Appl. Meteor., 36, 1449–1469, https://doi.org/10.1175/1520-0450(1997)036<1449:CPTHSW>2.0.CO;2, 1997. a, b
Drofa, A. S., Ivanov, V. N., Rosenfeld, D., and Shilin, A. G.: Studying an effect of salt powder seeding used for precipitation enhancement from convective clouds, Atmos. Chem. Phys., 10, 8011–8023, https://doi.org/10.5194/acp-10-8011-2010, 2010. a, b
Flossmann, A. I., Manton, M., Abshaev, A., Bruintjes, R., Murakami, M., Prabhakaran, T., and Yao, Z.: Review of advances in precipitation enhancement research, B. Am. Meteorol. Soc., 100, 1465–1480, 2019. a
Ghate, V. P., Albrecht, B. A., Kollias, P., Jonsson, H. H., and Breed, D. W.: Cloud seeding as a technique for studying aerosol-cloud interactions in marine stratocumulus, Geophys. Res. Lett., 34, L14807, https://doi.org/10.1029/2007GL029748, 2007. a, b
Greenspan, L.: Humidity fixed points of binary saturated aqueous solutions, J. Res. NBS A Phys. Ch., 81, 89, https://doi.org/10.6028/jres.081A.011, 1977. a
Houghton, H. G. and Radford, W. H.: On the local dissipation of warm fog, Papers in Physical Oceanography and Meteorology, 6, 63, 1938. a
Khain, A., Pinsky, M., Gavze, E., Ronen, A., Elisha, S., Shoshanim, O., and Khain, P.: Warm Fog Elimination by Seeding with Salty Drops: Experiments and Theory, Journal of Weather Modification, 55, 30–51, 2023. a
Kim, B.-Y., Belorid, M., Cha, J. W., Kim, Y., and Kim, S.: Analysis of hygroscopic cloud seeding materials using the Korea Cloud Physics Experimental Chamber (K-CPEC): a case study for powder-type sodium chloride and calcium chloride, Atmos. Meas. Tech., 18, 3781–3797, https://doi.org/10.5194/amt-18-3781-2025, 2025. a
Konwar, M., Werden, B., Fortner, E. C., Bera, S., Varghese, M., Chowdhuri, S., Hibert, K., Croteau, P., Jayne, J., Canagaratna, M., Malap, N., Jayakumar, S., Dixit, S. A., Murugavel, P., Axisa, D., Baumgardner, D., DeCarlo, P. F., Worsnop, D. R., and Prabhakaran, T.: Identifying the seeding signature in cloud particles from hydrometeor residuals, Atmos. Meas. Tech., 17, 2387–2400, https://doi.org/10.5194/amt-17-2387-2024, 2024. a
Langmuir, I.: The production of rain by a chain reaction in cumulus clouds at temperatures above freezing, J. Meteor., 5, 175–192, https://doi.org/10.1175/1520-0469(1948)005<0175:TPORBA>2.0.CO;2, 1948. a
Lin, K.-I., Chung, K.-S., Wang, S.-H., Chen, L.-H., Liou, Y.-C., Lin, P.-L., Chang, W.-Y., Chiu, H.-J., and Chang, Y.-H.: Evaluation of hygroscopic cloud seeding in warm-rain processes by a hybrid microphysics scheme using a Weather Research and Forecasting (WRF) model: a real case study, Atmos. Chem. Phys., 23, 10423–10438, https://doi.org/10.5194/acp-23-10423-2023, 2023. a
Mather, G. K., Terblanche, D. E., Steffens, F. E., and Fletcher, L.: Results of the South African Cloud-Seeding Experiments Using Hygroscopic Flares, J. Appl. Meteorol., 36, 1433–1447, 1997. a
Mülmenstädt, J., Sourdeval, O., Del Genio, A. D., and Neubauer, D.: Frequency of occurrence of rain from liquid‐, mixed‐, and ice‐phase clouds derived from three satellite sensors, Geophys. Res. Lett., 42, 6502–6509, https://doi.org/10.1002/2015GL064604, 2015. a
Rosenfeld, D., Axisa, D., Woodley, W. L., and Lahav, R.: A quest for effective hygroscopic cloud seeding, J. Appl. Meteorol. Clim., 49, 1548–1562, 2010. a
Schaefer, V. J.: The production of ice crystals in a cloud of supercooled water droplets, Science, 104, 457–459, 1946. a
Simmons, J.: Datasets for Response of a liquid water cloud to in situ hygroscopic seeding, Digital Commons and Michigan Technological University [data set], https://digitalcommons.mtu.edu/all-datasets/67 (last access: 9 February 2026), 2026. a
Swietlicki, E., Hansson, H.-C., Hämeri, K., Svenningsson, B., Massling, A., McFiggans, G., McMurry, P. H., Petäjä, T., Tunved, P., Gysel, M., Topping, D., Weingartner, E., Baltensperger, U., Rissler, J., Wiedensohler, A., and Kulmala, M.: Hygroscopic properties of submicrometer atmospheric aerosol particles measured with H-TDMA instruments in various environments – a review, Tellus B, 60, 432–469, 2008. a
Tai, Y., Liang, H., Zaki, A., El Hadri, N., Abshaev, A. M., Huchunaev, B. M., Griffiths, S., Jouiad, M., and Zou, L.: Core/shell microstructure induced synergistic effect for efficient water-droplet formation and cloud-seeding application, ACS Nano, 11, 12318–12325, 2017. a
Vonnegut, B.: The nucleation of ice formation by silver iodide, J. Appl. Phys., 18, 593–595, 1947. a
Wang, F., Li, Z., Jiang, Q., Wang, G., Jia, S., Duan, J., and Zhou, Y.: Evaluation of hygroscopic cloud seeding in liquid-water clouds: a feasibility study, Atmos. Chem. Phys., 19, 14967–14977, https://doi.org/10.5194/acp-19-14967-2019, 2019. a
Wehbe, Y., Griffiths, S., Al Mazrouei, A., Al Yazeedi, O., and Al Mandous, A.: Rethinking water security in a warming climate: rainfall enhancement as an innovative augmentation technique, npj Clim. Atmos. Sci., 6, 171, https://doi.org/10.1038/s41612-023-00503-2, 2023. a
Zieger, P., Kristensson, E. F., Facchini, F. G. R., Swietlicki, E., Wise, D. F., and Nilsson, E. N.: Revising the hygroscopicity of inorganic sea salt particles, Nat. Commun., 8, 15883, https://doi.org/10.1038/ncomms15883, 2017. a
- Abstract
- Introduction
- Methods
- Results
- Discussion
- Operational Implications and Conclusions
- Appendix A: Milled salt and NaCl-TiO2 core-shell material
- Appendix B: Additional data
- Data availability
- Author contributions
- Competing interests
- Disclaimer
- Acknowledgements
- Financial support
- Review statement
- References
- Abstract
- Introduction
- Methods
- Results
- Discussion
- Operational Implications and Conclusions
- Appendix A: Milled salt and NaCl-TiO2 core-shell material
- Appendix B: Additional data
- Data availability
- Author contributions
- Competing interests
- Disclaimer
- Acknowledgements
- Financial support
- Review statement
- References