
the Creative Commons Attribution 4.0 License.
the Creative Commons Attribution 4.0 License.
 | 04 Aug 2026
Summertime ice-nucleating particle concentrations over the Eurasian-Arctic Seas

André Welti
Iris Thurnherr
Ulrike Lohmann
Ice nucleating particles (INPs) catalyze primary ice formation in Arctic low-level mixed-phase clouds, influencing their persistence and radiative properties. Knowledge of the abundance, sources, and nature of INPs over the remote Arctic Ocean is scarce, particularly in the Eurasian Arctic. In this work, we present summertime measurements of INP concentrations (NINP) in immersion mode from the ship-based Arctic Century Expedition exploring the Barents, Kara, and Laptev Seas and the adjacent high Arctic islands and archipelagos during August to September 2021. Atmospheric NINP were found to be lower than in continental high-latitude sites, particularly at temperatures below −15 °C, suggesting a lower abundance of mineral dust INPs. The geographical NINP variability in the Eurasian Arctic shows that the highest NINP are observed when the ship was in the ice-free ocean, marginal ice zones (MIZ), and in the vicinity of land. Very low NINP were measured within the ice pack. The peak NINP was observed north of Novaya Zemlya where backward trajectories indicate air parcels arriving from the western Siberian coast. Overall, we find that INP sources are local to regional, with little evidence for long-range transport to the investigated area of the Eurasian Arctic in summer months.
- Article
(15164 KB) - Full-text XML
- BibTeX
- EndNote


The Arctic warming mechanism is intricately linked to the presence of ice in mixed-phase clouds (MPCs). The phase partitioning of hydrometeors in Arctic low-level MPCs affects the Arctic's radiation budget (Korolev et al., 2017; Serreze and Barry, 2011) through cloud phase feedbacks associated with glaciation. This phase transition reduces cloud albedo, enhancing shortwave absorption at the surface during summer and contributing to Arctic warming (Tan and Storelvmo, 2019). In the wintertime, glaciation may also lead to cloud thinning and an increase in outgoing longwave radiation (Intrieri et al., 2002), the dominant radiative impact during the melt season remains the decrease in cloud albedo. Primary ice formation in MPCs occurs on ice-nucleating particles (INPs), capable of catalyzing ice nucleation at temperatures above −38 °C, below which cloud droplets freeze homogeneously (Bigg, 1953; Vali et al., 2015). Cloud glaciation alters the cloud optical thickness and lifetime, thereby affecting the surface energy balance by modulating the reflection of sunlight and trapping of outgoing longwave radiation. Murray et al. (2021) highlighted that an accurate representation of INPs in climate models is essential for predicting the microphysical and radiative properties of Arctic MPCs in the future. To this end, the scarcity of observations and the uncertainties in abundance and sources of INP remain a challenge. As the Arctic continues to warm, changes in INP sources, caused by increased emissions from open water, increasing wind speed and wave height, or increased biological activity, are expected to change INP abundance and thereby cloud properties, which enhances positive feedback mechanisms and exacerbates regional warming (Murray et al., 2021).
Previous efforts to measure the abundance, variability, sources, and origins of INPs in the Arctic have shown that both terrestrial and marine aerosols can serve as INPs in this region (Hartmann et al., 2021). While terrestrial sources of mineral dust INPs are less prominent compared to the mid-latitudes, they still contribute notably through high-latitude dust emitted from, e.g., coastal Greenland (Li et al., 2023), Siberia (Porter et al., 2022), glacial outwash plains in Svalbard (Tobo et al., 2019), and Iceland's deserts (Sanchez-Marroquin et al., 2020). Creamean et al. (2018) and Irish et al. (2019) found a positive correlation between NINP measured on ships and the duration that sampled air masses spent over land, underscoring the dominance of terrestrial sources. Additionally, terrestrial sources of biogenic INPs have been associated with sediments from rivers (Tobo et al., 2019), vegetated regions (Conen et al., 2016), and thawing permafrost (Barry et al., 2023; Creamean et al., 2020). In the marine environment, deposited dust on the water surface can be re-suspended to the atmosphere during sea spray aerosol (SSA) generation (Cornwell et al., 2020). Additionally, marine biogenic aerosols (MBAs) from sea spray (DeMott et al., 2016; Wilson et al., 2015; Bigg, 1996), including marine organics (McCluskey et al., 2018; Wilson et al., 2015), bacteria, and fragments of marine organisms (Šantl Temkiv et al., 2019; Bigg and Leck, 2001), phytoplankton exudates (Ickes et al., 2020; Hartmann et al., 2020; Creamean et al., 2019), and marine diatoms (Knopf et al., 2011), have all been suggested as effective INPs, particularly at temperatures above −15 °C (Murray et al., 2012). Collectively, previous findings indicate that the INP population in the remote Arctic is a mixture of aerosols from both the local terrestrial and marine environments, with a possible contribution from long-range transport (Murray et al., 2021). Previous studies (Bigg, 1996; Creamean et al., 2018; Wex et al., 2019; Schmale et al., 2021; Creamean et al., 2022) also show that INP levels in the Arctic vary seasonally, with higher concentrations typically observed during the summer months at the same time as increased biological activity and terrestrial dust emissions.
The Arctic is particularly susceptible to climate change and has experienced accelerated warming over the past few decades (Forster et al., 2021). Notable evidence of climate change in the Arctic includes the perennial retreat of sea ice cover in all seasons (Wendisch et al., 2019). Future warming associated with receding Arctic sea ice will cause a strong positive surface-albedo feedback (Yoshimori et al., 2025; Rantanen et al., 2022). With more open water, wind-induced SSA generation is expected to increase (Browse et al., 2014). Additionally, Gabric et al. (2018) demonstrated a significant rise in MBA burden connected to the declining sea ice extent, induced by a concomitant elevation in the primary production of phytoplankton due to increased light availability (Galindo et al., 2016), warming of the ocean mixed layer (Gabric et al., 2005), and enhanced nutrient supply (Becagli et al., 2011). It is imperative for regional climate models to incorporate the dynamic changes in sea ice, MBA emissions, detailed cloud microphysics, and cloud radiative feedback to simulate the future climate in the Arctic.
In this work, we present ship-based INP measurements from the Arctic Century Expedition over the previously unexplored Barents, Kara, and Laptev Seas and the adjacent high Arctic islands and archipelagos in the Eurasian Arctic. We report on the current state of INP abundance, spatiotemporal variability, source regions, and origins to improve the understanding of atmospheric INPs over the remote Eurasian Arctic Ocean.
2.1 Campaign overview
The Arctic Century Expedition took place from 5 August to 6 September 2021. Collocated measurements of atmospheric and marine physics and chemistry were conducted on the research vessel (RV) Akademik Tryoshnikov. Figure 1a shows the route of the expedition. The Arctic Century Expedition started and ended at the harbor in Murmansk, Russia (68.98° N, 33.09° E) and explored an extensive area in the Eurasian Arctic Seas, including rarely accessible locations in the Kara and Laptev Seas, and the archipelagos of Franz-Josef Land, Novaya Zemlya, and Severnaya Zemlya.
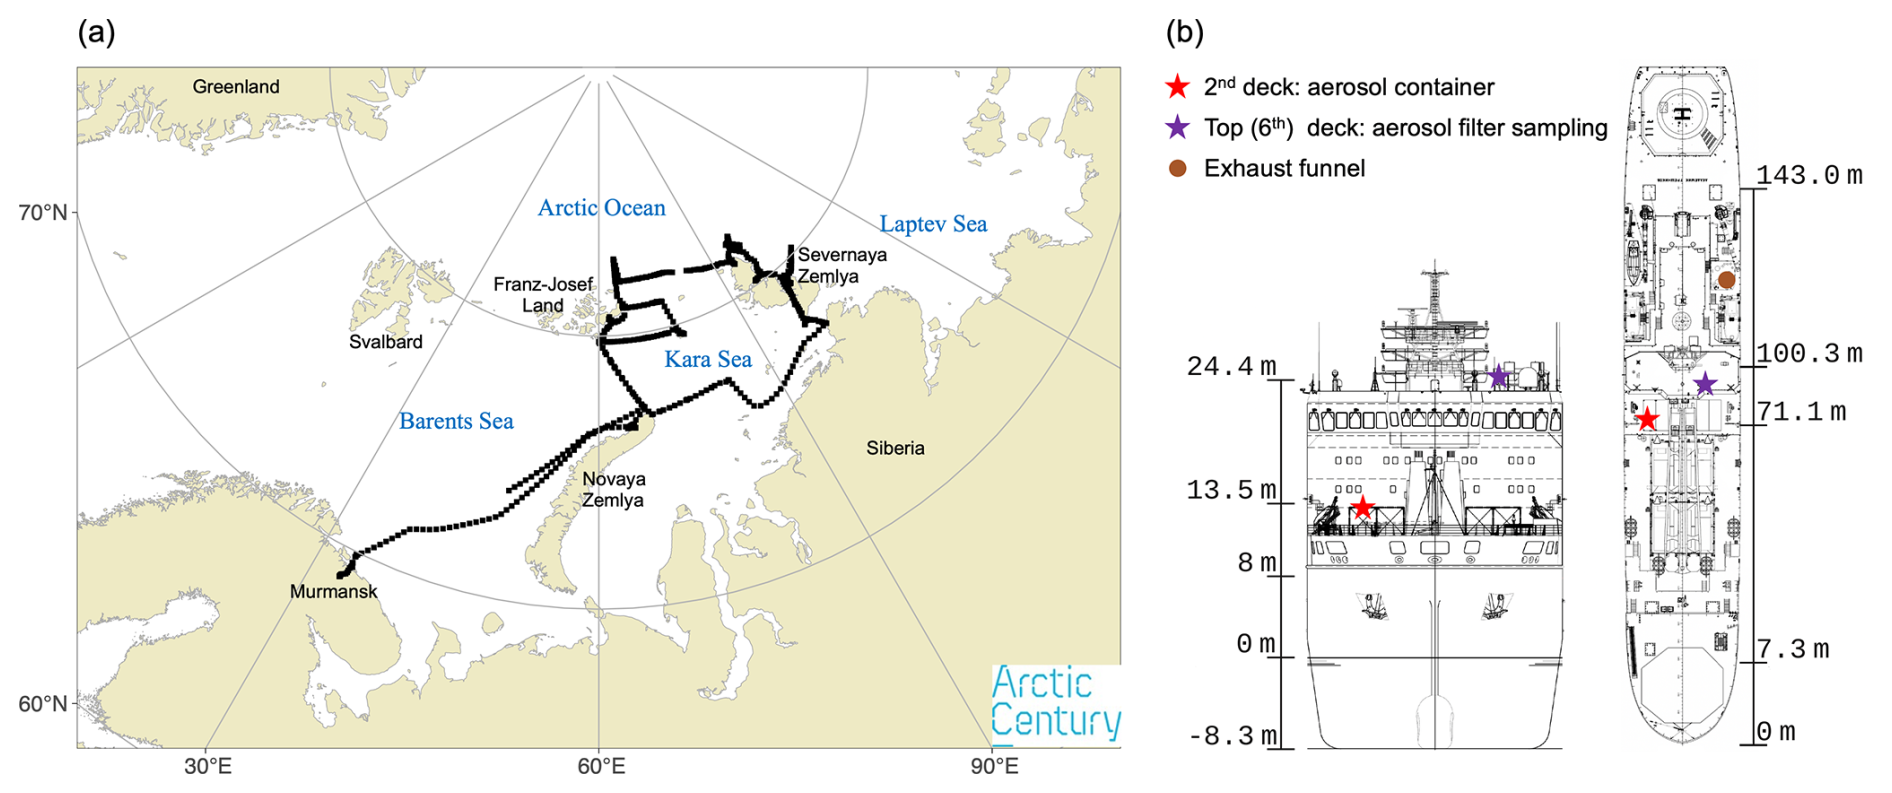
Figure 1(a) Map of Arctic Century Expedition ship track. The cruise departure and return point was the harbor of Murmansk. The black squares show the hourly ship position during the campaign. Location information is missing at the beginning of the campaign due to restrictions from the local authority. (b) The equipment location on board the RV Akademik Tryoshnikov (adapted from vessel plans by the Arctic and Antarctic Research Institute). Height is provided relative to the approximate water line in the front view (left panel), and distance from the ship's bow in the top view (right panel). Further information on the instrumentation in both sectors is given in Table 1.
A comprehensive set of atmospheric aerosol sampling and measurement (online and offline) was conducted on board. The locations of the measurement set-ups are indicated in Fig. 1b, and instrumentation at each location is given in Table 1. On the 2nd deck, monitoring and sampling of ambient aerosol were conducted from an aerosol container laboratory set-up following the configuration described in Li et al. (2025). A combination of online INP measurements and sampling for offline INP analysis was used to quantify NINP. Additionally, the aerosol concentration and number size distribution were monitored continuously. On the top deck (6th deck), filter samples were collected for INP analysis after the expedition. Details on instrumentation, sample collection, and analysis are provided below.
Table 1Summary of instrumentation set-up on the RV Akademik Tryoshnikov during the Arctic Century Expedition (for onboard location see Fig. 1). Measurement principles are provided in Sect. 2.2. The abbreviations of instruments represent Horizontal Ice Nucleation Chamber (HINC, described in Lacher et al., 2017), Scanning Mobility Particle Sizer (SMPS), Aerodynamic Particle Sizer (APS), Condensation Particle Counter (CPC), and Low-Volume Sampler (LVS).

2.2 Ambient aerosol sample collection
From the aerosol container laboratory, ambient aerosols were collected 3 times a day, for 3 h each, into 15 mL ultra-pure water (W4502-1L, Sigma-Aldrich), using the high flow-rate impinger (Coriolis® µ, Bertin Instruments, with a lower limit aerodynamic cut-off size of 0.5 µm) at a flow rate of 300 L min−1. Additional ultra-pure water (W4502-1L, Sigma-Aldrich) was constantly supplied to the sampling container during the operation of the impinger via a refilling system to compensate for evaporation loss. On the top deck, aerosol particles were collected onto 47 mm polycarbonate membrane filters (Whatman, 0.4 µm pore size) using a low volume sampler (LVS, Model DPA14, Digitel) with a 10 µm particulate matter (PM10) inlet that excludes particles that are larger than 10 µm in diameter from being collected (samples are hereafter referred to as PM10 filters). The LVS inlet was approximately 25 m above sea level (m a.s.l.). The operating flow rate was maintained at 38.3 L min−1 for 12 h sampling intervals, which was selected to be consistent with the PM10 inlet design, ensuring the aerodynamic cutoff size of 10 µm was maintained. A trade-off was made between sampling flow rate (38.3 L min−1) and duration (12 h) to maximize total sampled volume, achieve suitable temporal resolution, and match the INP detection range. The impinger and LVS were located on the 2nd and 6th decks, respectively, with a vertical separation of over 10 m. Under stratified atmospheric conditions, especially near the ocean surface, the vertical variability of aerosol properties between different sampling heights cannot be entirely ruled out. However, given that both are in the boundary layer, we do not expect large differences in aerosol number and composition between the two sampling locations, except those introduced by the sampling method (impinger samples particles >0.5 µm aerodynamic diameter). In addition, to minimize contamination from ship exhaust, specific procedures were followed for the two sampling locations. On the 6th deck, the PM10 filter sampling (LVS) was automatically paused whenever wind direction sensors indicated air flow from the ship's funnel. For impinger and HINC measurements on the 2nd deck, spikes in total particle number concentration measured by a CPC were used to identify exhaust plumes; these periods were flagged and removed from the dataset. These measures substantially reduce the influence of exhaust emissions on the reported INP data, although minor residual contamination cannot be fully excluded.
The impinger samples and PM10 filters were stored at −20 °C on board, for transport, and after the campaign at the ETH laboratory until analysis. During the campaign, a total of 75 impinger and 50 PM10 filter samples were collected.
2.3 INP analyses
2.3.1 Impinger and filter samples
Impinger samples were brought out of a freezer into the refrigerator at 4 °C overnight before analysis. Membrane filter samples were immersed in 15 mL ultra-pure water (W4502-1L, Sigma-Aldrich) and agitated using a sonicator for 30 min to re-suspend the particles from filters into the water. The impinger and filter suspensions were subsequently used for immersion-mode INP analysis with DRoplet Ice Nuclei Counter Zurich (DRINCZ, David et al., 2019).
2.3.2 DRINCZ
Each liquid sample was pipetted into a Polymerase Chain Reaction (PCR) tray with 96 aliquots of 50 µL and cooled in an ethanol bath at 1 °C min−1. Freezing events were detected optically from the change in transparency of an aliquot upon freezing. NINP were derived at each integer temperature following Vali (1971):
where NINP(T) is the INP concentration at temperature T, Nfrz(T) is the number of frozen aliquots at temperature T, Ntot is the total number of aliquots (Ntot=96), Valiquot is the aliquot volume (Valiquot=50 µL),Vwater is the total water volume of the Coriolis sample or the volume of water used to suspend PM10 filters. Vflow is the sampled air volume. Field blank samples, undergoing the same procedures as actual samples, were collected every three days during the campaign. The NINP were corrected for the background of field blank samples by subtracting the differential INP spectrum of field blanks from samples (Vali, 2019). Based on the limit of detection (LOD) of DRINCZ and the purity of the ultra-pure water, the highest temperature for NINP detection was approximately −5 °C (above which sampled air volumes are too small to detect lower concentrations), and the lowest temperature at which NINP can be reliably reported was −25 °C (below which ultra-pure water starts to freeze). The overall uncertainty of the reported freezing temperatures is ±0.9 °C (David et al., 2019).
2.3.3 Horizontal ice nucleation chamber (HINC)
To extend observations of the INP spectrum to low temperatures, measurements were conducted with HINC (Lacher et al., 2017). HINC was operated alternately at °C and °C (±0.4 °C), at a relative humidity with respect to water of RHw=104 % (±1.5 %), representative for immersion-mode ice nucleation conditions. The two experimental temperatures were alternated after half a day when the moisture source inside HINC was depleted, and the measurement had to be restarted. Details on the field configuration of HINC can be found in Li et al. (2022), and operational details of detecting and distinguishing ice crystals from droplets are given in Lacher et al. (2017). To account for background ice crystal counts from frost particles detaching from the inner chamber surface, a period of filtered air measurement (5 min) before and after each sampling interval (15 min) was included in the measurement sequence. The background count of ice crystals and the limit of detection are determined based on Poisson statistics. The LOD is given by the mean +1σ of the background counts. NINP was calculated by subtracting the mean background counts from the ice counts during the sampling interval (see Lacher et al., 2017 for details). During the Arctic Century Expedition, 285 NINP out of 589 measurement intervals were above the LOD of the instrument. In other words, the 285 NINP data points have a significance level of 68.3 % (1σ), which we considered reliable based on the limitations of the instrument at the measurement conditions.
2.4 Supporting measurements and analyses
2.4.1 Particle size distribution
From the aerosol container laboratory on the second deck, the size distribution of submicron particles was measured using a scanning mobility particle sizer (SMPS, Model 3938, comprising a 3088 soft X-ray neutralizer, a 3082 classifier, a 3081 long differential mobility analyzer, and a 3787 CPC, TSI Inc.). The sampling flow rate of the SMPS was 0.6 L min−1 with a sheath-to-sample ratio of 10:1, leading to an observable size range from approximately 12 to 600 nm in electrical mobility diameter. A multiple charge correction was applied to account for the misclassification of larger particles carrying multiple charges. Parallel to the SMPS, the size distribution of coarse-mode particles (ranging from approximately 0.5 to 20 µm in aerodynamic diameter) was measured by an aerodynamic particle sizer (APS, model 3321, TSI Inc.) at a flow rate of 1 L min−1. The SMPS and APS were operated at the same temporal resolution of 4 min to align the obtained size distributions. The electrical mobility diameters obtained from the SMPS and aerodynamic diameters from the APS were converted to volume-equivalent diameters assuming an average particle density of 2 g cm−3 (Tunved et al., 2013). The surface area of particles was calculated assuming a spherical shape at all sizes. An additional CPC (Model 3787, TSI Inc.) was used to monitor the total aerosol particle number concentration continuously.
2.4.2 Chemical composition analysis
Inductively coupled plasma-optical emission spectrometry (ICP-OES, Model 5100, Agilent Technologies) was used to detect 11 selected elements (Al, Ca, Cl, Fe, K, Mg, Mn, Na, P, S, Si) in the 75 aerosol suspension samples collected by the impinger. Impinger samples were selected for chemical analysis due to their larger sampled air volume (54 m3 over 3 h), which improved detection limits in ICP-OES measurements under low aerosol mass conditions. The shorter sampling duration also provided higher temporal resolution, allowing clearer attribution of changes in chemical composition to specific air mass transitions. The impinger samples were diluted by a factor of 10 with 2 % HNO3 solution prior to the chemical analysis. Quality control was established by the measurement of blank samples and standard reference materials of each element processed in parallel (see details of experimental protocols in Gilli et al., 2018). The detection limit is element-dependent, particularly for trace elements or those with lower emission line sensitivity in ICP-OES. The resulting elemental compositions for Cl, Fe, Mn, and K were below the LOD and thus are not discussed. The elements analyzed in this work include P, S, and joint classes of AlSiCa and NaMg, representing dust and sea salt components, respectively, according to the standards introduced in Hiranuma et al. (2013). The instrument uncertainty ranges from 5 %–10 % of the reported concentrations.
2.4.3 Meteorological and sea ice conditions
An automated weather station (model AWS420, Vaisala) was operated on the top deck, delivering measurements of ambient pressure at 20 m a.s.l., air temperature and relative humidity at 23.7 m a.s.l., and relative and absolute wind speed and direction at 30 m a.s.l. The recorded measurements were processed automatically by the Vaisala software. In addition, relative wind speed and direction were measured from the wind sensor (Model WXT532, Vaisala) mounted on the LVS at approximately 26 m a.s.l.
For comparison to in situ observations at the position of the RV Akademik Tryoshnikov, the sea ice concentrations were determined from the daily observations of the U.S. National Ice Center. Additionally, sea ice coverage from hourly ERA5 data (5th generation of ECMWF atmospheric reanalysis of the global climate covering the period from January 1950 to the present, Hersbach et al., 2020) with a 30 km horizontal resolution was used to characterize the sea ice conditions. The sea ice coverage was classified following Aksenov et al. (2017) and Strong and Rigor (2013), where regions with <15 % are defined as the (ice-free) ocean, sea ice coverage between 15 % and 80 % as the marginal ice zone (MIZ, the transitional zone between open sea and dense ice pack), and >80 % sea ice as the ice-pack.
2.4.4 Backward trajectory analysis
Air parcel backward trajectories were computed to identify the origin of the air masses reaching the ship's location using the Lagrangian analysis tool LAGRANTO (Sprenger and Wernli, 2015; Wernli and Davies, 1997). Two-day and seven-day backward trajectories were calculated using the three-dimensional wind fields from the hourly ERA5 data with a horizontal resolution of 0.5°. The trajectories were launched every hour, starting from the ship's position along the ship track, with pressure closest to the sea level (1000 hPa) to reflect near-surface transport. To assess the vertical transport history, the pressure level of the air parcels and the local planetary boundary layer height were extracted along each trajectory (see Figs. E1 and E2 in Appendix E). Trajectories were removed when they were above the modeled height of the boundary layer or experienced precipitation (surface precipitation below air parcel position > 0.1 mm h−1), which would introduce washout effects on boundary layer aerosols due to wet scavenging. The trajectories were categorized according to the over-passed surface types (sea ice coverage or land).
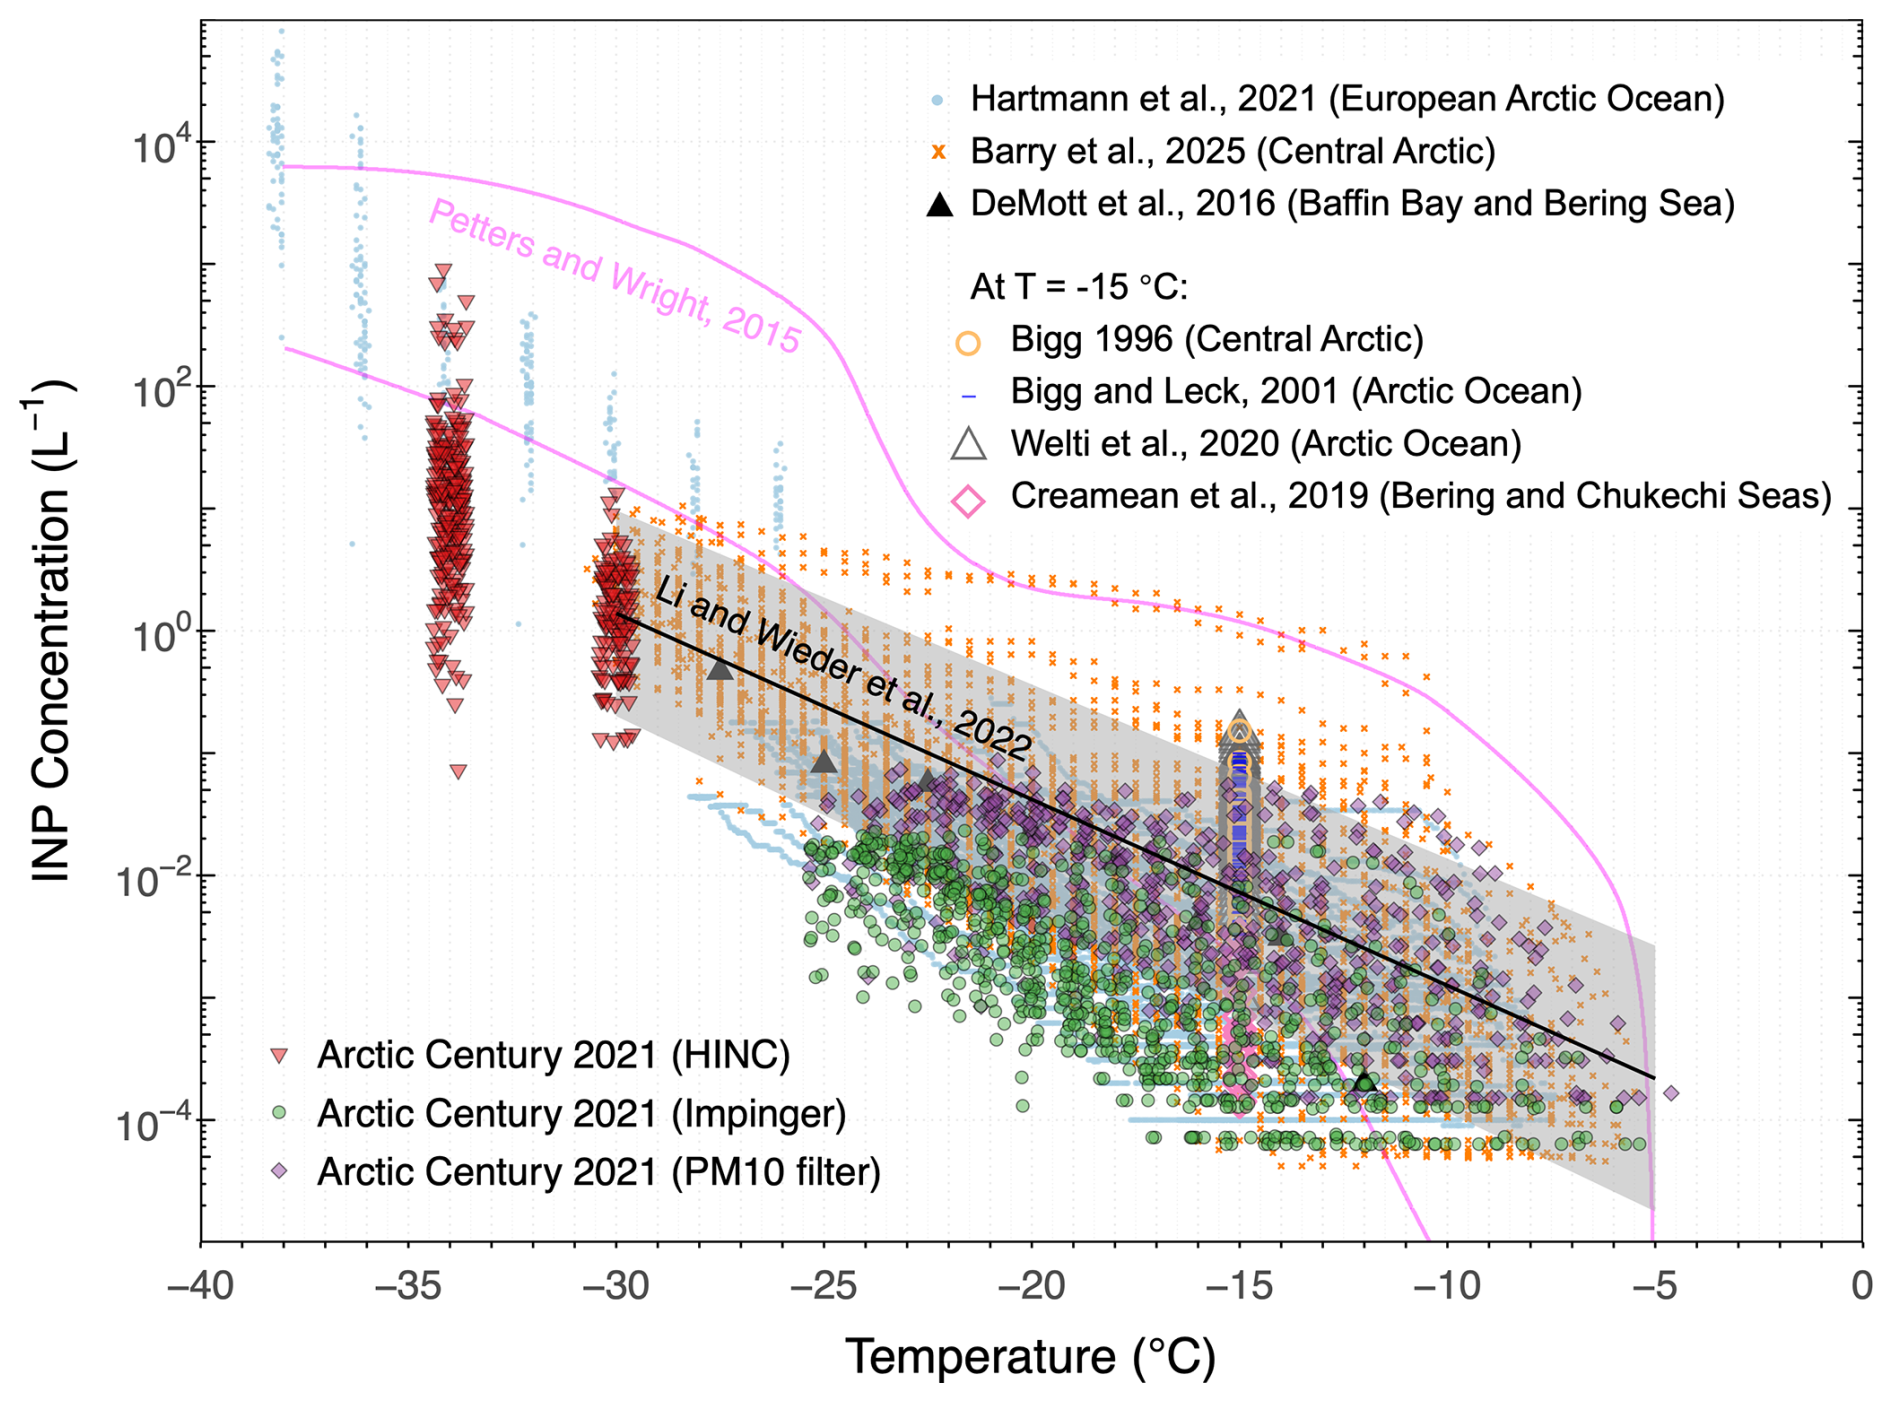
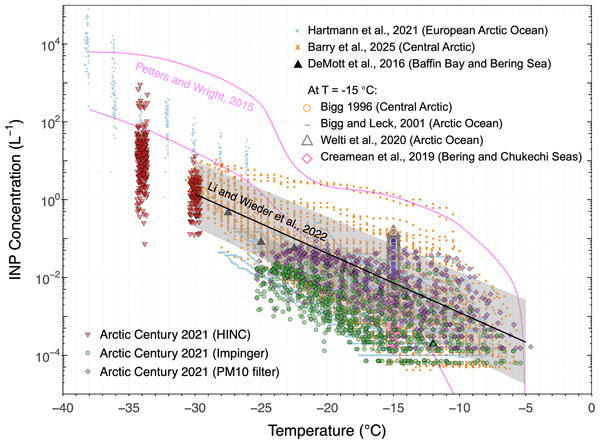
Figure 2Temperature spectrum of NINP measured with HINC, Coriolis impinger and PM10 filters (shown as filled triangles, circles and diamonds, respectively). Previously observed NINP in the high Arctic Ocean reported in Bigg (1996), Bigg and Leck (2001), DeMott et al. (2016), Creamean et al. (2019), Welti et al. (2020), Hartmann et al. (2021), Barry et al. (2025) are shown for comparison. The area between the two lines in light magenta spans the range of NINP observed from precipitation samples collected in mid-latitudes (Petters and Wright, 2015). The black solid line and gray shaded area represent the INP parameterization derived from measurements in Svalbard (Li et al., 2022).
3.1 Temperature-dependent variability of Arctic INP concentrations
The cumulative NINP as a function of freezing temperature from both online and offline measurements using HINC ( and −30 °C), impinger samples, and PM10 filters ( °C) is shown in Fig. 2. Across the assessed freezing temperatures, NINP spans 1 to 3 orders of magnitude, overlapping the parameterization derived from measurements in Svalbard (Li et al., 2022) except for impinger samples. The discussion on the difference in NINP measured across HINC, impinger samples, and PM10 filters was detailed in Appendix A. Figure 2 shows a comparison of our observed NINP from the Arctic Century Expedition to the range of NINP derived from midlatitude precipitation samples (Petters and Wright, 2015, the range between the light magenta lines). Overall, NINP observed during the Arctic Century Expedition is up to 2 orders of magnitude lower compared to the NINP at mid-latitudes, especially at °C. The significantly lower NINP at °C, where mineral dust becomes a dominant source of INPs (Hoose and Möhler, 2012), indicates that the concentration of mineral dust INPs is lower over the Eurasian-Arctic Ocean compared to mid-latitudes. Smaller differences in NINP were found at °C, in particular for °C, where NINP from the Arctic Century Expedition aligned with the range reported by Petters and Wright (2015). For T<−10 °C, the variability in the impinger INP data and the decrease to the lower bound of the Petters and Wright (2015) line could display a more pronounced trend than currently presented, as our measurements are limited by the lower LOD of the analytical method. For a comparison within different Arctic regions, Fig. 2 also includes ship-based INP observations in the summer over the Arctic Ocean from previous work (Hartmann et al., 2021; Barry et al., 2025; DeMott et al., 2016; Bigg and Leck, 2001; Welti et al., 2020; Creamean et al., 2019). Our offline NINP are similar to NINP reported by Hartmann et al. (2021). However, the NINP measured with HINC at and −30 °C were systematically lower than the low-temperature observations during this summer measurement campaign circumnavigating Svalbard from Hartmann et al. (2021). A difference in the concentration of mineral dust INP could be the reason. Hartmann et al. (2021) reported an abundance of mineral dust from Greenland and adjacent Svalbard, following ice and snow melt (see Tobo et al., 2019 for information on Arctic dust sources). In addition, our summertime NINP spectra over the Eurasian-Arctic Seas are largely consistent with recent year-long observations from the Central Arctic (Barry et al., 2025; represented by orange crosses in Fig. 2). Barry et al. (2025) reports that biological INPs dominate the Arctic spectrum year-round, with a significant seasonal peak in early summer (June–July) reaching concentrations up to 1.4 L−1 at −15 °C. While our late-summer observations (August–September) generally fall within the range of these Central Arctic measurements, they do not capture the extreme peaks observed earlier in the melt season. This discrepancy likely reflects the temporal shift in marine productivity and terrestrial runoff, which peaks prior to our late-summer campaign. Nevertheless, the overall consistency in NINP magnitudes and temperature-dependent trends across these two geographically distinct sectors suggests that the Eurasian Arctic Seas share a similar INP regime with the Central Arctic Ocean, characterized by regional emissions from the marginal ice zone and snow-free land surfaces. Other Arctic NINP measurements above −30 °C by Bigg (1996), Bigg and Leck (2001), DeMott et al. (2016), Creamean et al. (2019), Welti et al. (2020) corroborate our observations.
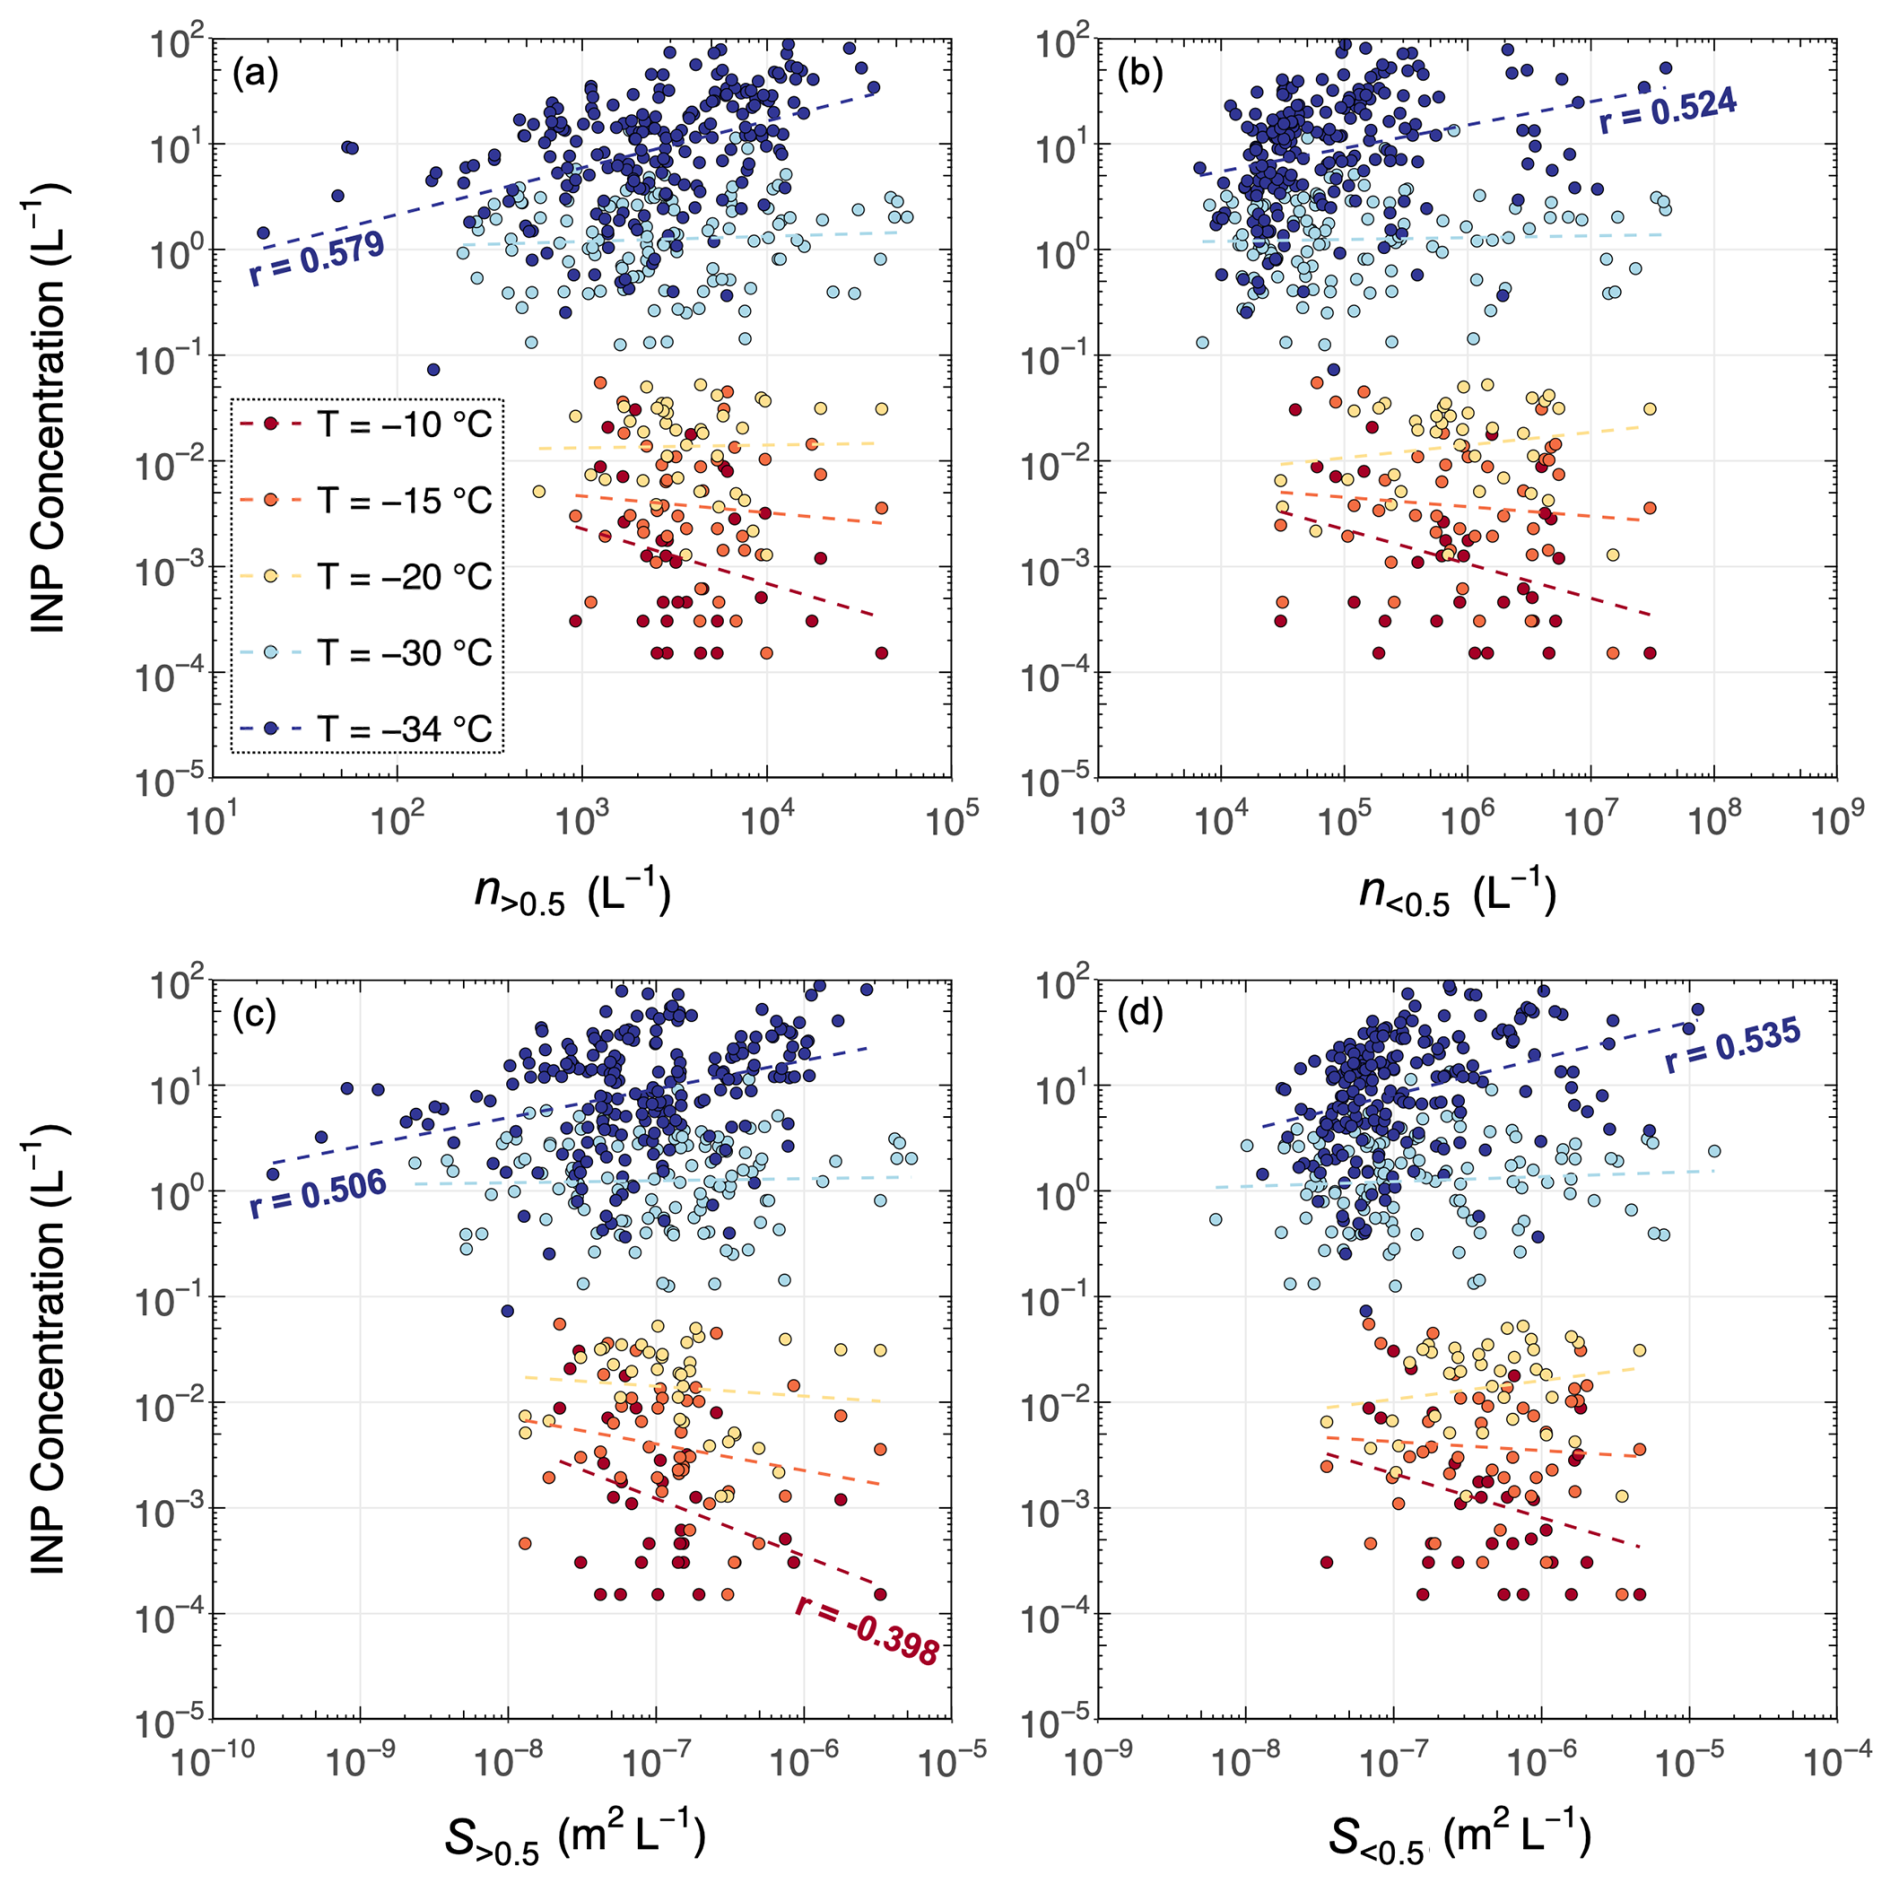
Figure 3Correlation of NINP measured from PM10 filters and HINC with (a) the particle number concentration with volume-equivalent diameter larger than 0.5 µm (n>0.5), (b) the particle number concentration with volume-equivalent diameter smaller than 0.5 µm (n<0.5), (c) the surface area concentration of particles larger than 0.5 µm (S>0.5) and (d) the surface area concentration of particles smaller than 0.5 µm (S<0.5). All size distribution parameters are taken from the SMPS/APS measurements described in Sect. 2.4.1. Note that n>0.5 and S>0.5, which correlate with NINP measured at and −34 °C, only consider particle sizes of up to 2.5 µm, i.e., the upper size threshold of HINC. Colors represent NINP measured at 5 different temperatures indicated in the figure; dashed lines show the linear regression. The r values in the figure indicate the correlation coefficients calculated with statistical significance (p<0.05). The correlation coefficients and statistical significance for all correlations are given in Table B1 in the Appendix.
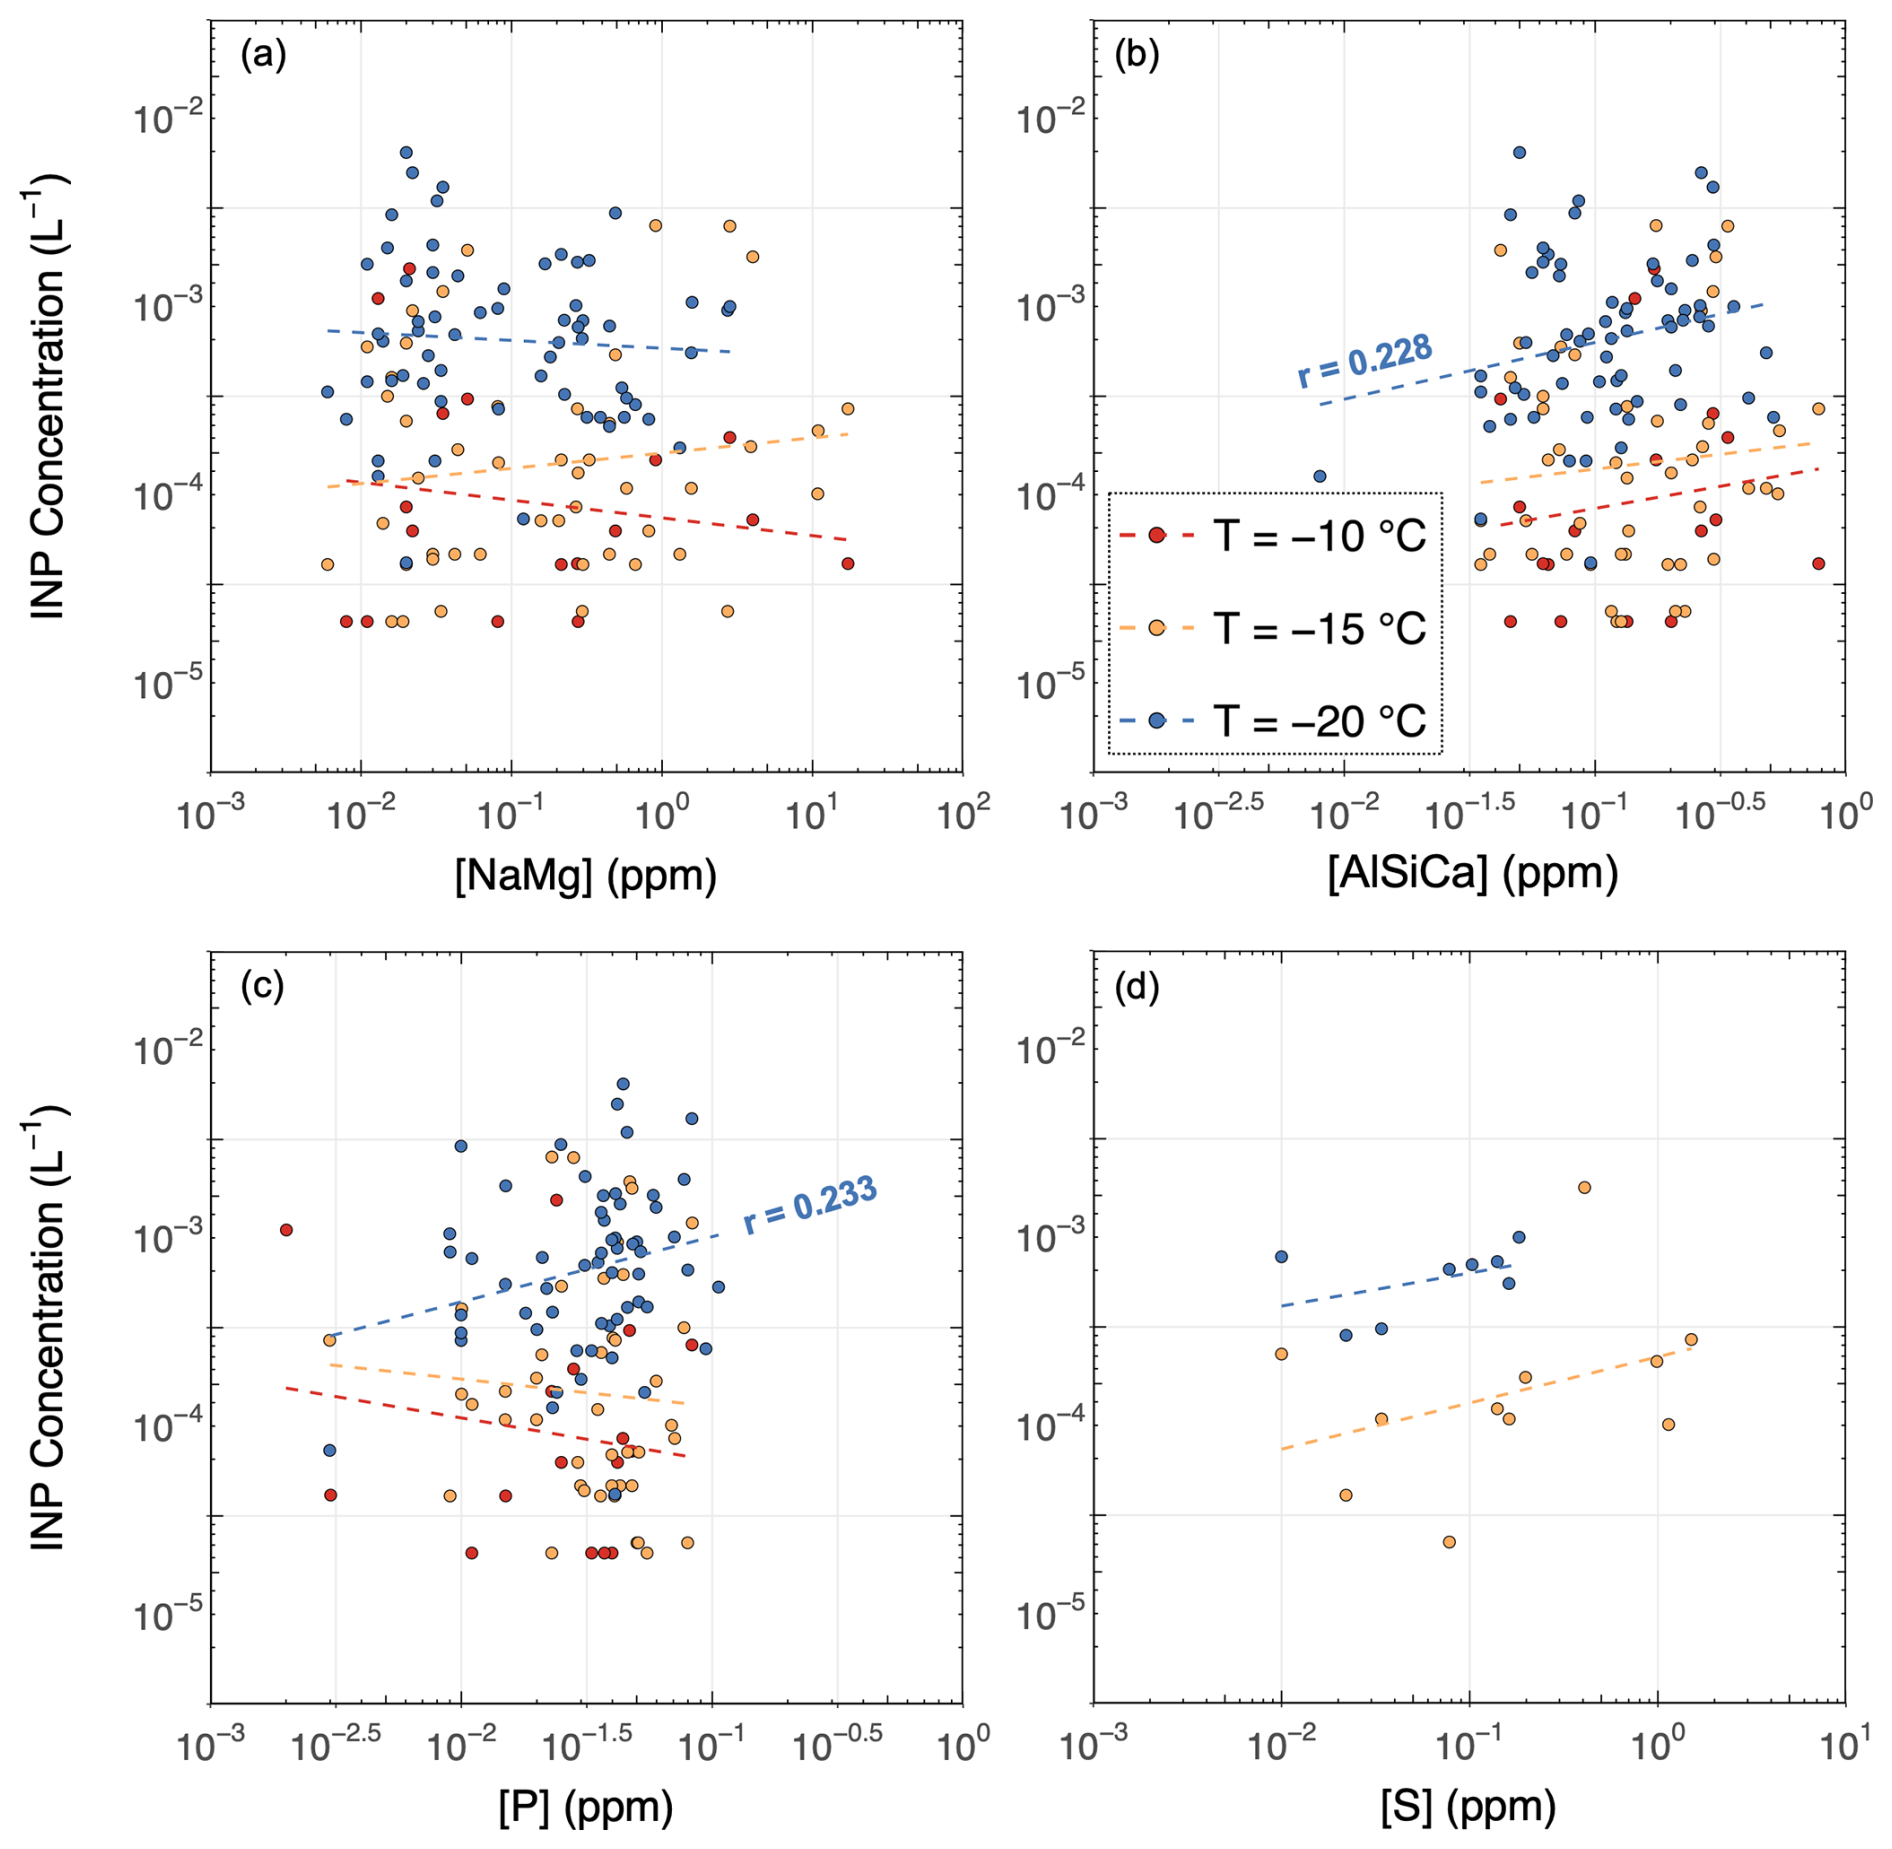
Figure 4Correlation of NINP with the concentration of indicator compounds measured from impinger samples using ICP-OES. Correlation of NINP with (a) NaMg (sea salt indicator), (b) AlSiCa (dust indicator), (c) phosphorus (nutrient indicator) and (d) sulfur (DMS indicator) (not plotted at °C because only 2 data points were available). Colors represent NINP measured at different temperatures indicated in the figure. Dashed lines show linear regression. The r values displayed in the figure are the correlation coefficient calculated with statistical significance (p<0.05). The correlation coefficients and statistical significance of all data are given in Table B2.
At most freezing temperatures, NINP from PM10 filters was observed to be higher than that from impinger samples. This difference could be influenced by the larger volume of air processed by the impinger (approximately 54 m3) compared to the PM10 filters (approximately 27.6 m3), which shifts the detectable range to lower NINP for the impinger samples. The minimum detectable NINP with DRINCZ decreases as the air volume increases. Therefore, the NINP detectable from impinger samples is lower, which is particularly relevant at the highest freezing temperatures. For °C, the variability in the impinger INP data and therefore the difference to the lower limit of the Petters and Wright (2015) line could potentially be even more than currently presented because our data are limited by reaching the lower limit of detection of our analysis method. Several other factors, listed below in no particular order, may also account for the differences in NINP measured from impinger and PM10 samples.
-
Aerosols captured by the impinger are directly immersed in water, potentially reducing the IN activity of certain particles, such as mineral dust (Perkins et al., 2020). Filter samples, due to their shorter water exposure before INP analysis, are less likely to undergo such degradation.
-
The freeze-thaw cycle of freezing impinger samples for storage at −20 °C before melting the samples for analysis could deactivate INPs (Beall et al., 2020).
-
Size selectivity of the samplers could explain the variation in INP abundance. The impinger collects particles larger than 0.5 µm, while PM10 filters also sample particles smaller than 0.5 µm. Additional sub-0.5 µm particles, such as biogenic macromolecules, may have played a role for higher NINP from filter compared to impinger samples, particularly at temperatures above −15 °C. Despite the findings that IN activity of mineral dust often scales with particle size (e.g., DeMott et al., 2015; Welti et al., 2009), some research has also revealed that biological, IN-active macromolecules of smaller size, e.g., marine organics smaller than 200 nm, can be effective INPs (McCluskey et al., 2018; Wilson et al., 2015) which would not be present in the impinger samples.
-
The difference in instrument positions (i.e., impinger samples and PM10 filters were collected on the second and sixth deck, respectively, see Fig. 1b) could have contributed to a sampling bias. Previous observations of wind speed on the RV Akademik Tryoshnikov indicated that the ship's superstructure distorts the airflow, potentially introducing a bias in measurements at various onboard locations (Landwehr et al., 2020). Such bias might similarly influence aerosol and INP measurements, with their abundance affected by the strength and direction of the ambient airflow.
Compared to the offline measurements, NINP measured with HINC at −34 and −30 °C generally align better with the values from the PM10 filters than those from impinger samples. The observed alignment of NINP from HINC with those from PM10 filters could come from HINC also sampling particles with sizes below 2.5 µm (Li et al., 2022; Lacher et al., 2017), therefore covering the sub-0.5 µm particles like the PM10 filters.
Overall, for °C, we observe lower NINP in the Eurasian Arctic compared to the mid-latitude range. We propose that this is due to lower concentrations of dust. Some of the observed NINP values fall within the lower end of the range reported for biological INPs in continental mid-latitude regions ( °C). This supports the contribution of MBAs with ice-nucleating potential over the Eurasian Arctic Ocean, despite the overall NINP in our study being lower than typical mid-latitude values.
3.2 Correlations of INP to aerosol number, size, and surface area
Figure 3 shows the correlations between NINP and parameters related to particle size (see Table B1 for the correlation parameters). Among the investigated freezing temperatures, a significant, moderate correlation was exclusively observed at °C for all parameters. At this temperature, the notable positive correlations between NINP, particle concentration, and surface area across all sizes indicate that as the freezing temperature decreases and approaches the homogeneous freezing temperature, a considerable fraction (1 in 102) of all particles become IN active. Conversely, at higher temperatures, NINP demonstrates a mostly insignificant correlation with bulk aerosol properties (except the small negative correlation with S>0.5). This decoupling can be attributed to INPs constituting a small fraction of ambient aerosols – only about 1 in 106 particles are IN-active at −15 °C. A recent study (Rinaldi et al., 2025) observed even lower NINP at −15 °C in Svalbard in spring, summer, and autumn (– L−1), demonstrating that lower concentrations than what we report are possible. The significant but weak anti-correlation between NINP and S>0.5 is unexpected, pointing towards higher NINP when the particle number concentration is low, which is the case when INPs come from a local source that has not been diluted by transport. This suggests the contribution is local at warmer temperatures where bioaerosols are IN-active. Additionally, the high abundance of sea salt particles, which contribute significantly to total surface area but are largely inactive as INPs, could further dilute the relationship between NINP and surface area concentrations. Moreover, the presence of mixed aerosol types with varying ice-nucleating efficiencies can further obscure any direct scaling with bulk surface area. However, we note that the small dataset size limits a more comprehensive interpretation. Nevertheless, our findings in the maritime Arctic environment challenge the established parameterization of ambient NINP based on specific aerosol sizes and surface areas (e.g., DeMott et al., 2010; Niemand et al., 2012; DeMott et al., 2015; McCluskey et al., 2018).
3.3 Chemical composition and sources of INPs over the Eurasian-Arctic Ocean
To further investigate the nature and source of INPs, the elemental composition of the ambient aerosol was determined from the impinger samples. Figure 4 exhibits the correlation analysis between NINP and multiple representative elements in the bulk aerosol samples. Statistically significant correlations were not found for NINP at −10 and −15 °C, likely due to the small ice active fraction of particles. In general, NINP is poorly correlated with the concentration of sea salt, which is expected since the soluble Na and Mg containing sea salt particles typically do not act as immersion INP. Despite the weak correlations at −10 and −15 °C, NINP increases with the concentration of AlSiCa (indicator for mineral dust), indicating an overall weak contribution of dust or covariant INP species over the Arctic Ocean. Additionally, a significant but weak correlation was found between NINP at −20 °C and phosphorus concentrations, and moderate but not significant correlations are observed between NINP and sulfur concentrations. In the biogeochemical cycle in the Arctic Ocean with minimal anthropogenic influence, phosphorus plays a crucial role as a nutrient for marine biology. Similarly, marine-released sulfur, often derived from dimethyl sulfide (DMS), a byproduct of marine phytoplankton and microbial metabolism (e.g., Becagli et al., 2019; Gabric et al., 2018), suggests that the appearance of marine biological activity, such as phytoplankton blooms, could enrich the INP population (DeMott et al., 2016). While directional trends between NINP and elemental tracers (e.g., AlSiCa, P, and S) are broadly consistent with potential mineral dust and marine biogenic influences, the generally weak to moderate correlations and limited statistical significance at several temperatures suggest that bulk elemental composition alone cannot fully resolve the diversity of INP sources. This is due to the chemical and physical complexity of the ambient aerosol population that are influenced by multiple potentially correlated factors in the Eurasian Arctic, where marine, terrestrial, and biogenic particles frequently co-emit and mix during transport. Furthermore, highly effective INPs constitute only a small fraction of total aerosol mass and are not adequately represented by bulk tracer signals. To disentangle the overlapping terrestrial and marine contributions to INPs, particularly in the remote and dynamic Arctic oceanic environment, future field studies would benefit from the use of more specific molecular tracers (e.g., molecular organics, biochemical tracers like DNA and lipids, and isotopic ratios), single-particle analyses, larger sample sizes, and multivariate data approaches, the latter of which are not possible with the limited dataset we have from this single cruise.
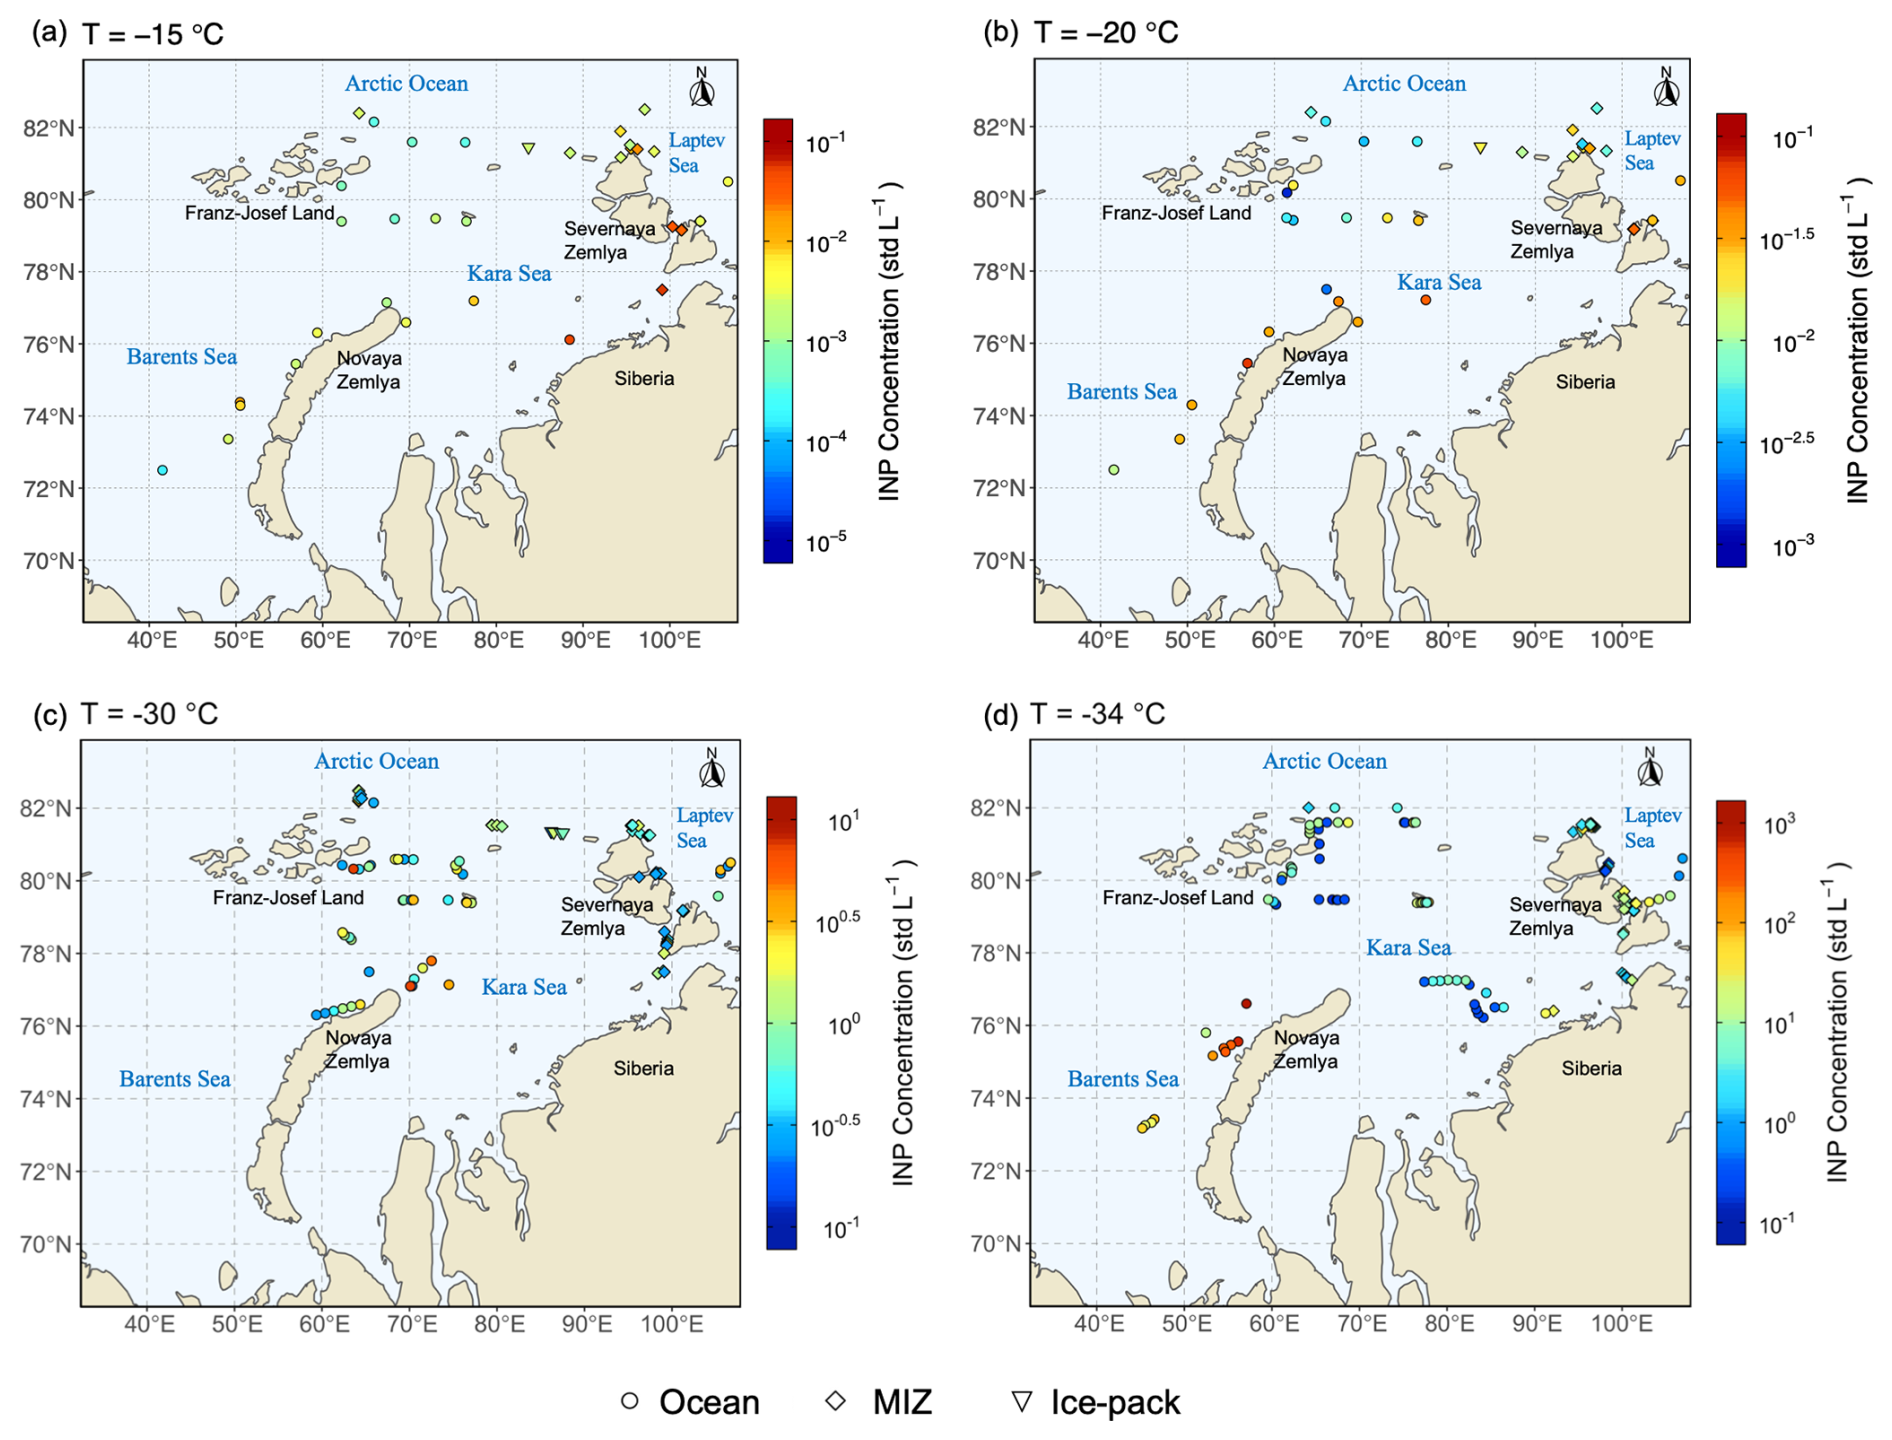
Figure 5Geographical variability during the Arctic Century Expedition of INP concentrations at (a) °C and (b) °C sampled with PM10 filters and analyzed with DRINCZ; (c) °C and (d) °C measured with HINC (note different color scales). Different shapes represent categories of sea ice extent (indicated in the figure legend) when the measurements were taken based on the daily observation of sea ice concentrations. Note the difference in color scale when comparing at different temperatures.
3.4 Geographical variability of INP concentrations across the Arctic marine and ice landscape
Figure 5 shows the geographical variability of NINP measured along the ship track with HINC and PM10 filters. Additional maps for NINP measured from the impinger samples are shown in Fig. D1 in Appendix D. Generally, there is a tendency that at higher latitudes, lower NINP are observed at all temperatures, except PM10 filters collected near the Severnaya Zemlya, highlighting the influence of nearby terrestrial sources. NINP vary with sea ice coverage, with the highest NINP often occurring over the ice-free ocean or marginal ice zone (MIZ), particularly near land, and less so within the dense ice pack. Figure 6a categorizes INP temperature spectra by sea ice cover. Observations at °C over the ice pack showed NINP below the LOD. T-test results indicate that at °C, the mean NINP is systematically, but not significantly higher over the ice-free ocean than over the ice pack and higher in the MIZ than on the ice-free ocean. Mean NINP at −30 and −34 °C are significantly different over the ice-free ocean compared to within the ice pack or the MIZ. Figure 6b summarizes the activated INP fraction at selected temperatures based on the locations of measurements. For aerosols in the ice-pack region, despite being less numerous, they may possess higher intrinsic IN efficiency, particularly at cold temperatures ( °C). Similarly, at warmer temperatures ( °C), the activated INP fraction in the MIZ is notably higher than in the open Ocean, suggesting a lower total aerosol background and a higher relative abundance of warm-temperature INP, likely driven by marine biological activity or wave breaking at the MIZ. Potential sources include biogenic INPs originating from marine biota, such as phytoplankton exudates (Creamean et al., 2019), augmented by nutrient influx from the warmer, saltier Atlantic waters entering the Arctic Ocean during ice-melting seasons (a process known as Arctic Atlantification, Tuerena et al., 2022), and mineral dust input from river runoff (Tobo et al., 2019; Hartmann et al., 2021) and thawing permafrost (Creamean et al., 2020). An additional potential source of INP in the MIZ that has previously been reported is sea ice algae growing at the marginal or seasonal ice zone and in open leads (Gabric et al., 2018; Kirpes et al., 2019).
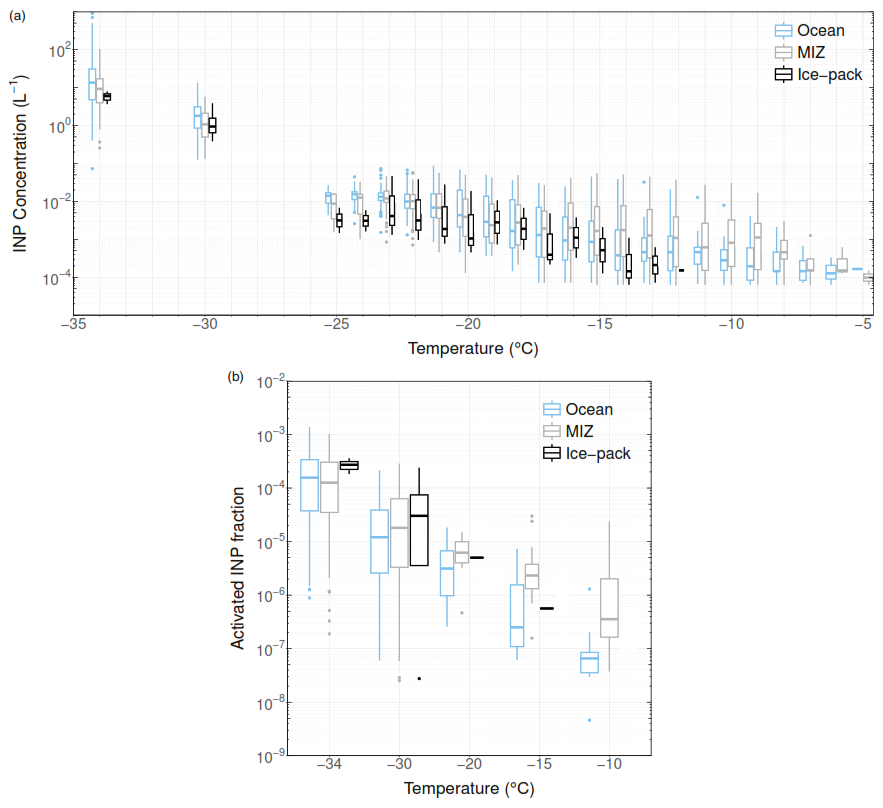
Figure 6Cumulative INP temperature-spectra (a) and activated INP fraction (b) derived from HINC (−30 and −34 °C), impinger samples and PM10 filters (−5 to −25 °C), given different sea ice conditions (sky blue: ice-free ocean; light grey: marginal ice zone (MIZ); black: ice pack). The lower and upper bounds of the boxes indicate the 25 % and 75 % quantiles, and the horizontal line within the boxes represents the median NINP. Whiskers have a length of 1.5×IQR (interquartile range), and individual dots mark outliers.
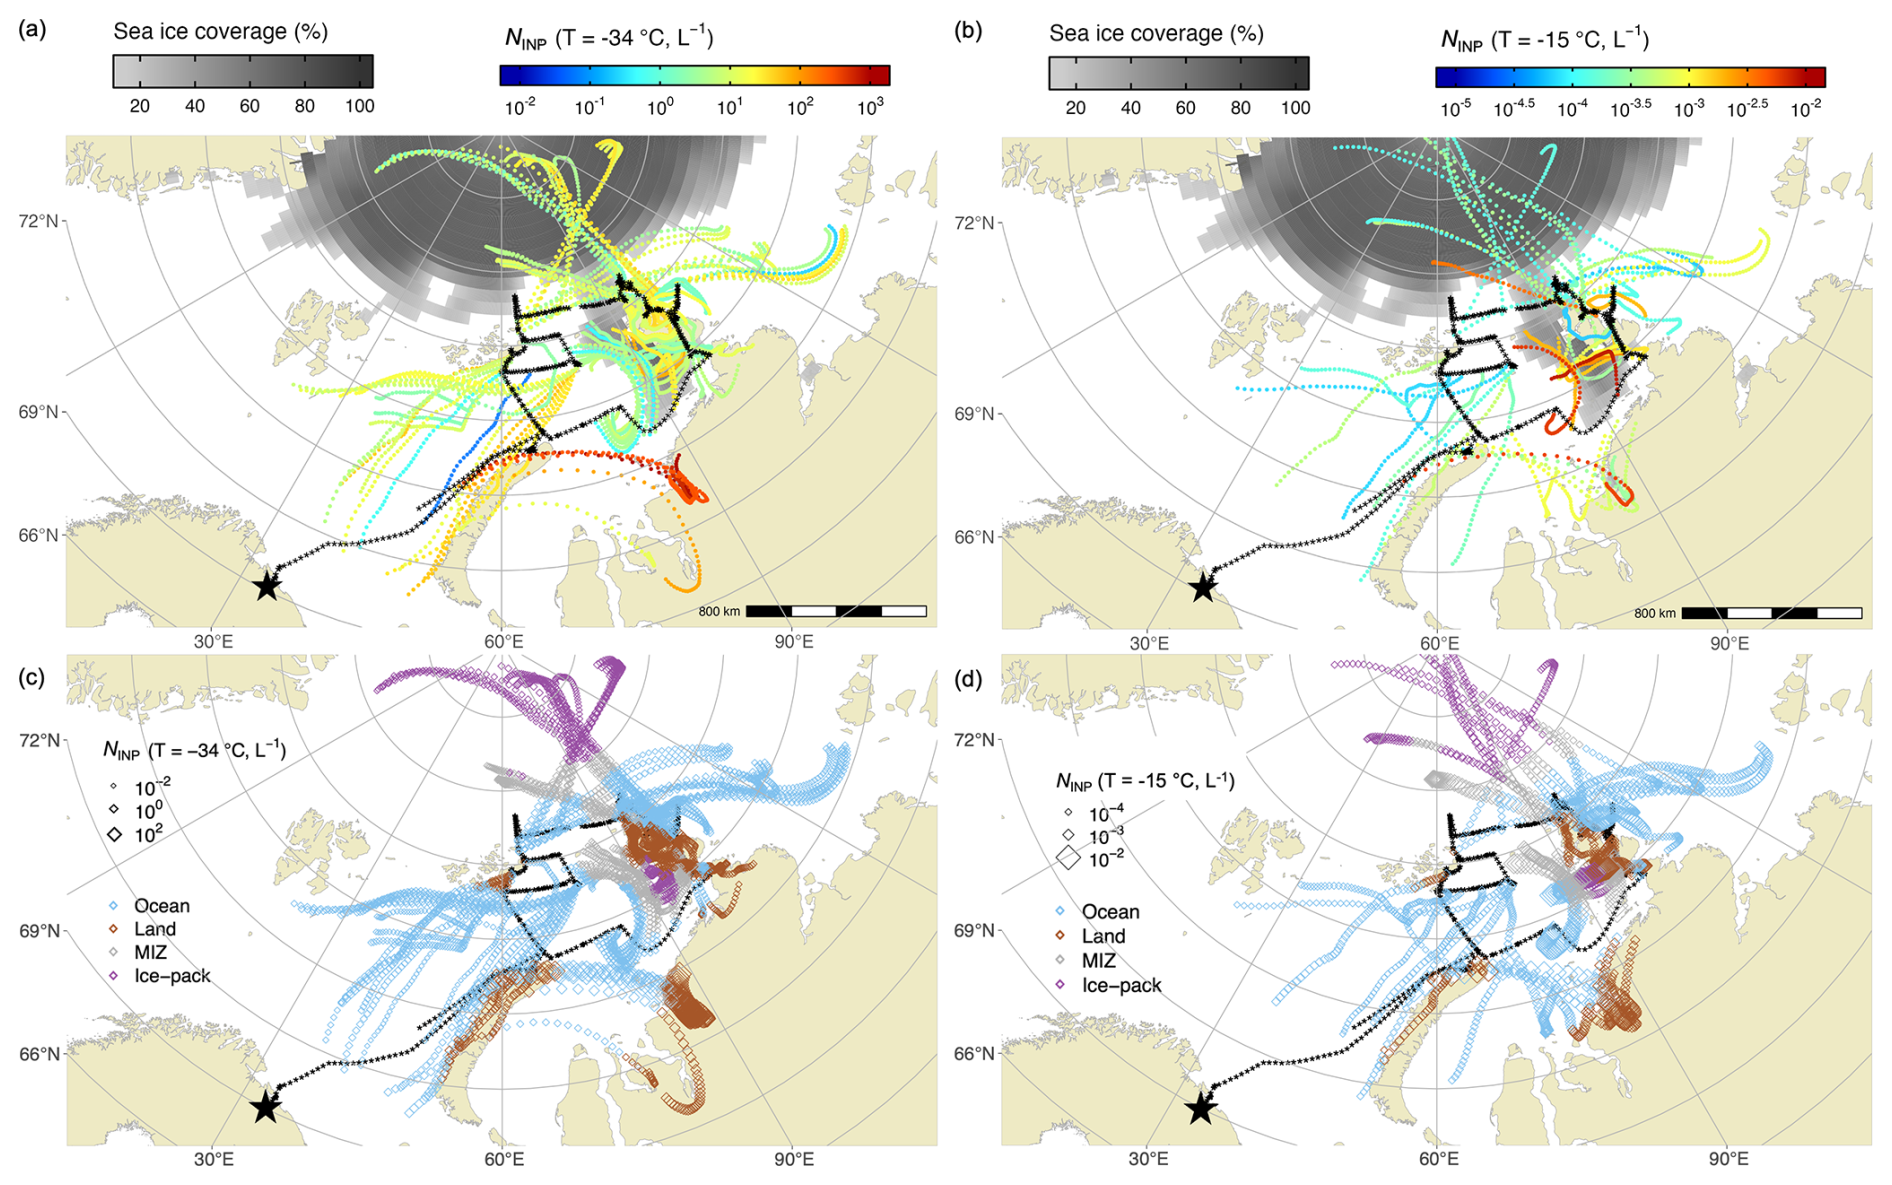
Figure 72 d backward trajectories starting from the ship location at sea level. A trajectory was launched every hour during each INP sampling period. Points along the trajectories are marked at hourly intervals. The black asterisks represent the ship's track and the starting point of the back trajectories. The large black star marks the starting and ending point of the expedition (i.e., the port of Murmansk). The trajectories are colored by the NINP concentrations at (a) °C and (b) °C (note the different color scales for different temperatures). The sea ice coverage is shown in grayscale. The same backward trajectories are shown for measurements at (c) °C and (d) °C, but here colored by the four surface types passed over by the air parcel. The marker size indicates the NINP.
3.5 Influence of Air mass origins on INP variability
To investigate the variability in NINP with airmass origin, 2 d backward trajectories starting from the boundary layer at the ship's location during observation periods were calculated. Figure 7a and b show the trajectories colored according to the observed NINP at °C and °C, respectively, at sea level. For both temperatures, the highest NINP were captured when the ship approached the northern coast of Novaya Zemlya, where the air masses originate from the western Siberian coast near the estuary of the Pyasina River. Local terrestrial sources from Novaya Zemlya or long-range aerosol transport may be significant contributors to these high-NINP cases. Porter et al. (2022) reported a similar air mass origin for the highest NINP active at temperatures above −15 °C. They measured in the central Arctic in 2018 during the summer season, suggesting the Novaya Zemlya region can be a strong Arctic INP source. Previous studies have reported that the shallow seas off the Siberian coast and Arctic archipelagos are heavily affected by fluvial discharge rich in organic matter, silt, clay, and nutrients (Ahmed et al., 2020; Juhls et al., 2019). Thawing permafrost in the summer enhances the mobilization of soil, nutrients, and active microbes into rivers and runoff into the ocean (Hultman et al., 2015). Aerosolization of silt, clay, and soil components at the water-air interface may contribute to the NINP at °C (Wieber et al., 2025; Nieto-Caballero et al., 2025). Elevated marine biological productivity due to increased nutrient availability from fluvial input could have enhanced NINP at °C. The INPs are likely locally generated dust and biological particles is further supported by the chemical composition time series shown in Fig. C1 (Appendix C), where at the corresponding ship location around 3 September, high concentrations in all categorized compositions were observed. Further evidence that local sources are mainly contributing to the NINP at −34 °C, comes from moderately elevated NINP when the ship approached Franz-Josef Land and Severnaya Zemlya (Fig. 7a). In these locations, air masses often originated from the central Arctic with high sea ice coverage, where the INP population is scarce, indicating local influences may dominate the INP source over long-range transport. Similarly, at °C, a few high INP occurrences coincided with air masses originating from the MIZ or ice packs, where the ship was located over the open ocean close to Severnaya Zemlya (Figs. 7b). Local aerosol emissions from the ocean and the island likely contributed to the high INP population at this temperature. This finding is corroborated by extended 7 d back trajectories (see Fig. E in the Appendix). Notably, elevated NINP observed near Novaya Zemlya at both −34 and −15 °C coincide with air masses characterized by prolonged residence over the western Siberian coast – a hotspot acting as a potent source for both mineral dust and biological particles as discussed previously. This regional terrestrial contribution is further substantiated by the vertical transport history of the pathways (Figs. E1 and E2 in the Appendix). Throughout the 7 d transport period, the air masses associated with the elevated NINP events near Novaya Zemlya remained predominantly confined to the lower troposphere, traveling below 900 hPa while traversing the Western Siberian coast. This persistent low-altitude transport indicates that the air parcels were actively coupled with the surface boundary layer, facilitating the effective entrainment and transport of regional mineral dust and biogenic particles to the marine boundary layer over the Eurasian-Arctic Seas. Conversely, trajectories showing low NINP predominantly originated from aloft or spent minimal time within the continental boundary layer, confirming that surface-level source interaction is the primary driver of the observed NINP enhancements.
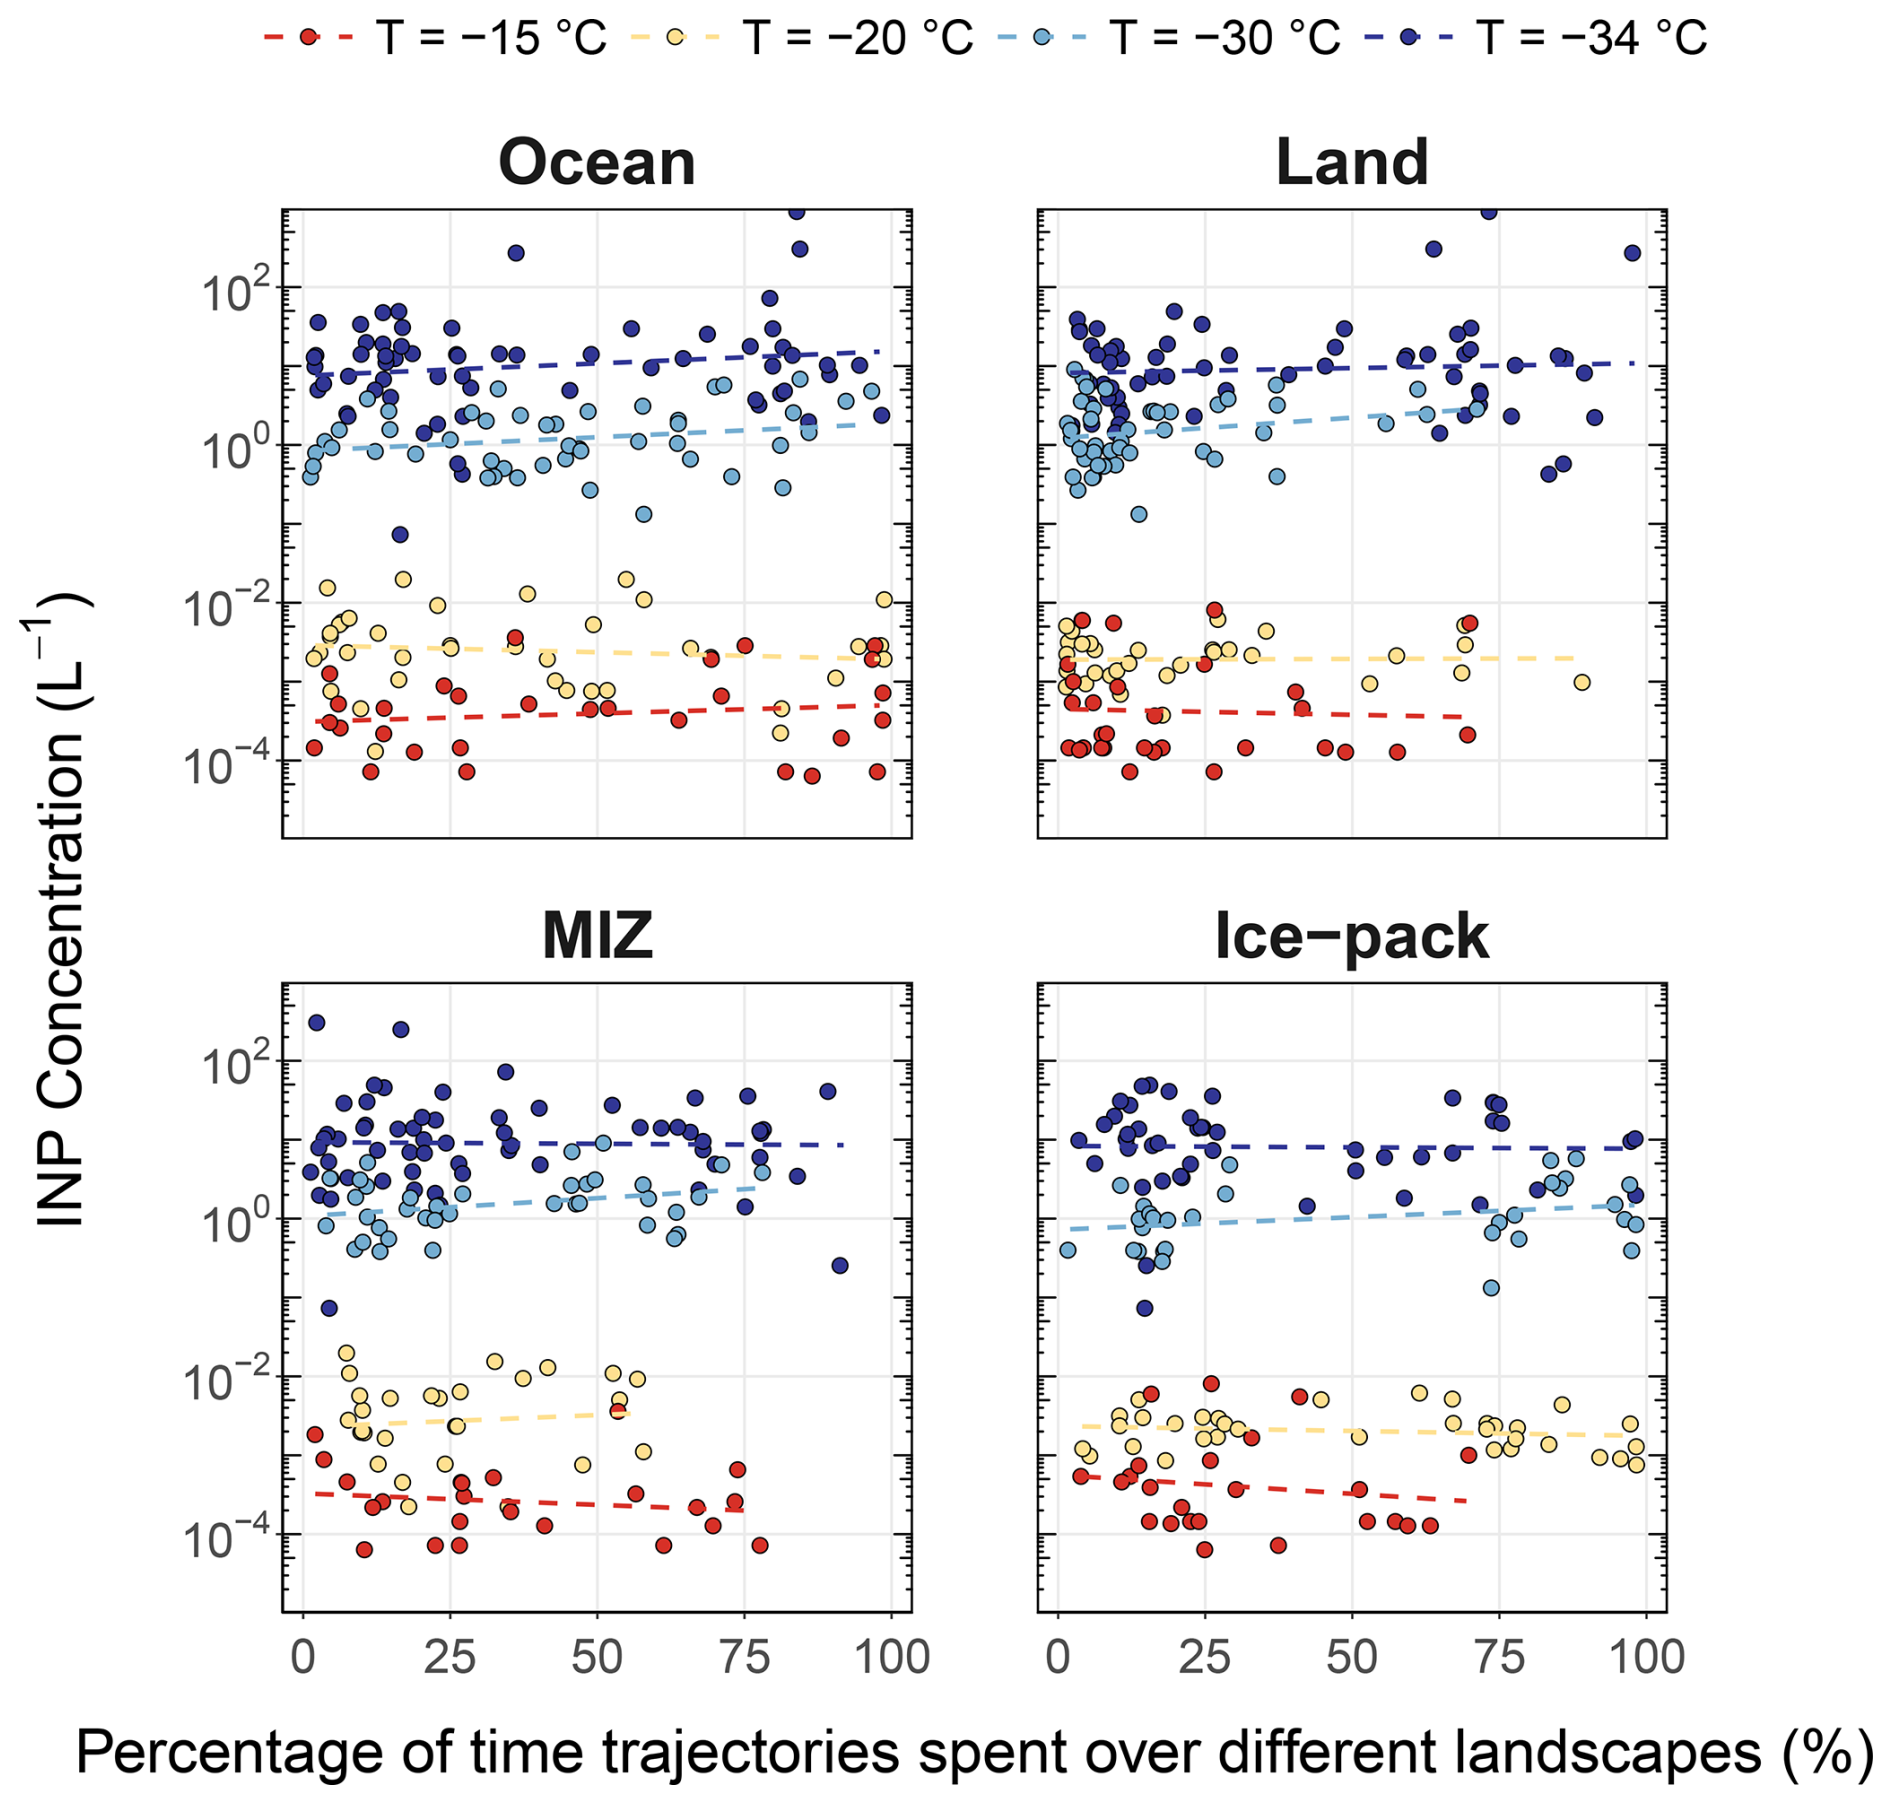
Figure 8NINP as a function of the percentage of time that the 2 d backward trajectories spent in the boundary layer over different types of surface. Colored circles represent NINP measured at four different temperatures; dashed lines show the linear regression of the corresponding data. None of the datasets shows an effect on NINP from the time air masses spent over land, ocean, or ice shelf. The correlation coefficients and statistical significance metrics are given in Table B3 in the Appendix.
Figure 7c and d display 2 d backward trajectories classified by the overpassed types of surface during air mass history. In addition to the western Siberian coast, air masses containing moderate to high NINP also passed over ice-free ocean and land. In contrast, air mass trajectories passing over the ice pack or MIZ contained lower NINP. One factor could be the absence of aerosolization via wave breaking and bubble bursting where there is sea ice. A correlation analysis between NINP and the residence time of air masses over different types of surface is shown in Fig. 8, with correlation coefficients provided in Table B3 in the Appendix. Negligible to no correlations were found between NINP and the percentage of time that trajectories spent in the boundary layer over the four different types of surface (i.e., ice-free ocean, land, MIZ, or ice pack), suggesting no clear pattern emerges, which surface types are most important for high NINP. The missing correlation between surface types along trajectories and NINP along the ship track indicates that local INP sources are important in shaping INP population in the Eurasian-Arctic Ocean. From the combination of all these observations, it can be concluded that long-range transport generally plays a less important role in the concentration of INPs over the Eurasian-Arctic Ocean during the summer season than local emissions.
3.6 Case study
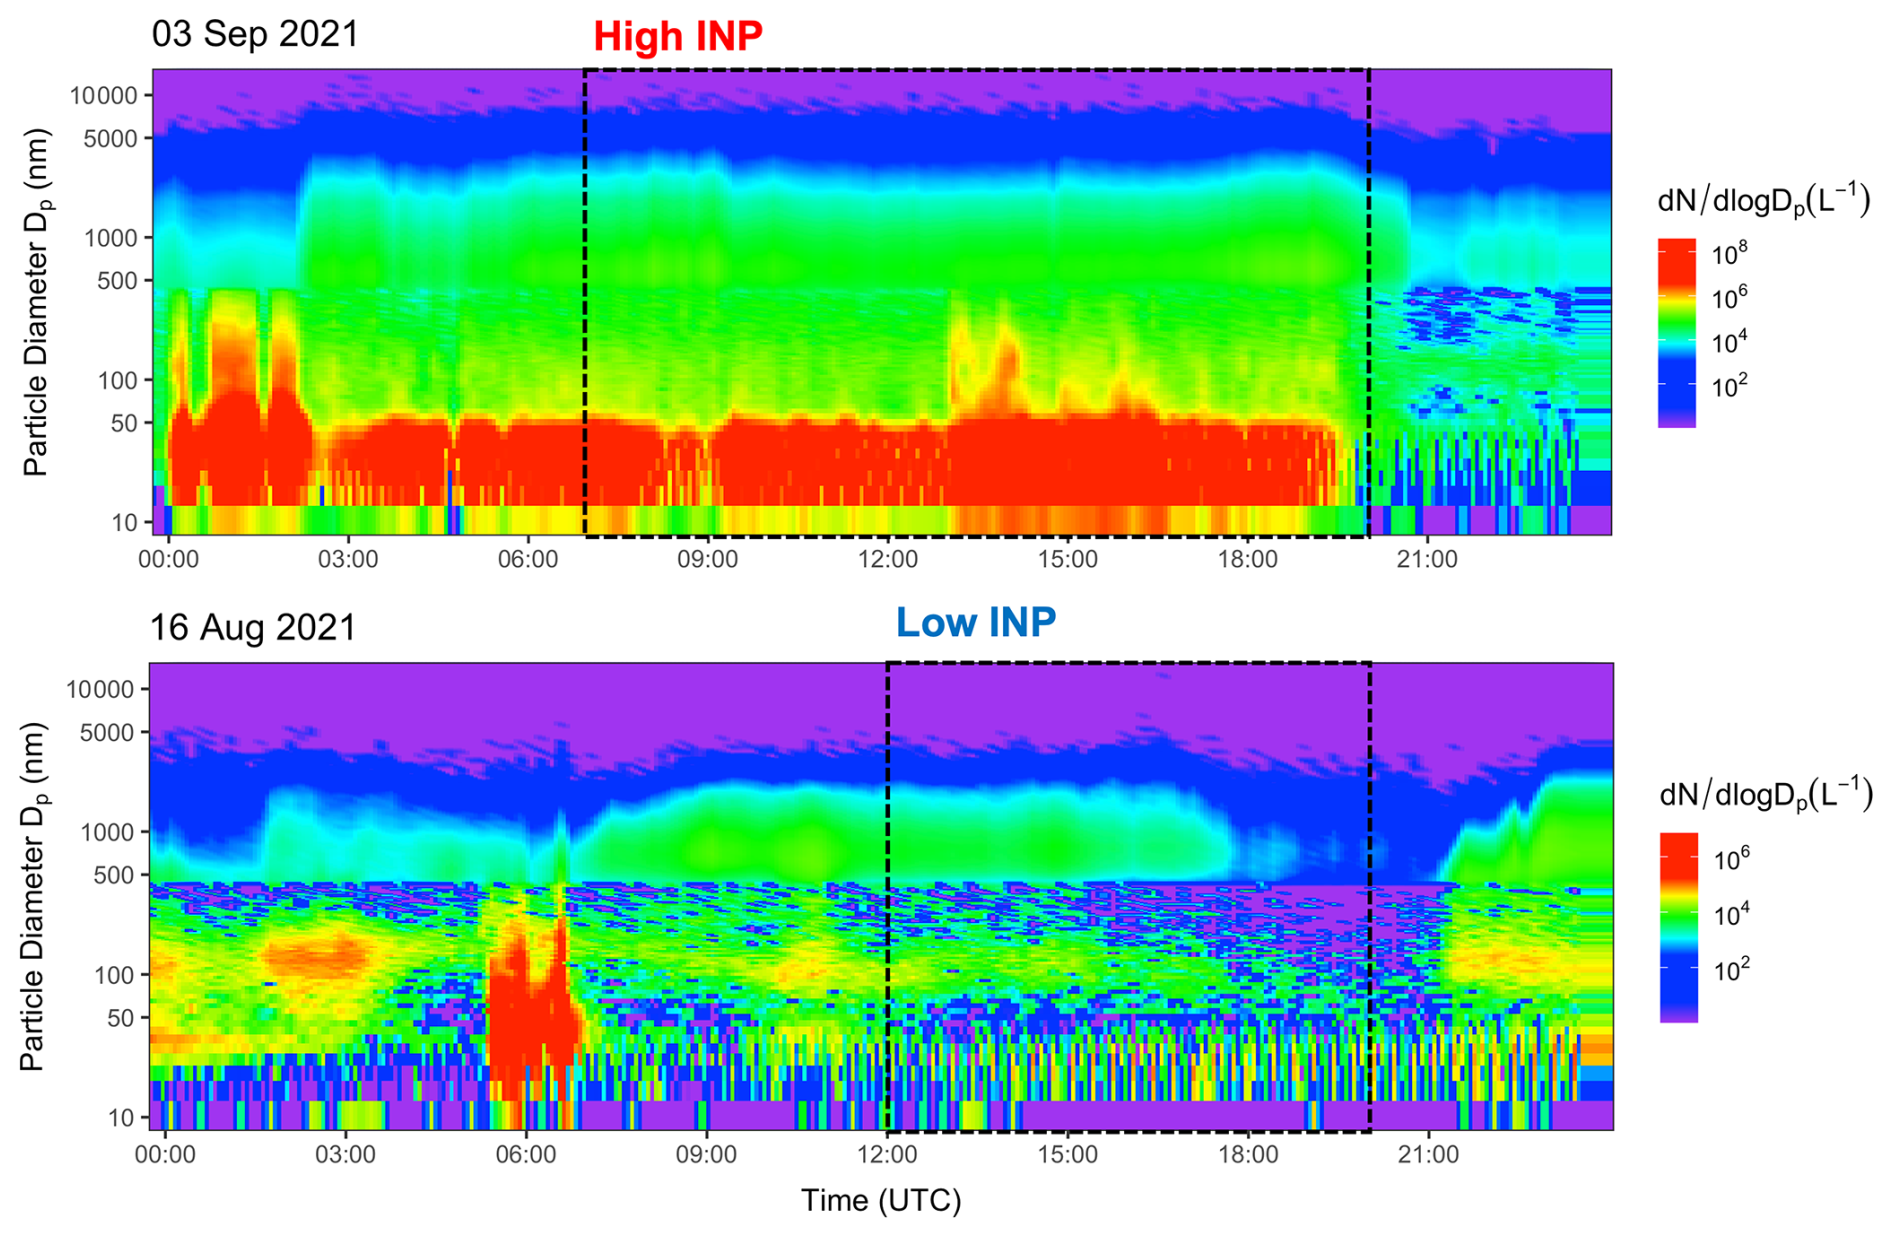
In this section, two selected periods of low and high NINP during the campaign are discussed in detail. The analysis includes measurements of aerosol size, elemental analysis, and air mass history. The periods are selected based on measured NINP at °C, where NINP were in the bottom and top 25 % quartiles for the low and high NINP period, respectively, and where parallel aerosol characterization was available (see Fig. A1 in the Appendix for NINP time series). The ship's location during the two periods and back trajectories of the sampled air are shown in Fig. 9 (the extended 7 d back trajectories are shown in Fig. E4 in the Appendix). The low NINP period occurred when the ship sailed northeast of Franz-Josef Land at the edge of the MIZ, with the majority of air parcels originating from the northeastern Arctic ice pack, where the sea surface is mostly covered by ice and lacked terrestrial and marine aerosol sources. In contrast, during the high NINP period, the ship was sailing along the western coast of Novaya Zemlya in the ice-free ocean, with air parcels rich in SSA, dust, and biogenic particles arriving from the west Siberian coast, suggesting INP influence from both local source and long-range transport. Similar patterns have also been observed in the Alaskan Arctic (Pantoya et al., 2025), where lower NINP were linked to air masses originating from the central Arctic and regions with high sea ice coverage, while higher INP episodes corresponded to transport from southerly, mid-latitude regions. During this time, there is a substantial presence of melt ponds up to 20 %–30 % of the sea ice surface (Webster et al., 2015), the peak primary productivity has already passed by late summer (Ardyna et al., 2020), leading to low local sources of INP coming from the ice-covered region.
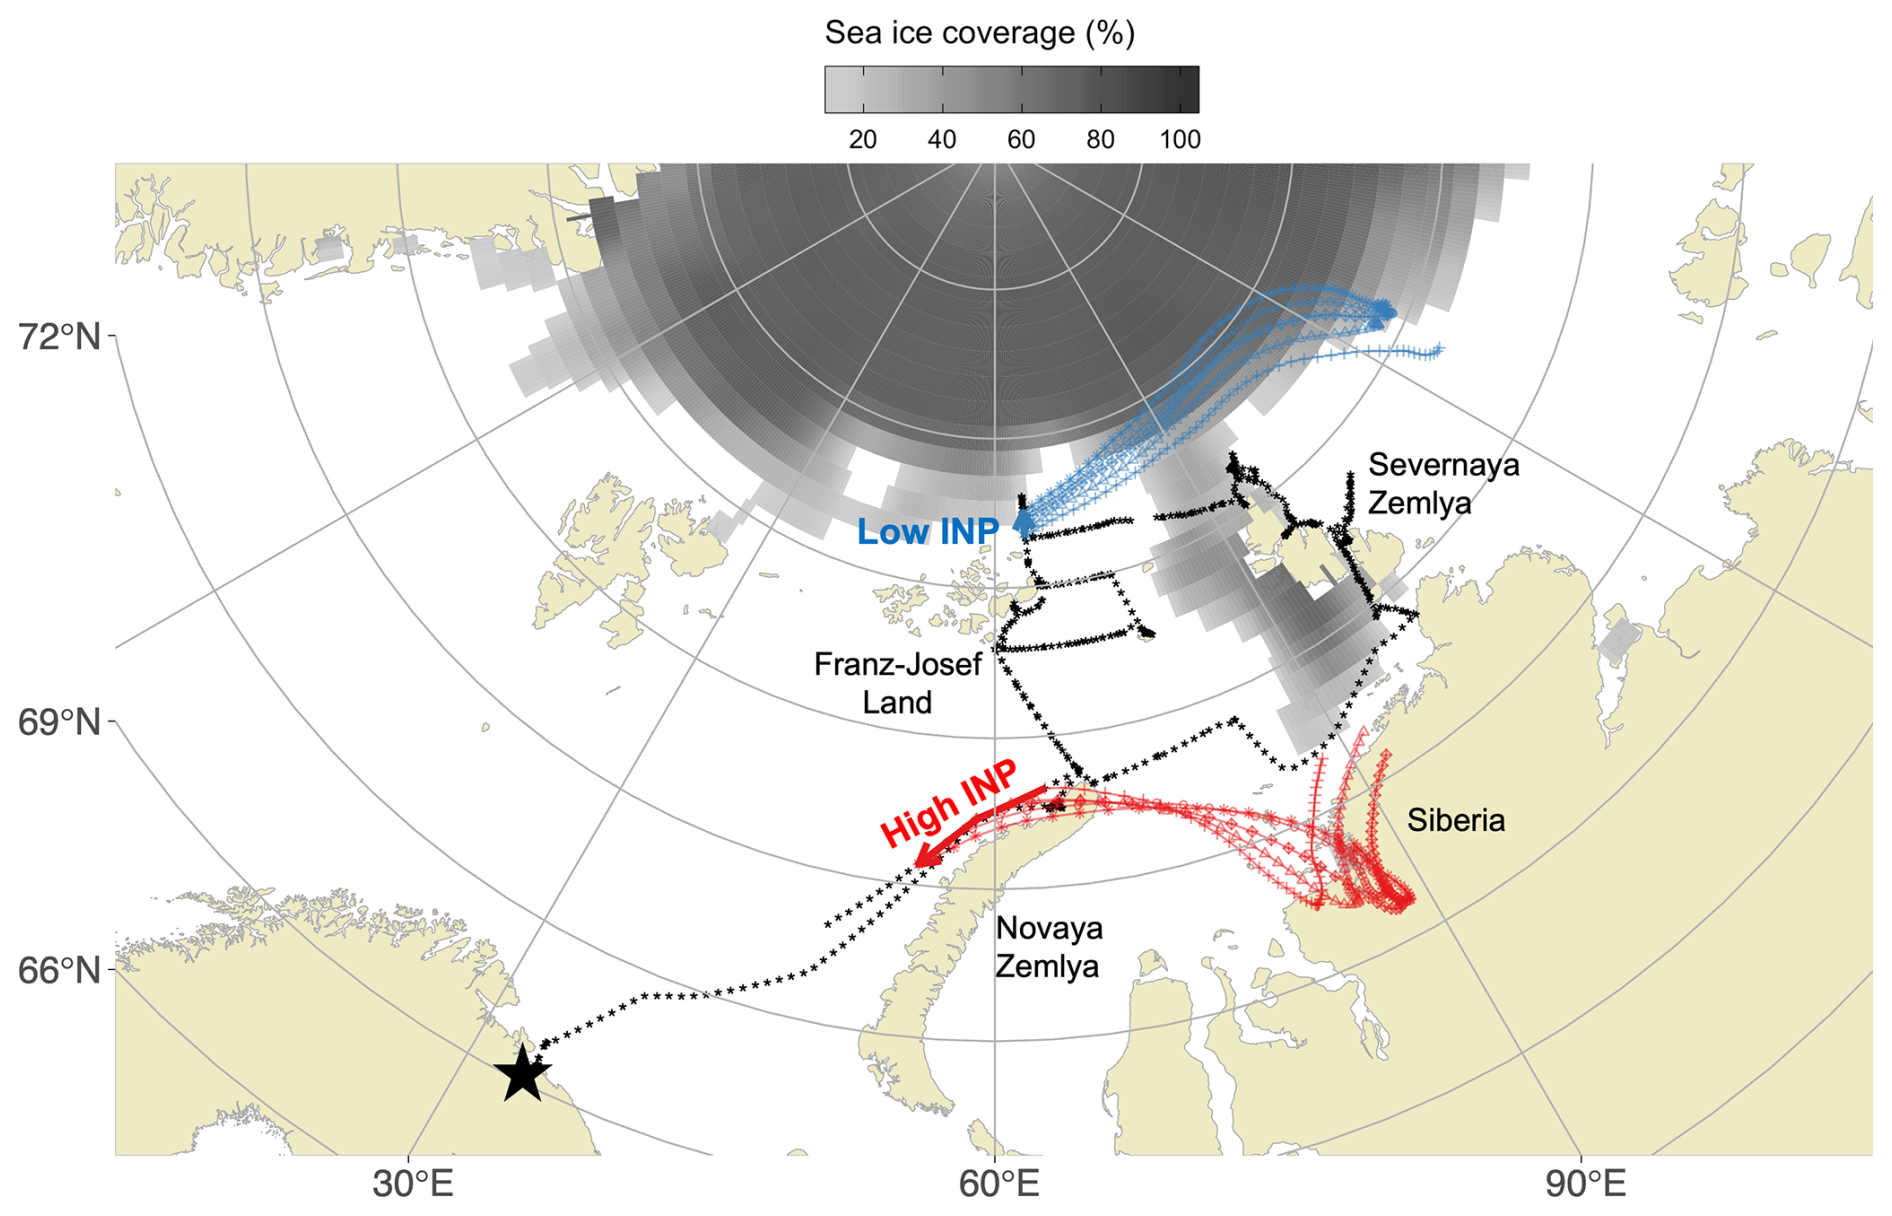
Figure 92 d backward trajectories for periods of low (blue) and high (red) NINP cases ( °C) during 12:00–20:00 UTC on 16 August 2021 and 07:00–20:00 UTC on 3 September 2021, respectively. The trajectories start from the ship's location at the sea level (0 m) and are launched hourly, with the points along the trajectory indicating hourly intervals. The solid thick arrows indicate the ship's track during the selected period. The black asterisks represent the ship's track, and the large black star marks the port of Murmansk, the start and end point of the expedition.
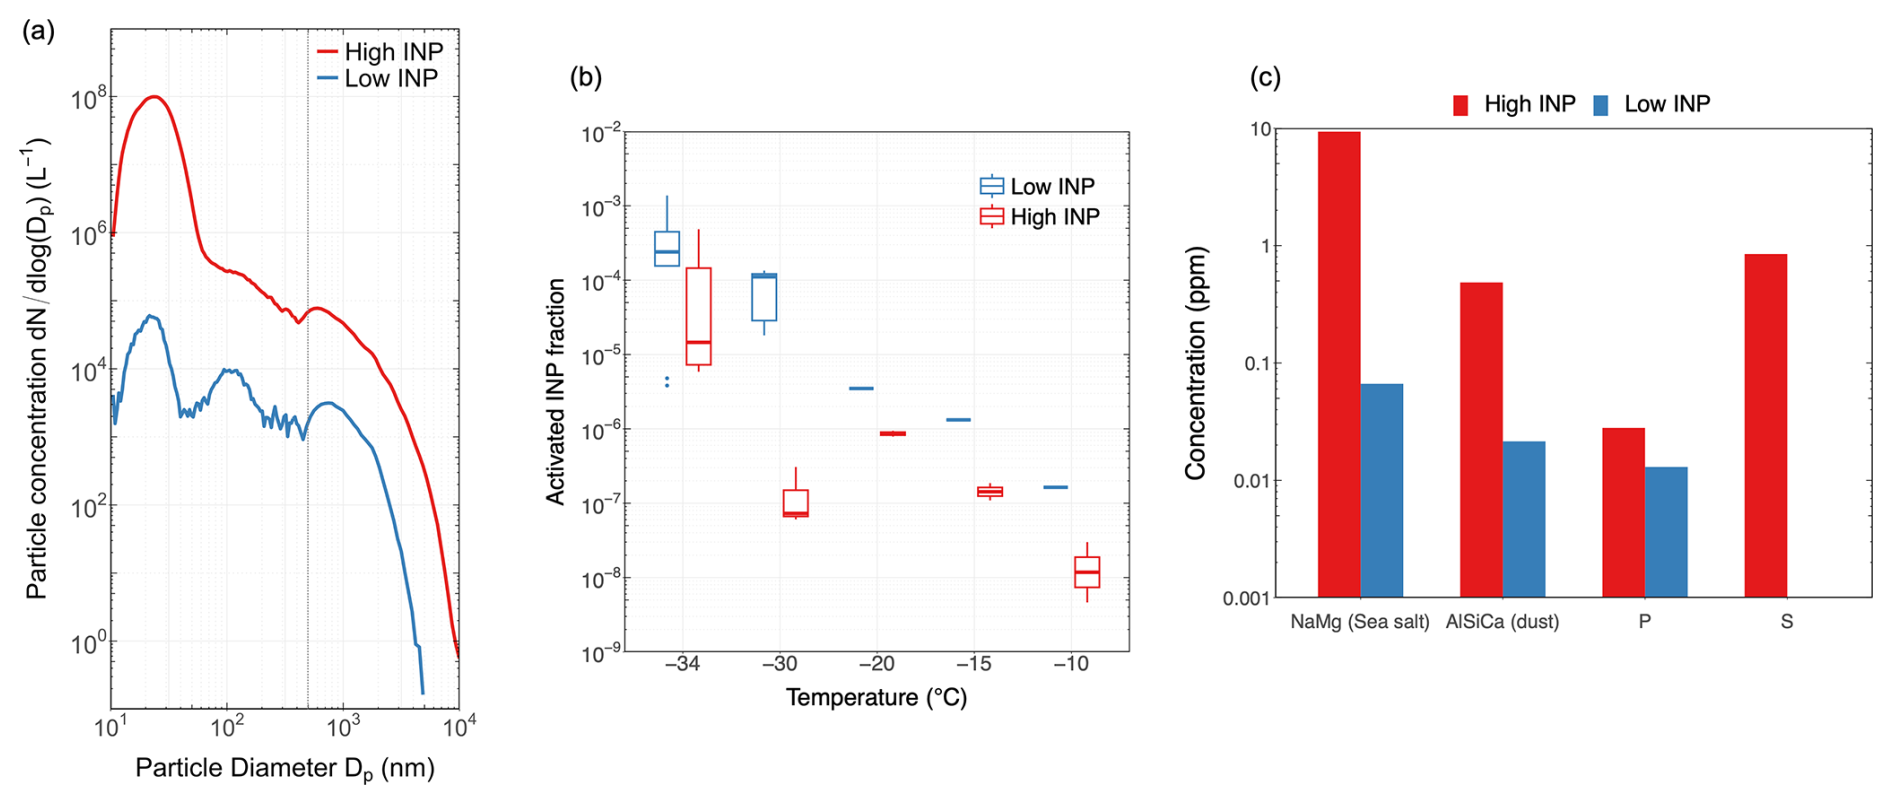
Figure 10Physicochemical properties of aerosols for low and high NINP cases during 12:00–20:00 UTC on 16 August 2021 and 07:00–20:00 UTC on 3 September 2021, respectively. (a) Averaged particle size distribution. The vertical dashed line indicates the volume equivalent diameter of 500 nm, where SMPS and APS measurements overlap; (b) activated INP fractions; and (c) concentrations of tracer elements measured by ICP-OES from impinger samples.
Figure 10a shows the average particle size distribution during the time windows of the two periods (see particle size distribution time series in Appendix Fig. F1). Notably, particle concentrations were 3 orders of magnitude higher across all size ranges during high NINP. Particularly, aerosol particles with diameters larger than 5 µm were only detected during the high INP period and could be responsible for the elevated NINP measured from impinger and PM10 filters. For particles below 2.5 µm captured by HINC, the high concentration in this size range could have caused the high NINP at −30 and −34 °C. Despite larger particle concentrations, Fig. 10b reveals consistently lower activated INP fraction during high NINP event at all selected temperatures, which could be caused by the dominance of ice-inactive aerosols, being enriched to a higher proportion in the air mass, such as sea salt particles. Figure 10c shows the abundance of tracer elements detected in impinger samples to support the case study. Sea salt concentrations were over 100 times higher in the high NINP sample compared to the low NINP sample, likely due to less saline seawater and ice covering the sea-air interface in the low NINP case. Additionally, the average wind speed at the sea surface was much higher (18 to 24 m s−1) in the high NINP period than during low NINP (3 to 6 m s−1) due to the passage of a cyclone during the high INP case. Since the concentration of local sea spray aerosols strongly depends on wind-induced wave breaking and bubble bursting (Moallemi et al., 2024; Inoue et al., 2021; Lewis et al., 2004), a heavier aerosol load, carrying IN-active MBA can be expected during high NINP. The higher phosphorous and sulfur contents during high NINP support the hypothesis of fluvial-marine transport of nutrients from meltwater runoff adjacent to Novaya Zemlya. Furthermore, approximately 25 times more AlSiCa (indicator of mineral dust) was detected in the high NINP sample compared to the low NINP sample. Albeit long-range transport of mineral dust cannot be ruled out, the local dust sources likely dominate as indicated by the concurrent elevated mineral dust and sea salt concentrations (see Figs. 10c, and C1 in the Appendix). The local dust sources can include re-suspended dust previously deposited at the ocean surface (Cornwell et al., 2020), aerosolization of muddy water surrounding the island, or wind-blown dust from the Novaya Zemlya coast due to high wind speed. In summary, differences in aerosol concentrations and the different air parcel origin led to a higher INP concentration during high winds from a southeasterly direction. The variation in strength of local island or ocean sources, as well as long-range transport of INP from the Siberian coast, could explain the difference in NINP for the two periods.
This study reports summertime observations of NINP over the Barents, Kara, and Laptev Seas in the Eurasian Arctic from August to September 2021. A combination of online and offline INP measurement techniques were deployed to cover a broad temperature range of immersion freezing temperatures from 0 to −34 °C and to investigate the spatiotemporal variability of INPs of different size ranges.
Atmospheric NINP in the summer Eurasian-Arctic was observed to be up to 2 orders of magnitude lower than in mid-latitudes, with concentrations varying by up to 3 orders of magnitude at individual freezing temperatures between −5 to −30 °C, and up to 4 orders of magnitude at −34 °C. In the open ocean, MIZ and ice packs consistently lower NINP were observed compared to measurements close to coastal Arctic sites, particularly for temperatures below −15 °C, indicating that the terrestrial aerosols significantly influence NINP in the Arctic region. However, if NINP are compared to year-around datasets from coastal Arctic locations in Wex et al. (2019), a similar range of concentrations is observed, pointing to a similar interseasonal, distance to land dependent spatial, and wind direction related quotidian variability in NINP. The influence of terrestrial sources for the current observations is further supported by observations of occasional spikes in NINP when the ship was close to Arctic islands or archipelagos, while lower NINP were recorded when the ship was within the packed ice. The observed dependence of NINP on sea ice cover and proximity to snow-free land is consistent with previous studies in the Arctic Ocean around Svalbard (Hartmann et al., 2021). Specifically, the activated INP fraction at MIZ and ice-pack is notably higher compared to that in the open ocean, particularly towards warmer temperatures. suggesting a higher relative abundance of biogenic INP. For additional confirmation, environmental analyses of high- and low-NINP samples reveal that less sea ice cover, higher wind speed, and proximity to terrestrial INP sources are key factors related to higher NINP. Nevertheless, long-range transport of air parcels from the west Siberian coast to the Barents Sea could also have contributed to an elevation in NINP. The summertime NINP reported here, driven by local marine and terrestrial emissions, represents a distinct phase in the Arctic's seasonal aerosol cycle. During the preceding late winter and spring, the Arctic atmosphere is characterized by “Arctic Haze”, where long-range transport from mid-latitudes delivers a high burden of mineral dust and anthropogenic particles (Rinaldi et al., 2025; Schmale et al., 2021). This springtime influx provides a relatively consistent background of efficient mineral INPs, particularly at °C (Rinaldi et al., 2025; Wex et al., 2019). As the season progresses into summer, the contraction of the polar vortex and increased wet scavenging reduce the influence of long-range transport (Schmale et al., 2021). In this regime, the INP population shifts toward regionally sourced, highly temperature-sensitive biogenic and terrestrial sources enabled by the retreating sea ice and snow-free land. Understanding this transition is increasingly critical, as the Arctic continues to warm and sea-ice duration decreases, the window for local biogenic and terrestrial INP emissions is expected to expand, potentially shifting the timing and phase of Arctic mixed-phase clouds over a larger portion of the annual cycle.
The accelerated warming in the future Arctic is expected to reduce sea ice cover, increase surface wind speeds, and enhance permafrost thawing, all of which may augment INP emissions and lead to shifts in MPC glaciation temperatures. To better assess the resulting impacts on Arctic sea–aerosol–cloud–climate interactions, future research should prioritize long-term INP monitoring and improved vertical profiling of INP concentrations across different atmospheric layers. Such efforts will be essential for capturing seasonal transitions, identifying persistent versus episodic sources, and constraining cloud microphysical responses to evolving aerosol regimes in a rapidly changing Arctic.
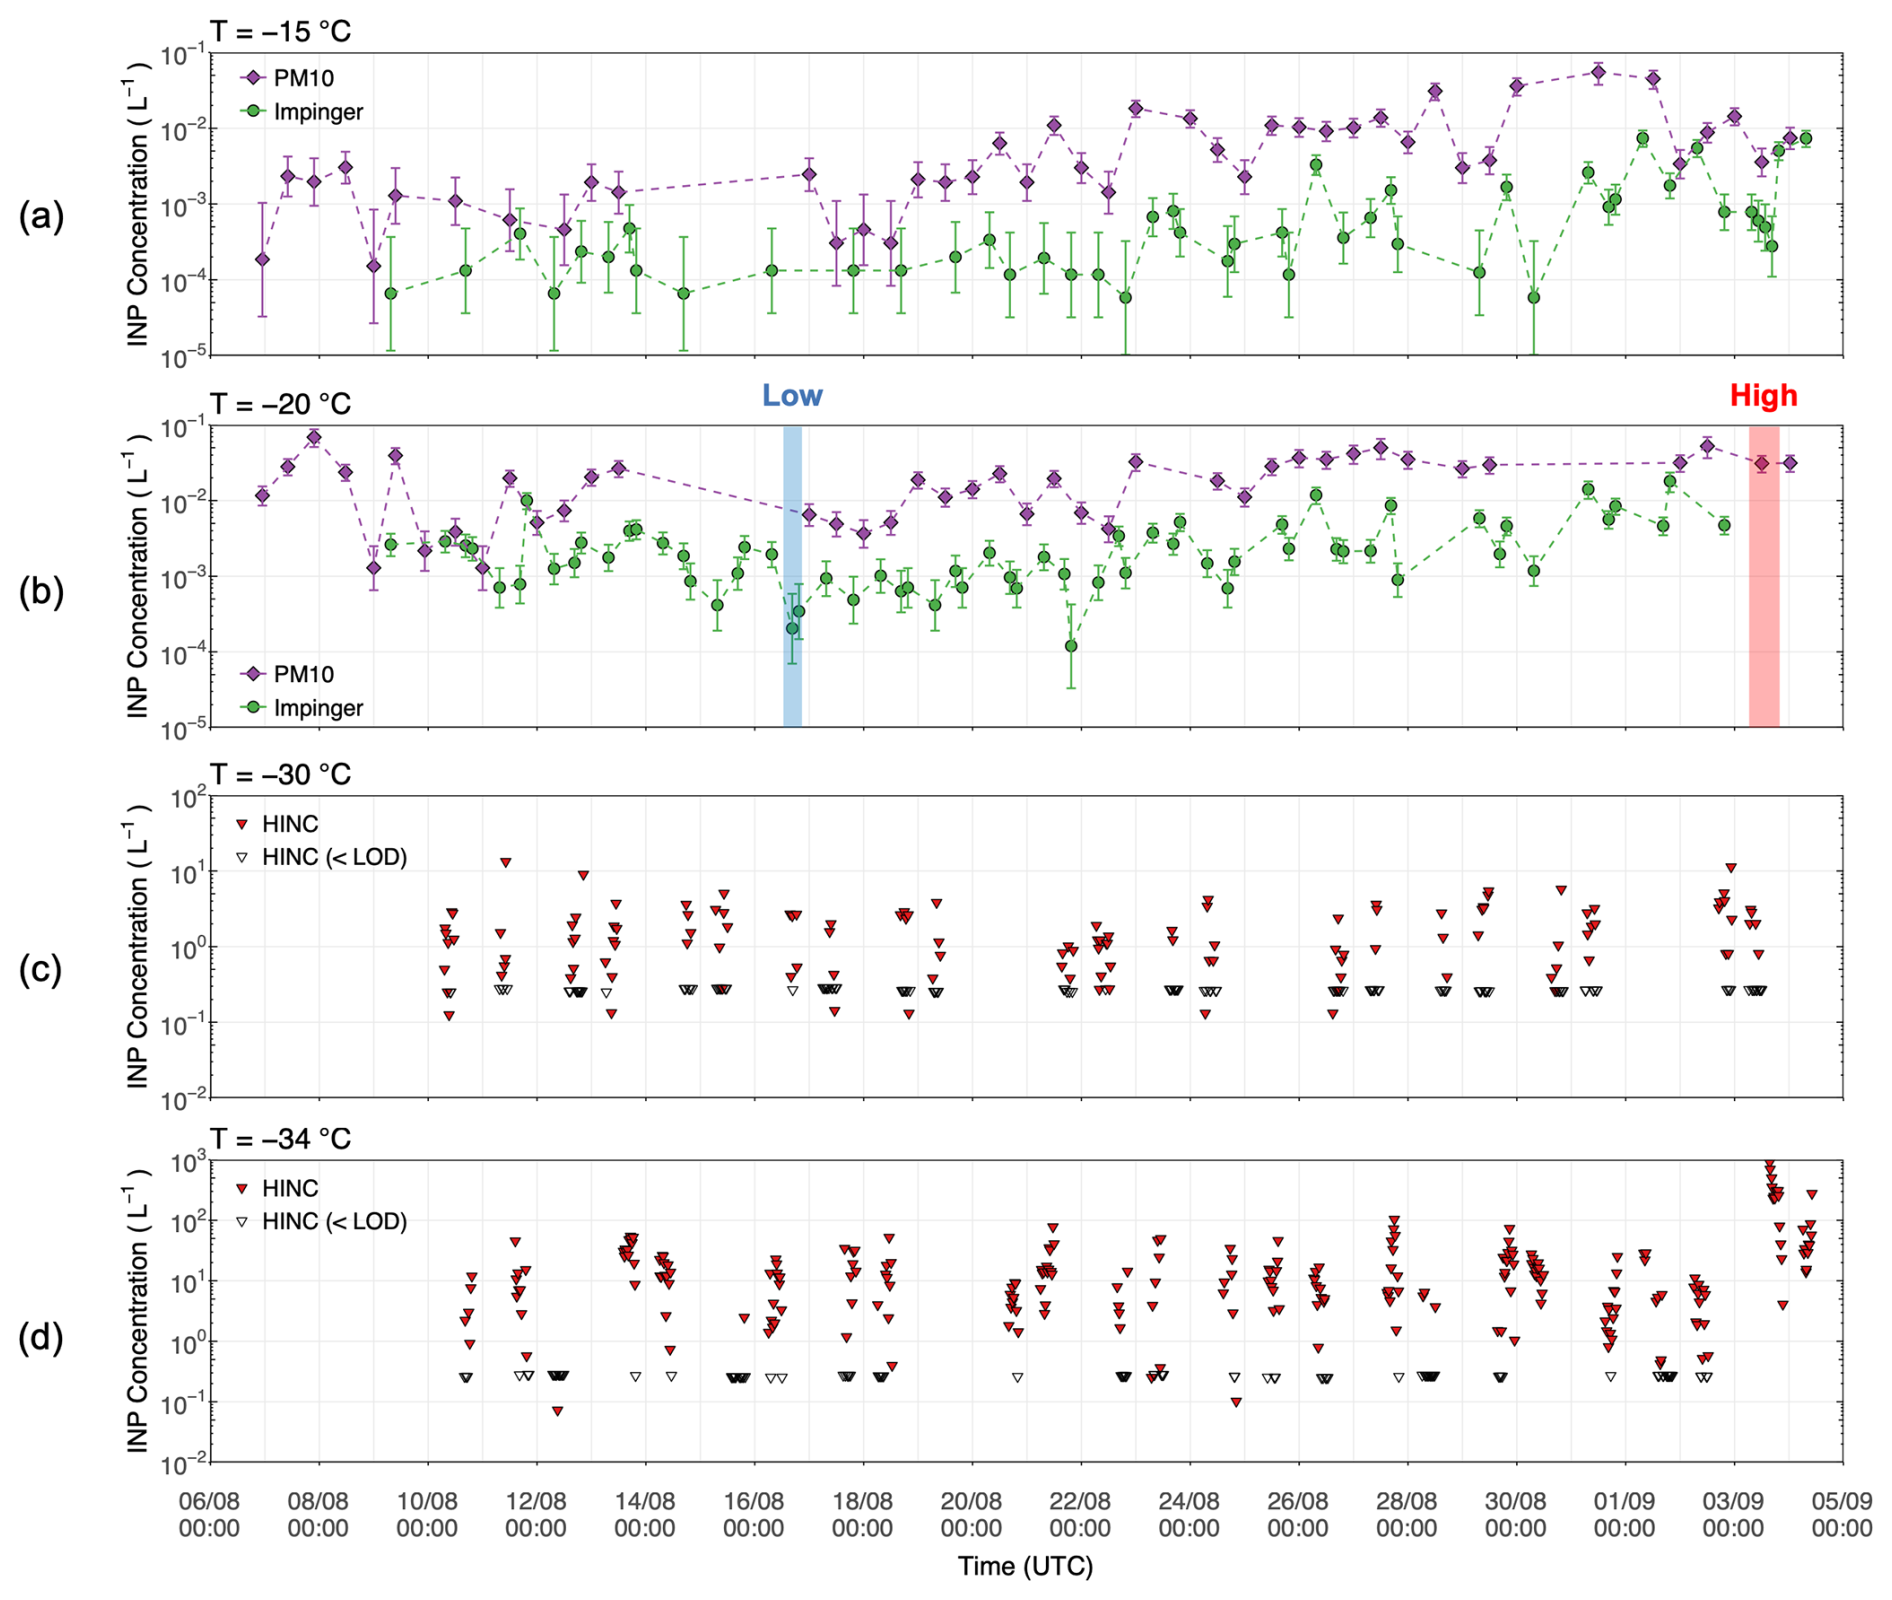
Figure A1NINP time series from 3 h impinger samples, 12 h PM10 filter samples and HINC measurements from 6 August to 4 September 2021 at temperatures of: (a) −15; (b) −20; (c) −30 and (d) −34 °C (note different y axis scale). Measurements below the LOD are not shown in (a) and (b) but are displayed in hollow triangles in (c) and (d). Rectangular boxes mark the time windows for selected low and high NINP cases.
Table B1Pearson correlation coefficients (r) calculated between NINP (from PM10 filters) at selected freezing temperatures and concentrations of different particle size-resolved parameters derived from SMPS and APS measurements. n is the number concentration and S the total surface area, separated for particles larger than 0.5 µm or smaller than 0.5 µm. r values in bold text represents results with statistical significance (p<0.05). r values with * denote moderate correlations (), and with indicate strong correlations (). Statistical significant r values (p<0.05) are also displayed in Fig. 3.

Table B2Pearson correlation coefficients (r) calculated between NINP at selected freezing temperatures and concentrations of elemental compositions indicating sea salt, dust, and marine biological sources were measured using ICP-OES. r values in bold represent results with statistical significance (p<0.05). r values with * denote moderate correlations (), and with indicate strong correlations (). Statistical significant r values (p<0.05) are also displayed in Fig. 4.
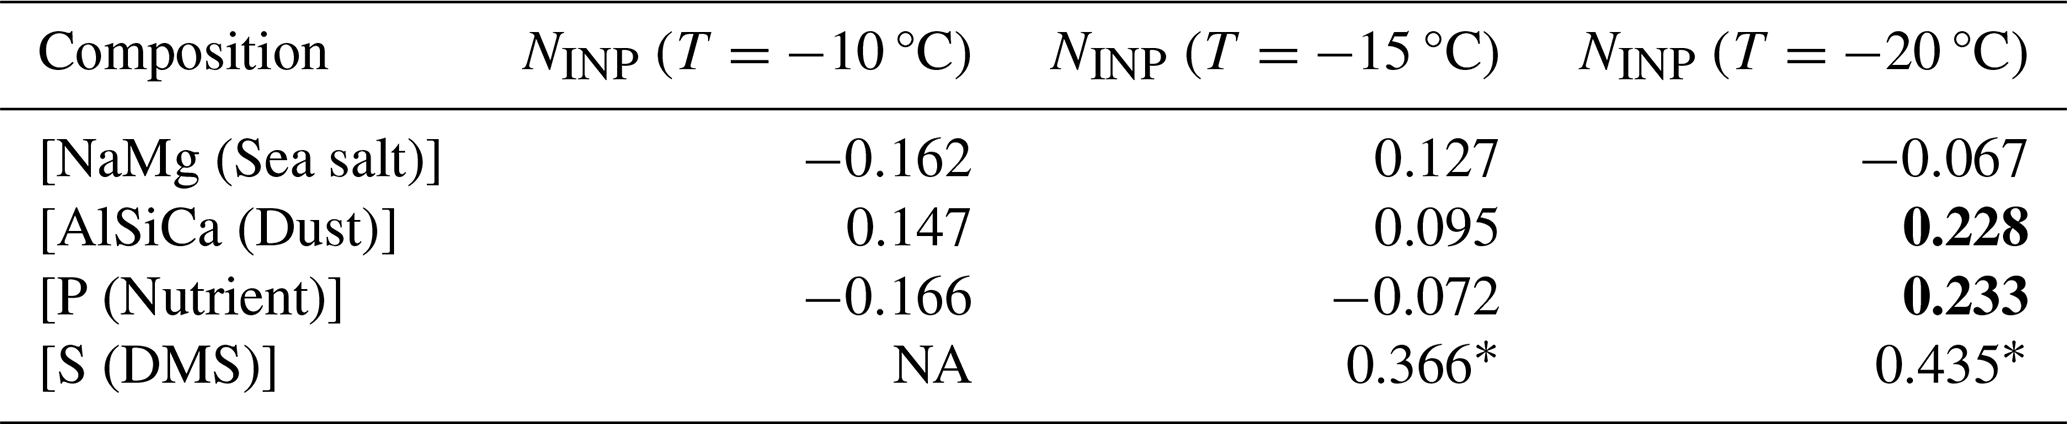
Table B3Pearson correlation coefficients (r) calculated between NINP at selected freezing temperatures and the percentage of time that 2 d backward trajectories have spent over the ocean, land, MIZ, and ice pack. r values in bold represent results with statistical significance (p<0.05). r values with * denote moderate correlations (), and with indicate strong correlations ().

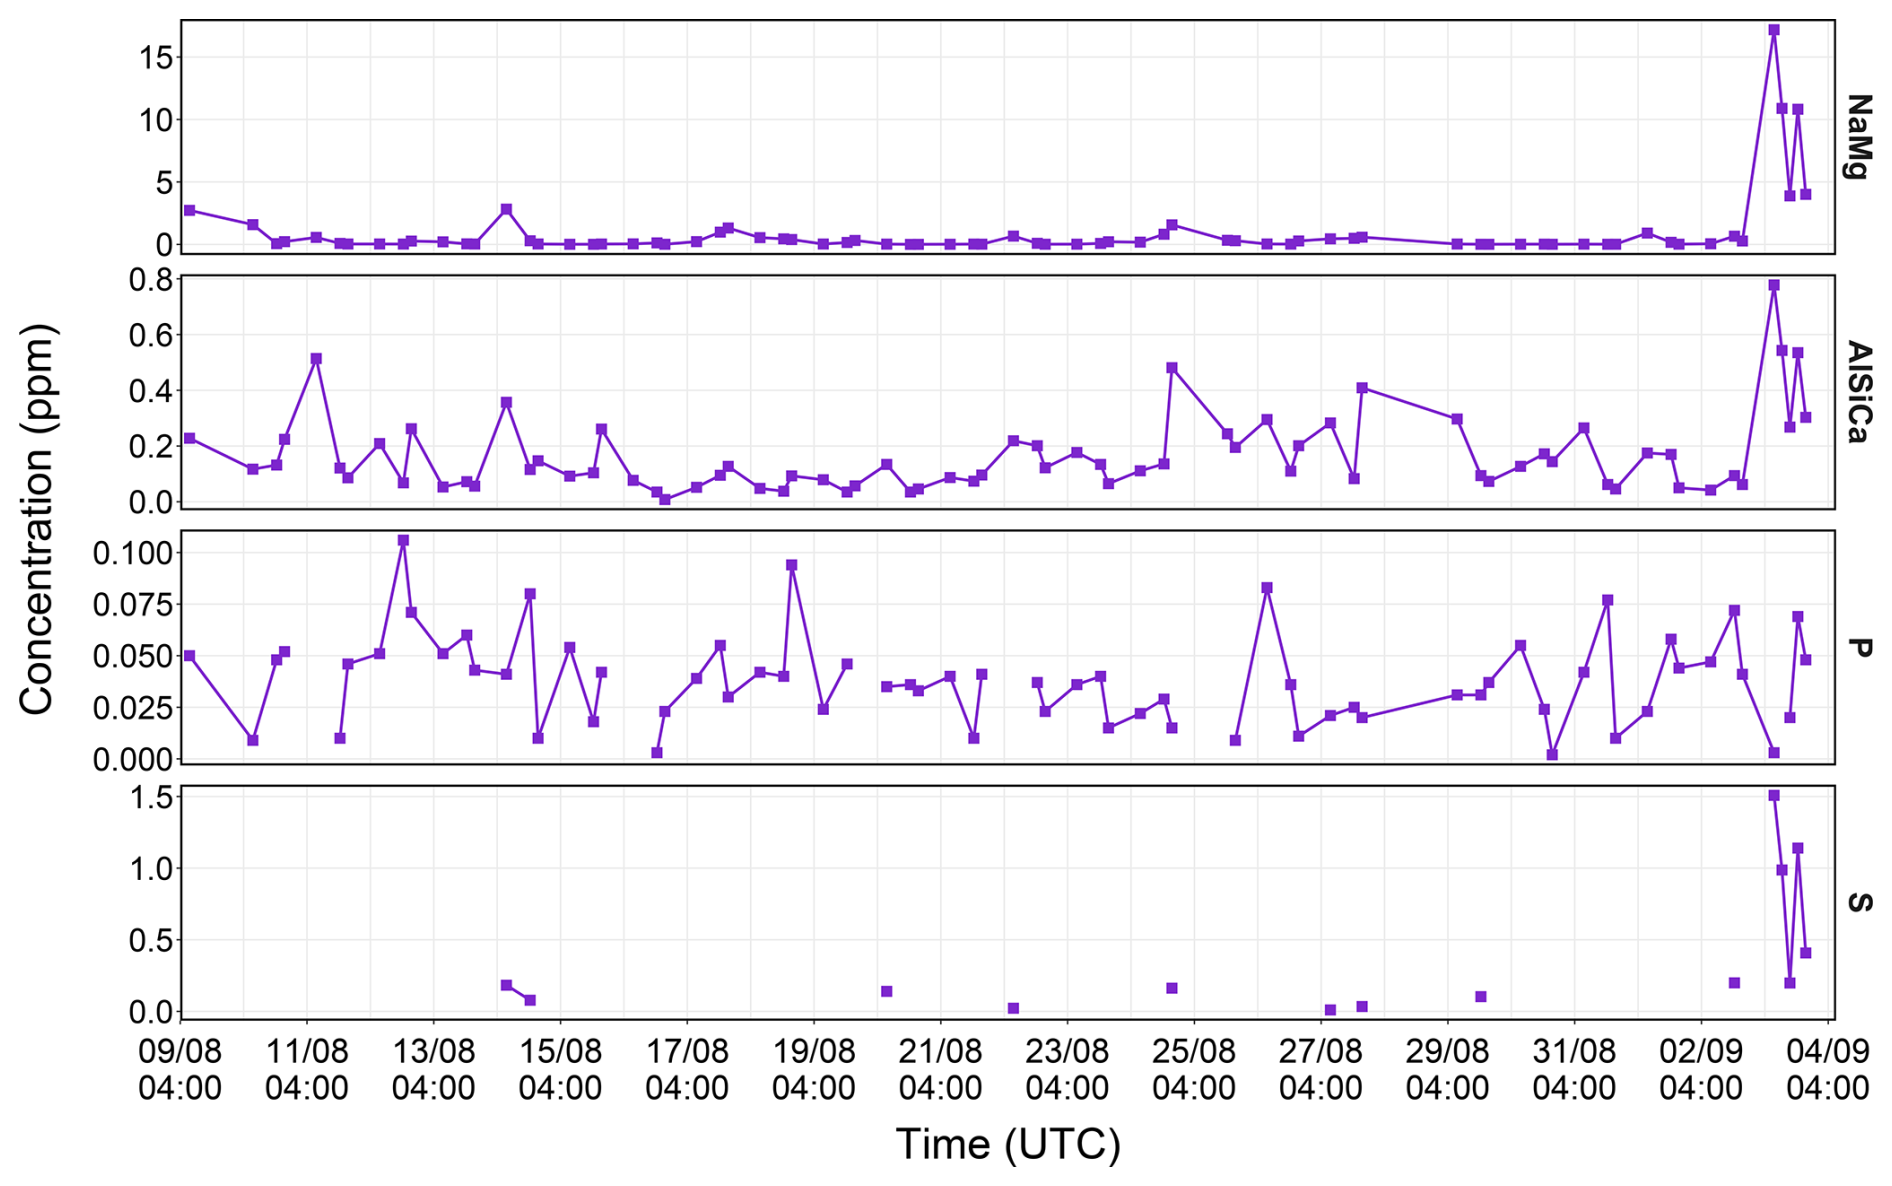
Figure C1Time series of concentrations of selected elemental species (from top to bottom panels: Na and Mg (sea salt), AlSiCa (dust), P and S) measured from impinger samples using ICP-OES. Only results above the LOD are shown.
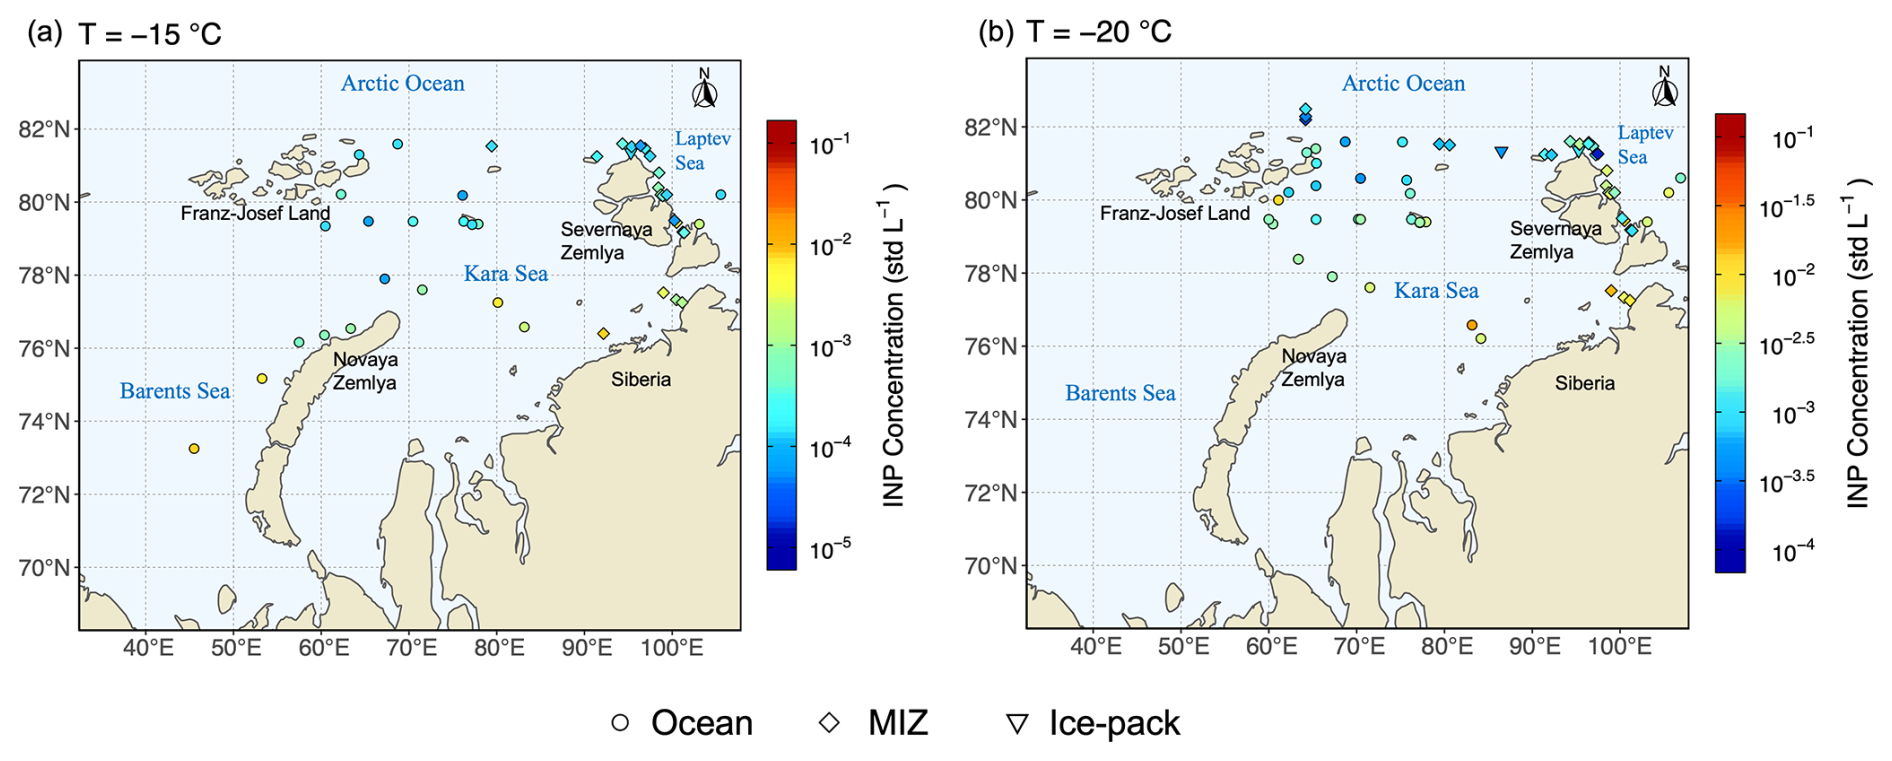
Figure D1Geographical variability of INP concentrations during the Arctic Century Expedition at (a) °C and (b) °C measured with impinger samples and DRINCZ. Different shapes represent the categories of sea ice extent when the measurements were taken based on the daily observation of sea ice concentrations.
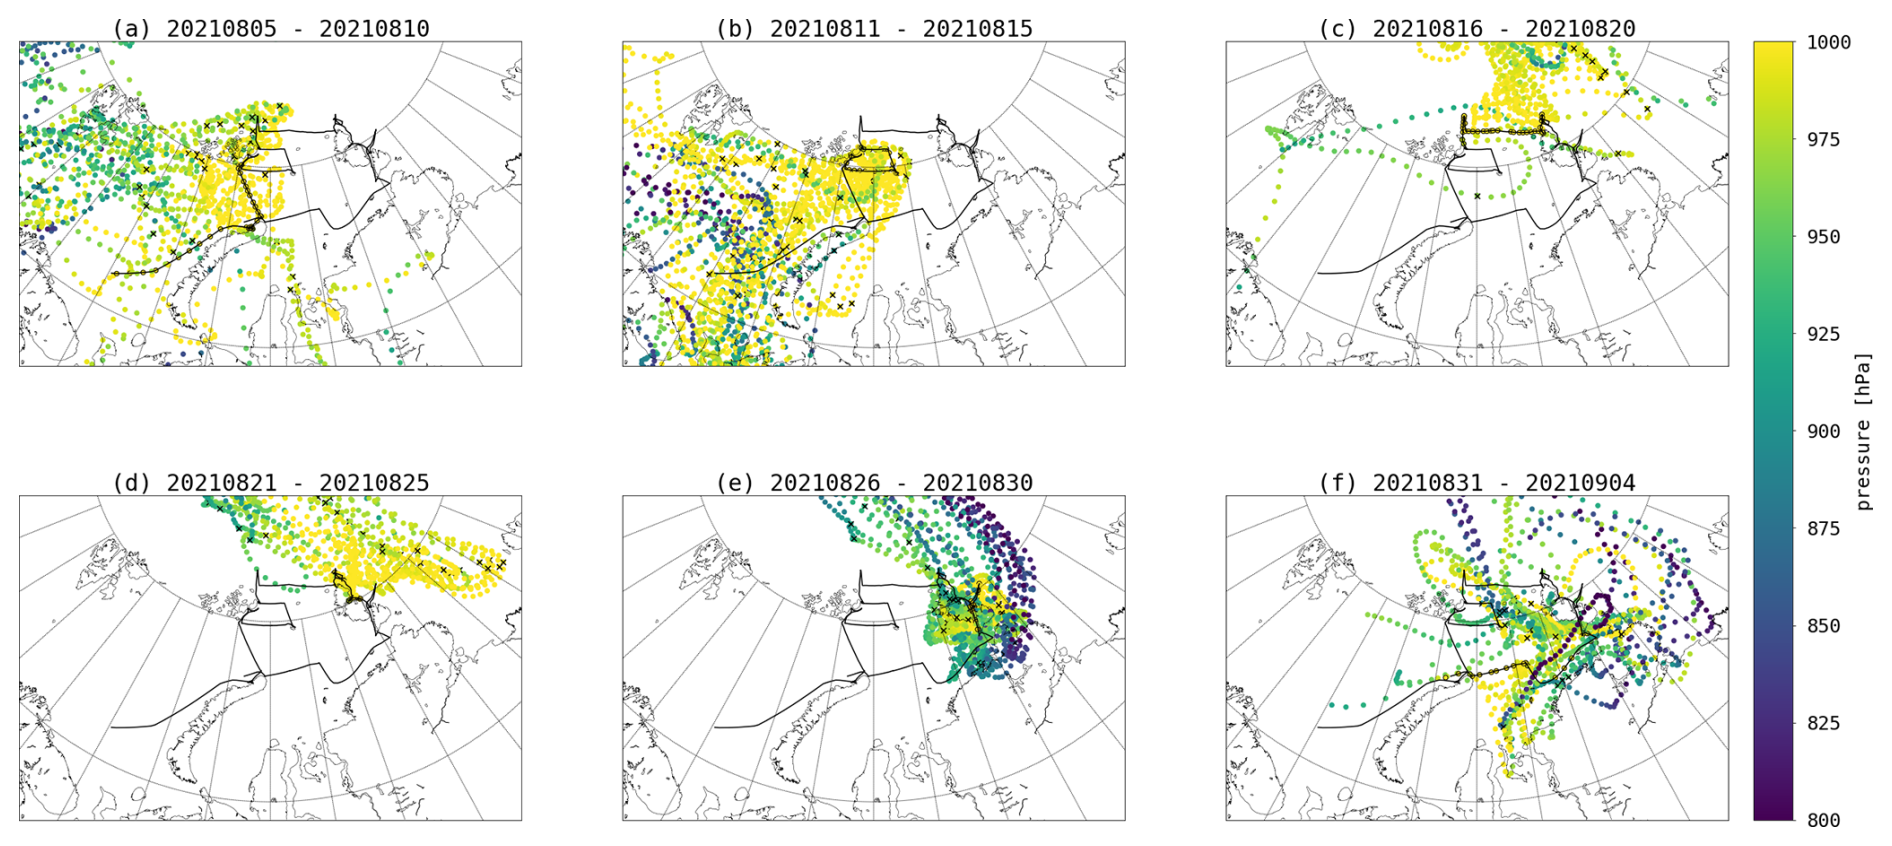
Figure E1Spatial distribution of atmospheric pressure (hPa) along the 7 d backward trajectories for the Arctic Century 2021 campaign, illustrating the horizontal and vertical pathways of sampled air masses.
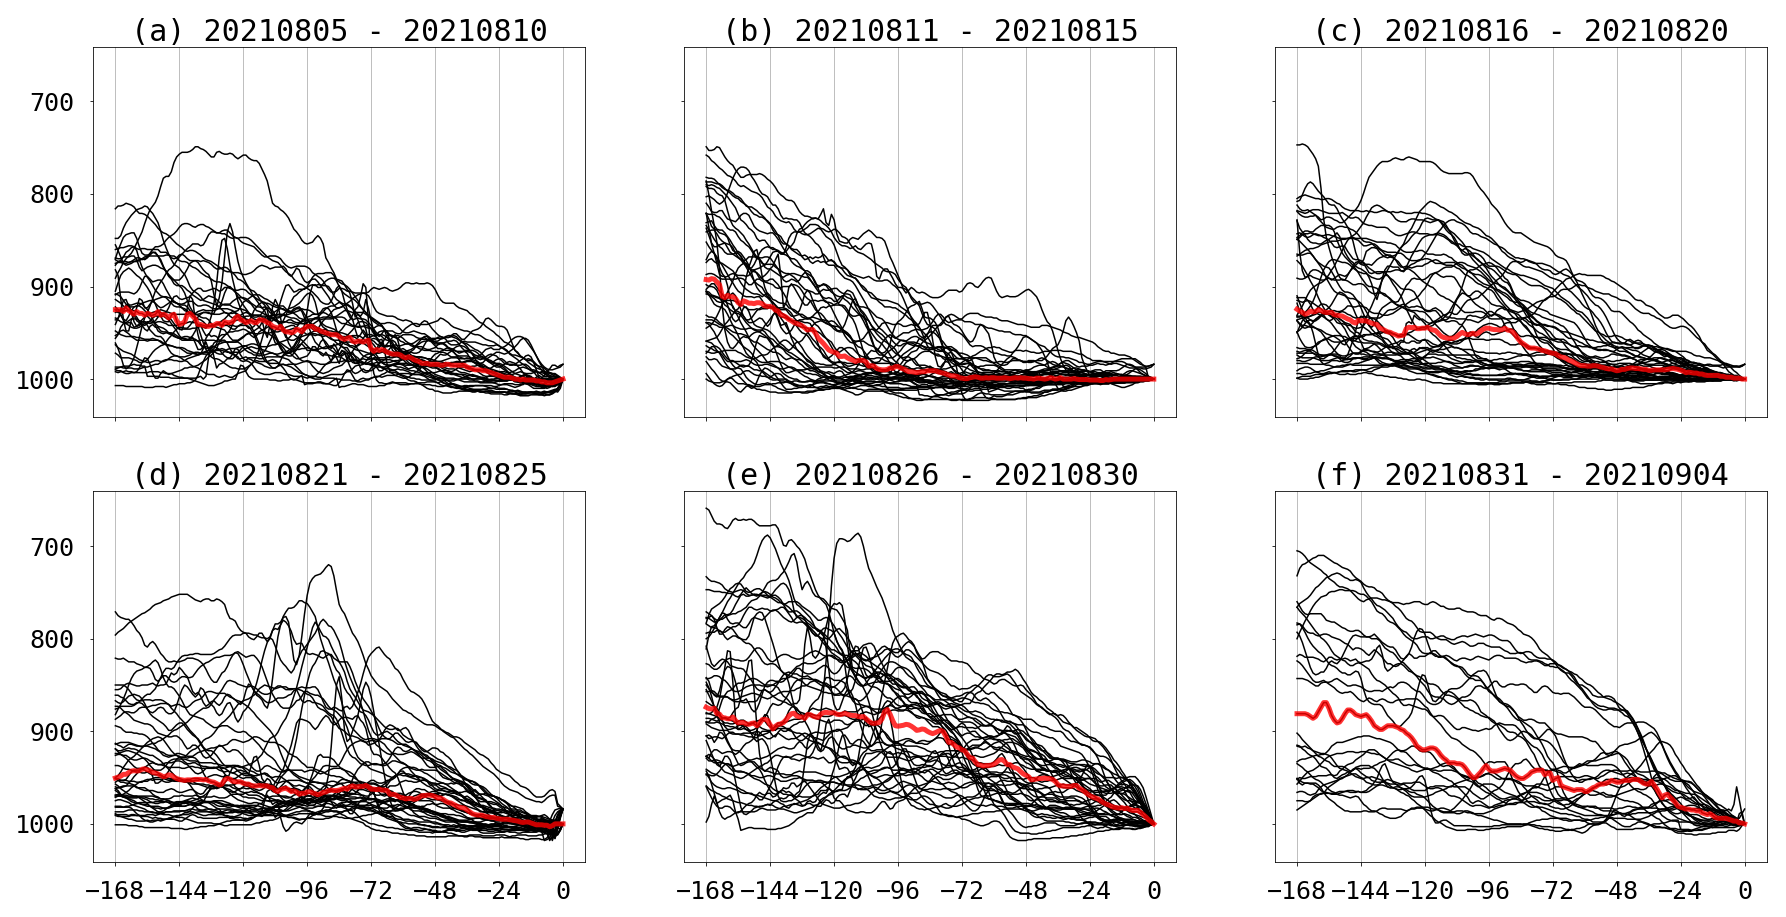
Figure E2Vertical profiles of the 7 d backward trajectories showing air parcel pressure levels relative to the planetary boundary layer height to characterize surface coupling during transport.
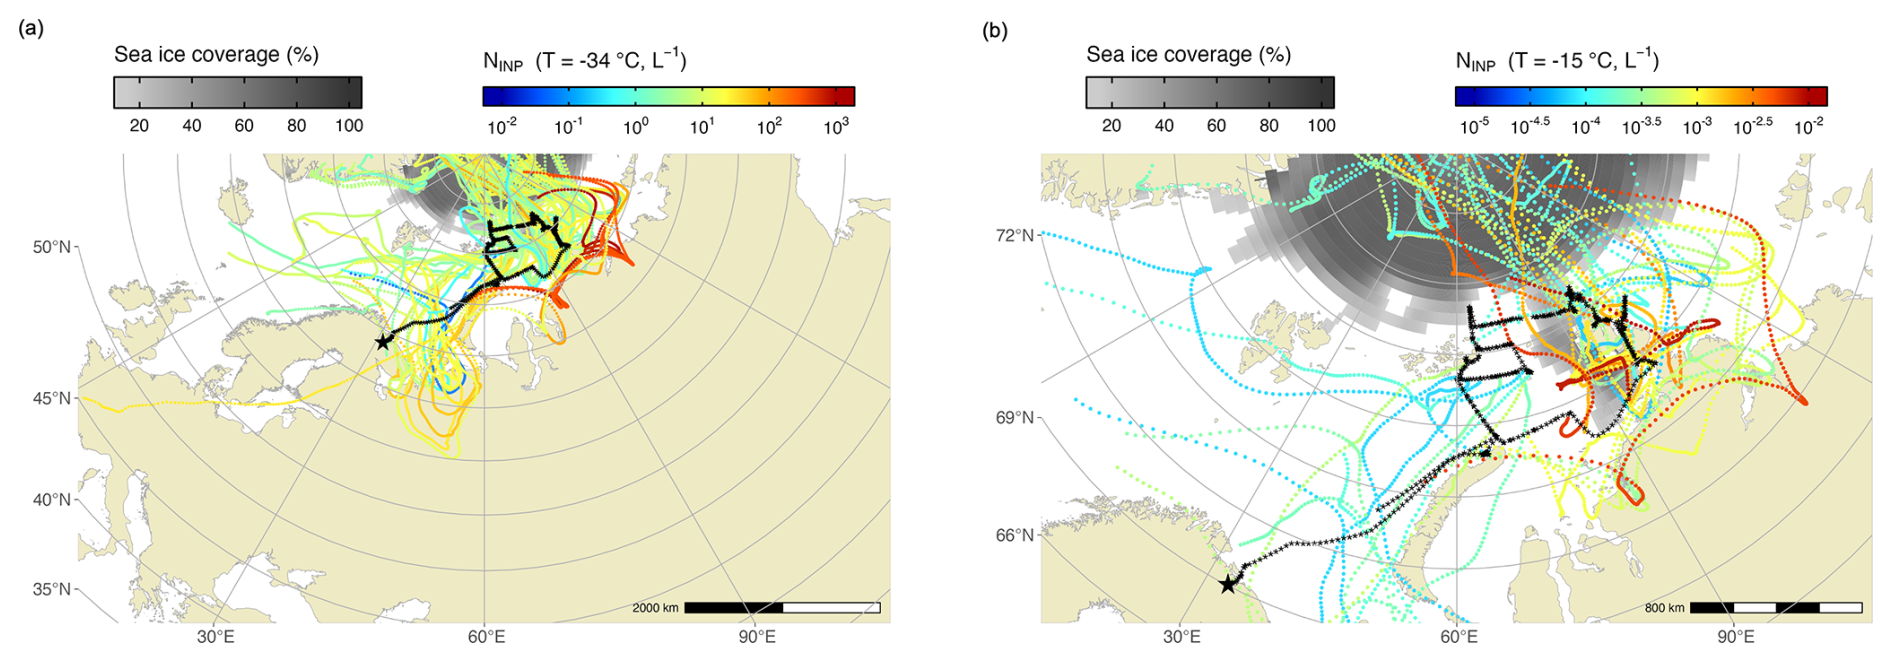
Figure E37 d backward trajectories starting from the ship location at sea level. A trajectory was launched every hour during each INP sampling period. Points along the trajectories are marked at hourly intervals. The black asterisks represent the ship's track and the starting point of the back trajectories. The large black star marks the starting and ending point of the expedition (i.e., the port of Murmansk). The trajectories are colored by the NINP concentrations at (a) °C and (b) °C (note the different color scales for different temperatures). The sea ice coverage is shown in grayscale.
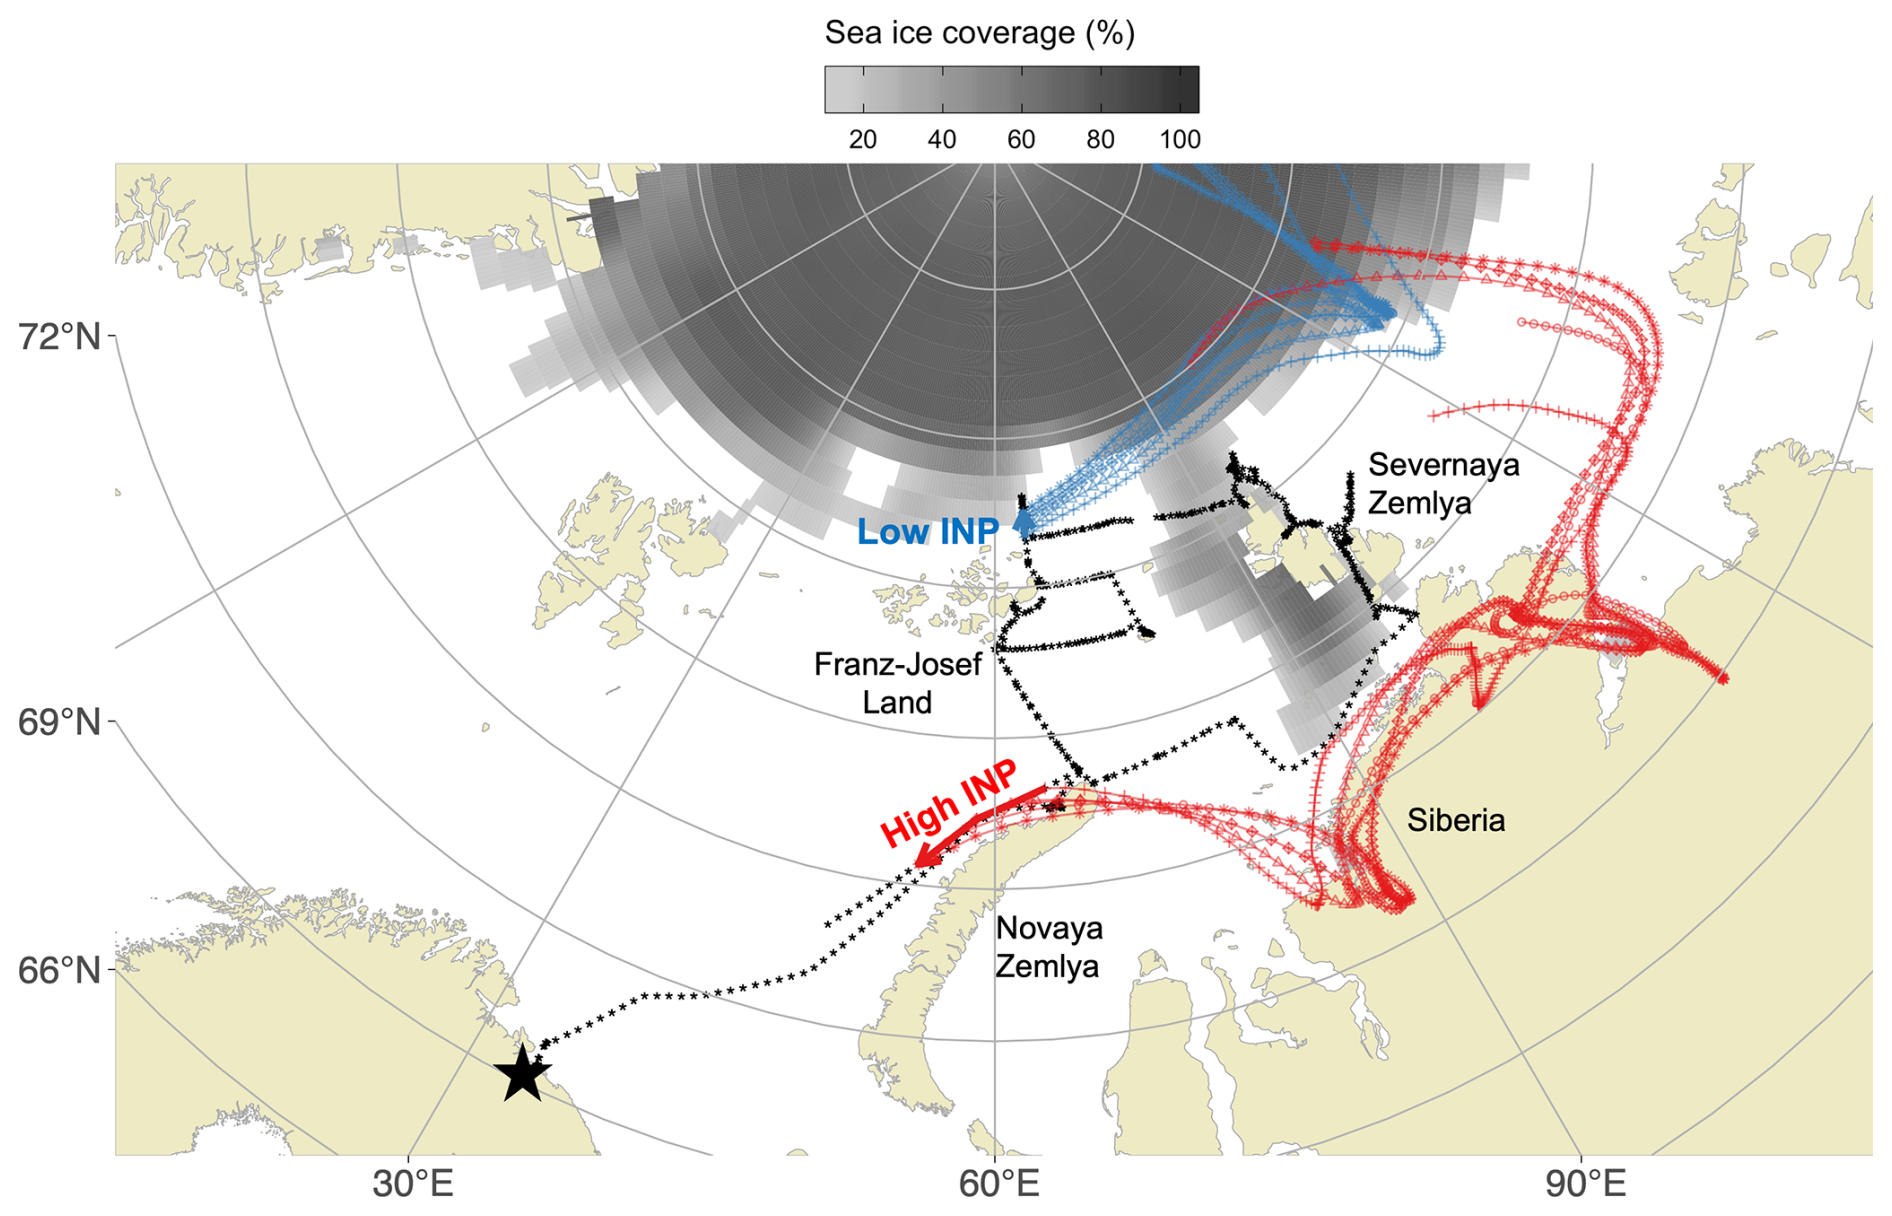
Figure E47 d backward trajectories for periods of low (blue) and high (red) NINP cases ( °C) during 12:00–20:00 UTC on 16 August 2021 and 07:00–20:00 UTC on 3 September 2021, respectively. The trajectories start from the ship's location at the sea level (0 m) and are launched hourly, with the points along the trajectory indicating hourly intervals. The solid thick arrows indicate the ship's track during the selected period. The black asterisks represent the ship's track, and the large black star marks the port of Murmansk, the start and end point of the expedition.
The data presented in this study are available at https://doi.org/10.3929/ethz-b-000717424 (Li et al., 2026).
GL performed sample processing and data analysis, produced figures, interpreted results, and wrote the original manuscript draft. GL and AW participated in the campaign and conducted in situ sampling and measurements. IT provided the LAGRANTO backward trajectory data. AW, IT, and UL provided feedback on data interpretation. ZAK supervised the project, obtained funding, and was involved in experiment planning, data interpretation, and manuscript writing. All authors reviewed the manuscript.
The contact author has declared that none of the authors has any competing interests.
Publisher's note: Copernicus Publications remains neutral with regard to jurisdictional claims made in the text, published maps, institutional affiliations, or any other geographical representation in this paper. The authors bear the ultimate responsibility for providing appropriate place names. Views expressed in the text are those of the authors and do not necessarily reflect the views of the publisher.
This research used samples and/or data provided by the Arctic Century Expedition, a joint initiative led by the Swiss Polar Institute (SPI), the Antarctic and Arctic Research Institute (AARI) and GEOMAR Helmholtz Centre for Ocean Research Kiel (GEOMAR) and funded by the Swiss Polar Foundation. GL and ZAK acknowledge that this project has been made possible by a grant from the Swiss Polar Institute, Dr. Frederik Paulsen. We acknowledge all those involved in the fieldwork associated with the Arctic Century Expedition, including technical support from Dr. Michael Rösch. We would like to thank Dr. Xu Fang from ETH for providing the ICP-OES instrument, with assistance on sample preparation and measurements. We thank Franziska Aemisegger for the calculation of the backward trajectories.
This research has been supported by the Swiss Polar Institute (grant no. Arctic Century Expedition), the GEOMAR Helmholtz-Zentrum für Ozeanforschung Kiel (grant no. Arctic Century Expedition). This project has received funding from the Horizon Europe Program under Grant Agreement no. 101137680 via project CERTAINTY (Cloud aERosol inTeractions & their impActs IN The earth sYstem). This work has received funding from the Swiss State Secretariat for Education, Research and Innovation (SERI).
This paper was edited by Bingbing Wang and reviewed by four anonymous referees.
Ahmed, R., Prowse, T., Dibike, Y., Bonsal, B., and O’Neil, H.: Recent Trends in Freshwater Influx to the Arctic Ocean from Four Major Arctic-Draining Rivers, Water-Sui, 12, https://doi.org/10.3390/w12041189, 2020. a
Aksenov, Y., Popova, E. E., Yool, A., Nurser, A. G., Williams, T. D., Bertino, L., and Bergh, J.: On the future navigability of Arctic sea routes: High-resolution projections of the Arctic Ocean and sea ice, Mar. Policy, 75, 300–317, https://doi.org/10.1016/j.marpol.2015.12.027, 2017. a
Ardyna, M., Mundy, C. J., Mayot, N., Matthes, L. C., Oziel, L., Horvat, C., Leu, E., Assmy, P., Hill, V., Matrai, P. A., Gale, M., Melnikov, I. A., and Arrigo, K. R.: Under-Ice Phytoplankton Blooms: Shedding Light on the “Invisible” Part of Arctic Primary Production, Frontiers in Marine Science, 7, https://doi.org/10.3389/fmars.2020.608032, 2020. a
Barry, K. R., Hill, T. C. J., Moore, K. A., Douglas, T. A., Kreidenweis, S. M., DeMott, P. J., and Creamean, J. M.: Persistence and Potential Atmospheric Ramifications of Ice-Nucleating Particles Released from Thawing Permafrost, Environ. Sci. Technol., 57, 3505–3515, https://doi.org/10.1021/acs.est.2c06530, 2023. a
Barry, K. R., Hill, T. C. J., Kreidenweis, S. M., DeMott, P. J., Tobo, Y., and Creamean, J. M.: Bioaerosols as indicators of central Arctic ice nucleating particle sources, Atmos. Chem. Phys., 25, 11919–11933, https://doi.org/10.5194/acp-25-11919-2025, 2025. a, b, c, d
Beall, C. M., Lucero, D., Hill, T. C., DeMott, P. J., Stokes, M. D., and Prather, K. A.: Best practices for precipitation sample storage for offline studies of ice nucleation in marine and coastal environments, Atmos. Meas. Tech., 13, 6473–6486, https://doi.org/10.5194/amt-13-6473-2020, 2020. a
Becagli, S., Ghedini, C., Peeters, S., Rottiers, A., Traversi, R., Udisti, R., Chiari, M., Jalba, A., Despiau, S., Dayan, U., and Temara, A.: MBAS (Methylene Blue Active Substances) and LAS (Linear Alkylbenzene Sulphonates) in Mediterranean coastal aerosols: Sources and transport processes, Atmos. Environ., 45, 6788–6801, https://doi.org/10.1016/j.atmosenv.2011.04.041, 2011. a
Becagli, S., Amore, A., Caiazzo, L., Di Iorio, T., di Sarra, A., Lazzara, L., Marchese, C., Meloni, D., Mori, G., Muscari, G., Nuccio, C., Pace, G., Severi, M., and Traversi, R.: Biogenic Aerosol in the Arctic from Eight Years of MSA Data from Ny Ålesund (Svalbard Islands) and Thule (Greenland), Atmosphere-Basel, 10, https://doi.org/10.3390/atmos10070349, 2019. a
Bigg, E. K.: The formation of atmospheric ice crystals by the freezing of droplets, Q. J. Roy. Meteor. Soc., 79, 510–519, https://doi.org/10.1002/qj.49707934207, 1953. a
Bigg, E. K.: Ice forming nuclei in the high Arctic, Tellus B, 48, 223–233, https://doi.org/10.3402/tellusb.v48i2.15888, 1996. a, b, c, d
Bigg, E. K. and Leck, C.: Cloud-active particles over the central Arctic Ocean, J. Geophys. Res.-Atmos., 106, 32155–32166, https://doi.org/10.1029/1999JD901152, 2001. a, b, c, d
Browse, J., Carslaw, K. S., Mann, G. W., Birch, C. E., Arnold, S. R., and Leck, C.: The complex response of Arctic aerosol to sea-ice retreat, Atmos. Chem. Phys., 14, 7543–7557, https://doi.org/10.5194/acp-14-7543-2014, 2014. a
Conen, F., Stopelli, E., and Zimmermann, L.: Clues that decaying leaves enrich Arctic air with ice nucleating particles, Atmos. Environ., 129, 91–94, https://doi.org/10.1016/j.atmosenv.2016.01.027, 2016. a
Cornwell, G. C., Sultana, C. M., Prank, M., Cochran, R. E., Hill, T. C. J., Schill, G. P., DeMott, P. J., Mahowald, N., and Prather, K. A.: Ejection of Dust From the Ocean as a Potential Source of Marine Ice Nucleating Particles, J. Geophys. Res.-Atmos., 125, e2020JD033073, https://doi.org/10.1029/2020JD033073, 2020. a, b
Creamean, J. M., Kirpes, R. M., Pratt, K. A., Spada, N. J., Maahn, M., de Boer, G., Schnell, R. C., and China, S.: Marine and terrestrial influences on ice nucleating particles during continuous springtime measurements in an Arctic oilfield location, Atmos. Chem. Phys., 18, 18023–18042, https://doi.org/10.5194/acp-18-18023-2018, 2018. a, b
Creamean, J. M., Cross, J. N., Pickart, R., McRaven, L., Lin, P., Pacini, A., Hanlon, R., Schmale, D. G., Ceniceros, J., Aydell, T., Colombi, N., Bolger, E., and DeMott, P. J.: Ice nucleating particles carried from below a phytoplankton bloom to the Arctic atmosphere, Geophys. Res. Lett., 46, 8572–8581, https://doi.org/10.1029/2019GL083039, 2019. a, b, c, d, e
Creamean, J. M., Hill, T. C., DeMott, P. J., Uetake, J., Kreidenweis, S., and Douglas, T. A.: Thawing permafrost: an overlooked source of seeds for Arctic cloud formation, Environ. Res. Lett., 15, 084022, https://doi.org/10.1088/1748-9326/ab87d3, 2020. a, b
Creamean, J. M., Barry, K., Hill, T. C., Hume, C., DeMott, P. J., Shupe, M. D., Dahlke, S., Willmes, S., Schmale, J., Beck, I., Hoppe, C. J. M., Fong, A., Chamberlain, E., Bowman, J., Scharien, R., and Persson, O.: Annual cycle observations of aerosols capable of ice formation in central Arctic clouds, Nat. Commun., 13, 3537, https://doi.org/10.1038/s41467-022-31182-x, 2022. a
David, R. O., Cascajo-Castresana, M., Brennan, K. P., Rösch, M., Els, N., Werz, J., Weichlinger, V., Boynton, L. S., Bogler, S., Borduas-Dedekind, N., Marcolli, C., and Kanji, Z. A.: Development of the DRoplet Ice Nuclei Counter Zurich (DRINCZ): validation and application to field-collected snow samples, Atmos. Meas. Tech., 12, 6865–6888, https://doi.org/10.5194/amt-12-6865-2019, 2019. a, b
DeMott, P. J., Prenni, A. J., Liu, X., Kreidenweis, S. M., Petters, M. D., Twohy, C. H., Richardson, M. S., Eidhammer, T., and Rogers, D. C.: Predicting global atmospheric ice nuclei distributions and their impacts on climate, P. Natl. Acad. Sci. USA, 107, 11217–11222, https://doi.org/10.1073/pnas.0910818107, 2010. a
DeMott, P. J., Prenni, A. J., McMeeking, G. R., Sullivan, R. C., Petters, M. D., Tobo, Y., Niemand, M., Möhler, O., Snider, J. R., Wang, Z., and Kreidenweis, S. M.: Integrating laboratory and field data to quantify the immersion freezing ice nucleation activity of mineral dust particles, Atmos. Chem. Phys., 15, 393–409, https://doi.org/10.5194/acp-15-393-2015, 2015. a, b
DeMott, P. J., Hill, T. C. J., McCluskey, C. S., Prather, K. A., Collins, D. B., Sullivan, R. C., Ruppel, M. J., Mason, R. H., Irish, V. E., Lee, T., Hwang, C. Y., Rhee, T. S., Snider, J. R., McMeeking, G. R., Dhaniyala, S., Lewis, E. R., Wentzell, J. J. B., Abbatt, J., Lee, C., Sultana, C. M., Ault, A. P., Axson, J. L., Martinez, M. D., Venero, I., Santos-Figueroa, G., Stokes, M. D., Deane, G. B., Mayol-Bracero, O. L., Grassian, V. H., Bertram, T. H., Bertram, A. K., Moffett, B. F., and Franc, G. D.: Sea spray aerosol as a unique source of ice nucleating particles, P. Natl. Acad. Sci. USA, 113, 5797–5803, https://doi.org/10.1073/pnas.1514034112, 2016. a, b, c, d, e
Forster, P., Storelvmo, T., Armour, K., Collins, W., Dufresne, J.-L., Frame, D., Lunt, D., Mauritsen, T., Palmer, M., Watanabe, M., Wild, M., and Zhang, H.: The Earth’s energy budget, climate feedbacks, and climate sensitivity, Climate Change 2021: The Physical Science Basis. Contribution of Working Group I to the Sixth Assessment Report of the Intergovernmental Panel on Climate Change, https://doi.org/10.25455/wgtn.16869671, 2021. a
Gabric, A., Matrai, P., Jones, G., and Middleton, J.: The Nexus between Sea Ice and Polar Emissions of Marine Biogenic Aerosols, B. Am. Meteorol. Soc., 99, 61–81, https://doi.org/10.1175/BAMS-D-16-0254.1, 2018. a, b, c
Gabric, A. J., Qu, B., Matrai, P., and Hirst, A. C.: The simulated response of dimethylsulfide production in the Arctic Ocean to global warming, Tellus B, 57, 391–403, https://doi.org/10.3402/tellusb.v57i5.16564, 2005. a
Galindo, V., Levasseur, M., Mundy, C. J., Gosselin, M., Scarratt, M., Papakyriakou, T., Stefels, J., Gale, M. A., Éric Tremblay, J., and Lizotte, M.: Contrasted sensitivity of DMSP production to high light exposure in two Arctic under-ice blooms, J. Exp. Mar. Biol. Ecol., 475, 38–48, https://doi.org/10.1016/j.jembe.2015.11.009, 2016. a
Gilli, R. S., Karlen, C., Weber, M., Rüegg, J., Barmettler, K., Biester, H., Boivin, P., and Kretzschmar, R.: Speciation and Mobility of Mercury in Soils Contaminated by Legacy Emissions from a Chemical Factory in the Rhône Valley in Canton of Valais, Switzerland, Soil Systems, 2, https://doi.org/10.3390/soilsystems2030044, 2018. a
Hartmann, M., Adachi, K., Eppers, O., Haas, C., Herber, A., Holzinger, R., Hünerbein, A., Jäkel, E., Jentzsch, C., van Pinxteren, M., Wex, H., Willmes, S., and Stratmann, F.: Wintertime airborne measurements of ice nucleating particles in the high Arctic: A hint to a marine, biogenic source for ice nucleating particles, Geophys. Res. Lett., 47, e2020GL087770, https://doi.org/10.1029/2020GL087770, 2020. a
Hartmann, M., Gong, X., Kecorius, S., van Pinxteren, M., Vogl, T., Welti, A., Wex, H., Zeppenfeld, S., Herrmann, H., Wiedensohler, A., and Stratmann, F.: Terrestrial or marine – indications towards the origin of ice-nucleating particles during melt season in the European Arctic up to 83.7° N, Atmos. Chem. Phys., 21, 11613–11636, https://doi.org/10.5194/acp-21-11613-2021, 2021. a, b, c, d, e, f, g, h
Hersbach, H., Bell, B., Berrisford, P., Hirahara, S., Horányi, A., Muñoz-Sabater, J., Nicolas, J., Peubey, C., Radu, R., Schepers, D., Simmons, A., Soci, C., Abdalla, S., Abellan, X., Balsamo, G., Bechtold, P., Biavati, G., Bidlot, J., Bonavita, M., De Chiara, G., Dahlgren, P., Dee, D., Diamantakis, M., Dragani, R., Flemming, J., Forbes, R., Fuentes, M., Geer, A., Haimberger, L., Healy, S., Hogan, R. J., Hólm, E., Janisková, M., Keeley, S., Laloyaux, P., Lopez, P., Lupu, C., Radnoti, G., de Rosnay, P., Rozum, I., Vamborg, F., Villaume, S., and Thépaut, J.-N.: The ERA5 global reanalysis, Q. J. Roy. Meteor. Soc., 146, 1999–2049, https://doi.org/10.1002/qj.3803, 2020. a
Hiranuma, N., Brooks, S. D., Moffet, R. C., Glen, A., Laskin, A., Gilles, M. K., Liu, P., Macdonald, A. M., Strapp, J. W., and McFarquhar, G. M.: Chemical characterization of individual particles and residuals of cloud droplets and ice crystals collected on board research aircraft in the ISDAC 2008 study, J. Geophys. Res.-Atmos., 118, 6564–6579, https://doi.org/10.1002/jgrd.50484, 2013. a
Hoose, C. and Möhler, O.: Heterogeneous ice nucleation on atmospheric aerosols: a review of results from laboratory experiments, Atmos. Chem. Phys., 12, 9817–9854, https://doi.org/10.5194/acp-12-9817-2012, 2012. a
Hultman, J., Waldrop, M. P., Mackelprang, R., David, M. M., McFarland, J., Blazewicz, S. J., Harden, J., Turetsky, M. R., McGuire, A. D., Shah, M. B., VerBerkmoes, N. C., Lee, L. H., Mavrommatis, K., and Jansson, J. K.: Multi-omics of permafrost, active layer and thermokarst bog soil microbiomes, Nature, 521, 208–212, https://doi.org/10.1038/nature14238, 2015. a
Ickes, L., Porter, G. C. E., Wagner, R., Adams, M. P., Bierbauer, S., Bertram, A. K., Bilde, M., Christiansen, S., Ekman, A. M. L., Gorokhova, E., Höhler, K., Kiselev, A. A., Leck, C., Möhler, O., Murray, B. J., Schiebel, T., Ullrich, R., and Salter, M. E.: The ice-nucleating activity of Arctic sea surface microlayer samples and marine algal cultures, Atmos. Chem. Phys., 20, 11089–11117, https://doi.org/10.5194/acp-20-11089-2020, 2020. a
Inoue, J., Tobo, Y., Taketani, F., and Sato, K.: Oceanic Supply of Ice-Nucleating Particles and Its Effect on Ice Cloud Formation: A Case Study in the Arctic Ocean During a Cold-Air Outbreak in Early Winter, Geophys. Res. Lett., 48, e2021GL094646, https://doi.org/10.1029/2021GL094646, 2021. a
Intrieri, J. M., Fairall, C. W., Shupe, M. D., Persson, P. O. G., Andreas, E. L., Guest, P. S., and Moritz, R. E.: An annual cycle of Arctic surface cloud forcing at SHEBA, J. Geophys. Res.-Oceans, 107, SHE 13-1–SHE 13-14, https://doi.org/10.1029/2000JC000439, 2002. a
Irish, V. E., Hanna, S. J., Willis, M. D., China, S., Thomas, J. L., Wentzell, J. J. B., Cirisan, A., Si, M., Leaitch, W. R., Murphy, J. G., Abbatt, J. P. D., Laskin, A., Girard, E., and Bertram, A. K.: Ice nucleating particles in the marine boundary layer in the Canadian Arctic during summer 2014, Atmos. Chem. Phys., 19, 1027–1039, https://doi.org/10.5194/acp-19-1027-2019, 2019. a
Juhls, B., Overduin, P. P., Hölemann, J., Hieronymi, M., Matsuoka, A., Heim, B., and Fischer, J.: Dissolved organic matter at the fluvial–marine transition in the Laptev Sea using in situ data and ocean colour remote sensing, Biogeosciences, 16, 2693–2713, https://doi.org/10.5194/bg-16-2693-2019, 2019. a
Kirpes, R. M., Bonanno, D., May, N. W., Fraund, M., Barget, A. J., Moffet, R. C., Ault, A. P., and Pratt, K. A.: Wintertime Arctic sea spray aerosol composition controlled by sea ice lead microbiology, ACS Central Science, 5, 1760–1767, https://doi.org/10.1021/acscentsci.9b00541, 2019. a
Knopf, D., Alpert, P., Wang, B., and Aller, J.: Stimulation of ice nucleation by marine diatoms, Nat. Geosci., 4, 88–90, https://doi.org/10.1038/ngeo1037, 2011. a
Korolev, A., McFarquhar, G., Field, P. R., Franklin, C., Lawson, P., Wang, Z., Williams, E., Abel, S. J., Axisa, D., Borrmann, S., Crosier, J., Fugal, J., Krämer, M., Lohmann, U., Schlenczek, O., Schnaiter, M., and Wendisch, M.: Mixed-Phase Clouds: Progress and Challenges, Meteor. Mon., 58, 5.1–5.50, https://doi.org/10.1175/AMSMONOGRAPHS-D-17-0001.1, 2017. a
Lacher, L., Lohmann, U., Boose, Y., Zipori, A., Herrmann, E., Bukowiecki, N., Steinbacher, M., and Kanji, Z. A.: The Horizontal Ice Nucleation Chamber (HINC): INP measurements at conditions relevant for mixed-phase clouds at the High Altitude Research Station Jungfraujoch, Atmos. Chem. Phys., 17, 15199–15224, https://doi.org/10.5194/acp-17-15199-2017, 2017. a, b, c, d, e
Landwehr, S., Thurnherr, I., Cassar, N., Gysel-Beer, M., and Schmale, J.: Using global reanalysis data to quantify and correct airflow distortion bias in shipborne wind speed measurements, Atmos. Meas. Tech., 13, 3487–3506, https://doi.org/10.5194/amt-13-3487-2020, 2020. a
Lewis, E. R., Lewis, R., and Schwartz, S. E.: Sea salt aerosol production: mechanisms, methods, measurements, and models, vol. 152, American Geophysical Union, ISBN: 9780875904177, 2004. a
Li, G., Wieder, J., Pasquier, J. T., Henneberger, J., and Kanji, Z. A.: Predicting atmospheric background number concentration of ice-nucleating particles in the Arctic, Atmos. Chem. Phys., 22, 14441–14454, https://doi.org/10.5194/acp-22-14441-2022, 2022. a, b, c, d
Li, G., Wilbourn, E. K., Cheng, Z., Wieder, J., Fagerson, A., Henneberger, J., Motos, G., Traversi, R., Brooks, S. D., Mazzola, M., China, S., Nenes, A., Lohmann, U., Hiranuma, N., and Kanji, Z. A.: Physicochemical characterization and source apportionment of Arctic ice-nucleating particles observed in Ny-Ålesund in autumn 2019, Atmos. Chem. Phys., 23, 10489–10516, https://doi.org/10.5194/acp-23-10489-2023, 2023. a
Li, G., Welti, A., Rocchi, A., Fogwill, G. P., Dall'Osto, M., and Kanji, Z. A.: Terrestrial and marine sources of ice nucleating particles in the Eurasian Arctic, Faraday Discuss., 258, 94–119, https://doi.org/10.1039/d4fd00160e, 2025. a
Li, G., Welti, A., Thurnherr, I., Lohmann, U., and Kanji, Z.: Ice Nucleating Particle Concentrations over the Eurasian-Arctic Seas, ETH Zurich [data set], https://doi.org/10.3929/ethz-b-000717424, 2026. a
McCluskey, C. S., Ovadnevaite, J., Rinaldi, M., Atkinson, J., Belosi, F., Ceburnis, D., Marullo, S., Hill, T. C., Lohmann, U., Kanji, Z. A., O'Dowd, C., Kreidenweis, S. M., and DeMott, P. J.: Marine and Terrestrial Organic Ice-Nucleating Particles in Pristine Marine to Continentally Influenced Northeast Atlantic Air Masses, J. Geophys. Res.-Atmos., 123, 6196–6212, https://doi.org/10.1029/2017JD028033, 2018. a, b, c
Moallemi, A., Alberello, A., Thurnherr, I., Li, G., Kanji, Z. A., Bergamasco, F., Pohorsky, R., Nelli, F., Toffoli, A., and Schmale, J.: Links between atmospheric aerosols and sea state in the Arctic Ocean, Atmos. Environ., 338, 120844, https://doi.org/10.1016/j.atmosenv.2024.120844, 2024. a
Murray, B., O'Sullivan, D., Atkinson, J., and Webb, M.: Ice nucleation by particles immersed in supercooled cloud droplets, Chem. Soc. Rev., 41, 6519–6554, https://doi.org/10.1039/C2CS35200A, 2012. a
Murray, B. J., Carslaw, K. S., and Field, P. R.: Opinion: Cloud-phase climate feedback and the importance of ice-nucleating particles, Atmos. Chem. Phys., 21, 665–679, https://doi.org/10.5194/acp-21-665-2021, 2021. a, b, c
Niemand, M., Möhler, O., Vogel, B., Vogel, H., Hoose, C., Connolly, P., Klein, H., Bingemer, H., Demott, P., Skrotzki, J., and Leisner, T.: A particle-surface-area-based parameterization of immersion freezing on desert dust particles, J. Atmos. Sci., 69, 3077–3092, https://doi.org/10.1175/JAS-D-11-0249.1, 2012. a
Nieto-Caballero, M., Barry, K. R., Hill, T. C. J., Douglas, T. A., DeMott, P. J., Kreidenweis, S. M., and Creamean, J. M.: Airborne Bacteria over Thawing Permafrost Landscapes in the Arctic, Environ. Sci. Technol., 59, 9027–9036, https://doi.org/10.1021/acs.est.4c11774, 2025. a
Pantoya, A. D., Simonsen, S. R., Andrews, E., Burgener, R., Cox, C. J., de Boer, G., Thomas, B. D., and Hiranuma, N.: Multi-seasonal measurements of the ground-level atmospheric ice-nucleating particle abundance on the North Slope of Alaska, Aerosol Research, 3, 253–270, https://doi.org/10.5194/ar-3-253-2025, 2025. a
Perkins, R. J., Vazquez de Vasquez, M. G., Beasley, E. E., Hill, T. C. J., Stone, E. A., Allen, H. C., and DeMott, P. J.: Relating Structure and Ice Nucleation of Mixed Surfactant Systems Relevant to Sea Spray Aerosol, J. Phys. Chem. A, 124, 8806–8821, https://doi.org/10.1021/acs.jpca.0c05849, 2020. a
Petters, M. and Wright, T.: Revisiting ice nucleation from precipitation samples, Geophys. Res. Lett., 42, 8758–8766, https://doi.org/10.1002/2015GL065733, 2015. a, b, c, d, e
Porter, G. C. E., Adams, M. P., Brooks, I. M., Ickes, L., Karlsson, L., Leck, C., Salter, M. E., Schmale, J., Siegel, K., Sikora, S. N. F., Tarn, M. D., Vüllers, J., Wernli, H., Zieger, P., Zinke, J., and Murray, B. J.: Highly Active Ice-Nucleating Particles at the Summer North Pole, J. Geophys. Res.-Atmos., 127, e2021JD036059, https://doi.org/10.1029/2021JD036059, 2022. a, b
Rantanen, M., Karpechko, A. Y., Lipponen, A., Nordling, K., Hyvärinen, O., Ruosteenoja, K., Vihma, T., and Laaksonen, A.: The Arctic has warmed nearly four times faster than the globe since 1979, Communications Earth & Environment, 3, 168, https://doi.org/10.1038/s43247-022-00498-3, 2022. a
Rinaldi, M., Nicosia, A., Paglione, M., Mansour, K., Decesari, S., Mazzola, M., Santachiara, G., and Belosi, F.: Ice-nucleating particles at Ny-Ålesund: a study of condensation freezing by the Dynamic Filter Processing Chamber, Aerosol Research, 3, 535–556, https://doi.org/10.5194/ar-3-535-2025, 2025. a, b, c
Sanchez-Marroquin, A., Arnalds, O., Baustian-Dorsi, K. J., Browse, J., Dagsson-Waldhauserova, P., Harrison, A. D., Maters, E. C., Pringle, K. J., Vergara-Temprado, J., Burke, I. T., McQuaid, J. B., Carslaw, K. S., and Murray, B. J.: Iceland is an episodic source of atmospheric ice-nucleating particles relevant for mixed-phase clouds, Science Advances, 6, eaba8137, https://doi.org/10.1126/sciadv.aba8137, 2020. a
Šantl Temkiv, T., Lange, R., Beddows, D., Rauter, U., Pilgaard, S., Dall’Osto, M., Gunde-Cimerman, N., Massling, A., and Wex, H.: Biogenic sources of ice nucleating particles at the high Arctic site villum research station, Environ. Sci. Technol., 53, 10580–10590, https://doi.org/10.1021/acs.est.9b00991, 2019. a
Schmale, J., Zieger, P., and Ekman, A. M.: Aerosols in current and future Arctic climate, Nat. Clim. Change, 11, 95–105, https://doi.org/10.1038/s41558-020-00969-5, 2021. a, b, c
Serreze, M. C. and Barry, R. G.: Processes and impacts of Arctic amplification: A research synthesis, Global. Planet. Change, 77, 85–96, https://doi.org/10.1016/j.gloplacha.2011.03.004, 2011. a
Sprenger, M. and Wernli, H.: The LAGRANTO Lagrangian analysis tool – version 2.0, Geosci. Model Dev., 8, 2569–2586, https://doi.org/10.5194/gmd-8-2569-2015, 2015. a
Strong, C. and Rigor, I. G.: Arctic marginal ice zone trending wider in summer and narrower in winter, Geophys. Res. Lett., 40, 4864–4868, https://doi.org/10.1002/grl.50928, 2013. a
Tan, I. and Storelvmo, T.: Evidence of strong contributions from mixed-phase clouds to Arctic climate change, Geophys. Res. Lett., 46, 2894–2902, https://doi.org/10.1029/2018GL081871, 2019. a
Tobo, Y., Adachi, K., DeMott, P. J., Hill, T. C., Hamilton, D. S., Mahowald, N. M., Nagatsuka, N., Ohata, S., Uetake, J., Kondo, Y., and Koike, M.: Glacially sourced dust as a potentially significant source of ice nucleating particles, Nat. Geosci., 12, 253–258, https://doi.org/10.1038/s41561-019-0314-x, 2019. a, b, c, d
Tuerena, R. E., Mahaffey, C., Henley, S. F., de la Vega, C., Norman, L., Brand, T., Sanders, T., Debyser, M., Dähnke, K., Braun, J., and März, C.: Nutrient pathways and their susceptibility to past and future change in the Eurasian Arctic Ocean, Ambio, 51, 355–369, https://doi.org/10.1007/s13280-021-01673-0, 2022. a
Tunved, P., Ström, J., and Krejci, R.: Arctic aerosol life cycle: linking aerosol size distributions observed between 2000 and 2010 with air mass transport and precipitation at Zeppelin station, Ny-Ålesund, Svalbard, Atmos. Chem. Phys., 13, 3643–3660, https://doi.org/10.5194/acp-13-3643-2013, 2013. a
Vali, G.: Quantitative Evaluation of Experimental Results an the Heterogeneous Freezing Nucleation of Supercooled Liquids, J. Atmos. Sci., 28, 402–409, https://doi.org/10.1175/1520-0469(1971)028<0402:QEOERA>2.0.CO;2, 1971. a
Vali, G.: Revisiting the differential freezing nucleus spectra derived from drop-freezing experiments: methods of calculation, applications, and confidence limits, Atmos. Meas. Tech., 12, 1219–1231, https://doi.org/10.5194/amt-12-1219-2019, 2019. a
Vali, G., DeMott, P. J., Möhler, O., and Whale, T. F.: Technical Note: A proposal for ice nucleation terminology, Atmos. Chem. Phys., 15, 10263–10270, https://doi.org/10.5194/acp-15-10263-2015, 2015. a
Webster, M. A., Rigor, I. G., Perovich, D. K., Richter-Menge, J. A., Polashenski, C. M., and Light, B.: Seasonal evolution of melt ponds on Arctic sea ice, J. Geophys. Res.-Oceans, 120, 5968–5982, https://doi.org/10.1002/2015JC011030, 2015. a
Welti, A., Lüönd, F., Stetzer, O., and Lohmann, U.: Influence of particle size on the ice nucleating ability of mineral dusts, Atmos. Chem. Phys., 9, 6705–6715, https://doi.org/10.5194/acp-9-6705-2009, 2009. a
Welti, A., Bigg, E. K., DeMott, P. J., Gong, X., Hartmann, M., Harvey, M., Henning, S., Herenz, P., Hill, T. C. J., Hornblow, B., Leck, C., Löffler, M., McCluskey, C. S., Rauker, A. M., Schmale, J., Tatzelt, C., van Pinxteren, M., and Stratmann, F.: Ship-based measurements of ice nuclei concentrations over the Arctic, Atlantic, Pacific and Southern oceans, Atmos. Chem. Phys., 20, 15191–15206, https://doi.org/10.5194/acp-20-15191-2020, 2020. a, b, c
Wendisch, M., Macke, A., Ehrlich, A., Lüpkes, C., Mech, M., Chechin, D., Dethloff, K., Velasco, C. B., Bozem, H., Brückner, M., Clemen, H.-C., Crewell, S., Donth, T., Dupuy, R., Ebell, K., Egerer, U., Engelmann, R., Engler, C., Eppers, O., Gehrmann, M., Gong, X., Gottschalk, M., Gourbeyre, C., Griesche, H., Hartmann, J., Hartmann, M., Heinold, B., Herber, A., Herrmann, H., Heygster, G., Hoor, P., Jafariserajehlou, S., Jäkel, E., Järvinen, E., Jourdan, O., Kästner, U., Kecorius, S., Knudsen, E. M., Köllner, F., Kretzschmar, J., Lelli, L., Leroy, D., Maturilli, M., Mei, L., Mertes, S., Mioche, G., Neuber, R., Nicolaus, M., Nomokonova, T., Notholt, J., Palm, M., van Pinxteren, M., Quaas, J., Richter, P., Ruiz-Donoso, E., Schäfer, M., Schmieder, K., Schnaiter, M., Schneider, J., Schwarzenböck, A., Seifert, P., Shupe, M. D., Siebert, H., Spreen, G., Stapf, J., Stratmann, F., Vogl, T., Welti, A., Wex, H., Wiedensohler, A., Zanatta, M., and Zeppenfeld, S.: The Arctic Cloud Puzzle: Using ACLOUD/PASCAL Multiplatform Observations to Unravel the Role of Clouds and Aerosol Particles in Arctic Amplification, B. Am. Meteorol. Soc., 100, 841–871, https://doi.org/10.1175/BAMS-D-18-0072.1, 2019. a
Wernli, H. and Davies, H. C.: A Lagrangian-based analysis of extratropical cyclones. I: The method and some applications, Q. J. Roy. Meteor. Soc., 123, 467–489, https://doi.org/10.1002/qj.49712353811, 1997. a
Wex, H., Huang, L., Zhang, W., Hung, H., Traversi, R., Becagli, S., Sheesley, R. J., Moffett, C. E., Barrett, T. E., Bossi, R., Skov, H., Hünerbein, A., Lubitz, J., Löffler, M., Linke, O., Hartmann, M., Herenz, P., and Stratmann, F.: Annual variability of ice-nucleating particle concentrations at different Arctic locations, Atmos. Chem. Phys., 19, 5293–5311, https://doi.org/10.5194/acp-19-5293-2019, 2019. a, b, c
Wieber, C., Jensen, L. Z., Vergeynst, L., Meire, L., Juul-Pedersen, T., Finster, K., and Šantl-Temkiv, T.: Terrestrial runoff is an important source of biological ice-nucleating particles in Arctic marine systems, Atmos. Chem. Phys., 25, 3327–3346, https://doi.org/10.5194/acp-25-3327-2025, 2025. a
Wilson, T. W., Ladino, L. A., Alpert, P. A., Breckels, M. N., Brooks, I. M., Browse, J., Burrows, S. M., Carslaw, K. S., Huffman, J. A., Judd, C., Kilthau, W. P., Mason, R. H., McFiggans, G., Miller, L. A., Nájera, J. J., Polishchuk, E., Rae, S., Schiller, C. L., Si, M., Temprado, J. V., Whale, T. F., Wong, J. P. S., Wurl, O., Yakobi-Hancock, J. D., Abbatt, J. P. D., Aller, J. Y., Bertram, A. K., Knopf, D. A., and Murray, B. J.: A marine biogenic source of atmospheric ice-nucleating particles, Nature, 525, 234, https://doi.org/10.1038/nature14986, 2015. a, b, c
Yoshimori, M., Kawasaki, T., Abe-Ouchi, A., and Hasumi, H.: Arctic Amplification in the Past, Present, and Future: A Review for the Challenge to the Integrative Understanding of its Mechanism, J. Meteorol. Soc. Jpn. Ser. II, 103, 523–558, https://doi.org/10.2151/jmsj.2025-027, 2025. a
- Abstract
- Introduction
- Data and methods
- Results and discussion
- Summary and Conclusions
- Appendix A: Temporal variability of NINP from different devices used during the Arctic Century Expedition
- Appendix B: Correlations of bulk aerosol parameters and air parcel history to NINP
- Appendix C: Time series of NINP and the concentration of elemental tracers for dust, sea salt, nutrients, and DMS.
- Appendix D: Geographical variability of NINP along the ship track measured from impinger samples
- Appendix E: 7 d Backward trajectories starting from the boundary layer at the ship's location
- Appendix F: Particle size distribution for selected case studies
- Data availability
- Author contributions
- Competing interests
- Disclaimer
- Acknowledgements
- Financial support
- Review statement
- References
- Abstract
- Introduction
- Data and methods
- Results and discussion
- Summary and Conclusions
- Appendix A: Temporal variability of NINP from different devices used during the Arctic Century Expedition
- Appendix B: Correlations of bulk aerosol parameters and air parcel history to NINP
- Appendix C: Time series of NINP and the concentration of elemental tracers for dust, sea salt, nutrients, and DMS.
- Appendix D: Geographical variability of NINP along the ship track measured from impinger samples
- Appendix E: 7 d Backward trajectories starting from the boundary layer at the ship's location
- Appendix F: Particle size distribution for selected case studies
- Data availability
- Author contributions
- Competing interests
- Disclaimer
- Acknowledgements
- Financial support
- Review statement
- References