
the Creative Commons Attribution 4.0 License.
the Creative Commons Attribution 4.0 License.
 | 03 Aug 2026
Direct thermal enhancement dominates over emission-mediated pathways in heatwave-induced O3 and SOA increases across China
Wenxuan Yu
Zhaolei Zhang
Jianyan Lu
Shenxin Li
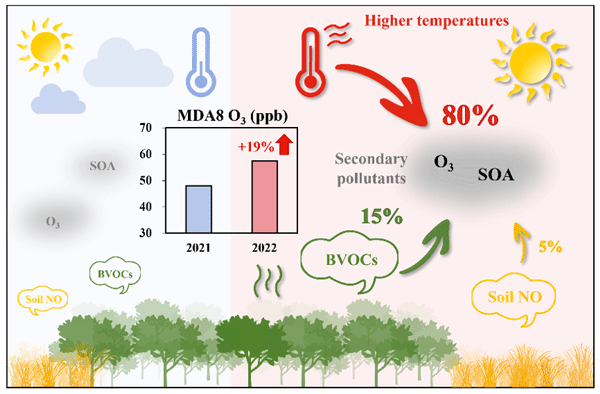
Heatwaves are major drivers of ozone (O3) and secondary organic aerosol (SOA) pollution. High temperatures directly accelerate photochemical reaction rates and concurrently enhance emissions of biogenic volatile organic compounds (BVOCs) and soil nitric oxide (SNO). However, the individual contributions of these direct and emission-mediated pathways to pollution formation remain poorly constrained. This study explicitly quantifies the distinct roles of these two pathways during heatwave events in China. Results show that high temperatures drive over 80 % (normalized) of the O3 and SOA increases nationally, primarily through favorable weather conditions and enhanced atmospheric oxidation capacity. The O3-temperature dependence is strongest in the Yangtze River Delta (0.66 ppb °C−1) and Pearl River Delta (0.95 ppb °C−1). Furthermore, high-temperature-induced BVOC emissions significantly exacerbate O3 in VOC-limited regions like the North China Plain. These findings underscore the importance of climate mitigation by illustrating its critical role in alleviating temperature-driven secondary pollution.
- Article
(3538 KB) - Full-text XML
-
Supplement
(1308 KB) - BibTeX
- EndNote


The Chinese government has implemented stringent emission control policies since 2013, achieving substantial reductions in primary pollutants sulfur dioxide (SO2) and nitrogen dioxide (NO2) (Weng et al., 2023; Zheng et al., 2017; Zhang et al., 2019; Zhao et al., 2018). However, there were still heavy pollution events driven by secondary pollutants such as ozone (O3) and secondary organic aerosol (SOA) (Shao et al., 2023; Wang et al., 2019; An et al., 2019; Wang et al., 2021b). In 2022, the observed O3 concentration across 337 cities in China reached an average of 68 ppb, a 5.8 % increase from 2021, with even higher levels in major city clusters. For instance, the Chengdu Plain experienced 17 consecutive days of O3 pollution in August 2022 (Wang et al., 2024). Similarly, widespread severe haze events were also largely driven by secondary components like SOA (Zhang et al., 2024; Huang et al., 2014; Duan et al., 2020; Lin et al., 2024; Huang et al., 2020, 2021). These trends raise growing concern, as exposure to elevated surface O3 and SOA poses serious threats to human respiratory health, crop yields and climate (Huang et al., 2018; Li et al., 2022; Hu and Guo, 2020; Li et al., 2020; Oh et al., 2023).
Secondary pollutant concentrations are directly or indirectly influenced by meteorological conditions, which affect their formation, transport, and removal processes (Mousavinezhad et al., 2021; Bai et al., 2022). Regarding direct effects, high temperatures could accelerate O3 formation rates including those involving hydrogen oxide radicals (HOx) (Eremenko et al., 2008; Filleul et al., 2006; Otero et al., 2016; Meng et al., 2023). Synoptic patterns, such as high-pressure systems and low wind speeds further exacerbate O3 accumulation by suppressing vertical and horizontal diffusion (Liu and Wang, 2020). These impacts are even more pronounced in urban areas due to the urban heat island effect, which intensifies local warming (Oke, 1982; Conti et al., 2005; Luo and Lau, 2017; Sun et al., 2014). An et al. (2023) reported the slope between maximum daily 8 h average (MDA8) O3 and daily maximum temperature (Tmax) was 0.49 ppb °C−1 steeper in urban areas than in rural areas, resulting in heightened O3 pollution.
As for the indirect effects, rising temperatures enhance emissions of biogenic volatile organic compounds (BVOCs) and soil NO (SNO), key precursors that drive secondary pollutant production (Guenther et al., 2012; Chang et al., 2009; Seco et al., 2022; Huang et al., 2023; Li et al., 2024). Based on measurements and model simulations, Zhang et al. (2023) found that high temperature drove an 18 % yr−1 isoprene increase at a suburban Hong Kong site, leading to a 0.44 ppb h−1 yr−1 O3 elevation. Besides, modeling studies also reported a 20 % increase in summertime biogenic SOA over North Europe under a 2.5 °C temperature rise (Megaritis et al., 2013). Beyond BVOCs, Oikawa et al. (2015) proved a positive correlation between SNO and temperature, which in turn aggravated secondary pollution. Although the impact of high temperatures on air quality has been widely recognized, the relative contributions of direct effects versus indirect emission-mediated pathways (e.g., via BVOCs and SNO) are still largely unknown.
This study quantifies the direct and indirect contributions of high temperatures to O3 and SOA concentrations during the record-breaking 2022 summer heatwave in China, using coupled Weather Research and Forecasting (WRF) and Community Multiscale Air Quality (CMAQ) modeling. The year was defined by an unprecedented summer of extreme heat, which had its most severe impact across the Yangtze River Basin (YRB) (Lu et al., 2023). Results show that ∼ 80 % of the increases in O3 and SOA are attributed to the direct impacts of high-temperature meteorology. These findings imply that effective mitigation of secondary pollution calls for integrated controls targeting both anthropogenic emissions and climate-driven warming.
2.1 Model Configuration
CMAQ version 5.4 with a modified SAPRC-11 photochemical mechanism was applied with a horizontal resolution of 36 km × 36 km. The WRF version 4.2.2 was utilized to generate meteorology inputs, driven by initial and boundary conditions from National Centers for Environmental Prediction (NCEP) Final Reanalysis Data (FNL) with a high resolution of 0.25 ° × 0.25 ° (https://rda.ucar.edu/datasets/ds083.2/, last access: April 2024). Anthropogenic emissions were projected for 2021 and 2022 by adjusting the 2020 Multi-resolution Emission Inventory for China (MEIC) (http://www.meicmodel.org, last access: April 2024) with updated traffic and industrial emission data (Zheng et al., 2018) (Sect. S1 in the Supplement). Biogenic emissions including BVOC and SNO were generated using the Model of Emissions of Gases and Aerosols from Nature (MEGAN) version 2.1 (Guenther et al., 2012). Based on the MEGAN estimates, the relative proportions of isoprene, terpenes, and sesquiterpenes are highly consistent between the 2021 baseline and 2022 heatwave conditions (Fig. S1 in the Supplement). They account for 81.8 %, 15.5 %, and 2.6 % of the total BVOC emissions in 2021, and 82.8 %, 14.7 %, and 2.5 % in 2022, respectively. Overall, the simulation was acceptable for the analysis compared with the observations, and a detailed model validation is presented in Sect. 3.1.
2.2 CMAQ O3 Process Analysis
The process analysis tools embedded in the CMAQ model were applied in the following analysis. The Integrated Process Rate (IPR) analysis was employed to quantify the contributions of key physical and chemical processes to O3 formation and to identify those most responsible for its increase (Byun and Schere, 2006). Seven processes in the IPR contributed to O3 formation, including horizontal diffusion (HDIF), horizontal advection (HADV), vertical diffusion (VDIF), vertical advection (ZADV), gas-phase chemistry (CHEM), dry deposition (DDEP), and cloud processes (CLDS). In this study, the sum of VDIF and ZADV was classified as vertical transport (VTRA). The sum of HADV and HDIF was classified as horizontal transport (HTRA).
2.3 CMAQ Simulation Scenarios
The summer of 2022 was selected for its record-high temperatures, while the summer of 2021 served as a baseline representing typical meteorological conditions (Lu et al., 2023). Two base cases, BASE21 and BASE22, were configured with default settings for 2021 and 2022 (Table 1). To isolate the effects of meteorology, BVOC, and SNO emissions, three sensitivity cases MET22, BVOC22, and SNO22 were conducted. These cases simulated 2022 using 2021 meteorology (MET22), 2021 BVOC emissions (BVOC22), and 2021 SNO emissions (SNO22), respectively. These simulations allowed the total difference between the two years (BASE22 – BASE21, termed “22-21”) to be partitioned into three components: (1) the direct meteorological effect (BASE22 – MET22, “MET”), (2) the indirect effect from climate-driven BVOC emissions (BASE22 – BVOC22, “BVOC”), and (3) the indirect effect from SNO emissions (BASE22 – SNO22, “SNO”). Four major Chinese city clusters including the North China Plain (NCP), the Yangtze River Delta (YRD), the Chongqing-Sichuan region (CY), and the Pearl River Delta (PRD) were selected for detailed analysis (Fig. 1a).
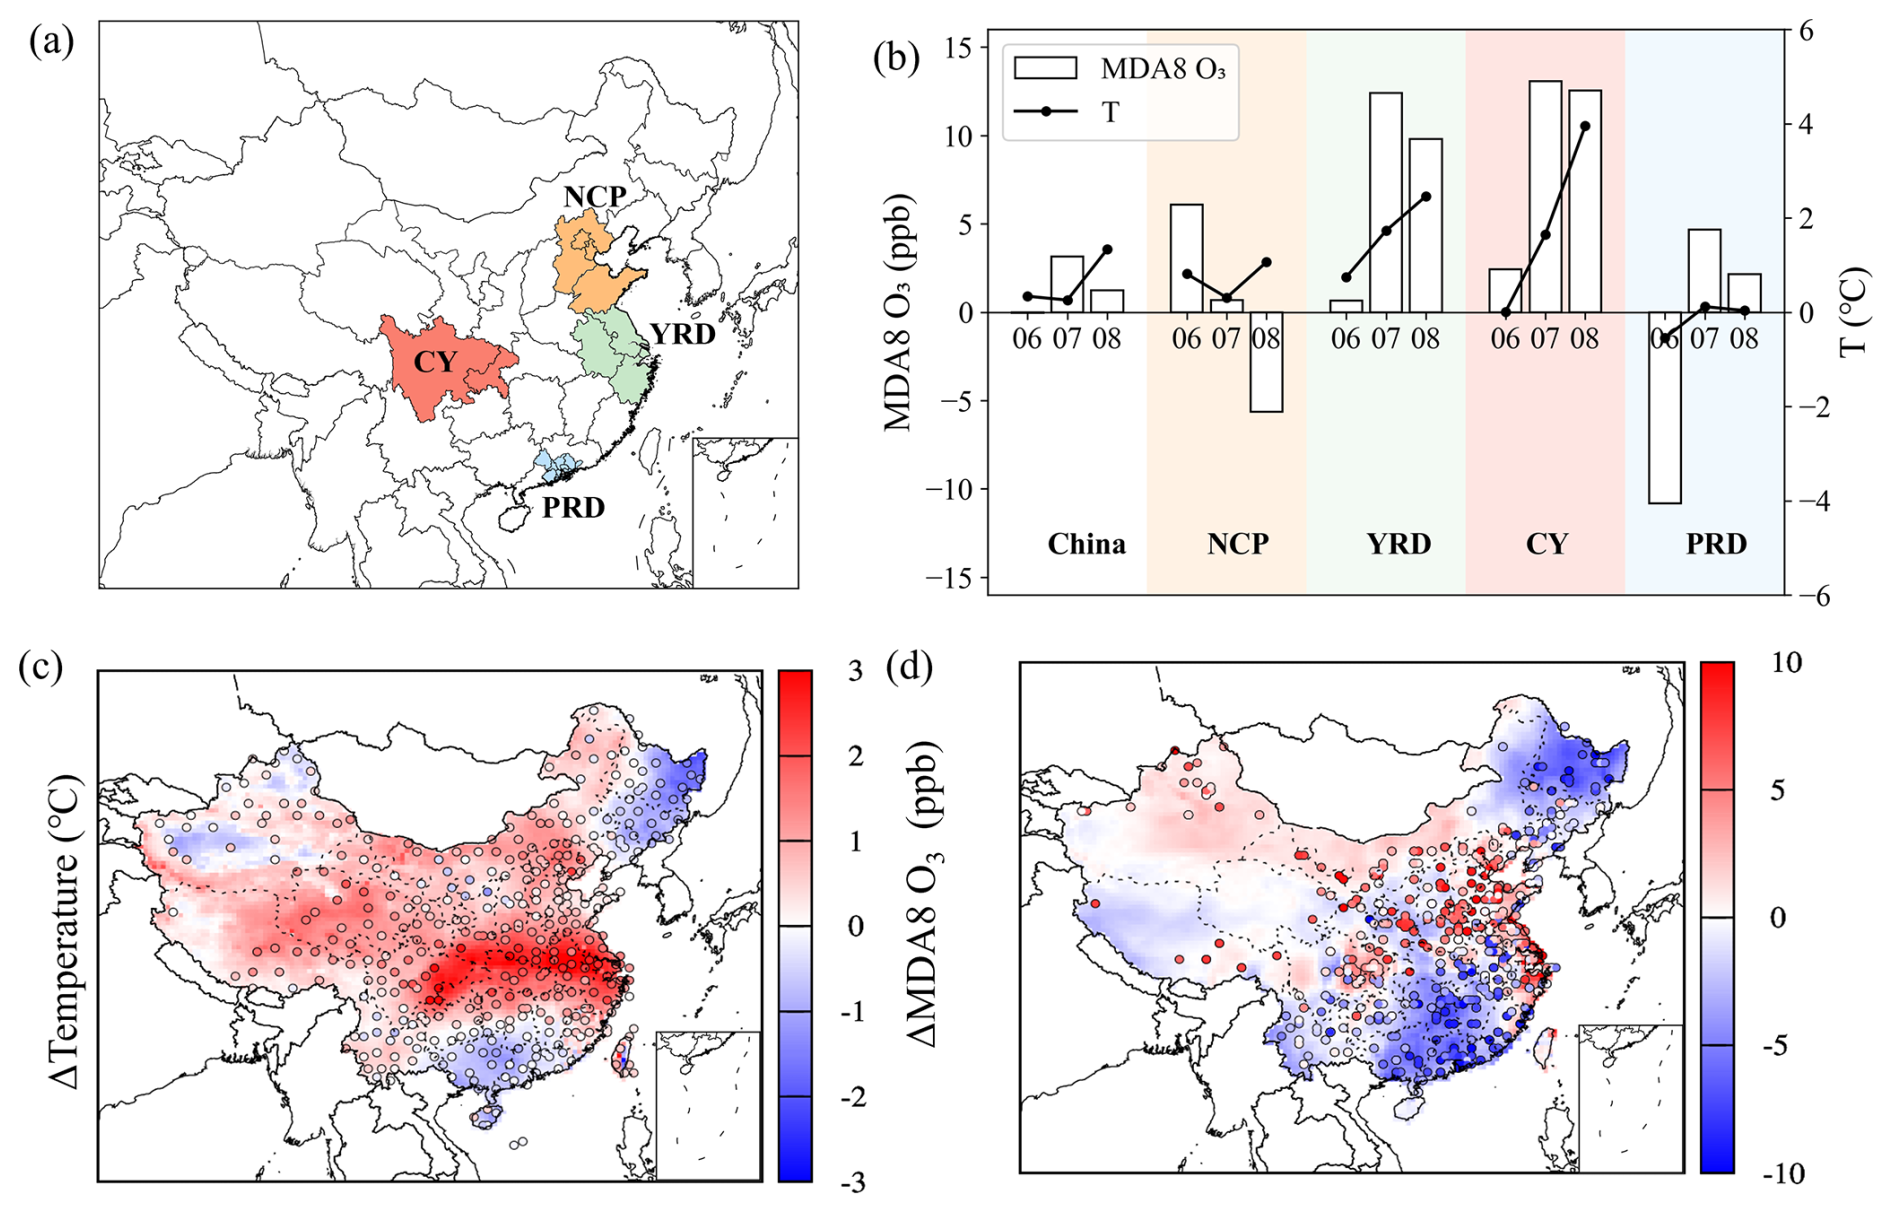
Figure 1The observed and simulated differences in temperature and MDA8 O3 between summer 2022 and 2021. (a) Major urban clusters in China. (b) Observed differences in temperature (T) and MDA8 O3 between summer 2022 and 2021 (2022–2021). (c) Simulated and observed temperature differences between summer 2022 and 2021 (BASE22–BASE21, dots: observed difference). (d) Same as (c), but for MDA8 O3.

2.4 Response of Secondary Pollutants to Temperature and Emission Changes
To better quantify the response of secondary pollutants to meteorology and biogenic emissions, a best-fit slope method was applied. This method, previously applied to the O3-Tmax relationship, was extended to SOA and biogenic emissions in this study (Wang et al., 2021a; Ma et al., 2019). Linear regression slope (k) and correlation coefficient (r) between secondary pollutants (MDA8 O3 and SOA) and Tmax, daily average temperature (T), BVOC and SNO emission rates were calculated, respectively. The equations are shown below (Su et al., 2012):
where n is the total number of grids in the area, and x represents Tmax, average temperature, BVOC and SNO emission rates, respectively. y denotes the concentrations of MDA8 O3 and SOA. and are the average of x and y. The sensitivity of MDA8 O3 is expressed in ppb °C−1 for temperature and ppb s mol−1 for emissions. The sensitivity of SOA is expressed in µg m−3 °C−1 for temperature and µg s (m−3 mol−1) for emissions. Because the calculated sensitivities to temperature and emissions possess incomparable units, these regression slopes were not normalized.
3.1 Model Evaluation
The simulation of meteorological conditions and pollutants was generally acceptable for the following analysis. Simulated 2 m temperature (T2), relative humidity (RH), 10 m wind speed (WS), and 10 m wind direction (WD) were compared with observations (Table S1 in the Supplement). The benchmarks were provided by Emery et al. (2017). For T2, despite the gross error (GE) being slightly higher than the benchmark (≤ 2), the mean bias (MB) values ranging from −0.2 to 0.0 K fully met the benchmark (≤ 0.5). WS was slightly overestimated, indicated by positive MB values of 0.6 to 0.8 m s−1, while the GE (1.4 to 1.6) and root mean square error (RMSE, 1.8 to 2.1) well met the benchmarks (≤ 2.0). Additionally, CMAQ simulations were compared with hourly observations from China National Environmental Monitoring Centre (CNMEC). Table S2 showed the model performance statistics of O3-1 h, PM2.5, and NO2. Simulated O3 and PM2.5 concentrations fell within the recommended standards. Specifically, although O3-1 h was slightly overestimated, its mean normalized bias (MNB) values ranged from 0.08 to 0.15 and successfully met the ≤ ± 0.15 benchmark. Similarly, while PM2.5 was underestimated, the corresponding MFB values ranged from −0.17 to 0.06, fully satisfying the ≤ ± 0.6 benchmark. Overall, the WRF and CMAQ model performance in this study was acceptable and comparable with previous studies, giving robust results for the subsequent process attribution analysis (Ji et al., 2024; Lyu et al., 2023).
However, a direct evaluation of SOA is currently unfeasible due to the absence of a nationwide monitoring network in China. Furthermore, previous studies reported that air quality models generally underestimate SOA concentrations because of missing precursor emissions, such as semivolatile/intermediate VOCs, and unrepresented multigenerational oxidation pathways (Zhao et al., 2022; Li et al., 2026). Consequently, the actual amplification of SOA caused by high temperatures is likely more severe than the model estimates.
3.2 Heatwave Increased Biogenic Emissions and O3 Pollution
The temperature in China was higher in the summer of 2022 than in 2021 based on observations (Fig. 1b and c), with an overall increase of ∼ 1 °C. In particular, the warming was most pronounced in the YRB, with the CY region experiencing an increase of over 4 °C in August. In contrast, the temperatures slightly decreased in the PRD region, consistent with previous studies (Yuan et al., 2023). Model simulations also reproduced the observed high-temperature pattern in summer 2022 (Fig. S2). Besides, these elevated temperatures were accompanied by an increase in planetary boundary layer (PBL) (∼ 300 m) and reductions in RH (−15 %) and soil moisture (SM) (−10 %), comparable with previous studies (Ding et al., 2021; García-García et al., 2023).
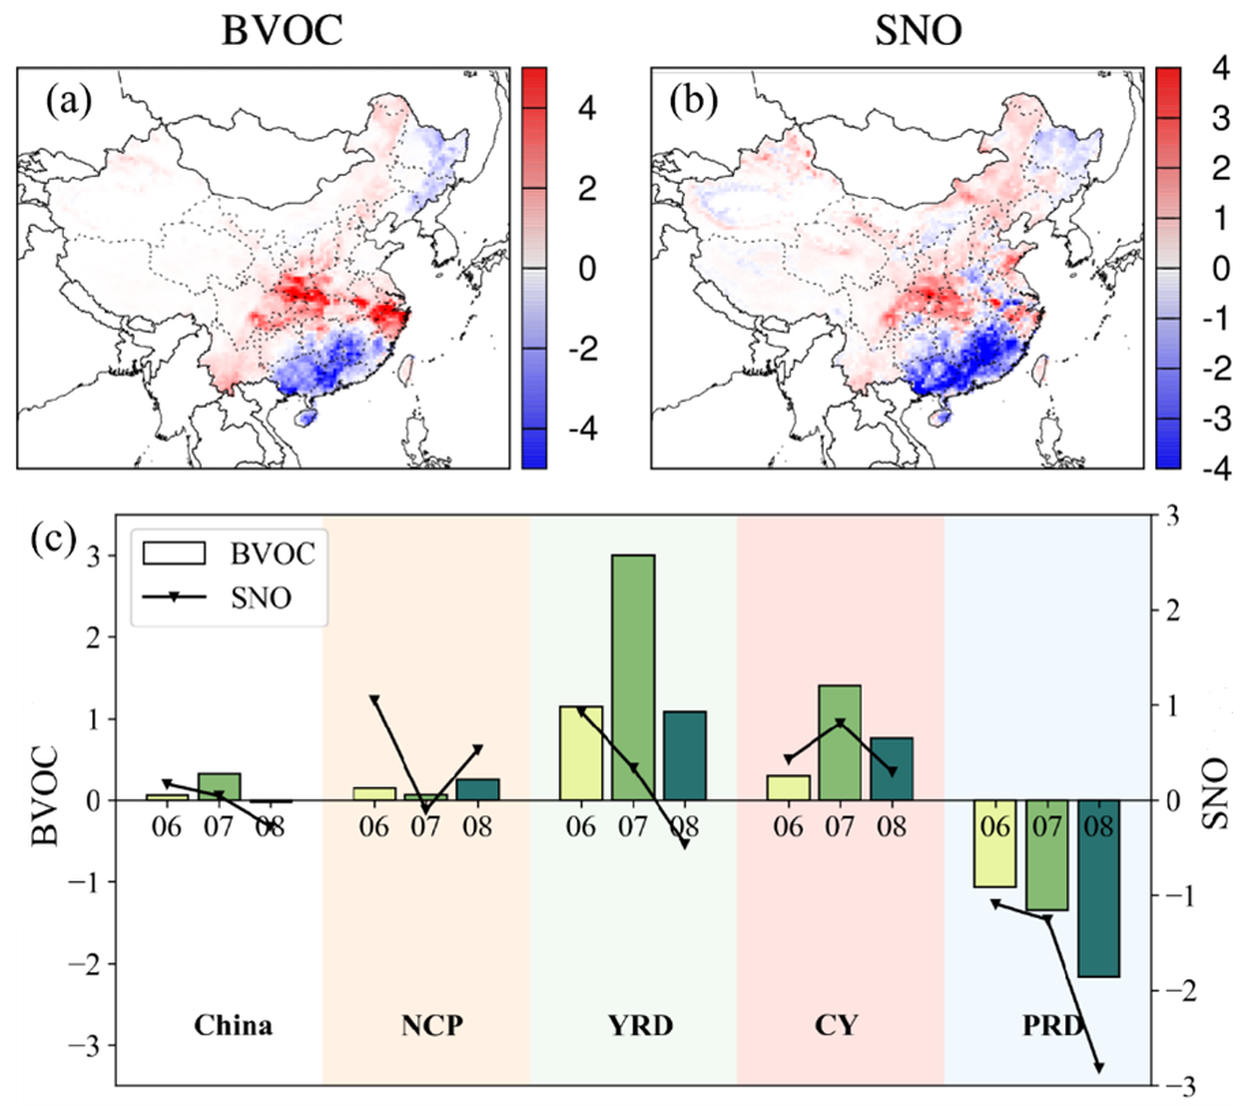
Figure 2(a) The differences in simulated BVOC emission rates between BASE22 and BASE21 (BASE22–BASE21, units: mol s−1). (b) Same as (a) but for SNO (units: µmol s−1). (c) Differences of BVOC and SNO emission rates between summer 2022 and 2021 across different regions based on the MEGAN model.
Correspondingly, the observed MDA8 O3 concentration in summer 2022 was higher than that in 2021 (Fig. 1d). The most notable increase of O3 was also found in the YRD and CY regions, with an increase of more than 10 ppb in July and August, aligned with the greatest warming (Fig. 1b and d), indicating that the occurrence of secondary pollution such as O3 was closely linked to high temperatures (Chen et al., 2024). Along with the high temperatures, simulated biogenic emission rates also increased during summer 2022 (Fig. 2). Notably, BVOC and SNO emissions increased in the YRD and CY regions, coinciding with the areas of most pronounced warming. In July, the BVOC emission rate in the YRD increased by 3 mol s−1, whereas the SNO emission rate in NCP saw the most significant increase of over 1 µmol s−1 in June. To understand how high temperatures affect secondary pollution, the following analysis separated their influence into direct meteorological effects and indirect effects mediated by biogenic emissions.
3.3 Dominant Role of High-Temperature Meteorology in Secondary Pollutants
Model results showed that the MET22 case (direct meteorological impacts of high temperatures) contributed the most to secondary pollution increases (Fig. 3a and b). For O3, the MET22 case accounted for over 80 % of the total increase and exhibited a spatial pattern consistent with the BASE2022 case. The most pronounced increases were concentrated in the YRD and CY regions. For SOA, the BVOC22 case also made a substantial contribution, particularly in the CY region. In contrast, the SNO22 case contributed the least to secondary pollutant formation (mostly <3 % for SOA) and even caused a slight SOA reduction in the CY region.
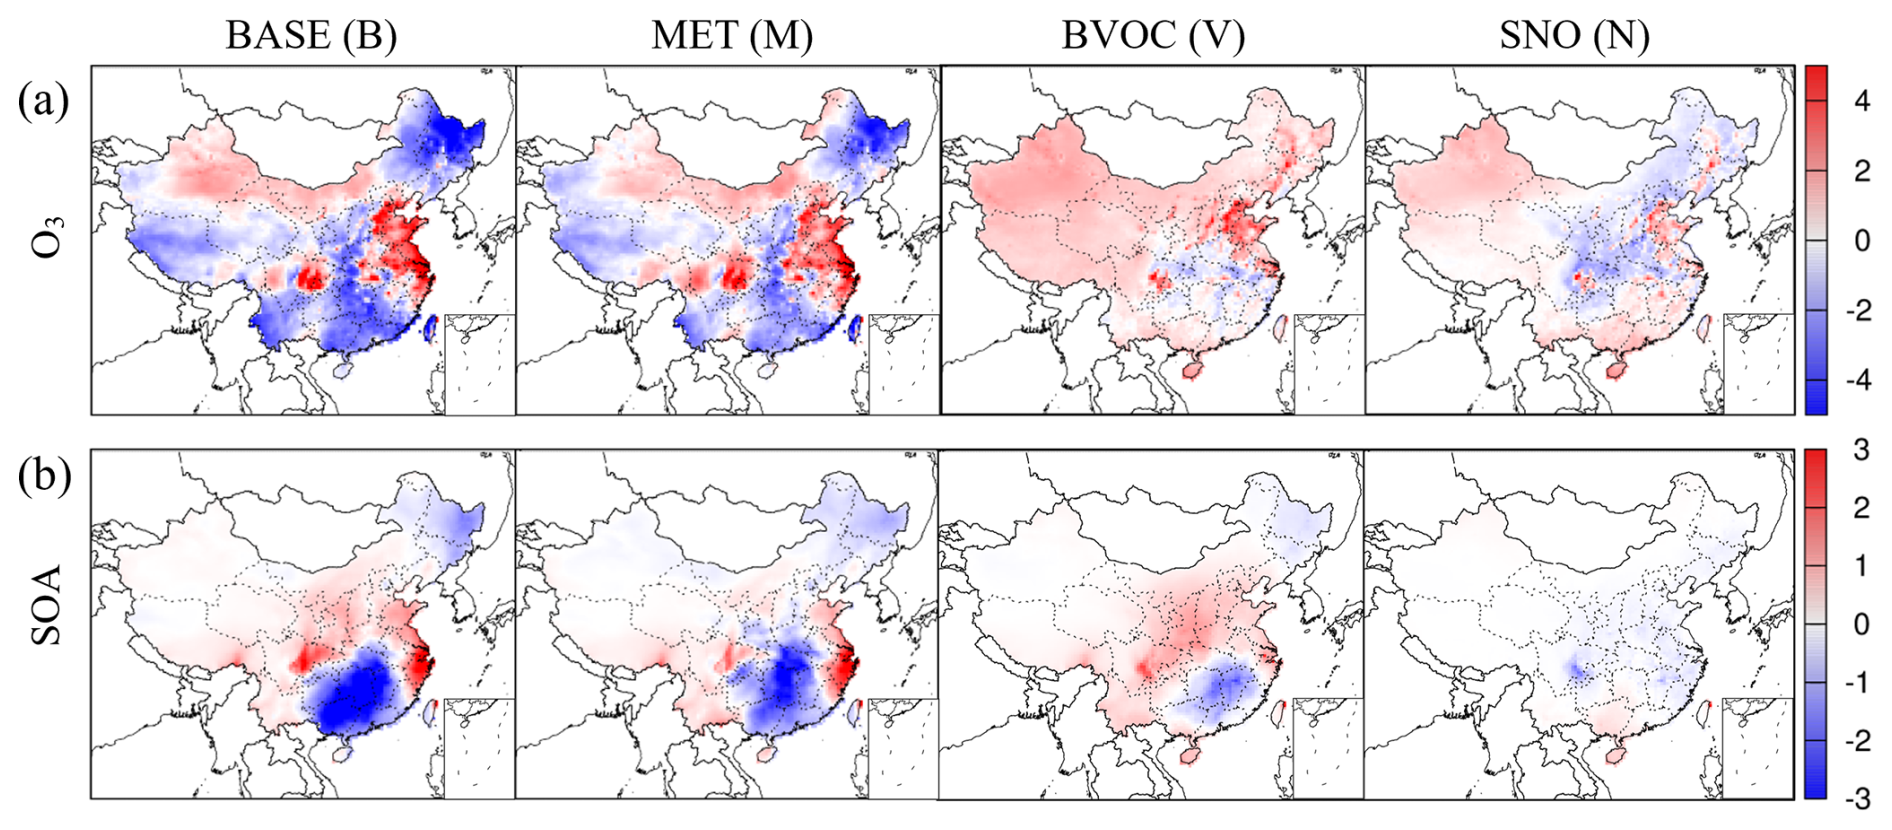
Figure 3(a) Simulated differences in O3 concentrations for BASE22–BASE21 (labeled “B”), BASE22–MET22 (labeled “M”), BASE22-BVOC22 (labeled “V”) and BASE22-SNO22 (labeled “N”). These scenarios represent the total differences between 2021 and 2022 (B), the contribution of meteorology (M), weather-driven BVOC (V) and SNO (N) emission changes, respectively (Units: ppb). (b) Same as (a) but for SOA (units: µg m−3).
IPR analysis of the total difference between summers 2022 and 2021 identified enhanced chemical production (CHEM) and horizontal transport (HTRA) were the primary processes responsible for the O3 rise (Fig. S3). Over the YRD and CY regions, where O3 increased markedly, both CHEM and HTRA increased by more than 1.0 ppb h−1 in 2022. Furthermore, more than 75 % of the increases in these two processes were attributed to the MET22 case. High-temperature conditions were typically accompanied by intensified solar radiation, which accelerated chemical reaction rates and further enhanced the CHEM process (Tian et al., 2024). Such conditions were often associated with persistent high-pressure systems that favor stable and intensified synoptic-scale flows, subsequently promoting O3 advection and its net influx into downwind areas (Tian et al., 2024).
3.4 Diurnal Patterns in Secondary Pollutants Driven by Atmospheric Oxidation Capacity
Diurnal variations of secondary pollutants (O3 and SOA) across regions exhibiting significant increases (NCP, YRD, and CY) were also examined (Figs. 4 and S4). In general, the MET22 case contributed significantly to secondary pollutants during both daytime and nighttime compared to other cases. Notably, its contribution to O3 varied regionally. The MET22 simulation showed a clear daytime contribution in the YRD and CY, whereas its contribution in the NCP was more pronounced at night. For SOA, the MET22 contribution was nearly equal between day and night across these regions.
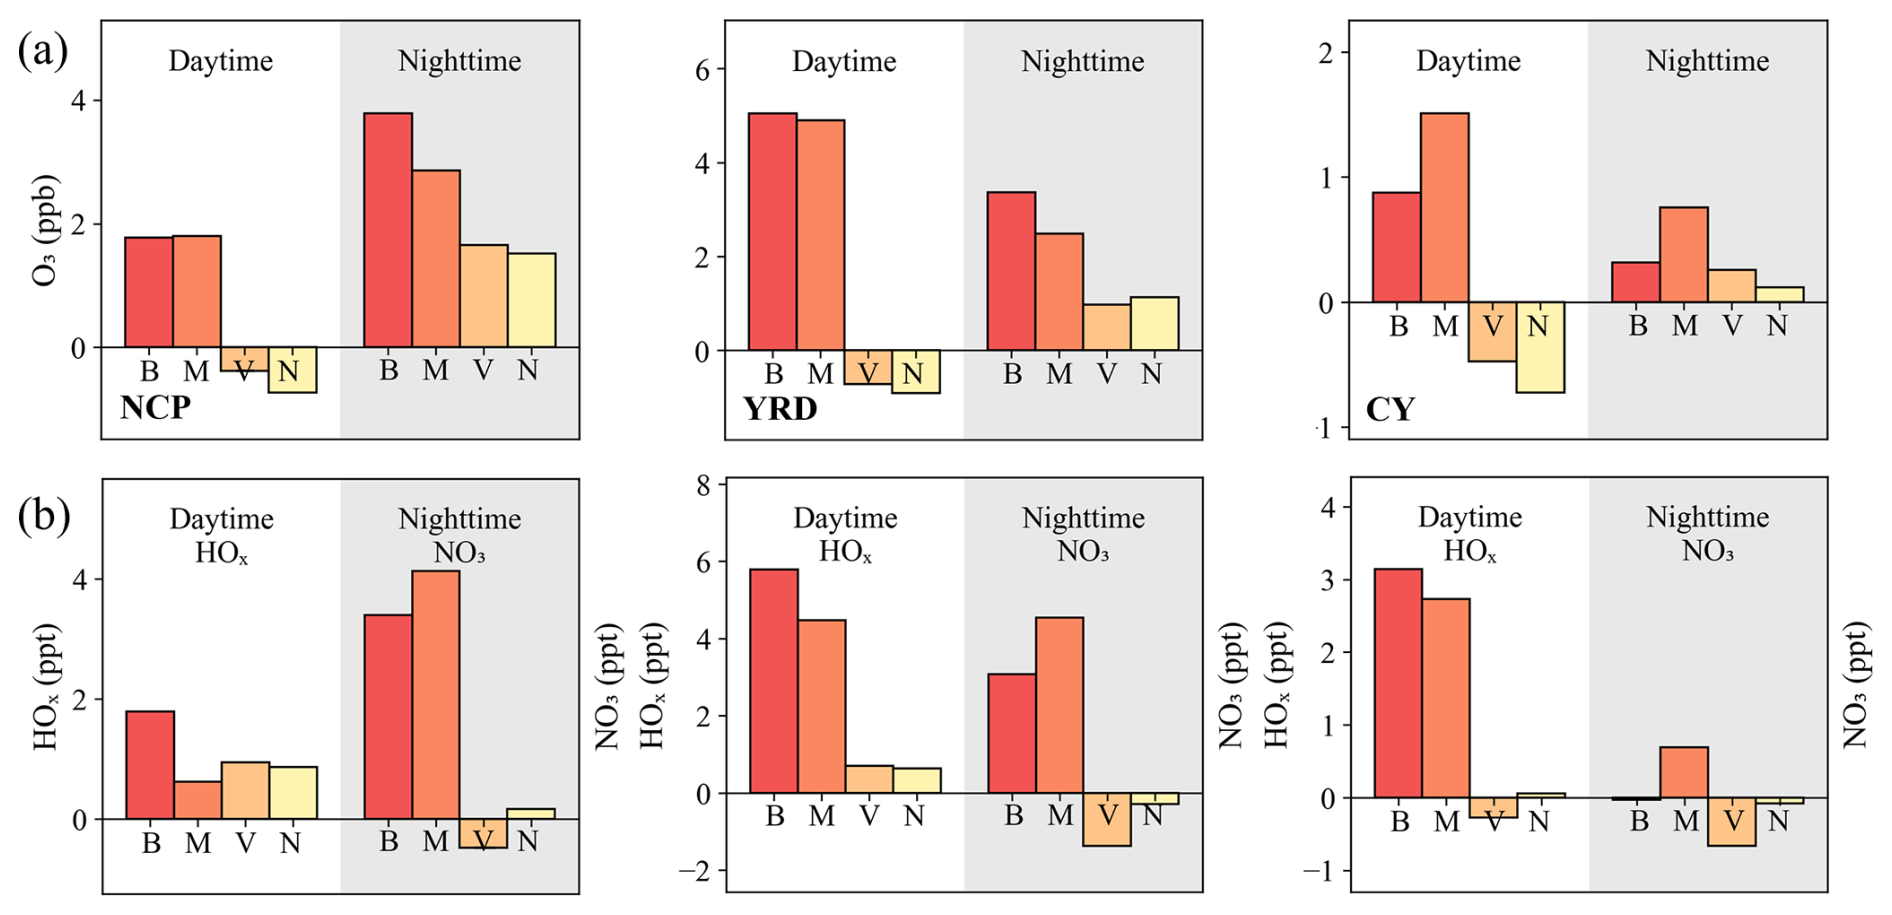
Figure 4Diurnal differences in hourly (a) O3, (b) daytime HOx, and nighttime NO3 concentrations in the NCP, YRD, and CY regions, respectively. Daytime is defined as 08:00 to 20:00 and nighttime as 20:00 to 08:00 Beijing Time (Zhu et al., 2020; Wang et al., 2022). The differences shown are BASE22–BASE21 (labelled “B”) for the total change between 2021 and 2022, BASE22–MET22 (labelled “M”) for the contribution of meteorology; BASE22–BVOC22 (labelled “V”) for weather-driven BVOC emission changes; and BASE22–SNO22 (labelled “N”) for weather-driven SNO emission changes.
To understand this regional divergence in the diurnal MET22 response, the atmospheric oxidation capacity (AOC) was also discussed. In this study, daytime AOC is indicated by hydrogen oxide radical (HOx = OH + HO2) concentrations, while nighttime AOC was indicated by nitrate radical (NO3) concentrations (Sillman, 1995; Zhu et al., 2021; Zhu et al., 2023; Liu et al., 2012). In general, the AOC enhancement driven by the MET22 case accounted for over 90 % of the total increase in AOC, which was closely linked to the formation of secondary pollutants (Fig. 4) (Coates et al., 2016; Xing et al., 2017). For O3, the daytime increase in the MET22 was primarily driven by enhanced HOx concentrations, which showed net increases of 4.5 and 2.7 ppt in the YRD and CY regions, respectively (Liu et al., 2022). While daytime chemistry dominated under high-temperature conditions, concurrent high-pressure system promoted stable atmospheric conditions at night (Nasong et al., 2025). This stability led to nocturnal surface cooling, which facilitated the formation of a temperature inversion layer. This inversion inhibited the vertical diffusion of O3, resulting in its accumulation at ground level and a subsequent increase in NO3 concentration. This mechanism explained the larger contribution of the MET22 case to nocturnal O3 elevation. For SOA, both daytime formation via thermally enhanced emissions and OH oxidation and nighttime formation through NO3/O3 oxidation were promoted under high temperatures. Consequently, SOA contribution from the MET22 remained similar throughout the diurnal cycle.
3.5 NCP O3 Showed Heightened Sensitivity to BVOC Emissions
In addition to the MET22 case, the BVOC22 case (weather-driven changes in BVOC emissions) also played an important role in O3 elevation, particularly in the NCP region (28 %). Although the increase in BVOC emissions was small there (+0.15 mol s−1), the resulting O3 increase was greater than in other regions (Fig. 5). This could be explained by the VOC-limited regime in the NCP, which makes O3 highly responsive to VOC emission changes (Fig. S5). The best-fit slope method quantifies this sensitivity at 4.03 ppb s mol−1 in the NCP (Fig. 6), which was an 8-fold enhancement over the national mean and a 5-to-6-fold increase compared to the YRD. These findings highlight the urgent need for enhanced VOC emission regulations within the NCP.
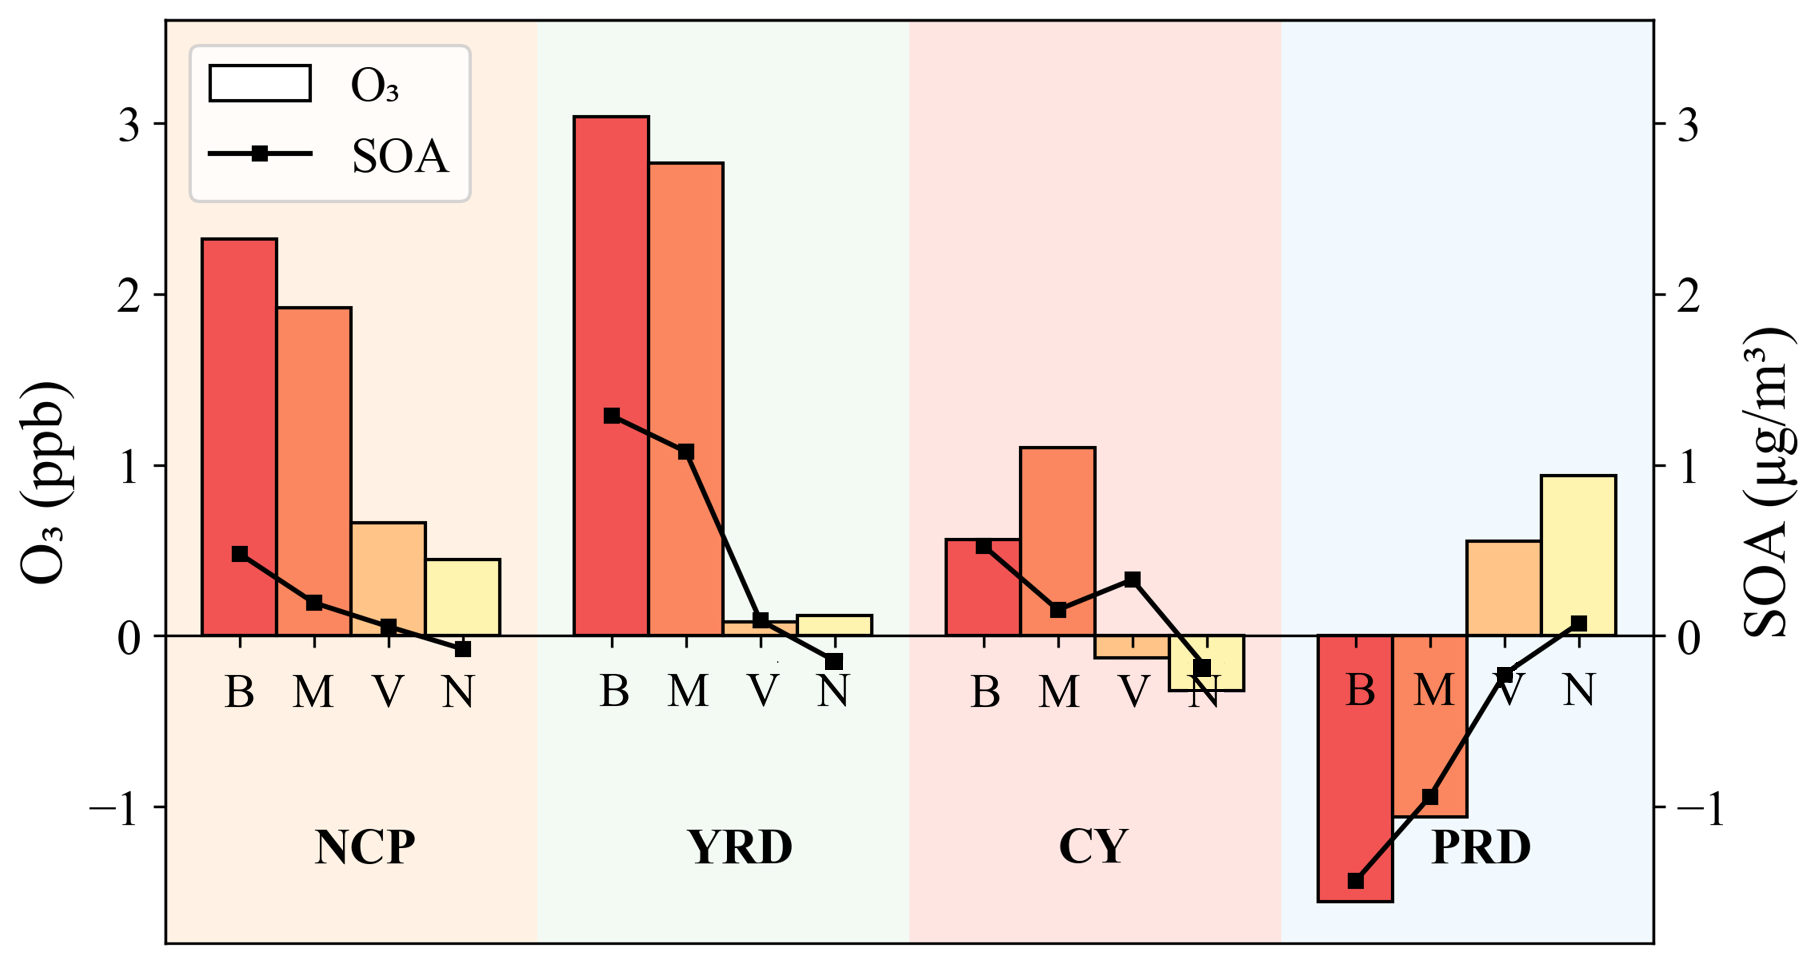
Figure 5Changes in MDA8 O3 and SOA are shown for BASE22–BASE21 (labelled “B”, total 2021–2022 change), BASE22–MET22 (“M”, meteorological contribution), BASE22–BVOC22 (“V”, weather-driven BVOC emission changes), and BASE22–SNO22 (“N”, weather-driven SNO emission changes) across major urban clusters. Units are ppb and µg m−3 for O3 and SOA, respectively.
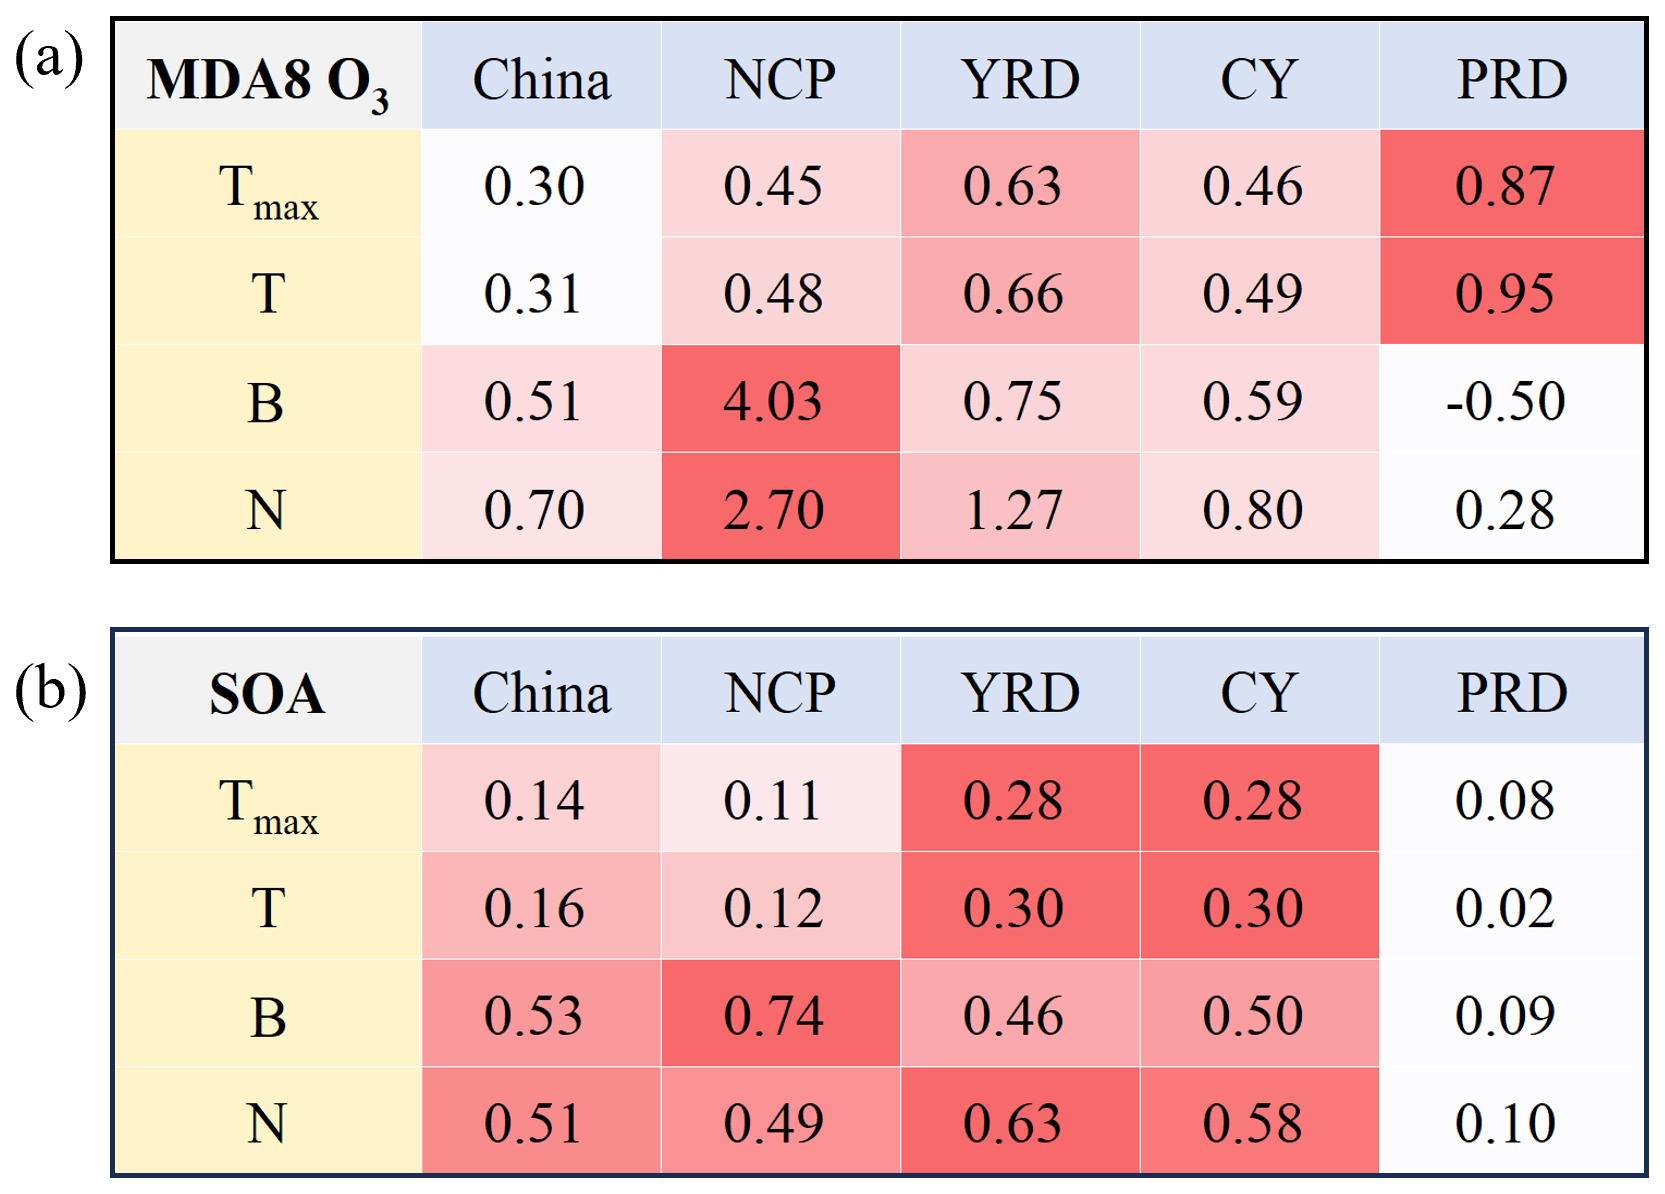
Figure 6Sensitivity of (a) MDA8 O3 and (b) SOA to Tmax, daily average temperature (T), BVOC emissions (B), and SNO emissions (N) across major urban clusters. MDA8 O3 sensitivity is in ppb °C−1 to temperature and ppb s mole−1 to emissions. SOA sensitivity is in µg m−3 °C−1 to temperature and µg s (m−3 mol−1) to emissions. Values are not normalized due to differing units. Color scales are row-specific, ranging from minimum (white) to maximum (dark red).
Moreover, the impact of the BVOC22 on NCP O3 exhibits a diurnal reversal, from negative in the daytime to positive at night (Fig. 4). During the day, an increase in BVOCs enhanced the oxidation of NO to NO2, and further facilitated the formation of O3. However, the concurrently increased NO from NO2 photolysis also intensified the O3 loss via titration (O3 + NO). When the titration process became slightly dominant, this could lead to a net negative daytime contribution to O3. Conversely, at night, the suppressed PBL height limits vertical mixing and traps pollutants (Fig. S6). Within this stable layer, increased BVOCs promoted NO3 radical chemistry, which is verified by the net decrease of nighttime NO3 concentrations (Fig. 4b). This process consumed NO and thus reduced the nocturnal O3 titration, facilitating residual O3 accumulation.
These estimated impacts of biogenic emissions in the NCP likely represent a conservative estimate. Specifically, coarse vegetation data and simplified fertilizer parameterizations lead the MEGAN model to underestimate urban BVOCs and SNO emissions, respectively (Zhang et al., 2025; Oikawa et al., 2015; Huang et al., 2023). As the NCP features dense urban clusters interspersed with intensive agricultural lands, the actual emissions of both precursors and their subsequent contributions to secondary pollution during the heatwave are expected to exceed the current simulations.
3.6 Sensitivity Patterns of Secondary Pollutants to Temperatures and Emissions
Based on best-slope analysis, O3 in urban areas was more sensitive to temperature changes (including both Tmax and T) compared to the national average level (+50 % to 290 %, Fig. 6). Especially in the YRD and PRD, the sensitivity of MDA8 O3 to temperature reached 0.66 and 0.95 ppb °C−1, respectively. This was partly due to the urban heat island (UHI) effect, which elevated daytime temperatures and favored pollutant accumulation. This effect could be further intensified during heatwaves (Clinton and Gong, 2013; Delcloo et al., 2018; Wang et al., 2018).
Notably, despite a slight decrease in summer O3 and temperature in the PRD in 2022, the region exhibited the highest O3-temperature sensitivity, which heightened local risks and necessitated targeted mitigation. As defined in Sect. 2.4, this positive slope represents the spatial linear regression across PRD grids rather than interannual temperature changes. This spatial variability heightens local risks and necessitates targeted mitigation. However, the correlation between O3 and temperature was higher in the YRD than in the PRD (Table S3). This was because precursor emissions in the PRD were generally lower and affected by multiple factors such as sea-land breezes, which may weaken the temperature-O3 linkage. NCP O3 showed remarkable sensitivity to emission changes. During heatwaves, both BVOCs and SNO emissions increased. This may accelerate radical-initiated oxidation cycles and enhance OH regeneration, resulting in amplified O3.
For SOA, the sensitivity to temperature showed pronounced regional variability, with the highest values found in the YRD and CY regions (0.28 to 0.30 µg m−3 °C−1, Fig. 6), roughly twice the national average. This heightened sensitivity in the CY region is primarily driven by weather-driven biogenic emissions (the BVOC22 scenario), which contribute more significantly to SOA formation than the direct meteorological impact (MET22) (Fig. 5). In the extensively vegetated CY region, high temperatures markedly increase the emissions of BVOC, such as isoprene and monoterpenes (Cao et al., 2022; Guenther et al., 2012). Simultaneously, the enhanced AOC during heatwaves (as discussed in Sect. 3.4) rapidly oxidizes these precursors into low-volatility products, facilitating SOA yields. Alongside BVOCs, SOA is also highly sensitive to SNO emissions in the YRD and CY areas (0.63 and 0.58 µg m−3 °C−1, respectively, Fig. 6). However, the SNO22 scenario reports that reducing SNO emissions only leads to a slight decrease in overall SOA concentrations (Fig. 5). Total NOx emissions in these regions are still dominated by anthropogenic sources (Huang et al., 2023). Although heat-induced SNO provides additional NOx to promote BVOC oxidation, fluctuations in SNO emissions have a limited impact on the total SOA concentration.
In contrast, temperature and SNO have minimal influence on SOA in the PRD. The limited contribution of heat induced SNO is largely constrained by low precursor emissions resulting from strict regional controls (Ou et al., 2016). Furthermore, elevated temperatures increase the saturation vapor pressure of semi-volatile organic compounds, driving their thermodynamic partitioning back into the gas phase and thereby suppressing SOA yields (Donahue et al., 2006). In the NCP, SOA is highly sensitive to BVOC emissions. Driven by high NOx emissions and AOC alongside lower overall vegetation coverage, additional biogenic precursors in the NCP are rapidly oxidized into SOA, leading to this pronounced sensitivity.
The 2022 summer heatwave clearly demonstrates that high temperatures drive secondary pollution through multiple pathways. This study separates the direct meteorological effects from the indirect effects mediated by biogenic emissions. Results show that direct meteorological conditions account for over 80 % of the O3 increase, particularly in the YRD and CY regions. This dominance reflects two linked processes. First, process analysis identifies enhanced chemical production as a primary factor, consistent with temperature-accelerated reaction kinetics. Second, horizontal transport also increased by more than 1.0 ppb h−1 in these regions, indicating that the persistent high-pressure systems accompanying heatwaves not only stagnate local air but also facilitate synoptic-scale transport of O3 to downwind areas. Together, these mechanisms explain why the spatial pattern of O3 increase closely matches the pattern of greatest warming.
Diurnal responses reveal additional complexity. In the YRD and CY, the direct meteorological contribution to O3 is largest during the daytime, driven by elevated HOx radicals. In the NCP, however, the contribution is more pronounced at night. This regional difference arises from nocturnal surface cooling under stable high-pressure conditions, which forms a temperature inversion that traps O3 near the ground. The trapped O3 then reacts with increased NO3 radicals, creating a distinct nighttime accumulation pathway. For SOA, the direct meteorological contribution is nearly equal between day and night across all regions, suggesting that both daytime OH oxidation and nighttime NO3/O3 oxidation are promoted under high temperatures. These patterns imply that heatwaves intensify atmospheric processing throughout the diurnal cycle, not only during peak photochemical hours.
Indirect effects driven by BVOCs, while smaller overall, are critically important in specific regions. In the NCP, a modest increase in BVOC emissions (0.15 mol s−1) produces an O3 response eight times the national average. This heightened sensitivity is explained by the VOC-limited chemical regime of the NCP, where O3 formation is highly responsive to VOC changes. The BVOC effect also exhibits a diurnal reversal: negative during the day and positive at night. Daytime BVOC increases enhance NO-to-NO2 conversion and O3 formation, but the concurrent increase in NO from NO2 photolysis also strengthens O3 loss via titration. When titration slightly dominates, the net daytime contribution becomes negative. At night, increased BVOCs promote NO3 chemistry, which consumes NO and reduces nocturnal O3 titration, allowing residual O3 to accumulate. This mechanism highlights that BVOC impacts are not simply additive but interact with background chemistry in ways that vary across the diurnal cycle.
Regional sensitivity analysis provides a quantitative basis for differentiated control strategies. O3 in urban areas is 50 %–290 % more sensitive to temperature than the national average, partly due to urban heat island effects. The YRD and CY show the highest SOA sensitivity to both temperature and soil NOx emissions, indicating that coordinated precursor reductions are needed in these regions. In the PRD, O3 shows the highest temperature sensitivity despite lower emissions, suggesting that mitigating the urban heat island itself may be necessary. In the NCP, the extreme O3 sensitivity to BVOC emissions points to an urgent need for aggressive VOC controls. These region-specific sensitivities, derived directly from the model simulations, offer a practical framework for designing climate-informed air quality policies.
While scenario analysis successfully isolates the key drivers of the 2022 anomaly, using the summer of 2021 as the sole baseline cannot completely separate the heatwave from background interannual weather variability. Nevertheless, this selection is justified by the highly comparable anthropogenic emissions between 2021 and 2022 resulting from continuous national emission control policies, which minimizes the interference of emission fluctuations. Furthermore, although 2021 also experienced high temperatures, the 2022 heatwave remains an unprecedented extreme event across China. The atmospheric conditions in 2021 therefore provide a relatively moderate control case to highlight the impacts of this rare extremity. Future studies should use a multi-year baseline to better separate localized extreme impacts from background climate variability.
Ground-level observation data for the key pollutants are from China's Ministry of Ecology and Environment (https://quotsoft.net/air, last access: 20 March 2026). The FNL reanalysis data are from NCAR (https://doi.org/10.5065/D6M043C6, National Centers for Environmental Prediction/National Weather Service/NOAA/U.S. Department of Commerce, 2000). The WRF model is downloaded from NCAR (https://www.mmm.ucar.edu/models/wrf, last access: 20 March 2026).
The supplement related to this article is available online at https://doi.org/10.5194/acp-26-10789-2026-supplement.
P.W. wrote the main manuscript text, reviewed the original draft, and contributed to conceptualization and methodology. W.Y. contributed to software and validation. Z.Z. contributed to data analysis. J.L. and S.L. contributed to the visualization. H.Z. reviewed and edited the manuscript.
The contact author has declared that none of the authors has any competing interests.
Publisher's note: Copernicus Publications remains neutral with regard to jurisdictional claims made in the text, published maps, institutional affiliations, or any other geographical representation in this paper. The authors bear the ultimate responsibility for providing appropriate place names. Views expressed in the text are those of the authors and do not necessarily reflect the views of the publisher.
The authors gratefully acknowledge the provision of ground-level pollutant data from China's Ministry of Ecology and Environment, and the FNL reanalysis data and WRF model from NCAR.
This research was jointly funded by the National Natural Science Foundation of China (42375178) and the Shanghai Pilot Program for Basic Research – Fudan University 21TQ1400100 (22TQ010).
This paper was edited by Dantong Liu and reviewed by two anonymous referees.
An, N., Chen, Y., Zhai, P., Li, J., and Wei, Y.: Compound hot and ozone extremes in urban China, Urban Climate, 52, 101689, https://doi.org/10.1016/j.uclim.2023.101689, 2023.
An, Z., Huang, R. J., Zhang, R., Tie, X., Li, G., Cao, J., Zhou, W., Shi, Z., Han, Y., Gu, Z., and Ji, Y.: Severe haze in northern China: A synergy of anthropogenic emissions and atmospheric processes, P. Natl. Acad. Sci. USA, 116, 8657–8666, https://doi.org/10.1073/pnas.1900125116, 2019.
Bai, Y., Zhao, T., Hu, W., Zhou, Y., Xiong, J., Wang, Y., Liu, L., Shen, L., Kong, S., Meng, K., and Zheng, H.: Meteorological mechanism of regional PM2.5 transport building a receptor region for heavy air pollution over Central China, Sci. Total Environ., 808, 151951, https://doi.org/10.1016/j.scitotenv.2021.151951, 2022.
Byun, D. and Schere, K. L.: Review of the Governing Equations, Computational Algorithms, and Other Components of the Models-3 Community Multiscale Air Quality (CMAQ) Modeling System, Appl. Mech. Rev., 59, 51–77, https://doi.org/10.1115/1.2128636, 2006.
Cao, J., Situ, S., Hao, Y., Xie, S., and Li, L.: Enhanced summertime ozone and SOA from biogenic volatile organic compound (BVOC) emissions due to vegetation biomass variability during 1981–2018 in China, Atmos. Chem. Phys., 22, 2351–2364, https://doi.org/10.5194/acp-22-2351-2022, 2022.
Chang, K.-H., Yu, J.-Y., Chen, T.-F., and Lin, Y.-P.: Estimating Taiwan biogenic VOC emission: Leaf energy balance consideration, Atmos. Environ., 43, 5092—5100, https://doi.org/10.1016/j.atmosenv.2009.06.038, 2009.
Chen, T., Wang, T., Xue, L., and Brasseur, G.: Heatwave exacerbates air pollution in China through intertwined climate-energy-environment interactions, Sci. Bull., 69, 2765–2775, https://doi.org/10.1016/j.scib.2024.05.018, 2024.
Clinton, N. and Gong, P.: MODIS detected surface urban heat islands and sinks: Global locations and controls, Remote Sens. Environ., 134, 294–304, https://doi.org/10.1016/j.rse.2013.03.008, 2013.
Coates, J., Mar, K. A., Ojha, N., and Butler, T. M.: The influence of temperature on ozone production under varying NOx conditions – a modelling study, Atmos. Chem. Phys., 16, 11601–11615, https://doi.org/10.5194/acp-16-11601-2016, 2016.
Conti, S., Meli, P., Minelli, G., Solimini, R., Toccaceli, V., Vichi, M., Beltrano, C., and Perini, L.: Epidemiologic study of mortality during the Summer 2003 heat wave in Italy, Environ. Res., 98, 390–399, https://doi.org/10.1016/j.envres.2004.10.009, 2005.
Delcloo, A., Duchêne, F., Hamdi, R., Berckmans, J., Deckmyn, A., and Termonia, P.: The impact of heat waves and urban heat island on the production of ozone concentrations under present and future climate conditions for the Belgian domain, Air Pollution Modeling and its Application XXV, 35, 189–193, 2018.
Ding, H., Cao, L., Jiang, H., Jia, W., Chen, Y., and An, J.: Influence on the temperature estimation of the planetary boundary layer scheme with different minimum eddy diffusivity in WRF v3.9.1.1, Geosci. Model Dev., 14, 6135–6153, https://doi.org/10.5194/gmd-14-6135-2021, 2021.
Donahue, N. M., Robinson, A. L., Stanier, C. O., and Pandis, S. N.: Coupled Partitioning, Dilution, and Chemical Aging of Semivolatile Organics, Environ. Sci. Technol., 40, 2635–2643, https://doi.org/10.1021/es052297c, 2006.
Duan, J., Huang, R.-J., Li, Y., Chen, Q., Zheng, Y., Chen, Y., Lin, C., Ni, H., Wang, M., Ovadnevaite, J., Ceburnis, D., Chen, C., Worsnop, D. R., Hoffmann, T., O'Dowd, C., and Cao, J.: Summertime and wintertime atmospheric processes of secondary aerosol in Beijing, Atmos. Chem. Phys., 20, 3793–3807, https://doi.org/10.5194/acp-20-3793-2020, 2020.
Emery, C., Liu, Z., Russell, A. G., Odman, M. T., Yarwood, G., and Kumar, N.: Recommendations on statistics and benchmarks to assess photochemical model performance, J. Air Waste Manage., 67, 582–598, https://doi.org/10.1080/10962247.2016.1265027, 2017.
Eremenko, M., Dufour, G., Foret, G., Keim, C., Orphal, J., Beekmann, M., Bergametti, G., and Flaud, J. M.: Tropospheric ozone distributions over Europe during the heat wave in July 2007 observed from infrared nadir spectra recorded by IASI, Geophys. Res. Lett., 35, https://doi.org/10.1029/2008GL034803, 2008.
Filleul, L., Cassadou, S., Médina, S., Fabres, P., Lefranc, A., Eilstein, D., Le Tertre, A., Pascal, L., Chardon, B., Blanchard, M., Declercq, C., Jusot, J.-F., Prouvost, H., and Ledrans, M.: The Relation Between Temperature, Ozone, and Mortality in Nine French Cities During the Heat Wave of 2003, Environ. Health Persp., 114, 1344–1347, https://doi.org/10.1289/ehp.8328, 2006.
García-García, A., Cuesta-Valero, F. J., Miralles, D. G., Mahecha, M. D., Quaas, J., Reichstein, M., Zscheischler, J., and Peng, J.: Soil heat extremes can outpace air temperature extremes, Nat. Clim. Change, 13, 1237–1241, https://doi.org/10.1038/s41558-023-01812-3, 2023.
Guenther, A. B., Jiang, X., Heald, C. L., Sakulyanontvittaya, T., Duhl, T., Emmons, L. K., and Wang, X.: The Model of Emissions of Gases and Aerosols from Nature version 2.1 (MEGAN2.1): an extended and updated framework for modeling biogenic emissions, Geosci. Model Dev., 5, 1471–1492, https://doi.org/10.5194/gmd-5-1471-2012, 2012.
Hu, F. and Guo, Y.: Health impacts of air pollution in China, Front. Env. Sci. Eng., 15, 74, https://doi.org/10.1007/s11783-020-1367-1, 2020.
Huang, J., Pan, X., Guo, X., and Li, G.: Health impact of China's Air Pollution Prevention and Control Action Plan: an analysis of national air quality monitoring and mortality data, Lancet – Planetary Health, 2, e313–e323, https://doi.org/10.1016/s2542-5196(18)30141-4, 2018.
Huang, L., Fang, J., Liao, J., Yarwood, G., Chen, H., Wang, Y., and Li, L.: Insights into soil NO emissions and the contribution to surface ozone formation in China, Atmos. Chem. Phys., 23, 14919–14932, https://doi.org/10.5194/acp-23-14919-2023, 2023.
Huang, R.-J., Zhang, Y., Bozzetti, C., Ho, K.-F., Cao, J.-J., Han, Y., Daellenbach, K. R., Slowik, J. G., Platt, S. M., Canonaco, F., Zotter, P., Wolf, R., Pieber, S. M., Bruns, E. A., Crippa, M., Ciarelli, G., Piazzalunga, A., Schwikowski, M., Abbaszade, G., Schnelle-Kreis, J., Zimmermann, R., An, Z., Szidat, S., Baltensperger, U., Haddad, I. E., and Prévôt, A. S. H.: High secondary aerosol contribution to particulate pollution during haze events in China, Nature, 514, 218–222, https://doi.org/10.1038/nature13774, 2014.
Huang, X., Ding, A., Wang, Z., Ding, K., Gao, J., Chai, F., and Fu, C.: Amplified transboundary transport of haze by aerosol–boundary layer interaction in China, Nat. Geosci., 13, 428–434, https://doi.org/10.1038/s41561-020-0583-4, 2020.
Huang, X., Tang, G., Zhang, J., Liu, B., Liu, C., Zhang, J., Cong, L., Cheng, M., Yan, G., Gao, W., Wang, Y., and Wang, Y.: Characteristics of PM2.5 pollution in Beijing after the improvement of air quality, J. Environ. Sci., 100, 1–10, https://doi.org/10.1016/j.jes.2020.06.004, 2021.
Ji, X., Chen, G., Chen, J., Xu, L., Lin, Z., Zhang, K., Fan, X., Li, M., Zhang, F., Wang, H., Huang, Z., and Hong, Y.: Meteorological impacts on the unexpected ozone pollution in coastal cities of China during the unprecedented hot summer of 2022, Sci. Total Environ., 914, 170035, https://doi.org/10.1016/j.scitotenv.2024.170035, 2024.
Li, D., Shindell, D., Ding, D., Lu, X., Zhang, L., and Zhang, Y.: Surface ozone impacts on major crop production in China from 2010 to 2017, Atmos. Chem. Phys., 22, 2625–2638, https://doi.org/10.5194/acp-22-2625-2022, 2022.
Li, K., Jacob, D. J., Shen, L., Lu, X., De Smedt, I., and Liao, H.: Increases in surface ozone pollution in China from 2013 to 2019: anthropogenic and meteorological influences, Atmos. Chem. Phys., 20, 11423–11433, https://doi.org/10.5194/acp-20-11423-2020, 2020.
Li, M., Huang, X., Yan, D., Lai, S., Zhang, Z., Zhu, L., Lu, Y., Jiang, X., Wang, N., Wang, T., Song, Y., and Ding, A.: Coping with the concurrent heatwaves and ozone extremes in China under a warming climate, Sci. Bull., https://doi.org/10.1016/j.scib.2024.05.034, 2024.
Li, Y., Qin, M., Hu, W., Zhao, B., Li, Y., Pye, H. O. T., Li, J., Zeng, L., Guo, S., Hu, M., and Hu, J.: Evaluating simulations of organic aerosol volatility and degree of oxygenation in eastern China , Atmos. Chem. Phys., 26, 1001–1020, https://doi.org/10.5194/acp-26-1001-2026, 2026.
Lin, H., Ding, K., Huang, X., Lou, S., Xue, L., Wang, Z., Ma, Y., and Ding, A.: Impacts of Northward Typhoons on Autumn Haze Pollution Over North China Plain, J. Geophys. Res.-Atmos., 129, e2023JD040465, https://doi.org/10.1029/2023JD040465, 2024.
Liu, T., Hong, Y., Li, M., Xu, L., Chen, J., Bian, Y., Yang, C., Dan, Y., Zhang, Y., Xue, L., Zhao, M., Huang, Z., and Wang, H.: Atmospheric oxidation capacity and ozone pollution mechanism in a coastal city of southeastern China: analysis of a typical photochemical episode by an observation-based model, Atmos. Chem. Phys., 22, 2173–2190, https://doi.org/10.5194/acp-22-2173-2022, 2022.
Liu, Y. and Wang, T.: Worsening urban ozone pollution in China from 2013 to 2017 – Part 1: The complex and varying roles of meteorology, Atmos. Chem. Phys., 20, 6305–6321, https://doi.org/10.5194/acp-20-6305-2020, 2020.
Liu, Z., Wang, Y., Gu, D., Zhao, C., Huey, L. G., Stickel, R., Liao, J., Shao, M., Zhu, T., Zeng, L., Amoroso, A., Costabile, F., Chang, C.-C., and Liu, S.-C.: Summertime photochemistry during CAREBeijing-2007: ROx budgets and O3 formation, Atmos. Chem. Phys., 12, 7737–7752, https://doi.org/10.5194/acp-12-7737-2012, 2012.
Lu, R., Xu, K., Chen, R., Chen, W., Li, F., and Lv, C.: Heat waves in summer 2022 and increasing concern regarding heat waves in general, Atmos. Ocean. Sc. Lett., 16, 100290, https://doi.org/10.1016/j.aosl.2022.100290, 2023.
Luo, M. and Lau, N.-C.: Heat Waves in Southern China: Synoptic Behavior, Long-Term Change, and Urbanization Effects, Environ. Sci. Technol., 30, 703–720, https://doi.org/10.1175/JCLI-D-16-0269.1, 2017.
Lyu, X., Li, K., Guo, H., Morawska, L., Zhou, B., Zeren, Y., Jiang, F., Chen, C., Goldstein, A. H., Xu, X., Wang, T., Lu, X., Zhu, T., Querol, X., Chatani, S., Latif, M. T., Schuch, D., Sinha, V., Kumar, P., Mullins, B., Seguel, R., Shao, M., Xue, L., Wang, N., Chen, J., Gao, J., Chai, F., Simpson, I., Sinha, B., and Blake, D. R.: A synergistic ozone-climate control to address emerging ozone pollution challenges, One Earth, 6, 964–977, https://doi.org/10.1016/j.oneear.2023.07.004, 2023.
Ma, M., Gao, Y., Wang, Y., Zhang, S., Leung, L. R., Liu, C., Wang, S., Zhao, B., Chang, X., Su, H., Zhang, T., Sheng, L., Yao, X., and Gao, H.: Substantial ozone enhancement over the North China Plain from increased biogenic emissions due to heat waves and land cover in summer 2017, Atmos. Chem. Phys., 19, 12195–12207, https://doi.org/10.5194/acp-19-12195-2019, 2019.
Megaritis, A. G., Fountoukis, C., Charalampidis, P. E., Pilinis, C., and Pandis, S. N.: Response of fine particulate matter concentrations to changes of emissions and temperature in Europe, Atmos. Chem. Phys., 13, 3423–3443, https://doi.org/10.5194/acp-13-3423-2013, 2013.
Meng, X., Jiang, J., Chen, T., Zhang, Z., Lu, B., Liu, C., Xue, L., Chen, J., Herrmann, H., and Li, X.: Chemical drivers of ozone change in extreme temperatures in eastern China, Sci. Total Environ., 874, 162424, https://doi.org/10.1016/j.scitotenv.2023.162424, 2023.
Mousavinezhad, S., Choi, Y., Pouyaei, A., Ghahremanloo, M., and Nelson, D. L.: A comprehensive investigation of surface ozone pollution in China, 2015–2019: Separating the contributions from meteorology and precursor emissions, Atmos. Res., 257, 105599, https://doi.org/10.1016/j.atmosres.2021.105599, 2021.
Nasong, D., Zhou, S., Kornhuber, K., and Yu, B.: Concurrent Heat Extremes in Relation to Global Warming, High Atmospheric Pressure and Low Soil Moisture in the Northern Hemisphere, Earth's Future, 13, e2024EF005256, https://doi.org/10.1029/2024EF005256, 2025.
National Centers for Environmental Prediction/National Weather Service/NOAA/U.S. Department of Commerce: NCEP FNL Operational Model Global Tropospheric Analyses, continuing from July 1999, updated daily, NSF National Center for Atmospheric Research [data set], https://doi.org/10.5065/D6M043C6, 2000.
Oh, H.-J., Chen, Y., and Kim, H.: Deposition of secondary organic aerosol in human lung model: Effect of photochemically aged aerosol on human respiratory system, Ecotox. Environ. Safe., 265, 115497, https://doi.org/10.1016/j.ecoenv.2023.115497, 2023.
Oikawa, P. Y., Ge, C., Wang, J., Eberwein, J. R., Liang, L. L., Allsman, L. A., Grantz, D. A., and Jenerette, G. D.: Unusually high soil nitrogen oxide emissions influence air quality in a high-temperature agricultural region, Nat. Commun., 6, 8753, https://doi.org/10.1038/ncomms9753, 2015.
Oke, T. R.: The energetic basis of the urban heat island, Q. J. Roy. Meteor. Soc., 108, 1–24, https://doi.org/10.1002/qj.49710845502, 1982.
Otero, N., Sillmann, J., Schnell, J. L., Rust, H. W., and Butler, T.: Synoptic and meteorological drivers of extreme ozone concentrations over Europe, Environ. Res. Lett., 11, 024005, https://doi.org/10.1088/1748-9326/11/2/024005, 2016.
Ou, J., Yuan, Z., Zheng, J., Huang, Z., Shao, M., Li, Z., Huang, X., Guo, H., and Louie, P. K. K.: Ambient Ozone Control in a Photochemically Active Region: Short-Term Despiking or Long-Term Attainment?, Environ. Sci. Technol., 50, 5720–5728, https://doi.org/10.1021/acs.est.6b00345, 2016.
Seco, R., Holst, T., Davie-Martin, C. L., Simin, T., Guenther, A., Pirk, N., Rinne, J., and Rinnan, R.: Strong isoprene emission response to temperature in tundra vegetation, P. Natl. Acad. Sci., 119, e2118014119, https://doi.org/10.1073/pnas.2118014119, 2022.
Shao, T., Wang, P., Yu, W., Gao, Y., Zhu, S., Zhang, Y., Hu, D., Zhang, B., and Zhang, H.: Drivers of alleviated PM2.5 and O3 concentrations in China from 2013 to 2020, Resour. Conserv. Recy., 197, 107110, https://doi.org/10.1016/j.resconrec.2023.107110, 2023.
Sillman, S.: The use of NOy, H2O2, and HNO3 as indicators for ozone-NOx-hydrocarbon sensitivity in urban locations, J. Geophys. Res.-Atmos., 100, 14175–14188, https://doi.org/10.1029/94JD02953, 1995.
Su, X., Yan, X., and Tsai, C.-L.: Linear regression, WIREs Computational Statistics, 4, 275–294, https://doi.org/10.1002/wics.1198, 2012.
Sun, Y., Zhang, X., Zwiers, F. W., Song, L., Wan, H., Hu, T., Yin, H., and Ren, G.: Rapid increase in the risk of extreme summer heat in Eastern China, Nat. Clim. Change, 4, 1082–1085, https://doi.org/10.1038/nclimate2410, 2014.
Tian, Y., Kleidon, A., Lesk, C., Zhou, S., Luo, X., Ghausi, S. A., Wang, G., Zhong, D., and Zscheischler, J.: Characterizing heatwaves based on land surface energy budget, Commun. Earth Environ., 5, 617, https://doi.org/10.1038/s43247-024-01784-y, 2024.
Wang, H., Wu, K., Liu, Y., Sheng, B., Lu, X., He, Y., Xie, J., Wang, H., and Fan, S.: Role of Heat Wave-Induced Biogenic VOC Enhancements in Persistent Ozone Episodes Formation in Pearl River Delta, J. Geophys. Res.-Atmos., 126, e2020JD034317, https://doi.org/10.1029/2020JD034317, 2021a.
Wang, J., Ye, J., Zhang, Q., Zhao, J., Wu, Y., Li, J., Liu, D., Li, W., Zhang, Y., Wu, C., Xie, C., Qin, Y., Lei, Y., Huang, X., Guo, J., Liu, P., Fu, P., Li, Y., Lee, H. C., Choi, H., Zhang, J., Liao, H., Chen, M., Sun, Y., Ge, X., Martin, S. T., and Jacob, D. J.: Aqueous production of secondary organic aerosol from fossil-fuel emissions in winter Beijing haze, P. Natl. Acad. Sci., 118, e2022179118, https://doi.org/10.1073/pnas.2022179118, 2021b.
Wang, J., Wang, D., Ge, B., Lin, W., Ji, D., Pan, X., Li, J., and Wang, Z.: Increase in daytime ozone exposure due to nighttime accumulation in a typical city in eastern China during 2014–2020, Atmos. Pollut. Res., 13, 101387, https://doi.org/10.1016/j.apr.2022.101387, 2022.
Wang, N., Lyu, X., Deng, X., Huang, X., Jiang, F., and Ding, A.: Aggravating O3 pollution due to NOx emission control in eastern China, Sci. Total Environ., 677, 732–744, https://doi.org/10.1016/j.scitotenv.2019.04.388, 2019.
Wang, N., Du, Y., Chen, D., Meng, H., Chen, X., Zhou, L., Shi, G., Zhan, Y., Feng, M., Li, W., Chen, M., Li, Z., and Yang, F.: Spatial disparities of ozone pollution in the Sichuan Basin spurred by extreme, hot weather, Atmos. Chem. Phys., 24, 3029–3042, https://doi.org/10.5194/acp-24-3029-2024, 2024.
Wang, Y., Du, H., Xu, Y., Lu, D., Wang, X., and Guo, Z.: Temporal and spatial variation relationship and influence factors on surface urban heat island and ozone pollution in the Yangtze River Delta, China, Sci. Total Environ., 631–632, 921–933, https://doi.org/10.1016/j.scitotenv.2018.03.050, 2018.
Weng, Z., Tong, D., Wu, S., and Xie, Y.: Improved air quality from China's clean air actions alleviates health expenditure inequality, Environ. Int., 173, 107831, https://doi.org/10.1016/j.envint.2023.107831, 2023.
Xing, J., Wang, J., Mathur, R., Wang, S., Sarwar, G., Pleim, J., Hogrefe, C., Zhang, Y., Jiang, J., Wong, D. C., and Hao, J.: Impacts of aerosol direct effects on tropospheric ozone through changes in atmospheric dynamics and photolysis rates, Atmos. Chem. Phys., 17, 9869–9883, https://doi.org/10.5194/acp-17-9869-2017, 2017.
Yuan, Y., Liao, Z., Zhou, B., and Zhai, P.: Unprecedented Hot Extremes Observed in City Clusters in China during Summer 2022, J. Meteorol. Res., 37, 141–148, https://doi.org/10.1007/s13351-023-2184-9, 2023.
Zhang, H., Yee, L. D., Lee, B. H., Curtis, M. P., Worton, D. R., Isaacman-VanWertz, G., Offenberg, J. H., Lewandowski, M., Kleindienst, T. E., Beaver, M. R., Holder, A. L., Lonneman, W. A., Docherty, K. S., Jaoui, M., Pye, H. O. T., Hu, W., Day, D. A., Campuzano-Jost, P., Jimenez, J. L., Guo, H., Weber, R. J., de Gouw, J., Koss, A. R., Edgerton, E. S., Brune, W., Mohr, C., Lopez-Hilfiker, F. D., Lutz, A., Kreisberg, N. M., Spielman, S. R., Hering, S. V., Wilson, K. R., Thornton, J. A., and Goldstein, A. H.: Monoterpenes are the largest source of summertime organic aerosol in the southeastern United States, P. Natl. Acad. Sci., 115, 2038–2043, https://doi.org/10.1073/pnas.1717513115, 2018.
Zhang, J., Su, Y., Chen, C., Guo, W., Tan, Q., Feng, M., Song, D., Jiang, T., Chen, Q., Li, Y., Li, W., Wang, Y., Huang, X., Han, L., Wu, W., and Wang, G.: Chemical composition, sources and formation mechanism of urban PM2.5 in Southwest China: a case study at the beginning of 2023, Atmos. Chem. Phys., 24, 2803–2820, https://doi.org/10.5194/acp-24-2803-2024, 2024.
Zhang, Q., Zheng, Y., Tong, D., Shao, M., Wang, S., Zhang, Y., Xu, X., Wang, J., He, H., Liu, W., Ding, Y., Lei, Y., Li, J., Wang, Z., Zhang, X., Wang, Y., Cheng, J., Liu, Y., Shi, Q., Yan, L., Geng, G., Hong, C., Li, M., Liu, F., Zheng, B., Cao, J., Ding, A., Gao, J., Fu, Q., Huo, J., Liu, B., Liu, Z., Yang, F., He, K., and Hao, J.: Drivers of improved PM2.5 air quality in China from 2013 to 2017, P. Natl. Acad. Sci., 116, 24463–24469, https://doi.org/10.1073/pnas.1907956116, 2019.
Zhang, Y., Dai, J., Li, Q., Chen, T., Mu, J., Brasseur, G., Wang, T., and Xue, L.: Biogenic volatile organic compounds enhance ozone production and complicate control efforts: Insights from long-term observations in Hong Kong, Atmos. Environ., 309, 119917, https://doi.org/10.1016/j.atmosenv.2023.119917, 2023.
Zhang, Y., Ran, H., Guenther, A., Zhang, Q., George, C., Mellouki, W., Sheng, G., Peng, P. A., and Wang, X.: Improved modelling of biogenic emissions in human-disturbed forest edges and urban areas, Nat. Commun., 16, 8064, https://doi.org/10.1038/s41467-025-63437-8, 2025.
Zhao, B., Zheng, H., Wang, S., Smith, K. R., Lu, X., Aunan, K., Gu, Y., Wang, Y., Ding, D., Xing, J., Fu, X., Yang, X., Liou, K.-N., and Hao, J.: Change in household fuels dominates the decrease in PM2.5 exposure and premature mortality in China in 2005–2015, P. Natl. Acad. Sci., 115, 12401–12406, https://doi.org/10.1073/pnas.1812955115, 2018.
Zhao, J., Lv, Z., Qi, L., Zhao, B., Deng, F., Chang, X., Wang, X., Luo, Z., Zhang, Z., Xu, H., Ying, Q., Wang, S., He, K., and Liu, H.: Comprehensive Assessment for the Impacts of S/IVOC Emissions from Mobile Sources on SOA Formation in China, Environ. Sci. Technol., 56, 16695–16706, https://doi.org/10.1021/acs.est.2c07265, 2022.
Zheng, B., Tong, D., Li, M., Liu, F., Hong, C., Geng, G., Li, H., Li, X., Peng, L., Qi, J., Yan, L., Zhang, Y., Zhao, H., Zheng, Y., He, K., and Zhang, Q.: Trends in China's anthropogenic emissions since 2010 as the consequence of clean air actions, Atmos. Chem. Phys., 18, 14095–14111, https://doi.org/10.5194/acp-18-14095-2018, 2018.
Zheng, Y., Xue, T., Zhang, Q., Geng, G., Tong, D., Li, X., and He, K.: Air quality improvements and health benefits from China's clean air action since 2013, Environ. Res. Lett., 12, 114020, https://doi.org/10.1088/1748-9326/aa8a32, 2017.
Zhu, S., Poetzscher, J., Shen, J., Wang, S., Wang, P., and Zhang, H.: Comprehensive Insights Into O3 Changes During the COVID-19 From O3 Formation Regime and Atmospheric Oxidation Capacity, Geophys. Res. Lett., 48, e2021GL093668, https://doi.org/10.1029/2021GL093668, 2021.
Zhu, S., Ma, J., Wang, S., Sun, S., Wang, P., and Zhang, H.: Shifts of Formation Regimes and Increases of Atmospheric Oxidation Led to Ozone Increase in North China Plain and Yangtze River Delta From 2016 to 2019, J. Geophys. Res.-Atmos., 128, e2022JD038373, https://doi.org/10.1029/2022JD038373, 2023.
Zhu, X., Ma, Z., Li, Z., Wu, J., Guo, H., Yin, X., Ma, X., and Qiao, L.: Impacts of meteorological conditions on nocturnal surface ozone enhancement during the summertime in Beijing, Atmos. Environ., 225, 117368, https://doi.org/10.1016/j.atmosenv.2020.117368, 2020.