
the Creative Commons Attribution 4.0 License.
the Creative Commons Attribution 4.0 License.
 | 30 Jul 2026
Detection and quantification of agricultural methane plumes using MethaneAIR through targeted scene selection, wavelet denoising, and divergence-integral analysis
Penelope Smale
Alexander Geddes
Sara Mikaloff-Fletcher
Zhan Zhang
Apisada Chulakadabba
MaryAnn Sargent
Christopher C. Miller
Sébastien Roche
Joseph Rudek
Jonathan Franklin
Jack Warren
Steven Wofsy
Methane is a potent greenhouse gas, and accurate emission estimates are essential for effective climate mitigation. Agricultural sources, particularly concentrated animal feeding operations (CAFOs), are significant anthropogenic contributors, yet their emissions remain difficult to quantify, contributing to uncertainty in inventories.
MethaneAIR, an aircraft-based imaging spectrometer and precursor to MethaneSAT, was primarily developed to characterize methane emissions from oil and gas infrastructure. Between 2021 and 2024, MethaneAIR conducted 75 flights across the United States and Canada, producing orthorectified mosaics of column-averaged methane. These data were used to assess agricultural emissions at high resolution using a targeted scene-based analysis framework designed to enhance detection and quantification of weak agricultural plumes. Wavelet denoising and a Gaussian-based Divergence Integral method were applied to 209 agricultural scenes coincident with 84 CAFOs. Detection performance varies with emission strength, wind conditions, and background variability, and is therefore conditional on favourable detection conditions. A robustness-based criterion is used to interpret quantification results rather than defining a single fixed detection threshold. Of 200 identified plumes, 89 met our quantitative robustness criteria and were analysed further, with emphasis on northeast Colorado.
While limited on-farm data, such as the number of animals and waste management practices, constrained the ability to fully interpret emission drivers, the analysis revealed emissions that are frequently elevated relative to inventory estimates under detectable conditions and exhibit high variability, likely influenced by interactions between wind and waste management systems. These findings highlight variability not captured in annual inventories and inform the design of future satellite missions like MethaneSAT, which will improve global methane monitoring and climate models. With improved on-farm information, this approach could provide a scalable pathway for emission and mitigation verification.
- Article
(11683 KB) - Full-text XML
- BibTeX
- EndNote


Methane (CH4) emission reductions are an effective method to mitigate near term climate change as CH4 is both a potent greenhouse gas (GHG) and short lived (IPCC, 2023). Global atmospheric methane has increased substantially since pre-industrial values (Saunois et al., 2025) with a record high growth rate between 2020 and 2022 (Michel et al., 2024). Globally, agriculture is the largest anthropogenic methane source, at 40 % (Saunois et al., 2025). This is in turn dominated by emissions from livestock agriculture in the form of enteric fermentation and manure management.
Enteric fermentation is a natural digestive process in ruminant animals where anaerobic microbes (methanogens) break down feed, producing methane (CH4) as a byproduct, released through burping. The quantity of CH4 produced is dependent on animal species, animal life stage, diet composition, feed intake, and digestive efficiency (Roques et al., 2024).
Within manure management systems, open anaerobic lagoons are a particularly important source of methane emissions. These lagoons emit methane through microbial decomposition and are highly sensitive to environmental conditions such as wind and temperature, which can influence emission rates and plume detectability (Golston et al., 2020; Ouatahar et al., 2024). In the USA, 36 % of anthropogenic methane emissions are attributed to agriculture (U.S. Environmental Protection Agency, 2024).
CH4 emissions can be quantified using bottom-up (reported inventory) and top-down (atmospheric measurement) approaches. Inventories of agricultural methane emissions, used for tracking and reporting, are primarily based on an emission factor (EF) per-animal (IPCC, 2006), which can be a default value or use more detailed country-specific information to account for different animals, feed types and management practices (IPCC, 2019). As part of the United States GHG reporting, the Environmental Protection Agency (EPA) Methane inventory applies regional, animal, and process specific EF's (IPCC's tier 3) including enteric fermentation and manure management and is made available in a gridded format on an annual basis. However, methane emissions can vary considerably temporally far beyond the mean, due to animal behaviour, management practices, diet, and environmental conditions (Tedeschi et al., 2022; Leytem et al., 2017; Mead et al., 2024; Golston et al., 2020). While emission inventories are adopting more sophisticated methods to estimate methane emission factors (Maasakkers et al., 2023; Mead et al., 2024), substantial uncertainties persist. This is exacerbated when considering individual farms and facilities.
Top-down measurements, where atmospheric methane concentrations are used to infer emission rates, have been widely applied at global to regional scales (e.g. Worden et al. (2022) and Jacob et al. (2022)) supporting the validation and refinement of emission inventories (Maasakkers et al., 2019). However, discrepancies between bottom-up and top-down approaches exist, with several reports of inventory underestimating regional and national emissions compared to top-down approaches (Jacob et al., 2016; Jacob et al., 2022; Saunois et al., 2025; Yu et al., 2021; Wójcik-Gront and Wnuk, 2025). Incongruities arise from multiple sources; for example, bottom-up approaches do not always account for all methane sources (National Academies of Sciences, Engineering, and Medicine, 2018), while top-down do not generally have spatial and temporal resolutions to identify and quantify sources (Saunois et al., 2025), though this is changing with high resolution point source mappers.
At a facility level, top-down approaches have advanced significantly through the widespread use of techniques such as hyperspectral imaging, enabling a shift to plume quantification (Varon et al., 2018; Li et al., 2024; Schuit et al., 2023). TROPOMI and GHGSat have been used to detect large methane plumes, including those from urban areas and landfills. Varon et al. (2018), using GHGSat-D, demonstrated that emissions as small as 0.03 t h−1 could be detected under controlled conditions. Building on this, Sherwin et al. (2024) evaluated nine satellite platforms including GHGSat-C, PRISMA, EnMAP, WorldView-3, Sentinel-2, and Landsat 8 and confirmed that GHGSat-C was capable of detecting emissions down to 0.03 t h−1, while other systems exhibited minimum detection thresholds ranging from approximately 0.2 to 7.2 t h−1. Wind speed was identified as a key source of uncertainty in quantification (Sherwin et al., 2024). Li et al. (2024) used the Chinese GF5-01A/02 hyperspectral satellites to detect oil and gas plumes across North America, with emission rates ranging from 0.52 to 16.07 t h−1. Schuit et al. (2023) notes that targeting known emission sites improves detection, and Li et al. (2024) similarly suggest that future surveys could benefit from more targeted assessments with additional data. Although agricultural methane emissions are commonly treated as spatially diffuse, concentrated animal feeding operations (CAFOs) can act as localized methane sources capable of producing coherent plumes that are not fully resolved at the spatial scales of typical satellite products.
MethaneSAT, a combined American initiative led by the Environmental Defense Fund (EDF) and its subsidiary MethaneSAT LLC, together with Aotearoa New Zealand partners, was developed and launched in 2024 with the primary purpose to quantify oil and gas CH4 emissions at better spatial and temporal resolution than existing satellite measurements (Chan Miller et al., 2024). The MethaneSAT has a native resolution of 100×400 m over targeted 200 km × 200 km regions of interest with precision of 2–3 ppb at 1.5×1.5 km resolution. This unique combination is ideal for wide scale monitoring of oil and gas emissions and other large point sources, such as intensive livestock operations, as well as diffuse agriculture. Although communication with MethaneSAT was lost in 2025, the satellite collected a vast amount of data that can be analyzed to provide derived techniques and information applicable to future missions.
MethaneAIR, is an aircraft-based precursor to MethaneSAT with similar spectroscopy and has by flown on ∼ 75 flights from 2021 to 2024 in targeted regions of USA and Canada (Fig. 1). Techniques developed to identify and quantify CH4 emission sources using MethaneAIR data are transferable to MethaneSAT and other satellite platforms, with the MethaneAIR data being used to directly test MethaneSAT algorithms and for validation with coordinated campaigns. MethaneAIR flight data has been used successfully to quantify oil and gas point sources (Guanter et al., 2025; Chulakadabba et al., 2023). Using mosaic images Chulakadabba applied both a physics based, Integrated Mass enhancement (IME) and a Divergence Integral (DI) method to estimate emission rates. Both methods detect single blind controlled releases. The IME method, which used winds from weather simulations, was able to detect 200 kg h−1 while the DI was effective over 500 kg h−1 (Chulakadabba et al., 2023). Guanter et al. (2025) used an optimized processing chain to retrieve ΔXCH4 (change in column-averaged methane concentration) on MethaneAIR L1B data (calibrated and georeferenced) showing the ability to detect plumes with emission rates of 120 kg h−1. In this work we present a modification of the workflow used in Chulakadabba et al. (2023) by combining with the wavelet denoising method described by Zhang et al. (2024) via subsetting of area maps. This allows the far weaker CAFO plumes to not only be detected but quantified.
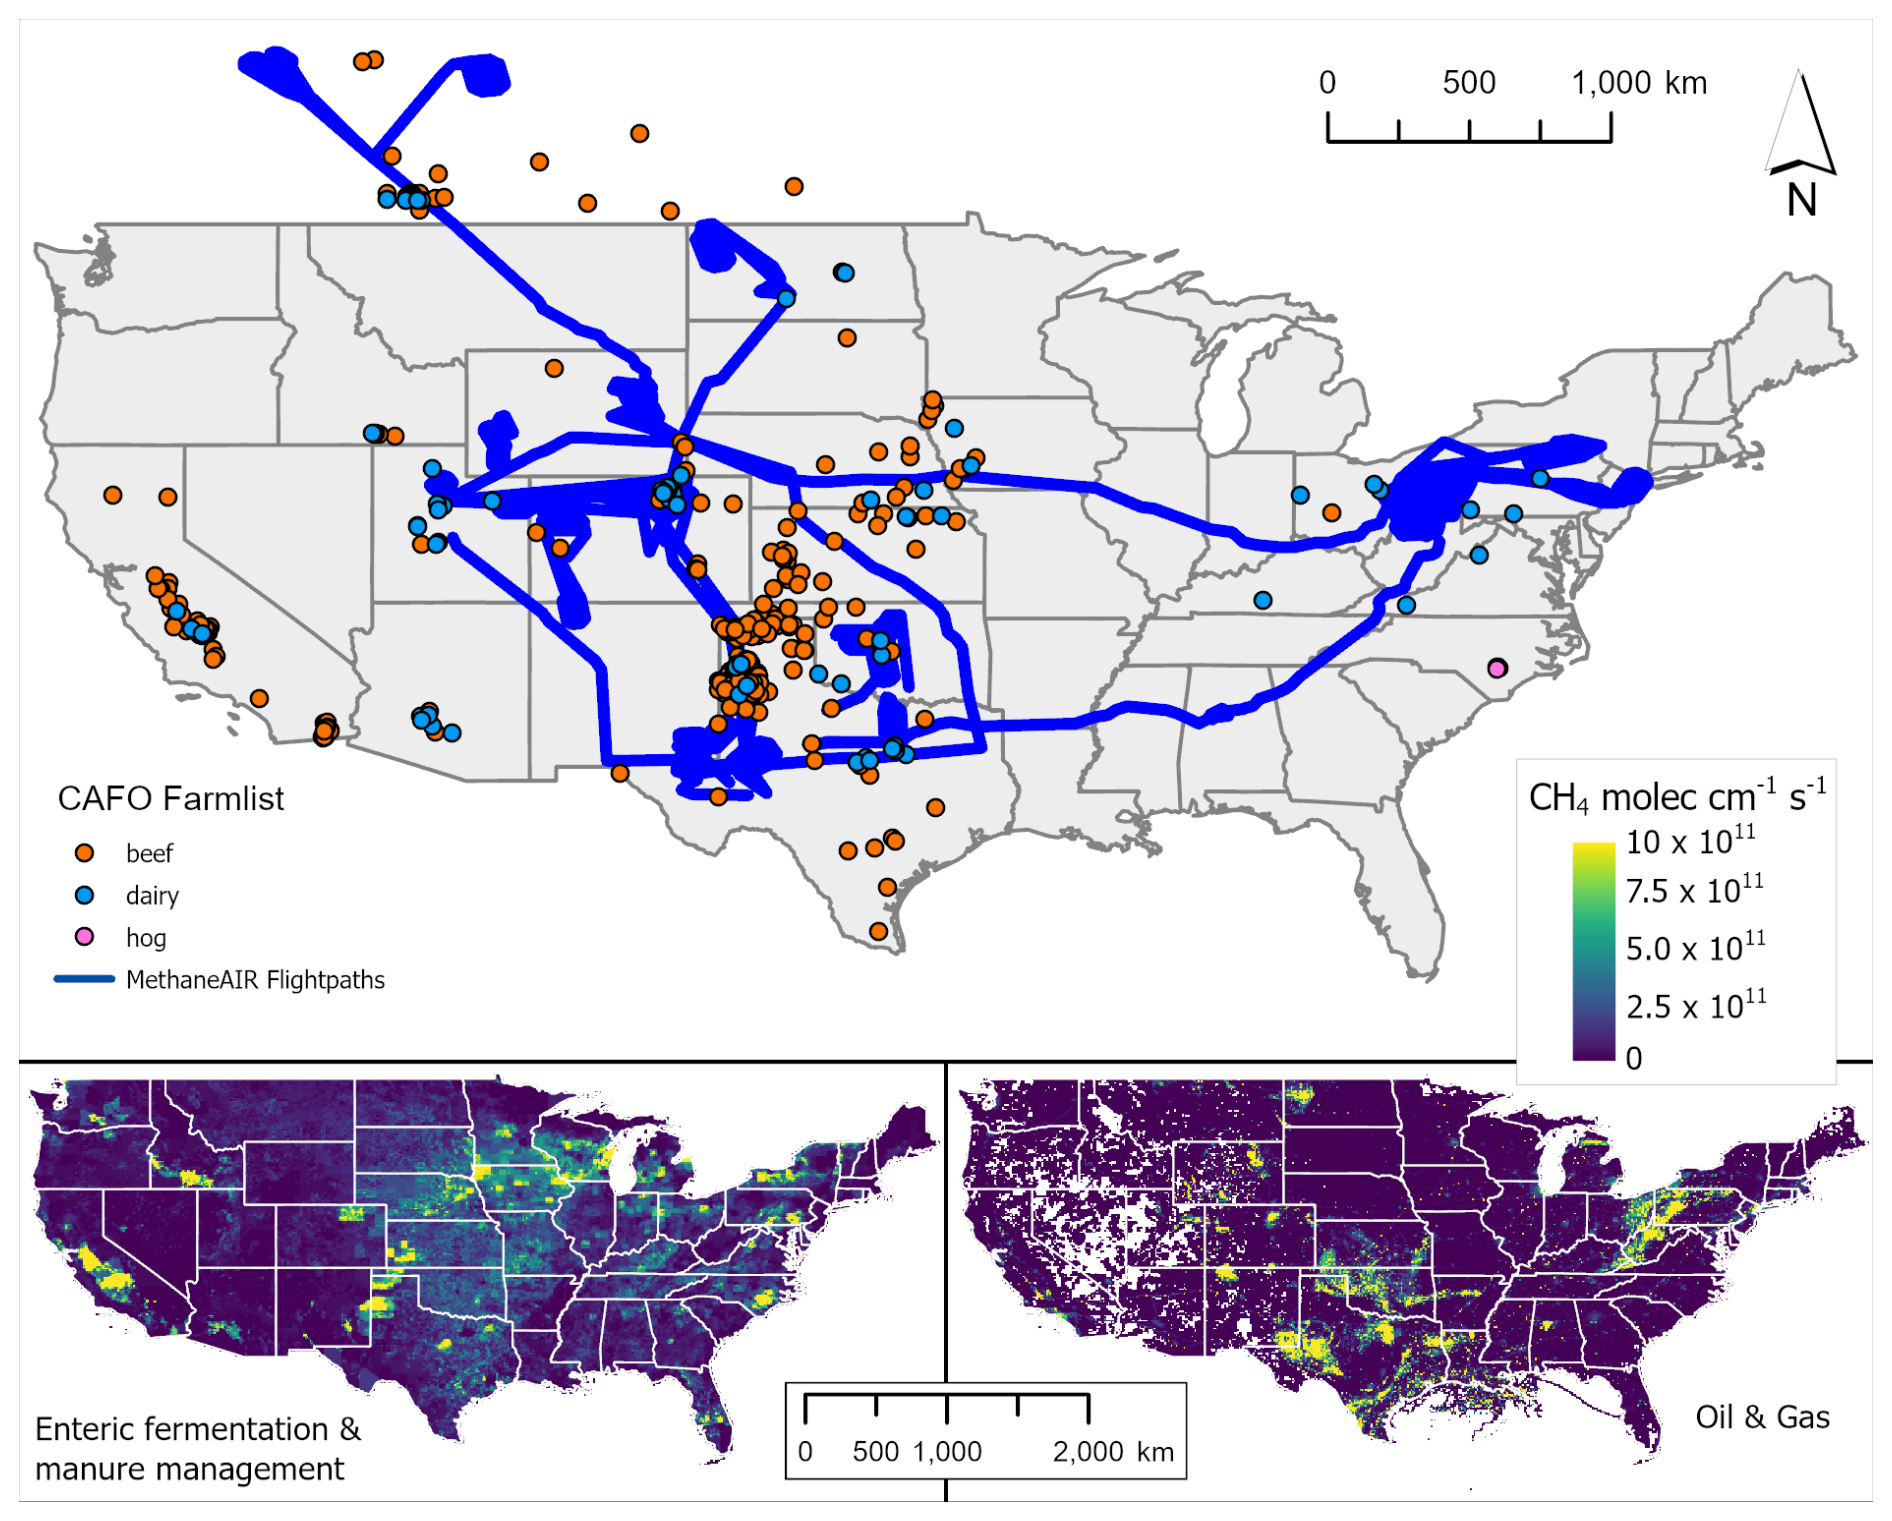
Figure 1(Top) MethaneAIR flightpaths and Distribution of CAFO targets on initial Farm-list. (bottom left) EPA gridded inventory field for combined enteric fermentation and manure management, and (bottom right) oil and gas (Maasakkers et al., 2023). USA administrative boundaries from Esri Data and Maps (derived from U.S. Census Bureau) | Powered by Esri.
Whilst several aircraft-based campaigns have been performed to measure methane emissions over oil and gas production (e.g. Peischl et al., 2016; Karion et al., 2013; Chen et al., 2022), there are a limited number that have focused on Agricultural emissions. One study that separated aircraft derived Agricultural methane emissions from oil and gas was that by McCabe et al. (2023) where they determined rates of 13 +-2 g of CH4 animal−1 h−1 for a single CAFO, which was considerably higher than reported in the EPA inventory. Background noise and wind speed are attributed as being major sources of uncertainty for plume detection (Saunois et al., 2025; Hancock et al., 2025; Petrescu et al., 2024). Tedeschi et al (2022) emphasized the need to use both top-down and bottom-up methods to improve methane estimates.
This work quantifies agricultural plumes using a combination of MethaneAIR mosaics and known locations of CAFOs. Agricultural Scenes derived using these data are then processed using a wavelet denoising method to identify and mask plumes which are then quantified by the Divergence integral (DI) method. Robust plumes associated with CAFO's are quantified and discussed in relation to reported values from inventories and past studies.
2.1 Farm-list Development
The farm list comprises identified Concentrated Animal Feeding Operations (CAFOs), including their locations, types, and estimated maximum methane emissions. Site identification was initially guided by existing inventories (Maasakkers et al., 2023; Chang et al., 2021; Crippa et al., 2021), satellite imagery (Google Earth, © Google), and Climate TRACE agricultural-sector emissions estimates described by Davitt et al. (2024). Verification was conducted using business information from Google Maps (© Google) and visible signage via Google Street View (© Google).
CAFOs were included if they were estimated to emit more than 100 kg CH4 h−1, equivalent to ∼ 60 000–20 000 cattle depending on type and management, based on national emission factors and maximum reported livestock numbers (U.S. Environmental Protection Agency, 2024). Sites were also required to be sufficiently distant from oil and gas infrastructure to allow for source separation. Maximum livestock capacity was determined using the following hierarchy of data sources: (1) state-reported values, (2) self-reported data, (3) facility footprint and type, and (4) inventory estimates. Emissions were then calculated using EPA emission factors.
Each CAFO was assigned a unique numeric identifier. Prior to each MethaneAIR flight (2023), CAFOs near the planned flight path were supplied to flight planners for them to be flown over if the mission would allow. After flight completion, additional CAFOs intersected by the actual flight paths were identified and added to the list, including smaller facilities.
2.2 MethaneAIR data
MethaneAIR uses a pair of grating spectrometers: one targeting absorption bands at 1.61 and 1.65 µm for CO2 and CH4 detection, and another at 1.27 µm for O2, used to constrain the optical path length (Staebell et al., 2021). Installed and tested on NSF research aircraft in 2019 (Staebell et al., 2021), MethaneAIR operates at ∼ 12 km altitude with a swath width of ∼ 5.05 km and spatial resolution of ∼ 6 × 20 m. Its design enables high retrieval precision (∼ 17–20 ppb over flat terrain at 10 m × 10 m, (Chulakadabba et al., 2023)) allowing the detection of both large and small methane emission sources which are often missed by coarser satellite instruments. This capability is essential for measuring methane emissions in complex environments such as oil and gas fields, landfills, and agricultural areas.
Level 3 (L3) data are delivered as gridded mosaics of column-averaged methane concentrations (XCH4), derived using a CO2 proxy retrieval algorithm that has been validated as a demonstration for the MethaneSAT mission (Chan Miller et al., 2024). A total of 75 flights conducted between 2021 and 2024 were available for analysis (Fig. 1).
2.3 Scene determination
To isolate agricultural emissions, MethaneAIR L3 mosaics (Fig. 2) were subset around CAFO targets before applying wavelet denoising and the Divergence Integral (DI) method. This preprocessing reduces background variability and limits interference from nearby oil and gas emissions, thereby improving plume detectability.
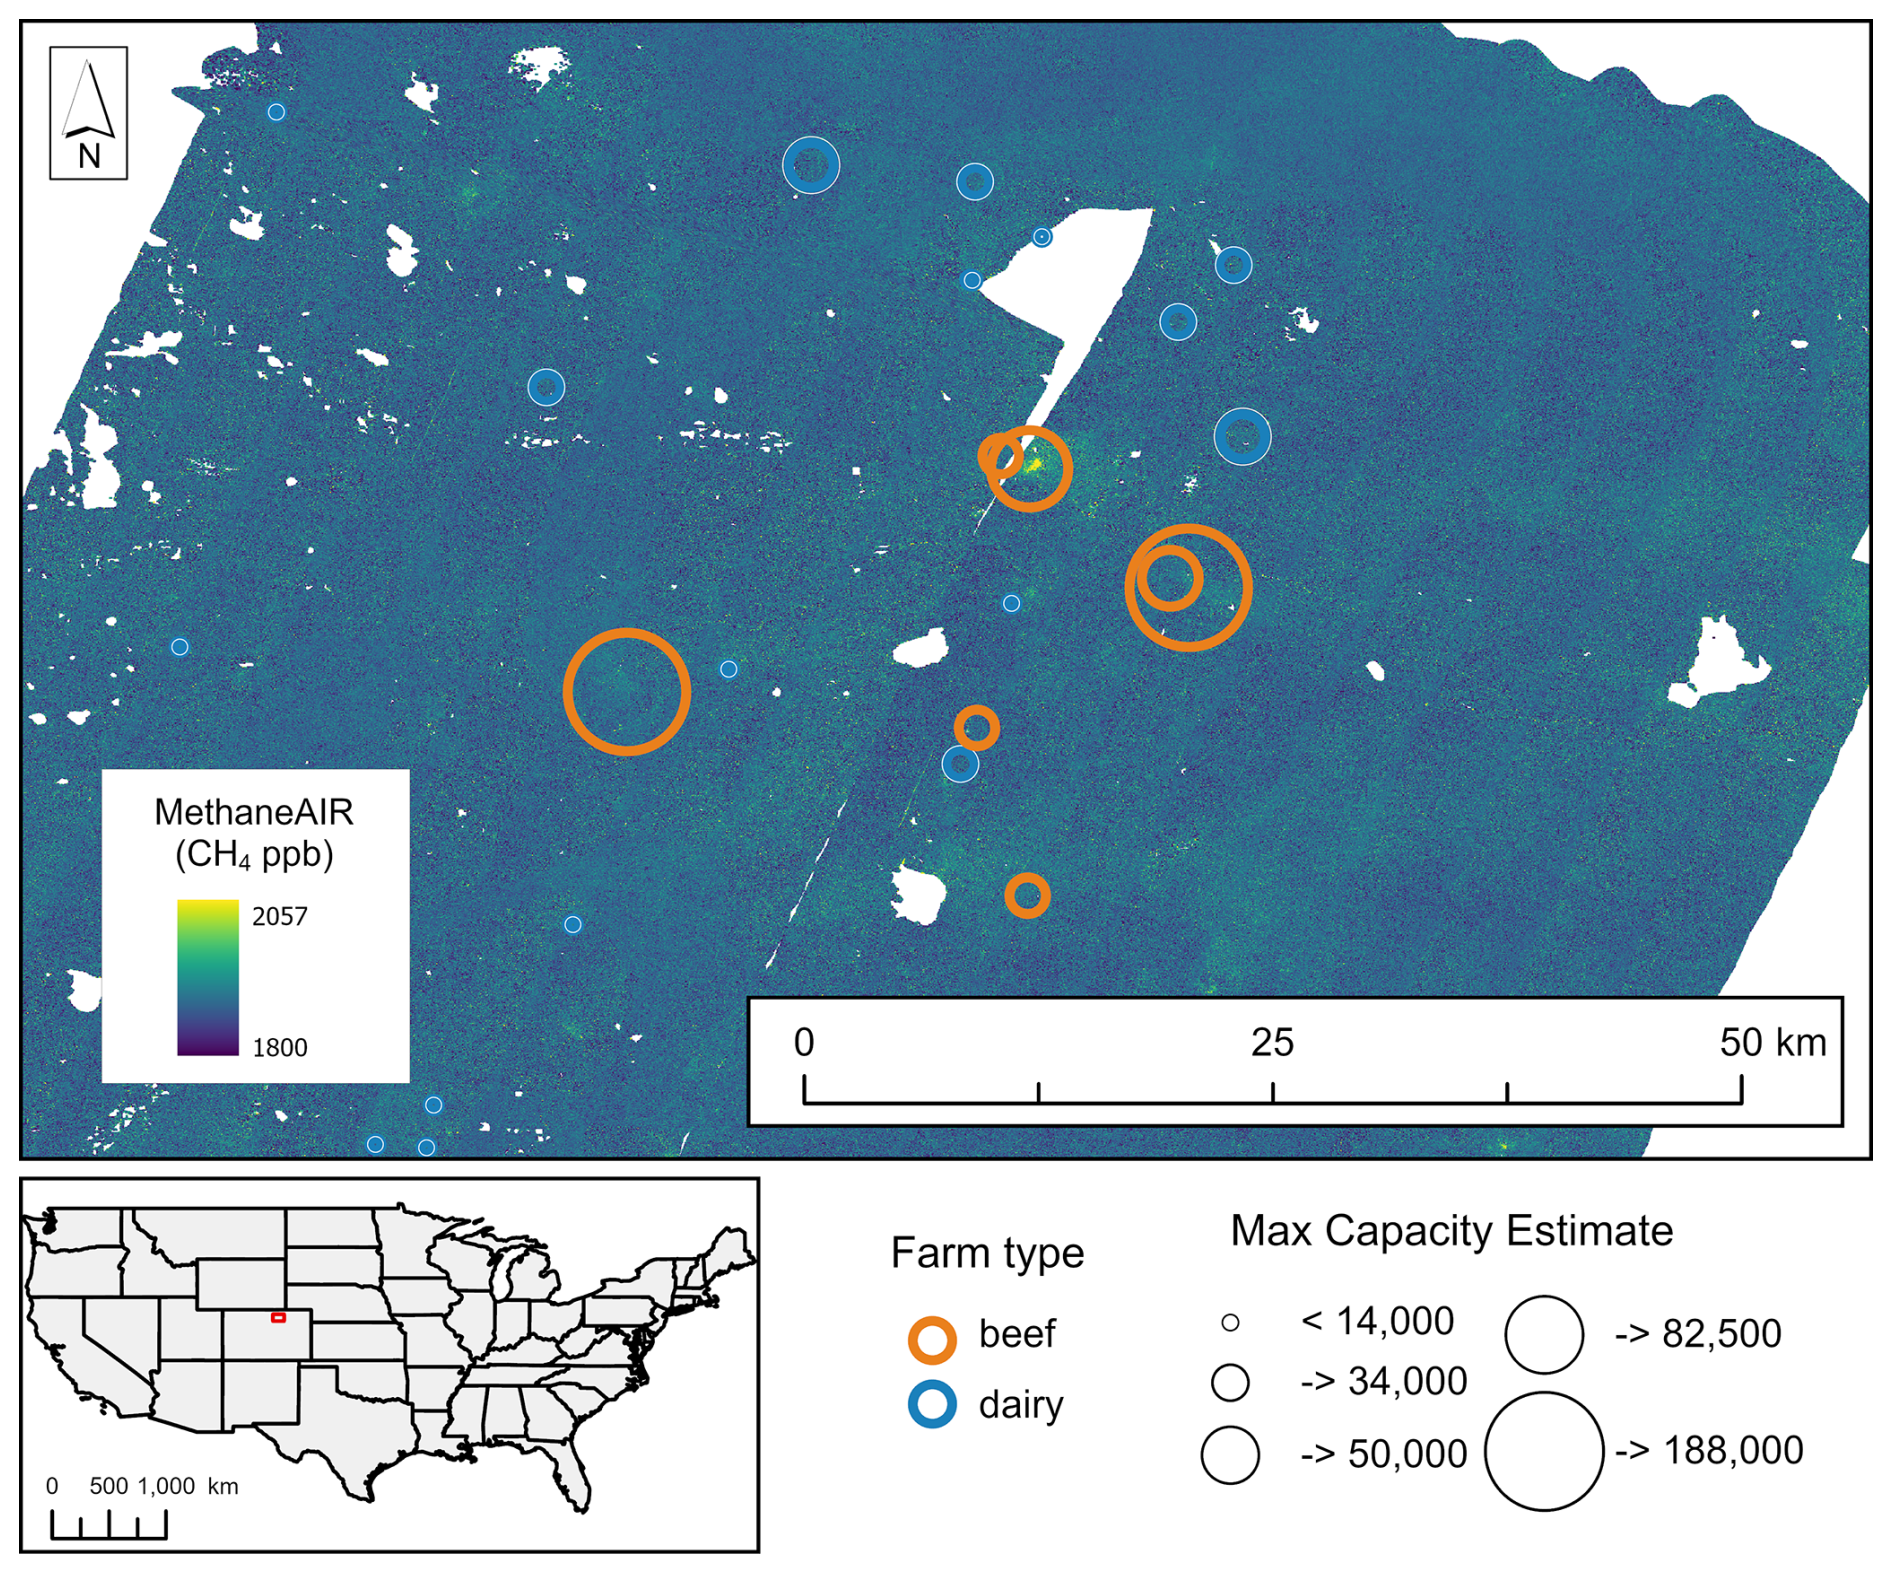
Figure 2MethaneAIR flight mosaic from MethaneAIR flight MX050 over Denver, 25 September 2023 showing CAFOs in the area from the initial farm list. Maximum capacity values represent the registered animal capacity as reported by the Colorado Public Health and Environment (CDPHE, 2017). USA administrative boundaries from Esri Data and Maps (derived from U.S. Census Bureau) | Powered by Esri.
For each flight, CAFOs located within the mosaic extent were identified and screened for quality. Cases were retained where no more than 2 % of pixels within a ±0.005° (∼ 500 m) buffer were masked, typically due to cloud cover or close proximity to swath edge. For CAFOs meeting this threshold, an “Agricultural Scene” was extracted as a ±0.02° subset of the Level 3 (L3) data centred on the CAFO.
The resulting scene size of ∼ 2 km × 2 km is a compromise between capturing sufficient plume structure required for DI flux estimation and minimising background heterogeneity. While smaller scene extents could further reduce background heterogeneity, they risk truncating plume structure required for divergence-based flux estimation and increasing sensitivity to plume misidentification. In contrast, larger scenes would introduce competing sources and dilute weak agricultural signals. The scene size adopted here represents a balance between plume containment and background stability.
Previous MethaneAIR plume sensitivity studies indicate that detectable plumes are typically concentrated within the first few kilometres downwind of the emission source, with far-downwind plume structure becoming increasingly diffuse and less informative for divergence-based methods (Chulakadabba et al., 2023; Guanter et al., 2025). While strong plumes may extend beyond the scene boundary under high wind conditions, the DI method primarily relies on near source gradients, with the loss of far-downwind plume signal having limited impact on flux estimation. Additionally, sub-setting scenes reduces the influence of regional methane enhancements and competing sources, which is critical for low-emission agricultural targets.
This process resulted in the identification of 209 agricultural scenes associated with 84 unique CAFOs across 75 flights. These scenes are then individually processed for plume detection and quantification.
2.4 Plume Detection and Quantification
Plume detection is performed using a 2D discrete wavelet transform to denoise the methane concentration imagery (Fig. 3), following the approach of Zhang et al. (2026). The wavelet transform separates each agricultural scene into low frequency approximation coefficients which represent smooth, large-scale background structure; and high frequency detail coefficients which capture fine-scale features. An image containing only high-frequency components is reconstructed by setting the approximation coefficients to zero and applying an inverse wavelet transform using only the detail coefficients. This high-frequency image is then subtracted from the original XCH4 scene, suppressing background variability while preserving plume structure. Finally, soft-threshold wavelet denoising is applied to the background suppressed image to reduce residual noise by reducing small coefficients while retaining signal-related features. Wavelet basis, decomposition depth, and thresholding parameters follow those defined in Zhang et al. (2026).
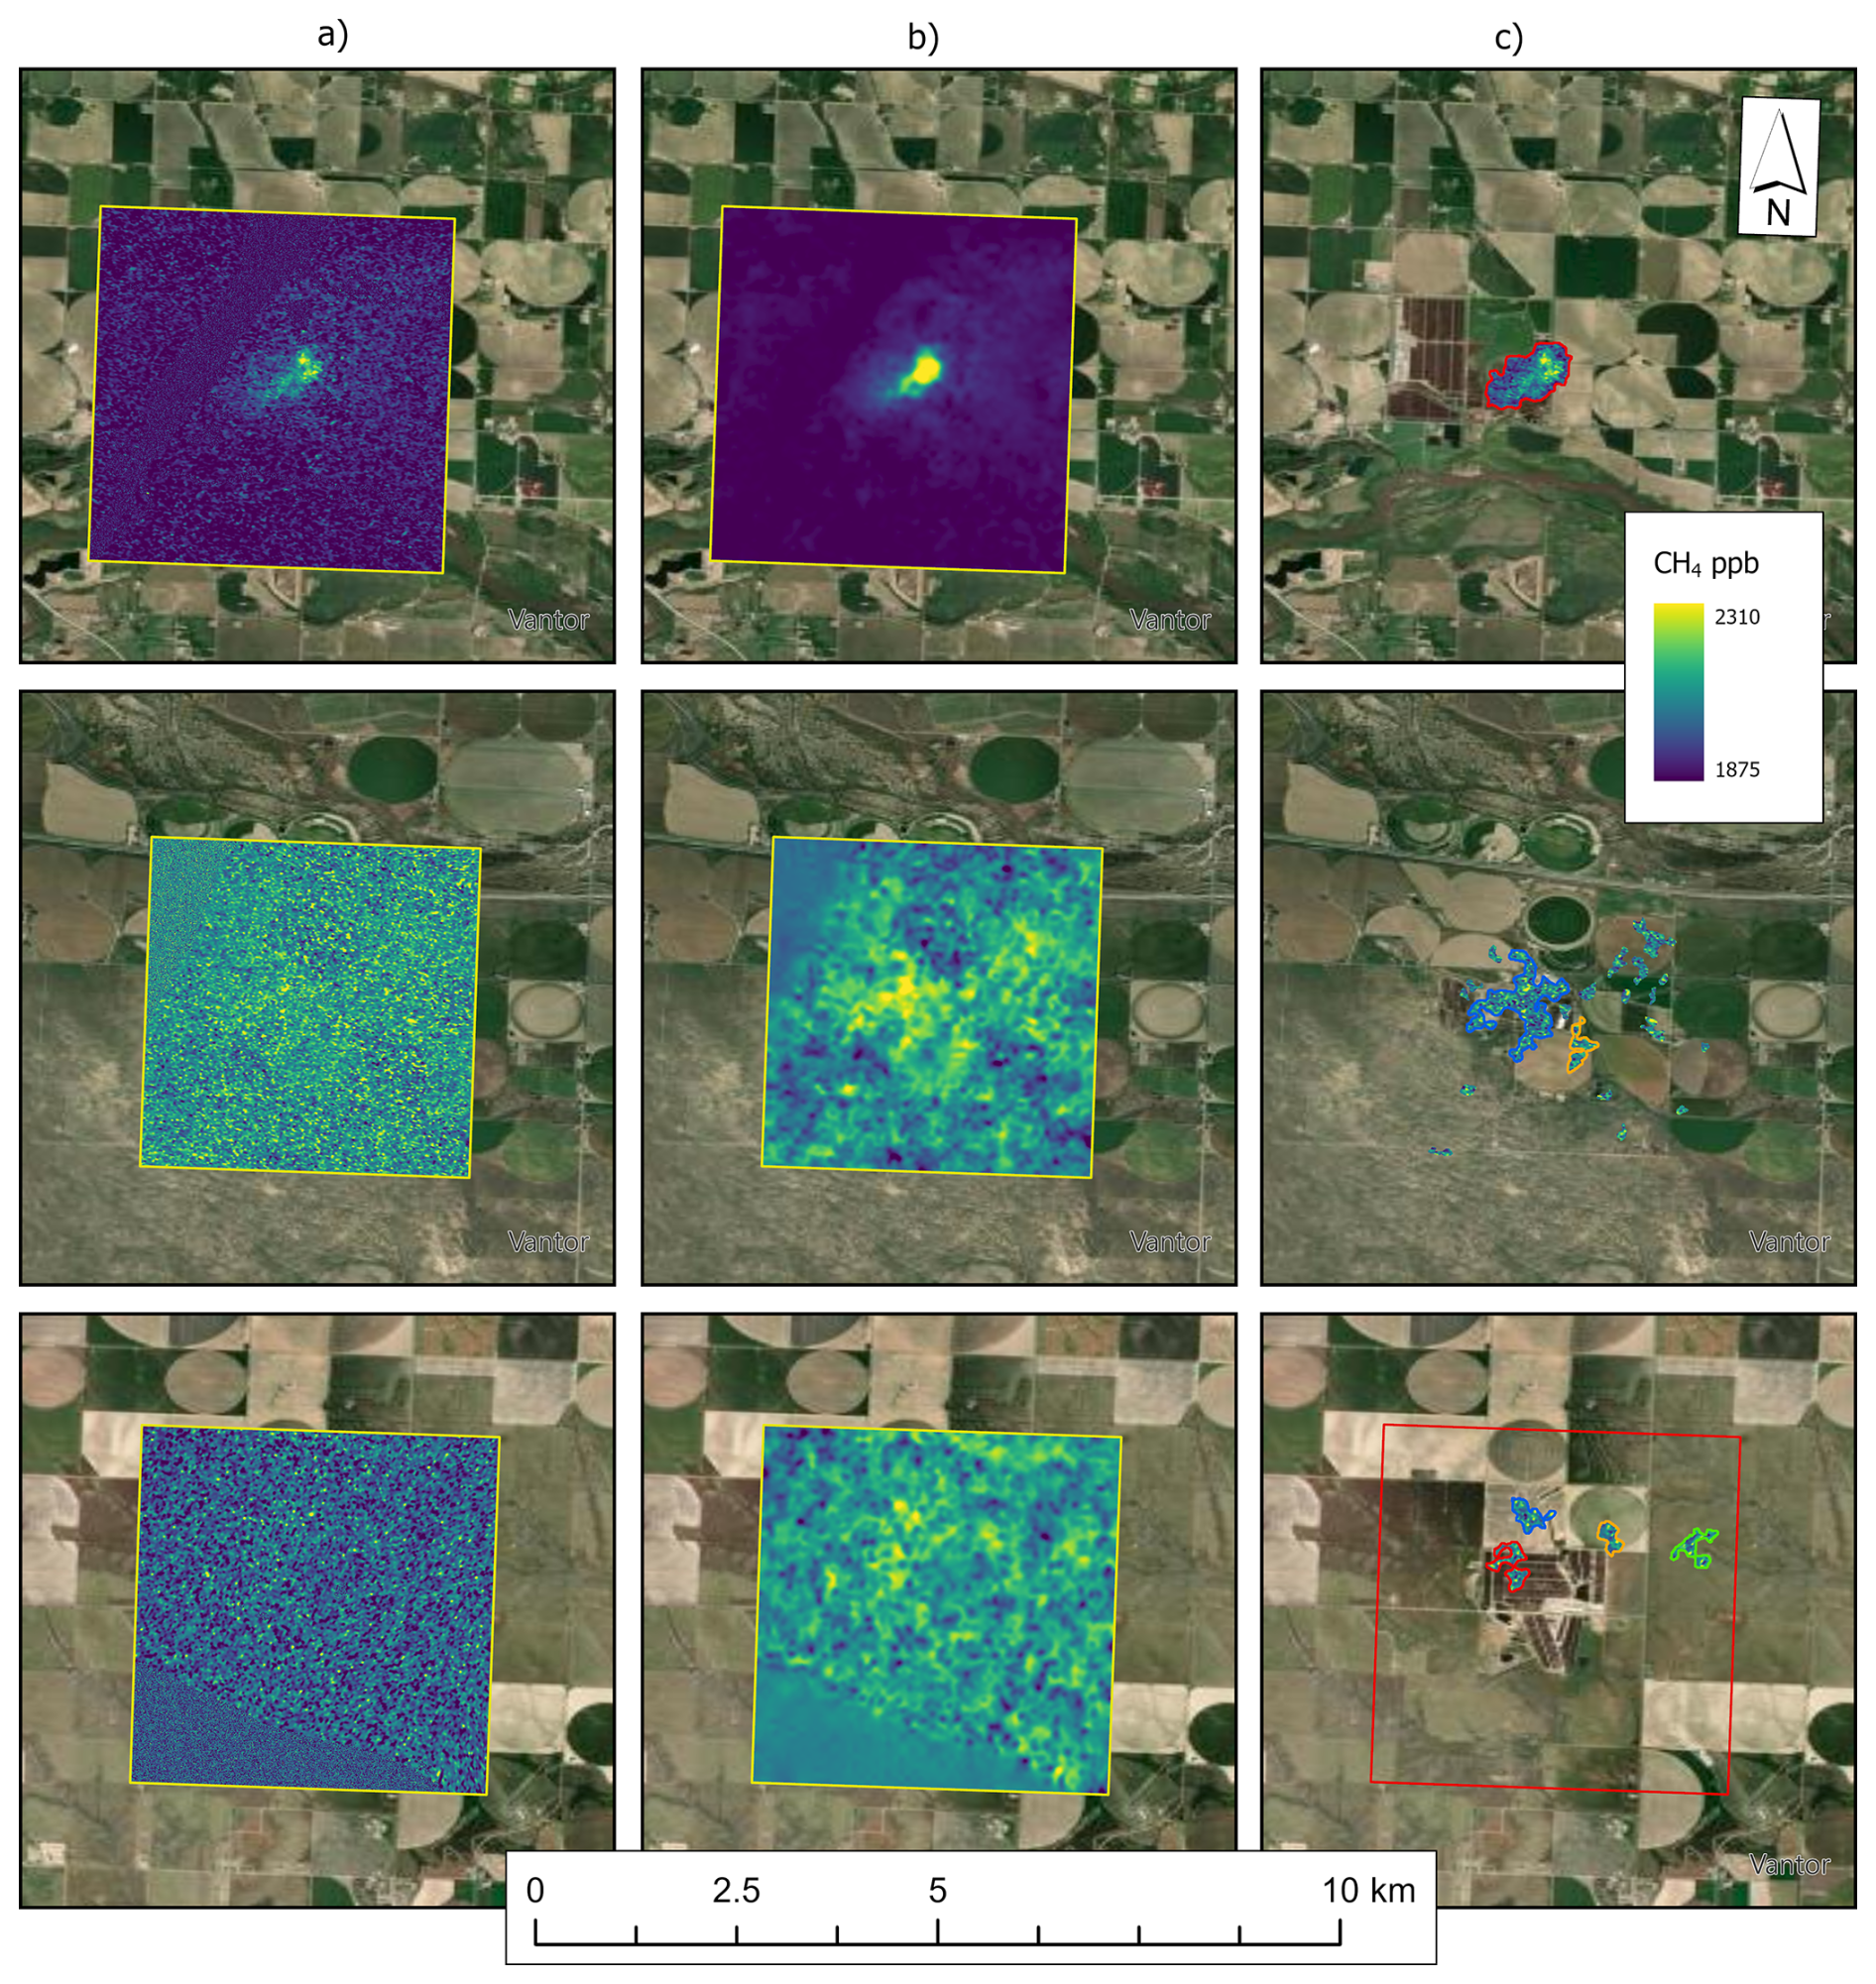
Figure 3Example of Agricultural Scenes extracted from MethaneAIR L3 XCH4 Mosaics (a) extracted scene ∼ 0.02 degrees surrounding CAFO of interest (b) Denoised Scene (c) Masked Plume/s associated with the CAFO, with different colours denoting individual plumes. Imagery © Vantor (2024).
Binary plume masks are generated from the denoised images (Fig. 3) using a combination of percentile based XCH4 thresholding and a connected component labelling algorithm (Zhang et al., 2026). Percentile based thresholds are computed within each scene to adapt to local background variability and are held constant across all agricultural scenes. Candidate plume masks are refined using size, shape and connectivity criteria to remove isolated noise artifacts and spatially incoherent features. Plume origins are subsequently determined based on plume morphology and consistency with 80 m wind direction from the High Resolution Rapid Refresh (HRRR) model (NOAA, 2025). Compared to the DI based plume detection previously applied to MethaneAIR data (Warren et al., 2025), the wavelet based denoising method exhibits improved sensitivity for detecting low volume plumes (Manninen et al., 2026; Zhang et al., 2026).
In this study, plume detection is applied within targeted agricultural scenes rather than across full MethaneAIR flight mosaics to better capture the characteristics of CAFO emissions. While the combination of scene-based analysis and wavelet denoising has seen limited application outside of controlled release experiments, it is well suited to spatial subsets centered on known facilities. Full-mosaic approaches (e.g., Cusworth et al., 2021; Guanter et al., 2025) typically rely on background-dependent thresholding, hotspot detection, and coherent plume structure (Zhang et al., 2026), which are less appropriate for the diffuse and often weak signals associated with CAFOs.
By focusing on scenes centered on known facilities, background variability and interference from unrelated sources are reduced. This results in more compact concentration distributions, which support percentile-based detection and helps limit false positives compared to full-mosaic approaches. This approach is therefore not a blind survey but a targeted analysis designed to enhance sensitivity to facility-scale methane signals. By constraining the background and reducing reliance on idealised plume morphology, targeted processing provides an appropriate framework for identifying weak agricultural signals.
In this work, the wavelet-based processing is used exclusively for plume detection and mask generation, rather than for flux estimation. No explicit background subtraction is applied to the XCH4 concentration field prior to divergence integral (DI) calculations. Instead, flux estimates are derived from the original, non-denoised XCH4 concentration field using plume masks defined from the denoising process. As a result, large-scale background methane enhancements are retained within the scenes used for flux estimation and are implicitly included in the DI flux calculation. This avoids introducing artefacts associated with background processing, although residual background variability may contribute to overall uncertainty. This process is consistent with Zhang et al. (2026), where wavelet-based processing is used for plume masking while flux quantification is performed on the original concentration field.
Following plume identification, flux quantification is performed using the divergence integral (DI) method introduced for MethaneAIR by Chulakadabba et al. (2023) as it has been validated through controlled release experiments with near-unbiased performance (El Abbadi et al., 2024). Following plume detection, a series of progressively expanding integration boxes is drawn around the inferred plume origin. The surface flux divergence integral is computed for each box using 80 m wind fields from the High Resolution Rapid Refresh (HRRR) model (NOAA, 2025). Chulakadabba et al. (2023) evaluated HRRR derived winds against in situ observations during controlled release experiments and found good agreement for the purposes of emission quantification. In this study, the wind direction is further constrained through consistency with plume orientation. The final emission rate is taken as the mean of the flux estimates across these values, with uncertainty defined as their standard deviation. Across the 209 agricultural scenes analysed, 652 methane plumes were initially identified prior to robustness screening.
The DI method was originally evaluated by Chulakadabba et al. (2023) under blind detection conditions, indicating a nominal detection limit of approximately 500 kg CH4 h−1. In this study, it is employed solely for flux quantification following plume identification within the targeted, scene-based workflow described above. Although wavelet denoising improves detectability by enhancing signal to noise ratios for weak plumes (Zhang et al., 2026), it does not alter the intrinsic quantification limit of the DI method because flux estimates are derived from the original, non-denoised concentration field. Consequently, emissions below 500 kg CH4 h−1 may be detectable under favourable wind and background conditions but are not always robustly quantifiable. To account for this, a robustness criterion based on the consistency of DI derived flux estimates across the series is applied and only plumes meeting this criterion are interpreted quantitatively. Robust plumes are defined as having a ratio of the standard deviation of the DI-derived flux to the flux itself of less than 1 (i.e., uncertainty below 100 %). As a result, while emissions below 200 kg CH4 h−1 are occasionally detected, the effective limit of robust quantification depends jointly on emission strength, wind speed, background variability, and scene geometry rather than a single fixed threshold. Transport errors and wind uncertainties remain the dominant sources of uncertainty for DI derived fluxes, particularly for weak and intermittent agricultural emissions.
Following plume detection and quantification, source attribution is conducted to assess whether individual plumes originate from CAFOs.
2.5 Plume Source Attribution
Each detected plume was reviewed manually to determine (i) whether the source was agricultural (associated with a CAFO), (ii) whether it was unique, and (iii) the likely on-farm source where identifiable. Methane plume rasters were overlaid on high-resolution imagery from Google Earth (imagery © Google, 2024) to assess spatial alignment with the CAFO of interest. A plume was considered to be associated with a CAFO when multiple qualitative indicators were consistent, including proximity of the plume origin to the CAFO footprint, alignment with corresponding wind direction, plume morphology, and the absence of nearby competing sources such as oil and gas infrastructure or adjacent CAFOs.
Uniqueness was determined through visual assessment of plume continuity, with segments interpreted as part of a single contiguous plume treated as one emission case (e.g., Fig. 3c). While most plumes could be confidently associated with an agricultural source, attribution of a specific on-farm origin was not always possible with high certainty. Where feasible, sub-source types (e.g. lagoons) within CAFO systems were identified, and a confidence level was assigned based on plume clarity, spatial isolation, and consistency with expected emission behaviour.
To assess the reproducibility of this qualitative attribution approach, an independent quality assurance/quality control (QAQC) exercise was conducted. All scenes were re-evaluated by a second analyst operating without reference to the original classifications. Inter-analyst agreement was evaluated by directly comparing assigned source categories. Agreement was strongly dependent on confidence level. Inter-analyst agreement exceeded 95 % for the highest-confidence classifications and remained high (> 90 %) when all high-confidence cases were considered, reflecting highly consistent identification of CAFO-related plumes. Agreement was lower overall (∼ 70 %) when all classifications were included, primarily due to increased ambiguity in low-confidence cases and in structurally complex settings. Most disagreements arose from the classification of sub-components such as lagoons and other on-farm infrastructure, rather than from identifying the agricultural source itself. Including lagoons in the broader CAFO category increases agreement and suggests that discrepancies mainly stem from how on-farm sources are assigned, rather than from differences in source classification. When restricted to cases that were both high-confidence and identified as robust, inter-analyst agreement approached 98 %, indicating near-identical interpretation of the clearest plume signals.
Overall, the attribution approach used here was highly reproducible for high-confidence agricultural sources, while the confidence levels captured uncertainty in more complex or ambiguous cases.
3.1 Detection Summary
A total of 209 agricultural scenes, encompassing 84 unique CAFOs representing beef, dairy, and manure management operations, were analysed using the wavelet denoising and divergence integral (DI) method (Fig. 4a). This analysis resulted in 652 individual plume detections. However, the majority of these plumes were not attributable to the targeted CAFOs and were instead associated with nearby oil and gas infrastructure, adjacent CAFOs, unidentified upwind sources, or cases where a single plume was split into multiple detections (non-unique plumes).
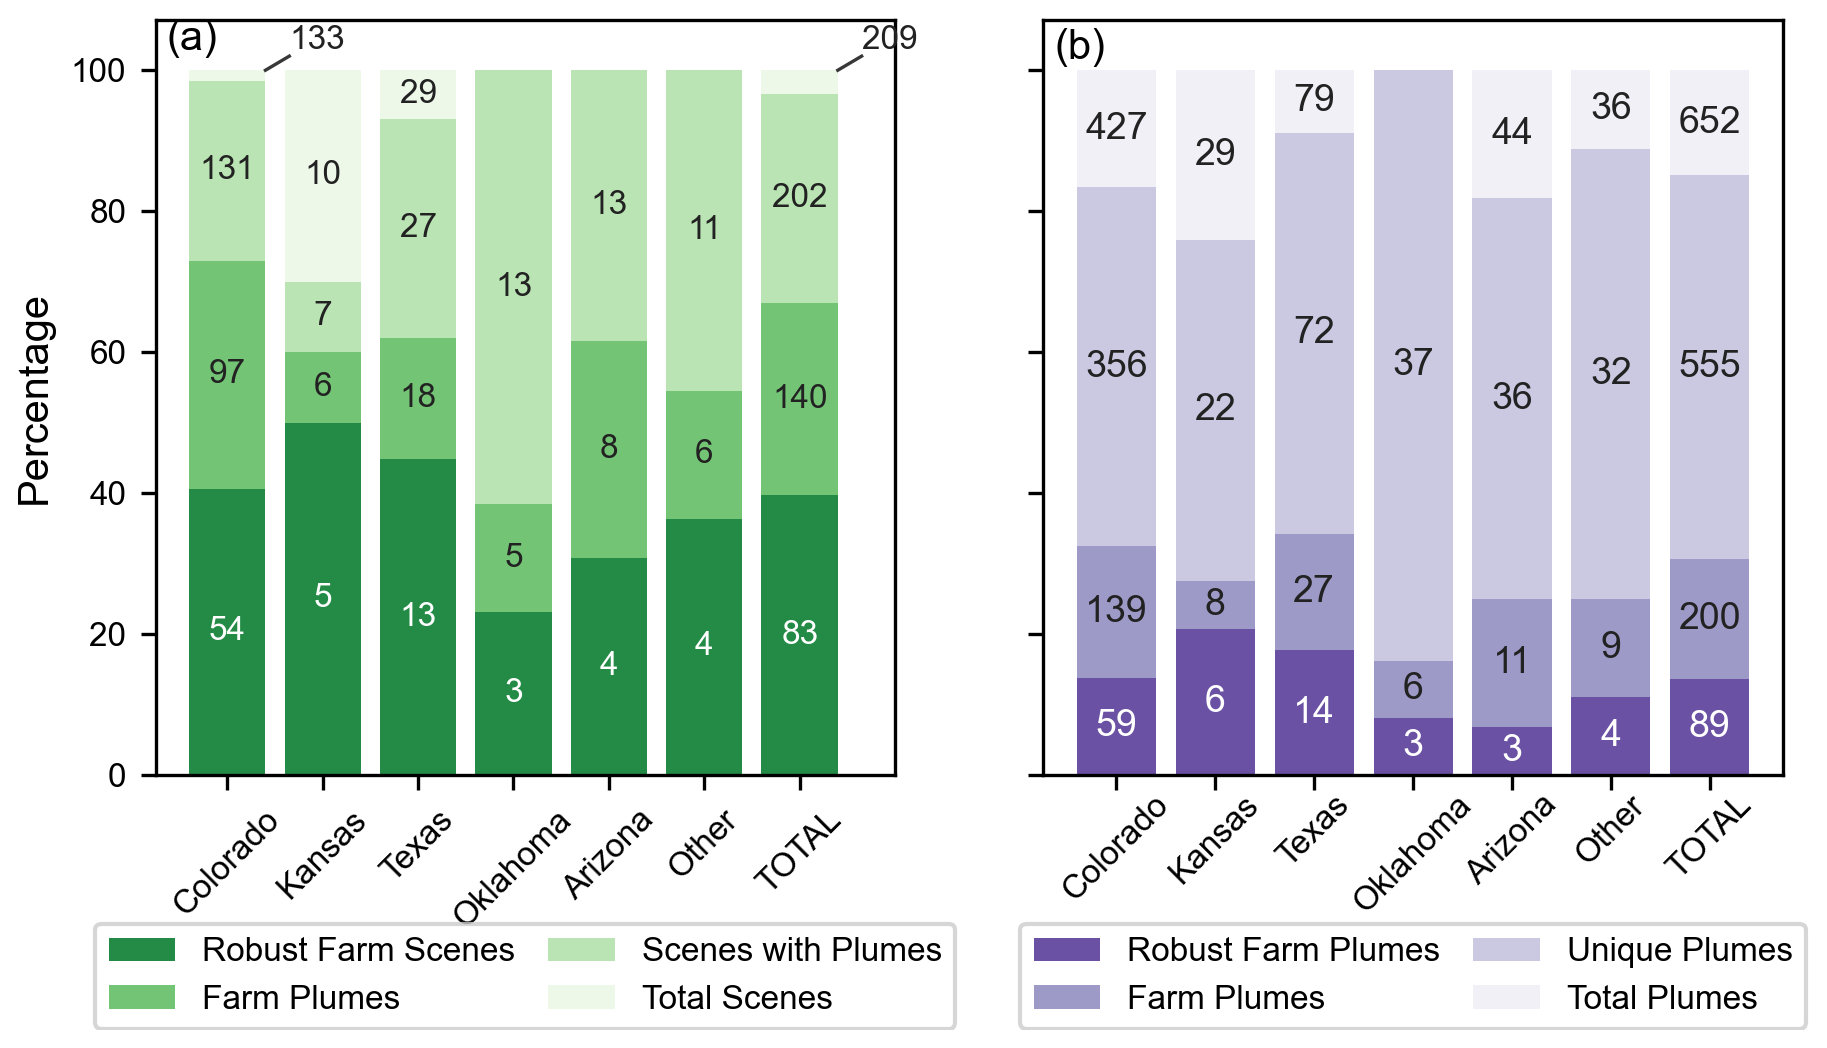
Figure 4Summary of valid agricultural scenes (a) and associated plume detections (b), by state. Actual counts are displayed on each bar. Note: for Oklahoma, Arizona, and “Other”, all valid scenes included plume detections. Additionally, all plumes detected in Oklahoma were classified as unique.
A total of 200 unique agricultural plumes were identified, of which 89 (44 %) were classified as robust according to the criteria defined in Sect. 2.4 (Fig. 4b). Although only 14 % of total detections were both agricultural and met the most stringent robustness criteria, nearly 40 % of all scenes contained at least one robust plume. Overall, these results demonstrate that the method is capable of identifying agricultural methane plumes even within complex, mixed-source environments where oil and gas emissions are present.
3.2 Facility scale emissions
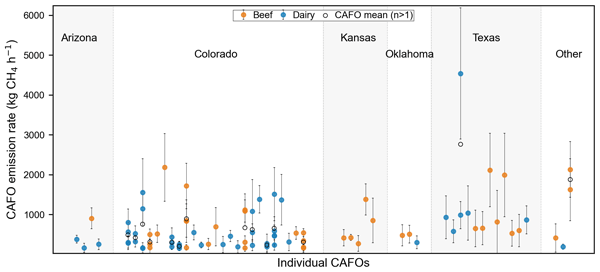
Figure 5 shows methane emission rates derived from robust agricultural plume detections for individual CAFOs observed during MethaneAIR flights. Emissions are reported on a per-scene basis. Where multiple robust plumes were identified as originating from the same CAFO they are combined.
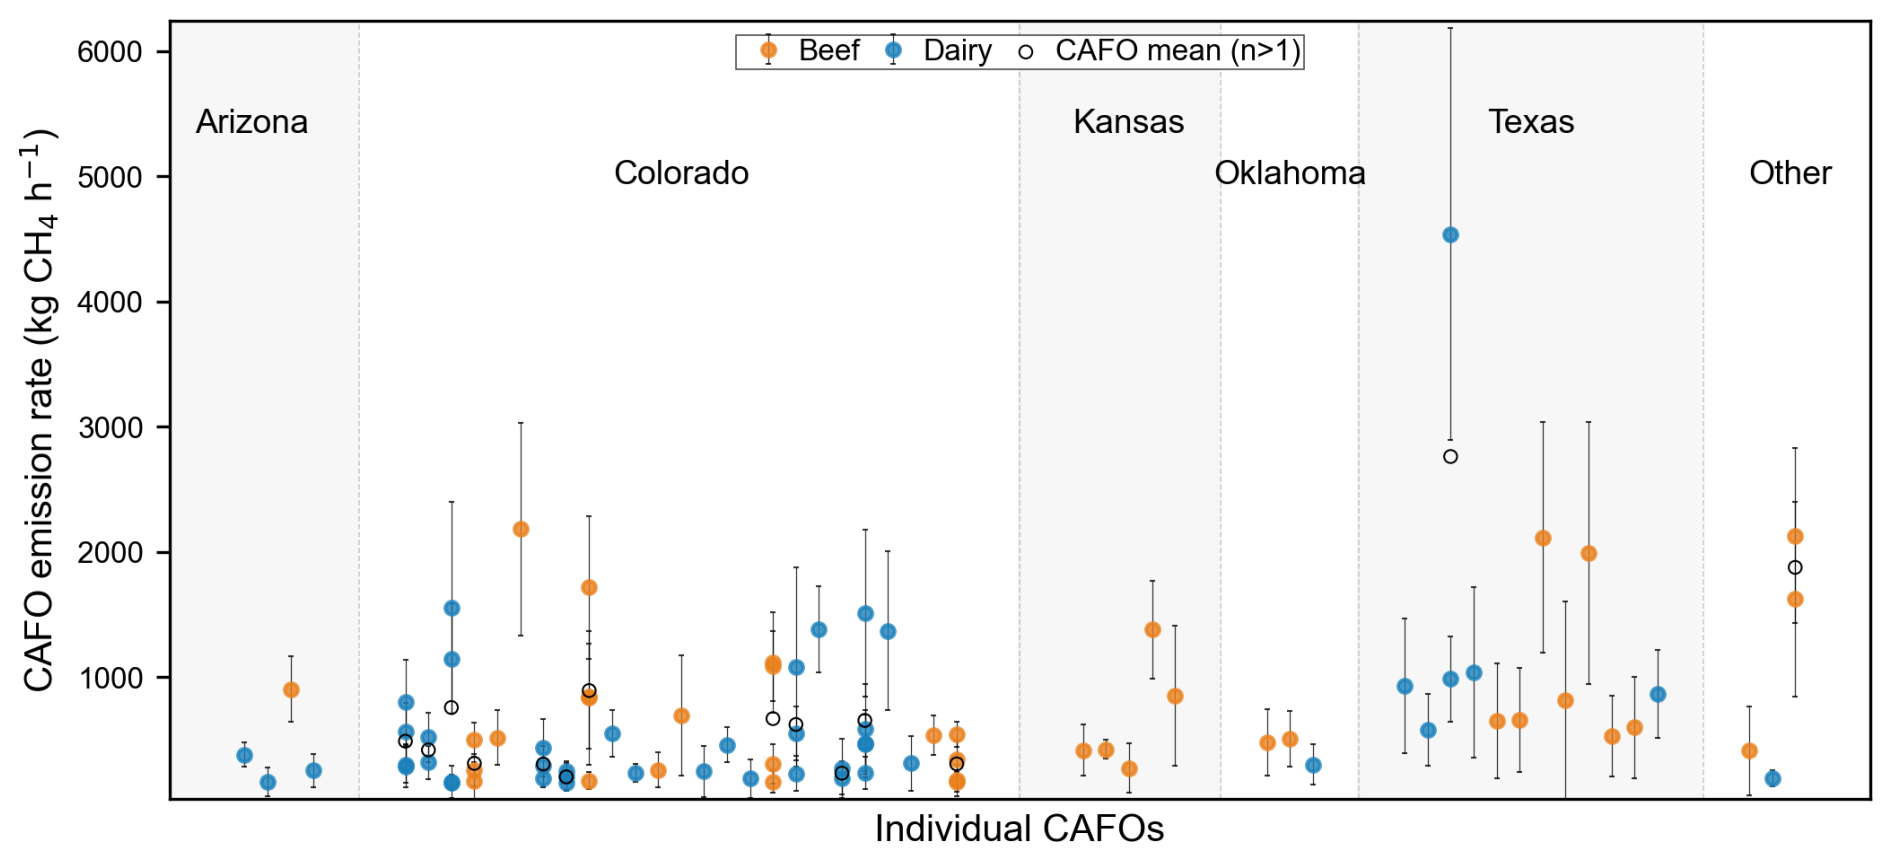
Figure 5Estimated methane emission rates from robust agricultural plume detections from MethaneAIR. Colours indicate facility type (orange: beef; blue: dairy). Error bars are standard deviation from the divergence-integral (DI) flux estimates. Only plumes with relative DI uncertainty below 100 % are shown. Where there have been more than one overpass mean CAFO emission estimates are shown with a black circle.
Overall, emissions span a wide range (∼ 150–4500 kg CH4 h−1) with substantial variability both within and between states, as well as across repeated observations of the same CAFO. A small number of high-magnitude events are evident, particularly in Texas. The largest apparent emission rate, associated with a dairy operation, was an aggregation of several distinct plumes and assigned low confidence. A separate overpass of the same facility gave substantially lower flux estimates (Fig. 5), indicating that additional observations would be required to better characterise emissions from this site. Overall, these results are consistent with facility-scale methane emissions reported in previous airborne studies.
Uncertainties reported here reflect the repeatability of DI flux estimates across varying box sizes. These estimates do not directly include additional sources of uncertainty such as wind field error, methane retrieval uncertainty, or background variability which are partially mitigated but not fully captured by the DI method itself. The reported uncertainties, therefore, should be considered lower bound estimates of total error. These limitations are consistent with those identified in previous MethaneAIIR validation studies. Controlled release experiments by Chulakadabba et al. (2023) demonstrate that the DI method provided good agreement across a range of release rates. Some overestimation was observed for emissions below ∼ 250 kg CH4 h−1 due to interference from nearby sources (Chulakadabba et al., 2023). The wavelet-based plume detection method applied here is expected to reduce this effect by improving source isolation prior to flux estimation. No significant bias was observed at higher emission rates. The robust criterion is applied at the individual plume level prior to aggregation. Subsequent analyses are based on averaged emission estimates across multiple plumes and facilities, which reduces the influence of high relative uncertainty in any single detection. Nevertheless, interpretation of induvial plume estimates, should remain cautious, particularly near the robustness threshold. A full propagation of uncertainties is not undertaken, instead, key sources of uncertainty are characterised and their implications for interpretation are discussed.
The scene-total values represent aggregate facility emissions and do not account for differences in livestock numbers or size of individual operations. To allow comparison across facilities, with past studies, and with inventory estimates, approximate livestock numbers are next used to derive per-animal emission rates.
3.3 Per-animal emissions
To enable comparison with inventory-based emission factors and previous studies, facility-scale methane emissions must be divided by stock numbers to determine a per-animal rate. This requires estimates of livestock numbers at each CAFO during the overpass. Unfortunately, animal counts at the time of the observations are not publicly available.
As Colorado contains the largest number of robust plume detections it was used as the primary focus for this analysis. Further, it is the only state for which publicly available, facility-level livestock data could be identified. These data were obtained from the Colorado Department of Public Health and Environment (CDPHE). Other States had fewer observations and lack comparable activity data, limiting their suitability for similar analyses. The CDPHE dataset provides maximum permitted livestock capacities (CDPHE, 2017) and was the most consistent facility level dataset available. Climate TRACE (2025) livestock estimates were also obtained which are based on a combination of reported activity, observations, and machine learning so considered model-base estimates rather exact numbers although they are more recent than the CDPHE data. Both the CDPHE and Climate TRACE datasets are used here to assess the sensitivity of per-animal emission estimates to assumptions about livestock numbers.
CDPHE capacities provide a consistent reference across facilities and are proportional to the scale of operation enabling relative comparisons between farms. However, these values are not necessarily the actual animal population at the time of observation and may differ over time. Climate TRACE estimates provide independent, activity-based livestock estimates that may be representative of numbers during the observation period. Together, these datasets are complementary and are used here to assess sensitivity to livestock number rather than to define strict bounds.
Figure 6 shows per-animal methane emission rates for individual CAFOs in northeast Colorado using both datasets. Overall beef operations have lower per-animal emissions than dairy operations, although substantial variability is observed for each farm type. A Welch's t-test indicates that beef emissions are significantly lower than dairy emissions for both datasets (t(33.86) = −4.02, p= 0.00031 for CDPHE and t(51.64) = −3.345, p= 0.001538 for Climate TRACE). Results are consistent across both datasets, with a clear separation between dairy and beef operations and substantial variability between facilities. Absolute per-animal emission estimates vary with the choice of livestock dataset used, yet the relative differences between CAFO types remain consistent. Across all estimated emissions for Colorado CAFO's, using Climate TRACE reduced the mean per-animal emission estimate by ∼ 15 % for beef and ∼ 40 % for dairy operations compared to the CDPHE dataset. This reflects the differences in livestock estimates between datasets. Despite these changes in magnitude the overall structure of the results remains consistent, with a clear separation between dairy and beef operations, making relative comparisons reliable.
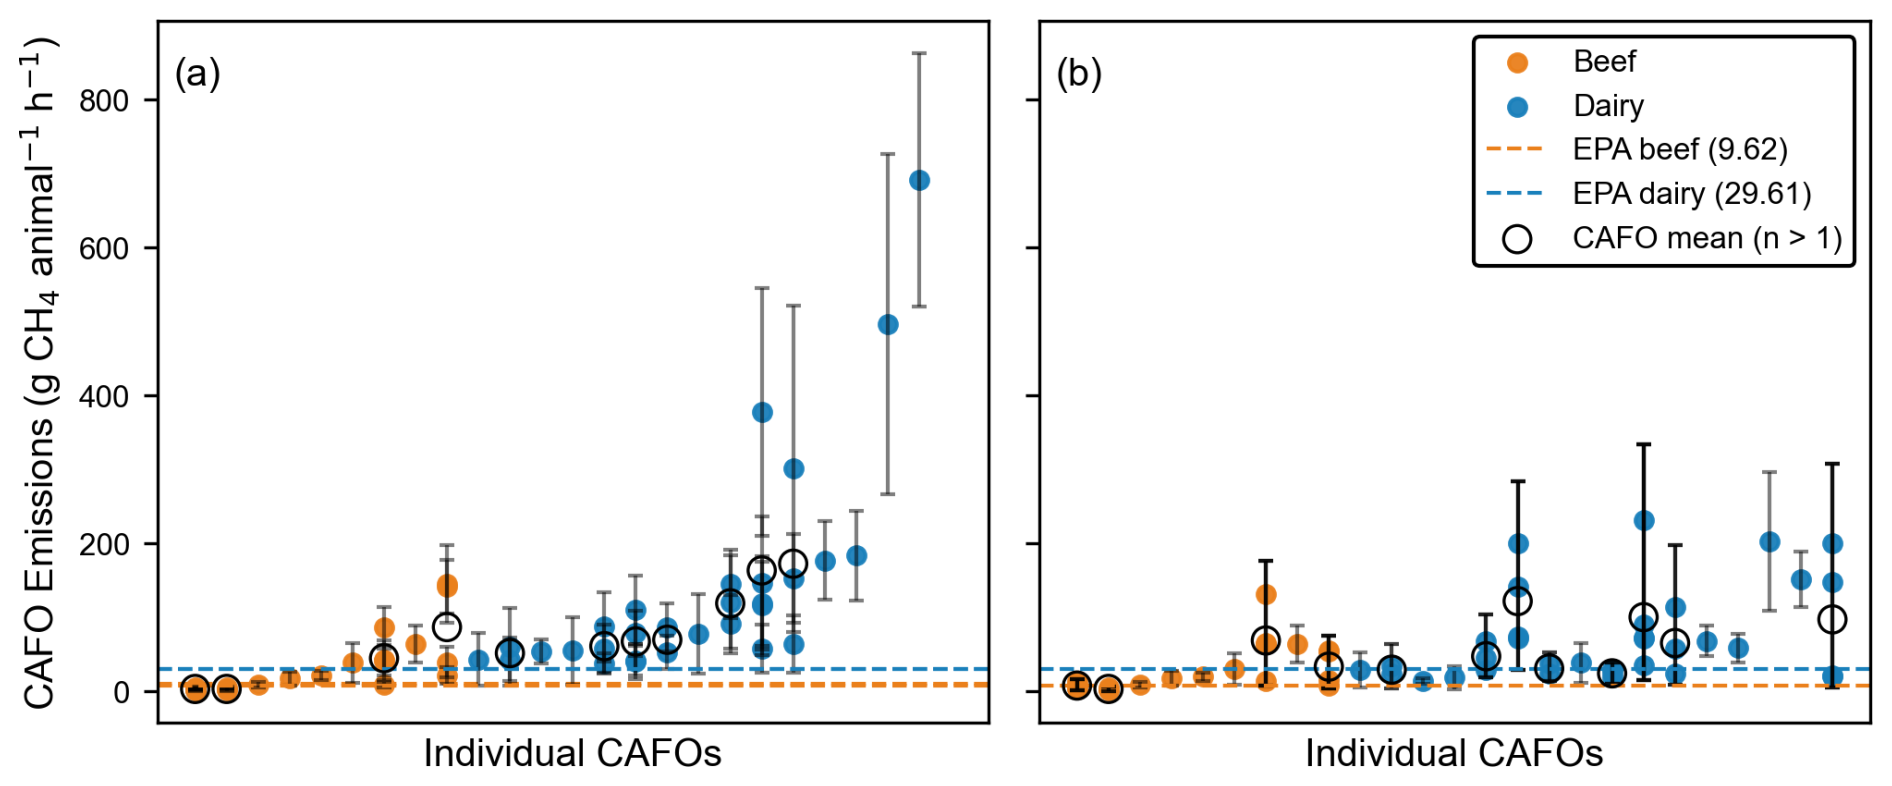
Figure 6Methane emissions per-animal for individual CAFOs in northeast Colorado, ranked from low to high and separated by facility type. (a) Per-animal emissions normalized by CDPHE maximum permitted animal capacities (CDPHE, 2017). (b) Per-animal emissions normalized by Climate TRACE animal estimates (Climate TRACE, 2025). Horizontal dashed lines indicate EPA Colorado mean per-animal emission factors for beef and dairy. Emission values represent means of detectable, robust plume conditions and are not directly equivalent to annual-average emission factors.
These comparisons are affected by both uncertainties in animal numbers and the fact that plume detection depends on specific conditions. The per-animal emission estimates presented here represent detectable plume event averages and so are not directly equivalent to annual mean emissions such as EPA. The implications of this approach are discussed further in Sect. 3.5.
3.4 EPA comparison
For context, the per-animal emission estimates are compared with EPA inventory emission factors derived from state-level data for Colorado (U.S. Environmental Protection Agency, 2024). These correspond to mean emission rates of 29.61 g CH4 animal−1 h−1 for dairy and 9.62 g CH4 animal−1 h−1 for beef, representing annual-average emissions across all operations within the state.
MethaneAIR-derived per-animal emission estimates are generally higher than these EPA values under detectable plume conditions (Fig. 6). As Mean emissions across all Colorado CAFOs are 34.8±4.5 g CH4 animal−1 h−1 (CDPHE) and 29.4±9.7 g CH4 animal−1 h−1 (Climate TRACE) for beef, and 138.6±26.9 g CH4 animal−1 h−1 (CDPHE) and 73.1±10.7 g CH4 animal−1 h−1 (Climate TRACE) for dairy. Median values are lower but still frequently higher than EPA factors under detectable conditions. A summary of these results, inventory estimates, and previous studies, is provided in Table 1.
Table 1Approximate CH4 emissions (g animal−1 h−1) for Colorado CAFOs from EPA inventories, IPCC defaults, and MethaneAIR observations. MethaneAIR values represent mean emissions from detectable plumes and are normalized using CDPHE and Climate TRACE livestock data.
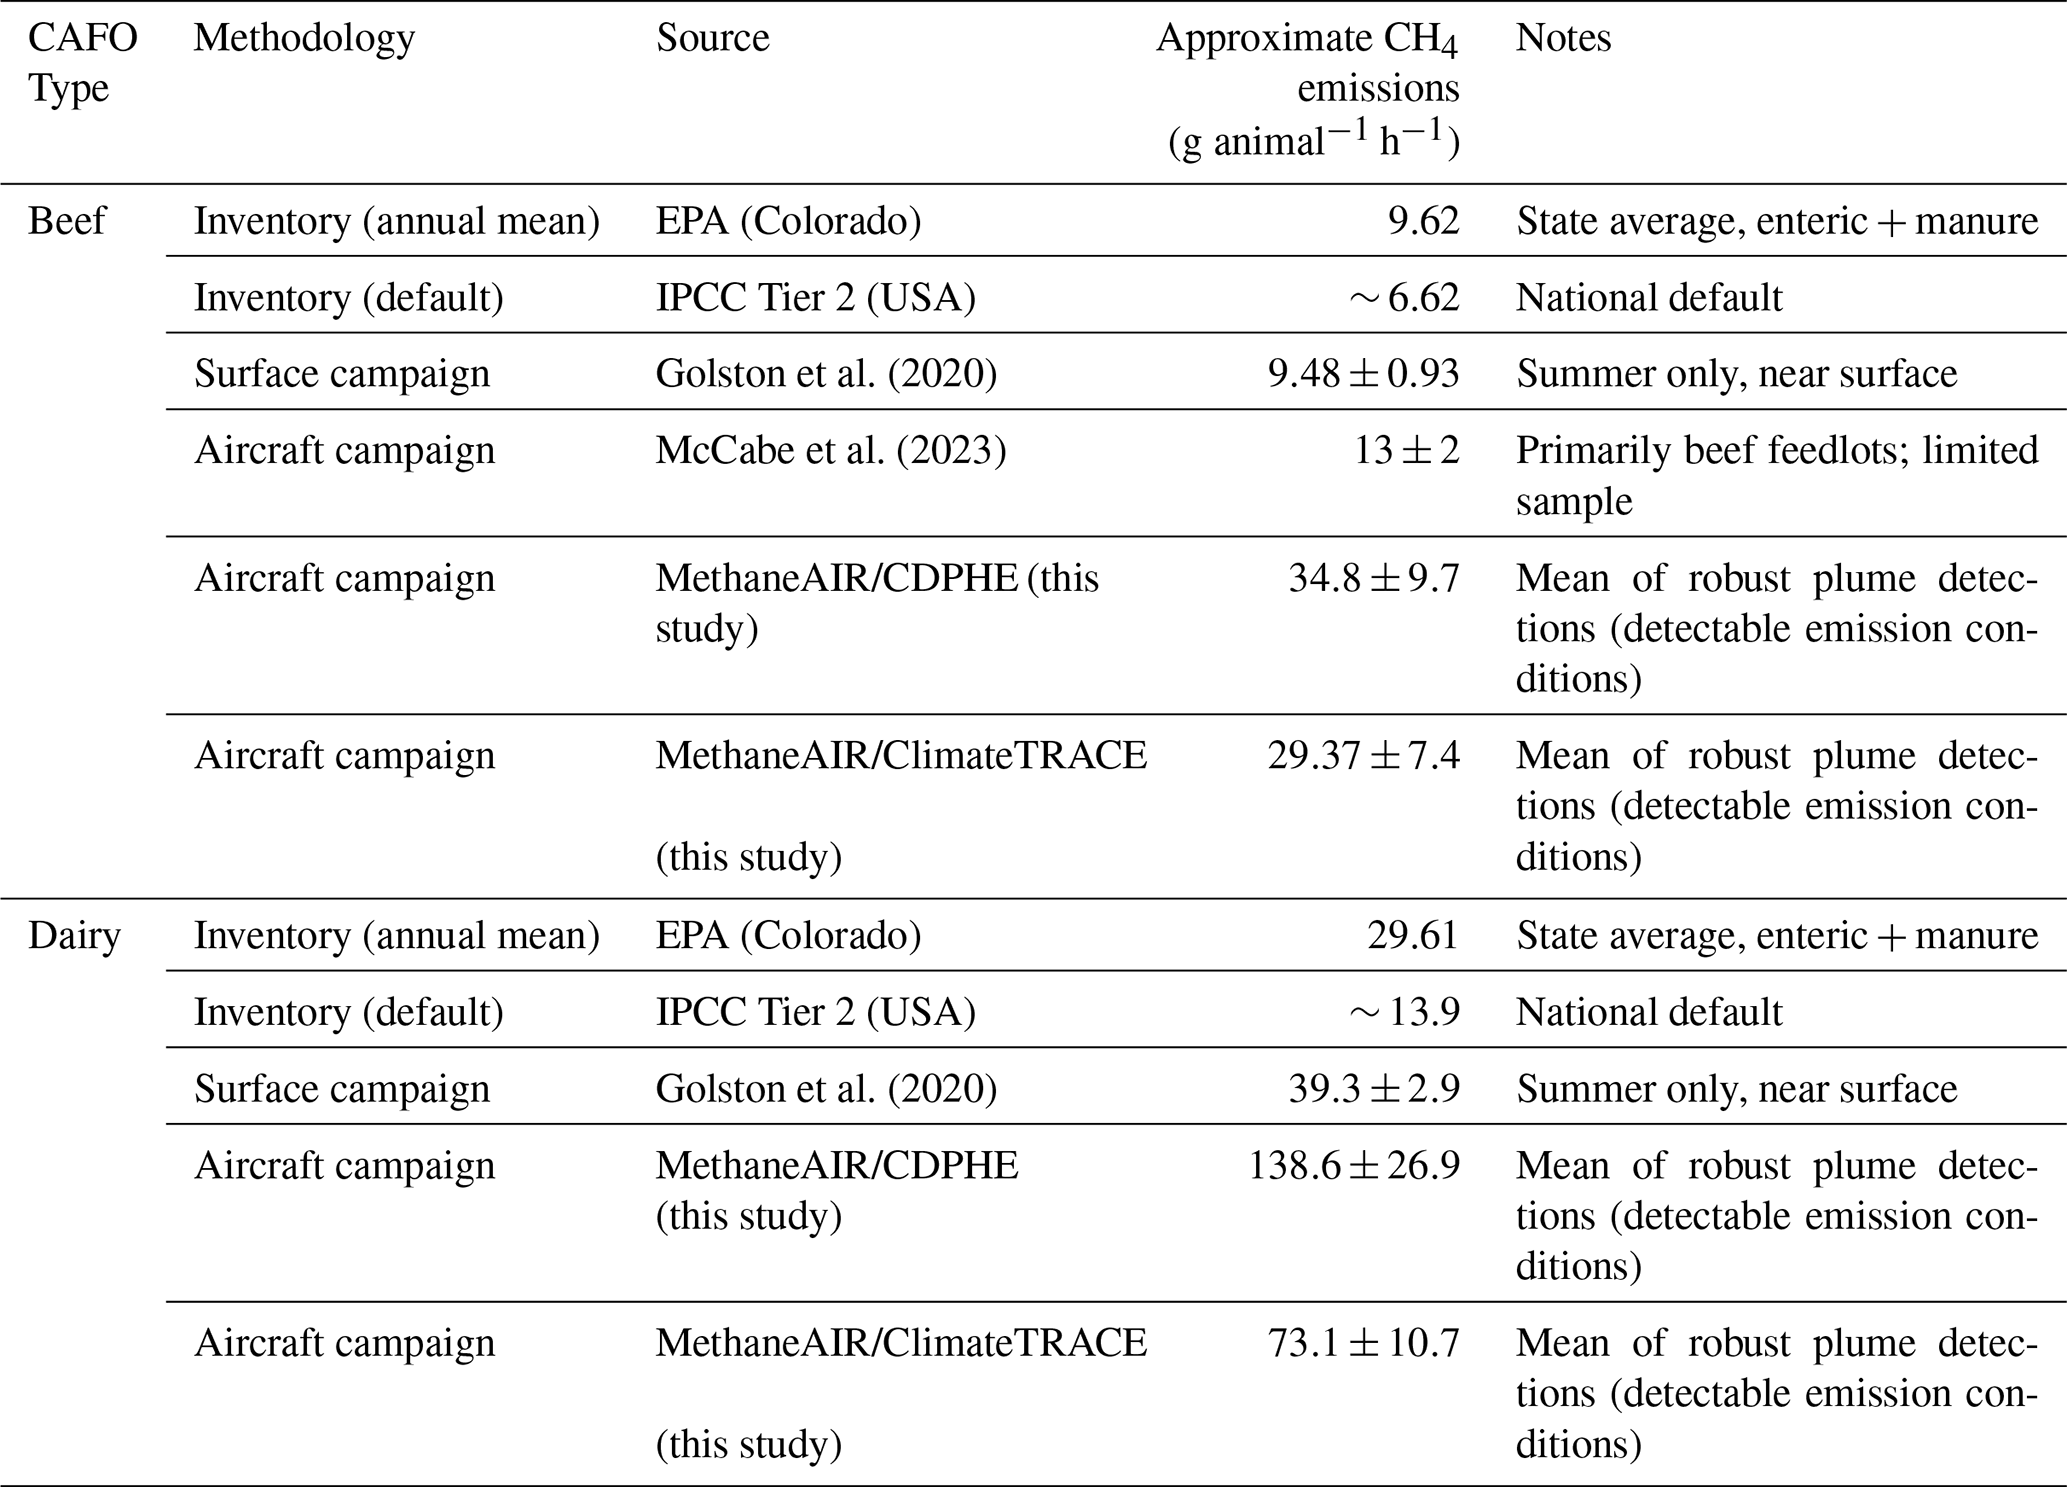
MethaneAIR derived per-animal emission estimates are also higher than those reported in other observational studies (Table 1). Surface-based estimates by Golston et al. (2020) were 9.48±0.93 g CH4 animal−1 h−1 for beef and 39.3±2.9 g CH4 animal−1 h−1 for dairy, while aircraft-based estimates from McCabe et al. (2023) gave a blended average of 13±2 g CH4 animal−1 h−1. Regional inversion studies (e.g. Yu et al., 2021) have also reported livestock emissions above EPA estimates, although these represent aggregated fluxes rather than facility-scale plume measurements.
These differences between MethaneAIR-derived values and inventory estimates likely come from a combination of factors, including variability in livestock activity, differences in spatial and temporal sampling, and methodological differences between plume-based and inventory approaches. MethaneAIR observations capture instantaneous emissions under conditions when plumes are detectable, whereas EPA emission factors correspond to annual-average values. MethaneAIR derived per-animal emission rates should therefore be interpreted as representing detectable emission conditions rather than time-averaged facility behaviour. As noted in Sect. 3.2, these comparisons are based on aggregated emission estimates across multiple plumes and facilities, reducing the influence of high relative uncertainty in individual plume measurements. In addition, as discussed in Sect. 3.5, the analysis is conditional on plume detection and therefore likely biased toward higher emission rates.
3.5 Detection bias and implications for per-animal emission estimates
Per-animal emission estimates presented here are derived exclusively from methane plumes that meet the robustness criterion defined in Sect. 2.4, representing 89 robust detections out of 200 identified agricultural plumes. As such, the analysis is conditional on successful plume detection and quantification, rather than representing continuous or unbiased sampling of CAFO emissions.
Because plume detection depends on emission strength, meteorological conditions and background variability, larger plumes and plumes with a well-defined structure are more likely to be found. Smaller, or more diffuse emissions may not be detected or fail the robustness criteria. Consequently, lower emission plumes are likely underrepresented in the analysed dataset. This introduces a sampling bias toward higher emissions. The distribution of per-animal emission estimates (Fig. 6) is correspondingly skewed, with elevated values (particularly for dairy operations) dominating the upper range. Because non-detected or non-robust emissions are excluded, derived per-animal values are expected to be biased high relative to time-averaged facility emissions.
This bias is particularly relevant when comparing top-down plume-based estimates with inventory emission factors. It is important to note that EPA emission factors are annual averages across a wide range of operational and environmental conditions, while MethaneAIR observations are instantaneous emissions that are conditional on detectability. Apparent exceedances of EPA values should therefore be interpreted in this context rather than as direct evidence of systematic inventory underestimation.
Despite this limitation, the overall patterns in the results are consistent. In particular, the separation between dairy and beef per-animal emission rates persists across both CDPHE- and Climate TRACE–normalized datasets, indicating that relative differences between CAFO types are not solely an artefact of activity assumptions or detection filtering. However, the absolute magnitude of derived per-animal emission rates likely reflects the upper envelope of facility emissions under detectable conditions rather than mean operational behaviour.
3.6 Plume Detection Thresholds
To assess reliability and frequency of observation, detection thresholds were evaluated using plume detection rates under varying conditions, focusing on expected emission size and meteorological factors such as wind speed.
Figure 7 shows the rate of plume and robust plume detection as a function of expected CAFO emissions (derived from animal numbers and EPA emission factors) and wind speed for the Colorado subset. These expected emission values are used to group facilities by approximate emission strength and do not represent observed emissions. A “None Detected” classification indicates that no plume meeting the detection criteria was identified within the scene. Unsurprisingly, the majority of “None” detections occur at low expected emission rates, although a significant number of plumes are also detected in this range too. The meteorological features are more nuanced, with wind speed showing modest increase in non-detections at low and high wind speeds. Again, this makes sense intuitively, at high wind speeds, there will be less buildup of methane, making plumes harder to detect, at low wind speeds the increased build up may no longer be plume like. Temperature and preceding rainfall were also investigated but did not show significant relationships due to the limited variability of conditions during observations.
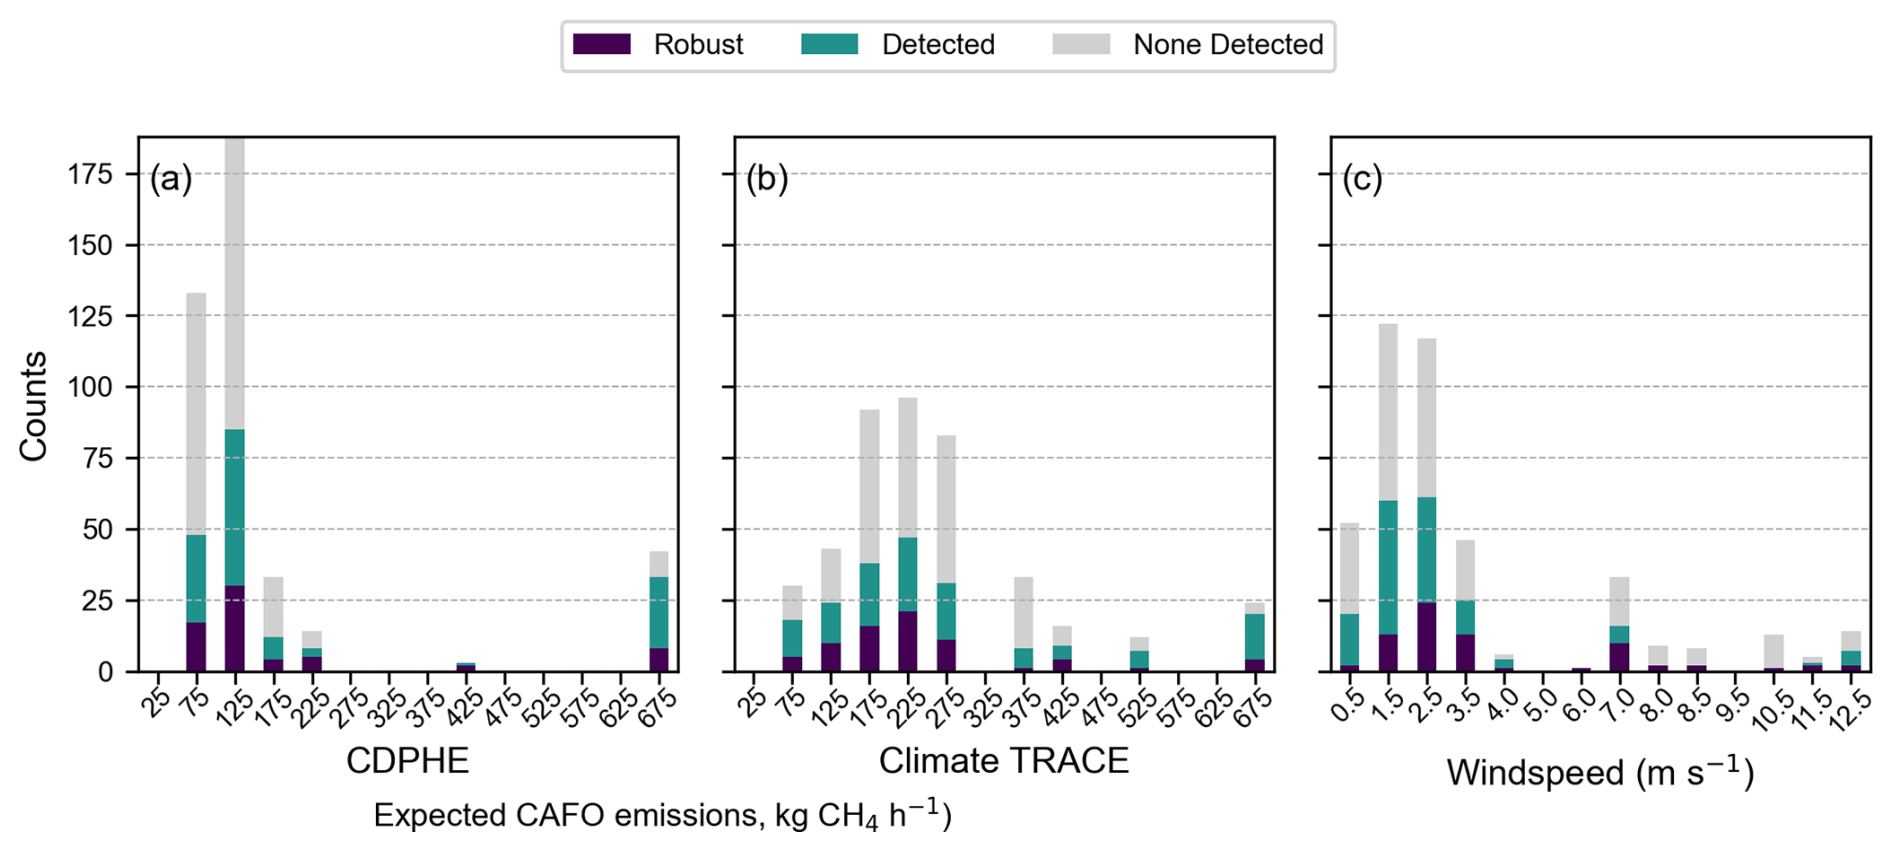
Figure 7MethaneAIR scene-based plume detection rates for CAFOs in northeast Colorado versus for expected emissions (a, b) and wind speed (c). Expected emissions are derived using stock numbers from CDPHE (a) and Climate TRACE (b).
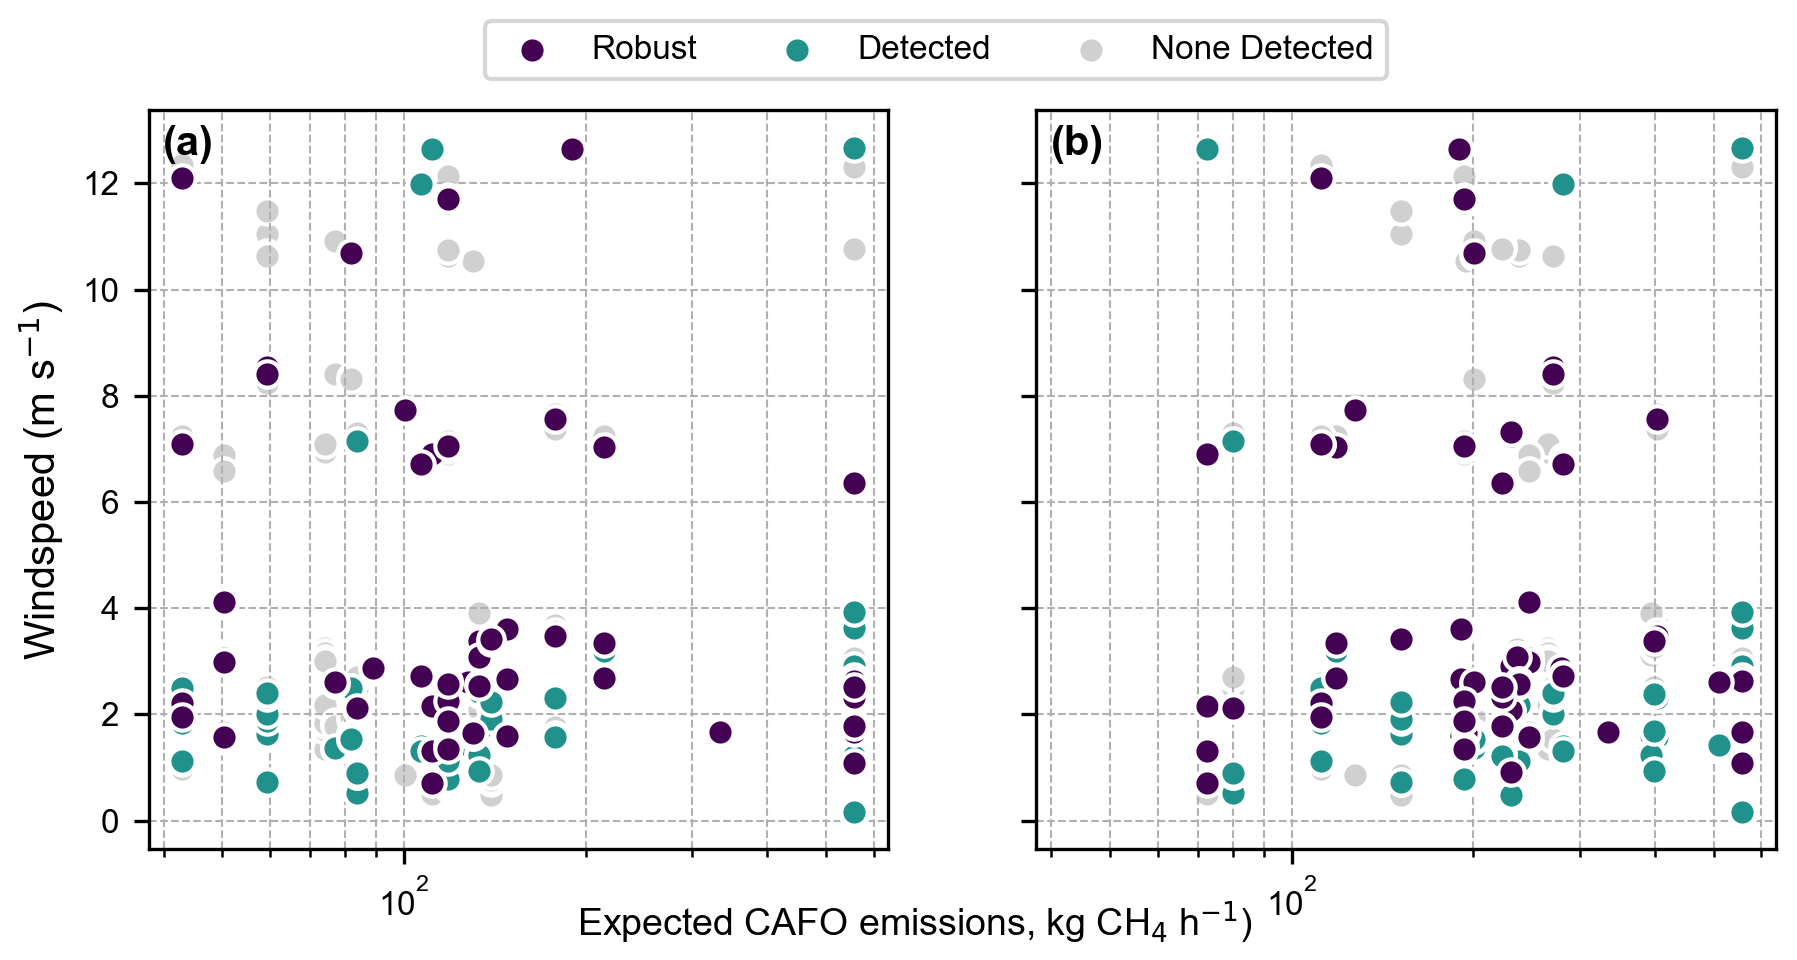
Figure 8Detection class as a function of expected emissions and wind speed. Expected emissions are derived using stock numbers from CDPHE (a) and Climate TRACE (b).
The relationship between emission rate, wind speed, and detection performance was evaluated across three detection classes (Fig. 8). While the limited sample size precludes the development of statistically reliable detection thresholds, several trends are evident.
Detection and reliable quantification of emission sources emitting less than 100 kg h−1 are occasionally achievable when wind speeds range between 2 and 6 m s−1. Within this wind speed window, the atmospheric transport conditions appear favourable for plume detection. At higher emission rates, particularly above 200 kg h−1, the influence of wind speed on detection success diminishes, suggesting that stronger sources are more readily detectable regardless of moderate variations in wind conditions.
A subset of failed or non-robust detections occurred despite satisfying the nominal wind speed and emission rate criteria. These anomalies may be attributed to several factors, including temporal variability in actual emission rates, discrepancies between modelled wind data (e.g., HRRR) and on-site wind conditions, and elevated background methane concentrations that may obscure the signal from emission sources.
3.7 Emission Variability Drivers
We can extend this analysis to explore the variability in observed, robust methane emissions from CAFOs, as in the detection case we focus only on the influence of wind speed. Although the dataset is limited, most outliers occurred during high wind speed conditions. While this pattern may reflect a wind speed-related bias in the emission estimation methodology, it is notable that several high-wind cases exhibited minimal emission enhancements, suggesting site-specific behaviour (Fig. 9).
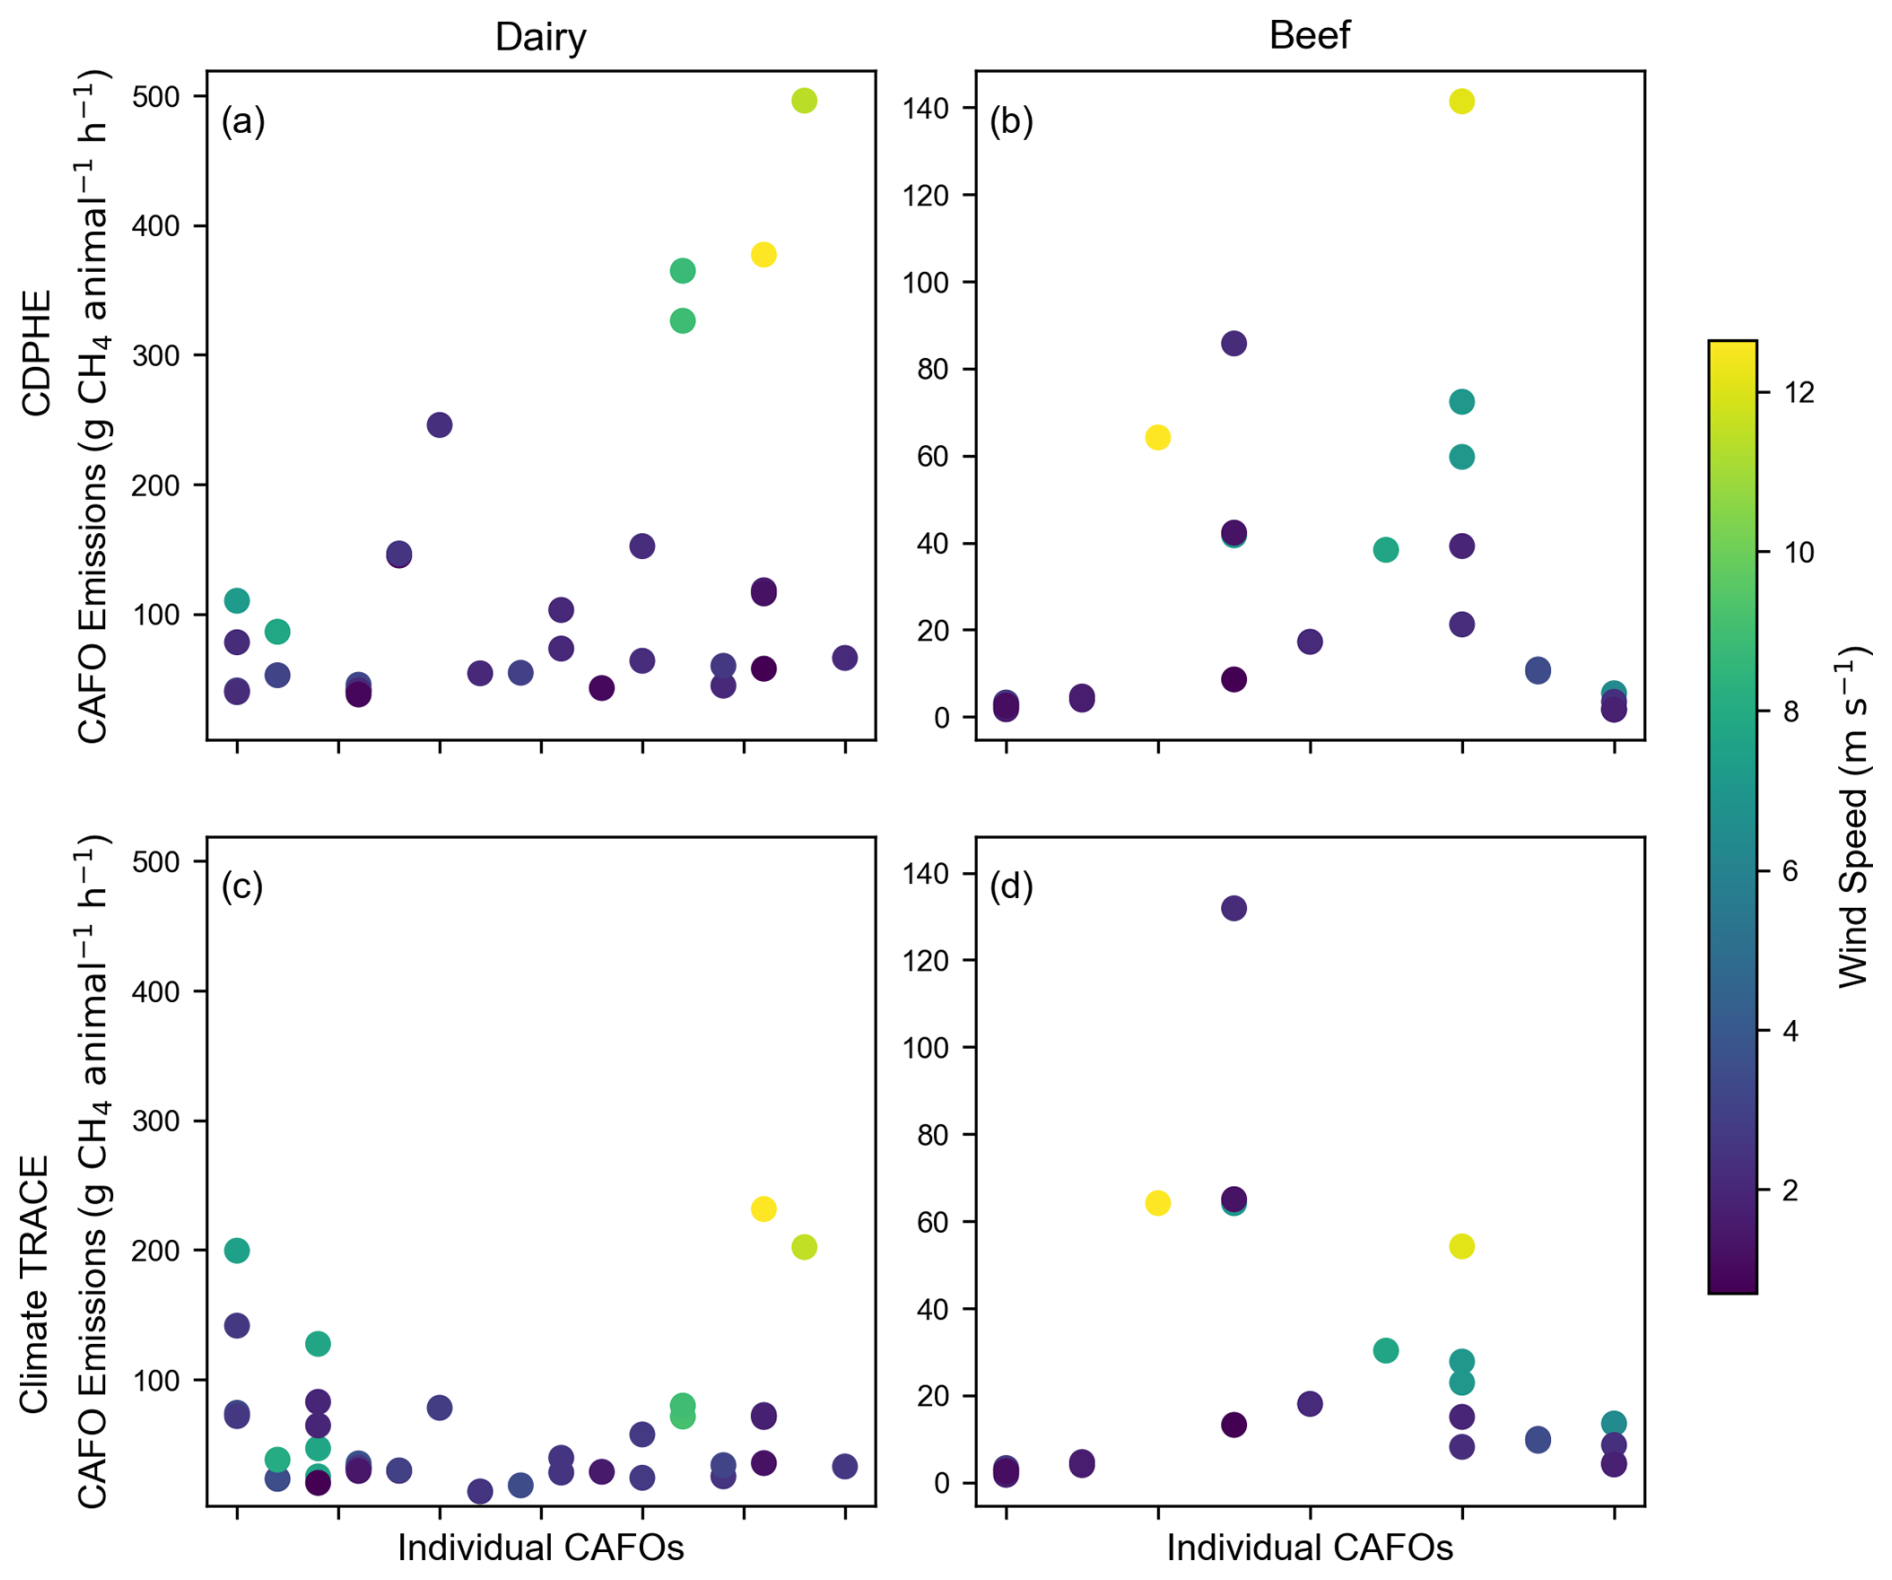
Figure 9Methane emissions per-animal (g h−1) from dairy (a, c) and beef (b, d) CAFOs in northeast Colorado. Emissions per animal are derived using stock numbers from CDPHE (a, b) and Climate TRACE (c, d).
For two CAFOs with repeated observations across a range of wind conditions, elevated emissions were only detected during periods of high wind speed. At other sites, however, high winds did not correspond to increased enhancements. Together, these observations indicate that high wind speed alone does not consistently produce larger observed enhancements. This pattern suggests that facility-specific factors likely influence emission responsiveness to wind, and that the wind speed-emission relationship may be site-specific, and shaped by the intermittent, weather-dependent nature of emissions from lagoon-based systems.
The site-dependent nature of the wind–emission relationship aligns with previous studies showing that methane emissions from lagoon-based systems can respond strongly to weather events. Leytem et al. (2017) demonstrated that wind events, alongside rainfall and freeze/thaw cycles, significantly increased CH4 emissions from dairy lagoons in Idaho, independent of temperature. Their models identified wind speed as a key predictor. Confirming this wind-driven variability more reliably would require expanded aerial surveys, improved traceability of CAFO-related EPA data beyond Colorado, or additional facility operation data.
Other studies have identified several factors influencing variability of CH4 emissions from farms, including barn temperature and humidity (Ouatahar et al., 2024), manure management practice, diurnal variability due to temperature and other atmospheric conditions (Golston et al., 2020; Ouatahar et al., 2024). Golston et al. also reported substantial spatial variability within facilities. Dietary influence can also be significant. Yu et al. (2021) suggested that management practices had a stronger influence than seasonality accounted for in bottom-up approaches; for example, anaerobic lagoons produce significant emissions, and the length of time the manure is stored in them following removal from housing can have an impact.
This study demonstrates the effectiveness of MethaneAIR in detecting and quantifying methane emissions from CAFOs in Northeast Colorado. A total of 652 methane plumes were identified across 209 agricultural scenes, with 89 (44 %) of scenes containing at least one CAFO-related plume meeting the robustness criterion. These results confirm both the potential and the complexity of isolating agricultural emissions in regions with competing oil and gas sources and highlight the importance of targeted approaches.
A central component of this work is agricultural scene extraction prior to further processing, which isolates CAFO-associated emissions from broader MethaneAIR flight mosaics. By spatially subsetting the data around known CAFO locations and filtering out scenes with insufficient data coverage, this approach improves the detectability of smaller, diffuse agricultural plumes that would otherwise be difficult to isolate in the presence of dominant oil and gas emissions. This method supports improved attribution accuracy and provides a scalable framework for future airborne and satellite-based methane monitoring in mixed-source landscapes.
Given the observational nature of this dataset and the lack of controlled releases for agricultural sources, a single deterministic detection limit cannot be defined for the combined method. Instead, detection and quantification capability are assessed empirically, reflecting the interplay between emission strength, meteorological conditions, and background variability. As a result, the effective detection limit is not fixed, and weaker emission states may fall below detectability, contributing to a bias toward higher emission events, as discussed in Sect. 3.5.
Per-animal emission estimates derived from MethaneAIR observations show clear and consistent differences between CAFO types, with dairy operations generally exhibiting higher emissions than beef operations. This pattern is consistent across both CDPHE maximum capacity and Climate TRACE–based normalization approaches, indicating that the relative distinction between dairy and beef emissions is not solely an artefact of livestock activity assumptions. However, the absolute magnitude of per-animal emission estimates is sensitive to the choice of normalization dataset, reflecting uncertainty in underlying animal counts.
MethaneAIR-derived per-animal emission rates are frequently higher than EPA emission factor estimates, although this may partly reflect uncertainty in livestock activity data. The analysis is based on detectable plume conditions, and therefore preferentially samples higher emission states. In contrast, EPA emission factors represent annual averages across a wide range of conditions. As a result, MethaneAIR observations are more representative of detectable emission conditions than of time-averaged behaviour, and apparent exceedances of EPA values likely reflect a combination of detection bias, activity data uncertainty, and real variability in emissions. These results should therefore be interpreted as characterising elevated emission states rather than average facility behaviour. Additional observations, together with improved on-farm data such as true stocking rates and waste management practices, would help better link observed emissions to underlying activity and to enable more robust evaluation of emission factors.
Wind speed played an important role in plume detectability, with lower emissions being detected during moderate wind conditions. However, the relationship between wind speed and observed emissions varied between facilities, suggesting that emission behaviour is influenced by site-specific factors such as infrastructure, management practices, and lagoon dynamics. This variability is further reflected in the wide range of emissions observed across CAFOs, including several high-emission outliers. This study used a fixed scene size, which does not account for variability in plume extent driven by changing meteorological conditions. An adaptive scene size that responds dynamically to wind speed, direction, and boundary-layer structure may enhance performance and could be included in future developments.
This study focused on one region and relied on coincident CAFO location and activity data. Broader application will require validation across additional regions and seasons and incorporation of farm-specific information such as actual livestock numbers and waste management practices. In addition, uncertainties in the DI flux estimates are not fully captured by the robustness criterion alone and do not explicitly account for wind field uncertainty, retrieval error, or background variability.
These findings provide insight into the variability and intensity of methane emissions from CAFOs and highlight the value of targeted observations for facility-scale agricultural emissions. Although MethaneSAT is no longer operational, the agricultural scene extraction and attribution strategies developed here remain highly relevant for current and future airborne and satellite missions. When interpreted within the context of detection constraints and activity data uncertainty, this approach provides a strong foundation for improving methane emission monitoring, inventory evaluation, and mitigation strategies in agricultural systems.
Python code used for data analyses and visualizations can be obtained from the corresponding authors upon reasonable request. MethaneAIR point source data can be accessed online from the Earth Engine Data Catalog at https://developers.google.com/earth-engine/datasets/tags/methaneair (Earth Engine Data Catalog, 2025).
PS led the writing of the manuscript, incorporating comments and revisions from all authors, and produced several key figures and analyses. AG developed the processing methods presented in this work and contributed to the manuscript and figure generation. ZZ developed the wavelet denoising approach, building on the DI flux estimates produced by AC and MS.. MS, JEF, and SCW oversaw campaign planning, instrument calibration, CM and SR developed the level-2 data processing used in this study. SMF, JW, JR, and all other authors provided valuable insights and interpretations throughout the research and the preparation of the manuscript.
The contact author has declared that none of the authors has any competing interests.
Publisher's note: Copernicus Publications remains neutral with regard to jurisdictional claims made in the text, published maps, institutional affiliations, or any other geographical representation in this paper. The authors bear the ultimate responsibility for providing appropriate place names. Views expressed in the text are those of the authors and do not necessarily reflect the views of the publisher.
We thank the three anonymous reviewers for their insightful comments on the manuscript.
This research has been supported by the Ministry for Business Innovation and Employment (grant no. CO1X2023) and by funding from the Environmental Defense Fund.
This paper was edited by Huilin Chen and reviewed by three anonymous referees.
CDPHE: Feedlot registration and compliance data, Colorado Department of Public Health Environment – Environmental Agriculture Program, 2017.
Chan Miller, C., Roche, S., Wilzewski, J. S., Liu, X., Chance, K., Souri, A. H., Conway, E., Luo, B., Samra, J., Hawthorne, J., Sun, K., Staebell, C., Chulakadabba, A., Sargent, M., Benmergui, J. S., Franklin, J. E., Daube, B. C., Li, Y., Laughner, J. L., Baier, B. C., Gautam, R., Omara, M., and Wofsy, S. C.: Methane retrieval from MethaneAIR using the CO2 proxy approach: a demonstration for the upcoming MethaneSAT mission, Atmos. Meas. Tech., 17, 5429–5454, https://doi.org/10.5194/amt-17-5429-2024, 2024.
Chang, J., Peng, S., Yin, Y., Ciais, P., Havlik, P., and Herrero, M.: The Key Role of Production Efficiency Changes in Livestock Methane Emission Mitigation, AGU Advances, 2, e2021AV000391, https://doi.org/10.1029/2021AV000391, 2021.
Chen, Y., Sherwin, E. D., Berman, E. S. F., Jones, B. B., Gordon, M. P., Wetherley, E. B., Kort, E. A., and Brandt, A. R.: Quantifying Regional Methane Emissions in the New Mexico Permian Basin with a Comprehensive Aerial Survey, Environ. Sci. Technol. 56, 4317–4323, 10.1021/acs.est.1c06458, 2022.
Chulakadabba, A., Sargent, M., Lauvaux, T., Benmergui, J. S., Franklin, J. E., Chan Miller, C., Wilzewski, J. S., Roche, S., Conway, E., Souri, A. H., Sun, K., Luo, B., Hawthrone, J., Samra, J., Daube, B. C., Liu, X., Chance, K., Li, Y., Gautam, R., Omara, M., Rutherford, J. S., Sherwin, E. D., Brandt, A., and Wofsy, S. C.: Methane point source quantification using MethaneAIR: a new airborne imaging spectrometer, Atmos. Meas. Tech., 16, 5771–5785, https://doi.org/10.5194/amt-16-5771-2023, 2023.
Climate TRACE: Climate TRACE Emissions Inventory, version 4.2.0, https://climatetrace.org (last access: 18 July 2025), 2025.
Crippa, M., Guizzardi, D., Muntean, M., Schaaf, E., Lo Vullo, E., Solazzo, E., Monforti-Ferrario, F., Olivier, J., and Vignati, E.: EDGAR v6.0 Greenhouse Gas Emissions. European Commission Joint Research Centre, https://doi.org/10.2905/JRC.787T5VR, 2021.
Cusworth, D. H., Bloom, A. A., Ma, S., Miller, C. E., Bowman, K., Yin, Y., Maasakkers, J. D., Zhang, Y., Scarpelli, T. R., Qu, Z., Jacob, D. J., and Worden, J. R.: A Bayesian framework for deriving sector-based methane emissions from top-down fluxes, Commun. Earth Environ., 2, 242, https://doi.org/10.1038/s43247-021-00312-6, 2021.
Davitt, A., Lewis, C., Andoe-Leggett, M., and Schiller, S.: Agriculture sector – Countrylevel Enteric fermentation and Manure Management Emissions Estimates from Cattle Operations. WattTime, USA and Carbon Yield, USA, https://climatetrace.org (last access: 20 January 2025), 2024.
El Abbadi, S. H., Chen, Z., Burdeau, P. M., Rutherford, J. S., Chen, Y., Zhang, Z., Sherwin, E. D., and Brandt, A. R.: Technological Maturity of Aircraft-Based Methane Sensing for Greenhouse Gas Mitigation, Environ. Sci. Technol. 58, 9591–9600, 10.1021/acs.est.4c02439, 2024.
Golston, L. M., Pan, D., Sun, K., Tao, L., Zondlo, M. A., Eilerman, S. J., Peischl, J., Neuman, J. A., and Floerchinger, C.: Variability of Ammonia and Methane Emissions from Animal Feeding Operations in Northeastern Colorado, Environ. Sci. Technol. 54, 11015–11024, https://doi.org/10.1021/acs.est.0c00301, 2020.
Google Earth Engine Data Catalog: MethaneAIR datasets, available at: https://developers.google.com/earth-engine/datasets/tags/methaneair (last access: 10 November 2025), 2025.
Guanter, L., Warren, J., Omara, M., Chulakadabba, A., Roger, J., Sargent, M., Franklin, J. E., Wofsy, S. C., and Gautam, R.: Detection and quantification of methane plumes with the MethaneAIR airborne spectrometer, Atmos. Meas. Tech., 18, 3857–3872, https://doi.org/10.5194/amt-18-3857-2025, 2025.
Hancock, S. E., Jacob, D. J., Chen, Z., Nesser, H., Davitt, A., Varon, D. J., Sulprizio, M. P., Balasus, N., Estrada, L. A., Cazorla, M., Dawidowski, L., Diez, S., East, J. D., Penn, E., Randles, C. A., Worden, J., Aben, I., Parker, R. J., and Maasakkers, J. D.: Satellite quantification of methane emissions from South American countries: a high-resolution inversion of TROPOMI and GOSAT observations, Atmos. Chem. Phys., 25, 797–817, https://doi.org/10.5194/acp-25-797-2025, 2025.
IPCC: 2006 IPCC Guidelines for National Greenhouse Gas Inventories, IPCC, ISBN 4-88788-032-4, https://www.ipcc-nggip.iges.or.jp/public/2006gl/ (last access: 21 November 2024), 2006.
IPCC: 2019 Refinement to the 2006 IPCC Guidelines for National Greenhouse Gas Inventories, IPCC, ISBN 978-4-88788-232-4, https://www.ipcc-nggip.iges.or.jp/public/2019rf/index.html (last access: 21 January 2025), 2019.
IPCC: Sections, in: Climate Change 2023: Synthesis Report. Contribution of Working Groups I, II and III to the Sixth Assessment Report of the Intergovernmental Panel on Climate Change IPCC, Geneva, Switzerland, 35–115, https://doi.org/10.59327/IPCC/AR6-9789291691647, 2023.
Jacob, D. J., Turner, A. J., Maasakkers, J. D., Sheng, J., Sun, K., Liu, X., Chance, K., Aben, I., McKeever, J., and Frankenberg, C.: Satellite observations of atmospheric methane and their value for quantifying methane emissions, Atmos. Chem. Phys., 16, 14371–14396, https://doi.org/10.5194/acp-16-14371-2016, 2016.
Jacob, D. J., Varon, D. J., Cusworth, D. H., Dennison, P. E., Frankenberg, C., Gautam, R., Guanter, L., Kelley, J., McKeever, J., Ott, L. E., Poulter, B., Qu, Z., Thorpe, A. K., Worden, J. R., and Duren, R. M.: Quantifying methane emissions from the global scale down to point sources using satellite observations of atmospheric methane, Atmos. Chem. Phys., 22, 9617–9646, https://doi.org/10.5194/acp-22-9617-2022, 2022.
Karion, A., Sweeney, C., Pétron, G., Frost, G., Michael Hardesty, R., Kofler, J., Miller, B. R., Newberger, T., Wolter, S., Banta, R., Brewer, A., Dlugokencky, E., Lang, P., Montzka, S. A., Schnell, R., Tans, P., Trainer, M., Zamora, R., and Conley, S.: Methane emissions estimate from airborne measurements over a western United States natural gas field, Geophys. Res. Lett., 40, 4393–4397, https://doi.org/10.1002/grl.50811, 2013.
Leytem, A. B., Bjorneberg, D. L., Koehn, A. C., Moraes, L. E., Kebreab, E., and Dungan, R. S.: Methane emissions from dairy lagoons in the western United States, J. Dairy Sci., 100, 6785–6803, https://doi.org/10.3168/jds.2017-12777, 2017.
Li, F., Bai, S., Lin, K., Feng, C., Sun, S., Zhao, S., Wang, Z., Zhou, W., Zhou, C., and Zhang, Y.: Satellite-Based Surveys Reveal Substantial Methane Point-Source Emissions in Major Oil & Gas Basins of North America During 2022–2023, J. Geophys. Res.-Atmos., 129, e2024JD040870, https://doi.org/10.1029/2024JD040870, 2024.
Maasakkers, J. D., Jacob, D. J., Sulprizio, M. P., Scarpelli, T. R., Nesser, H., Sheng, J.-X., Zhang, Y., Hersher, M., Bloom, A. A., Bowman, K. W., Worden, J. R., Janssens-Maenhout, G., and Parker, R. J.: Global distribution of methane emissions, emission trends, and OH concentrations and trends inferred from an inversion of GOSAT satellite data for 2010–2015, Atmos. Chem. Phys., 19, 7859–7881, https://doi.org/10.5194/acp-19-7859-2019, 2019.
Maasakkers, J. D., McDuffie, E. E., Sulprizio, M. P., Chen, C., Schultz, M., Brunelle, L., Thrush, R., Steller, J., Sherry, C., Jacob, D. J., Jeong, S., Irving, B., and Weitz, M.: A Gridded Inventory of Annual 2012–2018 U.S. Anthropogenic Methane Emissions, Environ. Sci. Technol. 57, 16276–16288, 10.1021/acs.est.3c05138, 2023.
Manninen, E., Chulakadabba, A., Sargent, M., Zhang, Z., Kamdar, H., Warren, J., Roche, S., Chan Miller, C., Kyzivat, E., Benmergui, J., Pittman, J., Walker, E., Bushey, J., Samra, J., Hawthorne, J., Luo, B., Nasr, M., Sun, K., Franklin, J., Liu, X., Chen, J., and Wofsy, S.: Probabilities of Detection of Methane Plumes by Remote Sensing and Implications for Inferred Emissions Distributions, EGUsphere [preprint], https://doi.org/10.5194/egusphere-2026-115, 2026.
McCabe, M. E., Pollack, I. B., Fischer, E. V., Steinmann, K. M., and Caulton, D. R.: Technical note: Isolating methane emissions from animal feeding operations in an interfering location, Atmos. Chem. Phys., 23, 7479–7494, https://doi.org/10.5194/acp-23-7479-2023, 2023.
Mead, G. J., Herman, D. I., Giorgetta, F. R., Malarich, N. A., Baumann, E., Washburn, B. R., Newbury, N. R., Coddington, I., and Cossel, K. C.: Apportionment and Inventory Optimization of Agriculture and Energy Sector Methane Emissions Using Multi-Month Trace Gas Measurements in Northern Colorado, Geophys. Res. Lett., 51, e2023GL105973, https://doi.org/10.1029/2023GL105973, 2024.
Michel, S. E., Lan, X., Miller, J., Tans, P., Clark, J. R., Schaefer, H., Sperlich, P., Brailsford, G., Morimoto, S., Moossen, H., and Li, J.: Rapid shift in methane carbon isotopes suggests microbial emissions drove record high atmospheric methane growth in 2020–2022, P. Natl. Acad. Sci., 121, e2411212121, https://doi.org/10.1073/pnas.2411212121, 2024.
National Academies of Sciences, Engineering, and Medicine: Improving Characterization of Anthropogenic Methane Emissions in the United States, National Academies Press, ISBN 978-0-309-47050-6, https://doi.org/10.17226/24987, 2018.
NOAA: High-Resolution Rapid Refresh (HRRR) Model, Registry of Open Data on AWS, NOAA [data set], https://rapidrefresh.noaa.gov/hrrr/ (last access: 21 May 2025), 2025.
Ouatahar, L., Bannink, A., Zentek, J., Amon, T., Deng, J., Hempel, S., Janke, D., Beukes, P., van der Weerden, T., Krol, D., Lanigan, G. J., and Amon, B.: An integral assessment of the impact of diet and manure management on whole-farm greenhouse gas and nitrogen emissions in dairy cattle production systems using process-based models, Waste Manage., 187, 79–90, https://doi.org/10.1016/j.wasman.2024.07.007, 2024.
Peischl, J., Karion, A., Sweeney, C., Kort, E. A., Smith, M. L., Brandt, A. R., Yeskoo, T., Aikin, K. C., Conley, S. A., Gvakharia, A., Trainer, M., Wolter, S., and Ryerson, T. B.: Quantifying atmospheric methane emissions from oil and natural gas production in the Bakken shale region of North Dakota, J. Geophys. Res.-Atmos., 121, 6101–6111, https://doi.org/10.1002/2015JD024631, 2016.
Petrescu, A. M. R., Peters, G. P., Engelen, R., Houweling, S., Brunner, D., Tsuruta, A., Matthews, B., Patra, P. K., Belikov, D., Thompson, R. L., Höglund-Isaksson, L., Zhang, W., Segers, A. J., Etiope, G., Ciotoli, G., Peylin, P., Chevallier, F., Aalto, T., Andrew, R. M., Bastviken, D., Berchet, A., Broquet, G., Conchedda, G., Dellaert, S. N. C., Denier van der Gon, H., Gütschow, J., Haussaire, J.-M., Lauerwald, R., Markkanen, T., van Peet, J. C. A., Pison, I., Regnier, P., Solum, E., Scholze, M., Tenkanen, M., Tubiello, F. N., van der Werf, G. R., and Worden, J. R.: Comparison of observation- and inventory-based methane emissions for eight large global emitters, Earth Syst. Sci. Data, 16, 4325–4350, https://doi.org/10.5194/essd-16-4325-2024, 2024.
Roques, S., Martinez-Fernandez, G., Ramayo-Caldas, Y., Popova, M., Denman, S., Meale, S. J., and Morgavi, D. P.: Recent Advances in Enteric Methane Mitigation and the Long Road to Sustainable Ruminant Production, Annu. Rev. Anim. Biosci., 12, 321–343, https://doi.org/10.1146/annurev-animal-021022-024931, 2024.
Saunois, M., Martinez, A., Poulter, B., Zhang, Z., Raymond, P. A., Regnier, P., Canadell, J. G., Jackson, R. B., Patra, P. K., Bousquet, P., Ciais, P., Dlugokencky, E. J., Lan, X., Allen, G. H., Bastviken, D., Beerling, D. J., Belikov, D. A., Blake, D. R., Castaldi, S., Crippa, M., Deemer, B. R., Dennison, F., Etiope, G., Gedney, N., Höglund-Isaksson, L., Holgerson, M. A., Hopcroft, P. O., Hugelius, G., Ito, A., Jain, A. K., Janardanan, R., Johnson, M. S., Kleinen, T., Krummel, P. B., Lauerwald, R., Li, T., Liu, X., McDonald, K. C., Melton, J. R., Mühle, J., Müller, J., Murguia-Flores, F., Niwa, Y., Noce, S., Pan, S., Parker, R. J., Peng, C., Ramonet, M., Riley, W. J., Rocher-Ros, G., Rosentreter, J. A., Sasakawa, M., Segers, A., Smith, S. J., Stanley, E. H., Thanwerdas, J., Tian, H., Tsuruta, A., Tubiello, F. N., Weber, T. S., van der Werf, G. R., Worthy, D. E. J., Xi, Y., Yoshida, Y., Zhang, W., Zheng, B., Zhu, Q., Zhu, Q., and Zhuang, Q.: Global Methane Budget 2000–2020, Earth Syst. Sci. Data, 17, 1873–1958, https://doi.org/10.5194/essd-17-1873-2025, 2025.
Schuit, B. J., Maasakkers, J. D., Bijl, P., Mahapatra, G., van den Berg, A.-W., Pandey, S., Lorente, A., Borsdorff, T., Houweling, S., Varon, D. J., McKeever, J., Jervis, D., Girard, M., Irakulis-Loitxate, I., Gorroño, J., Guanter, L., Cusworth, D. H., and Aben, I.: Automated detection and monitoring of methane super-emitters using satellite data, Atmos. Chem. Phys., 23, 9071–9098, https://doi.org/10.5194/acp-23-9071-2023, 2023.
Sherwin, E. D., El Abbadi, S. H., Burdeau, P. M., Zhang, Z., Chen, Z., Rutherford, J. S., Chen, Y., and Brandt, A. R.: Single-blind test of nine methane-sensing satellite systems from three continents, Atmos. Meas. Tech., 17, 765–782, https://doi.org/10.5194/amt-17-765-2024, 2024.
Staebell, C., Sun, K., Samra, J., Franklin, J., Chan Miller, C., Liu, X., Conway, E., Chance, K., Milligan, S., and Wofsy, S.: Spectral calibration of the MethaneAIR instrument, Atmos. Meas. Tech., 14, 3737–3753, https://doi.org/10.5194/amt-14-3737-2021, 2021.
Tedeschi, L. O., Abdalla, A. L., Álvarez, C., Anuga, S. W., Arango, J., Beauchemin, K. A., Becquet, P., Berndt, A., Burns, R., De Camillis, C., Chará, J., Echazarreta, J. M., Hassouna, M., Kenny, D., Mathot, M., Mauricio, R. M., McClelland, S. C., Niu, M., Onyango, A. A., Parajuli, R., Pereira, L. G. R., Del Prado, A., Paz Tieri, M., Uwizeye, A., and Kebreab, E.: Quantification of methane emitted by ruminants: a review of methods, J. Anim. Sci., 100, https://doi.org/10.1093/jas/skac197, 2022.
U.S. Environmental Protection Agency: Inventory of U.S. Greenhouse Gas Emissions and Sinks: 1990–2022 – Annexes, https://www.epa.gov/ghgemissions/inventory-us-greenhouse-gas-emissions-and-sinks-1990-2022 (last access: 14 February 2025), 2024.
Varon, D. J., Jacob, D. J., McKeever, J., Jervis, D., Durak, B. O. A., Xia, Y., and Huang, Y.: Quantifying methane point sources from fine-scale satellite observations of atmospheric methane plumes, Atmos. Meas. Tech., 11, 5673–5686, https://doi.org/10.5194/amt-11-5673-2018, 2018.
Warren, J. D., Sargent, M., Williams, J. P., Omara, M., Miller, C. C., Roche, S., MacKay, K., Manninen, E., Chulakadabba, A., Himmelberger, A., Benmergui, J., Zhang, Z., Guanter, L., Wofsy, S., and Gautam, R.: Sectoral contributions of high-emitting methane point sources from major US onshore oil and gas producing basins using airborne measurements from MethaneAIR, Atmos. Chem. Phys., 25, 10661–10675, https://doi.org/10.5194/acp-25-10661-2025, 2025.
Wójcik-Gront, E. and Wnuk, A.: Evaluating Methane Emission Estimates from Intergovernmental Panel on Climate Change Compared to Sentinel-Derived Air–Methane Data, Sustainability, 17, 850 https://doi.org/10.3390/su17030850, 2025.
Worden, J. R., Cusworth, D. H., Qu, Z., Yin, Y., Zhang, Y., Bloom, A. A., Ma, S., Byrne, B. K., Scarpelli, T., Maasakkers, J. D., Crisp, D., Duren, R., and Jacob, D. J.: The 2019 methane budget and uncertainties at 1° resolution and each country through Bayesian integration Of GOSAT total column methane data and a priori inventory estimates, Atmos. Chem. Phys., 22, 6811–6841, https://doi.org/10.5194/acp-22-6811-2022, 2022.
Yu, X., Millet, D. B., Wells, K. C., Henze, D. K., Cao, H., Griffis, T. J., Kort, E. A., Plant, G., Deventer, M. J., Kolka, R. K., Roman, D. T., Davis, K. J., Desai, A. R., Baier, B. C., McKain, K., Czarnetzki, A. C., and Bloom, A. A.: Aircraft-based inversions quantify the importance of wetlands and livestock for Upper Midwest methane emissions, Atmos. Chem. Phys., 21, 951–971, https://doi.org/10.5194/acp-21-951-2021, 2021.
Zhang, Z., Sargent, M., Benmergui, J., and Wofsy, S. C.: Automatic Methane Point Source Plume Masking Based on Wavelet Transform Image Processing, AGU24, Washington, D.C., https://ui.adsabs.harvard.edu/abs/2024AGUFMA11R.1893Z (last access: 24 July 2026), 2024.
Zhang, Z., Sargent, M., Warren, J. D., Chulakadabba, A., Russi, M., Ayvazov, S., Benmergui, J., Knapp, M., Kyzivat, E., Miller, C. C., Roche, S., Luo, B., Miller, D. J., Nasr, M., Sun, K., Williams, J. P., MacKay, K., Omara, M., Guanter, L., Gautam, R., Franklin, J., Liu, X., and Wofsy, S. C.: Automatic Methane Plume Masking Based on Wavelet Transform Image Processing: Application to MethaneAIR and MethaneSAT data, EGUsphere [preprint], https://doi.org/10.5194/egusphere-2026-141, 2026.