
the Creative Commons Attribution 4.0 License.
the Creative Commons Attribution 4.0 License.
 | 23 Jul 2026
Hydrocarbon and carbonyl contributions to wintertime ozone formation in the Uinta Basin, Utah
Loknath Dhar
Using the Framework for 0-D Atmospheric Modeling (F0AM), a zero-dimensional box model designed for simulating atmospheric chemistry, we simulated winter ozone (O3) formation in the Uinta Basin, Utah, with four chemical mechanisms: the Master Chemical Mechanism (MCMv331), Statewide Air Pollution Research Centre Mechanism (SAPRC07), Regional Atmospheric Chemistry Mechanism (RACM2), and Carbon Bond Mechanism (CB6). Our aim was to investigate the chemical processes linking hydrocarbon emissions to the formation of O3 in winter, with a focus on the role of carbonyls as O3 precursors, their primary versus secondary origins, and the impact of various hydrocarbon groups on carbonyl and O3 production across four chemical mechanisms. Regarding carbonyl origins, the final emission flux for carbonyls was near zero, indicating that they were mostly secondary photochemical products. MCMv331 identified formaldehyde and acetaldehyde as the dominant O3 precursors, contributing 0.20 and 0.06 ppb h−1, respectively, to the O3 production rate. Similarly, SAPRC07 and RACM2 identified formaldehyde and acetaldehyde as the dominant carbonyl contributors to O3 production, while CB6 emphasized the generic group “ketones” as key contributors due to its lumping of higher molecular weight carbonyls into a single species. Across all mechanisms, alkanes were the most influential precursor group for the formation of carbonyls and O3. Including heterogeneous chemistry in the model resulted in a modest (1 ppb) decrease in O3 levels without altering the relative importance of precursors. This study highlights the importance of primarily emitted organic groups in winter O3 production and provides insights into O3 reduction strategies in the Uinta Basin and similar regions.
- Article
(1767 KB) - Full-text XML
-
Supplement
(1996 KB) - BibTeX
- EndNote


Elevated tropospheric O3 levels have raised serious concerns over the past decades due to their harmful effects on human health and the environment. High ground-level O3 can cause respiratory issues, eye irritation, and chest discomfort (Soares and Silva, 2022; Filippidou and Koukouliata, 2011). It also negatively impacts ecosystems (Ashmore, 2005) and contributes to climate change in the long term (Barnes et al., 2019; Simpson et al., 2014). Tropospheric O3 forms through photochemical reactions involving precursors like nitrogen oxides (NOx) and non-methane organic compounds (NMOC), and is highly influenced by meteorological and topographical conditions. Although tropospheric O3 is typically considered a summertime problem, high O3 during winter conditions has been reported worldwide. Notable examples include Wyoming, USA (2008) and Lanzhou, China (2018), where high O3 levels were observed despite cold winter conditions (Yang et al., 2024). Weak vertical mixing and high NMOC mixing ratios existed in all of these cases. Mansfield and Hall (2018) and Mansfield and Lyman (2025) showed that wintertime O3 can only form in high-NMOC environments (Mansfield and Hall, 2018; Mansfield and Lyman, 2025).
In the Uinta Basin, Utah, USA, high levels of ground-level O3 were initially observed in December 2009, drawing attention to wintertime O3 pollution in the region (Mansfield and Lyman, 2020). This phenomenon is primarily attributed to a combination of strong temperature inversions with snow cover and emissions from oil and gas operations. Geographically, the Uinta Basin is surrounded by high mountains, creating a bowl-shaped terrain that traps local pollution. This topography provides ideal conditions for creating strong thermal inversions that form at the lowest elevations and expand daily until disrupted by a significant storm (Lyman and Tran, 2015; Oltmans et al., 2014). Snow cover plays an important role in stabilizing inversions by reducing the mixed-layer height (Edwards et al., 2014). Snow cover also increases the surface albedo, which leads to a higher actinic flux for photolysis reactions (Mansfield and Hall, 2013). Under these conditions, precursors emitted from oil and gas operations accumulate in the basin and undergo photochemical reactions in the presence of sunlight to produce O3, and O3 itself accumulates day after day (Lyman et al., 2015). Additionally, oil and gas operations exhibit seasonal variability in emissions, with wintertime activities often associated with higher releases of NOx, methane, and volatile organic compounds due to increased cold-start emissions, reduced efficiency of emission control systems at low temperatures, and additional sources such as natural gas-fired heaters and cold-weather maintenance activities that are largely absent during warmer months (Mansfield and Lyman, 2025).
The photochemical process starts with the reaction of hydroxyl (OH) radicals with hydrocarbons, forming alkyl radicals (R1). These radicals rapidly react with oxygen to form peroxy radicals (R2), which, in the presence of nitrogen monoxide (NO), convert into alkoxy radicals while generating nitrogen dioxide (NO2) (R3). The NO2 then undergoes photolysis (R4), producing an oxygen atom that reacts with molecular oxygen to form O3 (R5) (Wilkes, 2020). In Reactions (1–5), methane (CH4) is used as a representative hydrocarbon to illustrate these pathways.
In this whole process, radicals play a crucial role in initiating and sustaining the oxidation cycles of O3 production by driving the interaction between NMOC and NOx in the troposphere (Carter and Seinfeld, 2012; Seinfeld, 1989).
During the summer, hydroxyl radicals mostly come from the photolysis of O3 and the subsequent reaction of O(1D) with water vapor (Levy, 1971). However, this mechanism becomes less efficient in winter due to decreased ultraviolet light and water vapor, leading to a 15-to-60-fold reduction in primary radical production (Levy, 1971; Edwards et al., 2013). Photolysis of carbonyl compounds and other photolabile oxygenated NMOC (ONMOC) is another source of radicals that can lead to O3 production (Carbajo et al., 2008). These carbonyls can originate from the oxidation of primarily emitted, non-oxygenated NMOC (R6–R8; formaldehyde, HCHO, used as the representative species). In the Uinta Basin, the winter conditions and the high mixing ratio of NMOC originating from oil and gas operations enhance the role of carbonyl photolysis as the dominant source of oxidants (Edwards et al., 2014).
Radical amplification is a chemical process in which a small number of atmospheric radicals (OH or HO2) initiate reaction chains that generate additional radicals, greatly increasing their overall mixing ratio. In the sequence of Reactions (R1)–(R3) and (R6)–(R8), this chain leads to the formation of three OH radicals from a single initial OH, demonstrating the multiplying effect of radical amplification and showing how a high-NMOC wintertime atmosphere can still produce adequate radicals for significant O3 production. These unique and complex interactions between geographical, meteorological, and chemical conditions create an ideal environment for winter O3 formation in the Uinta Basin.
Previous studies on O3 pollution have primarily focused on the relationship between O3 and its precursors during the summertime (Yang et al., 2024). However, studies such as Edwards et al. (2014) highlight the important role of carbonyl compounds in winter, emphasizing their contribution to radical production and subsequent O3 formation. Despite this progress, the detailed chemical mechanisms driving winter O3 events remain underexplored. Addressing this knowledge gap is critical for understanding the unique conditions driving winter O3 production in regions like the Uinta Basin.
A zero-dimensional (0-D) box model like the Framework for 0-D Atmospheric Modeling (F0AM) simplifies the atmosphere into a single, well-mixed ”box,” isolating chemical processes from transport effects, which allows controlled experimentation with precursor emissions and environmental parameters, enabling a detailed analysis of chemical processes. It is also capable of simulating winter-specific conditions such as low temperatures, limited sunlight, and stagnant boundary layers, which makes it ideal for studying winter O3 formation (Wolfe et al., 2016). Researchers have previously utilized F0AM to simulate wintertime O3 (Lyman et al., 2022, and Mansfield and Lyman, 2025).
In this study, the chemistry of carbonyl compounds and a range of primarily emitted organic compounds was investigated, with a particular focus on their role in winter O3 formation in the Uinta Basin. The sensitivity of primarily emitted organic groups such as alkanes, alkenes, alkynes, alcohols, and aromatics to carbonyl formation and their overall impact on winter O3 production was examined using the F0AM box model coupled with Master Chemical Mechanism version 331 (MCMv331). The MCM is a near-explicit chemical mechanism that represents detailed gas-phase degradation of various NMOCs, leading to the formation of O3 and other secondary pollutants (Saunders et al., 2003). To establish a solid understanding of the chemical processes driving winter O3 formation, we compared the outputs of MCMv331 with lumped mechanisms, including the Regional Atmospheric Chemistry Mechanism version 2 (RACM2), Statewide Air Pollution Research Center Chemical Mechanism version 07 (SAPRC07), and Carbon Bond Chemical Mechanism version 6 revision 2 (CB6r2). Our goal in these comparisons was to identify a chemical mechanism that balances computational efficiency with chemical accuracy for future 3D photochemical modeling.
2.1 Site Description and Study Period
Measurement data were collected at the Horsepool atmospheric monitoring station in the central Uinta Basin, Utah (40.143° N, 109.469° W; 1569 m above sea level). This remote desert site has minimal influence from urban emissions and is primarily impacted by nearby oil and gas operations, making it an ideal location for investigating their effects on regional air quality and wintertime O3 formation (Lyman et al., 2015; Neemann et al., 2015; Mansfield et al., 2020).
The simulation period (24–27 February 2019) was notable for a strong thermal inversion and the buildup of winter O3. These inversion episodes were characterized by persistent snow cover from January through early March 2019, which contributed to multiday stagnation episodes and the accumulation of O3 near the surface. The inversion layer acted as a barrier, limiting vertical mixing and trapping O3 precursors close to the ground, thereby enhancing local photochemical O3 production (Lyman et al., 2022).
2.2 Instrumentation
Trace gases were measured at the Horsepool site by drawing ambient air through an unheated PTFE filter pack inlet into an indoor PFA manifold at a flow rate of 10 L min−1. O3, NOx, NOy, and CO were measured using Ecotech analyzer models 9810, 9841, 9843, and 9830, respectively; methane and total nonmethane hydrocarbons were measured using a Chromatotec Chroma THC Analyzer; and PM2.5 was measured using a Met One BAM 1020. Weekly calibrations were performed using an Ecotech GasCal system and a Thermo 701H zero air generator. Meteorological parameters, including snow depth (MaxBotix MB7092), total solar radiation (Kipp and Zonen CNR4), wind speed and direction (RM Young 05108-45L), temperature and humidity (Vaisala HMP155), and barometric pressure (Vaisala PTB101B) were recorded with a Campbell CR1000 datalogger, which was checked annually against NIST-traceable standards (Lyman et al., 2022).
Speciated nonmethane organic compounds were also measured, including C2–C10 hydrocarbons, C1–C3 alcohols, and 12 carbonyl compounds. Carbonyl measurements were not available for 2019; therefore, average values from inversion periods in other seasons were used (Lyman et al., 2022). Air samples were collected in Silonite-coated whole-air canisters for hydrocarbons and alcohols and on DNPH (2,4-dinitrophenylhydrazine) cartridges for carbonyls. One 3 h sample was collected daily, with start times alternating between midnight and noon to capture the diurnal extremes of mixing ratios, as midday typically reflects higher concentrations driven by emissions and photochemical activity, while midnight represents lower values when these processes are reduced. DNPH cartridge samples were analyzed by eluting the absorbed carbonyl compounds using a mixture of 75 % acetonitrile and 25 % dimethyl sulfoxide. The resulting extracts were then injected into a high-performance liquid chromatography (HPLC) system equipped with a UV detector to separate, identify, and quantify the carbonyl–DNPH derivatives based on retention times and peak areas. Additional methodological details are provided in Lyman et al. (2020). Whole-air canister samples were preconcentrated using an Entech 7200 with a cold-trap dehydration method and analyzed by gas chromatography with flame ionization detection for C1–C3 hydrocarbons and by gas chromatography–mass spectrometry for the remaining compounds (Lyman et al., 2022, 2020).
2.3 Box Model
The Framework for 0-D Atmospheric Modeling (F0AM) box model version 4.1 (Wolfe et al., 2016; Xiong et al., 2023) was used with an average diurnal cycle configuration to simulate winter O3 production, similar to Lyman et al. (2022). Average hourly meteorological data, CO, and total NOx from the 4 d modeling period were used as inputs for each modeled day, with NOx speciation determined internally by the model. Model inputs included study period average mixing ratios of all organic compounds, including methane, as well as individual hydrocarbons, alcohols, and carbonyls. An albedo of 0.7 was applied for winter conditions, consistent with observations during the study period, and an O3 column of 275 Dobson units was used based on data from the OMI satellite (OMDOAO3e v003) accessed through NASA's Giovanni application (NASA Giovanni, 2024). Variable boundary layer heights were prescribed following Edwards et al. (2014). The same variable dilution constant (kdil) as in Edwards et al. (2014) was initially applied and subsequently adjusted until modeled O3 concentrations were consistent with observed values, following Ninneman et al. (2023).
A subset of the MCMv331 was used, consisting of 3423 chemical species and 10 309 chemical reactions (Saunders et al., 2003; Bloss et al., 2005). This explicit mechanism represents detailed oxidation pathways of measured organic compounds, including stepwise degradation of NMOCs, formation of intermediate carbonyls, radical cycling involving OH, HO2, and RO2, and their interactions with NOx that drive winter O3 production. HONO was not prescribed as a model input, as its mixing ratio in the Uinta Basin is relatively low () during winter (Li, 2024; Edwards et al., 2014). Its contribution to HOx production is captured within the MCMv331 mechanism through endogenous gas-phase chemistry.
For a subset of model runs, we introduced heterogeneous chemistry to understand the impact on winter O3 formation due to OH and HO2 uptake onto aerosol surfaces, following the method of Ninneman et al. (2023). In this approach, the uptake of OH and HO2 was represented using a fixed uptake coefficient (γ) of 0.2. The heterogeneous loss rates were calculated as a function of aerosol surface area using observed PM2.5 concentrations and an assumed specific surface area, consistent with the parameterization described in Ninneman et al. (2023).
2.4 Comparison with Lumped Chemical Mechanisms
The output of MCMv331 was compared with several lumped mechanisms, including the RACM2, SAPRC07, and CB6, which consist of fewer species and reactions. Lumped mechanisms simplify atmospheric chemical modeling by aggregating similar species and reactions into fewer representative categories, which reduces computational complexity and enhances efficiency, making them ideal for large-scale air-quality models. Lumped mechanisms allow for faster computation while still capturing essential chemical processes, which is very important for the computational efficiency of large 3-D photochemical models (Zaveri and Peters, 1999).
SAPRC07 and RACM2 use a molecule-based lumping approach. In these mechanisms, organic compounds with similar molecular structure, functional groups, and gas-phase reactivity are grouped into a single surrogate species. The reaction rate constants of each surrogate are typically calculated as weighted averages of the individual compounds included in the lump, based on their chemical reactivity and atmospheric importance. As a result, each surrogate species represents the overall chemical behavior of a group of similar compounds rather than any individual molecule. SAPRC07 consists of 134 surrogate species and 698 chemical reactions, while RACM2 includes 124 surrogate species and 363 chemical reactions. In contrast, the CB6 mechanism follows a structure-based lumping approach. Instead of representing whole molecules, CB6 conserves carbon–carbon bond types and functional carbon groups. Organic compounds are decomposed into carbon bond fragments such as alkyl groups, double bonds, and aromatic rings, which are then assigned to surrogate species based on bond type. Chemical reactions track the transformation of these carbon bonds during oxidation processes, allowing CB6 to represent organic carbon chemistry with fewer species while maintaining carbon conservation. The CB6 mechanism includes 77 surrogate species and 216 chemical reactions. All three of these lumped mechanisms retain some explicit organic species, including formaldehyde. SAPRC07 and RACM2 retain more explicit species than CB6. The version of CB6 used in this study was CB6r2 (Cao et al., 2021). In CB6r2, HO2NO2 (denoted PNA) is represented explicitly, forming from HO2 and NO2 and removed by thermal decomposition and photolysis, in the same way as in the other mechanisms. HO2NO2 decomposition is the largest single contributor to HOx production in CB6 (see Sect. 3.1), consistent with its role in MCMv331, SAPRC07, and RACM2.
To compare these mechanisms with MCMv331, species mapping was performed to aggregate and convert measured organic chemical species into the corresponding species in the lumped mechanisms. Species properties from the United States Environmental Protection Agency (EPA) SPECIATE database version 5.2 were used, along with a species conversion database provided by Ramboll (EPA, 2024). The species conversion database is provided as Data File S1 in the Supplement. When more than one MCM species corresponded to a single lumped mechanism species, their mixing ratios were summed to obtain the lumped species concentration.
2.5 Emission Flux
Hydrocarbons in the Uinta Basin are primarily emitted from oil and gas activities (Lyman et al., 2015; Mansfield et al., 2020; Warneke et al., 2014). Because the hydrocarbon dataset was temporally limited, their mixing ratios were held constant throughout the simulation period. On the other hand, carbonyl compounds can be emitted directly or formed secondarily through photochemical reactions of hydrocarbons. To accurately represent atmospheric conditions and allow for realistic secondary carbonyl production, optimized emission fluxes (EFs) were developed for carbonyl compounds. Initial mixing ratios were set to measured values, while subsequent modeled mixing ratios were allowed to vary over time. Emission flux values were iteratively adjusted to achieve minimal increasing or decreasing trends in mixing ratios across the four modeled days. If the Day 4 mixing ratio of a given carbonyl compound was lower than the Day 1 value, the initial EF was considered too low and was incrementally increased until the trends aligned as closely as possible. Conversely, if mixing ratios increased throughout the simulation, the EF was considered too high and was reduced, in some cases to zero. An EF of zero implied no local emissions and that all carbonyls, except those initially present, were formed from atmospheric photochemical reactions (Maasakkers et al., 2019). Through systematic adjustment of EF values, the modeled carbonyl mixing ratios were constrained to reflect observed atmospheric behavior, thereby improving the reliability of the simulation results.
2.6 Determination of the Influence of Selected Carbonyls on O3 Production
To investigate the influence of individual carbonyl compounds on winter O3 production, the F0AM box model was initially run without any modifications to establish baseline O3 production. The initial mixing ratio of a selected carbonyl compound was then set to zero and constrained to remain at zero in a subsequent model run. The average O3 production rate (ppb h−1) between 09:00 and 16:00 local time, MST on the fourth day of the simulation was compared between the two scenarios. This time window was selected to capture periods of consistent photochemical activity, during which carbonyl compounds contribute to radical production and daytime O3 formation (Pang and Mu, 2006). Differences in O3 production rates resulting from forcing the mixing ratio of a given carbonyl compound to zero were used to quantify its influence. This procedure was systematically repeated for all measured carbonyl compounds, and the resulting outputs were compared to determine compound-specific contributions to O3 production.
2.7 Determination of the Influence of Primarily Emitted Organics on Carbonyl and O3 Production
A sensitivity analysis was conducted to assess the impacts of primarily emitted organic groups (alkanes, alkenes, alkynes, alcohols, and aromatics) on carbonyl production. The analysis focused on selected carbonyl compounds, including formaldehyde, acetaldehyde, methacrolein, benzaldehyde, and methyl ethyl ketone, which were chosen based on their significant influence on winter O3 formation. Initial mixing ratios of the primary organic groups were varied by ±50 %, while maintaining constant speciation within each group, and the corresponding percentage changes in average mixing ratios of carbonyls were evaluated between 13:00 and 17:00 local time, MST on the fourth day of the simulation. This time window was selected to avoid rapid morning changes in boundary layer height that could introduce variability in pollutant mixing ratios (Lapworth, 2006; Mahrt, 1981). During the afternoon period, the atmosphere is more homogeneous, allowing for an even distribution of precursors and reaction products. It also represents a steady-state condition for radical species (⋅OH, HO2⋅, and RO2⋅), ensuring a balanced production and loss cycle (Lew et al., 2020; Heard et al., 2004). This approach allowed us to evaluate the sensitivity of carbonyl formation to fluctuations in levels of primary organic groups.
A similar sensitivity analysis was performed to determine the influence of primarily emitted organic groups on the O3 production rate, which allowed us to identify the individual impact of each organic compound group on winter O3 production.
3.1 Winter O3 Pollution in the Uinta Basin
The study period (24–27 February 2019) was characterized by a persistent thermal inversion, continuous snow cover, and the progressive accumulation of O3 near the surface, as shown in Fig. S1 in the Supplement. On the fourth day, the daily maximum 8 h average O3 mixing ratio reached 94 ppb and the maximum hourly value reached 102 ppb, both exceeding the U.S. Environmental Protection Agency standard of 70 ppb. These conditions are representative of severe wintertime O3 episodes in the Uinta Basin, where high NMOC emissions from oil and gas operations are trapped by stagnant boundary layers and limited sunlight. The negative relationship between O3 and relative humidity is shown in Fig. S2. In comparison, the F0AM Box model with the explicit chemical mechanism MCMv331 estimated a maximum O3 mixing ratio of 107 ppb on the fourth day of the simulation (Fig. 1). After incorporating heterogeneous chemistry based on MCMv331, the O3 level decreased by 1 ppb. The SAPRC07 lumped mechanism estimated the O3 level at 111 ppb, while RACM2 predicted slightly lower than the measured value at 100 ppb, and CB6 provided the highest estimation of 122 ppb. Liu et al. (2023) conducted a Box model study with commonly used chemical mechanisms during summertime in multiple cities of China and identified that RACM2 showed the best agreement with observation during the polluted period, followed by MCMv331 and SAPRC07. These findings aligned with our studies. On the other hand, Shareef et al. (2022) evaluated different lumped chemical mechanisms with CMAQ (3D chemical transport model) on winter O3 prediction in Alberta, Canada, and found no significant differences in SAPRC07, RACM2, and CB6 output.
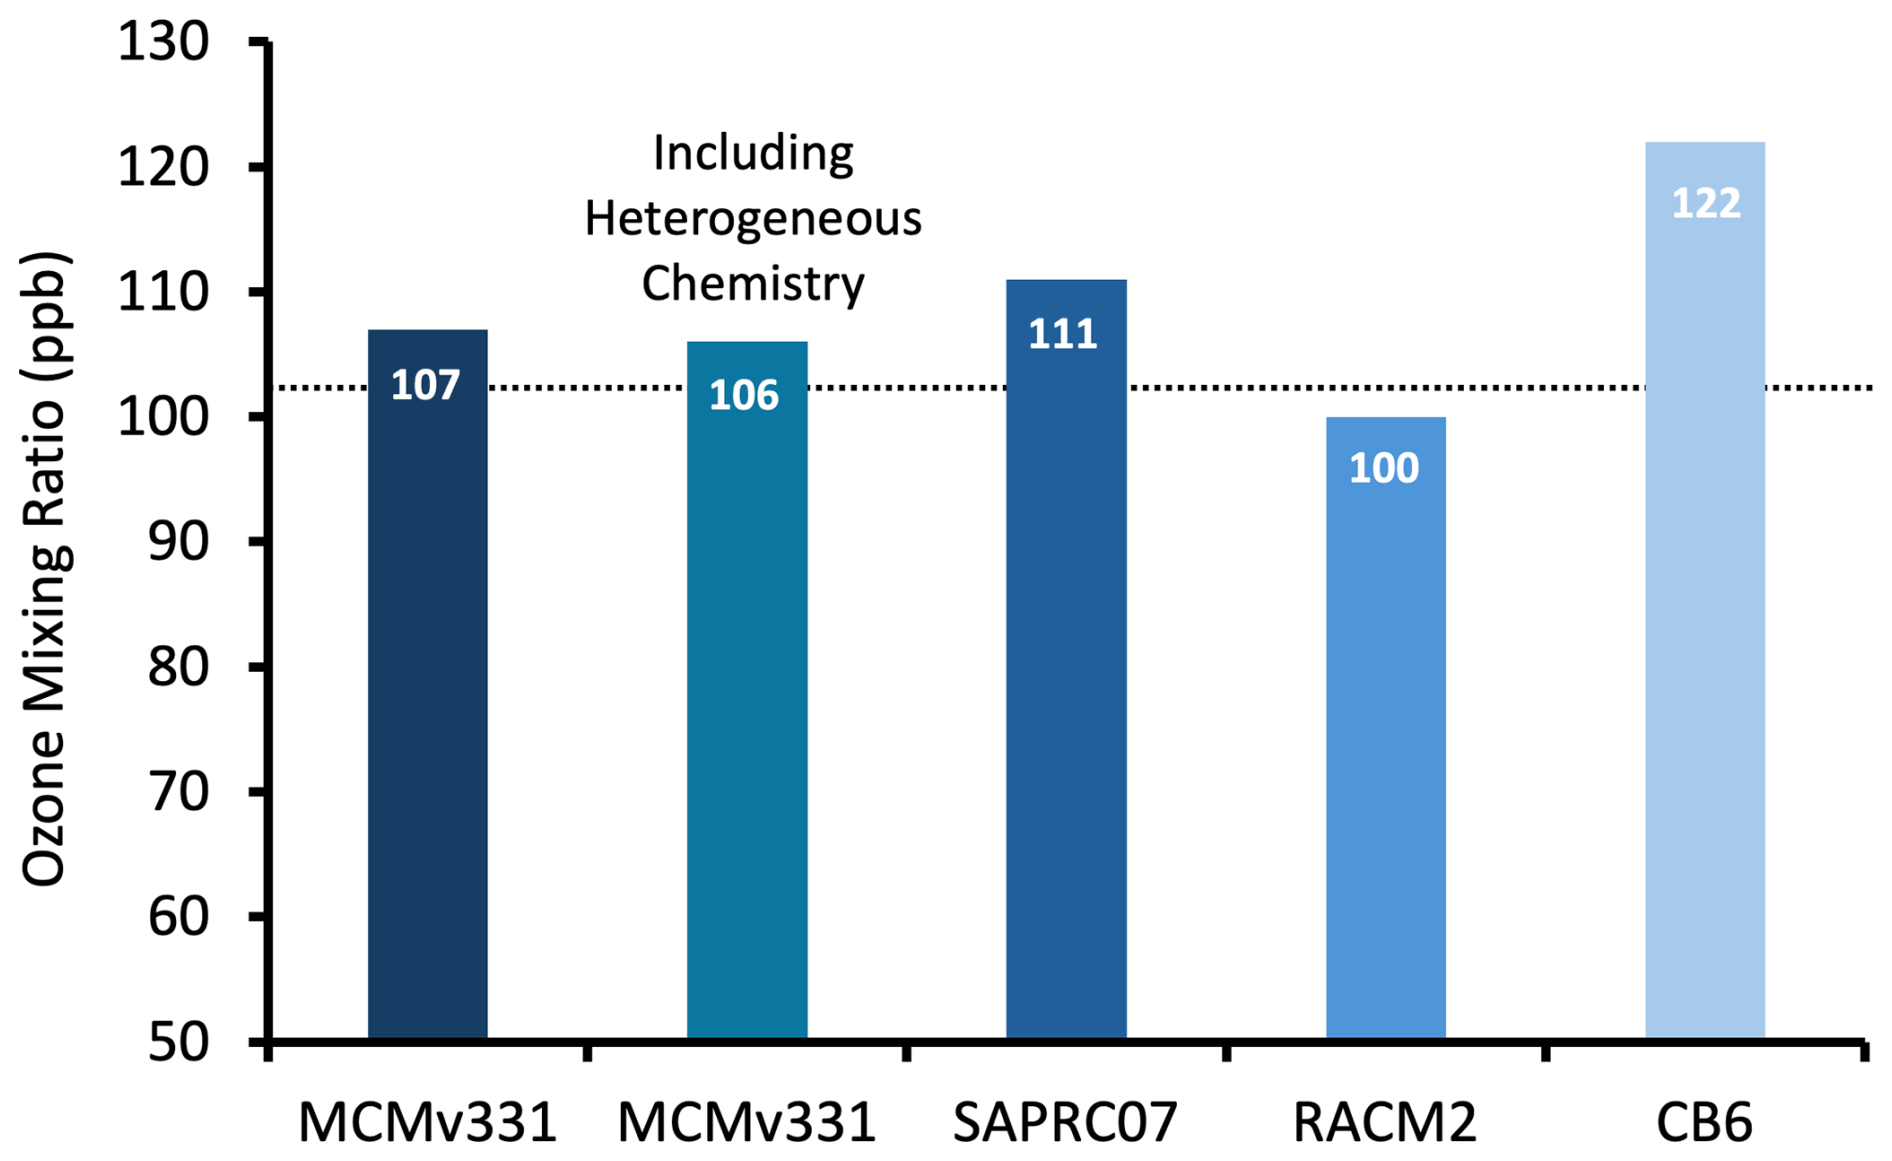
Figure 1Comparative analysis of maximum hourly O3 mixing ratio using different chemical mechanisms. The dotted line represents the observed maximum hourly O3 level (102 ppb).
The O3 budget on Day 4 shows a consistent pattern across all four mechanisms (Tables S8.1–S8.4 in the Supplement). O3 production is controlled almost entirely by the reaction between ground-state oxygen atoms and molecular oxygen, contributing 99 %–100 % of total formation, while reactions involving organic peroxy radicals and HO2 contribute less than 0.01 %. O3 loss is driven mainly by photolysis, which accounts for 75 %–78 % of total removal, followed by the reaction of NO with O3, which contributes 18 %–21 %. This budget structure reflects the mechanistic representation of O3 formation in F0AM, in which is the final step common to all pathways. A more process-oriented view frames O3 production in terms of the HO2+NO and RO2+NO reactions that convert NO to NO2, since each such conversion yields an O3 molecule upon subsequent NO2 photolysis. The integrated rates of these radical-driven conversions (Table S8.5) track the simulated O3 levels across mechanisms, being lowest in RACM2 (26.6 ) and highest in CB6 (36.7 ). HO2+NO contributes 43 %–51 % and RO2+NO 49 %–57 % of this radical-driven conversion across the four mechanisms. This conversion is sustained by radical production, whose total rate differs substantially across mechanisms (Fig. 3 and Tables S9.1–S9.4). CB6's HOx production (38.7 ) is roughly 1.6–1.8 times that of MCMv331, SAPRC07, and RACM2 (21.2, 23.7, and 22.1 ), driving faster NO to NO2 cycling and ultimately higher simulated O3.
3.2 Contribution of Carbonyls to Winter O3 Formation
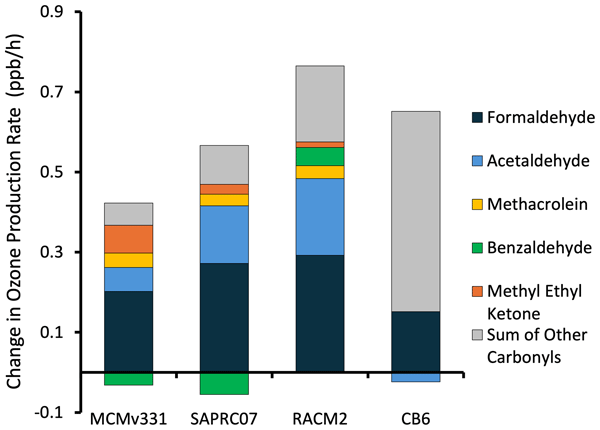
Carbonyl compounds are examined here as intermediaries in O3 production, as their photolysis and oxidation reactions generate HO2 and RO2 radicals that drive NO to NO2 conversion and ultimately O3 formation. Figure 2 shows that O3 was more sensitive to changes in carbonyl mixing ratios in the lumped mechanisms compared to MCMv331. Master Chemical Mechanism (MCM) employs an explicit representation of reactions, wherein carbonyl compounds degrade through multi-generational, branched pathways that distribute radical formation across several intermediate species and slower reaction steps (Saunders et al., 2003). On the other hand, with simplified chemical mechanisms, carbonyl chemistry is formulated to produce O3, forming radicals like HO2 rapidly and directly, often in a single reaction step. This fundamental difference in mechanism structure may explain the higher O3 sensitivity to carbonyls observed with the lumped mechanisms compared to MCMv331 (Goliff et al., 2013; Yarwood et al., 2010).
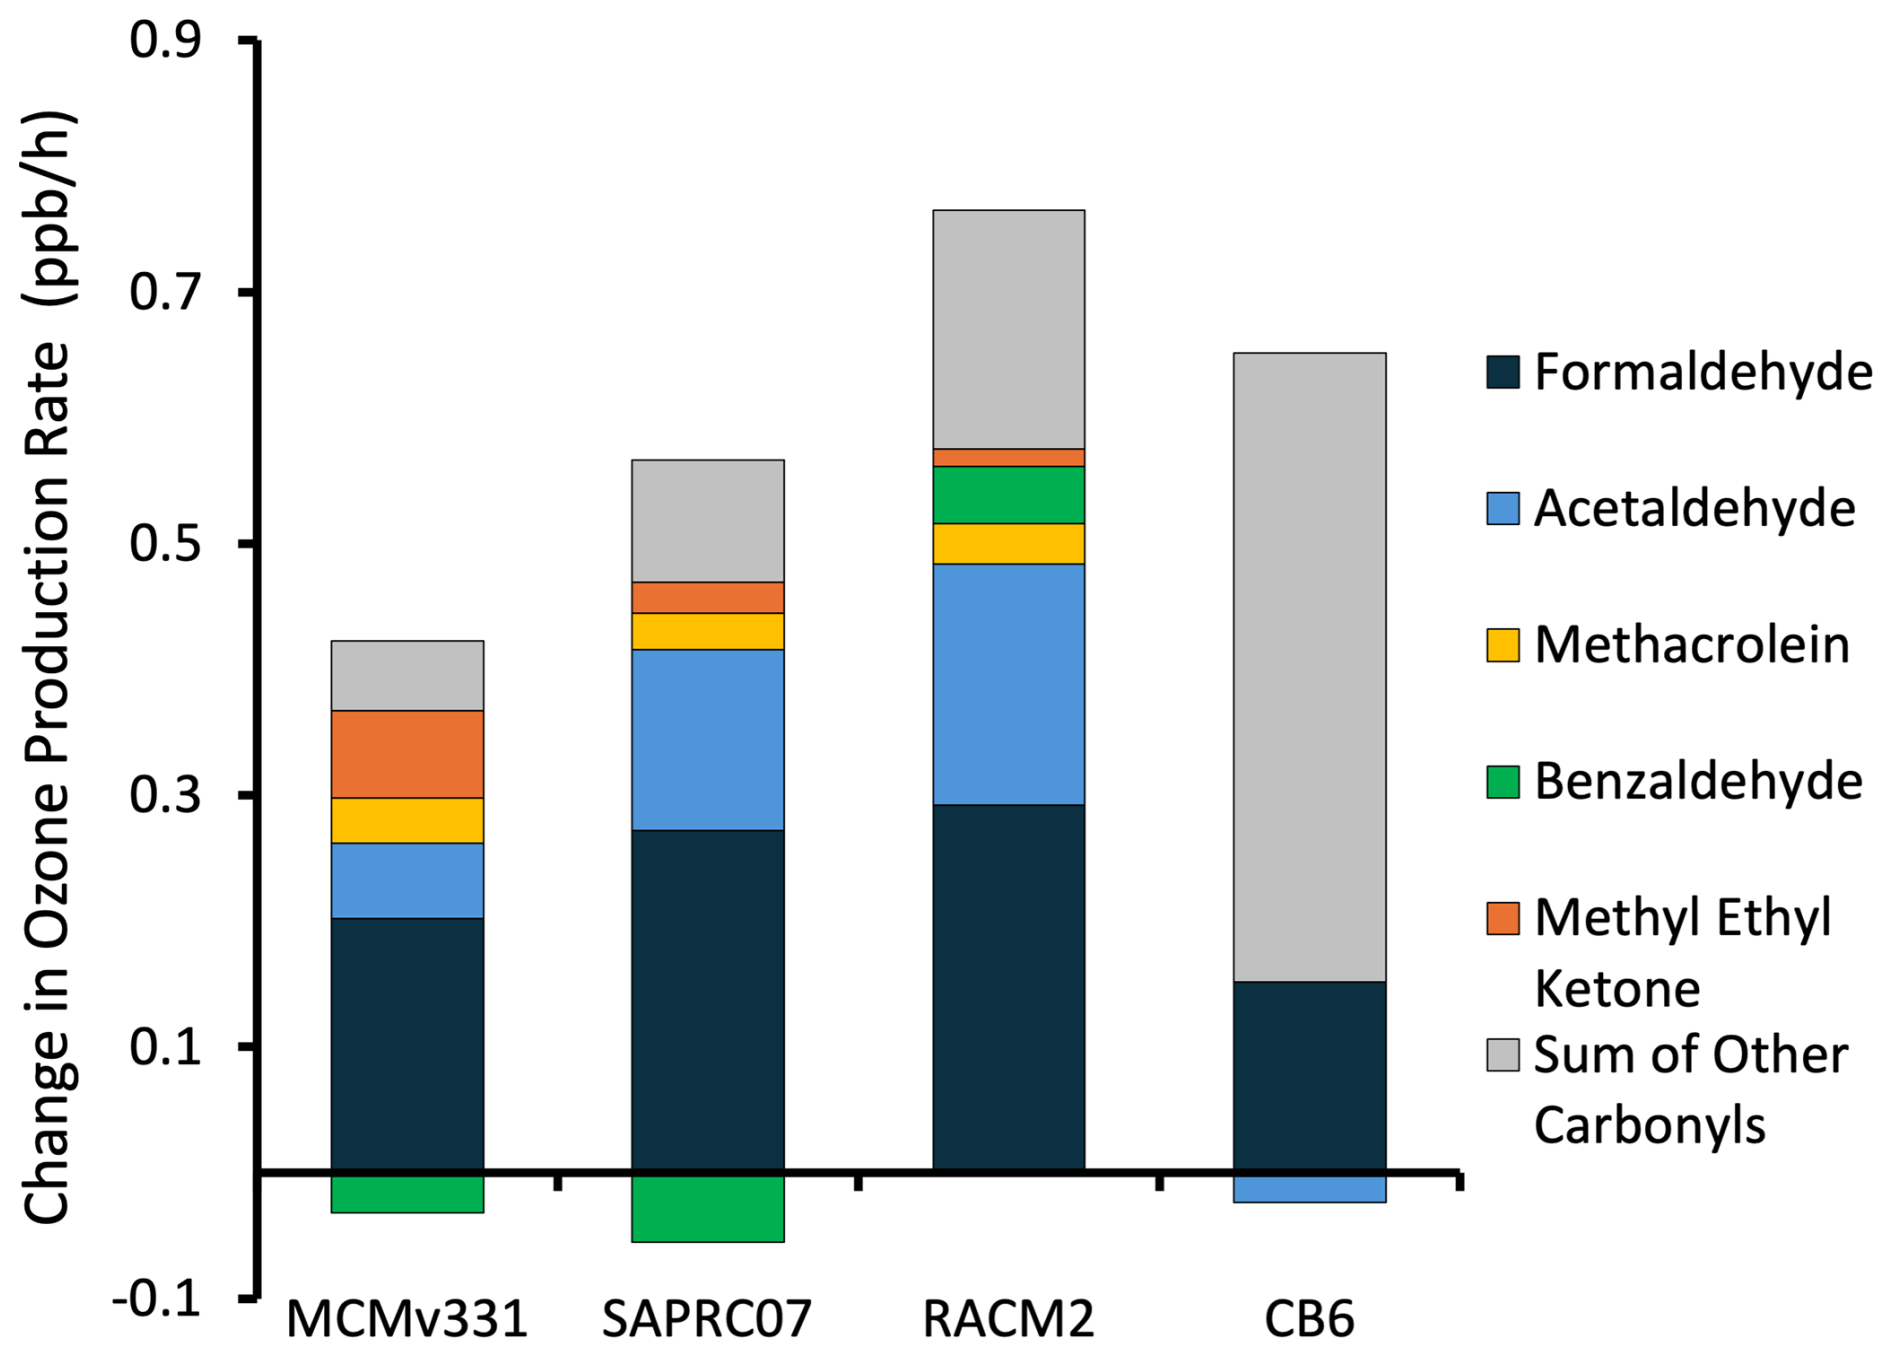
Figure 2Change in O3 production rate on Day 4 of the modeled period in response to a 50 % increase in the mixing ratio of the indicated carbonyls. Each bar represents the overall change in O3 production rate for a specific chemical mechanism. The sections within each bar illustrate the contributions of individual carbonyl compounds.
To understand the mechanistic basis for the differences in carbonyl-driven O3 sensitivity observed across mechanisms in Fig. 2, the modeled day 4 HOx production and loss budgets across the four chemical mechanisms are illustrated in Fig. 3, expressed as percentages of each mechanism's total (Table S9 provides more information). Across all mechanisms, thermal decomposition of peroxynitric acid (HO2NO2) is the single largest HOx production pathway, accounting for 23 %–38 % of total production, with CB6 at the upper end of this range (37.8 %). The dominance of HO2NO2 thermal decomposition is physically consistent with the cold wintertime conditions of the Uinta Basin, where low temperatures (∼0 °C) allow HO2NO2 to accumulate overnight as a radical reservoir that is released during daylight hours, consistent with findings by Edwards et al. (2014) at the same site. Organoperoxy radical (RO2)+NO reactions were far more important for the lumped mechanisms compared to MCMv331, but this is likely an artifact of collapsing multi-step reaction sequences in lumped mechanisms, leading to higher budget percentages from fewer reaction pathways. In the HOx loss budget, HO2+NO2 termination dominates in all mechanisms (25 %–40 %), and OH reactions with alkanes represent the second-largest sink (9 %–33 %), consistent with the dominance of alkane emissions in the Uinta Basin. OH-alkane reactions appear less important for MCMv331 in the figure because it catalogs reactions with specific alkanes, so most OH-alkane reactions were not among the top five most important reactions and were instead included as Other. Notably, the OH + benzaldehyde loss term appears in the MCMv331 top-5 reactions (approximately 3 % of total HOx loss) but is absent from the RACM2 and CB6 budgets, providing a direct mechanistic basis for the negative O3 sensitivity to benzaldehyde observed in MCMv331 and SAPRC07 but not in the lumped mechanisms (Fig. 2 and Table 3).
Notwithstanding these caveats, all four mechanisms have fairly similar HOx production budgets. Total HOx production rates were similar for MCMv331, SAPRC07, RACM2 (21.2, 23.7, and 22.1 , respectively), while CB6 radical production was notably higher, at 38.7 . Higher radical production in CB6 may explain the higher ozone mixing ratios modeled by CB6, as shown in Fig. 1.
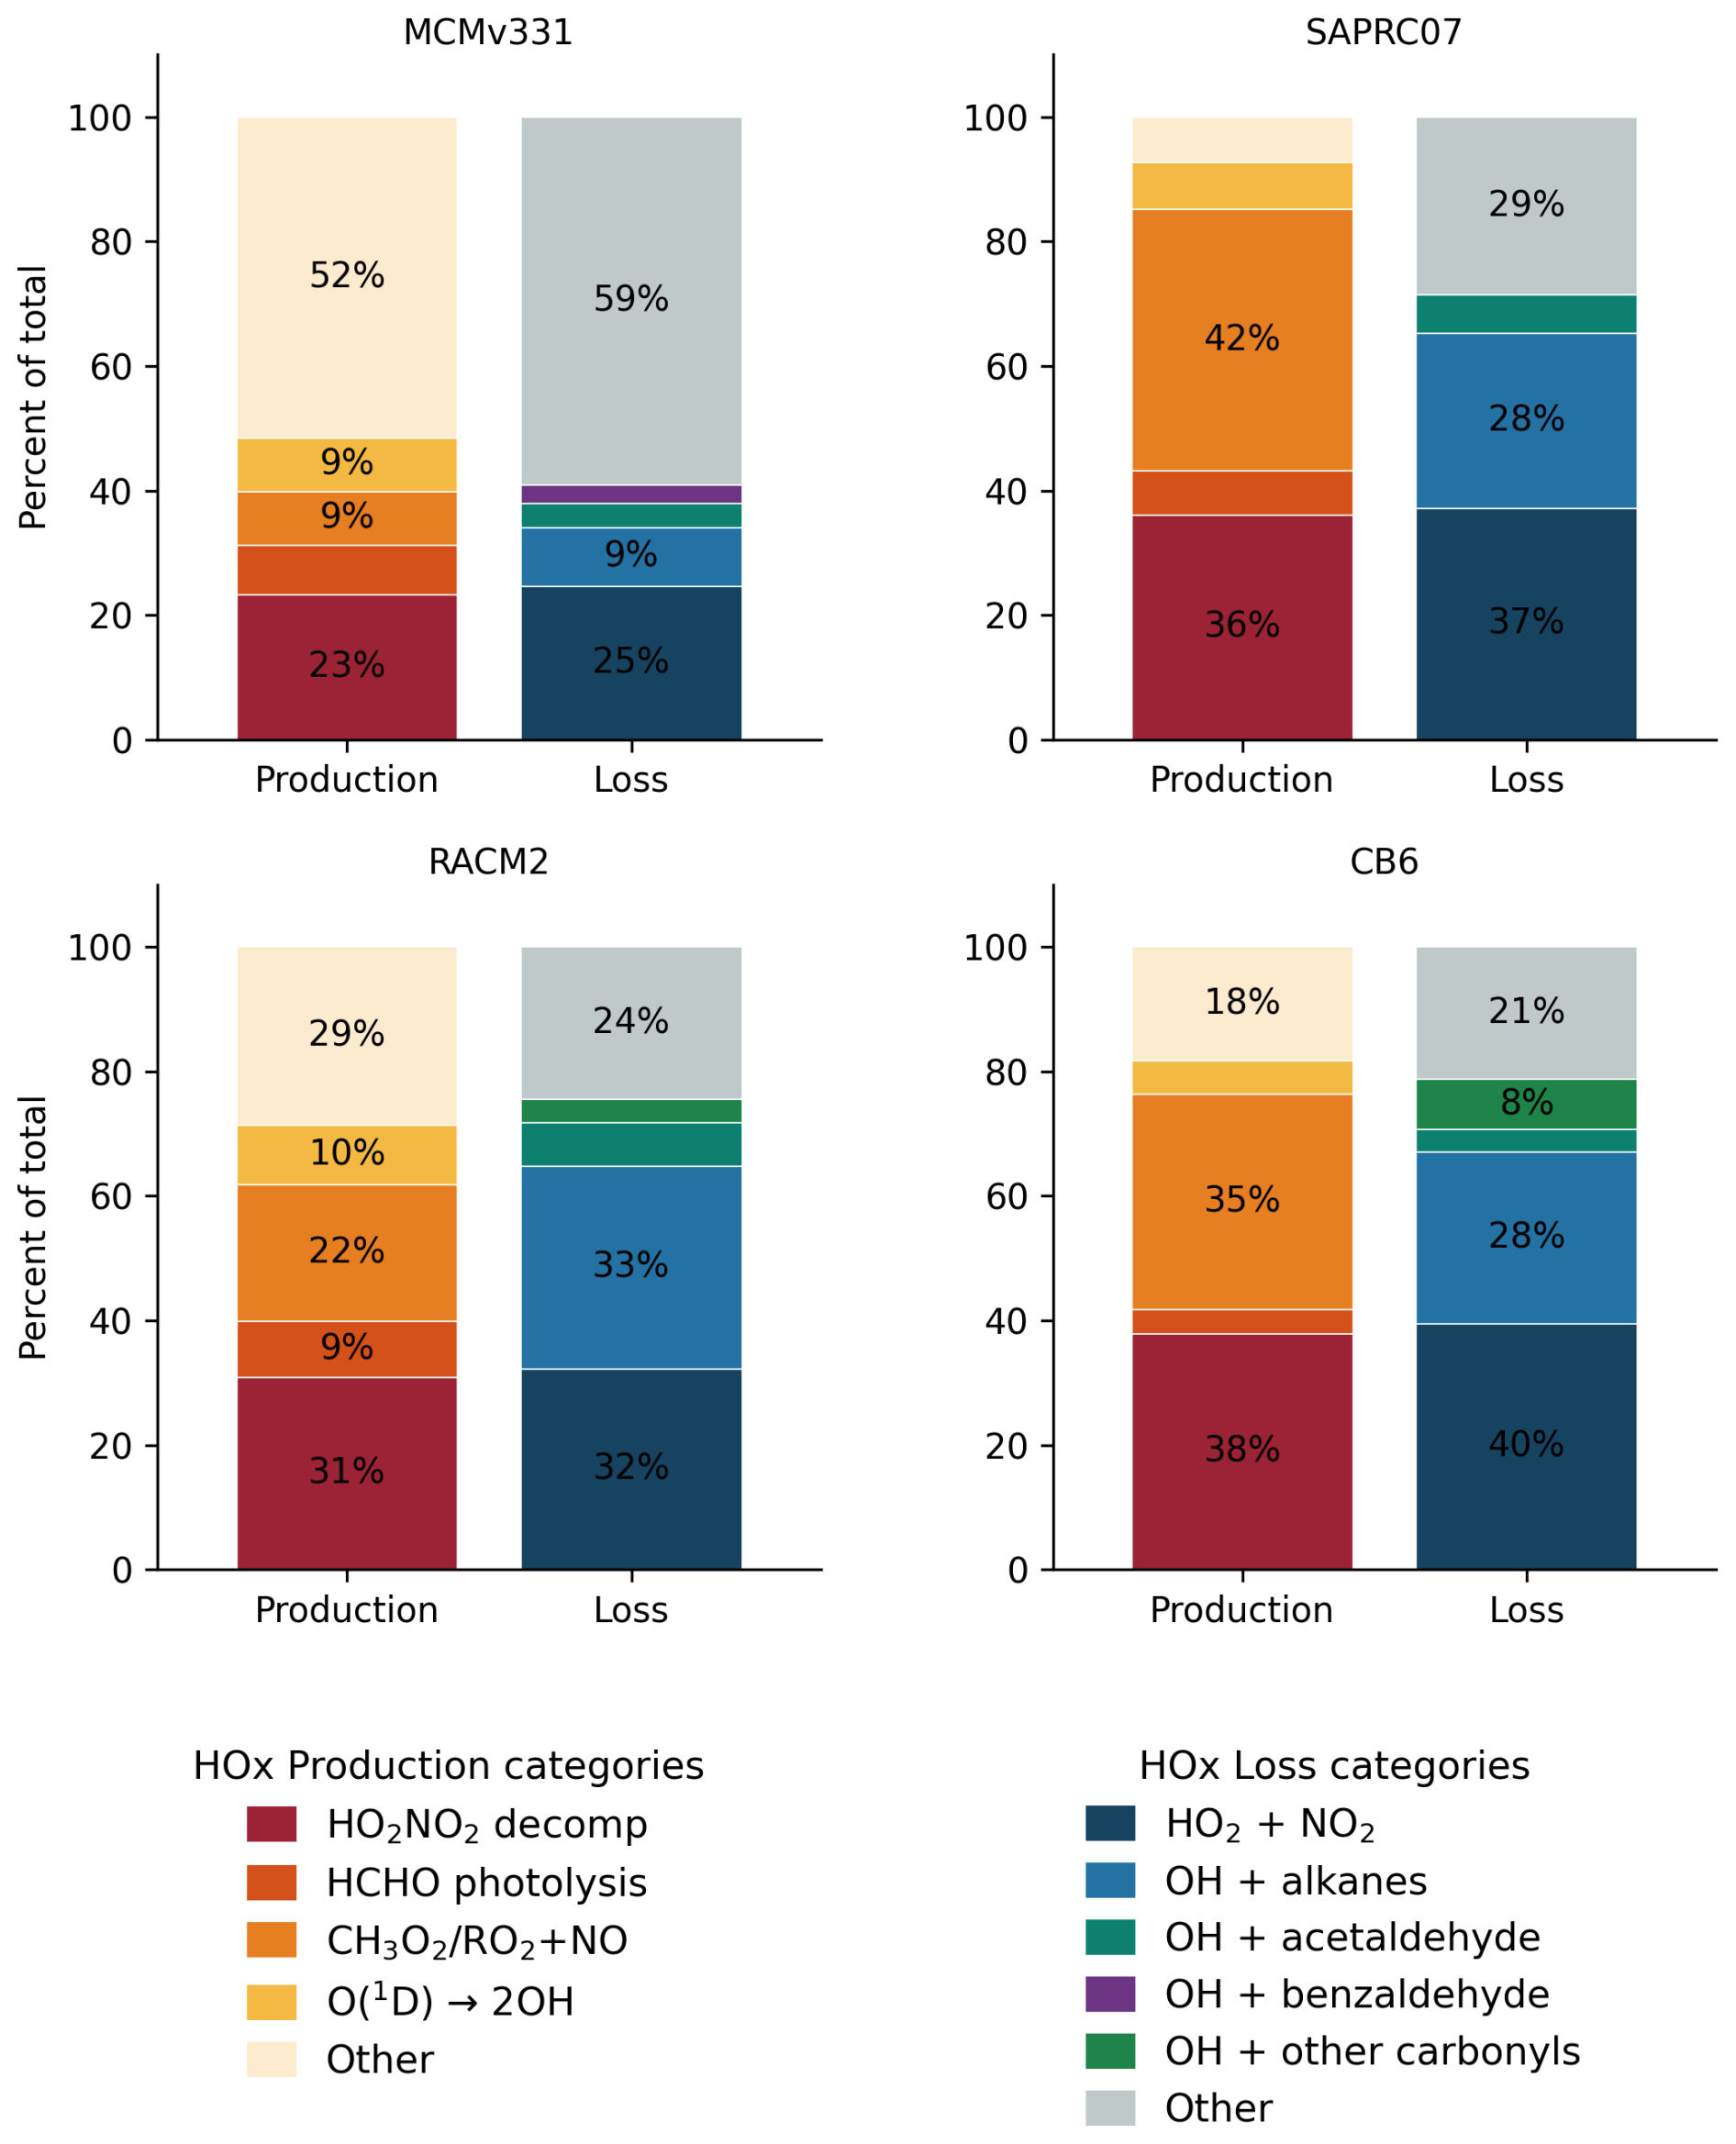
Figure 3Modeled day 4 HOx production and loss budgets for each of the four chemical mechanisms evaluated in this study. For each mechanism, the left bar shows the percentage contribution of each reaction pathway to total HOx production, and the right bar shows the percentage contribution to total HOx loss. Reaction pathways are grouped into chemical categories, and pathways outside the named categories are pooled as “Other.” See Tables S8 through S10 for detailed reaction-level budget information for O3, HOx, and individual carbonyls.
The F0AM box model with MCMv331 identified formaldehyde as the dominant contributor to the O3 production rate, accounting for a change of 0.20 ppb h−1, or approximately 50 % of the total contribution from carbonyl compounds. This finding aligns with Edwards et al. (2014), who reported formaldehyde as the primary daytime radical source in the Uinta Basin, contributing 30 % of radical formation from carbonyls, with the remainder attributed to larger carbonyl species. Across all chemical mechanisms examined, both the production and loss of formaldehyde lead to substantial HO2 radical formation through Reactions (R6) and (R7), which play a critical role in O3 production. The combined HO2 production from formaldehyde accounts for approximately 8 %–20 % of total hydrogen oxide radicals (HOx) production across the mechanisms considered (Table 1). In MCMv331, acetaldehyde was found to be the second-highest contributor in our study, causing a change of 0.06 ppb h−1 in the O3 production rate, with SAPRC07 and RACM2 following a similar trend. Overall, acetaldehyde contributes roughly half of the HO2 produced by formaldehyde (Tables 1 and 2). In addition, reactions with acetaldehyde lead to a substantially greater loss of OH, an important radical in O3 production, compared to formaldehyde. Oxidation of acetaldehyde by OH forms the acetyl peroxy radical, which can be sequestered as peroxyacetyl nitrate under cold conditions. This compound is thermally stable at low temperatures and can transport NOx and radicals over long distances, thereby reducing their availability for local O3 production (Fischer et al., 2014).
In CB6, most medium and high molecular weight carbonyls are lumped into the single “KET” species (Yarwood et al., 2010), so KET represents a much larger carbon pool than any individual carbonyl. As shown in Table S10.4, almost all KET is formed through the alkoxy-radical pathway (ROR → KET, ∼99 %), which strongly promotes radical propagation. At the same time, formaldehyde in CB6 undergoes a substantial HO2 removal reaction (FORM + HO2, ∼31 % of its loss; Table S10.4), limiting its radical yield. As a result, KET has a much stronger effect on O3 production than formaldehyde in CB6.
The relative contributions of each carbonyl compound remained largely unchanged after introducing heterogeneous chemistry into the model (Fig. S4). This is likely due to low specific humidity during the simulation period, which limits the uptake of HOx radicals by aerosols. As a result, the radical budget and hence O3 production potential were not significantly altered (Fig. 1), preserving the dominance of formaldehyde and acetaldehyde among carbonyl precursors.
Table 1Contribution of formaldehyde to HO2 production by process across chemical mechanisms.
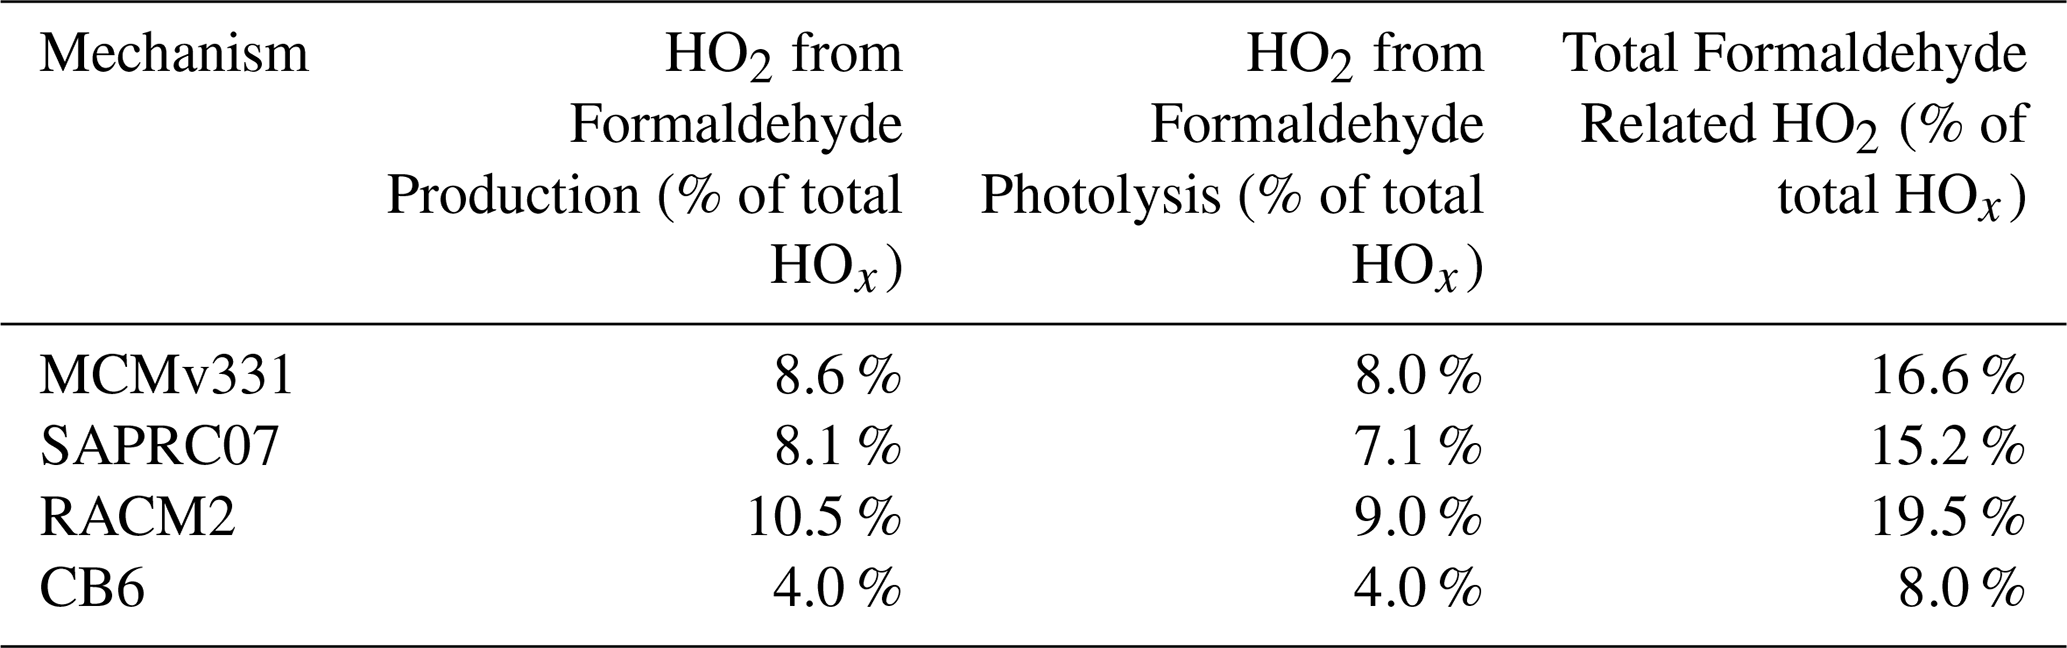
Table 2Contribution of acetaldehyde to HO2 production by process across chemical mechanisms.
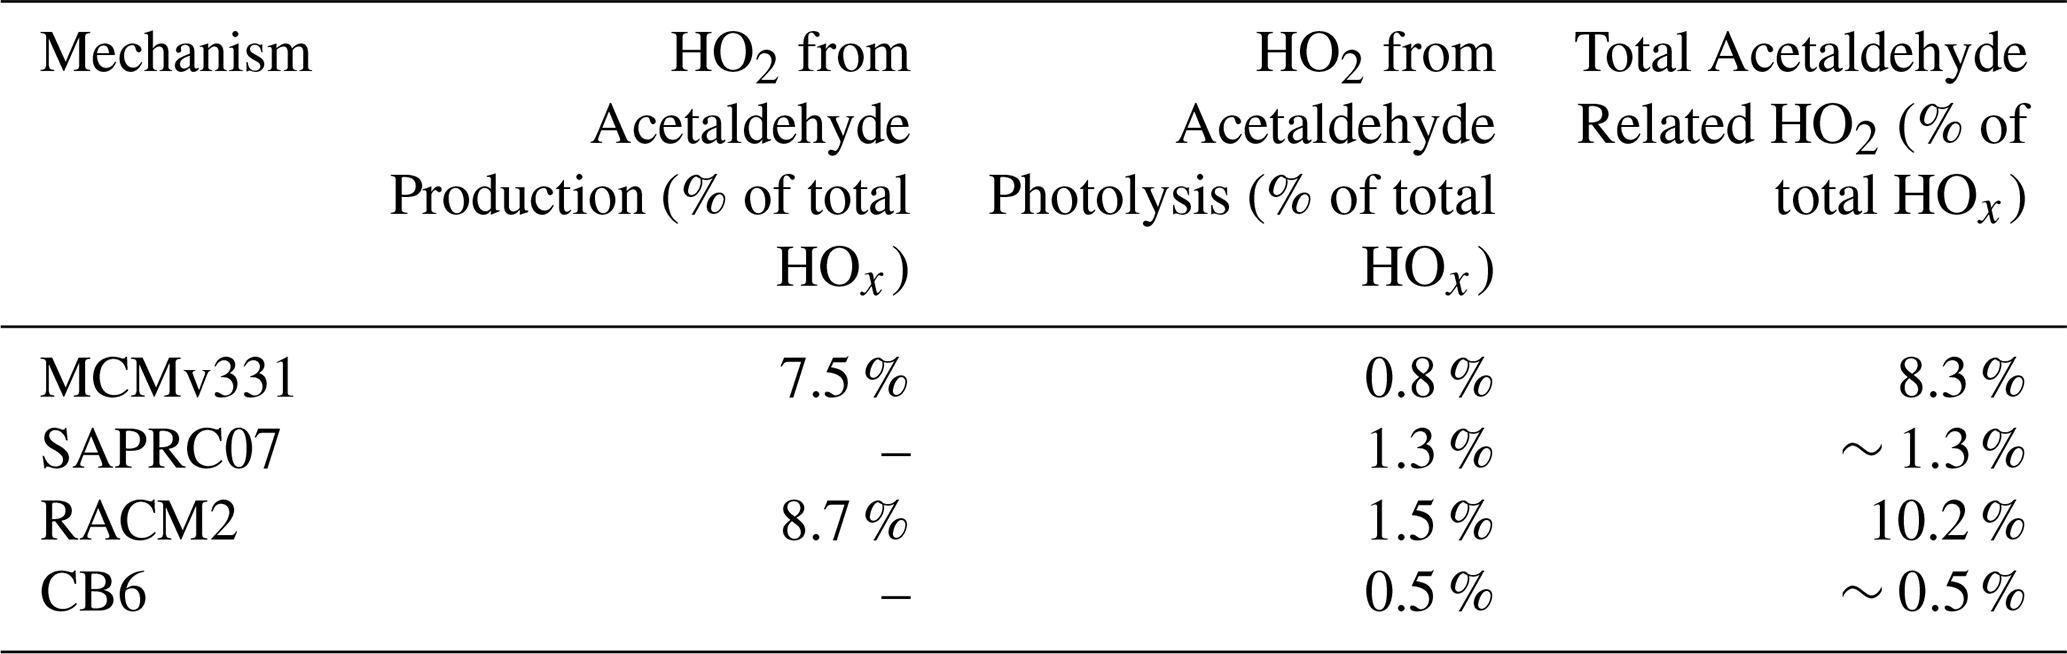
Table 3Contribution of benzaldehyde to the HOx budget across chemical mechanisms.
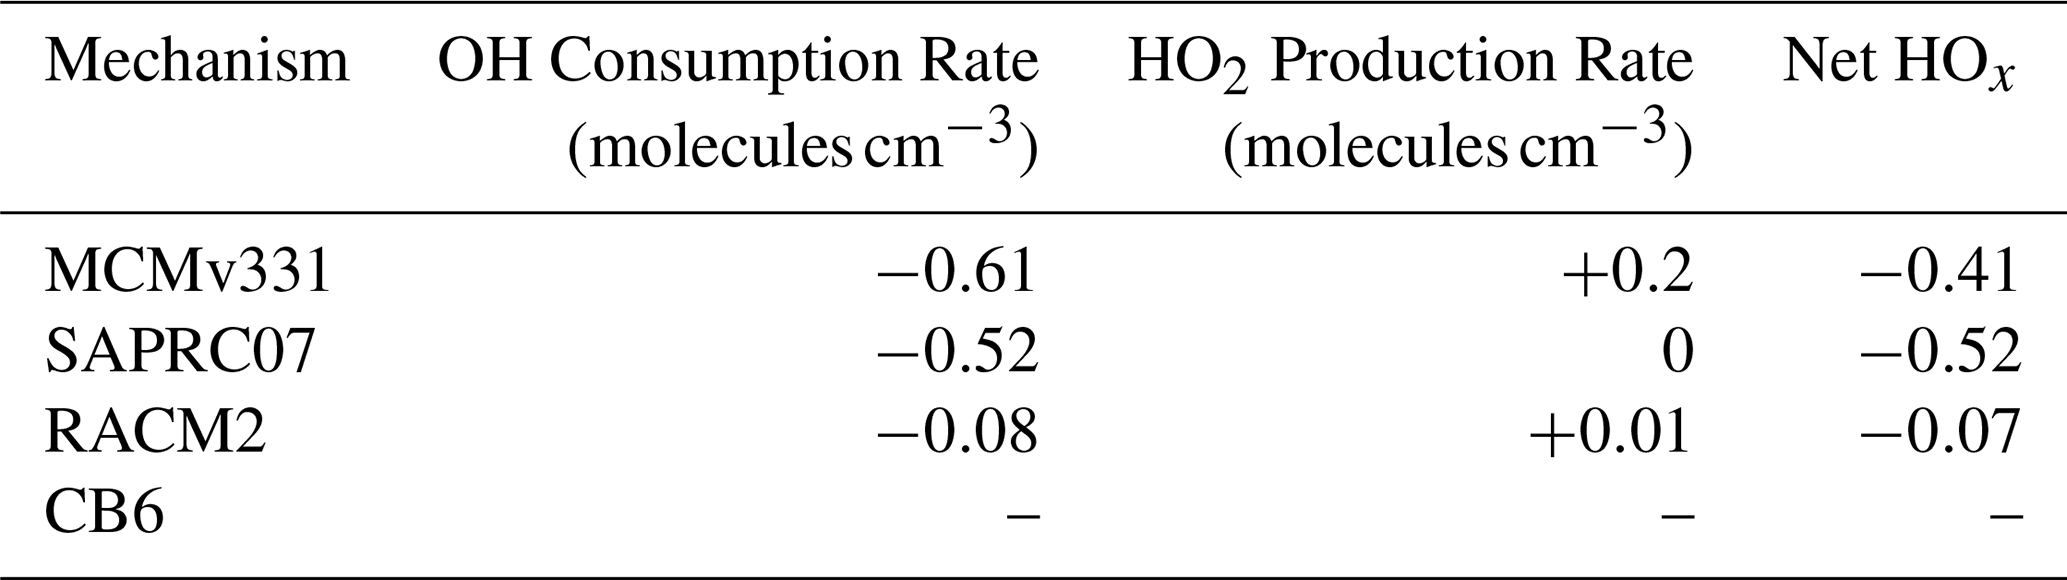
The impact of benzaldehyde on O3 production differs across chemical mechanisms. In MCMv331, benzaldehyde shows a negative contribution of , indicating that increasing benzaldehyde reduces the O3 production rate, with a similar negative response observed in SAPRC07. In both MCMv331 and SAPRC07, benzaldehyde undergoes detailed aromatic degradation that consumes radicals or forms less reactive products. As a result, benzaldehyde competes for OH and acts as a radical sink, leading to increased HOx loss (Table 3). In MCMv331, phenoxy radicals formed from benzaldehyde directly consume O3, further contributing to the negative impact on O3 production. In contrast, in RACM2, the OH + benzaldehyde reaction is much less important relative to the total HOx budget, so increasing benzaldehyde does not significantly increase HOx loss. Instead, oxidation of benzaldehyde in RACM2 forms peroxybenzoyl radicals that enhance NO to NO2 cycling, resulting in net positive O3 production.
Edwards et al. (2014) attributed 85 % of radical production to the photolysis of carbonyl compounds during a 2013 winter O3 episode at the same Uinta Basin location. However, studies have shown that the emissions in the Uinta Basin have declined since the Edwards et al. study (Mansfield et al., 2020; Lin et al., 2021), and during our study, we found that the initial mixing ratios of several carbonyls were lower compared to those of Edwards et al. on the fourth day of the simulation period (Table S1). Furthermore, the emission flux required to simulate representative carbonyl mixing ratios was minimal or zero. The addition of carbonyl emissions in the box model led to an overestimation of their mixing ratios, indicating that carbonyls were mostly secondary pollutants, created in the atmosphere from photochemistry, rather than emitted directly from sources. Stockwell et al. (2011) and Nogueira et al. (2017) also identified carbonyl compounds mainly as secondary pollutants generated through the oxidation of hydrocarbons from anthropogenic or biogenic emissions.
3.3 Contribution of Hydrocarbons to Carbonyl Compound Formation
Since carbonyls were found to be largely secondary pollutants, their formation is traced here to primarily emitted hydrocarbon groups. Understanding which hydrocarbon groups drive carbonyl production is essential for identifying the key precursors of wintertime O3. Figure 4 shows the production pathways for formaldehyde and acetaldehyde, the two dominant carbonyl O3 precursors, across the four mechanisms (additional carbonyl production and loss budgets are available in Table S10). For formaldehyde, the methyl peroxy radical + NO reaction () accounts for 55 %–60 % of production in MCMv331, SAPRC07, and RACM2. CB6 shows a notably different pattern, with the CH3O2+NO contribution falling to 36 % while alkene oxidation rises to nearly 20 %. For acetaldehyde, all four mechanisms show strong dominance of alkyl peroxy, and alkoxy radical pathways derived from alkane oxidation, with ethoxy radical decomposition () accounting for approximately 75 % of production in MCMv331 and similar lumped pathways dominating in SAPRC07 and RACM2. CB6 is again distinctive, with a significant contribution from its lumped ketone species (KET → ALD2, approximately 17 %; denoted as aldehyde photolysis in the figure), reflecting the broader lumping of C3+ alkane oxidation intermediates into a single ketone pool in that mechanism. Also, Fig. 4 shows 99 % of acetaldehyde production in the SAPRC07 mechanism comes from ethoxy radical decomposition, while the other mechanisms show a significant contribution from larger organic oxy or peroxy radical species. SAPRC07 actually uses a system of “yield tokens” as outcomes of upstream reactions, obscuring the radical species that generated acetaldehyde. In the absence of information about radical species, we assigned all to ethoxy radical decomposition in the figure. Total formaldehyde production rates were 3.31, 3.25, 3.88, and 4.28 for MCMv331, SAPRC07, RACM2, and CB6, respectively; total acetaldehyde production rates were 2.12, 3.77, 4.02, and 2.86 for the same mechanisms.
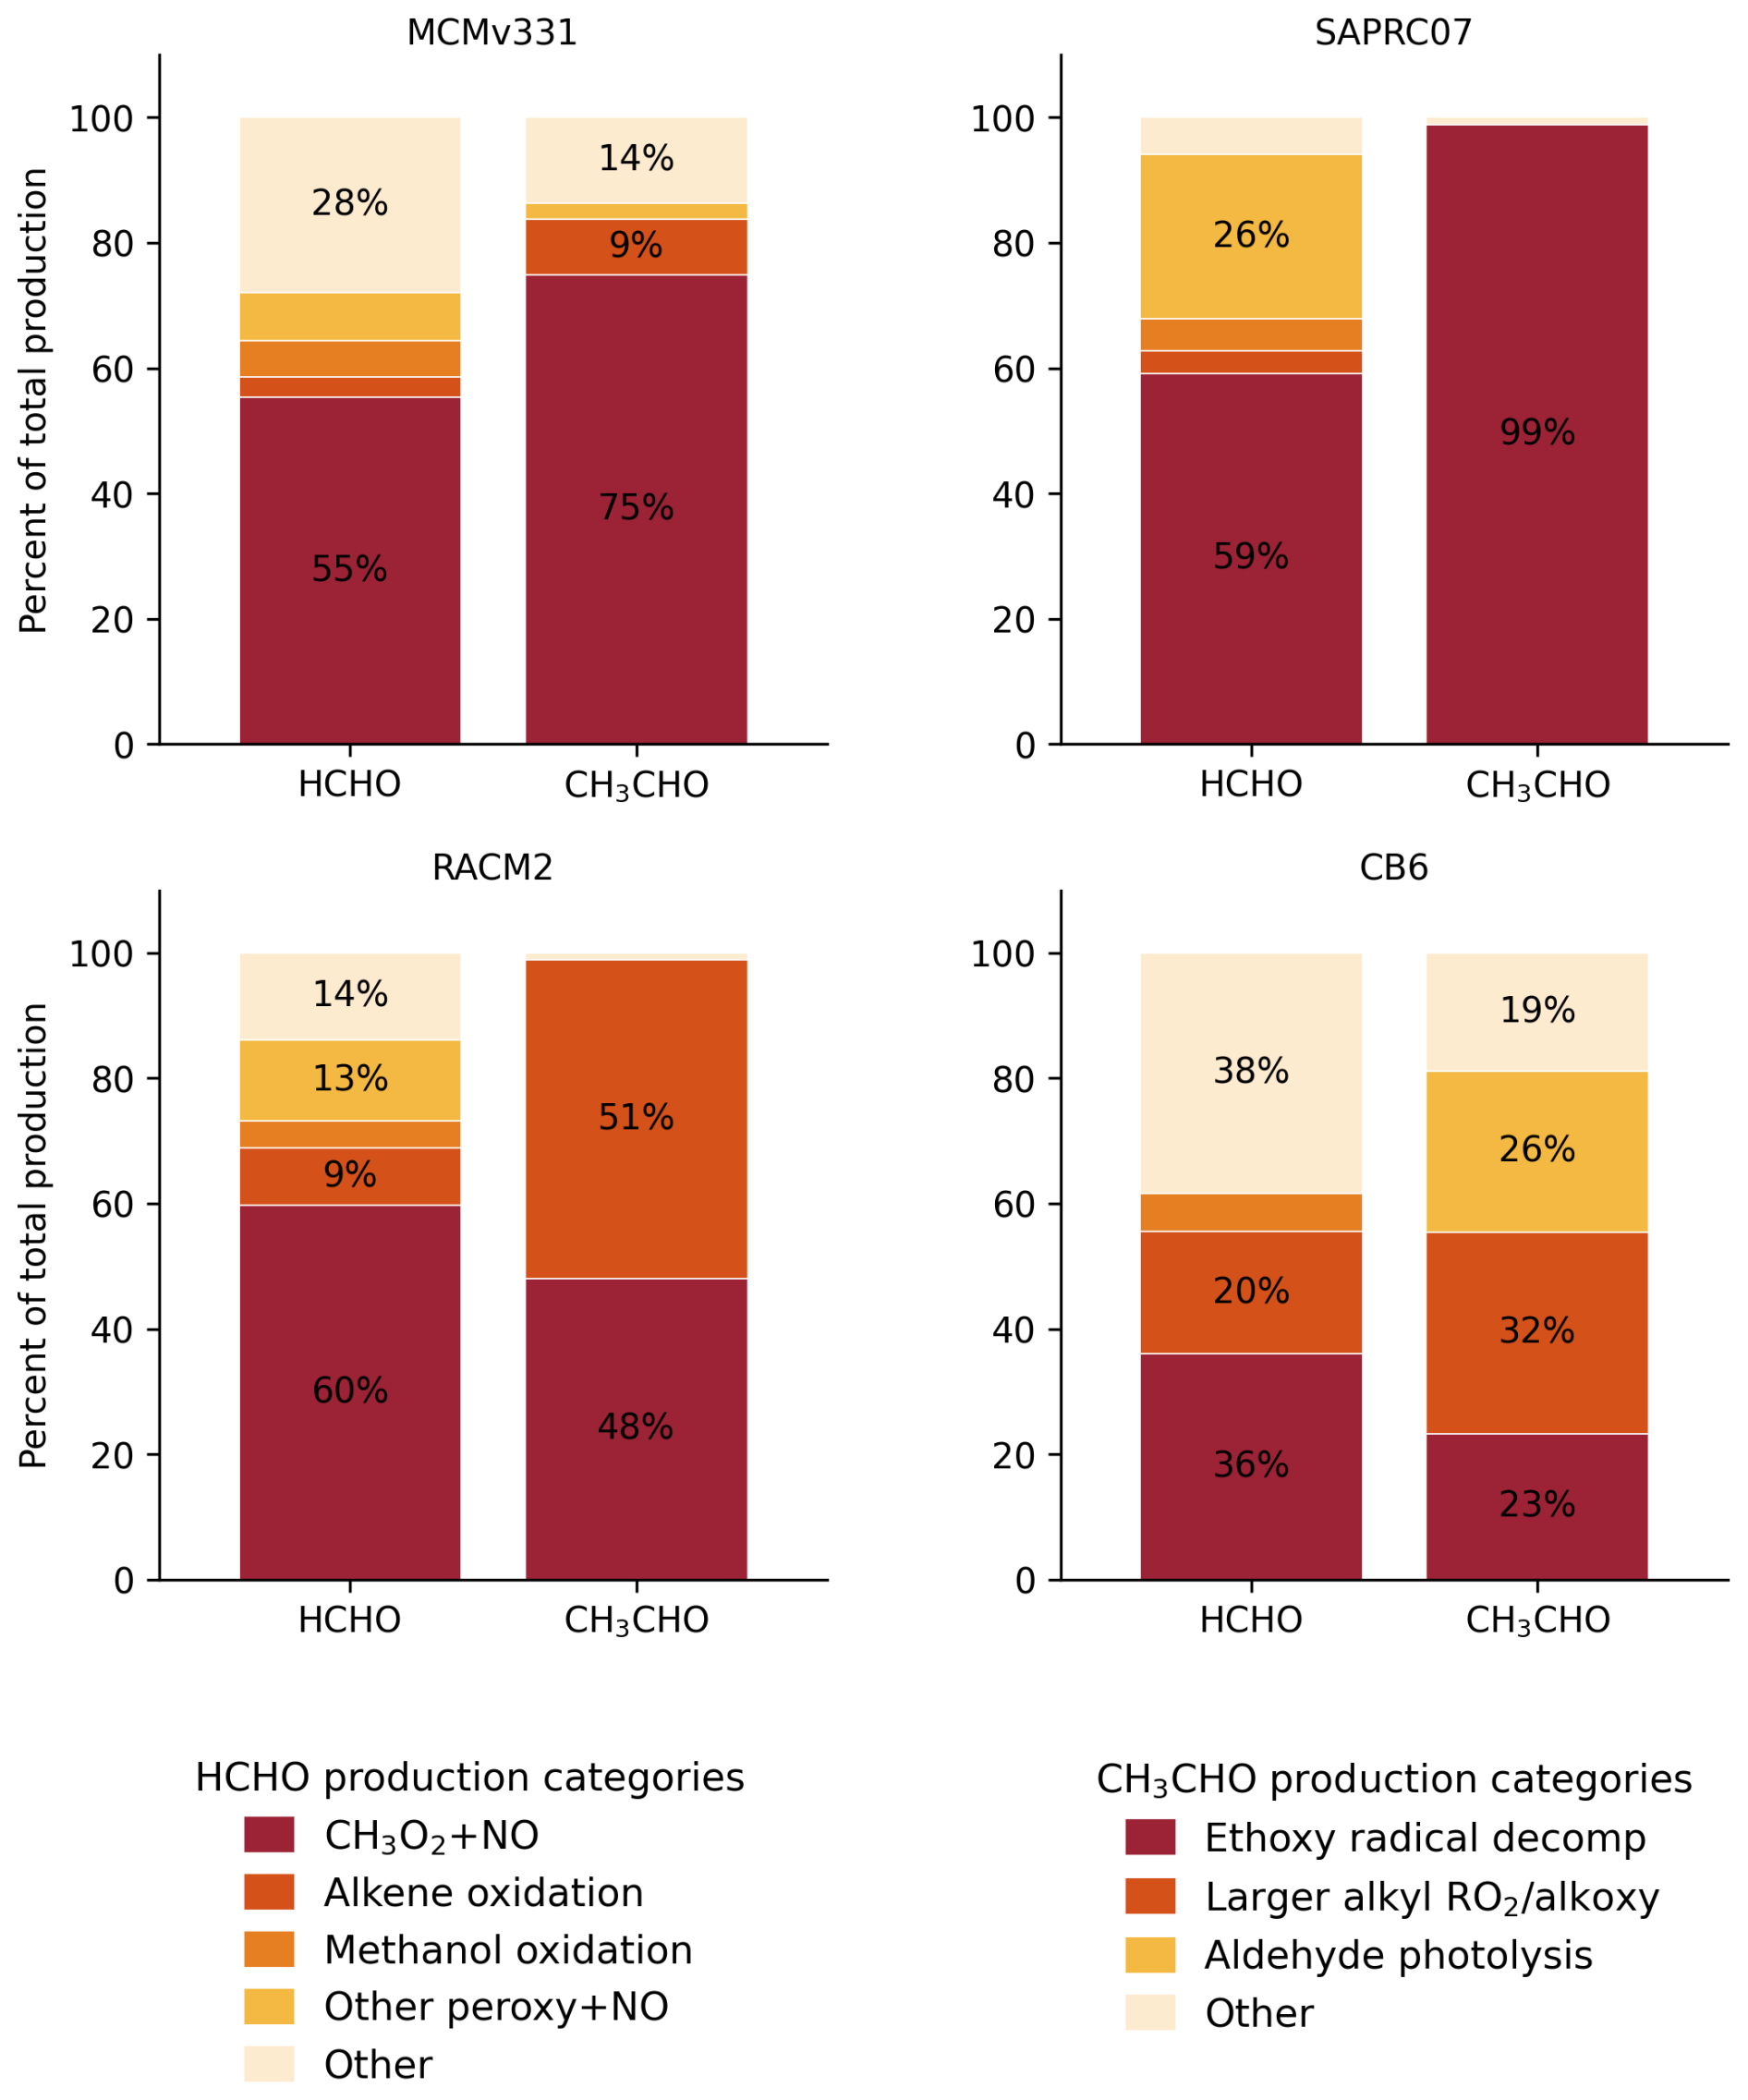
Figure 4Modeled day 4 production budgets for formaldehyde (HCHO) and acetaldehyde (CH3CHO) across the four chemical mechanisms. For each mechanism, bars show the percentage contribution of each reaction pathway to total production of the indicated carbonyl species. Reaction pathways are grouped into chemical categories, and pathways outside the named categories are pooled as “Other”. See Tables S8 through S10 for detailed reaction-level budget information for O3, HOx, and individual carbonyls.
Figure 5 illustrates the contribution of various hydrocarbon groups to the formation of key carbonyl compounds, including alkanes, alkenes, alkynes, aromatics, and alcohols. The MCMv331 results indicated that formaldehyde formation is influenced by a wide variety of NMOC groups (4 %–7 % each) because, as shown in Fig. 4, its dominant production pathway (R6, 55.3 %) relies on the methyl peroxy radical (CH3O2) (Reactions R1–R3), a universal intermediate generated from oxidation of multiple organic classes, including alkane oxidation via fragmentation of larger alkoxy radicals, alkene ozonolysis through Criegee intermediate decomposition, and aromatic ring-opening reactions. In addition, formaldehyde is produced through several direct pathways independent of CH3O2, such as terminal alkene ozonolysis, methanol oxidation, and glyoxal photolysis (Saunders et al., 2003).
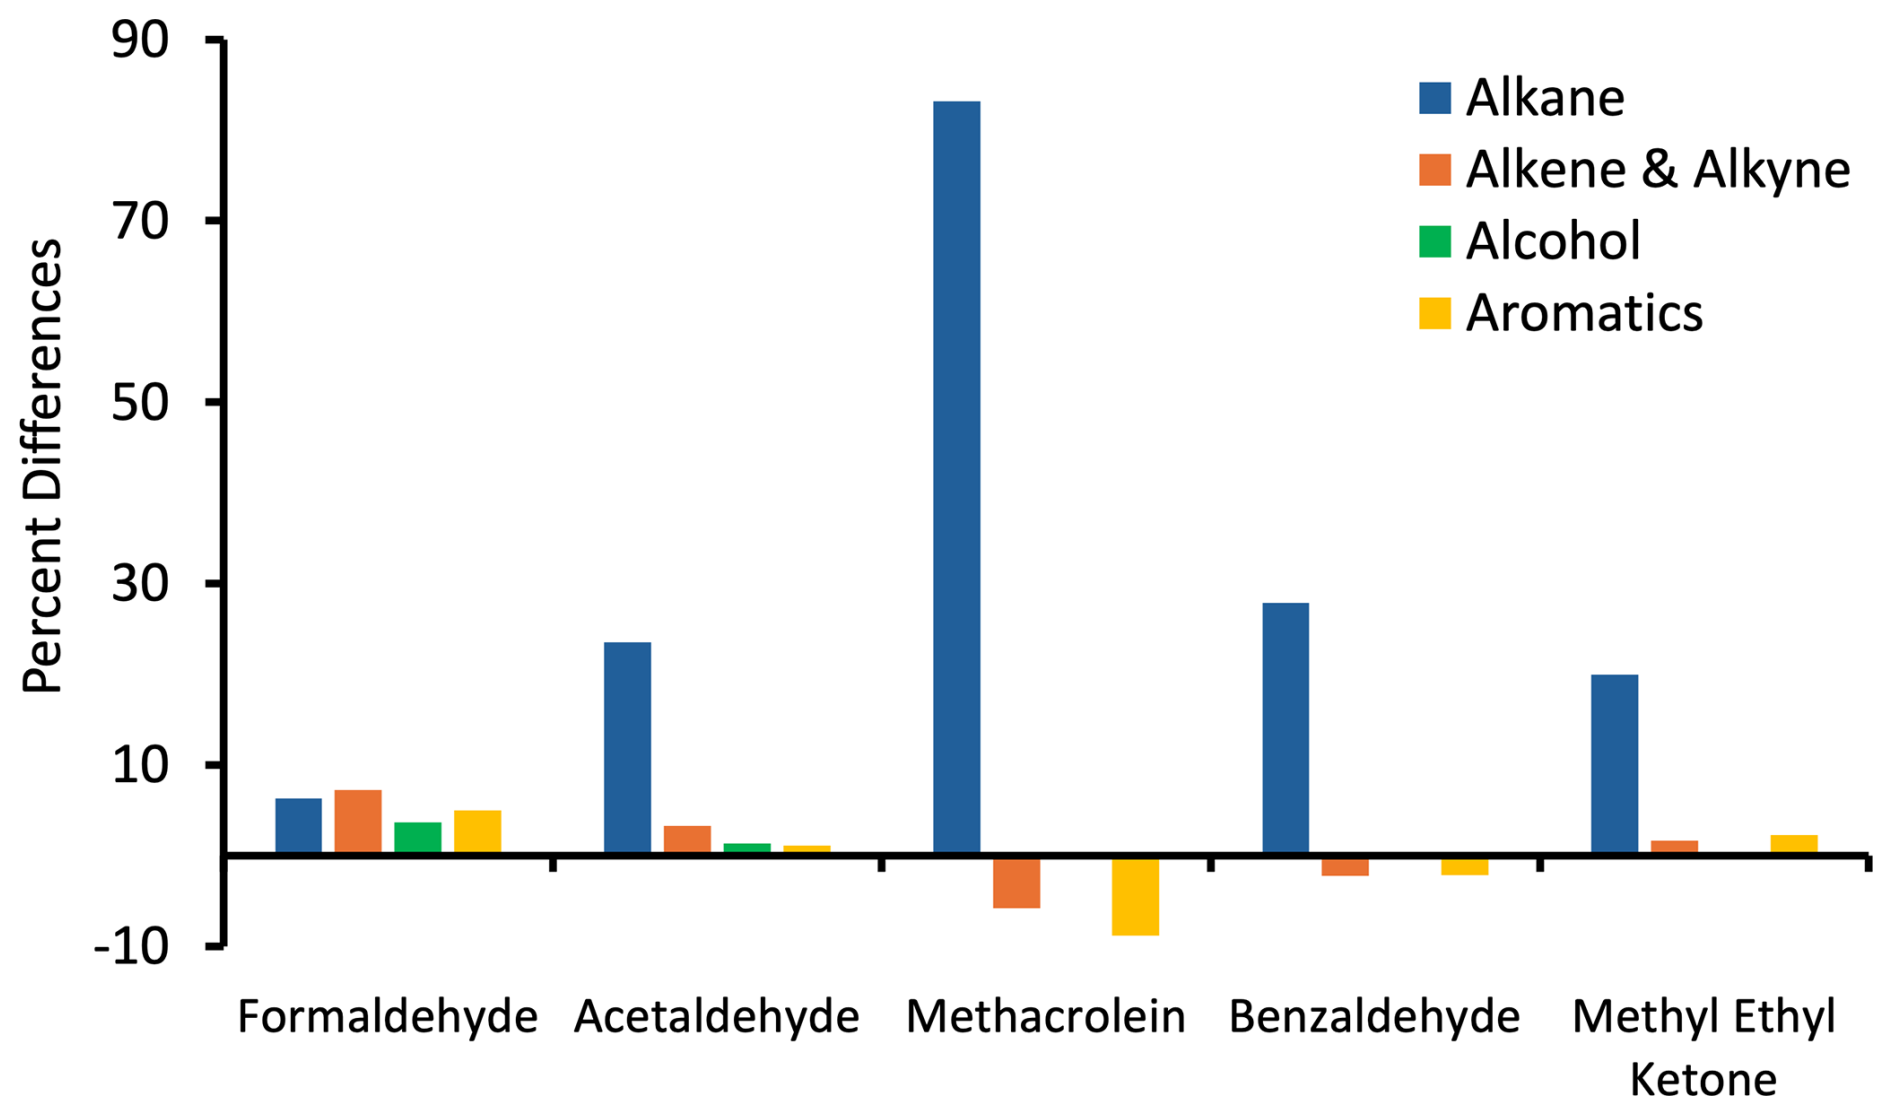
Figure 5Sensitivity of carbonyl compounds to changes in NMOC precursor groups (MCMv331 output). The bars represent the changes in carbonyl mixing ratios due to an increase in the NMOC mixing ratio of 50 %.
Alkanes are generally less reactive than other NMOC groups; however, due to their prominence in the Uinta Basin atmosphere, they still play a dominant role in the formation of formaldehyde and other carbonyl compounds. The mixing ratios of acetaldehyde, benzaldehyde, and methyl ethyl ketone increased by 24 %, 28 %, and 20 %, respectively, in response to a 50 % increase in the initial mixing ratio of total alkanes. Ethane reacts with the OH radical to form the ethoxy radical (C2H5O⋅) (R9), which is then oxidized to produce acetaldehyde (Reaction R10). This reaction pathway is the dominant source of acetaldehyde, accounting for 74.9 % of its total formation. Isopentane also acts as a significant contributor to acetaldehyde formation (Table S4), feeding into the same pathway. Its branched structure promotes alkoxy radical decomposition, which releases ethyl radicals that subsequently produce acetaldehyde through the same ethoxy radical pathway (Reactions R9–R10) as ethane. There are no such comparable pathways available for other NMOC groups, making alkane oxidation the primary contributor to acetaldehyde production. Ethanol oxidation forms some acetaldehyde, but ethanol mixing ratios were low in the model, and Figs. 4 and 5 show this to be a minor pathway.
Methacrolein production is typically associated with isoprene oxidation (Reaction R11); however, isoprene mixing ratios are negligible in the wintertime Uinta Basin due to plant dormancy. Budget analysis confirms that methacrolein is introduced almost entirely through primary emissions (Table S10.1). A 50 % increase in alkane mixing ratios resulted in an 83 % increase in methacrolein mixing ratio in MCMv331, the largest response among all carbonyl compounds (Fig. 5). This sensitivity arises because OH radicals account for 80 % of total methacrolein destruction, and alkane oxidation is simultaneously the largest OH sink in the system. Increasing alkane concentrations enhances OH consumption, reducing steady state OH and suppressing methacrolein destruction. Other carbonyls such as formaldehyde and acetaldehyde are less affected because their chemical production also decreases when OH is reduced, partially offsetting the slower destruction. Methacrolein, with no chemical production source, lacks this counterbalance. A 50 % increase in aromatics reduced methacrolein by 9 % due to phenoxy radical-driven HOx suppression. The O3 budget reveals that phenoxy radicals directly destroy O3 (R12, 2.31 molecule cm−3, 0.19 % of total O3 loss), reducing the primary OH source (). Additionally, phenoxy radicals react with NO2 to form nitrophenols (), which terminate radical chains and sequester NOx, thereby suppressing the recycling pathway. These combined effects reduce OH availability for isoprene oxidation, resulting in decreased methacrolein production.
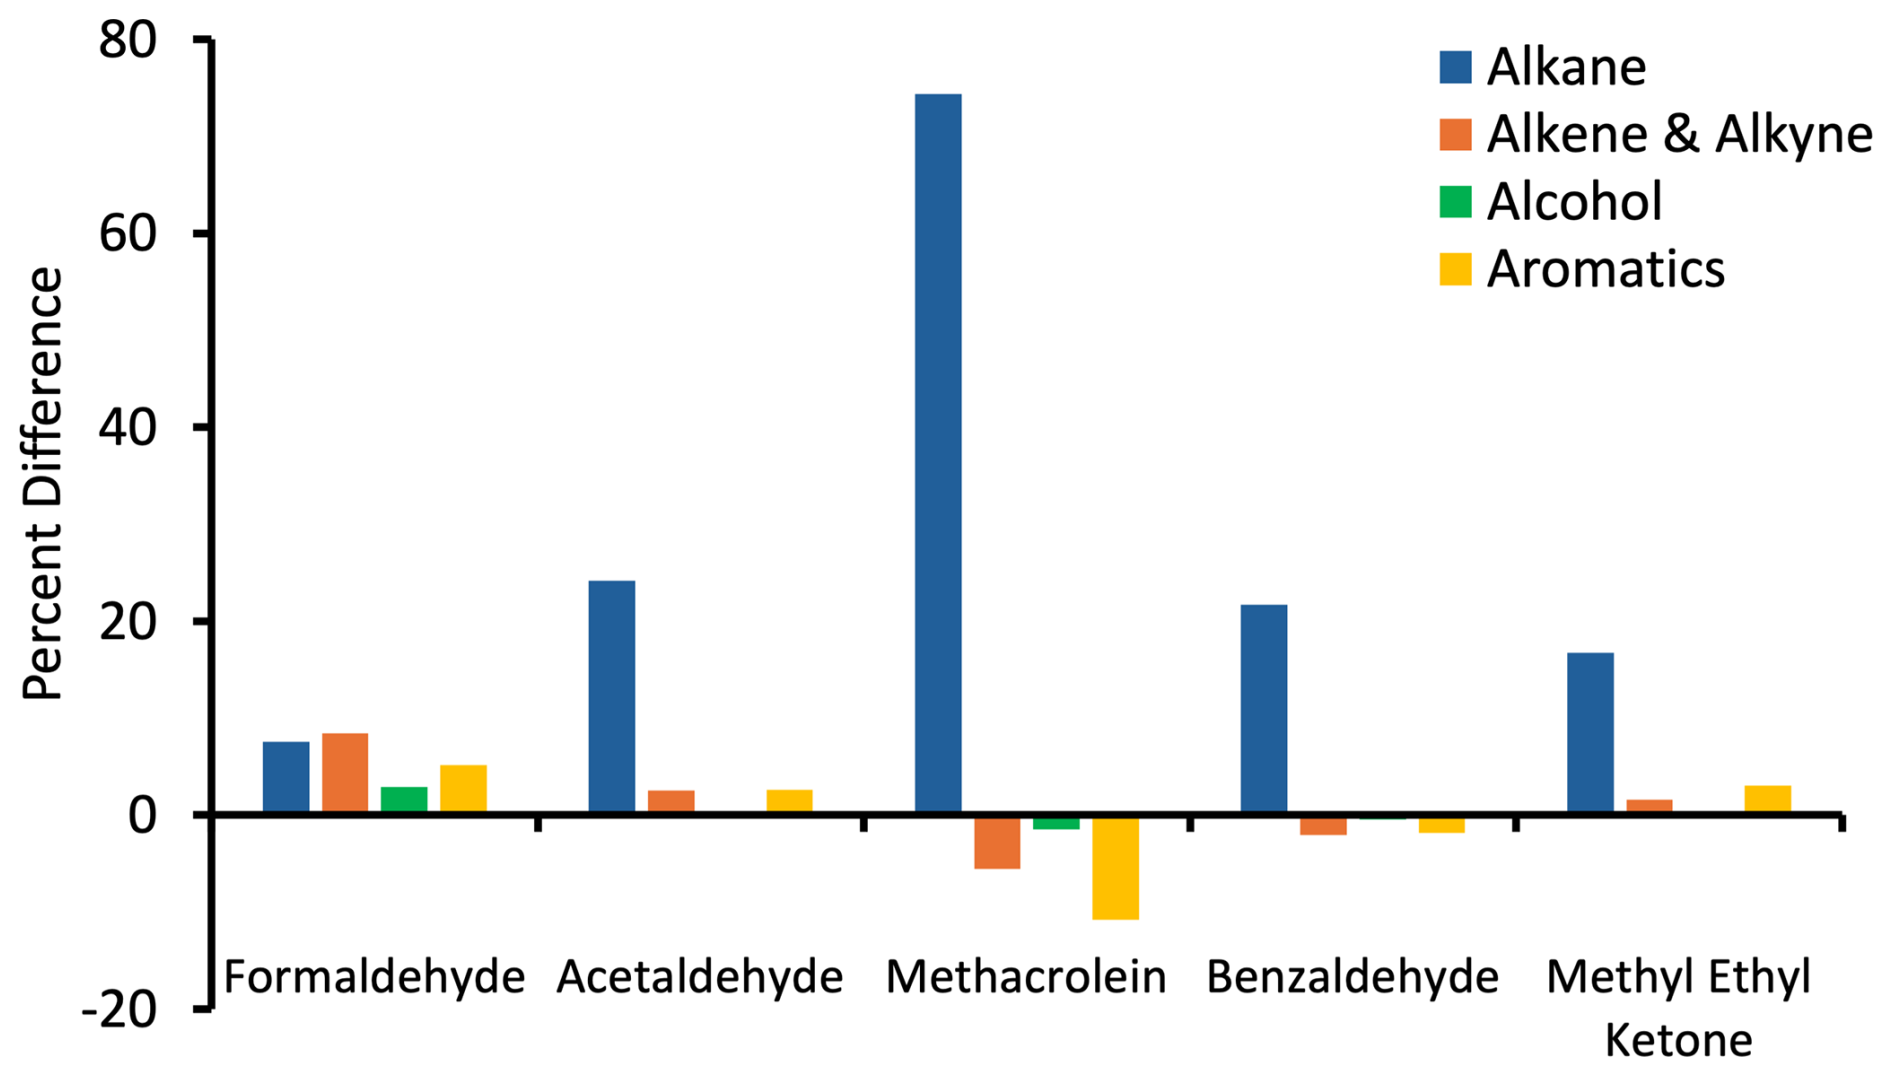
Figure 6Sensitivity of hydrocarbons to carbonyl compounds (SAPRC07 Output). The bars represent the changes in carbonyl mixing ratios due to the increase in the hydrocarbon initial mixing ratio by 50 %.
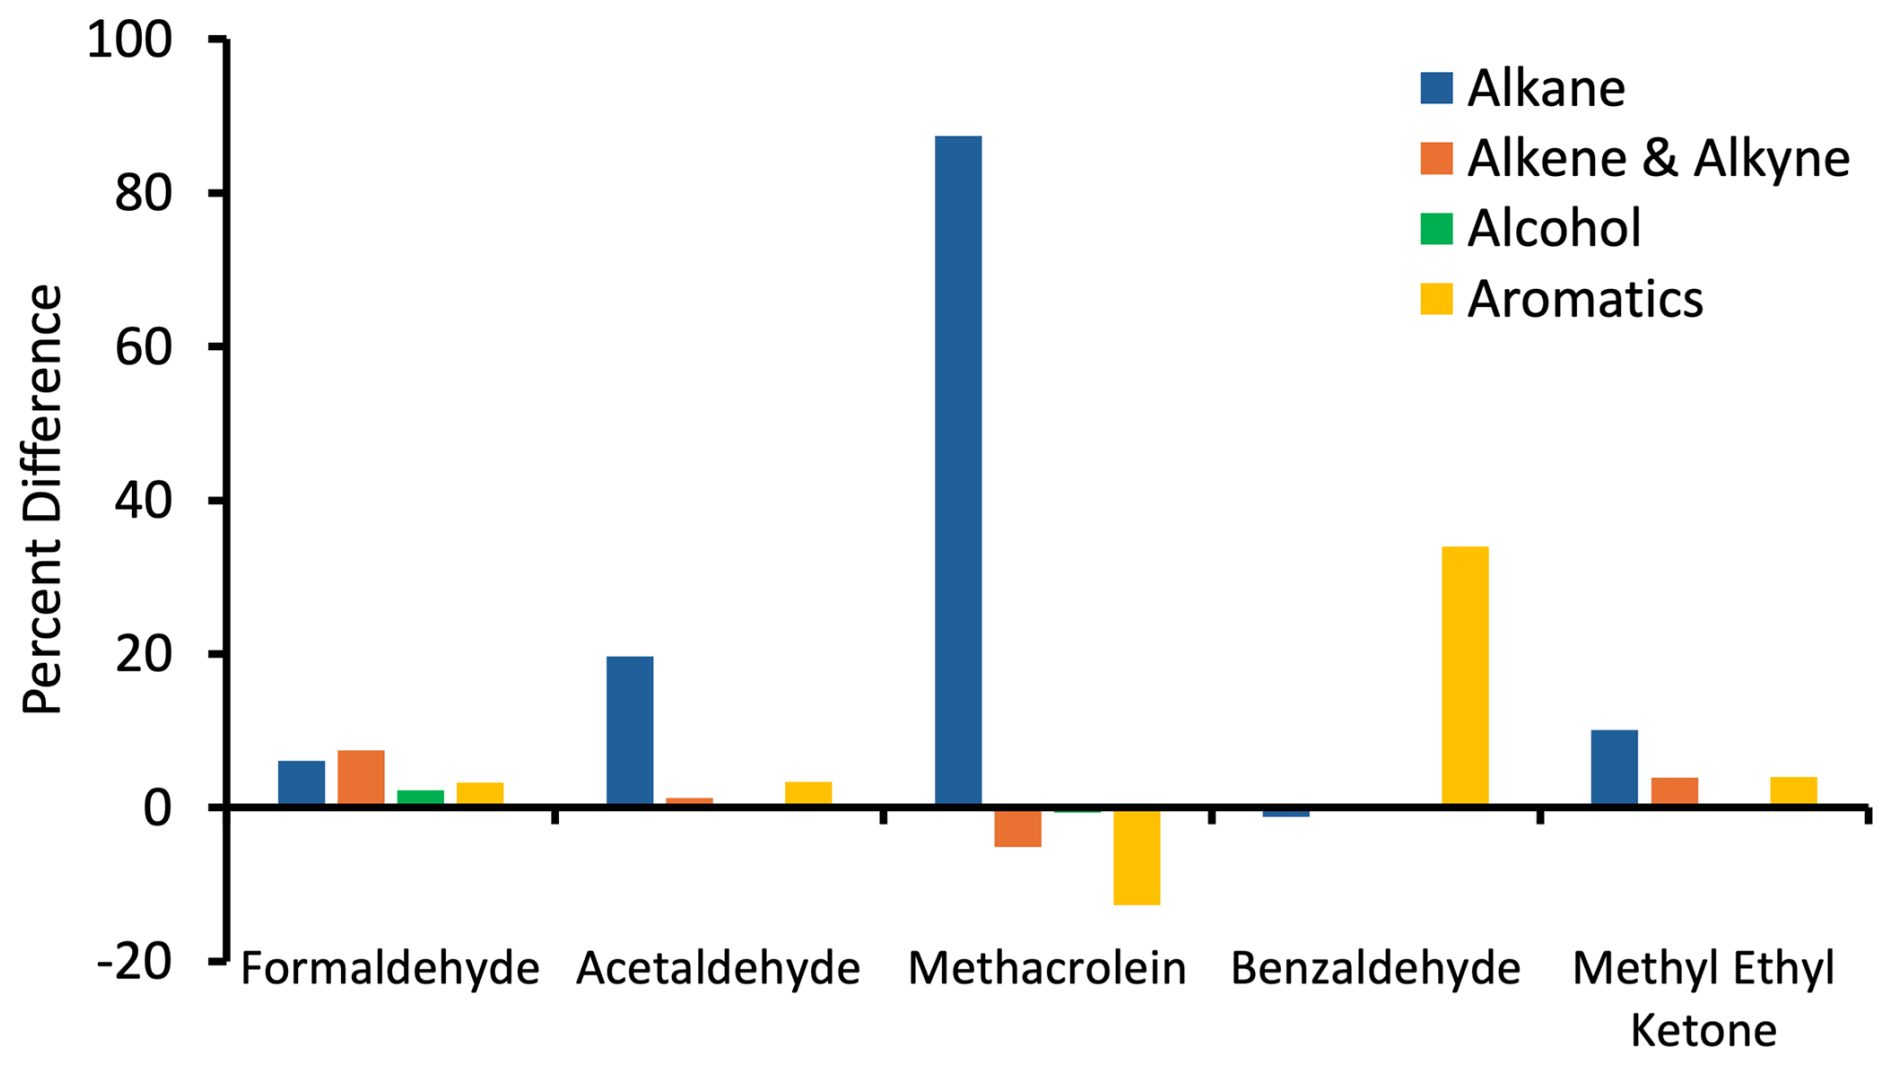
Figure 7Sensitivity of hydrocarbons to carbonyl compounds (RACM2 Output). The bars represent the changes in carbonyl mixing ratios due to the increase in the hydrocarbon initial mixing ratio by 50 %.
Sensitivity analyses following the same method with the SAPRC07 and RACM2 (Figs. 6 and 7) chemical mechanisms showed similar trends as MCMv331, except aromatics had a more substantial positive effect on benzaldehyde formation than alkanes, according to RACM2. Reactions (R13) and (R14) represent the formation of benzaldehyde from benzene in RACM2. Here, benzene reacts with OH to produce an epoxy muconate intermediate, which reacts with O3 to directly produce benzaldehyde (R14, accounting for 72.1 % of benzaldehyde production). In contrast, in MCMv331, ring-opening chemistry produces dicarbonyls (glyoxal, butenedial) that cannot form benzaldehyde because the aromatic ring is destroyed (Reaction R15). In MCMv331, benzaldehyde production requires the intact benzene ring and occurs only through the minor side-chain oxidation pathway (R16–R17, 0.7 % of production), with 99.3 % coming from direct emissions. This mechanistic difference explains why increasing aromatics has a stronger positive effect on benzaldehyde in RACM2 than in MCMv331.
The CB6 mechanism is based on carbon bond types rather than explicit chemical species, resulting in fundamentally different formaldehyde sensitivity compared to MCMv331 (Fig. 8). In MCMv331, alkane oxidation produces methoxy radicals (CH3O) through sequential fragmentation, which decompose directly to formaldehyde (Reaction R6). In contrast, CB6 represents alkanes as paraffinic carbon bonds (PAR), and their oxidation produces a lumped alkoxy intermediate (ROR) that decomposes exclusively to ketones (KET), acetaldehyde, acetone, and higher aldehydes but not formaldehyde. Meanwhile, alkenes in CB6 directly produce formaldehyde with high yields ( Formaldehyde). Since alkane oxidation consumes 34 % of OH without producing formaldehyde, increasing alkanes reduces OH availability for alkene oxidation, resulting in decreased formaldehyde production. Acetaldehyde and ketone formation remain alkane-dominated in CB6, consistent with other mechanisms. This carbon-bond lumping approach fundamentally alters formaldehyde's NMOC sensitivity in CB6 compared to more explicit mechanisms like MCMv331 and SAPRC07.
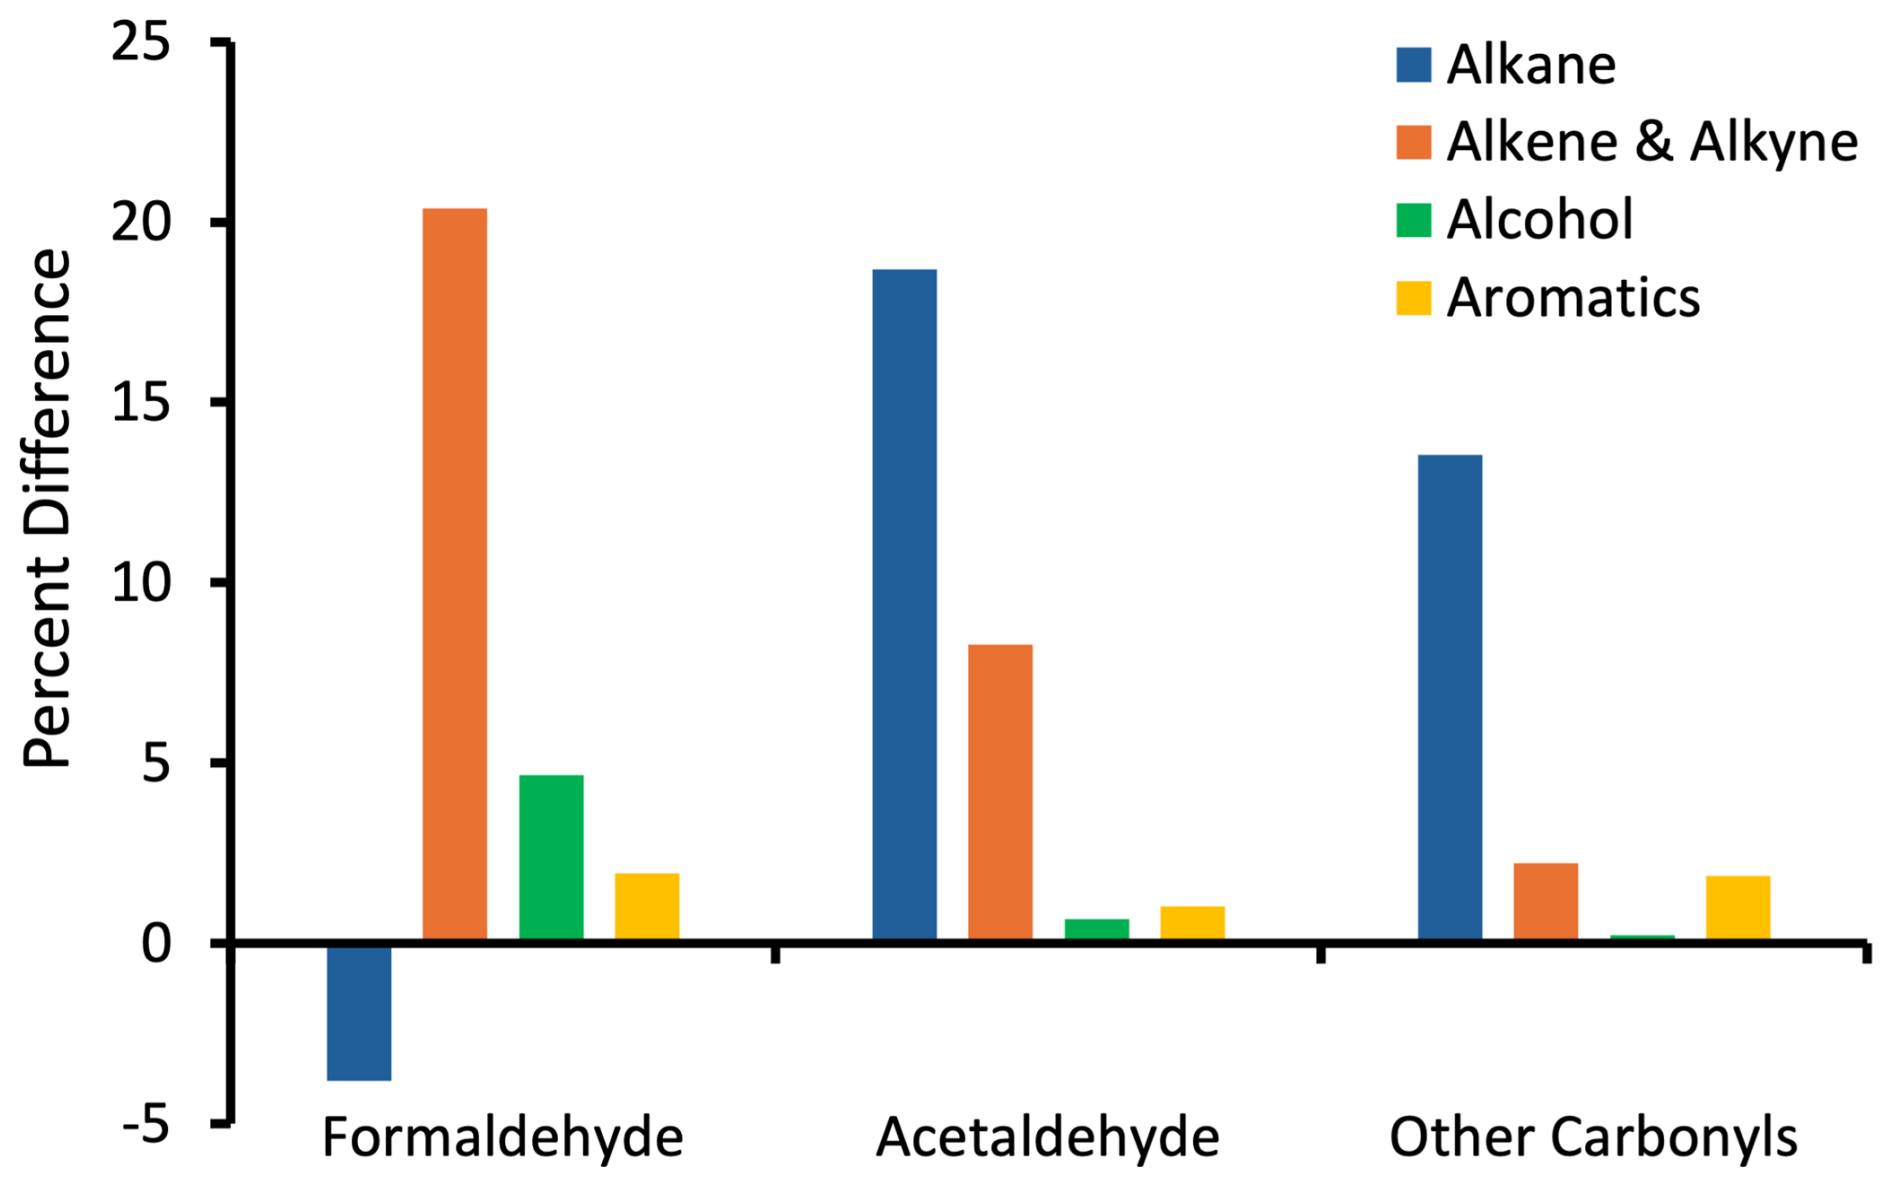
Figure 8Sensitivity of hydrocarbons to carbonyl compounds (CB6 Output). The bars represent the changes in carbonyl mixing ratios due to the increase in the hydrocarbon initial mixing ratio by 50 %.
3.4 Contribution of Hydrocarbons to Winter O3 Formation
The overall contribution of primarily emitted hydrocarbon groups to wintertime O3 production was quantified through a sensitivity analysis using the same chemical mechanisms as before. This analysis completes the chain from primarily emitted hydrocarbons through their influence on carbonyl formation to O3 production. It also provides the basis for identifying emission reduction targets. Figure 9 reveals that both MCMv331 and SAPRC07 chemical mechanisms exhibit similar chemical behavior, with alkanes having the most significant influence on winter O3 formation. A 50 % increase in the mixing ratio of alkanes resulted in approximately a 0.29 and 0.35 ppb h−1 increase in O3 production rate on the fourth day of the simulation with the MCMv331 and SAPRC07 mechanisms, respectively. The dominant role of alkanes in winter O3 formation can be attributed to their high ambient mixing ratio and efficient radical propagation chemistry. Although alkane reactions with OH radicals have moderate rate constants, their elevated mixing ratios enable efficient production of alkyl peroxy radicals. These peroxy radicals subsequently propagate the NO to NO2 conversion cycle, ultimately contributing to O3 production (Reactions R1–R5). While this fundamental chemistry is represented in all mechanisms, RACM2 underestimates the full impact of alkane degradation due to over-simplification through species lumping. Compared to MCMv331, RACM2 showed a 76 % reduction in parent alkane species and an 86 % reduction in peroxy radical species after lumping. This simplification resulted in a 34 % reduction in HO2 radical yields from alkane oxidation, which consequently reduced the apparent contribution of alkanes to O3 production relative to MCMv331.
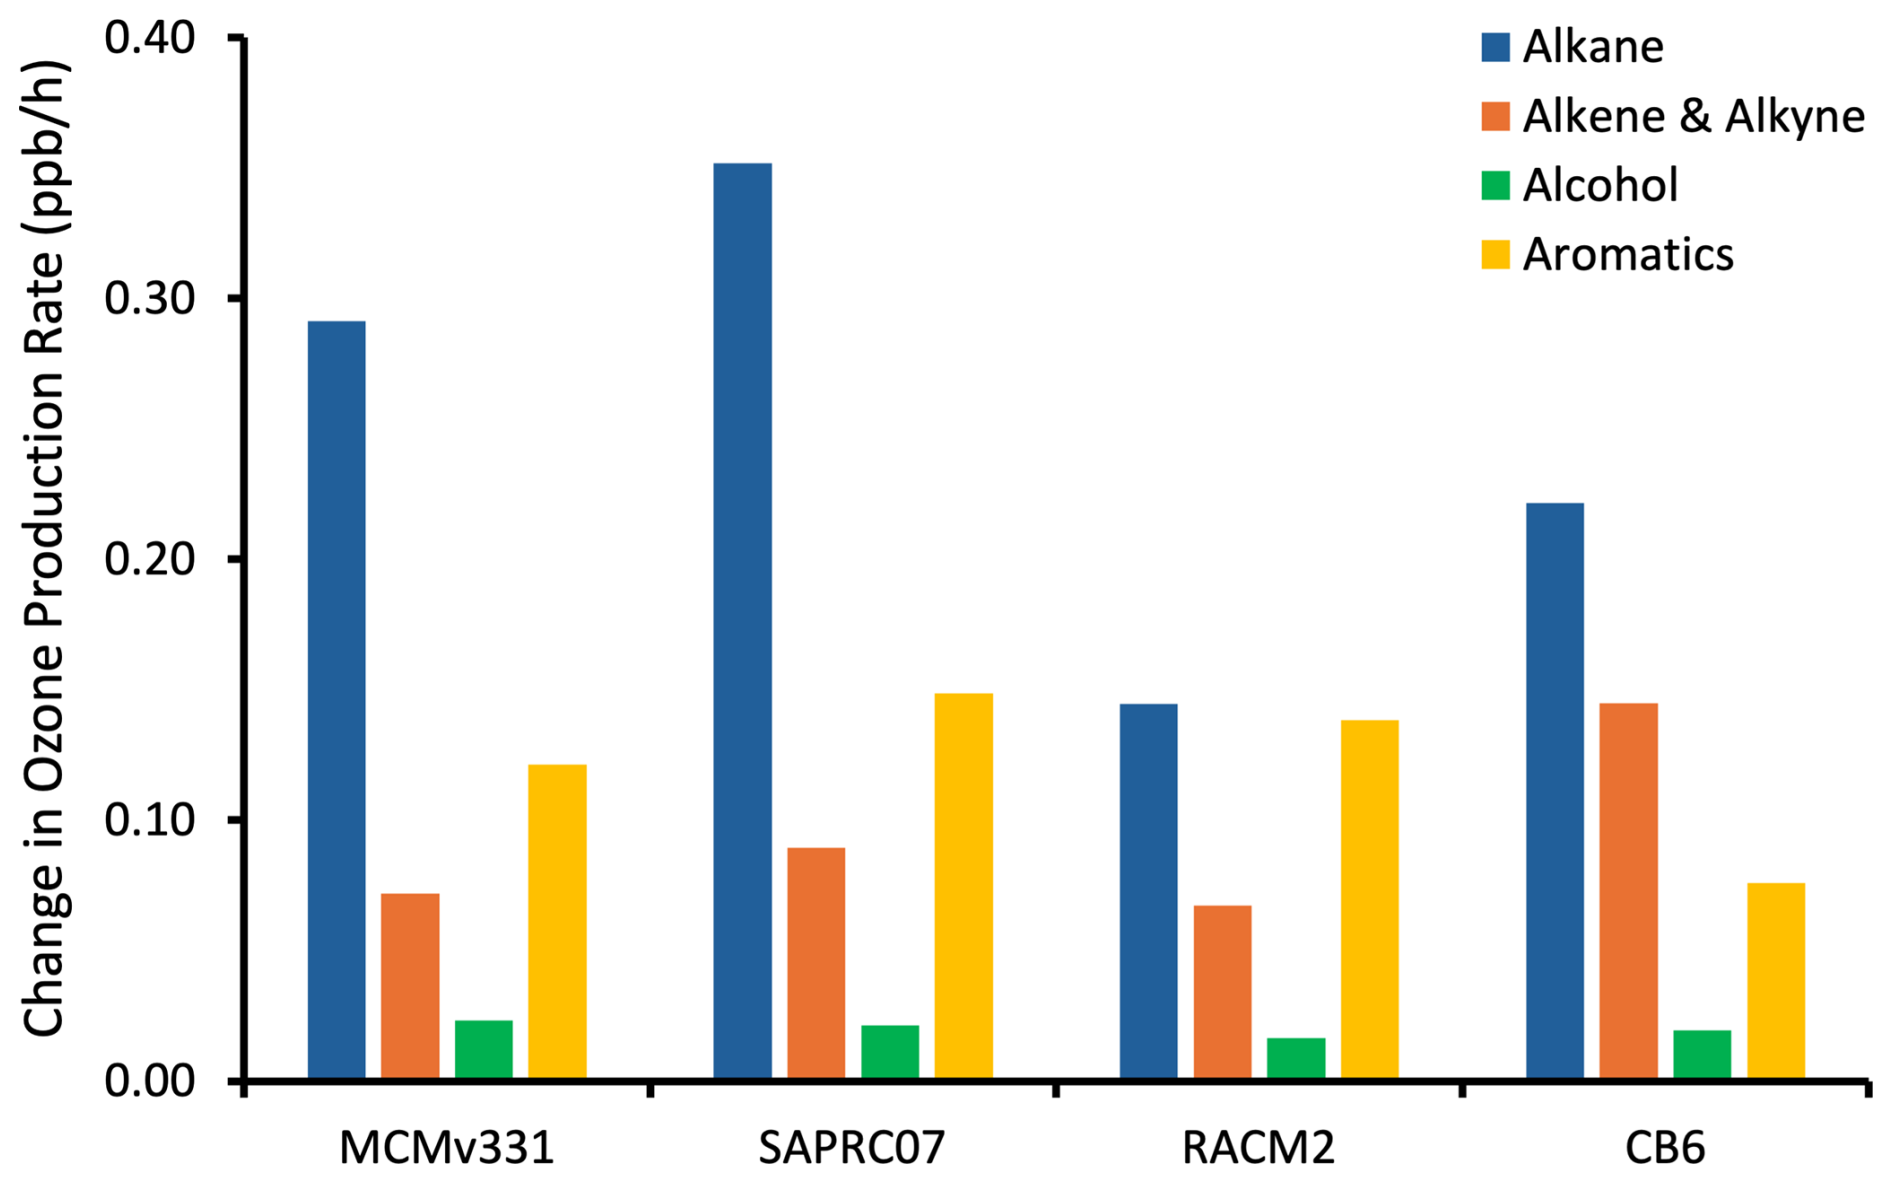
Figure 9Sensitivity of hydrocarbons to O3 production rate. The bars represent the changes in O3 production rate from the base model due to the increase in hydrocarbon initial mixing ratio by 50 %.
In MCMv331 and SAPRC07, aromatics emerged as the second most important precursor for winter O3 formation due to their efficient sequential multi-step oxidation chemistry. The initial OH-addition to the aromatic ring produces bicyclic peroxy radicals, which subsequently undergo ring-opening to form highly reactive dicarbonyl compounds such as glyoxal and methylglyoxal. These dicarbonyls photolyze to produce additional HOx radicals, creating a radical amplification chain that significantly enhances O3 production per aromatic molecule oxidized. Simulations using RACM2 showed a similar magnitude of aromatic-induced O3 production change compared to MCMv331 and SAPRC07. The CB6 mechanism identified alkanes as the major contributor, similar to MCMv331 and SAPRC07. However, it ranked alkenes and alkynes, rather than aromatics, as the second-highest contributors to winter O3 production, diverging from the trends observed in the other chemical mechanisms.
Although alkanes showed the largest contribution to O3 production, a 50 % increase in alkane mixing ratios resulted in only a modest change of about 0.2–0.4 ppb h−1 in the O3 production rate on day four of the model run across the chemical mechanisms. This limited response likely occurs because both physical and chemical constraints begin to develop by the fourth day of the simulation (Fig. S1). As the inversion persists, the accumulation of precursors approaches a balance between emissions into the basin and loss through air exchange at the top of the inversion, which limits further increases in O3 forming compounds (Edwards et al., 2014). At the same time, highly reactive NMOCs are consumed during the early days of the episode, and the remaining NMOC mixture is dominated by slower reacting species that are less efficient at producing O3 (Koss et al., 2015; Lyman et al., 2018). Further, more NOx is consumed as photochemical activity is enhanced day upon day, leading to less NOx available to produce O3 (Lyman et al., 2018). Thus, increasing precursor mixing ratios by 50 % has a much smaller effect on O3 production on day four than during the earlier days.
Previous box model and observational studies indicate that alkanes can play a critical role in wintertime O3 production in oil and gas–influenced regions (Chen et al., 2020; Koss et al., 2015). In Utah's Uintah Basin, light alkanes are the most abundant in NMOC (Table S2). Although light alkanes react more slowly with OH radicals than aromatics, their high ambient mixing ratios cause them to dominate the NMOC mixture by volume and account for approximately 70 % of OH-initiated hydrocarbon oxidation (Koss et al., 2015). Studies in other oil and gas producing regions similarly report that light alkanes contribute about 60 % of total OH reactivity and play an important role in the formation of carbonyl compounds, which serve as major radical sources for O3 production (Gilman et al., 2013; Edwards et al., 2014; Field et al., 2015).
The contribution of different NMOC groups to the O3 production rate remained largely unchanged after incorporating heterogeneous chemistry in the box model simulation using MCMv331, consistent with the explanation provided in Sect. 3.2 (Fig. S5). Figure S5 shows that a 50 % increase in the mixing ratio of each NMOC group with heterogeneous chemistry resulted in nearly similar magnitudes of change in O3 production rate as without heterogeneous chemistry.
This box model study provides a comprehensive understanding of the chemical processes governing winter O3 formation in the Uinta Basin, along with an evaluation of the performance of different chemical mechanisms. Our analysis identified formaldehyde as the most critical carbonyl species driving wintertime O3 production, followed by acetaldehyde, a finding consistently observed across MCMv331, RACM2, and SAPRC07 mechanisms. Formaldehyde photolysis serves as a primary source of HO2 radicals, which subsequently convert NO to NO2 and ultimately produce O3. Among the NMOC groups, alkanes emerged as the dominant contributors to O3 formation across all mechanisms, primarily due to their high ambient mixing ratios from oil and gas operations and their efficient production of alkyl peroxy radicals that propagate NOx cycling. Aromatics ranked as the second most important precursor in MCMv331 and SAPRC07 simulations, attributed to their multi-step oxidation chemistry that produces reactive dicarbonyl intermediates and amplifies radical production. The inclusion of heterogeneous chemistry had minimal impact on NMOC and carbonyl contributions to winter O3 formation, indicating that the primary chemical pathways remain unaffected (Figs. S4 and S5).
Significant differences were observed among the chemical mechanisms in representing NMOC contributions to carbonyls and winter O3 production. RACM2 showed lower contributions from alkanes due to its heavy lumping of alkane species, which resulted in approximately 34 % lower HO2 yields from alkane oxidation compared to MCMv331. It also identified aromatics as the major contributor to benzaldehyde rather than alkanes. In CB6, ketones showed the highest carbonyl contribution to O3 formation because CB6 lumps higher ketones into a single species. This lumping concentrated the contributions of multiple ketone compounds that would be tracked individually in MCMv331 and reduced the importance of formaldehyde as an O3 precursor in CB6. Among the lumped mechanisms evaluated, SAPRC07 best reproduced the chemical behavior of the explicit MCMv331, making it the recommended choice for regulatory modeling of winter O3 episodes. CB6 may be suitable for pollutant concentration estimation but lacks the detail needed to understand the underlying chemical processes.
A key finding of this study is that the carbonyls driving wintertime O3 in the Uinta Basin are predominantly secondary in origin, formed through atmospheric photochemistry rather than emitted directly. Formaldehyde and acetaldehyde were identified as the dominant radical-producing carbonyls, with the elevated acetaldehyde levels sustained mainly by the oxidation of light alkanes, which constitute the bulk of the NMOC mixture from oil and gas operations. These findings provide a basis for developing effective O3 mitigation strategies in the Uinta Basin and similar oil and gas producing regions, with alkanes and aromatics identified as the primary emission reduction targets. Alkanes dominate O3 formation and serve as the main precursors for most carbonyl production, while aromatics contribute through their efficient multi-step oxidation chemistry. The primary uncertainty related to this study is that the sensitivity analysis output across chemical mechanisms may vary in different regions due to differences in emission source profiles, meteorological conditions, and topographical characteristics, all of which influence NMOC composition, radical cycling, and pollutant accumulation.
The F0AM Box model script can be provided by the corresponding author upon request.
Measurement data used in this study are available at https://www.usu.edu/binghamresearch/data-access (last access: 12 July 2026).
The supplement related to this article is available online at https://doi.org/10.5194/acp-26-10287-2026-supplement.
SNL and LD planned the overall research framework and study objectives. LD conducted all atmospheric chemistry simulations and data processing. LD prepared the initial manuscript draft, including figures and interpretation of model results. SNL provided critical revisions, contributed to the interpretation of findings, and supervised the entire project.
The contact author has declared that neither of the authors has any competing interests.
Publisher's note: Copernicus Publications remains neutral with regard to jurisdictional claims made in the text, published maps, institutional affiliations, or any other geographical representation in this paper. The authors bear the ultimate responsibility for providing appropriate place names. Views expressed in the text are those of the authors and do not necessarily reflect the views of the publisher.
We thank Huy Tran from the Center for Environmental Modeling for Policy Development at the University of North Carolina and RAMBOLL for providing the species mapping information. We also thank Pamela Gardner, Project Development Specialist at the Bingham Research Center, Utah State University, for reviewing and editing the grammar, spelling, and formatting. The authors also used ChatGPT and Claude AI for grammar editing. They used Claude AI to develop code for operation of the F0AM model and to create some of the figures.
Funding for this work was provided by Uintah Special Service District 1 and the Utah State Legislature. Additional funding for student support was provided by an endowment from the Anadarko Petroleum Corporation.
This paper was edited by Maria Kanakidou and reviewed by two anonymous referees.
Ashmore, M. R.: Assessing the future global impacts of ozone on vegetation, Plant Cell Environ., 28, 949–964, https://doi.org/10.1111/j.1365-3040.2005.01341.x, 2005.
Barnes, P. W., Williamson, C. E., Lucas, R. M., Robinson, S. A., Madronich, S., Paul, N. D., and Zepp, R. G.: Ozone depletion, ultraviolet radiation, climate change, and prospects for a sustainable future, Nat. Sustain., 2, 569–579, https://doi.org/10.1038/s41893-019-0314-2, 2019.
Bloss, C., Wagner, V., Jenkin, M. E., Volkamer, R., Bloss, W. J., Lee, J. D., Heard, D. E., Wirtz, K., Martin-Reviejo, M., Rea, G., Wenger, J. C., and Pilling, M. J.: Development of a detailed chemical mechanism (MCMv3.1) for the atmospheric oxidation of aromatic hydrocarbons, Atmos. Chem. Phys., 5, 641–664, https://doi.org/10.5194/acp-5-641-2005, 2005.
Cao, L., Li, S., and Sun, L.: Study of different Carbon Bond 6 (CB6) mechanisms by using a concentration sensitivity analysis, Atmos. Chem. Phys., 21, 12687–12714, https://doi.org/10.5194/acp-21-12687-2021, 2021.
Carbajo, P. G., Smith, S. C., Holloway, A. L., Smith, C. A., Pope, F. D., Shallcross, D. E., and Orr-Ewing, A. J.: Ultraviolet photolysis of HCHO: absolute HCO quantum yields by direct detection of the HCO radical photoproduct, J. Phys. Chem. A, 112, 12437–12448, https://doi.org/10.1021/jp8070508, 2008.
Carter, W. P. and Seinfeld, J. H.: Winter ozone formation and VOC incremental reactivities in the Upper Green River Basin of Wyoming, Atmos. Environ., 50, 255–266, https://doi.org/10.1016/j.atmosenv.2011.12.025, 2012.
Chen, T., Xue, L., Zheng, P., Zhang, Y., Liu, Y., Sun, J., Han, G., Li, H., Zhang, X., Li, Y., Li, H., Dong, C., Xu, F., Zhang, Q., and Wang, W.: Volatile organic compounds and ozone air pollution in an oil production region in northern China, Atmos. Chem. Phys., 20, 7069–7086, https://doi.org/10.5194/acp-20-7069-2020, 2020.
Edwards, P. M., Young, C. J., Aikin, K., deGouw, J., Dubé, W. P., Geiger, F., Gilman, J., Helmig, D., Holloway, J. S., Kercher, J., Lerner, B., Martin, R., McLaren, R., Parrish, D. D., Peischl, J., Roberts, J. M., Ryerson, T. B., Thornton, J., Warneke, C., Williams, E. J., and Brown, S. S.: Ozone photochemistry in an oil and natural gas extraction region during winter: simulations of a snow-free season in the Uintah Basin, Utah, Atmos. Chem. Phys., 13, 8955–8971, https://doi.org/10.5194/acp-13-8955-2013, 2013.
Edwards, P. M., Brown, S. S., Roberts, J. M., Ahmadov, R., Banta, R. M., de Gouw, J. A., and Zamora, R.: High winter ozone pollution from carbonyl photolysis in an oil and gas basin, Nature, 514, 351–354, https://doi.org/10.1038/nature13767, 2014.
Field, R. A., Soltis, J., McCarthy, M. C., Murphy, S., and Montague, D. C.: Influence of oil and gas field operations on spatial and temporal distributions of atmospheric non-methane hydrocarbons and their effect on ozone formation in winter, Atmos. Chem. Phys., 15, 3527–3542, https://doi.org/10.5194/acp-15-3527-2015, 2015.
Filippidou, E. C. and Koukouliata, A.: Ozone affects the respiratory system, Prog. Health Sci., 1, 144–155, 2011.
Fischer, E. V., Jacob, D. J., Yantosca, R. M., Sulprizio, M. P., Millet, D. B., Mao, J., Paulot, F., Singh, H. B., Roiger, A., Ries, L., Talbot, R. W., Dzepina, K., and Pandey Deolal, S.: Atmospheric peroxyacetyl nitrate (PAN): a global budget and source attribution, Atmos. Chem. Phys., 14, 2679–2698, https://doi.org/10.5194/acp-14-2679-2014, 2014.
Gilman, J. B., Lerner, B. M., Kuster, W. C., and de Gouw, J. A.: Source signature of volatile organic compounds from oil and natural gas operations in northeastern Colorado, Environ. Sci. Technol., 47, 1297–1305, https://doi.org/10.1021/es304119a, 2013.
Goliff, W. S., Stockwell, W. R., and Lawson, C. V.: The regional atmospheric chemistry mechanism, version 2, Atmos. Environ., 68, 174–185, https://doi.org/10.1016/j.atmosenv.2012.11.038, 2013.
Heard, D. E., Carpenter, L. J., Creasey, D. J., Hopkins, J. R., Lee, J. D., Lewis, A. C., and Emmerson, K. M.: High levels of the hydroxyl radical in the winter urban troposphere, Geophys. Res. Lett., 31, L18112, https://doi.org/10.1029/2004GL020544, 2004.
Koss, A. R., de Gouw, J., Warneke, C., Gilman, J. B., Lerner, B. M., Graus, M., Yuan, B., Edwards, P., Brown, S. S., Wild, R., Roberts, J. M., Bates, T. S., and Quinn, P. K.: Photochemical aging of volatile organic compounds associated with oil and natural gas extraction in the Uintah Basin, UT, during a wintertime ozone formation event, Atmos. Chem. Phys., 15, 5727–5741, https://doi.org/10.5194/acp-15-5727-2015, 2015.
Lapworth, A.: The morning transition of the nocturnal boundary layer, Bound.-Lay. Meteorol., 119, 501–526, https://doi.org/10.1007/s10546-005-9046-0, 2006.
Levy, H.: Normal atmosphere: Large radical and formaldehyde concentrations predicted, Science, 173, 141–143, https://doi.org/10.1126/science.173.3992.141, 1971.
Lew, M. M., Rickly, P. S., Bottorff, B. P., Reidy, E., Sklaveniti, S., Léonardis, T., Locoge, N., Dusanter, S., Kundu, S., Wood, E., and Stevens, P. S.: OH and HO2 radical chemistry in a midlatitude forest: measurements and model comparisons, Atmos. Chem. Phys., 20, 9209–9230, https://doi.org/10.5194/acp-20-9209-2020, 2020.
Li, C.: Nitrous Acid (HONO) Chemistry over Snow in the Uintah Basin, Utah, M. S. thesis, University of California, Los Angeles, USA, https://www.proquest.com/docview/3066745289, 2024.
Lin, J. C., Bares, R., Fasoli, B., Garcia, M., Crosman, E., and Lyman, S.: Declining methane emissions and steady, high leakage rates observed over multiple years in a western US oil/gas production basin, Sci. Rep., 11, 22291, https://doi.org/10.1038/s41598-021-01721-5, 2021.
Liu, Y., Li, J., Ma, Y., Zhou, M., Tan, Z., Zeng, L., and Zhang, Y.: A review of gas-phase chemical mechanisms commonly used in atmospheric chemistry modeling, J. Environ. Sci., 123, 522–534, https://doi.org/10.1016/j.jes.2022.10.031, 2023.
Lyman, S. and Tran, T.: Inversion structure and winter ozone distribution in the Uintah Basin, Utah, USA, Atmos. Environ., 123, 156–165, https://doi.org/10.1016/j.atmosenv.2015.10.067, 2015.
Lyman, S., Mansfield, M., Tran, H., and Tran, T.: Uintah Basin Air Quality Research 2018 Annual Report, BRC-181031A, Bingham Research Center, Utah State University, Vernal, UT, USA, https://www.usu.edu/binghamresearch/files/reports/UBAQR-2018-AnnualReport.pdf (last access: 12 July 2026), 2018.
Lyman, S. N., Holmes, M. L., Tran, H. N., Tran, T., and O'Neil, T.: High ethylene and propylene in an area dominated by oil production, Atmosphere, 12, 1, https://doi.org/10.3390/atmos12010001, 2020.
Lyman, S. N., Elgiar, T., Gustin, M. S., Dunham-Cheatham, S. M., David, L. M., and Zhang, L.: Evidence against rapid mercury oxidation in photochemical smog, Environ. Sci. Technol., 56, 11225–11235, https://doi.org/10.1021/acs.est.2c02224, 2022.
Maasakkers, J. D., Jacob, D. J., Sulprizio, M. P., Scarpelli, T. R., Nesser, H., Sheng, J.-X., Zhang, Y., Hersher, M., Bloom, A. A., Bowman, K. W., Worden, J. R., Janssens-Maenhout, G., and Parker, R. J.: Global distribution of methane emissions, emission trends, and OH concentrations and trends inferred from an inversion of GOSAT satellite data for 2010–2015, Atmos. Chem. Phys., 19, 7859–7881, https://doi.org/10.5194/acp-19-7859-2019, 2019.
Mahrt, L.: The early evening boundary layer transition, Q. J. Roy. Meteor. Soc., 107, 329–343, https://doi.org/10.1002/qj.49710745205, 1981.
Mansfield, M. L. and Hall, C. F.: Statistical analysis of winter ozone events, Air Qual. Atmos. Hlth., 6, 687–699, https://doi.org/10.1007/s11869-013-0204-0, 2013.
Mansfield, M. L. and Hall, C. F.: A survey of valleys and basins of the western United States for the capacity to produce winter ozone, J. Air Waste Manage., 68, 909–919, https://doi.org/10.1080/10962247.2018.1454356, 2018.
Mansfield, M. L. and Lyman, S. N.: Winter ozone pollution in Utah's Uinta Basin is attenuating, Atmosphere, 12, 4, https://doi.org/10.3390/atmos12010004, 2020.
Mansfield, M. L. and Lyman, S. N.: Seasonal trends in the wintertime photochemical regime of the Uinta Basin, Utah, USA, Atmos. Chem. Phys., 25, 11261–11274, https://doi.org/10.5194/acp-25-11261-2025, 2025.
NASA Giovanni: The Bridge between Data and Science, https://giovanni.gsfc.nasa.gov/giovanni/, last accessed: 2 May 2024.
Neemann, E. M., Crosman, E. T., Horel, J. D., and Avey, L.: Simulations of a cold-air pool associated with elevated wintertime ozone in the Uintah Basin, Utah, Atmos. Chem. Phys., 15, 135–151, https://doi.org/10.5194/acp-15-135-2015, 2015.
Ninneman, M., Lyman, S., Hu, L., Cope, E., Ketcherside, D., and Jaffe, D.: Investigation of ozone formation chemistry during the Salt Lake Regional Smoke, Ozone, and Aerosol Study (SAMOZA), ACS Earth Space Chem., 7, 2521–2534, https://doi.org/10.1021/acsearthspacechem.3c00235, 2023.
Nogueira, T., Dominutti, P. A., Fornaro, A., and Andrade, M. D. F.: Seasonal trends of formaldehyde and acetaldehyde in the megacity of São Paulo, Atmosphere, 8, 144, https://doi.org/10.3390/atmos8080144, 2017.
Oltmans, S., Schnell, R., Johnson, B., Pétron, G., Mefford, T., and Neely III, R.: Anatomy of wintertime ozone associated with oil and natural gas extraction activity in Wyoming and Utah, Elem. Sci. Anth., 2, 000024, https://doi.org/10.12952/journal.elementa.000024, 2014.
Pang, X. and Mu, Y.: Seasonal and diurnal variations of carbonyl compounds in Beijing ambient air, Atmos. Environ., 40, 6313–6320, https://doi.org/10.1016/j.atmosenv.2006.05.044, 2006.
Saunders, S. M., Jenkin, M. E., Derwent, R. G., and Pilling, M. J.: Protocol for the development of the Master Chemical Mechanism, MCM v3 (Part A): tropospheric degradation of non-aromatic volatile organic compounds, Atmos. Chem. Phys., 3, 161–180, https://doi.org/10.5194/acp-3-161-2003, 2003.
Seinfeld, J. H.: Urban air pollution: state of the science, Science, 243, 745–752, https://doi.org/10.1126/science.243.4892.745, 1989.
Shareef, M., Cho, S., Lyder, D., Zelensky, M., and Heckbert, S.: Evaluation of different chemical mechanisms on O3 and PM2.5 predictions in Alberta, Canada, Appl. Sci., 12, 8576, https://doi.org/10.3390/app12178576, 2022.
Simpson, D., Arneth, A., Mills, G., Solberg, S., and Uddling, J.: Ozone – the persistent menace: interactions with the N cycle and climate change, Curr. Opin. Env. Sust., 9, 9–19, https://doi.org/10.1016/j.cosust.2014.07.008, 2014.
Soares, A. R. and Silva, C.: Review of ground-level ozone impact in respiratory health deterioration for the past two decades, Atmosphere, 13, 434, https://doi.org/10.3390/atmos13030434, 2022.
Stockwell, W. R., Lawson, C. V., Saunders, E., and Goliff, W. S.: A review of tropospheric atmospheric chemistry and gas-phase chemical mechanisms for air quality modeling, Atmosphere, 3, 1–32, https://doi.org/10.3390/atmos3010001, 2011.
United States Environmental Protection Agency (EPA): SPECIATE database browser 5.2 for air emission modeling, https://www.epa.gov/air-emissions-modeling/speciate-0, last accessed: 2 May 2024.
Warneke, C., Geiger, F., Edwards, P. M., Dube, W., Pétron, G., Kofler, J., Zahn, A., Brown, S. S., Graus, M., Gilman, J. B., Lerner, B. M., Peischl, J., Ryerson, T. B., de Gouw, J. A., and Roberts, J. M.: Volatile organic compound emissions from the oil and natural gas industry in the Uintah Basin, Utah: oil and gas well pad emissions compared to ambient air composition, Atmos. Chem. Phys., 14, 10977–10988, https://doi.org/10.5194/acp-14-10977-2014, 2014.
Wilkes, H. (Ed.): Hydrocarbons, oils and lipids: diversity, origin, chemistry and fate, Handbook of Hydrocarbon and Lipid Microbiology, Springer, https://doi.org/10.1007/978-3-319-90569-3, 2020.
Wolfe, G. M., Marvin, M. R., Roberts, S. J., Travis, K. R., and Liao, J.: The Framework for 0-D Atmospheric Modeling (F0AM) v3.1, Geosci. Model Dev., 9, 3309–3319, https://doi.org/10.5194/gmd-9-3309-2016, 2016.
Xiong, Y., Chai, J., Mao, H., Mariscal, N., Yacovitch, T., Lerner, B., and Huang, Y.: Examining the summertime ozone formation regime in Southeast Michigan using MOOSE ground-based HCHO/NO2 measurements and F0AM box model, J. Geophys. Res.-Atmos., 128, e2023JD038943, https://doi.org/10.1029/2023JD038943, 2023.
Yang, J., Zeren, Y., Guo, H., Wang, Y., Lyu, X., Zhou, B., and Zhang, G.: Wintertime ozone surges: the critical role of alkene ozonolysis, Environ. Sci. Ecotechnol., 22, 100477, https://doi.org/10.1016/j.ese.2024.100477, 2024.
Yarwood, G., Jung, J., Whitten, G. Z., Heo, G., Mellberg, J., and Estes, M.: Updates to the Carbon Bond mechanism for version 6 (CB6), in: Proceedings of the 9th Annual CMAS Conference, Chapel Hill, NC, USA, 11–13 October 2010, https://www.cmascenter.org/conference/2010/abstracts/emery_updates_carbon_2010.pdf (last access: 12 July 2026), 2010.
Zaveri, R. A. and Peters, L. K.: A new lumped structure photochemical mechanism for large-scale applications, J. Geophys. Res.-Atmos., 104, 30387–30415, https://doi.org/10.1029/1999JD900876, 1999.