
the Creative Commons Attribution 4.0 License.
the Creative Commons Attribution 4.0 License.
 | 21 Jul 2026
Methanethiol and dimethyl sulfide measurements in seawater and the atmosphere around the Antarctic Peninsula and in the Weddell Sea
Elisabeth S. M. Deschaseaux
Lauriane L. J. Quéléver
David C. S. Beddows
Harald Stark
Veronika Pospisilova
Felipe D. Lopez-Hilfiker
Guillaume Chamba
Karine Sellegri
Elisabet L. Sà
Queralt Güell-Bujons
Magda Vila
Yaiza M. Castillo
Arianna Rocchi
Ana Sotomayor
Dolors Vaqué
Manuel Dall'Osto
Elisa Berdalet
Rafel Simó
Inclusion of methanethiol (MeSH) in global atmospheric chemistry–climate model assessments has shown that MeSH emissions increase SO2, particulate sulfate and aerosol cooling over the Southern Ocean. However, measurements in the Southern Ocean are sparse. In February and March 2023, we deployed three online high-resolution mass spectrometers to measure MeSH and dimethyl sulfide (DMS) in seawater (down to 100 m in depth) and air during a cruise on the west side of the Antarctic Peninsula and in the Weddell Sea. MeSH concentrations in surface seawater (mean 0.5, range 0.11 to 1.7 nmol dm−3) were within the range previously reported for polar and subpolar regions. Considering concurrent DMS seawater concentrations (mean 1.6, range 0.45 to 11.3 nmol dm−3), MeSH represented 28±8 % of the ocean's volatile methylated sulfur (VMS = DMS + MeSH). Depth profiles of MeSH showed higher concentrations in the euphotic layer. Sea to air fluxes of MeSH (mean 0.9, range 0.03 to 4.3 µmol m2 d−1) were comparable to those of DMS (mean 1.7, range −0.6 to 8.6 µmol m2 d−1). Ambient air MeSH (mean 0.015, range 0.001 to 0.060 ppbv) was low and similar to other observations. Air DMS concentrations were about a factor of 10 higher than MeSH (mean 0.25, range 0.008 to 1.35 ppbv) and there was excellent agreement between two different instruments using different ionization chemistries. MeSH seawater concentrations, sea–air fluxes, and atmospheric mixing ratios displayed depletion during daytime. Overall, this dataset represents a useful resource for model integration and validation.
- Article
(6295 KB) - Full-text XML
-
Supplement
(1212 KB) - BibTeX
- EndNote


The Southern Ocean is a region of rapid climatic change that impacts the regional ocean biogeochemistry (Henley et al., 2020) and biology (Petrou et al., 2016), which, in turn, elicit feedback impacts on climate. At the same time, the Southern Ocean is a region of consistent radiative model bias, where models underpredict the true amount of aerosol-related cooling due to cloud cover and radiation scattering (Mallet et al., 2023). This leads to large uncertainties in global climate models and local weather predictions (Fiddes et al., 2022). In particular, summertime measured aerosol concentrations are consistently higher than models suggest (Schmale et al., 2019). This could be due to an under representation in the models of natural marine aerosol forming processes (McCoy et al., 2015), such as through sulfuric acid and methane sulfonic acid production from the oxidation of ocean-derived dimethyl sulfide (DMS, Hossain et al., 2024). Alternatively, it could be due to missing formation pathways involving other species, such as organics, iodine or amines (He et al., 2026). Scaling of methanethiol (MeSH) to DMS, using in situ measurements, has shown that the sea–air flux of methanethiol (MeSH) makes a hitherto overlooked, substantial contribution to the Southern Ocean atmospheric sulfate burden (Tashmim et al., 2025), and subsequent atmospheric chemistry–climate modelling suggests that the inclusion of MeSH emissions reduces a small proportion of the radiative bias (Wohl et al., 2024).
The distribution of MeSH in the surface ocean remains poorly described, largely due to a paucity of measurements which hampers our understanding of the biogeochemical cycling of this compound. Dimethylsulfoniopropionate (DMSP) is the common precursor of MeSH and DMS (Kiene, 1996). DMSP is produced in the surface ocean by plankton and enhanced under specific settings of community composition and environmental conditions (Hopkins et al., 2023). DMSP is released mainly by the mortality of phytoplankton cells, especially during viral lysis or sloppy grazing by zooplankton (Archer et al., 2002; Stefels et al., 2007). Once in the water column, bacteria rapidly take up DMSP and either assimilate its sulfur into proteins (Kiene et al., 1999), with intermediate production and leakage of MeSH, or break it down into DMS (Bürgmann et al., 2007; Sun et al., 2016; Hopkins et al., 2023; Wohl et al., 2023a). Studies have shown that the microbial switch (Simó, 2001) gives rise to variable proportions of DMS or MeSH as intermediate or final products of DMSP catabolism, and have suggested that DMSP availability relative to bacterial sulfur demands for growth act as the main driver for this variability (Kiene et al., 2000). Genetic studies (Landa et al., 2019; Hopkins et al., 2023) and experiments with radiolabelled DMSP (Kiene and Linn, 2000) have shown that the route through MeSH dominates bacterial DMSP catabolism over most of the ocean. On the other hand, many high DMSP-producing phytoplankton, notably dinoflagellates and haptophytes (including bloom-forming polar species of Phaeocystis), (Schoemann et al., 2005; Vaqué et al., 2025) preferentially cleave DMSP into DMS (Hopkins et al., 2023).
The largest sink for MeSH and DMS in the surface ocean is thought to be biological consumption by bacteria, giving MeSH a lifetime in the surface ocean on the order of hours (Kiene and Linn, 2000), compared to 0.5–2 d for DMS (Galí and Simó, 2015). Some of the DMSP, DMS and MeSH produced in the euphotic zone sink down into the water column, where it is thought to be consumed by bacteria (Teng et al., 2021; Wohl et al., 2022). The abiotic sinks for MeSH are poorly understood. MeSH has been shown to be photochemically degraded, possibly into carbonyl sulfide (OCS) (Flöck and Andreae, 1996; Ulshöfer et al., 1996). Additionally, fast reactions with dissolved organic matter (Kiene, 1996) and chelation with dissolved metals (Bjørklund et al., 2019) represent hitherto unquantified sinks for MeSH in the surface ocean and throughout the water column. Due to fast biological incorporation and the abiotic losses, surface ocean dissolved MeSH concentrations are generally lower than those of DMS, although episodes of MeSH dominating the volatile methylated sulfur pool have been observed (Kettle et al., 2001; Kiene et al., 2021; Gros et al., 2023; Deschaseaux et al., 2025).
A small fraction of MeSH and DMS produced in the surface ocean is ventilated to the atmosphere as a function primarily of wind speed. Once in the air, DMS is mostly oxidised by the day time oxidant radical OH (Fung et al., 2022). The reaction of MeSH with OH is 2–5 times faster than that of DMS (Lawson et al., 2020; Novak et al., 2022), contributing to the generally lower abundance of MeSH in the atmosphere compared to DMS. MeSH is oxidized in several steps into SO2 while DMS is oxidized into SO2 and methanesulfonic acid (Novak et al., 2022; Jacob et al., 2024). The final oxidation products of DMS and MeSH, namely sulfuric acid and methanesulfonic acid, could lead to new particle formation and particle growth (Ishino et al., 2026). These particles contribute to the cloud condensation nuclei (CCN) budget and therefore ultimately impact aerosol-related cooling globally and especially over the remote Southern Ocean where background aerosol concentrations are low and episodically high biological productivity provides a strong marine sulfur source (Hodshire et al., 2019).
Here we present measurements of MeSH and DMS in surface seawater, along the water column down to 100 m, and in ambient air around the Antarctic Peninsula and in the northern Weddell Sea. Using measurements in air and water, we calculate two-layer sea–air fluxes. We explore the potential links between the MeSH and DMS distribution patterns and our observations of concurrent biological and biogeochemical measurements. A better understanding of the factors influencing MeSH and DMS in this region will foster a process-based understanding of their cycling and more informed projections of how their emissions will evolve in a changing climate. The concentration and emission patterns described here are also useful resources for chemistry–climate models that should attempt to fix radiative biases in this climate-relevant region.
2.1 Cruise overview
The POLAR-CHANGE (Aerosol Emissions from POLAR CHANGing Environments) cruise was conducted on board the BIO Hespérides (A33) from 14 February to 17 March 2023. Figure 1 shows the ship track below 60° S. The vessel serviced research bases in the South Shetland Islands before commencing a transect southwards on the western side of the Antarctic Peninsula. It traversed the Gerlache Strait and chose a more open ocean pathway south of 65° to arrive at Rothera Research station on Adelaide Island. From there, the vessel retraced its pathway northwards to go via Esperanza (Hope) Bay to the Weddell Sea. Then it traversed among multiple ice floes to encounter floating ice strips detached from the sea ice edge of the Weddell Sea during a record low sea ice year in 2023. Multiple Conductivity Temperature Depth (CTD) profiles were carried out in the northern Weddell Sea, the locations of which are indicated in Fig. 1. The ship then carried out a transect part way towards the South Orkney Islands and back to Marambio Island where it remained until the end of sampling.
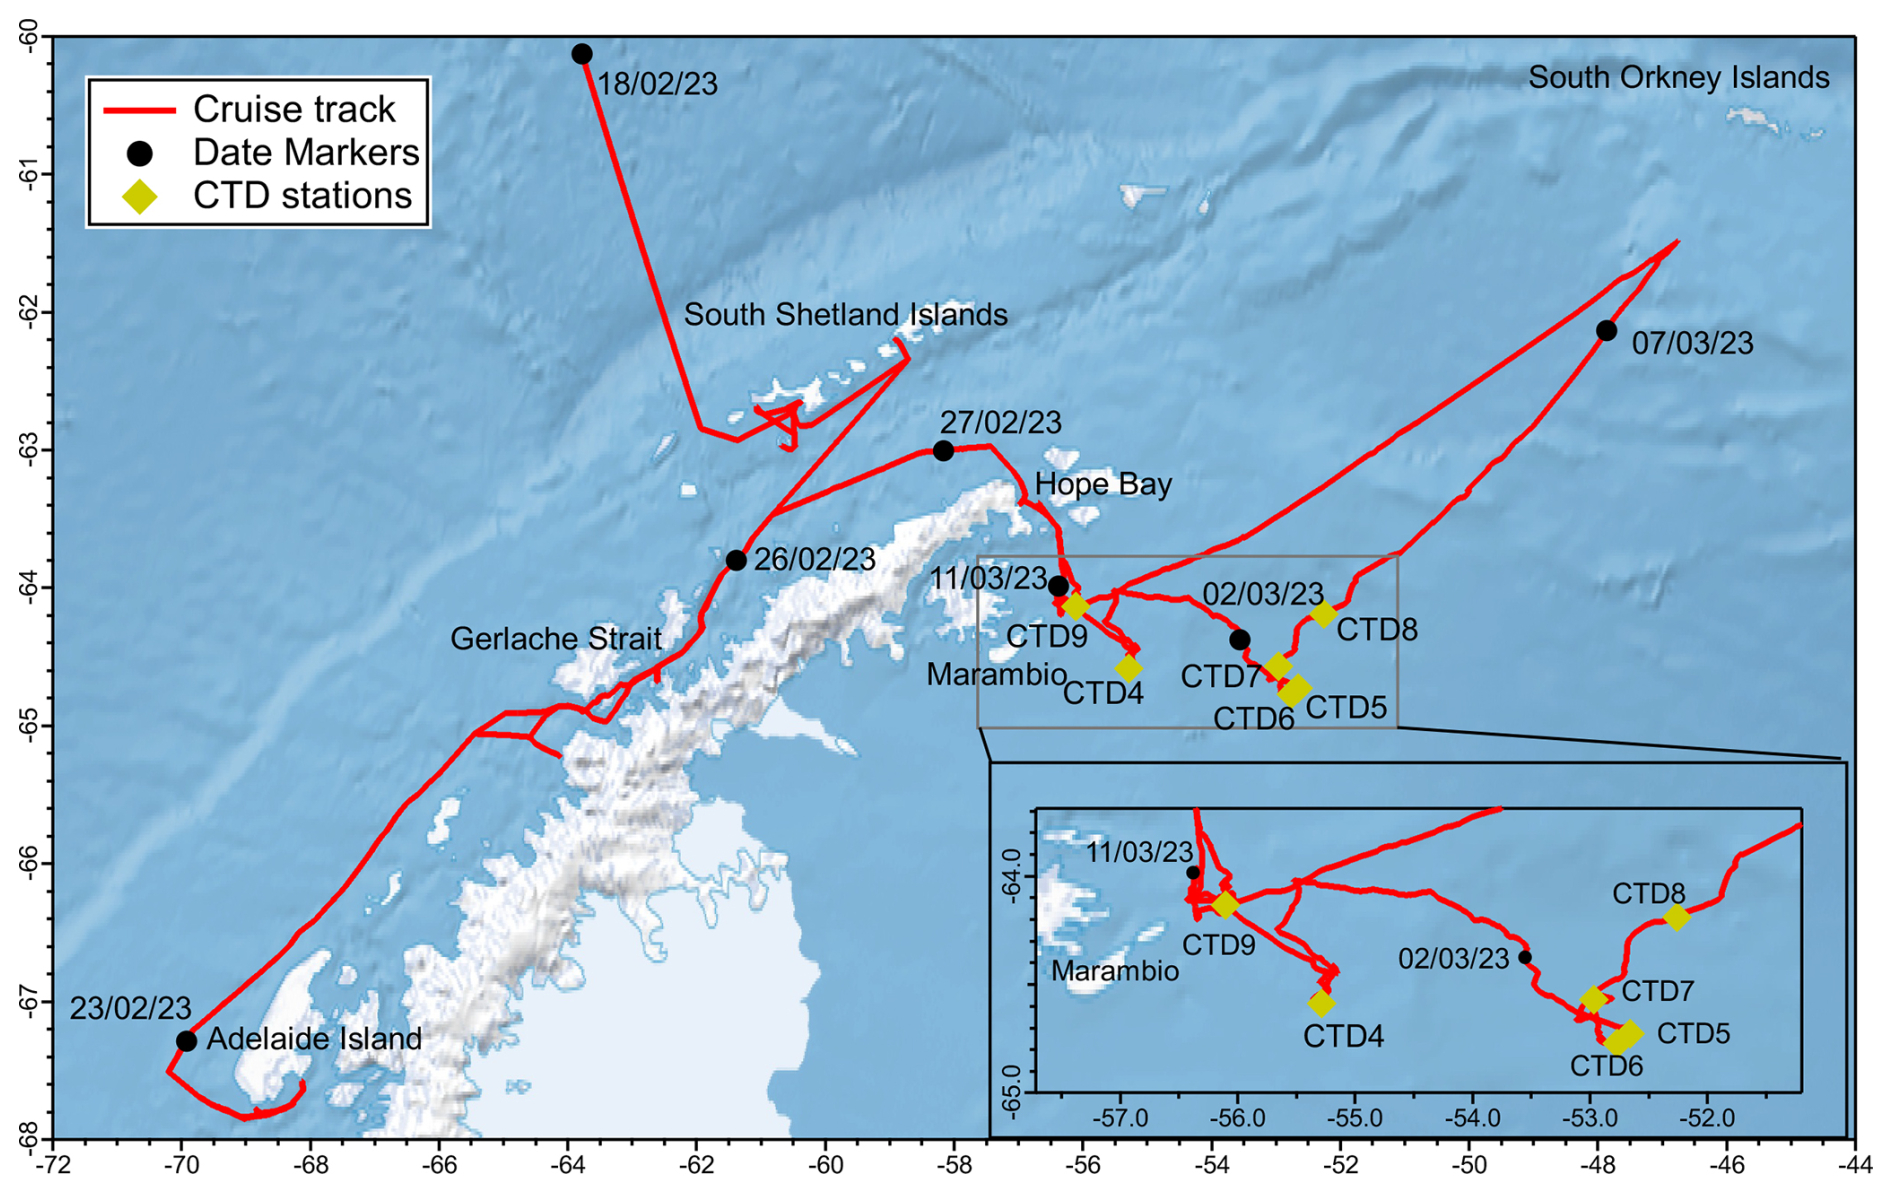
Figure 1Map showing the cruise track with date markers and the locations of the CTD samples discussed in this paper. The box shows an expanded view of the Weddell Sea. Map created from public GIS data found at Natural Earth (https://www.naturalearthdata.com/, last access: 8 May 2020).
Sea surface temperature (SST, °C) and sea surface salinity (SSS, g dm−3) were measured every 5 s in seawater from the underway water inlet of the ship located at 4 m depth (Fig. 2a). Measurements are averaged to 1 h in Fig. 2a. There was good agreement between the underway SST and SSS and the CTD sensors (SeaBird SB21), confirming that the underway sensors were well calibrated. Bathymetry data (Fig. 2b) were obtained by matching measurement coordinates with the General Bathymetric Chart of the Oceans (https://gebco.net/data_and_products/gridded_bathymetry_data/, last access: 5 June 2025; GEBCO_2023 sub ice topo, last accessed June 2025). Underway seawater chlorophyll related fluorescence was measured every 5 s and is averaged to 1 h in Fig. 2c. The fluorescence measurements were calibrated for total chlorophyll a (Chl a) concentration by frequent (every 6 h, using only nighttime data) discrete measurements of Chl a extracted in acetone using the onboard Turner 10AU fluorometer, calibrated with a spinach derived chlorophyll standard (Sigma C5357) and verified with a Beckton–Dickinson spectrophotometer (Fig. 2c). We also simultaneously measured Chl a concentration in seawater samples passed through a 3 µm filter, to estimate the contribution of the smallest size photosynthetic organisms (<3 µm).
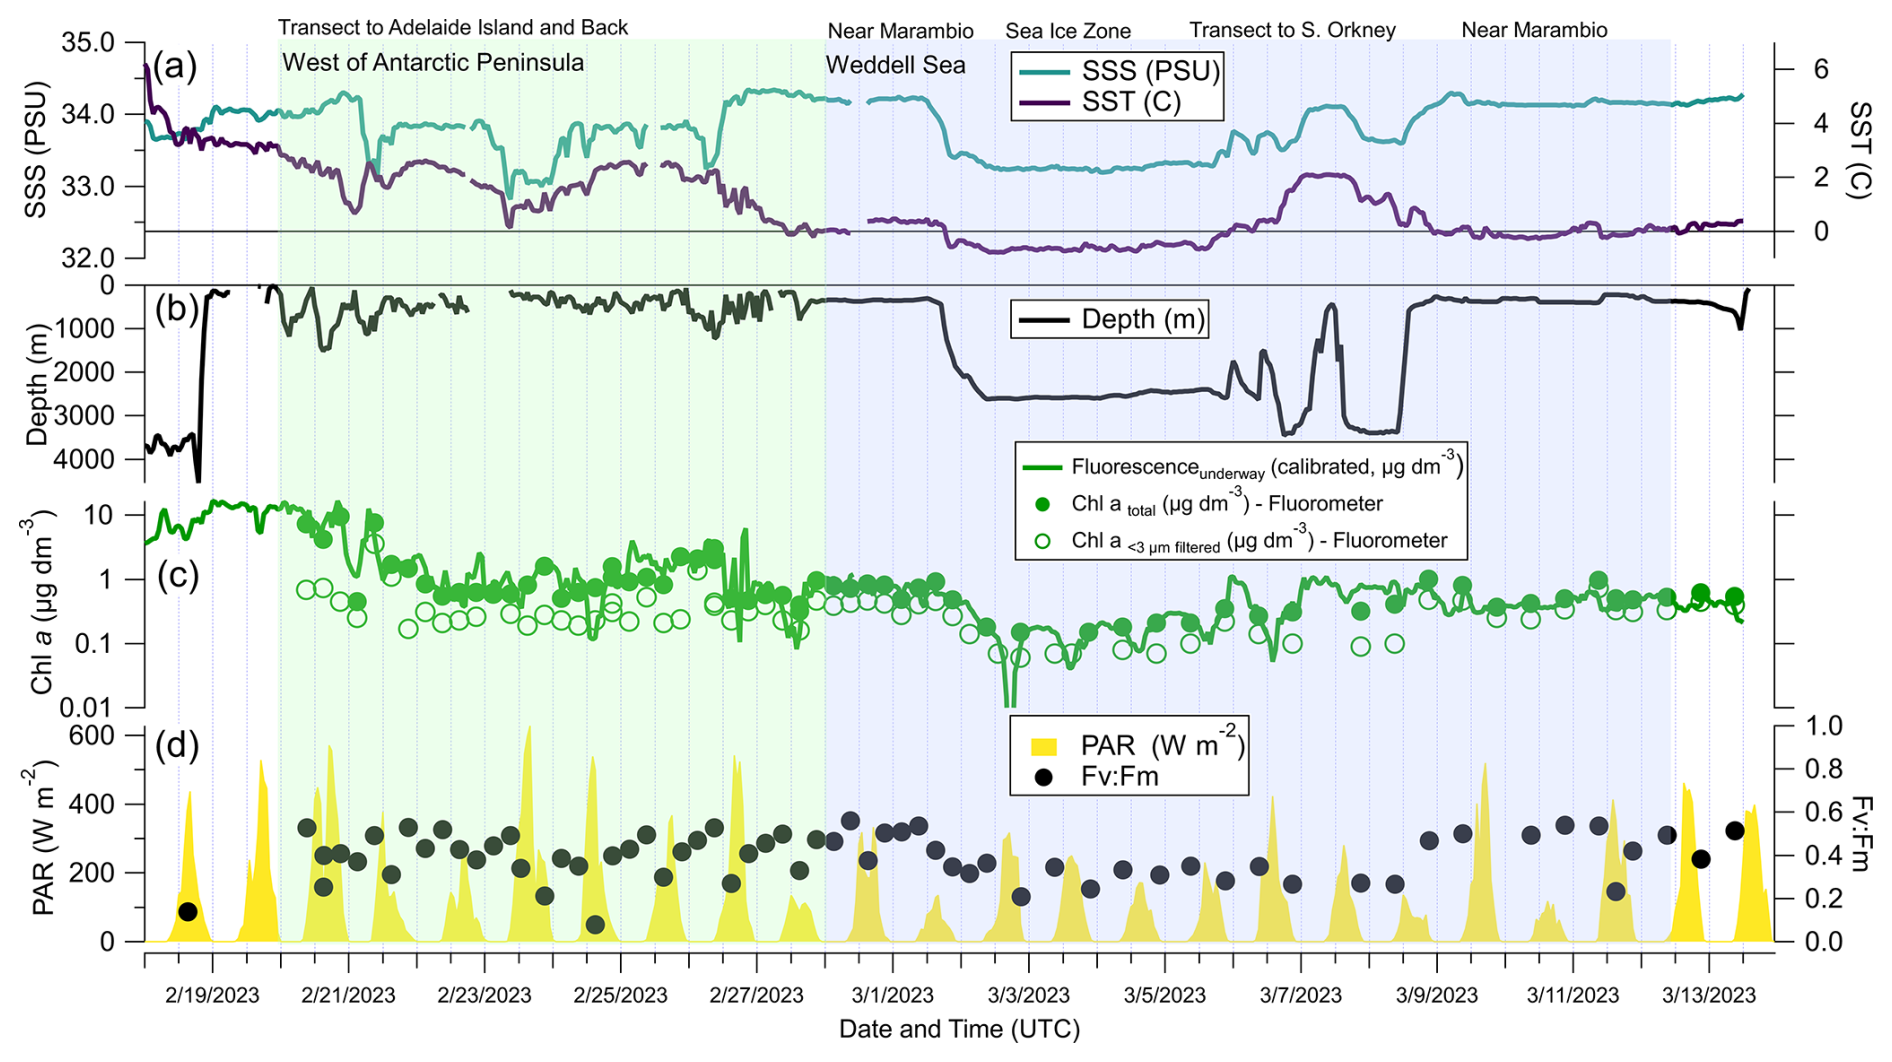
Figure 2(a) Underway surface seawater salinity (SSS) and temperature (SST), (b) sea depth, (c) underway surface seawater fluorescence calibrated to the discrete fluorometer measurements of total Chl a, and the Chl a concentration in the <3 µm size fraction plotted on a log scale, and (d) photosynthetic active radiation (PAR) and Fv:Fm, a measure of photosynthetic efficiency. Green shaded area indicates when the ship was west of the Antarctic Peninsula and blue shaded area indicates when the ship was in the Weddell Sea.
2.2 Biological measurements
Biological and biogeochemical measurements were conducted every 6 h over most of the cruise at 06:00, 12:00, 18:00 and 24:00 LT. A brief overview of the methodology is presented here while extensive details are given in Rocchi et al. (2025). Seawater samples were collected from the underway water inlet for the estimation of bacterial (2.0 cm3, preserved with 1 % paraformaldehyde plus 0.05 % glutaraldehyde, final concentration) and pico- and nano-phytoplankton (5.0 cm3, preserved with 1 % glutaraldehyde, final concentration) cell abundances. All samples were stored at −80 °C until analysis at the ICM-CSIC within 5 months. A Cytoflex flow cytometer was used for estimation of bacterial number and a CyFlow Cube 8 (Sysmex) was used for pico- and nano-plankton abundances. Photochemical efficiency of photosystem II (Fv:Fm) was measured on board using a Mini-FIRe fast repetition fluorometer (Gorbunov et al., 2020). Seawater samples for this analysis were collected into a 25 cm3 quartz cuvette and analysed immediately, without dark acclimation. Fv:Fm varies based on phytoplankton population composition in an unpredictable way, but for a given population composition, a low Fv:Fm ratio is thought to indicate phytoplanktonic light stress as an average across the population (Tan et al., 2019).
Total DMSP (DMSPt) samples were collected unfiltered from the underway seawater inlet in ∼30 mL borosilicate serum vials. Following Kinsey and Kieber (2016), the uncapped vials were individually heated by microwave until they began to boil. After the first bubble formed, the microwave was stopped and the vial was left to cool. Subsequently, 30 µL of 37 % HCl (Analytical Grade) were added to each vial to remove the DMS present and preserve the DMSP. Acidified samples were stored at room temperature in the dark. Within 6 months after the cruise, DMSPt was converted to DMS by alkaline hydrolysis with NaOH for at least 24 h. The resulting DMS was quantified with a cryogenic purge and trap system coupled to a Thermo Fisher TRACE 1300 gas chromatograph with flame photometric detection following Masdeu-Navarro et al. (2022).
2.3 Seawater MeSH and DMS measurements
Seawater concentrations of MeSH and DMS were measured with a Vocus PTR (Aerodyne Research/Tofwerk AG, SN P4Q-188) installed in one of the laboratories in the hull of the ship with access to an underway seawater tap and have been reported previously in Wohl et al. (2024). Here we report updated analysis and additional measurements of depth profiles. A segmented flow coil equilibrator (SFCE) (Wohl et al., 2019) was used to extract gases from seawater into zero air carrier gas (generated by a Pt catalyst zero air generator, Tofwerk AG) which was then measured by the Vocus PTR. As in previous deployments of the SFCE (e.g., Wohl et al., 2023b), for underway sampling the inlet of the equilibrator was used to draw seawater from the underway tap via the bottom of a slightly overflowing glass bottle. For discrete samples (e.g., from the CTD), the SFCE sampled from the bottom of a 500 cm3 bottle. Further details on cruise specific operation, calibrations and calculating dissolved concentrations are provided in the Supplement (Sects. S1–S2).
Seawater MeSH concentrations are not reported for the first part of the cruise due to bacterial growth in the SFCE causing unrealistically high concentrations (Sect. S3). This issue was dealt with by daily rinsing of the tubing with 3.7 % HCl. Thereafter, we checked for bacterial growth in the SFCE and the underway seawater supply lines of the ship by comparisons to concentrations measured in the 5 m Niskin bottle from the CTD casts. Both MeSH and DMS agreed well between the underway seawater supply and the 5 m Niskin bottle indicating that biofouling and contamination were minimal (Sect. S4).
2.4 Ambient air MeSH and DMS measurements
Gas-phase concentrations of MeSH and DMS were measured with a Vocus PTR (Aerodyne Research/Tofwerk AG, SN P4Q-171) installed in the cabin of the chief scientist, located just under the bridge of the BIO Hespérides. A hole was bored through the wall facing the bow (front) at about 12 m above the sea surface. A downward facing 90° bent metal tube was mounted on the outside to prevent sea spray and precipitation entering the room. A main sampling line of 1.3 cm outer diameter (OD) PFA tubing was passed through the metal tube to sample outside air. The main sampling line carried a sample flow of 14 dm3 min−1. After 1.5 m, the main sampling line was split in two, with 8 dm3 min−1 flowing through a 0.95 cm OD, 1.1 m long PFA line to the Vocus PTR. The Vocus PTR subsampled 250 cm3 min−1 through a 250-mm inner diameter (ID) capillary. The estimated residence time in the sampling line was 0.7 s and flow was close to laminar. Calibrations with a standard gas mixture containing DMS were performed every 4 h with zeros using a Pt catalyst zero air generator (Tofwerk AG) before and after each calibration. Calibration for MeSH using a permeation tube was performed after the campaign (Vici, emission rate of 103.8 ng min−1 at 40 °C, held in a perm tube oven at 40 °C, diluted with 2 to 5 slpm of zero air). Data was acquired at 1 Hz and averaged to 1 min before being analysed with Tofware 4.0.2. Due to the low ambient concentrations of DMS and MeSH, careful peak fitting was required to remove interferences from background compounds at nominal 49 and 63. Further details on the analysis are provided in the Supplement (Sect. S5).
Gas-phase DMS was also measured with the benzene cation channel of a fast polarity switching high-resolution time-of-flight chemical ionization mass spectrometer (Vocus B, Aerodyne Research, SN P4B-002) (Aggarwal et al., 2025; Chang et al., 2026). The Vocus B switches every 0.5 s between two different polarity mass spectrometers and between two different vacuum ultraviolet (VUV) ion sources, one generating benzene cations and iodide anions and the other generating acetone cations and O2 anions. At the split in the main sampling line, a 1.3 cm OD, 0.1 m long PFA tube carried 6 dm3 min−1 to the Vocus B inlet. The Vocus B subsampled 1.5 dm3 min−1 through a 0.5 mm pinhole into the Adduct Ionization Mechanism (AIM) reactor held at a fixed pressure between 85 and 95 mbar. The inlet was zeroed every 4 h with dry gas from a nitrogen generator (LNI). Calibration for DMS was performed after the campaign using the same calibration gas as for the Vocus PTR. The calibrations were conducted over a range of relative humidities (RH) and used to correct the data for changes in sensitivity due to changes in water vapor concentration in the AIM reactor. In particular, the difference in sensitivity between the dry zeros and the ambient measurements (RH 46 to 100 %) needed to be accounted for in the calibrations. The sensitivity also depends on the pressure in the AIM reactor and calibrations were performed at the three pressures used during the campaign to correct for this. The data was acquired at 0.5 Hz and averaged to 1 min before being analysed with Tofware 4.0.2. We were not able to detect MeSH with the Vocus B.
Gas-phase ambient concentrations of MeSH and DMS were additionally measured with a quadrupole PTR (Ionicon) as part of experiments with two Air-Sea Interface Tanks (ASITs) located on a rear deck. These measurements are described in detail in Chamba et al. (2026).
2.5 Calculations of sea–air flux
Sea–air fluxes were calculated using the two layer model (Liss and Slater, 1974) with the equation
where Flux (µmol m−2 d−1) is the sea–air flux, Kw (cm h−1) is the total transfer velocity from the sea to the air, Cw (nmol dm−3) is the concentration in the seawater, Ca (nmol dm−3) is the concentration in air and H is the unitless Henry's law solubility for water over air. The solubilities for DMS and MeSH are from Sander (2023), scaled to measured seawater temperature and salinity. The factor of 0.24 converts the units on the right-hand side of the equation to the units on the left-hand side. Kw is calculated as
where kw (cm h−1) is the water side transfer velocity and ka (cm h−1) is the air side transfer velocity. kw is a function primarily of windspeed and secondarily of the waterside Schmidt number which is in turn a function of SST and diffusivity. kw is calculated from
where k660 is kw at a Schmidt number (Sc) of 660 and is based on a linear fit to data for DMS versus windspeed over the Southern Ocean presented in Table 2 of Yang et al. (2011) with k660 set equal to 1.1 for windspeeds less than 2 m s−1. The Schmidt number for DMS is calculated as in Wanninkhof (2014). The Schmidt number for MeSH is calculated with the supplementary R code provided in Johnson (2010). The air side transfer velocity (ka) is calculated using the parametrisation by Yang et al. (2013b), where the friction velocity was calculated as per Johnson (2010). Apparent wind speed (m s−1) was measured on the BIO Hespérides at a height of 27.3 m and converted to true wind speed (TWS, m s−1) using the data for ship speed and direction. TWS was converted to a height of 10 m using the equation in Hsu et al. (1994). Despite the vessel spending some time in the sea ice zone of the Weddell Sea, we did not explicitly account for suppression of gas transfer due to sea ice because sea ice cover was generally less than 15 %.
3.1 Seawater concentrations of MeSH and DMS
Figure 3 shows underway (4 m) seawater DMS and MeSH concentrations averaged to 1 h. DMS concentrations ranged from 0.45 to 11.3 nmol dm−3, with an average of 1.6 nmol dm−3, which are similar to previous measurements in the region at this time of year (Wohl et al., 2020; Zhang et al., 2020) and close to the climatological range for March of 1–3 nmol dm−3 (Hulswar et al., 2022). Higher DMS concentrations are typically observed earlier in the season (December to early February, Hulswar et al., 2022). As in previous studies (e.g., Webb et al., 2019), we observed a few localized episodes of much higher than average hourly DMS concentrations (>8 nmol dm−3). The estimated uncertainty for DMS is ± 20 % (Sect. S2). Additional statistics, such as median, standard deviation, 25th percentile and 75th percentile, are given in Table S1 in the Supplement for the seawater and air measurements presented here.
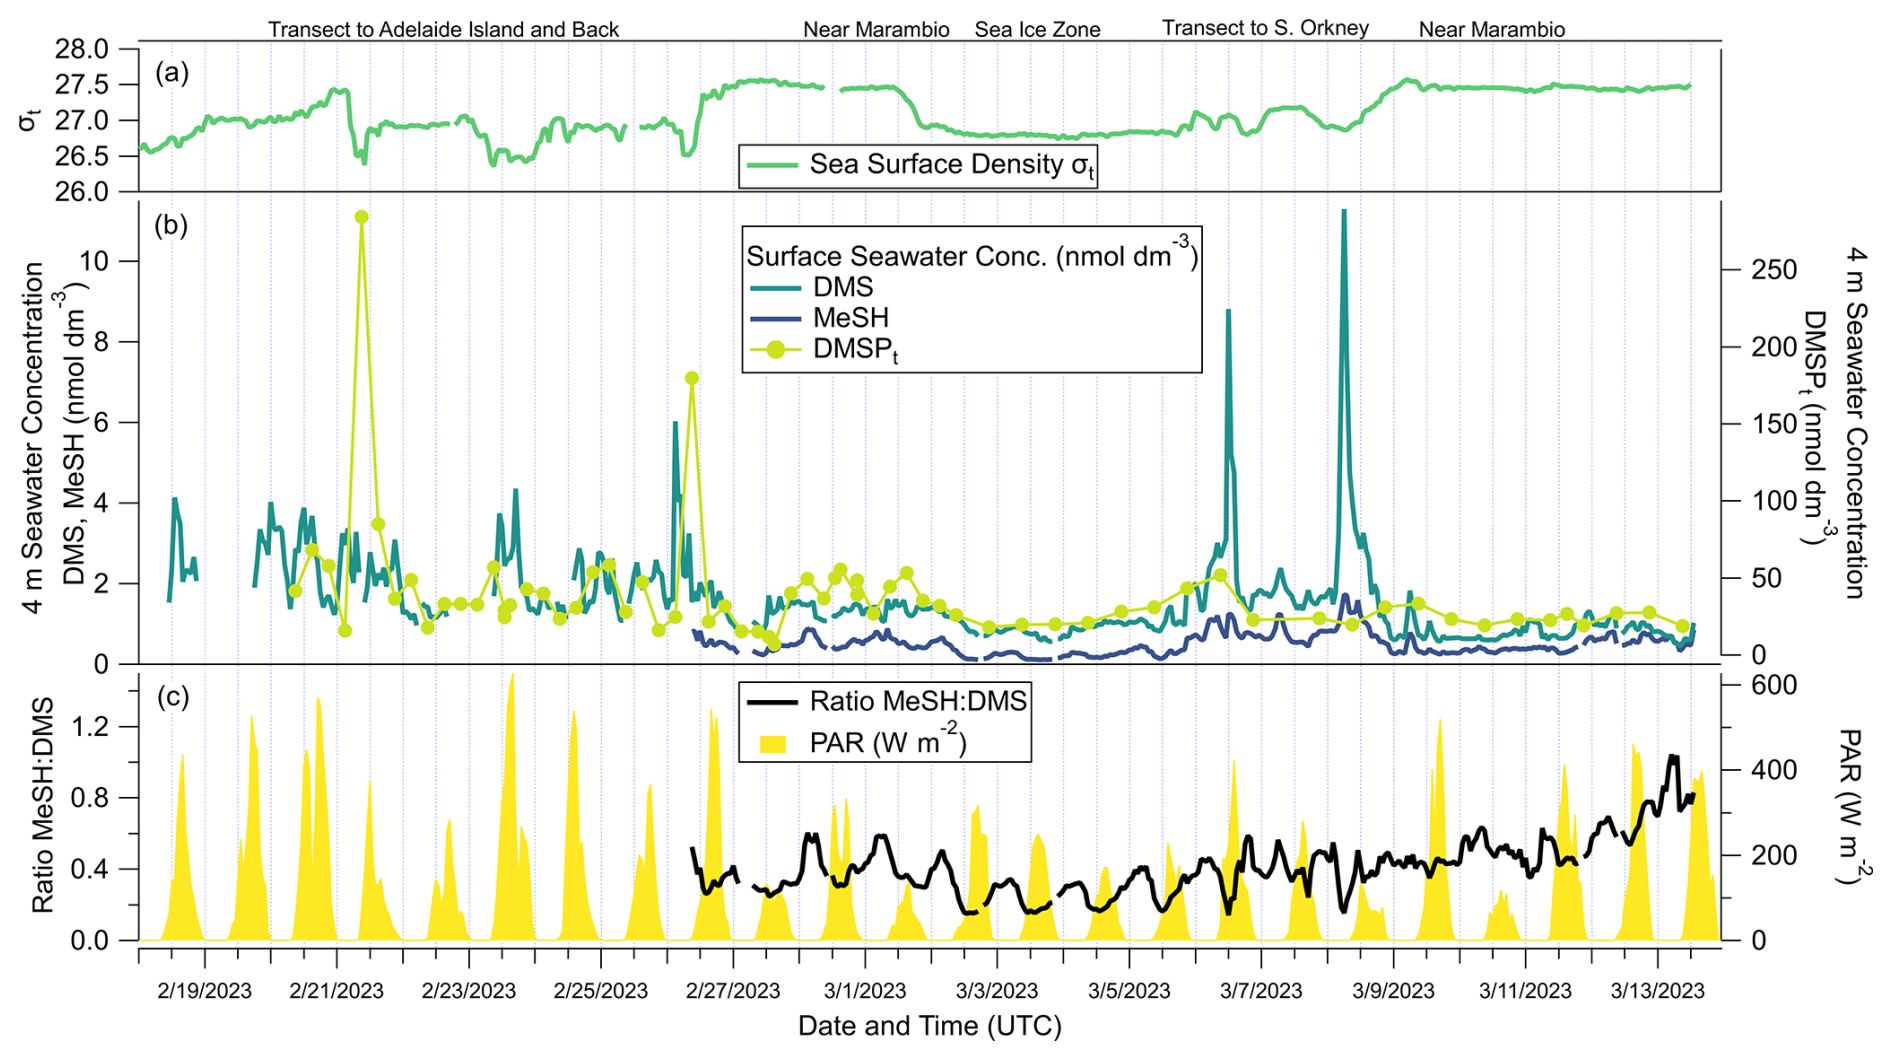
Figure 3(a) Sea surface density, (b) surface seawater concentrations of MeSH, DMS, and DMSPt and (c) the ratio of MeSH : DMS from the continuous underway seawater inlet. PAR is also shown in (c).
The hourly seawater MeSH concentrations ranged from 0.11 to 1.7 nmol dm−3, with an average of 0.5 nmol dm−3, though this measurement has an estimated uncertainty of ± 30 % (Sect. S2). This average concentration was somewhat higher than average measurements across the Atlantic of 0.39 nmol dm−3 (Kettle et al., 2001), near the Mediterranean coast of 0.3 nmol dm−3 (Wohl and Simó, 2024) and in the Great Barrier Reef of 0.49 in 2021 and 0.34 nmol dm−3 in 2022 (Deschaseaux et al., 2025). These MeSH concentrations were lower than measurements in the Arctic of 2.96 nmol dm−3 for polar water (Gros et al., 2023) and similar to measurements in the sub-Arctic of 0.57 nmol dm−3, average of cruise OC1607 and OC1708 (Kiene et al., 2021), where episodes of higher than 1.5 nmol dm−3 MeSH were also observed.
The mean seawater MeSH:DMS ratio was 0.41 (range 0.14 to 1.0), which was higher than in warmer ocean regions, where it has been reported to range from 0.05 to 0.3 (Kettle et al., 2001; Gros et al., 2023; Wohl and Simó, 2024; Deschaseaux et al., 2025). Expressed as a percentage of volatile methylated sulfur (VMS = MeSH + DMS), MeSH represents a substantial (28 ± 8 %) portion of the surface ocean VMS in Antarctic waters in late summer. Between 6 and 8 March 2023, during the transect towards the South Orkney Islands, two brief episodes were encountered of high seawater DMS where concentrations increased by ten times with respect to the background levels to reach 8.8 and 11.3 nmol dm−3. During these two episodes, seawater MeSH concentrations also increased but only by factors of 1.5–3. In other words, there was episodic decoupling between the two compounds, where large DMS increases were not accompanied by proportional increases in MeSH. The lowest seawater MeSH concentrations (∼ 0.3 nmol dm−3) and MeSH:DMS ratios (<0.4) were observed between 2 and 5 March in the Weddell Sea near sea ice floes, in agreement with lower MeSH concentrations encountered previously near the sea ice in the Arctic (Gros et al., 2023). These commonalities suggest conditions of lower MeSH production (or enhanced MeSH loss) in low productivity waters near sea ice in polar regions.
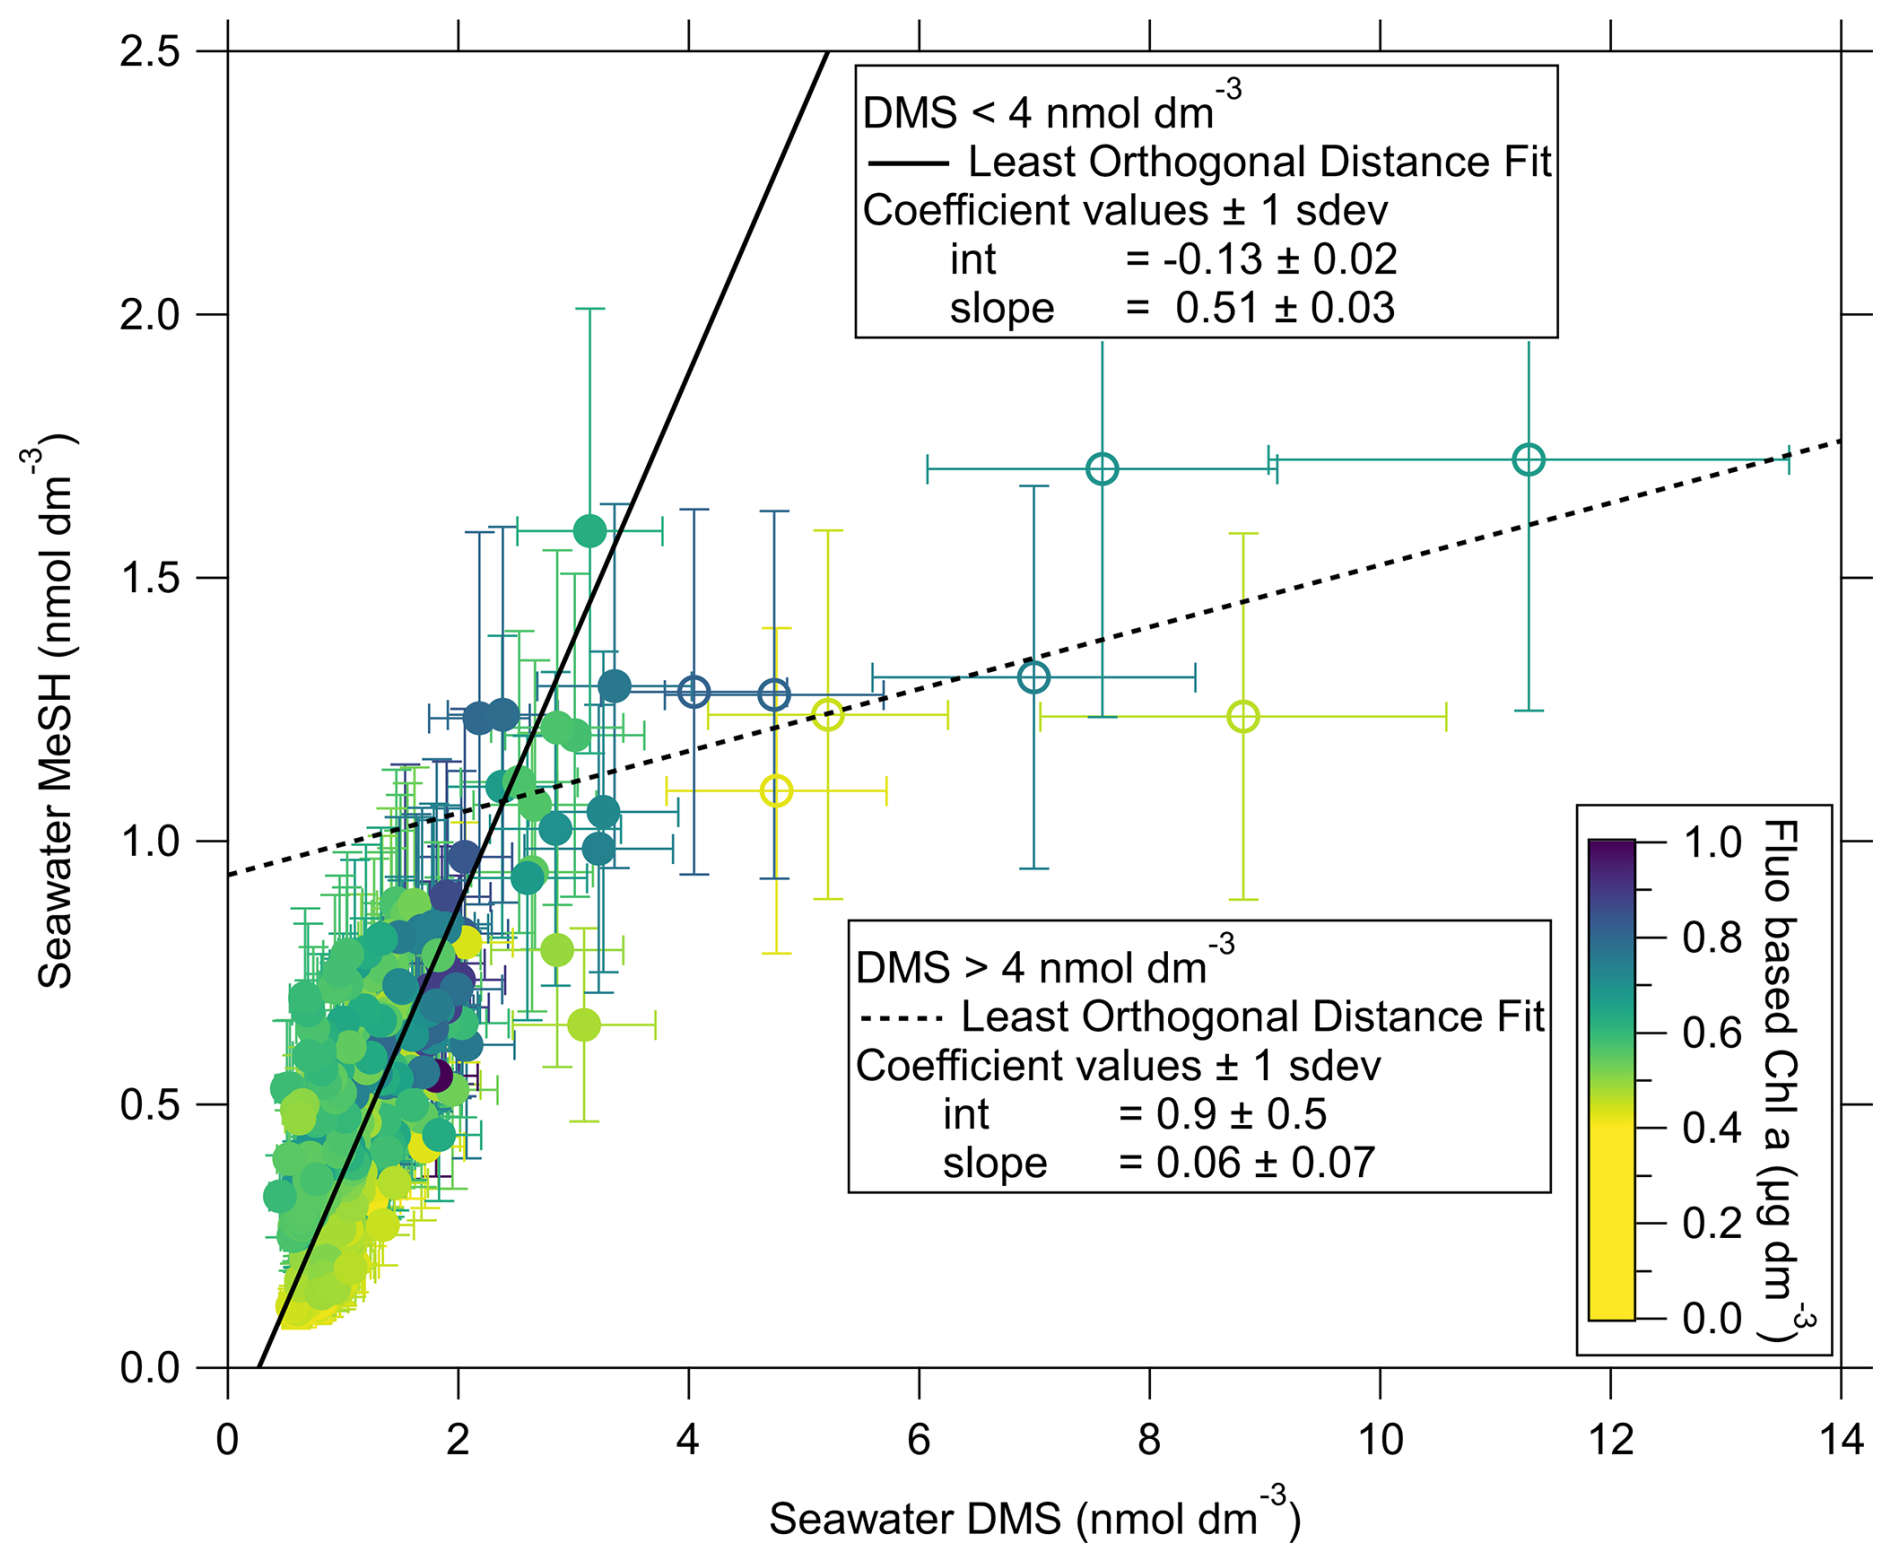
Figure 4 shows seawater MeSH plotted against seawater DMS with the points coloured by Chl a (from the continuous fluorescence-based measurement). The error bars indicate the estimated uncertainty of ± 20 % in DMS and ± 30 % in MeSH (Sect. S2 in the Supplement). The regression between the two compounds displays different behaviour at higher and lower DMS concentrations. Focussing on data collected at lower DMS concentrations (<4 nmol dm−3), the two compounds are positively correlated with a Pearson r of 0.8. This tight correlation between MeSH and DMS in surface seawater for the majority of the measurement points (98 % of the points in Fig. 4 have less than 4 nmol dm−3 DMS) suggests that the sources and sinks of these two compounds are tightly coupled and similarly balanced. Since the dominant known source of MeSH in surface seawater is bacterial DMSP demethylation (Kiene and Linn, 2000), and that of DMS is algal and bacterial DMSP cleavage (Kiene and Linn, 2000; Hopkins et al., 2023), this result suggests that the biological community dominating the Southern Ocean and Weddell Sea at the time of sampling was capable of undertaking both DMSP degradation pathways.
3.2 Depth profiles of MeSH and DMS
Figure 5 shows average depth profiles of MeSH and DMS taken during 6 CTD casts between 28 February and 9 March in the Weddell Sea. Two of the CTD casts (CTD 4 and 9) were taken at 09:00–10:00 solar time (approximately 4 h after sunrise), while the other four casts (CTD 5–8) were taken at 17:00–18:00 solar time (approximately 1 h before sunset). The mid-morning casts may represent the accumulated conditions over the night, while the late afternoon casts represent accumulated conditions during the day. This grouping of the CTD casts also splits them by location, as the morning casts were closer to land and with no ice present, while the afternoon casts were located in the Weddell Sea near sea ice floes.
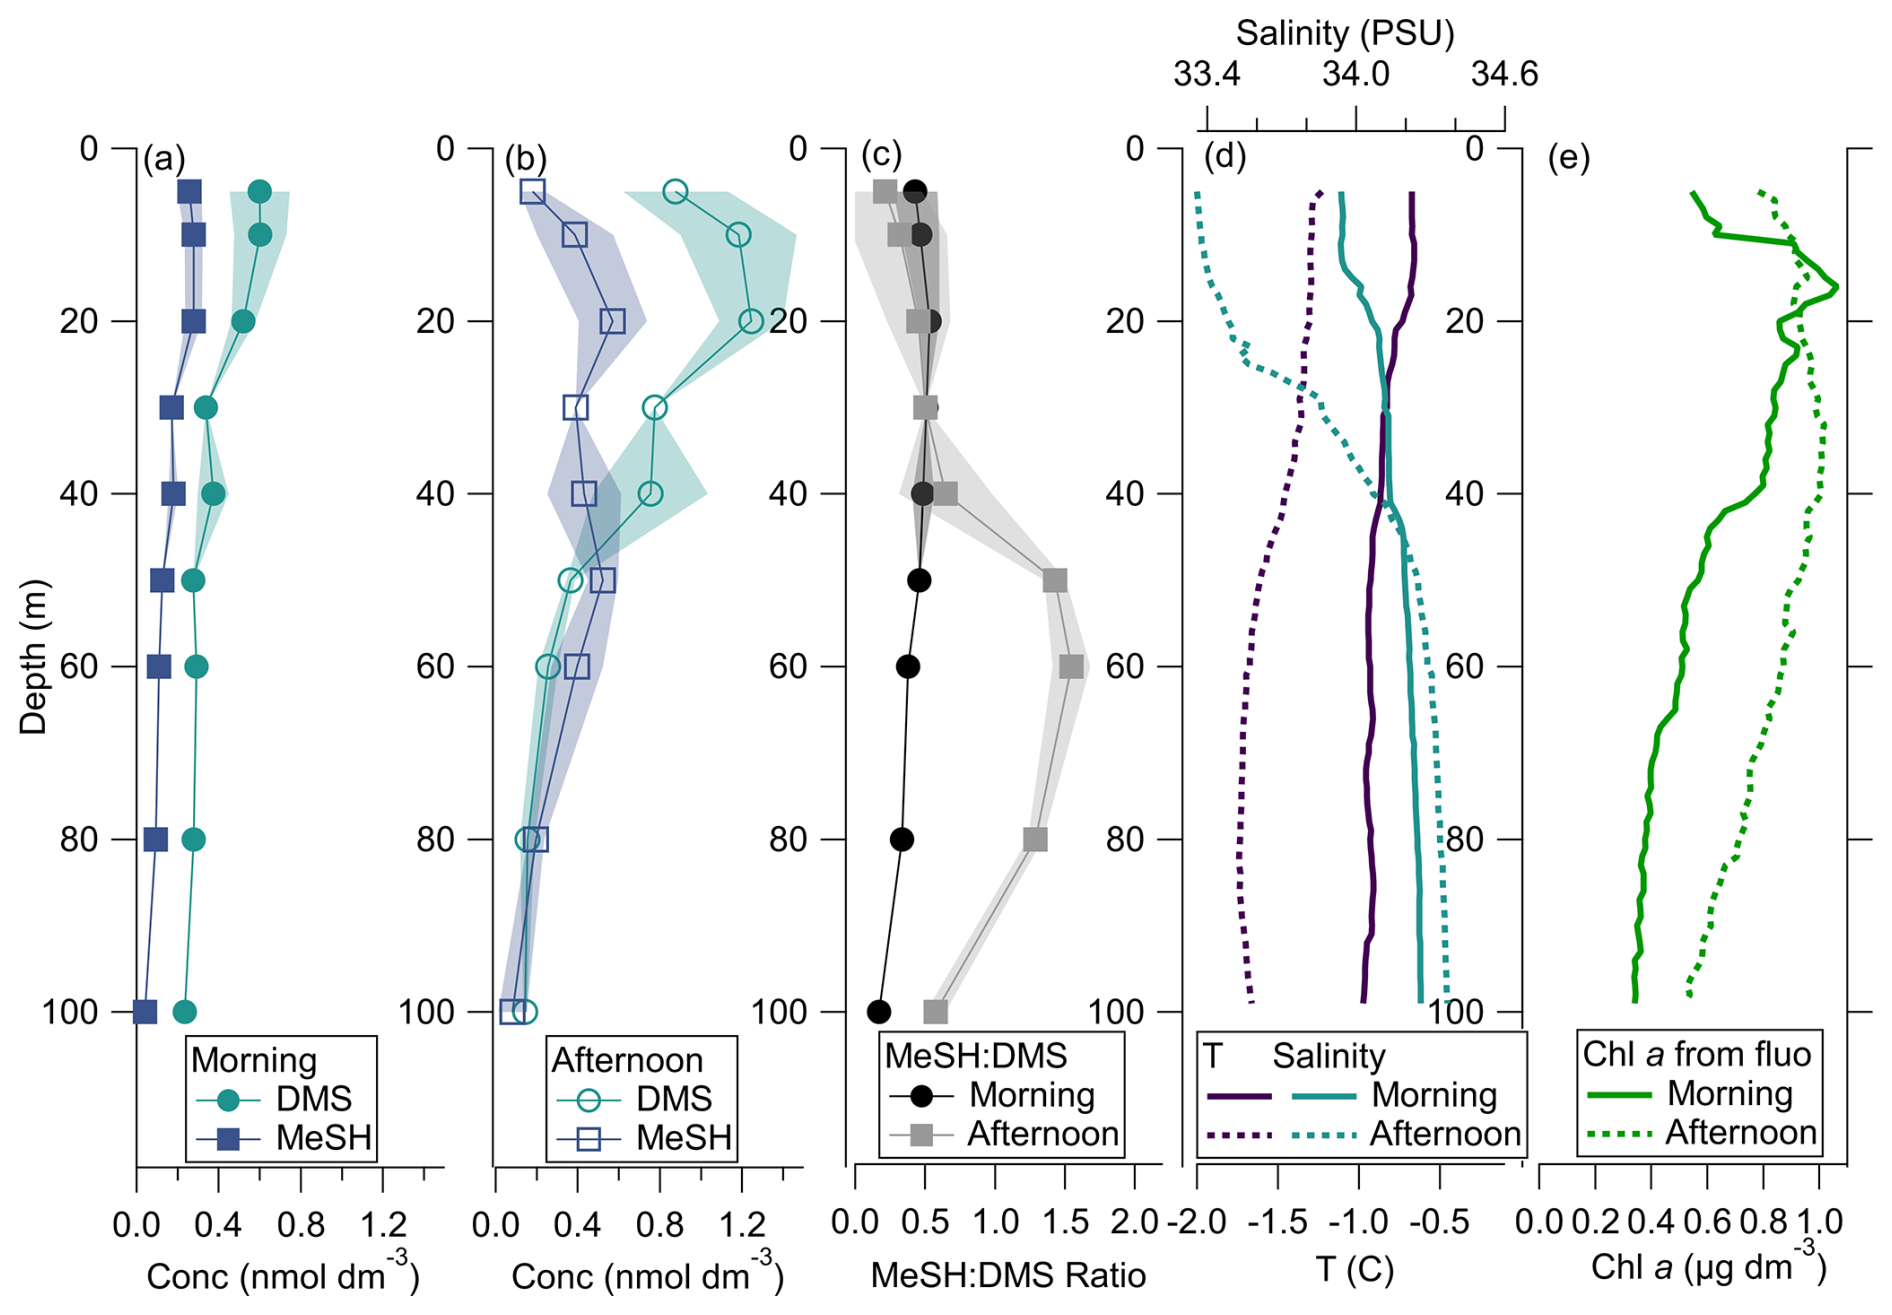
Figure 5Averaged vertical profiles of MeSH and DMS in seawater, grouped by (a) mid-morning and (b) late afternoon casts, with the ratio indicated in panel (c). Shaded areas in the mid-morning casts illustrate range (N=2), while they illustrate standard deviation in the late afternoon casts (N=4). Shaded areas in (c) are the propagated uncertainty in the ratio. (d) Salinity and temperature for mid-morning and late afternoon casts. (e) Chl a from fluorescence for mid-morning and late afternoon casts.
The mid-morning casts showed more uniform MeSH and DMS concentrations in the 25 m near the surface with a ratio that is similar to the campaign average of about 0.4. Below 25 m, concentrations were lower and gradually decreased to near zero at 100 m depth. The late afternoon casts showed on average higher maximum concentrations of both compounds, which also decreased sharply below 25 m. Higher concentrations in sunlit waters are in line with previous observations in the Southern Ocean which generally show more DMS near the surface than at depth (Jones et al., 1998; Rellinger et al., 2009; Li et al., 2024), as light enhances biological production over abiotic consumption (Galí and Simó, 2015). The fact that MeSH exhibited the same pattern supports a dominant biological net source for MeSH, too. One of the most prominent differences between the mid-morning and late afternoon casts is the notable depletion of both compounds near the surface in the latter (Fig. 5b). Despite the fact that exposure to high sunlight favours gross DMS production (Galí et al., 2011), depletion of surface DMS concentrations during the course of the day is a common feature, due to fast photochemical loss in the presence of fresh coloured dissolved organic matter or high nitrate concentrations (Yang et al., 2013a; Royer et al., 2016; Galí et al., 2023). MeSH is expected to behave similarly, as it is known to be sensitive to photochemical oxidation (Flöck and Andreae, 1996). The MeSH:DMS ratio near the surface is slightly smaller in the afternoon casts, suggesting that photochemical loss is faster for MeSH. Another difference between the mid-morning and late afternoon casts is the profiles of MeSH and DMS below 40 m. While in the mid-morning MeSH paralleled DMS in their slow decrease to the deep (Fig. 5a), in the late afternoon MeSH increased again around 60 m while DMS steadily decreased (Fig. 5b). As a result, the MeSH:DMS ratio increased below 40 m during the day and reached values well above 1 at 50–80 m (Fig. 5c). These depths correspond to the deeper part of the high Chl a fluorescence region of the water column (Fig. 5e), suggesting that either DMSP degradation is more geared to MeSH production in high Chl a –low light waters, i.e., is dominated by bacterial activity on sinking or decaying phytoplankton, or MeSH loss decreases substantially in low light, or both. Below 70–80 m (i.e., below the pycnocline), both DMS and MeSH concentrations were lower because the lack of light prevented phytoplankton growth and DMSP production, and bacterial consumption and convection drove the loss of sinking compounds.
3.3 Air concentrations of MeSH and DMS
Hourly measurements of the air concentration of DMS and MeSH are shown in Fig. 6. Mean DMS ambient air concentration measured with the Vocus PTR was 0.25 ppbv with a range of 0.008 to 1.35 ppbv. DMS measured with the Vocus B was within ± 10 % of the Vocus PTR measurement (see Appendix A). These ambient air mixing concentrations are typical for DMS over the Southern Ocean (0.1 to 1 ppbv, Read et al., 2008; Wohl et al., 2020; Bhatti et al., 2023; Mynard et al., 2025). The mean MeSH ambient air concentration was 0.015 ppbv with a range of 0.001 to 0.060 ppbv. These MeSH air mixing ratios are similar to previous measurements in marine air of the North East Pacific (0.019 ppbv, Novak et al., 2022), the eastern North Atlantic (0.015 ppbv, Kilgour et al., 2024), the North Sea (0.016 ppbv, Wohl et al., 2025), the southwest Pacific Ocean (0.018 ppbv, Lawson et al., 2020) and the Southwest Pacific Ocean east of New Zealand (0.040 ppbv, Rocco et al., 2025). Our measurements are within the range of MeSH observations over the Southern Ocean near the sea ice edge binned by latitude between 62 and 66° S (medians 0.014–0.064 ppbv, Mynard et al., 2025). Measurements of DMS and MeSH with the Quad PTR were in reasonable agreement with the measurements from the Vocus PTR (Sect. S6).
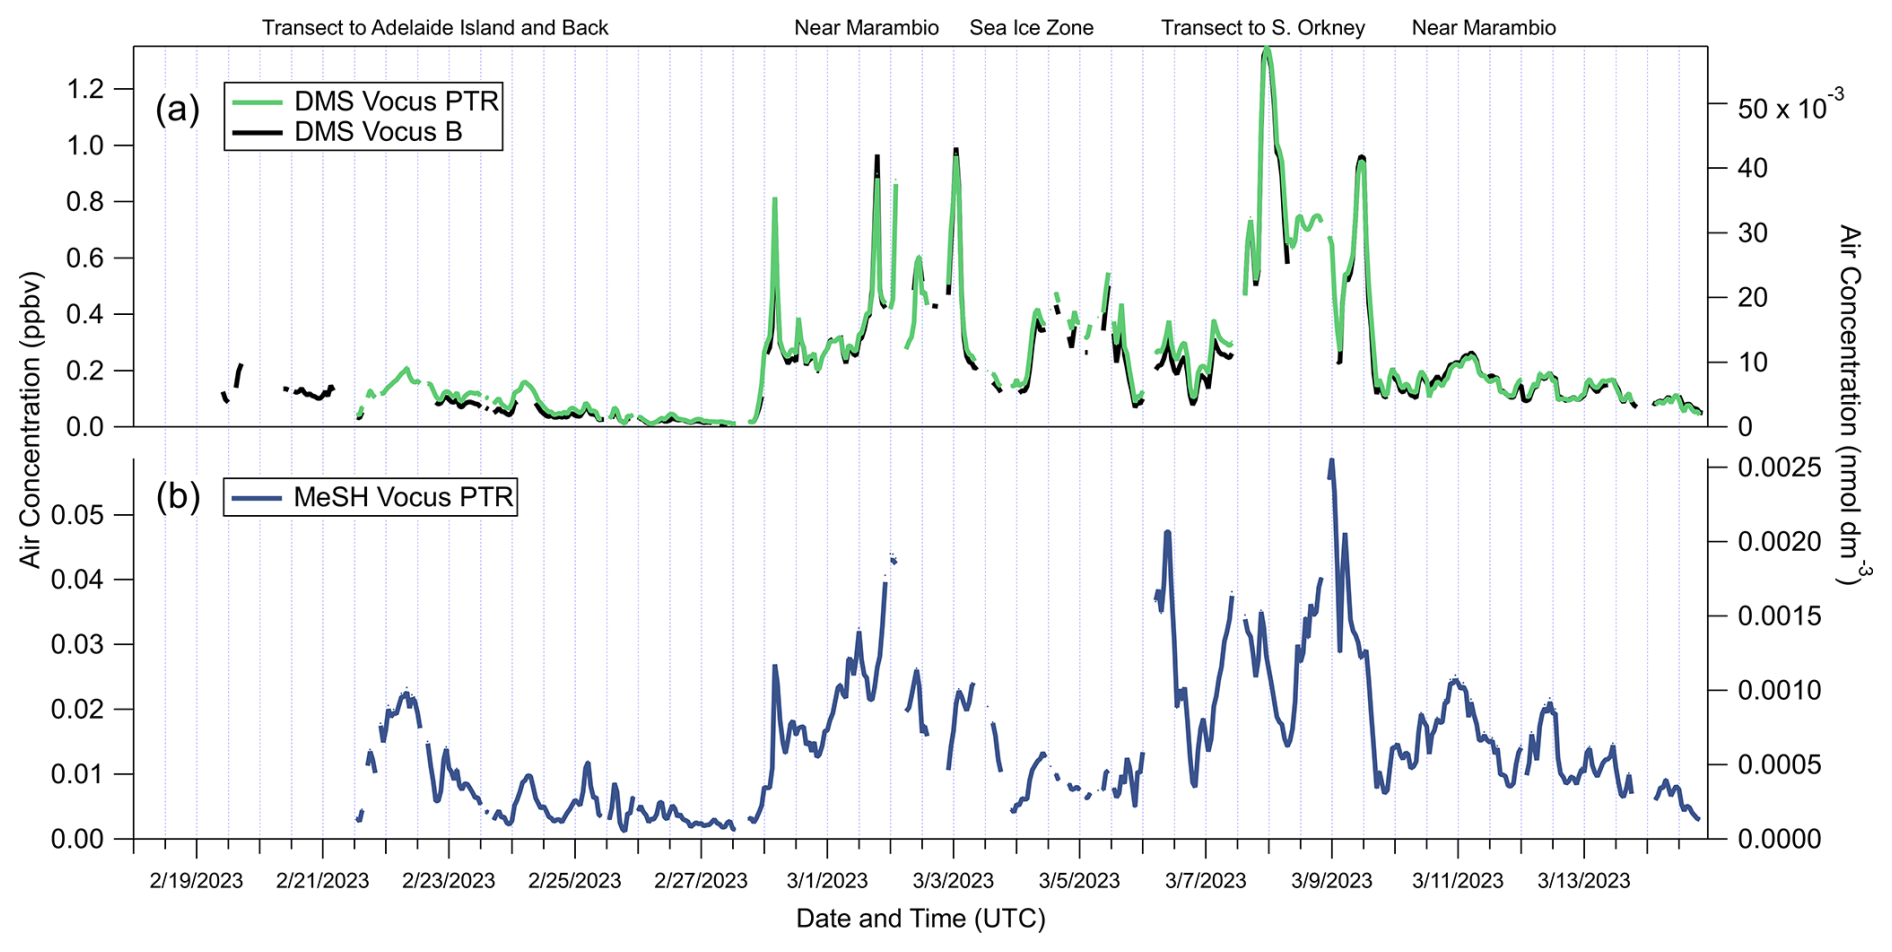
Figure 6Air concentrations of (a) DMS measured with Vocus PTR and Vocus B and (b) MeSH measured with Vocus PTR.
Figure 7 shows the scatter plot of air MeSH vs air DMS coloured by source region of the 24-h backtrajectory at an arrival height of 10 m. When the backtrajectories pass over open sea or land, MeSH and DMS are positively correlated with a Pearson r=0.7. The slope of a least orthogonal distance fit is 0.064, corresponding to an MeSH:DMS ratio of roughly 1:15. This significantly lower ratio than in seawater (roughly 1:2.5) is explained by the fact that MeSH reacts 2–5 times faster than DMS with the most common daytime atmospheric oxidant, OH (Lawson et al., 2020; Novak et al., 2022). In contrast, when backtrajectories pass over broken sea ice (sea ice concentration <50 %), DMS is much higher relative to MeSH with a slope of 0.019, corresponding to an MeSH:DMS ratio of about 1:50. Mynard et al. (2025, Fig. 3h) also observe a more variable MeSH:DMS ratio in air when air masses originated from a mixture of open ocean, Antarctic continent and the ice edge. Only a few of the timepoints with high air DMS concentration correspond to times with high sea DMS concentration. Thus, the air DMS concentration is impacted both by local flux and by transport, more so than the air MeSH concentration with its shorter lifetime.
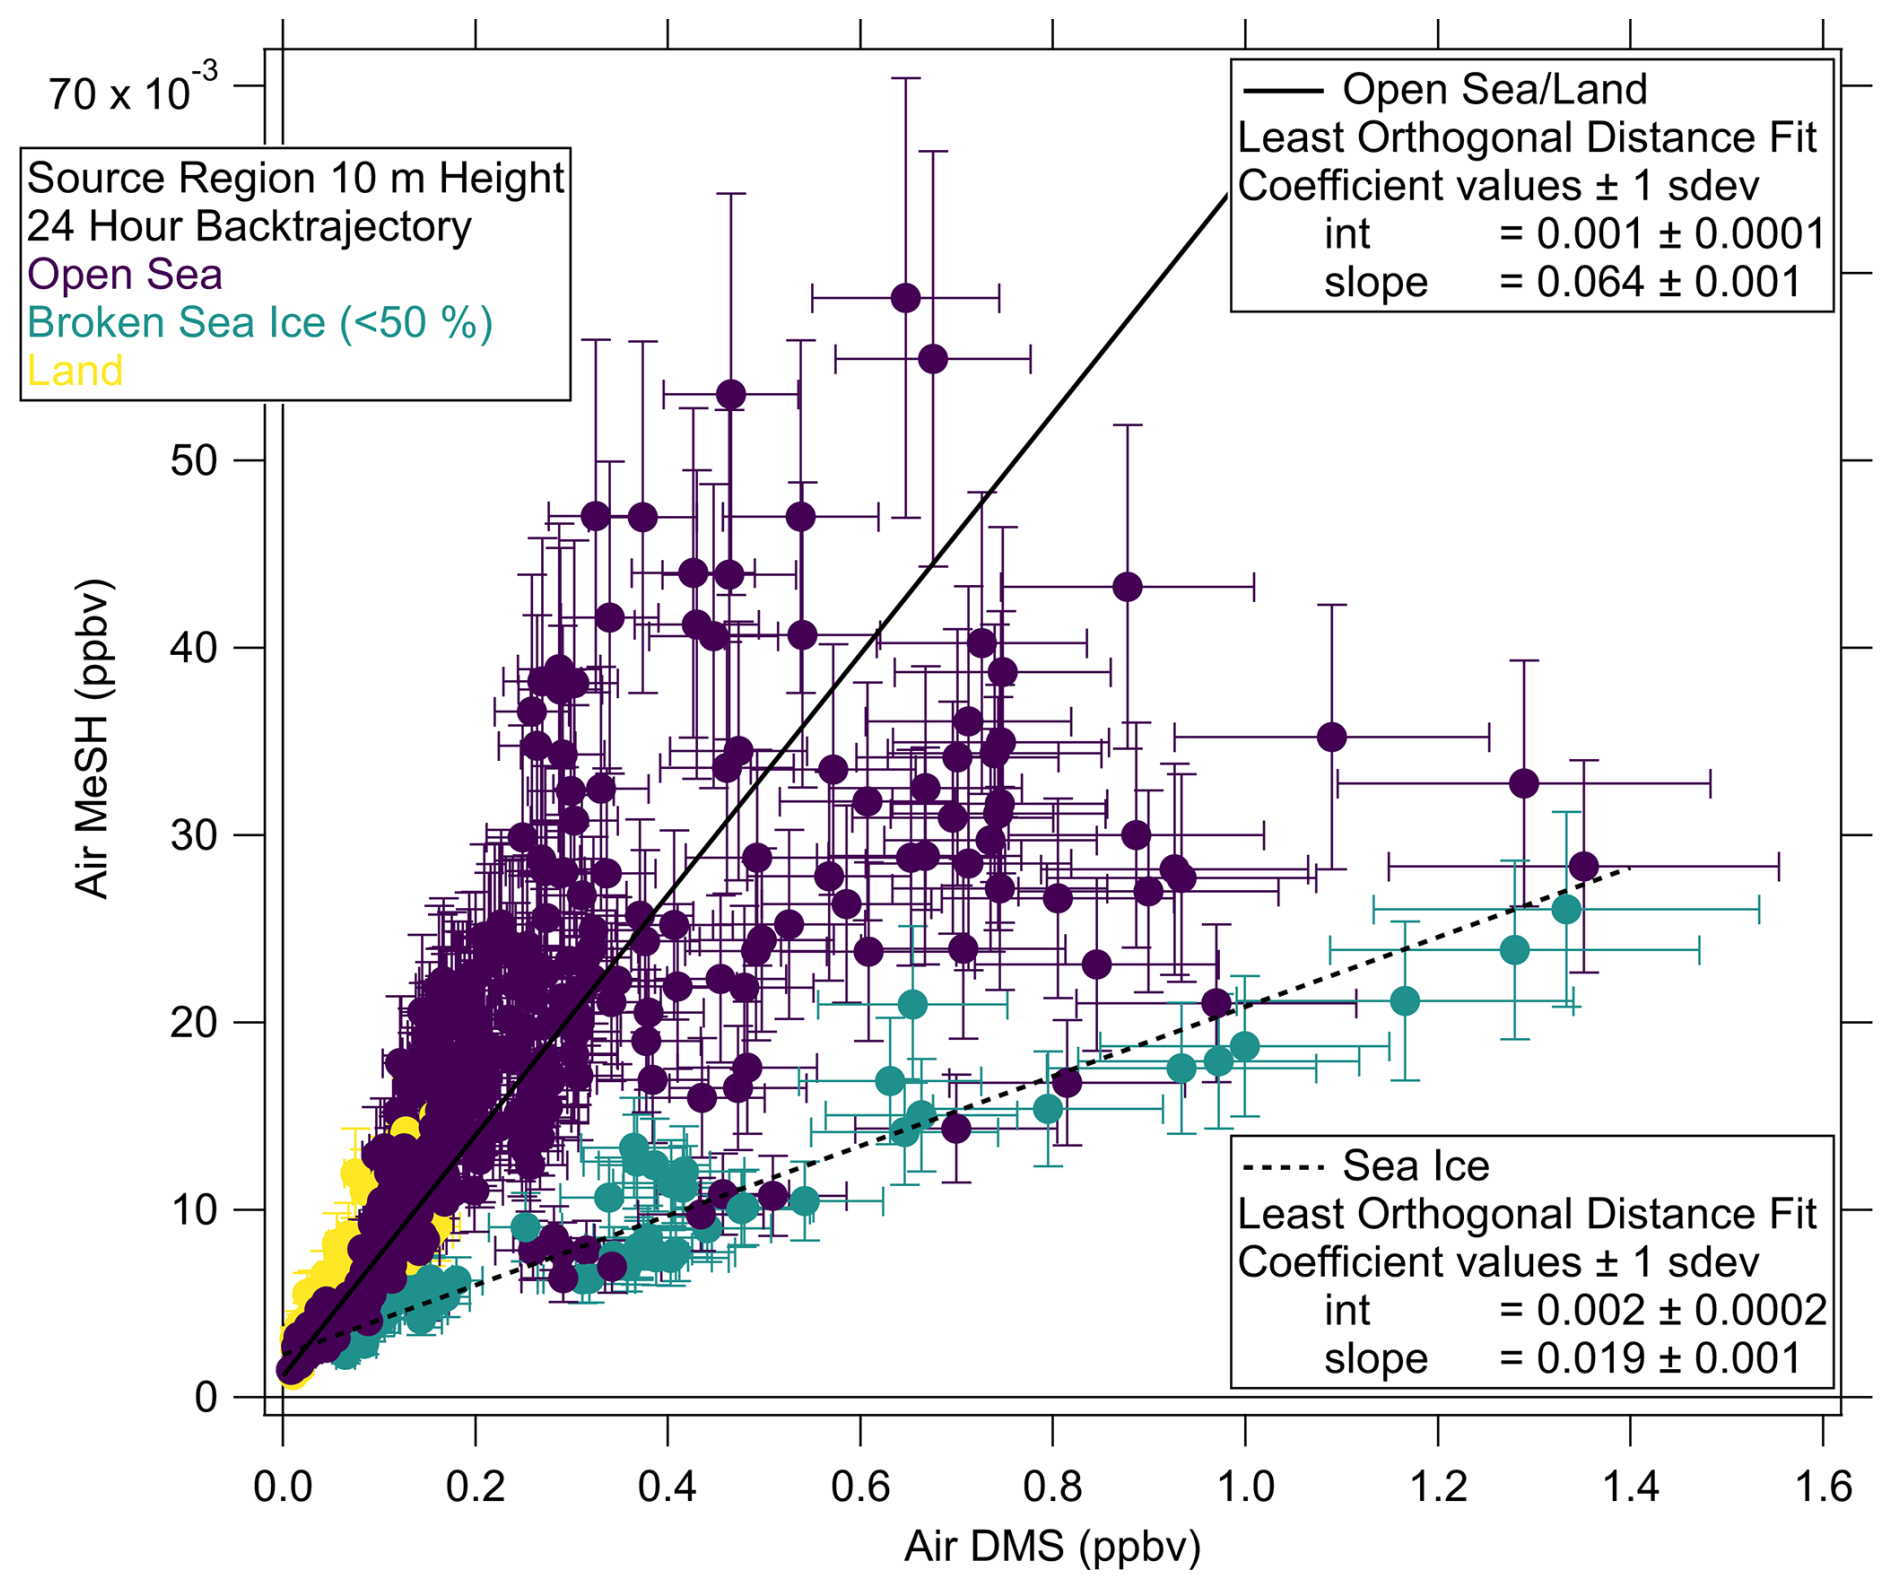
Figure 7Scatter plot of air MeSH vs air DMS. Colour indicates 24-h backtrajectory passing over open sea, sea ice (<50 %) or land.
3.4 Sea-to-air fluxes
Calculated two-layer fluxes of MeSH and DMS are presented in Fig. 8, along with the true wind speed. The gap between 1 and 5 March is due to a failure of the wind sensor. The mean MeSH sea–air flux was 0.9 µmol m2 d−1 with a range of 0.03 to 4.3 µmol m2 d−1 and the mean DMS flux was 1.7 µmol m2 d−1 with a range of −0.6 to 8.6 µmol m2 d−1 (or mean 1.5 µmol m2 d−1 for the time period with both MeSH and DMS flux measurements). The MeSH flux was within the range of previous measurements, including eddy covariance flux measurements in coastal temperate waters of 0.74 µmol m2 d−1 (Novak et al., 2022), estimates from the nighttime accumulation technique of 0.47–5.4 µmol m2 d−1 (Rocco et al., 2025), and two-layer fluxes calculated using air and seawater measurements in the Great Barrier Reef of 1.2 µmol m2 d−1 (Deschaseaux et al., 2025). Our DMS fluxes were somewhat lower than previous measurements in the Southern Ocean, reported to be mostly between 2.5 and 5.5 µmol m2 d−1 (Yang et al., 2011; Wohl et al., 2020; Zhang et al., 2020), likely because we sampled after the DMS emission peak typically observed in December through early February (Hulswar et al., 2022).
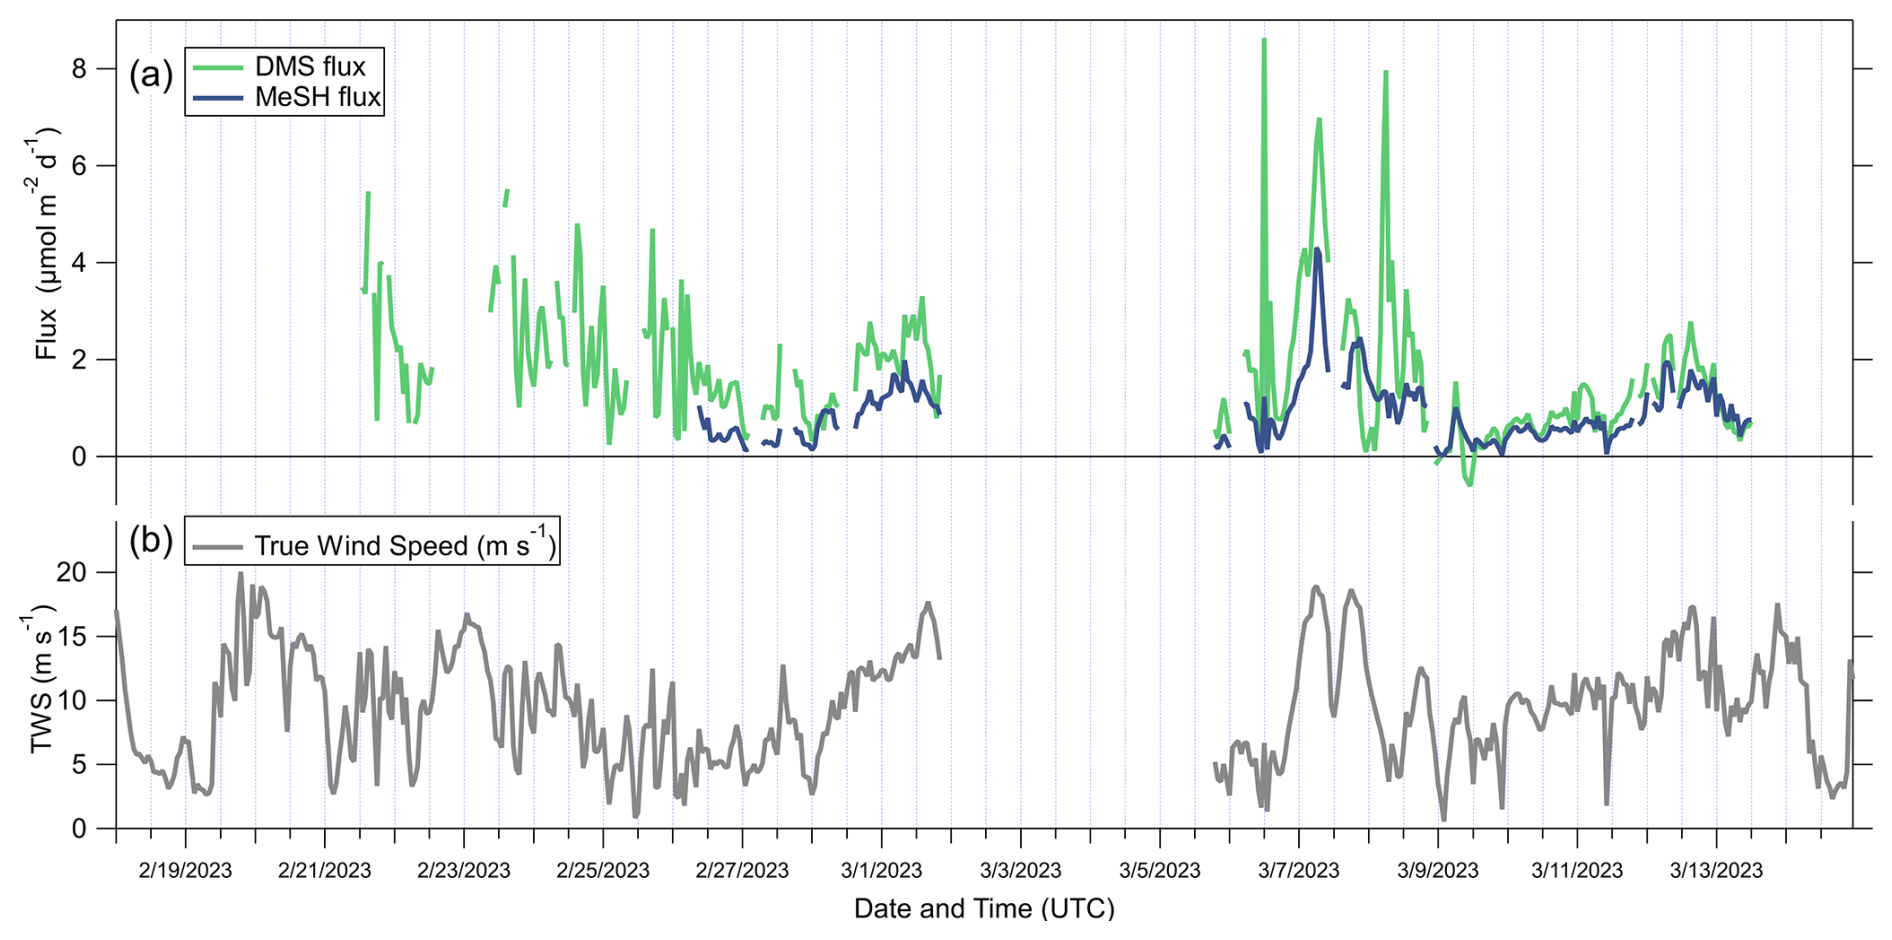
Figure 8(a) Sea to air fluxes of DMS and MeSH, and (b) true wind speed (TWS, relative to ground).
Equation (1) shows that the flux is driven by two terms, the total transfer velocity (Kw), mostly dependent on wind speed, and the difference between the sea water concentration (Cw) and the air concentration times the solubility (CaH). The average dimensionless solubilities at ambient conditions during this cruise were similar for both compounds (20 for MeSH and 28 for DMS). For MeSH, seawater concentrations were on average 60 times larger than CaH, indicating that the seawater was strongly supersaturated relative to the air. As a result, the thermodynamic driving force consistently favoured sea to air transfer. In other words, the air concentrations were so low that they did not make a difference to the flux calculation. For DMS, the seawater concentration is on average 18 times larger than CaH, meaning that the driving force was predominantly sea to air transfer too, although there was one short period on 9 March when the air concentration was high enough to drive net air to sea transfer.
3.5 Diel variability
Although not visually pronounced in the cruise mean data, we observed significant diel variability in surface seawater concentrations, sea–air fluxes, and ambient air mixing ratios of MeSH (Fig. 9). The mean MeSH seawater concentration during darkness (0.56 nmol dm−3) was significantly higher than the mean during daylight (0.45 nmol dm−3, P=0.0006, 2-tailed T Test, n=11 for dark and n=13 for light). Depleted seawater MeSH concentrations by about 20 % during the day were consistent with the near surface depletion in depth profiles during the day (Fig. 5b), indicating either rapid photochemical loss (Flöck and Andreae, 1996; Ulshöfer et al., 1996) or an as yet unknown light driven decrease in microbial MeSH production or increase in consumption. The diel changes in MeSH were particularly pronounced while the ship was sampling near sea ice in the Weddell Sea between 2 and 5 March (Fig. 3). These were the least productive (lowest Chl a concentrations) hence clearest waters of the cruise. The night–day difference in the underway (in vivo) fluorescence, and the low level of photosynthetic efficiency as depicted by the Fv:Fm ratio (Fig. 2) also suggest that phytoplankton were particularly light stressed in this area during the day, supporting the notion of clearer waters and more exposure to solar radiation. Diatom cultures indicate higher MeSH concentrations during periods of illumination (Kameyama et al., 2011; Padaki et al., 2025), suggesting higher production by the algal-bacterial coupling during the day. Similarly, on board incubations of bubbled seawater samples during a previous cruise found that daytime production rates of MeSH are possibly higher than at night (Davie-Martin et al., 2020). However, in our field observations, consistent daytime MeSH depletion suggests that UV exposure and photo-oxidation may have controlled the MeSH concentration near the surface.
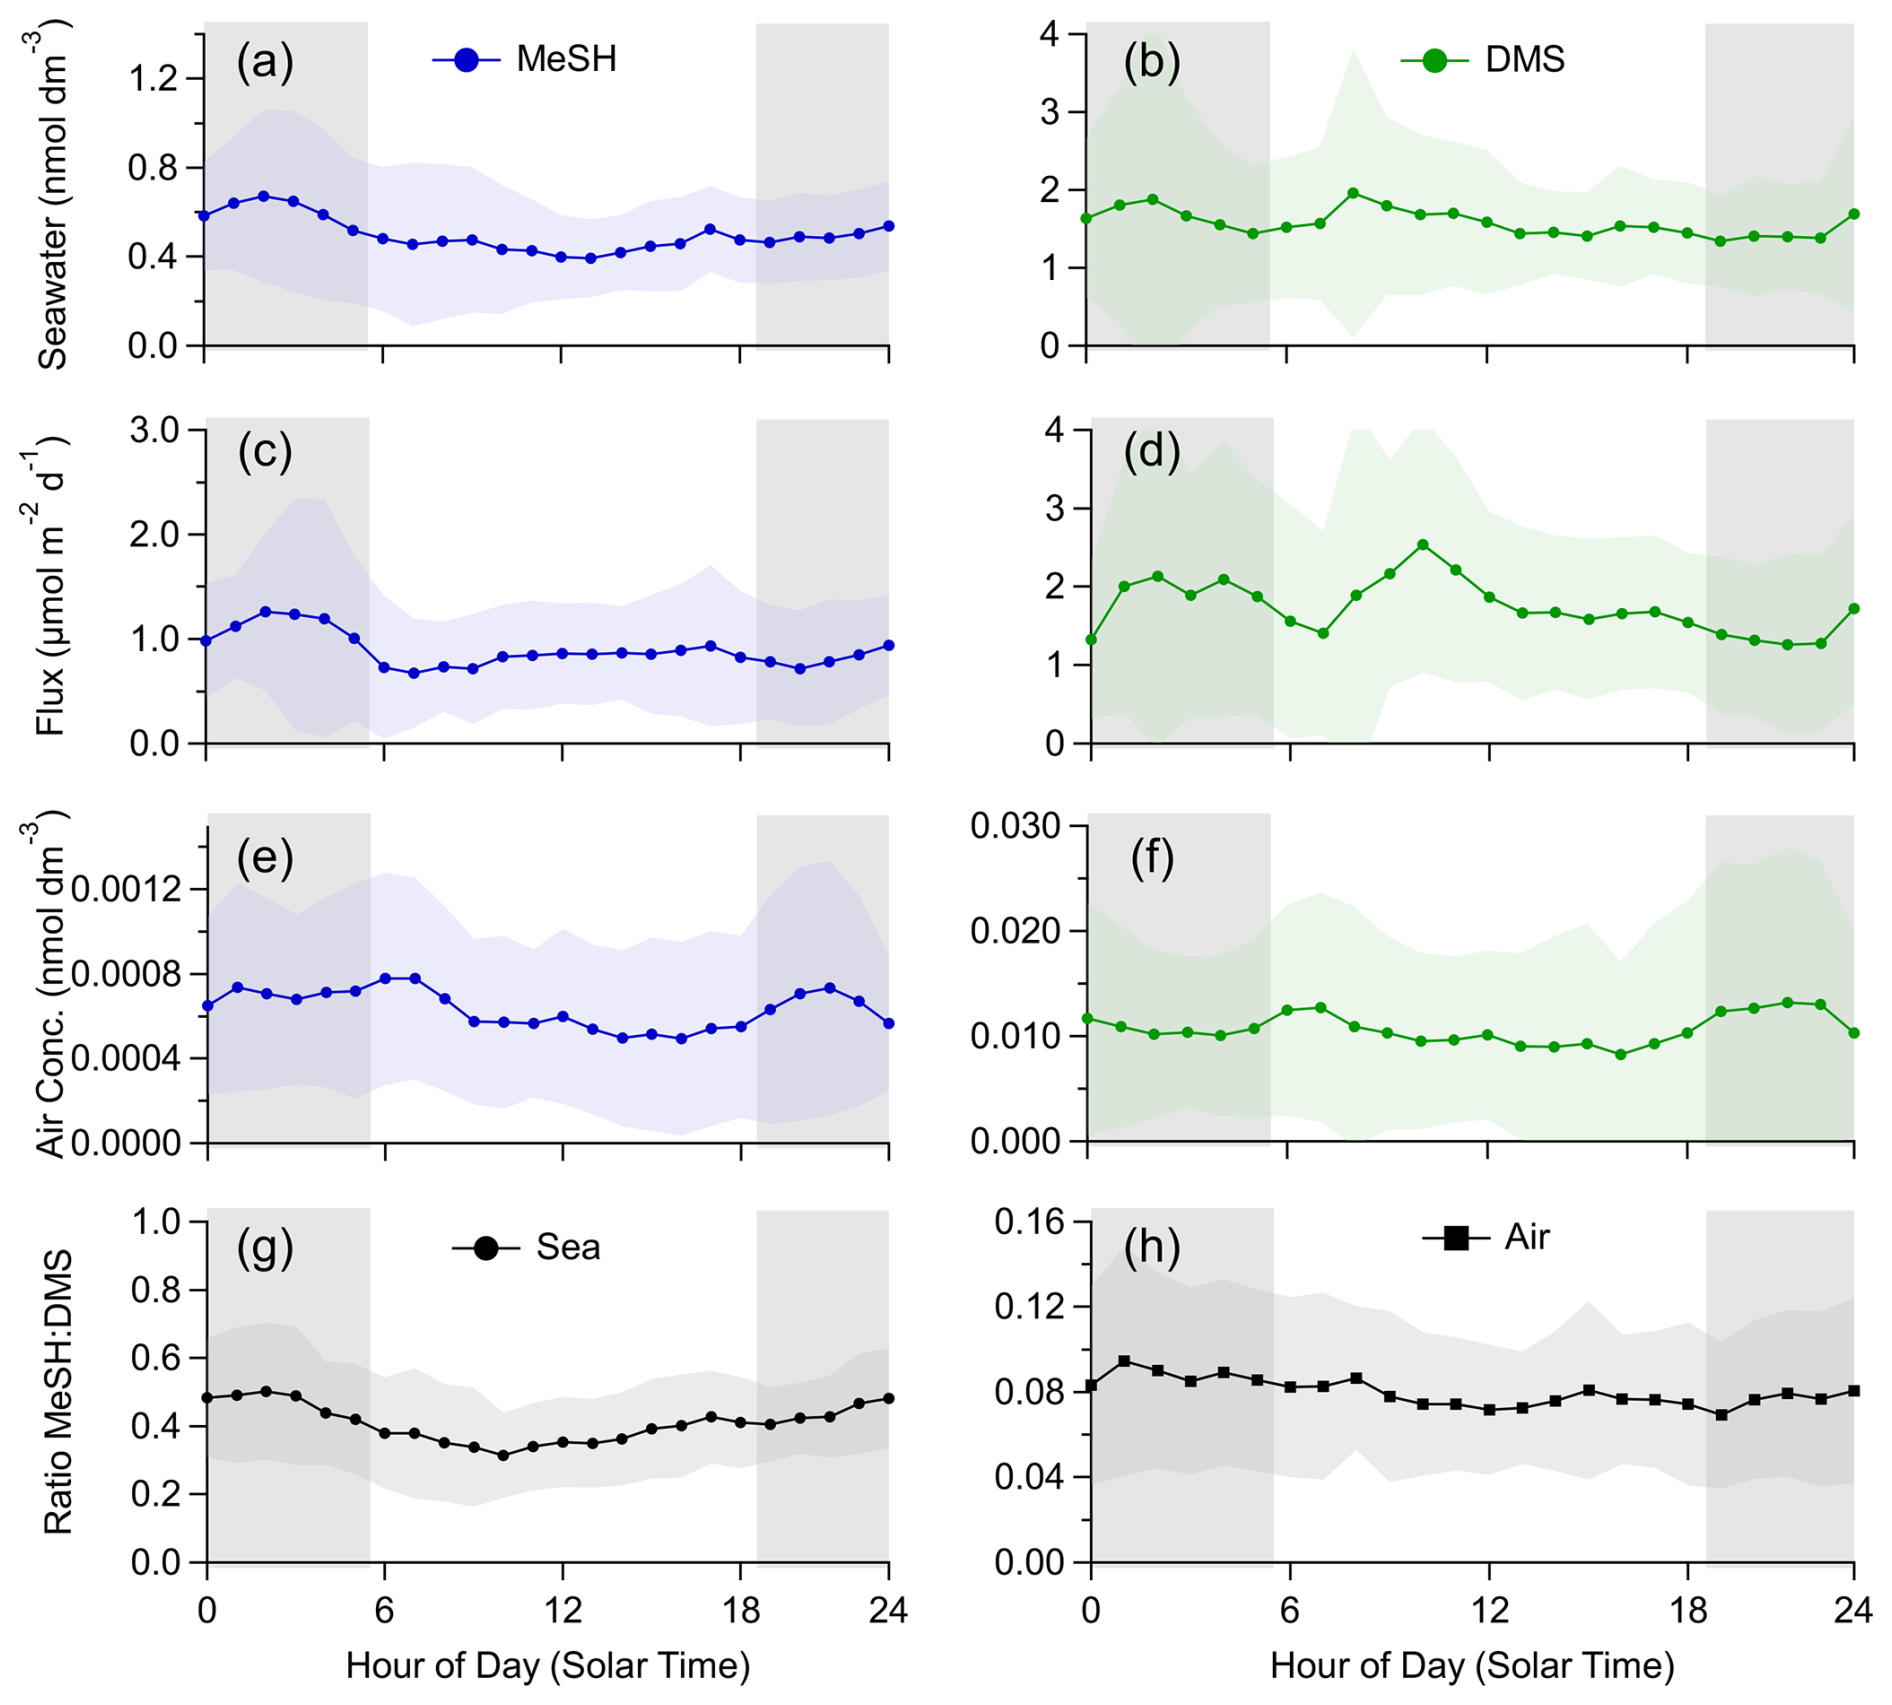
Figure 9Diel changes in surface seawater concentration of (a) MeSH and (b) DMS, the sea–air flux of (c) MeSH and (d) DMS, the ambient air concentrations of (e) MeSH and (f) DMS and the changes in the MeSH:DMS ratio in (g) sea and (h) air. The points show the mean and the shaded areas show one standard deviation. Nighttime is indicated with the grey boxes.
In contrast to MeSH, the surface seawater DMS concentrations over the entire cruise did not show a statistically significant diel change, although the vertical profiles in the Weddell Sea showed near-surface depletion during the day. The diel variability in surface seawater DMS depends on a delicate balance between a range of biological sources and biotic and abiotic sinks, which are tightly coupled and highly dependent on season and location (e.g., Royer et al., 2016). Our current understanding is that DMS cycling rates display diurnal variability, with high solar radiation favouring gross biological DMS production (Archer et al., 2010; Galí et al., 2011; Kinsey et al., 2023) but also photochemical loss (Galí et al., 2013, 2023), processes that may balance out and lead to large, opposite, small or no substantial diel changes in DMS seawater concentrations (Royer et al., 2016). The mean MeSH:DMS ratio during darkness was 0.46, while during daylight hours it was 0.37, 20 % lower and a diel change of similar magnitude to MeSH alone. Overall, the diel cycles of MeSH and DMS concentrations in surface seawater indicate that MeSH is more net sensitive to light than DMS. In any case, as has been done for DMS (e.g., Royer et al., 2016), high temporal resolution measurements and mechanistic studies assisted by modelling, are necessary to further elucidate what drives MeSH diel variability in seawater and how widespread it is.
The mean nighttime MeSH emission flux was 1.0 µmol m2 d−1 and decreased by 18 % to 0.82 µmol m2 d−1 during daytime (P=0.017, 2-tailed T Test). Wind speed did not show any marked diel variation and MeSH was highly supersaturated in seawater throughout the cruise, implying that the diel changes in the sea–air flux were due to changes in seawater concentration alone. Conversely, the DMS flux did not show significant diel variability, which is consistent with the lack of a diel change in seawater DMS and in line with previous high-resolution measurements in the Southern Ocean (Wohl et al., 2020; Zhang et al., 2020).
The mean air MeSH concentration at night was 0.00068 nmol dm−3 (0.013 ppbv), while the mean during daytime was 0.00059 nmol dm−3 (0.011 ppbv). This is a 13 % decrease on average from night to day (P=0.0073). The lowest MeSH concentrations were measured at solar zenith coinciding with the hours of highest OH concentrations. OH is thought to be the largest sink for MeSH in the remote pristine atmosphere (Novak et al., 2022). The few existing studies of MeSH in marine air report a diel change in the mixing ratio (e.g., Lawson et al., 2020; Novak et al., 2022; Kilgour et al., 2024; Wohl et al., 2025). However, we note that the diel variability of MeSH in air reported for this cruise is markedly smaller than the diel change observed at lower latitudes (typically about 0.015–0.030 ppbv night to day difference). As also pointed out by Mynard et al. (2025), this is likely due to lower daytime OH concentrations at higher latitudes (Wolfe et al., 2019). MeSH reacts faster with OH than DMS does (Lawson et al., 2020; Novak et al., 2022) and, indeed, air DMS concentrations did not display a significant diel change. The invariance in atmospheric DMS indicated that diel changes in the boundary layer height were not behind the MeSH diel variation. Since the night–day change for air MeSH is a somewhat smaller relative decrease than for the seawater MeSH, the night–day change in emission flux may be a stronger driver of the air MeSH diel changes than the oxidation rates. All in all, this diel behaviour illustrates the complexity in modelling MeSH in the marine environment as difficulties in accurately representing the diel variation may impact mean modelled concentrations.
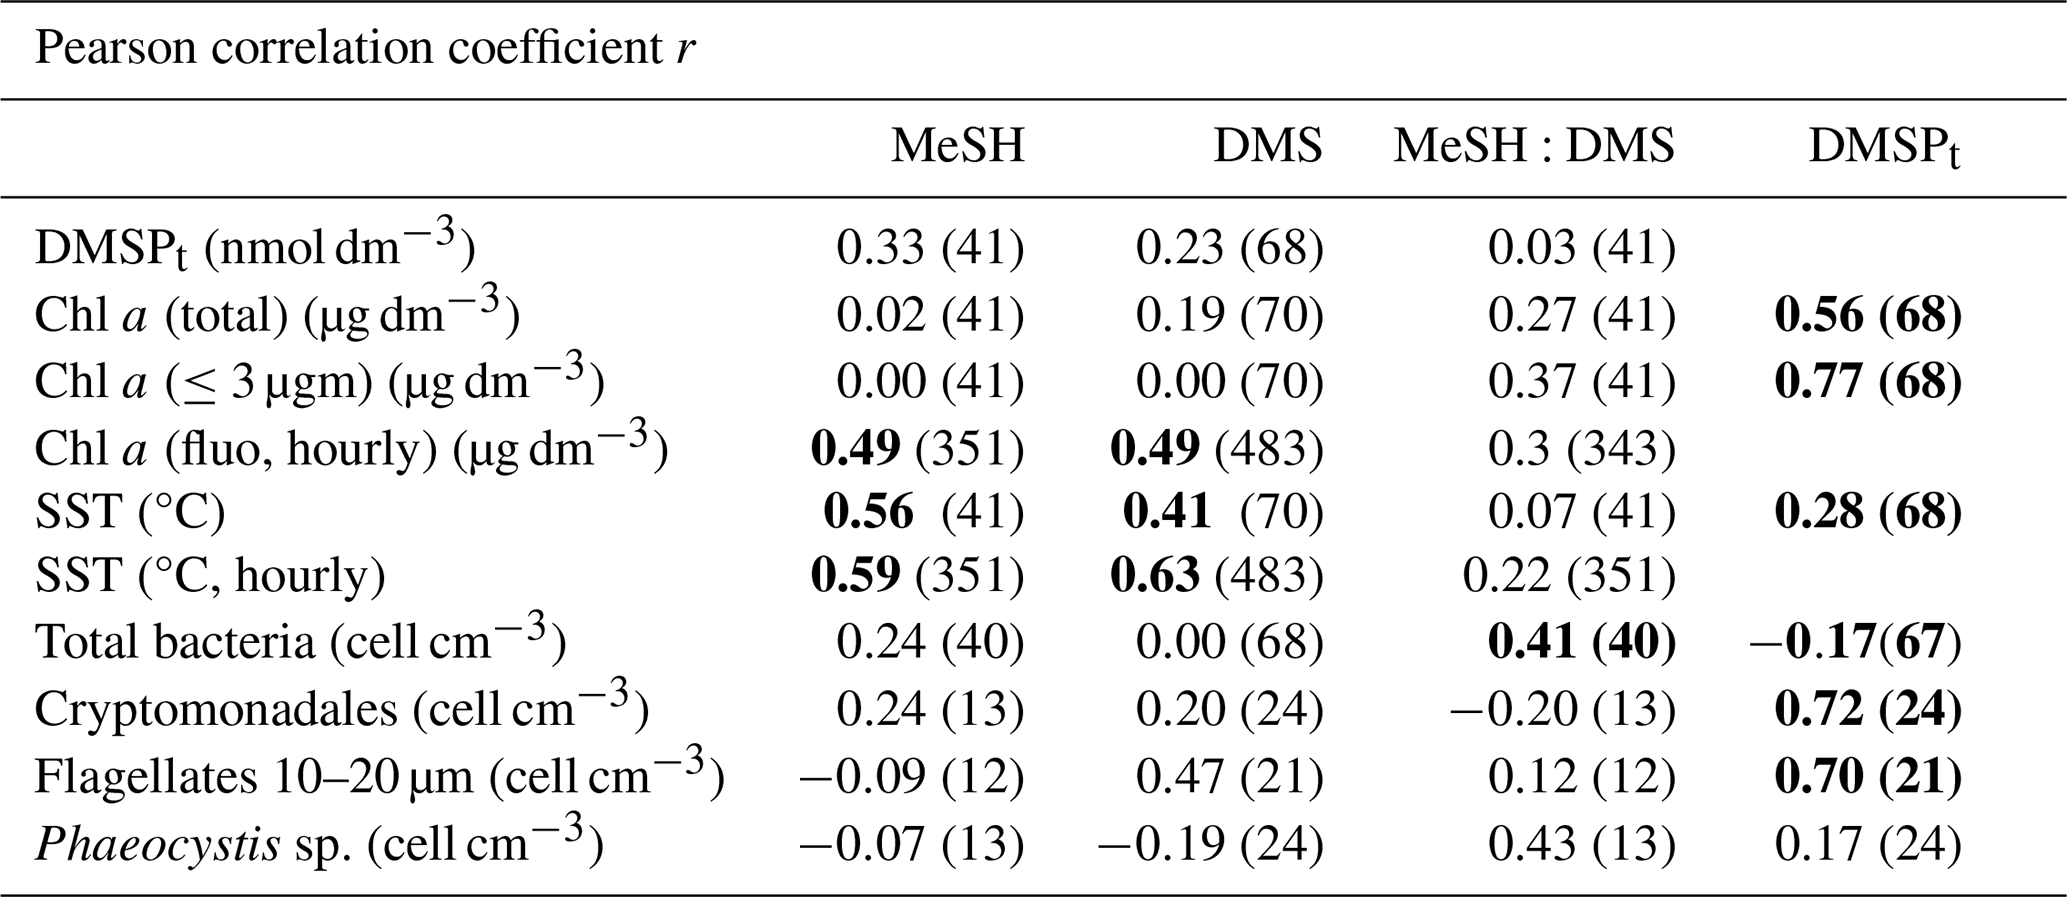
Table 1Pearson correlation coefficient (r) and number of samples (in parentheses) for seawater MeSH, DMS, MeSH:DMS ratio and DMSPt with selected biological parameters measured during the cruise. Values in bold show that the two-tailed p value of the correlation is less than 0.01, indicating statistically significant linear correlation.
3.6 Potential surface seawater biological drivers of MeSH and DMS
The biological variables monitored (Fig. 2; Table 1) paint a typical picture of the Chl a, DMSPt and DMS system for this time of year. Chl a (which ranged 0.15–9.6 µg dm−3, Fig. 2c) correlated best with the abundance of large nanophytoplankton (15–20 µm, R2=0.70) as well as with the biomass of dinoflagellates (>40 µm) and diatoms (R2=0.90) (Fig. S6 in Rocchi et al., 2025). In other words, the largest contribution to Chl a was from large phytoplankton (mainly Corethron, heterotrophic dinoflagellates and large cryptomonadales), consistent with previous measurements in Antarctic waters at this time of year (late summer, Alvain et al., 2008; Deppeler and Davidson, 2017). As a phytoplankton product, DMSPt (7–284 nmol dm−3; Fig. 3b) correlated positively with total Chl a, with a stronger correlation to the small size fraction Chl a (≤3 µm). Like Chl a, DMSPt showed lower concentrations in the sea ice zone of the northern Weddell Sea and higher concentrations on the west side of the Antarctic Peninsula. Among phytoplankton, DMSPt correlated better with microscopy-counted flagellated cells in the size range of 10–20 µm, and particularly with the pigment-distinguishable cryptomonadales (Table 1), known to be high DMSP producers in polar waters (McParland and Levine, 2019). The peak of DMSPt concentration on 21 February (284 nmol dm−3) coincided with high abundance of cryptomonadales (2005 cell cm−3) at the entrance of the Gerlache Strait. The other DMSPt peak on 26 February coincided with a high abundance (387 cell cm−3) of large nanophytoplankton. Note that no significant correlation was observed with cell abundances of nanoalgae of the genus Phaeocystis (Table 1), despite these being known DMSP producers, particularly in the Southern Ocean (Wang et al., 2015). During the cruise, Phaeocystis cell abundances were always less than 550 cell cm−3, 100 times lower than earlier in summer (e.g., Vaqué et al., 2025). Overall, most of the DMSPt variance was explained by nanophytoplankton abundance (Rocchi et al., 2025), in agreement with previous studies (Belviso et al., 2008; Sheehan and Petrou, 2020; Hopkins et al., 2023).
In general, biological variables had poor predictive capabilities for MeSH and DMS (Table 1), with correlation coefficients below 0.5. MeSH and DMS showed a similar general pattern to DMSPt (Fig. 3b). Yet, covariation was not strong enough to yield significant correlation (Table 1), partly because the large increase in DMSPt on 21 February was not accompanied with an increase in DMS or MeSH concentrations, and the two high-DMS episodes in early March were unrelated to the DMSPt concentration. Only the DMSPt peak on 26 February coincided with elevated concentrations of DMS and MeSH. This may be because MeSH and DMS are produced from the available dissolved DMSP pool, while the total DMSP (DMSPt) measured here is contributed mainly by the particulate form (Kiene and Slezak, 2006). Hence, peaks of DMSPt correspond to snapshot conditions of high abundances of strong DMSP producing phytoplankton, not necessarily accompanied by high rates of mortality and dissolved DMSP release.
As for the MeSH:DMS ratio, it correlated significantly only with bacterial abundance (Table 1). This could be because bacterial catabolism of DMSP produces both MeSH and DMS (Kiene and Linn, 2000; Omori et al., 2025) while algal enzymes produce only DMS (Stefels et al., 2007; Shemi et al., 2023). However, abundance alone is not a quantitative surrogate for bacterial activity (Hunt et al., 2013). No clue was obtained either as to why the MeSH:DMS ratios were higher in this cruise than in warmer ocean basins with SST > 12 °C (Wohl and Simó, 2024). It appears that polar conditions favoured the proportion of MeSH in biological VMS production. Yet, within the polar conditions of the cruise, MeSH and, to lesser extent, DMS significantly correlated positively with SST, with lowest concentrations and SST observed in the sea ice-influenced zone of the Weddell Sea, coinciding with low Chl a concentration (Figs. 2, 3). Both MeSH and DMS showed a better correlation with hourly measurements of Chl a concentration based on fluorescence, probably because the discrete measurements during the later part of the campaign were only conducted twice a day and likely did not capture the diel variation in Chl a concentration (Fig. 2c).
3.7 Comparison with Model Results
The average air DMS concentration was approximately half the concentration modelled by Wohl et al. (2024) for March over the Southern Ocean in the quadrant of this cruise (0.438–0.557 ppbv in the model). This discrepancy may be due to the larger mean sea–air flux used in the model for DMS (4.91 µmol m2 d−1) compared to the 1.7 µmol m2 d−1 estimated here. The discrepancy between measurement and model was much larger for MeSH, on the order of a factor of ten for air concentrations (0.136–0.170 ppbv in the model). This could be partly due to the afore mentioned difference in DMS, as Wohl et al. (2024) estimated the seawater MeSH concentration from the climatological seawater DMS (Hulswar et al., 2022). The ratio of seawater MeSH:DMS used in the model (∼ 0.5) and the mean sea–air MeSH flux in the model (1.28 µmol m2 d−1) are similar to the results given here. Tashmim et al. (2025) modelled an annual mean MeSH mixing ratio for 2018 of above 0.050 ppbv for the Southern Ocean, which is about three times larger than what was measured here. Therefore, the discrepancy in air MeSH concentration between models and observations might be due to an underestimate of the oxidants, particularly OH, in the models, or to as yet unknown MeSH oxidation pathways.
Overall, this study confirms that the sector of the Southern Ocean around the Antarctic Peninsula is a substantial source of MeSH and DMS to the atmosphere. The distributions of MeSH and DMS in seawater reveal that both compounds are tightly linked, with sporadic decoupling observed during events of high DMS concentrations. Depth profiles confirm that the origin of MeSH, like that of DMS, is biological, but no single biological predictor stood out as controlling DMS and MeSH concentrations, not even the concentration of their main known precursor, DMSP. This illustrates that the transformation of DMSP into its main catabolic products occurs through a complex web of processes and actors, so that MeSH and DMS concentrations do not only depend on the size of the DMSP pool but on how efficiently it is released and degraded (Simó, 2001). This hinders attribution of cause and effect relationships between organism abundances and MeSH or DMS concentrations in regional surveys.
Depth profiles and diel variability near the surface suggest that MeSH is more prone to light driven loss than DMS. Air concentrations of MeSH and DMS correlated most of the time, with a much lower MeSH:DMS ratio in air than in seawater due to faster gas-phase oxidation of MeSH compared to DMS. Episodes of proportionally more DMS in air were associated with air masses passing over the sea ice edge before sampling. Diel changes in seawater MeSH concentrations, sea–air fluxes, and atmospheric concentrations, all decreasing during daytime, call for the need to accurately represent the diurnal variability when modelling this compound in the marine environment.
This study was part of an emerging effort to characterise the distribution of MeSH in more detail in the ocean, especially the Southern Ocean, and how this relates to biogeochemical processes. This is particularly timely given that MeSH has received comparatively less attention than DMS so far, despite its important role in the Southern Hemisphere. Our measurements show that MeSH and DMS share many similarities due to their common precursor, but MeSH is more reactive in seawater and in air, resulting in a slightly distinct behaviour. The data here is also a useful dataset for model comparison and development.
Figure A1 shows the comparison between air DMS measured with the Vocus B and measured with the Vocus PTR. The estimated ±15 % uncertainty in both instruments is indicated with error bars. At higher concentrations (>0.5 ppb) the agreement between the two instruments is excellent as indicated by the 1:1 line. At lower concentrations, the Vocus B concentrations were about 10 % lower as indicated by the slope of 0.91 for the least orthogonal distance fit with both x and y data weighted by the uncertainty.
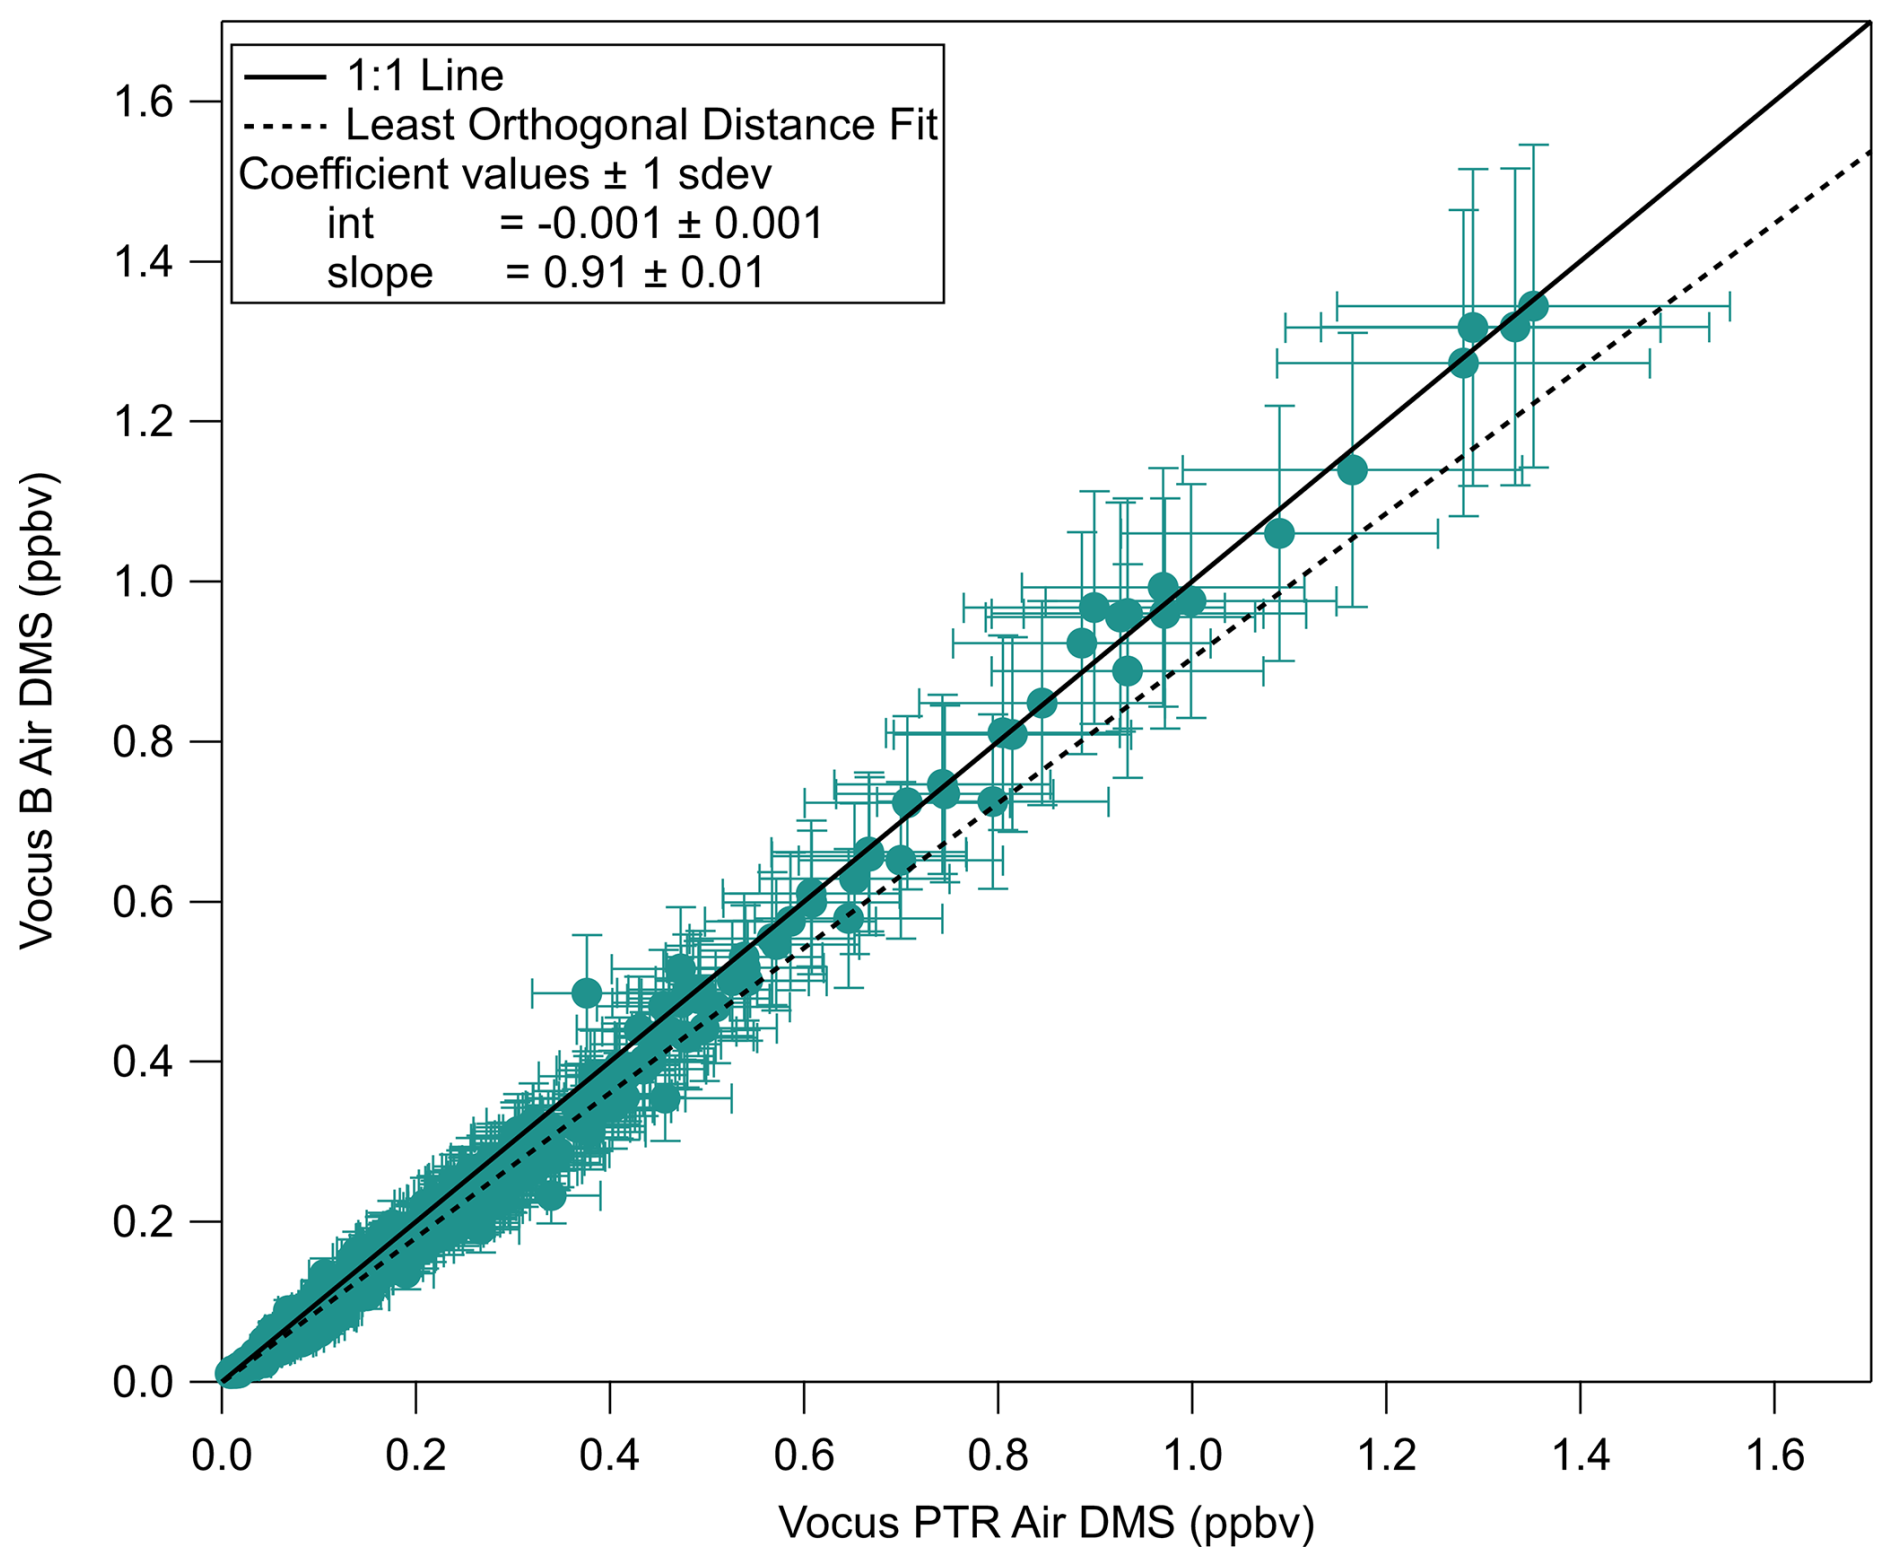
Figure A1Vocus B air DMS vs Vocus PTR air DMS with a 1:1 line and the least orthogonal distance fit.
Surface underway seawater measurements of MeSH and DMS are available for download at https://doi.org/10.5281/zenodo.12758981 (Wohl, 2024). Air measurements of MeSH and DMS are available for download at https://doi.org/10.5281/zenodo.18434929 (Williams, 2026).
The supplement related to this article is available online at https://doi.org/10.5194/acp-26-10149-2026-supplement.
CW, MDO and RS conceptualized and designed the study. CW carried out the measurements and calibrations of MeSH and DMS in seawater. LRW, LLJQ, DCSB, VP and FL-H carried out the measurements of MeSH and DMS in ambient air with the Vocus PTR and Vocus B. HS and ED contributed to the data analysis of seawater and air MeSH and DMS. GC and KS performed the measurements of ambient air MeSH and DMS with the Quad PTR. AR, DV, ELS, QG, MV, AS, EB and RS collected samples and conducted biogeochemical and biological analyses. YMC and AR processed and analysed flow cytometry and DMSP samples at ICM. CW and LRW performed the statistical analyses, prepared the figures, and drafted the manuscript. RS acquired funding for the seawater measurements of DMS and MeSH. The cruise was organised and led by MDO. All co-authors contributed to the final version of the manuscript.
LRW, HS, VP, and FL-H are employed by the vendors of the Vocus PTR and Vocus B. The peer-review process was guided by an independent editor, and the authors also have no other competing interests to declare.
Publisher's note: Copernicus Publications remains neutral with regard to jurisdictional claims made in the text, published maps, institutional affiliations, or any other geographical representation in this paper. The authors bear the ultimate responsibility for providing appropriate place names. Views expressed in the text are those of the authors and do not necessarily reflect the views of the publisher.
We thank the captain and crew of the A33 BIO Hespérides for enabling us to carry out this work and going above and beyond to make us feel welcome onboard. Thank you very much to Martí Galí Tapias and Matt Baker for helpful discussions around calculating dissolved concentrations in the SFCE.
This work was supported through an Advanced Grant from the European Research Council (grant no. ERC-2018-AdG #834162) to RS. The POLAR CHANGE project (grant no. PID2019-110288RB-I00) awarded to MDO, RS and EB, was funded by MCIN/AEI/10.13039/501100011033. This latter agency also provided institutional support via a Severo Ocho Centre of Excellence accreditation (grant no. CEX2024-001494-S) to the ICM-CSIC. The study is part of the POLARCSIC Conexión activities. Some of CW’s time spent on data analysis has been paid for by the UK Natural Environment Research Council (NERC) CARES project (ConstrAining the RolE of Sulfur in the Earth System, grant no. NE/W009307/1). LLJQ thanks the Virtual laboratory for molecular level atmospheric transformations (VILMA), Research council of Finland (grant nos. 346372 and 364230). The measurements of air DMS and MeSH were funded by Aerodyne Research.
This paper was edited by Kelvin Bates and reviewed by Nadja Steiner and Manon Rocco.
Aggarwal, S., Bansal, P., Wang, Y., Jorga, S., Macgregor, G., Rohner, U., Bannan, T., Salter, M., Zieger, P., Mohr, C., and Lopez-Hilfiker, F.: Identifying key parameters that affect sensitivity of flow tube chemical ionization mass spectrometers, Atmos. Meas. Tech., 18, 4227–4247, https://doi.org/10.5194/amt-18-4227-2025, 2025.
Alvain, S., Moulin, C., Dandonneau, Y., and Loisel, H.: Seasonal distribution and succession of dominant phytoplankton groups in the global ocean: A satellite view, Global Biogeochem. Cy., 22, https://doi.org/10.1029/2007GB003154, 2008.
Archer, S. D., Smith, G. C., Nightingale, P. D., Widdicombe, C. E., Tarran, G. A., Rees, A. P., and Burkill, P. H.: Dynamics of particulate dimethylsulphoniopropionate during a Lagrangian experiment in the northern North Sea, Deep Sea Res. Part II, 49, 2979–2999, https://doi.org/10.1016/S0967-0645(02)00067-X, 2002.
Archer, S. D., Ragni, M., Webster, R., Airs, R. L., and Geider, R. J.: Dimethyl sulfoniopropionate and dimethyl sulfide production in response to photoinhibition in Emiliania huxleyi, Limnol. Oceanogr., 55, 1579–1589, https://doi.org/10.4319/lo.2010.55.4.1579, 2010.
Belviso, S., Bopp, L., Mosseri, J., Tedetti, M., Garcia, N., Griffiths, B., Joux, F., Obernosterer, I., Uitz, J., and Veldhuis, M. J. W.: Effect of natural iron fertilisation on the distribution of DMS and DMSP in the Indian sector of the Southern Ocean, Deep Sea Res. Part II, 55, 893–900, https://doi.org/10.1016/j.dsr2.2007.12.040, 2008.
Bhatti, Y. A., Revell, L. E., Schuddeboom, A. J., McDonald, A. J., Archibald, A. T., Williams, J., Venugopal, A. U., Hardacre, C., and Behrens, E.: The sensitivity of Southern Ocean atmospheric dimethyl sulfide (DMS) to modeled oceanic DMS concentrations and emissions, Atmos. Chem. Phys., 23, 15181–15196, https://doi.org/10.5194/acp-23-15181-2023, 2023.
Bjørklund, G., Crisponi, G., Nurchi, V. M., Cappai, R., Buha Djordjevic, A., and Aaseth, J.: A Review on Coordination Properties of Thiol-Containing Chelating Agents Towards Mercury, Cadmium, and Lead, Molecules, 24, 3247, https://doi.org/10.3390/molecules24183247, 2019.
Bürgmann, H., Howard, E. C., Ye, W., Sun, F., Sun, S., Napierala, S., and Moran, M. A.: Transcriptional response of Silicibacter pomeroyi DSS-3 to dimethylsulfoniopropionate (DMSP), Environ. Microbiol., 9, 2742–2755, https://doi.org/10.1111/j.1462-2920.2007.01386.x, 2007.
Chamba, G., Sellegri, K., Gros, V., Rose, C., Williams, L., Berdalet, E., Vaqué, D., Vila, M., Güell-Bujons, Q., Sà, E.-L., Castillo, Y. M., Rocchi, A., Colomb, A., Pichon, J.-M., Ribeiro, M., Wohl, C., Dall'Osto, M., and Simó, R.: DMS, MeSH and nanoparticles in semi-controlled deck-borne experiments using Antarctic seawater: on the effect of UV light, EGUsphere [preprint], https://doi.org/10.5194/egusphere-2026-1720, 2026.
Chang, Y., Ding, T., Yu, H., Yang, Y., Zhu, L., Liu, X., and Tan, W.: All-in-one: validation and versatile applications of a novel chemical ionization mass spectrometer for simultaneous measurements of volatile organic and inorganic compounds, Atmos. Meas. Tech., 19, 1515–1528, https://doi.org/10.5194/amt-19-1515-2026, 2026.
Davie-Martin, C. L., Giovannoni, S. J., Behrenfeld, M. J., Penta, W. B., and Halsey, K. H.: Seasonal and Spatial Variability in the Biogenic Production and Consumption of Volatile Organic Compounds (VOCs) by Marine Plankton in the North Atlantic Ocean, Front. Mar. Sci., 7, https://doi.org/10.3389/fmars.2020.611870, 2020.
Deppeler, S. L. and Davidson, A. T.: Southern Ocean Phytoplankton in a Changing Climate, Front. Mar. Sci., 4, https://doi.org/10.3389/fmars.2017.00040, 2017.
Deschaseaux, E. S. M., Dunne, E., Schulz, K. G., Eyre, B. D., and Harrison, D. P.: The Central Great Barrier Reef as a Net Source of Climatically Relevant Biogenic Volatile Organic Compounds, J. Geophys. Res.-Oceans, 130, e2024JC021192, https://doi.org/10.1029/2024JC021192, 2025.
Fiddes, S. L., Protat, A., Mallet, M. D., Alexander, S. P., and Woodhouse, M. T.: Southern Ocean cloud and shortwave radiation biases in a nudged climate model simulation: does the model ever get it right?, Atmos. Chem. Phys., 22, 14603–14630, https://doi.org/10.5194/acp-22-14603-2022, 2022.
Flöck, O. R. and Andreae, M. O.: Photochemical and non-photochemical formation and destruction of carbonyl sulfide and methyl mercaptan in ocean waters, Mar. Chem., 54, 11–26, https://doi.org/10.1016/0304-4203(96)00027-8, 1996.
Fung, K. M., Heald, C. L., Kroll, J. H., Wang, S., Jo, D. S., Gettelman, A., Lu, Z., Liu, X., Zaveri, R. A., Apel, E. C., Blake, D. R., Jimenez, J.-L., Campuzano-Jost, P., Veres, P. R., Bates, T. S., Shilling, J. E., and Zawadowicz, M.: Exploring dimethyl sulfide (DMS) oxidation and implications for global aerosol radiative forcing, Atmos. Chem. Phys., 22, 1549–1573, https://doi.org/10.5194/acp-22-1549-2022, 2022.
Galí, M. and Simó, R.: A meta-analysis of oceanic DMS and DMSP cycling processes: Disentangling the summer paradox, Global Biogeochem. Cy., 29, 496–515, https://doi.org/10.1002/2014GB004940, 2015.
Galí, M., Saló, V., Almeda, R., Calbet, A., and Simó, R.: Stimulation of gross dimethylsulfide (DMS) production by solar radiation, Geophys. Res. Lett., 38, https://doi.org/10.1029/2011GL048051, 2011.
Galí, M., Simó, R., Vila-Costa, M., Ruiz-González, C., Gasol, J. M., and Matrai, P.: Diel patterns of oceanic dimethylsulfide (DMS) cycling: Microbial and physical drivers, Global Biogeochem. Cy., 27, 620–636, https://doi.org/10.1002/gbc.20047, 2013.
Galí, M., Devred, E., Pérez, G. L., Kieber, D. J., and Simó, R.: Global Ocean dimethylsulfide photolysis rates quantified with a spectrally and vertically resolved model, Limnol. Oceanogr. Lett., 8, 760–769, https://doi.org/10.1002/lol2.10342, 2023.
Gorbunov, M. Y., Shirsin, E., Nikonova, E. E., Fadeev, V. V., and Falkowski, P. G.: A multi-spectral fluorescence induction and relaxation (FIRe) technique for physiological and taxonomic analysis of phytoplankton communities, Mar. Ecol. Prog. Ser., 644, 1–13, https://doi.org/10.3354/MEPS13358, 2020.
Gros, V., Bonsang, B., Sarda-Estève, R., Nikolopoulos, A., Metfies, K., Wietz, M., and Peeken, I.: Concentrations of dissolved dimethyl sulfide (DMS), methanethiol and other trace gases in context of microbial communities from the temperate Atlantic to the Arctic Ocean, Biogeosciences, 20, 851–867, https://doi.org/10.5194/bg-20-851-2023, 2023.
He, X.-C., Abraham, N. L., Ding, H., Russo, M. R., Grosvenor, D. P., Ge, Y., Wang, X., Jones, A. C., Campuzano-Jost, P., Nault, B., Kupc, A., Blake, D., Jimenez, J. L., Williamson, C. J., Weber, J., Archibald, A. T., and Gordon, H.: Evaluation of UKESM aerosol size and composition using ATom measurements indicates missing marine aerosol formation mechanisms, Atmos. Chem. Phys., 26, 3805–3851, https://doi.org/10.5194/acp-26-3805-2026, 2026.
Henley, S. F., Cavan, E. L., Fawcett, S. E., Kerr, R., Monteiro, T., Sherrell, R. M., Bowie, A. R., Boyd, P. W., Barnes, D. K. A., Schloss, I. R., Marshall, T., Flynn, R., and Smith, S.: Changing Biogeochemistry of the Southern Ocean and Its Ecosystem Implications, Front. Mar. Sci., 7, https://doi.org/10.3389/fmars.2020.00581, 2020.
Hodshire, A. L., Campuzano-Jost, P., Kodros, J. K., Croft, B., Nault, B. A., Schroder, J. C., Jimenez, J. L., and Pierce, J. R.: The potential role of methanesulfonic acid (MSA) in aerosol formation and growth and the associated radiative forcings, Atmos. Chem. Phys., 19, 3137–3160, https://doi.org/10.5194/acp-19-3137-2019, 2019.
Hopkins, F. E., Archer, S. D., Bell, T. G., Suntharalingam, P., and Todd, J. D.: The biogeochemistry of marine dimethylsulfide, Nat. Rev. Earth Environ., 4, 361–376, https://doi.org/10.1038/s43017-023-00428-7, 2023.
Hossain, M., Garland, R. M., and Horowitz, H. M.: Quantifying the impacts of marine aerosols over the southeast Atlantic Ocean using a chemical transport model: implications for aerosol–cloud interactions, Atmos. Chem. Phys., 24, 14123–14143, https://doi.org/10.5194/acp-24-14123-2024, 2024.
Hsu, S. A., Meindl, E. A., and Gilhousen, D. B.: Determining the Power-Law Wind-Profile Exponent under Near-Neutral Stability Conditions at Sea, Appl. Meteorol., 33, https://doi.org/10.1175/1520-0450(1994)033<0757:DTPLWP>2.0.CO;2, 1994.
Hulswar, S., Simó, R., Galí, M., Bell, T. G., Lana, A., Inamdar, S., Halloran, P. R., Manville, G., and Mahajan, A. S.: Third revision of the global surface seawater dimethyl sulfide climatology (DMS-Rev3), Earth Syst. Sci. Data, 14, 2963–2987, https://doi.org/10.5194/essd-14-2963-2022, 2022.
Hunt, D. E., Lin, Y., Church, M. J., Karl, D. M., Tringe, S. G., Izzo, L. K., and Johnson, Z. I.: Relationship between Abundance and Specific Activity of Bacterioplankton in Open Ocean Surface Waters, Appl. Environ. Microbiol., 79, 177–184, https://doi.org/10.1128/AEM.02155-12, 2013.
Ishino, S., Willis, M. D., Angot, H., Bartels-Rausch, T., Crabeck, O., Delille, B., Dunne, E., Franklin, E., Haddon, A., Hayashida, H., Joge, S. D., Lapere, R., Lim, H.-G., Mahajan, A. S., Mallet, M. D., Manville, G., Marelle, L., Nomura, D., Pratt, K. A., Peeken, I., Price, R., Simó, R., Stefels, J., Thomas, J. L., Zang, C. L., and Steiner, N.: The biogenic sulfur cycle in the coupled ocean–sea ice–atmosphere system, Elementa: Sci. Anthropo., 14, 1–60, https://doi.org/10.1525/elementa.2025.00067, 2026.
Jacob, L. S. D., Giorio, C., and Archibald, A. T.: Extension, development, and evaluation of the representation of the OH-initiated dimethyl sulfide (DMS) oxidation mechanism in the Master Chemical Mechanism (MCM) v3.3.1 framework, Atmos. Chem. Phys., 24, 3329–3347, https://doi.org/10.5194/acp-24-3329-2024, 2024.
Johnson, M. T.: A numerical scheme to calculate temperature and salinity dependent air-water transfer velocities for any gas, Ocean Sci., 6, 913–932, https://doi.org/10.5194/os-6-913-2010, 2010.
Jones, G. B., Curran, M. A. J., Swan, H. B., Greene, R. M., Griffiths, F. B., and Clementson, L. A.: Influence of different water masses and biological activity on dimethylsulphide and dimethylsulphoniopropionate in the subantarctic zone of the Southern Ocean during ACE 1, J. Geophys. Res.-Atmos., 103, 16691–16701, https://doi.org/10.1029/98JD01200, 1998.
Kameyama, S., Tanimoto, H., Inomata, S., Suzuki, K., Komatsu, D. D., Hirota, A., Konno, U. T. A., and Tsunogai, U.: Application of PTR-MS to an incubation experiment of the marine diatom Thalassiosira pseudonana, Geochem. J., 45, 355–363, https://doi.org/10.2343/geochemj.1.0127, 2011.
Kettle, A. J., Rhee, T. S., Von Hobe, M., Poulton, A., Aiken, J., and Andreae, M. O.: Assessing the flux of different volatile sulfur gases from the ocean to the atmosphere, J. Geophys. Res.-Atmos., 106, 12193–12209, https://doi.org/10.1029/2000JD900630, 2001.
Kiene, R. P.: Production of methanethiol from dimethylsulfoniopropionate in marine surface waters, Mar. Chem., 54, 69–83, https://doi.org/10.1016/0304-4203(96)00006-0, 1996.
Kiene, R. P. and Linn, L. J.: The fate of dissolved dimethylsulfoniopropionate (DMSP) in seawater: tracer studies using 35S-DMSP, Geochim. Cosmochim. Acta, 64, 2797–2810, https://doi.org/10.1016/S0016-7037(00)00399-9, 2000.
Kiene, R. P. and Slezak, D.: Low dissolved DMSP concentrations in seawater revealed by small-volume gravity filtration and dialysis sampling, Limnol. Oceanogr. Methods, 4, 80–95, https://doi.org/10.4319/lom.2006.4.80, 2006.
Kiene, R. P., Linn, L. J., González, J., Moran, M. A., and Bruton, J. A.: Dimethylsulfoniopropionate and methanethiol are important precursors of methionine and protein-sulfur in marine bacterioplankton, Appl. Environ. Microbiol., 65, 4549–4558, https://doi.org/10.1128/AEM.65.10.4549-4558.1999, 1999.
Kiene, R. P., Linn, L. J., and Bruton, J. A.: New and important roles for DMSP in marine microbial communities, J. Sea Res., 43, 209–224, https://doi.org/10.1016/S1385-1101(00)00023-X, 2000.
Kiene, R. P., Dacey, J., Rellinger, A. N., and Williams, T. E.: Standing stocks and rates for organic sulfur compounds during summer in the subarctic Northeast Pacific (Version 2), https://doi.org/10.26008/1912/bco-dmo.705636.2, 2021.
Kilgour, D. B., Jernigan, C. M., Zhou, S., Brito de Azevedo, E., Wang, J., Zawadowicz, M. A., and Bertram, T. H.: Contribution of Speciated Monoterpenes to Secondary Aerosol in the Eastern North Atlantic, ACS ES&T Air, 555–566, https://doi.org/10.1021/acsestair.3c00112, 2024.
Kinsey, J. D. and Kieber, D. J.: Microwave preservation method for DMSP, DMSO, and acrylate in unfiltered seawater and phytoplankton culture samples, Limnol. Oceanogr. Methods, 14, 196–209, https://doi.org/10.1002/lom3.10081, 2016.
Kinsey, J. D., Tyssebotn, I. M. B., and Kieber, D. J.: Effect of PAR irradiance intensity on Phaeocystis antarctica (Prymnesiophyceae) growth and DMSP, DMSO, and acrylate concentrations, J. Phycol., 59, 963–979, https://doi.org/10.1111/jpy.13360, 2023.
Landa, M., Burns, A. S., Durham, B. P., Esson, K., Nowinski, B., Sharma, S., Vorobev, A., Nielsen, T., Kiene, R. P., and Moran, M. A.: Sulfur metabolites that facilitate oceanic phytoplankton–bacteria carbon flux, The ISME J., 13, 2536–2550, https://doi.org/10.1038/s41396-019-0455-3, 2019.
Lawson, S. J., Law, C. S., Harvey, M. J., Bell, T. G., Walker, C. F., de Bruyn, W. J., and Saltzman, E. S.: Methanethiol, dimethyl sulfide and acetone over biologically productive waters in the southwest Pacific Ocean, Atmos. Chem. Phys., 20, 3061–3078, https://doi.org/10.5194/acp-20-3061-2020, 2020.
Li, C.-X., Chen, K., Sun, X., Liu, L., Xin, M., Liu, X.-L., and Wang, B.-D.: Summer sea ice melting enhances phytoplankton and dimethyl sulfide production, Limnol. Oceanogr., 69, 2453–2472, https://doi.org/10.1002/lno.12681, 2024.
Liss, P. S. and Slater, P. G.: Flux of Gases across the Air-Sea Interface, Nature, 247, 181–184, https://doi.org/10.1038/247181a0, 1974.
Mallet, M. D., Humphries, R. S., Fiddes, S. L., Alexander, S. P., Altieri, K., Angot, H., Anilkumar, N., Bartels-Rausch, T., Creamean, J., Dall'Osto, M., Dommergue, A., Frey, M., Henning, S., Lannuzel, D., Lapere, R., Mace, G. G., Mahajan, A. S., McFarquhar, G. M., Meiners, K. M., Miljevic, B., Peeken, I., Protat, A., Schmale, J., Steiner, N., Sellegri, K., Simó, R., Thomas, J. L., Willis, M. D., Winton, V. H. L., and Woodhouse, M. T.: Untangling the influence of Antarctic and Southern Ocean life on clouds, Elementa: Sci. Anthropo., 11, 00130, https://doi.org/10.1525/elementa.2022.00130, 2023.
Masdeu-Navarro, M., Mangot, J.-F., Xue, L., Cabrera-Brufau, M., Gardner, S. G., Kieber, D. J., González, J. M., and Simó, R.: Spatial and diel patterns of volatile organic compounds, DMSP-derived compounds, and planktonic microorganisms around a tropical scleractinian coral colony, Front. Mar. Sci., 9, https://doi.org/10.3389/fmars.2022.944141, 2022.
McCoy, D. T., Burrows, S. M., Wood, R., Grosvenor, D. P., Elliott, S. M., Ma, P.-L., Rasch, P. J., and Hartmann, D. L.: Natural aerosols explain seasonal and spatial patterns of Southern Ocean cloud albedo, Sci. Adv., 1, e1500157, https://doi.org/10.1126/sciadv.1500157, 2015.
McParland, E. L. and Levine, N. M.: The role of differential DMSP production and community composition in predicting variability of global surface DMSP concentrations, Limnol. Oceanogr., 64, 757–773, https://doi.org/10.1002/lno.11076, 2019.
Mynard, C., Franklin, E. B., Alroe, J., Somerville, N., Patti, A., Siems, S. T., Williams, A., Mallet, M. D., Humphries, R., and Dunne, E.: Constraining Atmospheric Methanethiol Estimates Over the Southern Ocean, Geophys. Res. Lett., 52, e2025GL116470, https://doi.org/10.1029/2025GL116470, 2025.
Novak, G. A., Kilgour, D. B., Jernigan, C. M., Vermeuel, M. P., and Bertram, T. H.: Oceanic emissions of dimethyl sulfide and methanethiol and their contribution to sulfur dioxide production in the marine atmosphere, Atmos. Chem. Phys., 22, 6309–6325, https://doi.org/10.5194/acp-22-6309-2022, 2022.
Omori, Y., Takahashi, T., Wada, S., Hama, T., Inomata, S., and Tanimoto, H.: Production of Oxygen- and Sulfur-Containing Volatile Organic Compounds by Marine Bacteria From Coastal Seawater, J. Geophys. Res.-Biogeosci., 130, e2025JG008969, https://doi.org/10.1029/2025JG008969, 2025.
Padaki, V. G., Palmer, E., Jiang, Y., Buchholz, H. H., Kimbrel, J. A., and Halsey, K. H.: Diatom volatile organic compound production is driven by diel metabolism and the cell cycle, Front. Microbiol., 16, https://doi.org/10.3389/fmicb.2025.1620542, 2025.
Petrou, K., Kranz, S. A., Trimborn, S., Hassler, C. S., Ameijeiras, S. B., Sackett, O., Ralph, P. J., and Davidson, A. T.: Southern Ocean phytoplankton physiology in a changing climate, J. Plant Physiol., 203, 135–150, https://doi.org/10.1016/j.jplph.2016.05.004, 2016.
Read, K. A., Lewis, A. C., Bauguitte, S., Rankin, A. M., Salmon, R. A., Wolff, E. W., Saiz-Lopez, A., Bloss, W. J., Heard, D. E., Lee, J. D., and Plane, J. M. C.: DMS and MSA measurements in the Antarctic Boundary Layer: impact of BrO on MSA production, Atmos. Chem. Phys., 8, 2985–2997, https://doi.org/10.5194/acp-8-2985-2008, 2008.
Rellinger, A. N., Kiene, R. P., del Valle, D. A., Kieber, D. J., Slezak, D., Harada, H., Bisgrove, J., and Brinkley, J.: Occurrence and turnover of DMSP and DMS in deep waters of the Ross Sea, Antarctica, Deep Sea Res. I, 56, 686–702, https://doi.org/10.1016/j.dsr.2008.12.010, 2009.
Rocchi, A., Fitzsimons, M. F., Akenga, P., Sotomayor, A., Sà, E. L., Güell-Bujons, Q., Vila, M., Castillo, Y. M., Dall'Osto, M., Vaqué, D., Wohl, C., Simó, R., and Berdalet, E.: Distribution of alkylamines in surface waters around the Antarctic Peninsula and Weddell Sea, Biogeosciences, 22, 3429–3448, https://doi.org/10.5194/bg-22-3429-2025, 2025.
Rocco, M., Dunne, E., Salignat, R., Saint-Macary, A., Peltola, M., Barthelmeß, T., Chamba, G., Barr, N., Safi, K., Marriner, A., Deppeler, S., Rose, C., Uitz, J., Harnwell, J., Engel, A., Colomb, A., Saiz-Lopez, A., Harvey, M. J., Law, C. S., and Sellegri, K.: Relating Dimethyl Sulphide and Methanethiol Fluxes to Surface Biota in the South-West Pacific Using Shipboard Air-Sea Interface Tanks, J. Geophys. Res.-Atmos., 130, e2024JD041072, https://doi.org/10.1029/2024JD041072, 2025.
Royer, S. J., Galí, M., Mahajan, A. S., Ross, O. N., Pérez, G. L., Saltzman, E. S., and Simó, R.: A high-resolution time-depth view of dimethylsulphide cycling in the surface sea, Sci. Rep., 6, 32325, https://doi.org/10.1038/srep32325, 2016.
Sander, R.: Compilation of Henry's law constants (version 5.0.0) for water as solvent, Atmos. Chem. Phys., 23, 10901–12440, https://doi.org/10.5194/acp-23-10901-2023, 2023.
Schmale, J., Baccarini, A., Thurnherr, I., Henning, S., Efraim, A., Regayre, L., Bolas, C., Hartmann, M., Welti, A., Lehtipalo, K., Aemisegger, F., Tatzelt, C., Landwehr, S., Modini, R. L., Tummon, F., Johnson, J. S., Harris, N., Schnaiter, M., Toffoli, A., Derkani, M., Bukowiecki, N., Stratmann, F., Dommen, J., Baltensperger, U., Wernli, H., Rosenfeld, D., Gysel-Beer, M., and Carslaw, K. S.: Overview of the Antarctic Circumnavigation Expedition: Study of Preindustrial-like Aerosols and Their Climate Effects (ACE-SPACE), B. Am. Meteorol. Soc., https://doi.org/10.1175/bams-d-18-0187.1, 2019.
Schoemann, V., Becquevort, S., Stefels, J., Rousseau, V., and Lancelot, C.: Phaeocystis blooms in the global ocean and their controlling mechanisms: a review, J. Sea Res., 53, 43–66, https://doi.org/10.1016/j.seares.2004.01.008, 2005.
Sheehan, C. E. and Petrou, K.: Dimethylated sulfur production in batch cultures of Southern Ocean phytoplankton, Biogeochemistry, 147, 53–69, https://doi.org/10.1007/s10533-019-00628-8, 2020.
Shemi, A., Ben-Dor, S., Rotkopf, R., Dym, O., and Vardi, A.: Phylogeny and biogeography of the algal DMS-releasing enzyme in the global ocean, ISME Commun., 3, 1–9, https://doi.org/10.1038/s43705-023-00280-2, 2023.
Simó, R.: Production of atmospheric sulfur by oceanic plankton: biogeochemical, ecological and evolutionary links, Trend. Ecol. Evolut., 16, 287–294, https://doi.org/10.1016/S0169-5347(01)02152-8, 2001.
Stefels, J., Steinke, M., Turner, S., Malin, G., and Belviso, S.: Environmental constraints on the production and removal of the climatically active gas dimethylsulphide (DMS) and implications for ecosystem modelling, Biogeochemistry, 83, 245–275, https://doi.org/10.1007/s10533-007-9091-5, 2007.
Sun, J., Todd, J. D., Thrash, J. C., Qian, Y., Qian, M. C., Temperton, B., Guo, J., Fowler, E. K., Aldrich, J. T., Nicora, C. D., Lipton, M. S., Smith, R. D., De Leenheer, P., Payne, S. H., Johnston, A. W. B., Davie-Martin, C. L., Halsey, K. H., and Giovannoni, S. J.: The abundant marine bacterium Pelagibacter simultaneously catabolizes dimethylsulfoniopropionate to the gases dimethyl sulfide and methanethiol, Nat. Microbiol., 1, 16065, https://doi.org/10.1038/nmicrobiol.2016.65, 2016.
Tan, L., Xu, W., He, X., and Wang, J.: The feasibility of Fv/Fm on judging nutrient limitation of marine algae through indoor simulation and in situ experiment, Estu. Coast. Shelf Sci., 229, 106411, https://doi.org/10.1016/j.ecss.2019.106411, 2019.
Tashmim, L., Porter, W. C., Bertram, T. H., Kilgour, D. B., and Rollins, A.: Global Impacts of Marine Methanethiol Emissions and Chemistry in the Atmosphere, Environ. Sci. Technol., 59, 20421–20428, https://doi.org/10.1021/acs.est.5c02019, 2025.
Teng, Z.-J., Qin, Q.-L., Zhang, W., Li, J., Fu, H.-H., Wang, P., Lan, M., Luo, G., He, J., McMinn, A., Wang, M., Chen, X.-L., Zhang, Y.-Z., Chen, Y., and Li, C.-Y.: Biogeographic traits of dimethyl sulfide and dimethylsulfoniopropionate cycling in polar oceans, Microbiome, 9, 207, https://doi.org/10.1186/s40168-021-01153-3, 2021.
Ulshöfer, V. S., Flöck, O. R., Uher, G., and Andreae, M. O.: Photochemical production and air-sea exchange of carbonyl sulfide in the eastern Mediterranean Sea, Mar. Chem., 53, 25–39, https://doi.org/10.1016/0304-4203(96)00010-2, 1996.
Vaqué, D., Berdalet, E., Sotomayor-Garcia, A., Estrada, M., Cabrera-Brufau, M., Masdeu-Navarro, M., Rocchi, A., López-Alforja, X., Vila, M., Marrasé, C., Simó, R., Dall'osto, M., and Sala, M. M.: Assessing the relationship between viruses and protists and their role in dimethylsulphoniopropionate release in Antarctic surface microlayers, Antarct. Sci., 37, 265–277, https://doi.org/10.1017/S0954102025100205, 2025.
Wang, S., Elliott, S., Maltrud, M., and Cameron-Smith, P.: Influence of explicit Phaeocystis parameterizations on the global distribution of marine dimethyl sulfide, J. Geophys. Res.- Biogeosci., 120, 2158–2177, https://doi.org/10.1002/2015JG003017, 2015.
Wanninkhof, R.: Relationship between wind speed and gas exchange over the ocean revisited, Limnol. Oceanogr. Methods, 12, 351–362, https://doi.org/10.4319/lom.2014.12.351, 2014.
Webb, A. L., van Leeuwe, M. A., den Os, D., Meredith, M. P., Venables, H. J., and Stefels, J.: Extreme spikes in DMS flux double estimates of biogenic sulfur export from the Antarctic coastal zone to the atmosphere, Sci. Rep., 9, 1–11, https://doi.org/10.1038/s41598-019-38714-4, 2019.
Williams, L. R.: Measurements of methanethiol (MeSH) and dimethyl sulfide (DMS) in air during POLAR-CHANGE Antarctic research cruise 2023 on board the BIO Hespérides, Zenodo [data set], https://doi.org/10.5281/zenodo.18434929, 2026.
Wohl, C.: Measurements of Methanethiol (MeSH) and dimethyl sulfide (DMS) in surface seawater during POLAR-CHANGE Antarctic expedition 2023 on board the BIO Hespérides, Zenodo [data set], https://doi.org/10.5281/zenodo.12758981, 2024.
Wohl, C. and Simó, R.: Measurements of methanethiol (MeSH) and dimethyl sulfide (DMS) in surface seawater during 2022 at the monthly sampling observatory of Blanes Bay Microbial Observatory, Zenodo, https://zenodo.org/records/12758703, 2024.
Wohl, C., Capelle, D., Jones, A., Sturges, W. T., Nightingale, P. D., Else, B. G. T., and Yang, M.: Segmented flow coil equilibrator coupled to a proton-transfer-reaction mass spectrometer for measurements of a broad range of volatile organic compounds in seawater, Ocean Sci., 15, 925–940, https://doi.org/10.5194/os-15-925-2019, 2019.
Wohl, C., Brown, I., Kitidis, V., Jones, A. E., Sturges, W. T., Nightingale, P. D., and Yang, M.: Underway seawater and atmospheric measurements of volatile organic compounds in the Southern Ocean, Biogeosciences, 17, 2593–2619, https://doi.org/10.5194/bg-17-2593-2020, 2020.
Wohl, C., Jones, A. E., Sturges, W. T., Nightingale, P. D., Else, B., Butterworth, B. J., and Yang, M.: Sea ice concentration impacts dissolved organic gases in the Canadian Arctic, Biogeosciences, 19, 1021–1045, https://doi.org/10.5194/bg-19-1021-2022, 2022.
Wohl, C., Güell-Bujons, Q., Castillo, Y. M., Calbet, A., and Simó, R.: Volatile Organic Compounds Released by Oxyrrhis marina Grazing on Isochrysis galbana, Oceans, 4, 151–169, https://doi.org/10.3390/oceans4020011, 2023a.
Wohl, C., Li, Q., Cuevas, C. A., Fernández, R. P., Yang, M., Saiz-Lopez, A., and Simó, R.: Marine biogenic emissions of benzene and toluene and their contribution to secondary organic aerosols over the polar oceans, Sci. Adv., 9, 1–12, https://doi.org/10.1126/sciadv.add9031, 2023b.
Wohl, C., Villamayor, J., Galí, M., Mahajan, A. S., Fernández, R. P., Cuevas, C. A., Bossolasco, A., Li, Q., Kettle, A. J., Williams, T., Sarda-Esteve, R., Gros, V., Simó, R., and Saiz-Lopez, A.: Marine emissions of methanethiol increase aerosol cooling in the Southern Ocean, Sci. Adv., 10, eadq2465, https://doi.org/10.1126/sciadv.adq2465, 2024.
Wohl, C., Forster, G. L., Edwards, P. M., Suntharalingam, P., and Oram, D. E.: Methanethiol Abundance and Oxidation in a Polluted Marine Atmosphere, Geophys. Res. Lett., 52, e2025GL114929, https://doi.org/10.1029/2025GL114929, 2025.
Wolfe, G. M., Nicely, J. M., St. Clair, J. M., Hanisco, T. F., Liao, J., Oman, L. D., Brune, W. B., Miller, D., Thames, A., González Abad, G., Ryerson, T. B., Thompson, C. R., Peischl, J., McKain, K., Sweeney, C., Wennberg, P. O., Kim, M., Crounse, J. D., Hall, S. R., Ullmann, K., Diskin, G., Bui, P., Chang, C., and Dean-Day, J.: Mapping hydroxyl variability throughout the global remote troposphere via synthesis of airborne and satellite formaldehyde observations, P. Natl. Acad. Sci. USA, 116, 11171–11180, https://doi.org/10.1073/pnas.1821661116, 2019.
Yang, M., Blomquist, B. W., Fairall, C. W., Archer, S. D., and Huebert, B. J.: Air-sea exchange of dimethylsulfide in the Southern Ocean: Measurements from SO GasEx compared to temperate and tropical regions, J. Geophys. Res.-Oceans, 116, https://doi.org/10.1029/2010JC006526, 2011.
Yang, M., Archer, S. D., Blomquist, B. W., Ho, D. T., Lance, V. P., and Torres, R. J.: Lagrangian evolution of DMS during the Southern Ocean gas exchange experiment: The effects of vertical mixing and biological community shift, J. Geophys. Res.-Oceans, 118, 6774–6790, https://doi.org/10.1002/2013JC009329, 2013a.
Yang, M., Nightingale, P. D., Beale, R., Liss, P. S., Blomquist, B. W., and Fairall, C. W.: Atmospheric deposition of methanol over the Atlantic Ocean, P. Natl. Acad. Sci. USA, 110, 20034–20039, https://doi.org/10.1073/pnas.1317840110, 2013b.
Zhang, M., Park, K.-T., Yan, J., Park, K., Wu, Y., Jang, E., Gao, W., Tan, G., Wang, J., and Chen, L.: Atmospheric dimethyl sulfide and its significant influence on the sea-to-air flux calculation over the Southern Ocean, Prog. Oceanogr., 186, 102392, https://doi.org/10.1016/j.pocean.2020.102392, 2020.