
the Creative Commons Attribution 4.0 License.
the Creative Commons Attribution 4.0 License.
 | 17 Jul 2026
Reconstructed VOC emissions reveal hidden ozone precursors: Overlooked roles of primary OVOCs and unmeasured species
Sijia Yin
Gan Yang
Chuang Li
Qingyan Fu
Juntao Huo
Yuruo Fu
Rengqi Yan
Ambient volatile organic compounds (VOCs), including non-methane hydrocarbons (NMHCs) and oxygenated VOCs (OVOCs), are critical precursors of tropospheric ozone (O3). However, conventional estimates of the ozone formation potential (OFP) derived from observed VOC concentrations may introduce substantial biases, as they neglect the photochemical degradation of primary VOCs and the concurrent generation of secondary OVOCs during atmospheric transport. This study quantified the sources of ambient OVOCs at a suburban site in Shanghai, China during summer 2020 to reconstruct their initial emission concentrations. Together with the reconstructed initial concentrations of NMHCs, we estimated the OFP of freshly emitted VOCs. In addition, the sources and the OFP of unmeasured VOCs were inferred by concurrent measurements of missing OH reactivity. Our results demonstrate that photochemical reactions substantially altered the composition and source characteristics of VOCs, leading to pronounced discrepancies in the OFP estimation between observed and reconstructed initial concentrations. Specifically, the OFP contributions from reconstructed primary emitted NMHCs (52.3 %) were underestimated by 31.7 % when derived from observed concentrations for this site, whereas those from reconstructed primary emitted OVOCs (33.2 %) were overestimated by 42.6 %. Reconstructed VOC emissions indicated that anthropogenic sources dominated total emissions (71.5 %), whereas OVOCs constituted a substantial fraction of total VOC emissions (40.8 %). Unmeasured VOCs, primarily of biogenic origin, contributed an additional 12.6 %. Collectively, OVOCs and unmeasured species exhibited an OFP comparable to NMHCs, underscoring their critical role in O3 production and the necessity of incorporating these species into the design of comprehensive and effective O3 control strategies.
- Article
(1971 KB) - Full-text XML
-
Supplement
(1307 KB) - BibTeX
- EndNote


As a critical group of precursors for ozone (O3), atmospheric volatile organic compounds (VOCs), including non-methane hydrocarbons (NMHCs) and oxygenated VOCs (OVOCs), have attracted considerable attention in air pollution mitigation strategies (Atkinson and Arey, 2003; Atkinson and Carter, 1984; Mellouki et al., 2015). To identify key O3 precursors, the maximum incremental reactivity (MIR) method is widely applied to calculate the ozone formation potential (OFP) of VOCs (Gu et al., 2021; Huang et al., 2020; Ou et al., 2015; Wang et al., 2023). By definition, the MIR coefficient quantifies the mass of O3 formed per unit mass of a freshly emitted VOC (i.e., before any photochemical processing) (Carter, 1994, 2010); a physically consistent OFP must therefore be evaluated from the initial emission concentrations rather than from ambient observations. However, most OFP studies are performed with observed VOC concentrations after atmospheric processing (Cui et al., 2022; Huang et al., 2020; Hui et al., 2023; Shang et al., 2022), which may bias the identification of key O3 precursors, as the degradation of NMHCs and the concurrent formation of secondary OVOCs during atmospheric transport can significantly alter compositions and concentrations of VOCs. This bias has recently been demonstrated by reconstructing emitted concentrations from ambient observations, which revealed that observation-based OFP underestimates reactive NMHCs and overestimates OVOCs (Zheng and Xie, 2025).
While it is relatively straightforward to understand the photodegradation of NMHCs and trace back to their initial concentrations, it is less common to notice that ambient OVOCs are not only directly emitted from anthropogenic and biogenic sources, but also generated from photochemical oxidation of precursors (Huang et al., 2020; Ou et al., 2015). Therefore, calculating OFP using observed OVOC concentrations could overestimate their true contributions unless the secondary fraction is excluded. However, this overestimation bias in the OFP of OVOCs has been previously explored, but not for a broad range of OVOCs detected by multiple state-of-the-art instruments. An accurate source apportionment of primary and secondary OVOCs is thus essential for a reliable OFP estimation.
Commonly used VOC source appointment approaches, including principal component analysis, positive matrix factorization, and chemical mass balance, generally rely on observed VOC concentrations as input without explicitly accounting for photochemical loss of VOCs during atmospheric transport, and thus could introduce uncertainties in source apportionment results. In contrast, the photochemical age-based parameterization method (PAPM) explicitly incorporates OH radical oxidation and photolysis of OVOCs (De Gouw et al., 2005, 2018), enabling a more precise quantification of their sources. While the PAPM has been widely applied to OVOC source apportionment in China (Huang et al., 2020; Li et al., 2024b), its application remains limited to a few OVOCs, such as formaldehyde, acetaldehyde, and acetone. The source distributions of other critical OVOCs are yet to be characterized (Li et al., 2024b).
In addition, a large number of VOCs remain undetected or unquantified by current analytical techniques, especially those with multifunctional groups or complex molecular structures (Spinelle et al., 2017; Wang et al., 2024). These unmeasured VOCs can profoundly affect our understanding of VOC contributions to O3 formation. For instance, Tan et al. (2019) reported that unmeasured species accounted for up to 60 % of O3 production and contributed nearly 50 % to the total OH reactivity (ROH) at a suburban site in Heshan, China. Other studies have shown that unmeasured VOCs resulted in up to a 46 % overestimation in the response of O3 to nitrogen oxides (NOx) (Wang et al., 2024), and a 30 % underestimation in simulated net O3 production rates (Zhou et al., 2024). Collectively, these findings underscore the critical importance of unmeasured VOCs in accurately characterizing O3 formation.
In this study, we applied the PAPM to quantify the contributions of anthropogenic and biogenic sources to 208 OVOCs measured at a suburban site of Shanghai, China from 1 August to 15 September 2020 (Yang et al., 2022). In addition, the sources of unmeasured VOCs were inferred using measurements of missing ROH combined with a multiple linear regression (MLR) approach. Based on the source apportionment results, the initial emission concentrations of OVOCs, NMHCs, and unmeasured VOCs were reconstructed to evaluate their OFP at the emission site, and to identify the key O3 precursors and contributing sources.
2.1 Field campaign
A field campaign was carried out at the Dianshan Lake (DSL) Air Quality Monitoring Supersite (120.98° E, 31.09° N), Shanghai, China (Fig. S1 in the Supplement). The sampling site is ∼ 15 m above ground, and surrounded by farmland, vegetation, several villages, and Dianshan Lake. As a representative of the suburban environment, this site has been frequently selected as a reference site for the study of air pollution in the Yangtze River Delta region (Feng et al., 2023; Wu et al., 2023; Yang et al., 2022).
Table S1 summarizes the observed concentrations of VOCs. A gas chromatograph with mass spectrometry and flame ionization detection (hereinafter referred to as GC-MS/FID; TH-PKU 300B, Wuhan Tianhong Instrument Co. Ltd., China) was used to measure 56 Photochemical Assessment Monitoring Station (PAMS) compounds (including 29 alkanes, 10 alkenes, 16 aromatics, and acetylene) and 11 carbonyls (including 6 aldehydes and 5 ketones), a Kore proton transfer reaction time-of-flight mass spectrometry (KORE PTR 3C, KORE Technologies, UK) was used to measure formaldehyde and acetaldehyde, and a Vocus-2R PTR-TOF-MS (Vocus-PTR, Tofwerk AG and Aerodyne Research Inc., USA) was used to measure 57 NMHCs and 195 OVOCs without definitive identity assignments. In total, 321 VOCs (including 56 PAMS, 13 carbonyls, 57 unspecified NMHCs, and 195 unspecified OVOCs) were quantified in this campaign. In addition to VOC measurements, O3, NOx, temperature, and relative humidity were continuously monitored during the campaign. Details of the instruments and their operation have been described previously (Yang et al., 2022).
Additionally, ROH was measured using a comparative reactivity method (CRM) (Sinha et al., 2008; Fuchs et al., 2017) and calculated with measured inorganic and organic trace gas concentrations. In brief, pyrrole (C4H5N), used as a reference substance, was passed through a glass reactor and monitored by Vocus-PTR. OH radicals were then introduced to react with C4H5N, first in the presence of pure nitrogen gas and then in the presence of ambient air. Comparing the concentration of C4H5N exiting the reactor with and without the ambient air allows determination of the measured OH reactivity (Sinha et al., 2008).
2.2 Photochemical age-based parameterization method
The PAPM (De Gouw et al., 2005, 2018) assumes that the amount of each emitted OVOC is proportional to the amount of an inert tracer (e.g., acetylene (C2H2)), and that reactions with OH radicals and photolysis dominate the photochemical removal of OVOCs. In this method, ambient OVOC concentrations can be attributed to anthropogenic primary emissions (characterized by emission ratio EROVOC), anthropogenic secondary formation (characterized by emission ratio ERprecursor), biogenic sources (characterized by emission ratio ERbiogenic), and regional background, as expressed in Eq. (1):
where EROVOC and ERprecursor are the emission ratios of OVOC and their precursors relative to C2H2; and kprecursor are the OH rate coefficients of C2H2 and OVOC precursors, respectively; is the effective loss rate constant of OVOC representing the combined loss due to OH radicals and photolysis, for which the daytime photolysis of 13 carbonyls was considered in this study (Sect. S1 and Table S2); [C2H2] is the observed concentration of acetylene; ERbiogenic is the emission ratio of OVOCs from biogenic emissions to isoprene ([Isoprene]source, calculated using Eq. 2), and [background] denotes the background level. OH exposure of anthropogenic VOCs ([OH]Δta) is calculated from a species ratio method using the observed ethylbenzene and m&p-xylene concentrations (Roberts et al., 1984).
Since OH radical reactions dominate VOC consumption during the daytime, only observations from 07:00 to 18:00 LT were used for the PAPM fitting, ensuring that the underlying assumption of OH-driven oxidation (Eq. 1) is satisfied. The source contributions of OVOCs were then determined by a least-squares fit, with the fitted emission ratios and background levels summarized in Tables S3 and S4.
2.3 Estimation of initial VOCs
The photochemical loss of VOCs is dominated by reactions with OH radicals during the daytime, and other removal paths, including deposition and reactions with nitrate radical (NO3) or O3, are regarded to be negligible. Thus, the initial concentration of NMHCs emitted from sources can be estimated by Eq. (2):
where [NMHCi,j]source is the initial concentration of NMHC species i from the jth source; [NMHCi,j]t is the observed concentration of NMHCs species i from the jth source (including anthropogenic and biogenic sources); [OH]Δtj is the OH exposure of VOCs from the jth source, whose detailed descriptions are provided in Sects. S2 and S3; ki represents the first-order rate coefficient for the reaction of species i with OH radicals (Sect. S4 and Table S5). Unlike OVOCs, NMHCs are treated as directly emitted compounds with no secondary formation pathway. Among them, isoprene, monoterpenes (C10H16), and sesquiterpenes (C15H24) are classified as biogenic VOCs, whereas other measured NMHCs are categorized as anthropogenic VOCs.
Based on the source apportionment results (Sect. 3.1), the initial concentration of OVOCs can be estimated by Eq. (3).
where ERi,j is the emission ratios of the OVOC species i relative to the initial tracer concentration from the jth source ([tracerj]source, specifically [C2H2]source for anthropogenic and [isoprene]source for biogenic source).
2.4 Estimation of unmeasured VOCs
The difference between measured ROH and calculated ROH, termed as missing ROH, is a parameter for assessing the reactivity of unmeasured or unrecognized compounds.
where [Xi] represents the observed concentration of inorganic or VOC species i. To explore the potential sources of missing ROH, we quantified the sources of missing ROH by a MLR method introduced by Wang et al. (2024).
where [Ox] is the observed concentrations of NO2+ O3. a, b, and c are regression coefficients representing the sensitivities of missing ROH to the tracers of anthropogenic, biogenic and secondary sources, with fitted values of 0.39, 2.48 and 0.04 s−1 ppb−1, respectively. The intercept, Cbackground (2.27 s−1), represents the baseline missing ROH that is independent of these three source categories.
Unmeasured VOCs, such as long-chain alkanes, diterpenes, and OVOCs with more than four oxygen atoms, mainly originate from anthropogenic sources, biogenic sources, and secondary generation, respectively. These compounds exhibit high reactivity toward OH radicals and are therefore expected to be important sources of missing ROH (Li et al., 2020; Wang et al., 2020; Wu et al., 2020). In addition to VOC species, other reactive gases such as hydrogen sulfide, HONO, and ammonia, etc., although not measured in this study, have been identified in previous studies as important contributors to total ROH (Anglada and Solé, 2017; Pai et al., 2021; Wine et al., 1981). Moreover, heterogeneous OH uptake on atmospheric aerosol surfaces represents another non-negligible sink of OH radicals (Zhang et al., 2020), which may further contribute to missing ROH. The background fraction of missing ROH exhibited no correlation with [C2H2], [isoprene]source, or [Ox], hinting that it could not be attributed to the three sources represented by these tracers. We therefore attributed the background fraction of missing ROH to unmeasured inorganic reactive gases or unaccounted heterogeneous processes, and its OFP contribution was not considered in subsequent calculations. Missing ROH associated with anthropogenic, biogenic, and secondary sources was attributed to unmeasured VOCs from the corresponding source. Given that unmeasured VOCs are likely a complex mixture of diverse chemical species, we scaled the concentrations of the 191 measured species with available MIR values (Table S5) from the corresponding source to compensate for missing ROH, as shown in Eq. (6):
where [unmeasured VOCsi,j]t denotes the ambient concentrations of unmeasured VOCi originating from the jth source, [VOCsi,j]t represents the concentrations of measured VOCs from the jth source, missing ROH,j and ROH,j represent the OH reactivity of unmeasured and measured VOCs from the jth source, respectively.
Based on the equivalent concentrations derived from Eq. (6), the initial concentrations of unmeasured VOCs, [unmeasured VOCsi,j]source, were estimated following the same approach as that for measured species in Sect. 2.3. Note that unmeasured VOCs attributed to secondary formation were excluded from this calculation, as secondary OVOCs are produced during atmospheric transport rather than emitted at the source. Accordingly, the initial unmeasured anthropogenic and biogenic VOCs were determined using Eq. (7), with the same source-specific OH exposures and corresponding OH rate constants as those used for measured species.
Eq. (7) follows the same formulation as Eq. (2), but is specifically applied to unmeasured VOCs using their inferred concentrations rather than directly measured values.
2.5 Ozone formation potential
The MIR method was applied to calculate the OFP of individual VOC species (OFPi) to evaluate their respective contributions to O3 generation.
where [VOCi] is the concentration of a species i and MIRi is the maximum incremental reactivity coefficient for an individual species i, as reported by Carter (2010). Note that MIR values are unavailable for many VOCs, particularly those detected by Vocus-PTR without structural information. To enable OFP estimation, MIR values for these species were assigned as follow: (1) If the molecular formula corresponds to a unique compound without isomers, the reported MIR value of that compound was directly assigned; (2) If the molecular formula matched multiple isomers, the minimum MIR value among multiple isomers was conservatively adopted; (3) Nevertheless, 130 OVOCs (Table S5), accounting for 7.8 % of the total observed VOC concentration, still lacked MIR values. Including them without MIR values would require additional assumptions that would introduce unquantifiable uncertainties; therefore, to ensure the robustness of the results, these species were excluded from both the OFP calculations and the estimation of unmeasured VOCs. Thus, we estimated the OFP of unmeasured VOCs with the equivalent concentrations and corresponding MIR coefficients of the 191 measured species with available MIR values. The MIR coefficients used for the OFP estimation are summarized in Table S5.
These assignment strategies and the inference of unmeasured VOCs inevitably introduce uncertainties into the OFP calculations. A detailed discussion on the uncertainties associated with VOC measurements, ki and MIR assignments, and assumptions with unmeasured species is provided in Sect. S5, together with their impacts on the OFP estimation. Additionally, it should be noted that MIR-based OFP represents a simplified reactivity metric under idealized conditions and does not explicitly account for region-specific chemical regimes. The OFP values reported in this study should therefore be interpreted as relative indicators of precursor reactivities, rather than direct representations of O3 production under ambient conditions.
3.1 Source apportionment of measured and unmeasured VOCs
During the daytime (07:00–18:00 LT), the mean temperature and relative humidity were 28.7 °C and 75.8 %, respectively. Ambient O3 concentrations ranged from 24.0 to 324.0 µg m−3 (mean ± one standard deviation: 127.1 ± 58.4 µg m−3), and NOx averaged 14.0 ± 6.3 ppbv, indicating conditions favorable for photochemical oxidation of VOCs. Consistent with this chemical environment, the daytime measured total ROH averaged 39.9 ± 20.9 s−1 (Yang et al., 2022), comparable to values reported at other suburban Chinese sites with substantial biogenic and photochemical influence. For example, Yang et al. (2017) reported total ROH of ∼ 30–40 s−1 at the suburban Heshan site in the Pearl River Delta during summer. During our campaign, the OH exposure of anthropogenic VOCs, derived from the ethylbenzene m&p-xylene ratio method (Roberts et al., 1984), was estimated to be 3.2 ± 3.2×10¹⁰ molecules cm−3 s, corresponding to a photochemical age of approximately 4.4 h, assuming a mean daytime OH concentration of ∼ 2.0×10⁶ molecules cm−3. For biogenic VOCs, the OH exposure estimated using a sequential reaction model (Stroud et al., 2001) was 7.9 ± 5.1×10⁹ molecules cm−3 s, equivalent to a photochemical age of 1.1 h. Overall, the air masses sampled at DSL site on average underwent 1–4 h of integrated photochemical processing prior to arrival; therefore, the observed OVOCs are expected to reflect contributions from both primary emissions and substantial secondary production.
Using the parametric method incorporating photochemical age, we quantified contributions of anthropogenic primary emissions, anthropogenic secondary formation, biogenic sources, and regional background during the daytime for 8 aldehydes, 5 ketones, and 195 unspecified OVOCs. The fitted results from Eq. (1), with the fitted parameters summarized in Tables S3 and S4, show good agreement with observed concentrations (R=0.40–0.90) and reconstruct the time series well, as illustrated for formaldehyde, acetaldehyde, and acetone in Fig. 1.
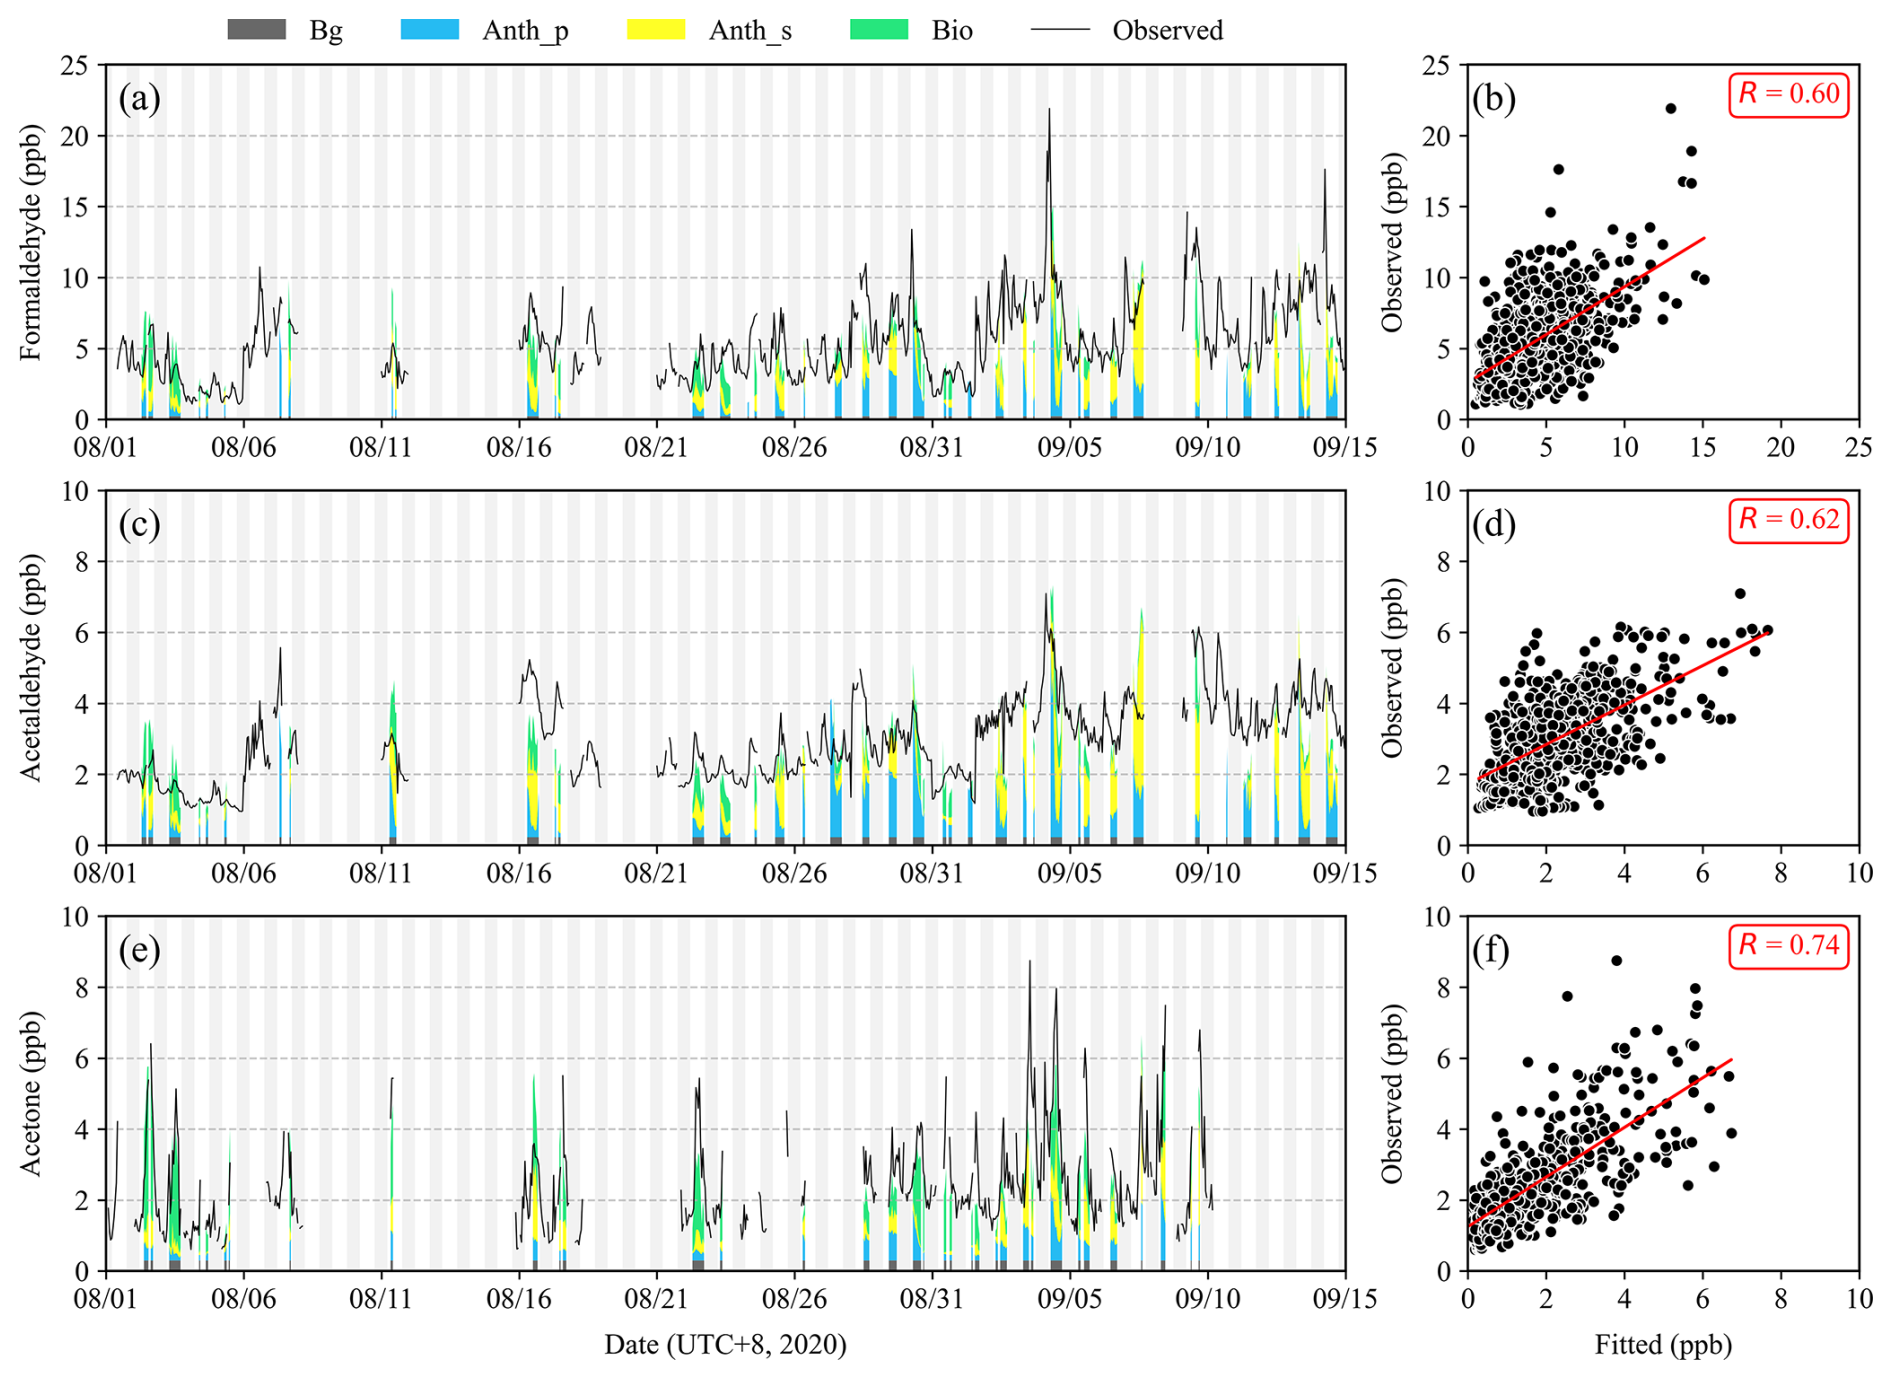
Figure 1Time series (a, c, e) and scatter plot (b, d, f) of the PAPM fitting result from Eq. (1) (using the emission ratios and background levels in Tables S3 and S4) versus the measured concentrations of formaldehyde, acetaldehyde, and acetone. Sources include anthropogenic primary emissions (Anth_p), anthropogenic secondary formation (Anth_s), biogenic sources (Bio), and background (Bg). Shaded areas in (a, c, e) represent nighttime, and missing data in (a, c, e) are due to the unavailability of tracer gases or OH exposure.
Ambient aldehydes, as shown in Fig. S2a, were predominantly of anthropogenic sources, with a large fraction of anthropogenic secondary formation (36.5 %) and anthropogenic primary emissions (33.1 %). Biogenic sources (24.7 %) also played a notable role, whereas the regional background was minor (5.6 %). Specifically, anthropogenic secondary formation was dominant for several major aldehydes, including formaldehyde (37.5 %), acetaldehyde (36.0 %), and propanal (34.6 %). In contrast, biogenic sources were dominant for methacrolein (81.8 %), pentanal (39.7 %), hexanal (67.2 %), butanal (52.1 %), and acrolein (48.7 %).
Ketones exhibited a higher regional background contribution (9.2 %) compared to aldehydes (Fig. S2b). Biogenic sources represented the dominant source of ketones (47.1 %), with particularly high contributions of methyl vinyl ketone (69.0 %), 2-pentanone (64.3 %), 2-butanone (50.7 %), and acetone (45.3 %). Anthropogenic secondary formation (24.9 %) and anthropogenic primary emissions (18.9 %) were also important contributors. Collectively, our results underscore a substantial contribution of photochemically derived carbonyls from anthropogenic VOC precursors during daytime at the DSL site.
For unspecified OVOCs measured by Vocus-PTR, as shown in Fig. S2c, anthropogenic primary emissions accounted for the largest fraction (36.9 %), followed by anthropogenic secondary formation (21.2 %), biogenic sources (34.2 %), and a low regional background level (7.7 %). Specifically, CnH2nO2 (n=2–8) were predominantly attributed to primary anthropogenic sources (34.7 %–84.4 %). These compounds are likely alkanoic acids, which have been previously linked to emissions from traffic and agricultural activities (Mattila et al., 2018). Similarly, compounds such as C6H14O2, C9H10O, C2H3NO2, C3H7NO, C5H9NO, and C6H5NO3 were also mainly associated with anthropogenic primary emissions (> 50 %). These species are likely solvents and amides, with potential sources including industrial processes, volatile chemical products, and wildfire, as reported by previous studies (Salvador et al., 2025; Zhang et al., 2024). OVOCs with more than or equal to three oxygen atoms (e.g., C2H4O3, C4H4O3, C4H2O4, C5H6O3, C4H4O4, and C5H4O4) were likely formed via multi-generation oxidation reactions of anthropogenic VOCs, with over 60 % attributed to anthropogenic secondary formation. Biogenic sources were dominant sources of CnH2nO (n=9–14), C8H8O2, C9H6O2, C8H6O3, C10H14O2, and C10H20O2, accounting for 45.0 %–74.2 %. These species likely represent carbonyls, fatty acid derivatives, and phenylpropanoids, commonly identified as primary biogenic OVOCs (Ma et al., 2022a; Wang et al., 2024a). In addition, several compounds such as C6H8O, C6H8O3, C8H10O3, C8H6O4, C9H14O2, C9H10O3, C9H8O4, C10H8O3, C12H18O, and C13H12O2 also exhibited substantial contributions from biogenic sources, ranging from 44.8 % to 77.7 %. These OVOCs have been identified as dominant products of terpene oxidation in laboratory simulations, and frequently observed in forest environments (Calogirou et al., 1999; Li et al., 2020; Vermeuel et al., 2023).
Unlike OVOCs, 113 NMHCs, including 29 alkanes, 9 alkenes, 16 aromatics, 1 alkyne, 3 terpenes, and 55 unspecified ones, are considered directly emitted since there is no secondary formation for NMHCs. Among them, isoprene, C10H16, and C15H24 are classified as biogenic VOCs, whereas the other 110 NMHCs are categorized as anthropogenic VOCs. It should be noted, however, that terpenoids may also be emitted from anthropogenic activities, such as vehicular exhaust and the usage of volatile chemical products (Borbon et al., 2001; Gu et al., 2024; Xie et al., 2025). Moreover, certain benzenoid compounds have been reported to be emitted from biogenic sources as well (Ma et al., 2022a; Misztal et al., 2015; Wang et al., 2024a; Wohl et al., 2023). Nevertheless, the impact of these cross-sources was generally considered to be minor (Ma et al., 2022a; Seltzer et al., 2021).
In addition to the detected VOCs, numerous other VOCs are present in the ambient air but were not measured during this campaign. Those unmeasured VOCs led to a gap between the measured and calculated ROH, i.e., missing ROH. To explore the potential sources of missing ROH at the DSL site, we quantified its sources by applying an MLR method. The fitted and calculated missing ROH were in good agreement (R=0.63, Fig. S3). The estimated missing ROH is approximately 6.8 ± 4.4 s−1 during the daytime. Biogenic sources accounted for the largest fraction (2.3 ± 1.7 s−1, 34.3 %), followed by background (2.1 s−1, 30.9 %) and secondary sources (2.1 ± 1.3 s−1, 30.5 %). In contrast, anthropogenic sources played a minor role in missing ROH (0.3 ± 0.2 s−1, 4.2 %). These results are consistent with previous suggestions that missing ROH was mainly from biogenic sources or photochemical production processes (Di Carlo et al., 2004; Yang et al., 2017). To quantify the OFP of unmeasured VOCs, the missing ROH attributed to anthropogenic, biogenic, and secondary sources was converted into equivalent concentrations of measured VOCs from corresponding sources using Eq. (6). The background fraction of missing ROH was not converted, as it was attributed to undetected reactive inorganic gases or unaccounted heterogeneous reactions rather than unmeasured VOCs. Our results showed that unmeasured VOCs were dominated by secondary OVOCs (4.1 ± 2.6 ppbv, 43.8 %) during daytime, followed by biogenic VOCs (3.7 ± 2.5 ppbv, 40.1 %) and anthropogenic VOCs (1.5 ± 1.0 ppbv, 16.0 %).
3.2 VOC evolution from initial emission to observation
Based on the above calculation, as shown in Fig. 2a, the daytime average concentration of total VOCs (TVOCs, including measured and unmeasured VOC species) at the observation site was estimated to be 58.4 ± 24.2 ppbv. Among them, measured species were 49.1 ± 21.3 ppbv. Measured OVOCs were the dominant group (52.4 %), with unspecified OVOCs comprising the largest fraction (26.4 %), followed by aldehydes (17.2 %) and ketones (8.8 %). Measured NMHCs contributed 31.7 % of TVOCs, with alkanes as the major fraction (17.7 %), followed by unspecified NMHCs (4.0 %), alkenes (3.2 %), aromatics (3.2 %), terpenes (2.4 %), and alkynes (1.3 %). In addition, the daytime average concentration of unmeasured VOCs at the observation site was estimated to be equivalent to 9.3 ± 5.2 ppbv of measured VOCs, which contributed approximately 15.9 % of TVOCs.
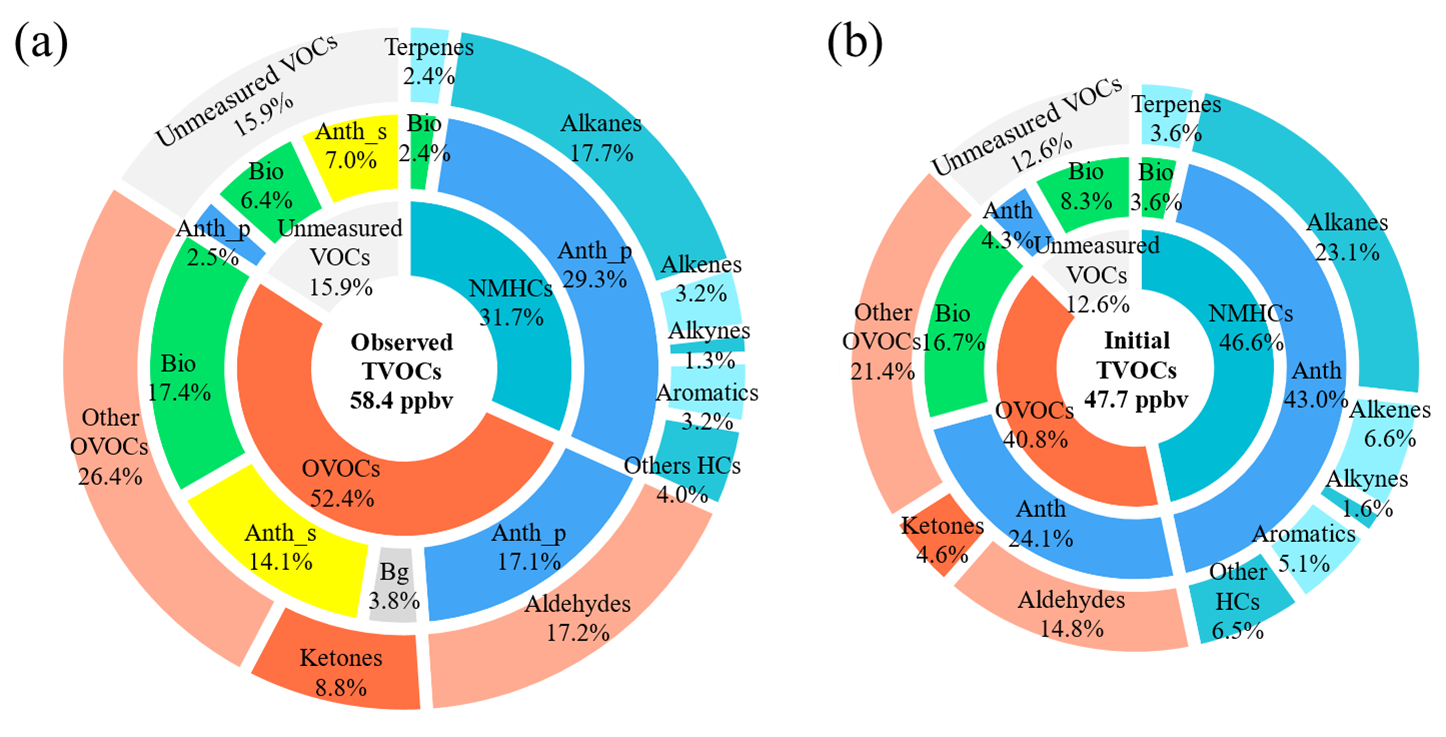
Figure 2The contributions of different VOC groups and sources to (a) observed TVOCs at the observation site and (b) initial TVOCs at the emission site. The inner, middle, and outer rings represent the proportion of different VOC components, different sources, and different VOC groups to TVOCs, respectively. The size of the ring is proportional to TVOC concentrations.
Source apportionment reveals that anthropogenic primary sources were the largest contributors to TVOCs at the observation site (48.9 %), followed by biogenic sources (26.2 %), anthropogenic secondary formation (21.1 %), and regional background (3.8 %). This distribution reflects a substantial anthropogenic influence, consistent with nearby urban and traffic emissions at the DSL site, although contributions from biogenic sources were also evident.
After deducting secondary formation contributions and accounting for photochemical aging, the initial concentration of individual measured VOCs was estimated (Table S5). In addition, the initial concentration of unmeasured VOCs was estimated using Eq. (7) based on the equivalent observed concentrations of measured VOCs. As shown in Fig. 2b, the estimated daytime average initial concentration of TVOCs was 47.7 ± 22.6 ppbv. Among these, measured species were 41.7 ± 19.8 ppbv. In contrast to the distribution at the observation site, NMHCs (22.3 ± 18.4 ppbv, 46.6 %) constituted the largest fraction of the initial TVOCs, rather than OVOCs (19.5 ± 9.8 ppbv, 40.8 %). Based on Eq. (7), the initial concentration of unmeasured VOCs was estimated to be 6.0 ± 3.6 ppbv, accounting for 12.6 % of initial TVOCs.
Anthropogenic and biogenic source emissions contributed 71.5 % and 28.5 % of initial TVOCs, respectively. A notable feature of these emissions is the substantial presence of OVOCs in primary sources. Anthropogenic OVOCs alone contributed 24.1 % of the initial TVOCs, indicating that a considerable fraction of oxygenated compounds originated directly from anthropogenic activities. Biogenic emissions also contained a large proportion of OVOCs, representing more than half of the total biogenic VOCs. These findings are consistent with bottom-up emission inventories (Gu et al., 2021; Ou et al., 2015; Salvador et al., 2025; Yan et al., 2024), as well as direct source measurements (Li et al., 2024a; Sekimoto et al., 2023; Seltzer et al., 2021; Wang et al., 2024a), which have reported significant primary OVOC emissions from solvents, industrial activities, volatile chemical products, and plant emissions. Concentrations of primarily emitted OVOCs were comparable to those of NMHCs. However, previous studies mainly focused on NMHCs and neglected the role of primarily emitted OVOCs (Ma et al., 2022b).
Comparison between initial and observed VOCs reveals a substantial compositional change during atmospheric transport. The concentration of TVOCs at the observation site was 10.6 ppbv (22.3 %) higher than the initial TVOCs. However, NMHC concentrations were underestimated by 16.8 %. Species with the largest discrepancies were alkenes and aromatics: the average initial concentrations of alkenes and aromatics were 3.1 ± 1.7 and 2.5 ± 1.8 ppbv, respectively, significantly exceeding their respective measured concentrations of 1.8 and 1.9 ppbv at the observation site. This discrepancy can be primarily attributed to the high reactivity of these compounds and thus their rapid photochemical degradation during atmospheric transport. OVOC concentrations, if inferred from observation, were overestimated by 57.1 %. For instance, unspecified OVOCs increased from 10.2 ± 5.1 ppbv at the real emission to 15.4 ± 12.2 ppbv at the observation site, reflecting substantial secondary production during transport.
Photochemical aging also altered different sources' contributions to VOCs significantly. Anthropogenic and biogenic sources emitted 71.5 % and 28.5 % of TVOCs, respectively. However, anthropogenic primary VOCs only accounted for 48.9 % of TVOCs when transported to the observation site. Photochemically degradable VOCs were converted into OVOCs, with these secondary products accounting for 21.1 % of TVOCs at the observation site, explaining the increase of OVOCs from the real emission to ambient measurements.
3.3 Ozone formation potential and the key contributors
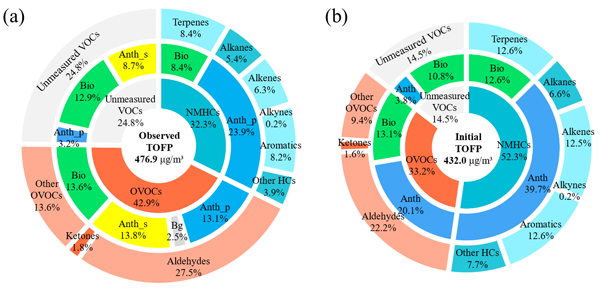
To identify key O3 precursors, we further calculated the OFP of individual VOCs using the MIR method (Table S5). As shown in Fig. 3, the total OFP (TOFP) of TVOCs at the emission site was 432.0 ± 319.2 µg m−3. Measured NMHCs contributed the largest fraction (52.3 %), led by aromatics (12.6 %), terpenes (12.6 %), alkenes (12.5 %), unspecified NMHCs (7.7 %), alkanes (6.6 %), and alkynes (0.2 %). These results differed remarkably from those based on the observed concentrations, i.e., the OFP of measured NMHCs was smaller by 31.7 % due to photochemical degradation. For instance, the OFP of initial alkenes was 54.1 ± 29.6 µg m−3, but would be underestimated by 44.7 % (30.0 ± 16.4 µg m−3) if photochemical losses were not considered.
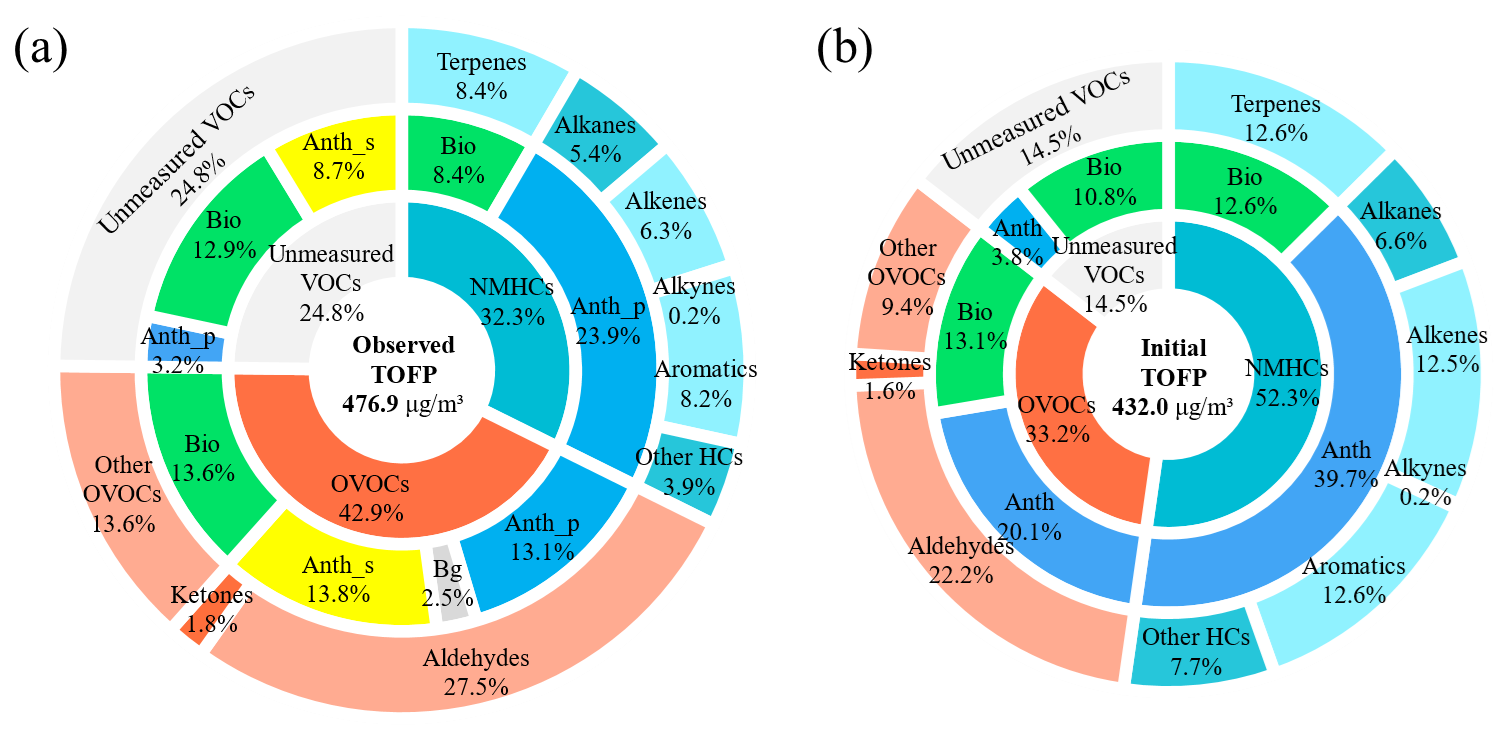
Figure 3The contributions of different VOC groups and sources to TOFP (a) at the observation site and (b) at the emission site. The inner, middle, and outer rings represent the proportion of different VOC components, different sources, and different VOC groups to TOFP, respectively. The size of the ring is proportional to the total OFP.
OVOCs are often regarded as secondary oxidation products and overlooked as primary O3 precursors. However, our results demonstrate that directly emitted OVOCs accounted for 33.2 % of initial TOFP, primarily from aldehydes (22.2 %) and unspecified OVOCs (9.4 %), whereas ketones contributed only 1.6 %. It should be noted that the actual contribution of OVOCs was likely larger, as many OVOCs (with a total initial concentration of 3.2 ppbv, accounting for 6.7 % of the initial TVOCs) were excluded from the OFP calculation because their MIR coefficients were unavailable. These findings show that primary OVOCs have an O3 formation impact comparable to or exceeding that of many NMHCs. On the other hand, when estimated directly from the observed concentrations, the OFP of OVOCs, as inferred from Fig. 3, was overestimated by 42.6 % (observed OVOCs: 204.6 µg m−3, i.e., 42.9 % × 476.9 µg m−3; reconstructed primary emitted OVOCs: 143.4 µg m−3, i.e., 33.2 % × 432.0 µg m−3), which is a bias largely attributable to secondary production. This explains why, despite an underestimation of NMHCs' OFP, TOFP calculated from the observed TVOCs' concentrations, i.e., 476.9 µg m−3 (Fig. 3a), was still 10.4 % higher than that (432.0 µg m−3) derived from the reconstructed initial concentrations (Fig. 3b). These numbers highlight systematic biases introduced by photochemical aging and underscore the necessity of reconstructing initial VOC emissions for accurate OFP assessments.
The contributions of unmeasured VOCs to TOFP were also considerable. The OFP of initial unmeasured VOCs was 62.8 ± 37.6 µg m−3, representing 14.5 % of initial TOFP, mainly contributed by unmeasured biogenic VOCs (46.5 ± 30.2 µg m−3, 10.8 %), followed by unmeasured anthropogenic VOCs (16.3 ± 12.0 µg m−3, 3.8 %). Although their exact identities remain to be elucidated, unmeasured VOCs' substantial OFP demonstrates that they are a non-negligible fraction of the O3 precursors. Ignoring unmeasured VOCs would underestimate VOC's contributions to O3 pollution.
In terms of individual VOCs at the emission site, formaldehyde was the largest single contributor to TOFP (13.4 %), consistent with emission inventory findings in Beijing and Guangzhou, China (Huang et al., 2021; Wang et al., 2023). Isoprene ranked second (8.1 %), which is emitted primarily from biogenic sources with a high photochemical reactivity. Acetaldehyde was the third contributor (6.9 %), largely driven by its relatively high concentrations (2.3 ± 1.4 ppbv). Other key VOCs with high OFP included propylene, m&p-xylene, monoterpenes, ethylene, toluene, n-hexane, and o-xylene, each accounting for more than 1.5 % of TOFP (Fig. 4). The relative importance of these species differed notably from what is based on the observed concentrations (Fig. S4), particularly for propylene and n-hexane, which ranked the fourth and the tenth, respectively, based on their initial concentrations, but decreased to the seventh and the fifteenth when ranked by observed concentrations. This indicates that evaluations without considering initial concentrations could miss key O3 precursors.
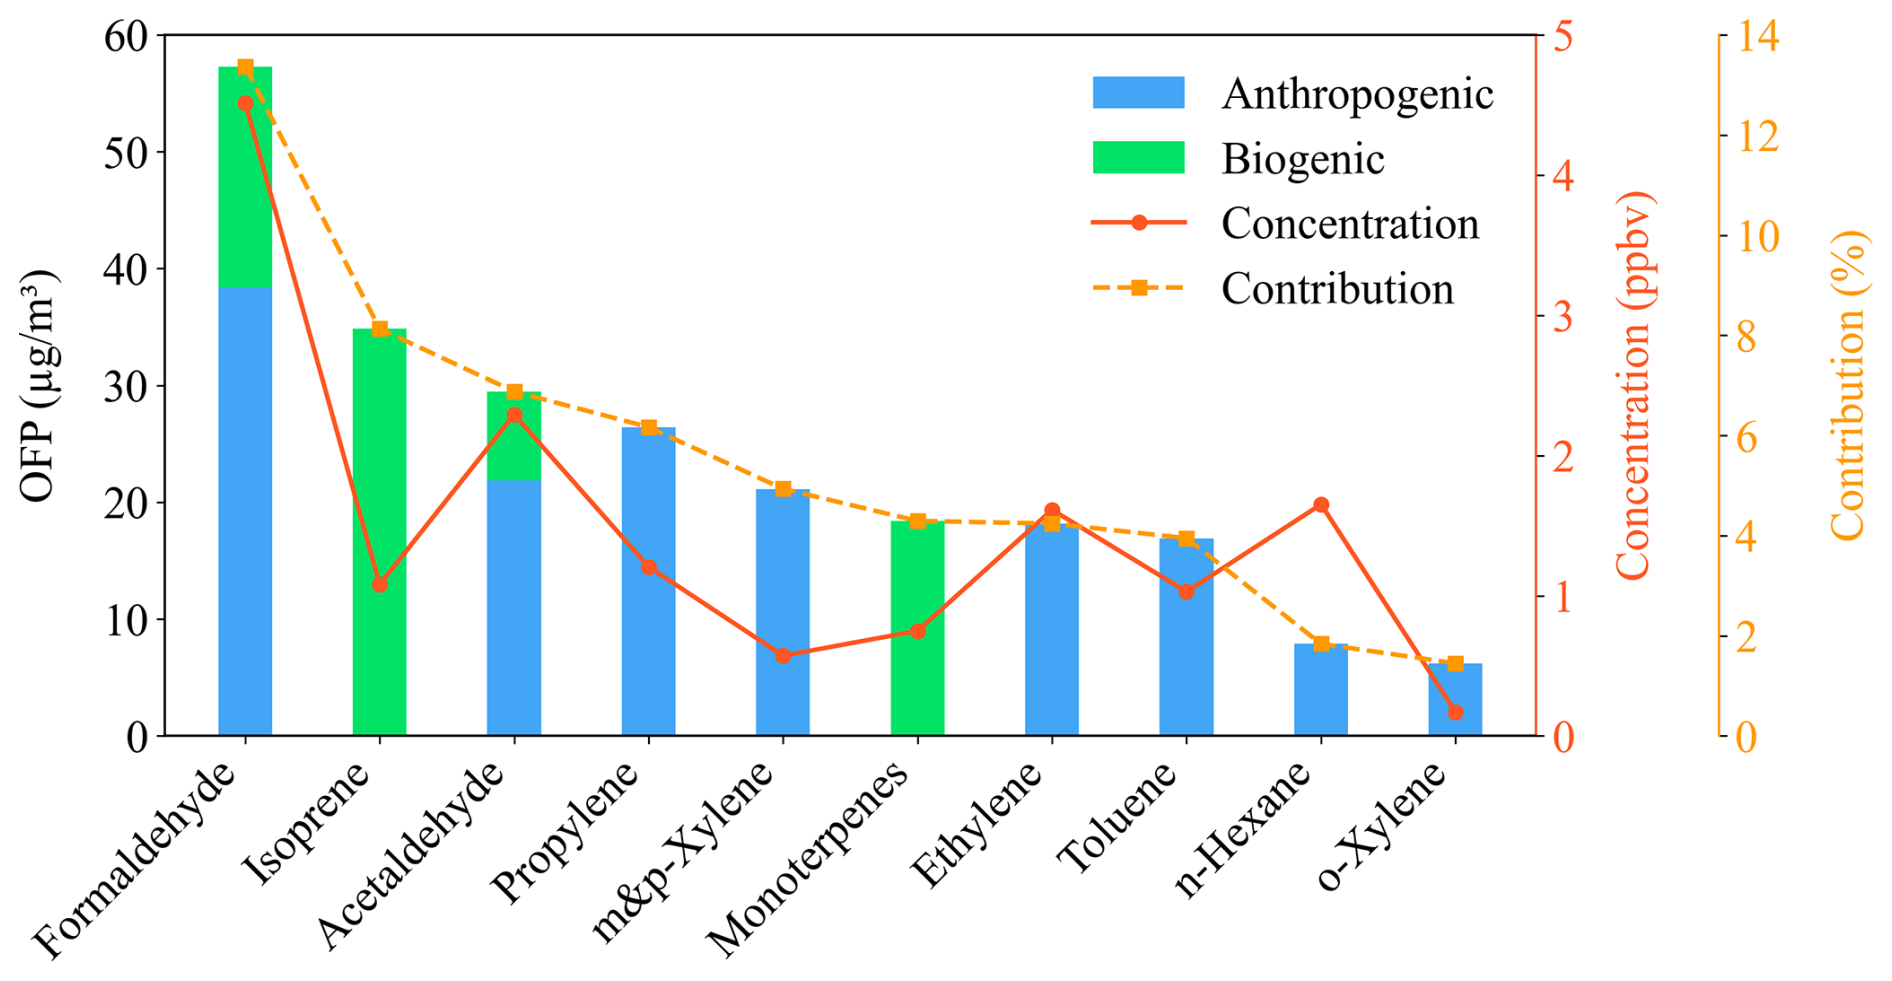
Figure 4The reconstructed initial concentrations and contributions to the initial total OFP of the top-ten contributors during the daytime. Bar colors indicate source attribution (blue: anthropogenic sources; green: biogenic sources).
The top-ten reconstructed primary emitted VOCs collectively accounted for 55.3 % of the initial TOFP, despite representing only 31.2 % of initial TVOCs, highlighting that high OFPs did not necessarily correlate with high concentrations. For instance, C2H4O2 (likely acetic acid), acetone, and ethane together comprised 12.1 % of initial TVOCs but contributed only 1.2 % to TOFP. Among the top ten contributors, eight species were primarily emitted from anthropogenic sources, reinforcing the dominant role of anthropogenic activities in O3 formation in the suburban area of Shanghai.
Anthropogenic emissions, including both measured and unmeasured species, have the potential to form about 274.4 ± 128.6 µg m−3 of O3, accounting for 63.5 % of TOFP. Initial anthropogenic NMHCs were the dominant contributors (39.7 %) to TOFP, followed by anthropogenic OVOCs (20.1 %), whereas unmeasured anthropogenic VOCs also represented a non-negligible fraction (3.8 %). Formaldehyde, propylene, and acetaldehyde were the top three contributors among anthropogenic VOCs, which cumulatively contributed 20.1 % of TOFP, even though they accounted for only 12.4 % of initial TVOC concentrations. Initial biogenic VOCs had the potential to form about 157.5 ± 111.9 µg m−3 of O3 (36.5 % of TOFP), with biogenic OVOCs, terpenes, and unmeasured biogenic species contributing 13.1 %, 12.6 %, and 10.8 % to TOFP, respectively. Isoprene, monoterpenes, and formaldehyde were the dominant biogenic contributors, with contributions of 8.1 %, 4.3 %, and 4.4 %, respectively, mainly attributed to their abundant initial concentrations combined with their high MIRs.
Our results are qualitatively consistent with, yet quantitatively and conceptually distinct from, those of Zheng and Xie (2025), who compared reconstructed primary emitted versus ambient VOC concentrations at three sites in the Sichuan Basin. Both studies found that NMHCs, particularly alkenes and aromatics, were underestimated in OFP estimation when using observed rather than primary emitted concentrations, while OVOCs' OFP were overestimated. A quantitative comparison of the observed and reconstructed initial OFP estimates between the two studies is summarized in Table 1. Specifically, Zheng and Xie (2025) found that OVOCs' OFP in Chengdu decreased from ∼ 75.0 to ∼ 50.0 µg m−3 when emitted rather than ambient concentrations were used (∼ 50.0 % overestimation), consistent with the 42.6 % overestimation identified here; conversely, the OFP of reactive NMHCs increased, mirroring the 31.7 % underestimation for NMHCs at the DSL site. For individual species, isoprene, acetaldehyde, propylene, m&p-xylene, ethylene, toluene, and o-xylene were consistently identified as key O3 precursors, reinforcing their priority status in O3 control strategies. Notably, a key distinction is that our study covers a far broader range of VOC species, encompassing 321 measured VOC species (113 NMHCs and 208 OVOCs), together with ROH inferred unmeasured species, compared to the 99 species (86 NMHCs and 13 OVOCs) analyzed by Zheng and Xie (2025). This broader coverage enables us to attribute 33.2 % and 14.5 % of initial TOFP to primary emitted OVOCs and unmeasured species. The two studies are thus complementary rather than hierarchical: Zheng and Xie (2025) additionally resolved nighttime NOO3-driven alkene loss, whereas our reconstruction focuses on the daytime OH-dominated window to characterize a broader range of oxygenated and unmeasured species.
Table 1Comparison of observed and reconstructed initial OFP (µg m−3) and associated biases between this study (suburban, Shanghai) and Zheng and Xie (2025) (suburban, Chengdu).
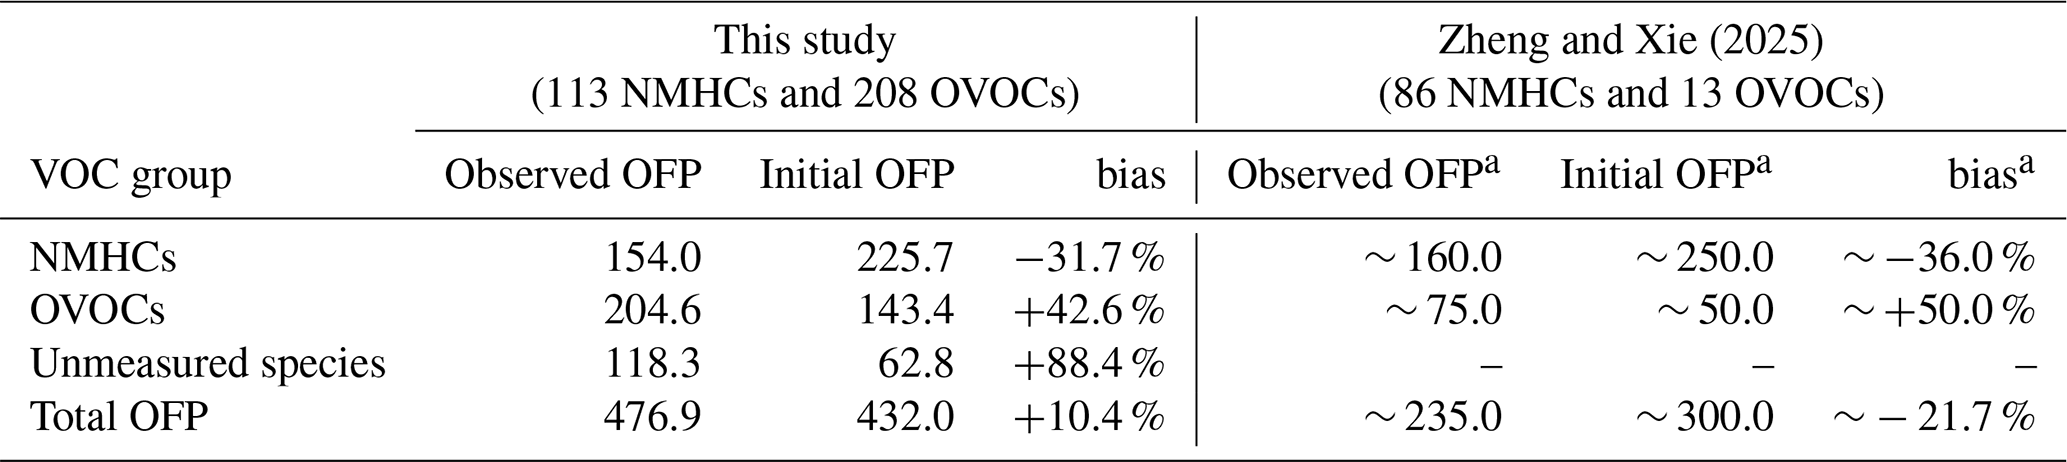
a Values estimated from Fig. 3 in Zheng and Xie (2025); exact numbers may differ slightly from those extracted here. “-”: Not quantified.
An accurate OFP estimation of VOCs is essential for designing effective O3 pollution control strategies, particularly across the VOC-limited regimes of the Yangtze River Delta (Ren et al., 2022). However, ambient VOC measurements inherently represent photochemically processed mixtures rather than true emissions, complicating the identification of key O3 contributors. This study demonstrates that photochemical aging substantially reshapes both the chemical composition and source characteristics of VOCs, systematically leading to underestimation of NMHCs and overestimation of OVOCs when relying solely on observed concentrations. Therefore, a reconstruction of initial emissions is necessary to correctly diagnose O3 precursors.
By reconstructing initial VOC emissions from ambient observations, we provide observationally constrained evidence that primary OVOCs constitute a large fraction of total VOC emissions (40.8 %) during our campaign, and that both anthropogenic and biogenic activities directly emit reactive oxygenated species with OFP comparable to NMHCs. These reconstructed emissions help to reconcile previously reported discrepancies between ambient VOC observations and emission inventories. Previous inventories and direct source measurements in urban and suburban environments indicate that anthropogenic sources contribute roughly 70 % of the total VOC burden, with OVOCs comprising approximately 20 %–65 % of total VOC emissions (Gu et al., 2021; Ma et al., 2022a; Ou et al., 2015; Yan et al., 2024). Our reconstructed initial concentrations closely reproduce this source-level composition (OVOCs: 40.8 %; anthropogenic origin: 71.5 %). By contrast, ambient observations show a markedly reduced anthropogenic primary fraction (48.9 %), alongside a substantially elevated OVOC proportion (52.4 %), reflecting photochemical aging and secondary OVOC formation during atmospheric transport, which obscure the original VOC emission profile. Moreover, the substantial contribution of unmeasured VOCs (14.5 % of the initial TOFP, despite only comprising 12.6 % of the initial TVOC concentrations) underscores the limitations of current monitoring networks, particularly for biogenic and oxygenated species; expanding measurement capabilities is therefore critical for capturing the true O3 formation capacity of the atmosphere. It should be emphasized, however, that the OFP reported in this study represents a relative reactivity metric rather than an estimate of actual O3 production under ambient conditions. Quantifying the contribution of primary OVOCs and unmeasured species to ambient O3 levels at the DSL site will require future work integrating detailed chemical mechanism modeling.
Current emission control strategies remain narrowly focused on a limited set of NMHCs (e.g., PAMS species) (Gao et al., 2025). However, our results show that the 56 PAMS compounds account for only ∼ 40 % (173.0 µg m−3) of the initial TOFP, implying that exclusive reliance on PAMS monitoring would leave ∼ 60 % of the total initial OFP unaddressed. The unaccounted fraction is composed of primary OVOCs (33.2 %), reactivity-inferred unmeasured VOCs (14.5 %), and non-PAMS NMHCs detected by Vocus-PTR (12.2 %). These findings underscore the necessity of integrating these species into emission inventories, routine monitoring networks, and regional chemical transport models to improve the accuracy of O3 predictions. On the other hand, given that these findings are based on observations from a single suburban site in Shanghai during summer, the spatial and seasonal representativeness of these results is inherently limited. While the quantitative contributions may vary across seasons and regions, the bias identified here is driven by photochemical aging and is expected to be generally applicable. Future investigations across diverse geographical regions and seasons are therefore warranted to evaluate the broader applicability of these conclusions. Consequently, by clarifying the OFP of a broader range of VOCs at the emission stage, this work provides an integrated observational–diagnostic framework that bridges ambient measurements with source emissions, offering a more robust tool for identifying key O3 precursors and informing the design of future process-based modeling studies.
The measured and reconstructed concentrations of VOCs detected by Vocus PTR-ToF-MS are available at https://doi.org/10.5281/zenodo.20606085 (Yin, 2026). The measured and calculated OH reactivity are available at https://doi.org/10.6084/m9.figshare.19361159 (Yang, 2022). The concentrations of PAMS compounds and carbonyls measured by GC-MS/FID and Kore PTR are part of a routine monitoring network and are not publicly available due to data privacy regulations; these data can be made available only with permission of the Shanghai Environmental Monitoring Center.
The supplement related to this article is available online at https://doi.org/10.5194/acp-26-10101-2026-supplement.
SY, conceptualization, methodology, investigation, formal analysis, data curation, visualization, writing–original draft, and editing; GY, QF, and JH, conducted the field measurement; CL, YF, and RY, editing; LW, conceptualization, methodology, funding acquisition, project administration, supervision, and editing.
The contact author has declared that none of the authors has any competing interests.
Publisher's note: Copernicus Publications remains neutral with regard to jurisdictional claims made in the text, published maps, institutional affiliations, or any other geographical representation in this paper. The authors bear the ultimate responsibility for providing appropriate place names. Views expressed in the text are those of the authors and do not necessarily reflect the views of the publisher.
This research has been supported by the National Natural Science Foundation of China (grant no. 22127811 and 21925601).
This paper was edited by Eva Y. Pfannerstill and reviewed by four anonymous referees.
Anglada, J. M. and Solé, A.: The Atmospheric Oxidation of HONO by OH, Cl, and ClO Radicals, J. Phys. Chem. A, 121, 9698–9707, https://doi.org/10.1021/acs.jpca.7b10715, 2017.
Atkinson, R. and Arey, J.: Atmospheric Degradation of Volatile Organic Compounds, Chem. Rev., 103, 4605–4638, https://doi.org/10.1021/cr0206420, 2003.
Atkinson, R. and Carter, W. P. L.: Kinetics and mechanisms of the gas-phase reactions of ozone with organic compounds under atmospheric conditions, Chem. Rev., 84, 437–470, https://doi.org/10.1021/cr00063a002, 1984.
Borbon, A., Fontaine, H., Veillerot, M., Locoge, N., Galloo, J. C., and Guillermo, R.: An investigation into the traffic-related fraction of isoprene at an urban location, Atmos. Environ., 35, 3749–3760, https://doi.org/10.1016/S1352-2310(01)00170-4, 2001.
Calogirou, A., Larsen, B. R., and Kotzias, D.: Gas-phase terpene oxidation products: a review, Atmos. Environ., 33, 1423–1439, https://doi.org/10.1016/S1352-2310(98)00277-5, 1999.
Carter, W. P.: Development of ozone reactivity scales for volatile organic compounds, Air Waste, 44, 881–899, 1994.
Carter, W. P.: Development of the SAPRC-07 chemical mechanism, Atmos. Environ., 44, 5324–5335, 2010.
Cui, L., Wu, D., Wang, S., Xu, Q., Hu, R., and Hao, J.: Measurement report: Ambient volatile organic compound (VOC) pollution in urban Beijing: characteristics, sources, and implications for pollution control, Atmos. Chem. Phys., 22, 11931–11944, https://doi.org/10.5194/acp-22-11931-2022, 2022.
De Gouw, J. A., Middlebrook, A. M., Warneke, C., Goldan, P. D., Kuster, W. C., Roberts, J. M., Fehsenfeld, F. C., Worsnop, D. R., Canagaratna, M. R., Pszenny, A. P., Keene, W. C., Marchewka, M., Bertman, S. B., and Bates, T. S.: Budget of organic carbon in a polluted atmosphere: Results from the New England Air Quality Study in 2002, J. Geophys. Res.-Atmos., 110, D16305, https://doi.org/10.1029/2004JD005623, 2005.
De Gouw, J. A., Gilman, J. B., Kim, S.-W., Alvarez, S. L., Dusanter, S., Graus, M., Griffith, S. M., Isaacman-VanWertz, G., Kuster, W. C., Lefer, B. L., Lerner, B. M., McDonald, B. C., Rappenglück, B., Roberts, J. M., Stevens, P. S., Stutz, J., Thalman, R., Veres, P. R., Volkamer, R., Warneke, C., Washenfelder, R. A., and Young, C. J.: Chemistry of Volatile Organic Compounds in the Los Angeles Basin: Formation of Oxygenated Compounds and Determination of Emission Ratios, J. Geophys. Res.-Atmos., 123, 2298–2319, https://doi.org/10.1002/2017JD027976, 2018.
Di Carlo, P., Brune, W. H., Martinez, M., Harder, H., Lesher, R., Ren, X., Thornberry, T., Carroll, M. A., Young, V., Shepson, P. B., Riemer, D., Apel, E., and Campbell, C.: Missing OH Reactivity in a Forest: Evidence for Unknown Reactive Biogenic VOCs, Science, 304, 722–725, https://doi.org/10.1126/science.1094392, 2004.
Feng, J., Ren, E., Hu, M., Fu, Q., Duan, Y., Huang, C., Zhao, Y., and Wang, S.: Budget of atmospheric nitrous acid (HONO) during the haze and clean periods in Shanghai: Importance of heterogeneous reactions, Sci. Total Environ., 900, 165717, https://doi.org/10.1016/j.scitotenv.2023.165717, 2023.
Fuchs, H., Novelli, A., Rolletter, M., Hofzumahaus, A., Pfannerstill, E. Y., Kessel, S., Edtbauer, A., Williams, J., Michoud, V., Dusanter, S., Locoge, N., Zannoni, N., Gros, V., Truong, F., Sarda-Esteve, R., Cryer, D. R., Brumby, C. A., Whalley, L. K., Stone, D., Seakins, P. W., Heard, D. E., Schoemaecker, C., Blocquet, M., Coudert, S., Batut, S., Fittschen, C., Thames, A. B., Brune, W. H., Ernest, C., Harder, H., Muller, J. B. A., Elste, T., Kubistin, D., Andres, S., Bohn, B., Hohaus, T., Holland, F., Li, X., Rohrer, F., Kiendler-Scharr, A., Tillmann, R., Wegener, R., Yu, Z., Zou, Q., and Wahner, A.: Comparison of OH reactivity measurements in the atmospheric simulation chamber SAPHIR, Atmos. Meas. Tech., 10, 4023–4053, https://doi.org/10.5194/amt-10-4023-2017, 2017.
Gao, Y., Wang, H., Zhu, S., Jing, S., Wang, Q., Huang, D. D., Li, Y., Lou, S., Fu, Q., Huang, C., and Su, H.: More Complete Reactive Organic Gases Measurements Reveal Greater Role of Combustion Emissions in Shanghai Megacity, J. Geophys. Res.-Atmos., 130, https://doi.org/10.1029/2024JD043129, 2025.
Gu, S., Guenther, A., and Faiola, C.: Effects of Anthropogenic and Biogenic Volatile Organic Compounds on Los Angeles Air Quality, Environ. Sci. Technol., 55, 12191–12201, https://doi.org/10.1021/acs.est.1c01481, 2021.
Gu, S., Luo, W., Charmchi, A., McWhirter, K. J., Rosenstiel, T., Pankow, J., and Faiola, C. L.: Limonene Enantiomeric Ratios from Anthropogenic and Biogenic Emission Sources, Environ. Sci. Technol. Lett., 11, 130–135, https://doi.org/10.1021/acs.estlett.3c00794, 2024.
Huang, X.-F., Zhang, B., Xia, S.-Y., Han, Y., Wang, C., Yu, G.-H., and Feng, N.: Sources of oxygenated volatile organic compounds (OVOCs) in urban atmospheres in North and South China, Environ. Pollut., 261, 114152, https://doi.org/10.1016/j.envpol.2020.114152, 2020.
Huang, Z., Zhong, Z., Sha, Q., Xu, Y., Zhang, Z., Wu, L., Wang, Y., Zhang, L., Cui, X., Tang, M., Shi, B., Zheng, C., Li, Z., Hu, M., Bi, L., Zheng, J., and Yan, M.: An updated model-ready emission inventory for Guangdong Province by incorporating big data and mapping onto multiple chemical mechanisms, Sci. Total Environ., 769, 144535, https://doi.org/10.1016/j.scitotenv.2020.144535, 2021.
Hui, L., Feng, X., Yuan, Q., Chen, Y., Xu, Y., Zheng, P., Lee, S., and Wang, Z.: Abundant oxygenated volatile organic compounds and their contribution to photochemical pollution in subtropical Hong Kong, Environ. Pollut., 335, 122287, https://doi.org/10.1016/j.envpol.2023.122287, 2023.
Li, H., Riva, M., Rantala, P., Heikkinen, L., Daellenbach, K., Krechmer, J. E., Flaud, P.-M., Worsnop, D., Kulmala, M., Villenave, E., Perraudin, E., Ehn, M., and Bianchi, F.: Terpenes and their oxidation products in the French Landes forest: insights from Vocus PTR-TOF measurements, Atmos. Chem. Phys., 20, 1941–1959, https://doi.org/10.5194/acp-20-1941-2020, 2020.
Li, K., Zhang, J., Bell, D. M., Wang, T., Lamkaddam, H., Cui, T., Qi, L., Surdu, M., Wang, D., Du, L., El Haddad, I., Slowik, J. G., and Prevot, A. S. H.: Uncovering the dominant contribution of intermediate volatility compounds in secondary organic aerosol formation from biomass-burning emissions, Natl. Sci. Rev., 11, https://doi.org/10.1093/nsr/nwae014, 2024a.
Li, Z.-J., He, L.-Y., Ma, H.-N., Peng, X., Tang, M.-X., Du, K., and Huang, X.-F.: Sources of atmospheric oxygenated volatile organic compounds in different air masses in Shenzhen, China, Environ. Pollut., 340, 122871, https://doi.org/10.1016/j.envpol.2023.122871, 2024b.
Ma, M., Gao, Y., Ding, A., Su, H., Liao, H., Wang, S., Wang, X., Zhao, B., Zhang, S., Fu, P., Guenther, A. B., Wang, M., Li, S., Chu, B., Yao, X., and Gao, H.: Development and Assessment of a High-Resolution Biogenic Emission Inventory from Urban Green Spaces in China, Environ. Sci. Technol., 56, 175–184, https://doi.org/10.1021/acs.est.1c06170, 2022a.
Ma, W., Feng, Z., Zhan, J., Liu, Y., Liu, P., Liu, C., Ma, Q., Yang, K., Wang, Y., He, H., Kulmala, M., Mu, Y., and Liu, J.: Influence of photochemical loss of volatile organic compounds on understanding ozone formation mechanism, Atmos. Chem. Phys., 22, 4841–4851, https://doi.org/10.5194/acp-22-4841-2022, 2022b.
Mattila, J. M., Brophy, P., Kirkland, J., Hall, S., Ullmann, K., Fischer, E. V., Brown, S., McDuffie, E., Tevlin, A., and Farmer, D. K.: Tropospheric sources and sinks of gas-phase acids in the Colorado Front Range, Atmos. Chem. Phys., 18, 12315–12327, https://doi.org/10.5194/acp-18-12315-2018, 2018.
Mellouki, A., Wallington, T. J., and Chen, J.: Atmospheric Chemistry of Oxygenated Volatile Organic Compounds: Impacts on Air Quality and Climate, Chem. Rev., 115, 3984–4014, https://doi.org/10.1021/cr500549n, 2015.
Misztal, P. K., Hewitt, C. N., Wildt, J., Blande, J. D., Eller, A. S. D., Fares, S., Gentner, D. R., Gilman, J. B., Graus, M., Greenberg, J., Guenther, A. B., Hansel, A., Harley, P., Huang, M., Jardine, K., Karl, T., Kaser, L., Keutsch, F. N., Kiendler-Scharr, A., Kleist, E., Lerner, B. M., Li, T., Mak, J., Nölscher, A. C., Schnitzhofer, R., Sinha, V., Thornton, B., Warneke, C., Wegener, F., Werner, C., Williams, J., Worton, D. R., Yassaa, N., and Goldstein, A. H.: Atmospheric benzenoid emissions from plants rival those from fossil fuels, Sci. Rep., 5, 12064, https://doi.org/10.1038/srep12064, 2015.
Ou, J., Zheng, J., Li, R., Huang, X., Zhong, Z., Zhong, L., and Lin, H.: Speciated OVOC and VOC emission inventories and their implications for reactivity-based ozone control strategy in the Pearl River Delta region, China, Sci. Total Environ., 530–531, 393–402, https://doi.org/10.1016/j.scitotenv.2015.05.062, 2015.
Pai, S. J., Heald, C. L., and Murphy, J. G.: Exploring the Global Importance of Atmospheric Ammonia Oxidation, ACS Earth Space Chem., 5, 1674–1685, https://doi.org/10.1021/acsearthspacechem.1c00021, 2021.
Ren, J., Guo, F., and Xie, S.: Diagnosing ozone-NOx-VOC sensitivity and revealing causes of ozone increases in China based on 2013–2021 satellite retrievals, Atmos. Chem. Phys., 22, 15035–15047, https://doi.org/10.5194/acp-22-15035-2022, 2022.
Roberts, J. M., Fehsenfeld, F. C., Liu, S. C., Bollinger, M. J., Hahn, C., Albritton, D. L., and Sievers, R. E.: Measurements of aromatic hydrocarbon ratios and NOx concentrations in the rural troposphere: Observation of air mass photochemical aging and NOx removal, Atmospheric Environ (1967), 18, 2421–2432, https://doi.org/10.1016/0004-6981(84)90012-X, 1984.
Salvador, C. M. G., Wood, J. D., Cochran, E. G., Seubert, H. A., Kamplain, B. D., Overby, S. S., Birdwell, K. R., Gu, L., and Mayes, M. A.: Measurement report: Extreme heat and wildfire emissions enhance volatile organic compounds in a temperate forest, Atmos. Chem. Phys., 25, 16611–16629, https://doi.org/10.5194/acp-25-16611-2025, 2025.
Sekimoto, K., Coggon, M. M., Gkatzelis, G. I., Stockwell, C. E., Peischl, J., Soja, A. J., and Warneke, C.: Fuel-Type Independent Parameterization of Volatile Organic Compound Emissions from Western US Wildfires, Environ. Sci. Technol., 57, 13193–13204, https://doi.org/10.1021/acs.est.3c00537, 2023.
Seltzer, K. M., Pennington, E., Rao, V., Murphy, B. N., Strum, M., Isaacs, K. K., and Pye, H. O. T.: Reactive organic carbon emissions from volatile chemical products, Atmos. Chem. Phys., 21, 5079–5100, https://doi.org/10.5194/acp-21-5079-2021, 2021.
Shang, Y., Chen, W., Bao, Q., Yu, Y., Pang, X., Zhang, Y., Guo, L., Fu, J., and Feng, W.: Characteristics and source profiles of atmospheric volatile organic compounds (VOCs) in the heavy industrial province of Northeast China with cruise monitoring, Front. Environ. Sci., 10, https://doi.org/10.3389/fenvs.2022.1055886, 2022.
Sinha, V., Williams, J., Crowley, J. N., and Lelieveld, J.: The Comparative Reactivity Method – a new tool to measure total OH Reactivity in ambient air, Atmos. Chem. Phys., 8, 2213–2227, https://doi.org/10.5194/acp-8-2213-2008, 2008.
Spinelle, L., Gerboles, M., Kok, G., Persijn, S., and Sauerwald, T.: Review of Portable and Low-Cost Sensors for the Ambient Air Monitoring of Benzene and Other Volatile Organic Compounds, Sensors, 17, 1520, https://doi.org/10.3390/s17071520, 2017.
Stroud, C. A., Roberts, J. M., Goldan, P. D., Kuster, W. C., Murphy, P. C., Williams, E. J., Hereid, D., Parrish, D., Sueper, D., Trainer, M., Fehsenfeld, F. C., Apel, E. C., Riemer, D., Wert, B., Henry, B., Fried, A., Martinez-Harder, M., Harder, H., Brune, W. H., Li, G., Xie, H., and Young, V. L.: Isoprene and its oxidation products, methacrolein and methylvinyl ketone, at an urban forested site during the 1999 Southern Oxidants Study, J. Geophys. Res.-Atmos., 106, 8035–8046, https://doi.org/10.1029/2000JD900628, 2001.
Tan, Z., Lu, K., Hofzumahaus, A., Fuchs, H., Bohn, B., Holland, F., Liu, Y., Rohrer, F., Shao, M., Sun, K., Wu, Y., Zeng, L., Zhang, Y., Zou, Q., Kiendler-Scharr, A., Wahner, A., and Zhang, Y.: Experimental budgets of OH, HO2, and RO2 radicals and implications for ozone formation in the Pearl River Delta in China 2014, Atmos. Chem. Phys., 19, 7129–7150, https://doi.org/10.5194/acp-19-7129-2019, 2019.
Vermeuel, M. P., Novak, G. A., Kilgour, D. B., Claflin, M. S., Lerner, B. M., Trowbridge, A. M., Thom, J., Cleary, P. A., Desai, A. R., and Bertram, T. H.: Observations of biogenic volatile organic compounds over a mixed temperate forest during the summer to autumn transition, Atmos. Chem. Phys., 23, 4123–4148, https://doi.org/10.5194/acp-23-4123-2023, 2023.
Wang, C., Yuan, B., Wu, C., Wang, S., Qi, J., Wang, B., Wang, Z., Hu, W., Chen, W., Ye, C., Wang, W., Sun, Y., Wang, C., Huang, S., Song, W., Wang, X., Yang, S., Zhang, S., Xu, W., Ma, N., Zhang, Z., Jiang, B., Su, H., Cheng, Y., Wang, X., and Shao, M.: Measurements of higher alkanes using NO+ chemical ionization in PTR-ToF-MS: important contributions of higher alkanes to secondary organic aerosols in China, Atmos. Chem. Phys., 20, 14123–14138, https://doi.org/10.5194/acp-20-14123-2020, 2020.
Wang, L., Lun, X., Wang, Q., and Wu, J.: Biogenic volatile organic compounds emissions, atmospheric chemistry, and environmental implications: a review, Environ. Chem. Lett., 22, 3033–3058, https://doi.org/10.1007/s10311-024-01785-5, 2024a.
Wang, R., Zhang, S., Xue, J., Guo, L., and Li, L.: Speciated VOCs emissions and ozone formation potential from on-road vehicles in North China Plain based on detailed and localized source profiles, Environ. Technol. Innov., 32, 103422, https://doi.org/10.1016/j.eti.2023.103422, 2023.
Wang, W., Yuan, B., Su, H., Cheng, Y., Qi, J., Wang, S., Song, W., Wang, X., Xue, C., Ma, C., Bao, F., Wang, H., Lou, S., and Shao, M.: A large role of missing volatile organic compound reactivity from anthropogenic emissions in ozone pollution regulation, Atmos. Chem. Phys., 24, 4017–4027, https://doi.org/10.5194/acp-24-4017-2024, 2024.
Wine, P. H., Kreutter, N. M., Gump, C. A., and Ravishankara, A. R.: Kinetics of hydroxyl radical reactions with the atmospheric sulfur compounds hydrogen sulfide, methanethiol, ethanethiol, and dimethyl disulfide, J. Phys. Chem., 85, 2660–2665, https://doi.org/10.1021/j150618a019, 1981.
Wohl, C., Li, Q., Cuevas, C. A., Fernandez, R. F., Yang, M., Saiz-Lopez, A., and Simó, R.: Marine biogenic emissions of benzene and toluene and their contribution to secondary organic aerosols over the polar oceans, Sci. Adv., https://doi.org/10.1126/sciadv.add9031, 2023.
Wu, C., Wang, C., Wang, S., Wang, W., Yuan, B., Qi, J., Wang, B., Wang, H., Wang, C., Song, W., Wang, X., Hu, W., Lou, S., Ye, C., Peng, Y., Wang, Z., Huangfu, Y., Xie, Y., Zhu, M., Zheng, J., Wang, X., Jiang, B., Zhang, Z., and Shao, M.: Measurement report: Important contributions of oxygenated compounds to emissions and chemistry of volatile organic compounds in urban air, Atmos. Chem. Phys., 20, 14769–14785, https://doi.org/10.5194/acp-20-14769-2020, 2020.
Wu, Y., Huo, J., Yang, G., Wang, Y., Wang, L., Wu, S., Yao, L., Fu, Q., and Wang, L.: Measurement report: Production and loss of atmospheric formaldehyde at a suburban site of Shanghai in summertime, Atmos. Chem. Phys., 23, 2997–3014, https://doi.org/10.5194/acp-23-2997-2023, 2023.
Xie, Q., Chen, W., Yuan, B., Huangfu, Y., He, X., Wu, L., Liu, M., You, Y., Shao, M., and Wang, X.: Significant but Overlooked: The Role of Anthropogenic Monoterpenes in Ozone Formation in a Chinese Megacity, Environ. Sci. Technol., https://doi.org/10.1021/acs.est.5c00001, 2025.
Yan, X., Qiu, X., Yao, Z., Liu, J., and Wang, L.: Emissions of Oxygenated Volatile Organic Compounds and Their Roles in Ozone Formation in Beijing, Atmosphere, 15, 970, https://doi.org/10.3390/atmos15080970, 2024.
Yang, G.: Data for the study for total OH reactivity measurements in a suburban site of Shanghai, figshare [data set], https://doi.org/10.6084/m9.figshare.19361159.v1, 2022.
Yang, G., Huo, J., Wang, L., Wang, Y., Wu, S., Yao, L., Fu, Q., and Wang, L.: Total OH Reactivity Measurements in a Suburban Site of Shanghai, J. Geophys. Res.-Atmos., 127, https://doi.org/10.1029/2021JD035981, 2022.
Yang, Y., Shao, M., Keßel, S., Li, Y., Lu, K., Lu, S., Williams, J., Zhang, Y., Zeng, L., Nölscher, A. C., Wu, Y., Wang, X., and Zheng, J.: How the OH reactivity affects the ozone production efficiency: case studies in Beijing and Heshan, China, Atmos. Chem. Phys., 17, 7127–7142, https://doi.org/10.5194/acp-17-7127-2017, 2017.
Yin, S.: Reconstructed VOC emissions reveal hidden ozone precursors: Overlooked roles of primary OVOCs and unmeasured species, Zenodo [data set], https://doi.org/10.5281/zenodo.20606085, 2026.
Zhang, B., Hu, X., Yao, L., Wang, M., Yang, G., Lu, Y., Liu, Y., and Wang, L.: Hydroxyl radical-initiated aging of particulate squalane, Atmos. Environ., 237, 117663, https://doi.org/10.1016/j.atmosenv.2020.117663, 2020.
Zhang, Y., Xu, W., Zhou, W., Li, Y., Zhang, Z., Du, A., Qiao, H., Kuang, Y., Liu, L., Zhang, Z., He, X., Cheng, X., Pan, X., Fu, Q., Wang, Z., Ye, P., Worsnop, D. R., and Sun, Y.: Characterization of organic vapors by a Vocus proton-transfer-reaction mass spectrometry at a mountain site in southeastern China, Sci. Total Environ., 919, 170633, https://doi.org/10.1016/j.scitotenv.2024.170633, 2024.
Zheng, X. and Xie, S.: Differences in the key volatile organic compound species between their emitted and ambient concentrations in ozone formation, Atmos. Chem. Phys., 25, 3807–3820, https://doi.org/10.5194/acp-25-3807-2025, 2025.
Zhou, J., Wang, W., Wang, Y., Zhou, Z., Lv, X., Zhong, M., Zhong, B., Deng, M., Jiang, B., Luo, J., Cai, J., Li, X.-B., Yuan, B., and Shao, M.: Intercomparison of measured and modelled photochemical ozone production rates: Suggestion of chemistry hypothesis regarding unmeasured VOCs, Sci. Total Environ., 951, 175290, https://doi.org/10.1016/j.scitotenv.2024.175290, 2024.